Guide to Inpatient Quality Indicators
181
-
Upload
khangminh22 -
Category
Documents
-
view
1 -
download
0
Transcript of Guide to Inpatient Quality Indicators


[ This page left intentionally blank ]

AHRQ Quality Indicators
Guide to Inpatient Quality Indicators:
Quality of Care in Hospitals – Volume, Mortality, and Utilization
Department of Health and Human Services Agency for Healthcare Research and Quality http://www.qualityindicators.ahrq.gov June 2002 AHRQ Pub. No. 02-RO204 Revision 3 (July 21, 2004)

Citation
AHRQ Quality Indicators—Guide to Inpatient Quality Indicators: Quality of Care in Hospitals—Volume, Mortality, and Utilization. Rockville, MD: Agency for Healthcare Research and Quality, 2002. Revision 3 (July 21, 2004). AHRQ Pub. No. 02-RO204.

Version 2.1 i Revision 3 (July 21, 2004)
Preface In health care as in other arenas, that which cannot be measured is difficult to improve. Providers, consumers, policy makers, and others seeking to improve the quality of health care need accessible, reliable indicators of quality that they can use to flag potential problems or successes; follow trends over time; and identify disparities across regions, communities, and providers. As noted in a 2001 Institute of Medicine study, Envisioning the National Health Care Quality Report, it is important that such measures cover not just acute care but multiple dimensions of care: staying healthy, getting better, living with illness or disability, and coping with the end of life. The Agency for Healthcare Research and Quality (AHRQ) Quality Indicators (QIs) are one Agency response to this need for multidimensional, accessible quality indicators. They include a family of measures that providers, policy makers, and researchers can use with inpatient data to identify apparent variations in the quality of inpatient or outpatient care. AHRQ‘s Evidence-Based Practice Center (EPC) at the University of California San Francisco (UCSF) and Stanford University adapted, expanded, and refined these indicators based on the original Healthcare Cost and Utilization Project (HCUP) Quality Indicators developed in the early 1990s. The AHRQ QIs are organized into three modules: Prevention Quality Indicators, Inpatient Quality Indicators, and Patient Safety Indicators. AHRQ has published the three modules as a series. The first module—Prevention Quality Indicators—was released in 2001 and is available at AHRQ‘s Quality Indicators Web site at http://www.qualityindicators.ahrq.gov/. This second module focuses on health care provided within the inpatient hospital setting. The Inpatient Quality Indicators include three distinct types of measures. Volume measures examine the volume of inpatient procedures for which a link has been demonstrated between the number of procedures performed and outcomes such as mortality. In-hospital mortality measures examine outcomes following procedures and for common medical conditions. Utilization examines procedures for which questions have been raised about overuse, underuse, and misuse. Full technical information on the first two modules can be found in Evidence Report for Refinement of the HCUP Quality Indicators, prepared by the UCSF-Stanford EPC. It can be accessed at AHRQ‘s Quality Indicator Web site (http://www.qualityindicators.ahrq.gov). The third module—Patient Safety Indicators (PSIs)—was released in May 2003. Information on the PSIs, including the technical information, software and other documentation is also available at AHRQ‘s Quality Indicators Web site. Improving the quality of inpatient hospital services is a critical part of efforts to provide high quality health care in the United States. This guide is intended to facilitate such efforts. As always, we would appreciate hearing from those who use our measures and tools so that we can identify how they are used, how they can be refined, and how we can measure and improve the quality of the tools themselves. You may contact us by sending an e-mail to [email protected]. Irene Fraser, Ph.D., Director Center for Organization and Delivery Studies
The programs for the Inpatient Quality Indicators (IQIs) can be downloaded from http://www.qualityindicators.ahrq.gov/iqi_download.htm. Instructions on how to use the programs to calculate the IQI rates are contained in the companion text, Inpatient Quality Indicators: Software Documentation (both SAS and SPSS).

Version 2.1 ii Revision 3 (July 21, 2004)
Acknowledgments This product is based on the work of many individuals who contributed to its development and testing. The following staff from the Evidence-based Practice Center (EPC) at UCSF-Stanford performed the evidence review, completed the empirical evaluation, and created the programming code and technical documentation for the AHRQ Quality Indicators: Core Project Team Mark McClellan, M.D., Ph.D., principal investigator Kathryn M. McDonald, M.M., EPC coordinator Sheryl M. Davies, M.A.
Jeffrey Geppert, J.D. Patrick Romano, M.D., M.P.H. Kaveh G. Shojania, M.D.
Other Contributors
Amber Barnato, M.D. Paul Collins, B.A. Bradford Duncan M.D. Michael Gould, M.D., M.S. Paul Heidenreich, M.D. Corinna Haberland, M.D.
Paul Matz, M.D. Courtney Maclean, B.A. Susana Martins, M.D. Kristine McCoy, M.P.H. Suzanne Olson, M.A. L. LaShawndra Pace, B.A.
Mark Schleinitz, M.D. Herb Szeto, M.D. Carol Vorhaus, M.B.A Peter Weiss, M.D. Meghan Wheat, B.A.
Consultants
Douglas Staiger, Ph.D. The following staff from Social & Scientific Systems, Inc., developed this software product, documentation, and guide: Programmers Leif Karell Kathy McMillan
Technical Writer Patricia Burgess
Graphics Designer Laura Spofford
Contributors from the Agency for Healthcare Research and Quality:
Anne Elixhauser, Ph.D. Denise Remus, Ph.D., R.N.
H. Joanna Jiang, Ph.D. Margaret Coopey, R.N., M.G.A, M.P.S.
Support efforts, including refinement and enhancement of the AHRQ Quality Indicators and related products, are provided by the Support for Quality Indicators contract team. The following individuals from Stanford University, University of California (UC) and Battelle Memorial Institute constitute the Support for Quality Indicators core team: Sheryl M. Davies, M.A. Mark Gritz, Ph.D. Rajin Mangru, B.S. Bruce Ellis, M.S. Greg Hubert, B.S. Kathryn M. McDonald, M.M. Jeffrey Geppert, J.D. Elaine Keller, M.Ed. Patrick Romano, M.D., M.P.H The Agency for Healthcare Research and Quality Support for Quality Indicators team includes: Denise Remus, Ph.D., R.N., Project Officer Mary B. Haines, Contract Officer The contribution of the peer reviewers of the evidence report and the beta-testers of the software products is also knowledged, their input was invaluable.

Version 2.1 iii Revision 3 (July 21, 2004)
Table of Contents
Preface .......................................................................................................................................................... i
Acknowledgments ...................................................................................................................................... ii
Introduction to the AHRQ Inpatient Quality Indicators ........................................................................... 1 What Are the Inpatient Quality Indicators? ............................................................................................... 2 How Can the IQIs be Used in Quality Assessment? ................................................................................ 5 What Does this Guide Contain? ............................................................................................................... 5
Support for Potential and Current Users of the AHRQ QIs .................................................................... 6
Origins and Background of the Quality Indicators .................................................................................. 7 Development of the HCUP Quality Indicators .......................................................................................... 7 Development of the AHRQ Quality Indicators .......................................................................................... 7 AHRQ Quality Indicator Modules .............................................................................................................. 8
Methods of Identifying, Selecting, and Evaluating the Quality Indicators ............................................ 9 Step 1: Obtain Background Information on QI Use ................................................................................. 9 Step 2: Search the Literature to Identify Potential QIs .......................................................................... 10 Step 3: Review the Literature to Evaluate the QIs According to Predetermined Criteria ...................... 10 Step 4: Perform a Comprehensive Evaluation of Risk Adjustment ....................................................... 11 Step 5: Evaluate the Indicators Using Empirical Analyses .................................................................... 12
Summary Evidence on the Inpatient Quality Indicators ....................................................................... 15 Strengths and Limitations in Using the IQIs ........................................................................................... 20 Questions for Future Work ...................................................................................................................... 20
Detailed Evidence for Inpatient Quality Indicators ................................................................................ 22 Esophageal Resection Volume (IQI 1) ................................................................................................... 23 Pancreatic Resection Volume (IQI 2) ..................................................................................................... 25 Pediatric Heart Surgery Volume (IQI 3) .................................................................................................. 27 Abdominal Aortic Aneurysm Repair Volume (IQI 4) ............................................................................... 29 Coronary Artery Bypass Graft Volume (IQI 5) ........................................................................................ 31 Percutaneous Transluminal Coronary Angioplasty Volume (IQI 6) ........................................................ 33 Carotid Endarterectomy Volume (IQI 7) ................................................................................................. 36 Esophageal Resection Mortality Rate (IQI 8) ......................................................................................... 39 Pancreatic Resection Mortality Rate (IQI 9) ........................................................................................... 41 Pediatric Heart Surgery Mortality Rate (IQI 10) ...................................................................................... 43 Abdominal Aortic Aneurysm Repair Mortality Rate (IQI 11) ................................................................... 45 Coronary Artery Bypass Graft Mortality Rate (IQI 12) ............................................................................ 47 Craniotomy Mortality Rate (IQI 13) ......................................................................................................... 49 Hip Replacement Mortality Rate (IQI 14) ................................................................................................ 51 Acute Myocardial Infarction Mortality Rate (IQI 15) ................................................................................ 53 Acute Myocardial Infarction Mortality Rate, Without Transfer Cases (IQI 32) ........................................ 53 Congestive Heart Failure Mortality Rate (IQI 16) ................................................................................... 56 Acute Stroke Mortality Rate (IQI 17) ....................................................................................................... 58 Gastrointestinal Hemorrhage Mortality Rate (IQI 18) ............................................................................. 60 Hip Fracture Mortality Rate (IQI 19)........................................................................................................ 62 Pneumonia Mortality Rate (IQI 20) ......................................................................................................... 64 Cesarean Delivery Rate (IQI 21) ............................................................................................................ 66 Primary Cesarean Delivery Rate (IQI 33) ............................................................................................... 66 Vaginal Birth After Cesarean Rate, Uncomplicated (IQI 22) .................................................................. 69

Version 2.1 iv Revision 3 (July 21, 2004)
Vaginal Birth After Cesarean Rate, All (IQI 34) ...................................................................................... 69 Laparoscopic Cholecystectomy Rate (IQI 23) ........................................................................................ 72 Incidental Appendectomy in the Elderly Rate (IQI 24) ........................................................................... 74 Bilateral Cardiac Catheterization Rate (IQI 25) ...................................................................................... 76 Coronary Artery Bypass Graft Area Rate (IQI 26) .................................................................................. 78 Percutaneous Transluminal Coronary Angioplasty Area Rate (IQI 27) .................................................. 80 Hysterectomy Area Rate (IQI 28) ........................................................................................................... 82 Laminectomy or Spinal Fusion Area Rate (IQI 29) ................................................................................. 84
References ................................................................................................................................................. 86
Appendix A: Inpatient Quality Indicator Definitions ........................................................................... A-1 Provider-Level Indicators ...................................................................................................................... A-1
Procedure Volume Indicators ........................................................................................................... A-1 Mortality Indicators for Inpatient Procedures .................................................................................... A-8 Mortality Indicators for Inpatient Conditions ................................................................................... A-21 Procedure Utilization Indicators ...................................................................................................... A-25
Area-Level Indicators .......................................................................................................................... A-35
Appendix B: Detailed Methods ............................................................................................................. B-1 Semi-structured Interviews ................................................................................................................... B-1 Quality Indicators Evaluation Framework ............................................................................................. B-1 Literature Review of Quality Indicators ................................................................................................. B-8 Risk Adjustment of HCUP Quality Indicators ...................................................................................... B-13 Empirical Methods .............................................................................................................................. B-21 References for Appendix B ................................................................................................................. B-28
Appendix C: Log of Revisions to IQI Documentation and Software Version 2.1, Revision 3 ........ C-1
Appendix D: ICD-9-CM Coding Updates in IQI Release Version 2.1, Revision 3 ............................. D-1
List of Tables
Table 1: Inpatient Quality Indicator (IQI) Variables ...................................................................................... 4 Table 2: AHRQ Inpatient Quality Indicators Empirical Evaluations ........................................................... 16

Version 2.1 1 Revision 3 (July 21, 2004)
Introduction to the AHRQ Inpatient Quality Indicators Hospitals in the United States provide the setting for some of life‘s most pivotal events—the birth of a child, major surgery, treatment for otherwise fatal illnesses. These hospitals house the most sophisticated medical technology in the world and provide state-of-the-art diagnostic and therapeutic services. But access to these services comes with certain costs. About 36% of personal health care expenditures in the United States go towards hospital care,
1 and the rate of growth in spending for
hospital services has begun to increase following a half a decade of declining growth.2 Simultaneously,
concerns about the quality of health care services have reached a crescendo with the Institute of Medicine‘s series of reports describing the problem of medical errors
3 and the need for a complete
restructuring of the health care system to improve the quality of care.4 Policymakers, employers, and
consumers have made the quality of care in U.S. hospitals a top priority and have voiced the need to assess, monitor, track, and improve the quality of inpatient care. Hospital administrative data offer a window into the medical care delivered in our nation‘s hospitals. These data, which are collected as a routine step in the delivery of hospital services, provide information on diagnoses, procedures, age, gender, admission source, and discharge status. From these data elements, it is possible to construct a picture of the quality of medical care. Although quality assessments based on administrative data cannot be definitive, they can be used to flag potential quality problems and success stories, which can then be further investigated and studied. Hospital associations, individual hospitals, purchasers, regulators, and policymakers at the local, State, and Federal levels can use readily available hospital administrative data to begin the assessment of quality of care. In 2003, the Agency for Healthcare Research and Quality published the National Healthcare Quality Report
5 (NHQR)
and National Healthcare Disparities Report6 (NHDR) which provide a comprehensive picture of the level
and variation of quality within four components of health care quality— effectiveness, safety, timeliness, and patient centeredness. These reports incorporated many Prevention Quality Indicators and Patient Safety Indicators (selected IQIs are under evaluation for inclusion in the next reports). The AHRQ Quality Indicators are now being used for applications beyond quality improvement. Some organizations have used the AHRQ Quality Indicators to produce web based, comparative reports on hospital quality, such as the Texas Heath Care Information Council
7 and the Niagara Coalition
8. These
organizations also supplied users with guidance on indicator interpretation. Other organizations have incorporated selected AHRQ QIs into pay for performance demonstration projects or similar programs, such as the Centers for Medicare and Medicaid Services (CMS)
9 and Anthem Blue Cross Blue Shield of
1.http://www.cms.hhs.gov/statistics/nhe/projections-2002/t2.asp: Table 2: National Health Expenditure Amounts, and
Average Annual Percent Change by Type of Expenditure: Selected Calendar Years 1980-2012. 2Strunk BC, Ginsburg PB, Gabel JR. Tracking Health Care Costs. Health Affairs, 26 September 2001 (Web
exclusive). 3Institute of Medicine. To Err is Human: Building a Safer Health System. Kohn LT, Corrigan JM, Donaldson MS (eds.)
Washington DC: National Academy Press, 2000. 4Institute of Medicine. Crossing the Quality Chasm: A New Health System for the 21
st Century. Committee of Quality
of Care in America. Washington DC: National Academy Press, 2001. 5 Agency for Healthcare Research and Quality. National Healthcare Quality Report. Rockville, MD, U.S. Department
of Health and Human Services, Agency for Healthcare Research and Quality, December 2003. 6 Agency for Healthcare Research and Quality. National Healthcare Disparities Report. Rockville, MD, U.S.
Department of Health and Human Services, Agency for Healthcare Research and Quality, July 2003. 7 Texas Health Care Information Council. Indicators of Inpatient Care in Texas Hospitals, 1999-2001.
http://www.thcic.state.tx.us/IQIReport2001/IQIReport2001.htm. Accessed February 2004. 8 Niagara Health Quality Coalition. Alliance for Healthcare Quality: Indicators of Inpatient Care in New York
Hospitals, 2001. http://www.myhealthfinder.com/iqi2001/index.php. Accessed February 2004. 9 Centers for Medicare & Medicaid Services. The Premier Hospital Quality Incentive Demonstration.
http://www.cms.hhs.gov/quality/hospital/PremierFactSheet.pdf. Accessed February 2004.

Version 2.1 2 Revision 3 (July 21, 2004)
Virginia10
where hospitals would be financially rewarded for performance. Guidance on these alternative uses of the AHRQ QIs will be summarized in an upcoming AHRQ publication Guidance for Using the AHRQ Quality Indicators for Hospital-Level Public Reporting or Payment
11.
The Agency for Healthcare Research and Quality (AHRQ) Inpatient Quality Indicators (IQIs) are a tool that takes advantage of hospital administrative data. The IQIs represent the current state-of-the-art in measuring the quality of hospital care through analysis of inpatient discharge data. This update of the AHRQ Inpatient Quality Indicators (IQIs) (Revision 3), incorporates new indicators based on user feedback. As organizations have increasingly adopted standard measures for quality of care, users requested a convergence of actual operationalization of measures. For instance, IQI (# 15), Acute Myocardial Infarction (AMI) Mortality Rate, was defined slightly differently than the new core measure for the same condition adopted by the Joint Commission for the Accreditation of Healthcare Organizations (JCAHO). Both definitions have advantages and disadvantages, and users desired to look at AMI mortality in both manners. As a result both definitions are now included in the software. Similar considerations led to the addition of Primary Cesarean Delivery Rate and an alternative definition of Vaginal Birth After Delivery (VBAC).
What Are the Inpatient Quality Indicators?
The IQIs are a set of measures that can be used with hospital inpatient discharge data to provide a perspective on quality and include the following:
Volume indicators are proxy, or indirect, measures of quality. They are based on evidence suggesting that hospitals performing more of certain intensive, high-technology, or highly complex procedures may have better outcomes for those procedures. Volume indicators simply represent counts of admissions in which these procedures were performed.
Mortality indicators for inpatient procedures include procedures for which mortality has been shown to vary across institutions and for which there is evidence that high mortality may be associated with poorer quality of care.
Mortality indicators for inpatient conditions include conditions for which mortality has been shown to vary substantially across institutions and for which evidence suggests that high mortality may be associated with deficiencies in the quality of care.
Utilization indicators examine procedures whose use varies significantly across hospitals and for which questions have been raised about overuse, underuse, or misuse. High or low rates for these indicators are likely to represent inappropriate or inefficient delivery of care.
10
Grinnan, R and Shan, Y. (2003). Anthem Blue Cross and Blue Shield of Virginia. A Pay for Performance Initiative: Quality-In-Sights Hospital Incentive Program. Unpublished document provided to AHRQ on September 4, 2003. 11
Release of this document is anticipated to occur within the next few months. The release will be announced to
subscribers to the QI listserv. You may sign-up for the listserv, a free electronic distribution service, on the QI Web
site http://www.qualityindicators.ahrq.gov.

Version 2.1 3 Revision 3 (July 21, 2004)
The IQIs include the following thirty indicators, which are measured at the provider, or hospital, level:
Volume Indicators Mortality Indicators for Inpatient Procedures
Esophageal resection volume Esophageal resection mortality rate
Pancreatic resection volume Pancreatic resection mortality rate
Pediatric heart surgery volume Pediatric heart surgery mortality rate
Abdominal aortic aneurysm (AAA) repair volume AAA repair mortality rate
Coronary artery bypass graft (CABG) volume CABG mortality rate
Percutaneous transluminal coronary angioplasty (PTCA) volume
PTCA mortality rate12
Carotid endarterectomy (CEA) volume CEA mortality rate5
Craniotomy mortality rate
Hip replacement mortality rate
Mortality Indicators for Inpatient Conditions Utilization Indicators
Acute myocardial infarction (AMI) mortality rate13
Cesarean delivery rate
AMI mortality rate, without transfer cases Primary Cesarean delivery rate
Congestive heart failure (CHF) mortality rate Vaginal birth after Cesarean (VBAC) rate6
Acute stroke mortality rate VBAC rate, uncomplicated
Gastrointestinal hemorrhage mortality rate Laparoscopic cholecystecomy rate
Hip fracture mortality rate Incidental appendectomy in the elderly rate
Pneumonia mortality rate Bilateral cardiac catheterization rate
The IQIs also include four area-level utilization indicators that reflect the rate of hospitalization in the area for specific procedures. They are designed using an age- and sex-adjusted population-based denominator and discharge-based numerator. These indicators represent procedures whose use varies widely across relatively similar geographic areas with (in most cases) substantial inappropriate use. The area-level IQIs include the following: Area-level Utilization Indicators
CABG area rate Hysterectomy area rate PTCA area rate Laminectomy or spinal fusion area rate
A list of each IQI along with the associated reference number, as well as the age of the patient population included in the indicator, is provided in Table 1.
12 PTCA and CEA mortality are not recommended as standalone indicators, but are suggested as companion
measures to the corresponding volume measures. 13
AMI mortality and VBAC each have two versions: the original AHRQ specification and an alternative specification.
See Appendix A for details.

Version 2.1 4 Revision 3 (July 21, 2004)
Table 1: Inpatient Quality Indicator (IQI) Variables
Type IQI
number Indicator
Age categories 0 to 17
18 to 39
40 to 64
65 +
Provider
Volumes
1 Esophageal resection
2 Pancreatic resection
3 Pediatric heart surgery No No No
4 AAA repair
5 CABG No No
6 PTCAa No No
7 Carotid endarterectomy
Post-procedural mortality Rates
8 Esophageal resection
9 Pancreatic resection
10 Pediatric heart surgery No No No
11 AAA repair
12 CABG No No
30 PTCAb No No
31 Carotid endarterectomyb
13 Craniotomy No
14 Hip replacement
In- Hospital Mortality rates
15 AMI No
32 AMI, Without Transfer Cases* No
16 CHF No
17 Stroke No
18 GI hemorrhage No
19 Hip fracture No
20 Pneumonia No
Utilization rates
21 Cesarean delivery
33 Primary Cesarean delivery*
22 VBAC (Vaginal Birth After Cesarean), Uncomplicated*
34 VBAC, All*
23 Laparoscopic Cholecystectomy
24 Incidental appendectomy among elderly
No No No
25 Bi-lateral cardiac catheterization
Area Utilization rates
26 CABG No No
27 PTCA No No
28 Hysterectomy No
29 Laminectomy No a PTCA = percutaneous transluminal coronary angioplasty b PTCA and carotid endarterectomy mortality are not recommended as stand-alone indicators, but are
suggested as companion measures to the corresponding volume measures.
*These IQIs were modified (IQI 22) or added (IQIs 32, 33, 34) in version 2.1, revision 3.

Version 2.1 5 Revision 3 (July 21, 2004)
How Can the IQIs be Used in Quality Assessment?
The Inpatient Quality Indicators can be used by a variety of players in the health care arena to improve quality of care at the level of individual hospitals, the community, the State, or the nation. The following scenario illustrates one potential application of the IQIs.
A hospital association recognizes its member hospitals' needs for information that can help them evaluate the quality of care they provide. After learning about the IQIs, the association decides to apply the indicators to the discharge abstract data submitted by individual hospitals. For each hospital, the association develops a report with a graphic presentation of the risk-adjusted data to show how that hospital performs on each indicator compared with its peer group, the State as a whole, and other comparable States. National and regional averages are also provided as external benchmarks. Trend data are included to allow the hospital to examine any changing patterns in its performance. One member hospital, upon receiving the report, convenes an internal work group comprised of both quality improvement professionals and clinicians to review the information and address potential areas for improvements. Since the report is based on administrative data, the work group compares the data with information obtained from other internal sources. For example, to examine the mortality data, they perform chart review for a random sample of patients with a particular condition to verify that the coding is accurate and to ascertain if the death was preventable. After in-depth analysis of the data and additional chart review, the work group meets with various clinical departments to discuss the results. During those meetings, individual cases are examined and the processes of care are reviewed to identify what patient factors and care processes might have had an impact on patient outcomes. Best practices identified from the literature are also discussed. The work group puts together an internal document that summarizes the findings and makes recommendations for various quality improvement initiatives. The document is shared with the hospital‘s executives and physician leaders, who strongly support the implementation of several quality improvement projects:
To improve patient outcomes, the quality improvement team develops and implements comprehensive risk assessment tools and treatment protocols for patients at risk of mortality.
Physicians refine patient selection criteria for several elective procedures to improve appropriate utilization.
The hospital reaches out to the local chapter of the American College of Obstetrics and Gynecology and other health care organizations to address the high Cesarean delivery rates among obstetric patients in their community.
Problems in ICD-9-CM coding are discovered during the chart review process, so health information personnel in the hospital embark on a project to improve communication with physicians to increase the accuracy of coding medical records.
What Does this Guide Contain?
This guide provides information that hospitals, State data organizations, hospital associations, and others can use to decide how to use the IQIs. First, it describes the origin of the entire family of AHRQ Quality Indicators. Second, it provides an overview of the methods used to identify, select, and evaluate the AHRQ Quality Indicators. Third, the guide summarizes the IQIs specifically, describes strengths and limitations of the indicators, documents the evidence that links the IQIs to the quality of health care services, and then provides in-depth two-page descriptions of each IQI. Finally, two

Version 2.1 6 Revision 3 (July 21, 2004)
appendices present additional technical background information. Appendix A outlines the specific definitions of each IQI, with complete ICD-9-CM coding specifications. Appendix B provides the details of the empirical methods used to explore the IQIs. Appendix C summarizes all the revisions of the IQI Documentation and Software since the release of the initial version in 2002. Appendix D lists the changes in the ICD-9-CM codes specific to this update, IQI version 2.1, revision 3.
Support for Potential and Current Users of the AHRQ QIs
Technical assistance is available, through an electronic user support system monitored by the QI
support team, to support users in their application of the IQI software. The same e-mail address may be used to communicate to AHRQ any suggestions for IQI enhancements, general questions, and any QI related comments you may have. AHRQ welcomes your feedback. The Internet address for user support and feedback is: [email protected]. AHRQ also offers a listserv to keep you informed on the Quality Indicators (QIs). The listserv is used to announce any QI changes or updates, new tools and resources, and to distribute other QI related information. This is a free service. Sign-up information is available at the QI website at http://www.qualityindicators.ahrq.gov/.

Version 2.1 7 Revision 3 (July 21, 2004)
Origins and Background of the Quality Indicators
Development of the HCUP Quality Indicators
In the early 1990s, in response to requests for assistance from State-level data organizations and hospital associations with inpatient data collection systems, AHRQ developed a set of quality measures that required only the type of information found in routine hospital administrative data—diagnoses and procedures, along with information on patient‘s age, gender, source of admission, and discharge status. These States were part of the Healthcare Cost and Utilization Project (HCUP), an ongoing Federal-State-private sector collaboration to build uniform databases from administrative hospital-based data collected by State data organizations and hospital associations. Additional information on HCUP is available at the website http://www.ahrq.gov/data/hcup/. AHRQ developed these measures, called the HCUP Quality Indicators, to take advantage of a readily available data source—administrative data based on hospital claims—and quality measures that had been reported elsewhere.
14 The 33 HCUP QIs included measures for avoidable adverse outcomes,
such as in-hospital mortality and complications of procedures; use of specific inpatient procedures thought to be overused, underused, or misused; and ambulatory care sensitive conditions. Although administrative data cannot provide definitive measures of health care quality, they can be used to provide indicators of health care quality that can serve as the starting point for further investigation. The HCUP QIs have been used to assess potential quality-of-care problems and to delineate approaches for dealing with those problems. Hospitals with high rates of poor outcomes on the HCUP QIs have reviewed medical records to verify the presence of those outcomes and to investigate potential quality-of-care problems.
15 For example, one hospital that detected high utilization rates for
certain procedures refined patient selection criteria for these procedures to improve appropriate utilization.
Development of the AHRQ Quality Indicators
Since the original development of the HCUP QIs, the knowledge base on quality indicators has increased significantly. Risk adjustment methods have become more readily available, new measures have been developed, and analytic capacity at the State level has expanded considerably. Based on input from current users and advances to the scientific base for specific indicators, AHRQ funded a project to refine and further develop the original QIs. The project was conducted by the UCSF-Stanford Evidence-Based Practice Center (EPC). The major constraint placed on the UCSF-Stanford EPC was that the measures could require only the type of information found in hospital discharge abstract data. Further, the data elements required by the measures had to be available from most inpatient administrative data systems. Some State data systems contain innovative data elements, often based on additional information from the medical record. Despite the value of these record-based data elements, the intent of this project was to create measures that were based on a common denominator discharge data set, without the need for additional data collection. This was critical for two reasons. First, this constraint would result in a tool that could be used
14
Ball JK, Elixhauser A, Johantgen M, et al. HCUP Quality Indicators, Methods, Version 1.1: Outcome,
Utilization, and Access Measures for Quality Improvement. (AHCPR Publication No. 98-0035). Healthcare Cost and Utilization project (HCUP-3) Research notes: Rockville, MD: Agency for Health Care Policy and Research, 1998.
15
Impact: Case Studies Notebook – Documented Impact and Use of AHRQ's Research. Compiled by
Division of Public Affairs, Office of Health Care Information, Agency for Healthcare Research and Quality.

Version 2.1 8 Revision 3 (July 21, 2004)
with any inpatient administrative data, thus making it useful to most data systems. Second, this would enable national and regional benchmark rates to be provided using HCUP data, since these benchmark rates would need to be calculated using the universe of data available from the States.
AHRQ Quality Indicator Modules
The work of the UCSF-Stanford EPC resulted in the AHRQ Quality Indicators, which are being distributed as three separate modules:
Prevention Quality Indicators. These indicators consist of ―ambulatory care sensitive conditions,‖ hospital admissions that evidence suggests could have been avoided through high-quality outpatient care or that reflect conditions that could be less severe, if treated early and appropriately.
Inpatient Quality Indicators. These indicators reflect quality of care inside hospitals and include inpatient mortality; utilization of procedures for which there are questions of overuse, underuse, or misuse; and volume of procedures for which there is evidence that a higher volume of procedures is associated with lower mortality.
Patient Safety Indicators. These indicators focus on potentially preventable instances of complications and other iatrogenic events resulting from exposure to the health care system.
Version 2.1 9 Revision 3 (July 21, 2004)
Methods of Identifying, Selecting, and Evaluating the Quality Indicators In developing the new quality indicators, the UCSF-Stanford EPC applied the Institute of Medicine‘s widely cited definition of quality care: ―the degree to which health services for individuals and populations increase the likelihood of desired health outcomes and are consistent with current professional knowledge.‖
16 They formulated six specific key questions to guide the development process:
Which indicators are currently in use or described in the literature that could be defined using hospital discharge data?
What are the quality relationships reported in the literature that could be used to define new indicators using hospital discharge data?
What evidence exists for indicators not well represented in the original indicators—pediatric conditions, chronic disease, new technologies, and ambulatory care sensitive conditions?
Which indicators have literature-based evidence to support face validity, precision of measurement, minimum bias, and construct validity of the indicator?
What risk-adjustment method should be suggested for use with the recommended indicators, given the limits of administrative data and other practical concerns?
Which indicators perform well on empirical tests of precision of measurement, minimum bias, and construct validity?
As part of this project, the UCSF-Stanford EPC identified quality indicators reported in the literature and used by health care organizations, evaluated the original quality indicators and potential indicators using literature review and empirical methods, incorporated risk adjustment for comparative analysis, and developed new programs that could be employed by users with their own hospital administrative data. This section outlines the steps used to arrive at a final set of quality measures.
Step 1: Obtain Background Information on QI Use
The project team at the UCSF-Stanford EPC interviewed 33 individuals affiliated with hospital associations, business coalitions, State data groups, Federal agencies, and academia about various topics related to quality measurement, including indicator use, suggested indicators, and other potential contacts. Interviews were tailored to the specific expertise of interviewees. The sample was not intended to be representative of any population; rather, individuals were selected to include QI users and potential users from a broad spectrum of organizations in both the public and private sectors. Three broad audiences were considered for the quality measures: health care providers and managers, who could use the quality measures to assist in initiatives to improve quality; public health policy makers, who could use the information from indicators to target public health interventions; and health care purchasers, who could use the measures to guide decisions about health policies.
16
Institute of Medicine Division of Health Care Services. Medicare: a strategy for quality assurance.
Washington, DC: National Academy Press; 1990.

Version 2.1 10 Revision 3 (July 21, 2004)
Step 2: Search the Literature to Identify Potential QIs
The project team performed a structured review of the literature to identify potential indicators. They used Medline to identify the search strategy that returned a test set of known applicable articles in the most concise manner. Using the Medical Subject Heading (MeSH) terms ―Hospital/statistics and numerical data‖ and ―Quality Indicators, Health Care‖ resulted in approximately 2,600 articles published in 1994 or later. After screening titles and abstracts for relevancy, the search yielded 181 articles that provided information on potential quality indicators based on administrative data. Clinicians, health services researchers, and other team members abstracted information from these articles in two stages. In the first stage, preliminary abstraction, they evaluated each of the 181 identified articles for the presence of a defined quality indicator, clinical rationale, and strengths and weaknesses. To qualify for full abstraction, the articles must have explicitly defined a novel quality indicator. Only 27 articles met this criterion. The team collected information on the definition of the quality indicator, validation, and rationale during full abstraction. In addition, they identified additional potential indicators using the CONQUEST database; the National Library of Healthcare Indicators developed by the Joint Commission on Accreditation of Healthcare Organizations (JCAHO); a list of ORYX-approved indicators provided by JCAHO; and telephone interviews.
Step 3: Review the Literature to Evaluate the QIs According to Predetermined Criteria
The project team evaluated each potential quality indicator against the following six criteria, which were considered essential for determining the reliability and validity of a quality indicator:
Face validity. An adequate quality indicator must have sound clinical or empirical rationale for its use. It should measure an important aspect of quality that is subject to provider or health care system control.
Precision. An adequate quality indicator should have relatively large variation among providers or areas that is not due to random variation or patient characteristics. This criterion measures the impact of chance on apparent provider or community health system performance.
Minimum bias. The indicator should not be affected by systematic differences in patient case-mix, including disease severity and comorbidity. In cases where such systematic differences exist, an adequate risk adjustment system should be possible using available data.
Construct validity. The indicator should be related to other indicators or measures intended to measure the same or related aspects of quality. For example, improved performance on measures of inpatient care (such as adherence to specific evidence-based treatment guidelines) ought to be associated with reduced patient complication rates.
Fosters real quality improvement. The indicator should be robust to possible provider manipulation of the system. In other words, the indicator should be insulated from perverse incentives for providers to improve their reported performance by avoiding difficult or complex cases, or by other responses that do not improve quality of care.
Application. The indicator should have been used in the past or have high potential for working well with other indicators. Sometimes looking at groups of indicators together is likely to provide a more complete picture of quality.

Version 2.1 11 Revision 3 (July 21, 2004)
Based on the initial review, the team identified and evaluated over 200 potential indicators using these criteria. Of this initial set, 45 indicators passed this initial screen and received comprehensive literature and empirical evaluation. In some cases, whether an indicator complemented other promising indicators was a consideration in retaining it, allowing the indicators to provide more depth in specific areas. For this final set of 45 indicators, the team reviewed an additional 2,000 articles to provide evidence on indicators during the evaluation phase. They searched Medline for articles relating to each of the six areas of evaluation described above. Clinicians and health services researchers reviewed the literature for evidence and prepared a referenced summary description on each indicator. As part of the review process, the team assessed the link between each indicator and health care quality along the following dimensions:
Proxy. Some indicators do not specifically measure a patient outcome or a process measure of quality. Rather, they measure an aspect of care that is correlated with process measures of quality or patient outcomes. These indicators are best used in conjunction with other indicators measuring similar aspects of clinical care, or when followed with more direct and in-depth investigations of quality.
Selection bias. Selection bias results when a substantial percentage of care for a condition is provided in the outpatient setting, so the subset of inpatient cases may be unrepresentative. In these cases, examination of outpatient care or emergency room data may help reduce selection bias.
Information bias. Quality indicators are based on information available in hospital discharge data sets, but some missing information may actually be important to evaluating the outcomes of hospital care. In these cases, examination of missing information may help to improve indicator performance.
Confounding bias. Patient characteristics may substantially affect performance on a measure and may vary systematically across areas. In these cases, adequate risk adjustment may help to improve indicator performance.
Unclear construct validity. Problems with construct validity include uncertain or poor correlations with widely accepted process measures or with risk-adjusted outcome measures. These indicators would benefit from further research to establish their relationship with quality care.
Easily manipulated. Quality indicators may create perverse incentives to improve performance without actually improving quality. Although very few of these perverse responses have been proven, they are theoretically important and should be monitored to ensure true quality improvement.
Unclear benchmark. For some indicators, the ―right rate‖ has not been established, so comparison with national, regional, or peer group means may be the best benchmark available. Very low IQI rates may flag an underuse problem, that is, providers may fail to hospitalize patients who would benefit from inpatient care. On the other hand, overuse of acute care resources may potentially occur when patients who do not clinically require inpatient care are hospitalized.
Step 4: Perform a Comprehensive Evaluation of Risk Adjustment
The project team identified potential risk-adjustment systems by reviewing the applicable literature and asking the interviewees in step 1 to identify their preferences. Generally, users preferred

Version 2.1 12 Revision 3 (July 21, 2004)
that the system be (1) open, with published logic; (2) cost-effective, with data collection costs minimized and additional data collection being well justified; (3) designed using a multiple-use coding system, such as those used for reimbursement; and (4) officially recognized by government, hospital groups, or other organizations. Although no severity adjustment system based solely on administrative data is superior for all purposes, risk adjustment systems based on diagnosis-related groups (DRGs) seemed to meet the criteria for this evaluation better than other alternatives. Specifically, it was presumed that because a DRG-based system relies on the same diagnostic groups used for reimbursement, there may be more accurate coding as a result of the financial and audit incentives associated with use of DRGs. One DRG-based system in particular—all-patient refined (APR)-DRGs—appeared to be promising for several reasons. First, APR-DRGs are based on a refinement of two previously developed systems (R-DRGs and AP-DRGs) and take advantage of the strengths of both of these systems. Second, APR-DRGs were enhanced to provide improved risk adjustment for pediatric cases; to take advantage of information on comorbidities and non-operating room procedures; and to allow the interaction of secondary diagnoses, principal diagnosis, and age to influence the assignment of severity classes. Third, APR-DRGs have been reported to perform well in predicting resource use and death when compared to other DRG-based systems. Fourth, APR-DRGs have been used with ―smoothing‖ techniques, the statistical methods incorporated into the QI software, thus compatibility with the QI software was ensured. Finally, a majority of the users interviewed already used APR-DRGs; even though the system is proprietary, the burden on the group of potential QI users would be smaller than with another system that was less widely employed. APR-DRGs were used to conduct indicator evaluations to determine the impact of measured differences in patient severity on the relative performance of providers and to provide the basis for implementing APR-DRGs as an optional risk-adjustment system for hospital-level QI measures. The implementation of APR-DRGs is based on an ordinary least squares regression model. Area indicators were risk-adjusted only for age and sex differences. Detailed information on the risk-adjustment methods can be found in Appendix B.
Step 5: Evaluate the Indicators Using Empirical Analyses
The project team conducted extensive empirical testing of all potential indicators using the 1995-97 HCUP State Inpatient Databases (SID) and Nationwide Inpatient Sample (NIS) to determine precision, bias, and construct validity. The 1997 SID contains uniform data on inpatient stays in community hospitals for 22 States covering approximately 60% of all U.S. hospital discharges. The NIS is designed to approximate a 20% sample of U.S. community hospitals and includes all stays in the sampled hospitals. Each year of the NIS contains between 6 million and 7 million records from about 1,000 hospitals. The NIS combines a subset of the SID data, hospital-level variables, and hospital and discharge weights for producing national estimates. The project team conducted tests to examine three things: precision, bias, and construct validity. Precision. The first step in the analysis involved precision tests to determine the reliability of the indicator for distinguishing real differences in provider performance. For indicators that may be used for quality improvement, it is important to know with what precision, or surety, a measure can be attributed to an actual construct rather than random variation. For each indicator, the variance can be broken down into three components: variation within a provider (actual differences in performance due to differing patient characteristics), variation among providers (actual differences in performance among providers), and random variation. An ideal indicator would have a substantial amount of the variance explained by between-provider variance, possibly resulting from differences in quality of care, and a minimum amount of random variation. The project team performed four tests of precision to estimate the magnitude of between-provider variance on each indicator:

Version 2.1 13 Revision 3 (July 21, 2004)
Signal standard deviation was used to measure the extent to which performance of the QI varies systematically across hospitals or areas.
Provider/area variation share was used to calculate the percentage of signal (or true) variance relative to the total variance of the QI.
Signal-to-noise ratio was used to measure the percentage of the apparent variation in QIs across providers that is truly related to systematic differences across providers and not random variations (noise) from year to year.
In-sample R-squared was used to identify the incremental benefit of applying multivariate signal extraction methods for identifying additional signal on top of the signal-to-noise ratio.
In general, random variation is most problematic when there are relatively few observations per provider, when adverse outcome rates are relatively low, and when providers have little control over patient outcomes or variation in important processes of care is minimal. If a large number of patient factors that are difficult to observe influence whether or not a patient has an adverse outcome, it may be difficult to separate the ―quality signal‖ from the surrounding noise. Two signal extraction techniques were applied to improve the precision of an indicator:
Univariate methods were used to estimate the ―true‖ quality signal of an indicator based on information from the specific indicator and 1 year of data.
Multivariate signal extraction (MSX) methods were used to estimate the ―true‖ quality signal based on information from a set of indicators and multiple years of data. In most cases, MSX methods extracted additional signal, which provided much more precise estimates of true hospital or area quality.
Bias. To determine the sensitivity of potential QIs to bias from differences in patient severity, unadjusted performance measures for specific hospitals were compared with performance measures that had been adjusted for age and gender. All of the Prevention QIs and some of the IQIs could only be risk-adjusted for age and sex. The 3M APR-DRG System Version 12 with Severity of Illness and Risk of Mortality subclasses was used for risk adjustment of the utilization indicators and the in-hospital mortality indicators, respectively. Five empirical tests were performed to investigate the degree of bias in an indicator:
Rank correlation coefficient of the area or hospital with (and without) risk adjustment—gives the overall impact of risk adjustment on relative provider or area performance.
Average absolute value of change relative to mean—highlights the amount of absolute change in performance, without reference to other providers‘ performance.
Percentage of highly ranked hospitals that remain in high decile—reports the percentage of hospitals or areas that are in the highest deciles without risk adjustment that remain there after risk adjustment is performed.
Percentage of lowly ranked hospitals that remain in low decile—reports the percentage of hospitals or areas that are in the lowest deciles without risk adjustment that remain there after risk adjustment is performed.
Percentage that change more than two deciles—identifies the percentage of hospitals whose relative rank changes by a substantial percentage (more than 20%) with and without risk adjustment.

Version 2.1 14 Revision 3 (July 21, 2004)
Construct validity. Construct validity analyses provided information regarding the relatedness or independence of the indicators. If quality indicators do indeed measure quality, then two measures of the same construct would be expected to yield similar results. The team used factor analysis to reveal underlying patterns among large numbers of variables—in this case, to measure the degree of relatedness between indicators. In addition, they analyzed correlation matrices for indicators.

Version 2.1 15 Revision 3 (July 21, 2004)
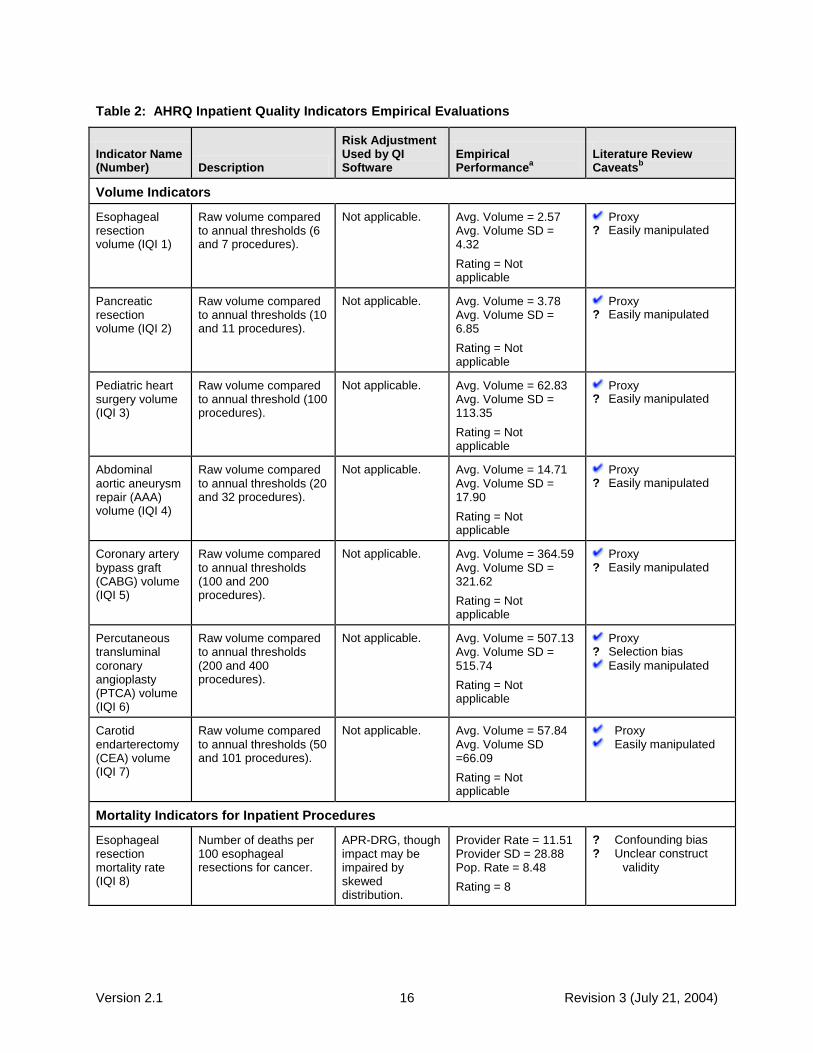
Summary Evidence on the Inpatient Quality Indicators
The rigorous evaluations performed by the UCSF-Stanford EPC, based on literature review and empirical testing of indicators, resulted in 29 indicators that reflect inpatient volume, mortality, and utilization. (Two additional mortality indicators are provided that are recommended for use only with the corresponding volume measures.) This release, Version 1.2, Revision 3, includes three additional measures—AMI Mortality without transfer cases, VBAC rate uncomplicated, and an indicator for Primary Cesarean delivery rate. Five of the provider-level IQIs and three area-level IQIs were included in the original HCUP QIs—Cesarean delivery rate, incidental appendectomy in the elderly rate, VBAC rate, laparoscopic cholecystectomy rate, hip replacement mortality rate, CABG area rate, hysterectomy area rate, and laminectomy or spinal fusion area rate. Table 2 summarizes the results of the literature review and empirical evaluations on the IQIs. The table lists each indicator, provides its definition, rates its empirical performance, recommends a risk adjustment strategy, and summarizes important caveats identified from the literature review. Rating of performance on empirical evaluations, as described in step 5 in the previous section, ranged from 0 to 26. (The average score for the mortality IQIs is 6.2; the average score for the utilization IQIs is 19.3.) The scores were intended as a guide for summarizing the performance of each indicator on four empirical tests of precision (signal variance, area-level share, signal ratio, and R-squared) and five tests of minimum bias (rank correlation, top and bottom decile movement, absolute change, and change over two deciles), as described in the previous section and in Appendix B. The magnitude of the scores, shown in the Empirical Performance column, provides an indication of the relative rankings of the indicators. These scores were based on indicator performance after risk-adjustment and smoothing, that is, they represent the ―best estimate‖ of the indicator‘s true value after accounting for case-mix and reliability. The score for each individual test is an ordinal ranking (e.g., very high, high, moderate, and low). The final summary score was derived by assigning a weight to each ranking (e.g., 3, 2, 1, 0) and summing across these nine individual tests. Higher scores indicate better performance on the empirical tests. The Literature Review Caveats column summarizes evidence specific to each potential concern on the link between the IQIs and quality of care, as described in step 3 above. A question mark (?) indicates that the concern is theoretical or suggested, but no specific evidence was found in the literature. A check mark ( ) indicates that the concern has been demonstrated in the literature. For additional details on the results of the literature review, see ―Detailed Evidence for the Inpatient Quality Indicators.‖ A complete description of each IQI is included later in the guide under ―Detailed Evidence for Inpatient Quality Indicators‖ and in Appendix A. Details on the empirical methods can be found in Appendix B.
Version 2.1 16 Revision 3 (July 21, 2004)
Table 2: AHRQ Inpatient Quality Indicators Empirical Evaluations
Indicator Name (Number) Description
Risk Adjustment Used by QI Software
Empirical Performance
a
Literature Review Caveats
b
Volume Indicators
Esophageal resection volume (IQI 1)
Raw volume compared to annual thresholds (6 and 7 procedures).
Not applicable. Avg. Volume = 2.57 Avg. Volume SD = 4.32
Rating = Not applicable
Proxy ? Easily manipulated
Pancreatic resection volume (IQI 2)
Raw volume compared to annual thresholds (10 and 11 procedures).
Not applicable. Avg. Volume = 3.78 Avg. Volume SD = 6.85
Rating = Not applicable
Proxy ? Easily manipulated
Pediatric heart surgery volume (IQI 3)
Raw volume compared to annual threshold (100 procedures).
Not applicable. Avg. Volume = 62.83 Avg. Volume SD = 113.35
Rating = Not applicable
Proxy ? Easily manipulated
Abdominal aortic aneurysm repair (AAA) volume (IQI 4)
Raw volume compared to annual thresholds (20 and 32 procedures).
Not applicable. Avg. Volume = 14.71 Avg. Volume SD = 17.90
Rating = Not applicable
Proxy ? Easily manipulated
Coronary artery bypass graft (CABG) volume (IQI 5)
Raw volume compared to annual thresholds (100 and 200 procedures).
Not applicable. Avg. Volume = 364.59 Avg. Volume SD = 321.62
Rating = Not applicable
Proxy ? Easily manipulated
Percutaneous transluminal coronary angioplasty (PTCA) volume (IQI 6)
Raw volume compared to annual thresholds (200 and 400 procedures).
Not applicable. Avg. Volume = 507.13 Avg. Volume SD = 515.74
Rating = Not applicable
Proxy ? Selection bias
Easily manipulated
Carotid endarterectomy (CEA) volume (IQI 7)
Raw volume compared to annual thresholds (50 and 101 procedures).
Not applicable. Avg. Volume = 57.84 Avg. Volume SD =66.09
Rating = Not applicable
Proxy Easily manipulated
Mortality Indicators for Inpatient Procedures
Esophageal resection mortality rate (IQI 8)
Number of deaths per 100 esophageal resections for cancer.
APR-DRG, though impact may be impaired by skewed distribution.
Provider Rate = 11.51 Provider SD = 28.88 Pop. Rate = 8.48
Rating = 8
? Confounding bias ? Unclear construct
validity

Version 2.1 17 Revision 3 (July 21, 2004)
Indicator Name (Number) Description
Risk Adjustment Used by QI Software
Empirical Performance
a
Literature Review Caveats
b
Pancreatic resection mortality rate (IQI 9)
Number of deaths per 100 pancreatic resections for cancer.
APR-DRG, though impact may be impaired by skewed distribution.
Provider Rate = 10.53 Provider SD = 25.11 Pop. Rate = 6.91
Rating = 5
? Confounding bias ? Unclear construct
validity
Pediatric heart surgery mortality rate (IQI 10)
Number of deaths per 100 heart surgeries in patients under age 18 years.
APR-DRG. Provider Rate = 4.90 Provider SD = 11.87 Pop. Rate = 4.97
Rating = 3
Confounding bias ? Unclear construct
validity ? Unclear benchmark
AAA repair mortality rate (IQI 11)
Number of deaths per 100 AAA repairs.
APR-DRG, though impact may be impaired by skewed distribution.
Provider Rate = 16.87 Provider SD = 22.97 Pop. Rate = 11.30
Rating = 8
Confounding bias ? Unclear construct
validity
CABG mortality rate (IQI 12)
Number of deaths per 100 CABG procedures.
APR-DRG. Provider Rate = 3.91 Provider SD = 4.35 Pop. Rate = 3.54
Rating = 5
? Selection bias
Confounding bias ? Unclear construct
validity ? Easily manipulated
PTCA mortality rate
c (IQI 30)
Number of deaths per 100 PTCAs
APR-DRG. Provider Rate = 2.05 Provider SD = 6.28 Pop. Rate = 1.46
Rating = not available
Not evaluated during initial literature review
CEA mortality rate
c (IQI 31)
Number of deaths per 100 CEAs.
APR-DRG. Provider Rate = 0.78 Provider SD = 2.63 Pop. Rate = 0.76
Rating = not available
Not evaluated during initial literature review
Craniotomy mortality rate (IQI 13)
Number of deaths per 100 craniotomies.
APR-DRG. Provider Rate = 9.74 Provider SD = 12.35 Pop. Rate = 7.59
Rating = 6
Confounding bias ? Unclear construct
validity
Hip replacement mortality rate (IQI 14)
Number of deaths per 100 hip replacements.
APR-DRG. Provider Rate = 0.38 Provider SD = 2.32 Pop. Rate = 0.25
Rating = 3
? Selection bias ? Confounding bias ? Unclear construct
validity
Mortality Indicators for Inpatient Conditions
Acute myocardial infarction (AMI) mortality rate (IQI 15)
Number of deaths per 100 discharges for AMI.
APR-DRG. Provider Rate = 15.41 Provider SD = 13.16 Pop. Rate = 10.24
Rating = 5
Information bias Confounding bias
Acute myocardial infarction (AMI) mortality rate, without transfer cases (IQI 32)
Number of deaths per 100 discharges for AMI.
APR-DRG. Provider Rate = 15.58 Provider SD = 12.98 Pop. Rate = 11.21
Rating = not available
Not evaluated during initial literature review

Version 2.1 18 Revision 3 (July 21, 2004)
Indicator Name (Number) Description
Risk Adjustment Used by QI Software
Empirical Performance
a
Literature Review Caveats
b
Congestive heart failure (CHF) mortality rate (IQI 16)
Number of deaths per 100 discharges for CHF.
APR-DRG. Provider Rate = 5.03 Provider SD = 4.39 Pop. Rate = 4.88
Rating = 6
Selection bias Information bias Confounding bias
Acute stroke mortality rate (IQI 17)
Number of deaths per 100 discharges for stroke.
APR-DRG Provider Rate = 11.19 Provider SD = 8.34 Pop. Rate = 11.66
Rating = 10
Selection bias ? Information bias
Confounding bias
Gastrointestinal (GI) hemorrhage mortality rate (IQI 18)
Number of deaths per 100 discharges for GI hemorrhage.
APR-DRG. Provider Rate = 3.46 Provider SD = 5.27 Pop. Rate = 3.41
Rating = 5
Confounding bias ? Unclear construct
validity
Hip fracture mortality rate (IQI 19)
Number of deaths per 100 discharges for hip fracture.
APR-DRG. Provider Rate = 3.45 Provider SD = 6.52 Pop. Rate = 3.07
Rating = 10
? Information bias
Confounding bias ? Unclear construct
validity
Pneumonia mortality rate (IQI 20)
Number of deaths per 100 discharges for pneumonia.
APR-DRG. Provider Rate = 8.11 Provider SD = 4.86 Pop. Rate = 8.95
Rating = 7
Selection bias ? Information bias
Confounding bias
Utilization Indicators - Provider (Hospital) Level
Cesarean delivery rate (IQI 21)
Number of Cesarean deliveries per 100 deliveries.
Age. Provider Rate = 20.33 Provider SD = 8.59 Pop. Rate = 19.88
Rating = 17
? Confounding bias ? Unclear construct
validity ? Unclear benchmark
Primary Cesarean Delivery rate (IQI 33)
Number of Cesarean deliveries per 100 deliveries in women with no history of previous Cesarean delivery.
Age. Provider Rate = 13.12 Provider SD = 7.45 Pop. Rate = 12.67
Rating = not available
Not evaluated during initial literature review
Vaginal birth after Cesarean (VBAC) rate, all (IQI 22)
Number of vaginal births per 100 deliveries in women with previous Cesarean delivery.
Age. Provider Rate = 26.54 Provider SD = 15.28 Pop. Rate = 28.45
Rating = 19
Selection bias ? Confounding bias ? Unclear construct
validity ? Unclear benchmark
Vaginal birth after Cesarean (VBAC) rate, uncomplicated (IQI 34)
Number of vaginal births per 100 deliveries in women with history of previous Cesarean delivery.
Age. Provider Rate = 25.45 Provider SD = 14.78 Pop. Rate = 27.32
Rating = not available
Not evaluated during initial literature review
Laparoscopic cholecystectomy rate (IQI 23)
Number of laparoscopic cholecystectomies per 100 cholecystectomies.
Age and sex. Provider Rate = 73.25 Provider SD = 18.65 Pop. Rate = 75.09
Rating = 20
Selection bias Confounding bias
? Unclear construct
validity Easily manipulated Unclear benchmark

Version 2.1 19 Revision 3 (July 21, 2004)
Indicator Name (Number) Description
Risk Adjustment Used by QI Software
Empirical Performance
a
Literature Review Caveats
b
Incidental appendectomy among the elderly rate (IQI 24)
Number of incidental appendectomies per 100 abdominal surgeries.
APR-DRG. Provider Rate = 2.83 Provider SD = 5.08 Pop. Rate = 2.43
Rating = 13
? Unclear construct
validity ? Easily manipulated
Bilateral cardiac catheterization rate (IQI 25)
Number of bilateral catheterizations per 100 cardiac catheterizations.
APR-DRG. Provider Rate = 11.19 Provider SD = 13.96 Pop. Rate = 9.93
Rating = 25
? Selection bias ? Unclear construct
validity
Utilization Indicators - Area Level
CABG rated
(IQI 26)
Number of CABGs per 100,000 population.
Age and sex. Area Rate = 137.39 Area SD = 378.23 Pop. Rate = 315.03
Rating = 19
Proxy Unclear construct
validity Unclear benchmark
PTCA rated
(IQI 27)
Number of PTCAs per 100,000 population.
Age and sex. Area Rate = 229.51 Area SD = 585.16 Pop. Rate = 528.16
Rating = 19
Proxy ? Selection bias
Unclear construct validity
Unclear benchmark
Hysterectomy rate (IQI 28)
Number of hysterectomies per 100,000 population.
Age and additional factors such as parity.
Area Rate = 437.16 Area SD = 397.36 Pop. Rate = 488.29
Rating = 22
Proxy ? Confounding bias
Unclear construct validity
Unclear benchmark
Laminectomy rate (IQI 29)
Number of laminectomies per 100,000 population.
Age and sex. Area Rate = 126.38 Area SD = 269.91 Pop. Rate = 250.98
Rating = 20
Proxy Unclear construct
validity Unclear benchmark
a Notes under Empirical Performance:
Provider Rates - Observed (unadjusted) and unweighted rates for providers (hospitals) and their standard
deviations (SD) were calculated using the HCUP Year 2000 SID from 27states. Provider rates are per 100. Area Rates - Observed (unadjusted) and unweighted rates for areas (counties) and their standard deviations
(SD) were based on 1371 geographic areas (counties) in the HCUP Year 2000 SID from 27 states. Area rates are per 100,000.
Population Rates - The population rates are weighted provider and area rates (weighted by the number of
discharges for each indicator or area populations). Ratings - Higher ratings in the Empirical Performance column indicate better performance on the nine empirical
tests. . b Notes under Literature Review Caveats:
Proxy – Indicator does not directly measure patient outcomes but an aspect of care that is associated with the
outcome; thus, it is best used with other indicators that measure similar aspects of care. Confounding bias – Patient characteristics may substantially affect the performance of the indicator; risk
adjustment is recommended. Unclear construct – There is uncertainty or poor correlation with widely accepted process measures.
Easily manipulated – Use of the indicator may create perverse incentives to improve performance on the
indicator without truly improving quality of care. Unclear benchmark – The ―correct rate‖ has not been established for the indicator; national, regional, or peer
group averages may be the best benchmark available. ? – The concern is theoretical or suggested, but no specific evidence was found in the literature.
– Indicates that the concern has been demonstrated in the literature.

Version 2.1 20 Revision 3 (July 21, 2004)
c PTCA and CEA mortality are not recommended as stand-alone indicators, but are suggested as
companion measures to the corresponding volume measures. d CABG and PTCA area utilization are not recommended as stand-alone indicators. They are
designed only for use with the corresponding volume and/or mortality measures.
Strengths and Limitations in Using the IQIs
This collection of AHRQ Quality Indicators represents the current state-of-the-art in assessing quality of care using hospital administrative data. However, these indicators must be used cautiously, because the administrative data on which the indicators are based are not collected for research purposes or for measuring quality of care, but for billing purposes. While these data are relatively inexpensive and convenient to use—and represent a rich data source that can provide valuable information—they should not be used as a definitive source of information on quality of health care. At least three limitations of administrative data warrant caution:
Coding differences across hospitals. Some hospitals code more thoroughly than others, making ―fair‖ comparisons across hospitals difficult.
Ambiguity about when a condition occurs. Most administrative data cannot distinguish unambiguously whether a specific condition was present at admission or whether it occurred during the stay (i.e., a possible complication).
Limitations in ICD-9-CM coding. The codes themselves are often not specific enough to adequately characterize a patient‘s condition, which makes it impossible to perfectly risk-adjust any administrative data set, thus fair comparisons across hospitals become difficult.
Ideally, the results on AHRQ IQIs for individual hospitals should be made available to those hospitals, with information on averages for a peer group, for the State, and for the nation. This information can be used by individual hospitals to launch investigations into reasons for potential quality problems. Further study may:
Reveal real quality problems for which quality improvement programs can be initiated.
Uncover problems in data collection that can be remedied through stepped-up efforts to code more diligently.
Determine that additional clinical information is required to understand the quality issues, beyond what can be obtained through billing data alone.
In short, the AHRQ IQIs are a valuable tool that takes advantage of readily available data to flag potential quality-of-care problems.
Questions for Future Work
The limitations discussed above suggest some directions for future work on development and use of the IQIs. Additional data and linkages could provide insights into whether the findings represent true quality problems, and could facilitate the exploration of potential interventions to prevent such events.
Hospitals with higher than average mortality rates for specific procedures or conditions should probe the underlying reasons: Are patients more severely ill? Is there a problem in the selection of patients for this particular procedure? Is there a quality-of-care problem? Although the mortality indicators use APR-DRG risk adjustment, limitations in the clinical sensitivity of administrative data mean that it is not possible to unambiguously measure and

Version 2.1 21 Revision 3 (July 21, 2004)
control for patient severity of illness. These indicators provide a starting point for further investigations that might explore severity of illness differences.
For hospitals with low volumes of particular procedures, how do patients fare? What is the mortality rate for patients who receive this procedure at this hospital compared with other hospitals? What is the resource use associated with receiving this procedure at this hospital compared with other hospitals? Is there evidence of higher complication rates that suggest a problem in quality of care?
What are potential explanations for hospitals with higher-than-average utilization rates? Is this hospital a referral center for this procedure? Do patients come from outside the area to receive their procedures at this hospital? Or is there evidence that patients from this area are receiving a greater number of procedures than expected? The AHRQ area-level IQIs use either the county (MSA) where the hospital is located or the county (MSA) of the patient's residence to define areas. The default is the hospital location because the IQIs presume the common denominator discharge data set (data elements routinely available across most discharge data systems); information such as patient county is often not available. High area rates might be due to patients admitted to a hospital that live outside the county where the hospitals is located. The MSA option is an alternative (patients admitted to a hospital are less likely to live outside the hospital's MSA). The preferred option is to use the county (MSA) of the residence of the patient. Then the area rate reflects the number of admissions for residents of that area to any hospital, regardless of location.
For two indicators, bilateral cardiac catheterization and incidental appendectomy, very few, if any, of there procedures are expected. Records for these patients could be examined to discern a possible justification for performing these procedures.

Version 2.1 22 Revision 3 (July 21, 2004)
Detailed Evidence for Inpatient Quality Indicators This section provides an abbreviated presentation of the details of the literature review and the empirical evaluation for each IQI, including:
The relationship between the indicator and quality of health care services
A suggested benchmark or comparison
The definition of each indicator
The numerator (or outcome of interest)
The denominator (or population at risk)
The results of the empirical testing The two-page descriptions for each indicator include a discussion of the summary of evidence, the limitations on using each indicator, and details on the following:
Face validity – Does the indicator capture an aspect of quality that is widely regarded as important and subject to provider or public health system control?
Precision – Is there a substantial amount of provider or community level variation that is not attributable to random variation?
Minimum bias – Is there either little effect on the indicator of variations in patient disease severity and comorbidities, or is it possible to apply risk adjustment and statistical methods to remove most or all bias?
Construct validity – Does the indicator perform well in identifying true (or actual) quality of care problems?
Fosters true quality improvement – Is the indicator insulated from perverse incentives for providers to improve their reported performance by avoiding difficult or complex cases, or by other responses that do not improve quality of care?
Prior use – Has the measure been used effectively in practice? Does it have potential for working well with other indicators?
A full report on the literature review and empirical evaluation can be found in Refinement of the HCUP Quality Indicators by the UCSF-Stanford EPC, available at AHRQ‘s Quality Indicator Web site http://www.qualityindicators.ahrq.gov/. Detailed coding information for each IQI is provided in Appendix A.

Version 2.1 23 Revision 3 (July 21, 2004)
Esophageal Resection Volume (IQI 1)
Esophageal cancer surgery is a rare procedure that requires technical proficiency; and errors in surgical technique or management may lead to clinically significant complications, such as sepsis, pneumonia, anastomotic breakdown, and death.
Relationship to Quality Higher volumes have been associated with better outcomes, which represent better quality.
Benchmark Threshold 1: 6 or more procedures per year17
Threshold 2: 7 or more procedures per year
17 18
Definition Raw volume of provider-level esophageal resection.
Numerator Discharges with ICD-9-CM codes of 4240 through 4242 in any procedure field and a diagnosis code of esophageal cancer in any field. Exclude MDC 14 (pregnancy, childbirth, and puerperium) and MDC 15 (newborns and other neonates).
Denominator Not applicable.
Type of Indicator Provider Level, Procedure Volume Indicator
Empirical Rating Not applicable.
Summary of Evidence The relative rarity of esophageal resection results in an indicator that is less precise than most volume indicators, although still highly adequate for use as a quality indicator. Hospitals should examine more than one year of data if possible and average volumes for a more precise estimate. Hospitals may also consider use with the pancreatic resection indicator, another complex cancer surgery. The volume-outcome relationship on which this indicator is based may not hold over time, as providers become more experienced or as technology changes. Most hospitals perform fewer than 10 procedures in a 5-year period; however, relatively strong relationships between volume and outcome—specifically post-operative mortality—have been noted in the literature. Empirical evidence shows that a low percentage of procedures were performed at high-volume hospitals. At threshold 1, 39.5% of esophageal resection procedures were performed at high-volume providers (and 8.6% of providers are high volume).
17 At threshold 2, 34.3% were
17
Patti MG, Corvera CU, Glasgow RE, et al.
A hospital‘s annual rate of esophagectomy influences
performed at high-volume providers (and 6.4% of providers are high volume).
18 19
Limitations on Use As a volume indicator, esophageal resection is a proxy measure for quality and should be used with other indicators. Details Face validity: Does the indicator capture an aspect of quality that is widely regarded as important and subject to provider or public health system control? The face validity of esophageal resection depends on whether a strong association with outcomes of care is both plausible and widely accepted in the professional community. No
the operative mortality rate. J Gastrointest Surg 1998;2(2):186-92.
18
Dudley RA, Johansen KL, Brand R, et al.
Selective referral to high-volume hospitals: estimating potentially avoidable deaths. JAMA 2000;283(9):1159-66.
19
Nationwide Inpatient Sample and State
Inpatient Databases. Healthcare Cost and Utilization Project. Agency for Healthcare Research and Quality, Rockville, MD. http://www.ahrq.gov/data/hcup

Version 2.1 24 Revision 3 (July 21, 2004)
consensus recommendations regarding minimum procedure volume currently exist. Precision: Is there a substantial amount of provider or community level variation that is not attributable to random variation? Esophageal resection is measured accurately with discharge data. Most facilities perform 10 or fewer esophagectomies for cancer during a 5-year period; therefore, this indicator is expected to have poor precision. Minimal bias: Is there either little effect on the indicator of variations in patient disease severity and comorbidities, or is it possible to apply risk adjustment and statistical methods to remove most or all bias? Risk adjustment is not appropriate, because volume measures are not subject to bias due to disease severity and comorbidities. Construct validity: Does the indicator perform well in identifying true (or actual) quality of care problems? Higher volumes have been repeatedly associated with better outcomes after esophageal surgery, although these findings may be limited by inadequate risk adjustment of the outcome measure. Only one study used clinical data to estimate the association between hospital volume and mortality following esophageal cancer surgery. Begg et al. analyzed retrospective data from the Surveillance, Epidemiology, and End Results (SEER)-Medicare linked database from 1984 through 1993.
20 The crude 30-day mortality rate
was 17.3% at hospitals that performed 1-5 esophagectomies on Medicare patients during the study period, versus 3.9% and 3.4% at hospitals that performed 6-10 and 11 or more esophagectomies, respectively. The association between volume and mortality remained highly significant (p<.001) in a multivariate model, adjusting for the number of comorbidities, cancer stage and volume, and age.
20
Begg CB, Cramer LD, Hoskins WJ, et al.
Impact of hospital volume on operative mortality for major cancer surgery. JAMA 1998;280(20):1747-51.
Studies based on California and Maryland data found that the risk-adjusted mortality rates at low-volume hospitals were around 3.0 times those at high-volume hospitals.
21 22
Empirical evidence shows that esophageal resection volume—after adjusting for age, sex, and APR-DRG—is moderately and negatively correlated with mortality for esophageal resection (r=-.29, p<.05), as well as mortality after other cancer resection procedures.
23
Fosters true quality improvement: Is the indicator insulated from perverse incentives for providers to improve their reported performance by avoiding difficult or complex cases, or by other responses that do not improve quality of care? Low-volume providers may attempt to increase their volume without improving quality of care by performing the procedure on patients who may not qualify or benefit from the procedure. Additionally, shifting procedures to high-volume providers may impair access to care for certain types of patients. Prior use: Has the measure been used effectively in practice? Does it have potential for working well with other indicators? Esophageal cancer surgical volume has not been widely used as an indicator of quality.
21
Patti MG, Corvera CU, Glasgow RE, et al.
A hospital‘s annual rate of esophagectomy influences the operative mortality rate. J Gastrointest Surg 1998;2(2):186-92.
22
Gordan TA, Bowman HM, Bass EB, et al.
Complex gastrointestinal surgery: impact of provider experience on clinical and economic outcomes. J Am Coll Surg 1999;189(1):46-56.
23
Nationwide Inpatient Sample.

Version 2.1 25 Revision 3 (July 21, 2004)
Pancreatic Resection Volume (IQI 2)
Pancreatic resection is a rare procedure that requires technical proficiency; and errors in surgical technique or management may lead to clinically significant complications, such as sepsis, anastomotic breakdown, and death.
Relationship to Quality Higher volumes have been associated with better outcomes, which represent better quality.
Benchmark Threshold 1: 10 or more procedures per year24
Threshold 2: 11 or more procedures per year
24 25
Definition Raw volume of provider-level pancreatic resection.
Numerator Discharges with ICD-9-CM codes of 526 or 527 in any procedure field and a diagnosis code of pancreatic cancer in any field. Exclude MDC 14 (pregnancy, childbirth, and puerperium) and MDC 15 (newborns and other neonates).
Denominator Not applicable.
Type of Indicator Provider Level, Procedure Volume Indicator
Empirical Rating Not applicable.
Summary of Evidence
The relative rarity of pancreatic resection results in an indicator that is less precise than most volume indicators, although still highly adequate for use as a quality indicator. Hospitals should examine more than one year of data if possible and average volumes for a more precise estimate. Hospitals may also consider use with the esophageal resection indicator, another complex cancer surgery. Most hospitals perform fewer than 10 procedures in a 5-year period; however, relatively strong relationships between volume and outcome—specifically post-operative mortality—have been noted in the literature.
Empirical evidence shows that a low percentage of procedures were performed at high-volume hospitals. At threshold 1, 30.3% of pancreatic resection procedures were performed at high-volume providers (and 5.1% of providers are high volume).
24 At threshold 2, 27.0% were
performed at high-volume providers (and 4.2% of providers are high volume).
25 26
24
Glasgow RE, Mulvihill SJ. Hospital volume
influences outcome in patients undergoing pancreatic resection for cancer. West J Med 1996;165(5):294-300.
25
Glasgow, Mulvihill, 1996.
Limitations on Use As a volume indicator, pancreatic resection is a proxy measure for quality and should be used with other indicators.
Details Face validity: Does the indicator capture an aspect of quality that is widely regarded as important and subject to provider or public health system control?
The face validity of pancreatic resection depends on whether a strong association with outcomes of care is both plausible and widely accepted in the professional community. No recommendations regarding minimum procedure volume exist. Precision: Is there a substantial amount of provider or community level variation that is not attributable to random variation?
Pancreatic resection is measured accurately with discharge data. Most facilities perform 10 or fewer pancreatectomies for cancer during a 5-year period; therefore, this indicator is expected to have poor precision.
26
Nationwide Inpatient Sample and State
Inpatient Databases. Healthcare Cost and Utilization Project. Agency for Healthcare Research and Quality, Rockville, MD. http://www.ahrq.gov/data/hcup
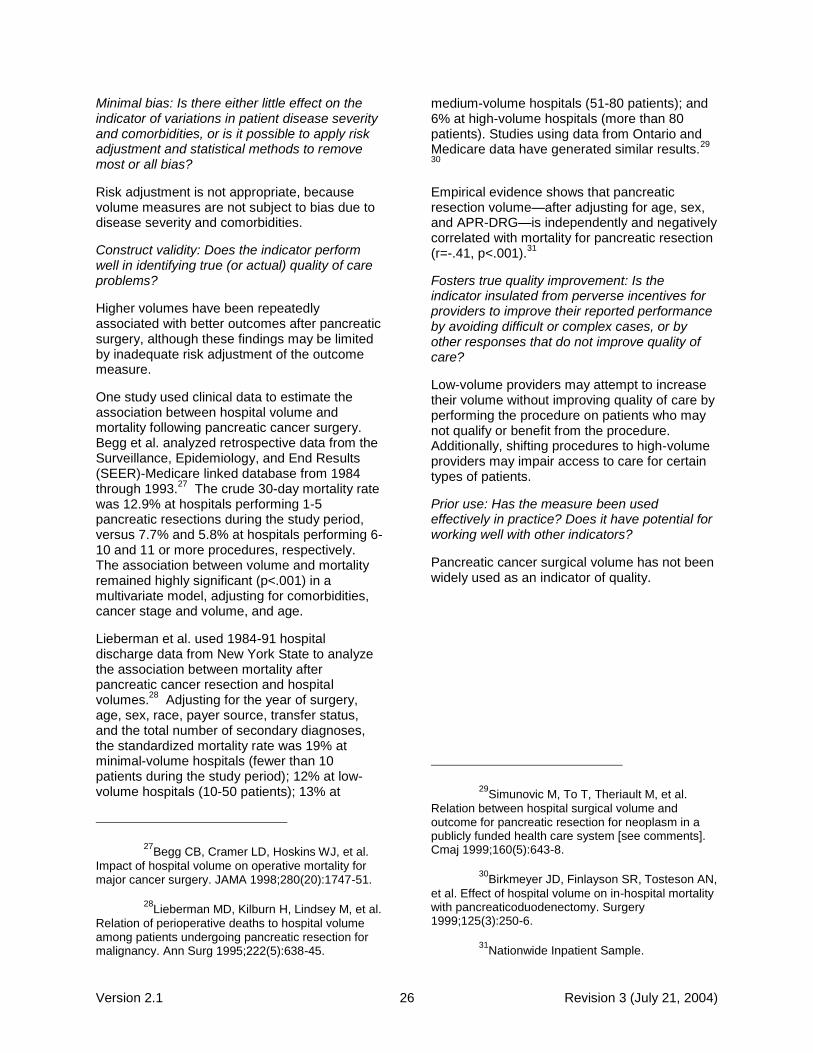
Version 2.1 26 Revision 3 (July 21, 2004)
Minimal bias: Is there either little effect on the indicator of variations in patient disease severity and comorbidities, or is it possible to apply risk adjustment and statistical methods to remove most or all bias?
Risk adjustment is not appropriate, because volume measures are not subject to bias due to disease severity and comorbidities.
Construct validity: Does the indicator perform well in identifying true (or actual) quality of care problems?
Higher volumes have been repeatedly associated with better outcomes after pancreatic surgery, although these findings may be limited by inadequate risk adjustment of the outcome measure.
One study used clinical data to estimate the association between hospital volume and mortality following pancreatic cancer surgery. Begg et al. analyzed retrospective data from the Surveillance, Epidemiology, and End Results (SEER)-Medicare linked database from 1984 through 1993.
27 The crude 30-day mortality rate
was 12.9% at hospitals performing 1-5 pancreatic resections during the study period, versus 7.7% and 5.8% at hospitals performing 6-10 and 11 or more procedures, respectively. The association between volume and mortality remained highly significant (p<.001) in a multivariate model, adjusting for comorbidities, cancer stage and volume, and age.
Lieberman et al. used 1984-91 hospital discharge data from New York State to analyze the association between mortality after pancreatic cancer resection and hospital volumes.
28 Adjusting for the year of surgery,
age, sex, race, payer source, transfer status, and the total number of secondary diagnoses, the standardized mortality rate was 19% at minimal-volume hospitals (fewer than 10 patients during the study period); 12% at low-volume hospitals (10-50 patients); 13% at
27
Begg CB, Cramer LD, Hoskins WJ, et al.
Impact of hospital volume on operative mortality for major cancer surgery. JAMA 1998;280(20):1747-51.
28
Lieberman MD, Kilburn H, Lindsey M, et al.
Relation of perioperative deaths to hospital volume among patients undergoing pancreatic resection for malignancy. Ann Surg 1995;222(5):638-45.
medium-volume hospitals (51-80 patients); and 6% at high-volume hospitals (more than 80 patients). Studies using data from Ontario and Medicare data have generated similar results.
29
30
Empirical evidence shows that pancreatic resection volume—after adjusting for age, sex, and APR-DRG—is independently and negatively correlated with mortality for pancreatic resection (r=-.41, p<.001).
31
Fosters true quality improvement: Is the indicator insulated from perverse incentives for providers to improve their reported performance by avoiding difficult or complex cases, or by other responses that do not improve quality of care?
Low-volume providers may attempt to increase their volume without improving quality of care by performing the procedure on patients who may not qualify or benefit from the procedure. Additionally, shifting procedures to high-volume providers may impair access to care for certain types of patients.
Prior use: Has the measure been used effectively in practice? Does it have potential for working well with other indicators?
Pancreatic cancer surgical volume has not been widely used as an indicator of quality.
29
Simunovic M, To T, Theriault M, et al.
Relation between hospital surgical volume and outcome for pancreatic resection for neoplasm in a publicly funded health care system [see comments]. Cmaj 1999;160(5):643-8.
30
Birkmeyer JD, Finlayson SR, Tosteson AN,
et al. Effect of hospital volume on in-hospital mortality with pancreaticoduodenectomy. Surgery 1999;125(3):250-6.
31
Nationwide Inpatient Sample.

Version 2.1 27 Revision 3 (July 21, 2004)
Pediatric Heart Surgery Volume (IQI 3)
Pediatric heart surgery requires proficiency with the use of complex equipment; and technical errors may lead to clinically significant complications, such as arrhythmias, congestive heart failure, and death.
Relationship to Quality Higher volumes have been associated with better outcomes, which represent better quality.
Benchmark Threshold: 100 or more procedures per year32 33
Definition Raw volume of pediatric heart surgery.
Numerator Discharges with ICD-9-CM procedure codes for either congenital heart disease (1P) in any field or non-specific heart surgery (2P) in any field and ICD-9-CM diagnosis of congenital heart disease (2D) in any field. Age less than 18 years old. MDC 14 (pregnancy, childbirth and pueperium); patients with transcatheter interventions (either 3AP, 3BP, 3CP, 3DP, 3EP with 3D, or 3FP) as single cardiac procedures, performed without bypass (5P) but with catheterization (6P); and patients with septal defects (4P) as single cardiac procedures without bypass (5P).
Denominator Not applicable.
Type of Indicator Provider Level, Procedure Volume Indicator
Empirical Rating Not applicable.
Summary of Evidence Pediatric heart surgery includes a number of procedures that vary in difficulty. Higher volumes of pediatric heart surgery have been associated with fewer in-hospital deaths. This indicator is measured with great precision, although volume indicators overall are not direct measures of quality and are relatively insensitive. For this reason, pediatric heart surgery should be used in conjunction with other measures of mortality to ensure that increasing volumes truly improve patient outcomes. The volume-outcome relationship on which this indicator is based may not hold over time, as providers become more experienced or as technology changes. Empirical analyses show that approximately 75% of pediatric heart surgeries are already performed at high-volume hospitals, suggesting regionalization. This leaves little room for improvement. Empirical evidence shows that a moderate percentage of procedures were performed at high-volume hospitals. At threshold 1, 75.5% of pediatric heart surgeries
were performed at high-volume providers (and 21% of providers are high volume).
32 33
Limitations on Use As a volume indicator, pediatric surgery is a proxy measure for quality and should be used with other indicators. Details Face validity: Does the indicator capture an aspect of quality that is widely regarded as important and subject to provider or public health system control? The face validity of pediatric surgery depends on whether a strong association with outcomes of care is both plausible and widely accepted in the
32
Hannan EL, Racz M, Kavey RE, et al.
Pediatric cardiac surgery: the effect of hospital and surgeon volume on in-hospital mortality. Pediatrics 1998;101(6):963-9.
33
Nationwide Inpatient Sample and State
Inpatient Databases. Healthcare Cost and Utilization Project. Agency for Healthcare Research and Quality, Rockville, MD. http://www.ahrq.gov/data/hcup

Version 2.1 28 Revision 3 (July 21, 2004)
professional community. No recommendations regarding minimum procedure volume currently exist. Precision: Is there a substantial amount of provider or community level variation that is not attributable to random variation? Pediatric heart surgery is measured accurately with discharge data. Studies suggest that pediatric heart surgery is already highly concentrated at a relatively small number of facilities. This highly skewed volume distribution may have an adverse effect on the precision of this measure. Minimal bias: Is there either little effect on the indicator of variations in patient disease severity and comorbidities, or is it possible to apply risk adjustment and statistical methods to remove most or all bias? Risk adjustment is not appropriate, because volume measures are not subject to bias due to disease severity and comorbidities. Construct validity: Does the indicator perform well in identifying true (or actual) quality of care problems? Although higher volumes have been repeatedly associated with better outcomes after pediatric cardiac surgery, these findings may be limited by inadequate risk adjustment of the outcome measure. A study using hospital discharge data showed that risk-adjusted mortality differed between low- and high-volume hospitals. Jenkins et al. estimated risk-adjusted mortality rates of 8.35% for low-volume hospitals (100 or fewer cases) and 5.95% for high-volume hospitals (more than 100 cases).
3435 They also demonstrated
especially high risk-adjusted mortality (18.5%) at very low-volume hospitals (fewer than 10 cases
34
Jenkins KJ, Newburger JW, Lock JE, et al.
In-hospital mortality for surgical repair of congenital heart defects: preliminary observations of variation by hospital caseload. Pediatrics 1995;95(3):323-30.
35 Jenkins KJ et al. Center-specific
differences in mortality: preliminary analyses using the Risk Adjustment in Congenital Heart Surgery (RACHS-1) method. J Thorac Cardiovasc Surg. 2002 Jul;124(1):97-104.
per year) and especially low risk-adjusted mortality (3.0%) at very high-volume hospitals (more than 300 cases per year). Sollano et al. reported a modest but statistically significant volume effect for higher-risk procedures (OR=0.944 for each additional 100 annual cases), which was limited to neonates and post-neonatal infants in stratified analyses.
36
Empirical evidence shows that pediatric heart surgery volume is independently and negatively correlated with mortality (r=-.27, p<.05).
37
However, this analysis does not include the intensive risk adjustment included in the volume studies described in the literature. Fosters true quality improvement: Is the indicator insulated from perverse incentives for providers to improve their reported performance by avoiding difficult or complex cases, or by other responses that do not improve quality of care? Low-volume providers may attempt to increase their volume without improving quality of care by performing the procedure on patients who may not qualify or benefit from the procedure. Additionally, shifting procedures to high-volume providers may impair access to care for certain types of patients. Prior use: Has the measure been used effectively in practice? Does it have potential for working well with other indicators? Pediatric heart surgery volume has not been widely used as an indicator of quality.
36
Sollano JA, Gelijns AC, Moskowitz AJ et al.
Volume-outcome relationships on cardiovascular operations: New York State, 1990-1995. J Thorac Cardiovasc Surg 1999;117(3):419-28.
37
Nationwide Inpatient Sample.

Version 2.1 29 Revision 3 (July 21, 2004)
Abdominal Aortic Aneurysm Repair Volume (IQI 4)
Abdominal Aortic Aneurysm (AAA) repair is a relatively rare procedure that requires proficiency with the use of complex equipment; and technical errors may lead to clinically significant complications, such as arrhythmias, acute myocardial infarction, colonic ischemia, and death.
Relationship to Quality Higher volumes have been associated with better outcomes, which represent better quality.
Benchmark Threshold 1: 10 or more procedures per year38
Threshold 2: 32 or more procedures per year
39 40 41
Definition Raw volume of provider-level AAA repair.
Numerator Discharges with ICD-9-CM codes of 3834, 3844, and 3864 in any procedure field with a diagnosis code of AAA in any field. Exclude MDC 14 (pregnancy, childbirth, and puerperium) and MDC 15 (newborns and other neonates).
Denominator Not applicable.
Type of Indicator Provider Level, Procedure Volume Indicator
Empirical Rating Not applicable.
Summary of Evidence
AAA repair volume is measured with great precision, although volume indicators overall are not direct measures of quality and are relatively insensitive. For this reason, this indicator should be used in conjunction with other measures of mortality to ensure that increasing volumes truly improve patient outcomes. The volume-outcome relationship on which this indicator is based may not hold over time, as providers become more experienced or as technology changes.
As noted in the literature, higher volume hospitals have lower mortality than lower volume hospitals, and the differences in patient case-mix do not account fully for these relationships.
Empirical evidence shows that a moderate to low percentage of procedures were performed at high-volume hospitals, depending on which threshold is used. At threshold 1, 83.9% of AAA repair procedures were performed at high-volume providers (and 44.3% of providers are high volume). At threshold 2, 43.0% were performed at high-volume providers (and 12.2% of providers are high volume).
38 39
40
41
38
Hannan EL, Kilburn H, Jr., O‘Donnell JF, et
al. A longitudinal analysis of the relationship between in-hospital mortality in New York state and the volume of abdominal aortic aneurysm surgeries performed. Health Serv Res 1992;27(4):517-42.
Limitations on Use As a volume indicator, AAA repair is a proxy measure for quality and should be used with other indicators.
Details Face validity: Does the indicator capture an aspect of quality that is widely regarded as important and subject to provider or public health system control? The face validity of AAA repair depends on whether a strong association with outcomes of care is widely accepted in the professional community. No consensus recommendations about minimum procedure volume currently exist.
39
Kazmers A, Jacobs L, Perkins A, et al.
Abdominal aortic aneurysm repair in Veterans Affairs medical centers. J Vasc Surg 1996;23(2):191-200.
40
Pronovost PJ, Jenckes MW, Dorman T, et
al. Organizational characteristics of intensive care units related to outcomes of abdominal aortic surgery. JAMA 1999;281(14):1310-7.
41
Nationwide Inpatient Sample and State
Inpatient Databases. Healthcare Cost and Utilization Project. Agency for Healthcare Research and Quality, Rockville, MD. http://www.ahrq.gov/data/hcup/
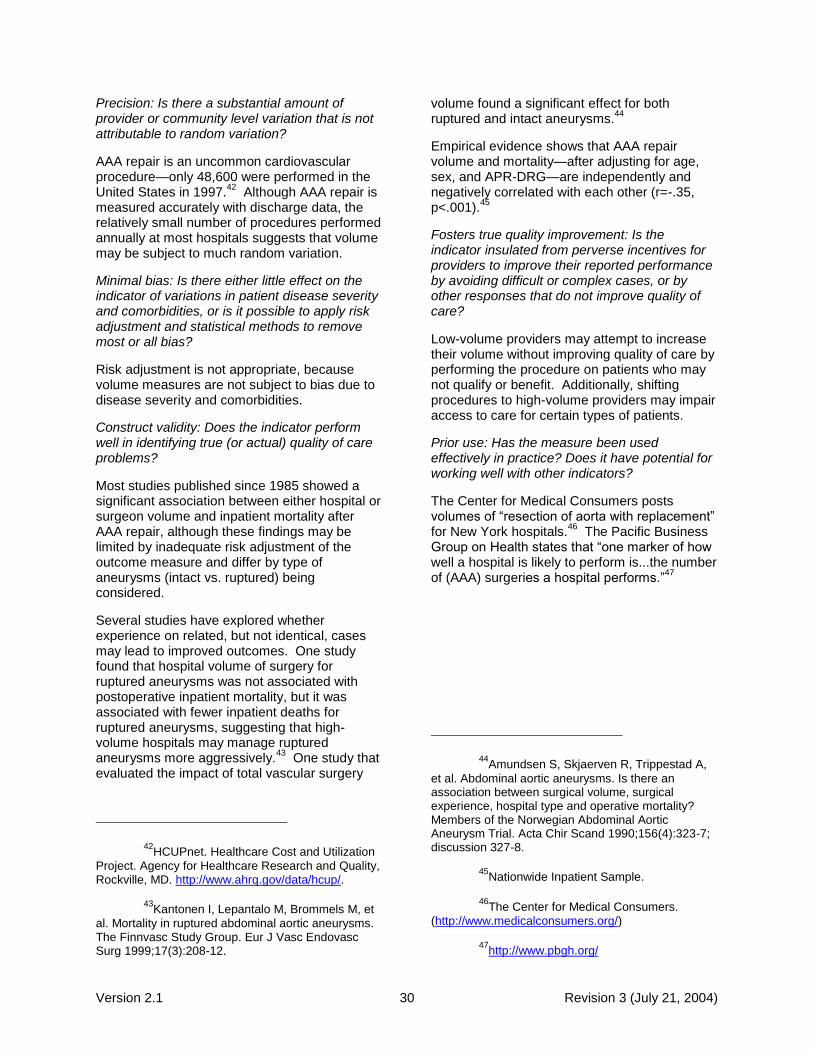
Version 2.1 30 Revision 3 (July 21, 2004)
Precision: Is there a substantial amount of provider or community level variation that is not attributable to random variation?
AAA repair is an uncommon cardiovascular procedure—only 48,600 were performed in the United States in 1997.
42 Although AAA repair is
measured accurately with discharge data, the relatively small number of procedures performed annually at most hospitals suggests that volume may be subject to much random variation.
Minimal bias: Is there either little effect on the indicator of variations in patient disease severity and comorbidities, or is it possible to apply risk adjustment and statistical methods to remove most or all bias?
Risk adjustment is not appropriate, because volume measures are not subject to bias due to disease severity and comorbidities.
Construct validity: Does the indicator perform well in identifying true (or actual) quality of care problems?
Most studies published since 1985 showed a significant association between either hospital or surgeon volume and inpatient mortality after AAA repair, although these findings may be limited by inadequate risk adjustment of the outcome measure and differ by type of aneurysms (intact vs. ruptured) being considered.
Several studies have explored whether experience on related, but not identical, cases may lead to improved outcomes. One study found that hospital volume of surgery for ruptured aneurysms was not associated with postoperative inpatient mortality, but it was associated with fewer inpatient deaths for ruptured aneurysms, suggesting that high-volume hospitals may manage ruptured aneurysms more aggressively.
43 One study that
evaluated the impact of total vascular surgery
42
HCUPnet. Healthcare Cost and Utilization
Project. Agency for Healthcare Research and Quality, Rockville, MD. http://www.ahrq.gov/data/hcup/.
43
Kantonen I, Lepantalo M, Brommels M, et
al. Mortality in ruptured abdominal aortic aneurysms. The Finnvasc Study Group. Eur J Vasc Endovasc Surg 1999;17(3):208-12.
volume found a significant effect for both ruptured and intact aneurysms.
44
Empirical evidence shows that AAA repair volume and mortality—after adjusting for age, sex, and APR-DRG—are independently and negatively correlated with each other (r=-.35, p<.001).
45
Fosters true quality improvement: Is the indicator insulated from perverse incentives for providers to improve their reported performance by avoiding difficult or complex cases, or by other responses that do not improve quality of care?
Low-volume providers may attempt to increase their volume without improving quality of care by performing the procedure on patients who may not qualify or benefit. Additionally, shifting procedures to high-volume providers may impair access to care for certain types of patients.
Prior use: Has the measure been used effectively in practice? Does it have potential for working well with other indicators?
The Center for Medical Consumers posts volumes of ―resection of aorta with replacement‖ for New York hospitals.
46 The Pacific Business
Group on Health states that ―one marker of how well a hospital is likely to perform is...the number of (AAA) surgeries a hospital performs.‖
47
44
Amundsen S, Skjaerven R, Trippestad A,
et al. Abdominal aortic aneurysms. Is there an association between surgical volume, surgical experience, hospital type and operative mortality? Members of the Norwegian Abdominal Aortic Aneurysm Trial. Acta Chir Scand 1990;156(4):323-7; discussion 327-8.
45
Nationwide Inpatient Sample.
46
The Center for Medical Consumers.
(http://www.medicalconsumers.org/)
47
http://www.pbgh.org/

Version 2.1 31 Revision 3 (July 21, 2004)
Coronary Artery Bypass Graft Volume (IQI 5)
Coronary artery bypass graft (CABG) requires proficiency with the use of complex equipment; and technical errors may lead to clinically significant complications, such as myocardial infarction, stroke, and death.
Relationship to Quality Higher volumes have been associated with better outcomes, which represent better quality.
Benchmark Threshold 1: 100 or more procedures per year48
Threshold 2: 200 or more procedures per year
49 50
Definition Raw volume of provider-level CABG.
Numerator Discharges with ICD-9-CM codes of 3610 through 3619 in any procedure field. Age 40 years and older. Exclude MDC 14 (pregnancy, childbirth, and puerperium) and MDC 15 (newborns and other neonates).
Denominator Not applicable.
Type of Indicator Provider Level, Procedure Volume Indicator
Empirical Rating Not applicable.
Summary of Evidence
CABG is measured with great precision, although volume indicators overall are not direct measures of quality and are relatively insensitive. For this reason, CABG should be used in conjunction with other measures of mortality to ensure that increasing volumes truly improve patient outcomes.
As noted in the literature, higher volumes of CABG have been associated with fewer deaths. However, the American Heart Association (AHA) and the American College of Cardiology (ACC) recommend that since some low-volume hospitals have very good outcomes, other measures besides volume should be used to evaluate individual surgeon‘s performance.
Empirical evidence shows that a high percentage of procedures were performed at high-volume hospitals. At threshold 1, 98.3% of CABG procedures were performed at high-volume providers (and 88% of providers are high volume).
48 At threshold 2, 90.7% were
48
Eagle KA, Guyton RA, Davidoff R, et al.
ACC/AHA Guidelines for Coronary Artery Bypass Graft Surgery: A Report of the American College of Cardiology/American Heart Association Task Force on Practice Guidelines (Committee to Revise the 1991 Guidelines for Coronary Artery Bypass Graft
performed at high-volume providers (and 68% of providers are high volume).
49 50
Limitations on Use
As a volume indicator, CABG is a proxy measure for quality and should be used with other indicators.
Details
Face validity: Does the indicator capture an aspect of quality that is widely regarded as important and subject to provider or public health system control?
The face validity of CABG depends on whether a strong association with outcomes of care is both plausible and widely accepted in the
Surgery). American College of Cardiology/American Heart Association. J Am Coll Cardiol 1999;34(4):1262-347.
49
Hannan EL, Kilburn H, Jr., Bernard H, et al.
Coronary artery bypass surgery: the relationship between inhospital mortality rate and surgical volume after controlling for clinical risk factors. Med Care 1991;29(11):1094-107.
50
Nationwide Inpatient Sample and State
Inpatient Databases. Healthcare Cost and Utilization Project. Agency for Healthcare Research and Quality, Rockville, MD. http://www.ahrq.gov/data/hcup

Version 2.1 32 Revision 3 (July 21, 2004)
professional community. The AHA and ACC have argued for ―careful outcome tracking‖ and supported ―monitoring institutions and individuals who annually perform fewer than 100 cases,‖ although the panel noted that ―some institutions and practitioners maintain excellent outcomes despite relatively low volumes.‖
51
Precision: Is there a substantial amount of provider or community level variation that is not attributable to random variation?
CABG is measured accurately with discharge data. The large number of procedures performed annually at most hospitals suggests that annual volume is not subject to considerable random variation. Hannan et al. reported year-to-year hospital volume correlations of 0.96-0.97 in New York.
52
Minimal bias: Is there either little effect on the indicator of variations in patient disease severity and comorbidities, or is it possible to apply risk adjustment and statistical methods to remove most or all bias?
Risk adjustment is not appropriate, because volume measures are not subject to bias due to disease severity and comorbidities.
Construct validity: Does the indicator perform well in identifying true (or actual) quality of care problems?
Higher volumes have been repeatedly associated with better outcomes of care, although these findings may be limited by inadequate risk adjustment of the outcome measure.
Hannan found that the adjusted relative risk of inpatient death at high-volume hospitals (more than 200 cases per year) in 1989-92 was 0.84, compared with low-volume hospitals.
53
However, only 3.3% of patients in that study underwent CABG at a low-volume hospital. Analyses using instrumental variables
51
Eagle et al. 1999.
52
Hannan EL, Kilburn H Jr., Racz M, et al.
Improving the outcomes of coronary artery bypass surgery in New York state. JAMA 1994;271(10):761-6.
53
Hannan et al. 1994.
suggested that much of the volume effect may be due to ―selective referral‖ of patients to high-quality centers.
54 55
Empirical evidence shows that CABG volume and mortality—after adjusting for age, sex, and APR-DRG—is independently and negatively correlated with mortality for CABG (r=-.29, p<.001).
56
Fosters true quality improvement: Is the indicator insulated from perverse incentives for providers to improve their reported performance by avoiding difficult or complex cases, or by other responses that do not improve quality of care?
Low-volume providers may attempt to increase their volume without improving quality of care by performing the procedure on patients who may not qualify or benefit from the procedure. Additionally, shifting procedures to high-volume providers may impair access to care for certain types of patients.
Prior use: Has the measure been used effectively in practice? Does it have potential for working well with other indicators?
Specific CABG volume thresholds have been suggested as ―standards‖ for the profession. The Pacific Business Group on Health states that ―one marker of how well a hospital is likely to perform is...the number of (CABG) surgeries a hospital performs.‖
57
54
Farley, DE, Ozminkowski RJ. Volume-
outcome relationships and in-hospital mortality: the effect of changes in volume over time. Med Care 1992;30(1):77-94.
55
Luft HS, Hunt SS, Maerki SC. The volume-
outcome relationship: practice-makes-perfect or selective-referral patterns? Health Serv Res 1987;22(2):157-82.
56
Nationwide Inpatient Sample.
57
http://www.pbgh.org/

Version 2.1 33 Revision 3 (July 21, 2004)
Percutaneous Transluminal Coronary Angioplasty Volume (IQI 6)
Percutaneous transluminal coronary angioplasty (PTCA) is a relatively common procedure that requires proficiency with the use of complex equipment, and technical errors may lead to clinically significant complications. The definition for PTCA mortality rate (IQI 30) is also noted below. The QI software calculates mortality for PTCA, so that the volumes for this procedure can be examined in conjunction with mortality. However, the mortality measure should not be examined independently, because it did not meet the literature review and empirical evaluation criteria to stand alone as its own measure.
Relationship to Quality Higher volumes have been associated with better outcomes, which represent better quality.
Benchmark Threshold 1: 200 or more procedures per year58
Threshold 2: 400 or more procedures per year
59 60
Definition Raw volume of PTCA.
Numerator Discharges with ICD-9-CM codes 3601, 3602, 3605, or 3606 in any procedure field. Age 40 years and older. Exclude MDC 14 (pregnancy, childbirth, and puerperium) and MDC 15 (newborns and other neonates).
Denominator Not applicable.
Type of Indicator Provider Level, Procedure Volume Indicator
Empirical Rating Not applicable.
PTCA Mortality Rate (IQI 30)
Relationship to Quality Better processes of care may reduce short-term mortality, which represents better quality.
Definition Number of deaths per 100 PTCAs.
Numerator Number of deaths with a code of PTCA in any procedure field.
Denominator Discharges with ICD-9-CM codes 3601, 3602, 3605, or 3606 in any procedure field. Age 40 years and older. Exclude patients with missing discharge disposition (DISP=missing), transferring to another short-term hospital (DISP=2), MDC 14 (pregnancy, childbirth, and puerperium), and MDC 15 (newborns and other neonates).
Type of Indicator Provider Level, Mortality Indicator – Recommended for use only with the corresponding volume indicator above.
Empirical Performance Population Rate: 1.46 per 100 discharges at risk
Empirical Rating Not available.
Summary of Evidence PTCA is measured with great precision, although volume indicators overall are not direct measures of quality and are relatively insensitive. For this reason, PTCA should be used in conjunction with measures of mortality and quality of care within cardiac care to ensure
that increasing volumes truly improve patient outcomes. As noted in the literature, higher volumes of PTCA have been associated with fewer deaths and post-procedural coronary artery bypass grafts (CABG).

Version 2.1 34 Revision 3 (July 21, 2004)
Empirical evidence shows that a moderate to high percentage of procedures were performed at high-volume hospitals. At threshold 1, 95.7% of PTCA procedures were performed at high-volume providers (and 69% of the providers are high volume).
58 At threshold 2, 77.0% were
performed at high-volume providers (and 42% of providers are high volume).
59 60
Limitations on Use As a volume indicator, PTCA is a proxy measure for quality and should be used with other indicators.
Details Face validity: Does the indicator capture an aspect of quality that is widely regarded as important and subject to provider or public health system control?
The face validity of PTCA depends on whether a strong association with outcomes of care is both plausible and widely accepted in the professional community. The American Heart Association (AHA) and the American College of Cardiology (ACC) have stated that ―a significant number of cases per institution—at least 200 PTCA procedures annually—is essential for the maintenance of quality and safe care.‖
61
Providers may wish to examine rates by surgeon with this indicator. Precision: Is there a substantial amount of provider or community level variation that is not attributable to random variation?
58
Ryan TJ, Bauman WB, Kennedy JW, et al.
Guidelines for percutaneous transluminal coronary angioplasty. A report of the American Heart Association/American College of Cardiology Task Force on Assessment of Diagnostic and Therapeutic Cardiovascular Procedures (Committee on Percutaneous Transluminal Coronary Angioplasty).
Circulation 1993;88(6):2987-3007.
59
Hannan EL, Racz M, Ryan TJ, et al.
Coronary angioplasty volume-outcome relationships for hospitals and cardiologists. JAMA 1997;277(11):892-8.
60
Nationwide Inpatient Sample and State
Inpatient Databases. Healthcare Cost and Utilization Project. Agency for Healthcare Research and Quality, Rockville, MD. http://www.ahrq.gov/data/hcup
61
Ryan et al., 1993.
PTCA is an increasingly common procedure (16.7 per 10,000 persons in 1997
62) and is
measured accurately with discharge data. The large number of procedures performed annually at most hospitals suggests that annual volume is not subject to considerable random variation. Minimal bias: Is there either little effect on the indicator of variations in patient disease severity and comorbidities, or is it possible to apply risk adjustment and statistical methods to remove most or all bias? Risk adjustment is not appropriate, because volume measures are not subject to bias due to disease severity and comorbidities. Construct validity: Does the indicator perform well in identifying true (or actual) quality of care problems? Higher volumes have been repeatedly associated with better outcomes of care, although these findings may be limited by inadequate risk adjustment of the outcome measure. Using hospital discharge data to adjust for age, gender, multilevel angioplasty, unstable angina, and six comorbidities, one study found that high-volume hospitals had significantly lower rates of same-stay coronary artery bypass surgery (CABG) and inpatient mortality than low-volume hospitals.
63 Better studies based on clinical data
systems (adjusting for left ventricular function) have confirmed higher risk-adjusted mortality and CABG rates at low-volume hospitals relative to high-volume hospitals.
64
Empirical evidence shows that PTCA volume is negatively related to several other post-procedural mortality rates: CABG (r=-.21, p<.001), craniotomy (r=-.200, p<.0001), and
62
Kozak LJ, Lawrence L. National Hospital
Discharge Survey: annual summary, 1997. Vital Health Stat 13 1999(144):i-iv, 1-46.
63
Ritchie JL, Maynard C, Chapko MK, et al.
Association between percutaneous transluminal coronary angioplasty volumes and outcomes in the Healthcare Cost and Utilization Project 1993-1994. Am J Cardiol 1999;83(4):493-7.
64
Hannan et al. 1997.

Version 2.1 35 Revision 3 (July 21, 2004)
abdominal aortic aneurysm (AAA) repair (r=-.45, p<.0001).
65
Fosters true quality improvement: Is the indicator insulated from perverse incentives for providers to improve their reported performance by avoiding difficult or complex cases, or by other responses that do not improve quality of care? Low-volume providers may attempt to increase their volume without improving quality of care by performing the procedure on patients who may not qualify or benefit from the procedure. Additionally, shifting procedures to high-volume providers may impair access to care for certain types of patients. Prior use: Has the measure been used effectively in practice? Does it have potential for working well with other indicators? PTCA volume has not been widely used as an indicator of quality, although specific volume thresholds have been suggested as ―standards‖ for the profession.
66
65
Nationwide Inpatient Sample.
66
Hirshfeld JW, Jr., Ellis SG, Faxon DP.
Recommendations for the assessment and maintenance of proficiency in coronary interventional procedures: Statement of the American College of Cardiology. J Am Coll Cardiol 1998;31(3):722-43.

Version 2.1 36 Revision 3 (July 21, 2004)
Carotid Endarterectomy Volume (IQI 7)
Carotid endarterectomy (CEA) is a fairly common procedure that requires proficiency with the use of complex equipment; and technical errors may lead to clinically significant complications, such as abrupt carotid occlusion with or without stroke, myocardial infarction, and death. The definition for CEA mortality rate (IQI 31) is also noted below. The QI software calculates mortality for CEA, so that the volumes for this procedure can be examined in conjunction with mortality. However, the mortality measure should not be examined independently, because it did not meet the literature review and empirical evaluation criteria to stand alone as its own measure.
Relationship to Quality Higher volumes have been associated with better outcomes, which represent better quality.
Benchmark Threshold 1: 50 or more procedures per year67
Threshold 2: 101 or more procedures per year
68 69
Definition Raw volume of provider-level CEA.
Numerator Discharges with ICD-9-CM codes of 3812 in any procedure field. Exclude MDC 14 (pregnancy, childbirth, and puerperium) and MDC 15 (newborns and other neonates).
Denominator Not applicable.
Type of Indicator Provider Level, Procedure Volume Indicator
Empirical Rating Not applicable.
CEA Mortality Rate (IQI 31)
Relationship to Quality Better processes of care may reduce short-term mortality, which represents better quality.
Definition Number of deaths per 100 CEAs.
Numerator Number of deaths with a code of CEA in any procedure field.
Denominator Discharges with ICD-9-CM codes of 3812 in any procedure field. Exclude patients with missing discharge disposition (DISP=missing), transferring to another short-term hospital (DISP=2), MDC 14 (pregnancy, childbirth, and puerperium), and MDC 15 (newborns and other neonates).
Type of Indicator Provider Level, Mortality Indicator – Recommended for use only with the corresponding volume indicator above.
Empirical Performance Population Rate: 0.76 per 100 discharges at risk
Empirical Rating Not available.
Summary of Evidence CEA is measured with great precision, although volume indicators overall are not direct measures of quality and are relatively insensitive. For this reason, CEA should be used with other measures of mortality to ensure that increasing volumes truly improve patient outcomes. As noted in the literature, higher volume hospitals have lower mortality and post-operative stroke rates than lower volume hospitals.
Empirical evidence shows that a moderate percentage of procedures were performed at high-volume hospitals.
67 At threshold 1, 77.8%
of CEA procedures were performed at high-volume providers (and 37% of providers are high
67
Nationwide Inpatient Sample and State
Inpatient Databases, Healthcare Cost and Utilization Project. Agency for Healthcare Research and Quality, Rockville, MD. http://www.ahrq.gov/data/hcup.

Version 2.1 37 Revision 3 (July 21, 2004)
volume).68
At threshold 2, 51.0% were performed at high-volume providers (and 17% of providers are high volume).
69 70
Limitations on Use As a volume indicator, CEA is a proxy measure for quality and should be used with other indicators. Details Face validity: Does the indicator capture an aspect of quality that is widely regarded as important and subject to provider or public health system control? The face validity of CEA depends on whether a strong association with outcomes of care is both plausible and widely accepted in the professional community. Recent guidelines focus on monitoring surgical outcomes rather than promoting volume standards.
71
Precision: Is there a substantial amount of provider or community level variation that is not attributable to random variation? CEA is measured accurately with discharge data. Approximately 144,000 CEAs were performed in the United States in 1997.
72 Many
hospitals perform relatively few procedures, suggesting that the actual annual count of
68
Manheim LM, Sohn MW, Feinglass J, et al.
Hospital vascular surgery volume and procedure mortality rates in California, 1982-1994. J Vasc Surg 1998;28(1):45-46.
69
Hannan EL, Popp AJ, Tranmer B, et al.
Relationship between provider volume and mortality for carotid endarterectomies in New York state. Stroke 1998;29(11):2292-7.
70
Dudley RA, Johansen KL, Brand R, et al.
Selective referral to high-volume hospitals: estimating potentially avoidable deaths. JAMA 2000;283(9):1159-66.
71
Biller J, Feinberg WM, Castaldo JE, et al.
Guidelines for carotid endarterectomy: a statement of healthcare professionals from a Special Writing Group of the Stroke Council, American Heart Association. Circulation 1998;97(5):501-9.
72
Owings, MF, Lawrence L. Detailed
diagnoses and procedures, National Hospital Discharge Survey, 1997. Vital Health Stat 13 199(145):1-157.
procedures may not be a reliable guide to the number of procedures performed on an ongoing basis. In one study of Medicare beneficiaries, approximately 50% of CEAs were performed in hospitals that performed 21 or fewer operations per year.
73
Minimal bias: Is there either little effect on the indicator of variations in patient disease severity and comorbidities, or is it possible to apply risk adjustment and statistical methods to remove most or all bias?
Risk adjustment is not appropriate, because volume measures are not subject to bias due to disease severity and comorbidities.
Construct validity: Does the indicator perform well in identifying true (or actual) quality of care problems?
Although higher volumes have repeatedly been associated with better outcomes after CEA, these findings may be limited by inadequate risk adjustment of the outcome measure. Cebul et al. found that undergoing surgery in a high-volume hospital was associated with a 71% reduction in the risk of stroke or death at 30 days, after adjusting for age, gender, indication for surgery, renal insufficiency, and two cardiovascular comorbidities.
74 In the study by
Karp et al., the risk of severe stroke or death was 2.6 times higher at the lowest-volume hospitals than at the highest-volume hospitals.
75
Empirical evidence shows that CEA volume is negatively correlated with several other mortality indicators: coronary artery bypass graft (CABG) (r=-.26, p<.0001), abdominal aortic aneurysm (AAA) repair (r=-.38, p<.0001), and craniotomy (r=-.18, p<.0001).
76
73
Cebul RD, Snow RJ, Pine R, et al.
Indications, outcomes, and provider volumes for carotid endarterectomy. JAMA 1998;279(16):1282-7.
74
Cebul et al. 1998.
75
Karp, HR, Flanders WD, Shipp CC, et al.
Carotid endarterectomy among Medicare beneficiaries: a statewide evaluation of appropriateness and outcome. Stroke 1998;29(1):46-52.
76
Nationwide Inpatient Sample.

Version 2.1 38 Revision 3 (July 21, 2004)
Fosters true quality improvement: Is the indicator insulated from perverse incentives for providers to improve their reported performance by avoiding difficult or complex cases, or by other responses that do not improve quality of care?
Low-volume providers may attempt to increase their volume without improving quality of care by performing the procedure on patients who may not qualify. Additionally, shifting procedures to high-volume providers may impair access to care for certain types of patients.
Prior use: Has the measure been used effectively in practice? Does it have potential for working well with other indicators?
The Center for Medical Consumers posts CEA volumes for New York hospitals.
77 The Pacific
Business Group on Health states that ―one marker of how well a hospital is likely to perform is...the number of (CEA) surgeries a hospital performs.‖
78
77
The Center for Medical Consumers.
(http://www.medicalconsumers.org./)
78
http://www.pbgh.org/

Version 2.1 39 Revision 3 (July 21, 2004)
Esophageal Resection Mortality Rate (IQI 8)
Esophageal cancer surgery is a rare procedure that requires technical proficiency; and errors in surgical technique or management may lead to clinically significant complications, such as sepsis, pneumonia, anastomotic breakdown, and death.
Relationship to Quality Better processes of care may reduce mortality for esophageal resection, which represents better quality care.
Benchmark State, regional, or peer group average.
Definition Number of deaths per 100 patients with discharge procedure code of esophageal resection.
Numerator Number of deaths with a code of esophageal resection in any procedure field.
Denominator Discharges with ICD-9-CM codes of 4240 through 4242 in any procedure field and a diagnosis code of esophageal cancer in any field. Exclude patients with missing discharge disposition (DISP=missing), transferring to another short-term hospital (DISP=2), MDC 14 (pregnancy, childbirth, and puerperium), and MDC 15 (newborns and other neonates).
Type of Indicator Provider Level, Mortality Indicator for Inpatient Procedures
Empirical Performance Population Rate: 8.48 per 100 population at risk
Empirical Rating 8
Summary of Evidence Esophageal resection is a complex cancer surgery, and studies have noted that providers with higher volumes have lower mortality rates. This suggests that providers with higher volumes have some characteristics, either structurally or with regard to processes, that influence mortality. This procedure is performed only by a select number of hospitals, which may compromise the precision of the indicator. Providers may wish to examine several consecutive years to potentially increase the precision of this indicator. Limitations on Use Risk adjustment for clinical factors is recommended because of the confounding bias for esophageal resection. In addition, little evidence exists supporting the construct validity of this indicator.
Details Face validity: Does the indicator capture an aspect of quality that is widely regarded as important and subject to provider or public health system control? The primary evidence for esophageal resection mortality as an indicator arises from the volume-outcome literature. The causal relationship between hospital volume and mortality is unclear, and the differing processes that may lead to better outcomes have not been identified. Precision: Is there a substantial amount of provider or community level variation that is not attributable to random variation? Esophageal resection is a relatively uncommon procedure; Patti et al. noted that most hospitals perform 10 or fewer procedures during a 5-year period.
79 The precision of this indicator may be
improved by using several years of data.
79
Patti MG, Corvera CU, Glasgow RE, et al.
A hospital‘s annual rate of esophagectomy influences

Version 2.1 40 Revision 3 (July 21, 2004)
Empirical evidence shows that this indicator is precise, with a raw provider level mean of 20.2% and a substantial standard deviation of 36.6%.
80
Relative to other indicators, a smaller percentage of the variation occurs at the provider level, rather than the discharge level. The signal ratio (i.e., the proportion of the total variation across providers that is truly related to systematic differences in provider performance rather than random variation) is low, at 8.9%, indicating that most of the observed differences in provider performance very likely do not represent true differences. Minimal bias: Is there either little effect on the indicator of variations in patient disease severity and comorbidities, or is it possible to apply risk adjustment and statistical methods to remove most or all bias? Although no studies specifically addressed the need for risk adjustment, most of the volume-outcome studies published have used some sort of risk adjustment. Most of these studies used administrative data for risk adjustment. Construct validity: Does the indicator perform well in identifying true (or actual) quality of care problems? There is no evidence for the construct validity of esophageal resection beyond the volume-outcome relationship. Two studies examined hospital volume as compared to in-hospital mortality rates. Patti et al. found decreasing mortality rates across five volume categories (17% for 1-5 procedures, 19% for 6-10 procedures, 10% for 11-20 procedures, 16% for 21-30 procedures, and 6% for more than 30 procedures).
81 Gordan et al. combined all
complex gastrointestinal procedures, finding that low-volume hospitals (11-20 procedures per
the operative mortality rate. J Gastrointest Surg 1998;2(2):186-92.
80
Nationwide Inpatient Sample and State
Inpatient Databases. Healthcare Cost and Utilization Project. Agency for Healthcare Research and Quality, Rockville, MD. http://www.ahrq.gov/data/hcup/
81
Patti et al., 1998.
year) had an adjusted odds of death of 4.0 as compared to the one high-volume hospital.
82
Fosters true quality improvement: Is the indicator insulated from perverse incentives for providers to improve their reported performance by avoiding difficult or complex cases, or by other responses that do not improve quality of care? No evidence exists on whether or not this indicator would stimulate true improvement in quality; however, it is possible that high-risk patients may be denied surgery. Prior use: Has the measure been used effectively in practice? Does it have potential for working well with other indicators? Esophageal resection has not been widely used as a quality indicator.
82
Gordan TA, Bowman HM, Bass EB, et al.
Complex gastrointestinal surgery: impact of provider experience on clinical and economic outcomes. J Am Coll Surg 1999;189(1):46-56.

Version 2.1 41 Revision 3 (July 21, 2004)
Pancreatic Resection Mortality Rate (IQI 9)
Pancreatic resection is a rare procedure that requires technical proficiency; and errors in surgical technique or management may lead to clinically significant complications, such as sepsis, anastomotic breakdown, and death.
Relationship to Quality Better processes of care may reduce mortality for pancreatic resection, which represents better quality care.
Benchmark State, regional, or peer group average.
Definition Number of deaths per 100 patients with discharge procedure code of pancreatic resection.
Numerator Number of deaths with a code of pancreatic resection in any procedure field.
Denominator Discharges with ICD-9-CM codes of 526 or 527 in any procedure field and a diagnosis code of pancreatic cancer in any field. Exclude patients with missing discharge disposition (DISP=missing), transferring to another short-term hospital (DISP=2), MDC 14 (pregnancy, childbirth, and puerperium), and MDC 15 (newborns and other neonates).
Type of Indicator Provider Level, Mortality Indicator for Inpatient Procedures
Empirical Performance Population Rate: 6.91 per 100 population at risk
Empirical Rating 5
Summary of Evidence Pancreatic resection is a complex cancer surgery, and studies have noted that providers with higher volumes have lower mortality rates for the procedure than providers with lower volumes. This suggests that providers with higher volumes have some characteristics, either structurally or with regard to processes, that influence mortality. This procedure is performed only by a select number of hospitals, which may compromise the precision of the indicator. Providers may wish to examine several consecutive years to potentially increase the precision of this indicator. Limitations on Use Risk adjustment for clinical factors is recommended because of the confounding bias for pancreatic resection. In addition, little evidence exists supporting the construct validity of this indicator.
Details Face validity: Does the indicator capture an aspect of quality that is widely regarded as important and subject to provider or public health system control? The primary evidence for pancreatic resection mortality as an indicator arises from the volume-outcome literature. The causal relationship between hospital volume and mortality is unclear, and the differing processes that may lead to better outcomes have not been identified. Precision: Is there a substantial amount of provider or community level variation that is not attributable to random variation? Pancreatic resection is a relatively uncommon procedure; Glasgow et al. found that most hospitals in California perform 10 or fewer procedures during a 5-year period.
83 However,
the mortality rate is high, ranging from 4% to
83
Glasgow RE, Mulvihill SJ. Hospital volume
influences outcome in patients undergoing pancreatic resection for cancer. West J Med 1996;165(5):294-300.

Version 2.1 42 Revision 3 (July 21, 2004)
13%.84
The precision of this indicator may be improved by using several years of data. Empirical evidence shows that this indicator is moderately precise, with a raw provider level mean of 15.4% and a standard deviation of 31.3%.
85
Relative to other indicators, a higher percentage of the variation occurs at the provider level, rather than the discharge level. The signal ratio (i.e., the proportion of the total variation across providers that is truly related to systematic differences in provider performance rather than random variation) is low, at 16.5%, indicating that some of the observed differences in provider performance very likely do not represent true differences. Minimal bias: Is there either little effect on the indicator of variations in patient disease severity and comorbidities, or is it possible to apply risk adjustment and statistical methods to remove most or all bias? Although no studies specifically addressed the need for risk adjustment, most of the volume-outcome studies published have used administrative data for risk adjustment. Construct validity: Does the indicator perform well in identifying true (or actual) quality of care problems? There is no evidence for the construct validity of pancreatic resection beyond the volume-outcome relationship. Ten studies examined hospital volume as compared to in-hospital mortality rates. Glasgow and Mulvihill estimated the following risk-adjusted mortality rates across hospital volume categories during the 5-year study period: 14% for 1-5 procedures, 10% for 6-10 procedures, 9% for 11-20 procedures, 7% for 21-30 procedures, 8% for 31-50 procedures,
84
Begg CB, Cramer LD, Hoskins WJ et al.
Impact of hospital volume on operative mortality for major cancer surgery. JAMA 1998;280(20):1747-51.
85
Nationwide Inpatient Sample and State
Inpatient Databases. Healthcare Cost and Utilization Project. Agency for Healthcare Research and Quality, Rockville, MD. http://www.ahrq.gov/data/hcup/
and 4% for over 50 procedures.86
Leiberman et al. found that surgeon volume was less significantly associated with mortality (6-13% across three volume categories).
87
Fosters true quality improvement: Is the indicator insulated from perverse incentives for providers to improve their reported performance by avoiding difficult or complex cases, or by other responses that do not improve quality of care? No evidence exists on whether or not this indicator would stimulate true improvement in quality; however, it is possible that high-risk patients may be denied surgery. Prior use: Has the measure been used effectively in practice? Does it have potential for working well with other indicators? Pancreatic resection has not been widely used as a quality indicator.
86
Glasgow RE, Mulvihill SJ. Hospital volume
influences outcome in patients undergoing pancreatic resection for cancer. West J Med 1996;165(5):294-300.
87
Lieberman MD, Kilburn H, Lindsey M, et al.
Relation of perioperative deaths to hospital volume among patients undergoing pancreatic resection for malignancy. Ann Surg 1995;222(5):638-45.

Version 2.1 43 Revision 3 (July 21, 2004)
Pediatric Heart Surgery Mortality Rate (IQI 10)
Pediatric heart surgery requires proficiency with the use of complex equipment; and technical errors may lead to clinically significant complications, such as arrhythmias, congestive heart failure, and death.
Relationship to Quality Better processes of care may reduce mortality for pediatric heart surgery, which represents better quality care.
Benchmark State, regional, or peer group average.
Definition Number of deaths per 100 patients with selected discharge procedure code of pediatric heart surgery.
Numerator Number of deaths with a code of pediatric heart surgery in any procedure field with ICD-9-CM diagnosis of congenital heart disease in any field.
Denominator Discharges with ICD-9-CM procedure codes for congenital heart disease (1P) in any field or non-specific heart surgery (2P) in any field with ICD-9-CM diagnosis of congenital heart disease (2D) in any field. Age less than 18 years old. Exclude MDC 14 (pregnancy, childbirth and pueperium); patients with transcatheter interventions (either 3AP, 3BP, 3CP, 3DP, 3EP with 3D, or 3FP) as single cardiac procedures, performed without bypass (5P) but with catheterization (6P); patients with septal defects (4P) as single cardiac procedures without bypass (5P); heart transplant (7P); premature infants (4D) with PDA closure (3D and 3EP) as only cardiac procedure; age less than 30 days with PDA closure as only cardiac procedure; missing discharge disposition (DISP=missing); and transferring to another short-term hospital (DISP=2). See Appendix A for detailed information on the exclusion categories.
Type of Indicator Provider Level, Mortality Indicator for Inpatient Procedures
Empirical Performance Population Rate: 4.97 per 100 discharges at risk
Empirical Rating 3
Summary of Evidence
Pediatric heart surgeries range from fairly straightforward to rather complex procedures, and studies have noted that providers with higher volumes have lower mortality rates. This suggests that providers with higher volumes have some characteristics, either structurally or with regard to processes that influence mortality.
This procedure is performed by relatively few hospitals, which may compromise the precision of the indicator. APR-DRG adjustment is not adequate and providers may want to consider breakdown in the types of surgeries performed. This indicator should also be considered with length of stay and transfer rates to account for differing discharge practices among hospitals.
Limitations on Use
Risk adjustment for clinical factors is recommended because of the substantial confounding bias for pediatric heart surgery. In addition, limited evidence exists supporting the construct validity of this indicator.
Details
Face validity: Does the indicator capture an aspect of quality that is widely regarded as important and subject to provider or public health system control?
Pediatric cardiac surgery represents a composite of numerous procedures performed to repair or palliate congenital anomalies. The literature suggests that post-operative mortality rates vary considerably across hospitals in a manner that reflects quality of care. Studying provider volume and mortality together would offer a comprehensive

Version 2.1 44 Revision 3 (July 21, 2004)
perspective on provider performance for pediatric cardiac surgery. Precision: Is there a substantial amount of provider or community level variation that is not attributable to random variation?
Pediatric cardiac surgery appears to be highly concentrated at a relatively small number of facilities, a significant number of which perform fewer than 10 surgeries per year. Empirical evidence shows that this indicator is adequately precise, with a raw provider level mean of 7.2% and a substantial standard deviation of 1.7%.
88
Relative to other indicators, a lower percentage of the variation occurs at the provider level, rather than the discharge level. The signal ratio (i.e., the proportion of the total variation across providers that is truly related to systematic differences in provider performance rather than random variation) is low, at 22.2%, indicating that some of the observed differences in provider performance very likely do not represent true differences.
Minimal bias: Is there either little effect on the indicator of variations in patient disease severity and comorbidities, or is it possible to apply risk adjustment and statistical methods to remove most or all bias?
The extreme heterogeneity among pediatric heart surgeries, as well as the underlying anomalies, makes bias a serious concern. For example, among procedures with at least 100 cases in New York‘s Cardiac Surgery Reporting System in 1992-95, in-hospital mortality varied from 0.4% for repair of atrial septal defect to 34.2% for Norwood repair of hypoplastic left ventricle.
89 Technical factors
that may be important are not available in administrative data, which could confound inter-provider performance comparisons.
Construct validity: Does the indicator perform well in identifying true (or actual) quality of care problems?
Several studies have reported an association between hospital volume and mortality following pediatric cardiac surgery. For example, Hannan et al. found 8.26% risk-adjusted mortality at hospitals
88
Nationwide Inpatient Sample and State
Inpatient Databases. Healthcare Cost and Utilization Project. Agency for Healthcare Research and Quality, Rockville, MD. http://www.ahrq.gov/data/hcup/
89
Hannan EL, Racz M, Kavey RE, et al.
Pediatric cardiac surgery: the effect of hospital and surgeon volume on in-hospital mortality. Pediatrics 1998;101(6):963-9.
with fewer than 100 cases per year, versus 5.95% at higher volume hospitals, using a multivariate model that included age, complexity category, and four comorbidities.
90 (The effect was limited to
surgeons who performed at least 75 procedures per year.)
Experienced surgeons should be able to improve post-operative mortality by reducing cardiopulmonary bypass or aortic cross-clamp time, which has been repeatedly associated with post-operative mortality after adjusting for a variety of patient characteristics.
91 92
This relationship has been demonstrated for the Fontan procedure and the Norwood procedure for hypoplastic left heart syndrome.
93
Fosters true quality improvement: Is the indicator insulated from perverse incentives for providers to improve their reported performance by avoiding difficult or complex cases, or by other responses that do not improve quality of care?
Potential responses by physicians to public reporting of procedure mortality rates would be to avoid operating on high-risk patients and to discharge patients earlier. It is unclear whether efforts to reduce length of stay may have unintended negative consequences, such as increased complications and re-admissions.
Prior use: Has the measure been used effectively in practice? Does it have potential for working well with other indicators?
Pediatric cardiac surgery mortality has not been widely used as an indicator of quality. The original pediatric heart surgery specification has undergone extensive revision by Jenkins et al. The inclusion and exclusion clinical logic were modified and the codes were updated. The changes were incorporated into Revision 3 of the Inpatient Quality Indicators.
90
Hannan et al. 1998.
91
Knott-Craig CJ, Danielson GK, Schaff HV,
et al. The modified Fontan operation. An analysis of risk factors for early postoperative death or takedown in 702 consecutive patients from one institution. J Thorac Cardiovasc Surg 1995;109(6):1237-43.
92
Gentles TL, Mayer JE, Jr., Gauvreau K, et
al. Fontan operation in 500 consecutive patients: factors influencing early and late outcome. J Thorac Cardiovasc Surg 1997;114(3):376-91.
93
Kern JH, Hayes CJ, Michler RE, et al.
Survival and risk factor analysis for the Norwood procedure for hypoplastic left heart syndrome. Am J Cardiol 1997;80(2):170-4.

Version 2.1 45 Revision 3 (July 21, 2004)
Abdominal Aortic Aneurysm Repair Mortality Rate (IQI 11)
Abdominal aortic aneurysm (AAA) repair is a relatively rare procedure that requires proficiency with the use of complex equipment; and technical errors may lead to clinically significant complications, such as arrhythmias, acute myocardial infarction, colonic ischemia, and death.
Relationship to Quality Better processes of care may reduce mortality for AAA repair, which represents better quality care.
Benchmark State, regional, or peer group average.
Definition Number of deaths per 100 discharges with procedure code of AAA repair.
Numerator Number of deaths with a code of AAA repair in any procedure field and a diagnosis of AAA in any field.
Denominator Discharges with ICD-9-CM codes of 3834, 3844, and 3864 in any procedure field and a diagnosis code of AAA in any field. Exclude patients with missing discharge disposition (DISP=missing), transferring to another short-term hospital (DISP=2), MDC 14 (pregnancy, childbirth, and puerperium), and MDC 15 (newborns and other neonates).
Type of Indicator Provider Level, Mortality Indicator for Inpatient Procedures
Empirical Performance Population Rate: 11.30 per 100 discharges at risk
Empirical Rating 8
Summary of Evidence
AAA repair is a technically difficult procedure with a relatively high mortality rate. Higher volume hospitals have been noted to have lower mortality rates, which suggests that some differences in the processes of care between lower and higher volume hospitals result in better outcomes.
Empirical analyses of demographic risk adjustment noted some potential bias for this indicator. Additional medical chart review or analyses of laboratory data may be helpful in determining whether more detailed risk adjustment is necessary. This indicator should also be considered with length of stay and transfer rates to account for differing discharge practices among hospitals.
Limitations on Use
Risk adjustment for clinical factors is recommended because of the confounding bias for AAA repair mortality rate. In addition, little evidence exists supporting the construct validity of this indicator.
Details
Face validity: Does the indicator capture an aspect of quality that is widely regarded as important and subject to provider or public health system control?
Studies have reported 40-55% in-hospital mortality after emergent repair of ruptured aneurysms.
94 95
96
These data suggest that improved quality of care could have a substantial impact on public health.
Precision: Is there a substantial amount of provider or community level variation that is not attributable to random variation?
94
Dardik A, Burleyson GP, Bowman H, et al.
Surgical repair of ruptured abdominal aortic aneurysms in the state of Maryland: factors influencing outcome among 527 recent cases. J Vasc Surg 1998;28(3):413-20.
95
Kazmers A, Jacobs L, Perkins A, et al.
Abdominal aortic aneurysm repair in Veterans Affairs medical centers. J Vasc Surg 1996;23(2):191-200.
96
Rutledge R, Oller DW, Meyer AA, et al. A
statewide, population-based time-series analysis of the outcome of ruptured abdominal aortic aneurysm. Ann Surg 1996;223(5):492-502.

Version 2.1 46 Revision 3 (July 21, 2004)
The relatively small number of AAA resections performed by each hospital suggests that mortality rates at the hospital level are likely to be unreliable. Empirical evidence shows that his indicator is precise, with a raw provider level mean of 21.5% and a substantial standard deviation of 26.8%.
97
Relative to other indicators, a higher percentage of the variation occurs at the provider level, rather than the discharge level. The signal ratio (i.e., the proportion of the total variation across providers that is truly related to systematic differences in provider performance rather than random variation) is low, at 30.7%, indicating that some of the observed differences in provider performance likely do not represent true differences.
Minimal bias: Is there either little effect on the indicator of variations in patient disease severity and comorbidities, or is it possible to apply risk adjustment and statistical methods to remove most or all bias?
The known predictors of in-hospital mortality include whether the aneurysm is intact or ruptured, age, female gender, admission through an emergency room, various comorbidities such as renal failure and dysrhythmias, and Charlson‘s comorbidity index.
98 99
100
In the absence of studies explicitly comparing models with and without additional clinical elements, it is difficult to assess whether administrative data contain sufficient information to remove bias.
97
Nationwide Inpatient Sample and State
Databases. Healthcare Cost and Utilization Project. Agency for Healthcare Research and Quality, Rockville, MD. http://www.ahrq.gov/data/hcup/
98
Manheim LM, Sohn MW, Feinglass J, et al.
Hospital vascular surgery volume and procedure mortality rates in California, 1982-1994. J Vasc Surg 1998;28(1):45-56.
99
Hannan EL, Kilburn H, Jr., O‘Donnell JF, et
al. A longitudinal analysis of the relationship between in-hospital mortality in New York state and the volume of abdominal aortic aneurysm surgeries performed. Health Serv Res 1992;27(4):517-42.
100
Wen SW, Simunovic M, Williams JI, et al.
Hospital volume, calendar age, and short term outcomes in patients undergoing repair of abdominal aortic aneurysm: the Ontario experience, 1988-92. J Epidemiol Community Health 1996;50(2):207-13.
Construct validity: Does the indicator perform well in identifying true (or actual) quality of care problems?
The correlation between hospital or physician characteristics and in-hospital mortality in most studies supports the validity of in-hospital mortality as a measure of quality.
101 102
Finally, excessive blood loss, which is a potentially preventable complication of surgery, has been identified as the most important predictor of mortality after elective AAA repair.
103
Empirical evidence shows that AAA repair mortality is positively related to other post-procedural mortality measures, such as craniotomy (r=.28, p<.0001) and coronary artery bypass graft (CABG) (r=.17, p<.01).
104
Fosters true quality improvement: Is the indicator insulated from perverse incentives for providers to improve their reported performance by avoiding difficult or complex cases, or by other responses that do not improve quality of care?
All in-hospital mortality measures may encourage earlier post-operative discharge, and thereby shift deaths to skilled nursing facilities or outpatient settings. Another potential response would be to avoid operating on high-risk patients.
Prior use: Has the measure been used effectively in practice? Does it have potential for working well with other indicators?
The Pennsylvania Health Care Cost Containment Council includes AAA repair in the ―Other major vessel operations except heart (DRG 100)‖ indicator. It is also used by HealthGrades.com.
101
Pearce WH, Parker MA, Feinglass J, et al.
The importance of surgeon volume and training in outcomes for vascular surgical procedures. J Vasc Surg 1999;29(5):768-76.
102
Rutledge et al., 1996.
103
Pilcher DB, Davis JH, Ashikaga T, et al.
Treatment of abdominal aortic aneurysm in an entire state over 7½ years. Am J Surg 1980;139(4):487-94.
104
Nationwide Inpatient Sample.

Version 2.1 47 Revision 3 (July 21, 2004)
Coronary Artery Bypass Graft Mortality Rate (IQI 12)
Coronary artery bypass graft (CABG) is a relatively common procedure that requires proficiency with the use of complex equipment; and technical errors may lead to clinically significant complications such as myocardial infarction, stroke, and death.
Relationship to Quality Better processes of care may reduce mortality for CABG, which represents better quality care.
Benchmark State, regional, or peer group average.
Definition Number of deaths per 100 discharges with procedure code of CABG.
Numerator Number of deaths with a code of CABG in any procedure field.
Denominator Discharges with ICD-9-CM codes of 3610 through 3619 in any procedure field. Age 40 years and older. Exclude patients with missing discharge disposition (DISP=missing), transferring to another short-term hospital (DISP=2), MDC 14 (pregnancy, childbirth, and puerperium), and MDC 15 (newborns and other neonates).
Type of Indicator Provider Level, Mortality Indicator for Inpatient Procedures
Empirical Performance Population Rate: 3.54 per 100 discharges at risk
Empirical Rating 5
Summary of Evidence
CABG mortality is one of the most widely used and publicized post-procedural mortality indicators. Demographics, comorbidities, and clinical characteristics of severity of disease are important predictors of outcome that may vary systematically by provider. Chart review may help distinguish comorbidities from complications.
This indicator should be considered with length of stay and transfer rates to account for differing discharge practices among hospitals. The use of smoothed estimates to help avoid the erroneous labeling of outlier hospitals is recommended.
Limitations on Use
Some selection of the patient population may lead to bias; providers may perform more CABG procedures on less clinically complex patients with questionable indications. Risk adjustment for clinical factors, or at a minimum APR-DRGs, is recommended because of the confounding bias of this indicator. Finally, the evidence for the construct validity of this indicator is limited.
Details
Face validity: Does the indicator capture an aspect of quality that is widely regarded as important and subject to provider or public health system control?
Post-CABG mortality rates have recently become the focus of State public reporting initiatives.
105 Studies suggest that these reports
serve as the basis for discussions between physicians and patients about the risks of cardiac surgery.
Precision: Is there a substantial amount of provider or community level variation that is not attributable to random variation?
Without applying hierarchical statistical models to remove random noise, it is likely that hospitals will be identified as outliers as a result of patient variation and other factors beyond the hospital‘s control. Empirical evidence shows that this indicator is precise, with a raw provider level
105
Localio AR, Hamory BH, Fisher AC, et al.
The public release of hospital and physician mortality data in Pennsylvania. A case study. Med Care 199;35(3):272-286.

Version 2.1 48 Revision 3 (July 21, 2004)
mean of 5.1% and a standard deviation of 6.2%.
106
Relative to other indicators, a lower percentage of the variation occurs at the provider level, rather than the discharge level. The signal ratio (i.e., the proportion of the total variation across providers that is truly related to systematic differences in provider performance rather than random variation) is moderate, at 54.5%, indicating that some of the observed differences in provider performance likely do not represent true differences.
Minimal bias: Is there either little effect on the indicator of variations in patient disease severity and comorbidities, or is it possible to apply risk adjustment and statistical methods to remove most or all bias?
Based on studies using large databases, cardiac function, coronary disease severity, and the urgency of surgery appear to be powerful predictors of mortality.
107 Some of these risk
factors are not available from administrative data.
Construct validity: Does the indicator perform well in identifying true (or actual) quality of care problems?
Numerous studies have reported an association between hospital volume and mortality after CABG surgery. However, experienced surgeons and surgical teams should be able to improve post-operative mortality by reducing aortic cross-clamp time, which has been repeatedly associated with post-operative mortality after adjusting for a variety of patient characteristics.
108 It is unknown how
performance of these processes of care would affect hospital-level mortality rates.
106
Nationwide Inpatient Sample and State
Databases. Healthcare Cost and Utilization Project. Agency for Healthcare Research and Quality, Rockville, MD. http://www.ahrq.gov/data/hcup/
107
Higgins TL, Estafanous FG, Loop FD, et
al. Stratification of morbidity and mortality outcome by preoperative risk factors in coronary artery bypass patients. A clinical severity score. JAMA 1992;267(17):2344-8.
108
Ottino G, Bergerone S, Di Leo M, et al.
Aortocoronary bypass results: a discriminant multivariate analysis of risk factors of operative mortality. J Cardiovasc Surg (Torino) 1990;31(1):20-5.
Empirical evidence shows that CABG mortality is positively related to bilateral catheterization and negatively related to laparoscopic cholecystectomy.
109
Fosters true quality improvement: Is the indicator insulated from perverse incentives for providers to improve their reported performance by avoiding difficult or complex cases, or by other responses that do not improve quality of care?
Public reporting of CABG mortality rates may cause providers to avoid high-risk patients. Sixty-three percent of cardiothoracic surgeons surveyed in Pennsylvania reported that they were ―less willing‖ to operate on the most severely ill patients since mortality data were released.
110 However, one study using Medicare
data shows no evidence that cardiac surgeons in New York, which also reports CABG mortality rates, avoided high-risk patients.
111 All in-
hospital mortality measures may encourage earlier post-operative discharge, shifting deaths to skilled nursing facilities or outpatient settings and causing biased comparisons across hospitals with different mean lengths of stay.
Prior use: Has the measure been used effectively in practice? Does it have potential for working well with other indicators?
CABG mortality is publicly reported by California, New Jersey, New York, and Pennsylvania. Recent users of CABG mortality as a quality indicator include the University Hospital Consortium, the Joint Commission on Accreditation of Healthcare Organizations‘ (JCAHO‘s) IMSystem, Greater New York Hospital Association, the Maryland Hospital Association (as part of the Maryland QI Project) and HealthGrades.com.
109
Nationwide Inpatient Sample.
110
Hannan EL, Siu AL, Kumar D, et al.
Assessment of coronary artery bypass graft surgery performance in New York. Is there a bias against taking high-risk patients? Med Care 1997;35(1):49-56.
111
Peterson ED, DeLong ER, Jollis JG, et al.
Public reporting of surgical mortality: a survey of new York State cardiothoracic surgeons. Ann Thorac surg 1999;68(4):1195-200; discussion 12-1-2.

Version 2.1 49 Revision 3 (July 21, 2004)
Craniotomy Mortality Rate (IQI 13)
Craniotomy for the treatment of subarachnoid hemorrhage or cerebral aneurysm entails substantially high post-operative mortality rates.
Relationship to Quality Better processes of care may reduce mortality for craniotomy, which represents better quality care.
Benchmark State, regional, or peer group average.
Definition Number of deaths per 100 discharges with DRG code for craniotomy (DRG 001, 002, 528, 529, and 530), with and without comorbidities and complications.
Numerator Number of deaths with DRG code for craniotomy (DRG 001, 002, 528, 529, and 530), Age >17, with and without comorbidities and complications.
Denominator All discharges with DRG code for craniotomy (DRG 001, 002, 528, 529, and 530), with and without comorbidities and complications. Age 18 years or older. Exclude patients with a principle diagnosis of head trauma, missing discharge disposition (DISP=missing), transferring to another short-term hospital (DISP=2), MDC 14 (pregnancy, childbirth, and puerperium), and MDC 15 (newborns and other neonates).
Type of Indicator Provider Level, Mortality Indicator for Inpatient Procedures
Empirical Performance Population Rate: 7.59 per 100 discharges at risk
Empirical Rating 6
Summary of Evidence Craniotomy is a complex procedure. Providers with high rates have better outcomes, although this may be an artifact of patient selection. This indicator is measured with good precision and very high provider systematic variation. Empirical analyses showed substantial bias for this indicator, particularly for age, and providers should risk-adjust for age and comorbidities. Medical chart reviews or analyses of laboratory tests can also be used to examine other patient characteristics that increase case-mix complexity. Limitations on Use Risk adjustment for clinical factors, or at a minimum APR-DRGs, is recommended because of the confounding bias for craniotomy. In addition, little evidence exists supporting the construct validity of this indicator.
Details Face validity: Does the indicator capture an aspect of quality that is widely regarded as important and subject to provider or public health system control? Craniotomy requires technical skill and the ability to identify the most appropriate cases. Post-operative mortality rates for craniotomy—together with measures of volume and utilization—will give a comprehensive perspective on provider performance for this condition. Precision: Is there a substantial amount of provider or community level variation that is not attributable to random variation? Most providers perform relatively high numbers of procedures; post-operative mortality rates are also relatively high, averaging nearly 14% for patients over age 65.
112
112
Taylor CL, Yuan A, Selman WR, et al.
Mortality rates, hospital length of stay, and the cost of

Version 2.1 50 Revision 3 (July 21, 2004)
Empirical evidence shows that this indicator is precise, with a raw provider level mean of 16.2% and a substantial standard deviation of 18.5%.
113
Relative to other indicators, a higher percentage of the variation occurs at the provider level, rather than the discharge level. The signal ratio (i.e., the proportion of the total variation across providers that is truly related to systematic differences in provider performance rather than random variation) is low, at 28.9%, indicating that most of the observed differences in provider performance likely do not represent true differences. Minimal bias: Is there either little effect on the indicator of variations in patient disease severity and comorbidities, or is it possible to apply risk adjustment and statistical methods to remove most or all bias? Studies have shown that patients undergoing treatment for subarachnoid hemorrhage had significantly higher post-craniotomy mortality rates by age group (from 3% for those 23-39 years old to 17% for those over 70 years old).
114
115
Older patients generally present with more severe illness on admission, including lower levels of consciousness, worse grade, thicker subarachnoid clot, intraventricular hemorrhage, and hydrocephalus. Older patients also present with higher comorbidity rates, including diabetes; hypertension; and pulmonary, myocardial, and cerebrovascular disease.
treating subarachnoid hemorrhage in older patients: institutional and geographical differences. J Neurosurg 1997;86(4):583-8.
113
Nationwide Inpatient Sample and State
Inpatient Databases. Healthcare Cost and Utilization Project. Agency for Healthcare Research and Quality, Rockville, MD. http://www.ahrq.gov/data/hcup/
114
Stachniak JB, Layon AJ, Day AL, et al.
Craniotomy for intracranial aneurysm and subarachnoid hemorrhage. Is course, cost, or outcome affected by age? Stroke 1996;27(2):276-81.
115
Lanzino G, Kassell NF, Germanson TP, et
al. Age and outcome after aneurysmal subarachnoid hemorrhage: why do older patients fare worse? J Neurosurg 1996;85(3):410-8.
Construct validity: Does the indicator perform well in identifying true (or actual) quality of care problems? Providers performing more than 30 procedures per year have lower mortality than providers performing fewer than 30, although the volume-outcome relationship may be a product of patient selection.
116 In one study, patients who
were referred to a large medical center for subarachnoid hemorrhage were less likely to have died early and had fewer severe indications, including lower clinical grade, rate of coma, diastolic blood pressure, and younger patient age.
117
Craniotomy appears to be positively related to mortality associated with abdominal aortic aneurysm (AAA) repair (r=.28, p<.0001), coronary artery bypass graft (CABG) (r=.23, p<.0001), and stroke (r=.49, p<.0001).
118
Fosters true quality improvement: Is the indicator insulated from perverse incentives for providers to improve their reported performance by avoiding difficult or complex cases, or by other responses that do not improve quality of care? All in-hospital mortality measures may encourage earlier post-operative discharge, and thereby shift deaths to skilled nursing facilities or outpatient settings. This phenomenon may also lead to biased comparisons among hospitals with different mean lengths of stay. Prior use: Has the measure been used effectively in practice? Does it have potential for working well with other indicators? The University Hospital Consortium uses post-operative mortality for craniotomy, non-trauma related, as a quality measure.
116
Soloman RA, Mayer SA, Tarmey JJ.
Relationship between the volume of craniotomies for cerebral aneurysm performed at New York state hospitals and in-hospital mortality. Stroke 1996;27(1):13-7.
117
Whisnant JP, Sacco SE, O‘Fallon WM, et
al. Referral bias in aneurysmal subarachnoid hemorrhage. J Neurosurg 1993;78(5):726-32.
118
Nationwide Inpatient Sample.
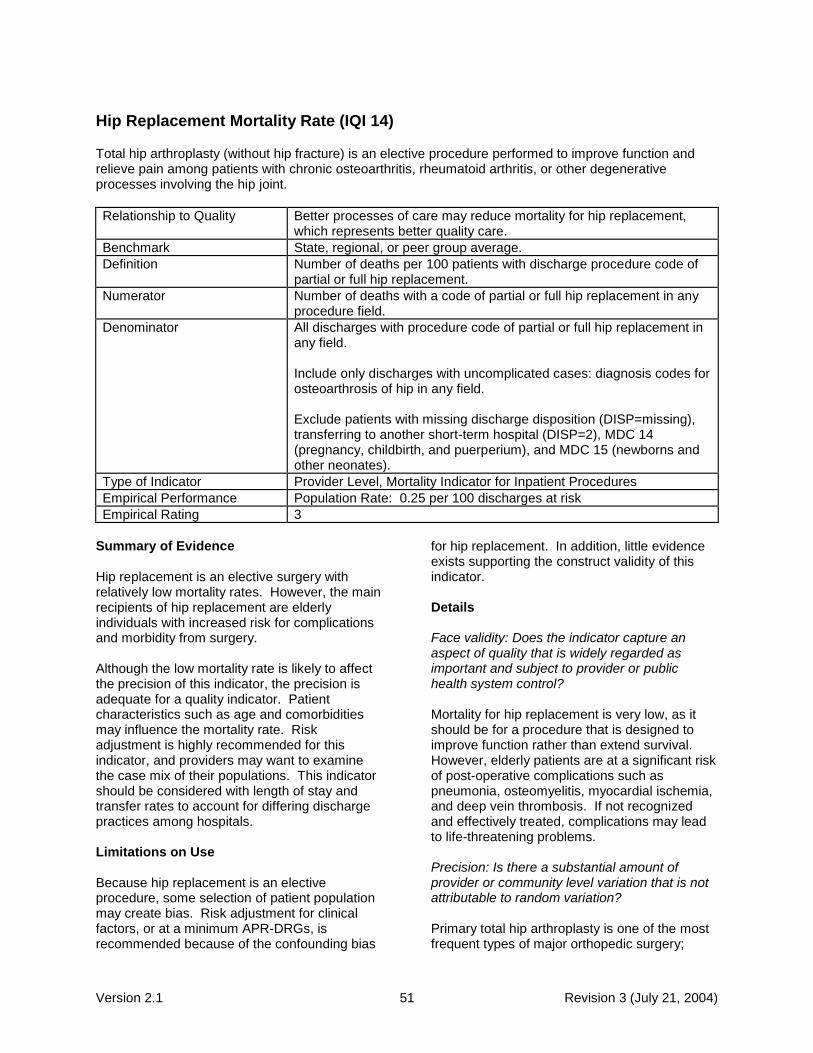
Version 2.1 51 Revision 3 (July 21, 2004)
Hip Replacement Mortality Rate (IQI 14)
Total hip arthroplasty (without hip fracture) is an elective procedure performed to improve function and relieve pain among patients with chronic osteoarthritis, rheumatoid arthritis, or other degenerative processes involving the hip joint.
Relationship to Quality Better processes of care may reduce mortality for hip replacement, which represents better quality care.
Benchmark State, regional, or peer group average.
Definition Number of deaths per 100 patients with discharge procedure code of partial or full hip replacement.
Numerator Number of deaths with a code of partial or full hip replacement in any procedure field.
Denominator All discharges with procedure code of partial or full hip replacement in any field. Include only discharges with uncomplicated cases: diagnosis codes for osteoarthrosis of hip in any field. Exclude patients with missing discharge disposition (DISP=missing), transferring to another short-term hospital (DISP=2), MDC 14 (pregnancy, childbirth, and puerperium), and MDC 15 (newborns and other neonates).
Type of Indicator Provider Level, Mortality Indicator for Inpatient Procedures
Empirical Performance Population Rate: 0.25 per 100 discharges at risk
Empirical Rating 3
Summary of Evidence Hip replacement is an elective surgery with relatively low mortality rates. However, the main recipients of hip replacement are elderly individuals with increased risk for complications and morbidity from surgery. Although the low mortality rate is likely to affect the precision of this indicator, the precision is adequate for a quality indicator. Patient characteristics such as age and comorbidities may influence the mortality rate. Risk adjustment is highly recommended for this indicator, and providers may want to examine the case mix of their populations. This indicator should be considered with length of stay and transfer rates to account for differing discharge practices among hospitals. Limitations on Use Because hip replacement is an elective procedure, some selection of patient population may create bias. Risk adjustment for clinical factors, or at a minimum APR-DRGs, is recommended because of the confounding bias
for hip replacement. In addition, little evidence exists supporting the construct validity of this indicator. Details Face validity: Does the indicator capture an aspect of quality that is widely regarded as important and subject to provider or public health system control? Mortality for hip replacement is very low, as it should be for a procedure that is designed to improve function rather than extend survival. However, elderly patients are at a significant risk of post-operative complications such as pneumonia, osteomyelitis, myocardial ischemia, and deep vein thrombosis. If not recognized and effectively treated, complications may lead to life-threatening problems. Precision: Is there a substantial amount of provider or community level variation that is not attributable to random variation? Primary total hip arthroplasty is one of the most frequent types of major orthopedic surgery;

Version 2.1 52 Revision 3 (July 21, 2004)
about 160,000 were performed in the United States in 1998.
119 The relatively small number
of deaths following total hip arthroplasty suggests that mortality rates are likely to be unreliable at the hospital level. Empirical evidence shows that this indicator is adequately precise, with a raw provider level mean of 1.2% and a substantial standard deviation of 5.7%.
120
Relative to other indicators, a high percentage of the variation occurs at the provider level, rather than the discharge level. The signal ratio (i.e., the proportion of the total variation across providers that is truly related to systematic differences in provider performance rather than random variation) is low, at 20.0%, indicating that some of the observed differences in provider performance very likely do not represent true differences. Minimal bias: Is there either little effect on the indicator of variations in patient disease severity and comorbidities, or is it possible to apply risk adjustment and statistical methods to remove most or all bias? Hip replacement has the potential for selection bias caused by the decision to select surgery. The known predictors of in-hospital mortality include age, hip fracture, and the presence of any significant comorbidity.
121 122
Construct validity: Does the indicator perform well in identifying true (or actual) quality of care problems? Using administrative data without any risk adjustment, Lavernia and Guzman found no association between hospital volume and
119
Popovic JR, Kozak LJ. National hospital
discharge survey: annual summary, 1998 [In Process Citation]. Vital Health Stat 13 2000(148):1-194.
120
Nationwide Inpatient Sample. Healthcare
Cost and Utilization Project. Agency for Healthcare Research and Quality, Rockville, MD. http://hcup.ahrq.gov/HCUPnet.asp.
121
Kreder HF, Williams JI, Jaglal S, et al. Are
complication rates for elective primary total hip arthroplasty in Ontario related to surgeon and hospital volumes? A preliminary investigation. Can J Surg 1998;41(6):431-7.
122
Whittle J, et al. 1993.
mortality following total hip arthroplasty.123
However, surgeons with fewer than 10 cases per year showed a significant increase in the death rate, and hospitals with fewer than 10 cases per year showed a significant increase in complications. One observational study attributed a decrease in post-operative mortality (from 0.36% in 1981-85 to 0.10% in 1987-91) to changes in perioperative care, such as reduced intraoperative blood loss, more aggressive arterial and oximetric monitoring, and increased use of epidural instead of general anesthesia.
124
Fosters true quality improvement: Is the indicator insulated from perverse incentives for providers to improve their reported performance by avoiding difficult or complex cases, or by other responses that do not improve quality of care? All in-hospital mortality measures may encourage earlier post-operative discharge, and thereby shift deaths to skilled nursing facilities or outpatient settings. Prior use: Has the measure been used effectively in practice? Does it have potential for working well with other indicators? Hip replacement was included in the original HCUP QIs; it is also used by HealthGrades.com and the Greater New York Hospital Association.
123
Lavernia CJ, Guzman JF. Relationship of
surgical volume to short-term mortality, morbidity, and hospital charges in arthroplasty. J Arthroplasty 1995;10(2):133-40.
124
Sharrock et al. 1995.
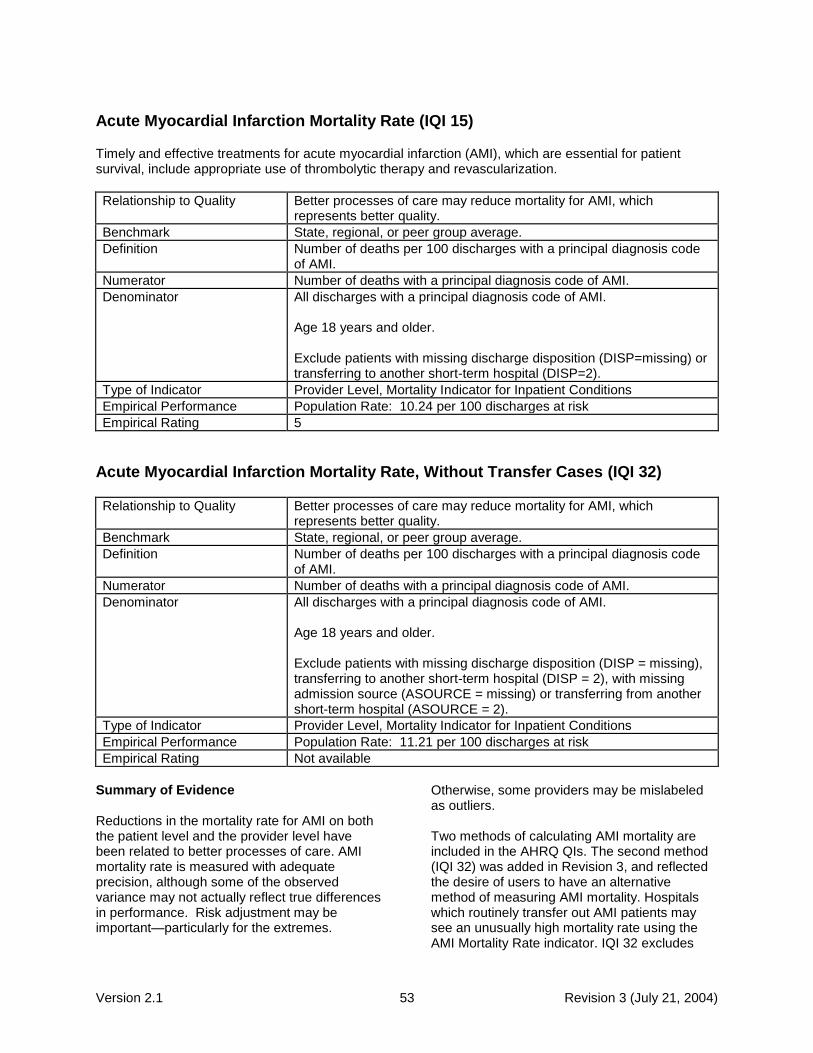
Version 2.1 53 Revision 3 (July 21, 2004)
Acute Myocardial Infarction Mortality Rate (IQI 15)
Timely and effective treatments for acute myocardial infarction (AMI), which are essential for patient survival, include appropriate use of thrombolytic therapy and revascularization.
Relationship to Quality Better processes of care may reduce mortality for AMI, which represents better quality.
Benchmark State, regional, or peer group average.
Definition Number of deaths per 100 discharges with a principal diagnosis code of AMI.
Numerator Number of deaths with a principal diagnosis code of AMI.
Denominator All discharges with a principal diagnosis code of AMI. Age 18 years and older. Exclude patients with missing discharge disposition (DISP=missing) or transferring to another short-term hospital (DISP=2).
Type of Indicator Provider Level, Mortality Indicator for Inpatient Conditions
Empirical Performance Population Rate: 10.24 per 100 discharges at risk
Empirical Rating 5
Acute Myocardial Infarction Mortality Rate, Without Transfer Cases (IQI 32)
Relationship to Quality Better processes of care may reduce mortality for AMI, which represents better quality.
Benchmark State, regional, or peer group average.
Definition Number of deaths per 100 discharges with a principal diagnosis code of AMI.
Numerator Number of deaths with a principal diagnosis code of AMI.
Denominator All discharges with a principal diagnosis code of AMI. Age 18 years and older. Exclude patients with missing discharge disposition (DISP = missing), transferring to another short-term hospital (DISP = 2), with missing admission source (ASOURCE = missing) or transferring from another short-term hospital (ASOURCE = 2).
Type of Indicator Provider Level, Mortality Indicator for Inpatient Conditions
Empirical Performance Population Rate: 11.21 per 100 discharges at risk
Empirical Rating Not available
Summary of Evidence Reductions in the mortality rate for AMI on both the patient level and the provider level have been related to better processes of care. AMI mortality rate is measured with adequate precision, although some of the observed variance may not actually reflect true differences in performance. Risk adjustment may be important—particularly for the extremes.
Otherwise, some providers may be mislabeled as outliers. Two methods of calculating AMI mortality are included in the AHRQ QIs. The second method (IQI 32) was added in Revision 3, and reflected the desire of users to have an alternative method of measuring AMI mortality. Hospitals which routinely transfer out AMI patients may see an unusually high mortality rate using the AMI Mortality Rate indicator. IQI 32 excludes

Version 2.1 54 Revision 3 (July 21, 2004)
transfers to account for this problem, however, doing so results in the loss of transferred AMI patients from any quality measurement. Therefore, some users may wish to use the AMI Mortality Rate to ensure the inclusion of all AMI patients. Limitations on Use Thirty-day mortality may be significantly different than in-hospital mortality, leading to information bias. This indicator should be considered in conjunction with length-of-stay and transfer rates. Risk adjustment for clinical factors (or at a minimum APR-DRGs) is recommended. Details Face validity: Does the indicator capture an aspect of quality that is widely regarded as important and subject to provider or public health system control? AMI affects 1.5 million people each year, and approximately one-third die in the acute phase of the heart attack.
125 Studies that show
processes of care linked to survival improvements have resulted in detailed practice guidelines covering all phases of AMI management.
126
Precision: Is there a substantial amount of provider or community level variation that is not attributable to random variation? The precision of AMI mortality rate estimates may be problematic for medium and small hospitals. Empirical evidence shows that this indicator is precise, with a raw provider level
125
American Heart Association. Heart Attack
and Stroke Facts: 1996 Statistical Supplement. Dallas, TX: American Heart Association; 1996.
126
Ryan TJ, Antman EM, Brooks NH, et al.
1999 update: ACC/AHA guidelines for the management of patients with acute myocardial infarction. A report of the American College of Cardiology/American Heart Association Task Force on Practice Guidelines (Committee on Management of Acute Myocardial Infarction). J Am Coll Cardiol 1999;34(3):890-911.
mean of 24.4% and a standard deviation of 16.1%.
127
Relative to other indicators, a higher percentage of the variation occurs at the provider level rather than the discharge level. The signal ratio (i.e., the proportion of the total variation across providers that is truly related to systematic differences in provider performance rather than random variation) is moderate, at 42.8%, indicating that some of the observed differences in provider performance likely do not represent true differences. Minimal bias: Is there either little effect on the indicator of variations in patient disease severity and comorbidities, or is it possible to apply risk adjustment and statistical methods to remove most or all bias? Numerous studies have established the importance of risk adjustment for AMI patients. The most important predictors of short-term AMI mortality have been shown to include age, previous AMI, tachycardia, pulmonary edema and other signs of congestive heart failure, hypotension and cardiogenic shock, anterior wall and Q-wave infarction, cardiac arrest, and serum creatinine or urea nitrogen. Using different risk adjustment methods or data sources (administrative versus clinical data) affects which specific hospitals are identified as outliers.
128 129
Construct validity: Does the indicator perform well in identifying true (or actual) quality of care problems? When Meehan et al. evaluated coding accuracy, severity of illness, and process-based quality of care in Connecticut hospitals, they found that the hospitals with the highest risk-adjusted mortality had significantly lower utilization of
127
Nationwide Inpatient Sample and State
Inpatient Databases. Healthcare Cost and Utilization Project. Agency for Healthcare Research and Quality, Rockville, MD. http://www.ahrq.gov/data/hcup
128
Landon B, Iezzoni LI, Ash AS, et al.
Judging hospitals by severity-adjusted mortality rates: the case of CABG surgery. Inquiry 1996;33(2):155-66.
129
Second Report of the California Hospitals
Outcomes Project, May 1996, Acute Myocardial Infarction. Sacramento, CA: Office of Statewide Health Planning and Development; 1996.

Version 2.1 55 Revision 3 (July 21, 2004)
beneficial therapies.130
In the California Hospital Outcomes Project, hospitals with low risk-adjusted AMI mortality were more likely to give aspirin within 6 hours of arrival in the emergency room, perform cardiac catheterization and revascularization procedures within 24 hours, and give heparin to prevent thromboembolic complications.
131
Empirical evidence shows that AMI mortality is correlated with bilateral catheterization (r=-.16, p<.0001), mortality for congestive heart failure (CHF) (r=.46, p<.0001), pneumonia (r=.46, p<.0001), coronary artery bypass graft (CABG) (r=.50, p<.0001), stroke (r=.40, p<.0001), and gastrointestinal hemorrhage (r=.38, p<.0001).
132
Fosters true quality improvement: Is the indicator insulated from perverse incentives for providers to improve their reported performance by avoiding difficult or complex cases, or by other responses that do not improve quality of care? The use of AMI mortality as an indicator is unlikely to impede access to needed care. However, a few patients who fail to respond to resuscitative efforts may not be admitted if there is pressure to reduce inpatient mortality. Prior use: Has the measure been used effectively in practice? Does it have potential for working well with other indicators? AMI mortality has been widely used as a hospital quality indicator by State health departments and the Joint Commission for the Accreditation of Healthcare Organizations (JCAHO). AMI mortality measured by IQI 32 is closely related to the JCAHO indicator for AMI mortality.
130
Meehan TP, Hennen J, Radford MJ, et al.
Process and outcome of care for acute myocardial infarction among Medicare beneficiaries in Connecticut: a quality improvement demonstration project. Ann Intern Med 1995;122(12):928-36.
131
Second Report of the California Hospitals
Outcomes Project, May 1996. Acute Myocardial Infarction. Sacramento, CA: Office of Statewide Health Planning and Development; 1996.
132
Nationwide Inpatient Sample.
Unlike the existing indicator for AMI mortality (IQI #15), it excludes patients transferring from another short-term hospital and patients with missing admission source. This indicator is NOT risk adjusted in the same manner as the JCAHO indicator and does not exclude hospice patients as the JCAHO indicator (due to inability to identify hospice patients in data).
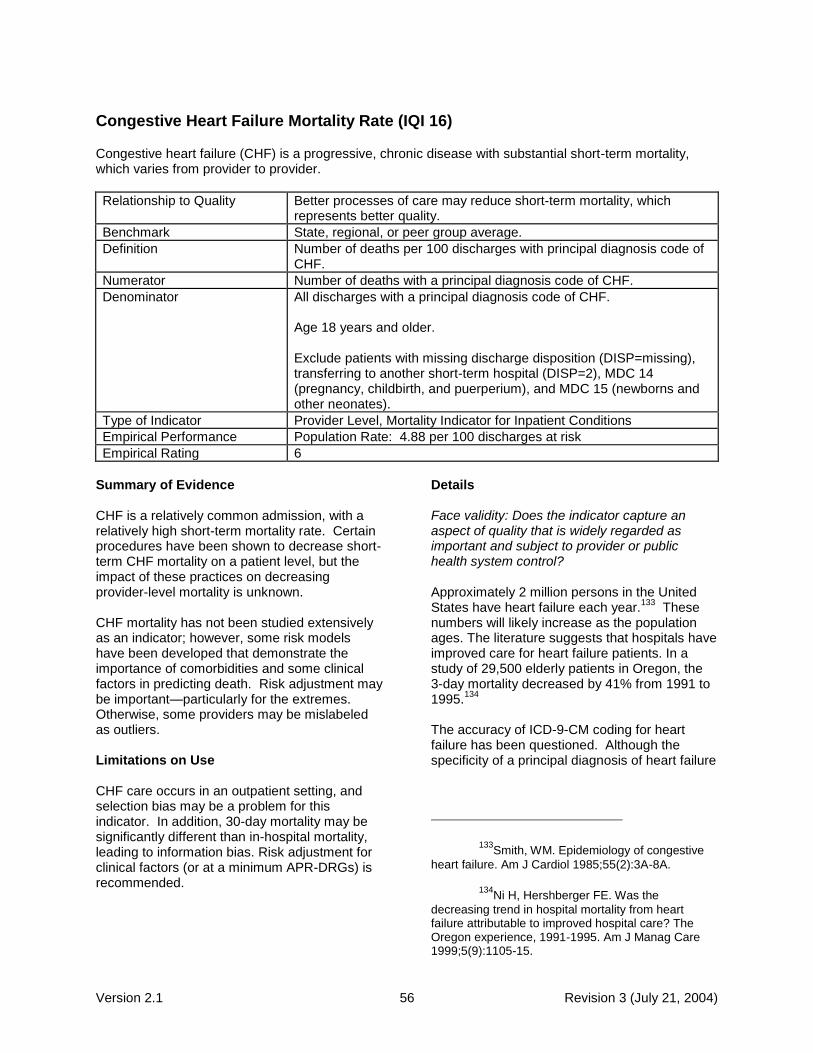
Version 2.1 56 Revision 3 (July 21, 2004)
Congestive Heart Failure Mortality Rate (IQI 16)
Congestive heart failure (CHF) is a progressive, chronic disease with substantial short-term mortality, which varies from provider to provider.
Relationship to Quality Better processes of care may reduce short-term mortality, which represents better quality.
Benchmark State, regional, or peer group average.
Definition Number of deaths per 100 discharges with principal diagnosis code of CHF.
Numerator Number of deaths with a principal diagnosis code of CHF.
Denominator All discharges with a principal diagnosis code of CHF. Age 18 years and older. Exclude patients with missing discharge disposition (DISP=missing), transferring to another short-term hospital (DISP=2), MDC 14 (pregnancy, childbirth, and puerperium), and MDC 15 (newborns and other neonates).
Type of Indicator Provider Level, Mortality Indicator for Inpatient Conditions
Empirical Performance Population Rate: 4.88 per 100 discharges at risk
Empirical Rating 6
Summary of Evidence CHF is a relatively common admission, with a relatively high short-term mortality rate. Certain procedures have been shown to decrease short-term CHF mortality on a patient level, but the impact of these practices on decreasing provider-level mortality is unknown. CHF mortality has not been studied extensively as an indicator; however, some risk models have been developed that demonstrate the importance of comorbidities and some clinical factors in predicting death. Risk adjustment may be important—particularly for the extremes. Otherwise, some providers may be mislabeled as outliers. Limitations on Use CHF care occurs in an outpatient setting, and selection bias may be a problem for this indicator. In addition, 30-day mortality may be significantly different than in-hospital mortality, leading to information bias. Risk adjustment for clinical factors (or at a minimum APR-DRGs) is recommended.
Details Face validity: Does the indicator capture an aspect of quality that is widely regarded as important and subject to provider or public health system control? Approximately 2 million persons in the United States have heart failure each year.
133 These
numbers will likely increase as the population ages. The literature suggests that hospitals have improved care for heart failure patients. In a study of 29,500 elderly patients in Oregon, the 3-day mortality decreased by 41% from 1991 to 1995.
134
The accuracy of ICD-9-CM coding for heart failure has been questioned. Although the specificity of a principal diagnosis of heart failure
133
Smith, WM. Epidemiology of congestive
heart failure. Am J Cardiol 1985;55(2):3A-8A.
134
Ni H, Hershberger FE. Was the
decreasing trend in hospital mortality from heart failure attributable to improved hospital care? The Oregon experience, 1991-1995. Am J Manag Care 1999;5(9):1105-15.

Version 2.1 57 Revision 3 (July 21, 2004)
is high, the sensitivity is low.135
Face validity will be maximized by limiting analyses to patients with a principal diagnosis of heart failure. Precision: Is there a substantial amount of provider or community level variation that is not attributable to random variation? Empirical evidence shows that this indicator is precise, with a raw provider level mean of 7.5% and an standard deviation of 9.5%.
136
Relative to other indicators, a lower percentage of the variation occurs at the provider level rather than the discharge level. The signal ratio (i.e., the proportion of the total variation across providers that is truly related to systematic differences in provider performance rather than random variation) is moderate, at 53.5%, indicating that some of the observed differences in provider performance likely do not represent true differences. Minimal bias: Is there either little effect on the indicator of variations in patient disease severity and comorbidities, or is it possible to apply risk adjustment and statistical methods to remove most or all bias? Mortality is greatly influenced by age, transfer, cerebrovascular disease, chronic obstructive pulmonary disease, hyponatremia, other hydro-electrolytic disturbance, metastatic disease, renal disease, ventricular arrhythmia, liver disease, malignancy, hypotension, and shock.
137
138 139
135
Goff, DC, Jr., Pandey DK, Chan FA, et al.
Congestive heart failure in the United States: is there more than meets the I(CD code)? The Corpus Christi Heart Project. Arch Intern Med 2000;160(2):197-202.
136
Nationwide Inpatient Sample and State
Inpatient Databases. Healthcare Cost and Utilization Project. Agency for Healthcare Research and Quality, Rockville, MD. http://www.ahrq.gov/data/hcup
137
Yusuf, et al. 1989.
138
MacIntyre K, Capewell lS, Stewart S, et al.
Evidence of improving prognosis in heart failure: trends in case fatality in 66,547 patients hospitalized between 1986 and 1995 [see comments]. Circulation 2000;102(10):1126-31.
Construct validity: Does the indicator perform well in identifying true (or actual) quality of care problems? No studies specifically examined the construct validity of in-hospital mortality from heart failure. Although processes of care have been shown to decrease mortality on a patient level, the effect of these processes of care on provider-level mortality rates is unknown. Empirical evidence shows that CHF mortality is positively related to other mortality indicators, such as pneumonia, gastrointestinal hemorrhage, and stroke. Fosters true quality improvement: Is the indicator insulated from perverse incentives for providers to improve their reported performance by avoiding difficult or complex cases, or by other responses that do not improve quality of care? Risk-adjusted measures of mortality may lead to an increase in coding of comorbidities. All in-hospital mortality measures may encourage earlier post-operative discharge, and thereby shift deaths to skilled nursing facilities or outpatient settings. However, Rosenthal et al. found no evidence that hospitals with lower in-hospital standardized mortality had higher (or lower) early post-discharge mortality.
140
Prior use: Has the measure been used effectively in practice? Does it have potential for working well with other indicators? CHF mortality has been widely used as a quality indicator. HealthGrades.com, the University Hospital Consortium, and the Greater New York Hospital Association have used this measure. The Maryland Hospital Association includes this measure in its Maryland QI Project Indicator set. Likewise, the Michigan Hospital Association includes CHF in an aggregated mortality measure.
139
Psaty BM, Boineau R, Kuller LH, et al.
The potential costs of upcoding for heart failure in the United States. Am J Cardiol 1999;84(1):108-9, A9.
140
Rosenthal GE, Baker DW, Norris DG, et
al. Relationships between in-hospital and 30-day standardized hospital mortality: implications for profiling hospitals. Health Serv Res 2000;34(7):1449-68.

Version 2.1 58 Revision 3 (July 21, 2004)
Acute Stroke Mortality Rate (IQI 17)
Quality treatment for acute stroke must be timely and efficient to prevent potentially fatal brain tissue death, and patients may not present until after the fragile window of time has passed.
Relationship to Quality Better processes of care may reduce short-term mortality, which represents better quality.
Benchmark State, regional, or peer group average.
Definition Number of deaths per 100 discharges with principal diagnosis code of stroke.
Numerator Number of deaths with a principal diagnosis code of stroke.
Denominator All discharges with a principal diagnosis code of stroke. Age 18 years and older. Exclude patients with missing discharge disposition (DISP=missing), transferring to another short-term hospital (DISP=2), MDC 14 (pregnancy, childbirth, and puerperium), and MDC 15 (newborns and other neonates).
Type of Indicator Provider Level, Mortality Indicator for Inpatient Conditions
Empirical Performance Population Rate: 11.66 per 100 discharges at risk
Empirical Rating 10
Summary of Evidence
Quality treatment for stroke must be timely and efficient to prevent brain tissue death. Clinical factors of severity at presentation, including use of mechanical ventilation on the first day, may vary by hospital and influence mortality. Providers with high rates may wish to examine the case mix for these potentially complicating factors.
Further, hospitals with rehabilitation programs may have higher mortality rates. Providers may want to use acute stroke mortality in conjunction with length of stay for their hospitals and for surrounding areas. Many deaths occur out of the hospital, suggesting that linkage to death records for patients post-discharge may be a good addition to this indicator.
Limitations on Use
Some stroke care occurs in an outpatient setting, and selection bias may be a problem for this indicator. In addition, 30-day mortality may be somewhat different than in-hospital mortality, leading to information bias. Risk adjustment for clinical factors (or at a minimum APR-DRGs) is recommended. Coding appears suboptimal for acute stroke and may lead to bias.
Details
Face validity: Does the indicator capture an aspect of quality that is widely regarded as important and subject to provider or public health system control?
Stroke remains the third leading cause of death in the United States.
141 However, hospital care
has a relatively modest impact on patient survival, and most stroke deaths occur after the initial acute hospitalization.
Precision: Is there a substantial amount of provider or community level variation that is not attributable to random variation?
Because stroke severity has a large effect on acute mortality, hospital mortality rates may be subject to considerable random variation. According to the literature, only 10-15% of stroke patients die during hospitalization.
142
141
Centers for Disease Control and
Prevention. Report of Final Mortality Statistics, 1996. Volume 47, Number 9. Available at http://www.cdc. gov/nchs/data/nvsr/nvsr47/nvs47_09.pdf.
142
Brown RD, Whisnant JP, Sicks JD, et al.
Stroke incidence, prevalence, and survival: secular trends in Rochester, Minnesota, through 1989. Stroke 1996;27(3):373-80.

Version 2.1 59 Revision 3 (July 21, 2004)
Empirical evidence shows that this indicator is precise, with a raw provider level mean of 21.3% and a standard deviation of 13.7%.
143
Relative to other indicators, a higher percentage of the variation occurs at the provider level, rather than the discharge level. The signal ratio (i.e., the proportion of the total variation across providers that is truly related to systematic differences in provider performance rather than random variation) is moderate, at 51.9%, indicating that some of the observed differences in provider performance likely do not represent true differences.
Minimal bias: Is there either little effect on the indicator of variations in patient disease severity and comorbidities, or is it possible to apply risk adjustment and statistical methods to remove most or all bias?
Williams et al. pooled the results of four studies that showed significant inaccuracies in ICD-9-CM codes for identifying stroke patients.
144
However, there are no studies documenting cross-hospital variations in these coding practices.
More patients with transient ischemic attacks (TIAs) are likely to be admitted to some hospitals because of the increased interest in the care of acute stroke patients.
145 Therefore,
hospitals with more liberal admitting policies may appear to have lower mortality rates.
Coma at presentation and a history of previous stroke substantially increase the mortality of patients admitted with stroke.
146 Patients with
143
Nationwide Inpatient Sample and State
Inpatient Databases. Healthcare Cost and Utilization Project. Agency for Healthcare Research and Quality, Rockville, MD. http://www.ahrq.gov/data/hcup/
144
Williams GR, Jiang JG, Matchar DB, et al.
Incidence and occurrence of total (first-ever and recurrent) stroke. Stroke 1999;30(12):2523-8.
145
Feinberg WM. Guidelines for the
management of transient ischemic attacks. Ad Hoc Committee on Guidelines for the Management of Transient Ischemic Attacks of the Stroke Council, American Heart Association, Heart Dis Stroke 1994;3(5):275-83.
146
Samsa GP, Bian J, Lipscomb J, et al.
Epidemiology of recurrent cerebral infarction: a Medicare claims-based comparison of first and
prior aspirin use tend to have better outcomes.
147
Construct validity: Does the indicator perform well in identifying true (or actual) quality of care problems?
Thrombolytic therapy has been shown to be beneficial in acute stroke; however, the small percentage of patients who receive this treatment suggests that it is likely to have only a modest impact on hospital mortality.
148
Empirical evidence shows that stroke mortality is positively related to mortality indicators for pneumonia, gastrointestinal hemorrhage, and congestive heart failure.
Fosters true quality improvement: Is the indicator insulated from perverse incentives for providers to improve their reported performance by avoiding difficult or complex cases, or by other responses that do not improve quality of care?
All in-hospital mortality measures may encourage earlier post-operative discharge, thereby shifting deaths to skilled nursing facilities or outpatient settings. This may lead to biased comparisons among hospitals with different mean lengths of stay. ―Overcoding‖ TIAs as strokes may also decrease stroke mortality rates.
Prior use: Has the measure been used effectively in practice? Does it have potential for working well with other indicators?
Stroke mortality indicators have been used by the HealthGrades.com, University Hospital Consortium, Maryland Hospital Association Quality Indicators Project, and the Greater New York Hospital Association.
recurrent strokes on 2-year survival and cost. Stroke 1999;30(2):338-49.
147
Kalra L, Perez I, Smithard DG, et al. Does
prior use of aspirin affect outcome in ischemic stroke? Am J Med 2000;108(3):205-9.
148
Tissue plasminogen activator for acute
ischemic stroke. The National Institute of Neurological Disorders and Stroke rt-PA Stroke Study Group. N Engl J Med 1995;333(24):1581-7.

Version 2.1 60 Revision 3 (July 21, 2004)
Gastrointestinal Hemorrhage Mortality Rate (IQI 18)
Gastrointestinal (GI) hemorrhage may lead to death when uncontrolled, and the ability to manage severely ill patients with comorbidities may influence the mortality rate.
Relationship to Quality Better processes of care may reduce mortality for GI hemorrhage, which represents better quality.
Benchmark State, regional, or peer group average.
Definition Number of deaths per 100 discharges with principal diagnosis code of GI hemorrhage.
Numerator Number of deaths with a principal diagnosis code of gastrointestinal hemorrhage.
Denominator All discharges with principal diagnosis code for gastrointestinal hemorrhage. Age 18 years and older. Exclude patients with missing discharge disposition (DISP=missing), transferring to another short-term hospital (DISP=2), MDC 14 (pregnancy, childbirth, and puerperium), and MDC 15 (newborns and other neonates).
Type of Indicator Provider Level, Mortality Indicator for Inpatient Conditions
Empirical Performance Population Rate: 3.41 per 100 discharges at risk
Empirical Rating 5
Summary of Evidence GI hemorrhage itself is rarely the cause of death, and the extreme influence of comorbidities on the survival rate of patients with GI hemorrhage—as well as the influence of age and timing of onset (pre- or post-hospitalization)—raises questions about the potential bias of this indicator. Providers should risk-adjust for comorbidities. In addition, providers with high rates may want to examine their case-mix for higher complexity of cases (e.g., patients over 60, more comorbidities). Hospital practices differ, with some hospitals discharging patients earlier than others. For this reason, this indicator should be considered in conjunction with length of stay and transfer rates. Limitations on Use Limited evidence supports the construct validity of this indicator. Risk adjustment for clinical factors, or at a minimum APR-DRGs, is recommended because of the substantial confounding bias for this indicator.
Details Face validity: Does the indicator capture an aspect of quality that is widely regarded as important and subject to provider or public health system control? Admission for GI hemorrhage is fairly common, and mortality rates vary greatly. Lower mortality has been associated with more use of treatments such as early endoscopy (within 24-48 hours of presentation). Mortality rates on large population-based databases have not changed since the 1940s, although the ages and comorbidities of patients have increased.
149
Precision: Is there a substantial amount of provider or community level variation that is not attributable to random variation? Rates of mortality in GI hemorrhage vary from 0% to 29%, with most studies reporting rates of 3.5% to 11%. Empirical evidence shows that
149
Rockall TA, Logan RF, Devlin HB, et al.
Variation in outcome after acute upper gastrointestinal haemorrhage. The National Audit of Acute Upper Gastrointestinal Haemorrhage. Lancet 1995;346(8971):346-50.

Version 2.1 61 Revision 3 (July 21, 2004)
this indicator is precise, with a raw provider mean of 4.6% and a standard deviation of 5.7%.
150
Relative to other indicators, a lower percentage of the variation occurs at the provider level, rather than the discharge level. The signal ratio (i.e., the proportion of the total variation across providers that is truly related to systematic differences in provider performance rather than random variation) is low, at 20.2%, indicating that some of the observed differences in provider performance do not represent true differences in provider performance. Minimal bias: Is there either little effect on the indicator of variations in patient disease severity and comorbidities, or is it possible to apply risk adjustment and statistical methods to remove most or all bias? Mortality from GI hemorrhage is highly influenced by patient comorbidities, as well as the nature and severity of the bleed itself. One study noted that some endoscopic findings, hemodynamic characteristics, and comorbidities were highly predictive of life-threatening events.
151 Another study tested the effect of risk
adjustment on hospital ranking for gastrointestinal hemorrhage mortality. Risk adjusting for age, shock, and comorbidity changed 30 hospitals‘ rankings by more than 10. Adding diagnosis, endoscopy findings, and rebleed status changed 32 hospital rankings by more than 10.
152
Construct validity: Does the indicator perform well in identifying true (or actual) quality of care problems? No studies explicitly evaluated the construct validity of GI hemorrhage. Although processes of care have been shown to decrease mortality on a patient level, the effect of these processes
150
Nationwide Inpatient Sample and State
Inpatient Databases. Healthcare Cost and Utilization Project. Agency for Healthcare Research and Quality, Rockville, MD. http://www.ahrq.gov/data/hcup
151
Hay JA, Lyubashevsky E, Elashoff J, et al.
Upper gastrointestinal hemorrhage clinical guideline determining the optimal hospital length of stay. Am J Med 1996;100(3):313-22.
152
Rockall et al., 1995.
of care on provider-level mortality rates is unknown. Empirical evidence shows that GI hemorrhage is positively related to mortality indicators such as pneumonia, stroke, and congestive heart failure.
153
One meta-analysis showed a slight advantage for early endoscopy.
154 Another study found that
endoscopy was not related to mortality in either the bivariate or multivariate analyses.
155
Fosters true quality improvement: Is the indicator insulated from perverse incentives for providers to improve their reported performance by avoiding difficult or complex cases, or by other responses that do not improve quality of care? Risk-adjusted measures of mortality may lead to an increase in coding of comorbidities. All in-hospital mortality measures may encourage earlier post-operative discharge, and thereby shift deaths to skilled nursing facilities or outpatient settings. This phenomenon may also lead to biased comparisons among hospitals with different mean lengths of stay. Prior use: Has the measure been used effectively in practice? Does it have potential for working well with other indicators? GI hemorrhage is currently used by the Cleveland Choice Health Quality Choice. The Maryland Hospital Association includes this measure in its Maryland QI Project Indicator set. Likewise, the Michigan Hospital Association includes GI hemorrhage in an aggregated mortality measure.
153
HCUPnet, Healthcare Cost and Utilization
Project, Agency for Healthcare Research and Quality, Rockville, MD. http://www.ahrq.gov/data/hcup/hcupnet.htm
154
Cook DJ, Guyatt GH, Salena BJ, et al.
Endoscopic therapy for acute nonvariceal upper gastrointestinal hemorrhage: a meta-analysis. Gastroenterology 1992;102(1):139-48.
155
Cooper GS, Chak A, Way LE, et al. Early
endoscopy in upper gastrointestinal hemorrhage: associations with recurrent bleeding, surgery, and length of hospital stay. Gastrointest Endosc 1999;49(2):145-52.

Version 2.1 62 Revision 3 (July 21, 2004)
Hip Fracture Mortality Rate (IQI 19)
Hip fractures, which are a common cause of morbidity and functional decline among elderly persons, are associated with a significant increase in the subsequent risk of mortality.
Relationship to Quality Better processes of care may reduce mortality for hip fracture, which represents better quality.
Benchmark State, regional, or peer group average.
Definition Number of deaths per 100 discharges with principal diagnosis code of hip fracture.
Numerator Number of deaths with a principal diagnosis code of hip fracture.
Denominator All discharges with a principal diagnosis code for hip fracture. Age 18 years and older. Exclude patients with missing discharge disposition, transferring to another short-term hospital, MDC 14 (pregnancy, childbirth, and puerperium), and MDC 15 (newborns and other neonates).
Type of Indicator Provider Level, Mortality Indicator for Inpatient Conditions
Empirical Performance Population Rate: 3.07 per 100 discharges at risk
Empirical Rating 10
Summary of Evidence
Complications of hip fracture and other comorbidities lead to a relatively high mortality rate, and evidence suggests that some of these complications are preventable. Hip fracture mortality rate is measured with good precision, although some of the observed variance does not reflect true differences in performance. About 89% of hip fracture patients are elderly.
Patient age, sex, comorbidities, fracture site, and functional status are all predictors of functional impairment and mortality. Administrative data may not contain sufficient information for these risk factors.
Limitations on Use
Thirty-day mortality may be somewhat different than in-hospital mortality, leading to information bias. Mortality rates should be considered in conjunction with length of stay and transfer rates. Risk adjustment for clinical factors (or at a minimum APR-DRGs) is recommended. Limited evidence exists for the construct validity of this indicator.
Details
Face validity: Does the indicator capture an aspect of quality that is widely regarded as important and subject to provider or public health system control? Hip fractures are associated with a significant increase in the subsequent risk of mortality, which persists for a minimum of 3 months among the oldest and most impaired individuals.
156 157
Elderly patients often have multiple comorbidities and pre-fracture functional impairments. As a result, they are at significant risk of postoperative complications, which—if not recognized and effectively treated—can lead to life-threatening problems.
Precision: Is there a substantial amount of provider or community level variation that is not attributable to random variation?
156
Forsen L, Sogaard AJ, Meyer HE, et al.
Survival after hip fracture: short- and long-term excess mortality according to age and gender. Osteoporos Int 1999;10(1):73-8.
157
Wolinsky FD, Fitzgerald JF, Stump TE.
The effect of hip fracture on mortality, hospitalization, and functional status: a prospective study. Am J Public Health 1997;87(3):398-403.

Version 2.1 63 Revision 3 (July 21, 2004)
The largest published study of in-hospital mortality reported a rate of 4.9% in 1979-88, which suggests that mortality rates are likely to be relatively reliable at the hospital level.
158
Empirical evidence shows that this indicator is precise, with a raw provider level mean of 14.4% and a standard deviation of 16.0%.
159
Relative to other indicators, a higher percentage of the variation occurs at the provider level, rather than the discharge level. The signal ratio (i.e., the proportion of the total variation across providers that is truly related to systematic differences in provider performance rather than random variation) is moderate, at 54.3%, indicating that some of the observed differences in provider performance likely do not represent true differences.
Minimal bias: Is there either little effect on the indicator of variations in patient disease severity and comorbidities, or is it possible to apply risk adjustment and statistical methods to remove most or all bias?
Demographic predictors of in-hospital or 30-day mortality include age, male sex, and prior residence in a nursing home. Fracture site may be a significant predictor for long-term outcomes. Comorbidity predictors include malnutrition; venous, digestive, and cardiovascular diseases; neoplasms, disorientation or delirium, chronic obstructive pulmonary disease, the number of chronic medical conditions, prior hospitalization within 1 month, and the American Society of Anesthesiology physical status score.
Empirical analyses confirm that this indicator has some potential bias, and risk adjustment with age and sex and APR-DRGs is highly recommended. Chart review may identify differences in functional status or other clinical factors not accounted for in discharge data.
Construct validity: Does the indicator perform well in identifying true (or actual) quality of care problems?
158
Myers AH, Robinson EG, Van Natta ML,
et al. Hip fractures among the elderly: factors associated with in-hospital mortality. Am J Epidemiol 1991;134(10):1128-37.
159
Nationwide Inpatient Sample and State
Inpatient Databases. Healthcare Cost and Utilization Project. Agency for Healthcare Research and Quality, Rockville, MD. http://www.ahrq.gov/data/hcup/
One study demonstrated that Medicare patients with poor ―process of care‖ had similar risk-adjusted 30-day mortality rates as patients with good process of care.
160 Nevertheless, there is
substantial evidence that at least two major causes of death among hip fracture patients are partially preventable: pulmonary emboli and acute myocardial infarction.
161 Very little
evidence supports an association between hospital volume and mortality following hip fracture repair.
Empirical evidence shows that hip fracture repair mortality is positively related to pneumonia, stroke, gastrointestinal hemorrhage, and congestive heart failure mortality.
162
Fosters true quality improvement: Is the indicator insulated from perverse incentives for providers to improve their reported performance by avoiding difficult or complex cases, or by other responses that do not improve quality of care?
All in-hospital mortality measures may encourage earlier post-operative discharge. Thirty-day mortality for hip fracture is substantially higher than in-hospital mortality in the largest published studies, suggesting that a relatively modest decrease in mean length of stay could significantly decrease inpatient mortality. Another potential effect would be to avoid operating on high-risk patients, although this seems unlikely.
Prior use: Has the measure been used effectively in practice? Does it have potential for working well with other indicators?
In-hospital mortality following hip fracture repair has not been widely used as a quality indicator, although it is included within a University Hospital Consortium indicator (mortality for DRG 209).
160
Kahn KL, Rogers WH, Rubenstein LV, et
al. Measuring quality of care with explicit process criteria before and after implementation of the DRG-based prospective payment system. JAMA 1990;264(15):1969-73.
161
Perez JV, Warwick DJ, Case CP, et al.
Death after proximal femoral fracture—an autopsy study. Injury 1995;26(4):237-40.
162
Nationwide Inpatient Sample.

Version 2.1 64 Revision 3 (July 21, 2004)
Pneumonia Mortality Rate (IQI 20)
Treatment with appropriate antibiotics may reduce mortality from pneumonia, which is a leading cause of death in the United States.
Relationship to Quality Inappropriate treatment for pneumonia may increase mortality.
Benchmark State, regional, or peer group average.
Definition Mortality in discharges with principal diagnosis code of pneumonia.
Numerator Number of deaths with a principal diagnosis code of pneumonia.
Denominator All discharges with principal diagnosis code of pneumonia. Age 18 years and older. Exclude patients with missing discharge disposition (DISP=missing), transferring to another short-term hospital (DISP=2), MDC 14 (pregnancy, childbirth, and puerperium), and MDC 15 (newborns and other neonates).
Type of Indicator Provider Level, Mortality Indicator for Inpatient Conditions
Empirical Performance Population Rate: 8.95 per 100 discharges at risk
Empirical Rating 7
Summary of Evidence
Pneumonia admissions are fairly common, and hospitals and physicians vary in admission practices. The high degree of patient heterogeneity suggests that providers may be mislabeled as poor quality without risk adjustment.
Providers with particularly high and low mortality rates should examine the case-mix of their patients for comorbidities, age, and clinical characteristics. Chart reviews may be helpful in determining whether differences truly arise from quality of care, or from patient-level differences in coding, comorbidities, or severity of disease. Providers may also wish to examine rates of outpatient care, because some patients are treated in outpatient settings.
Limitations on Use
Pneumonia care occurs in an outpatient setting, and selection bias may be a problem for this indicator. In addition, 30-day mortality may be somewhat different than in-hospital mortality, leading to information bias. Risk adjustment for clinical factors (or at a minimum APR-DRGs) is recommended.
Details
Face validity: Does the indicator capture an aspect of quality that is widely regarded as important and subject to provider or public health system control?
Pneumonia is the sixth leading cause of death in the United States.
163 Patient characteristics are
relatively important predictors of in-hospital mortality, although the performance of specific processes of care may also lead to better patient outcomes.
Precision: Is there a substantial amount of provider or community level variation that is not attributable to random variation?
The high degree of heterogeneity among patients admitted for pneumonia suggests that the mortality indicator will be imprecise. However, empirical evidence shows that this indicator is precise, with a raw provider level mean of 13.8% and a standard deviation of 10.2%.
164
163
Hoyert DL, Kochanek KD, Murphy SL.
Deaths: final data for 1997. Natl Vital Stat Rep 1999;47(19):1-104.
164
Nationwide Inpatient Sample and State
Inpatient Databases. Healthcare Cost and Utilization

Version 2.1 65 Revision 3 (July 21, 2004)
Relative to other indicators, a higher percentage of the variation occurs at the provider level rather than the discharge level. The signal ratio (i.e., the proportion of the total variation across providers that is truly related to systematic differences in provider performance rather than random variation) is moderate, at 62.9%, indicating that some of the observed differences in provider performance likely do not represent true differences.
Minimal bias: Is there either little effect on the indicator of variations in patient disease severity and comorbidities, or is it possible to apply risk adjustment and statistical methods to remove most or all bias? Comparison of hospital death rates with population death rates suggests that selection bias due to differing thresholds for admitting patients with pneumonia influences observed hospital mortality rates for pneumonia.
165
Population death rates from pneumonia (in particular, non-inpatient deaths) may be an important supplement to indicators based on hospital mortality. Some important predictors of pneumonia outcome are not reliably captured in administrative databases, including the microbial etiology, certain radiographic patterns, and pre-hospital functional status.
166 167
Construct validity: Does the indicator perform well in identifying true (or actual) quality of care problems? A recent study reported an association between choice of antibiotics and 3-day mortality for
Project. Agency for Healthcare Research and Quality, Rockville, MD. http://www.ahrq.gov/data/hcup/
165
Markowitz JS, Pashko S, Gutterman EM,
et al. Death rates among patients hospitalized with community-acquired pneumonia: a reexamination with data from three states. Am J Public Health 1996;86(8 Pt 1):1152-4.
166
Fine MJ, Smith MA, Carson CA, et al.
Prognosis and outcomes of patients with community-acquired pneumonia. A meta-analysis. JAMA 1996;275(2):134-41.
167
Davis RB, Iezzoni LI, Phillips RS, et al.
Predicting in-hospital mortality. The importance of functional status information. Med Care 1995;33(9):906-21.
patients hospitalized with pneumonia.168
More basic than the choice of a particular antibiotic regimen is the timely administration of any antibiotic to the patient, which bears a plausible connection to improved outcomes.
169
Empirical evidence shows that pneumonia mortality is positively related to stroke, gastrointestinal hemorrhage, and congestive heart failure.
170
Fosters true quality improvement: Is the indicator insulated from perverse incentives for providers to improve their reported performance by avoiding difficult or complex cases, or by other responses that do not improve quality of care? All in-hospital mortality measures may encourage earlier post-operative discharge, and thereby shift deaths to skilled nursing facilities or outpatient settings. This phenomenon may also lead to biased comparisons among hospitals with different mean lengths of stay. Prior use: Has the measure been used effectively in practice? Does it have potential for working well with other indicators? Pneumonia mortality is used as an indicator by the University Hospital Consortium, Greater New York Hospital Association, HealthGrades.com, Maryland Hospital Association, the Pennsylvania Health Care Cost Containment Council, and the California Hospital Outcomes Project.
168
Gleason PP, Heehan TP, Fine JM, et al.
Associations between initial antimicrobial therapy and medical outcomes for hospitalized elderly patients with pneumonia. Arch Intern Med 1999;159(21):2562-72.
169
Meehan TP, Fine MJ, Krumholz HM, et al.
Quality of care, process, and outcomes in elderly patients with pneumonia. JAMA 1997;278(23):2080-4.
170
Nationwide Inpatient Sample.

Version 2.1 66 Revision 3 (July 21, 2004)
Cesarean Delivery Rate (IQI 21)
Cesarean delivery is the most common operative procedure performed in the United States and is associated with higher costs than vaginal delivery. Despite a recent decrease in the rate of Cesarean deliveries, many organizations have aimed to monitor and reduce the rate.
Relationship to Quality Cesarean delivery has been identified as an overused procedure. As such, lower rates represent better quality.
Benchmark State, regional, or peer-group average.
Definition Provider-level number of Cesarean deliveries per 100 deliveries.
Numerator Number of Cesarean deliveries, identified by DRG, or by ICD-9-CM procedure codes if they are reported without a 7491 hysterotomy procedure.
Denominator All deliveries. Exclude patients with abnormal presentation, preterm, fetal death, multiple gestation diagnosis codes, or breech procedure codes.
Type of Indicator Provider Level, Procedure Utilization Indicator
Empirical Performance Population Rate: 19.88 per 100 discharges at risk
Empirical Rating 17
Primary Cesarean Delivery Rate (IQI 33)
Relationship to Quality Cesarean delivery has been identified as an overused procedure. As such, lower rates represent better quality.
Benchmark State, regional, or peer-group average.
Definition Provider-level number of Cesarean deliveries per 100 deliveries.
Numerator Number of Cesarean deliveries, identified by DRG, or by ICD-9-CM procedure codes if they are reported without a 7491 hysterotomy procedure.
Denominator All deliveries. Exclude patients with abnormal presentation, preterm delivery, fetal death, multiple gestation diagnosis codes, breech procedure codes, or a previous Cesarean delivery diagnosis in any diagnosis field.
Type of Indicator Provider Level, Procedure Utilization Indicator
Empirical Performance Population Rate: 12.67 per 100 discharges at risk
Empirical Rating Not evaluated
Summary of Evidence The rate of Cesarean delivery in the United States increased from 5.5% in 1970 to a high of 24.7% in 1988 and decreased to 20.7% in 1996.
171 A review of the literature indicates that
risk adjustment affects the outlier status and rankings of as many as 25% of hospitals. Given
171
Menard MK. Cesarean delivery rates in
the United States. The 1990s. Obstet Gynecol Clin North Am 1999;26(2):275-86.
these results, providers may want to examine the clinical characteristics of their populations when interpreting the results of this indicator. Clinical characteristics such as prior Cesarean, parity, breech presentation, placental or cord complications, sexually transmitted diseases (STDs), infections, and birth weight have been shown to explain substantial variation in Cesarean delivery rates. Information regarding some of these factors may be available by linking maternal discharge records to birth records. Providers may also wish to break down

Version 2.1 67 Revision 3 (July 21, 2004)
this indicator into primary and repeat Cesarean delivery rates. Empirical analyses demonstrated that Cesarean delivery rate is measured with good precision. Indicators for both total and primary cesarean delivery are included in Revision 3 of the AHRQ IQIs. Recently, the principle focus of quality initiatives has been primary cesarean deliveries, as more scrutiny has evolved around vaginal birth after cesarean delivery. However, some users, particularly when comparing with historical data, may wish to examine both the primary and total cesarean delivery rate. Limitations on Use Potential additional bias may result from clinical differences not identifiable in administrative data, so supplemental risk adjustment with linked birth records or other clinical data may be desirable. As a utilization indicator, the construct validity relies on the actual inappropriate use of procedures in hospitals with high rates, which should be investigated further. Face validity: Does the indicator capture an aspect of quality that is widely regarded as important and subject to provider or public health system control? While the appropriateness of Cesarean delivery depends largely on patients‘ clinical characteristics, studies have shown that individual physician practice patterns account for a significant portion of the variation in Cesarean delivery rates.
172 173
Non-clinical factors such as patient insurance status, hospital characteristics, and geographic region have also been related to rates.
174 175
176
172
Goyert GL, Bottoms FS, Treadwell MC, et
al. The physician factor in cesarean birth rates [see comments]. N Engl J Med 1989;320(11):706-9.
173
Berkowitz GS, Fiarman GS, Mojica MA, et
al. Effect of physician characteristics on the cesarean birth rate [see comments]. Am J Obstet Gynecol 1989;161(1):146-9.
174
Stafford RS. The impact of nonclinical
factors on repeat cesarean section [see comments]. JAMA 1991;265(1):59-63.
175
Haas JS, Udvarhelyi S, Epstein AM. The
effect of health coverage for uninsured pregnant
Precision: Is there a substantial amount of provider or community level variation that is not attributable to random variation? Based on empirical evidence, this indicator is precise, with a raw provider level mean of 21.4% and a substantial standard deviation of 8.7%.
177
Relative to other indicators, a higher percentage of the variation occurs at the provider level rather than the discharge level. However, the signal ratio (i.e., the proportion of the total variation across providers that is truly related to systematic differences in provider performance rather than random variation) is high, at 88.2%, indicating that the observed differences in provider performance represent true differences. Minimal bias: Is there either little effect on the indicator of variations in patient disease severity and comorbidities, or is it possible to apply risk adjustment and statistical methods to remove most or all bias? The overall Cesarean delivery rate cannot determine appropriate use, but the variation in rates across institutions and regions may, if the variations do not merely reflect variations in patient disease severity and comorbidities. Aron et al. used data from standardized reviews of medical records to adjust for clinical risk factors in women without prior Cesarean section. They found that hospital rankings often changed after risk adjustment, and in 57% of hospitals, the relative difference in unadjusted and adjusted rates was greater than 10%.
178
Additional studies found that risk-adjusting primary Cesarean delivery rates using a State
women on maternal health and the use of cesarean section [see comments]. JAMA 1993;270(1):61-4.
176
Stafford RS, Sullivan SD, Gardner LB.
Trends in cesarean section use in California, 1983 to 1990. Am J Obstet Gynecol 1993;168(4):1297-302.
177
Nationwide Inpatient Sample and State
Inpatient Databases. Healthcare Cost and Utilization Project. Agency for Healthcare Research and Quality, Rockville, MD. http://www.ahrq.gov/data/hcup
178
Aron DC, Harper DL, Shepardson LB, et
al. Impact of risk-adjusting cesarean delivery rates when reporting hospital performance. JAMA 1998;279(24):1968-72.

Version 2.1 68 Revision 3 (July 21, 2004)
birth certificate database substantially changes how hospital performance is judged.
179
Construct validity: Does the indicator perform well in identifying true (or actual) quality of care problems? The Cesarean rate for ―optimal‖ quality of care is unknown, and many studies note that lower Cesarean rates do not necessarily reflect better quality care. Based on empirical evidence, Cesarean section rate is inversely related to vaginal delivery after Cesarean (VBAC).
180
Fosters true quality improvement: Is the indicator insulated from perverse incentives for providers to improve their reported performance by avoiding difficult or complex cases, or by other responses that do not improve quality of care? The Cesarean delivery rate can be decreased by decreasing the primary Cesarean delivery rate or increasing the VBAC rate. Sachs et al. note that when a trial of labor after Cesarean delivery fails, the rate of maternal morbidity, including infection and operative injuries, increases substantially.
181
Prior use: Has the measure been used effectively in practice? Does it have potential for working well with other indicators? Cesarean delivery was included in the original HCUP QIs, and the reduction of Cesarean section rate is a goal for Healthy People 2010.
182
Cesarean Delivery Rate (IQI #21) closely mirrors indicators used by Healthy People 2010 and American College of Obstetricians and Gynecology. Primary Cesarean Delivery Rate (IQI #33) mirrors the Joint Commission on the
179
Balit JL, Dooley SL, Peaceman AN. Risk
adjustment for interhospital comparison of primary cesarean rates. Obstet Gynecol 1999;93(6):1025-30.
180
Nationwide Inpatient Sample.
181
Sachs BP, Kobelin C, Castro MA, et al.
The risks of lowering the cesarean-delivery rate. N Engl J Med 1999;340(1):54-7.
182
Healthy People 2010. Office of Disease
Prevention and Health Promotion, U.S. Department of Health and Human Services.
Accrediation of Healthcare Organizations (JCAHO) measure for Cesarean Delivery. Note that this indicator does not specifically exclude abortion procedures as the JCAHO measure does, although most abortion patients would not be included in the denominator.

Version 2.1 69 Revision 3 (July 21, 2004)
Vaginal Birth After Cesarean Rate, Uncomplicated (IQI 22)
The policy of recommending vaginal birth after Cesarean delivery (VBAC) represents to some degree a matter of opinion on the relative risks and benefits of a trial of labor in patients with previous Cesarean delivery.
Relationship to Quality VBAC has been identified as a potentially underused procedure. As such, higher rates represent better quality.
Benchmark State, regional, or peer-group average.
Definition Provider-level vaginal births per 100 discharges with a diagnosis of previous Cesarean delivery.
Numerator Number of vaginal births in women with a diagnosis of previous Cesarean delivery.
Denominator All deliveries with a previous Cesarean delivery diagnosis in any diagnosis field. Exclude patients with abnormal presentation, preterm, fetal death, multiple gestation diagnosis codes or breech procedure codes.
Type of Indicator Provider Level, Procedure Utilization Indicator
Empirical Performance Population Rate: 28.45 per 100 discharges at risk
Empirical Rating 19
Vaginal Birth After Cesarean Rate, All (IQI 34)
Relationship to Quality VBAC has been identified as a potentially underused procedure. As such, higher rates represent better quality.
Benchmark State, regional, or peer-group average.
Definition Provider-level vaginal births per 100 discharges with a diagnosis of previous Cesarean delivery.
Numerator Number of vaginal births in women with a diagnosis of previous Cesarean delivery.
Denominator All deliveries with a previous Cesarean delivery diagnosis in any diagnosis field.
Type of Indicator Provider Level, Procedure Utilization Indicator
Empirical Performance Population Rate: 27.32 per 100 discharges at risk
Empirical Rating Not evaluated
Summary of Evidence Health People 2010 established a goal of indirectly increasing VBAC rates by decreasing Cesarean deliveries in women with previous Cesarean deliveries to 63%.
183
This indicator is measured with very good precision, and it is likely that the observed
183
Healthy People 2010. Office of Disease
Prevention and Health Promotion. U.S. Department of Health and Human Services.
differences represent true differences in provider performance rather than random variation. According to the literature, some clinical factors—such as previous classic Cesarean delivery—may contraindicate VBAC, and this indicator should be risk-adjusted for these factors. Because these clinical factors may not be available in administrative data, linkage to birth records may provide for better risk adjustment. The best rate for VBAC has not been established. This indicator should be used in conjunction with area rates, national rates, and

Version 2.1 70 Revision 3 (July 21, 2004)
complication rates (maternal uterine rupture and length of stay, neonatal length of stay) to assess whether a rate is truly too high or too low. Limitations on Use Selection bias due to patient preferences and other factors may impact performance on this indicator. As noted earlier, supplemental adjustment with linked birth records or other clinical data may be desirable to address bias from clinical differences not identifiable in administrative data. Details Face validity: Does the indicator capture an aspect of quality that is widely regarded as important and subject to provider or public health system control? Despite the widespread use of VBAC rates as a quality indicator, a randomized trial comparing a trial of labor with elective repeat Cesarean delivery has yet to appear. In addition, approximately one-third of patients prefer to pursue repeat Cesarean delivery.
184 Many
physicians appear to consider Cesarean delivery preferable to vaginal delivery, given the potential complications of the former.
185
Precision: Is there a substantial amount of provider or community level variation that is not attributable to random variation? Empirical evidence shows that this indicator is very precise, with a raw provider level mean of 33.6% and a substantial standard deviation of 14.8%.
186 Relative to other indicators, a higher
percentage of the variation occurs at the provider level rather than the discharge level. The signal ratio (i.e., the proportion of the total variation across providers that is truly related to
184
Roberts RG, Bell HS, Wall EM, et al. Trial
of labor or repeated cesarean section. The woman‘s choice. Arch Fam Med 1997;6(2):120-5.
185
Al-Mufti R, McCarthy A, Fisk NM.
Obstetricians‘ personal choice and mode of delivery [letter] [see comments]. Lancet 1996;347(9000):544.
186
Nationwide Inpatient Sample and State
Inpatient Databases. Healthcare Cost and Utilization Project. Agency for Healthcare Research and Quality, Rockville, MD. http://www.ahrq.gov/data/hcup
systematic differences in provider performance rather than random variation) is high, at 83.1%. This indicates that the observed differences in provider performance likely represent true differences, although some of the observed difference is due to patient characteristics. Minimal bias: Is there either little effect on the indicator of variations in patient disease severity and comorbidities, or is it possible to apply risk adjustment and statistical methods to remove most or all bias? A study using birth certificates suggests that administrative data accurately distinguish the current mode of delivery (vaginal vs. Cesarean delivery), but less accurately identify VBAC and primary Cesarean delivery.
187 In addition,
administrative data sources do not include the clinical factors required to identify appropriate candidates for trial of labor.
188 As a result, the
denominator for VBAC rates calculated using administrative data will include women with an accepted medical indication for repeat Cesarean delivery, as well as patients who make an informed decision not to pursue a trial of labor.
189
Construct validity: Does the indicator perform well in identifying true (or actual) quality of care problems?
The likelihood that a patient will undergo VBAC correlates with certain provider and institutional variables, suggesting that certain providers are more likely to adapt to changes in policy or technology. Based on empirical results, VBAC rates are inversely related to Cesarean delivery.
190
187
Green DC, Moore JM, Adams MM, et al.
Are we underestimating rates of vaginal birth after previous cesarean birth? The validity of delivery methods from birth certificates. Am J Epidemiol 1998;147(6):581-6.
188
Aron DC, Harper DL, Shepardson LB, et
al. Impact of risk-adjusting cesarean delivery rates when reporting hospital performance. JAMA 1998;279(24):1968-72.
189
Roberts RG, Bell HS, Wall EM, et al. Trial
of labor or repeated cesarean section. The woman‘s choice. Arch Fam Med 1997;6(2):120-5.
190
Nationwide Inpatient Sample.

Version 2.1 71 Revision 3 (July 21, 2004)
Fosters true quality improvement: Is the indicator insulated from perverse incentives for providers to improve their reported performance by avoiding difficult or complex cases, or by other responses that do not improve quality of care? Promotion of VBAC as a quality indicator has led to successful increases in the VBAC rate in some cases, but not in others.
191 192
Prior use: Has the measure been used effectively in practice? Does it have potential for working well with other indicators? VBAC was included in the original HCUP QI indicator set. In addition, the Joint Commission on Accreditation of Healthcare Organizations (JCAHO) has selected VBAC as one of its core measures.
191
Kazandjian VA, Lied TR. Cesarean
section rates: effects of participation in a performance measurement project. Jt Comm J Qual Improv 1998;24(4):187-96.
192
Bickell NA, Zdeb MS, Applegate MS, et al.
Effect of external peer review on cesarean delivery rates: a statewide program. Obstet Gynecol 1996;87(5 Pt 1):664-7.

Version 2.1 72 Revision 3 (July 21, 2004)
Laparoscopic Cholecystectomy Rate (IQI 23)
Surgical removal of the gall bladder (cholecystectomy) performed with a laparoscope has been identified as an underused procedure. Laparoscopic cholecystectomy is associated with less morbidity in less severe cases.
Relationship to Quality Laparoscopic cholecystectomy is a new technology with lower risks than open cholecystectomy (removal of the gall bladder). Higher rates represent better quality.
Benchmark State, regional, or peer-group average.
Definition Number of laparoscopic cholecystectomies per 100 cholecystectomies.
Numerator Number of laparoscopic cholecystectomies (any procedure field).
Denominator All discharges with any procedure code of cholecystectomy in any procedure field. Include only discharges with uncomplicated cases: cholecystitis or cholelithiasis in any diagnosis field. Exclude MDC 14 (pregnancy, childbirth, and puerperium) and MDC 15 (newborns and other neonates).
Type of Indicator Provider Level, Procedure Utilization Indicator
Empirical Performance Population Rate: 75.09 per 100 discharges at risk
Empirical Rating 20
Summary of Evidence
Cholecystectomy—surgical removal of the gall bladder—is now performed with a laparoscope in about 75% of uncomplicated cases.
193
This indicator has a high percentage of variation attributable to providers. According to the literature, laparoscopic cholecystectomy may need to be adjusted for clinical severity, age, and other factors, because the procedure may be contraindicated for some patients, and others may not be clinically severe enough to qualify for cholecystectomy at all. Too many procedures in patients without appropriate clinical indications may artificially inflate the laparoscopic cholecystectomy rate without improving quality.
Limitations on Use
Up to one-half or more of all cholecystectomies are performed on an outpatient basis, and
193
Southern Surgeons Club. A prospective
analysis of 1518 laparoscopic cholecystectomies. NEJM 1991;324:1073-1078.
providers should incorporate outpatient data if possible when interpreting this indicator. Additional bias may result from clinical differences not identifiable in administrative data, so supplemental risk adjustment using other clinical data may be desirable. As a utilization indicator, the construct validity relies on the actual appropriate use of procedures in hospitals with high rates, which should be investigated further.
Details
Face validity: Does the indicator capture an aspect of quality that is widely regarded as important and subject to provider or public health system control?
Laparoscopic cholecystectomy is associated with less postoperative pain, lower patient-controlled morphine consumption, better postoperative pulmonary function and oxygen saturation, and quicker return to limited activity.
194 195
194
McMahon AJ, Russell IT, Baxter JN, et al.
Laparoscopic and minilaparotomy cholecystectomy: a randomised trial [see comment]. Lancet 1994;343(8890):135-8.

Version 2.1 73 Revision 3 (July 21, 2004)
Laparoscopic cholecystectomy requires more technical skill than the open approach. Therefore, a higher rate for this procedure (as a proportion of all cholecystectomies) suggests that a hospital can rapidly achieve proficiency in up-to-date treatment methods.
Precision: Is there a substantial amount of provider or community level variation that is not attributable to random variation?
According to the literature, cholecystectomies are relatively common, so moderately precise estimates of differences in laparoscopic use can be obtained. Based on empirical evidence, this indicator is very precise, with a raw provider level mean of 66.2% and a substantial standard deviation of 19.2%.
196
Relative to other indicators, a higher percentage of the variation occurs at the provider level, rather than the discharge level. The signal ratio (i.e., the proportion of the total variation across providers that is truly related to systematic differences in provider performance rather than random variation) is high, at 89.1%, indicating that the observed differences in provider performance likely represent true differences.
Minimal bias: Is there either little effect on the indicator of variations in patient disease severity and comorbidities, or is it possible to apply risk adjustment and statistical methods to remove most or all bias?
As surgeons become more experienced in laparoscopic cholecystectomies, they are likely to perform the procedure on more difficult patients. In addition, higher risks of complications are associated with older age and the presence of common bile duct stones.
197
195
McMahon AF, Russell IT, Ramsay G, et
al. Laparoscopic and minilaparotomy cholecystectomy: a randomized trial comparing postoperative pain and pulmonary function. Surgery 1994;115(5):533-9.
196
Nationwide Inpatient Sample and State
Inpatient Databases. Healthcare Cost and Utilization Project. Agency for Healthcare Research and Quality, Rockville, MD. http://www.ahrq.gov/data/hcup
197
Jatzko GR, Lisborg PH, Pertl AM, et al.
Multivariate comparison of complications after
Patient referral patterns and other selection factors may lead to substantial differences in laparoscopy rates (as a proportion of all cholecystectomies) across hospitals. Empirical results show that age and sex adjustment does seem to disproportionately impact hospitals in the low extreme relative to those in the high extreme.
Use of inpatient data could be substantially biasing, in that it eliminates those cholecystectomies performed on an outpatient basis, most of which are likely to be laparoscopic.
Construct validity: Does the indicator perform well in identifying true (or actual) quality of care problems?
According to the literature, there is no evidence that hospitals that use the laparoscopic approach more frequently provide better quality of care, based on other measures.
Fosters true quality improvement: Is the indicator insulated from perverse incentives for providers to improve their reported performance by avoiding difficult or complex cases, or by other responses that do not improve quality of care?
One concern with this indicator is that the advent of laparoscopic surgery has led to a substantial increase in the overall cholecystectomy rate, especially involving uncomplicated and elective patients.
198 Another concern is that the ―optimal‖
rate for this procedure has not been defined, and incentives to increase use may have negative consequences if local physicians lack appropriate training and expertise.
Prior use: Has the measure been used effectively in practice? Does it have potential for working well with other indicators?
Laparoscopic cholecystectomy was included in the original HCUP QI indicator set.
laparoscopic cholecystectomy and open cholecystectomy. Ann Surg 1995;221(4):381-6.
198
Escarce JJ, Chen W, Schwartz JS. Falling
cholecystectomy thresholds since the introduction of laparoscopic cholecystectomy. JAMA 1995;273(20):1581-5.

Version 2.1 74 Revision 3 (July 21, 2004)
Incidental Appendectomy in the Elderly Rate (IQI 24)
Removal of the appendix incidental to other abdominal surgery—such as urological, gynecological, or gastrointestinal surgeries—is intended to eliminate the risk of future appendicitis and to simplify any future differential diagnoses of abdominal pain.
Relationship to Quality Incidental appendectomy among the elderly is contraindicated. As such, lower rates represent better quality.
Benchmark State, regional, or peer-group average.
Definition Number of incidental appendectomies per 100 elderly with intra-abdominal procedure.
Numerator Number of incidental appendectomies (any procedure field).
Denominator All discharges age 65 years and older with intra-abdominal procedure (based on DRGs). Exclude MDC 14 (pregnancy, childbirth, and puerperium) and MDC 15 (newborns and other neonates).
Type of Indicator Provider Level, Procedure Utilization Indicator
Empirical Performance Population Rate: 2.43 per 100 discharges at risk
Empirical Rating 13
Summary of Evidence Incidental appendectomy is contraindicated in the elderly population, because this population has both a lower risk for developing appendicitis and a higher risk of postoperative complications. Given the low rate of incidental appendectomies, the precision for this indicator may be lower than other indicators. Empirical analyses found that this indicator is moderately precisely measured, and the bias with respect to provider differences is not likely to be high. Limitations on Use As a utilization indicator, the construct validity relies on the actual inappropriate use of procedures in hospitals with high rates, which should be investigated further. Details Face validity: Does the indicator capture an aspect of quality that is widely regarded as important and subject to provider or public health system control? For the population as a whole, evidence remains unclear whether the removal of the appendix increases risk of morbidity and mortality significantly, or whether it is worth any amount of
extra risk, given the low risk for future appendicitis and the ease of treatment. Andrew and Roty showed that incidental appendectomy was associated with a higher risk of wound infection (5.9% versus 0.9%) among cholecystectomy patients who were at least 50 years of age, but not among younger patients.
199
Based on this finding and the findings of Warren and colleagues, the risk of incidental appendectomy is believed to outweigh the benefits for elderly patients.
200 201
202
203
204
199
Andrew MH, Roty AR, Jr. Incidental
appendectomy with cholecystectomy: is the increased risk justified? Am Surg 1987;53(10):553-7.
200
Warren JL, Penberthy LT, Addiss DG, et
al. Appendectomy incidental to cholecystectomy among elderly Medicare beneficiaries. Surg Gynecol Obstet 1993;177(3):288-94.
201
Fisher KS, Ross DS. Guidelines for
therapeutic decision in incidental appendectomy. Surg Gynecol Obstet 1990;171(1):95-8.
202
Synder TE, Selanders JR. Incidental
appendectomy—yes or no? A retrospective case study and review of the literature. Infect Dis Obstet Gynecol 1998;6(1)30-7.
203
Wolff BG. Current status of incidental
surgery. Dis Colon Rectum 1995;38(4):435-41.

Version 2.1 75 Revision 3 (July 21, 2004)
Precision: Is there a substantial amount of provider or community level variation that is not attributable to random variation? Fewer than one-third of surgery departments routinely perform incidental appendectomies, and rates may be difficult to estimate with precision at the majority of hospitals where it is not a routine procedure.
205
Based on empirical evidence, this indicator is precise, with a raw provider level mean of 2.7% and a standard deviation of 3.5%.
206 Relative to
other indicators, a higher percentage of the variation occurs at the discharge level than for some indicators. The signal ratio (i.e., the proportion of the total variation across providers that is truly related to systematic differences in provider performance rather than random variation) is moderate, at 55.4%, indicating that some of the observed differences in provider performance do not represent true differences. Minimal bias: Is there either little effect on the indicator of variations in patient disease severity and comorbidities, or is it possible to apply risk adjustment and statistical methods to remove most or all bias? Incidental appendectomy appears to be contraindicated in an elderly population; therefore, very few (if any) cases would be justified by patients‘ preoperative characteristics. Empirical evidence shows that this indicator performs well to very well on multiple measures of minimum bias, and risk adjustment does not appear to impact the extremes of the distribution substantially. Construct validity: Does the indicator perform well in identifying true (or actual) quality of care problems?
204
Nockerts SR, Detmer DE, Fryback, DG.
Incidental appendectomy in the elderly? No. Surgery 1980;88(2):301-6.
205
Neulander EZ, Hawke CK, Soloway MS.
Incidental appendectomy during radical cystectomy: an interdepartmental survey and review of the literature. Urology 2000;56(2):241-4.
206
Nationwide Inpatient Sample and State
Inpatient Databases. Healthcare Cost and Utilization Project. Agency for Healthcare Research and Quality, Rockville, MD. http://www.ahrq.gov/data/hcup
Most of the available evidence appears to contraindicate incidental appendectomy in the elderly, and performance of the procedure is subject to patient and surgeon preference. Therefore, incidental appendectomy rates may correlate poorly with other measures of hospital performance. Fosters true quality improvement: Is the indicator insulated from perverse incentives for providers to improve their reported performance by avoiding difficult or complex cases, or by other responses that do not improve quality of care? Incidental appendectomy does not generally affect hospital payment; therefore, widespread use of this indicator may lead to less frequent coding of the procedure when it is performed. A reduction in the rate of incidental appendectomy may lead to a subsequent increase in the incidence of acute appendicitis, although this risk is expected to be small for the elderly population. Prior use: Has the measure been used effectively in practice? Does it have potential for working well with other indicators? Incidental appendectomy in the elderly is a provider-level utilization indicator in the original HCUP QI set.

Version 2.1 76 Revision 3 (July 21, 2004)
Bilateral Cardiac Catheterization Rate (IQI 25)
Right-side coronary catheterization incidental to left-side catheterization has little additional benefit for patients without clinical indications for right-side catheterization.
Relationship to Quality Bilateral catheterization is contraindicated in most patients without proper indications. As such, lower rates represent better quality.
Benchmark State, regional, or peer-group average.
Definition Provider level bilateral cardiac catheterizations per 100 discharges with procedure code of heart catheterization.
Numerator Number of simultaneous right and left heart catheterizations (in any procedure field). Include only coronary artery disease. Exclude valid indications for right-sided catheterization in any diagnosis field, MDC 14 (pregnancy, childbirth, and puerperium), and MDC 15 (newborns and other neonates).
Denominator All heart catheterizations in any procedure field. Include only coronary artery disease. Exclude MDC 14 (pregnancy, childbirth, and puerperium) and MDC 15 (newborns and other neonates).
Type of Indicator Provider Level, Procedure Utilization Indicator
Empirical Performance Population Rate: 9.93 per 100 discharges at risk
Empirical Rating 25
Summary of Evidence Bilateral cardiac catheterization received one of the highest precision ratings. Provider level variation accounts for a relatively large portion of the total variation compared to other indicators, meaning that variation for this indicator is influenced less by discharge level variation (patient level) than total variation for other indicators. It is likely that the observed differences in provider performance represent true differences, rather than random variation. Analyses of minimum bias identified very little bias in this indicator when adjusting for APR-DRGs. Limitations on Use Outpatient procedures may result in selection bias for this indicator and should be examined. In addition, as a utilization indicator, the construct validity relies on the actual inappropriate use of procedures in hospitals with high rates, which should be investigated further.
Details Face validity: Does the indicator capture an aspect of quality that is widely regarded as important and subject to provider or public health system control? Left-sided catheterization provides very useful information about coronary anatomy, as well as left ventricular function and valvular anatomy. However, the clinical yield for right-sided catheterization, which is often performed at the same time, is extremely low. The American College of Cardiology (ACC) and the American Heart Association (AHA) published guidelines for cardiac catheterization laboratories stating that ―without specific indications, routine right heart catheterizations...are unnecessary.‖
207
207
Pepine CJ, Allen HD, Bashore TM, et al.
ACC/AHA guidelines for cardiac catheterization and cardiac catheterization laboratories. American College of Cardiology/American Heart Association Ad Hoc Task Force on Cardiac Catheterization. Circulation 1991;84(5):2213-47.

Version 2.1 77 Revision 3 (July 21, 2004)
Precision: Is there a substantial amount of provider or community level variation that is not attributable to random variation? This measure should be estimable with reasonable precision, given that more than 1.2 million inpatient cardiac catheterizations were performed in the United States in 1998.
208
Based on empirical evidence, this indicator is very precise, with a raw provider level mean of 19.3% and a substantial standard deviation of 20.0%.
209
Relative to other indicators, a higher percentage of the variation occurs at the provider level, rather than the discharge level. The signal ratio (i.e., the proportion of the total variation across providers that is truly related to systematic differences in provider performance rather than random variation) is very high, at 96.2%, indicating that the observed differences in provider performance likely represent true differences. Minimal bias: Is there either little effect on the indicator of variations in patient disease severity and comorbidities, or is it possible to apply risk adjustment and statistical methods to remove most or all bias? Bilateral cardiac catheterization is considered appropriate in the presence of certain clinical indications: suspected pulmonary hypertension or significant right-sided valvular abnormalities, congestive heart failure, cardiomyopathies, congenital heart disease, pericardial disease, and cardiac transplantation. The validity of this measure rests on the assumption that the prevalence of these clinical indications is low and relatively uniform across the country. However, Malone et al. found that substantial variation in the use of bilateral catheterization persisted among 37 cardiologists at two large community hospitals, even after adjusting for clinical indications.
210
208
Hall M, Popovic J. 1998 summary:
National Hospital Discharge Survey. Advance Data from Vital and Health Statistics 2000;316.
209
Nationwide Inpatient Sample and State
Databases. Healthcare Cost and Utilization Project. Agency for Healthcare Research and Quality, Rockville, MD. http://www.ahrq.gov/data/hcup
210
Malone ML, Bajwa TK, Battiola RJ, et al.
Variation among cardiologists in the utilization of right
Another source of potential bias is the large number of catheterizations performed on an outpatient basis. Construct validity: Does the indicator perform well in identifying true (or actual) quality of care problems? No studies were found that explicitly address the construct validity of this indicator. Empirical testings show that bilateral catheterization is positively related to coronary artery bypass graft (CABG) and negatively related to laparoscopic cholecystectomy.
211
Fosters true quality improvement: Is the indicator insulated from perverse incentives for providers to improve their reported performance by avoiding difficult or complex cases, or by other responses that do not improve quality of care? Bilateral cardiac catheterization does not generally affect hospital payment; therefore, widespread use of this indicator may lead to less frequent coding when the procedure is performed. A reduction in the rate of bilateral cardiac catheterization may lead to rare, but potentially serious, missed diagnoses (e.g., pulmonary hypertension). Prior use: Has the measure been used effectively in practice? Does it have potential for working well with other indicators? Bilateral cardiac catheterization has been widely used as an indicator of quality in the Medicare program and is one of five quality indicators included in the Medicare Quality of Care Report of Surveillance Measures.
212 The success of
education and outreach projects suggests that right heart catheterization rates represent an actionable opportunity for quality improvement.
heart catheterization at time of coronary angiography [see comments]. Cathet Cardiovasc Diagn 1996;37(2):125-30.
211
Nationwide Inpatient Sample.
212
Medicare Quality of Care Report of
Surveillance Measures. Centers for Medicare and Medicaid Services (formerly Health Care Financing Administration), U.S. Department of Health and Human Services.

Version 2.1 78 Revision 3 (July 21, 2004)
Coronary Artery Bypass Graft Area Rate (IQI 26)
Coronary artery bypass graft (CABG) is performed on patients with coronary artery disease. No ideal rate for CABG has been established.
Relationship to Quality CABG is an elective procedure that may be overused; therefore, more average rates would represent better quality.
Benchmark State, regional, or peer group average.
Definition Number of CABGs per 100,000 population.
Numerator Number of CABGs in any procedure field. All discharges age 40 years and older. Exclude MDC 14 (pregnancy, childbirth, and puerperium) and MDC 15 (newborns and other neonates).
Denominator Population in MSA or county, age 40 years or older.
Type of Indicator Area Level, Utilization Indicator
Empirical Performance Population Rate: 315.03 per 100,000 population at risk
Empirical Rating 19
Summary of Evidence CABG is a potentially overused procedure, although several studies have noted that CABG is not often performed for inappropriate indications (under 15%). The risk factors associated with CABG include smoking, hyperlipidemia, and older age, and risk adjustment with demographic data—at a minimum—is recommended. This indicator was designed for use with CABG volume and mortality indicators. This indicator is measured with very high precision. Substantial and systematic small area variation that is not explained by socio-demographic characteristics has been noted in the literature. Examination of data containing patient residence may aid in identifying the extent to which patients are referred into an area. Limitations on Use As an area utilization indicator, CABG is a proxy for actual quality problems. This indicator in particular has unclear construct validity, because CABG does not appear to be performed inappropriately often. Caution should be maintained for CABG rates that are drastically below or above the average or recommended rates.
Details Face validity: Does the indicator capture an aspect of quality that is widely regarded as important and subject to provider or public health system control? Most previous studies of small area variation have found relatively high variation in CABG rates, as noted by the systematic component of variation (.758), which compares geographic variability between DRGs after removing random effects.
213 This variation is not explained by
population characteristics such as age and sex. No randomized controlled trials have demonstrated that CABG improves clinical outcomes in patients with symptoms less major than three-vessel disease, previous myocardial infarction, or less than strongly positive exercise ECG tests. Precision: Is there a substantial amount of provider or community level variation that is not attributable to random variation? Precise estimates of utilization can be generated at the area level; however, random variation may become more problematic for relatively small areas (e.g., ZIP codes) or underpopulated
213
Gittelsohn A, Powe NR, Small area
variations in health care delivery in Maryland. Health Serv Res 1995;30(2):295-317.

Version 2.1 79 Revision 3 (July 21, 2004)
areas (e.g., rural counties). Based on empirical evidence, the indicator is moderately precise, with a raw area level mean of 180.4 per 100,000 population and a standard deviation of 571.6.
214
Relative to other indicators, a larger percentage of the variation occurs at the area level, rather than the discharge level. The signal ratio (i.e., the proportion of the total variation that is truly related to systematic differences in area performance rather than random variation) is very high, at 97.3%, indicating that observed differences in area performance very likely represent true differences. Minimal bias: Is there either little effect on the indicator of variations in patient disease severity and comorbidities, or is it possible to apply risk adjustment and statistical methods to remove most or all bias? The prevalence of coronary artery disease may be related to the age structure of the population and the prevalence of behavioral or physiologic risk factors such as smoking and hyperlipidemia. Although race and demographic factors have significant effects on the likelihood of CABG, previous studies have shown that sociodemographic differences account for very little of the observed variation in CABG rates.
215
Some differences in CABG rates across areas may be attributable to the referral of rural and other patients from outside the area for surgery; however, such referrals are unlikely to explain a large part of the substantial differences in rates across small geographic areas. Construct validity: Does the indicator perform well in identifying true (or actual) quality of care problems? Although most studies have found relatively low rates of inappropriate CABG use, there is some evidence of variation in inappropriate rates across geographic areas. In addition, a larger
214
Nationwide Inpatient Sample and State
Inpatient Databases. Healthcare Cost and Utilization Project. Agency for Healthcare Research and Quality, Rockville, MD. http://www.ahrq.gov/data/hcup/
215
Leape LL, Hilborne LH, Park RE, et al.
The appropriateness of use of coronary artery bypass graft surgery in New York state. JAMA 1993;269(6):753-60.
proportion of bypass surgery procedures is performed for indications in which benefits are uncertain; procedure rates for uncertain indications may also vary substantially across hospitals and areas. In a follow-up to a New York appropriateness study, a panel of cardiologists found a rate of inappropriate procedure of 6% and a rate of uncertain procedures of 12%.
216 In another
study of 12 hospitals, the rate of CABG for inappropriate indications ranged from 0% to 5% across hospitals, and the rate of CABG for uncertain indications ranged from 5% to 8%.
217
Fosters true quality improvement: Is the indicator insulated from perverse incentives for providers to improve their reported performance by avoiding difficult or complex cases, or by other responses that do not improve quality of care? Little evidence exists on whether the use of CABG as a quality indicator might differentially reduce procedures that are inappropriate or of unclear benefit, rather than appropriate procedures. Prior use: Has the measure been used effectively in practice? Does it have potential for working well with other indicators? The hospital-based rate of CABG was included in the original HCUP QI indicator set. The area-based rate of CABG is a current indicator in the Dartmouth Atlas.
218
216
Leape LL, Park RE, Bashore TM, et al.
Effect of variability in the interpretation of coronary angiograms on the appropriateness of use of coronary revascularization procedures. American Heart Journal 2000;139(1 Pt 1):106-13.
217
Leape LL, Hilborne LH, Schwartz JS, et
al. The appropriateness of coronary artery bypass graft surgery in academic medical centers. Working Group of the Appropriateness Project of the Academic Medical Center Consortium. Ann Intern Med 1996;125(1):8-18.
218
Dartmouth Atlas of Health Care, Center
for the Evaluative Clinical Sciences at Dartmouth Medical School.

Version 2.1 80 Revision 3 (July 21, 2004)
Percutaneous Transluminal Coronary Angioplasty Area Rate (IQI 27)
Percutaneous transluminal coronary angioplasty (PTCA) is performed on patients with coronary artery disease. No ideal rate for PTCA has been established.
Relationship to Quality PTCA has been identified as a potentially overused procedure; therefore, more average rates represent better quality care.
Benchmark State, regional, or peer group average.
Definition Number of PTCA procedures per 100,000 population.
Numerator Number of PTCA procedures in any procedure field. All discharges age 40 years and older. Exclude MDC 14 (pregnancy, childbirth, and puerperium) and MDC 15 (newborns and other neonates).
Denominator Population in MSA or county, age 40 years and older.
Type of Indicator Area Level, Utilization Indicator
Empirical Performance Population Rate: 528.16 per 100,000 population at risk
Empirical Rating 19
Summary of Evidence PTCA is a potentially overused procedure, and rates vary widely and systematically between areas. Patient and physician preferences may play a role in this variation. Clinical factors that are appropriate indications for PTCA may be more prevalent in areas with an older age structure or higher rates of smoking or hyperlipidemia. It is unlikely that these factors would account for all the observed variance. Empirical evidence shows that risk adjustment by age and sex affects the performance of this indicator; without adequate risk adjustment, areas may be mislabeled as outliers. In addition, examination of data containing patient residence may aid in identifying the extent to which patients are referred into an area. Limitations on Use As an area utilization indicator, PTCA is a proxy for actual quality problems. The indicator has unclear construct validity, as high utilization of PTCA has not been shown to necessarily be associated with higher rates of inappropriate utilization. A minor source of bias may be the small number of procedures performed on an outpatient basis. Caution should be maintained for PTCA rates that are drastically below or above the average or recommended rates.
Details Face validity: Does the indicator capture an aspect of quality that is widely regarded as important and subject to provider or public health system control? No randomized controlled trials have demonstrated that PTCA improves clinical outcomes in many patients who commonly receive the procedure, and previous studies have documented large differences across hospitals in the likelihood of treatment with PTCA after myocardial infarction and in other clinical settings. Studies on small area variation also found substantial variation in PTCA rates. Precision: Is there a substantial amount of provider or community level variation that is not attributable to random variation? Precise estimates of utilization can be generated at the area level; however, random variation may become more problematic for relatively small areas (e.g., ZIP codes) or underpopulated areas (e.g., rural counties). Based on empirical evidence, this indicator is precise, with a raw area level mean of 190.8 per 100,000 population and a standard deviation of 455.6.
219
219
Nationwide Inpatient Sample and State
Inpatient Databases. Healthcare Cost and Utilization

Version 2.1 81 Revision 3 (July 21, 2004)
Relative to other indicators, a higher percentage of the variation occurs at the area level, rather than the discharge level. The signal ratio (i.e., the proportion of the total variation that is truly related to systematic differences in area performance rather than random variation) is very high, at 97.3%, indicating that observed differences in area performance very likely represent true differences. Minimal bias: Is there either little effect on the indicator of variations in patient disease severity and comorbidities, or is it possible to apply risk adjustment and statistical methods to remove most or all bias? Little evidence exists on the extent to which area differences in socioeconomic and clinical characteristics may explain area differences in PTCA rates, although large variations in rates across small geographic areas suggest that population characteristics are unlikely to explain most of the differences.
220
Construct validity: Does the indicator perform well in identifying true (or actual) quality of care problems? For this indicator to perform well in identifying true quality of care problems, there must be evidence of significant inappropriate use in population-based studies, as well as substantial variation in the rate of inappropriate use across providers or small areas. In a study of seven Swedish heart centers, 38.3% of all PTCA procedures were performed for inappropriate indications and 30% for uncertain indications.
221
In a follow-up study of a coronary angiography study conducted in New York, a panel of
Project. Agency for Healthcare Research and Quality, Rockville, MD. http://www.ahrq.gov/data/hcup/
220
Ziskind AA, Lauer MA, Bishop G, et al.
Assessing the appropriateness of coronary revascularization: the University of Maryland Revascularization Appropriateness Score (RAS) and its comparison to RAND expert panel ratings and American College of Cardiology/American Heart Association guidelines with regard to assigned appropriateness rating and ability to predict outcome. Clin Cardiol 1999;22(2):67-76.
221
Bernstein SJ, Brorsson B, Aberg T, et al.
Appropriateness of referral of coronary angiography patients in Sweden. SECOR/SBU Project Group. Heart 1999;81(5):470-7.
cardiologists found the rate for inappropriate indications was 12% and the rate of procedures performed for uncertain indications was 27%.
222
Fosters true quality improvement: Is the indicator insulated from perverse incentives for providers to improve their reported performance by avoiding difficult or complex cases, or by other responses that do not improve quality of care? Providers might engage in practices such as miscoding cases or recruiting patient groups that are known to have increased risk of coronary artery disease to achieve more favorable quality assessment results. Instead of serving as quality assessments, patients and their providers might use the results of appropriateness studies to spark questions and discussion about coronary artery disease, the patient‘s specific indications, and the treatment that poses the least risk to the patient.
223
Prior use: Has the measure been used effectively in practice? Does it have potential for working well with other indicators? The area-based rate of PTCA is a current indicator in the Dartmouth Atlas.
224
222
Leape LL, Park RE, Bashore TM, et al.
Effect of variability in the interpretation of coronary angiograms on the appropriateness of use of coronary revascularization procedures. American Heart Journal 2000;139(1 Pt 1):106-13.
223
Hilborne LH, Leape LL, Bernstein SJ, et
al. The appropriateness of use of percutaneous transluminal coronary angioplasty in New York state. JAMA 1993;269(6):761-5.
224
Dartmouth Atlas of Health Care, Center
for the Evaluative Clinical Sciences at Dartmouth Medical School.

Version 2.1 82 Revision 3 (July 21, 2004)
Hysterectomy Area Rate (IQI 28)
Hysterectomy is performed on patients with a number of indications, such as recurrent uterine bleeding, chronic pelvic pain, or menopause, usually in some combination. No ideal rate for hysterectomy has been established.
Relationship to Quality Hysterectomy has been identified as a potentially overused procedure; therefore, more average rates represent better quality care.
Benchmark State, regional, or peer group average.
Definition Number of hysterectomies per 100,000 population.
Numerator Number of hysterectomies in any procedure field. All discharges of females age 18 years and older. Exclude discharges with genital cancer or pelvic or lower abdominal trauma in any diagnosis field, MDC 14 (pregnancy, childbirth, and puerperium), and MDC 15 (newborns and other neonates).
Denominator Female population in MSA or county age 18 years or older.
Type of Indicator Area Level, Utilization Indicator
Empirical Performance Population Rate: 488.29 per 100,000 population at risk
Empirical Rating 22
Summary of Evidence Hysterectomy is a potentially overused procedure. Population rates have been shown to vary systematically by small geographic area; however, patient and physician preference may play a role in the choice to have a hysterectomy, which in turn may affect area rates. Examination of data containing patient residence may aid in identifying the extent to which patients are referred into an area. This indicator is not expected to be substantially biased, because it is unlikely that appropriate indications for hysterectomy would vary systematically by area. However, risk adjustment with age is recommended. Although the ideal rate for hysterectomy has not been established, several studies have noted relatively high rates of inappropriate indicators for surgery (16-70%). Limitations on Use As an area utilization indicator, hysterectomy is a proxy for actual quality problems. The indicator has unclear construct validity, as high utilization of hysterectomy has not been shown to necessarily be associated with higher rates of inappropriate utilization. Additional clinical risk adjustment, such as for parity, may be desirable. Caution should be maintained for hysterectomy
rates that are drastically below or above the average or recommended rates. Details Face validity: Does the indicator capture an aspect of quality that is widely regarded as important and subject to provider or public health system control? No randomized controlled trials have demonstrated that hysterectomy improves outcomes in patients with uncertain clinical indications, including persistent or recurrent abnormal bleeding, pain, adnexal mass, limited hormonal therapy, and premenopausal age. Small area variation has been noted in the literature on hysterectomy rates.
225
Precision: Is there a substantial amount of provider or community level variation that is not attributable to random variation? Precise estimates of utilization can be generated at the area level; however, random variation may become more problematic for relatively
225
Gittlesohn A, Powe NR. Small area
variations in health care delivery in Maryland. Health Serv Res 1995;30(2):295-317.

Version 2.1 83 Revision 3 (July 21, 2004)
small areas (e.g., ZIP codes) or underpopulated areas (e.g., rural counties). Based on empirical evidence, this indicator is precise, with a raw area level rate of 419.4 per 100,000 population and a substantial standard deviation of 323.3.
226
Relative to other indicators, a higher percentage of the variation occurs at the area level, rather than the discharge level. The signal ratio (i.e., the proportion of the total variation that is truly related to systematic differences in area performance rather than random variation) is very high, at 93.6%, indicating that observed differences in area performance likely represent true differences. Minimal bias: Is there either little effect on the indicator of variations in patient disease severity and comorbidities, or is it possible to apply risk adjustment and statistical methods to remove most or all bias? Utilization rates standardized at the area level (e.g., adult population of the county or standard metropolitan statistical area) may be biased by differences in the prevalence of those indications that warrant the procedure. The prevalence of these indications may, in turn, be related to the age structure of the population and the prevalence of behavioral or physiologic risk factors. In a study of seven managed care organizations, older women were more likely than younger women to have received a hysterectomy for appropriate reasons.
227
Construct validity: Does the indicator perform well in identifying true (or actual) quality of care problems? For this indicator to perform well in identifying true quality of care problems, there must be evidence of significant inappropriate use in population-based studies, as well as substantial variation in the rate of inappropriate use across
226
Nationwide Inpatient Sample and State
Inpatient Databases. Healthcare Cost and Utilization Project. Agency for Healthcare Research and Quality, Rockville, MD. http://www.ahrq.gov/data/hcup/
227
Bernstein SJ, McGlynn EA, Siu AL, et al.
The appropriateness of hysterectomy. A comparison of care in seven health plans. Health Maintenance Organization Quality of Care Consortium [see comments]. JAMA 1993;269(18):2398-402.
providers or small areas. In a random sample of 642 hysterectomies, 16% of procedures were inappropriate based on patient indications, and 25% were uncertain.
228 Another study found a
70% rate of overall inappropriate indications, varying from 45% to 100% across diagnoses indicative of hysterectomy.
229
Fosters true quality improvement: Is the indicator insulated from perverse incentives for providers to improve their reported performance by avoiding difficult or complex cases, or by other responses that do not improve quality of care? Little evidence exists on whether hysterectomy as a quality indicator might reduce appropriate as well as inappropriate hysterectomies, or the extent to which overall hysterectomy rates are correlated with inappropriate hysterectomy rates. Prior use: Has the measure been used effectively in practice? Does it have potential for working well with other indicators? The hospital-based rate of hysterectomy was included in the original HCUP QI indicator set. The area-based rate of hysterectomy is a current indicator in the Dartmouth Atlas.
230
228
Bernstein et al., 1993.
229
Broder MS, Kanouse DE, Mittman BS, et
al. The appropriateness of recommendations for hysterectomy. Obstet Gynecol 2000;95(2):199-205.
230
Dartmouth Atlas of Health Care, Center
for the Evaluative Clinical Sciences at Dartmouth Medical School.

Version 2.1 84 Revision 3 (July 21, 2004)
Laminectomy or Spinal Fusion Area Rate (IQI 29)
Laminectomy is performed on patients with a herniated disc or spinal stenosis. No ideal rate for laminectomy has been established.
Relationship to Quality Laminectomy has been identified as a potentially overused procedure; therefore, more average rates represent better quality care.
Benchmark State, regional, or peer group average.
Definition Number of laminectomies or spinal fusions per 100,000 population.
Numerator Number of laminectomies or spinal fusions in any procedure field. All discharges age 18 years and older. Exclude MDC 14 (pregnancy, childbirth, and puerperium) and MDC 15 (newborns and other neonates).
Denominator Population in MSA or county, age 18 years or older.
Type of Indicator Area Level, Utilization Indicator
Empirical Performance Population Rate: 250.98 per 100,000 population at risk
Empirical Rating 20
Summary of Evidence Laminectomy, which is a potentially overused procedure, has been shown to vary widely and systematically between areas. Patient and physician preference may play a role in the decision to have a laminectomy, which may in turn affect area rates. Empirical analysis suggests that performance is not highly influenced by the demographic breakdown of the population. Without adequate risk adjustment for age and sex, areas may be mislabeled as outliers. Although the ideal rate for laminectomy has not been established, several studies have noted relatively high rates of inappropriate procedures (23-38%). High area rates may not take into account that some patients are referred into an area hospital from a different area. Examination of data with patient residence can help in determining the extent to which patients are referred into the area. Limitations on Use As an area utilization indicator, laminectomy is a proxy for actual quality problems. The indicator has unclear construct validity, as high utilization of laminectomy has not been shown to necessarily be associated with higher rates of inappropriate utilization. Caution should be maintained for laminectomy rates that are
drastically below or above the average or recommended rates. Details Face validity: Does the indicator capture an aspect of quality that is widely regarded as important and subject to provider or public health system control? No randomized controlled trials have demonstrated that laminectomy improves outcomes in patients with uncertain clinical indications, including minor neurological findings, lengthy restricted activity, and equivocal imaging for discal hernia or spinal stenosis. Prior research on small area variation has found relatively high variation in laminectomy rates.
231
Larequi-Lauber et al. report that the use of back surgery in the United States varies from one area to another by as much as 15-fold.
232 This
231
Gittlesohn A, Powe NR. Small area
variations in health care delivery in Maryland. Health Serv Res 1995;30(2):295-317.
232
Larequi-Lauber T, Vader JP, Burnand B,
et al. Appropriateness of indications for surgery of lumbar disc hernia and spinal stenosis. Spine 1997;22(2):203-9.

Version 2.1 85 Revision 3 (July 21, 2004)
high variation was not explained by population characteristics such as age and sex. Precision: Is there a substantial amount of provider or community level variation that is not attributable to random variation? Precise estimates of utilization can be generated at the area level; however, random variation may become more problematic for relatively small areas (e.g., ZIP codes) or underpopulated areas (e.g., rural counties). Based on empirical evidence, this indicator is moderately precise, with a raw area level mean of 139.0 per 100,000 population and a standard deviation of 347.5.
233
Relative to other indicators, a higher percentage of the variation occurs at the area level, rather than the discharge level. The signal ratio (i.e., the proportion of the total variation that is truly related to systematic differences in area performance rather than random variation) is very high, at 96.7%, indicating that observed differences in area performance very likely represent true differences. Minimal bias: Is there either little effect on the indicator of variations in patient disease severity and comorbidities, or is it possible to apply risk adjustment and statistical methods to remove most or all bias? Utilization rates standardized at the area level (e.g., county or metropolitan statistical area) may be biased by differences in the prevalence of herniated disc or spinal stenosis, which may in turn be related to the age structure of the population and the prevalence of behavioral or physiologic risk factors. However, studies have shown that sociodemographic differences and other measurable population characteristics account for very little or none of the observed variation in laminectomy rates.
234
Construct validity: Does the indicator perform well in identifying true (or actual) quality of care problems?
233
Nationwide Inpatient Sample and State
Inpatient Databases. Healthcare Cost and Utilization Project. Agency for Healthcare Research and Quality, Rockville, MD. http://www.ahrq.gov/data/hcup/
234
Barron M, Kazandjian VA. Geographic
variation in lumbar diskectomy: a protocol for evaluation. QRB Qual Rev Bull 1992;18(3):98-107.
For this indicator to perform well in identifying true quality of care problems, there must be evidence of significant inappropriate use in population-based studies, as well as substantial variation in the rate of inappropriate use across providers or small areas. In an assessment of cases at one Swiss hospital, 23% of patients received surgical treatment for herniated discs for inappropriate reasons and 29% received surgical treatment for uncertain indications.
235 In
another study of teaching hospital patients undergoing surgery for herniated disc or spinal stenosis, 38% of surgeries were performed for inappropriate indications. Fosters true quality improvement: Is the indicator insulated from perverse incentives for providers to improve their reported performance by avoiding difficult or complex cases, or by other responses that do not improve quality of care? Little evidence exists on whether use of laminectomy as a quality indicator would lead to less performance of laminectomies for inappropriate or uncertain indications without reducing the use of laminectomy for appropriate indications. Prior use: Has the measure been used effectively in practice? Does it have potential for working well with other indicators? The hospital-based rate of laminectomy was included in the original HCUP QI indicator set. The area-based rate of laminectomy is a current indicator in the Dartmouth Atlas.
236
235
Porchet F, Vader JP, Larequi-Lauber T, et
al. The assessment of appropriate indications for laminectomy. J Bone Joint Surg Br 1999;81(2):234-9.
236
Dartmouth Atlas of Health Care, Center
for the Evaluative Clinical Sciences at Dartmouth Medical School.

Version 2.1 86 Revision 3 (July 21, 2004)
References Al-Mufti R, McCarthy A, Fisk NM. Obstetricians‘ personal choice and mode of delivery [letter] [see
comments]. Lancet 1996;347(9000):544. American Heart Association. Heart Attack and Stroke Facts: 1996 Statistical Supplement. Dallas, TX:
American Heart Association; 1996. Amundsen S, Skjaerven R, Trippestad A, et al. Abdominal aortic aneurysms. Is there an association
between surgical volume, surgical experience, hospital type and operative mortality? Members of the Norwegian Abdominal Aortic Aneurysm Trial. Acta Chir Scand 1990;156(4):323-7; discussion 327-8.
Andrew MH, Roty AR, Jr. Incidental appendectomy with cholecystectomy: is the increased risk justified?
Am Surg 1987;53(10):553-7. Aron DC, Harper DL, Shepardson LB, et al. Impact of risk-adjusting cesarean delivery rates when
reporting hospital performance. JAMA 1998;279(24):1968-72. Balit JL, Dooley SL, Peaceman AN. Risk adjustment for interhospital comparison of primary cesarean
rates. Obstet Gynecol 1999;93(6):1025-30. Ball JK, Elixhauser A, Johantgen M, et al. HCUP Quality Indicators, Methods, Version 1.1: Outcome,
Utilization, and Access Measures for Quality Improvement. (AHCPR Publication No. 98-0035). Healthcare Cost and Utilization project (HCUP-3) Research notes: Rockville, MD: Agency for Health Care Policy and Research, 1998.
Barron M, Kazandjian VA. Geographic variation in lumbar diskectomy: a protocol for evaluation. QRB
Qual Rev Bull 1992;18(3):98-107. Begg CB, Cramer LD, Hoskins WJ, et al. Impact of hospital volume on operative mortality for major
cancer surgery. JAMA 1998;280(20):1747-51. Berkowitz GS, Fiarman GS, Mojica MA, et al. Effect of physician characteristics on the cesarean birth rate
[see comments]. Am J Obstet Gynecol 1989;161(1):146-9. Bernstein SJ, Brorsson B, Aberg T, et al. Appropriateness of referral of coronary angiography patients in
Sweden. SECOR/SBU Project Group. Heart 1999;81(5):470-7. Bernstein SJ, McGlynn EA, Siu AL, et al. The appropriateness of hysterectomy. A comparison of care in
seven health plans. Health Maintenance Organization Quality of Care Consortium [see comments]. JAMA 1993;269(18):2398-402.
Bickell NA, Zdeb MS, Applegate MS, et al. Effect of external peer review on cesarean delivery rates: a
statewide program. Obstet Gynecol 1996;87(5 Pt 1):664-7. Biller J, Feinberg WM, Castaldo JE, et al. Guidelines for carotid endarterectomy: a statement of
healthcare professionals from a Special Writing Group of the Stroke Council, American Heart Association. Circulation 1998;97(5):501-9.
Birkmeyer JD, Finlayson SR, Tosteson AN, et al. Effect of hospital volume on in-hospital mortality with
pancreaticoduodenectomy. Surgery 1999;125(3):250-6. Broder MS, Kanouse DE, Mittman BS, et al. The appropriateness of recommendations for hysterectomy.
Obstet Gynecol 2000;95(2):199-205.

Version 2.1 87 Revision 3 (July 21, 2004)
Brown RD, Whisnant JP, Sicks JD, et al. Stroke incidence, prevalence, and survival: secular trends in
Rochester, Minnesota, through 1989. Stroke 1996;27(3):373-80. Cebul RD, Snow RJ, Pine R, et al. Indications, outcomes, and provider volumes for carotid
endarterectomy. JAMA 1998;279(16):1282-7. Centers for Disease Control and Prevention. Report of Final Mortality Statistics, 1996. Volume 47,
Number 9. Available at http://www.cdc.gov/nchs/. Cook DJ, Guyatt GH, Salena BJ, et al. Endoscopic therapy for acute nonvariceal upper gastrointestinal
hemorrhage: a meta-analysis. Gastroenterology 1992;102(1):139-48. Cooper GS, Chak A, Way LE, et al. Early endoscopy in upper gastrointestinal hemorrhage: associations
with recurrent bleeding, surgery, and length of hospital stay. Gastrointest Endosc 1999;49(2):145-52. Dardik A, Burleyson GP, Bowman H, et al. Surgical repair of ruptured abdominal aortic aneurysms in the
state of Maryland: factors influencing outcome among 527 recent cases. J Vasc Surg 1998;28(3):413-20.
Dartmouth Atlas of Health Care, Center for the Evaluative Clinical Sciences at Dartmouth Medical School,
1999. Davis RB, Iezzoni LI, Phillips RS, et al. Predicting in-hospital mortality. The importance of functional
status information. Med Care 1995;33(9):906-21. Dudley RA, Johansen KL, Brand R, et al. Selective referral to high-volume hospitals: estimating
potentially avoidable deaths. JAMA 2000;283(9):1159-66. Eagle KA, Guyton RA, Davidoff R, et al. ACC/AHA Guidelines for Coronary Artery Bypass Graft Surgery:
A Report of the American College of Cardiology/American Heart Association Task Force on Practice Guidelines (Committee to Revise the 1991 Guidelines for Coronary Artery Bypass Graft Surgery). American College of Cardiology/American Heart Association. J Am Coll Cardiol 1999;34(4):1262-347.
Escarce JJ, Chen W, Schwartz JS. Falling cholecystectomy thresholds since the introduction of
laparoscopic cholecystectomy. JAMA 1995;273(20):1581-5. Farley, DE, Ozminkowski RJ. Volume-outcome relationships and in-hospital mortality: the effect of
changes in volume over time. Med Care 1992;30(1):77-94. Feinberg WM. Guidelines for the management of transient ischemic attacks. Ad Hoc Committee on
Guidelines for the Management of Transient Ischemic Attacks of the Stroke Council, American Heart Association, Heart Dis Stroke 1994;3(5):275-83.
Fine MJ, Smith MA, Carson CA, et al. Prognosis and outcomes of patients with community-acquired
pneumonia. A meta-analysis. JAMA 1996;275(2):134-41. Fisher KS, Ross DS. Guidelines for therapeutic decision in incidental appendectomy. Surg Gynecol
Obstet 1990;171(1):95-8. Forsen L, Sogaard AJ, Meyer HE, et al. Survival after hip fracture: short- and long-term excess mortality
according to age and gender. Osteoporos Int 1999;10(1):73-8. Gentles TL, Mayer JE, Jr., Gauvreau K, et al. Fontan operation in 500 consecutive patients: factors
influencing early and late outcome. J Thorac Cardiovasc Surg 1997;114(3):376-91.

Version 2.1 88 Revision 3 (July 21, 2004)
Ghali WA, Ash AS, Hall RE, et al. Statewide quality improvement initiatives and mortality after cardiac surgery. JAMA 1997;277(5):379-82.
Gittelsohn A, Powe NR, Small area variations in health care delivery in Maryland. Health Serv Res
1995;30(2):295-317. Glasgow RE, Mulvihill SJ. Hospital volume influences outcome in patients undergoing pancreatic
resection for cancer. West J Med 1996;165(5):294-300. Gleason PP, Heehan TP, Fine JM, et al. Associations between initial antimicrobial therapy and medical
outcomes for hospitalized elderly patients with pneumonia. Arch Intern Med 1999;159(21):2562-72. Goff, DC, Jr., Pandey DK, Chan FA, et al. Congestive heart failure in the United States: is there more
than meets the I(CD code)? The Corpus Christi Heart Project. Arch Intern Med 2000;160(2):197-202. Gordan TA, Bowman HM, Bass EB, et al. Complex gastrointestinal surgery: impact of provider experience
on clinical and economic outcomes. J Am Coll Surg 1999;189(1):46-56. Goyert GL, Bottoms FS, Treadwell MC, et al. The physician factor in cesarean birth rates [see
comments]. N Engl J Med 1989;320(11):706-9. Green DC, Moore JM, Adams MM, et al. Are we underestimating rates of vaginal birth after previous
cesarean birth? The validity of delivery methods from birth certificates. Am J Epidemiol 1998;147(6):581-6.
Haas JS, Udvarhelyi S, Epstein AM. The effect of health coverage for uninsured pregnant women on
maternal health and the use of cesarean section [see comments]. JAMA 1993;270(1):61-4. Hall M, Popovic J. 1998 summary: National Hospital Discharge Survey. Advance Data from Vital and
Health Statistics 2000;316. Hannan EL, Racz M, Kavey RE, et al. Pediatric cardiac surgery: the effect of hospital and surgeon
volume on in-hospital mortality. Pediatrics 1998;101(6):963-9. Hannan EL, Popp AJ, Tranmer B, et al. Relationship between provider volume and mortality for carotid
endarterectomies in New York state. Stroke 1998;29(11):2292-7. Hannan EL, Kilburn H, Jr., O‘Donnell JF, et al. A longitudinal analysis of the relationship between in-
hospital mortality in New York state and the volume of abdominal aortic aneurysm surgeries performed. Health Serv Res 1992;27(4):517-42.
Hannan EL, Racz M, Ryan TJ, et al. Coronary angioplasty volume-outcome relationships for hospitals
and cardiologists. JAMA 1997;277(11):892-8. Hannan EL, Kilburn H, Jr., Bernard H, et al. Coronary artery bypass surgery: the relationship between
inhospital mortality rate and surgical volume after controlling for clinical risk factors. Med Care 1991;29(11):1094-107.
Hannan EL, Racz M, Kavey RE, et al. Pediatric cardiac surgery: the effect of hospital and surgeon
volume on in-hospital mortality. Pediatrics 1998;101(6):963-9. Hannan EL, Kilburn H Jr., Racz M, et al. Improving the outcomes of coronary artery bypass surgery in
New York state. JAMA 1994;271(10):761-6. Hannan EL, Siu AL, Kumar D, et al. Assessment of coronary artery bypass graft surgery performance in
New York. Is there a bias against taking high-risk patients? Med Care 1997;35(1):49-56.

Version 2.1 89 Revision 3 (July 21, 2004)
Hay JA, Lyubashevsky E, Elashoff J, et al. Upper gastrointestinal hemorrhage clinical guideline
determining the optimal hospital length of stay. Am J Med 1996;100(3):313-22. HCUPnet. Healthcare Cost and Utilization Project. Agency for Healthcare Research and Quality,
Rockville, MD. http://hcup.ahrq.gov/HCUPnet.asp. Healthy People 2010. Office of Disease Prevention and Health Promotion, U.S. Department of Health and
Human Services, Washington, DC: U.S. Government Printing Office. Higgins TL, Estafanous FG, Loop FD, et al. Stratification of morbidity and mortality outcome by
preoperative risk factors in coronary artery bypass patients. A clinical severity score. JAMA 1992;267(17):2344-8.
Hilborne LH, Leape LL, Bernstein SJ, et al. The appropriateness of use of percutaneous transluminal
coronary angioplasty in New York state. JAMA 1993;269(6):761-5. Hirshfeld JW, Jr., Ellis SG, Faxon DP. Recommendations for the assessment and maintenance of
proficiency in coronary interventional procedures: Statement of the American College of Cardiology. J Am Coll Cardiol 1998;31(3):722-43.
Hoyert DL, Kochanek KD, Murphy SL. Deaths: final data for 1997. Natl Vital Stat Rep 1999;47(19):1-104. http://www.cms.hhs.gov/statistics/nhe/projections-2002/t2.asp: Table 2: National Health Expenditure
Amounts, and Average Annual Percent Change by Type of Expenditure: Selected Calendar Years 1980-2012.
Impact: Case Studies Notebook – Documented Impact and Use of AHRQ's Research. Compiled by
Division of Public Affairs, Office of Health Care Information, Agency for Healthcare Research and Quality.
Institute of Medicine Division of Health Care Services. Medicare: a strategy for quality assurance.
Washington, DC: National Academy Press; 1990. Institute of Medicine. To Err is Human: Building a Safer Health System. Kohn LT, Corrigan JM, Donaldson
MS (eds.) Washington DC: National Academy Press, 2000. Institute of Medicine. Crossing the Quality Chasm: A New Health System for the 21
st Century. Committee
of Quality of Care in America. Washington DC: National Academy Press, 2001. Jatzko GR, Lisborg PH, Pertl AM, et al. Multivariate comparison of complications after laparoscopic
cholecystectomy and open cholecystectomy. Ann Surg 1995;221(4):381-6. Jenkins KJ, Newburger JW, Lock JE, et al. In-hospital mortality for surgical repair of congenital heart
defects: preliminary observations of variation by hospital caseload. Pediatrics 1995;95(3):323-30. Kahn KL, Rogers WH, Rubenstein LV, et al. Measuring quality of care with explicit process criteria before
and after implementation of the DRG-based prospective payment system. JAMA 1990;264(15):1969-73.
Kalra L, Perez I, Smithard DG, et al. Does prior use of aspirin affect outcome in ischemic stroke? Am J
Med 2000;108(3):205-9. Kantonen I, Lepantalo M, Brommels M, et al. Mortality in ruptured abdominal aortic aneurysms. The
Finnvasc Study Group. Eur J Vasc Endovasc Surg 1999;17(3):208-12.

Version 2.1 90 Revision 3 (July 21, 2004)
Karp, HR, Flanders WD, Shipp CC, et al. Carotid endarterectomy among Medicare beneficiaries: a statewide evaluation of appropriateness and outcome. Stroke 1998;29(1):46-52.
Kazandjian VA, Lied TR. Cesarean section rates: effects of participation in a performance measurement
project. Jt Comm J Qual Improv 1998;24(4):187-96. Kazmers A, Jacobs L, Perkins A, et al. Abdominal aortic aneurysm repair in Veterans Affairs medical
centers. J Vasc Surg 1996;23(2):191-200. Kern JH, Hayes CJ, Michler RE, et al. Survival and risk factor analysis for the Norwood procedure for
hypoplastic left heart syndrome. Am J Cardiol 1997;80(2):170-4. Knott-Craig CJ, Danielson GK, Schaff HV, et al. The modified Fontan operation. An analysis of risk
factors for early postoperative death or takedown in 702 consecutive patients from one institution. J Thorac Cardiovasc Surg 1995;109(6):1237-43.
Kozak LJ, Lawrence L. National Hospital Discharge Survey: annual summary, 1997. Vital Health Stat 13
1999(144):i-iv, 1-46. Kreder HF, Williams JI, Jaglal S, et al. Are complication rates for elective primary total hip arthroplasty in
Ontario related to surgeon and hospital volumes? A preliminary investigation. Can J Surg 1998;41(6):431-7.
Landon B, Iezzoni LI, Ash AS, et al. Judging hospitals by severity-adjusted mortality rates: the case of
CABG surgery. Inquiry 1996;33(2):155-66. Lanzino G, Kassell NF, Germanson TP, et al. Age and outcome after aneurysmal subarachnoid
hemorrhage: why do older patients fare worse? J Neurosurg 1996;85(3):410-8. Larequi-Lauber T, Vader JP, Burnand B, et al. Appropriateness of indications for surgery of lumbar disc
hernia and spinal stenosis. Spine 1997;22(2):203-9. Lavernia CJ, Guzman JF. Relationship of surgical volume to short-term mortality, morbidity, and hospital
charges in arthroplasty. J Arthroplasty 1995;10(2):133-40. Leape LL, Hilborne LH, Schwartz JS, et al. The appropriateness of coronary artery bypass graft surgery
in academic medical centers. Working Group of the Appropriateness Project of the Academic Medical Center Consortium. Ann Intern Med 1996;125(1):8-18.
Leape LL, Park RE, Bashore TM, et al. Effect of variability in the interpretation of coronary angiograms on
the appropriateness of use of coronary revascularization procedures. American Heart Journal 2000;139(1 Pt 1):106-13.
Leape LL, Hilborne LH, Park RE, et al. The appropriateness of use of coronary artery bypass graft
surgery in New York state. JAMA 1993;269(6):753-60. Lieberman MD, Kilburn H, Lindsey M, et al. Relation of perioperative deaths to hospital volume among
patients undergoing pancreatic resection for malignancy. Ann Surg 1995;222(5):638-45. Localio AR, Hamory BH, Fisher AC, et al. The public release of hospital and physician mortality data in
Pennsylvania. A case study. Med Care 1997;35(3):272-286. Luft HS, Hunt SS, Maerki SC. The volume-outcome relationship: practice-makes-perfect or selective-
referral patterns? Health Serv Res 1987;22(2):157-82.

Version 2.1 91 Revision 3 (July 21, 2004)
MacIntyre K, Capewell lS, Stewart S, et al. Evidence of improving prognosis in heart failure: trends in case fatality in 66,547 patients hospitalized between 1986 and 1995 [see comments]. Circulation 2000;102(10):1126-31.
Malone ML, Bajwa TK, Battiola RJ, et al. Variation among cardiologists in the utilization of right heart
catheterization at time of coronary angiography [see comments]. Cathet Cardiovasc Diagn 1996;37(2):125-30.
Manheim LM, Sohn MW, Feinglass J, et al. Hospital vascular surgery volume and procedure mortality
rates in California, 1982-1994. J Vasc Surg 1998;28(1):45-46. Markowitz JS, Pashko S, Gutterman EM, et al. Death rates among patients hospitalized with community-
acquired pneumonia: a reexamination with data from three states. Am J Public Health 1996;86(8 Pt 1):1152-4.
McMahon AJ, Russell IT, Baxter JN, et al. Laparoscopic and minilaparotomy cholecystectomy: a
randomised trial [see comment]. Lancet 1994;343(8890):135-8. McMahon AF, Russell IT, Ramsay G, et al. Laparoscopic and minilaparotomy cholecystectomy: a
randomized trial comparing postoperative pain and pulmonary function. Surgery 1994;115(5):533-9. Medicare Quality of Care Report of Surveillance Measures. Centers for Medicare and Medicaid Services
(formerly Health Care Financing Administration), U.S. Department of Health and Human Services. Meehan TP, Hennen J, Radford MJ, et al. Process and outcome of care for acute myocardial infarction
among Medicare beneficiaries in Connecticut: a quality improvement demonstration project. Ann Intern Med 1995;122(12):928-36.
Meehan TP, Fine MJ, Krumholz HM, et al. Quality of care, process, and outcomes in elderly patients with
pneumonia. JAMA 1997;278(23):2080-4. Menard MK. Cesarean delivery rates in the United States. The 1990s. Obstet Gynecol Clin North Am
1999;26(2):275-86. Myers AH, Robinson EG, Van Natta ML, et al. Hip fractures among the elderly: factors associated with in-
hospital mortality. Am J Epidemiol 1991;134(10):1128-37. Nationwide Inpatient Sample and State Inpatient Databases. Healthcare Cost and Utilization Project.
Agency for Healthcare Research and Quality, Rockville, MD. http://www.ahrq.gov/data/hcup Neulander EZ, Hawke CK, Soloway MS. Incidental appendectomy during radical cystectomy: an
interdepartmental survey and review of the literature. Urology 2000;56(2):241-4. Ni H, Hershberger FE. Was the decreasing trend in hospital mortality from heart failure attributable to
improved hospital care? The Oregon experience, 1991-1995. Am J Manag Care 1999;5(9):1105-15. Nockerts SR, Detmer DE, Fryback, DG. Incidental appendectomy in the elderly? No. Surgery
1980;88(2):301-6. Ottino G, Bergerone S, Di Leo M, et al. Aortocoronary bypass results: a discriminant multivariate analysis
of risk factors of operative mortality. J Cardiovasc Surg (Torino) 1990;31(1):20-5. Owings, MF, Lawrence L. Detailed diagnoses and procedures, National Hospital Discharge Survey, 1997.
Vital Health Stat 13 199(145):1-157. Pacific Business Group on Health. (http://www.pbgh.org/)

Version 2.1 92 Revision 3 (July 21, 2004)
Patti MG, Corvera CU, Glasgow RE, et al. A hospital‘s annual rate of esophagectomy influences the
operative mortality rate. J Gastrointest Surg 1998;2(2):186-92. Pearce WH, Parker MA, Feinglass J, et al. The importance of surgeon volume and training in outcomes
for vascular surgical procedures. J Vasc Surg 1999;29(5):768-76. Pepine CJ, Allen HD, Bashore TM, et al. ACC/AHA guidelines for cardiac catheterization and cardiac
catheterization laboratories. American College of Cardiology/American Heart Association Ad Hoc Task Force on Cardiac Catheterization. Circulation 1991;84(5):2213-47.
Perez JV, Warwick DJ, Case CP, et al. Death after proximal femoral fracture—an autopsy study. Injury
1995;26(4):237-40. Peterson ED, DeLong ER, Jollis JG, et al. Public reporting of surgical mortality: a survey of new York
State cardiothoracic surgeons. Ann Thorac surg 1999;68(4):1195-200; discussion 12-1-2. Pilcher DB, Davis JH, Ashikaga T, et al. Treatment of abdominal aortic aneurysm in an entire state over
7½ years. Am J Surg 1980;139(4):487-94. Popovic JR, Kozak LJ. National hospital discharge survey: annual summary, 1998 [In Process Citation].
Vital Health Stat 13 2000(148):1-194. Porchet F, Vader JP, Larequi-Lauber T, et al. The assessment of appropriate indications for laminectomy.
J Bone Joint Surg Br 1999;81(2):234-9. Pronovost PJ, Jenckes MW, Dorman T, et al. Organizational characteristics of intensive care units related
to outcomes of abdominal aortic surgery. JAMA 1999;281(14):1310-7. Psaty BM, Boineau R, Kuller LH, et al. The potential costs of upcoding for heart failure in the United
States. Am J Cardiol 1999;84(1):108-9, A9. Ritchie JL, Maynard C, Chapko MK, et al. Association between percutaneous transluminal coronary
angioplasty volumes and outcomes in the Healthcare Cost and Utilization Project 1993-1994. Am J Cardiol 1999;83(4):493-7.
Roberts RG, Bell HS, Wall EM, et al. Trial of labor or repeated cesarean section. The woman‘s choice.
Arch Fam Med 1997;6(2):120-5. Rockall TA, Logan RF, Devlin HB, et al. Variation in outcome after acute upper gastrointestinal
haemorrhage. The National Audit of Acute Upper Gastrointestinal Haemorrhage. Lancet 1995;346(8971):346-50.
Rosenthal GE, Baker DW, Norris DG, et al. Relationships between in-hospital and 30-day standardized
hospital mortality: implications for profiling hospitals. Health Serv Res 2000;34(7):1449-68. Rutledge R, Oller DW, Meyer AA, et al. A statewide, population-based time-series analysis of the
outcome of ruptured abdominal aortic aneurysm. Ann Surg 1996;223(5):492-502. Ryan TJ, Bauman WB, Kennedy JW, et al. Guidelines for percutaneous transluminal coronary
angioplasty. A report of the American Heart Association/American College of Cardiology Task Force on Assessment of Diagnostic and Therapeutic Cardiovascular Procedures (Committee on Percutaneous Transluminal Coronary Angioplasty). Circulation 1993;88(6):2987-3007.
Ryan TJ, Antman EM, Brooks NH, et al. 1999 update: ACC/AHA guidelines for the management of
patients with acute myocardial infarction. A report of the American College of Cardiology/American

Version 2.1 93 Revision 3 (July 21, 2004)
Heart Association Task Force on Practice Guidelines (Committee on Management of Acute Myocardial Infarction). J Am Coll Cardiol 1999;34(3):890-911.
Sachs BP, Kobelin C, Castro MA, et al. The risks of lowering the cesarean-delivery rate. N Engl J Med
1999;340(1):54-7. Samsa GP, Bian J, Lipscomb J, et al. Epidemiology of recurrent cerebral infarction: a Medicare claims-
based comparison of first and recurrent strokes on 2-year survival and cost. Stroke 1999;30(2):338-49.
Second Report of the California Hospitals Outcomes Project, May 1996. Acute Myocardial Infarction.
Sacramento, CA: Office of Statewide Health Planning and Development; 1996. Simunovic M, To T, Theriault M, et al. Relation between hospital surgical volume and outcome for
pancreatic resection for neoplasm in a publicly funded health care system [see comments]. Cmaj 1999;160(5):643-8.
Smith, WM. Epidemiology of congestive heart failure. Am J Cardiol 1985;55(2):3A-8A. Sollano JA, Gelijns AC, Moskowitz AJ et al. Volume-outcome relationships on cardiovascular operations:
New York State, 1990-1995. J Thorac Cardiovasc Surg 1999;117(3):419-28. Soloman RA, Mayer SA, Tarmey JJ. Relationship between the volume of craniotomies for cerebral
aneurysm performed at New York state hospitals and in-hospital mortality. Stroke 1996;27(1):13-7. Southern Surgeons Club. A prospective analysis of 1518 laparoscopic cholecystectomies. NEJM
1991;324:1073-1078. Stachniak JB, Layon AJ, Day AL, et al. Craniotomy for intracranial aneurysm and subarachnoid
hemorrhage. Is course, cost, or outcome affected by age? Stroke 1996;27(2):276-81. Stafford RS. The impact of nonclinical factors on repeat cesarean section [see comments]. JAMA
1991;265(1):59-63. Stafford RS, Sullivan SD, Gardner LB. Trends in cesarean section use in California, 1983 to 1990. Am J
Obstet Gynecol 1993;168(4):1297-302. Strunk BC, Ginsburg PB, Gabel JR. Tracking Health Care Costs. Health Affairs, 26 September 2001
(Web exclusive). Synder TE, Selanders JR. Incidental appendectomy—yes or no? A retrospective case study and review
of the literature. Infect Dis Obstet Gynecol 1998;6(1)30-7. Taylor CL, Yuan A, Selman WR, et al. Mortality rates, hospital length of stay, and the cost of treating
subarachnoid hemorrhage in older patients: institutional and geographical differences. J Neurosurg 1997;86(4):583-8.
The Center for Medical Consumers. (http://www.medicalconsumers.org/) Tissue plasminogen activator for acute ischemic stroke. The National Institute of Neurological Disorders
and Stroke rt-PA Stroke Study Group. N Engl J Med 1995;333(24):1581-7. Warren JL, Penberthy LT, Addiss DG, et al. Appendectomy incidental to cholecystectomy among elderly
Medicare beneficiaries. Surg Gynecol Obstet 1993;177(3):288-94.

Version 2.1 94 Revision 3 (July 21, 2004)
Wen SW, Simunovic M, Williams JI, et al. Hospital volume, calendar age, and short term outcomes in patients undergoing repair of abdominal aortic aneurysm: the Ontario experience, 1988-92. J Epidemiol Community Health 1996;50(2):207-13.
Whisnant JP, Sacco SE, O‘Fallon WM, et al. Referral bias in aneurysmal subarachnoid hemorrhage. J
Neurosurg 1993;78(5):726-32. Williams GR, Jiang JG, Matchar DB, et al. Incidence and occurrence of total (first-ever and recurrent)
stroke. Stroke 1999;30(12):2523-8. Wolff BG. Current status of incidental surgery. Dis Colon Rectum 1995;38(4):435-41. Wolinsky FD, Fitzgerald JF, Stump TE. The effect of hip fracture on mortality, hospitalization, and
functional status: a prospective study. Am J Public Health 1997;87(3):398-403. Ziskind AA, Lauer MA, Bishop G, et al. Assessing the appropriateness of coronary revascularization: the University of Maryland Revascularization Appropriateness Score (RAS) and its comparison to RAND expert panel ratings and American College of Cardiology/American Heart Association guidelines with regard to assigned appropriateness rating and ability to predict outcome. Clin Cardiol 1999;22(2):67-76.

Version 2.1 A-1 Revision 3 (July 21, 2004)
A.
Appendix A: Inpatient Quality Indicator Definitions For ICD-9-CM codes introduced after October 1995, the date of introduction is indicated after the code label. For example, ―OCT96-― indicates the ICD-9-CM code was introduced in October 1996.
Provider-Level Indicators
Procedure Volume Indicators
Esophageal Resection Volume (IQI 1)
Numerator:
Discharges with ICD-9-CM codes of 4240 through 4242 in any procedure field and a diagnosis code of esophageal cancer in any field.
ICD-9-CM esophageal resection procedure codes:
4240 ESOPHAGECTOMY NOS
4241 PARTIAL ESOPHAGECTOMY
4242 TOTAL ESOPHAGECTOMY ICD-9-CM esophageal cancer diagnosis codes:
1500 MAL NEO CERVICAL ESOPHAG 1504 MAL NEO MIDDLE 3RD ESOPH
1501 MAL NEO THORACIC ESOPHAG 1505 MAL NEO LOWER 3RD ESOPH
1502 MAL NEO ABDOMIN ESOPHAG 1508 MAL NEO ESOPHAGUS NEC
1503 MAL NEO UPPER 3RD ESOPH 1509 MAL NEO ESOPHAGUS NOS Exclude:
MDC 14 (pregnancy, childbirth, and puerperium) and MDC 15 (newborns and other neonates).
Denominator:
Not applicable.

Version 2.1 A-2 Revision 3 (July 21, 2004)
Pancreatic Resection Volume (IQI 2)
Numerator:
Discharges with ICD-9-CM codes of 526 or 527 in any procedure field and a diagnosis code of pancreatic cancer in any field.
ICD-9-CM pancreatic resection procedure codes:
526 TOTAL PANCREATECTOMY 527 RAD PANCREATICODUODENECT
ICD-9-CM pancreatic cancer diagnosis codes:
1520 MALIGNANT NEOPL DUODENUM 1572 MAL NEO PANCREAS TAIL
1561 MAL NEO EXTRAHEPAT DUCTS 1573 MAL NEO PANCREATIC DUCT
1562 MAL NEO AMPULLA OF VATER 1574 MAL NEO ISLET LANGERHANS
1570 MAL NEO PANCREAS HEAD 1578 MALIG NEO PANCREAS NEC
1571 MAL NEO PANCREAS BODY 1579 MALIG NEO PANCREAS NOS Exclude:
MDC 14 (pregnancy, childbirth, and puerperium) and MDC 15 (newborns and other neonates).
Denominator:
Not applicable.
Pediatric Heart Surgery Volume (IQI 3)
Numerator:
Discharges with ICD-9-CM procedure codes for either congenital heart disease (1P) in any field or non-specific heart surgery (2P) in any field with ICD-9-CM diagnosis of congenital heart disease (2D) in any field.
Age less than 18 years old.
Congenital heart disease procedures (1P)
3500 CLOSED VALVOTOMY NOS 3552 PROS REPAIR ATRIA DEF-CL 3501 CLOSED AORTIC VALVOTOMY 3553 PROST REPAIR VENTRIC DEF 3502 CLOSED MITRAL VALVOTOMY 3554 PROS REP ENDOCAR CUSHION 3503 CLOSED PULMON VALVOTOMY 3560 GRFT REPAIR HRT SEPT NOS 3504 CLOSED TRICUSP VALVOTOMY 3561 GRAFT REPAIR ATRIAL DEF 3510 OPEN VALVULOPLASTY NOS 3562 GRAFT REPAIR VENTRIC DEF 3511 OPN AORTIC VALVULOPLASTY 3563 GRFT REP ENDOCAR CUSHION 3512 OPN MITRAL VALVULOPLASTY 3570 HEART SEPTA REPAIR NOS 3513 OPN PULMON VALVULOPLASTY 3571 ATRIA SEPTA DEF REP NEC 3514 OPN TRICUS VALVULOPLASTY 3572 VENTR SEPTA DEF REP NEC 3520 REPLACE HEART VALVE NOS 3573 ENDOCAR CUSHION REP NEC 3521 REPLACE AORT VALV-TISSUE 3581 TOT REPAIR TETRAL FALLOT 3522 REPLACE AORTIC VALVE NEC 3582 TOTAL REPAIR OF TAPVC 3523 REPLACE MITR VALV-TISSUE 3583 TOT REP TRUNCUS ARTERIOS 3524 REPLACE MITRAL VALVE NEC 3584 TOT COR TRANSPOS GRT VES

Version 2.1 A-3 Revision 3 (July 21, 2004)
Pediatric Heart Surgery Volume (IQI 3)
3525 REPLACE PULM VALV-TISSUE 3591 INTERAT VEN RETRN TRANSP 3526 REPLACE PULMON VALVE NEC 3592 CONDUIT RT VENT-PUL ART 3527 REPLACE TRIC VALV-TISSUE 3593 CONDUIT LEFT VENTR-AORTA 3528 REPLACE TRICUSP VALV NEC 3594 CONDUIT ARTIUM-PULM ART 3531 PAPILLARY MUSCLE OPS 3595 HEART REPAIR REVISION 3532 CHORDAE TENDINEAE OPS 3598 OTHER HEART SEPTA OPS
3533 ANNULOPLASTY 3599 OTHER OP ON HRT VALVES 3534 INFUNDIBULECTOMY 3699 OTHER OPERATIONS ON VESSEL OF
HEART
3535 TRABECUL CARNEAE CORD OP 3733 EXCISION OR DESTRUCTION OF OTHER LESION OR TISSUE OF HEART
3539 TISS ADJ TO VALV OPS NEC 375 HEART TRANSPLANTATION (invalid as of OCT 03)
3541 ENLARGE EXISTING SEP DEF 3751 HEART TRANSPLANTATION OCT03- 3542 CREATE SEPTAL DEFECT 3752 IMPLANT TOT REP HRT SYS OCT03- 3550 PROSTH REP HRT SEPTA NOS 390 SYSTEMIC-PULM ART SHUNT 3551 PROS REP ATRIAL DEF-OPN 3921 CAVAL-PULMON ART ANASTOM
Non-specific cardiac procedures (2P)
3834 RESECTION OF ABDOMINAL AORTA WITH ANASTOMOSIS
3885 OCCLUDE THORACIC VES NEC
3835 THOR VESSEL RESECT/ANAST 3949 OTHER REVISION OF VASCULAR PROCEDURE
3844 RESECTION OF ABDOMINAL AORTA WITH REPLACEMENT
3956 REPAIR OF BLOOD VESSEL WITH TISSUE PATCH GRAFT
3845 RESECT THORAC VES W REPL 3957 REPAIR OF BLOOD VESSEL WITH SYNTHETIC PATCH GRAFT
3864 OTHER EXCISION OF ABDOMINAL AORTA 3958 REPAIR OF BLOOD VESSEL WITH UNSPECIFIED TYPE OF PATCH GRAFT
3865 OTHER EXCISION OF THORACIC VESSEL 3959 REPAIR OF VESSEL NEC
3884 OTHER SURGICAL OCCLUSION OF ABDOMINAL AORTA
Congenital heart disease diagnoses (2D)
7450 COMMON TRUNCUS 7465 CONGEN MITRAL STENOSIS 74510 COMPL TRANSPOS GREAT VES 7466 CONG MITRAL INSUFFICIENC 74511 DOUBLE OUTLET RT VENTRIC 7467 HYPOPLAS LEFT HEART SYND 74512 CORRECT TRANSPOS GRT VES 74681 CONG SUBAORTIC STENOSIS 74519 TRANSPOS GREAT VESS NEC 74682 COR TRIATRIATUM 7452 TETRALOGY OF FALLOT 74683 INFUNDIB PULMON STENOSIS 7453 COMMON VENTRICLE 74684 OBSTRUCT HEART ANOM NEC 7454 VENTRICULAR SEPT DEFECT 74685 CORONARY ARTERY ANOMALY 7455 SECUNDUM ATRIAL SEPT DEF 74687 MALPOSITION OF HEART 74560 ENDOCARD CUSHION DEF NOS 74689 CONG HEART ANOMALY NEC 74561 OSTIUM PRIMUM DEFECT 7469 CONG HEART ANOMALY NOS 74569 ENDOCARD CUSHION DEF NEC 7470 PATENT DUCTUS ARTERIOSUS 7457 COR BILOCULARE 74710 COARCTATION OF AORTA 7458 SEPTAL CLOSURE ANOM NEC 74711 INTERRUPT OF AORTIC ARCH 7459 SEPTAL CLOSURE ANOM NOS 74720 CONG ANOM OF AORTA NOS 74600 PULMONARY VALVE ANOM NOS 74721 ANOMALIES OF AORTIC ARCH 74601 CONG PULMON VALV ATRESIA 74722 AORTIC ATRESIA/STENOSIS 74602 CONG PULMON VALVE STENOS 74729 CONG ANOM OF AORTA NEC 74609 PULMONARY VALVE ANOM NEC 7473 PULMONARY ARTERY ANOM 7461 CONG TRICUSP ATRES/STEN 74740 GREAT VEIN ANOMALY NOS 7462 EBSTEIN‘S ANOMALY 74741 TOT ANOM PULM VEN CONNEC 7463 CONG AORTA VALV STENOSIS 74742 PART ANOM PULM VEN CONN 7464 CONG AORTA VALV INSUFFIC 74749 GREAT VEIN ANOMALY NEC

Version 2.1 A-4 Revision 3 (July 21, 2004)
Pediatric Heart Surgery Volume (IQI 3)
Exclude:
MDC 14 (pregnancy, childbirth and pueperium); patients with transcatheter interventions (either 3AP, 3BP, 3CP, 3DP, 3EP with 3D, or 3FP) as single cardiac procedures, performed without bypass (5P) but with catheterization (6P); and patients with septal defects (4P) as single cardiac procedures without bypass (5P).
Transcatheter interventions procedure codes: Closed heart valvotomy (3AP)
3500 CLOSED HEART VALVOTOMY, UNSPECIFIED VALUE 3501 CLOSED HEART VALVOTOMY, AORTIC VALUE 3502 CLOSED HEART VALVOTOMY, MITRAL VALUE 3503 CLOSED HEART VALVOTOMY, PULMONARY VALUE 3504 CLOSED HEART VALVOTOMY, TRICUSPID VALUE
Atrial septal enlargement (3BP)
3541 ENLARGEMENT OF EXISTING ATRIAL SEPTAL DEFECT 3542 CREATION OF SEPTAL DEFECT IN HEART
Atrial septal defect repair (3CP)
3551 REPAIR OF ATIAL SEPTAL DEFECT WITH PROSTHESIS, OPEN TECHNIQUE 3571 OTHER AND UNSPECIFIED REPAIR OF ATRIAL SEPTAL DEFECT
Ventricular septal defect repair (3DP)
3553 REPAIR OF VENTRICULAR SEPTAL DEFECT WITH PROSTHESIS
3572 OTHER AND UNSPECIFIED REPAIR OF VENTRICULAR SEPTAL DEFECT
Occlusion of thoracic vessel (3EP)
3885 OCCLUDE THORACIC VES NEC
PDA closure diagnosis code (3D)
7470 PATENT DUCTUS ARTERIOSUS
Other surgical occlusion (3FP)
3884 OTHER SURGICAL OCCLUSION OF AORTA, ABDOMINAL 3885 OTHER SURGICAL OCCLUSION OF THORACIC VESSEL
3959 OTHER REPAIR OF VESSEL Atrial septal defect repair and enlargement (4P)
3541 ENLARGE EXISTING SEP DEF 3552 PROS REPAIR ATRIA DEF-CL
Extracorporeal circulation (bypass) (5P)

Version 2.1 A-5 Revision 3 (July 21, 2004)
Pediatric Heart Surgery Volume (IQI 3)
3961 EXTRACORPOREAL CIRCULAT
Catheterization (6P)
3721 RT HEART CARDIAC CATH 8852 ANGIOCARDIOGRAPHY OF RIGHT HEART STRUCTURES
3722 LEFT HEART CARDIAC CATH 8853 ANGIOCARDIOGRAPHY OF LEFT HEART STRUCTURES
3723 RT/LEFT HEART CARD CATH 8854 COMBINED RIGHT AND LEFT HEART ANGIOCARDIOGRAPHY
8842 CONTRAST AORTOGRAM 8855 CORONARY ARTERIOGRAPHY USING A SINGLE CATHETER
8843 CONTR PULMON ARTERIOGRAM 8856 CORONARY ARTERIOGRAPHY USING TWO CATHETERS
8844 ARTERIOGRAPHY OF OTHER INTRATHORACIC VESSELS
8857 OTHER AND UNSPECIFIED CORONARY ARTERIOGRAPHY
8850 ANGIOCARDIOGRAPHY, NOT OTHERWISE SPECIFIED
8858 NEGATIVE-CONTRAST CARDIAC ROENTGENOGRAPHY
8851 ANGIOCARDIOGRAPHY OF VENAE CAVAE
Denominator:
Not applicable.
Abdominal Aortic Aneurysm (AAA) Repair Volume (IQI 4)
Numerator:
Discharges with ICD-9-CM codes of 3834, 3844, or 3864 in any procedure field with a diagnosis of AAA in any field.
ICD-9-CM AAA procedure codes:
3834 AORTA RESECTION & ANAST 3844 RESECT ABDM AORTA W REPL 3864 EXCISION OF AORTA
ICD-9-CM AAA diagnosis codes:
4413 RUPT ABD AORTIC ANEURYSM 4414 ABDOM AORTIC ANEURYSM
Exclude:
MDC 14 (pregnancy, childbirth, and puerperium) and MDC 15 (newborns and other neonates).
Denominator:
Not applicable.

Version 2.1 A-6 Revision 3 (July 21, 2004)
Coronary Artery Bypass Graft (CABG) Volume (IQI 5)
Numerator:
Discharges with ICD-9-CM codes of 3610 through 3619 in any procedure field.
Age 40 years and older. ICD-9-CM CABG procedure codes:
3610 AORTOCORONARY BYPASS NOS 3615 1 INT MAM-COR ART BYPASS 3611 AORTOCOR BYPAS-1 COR ART 3616 2 INT MAM-COR ART BYPASS 3612 AORTOCOR BYPAS-2 COR ART 3617 ABD-CORON ART BYPASS OCT96- 3613 AORTOCOR BYPAS-3 COR ART 3619 HRT REVAS BYPS ANAS NEC 3614 AORTCOR BYPAS-4+ COR ART
Exclude:
MDC 14 (pregnancy, childbirth, and puerperium) and MDC 15 (newborns and other neonates).
Denominator:
Not applicable.
Percutaneous Transluminal Coronary Angioplasty (PTCA) Volume (IQI 6)
Numerator:
Discharges with ICD-9-CM codes of 3601, 3602, 3605, or 3606 in any procedure field.
Age 40 years and older. ICD-9-CM PTCA procedure codes:
3601 PTCA-1 VESSEL W/O AGENT 3602 PTCA-1 VESSEL WITH AGNT 3605 PTCA-MULTIPLE VESSEL 3606 INSERT OF COR ART STENT OCT95-
Exclude:
MDC 14 (pregnancy, childbirth, and puerperium) and MDC 15 (newborns and other neonates).
Denominator:
Not applicable.
PTCA Mortality Rate (IQI 30)
Numerator:
Number of deaths (DISP = 20).

Version 2.1 A-7 Revision 3 (July 21, 2004)
Percutaneous Transluminal Coronary Angioplasty (PTCA) Volume (IQI 6)
Denominator: Discharges with ICD-9-CM codes of 3601, 3602, 3605, or 3606 in any procedure field.
Age 40 years and older.
ICD-9-CM PTCA procedure codes:
3601 PTCA-1 VESSEL W/O AGENT 3602 PTCA-1 VESSEL WITH AGNT 3605 PTCA-MULTIPLE VESSEL 3606 INSERT OF COR ART STENT OCT95-
Exclude:
Patients with missing discharge disposition (DISP=missing), transferring to another short-term hospital (DISP=2), MDC 14 (pregnancy, childbirth, and puerperium), and MDC 15 (newborns and other neonates).
Carotid Endarterectomy Volume (IQI 7)
Numerator:
Discharges with an ICD-9-CM code of 3812 in any procedure field. ICD-9-CM carotid endarterectomy procedure code:
3812 HEAD & NECK ENDARTER NEC Exclude:
MDC 14 (pregnancy, childbirth, and puerperium) and MDC 15 (newborns and other neonates).
Denominator:
Not applicable.
Carotid Endarterectomy Mortality Rate (IQI 31)
Numerator:
Number of deaths (DISP = 20).
Denominator:
Discharges with an ICD-9-CM code of 3812 in any procedure field. ICD-9-CM carotid endarterectomy procedure code:
3812 HEAD & NECK ENDARTER NEC Exclude:
Patients with missing discharge disposition (DISP=missing), transferring to another short-term hospital (DISP=2), MDC 14 (pregnancy, childbirth, and puerperium), and MDC 15 (newborns and other neonates).

Version 2.1 A-8 Revision 3 (July 21, 2004)
Mortality Indicators for Inpatient Procedures
Esophageal Resection Mortality Rate (IQI 8)
Numerator:
Number of deaths (DISP = 20) with a code of esophageal resection in any procedure field and a diagnosis code of esophageal cancer in any field.
Denominator:
Discharges with ICD-9-CM codes of 4240 through 4242 in any procedure field and a diagnosis code of esophageal cancer in any field.
ICD-9-CM esophageal resection procedure code:
4240 ESOPHAGECTOMY NOS 4241 PARTIAL ESOPHAGECTOMY 4242 TOTAL ESOPHAGECTOMY
ICD-9-CM esophageal cancer diagnosis codes:
1500 MAL NEO CERVICAL ESOPHAG 1504 MAL NEO MIDDLE 3RD ESOPH 1501 MAL NEO THORACIC ESOPHAG 1505 MAL NEO LOWER 3RD ESOPH 1502 MAL NEO ABDOMIN ESOPHAG 1508 MAL NEO ESOPHAGUS NEC 1503 MAL NEO UPPER 3RD ESOPH 1509 MAL NEO ESOPHAGUS NOS
Exclude:
Patients with missing discharge disposition (DISP = missing), transferring to another short-term hospital (DISP = 2), MDC 14 (pregnancy, childbirth, and puerperium), and MDC 15 (newborns and other neonates).
Pancreatic Resection Mortality Rate (IQI 9)
Numerator:
Number of deaths (DISP = 20) with a code of pancreatic resection in any procedure field and a diagnosis code of pancreatic cancer in any field.

Version 2.1 A-9 Revision 3 (July 21, 2004)
Pancreatic Resection Mortality Rate (IQI 9)
Denominator:
Discharges with ICD-9-CM codes of 526 or 527 in any procedure field and a diagnosis code of pancreatic cancer in any field.
ICD-9-CM pancreatic resection procedure codes:
526 TOTAL PANCREATECTOMY 527 RAD PANCREATICODUODENECT
ICD-9-CM pancreatic cancer diagnosis codes:
1520 MALIGNANT NEOPL DUODENUM 1572 MAL NEO PANCREAS TAIL 1561 MAL NEO EXTRAHEPAT DUCTS 1573 MAL NEO PANCREATIC DUCT 1562 MAL NEO AMPULLA OF VATER 1574 MAL NEO ISLET LANGERHANS 1570 MAL NEO PANCREAS HEAD 1578 MALIG NEO PANCREAS NEC 1571 MAL NEO PANCREAS BODY 1579 MALIG NEO PANCREAS NOS
Exclude:
Patients with missing discharge disposition (DISP = missing), transferring to another short-term hospital (DISP = 2), MDC 14 (pregnancy, childbirth, and puerperium), and MDC 15 (newborns and other neonates).
Pediatric Heart Surgery Mortality Rate (IQI 10)
Numerator:
Number of deaths (DISP = 20) with a code of pediatric heart surgery in any procedure field with ICD-9-CM diagnosis of congenital heart disease in any field.
Denominator:
Discharges with ICD-9-CM procedure codes for congenital heart disease (1P) in any field or non-specific heart surgery (2P) in any field with ICD-9-CM diagnosis of congenital heart disease (2D) in any field.
Age less than 18 years old.
Congenital heart disease procedures (1P)
3500 CLOSED VALVOTOMY NOS 3552 PROS REPAIR ATRIA DEF-CL
3501 CLOSED AORTIC VALVOTOMY 3553 PROST REPAIR VENTRIC DEF
3502 CLOSED MITRAL VALVOTOMY 3554 PROS REP ENDOCAR CUSHION
3503 CLOSED PULMON VALVOTOMY 3560 GRFT REPAIR HRT SEPT NOS
3504 CLOSED TRICUSP VALVOTOMY 3561 GRAFT REPAIR ATRIAL DEF
3510 OPEN VALVULOPLASTY NOS 3562 GRAFT REPAIR VENTRIC DEF
3511 OPN AORTIC VALVULOPLASTY 3563 GRFT REP ENDOCAR CUSHION
3512 OPN MITRAL VALVULOPLASTY 3570 HEART SEPTA REPAIR NOS
3513 OPN PULMON VALVULOPLASTY 3571 ATRIA SEPTA DEF REP NEC
3514 OPN TRICUS VALVULOPLASTY 3572 VENTR SEPTA DEF REP NEC
3520 REPLACE HEART VALVE NOS 3573 ENDOCAR CUSHION REP NEC

Version 2.1 A-10 Revision 3 (July 21, 2004)
Pediatric Heart Surgery Mortality Rate (IQI 10)
3521 REPLACE AORT VALV-TISSUE 3581 TOT REPAIR TETRAL FALLOT
3522 REPLACE AORTIC VALVE NEC 3582 TOTAL REPAIR OF TAPVC
3523 REPLACE MITR VALV-TISSUE 3583 TOT REP TRUNCUS ARTERIOS
3524 REPLACE MITRAL VALVE NEC 3584 TOT COR TRANSPOS GRT VES
3525 REPLACE PULM VALV-TISSUE 3591 INTERAT VEN RETRN TRANSP
3526 REPLACE PULMON VALVE NEC 3592 CONDUIT RT VENT-PUL ART
3527 REPLACE TRIC VALV-TISSUE 3593 CONDUIT LEFT VENTR-AORTA
3528 REPLACE TRICUSP VALV NEC 3594 CONDUIT ARTIUM-PULM ART
3531 PAPILLARY MUSCLE OPS 3595 HEART REPAIR REVISION
3532 CHORDAE TENDINEAE OPS 3598 OTHER HEART SEPTA OPS
3533 ANNULOPLASTY 3599 OTHER OP ON HRT VALVES
3534 INFUNDIBULECTOMY 3699 OTHER OPERATIONS ON VESSEL OF HEART
3535 TRABECUL CARNEAE CORD OP 3733 EXCISION OR DESTRUCTION OF OTHER LESION OR TISSUE OF HEART
3539 TISS ADJ TO VALV OPS NEC 375 HEART TRANSPLANTATION (invalid as of OCT03)
3541 ENLARGE EXISTING SEP DEF 3751 HEART TRANSPLANTATION OCT03-
3542 CREATE SEPTAL DEFECT 3752 IMPLANT TOT REP HRT SYS OCT03-
3550 PROSTH REP HRT SEPTA NOS 390 SYSTEMIC-PULM ART SHUNT
3551 PROS REP ATRIAL DEF-OPN 3921 CAVAL-PULMON ART ANASTOM
Congenital heart disease diagnoses (2D)
7450 COMMON TRUNCUS 7465 CONGEN MITRAL STENOSIS
74510 COMPL TRANSPOS GREAT VES 7466 CONG MITRAL INSUFFICIENC
74511 DOUBLE OUTLET RT VENTRIC 7467 HYPOPLAS LEFT HEART SYND
74512 CORRECT TRANSPOS GRT VES 74681 CONG SUBAORTIC STENOSIS
74519 TRANSPOS GREAT VESS NEC 74682 COR TRIATRIATUM
7452 TETRALOGY OF FALLOT 74683 INFUNDIB PULMON STENOSIS
7453 COMMON VENTRICLE 74684 OBSTRUCT HEART ANOM NEC
7454 VENTRICULAR SEPT DEFECT 74685 CORONARY ARTERY ANOMALY
7455 SECUNDUM ATRIAL SEPT DEF 74687 MALPOSITION OF HEART
74560 ENDOCARD CUSHION DEF NOS 74689 CONG HEART ANOMALY NEC
74561 OSTIUM PRIMUM DEFECT 7469 CONG HEART ANOMALY NOS
74569 ENDOCARD CUSHION DEF NEC 7470 PATENT DUCTUS ARTERIOSUS
7457 COR BILOCULARE 74710 COARCTATION OF AORTA
7458 SEPTAL CLOSURE ANOM NEC 74711 INTERRUPT OF AORTIC ARCH
7459 SEPTAL CLOSURE ANOM NOS 74720 CONG ANOM OF AORTA NOS
74600 PULMONARY VALVE ANOM NOS 74721 ANOMALIES OF AORTIC ARCH
74601 CONG PULMON VALV ATRESIA 74722 AORTIC ATRESIA/STENOSIS
74602 CONG PULMON VALVE STENOS 74729 CONG ANOM OF AORTA NEC
74609 PULMONARY VALVE ANOM NEC 7473 PULMONARY ARTERY ANOM
7461 CONG TRICUSP ATRES/STEN 74740 GREAT VEIN ANOMALY NOS
7462 EBSTEIN‘S ANOMALY 74741 TOT ANOM PULM VEN CONNEC
7463 CONG AORTA VALV STENOSIS 74742 PART ANOM PULM VEN CONN
7464 CONG AORTA VALV INSUFFIC 74749 GREAT VEIN ANOMALY NEC
Non-specific cardiac procedures (2P)

Version 2.1 A-11 Revision 3 (July 21, 2004)
Pediatric Heart Surgery Mortality Rate (IQI 10)
3834 RESECTION OF ABDOMINAL AORTA WITH ANASTOMOSIS
3885 OCCLUDE THORACIC VES NEC
3835 THOR VESSEL RESECT/ANAST 3949 OTHER REVISION OF VASCULAR PROCEDURE
3844 RESECTION OF ABDOMINAL AORTA WITH REPLACEMENT
3956 REPAIR OF BLOOD VESSEL WITH TISSUE PATCH GRAFT
3845 RESECT THORAC VES W REPL 3957 REPAIR OF BLOOD VESSEL WITH SYNTHETIC PATCH GRAFT
3864 OTHER EXCISION OF ABDOMINAL AORTA 3958 REPAIR OF BLOOD VESSEL WITH UNSPECIFIED TYPE OF PATCH GRAFT
3865 OTHER EXCISION OF THORACIC VESSEL 3959 REPAIR OF VESSEL NEC 3884 OTHER SURGICAL OCCLUSION OF
ABDOMINAL AORTA
Exclude MDC 14 (pregnancy, childbirth and pueperium); patients with transcatheter interventions (either 3AP, 3BP, 3CP, 3DP, 3EP with 3D, or 3FP) as single cardiac procedures, performed without bypass (5P) but with catheterization (6P); patients with septal defects (4P) as single cardiac procedures without bypass (5P); heart transplant (7P); premature infants (4D) with PDA closure (3D and 3EP) as only cardiac procedure; age less than 30 days with PDA closure as only cardiac procedure; missing discharge disposition (DISP=missing); and transferring to another short-term hospital (DISP=2).
Transcatheter interventions procedure codes:
Closed heart valvotomy (3AP)
3500 CLOSED HEART VALVOTOMY, UNSPECIFIED VALUE 3501 CLOSED HEART VALVOTOMY, AORTIC VALUE 3502 CLOSED HEART VALVOTOMY, MITRAL VALUE 3503 CLOSED HEART VALVOTOMY, PULMONARY VALUE 3504 CLOSED HEART VALVOTOMY, TRICUSPID VALUE
Atrial septal enlargement (3BP)
3541 ENLARGEMENT OF EXISTING ATRIAL SEPTAL DEFECT 3542 CREATION OF SEPTAL DEFECT IN HEART
Atrial septal defect repair (3CP)
3551 REPAIR OF ATIAL SEPTAL DEFECT WITH PROSTHESIS, OPEN TECHNIQUE 3571 OTHER AND UNSPECIFIED REPAIR OF ATRIAL SEPTAL DEFECT
Ventricular septal defect repair (3DP)
3553 REPAIR OF VENTRICULAR SEPTAL DEFECT WITH PROSTHESIS
3572 OTHER AND UNSPECIFIED REPAIR OF VENTRICULAR SEPTAL DEFECT
Occlusion of thoracic vessel (3EP)
3885 OCCLUDE THORACIC VES NEC
PDA closure diagnosis code (3D)
7470 PATENT DUCTUS ARTERIOSUS
Other surgical occlusion (3FP)

Version 2.1 A-12 Revision 3 (July 21, 2004)
Pediatric Heart Surgery Mortality Rate (IQI 10)
3884 OTHER SURGICAL OCCLUSION OF AORTA, ABDOMINAL 3885 OTHER SURGICAL OCCLUSION OF THORACIC VESSEL
3959 OTHER REPAIR OF VESSEL Atrial septal defect repair and enlargement (4P)
3541 ENLARGE EXISTING SEP DEF
3552 PROS REPAIR ATRIA DEF-CL
Extracorporeal circulation (5P)
3961 EXTRACORPOREAL CIRCULAT
Catheterization (6P)
3721 RT HEART CARDIAC CATH 8852 ANGIOCARDIOGRAPHY OF RIGHT HEART STRUCTURES
3722 LEFT HEART CARDIAC CATH 8853 ANGIOCARDIOGRAPHY OF LEFT HEART STRUCTURES
3723 RT/LEFT HEART CARD CATH 8854 COMBINED RIGHT AND LEFT HEART ANGIOCARDIOGRAPHY
8842 CONTRAST AORTOGRAM 8855 CORONARY ARTERIOGRAPHY USING A SINGLE CATHETER
8843 CONTR PULMON ARTERIOGRAM 8856 CORONARY ARTERIOGRAPHY USING TWO CATHETERS
8844 ARTERIOGRAPHY OF OTHER INTRATHORACIC VESSELS
8857 OTHER AND UNSPECIFIED CORONARY ARTERIOGRAPHY
8850 ANGIOCARDIOGRAPHY, NOT OTHERWISE SPECIFIED
8858 NEGATIVE-CONTRAST CARDIAC ROENTGENOGRAPHY
8851 ANGIOCARDIOGRAPHY OF VENAE CAVAE
Heart Transplant (7P)
375 HEART TRANSPLANTATION (invalid as of OCT03) 3751 HEART TRANSPLANTATION OCT03- 3752 IMPLANT TOT REP HRT SYS OCT03-
Premature infants (4D)
76500 EXTREME IMMATUR WTNOS 76510 PRETERM INFANT NEC WTNOS 76501 EXTREME IMMATUR <500G 76511 PRETERM NEC <500G 76502 EXTREME IMMATUR 500-749G 76512 PRETERM NEC 500-749G 76503 EXTREME IMMATUR 750-999G 76513 PRETERM NEC 750-999G 76504 EXTREME IMMAT 1000-1249G 76514 PRETERM NEC 1000-1249G 76505 EXTREME IMMAT 1250-1499G 76515 PRETERM NEC 1250-1499G
76506 EXTREME IMMAT 1500-1749G 76516 PRETERM NEC 1500-1749G 76507 EXTREME IMMAT 1750-1999G 76517 PRETERM NEC 1750-1999G 76508 EXTREME IMMAT 2000-2499G 76518 PRETERM NEC 2000-2499G 76509 EXTREME IMMAT 2500+G 76519 PRETERM NEC 2500+G

Version 2.1 A-13 Revision 3 (July 21, 2004)
Abdominal Aortic Artery (AAA) Repair Mortality Rate (IQI 11)
Numerator:
Number of deaths (DISP = 20) with a code of AAA repair in any procedure field and a diagnosis of AAA in any field.
Denominator:
Discharges with ICD-9-CM codes of 3834, 3844, or 3864 in any procedure field and a diagnosis of AAA in any field.
ICD-9-CM AAA repair procedure codes:
3834 AORTA RESECTION & ANAST 3844 RESECT ABDM AORTA W REPL 3864 EXCISION OF AORTA
ICD-9-CM AAA diagnosis codes:
4413 RUPT ABD AORTIC ANEURYSM 4414 ABDOM AORTIC ANEURYSM
Exclude:
Patients with missing discharge disposition (DISP = missing), transferring to another short-term hospital (DISP = 2), MDC 14 (pregnancy, childbirth, and puerperium), and MDC 15 (newborns and other neonates).
Coronary Artery Bypass Graft (CABG) Mortality Rate (IQI 12)
Numerator:
Number of deaths (DISP = 20) with a code of CABG in any procedure field.
Denominator:
Discharges with ICD-9-CM codes of 3610 through 3619 in any procedure field. Age 40 years and older.
ICD-9-CM CABG procedure codes:
3610 AORTOCORONARY BYPASS NOS 3615 1 INT MAM-COR ART BYPASS 3611 AORTOCOR BYPAS-1 COR ART 3616 2 INT MAM-COR ART BYPASS
3612 AORTOCOR BYPAS-2 COR ART 3617 ABD-CORON ART BYPASS OCT96- 3613 AORTOCOR BYPAS-3 COR ART 3619 HRT REVAS BYPS ANAS NEC 3614 AORTCOR BYPAS-4+ COR ART
Exclude:
Patients with missing discharge disposition (DISP = missing), transferring to another short-term hospital (DISP = 2), MDC 14 (pregnancy, childbirth, and puerperium), and MDC 15 (newborns and other neonates).

Version 2.1 A-14 Revision 3 (July 21, 2004)
Craniotomy Mortality Rate (IQI 13)
Numerator:
Number of deaths (DISP = 20) with DRG code for craniotomy (DRG 001, 002, 528, 529, and 530), Age >17, with and without comorbidities and complications.
Denominator:
All discharges with DRG code for craniotomy (DRG 001, 002, 528, 529, and 530), Age >17, with and without comorbidities and complications.
Exclude:
Patients with a principle diagnosis of head trauma, missing discharge disposition (DISP = missing), transferring to another short-term hospital (DISP = 2), MDC 14 (pregnancy, childbirth, and puerperium), and MDC 15 (newborns and other neonates).
ICD-9-CM Head Trauma diagnosis codes:
80000 CLOSED SKULL VAULT FX 80433 CL SKL W OTH FX-MOD COMA
80001 CL SKULL VLT FX W/O COMA 80434 CL SKL/OTH FX-PROLN COMA
80002 CL SKULL VLT FX-BRF COMA 80435 CL SKUL/OTH FX-DEEP COMA
80003 CL SKULL VLT FX-MOD COMA 80436 CL SKL W OTH FX-COMA NOS
80004 CL SKL VLT FX-PROLN COMA 80439 CL SKUL W OTH FX-CONCUSS
80005 CL SKUL VLT FX-DEEP COMA 80440 CL SKL/OTH FX/BR INJ NEC
80006 CL SKULL VLT FX-COMA NOS 80441 CL SKL W OTH FX W/O COMA
80009 CL SKL VLT FX-CONCUS NOS 80442 CL SKL W OTH FX-BRF COMA
80010 CL SKL VLT FX/CEREBR LAC 80443 CL SKL W OTH FX-MOD COMA
80011 CL SKULL VLT FX W/O COMA 80444 CL SKL/OTH FX-PROLN COMA
80012 CL SKULL VLT FX-BRF COMA 80445 CL SKUL/OTH FX-DEEP COMA
80013 CL SKULL VLT FX-MOD COMA 80446 CL SKL W OTH FX-COMA NOS
80014 CL SKL VLT FX-PROLN COMA 80449 CL SKUL W OTH FX-CONCUSS
80015 CL SKUL VLT FX-DEEP COMA 80450 OPN SKULL FX/OTH BONE FX
80016 CL SKULL VLT FX-COMA NOS 80451 OPN SKUL/OTH FX W/O COMA
80019 CL SKL VLT FX-CONCUS NOS 80452 OPN SKUL/OTH FX-BRF COMA
80020 CL SKL VLT FX/MENING HEM 80453 OPN SKUL/OTH FX-MOD COMA
80021 CL SKULL VLT FX W/O COMA 80454 OPN SKL/OTH FX-PROL COMA
80022 CL SKULL VLT FX-BRF COMA 80455 OPN SKL/OTH FX-DEEP COMA
80023 CL SKULL VLT FX-MOD COMA 80456 OPN SKUL/OTH FX-COMA NOS
80024 CL SKL VLT FX-PROLN COMA 80459 OPN SKULL/OTH FX-CONCUSS
80025 CL SKUL VLT FX-DEEP COMA 80460 OPN SKL/OTH FX/CEREB LAC
80026 CL SKULL VLT FX-COMA NOS 80461 OPN SKUL/OTH FX W/O COMA
80029 CL SKL VLT FX-CONCUS NOS 80462 OPN SKUL/OTH FX-BRF COMA
80030 CL SKULL VLT FX/HEM NEC 80463 OPN SKUL/OTH FX-MOD COMA
80031 CL SKULL VLT FX W/O COMA 80464 OPN SKL/OTH FX-PROL COMA
80032 CL SKULL VLT FX-BRF COMA 80465 OPN SKL/OTH FX-DEEP COMA
80033 CL SKULL VLT FX-MOD COMA 80466 OPN SKUL/OTH FX-COMA NOS
80034 CL SKL VLT FX-PROLN COMA 80469 OPN SKULL/OTH FX-CONCUSS
80035 CL SKUL VLT FX-DEEP COMA 80470 OPN SKL/OTH FX/MENIN HEM
80036 CL SKULL VLT FX-COMA NOS 80471 OPN SKUL/OTH FX W/O COMA
80039 CL SKL VLT FX-CONCUS NOS 80472 OPN SKUL/OTH FX-BRF COMA
80040 CL SKL VLT FX/BR INJ NEC 80473 OPN SKUL/OTH FX-MOD COMA
80041 CL SKULL VLT FX W/O COMA 80474 OPN SKL/OTH FX-PROL COMA
80042 CL SKULL VLT FX-BRF COMA 80475 OPN SKL/OTH FX-DEEP COMA
80043 CL SKULL VLT FX-MOD COMA 80476 OPN SKUL/OTH FX-COMA NOS

Version 2.1 A-15 Revision 3 (July 21, 2004)
Craniotomy Mortality Rate (IQI 13)
80044 CL SKL VLT FX-PROLN COMA 80479 OPN SKULL/OTH FX-CONCUSS
80045 CL SKUL VLT FX-DEEP COMA 80480 OPN SKL W OTH FX/HEM NEC
80046 CL SKULL VLT FX-COMA NOS 80481 OPN SKUL/OTH FX W/O COMA
80049 CL SKL VLT FX-CONCUS NOS 80482 OPN SKUL/OTH FX-BRF COMA
80050 OPN SKULL VAULT FRACTURE 80483 OPN SKUL/OTH FX-MOD COMA
80051 OPN SKUL VLT FX W/O COMA 80484 OPN SKL/OTH FX-PROL COMA
80052 OPN SKUL VLT FX-BRF COMA 80485 OPN SKL/OTH FX-DEEP COMA
80053 OPN SKUL VLT FX-MOD COMA 80486 OPN SKUL/OTH FX-COMA NOS
80054 OPN SKL VLT FX-PROLN COM 80489 OPN SKULL/OTH FX-CONCUSS
80055 OPN SKL VLT FX-DEEP COMA 80490 OP SKL/OTH FX/BR INJ NEC
80056 OPN SKUL VLT FX-COMA NOS 80491 OPN SKUL/OTH FX W/O COMA
80059 OP SKL VLT FX-CONCUS NOS 80492 OPN SKUL/OTH FX-BRF COMA
80060 OPN SKL VLT FX/CEREB LAC 80493 OPN SKUL/OTH FX-MOD COMA
80061 OPN SKUL VLT FX W/O COMA 80494 OPN SKL/OTH FX-PROL COMA
80062 OPN SKUL VLT FX-BRF COMA 80495 OPN SKL/OTH FX-DEEP COMA
80063 OPN SKUL VLT FX-MOD COMA 80496 OPN SKUL/OTH FX-COMA NOS
80064 OPN SKL VLT FX-PROLN COM 80499 OPN SKULL/OTH FX-CONCUSS
80065 OPN SKL VLT FX-DEEP COMA 80500 FX CERVICAL VERT NOS-CL
80066 OPN SKUL VLT FX-COMA NOS 80501 FX C1 VERTEBRA-CLOSED
80069 OP SKL VLT FX-CONCUS NOS 80502 FX C2 VERTEBRA-CLOSED
80070 OPN SKL VLT FX/MENIN HEM 80503 FX C3 VERTEBRA-CLOSED
80071 OPN SKUL VLT FX W/O COMA 80504 FX C4 VERTEBRA-CLOSED
80072 OPN SKUL VLT FX-BRF COMA 80505 FX C5 VERTEBRA-CLOSED
80073 OPN SKUL VLT FX-MOD COMA 80506 FX C6 VERTEBRA-CLOSED
80074 OPN SKL VLT FX-PROLN COM 80507 FX C7 VERTEBRA-CLOSED
80075 OPN SKL VLT FX-DEEP COMA 80508 FX MULT CERVICAL VERT-CL
80076 OPN SKUL VLT FX-COMA NOS 80510 FX CERVICAL VERT NOS-OPN
80079 OP SKL VLT FX-CONCUS NOS 80511 FX C1 VERTEBRA-OPEN
80080 OPN SKULL VLT FX/HEM NEC 80512 FX C2 VERTEBRA-OPEN
80081 OPN SKUL VLT FX W/O COMA 80513 FX C3 VERTEBRA-OPEN
80082 OPN SKUL VLT FX-BRF COMA 80514 FX C4 VERTEBRA-OPEN
80083 OPN SKUL VLT FX-MOD COMA 80515 FX C5 VERTEBRA-OPEN
80084 OPN SKL VLT FX-PROLN COM 80516 FX C6 VERTEBRA-OPEN
80085 OPN SKL VLT FX-DEEP COMA 80517 FX C7 VERTEBRA-OPEN
80086 OPN SKUL VLT FX-COMA NOS 80518 FX MLT CERVICAL VERT-OPN
80089 OP SKL VLT FX-CONCUS NOS 80600 C1-C4 FX-CL/CORD INJ NOS
80090 OP SKL VLT FX/BR INJ NEC 80601 C1-C4 FX-CL/COM CORD LES
80091 OPN SKUL VLT FX W/O COMA 80602 C1-C4 FX-CL/ANT CORD SYN
80092 OPN SKUL VLT FX-BRF COMA 80603 C1-C4 FX-CL/CEN CORD SYN
80093 OPN SKUL VLT FX-MOD COMA 80604 C1-C4 FX-CL/CORD INJ NEC
80094 OPN SKL VLT FX-PROLN COM 80605 C5-C7 FX-CL/CORD INJ NOS
80095 OP SKUL VLT FX-DEEP COMA 80606 C5-C7 FX-CL/COM CORD LES
80096 OPN SKUL VLT FX-COMA NOS 80607 C5-C7 FX-CL/ANT CORD SYN
80099 OP SKL VLT FX-CONCUS NOS 80608 C5-C7 FX-CL/CEN CORD SYN
80100 CLOS SKULL BASE FRACTURE 80609 C5-C7 FX-CL/CORD INJ NEC
80101 CL SKUL BASE FX W/O COMA 80610 C1-C4 FX-OP/CORD INJ NOS
80102 CL SKUL BASE FX-BRF COMA 80611 C1-C4 FX-OP/COM CORD LES
80103 CL SKUL BASE FX-MOD COMA 80612 C1-C4 FX-OP/ANT CORD SYN
80104 CL SKL BASE FX-PROL COMA 80613 C1-C4 FX-OP/CEN CORD SYN
80105 CL SKL BASE FX-DEEP COMA 80614 C1-C4 FX-OP/CORD INJ NEC
80106 CL SKUL BASE FX-COMA NOS 80615 C5-C7 FX-OP/CORD INJ NOS
80109 CL SKULL BASE FX-CONCUSS 80616 C5-C7 FX-OP/COM CORD LES
80110 CL SKL BASE FX/CEREB LAC 80617 C5-C7 FX-OP/ANT CORD SYN

Version 2.1 A-16 Revision 3 (July 21, 2004)
Craniotomy Mortality Rate (IQI 13)
80111 CL SKUL BASE FX W/O COMA 80618 C5-C7 FX-OP/CEN CORD SYN
80112 CL SKUL BASE FX-BRF COMA 80619 C5-C7 FX-OP/CORD INJ NEC
80113 CL SKUL BASE FX-MOD COMA 8500 CONCUSSION W/O COMA
80114 CL SKL BASE FX-PROL COMA 8501 CONCUSSION-BRIEF COMA
80115 CL SKL BASE FX-DEEP COMA 85011 CONCUS-BRIEF COMA <31 MN
80116 CL SKUL BASE FX-COMA NOS 85012 CONCUS-BRF COMA 31-59 MN
80119 CL SKULL BASE FX-CONCUSS 8502 CONCUSSION-MODERATE COMA
80120 CL SKL BASE FX/MENIN HEM 8503 CONCUSSION-PROLONG COMA
80121 CL SKUL BASE FX W/O COMA 8504 CONCUSSION-DEEP COMA
80122 CL SKUL BASE FX/BRF COMA 8505 CONCUSSION W COMA NOS
80123 CL SKUL BASE FX-MOD COMA 8509 CONCUSSION NOS
80124 CL SKL BASE FX-PROL COMA 85100 CEREBRAL CORTX CONTUSION
80125 CL SKL BASE FX-DEEP COMA 85101 CORTEX CONTUSION-NO COMA
80126 CL SKUL BASE FX-COMA NOS 85102 CORTEX CONTUS-BRIEF COMA
80129 CL SKULL BASE FX-CONCUSS 85103 CORTEX CONTUS-MOD COMA
80130 CL SKULL BASE FX/HEM NEC 85104 CORTX CONTUS-PROLNG COMA
80131 CL SKUL BASE FX W/O COMA 85105 CORTEX CONTUS-DEEP COMA
80132 CL SKUL BASE FX-BRF COMA 85106 CORTEX CONTUS-COMA NOS
80133 CL SKUL BASE FX-MOD COMA 85109 CORTEX CONTUS-CONCUS NOS
80134 CL SKL BASE FX-PROL COMA 85110 CORTEX CONTUSION/OPN WND
80135 CL SKL BASE FX-DEEP COMA 85111 OPN CORTX CONTUS-NO COMA
80136 CL SKUL BASE FX-COMA NOS 85112 OPN CORT CONTUS-BRF COMA
80139 CL SKULL BASE FX-CONCUSS 85113 OPN CORT CONTUS-MOD COMA
80140 CL SK BASE FX/BR INJ NEC 85114 OPN CORT CONTU-PROL COMA
80141 CL SKUL BASE FX W/O COMA 85115 OPN CORT CONTU-DEEP COMA
80142 CL SKUL BASE FX-BRF COMA 85116 OPN CORT CONTUS-COMA NOS
80143 CL SKUL BASE FX-MOD COMA 85119 OPN CORTX CONTUS-CONCUSS
80144 CL SKL BASE FX-PROL COMA 85120 CEREBRAL CORTEX LACERAT
80145 CL SKL BASE FX-DEEP COMA 85121 CORTEX LACERAT W/O COMA
80146 CL SKUL BASE FX-COMA NOS 85122 CORTEX LACERA-BRIEF COMA
80149 CL SKULL BASE FX-CONCUSS 85123 CORTEX LACERAT-MOD COMA
80150 OPEN SKULL BASE FRACTURE 85124 CORTEX LACERAT-PROL COMA
80151 OPN SKL BASE FX W/O COMA 85125 CORTEX LACERAT-DEEP COMA
80152 OPN SKL BASE FX-BRF COMA 85126 CORTEX LACERAT-COMA NOS
80153 OPN SKL BASE FX-MOD COMA 85129 CORTEX LACERAT-CONCUSS
80154 OP SKL BASE FX-PROL COMA 85130 CORTEX LACER W OPN WOUND
80155 OP SKL BASE FX-DEEP COMA 85131 OPN CORTEX LACER-NO COMA
80156 OPN SKL BASE FX-COMA NOS 85132 OPN CORTX LAC-BRIEF COMA
80159 OPN SKUL BASE FX-CONCUSS 85133 OPN CORTX LACER-MOD COMA
80160 OP SKL BASE FX/CEREB LAC 85134 OPN CORTX LAC-PROLN COMA
80161 OPN SKL BASE FX W/O COMA 85135 OPN CORTEX LAC-DEEP COMA
80162 OPN SKL BASE FX-BRF COMA 85136 OPN CORTX LACER-COMA NOS
80163 OPN SKL BASE FX-MOD COMA 85139 OPN CORTX LACER-CONCUSS
80164 OP SKL BASE FX-PROL COMA 85140 CEREBEL/BRAIN STM CONTUS
80165 OP SKL BASE FX-DEEP COMA 85141 CEREBELL CONTUS W/O COMA
80166 OPN SKL BASE FX-COMA NOS 85142 CEREBELL CONTUS-BRF COMA
80169 OPN SKUL BASE FX-CONCUSS 85143 CEREBELL CONTUS-MOD COMA
80170 OP SKL BASE FX/MENIN HEM 85144 CEREBEL CONTUS-PROL COMA
80171 OPN SKL BASE FX W/O COMA 85145 CEREBEL CONTUS-DEEP COMA
80172 OPN SKL BASE FX-BRF COMA 85146 CEREBELL CONTUS-COMA NOS
80173 OPN SKL BASE FX-MOD COMA 85149 CEREBELL CONTUS-CONCUSS
80174 OP SKL BASE FX-PROL COMA 85150 CEREBEL CONTUS W OPN WND
80175 OP SKL BASE FX-DEEP COMA 85151 OPN CEREBE CONT W/O COMA

Version 2.1 A-17 Revision 3 (July 21, 2004)
Craniotomy Mortality Rate (IQI 13)
80176 OPN SKL BASE FX-COMA NOS 85152 OPN CEREBE CONT-BRF COMA
80179 OPN SKUL BASE FX-CONCUSS 85153 OPN CEREBE CONT-MOD COMA
80180 OPN SKUL BASE FX/HEM NEC 85154 OPN CEREBE CONT-PROL COM
80181 OPN SKL BASE FX W/O COMA 85155 OPN CEREBE CONT-DEEP COM
80182 OPN SKL BASE FX-BRF COMA 85156 OPN CEREBE CONT-COMA NOS
80183 OPN SKL BASE FX-MOD COMA 85159 OPN CEREBEL CONT-CONCUSS
80184 OP SKL BASE FX-PROL COMA 85160 CEREBEL/BRAIN STEM LACER
80185 OP SKL BASE FX-DEEP COMA 85161 CEREBEL LACERAT W/O COMA
80186 OPN SKL BASE FX-COMA NOS 85162 CEREBEL LACER-BRIEF COMA
80189 OPN SKUL BASE FX-CONCUSS 85163 CEREBEL LACERAT-MOD COMA
80190 OP SK BASE FX/BR INJ NEC 85164 CEREBEL LACER-PROLN COMA
80191 OP SKUL BASE FX W/O COMA 85165 CEREBELL LACER-DEEP COMA
80192 OPN SKL BASE FX-BRF COMA 85166 CEREBEL LACERAT-COMA NOS
80193 OPN SKL BASE FX-MOD COMA 85169 CEREBEL LACER-CONCUSSION
80194 OP SKL BASE FX-PROL COMA 85170 CEREBEL LACER W OPEN WND
80195 OP SKL BASE FX-DEEP COMA 85171 OPN CEREBEL LAC W/O COMA
80196 OPN SKL BASE FX-COMA NOS 85172 OPN CEREBEL LAC-BRF COMA
80199 OPN SKUL BASE FX-CONCUSS 85173 OPN CEREBEL LAC-MOD COMA
8020 NASAL BONE FX-CLOSED 85174 OPN CEREBE LAC-PROL COMA
8021 NASAL BONE FX-OPEN 85175 OPN CEREBE LAC-DEEP COMA
80220 MANDIBLE FX NOS-CLOSED 85176 OPN CEREBEL LAC-COMA NOS
80221 FX CONDYL PROC MANDIB-CL 85179 OPN CEREBELL LAC-CONCUSS
80222 SUBCONDYLAR FX MANDIB-CL 85180 BRAIN LACERATION NEC
80223 FX CORON PROC MANDIB-CL 85181 BRAIN LACER NEC W/O COMA
80224 FX RAMUS NOS-CLOSED 85182 BRAIN LAC NEC-BRIEF COMA
80225 FX ANGLE OF JAW-CLOSED 85183 BRAIN LACER NEC-MOD COMA
80226 FX SYMPHY MANDIB BODY-CL 85184 BRAIN LAC NEC-PROLN COMA
80227 FX ALVEOLAR BORD MAND-CL 85185 BRAIN LAC NEC-DEEP COMA
80228 FX MANDIBLE BODY NEC-CL 85186 BRAIN LACER NEC-COMA NOS
80229 MULT FX MANDIBLE-CLOSED 85189 BRAIN LACER NEC-CONCUSS
80230 MANDIBLE FX NOS-OPEN 85190 BRAIN LAC NEC W OPEN WND
80231 FX CONDYL PROC MAND-OPEN 85191 OPN BRAIN LACER W/O COMA
80232 SUBCONDYL FX MANDIB-OPEN 85192 OPN BRAIN LAC-BRIEF COMA
80233 FX CORON PROC MANDIB-OPN 85193 OPN BRAIN LACER-MOD COMA
80234 FX RAMUS NOS-OPEN 85194 OPN BRAIN LAC-PROLN COMA
80235 FX ANGLE OF JAW-OPEN 85195 OPEN BRAIN LAC-DEEP COMA
80236 FX SYMPHY MANDIB BDY-OPN 85196 OPN BRAIN LACER-COMA NOS
80237 FX ALV BORD MAND BDY-OPN 85199 OPEN BRAIN LACER-CONCUSS
80238 FX MANDIBLE BODY NEC-OPN 85200 TRAUM SUBARACHNOID HEM
80239 MULT FX MANDIBLE-OPEN 85201 SUBARACHNOID HEM-NO COMA
8024 FX MALAR/MAXILLARY-CLOSE 85202 SUBARACH HEM-BRIEF COMA
8025 FX MALAR/MAXILLARY-OPEN 85203 SUBARACH HEM-MOD COMA
8026 FX ORBITAL FLOOR-CLOSED 85204 SUBARACH HEM-PROLNG COMA
8027 FX ORBITAL FLOOR-OPEN 85205 SUBARACH HEM-DEEP COMA
8028 FX FACIAL BONE NEC-CLOSE 85206 SUBARACH HEM-COMA NOS
8029 FX FACIAL BONE NEC-OPEN 85209 SUBARACH HEM-CONCUSSION
80300 CLOSE SKULL FRACTURE NEC 85210 SUBARACH HEM W OPN WOUND
80301 CL SKULL FX NEC W/O COMA 85211 OPN SUBARACH HEM-NO COMA
80302 CL SKULL FX NEC-BRF COMA 85212 OP SUBARACH HEM-BRF COMA
80303 CL SKULL FX NEC-MOD COMA 85213 OP SUBARACH HEM-MOD COMA
80304 CL SKL FX NEC-PROLN COMA 85214 OP SUBARACH HEM-PROL COM
80305 CL SKUL FX NEC-DEEP COMA 85215 OP SUBARACH HEM-DEEP COM
80306 CL SKULL FX NEC-COMA NOS 85216 OP SUBARACH HEM-COMA NOS

Version 2.1 A-18 Revision 3 (July 21, 2004)
Craniotomy Mortality Rate (IQI 13)
80309 CL SKULL FX NEC-CONCUSS 85219 OPN SUBARACH HEM-CONCUSS
80310 CL SKL FX NEC/CEREBR LAC 85220 TRAUMATIC SUBDURAL HEM
80311 CL SKULL FX NEC W/O COMA 85221 SUBDURAL HEM W/O COMA
80312 CL SKULL FX NEC-BRF COMA 85222 SUBDURAL HEM-BRIEF COMA
80313 CL SKULL FX NEC-MOD COMA 85223 SUBDURAL HEMORR-MOD COMA
80314 CL SKL FX NEC-PROLN COMA 85224 SUBDURAL HEM-PROLNG COMA
80315 CL SKUL FX NEC-DEEP COMA 85225 SUBDURAL HEM-DEEP COMA
80316 CL SKULL FX NEC-COMA NOS 85226 SUBDURAL HEMORR-COMA NOS
80319 CL SKULL FX NEC-CONCUSS 85229 SUBDURAL HEM-CONCUSSION
80320 CL SKL FX NEC/MENING HEM 85230 SUBDURAL HEM W OPN WOUND
80321 CL SKULL FX NEC W/O COMA 85231 OPEN SUBDUR HEM W/O COMA
80322 CL SKULL FX NEC-BRF COMA 85232 OPN SUBDUR HEM-BRF COMA
80323 CL SKULL FX NEC-MOD COMA 85233 OPN SUBDUR HEM-MOD COMA
80324 CL SKL FX NEC-PROLN COMA 85234 OPN SUBDUR HEM-PROL COMA
80325 CL SKUL FX NEC-DEEP COMA 85235 OPN SUBDUR HEM-DEEP COMA
80326 CL SKULL FX NEC-COMA NOS 85236 OPN SUBDUR HEM-COMA NOS
80329 CL SKULL FX NEC-CONCUSS 85239 OPN SUBDUR HEM-CONCUSS
80330 CL SKULL FX NEC/HEM NEC 85240 TRAUMATIC EXTRADURAL HEM
80331 CL SKULL FX NEC W/O COMA 85241 EXTRADURAL HEM W/O COMA
80332 CL SKULL FX NEC-BRF COMA 85242 EXTRADUR HEM-BRIEF COMA
80333 CL SKULL FX NEC-MOD COMA 85243 EXTRADURAL HEM-MOD COMA
80334 CL SKL FX NEC-PROLN COMA 85244 EXTRADUR HEM-PROLN COMA
80335 CL SKUL FX NEC-DEEP COMA 85245 EXTRADURAL HEM-DEEP COMA
80336 CL SKULL FX NEC-COMA NOS 85246 EXTRADURAL HEM-COMA NOS
80339 CL SKULL FX NEC-CONCUSS 85249 EXTADURAL HEM-CONCUSS
80340 CL SKL FX NEC/BR INJ NEC 85250 EXTRADURAL HEM W OPN WND
80341 CL SKULL FX NEC W/O COMA 85251 EXTRADURAL HEMOR-NO COMA
80342 CL SKULL FX NEC-BRF COMA 85252 EXTRADUR HEM-BRIEF COMA
80343 CL SKULL FX NEC-MOD COMA 85253 EXTRADURAL HEM-MOD COMA
80344 CL SKL FX NEC-PROLN COMA 85254 EXTRADUR HEM-PROLN COMA
80345 CL SKUL FX NEC-DEEP COMA 85255 EXTRADUR HEM-DEEP COMA
80346 CL SKULL FX NEC-COMA NOS 85256 EXTRADURAL HEM-COMA NOS
80349 CL SKULL FX NEC-CONCUSS 85259 EXTRADURAL HEM-CONCUSS
80350 OPEN SKULL FRACTURE NEC 85300 TRAUMATIC BRAIN HEM NEC
80351 OPN SKUL FX NEC W/O COMA 85301 BRAIN HEM NEC W/O COMA
80352 OPN SKUL FX NEC-BRF COMA 85302 BRAIN HEM NEC-BRIEF COMA
80353 OPN SKUL FX NEC-MOD COMA 85303 BRAIN HEM NEC-MOD COMA
80354 OPN SKL FX NEC-PROL COMA 85304 BRAIN HEM NEC-PROLN COMA
80355 OPN SKL FX NEC-DEEP COMA 85305 BRAIN HEM NEC-DEEP COMA
80356 OPN SKUL FX NEC-COMA NOS 85306 BRAIN HEM NEC-COMA NOS
80359 OPN SKULL FX NEC-CONCUSS 85309 BRAIN HEM NEC-CONCUSSION
80360 OPN SKL FX NEC/CEREB LAC 85310 BRAIN HEM NEC W OPN WND
80361 OPN SKUL FX NEC W/O COMA 85311 BRAIN HEM OPN W/O COMA
80362 OPN SKUL FX NEC-BRF COMA 85312 BRAIN HEM OPN-BRF COMA
80363 OPN SKUL FX NEC-MOD COMA 85313 BRAIN HEM OPEN-MOD COMA
80364 OPN SKL FX NEC-PROLN COM 85314 BRAIN HEM OPN-PROLN COMA
80365 OPN SKL FX NEC-DEEP COMA 85315 BRAIN HEM OPEN-DEEP COMA
80366 OPN SKUL FX NEC-COMA NOS 85316 BRAIN HEM OPEN-COMA NOS
80369 OPN SKULL FX NEC-CONCUSS 85319 BRAIN HEM OPN-CONCUSSION
80370 OPN SKL FX NEC/MENIN HEM 85400 BRAIN INJURY NEC
80371 OPN SKUL FX NEC W/O COMA 85401 BRAIN INJURY NEC-NO COMA
80372 OPN SKUL FX NEC-BRF COMA 85402 BRAIN INJ NEC-BRIEF COMA
80373 OPN SKUL FX NEC-MOD COMA 85403 BRAIN INJ NEC-MOD COMA

Version 2.1 A-19 Revision 3 (July 21, 2004)
Craniotomy Mortality Rate (IQI 13)
80374 OPN SKL FX NEC-PROL COMA 85404 BRAIN INJ NEC-PROLN COMA
80375 OPN SKL FX NEC-DEEP COMA 85405 BRAIN INJ NEC-DEEP COMA
80376 OPN SKUL FX NEC-COMA NOS 85406 BRAIN INJ NEC-COMA NOS
80379 OPN SKULL FX NEC-CONCUSS 85409 BRAIN INJ NEC-CONCUSSION
80380 OPN SKULL FX NEC/HEM NEC 85410 BRAIN INJURY W OPN WND
80381 OPN SKUL FX NEC W/O COMA 85411 OPN BRAIN INJ W/O COMA
80382 OPN SKUL FX NEC-BRF COMA 85412 OPN BRAIN INJ-BRIEF COMA
80383 OPN SKUL FX NEC-MOD COMA 85413 OPN BRAIN INJ-MOD COMA
80384 OPN SKL FX NEC-PROL COMA 85414 OPN BRAIN INJ-PROLN COMA
80385 OPN SKL FX NEC-DEEP COMA 85415 OPN BRAIN INJ-DEEP COMA
80386 OPN SKUL FX NEC-COMA NOS 85416 OPEN BRAIN INJ-COMA NOS
80389 OPN SKULL FX NEC-CONCUSS 85419 OPN BRAIN INJ-CONCUSSION
80390 OP SKL FX NEC/BR INJ NEC 9500 OPTIC NERVE INJURY
80391 OPN SKUL FX NEC W/O COMA 9501 INJURY TO OPTIC CHIASM
80392 OPN SKUL FX NEC-BRF COMA 9502 INJURY TO OPTIC PATHWAYS
80393 OPN SKUL FX NEC-MOD COMA 9503 INJURY TO VISUAL CORTEX
80394 OPN SKL FX NEC-PROL COMA 9509 INJ OPTIC NERV/PATH NOS
80395 OPN SKL FX NEC-DEEP COMA 9510 INJURY OCULOMOTOR NERVE
80396 OPN SKUL FX NEC-COMA NOS 9511 INJURY TROCHLEAR NERVE
80399 OPN SKULL FX NEC-CONCUSS 9512 INJURY TRIGEMINAL NERVE
80400 CL SKUL FX W OTH BONE FX 9513 INJURY ABDUCENS NERVE
80401 CL SKL W OTH FX W/O COMA 9514 INJURY TO FACIAL NERVE
80402 CL SKL W OTH FX-BRF COMA 9515 INJURY TO ACOUSTIC NERVE
80403 CL SKL W OTH FX-MOD COMA 9516 INJURY ACCESSORY NERVE
80404 CL SKL/OTH FX-PROLN COMA 9517 INJURY HYPOGLOSSAL NERVE
80405 CL SKUL/OTH FX-DEEP COMA 9518 INJURY CRANIAL NERVE NEC
80406 CL SKL W OTH FX-COMA NOS 9519 INJURY CRANIAL NERVE NOS
80409 CL SKUL W OTH FX-CONCUSS 95200 C1-C4 SPIN CORD INJ NOS
80410 CL SK W OTH FX/CEREB LAC 95201 COMPLETE LES CORD/C1-C4
80411 CL SKL W OTH FX W/O COMA 95202 ANTERIOR CORD SYND/C1-C4
80412 CL SKL W OTH FX-BRF COMA 95203 CENTRAL CORD SYND/C1-C4
80413 CL SKL W OTH FX-MOD COMA 95204 C1-C4 SPIN CORD INJ NEC
80414 CL SKL/OTH FX-PROLN COMA 95205 C5-C7 SPIN CORD INJ NOS
80415 CL SKUL/OTH FX-DEEP COMA 95206 COMPLETE LES CORD/C5-C7
80416 CL SKL W OTH FX-COMA NOS 95207 ANTERIOR CORD SYND/C5-C7
80419 CL SKUL W OTH FX-CONCUSS 95208 CENTRAL CORD SYND/C5-C7
80420 CL SKL/OTH FX/MENING HEM 95209 C5-C7 SPIN CORD INJ NEC
80421 CL SKL W OTH FX W/O COMA 95210 T1-T6 SPIN CORD INJ NOS
80422 CL SKL W OTH FX-BRF COMA 95211 COMPLETE LES CORD/T1-T6
80423 CL SKL W OTH FX-MOD COMA 95212 ANTERIOR CORD SYND/T1-T6
80424 CL SKL/OTH FX-PROLN COMA 95213 CENTRAL CORD SYND/T1-T6
80425 CL SKUL/OTH FX-DEEP COMA 95214 T1-T6 SPIN CORD INJ NEC
80426 CL SKL W OTH FX-COMA NOS 95215 T7-T12 SPIN CORD INJ NOS
80429 CL SKUL W OTH FX-CONCUSS 95216 COMPLETE LES CORD/T7-T12
80430 CL SKUL W OTH FX/HEM NEC 95217 ANTERIOR CORD SYN/T7-T12
80431 CL SKL W OTH FX W/O COMA 95218 CENTRAL CORD SYN/T7-T12
80432 CL SKL W OTH FX-BRF COMA 95219 T7-T12 SPIN CORD INJ NEC

Version 2.1 A-20 Revision 3 (July 21, 2004)
HIP REPLACEMENT MORTALITY RATE (IQI 14)
Numerator:
Number of deaths (DISP = 20) with a code of partial or full hip replacement in any procedure field.
Denominator:
All discharges with a procedure code of partial or full hip replacement in any field. ICD-9-CM hip replacement procedure codes:
8151 TOTAL HIP REPLACEMENT 8152 PARTIAL HIP REPLACEMENT 8153 REVISE HIP REPLACEMENT
Include only discharges with uncomplicated cases: diagnosis codes for osteoarthrosis of hip in any field. ICD-9-CM osteoarthrosis diagnosis codes:
71500 GENL OSTEOARTHROSIS NOS 71595 OSTEOARTHROS NOS-PELVIS 71509 GENL OSTEOARTHROSIS MULT 71598 OSTEOARTHRO NOS-OTH SITE 71510 LOC PRIM OSTEOART-UNSPEC 71650 POLYARTHRITIS NOS-UNSPEC 71515 LOC PRIM OSTEOART-PELVIS 71655 POLYARTHRITIS NOS-PELVIS 71518 LOC PRIM OSTEOARTHR NEC 71658 POLYARTHRITIS NOS-OTH SITE 71520 LOC 2ND OSTEOARTH-UNSPEC 71659 POLYARTHRITIS NOS-MULT 71525 LOC 2ND OSTEOARTH-PELVIS 71660 MONOARTHRITIS NOS-UNSPEC 71528 LOC 2ND OSTEOARTHROS NEC 71665 MONOARTHRITIS NOS-PELVIS 71530 LOC OSTEOARTH NOS-UNSPEC 71668 MONOARTHRITIS NOS-OTH SITE 71535 LOC OSTEOARTH NOS-PELVIS 71690 ARTHROPATHY NOS-UNSPEC
71538 LOC OSTEOAR NOS-SITE NEC 71695 ARTHROPATHY NOS-PELVIS 71580 OSTEOARTHROSIS-MULT SITE 71698 ARTHROPATHY NOS-OTH SITE 71589 OSTEOARTHROSIS-MULT SITE 71699 ARTHROPATHY NOS-MULT 71590 OSTEOARTHROS NOS-UNSPEC
Exclude:
Patients with missing discharge disposition (DISP = missing), transferring to another short-term hospital (DISP = 2), MDC 14 (pregnancy, childbirth, and puerperium), and MDC 15 (newborns and other neonates).
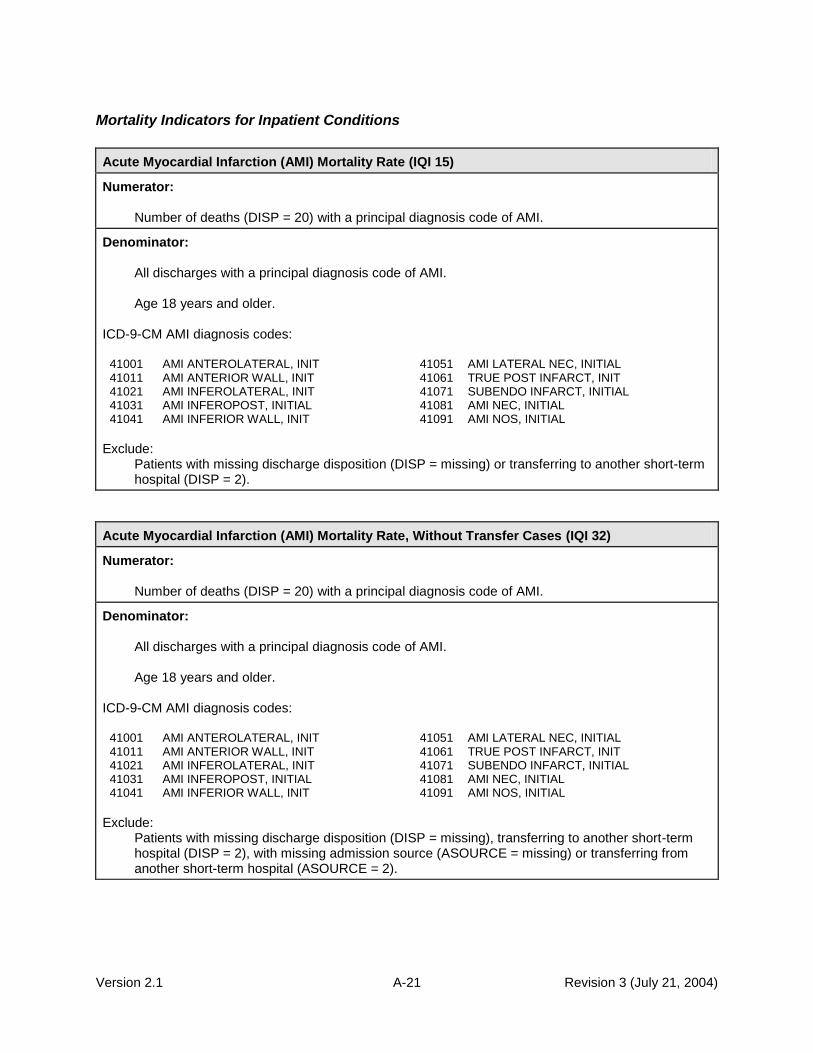
Version 2.1 A-21 Revision 3 (July 21, 2004)
Mortality Indicators for Inpatient Conditions
Acute Myocardial Infarction (AMI) Mortality Rate (IQI 15)
Numerator:
Number of deaths (DISP = 20) with a principal diagnosis code of AMI.
Denominator:
All discharges with a principal diagnosis code of AMI. Age 18 years and older.
ICD-9-CM AMI diagnosis codes:
41001 AMI ANTEROLATERAL, INIT 41051 AMI LATERAL NEC, INITIAL 41011 AMI ANTERIOR WALL, INIT 41061 TRUE POST INFARCT, INIT 41021 AMI INFEROLATERAL, INIT 41071 SUBENDO INFARCT, INITIAL 41031 AMI INFEROPOST, INITIAL 41081 AMI NEC, INITIAL 41041 AMI INFERIOR WALL, INIT 41091 AMI NOS, INITIAL
Exclude:
Patients with missing discharge disposition (DISP = missing) or transferring to another short-term hospital (DISP = 2).
Acute Myocardial Infarction (AMI) Mortality Rate, Without Transfer Cases (IQI 32)
Numerator:
Number of deaths (DISP = 20) with a principal diagnosis code of AMI.
Denominator:
All discharges with a principal diagnosis code of AMI. Age 18 years and older.
ICD-9-CM AMI diagnosis codes:
41001 AMI ANTEROLATERAL, INIT 41051 AMI LATERAL NEC, INITIAL 41011 AMI ANTERIOR WALL, INIT 41061 TRUE POST INFARCT, INIT 41021 AMI INFEROLATERAL, INIT 41071 SUBENDO INFARCT, INITIAL 41031 AMI INFEROPOST, INITIAL 41081 AMI NEC, INITIAL 41041 AMI INFERIOR WALL, INIT 41091 AMI NOS, INITIAL
Exclude:
Patients with missing discharge disposition (DISP = missing), transferring to another short-term hospital (DISP = 2), with missing admission source (ASOURCE = missing) or transferring from another short-term hospital (ASOURCE = 2).

Version 2.1 A-22 Revision 3 (July 21, 2004)
Congestive Heart Failure (CHF) Mortality Rate (IQI 16)
Numerator:
Number of deaths (DISP = 20) with a principal diagnosis code of CHF.
Denominator:
All discharges with principal diagnosis code of CHF.
Age 18 years and older.
ICD-9-CM CHF diagnosis codes:
39891 RHEUMATIC HEART FAILURE 42821 AC SYSTOLIC HRT FAILURE OCT02- 40201 MAL HYPERT HRT DIS W CHF 42822 CHR SYSTOLIC HRT FAILURE OCT02- 40211 BENIGN HYP HRT DIS W CHF 42823 AC ON CHR SYST HRT FAIL OCT02- 40291 HYPERTEN HEART DIS W CHF 4289 HEART FAILURE NOS 40401 MAL HYPER HRT/REN W CHF 42830 DIASTOLIC HRT FAILURE NOS OCT02- 40403 MAL HYP HRT/REN W CHF&RF 42831 AC DIASTOLIC HRT FAILURE OCT02- 40411 BEN HYPER HRT/REN W CHF 42832 CHR DIASTOLIC HRT FAIL OCT02- 40413 BEN HYP HRT/REN W CHF&RF 42833 AC ON CHR DIAST HRT FAIL OCT02- 40491 HYPER HRT/REN NOS W CHF 42840 SYST/DIAST HRT FAIL NOS OCT02- 40493 HYP HT/REN NOS W CHF&RF 42841 AC SYST/DIASTOL HRT FAIL OCT02- 4280 CONGESTIVE HEART FAILURE 42842 CHR SYST/DIASTL HRT FAIL OCT02- 4281 LEFT HEART FAILURE 42843 AC/CHR SYST/DIA HRT FAIL OCT02- 42820 SYSTOLIC HEART FAILURE NOS OCT02-
Exclude: Patients with missing discharge disposition (DISP = missing), transferring to another short-term hospital (DISP = 2), MDC 14 (pregnancy, childbirth, and puerperium), and MDC 15 (newborns and other neonates).
Acute Stroke Mortality Rate (IQI 17)
Numerator:
Number of deaths (DISP = 20) with a principal diagnosis code of stroke.
Denominator:
All discharges with principal diagnosis code for stroke Age 18 years and older.
ICD-9-CM stroke diagnosis codes:
430 SUBARACHNOID HEMORRHAGE 43331 MULT PRECER OCCL W/ INFRCT 431 INTRACEREBRAL HEMORRHAGE 43381 PRECER OCCL NEC W/ INFRCT 4320 NONTRAUM EXTRADURAL HEM 43391 PRECER OCCL NOS W/ INFRCT 4321 SUBDURAL HEMORRHAGE 43401 CERE THROMBOSIS W/ INFRCT 4329 INTRACRANIAL HEMORR NOS 43411 CERE EMBOLISM W/ INFRCT 43301 BASI ART OCCL W/ INFARCT 43491 CEREB OCCL NOS W/ INFRCT 43311 CAROTD OCCL W/ INFRCT 436 CVA 43321 VERTB ART OCCL W/ INFRCT
Exclude: Patients with missing discharge disposition (DISP = missing), transferring to another short-term hospital (DISP = 2), MDC 14 (pregnancy, childbirth, and puerperium), and MDC 15 (newborns and other neonates).

Version 2.1 A-23 Revision 3 (July 21, 2004)
Gastrointestinal Hemorrhage Mortality Rate (IQI 18)
Numerator:
Number of deaths (DISP = 20) with a principal diagnosis code of gastrointestinal hemorrhage.
Denominator:
All discharges with principal diagnosis code for gastrointestinal hemorrhage. Age 18 years and older.
ICD-9-CM gastrointestinal hemorrhage diagnosis codes:
4560 ESOPH VARICES W HEM 53400 AC MARGINAL ULCER W HEM
5307 GASTOESOPH LACER W HEM 53401 AC MARGIN ULC W HEM-OBST
53021 ULCER ESOPHAGUS W BLEED OCT03- 53420 AC MARGIN ULC W HEM/PERF
53082 ESOPHAGEAL HEMORRHAGE 53421 AC MARG ULC HEM/PERF-OBS
53100 AC STOMACH ULCER W HEM 53440 CHR MARGINAL ULCER W HEM
53101 AC STOMAC ULC W HEM-OBST 53441 CHR MARGIN ULC W HEM-OBS
53120 AC STOMAC ULC W HEM/PERF 53460 CHR MARGIN ULC HEM/PERF
53121 AC STOM ULC HEM/PERF-OBS 53461 CHR MARG ULC HEM/PERF-OB
53140 CHR STOMACH ULC W HEM 53501 ACUTE GASTRITIS W HMRHG
53141 CHR STOM ULC W HEM-OBSTR 53511 ATRPH GASTRITIS W HMRHG
53160 CHR STOMACH ULC HEM/PERF 53521 GSTR MCSL HYPRT W HMRG
53161 CHR STOM ULC HEM/PERF-OB 53531 ALCHL GSTRITIS W HMRHG
53200 AC DUODENAL ULCER W HEM 53541 OTH SPF GASTRT W HMRHG
53201 AC DUODEN ULC W HEM-OBST 53551 GSTR/DDNTS NOS W HMRHG
53220 AC DUODEN ULC W HEM/PERF 53561 DUODENITIS W HMRHG
53221 AC DUOD ULC HEM/PERF-OBS 53783 ANGIO STM/ DUDN W HMRHG
53240 CHR DUODEN ULCER W HEM 53784 DIEULAFOY LES,STOM&DUOD OCT02-
53241 CHR DUODEN ULC HEM-OBSTR 56202 DVRTCLO SML INT W HMRHG
53260 CHR DUODEN ULC HEM/PERF 56203 DVRTCLI SML INT W HMRHG
53261 CHR DUOD ULC HEM/PERF-OB 56212 DVRTCLO COLON W HMRHG
53300 AC PEPTIC ULCER W HEMORR 56213 DVRTCLI COLON W HMRHG
53301 AC PEPTIC ULC W HEM-OBST 5693 RECTAL & ANAL HEMORRHAGE
53320 AC PEPTIC ULC W HEM/PERF 56985 ANGIO INTES W HMRHG
53321 AC PEPT ULC HEM/PERF-OBS 56986 DIEULAFOY LES, INTESTINE OCT02-
53340 CHR PEPTIC ULCER W HEM 5780 HEMATEMESIS
53341 CHR PEPTIC ULC W HEM-OBS 5781 BLOOD IN STOOL
53360 CHR PEPT ULC W HEM/PERF 5789 GASTROINTEST HEMORR NOS
53361 CHR PEPT ULC HEM/PERF-OB
Exclude:
Patients with missing discharge disposition (DISP = missing), transferring to another short-term hospital (DISP = 2), MDC 14 (pregnancy, childbirth, and puerperium), and MDC 15 (newborns and neonates).

Version 2.1 A-24 Revision 3 (July 21, 2004)
Hip Fracture Mortality Rate (IQI 19)
Numerator:
Number of deaths (DISP = 20) with a principal diagnosis code of hip fracture.
Denominator:
All discharges with principal diagnosis code for hip fracture. Age 18 years and older.
ICD-9-CM hip fracture diagnosis codes:
82000 FX FEMUR INTRCAPS NOS-CL 82019 FX FEMUR INTRCAP NEC-OPN 82001 FX UP FEMUR EPIPHY-CLOS 82020 TROCHANTERIC FX NOS-CLOS 82002 FX FEMUR, MIDCERVIC-CLOS 82021 INTERTROCHANTERIC FX-CL 82003 FX BASE FEMORAL NCK-CLOS 82022 SUBTROCHANTERIC FX-CLOSE 82009 FX FEMUR INTRCAPS NEC-CL 82030 TROCHANTERIC FX NOS-OPEN 82010 FX FEMUR INTRCAP NOS-OPN 82031 INTERTROCHANTERIC FX-OPN 82011 FX UP FEMUR EPIPHY-OPEN 82032 SUBTROCHANTERIC FX-OPEN 82012 FX FEMUR, MIDCERVIC-OPEN 8208 FX NECK OF FEMUR NOS-CL 82013 FX BASE FEMORAL NCK-OPEN 8209 FX NECK OF FEMUR NOS-OPN
Exclude:
Patients with missing discharge disposition (DISP = missing), transferring to another short-term hospital (DISP = 2), MDC 14 (pregnancy, childbirth, and puerperium), and MDC 15 (newborns and other neonates).
Pneumonia Mortality Rate (IQI 20)
Numerator:
Number of deaths (DISP = 20) with a principal diagnosis code of pneumonia.
Denominator:
All discharges with a principal diagnosis code of pneumonia, age 18 years and older. ICD-9-CM pneumonia diagnosis codes:
00322 SALMONELLA PNEUMONIA 4831 CHLAMYDIA PNEUMONIA OCT96-
0212 PULMONARY TULAREMIA 4838 OTH SPEC ORG PNEUMONIA
0391 PULMONARY ACTINOMYCOSIS 4841 PNEUM W CYTOMEG INCL DIS
0521 VARICELLA PNEUMONITIS 4843 PNEUMONIA IN WHOOP COUGH
0551 POSTMEASLES PNEUMONIA 4845 PNEUMONIA IN ANTHRAX
0730 ORNITHOSIS PNEUMONIA 4846 PNEUM IN ASPERGILLOSIS
1124 CANDIDIASIS OF LUNG 4847 PNEUM IN OTH SYS MYCOSES
1140 PRIMARY COCCIDIOIDOMYCOS 4848 PNEUM IN INFECT DIS NEC
1144 CHRONIC PULMONCOCCIDIOIDOMYCOSIS 485 BRONCOPNEUMONIA ORG NOS
1145 UNSPEC PULMON COCCIDIOIDOMYCOSIS 486 PNEUMONIA, ORGANISM NOS
11505 HISTOPLASM CAPS PNEUMON 48230 STREP PNEUMONIA UNSPEC
11515 HISTOPLASM DUB PNEUMONIA 48231 GRP A STREP PNEUMONIA
11595 HISTOPLASMOSIS PNEUMONIA 48232 GRP B STREP PNEUMONIA
1304 TOXOPLASMA PNEUMONITIS 48239 OTH STREP PNEUMONIA
1363 PNEUMOCYSTOSIS 48240 STAPH PNEUMONIA UNSP OCT98-
4800 ADENOVIRAL PNEUMONIA 48241 STAPH AUREUS PNEUMON OCT98-

Version 2.1 A-25 Revision 3 (July 21, 2004)
Pneumonia Mortality Rate (IQI 20)
4801 RESP SYNCYT VIRAL PNEUM 48249 STAPH PNEUMON OTH OCT98-
4802 PARINFLUENZA VIRAL PNEUM 48281 ANAEROBIC PNEUMONIA
4803 PNEUMONIA DUE TO SARS OCT03- 48282 E COLI PNEUMONIA
4808 VIRAL PNEUMONIA NEC 48283 OTH GRAM NEG PNEUMONIA
4809 VIRAL PNEUMONIA NOS 48284 LEGIONNAIRES DX OCT97-
481 PNEUMOCOCCAL PNEUMONIA 48289 BACT PNEUMONIA NEC
4820 K. PNEUMONIAE PNEUMONIA 5070 FOOD/VOMIT PNEUMONITIS
4821 PSEUDOMONAL PNEUMONIA 5100 EMPYEMA WITH FISTULA
4822 H.INFLUENZAE PNEUMONIA 5109 EMPYEMA W/O FISTULA
4824 STAPHYLOCOCCAL PNEUMONIA 5110 PLEURISY W/O EFFUS OR TB
4829 BACTERIAL PNEUMONIA NOS 5130 ABSCESS OF LUNG 4830 MYCOPLASMA PNEUMONIA
Exclude: Patients with missing discharge disposition (DISP = missing), transferring to another short-term hospital (DISP = 2), MDC 14 (pregnancy, childbirth, and puerperium), and MDC 15 (newborns and other neonates).
Procedure Utilization Indicators
Cesarean Delivery Rate (IQI 21)
Numerator:
Number of Cesarean deliveries, identified by DRG, or by ICD-9-CM procedure codes if they are reported without a 7491 hysterotomy procedure.
Cesarean delivery DRGs:
370 CESAREAN SECTION W CC 371 CESAREAN SECTION W/O CC
ICD-9-CM Cesarean delivery procedure codes:
740 CLASSICAL C-SECTION 744 CESAREAN SECTION NEC 741 LOW CERVICAL C-SECTION 7499 CESAREAN SECTION NOS 742 EXTRAPERITONEAL C-SECT
Exclude:
ICD-9-CM procedure codes:
7491 HYSTEROTOMY TO TERMIN PG
Denominator:
All deliveries. All delivery DRGs:
370 CESAREAN SECTION W CC 373 VAG DELIVERY W/O COMPL 371 CESAREAN SECTION W/O CC 374 VAG DELIV W STERIL OR DC 372 VAGINAL DELIVERY W COMPL 375 VAG DELIV W OTH OR PROC

Version 2.1 A-26 Revision 3 (July 21, 2004)
Cesarean Delivery Rate (IQI 21)
Exclude: Patients with abnormal presentation, preterm, fetal death, multiple gestation diagnosis codes, and breech procedure codes.
ICD-9-CM abnormal presentation, preterm, fetal death and multiple gestation diagnosis codes:
65220 BREECH PRESENTAT-UNSPEC 65130 TWINS W FETAL LOSS-UNSP 65221 BREECH PRESENTAT-DELIVER 65131 TWINS W FETAL LOSS-DEL 65223 BREECH PRESENT-ANTEPART 65133 TWINS W FETAL LOSS-ANTE 66960 BREECH EXTR NOS-UNSPEC 65140 TRIPLETS W FET LOSS-UNSP 66961 BREECH EXTR NOS-DELIVER 65141 TRIPLETS W FET LOSS-DEL 65230 TRANSV/OBLIQ LIE-UNSPEC 65143 TRIPLETS W FET LOSS-ANTE 65231 TRANSVER/OBLIQ LIE-DELIV 65150 QUADS W FETAL LOSS-UNSP 65233 TRANSV/OBLIQ LIE-ANTEPAR 65151 QUADS W FETAL LOSS-DEL 65240 FACE/BROW PRESENT-UNSPEC 65153 QUADS W FETAL LOSS-ANTE 65241 FACE/BROW PRESENT-DELIV 65160 MULT GES W FET LOSS-UNSP 65243 FACE/BROW PRES-ANTEPART 65161 MULT GES W FET LOSS-DEL 64420 EARLY ONSET DELIV-UNSPEC 65163 MULT GES W FET LOSS-ANTE 64421 EARLY ONSET DELIVERY-DEL 65180 MULTI GESTAT NEC-UNSPEC 65640 INTRAUTERINE DEATH-UNSP 65181 MULTI GESTAT NEC-DELIVER 65641 INTRAUTER DEATH-DELIVER 65183 MULTI GEST NEC-ANTEPART 65643 INTRAUTER DEATH-ANTEPART 65190 MULTI GESTAT NOS-UNSPEC V271 DELIVER-SINGLE STILLBORN 65191 MULT GESTATION NOS-DELIV V273 DEL-TWINS, 1 NB, 1 SB 65193 MULTI GEST NOS-ANTEPART V274 DELIVER-TWINS, BOTH SB 65260 MULT GEST MALPRESEN-UNSP V276 DEL-MULT BRTH, SOME LIVE 65261 MULT GEST MALPRES-DELIV V277 DEL-MULT BIRTH, ALL SB 65263 MULT GES MALPRES-ANTEPAR 65100 TWIN PREGNANCY-UNSPEC 66050 LOCKED TWINS-UNSPECIFIED 65101 TWIN PREGNANCY-DELIVERED 66051 LOCKED TWINS-DELIVERED 65103 TWIN PREGNANCY-ANTEPART 66053 LOCKED TWINS-ANTEPARTUM 65110 TRIPLET PREGNANCY-UNSPEC 66230 DELAY DEL 2ND TWIN-UNSP 65111 TRIPLET PREGNANCY-DELIV 66231 DELAY DEL 2ND TWIN-DELIV 65113 TRIPLET PREG-ANTEPARTUM 66233 DELAY DEL 2 TWIN-ANTEPAR 65120 QUADRUPLET PREG-UNSPEC 7615 MULT PREGNANCY AFF NB 65121 QUADRUPLET PREG-DELIVER V272 DELIVER-TWINS, BOTH LIVE 65123 QUADRUPLET PREG-ANTEPART V275 DEL-MULT BIRTH, ALL LIVE
ICD-9-CM breech procedure codes:
7251 PART BRCH EXTRAC W FORCP 7253 TOT BRCH EXTRAC W FORCEP 7252 PART BREECH EXTRACT NEC 7254 TOT BREECH EXTRAC NEC

Version 2.1 A-27 Revision 3 (July 21, 2004)
Primary Cesarean Delivery Rate (IQI 33)
Numerator: Number of Cesarean deliveries, identified by DRG, or by ICD-9-CM procedure codes if they are reported without a 7491 hysterotomy procedure. Cesarean delivery DRGs:
370 CESAREAN SECTION W CC 371 CESAREAN SECTION W/O CC
ICD-9-CM Cesarean delivery procedure codes:
740 CLASSICAL C-SECTION 744 CESAREAN SECTION NEC
741 LOW CERVICAL C-SECTION 7499 CESAREAN SECTION NOS
742 EXTRAPERITONEAL C-SECT
Exclude: ICD-9-CM procedure codes:
7491 HYSTEROTOMY TO TERMIN PG
Denominator:
All deliveries. All delivery DRGs:
370 CESAREAN SECTION W CC 373 VAG DELIVERY W/O COMPL 371 CESAREAN SECTION W/O CC 374 VAG DELIV W STERIL OR DC 372 VAGINAL DELIVERY W COMPL 375 VAG DELIV W OTH OR PROC
Exclude:
Patients with abnormal presentation, preterm delivery, fetal death, multiple gestation diagnosis codes, breech procedure codes, or a previous Cesarean delivery diagnosis in any diagnosis field.
ICD-9-CM abnormal presentation, preterm, fetal death and multiple gestation diagnosis codes:
65220 BREECH PRESENTAT-UNSPEC 65130 TWINS W FETAL LOSS-UNSP
65221 BREECH PRESENTAT-DELIVER 65131 TWINS W FETAL LOSS-DEL
65223 BREECH PRESENT-ANTEPART 65133 TWINS W FETAL LOSS-ANTE
66960 BREECH EXTR NOS-UNSPEC 65140 TRIPLETS W FET LOSS-UNSP
66961 BREECH EXTR NOS-DELIVER 65141 TRIPLETS W FET LOSS-DEL
65230 TRANSV/OBLIQ LIE-UNSPEC 65143 TRIPLETS W FET LOSS-ANTE
65231 TRANSVER/OBLIQ LIE-DELIV 65150 QUADS W FETAL LOSS-UNSP
65233 TRANSV/OBLIQ LIE-ANTEPAR 65151 QUADS W FETAL LOSS-DEL
65240 FACE/BROW PRESENT-UNSPEC 65153 QUADS W FETAL LOSS-ANTE
65241 FACE/BROW PRESENT-DELIV 65160 MULT GES W FET LOSS-UNSP
65243 FACE/BROW PRES-ANTEPART 65161 MULT GES W FET LOSS-DEL
64420 EARLY ONSET DELIV-UNSPEC 65163 MULT GES W FET LOSS-ANTE
64421 EARLY ONSET DELIVERY-DEL 65180 MULTI GESTAT NEC-UNSPEC
65640 INTRAUTERINE DEATH-UNSP 65181 MULTI GESTAT NEC-DELIVER
65641 INTRAUTER DEATH-DELIVER 65183 MULTI GEST NEC-ANTEPART
65643 INTRAUTER DEATH-ANTEPART 65190 MULTI GESTAT NOS-UNSPEC
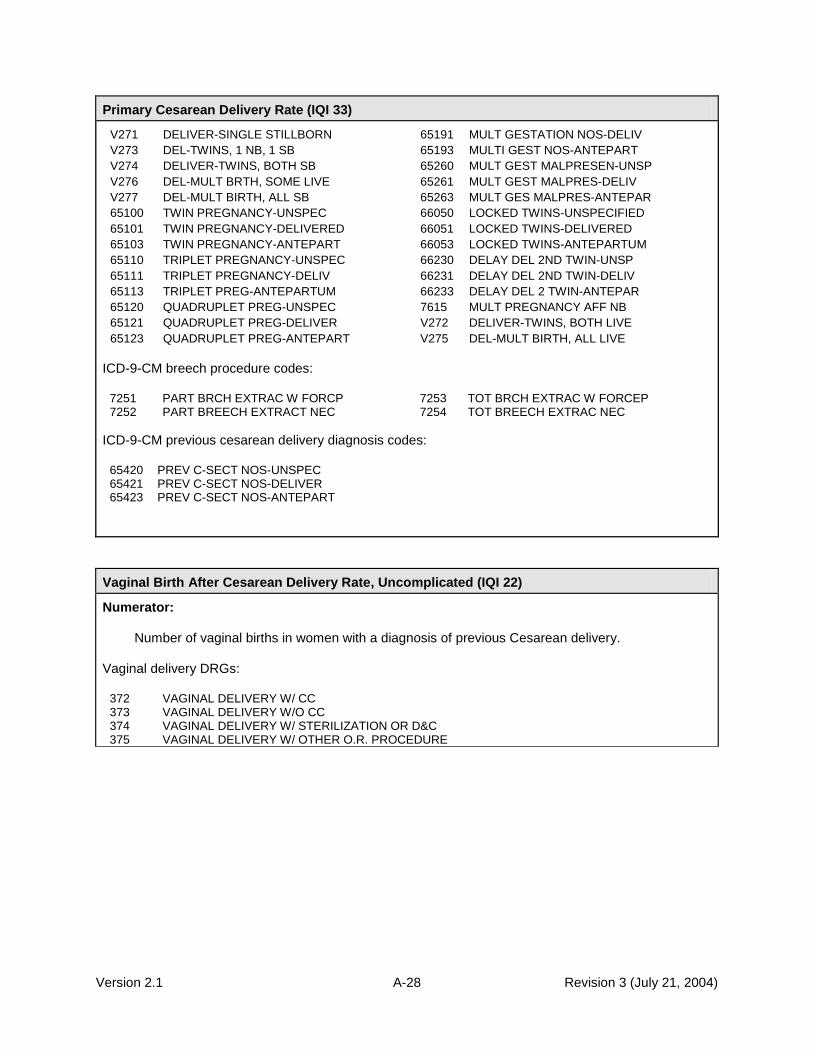
Version 2.1 A-28 Revision 3 (July 21, 2004)
Primary Cesarean Delivery Rate (IQI 33)
V271 DELIVER-SINGLE STILLBORN 65191 MULT GESTATION NOS-DELIV
V273 DEL-TWINS, 1 NB, 1 SB 65193 MULTI GEST NOS-ANTEPART
V274 DELIVER-TWINS, BOTH SB 65260 MULT GEST MALPRESEN-UNSP
V276 DEL-MULT BRTH, SOME LIVE 65261 MULT GEST MALPRES-DELIV
V277 DEL-MULT BIRTH, ALL SB 65263 MULT GES MALPRES-ANTEPAR
65100 TWIN PREGNANCY-UNSPEC 66050 LOCKED TWINS-UNSPECIFIED
65101 TWIN PREGNANCY-DELIVERED 66051 LOCKED TWINS-DELIVERED
65103 TWIN PREGNANCY-ANTEPART 66053 LOCKED TWINS-ANTEPARTUM
65110 TRIPLET PREGNANCY-UNSPEC 66230 DELAY DEL 2ND TWIN-UNSP
65111 TRIPLET PREGNANCY-DELIV 66231 DELAY DEL 2ND TWIN-DELIV
65113 TRIPLET PREG-ANTEPARTUM 66233 DELAY DEL 2 TWIN-ANTEPAR
65120 QUADRUPLET PREG-UNSPEC 7615 MULT PREGNANCY AFF NB
65121 QUADRUPLET PREG-DELIVER V272 DELIVER-TWINS, BOTH LIVE
65123 QUADRUPLET PREG-ANTEPART V275 DEL-MULT BIRTH, ALL LIVE
ICD-9-CM breech procedure codes:
7251 PART BRCH EXTRAC W FORCP 7253 TOT BRCH EXTRAC W FORCEP 7252 PART BREECH EXTRACT NEC 7254 TOT BREECH EXTRAC NEC
ICD-9-CM previous cesarean delivery diagnosis codes:
65420 PREV C-SECT NOS-UNSPEC 65421 PREV C-SECT NOS-DELIVER 65423 PREV C-SECT NOS-ANTEPART
Vaginal Birth After Cesarean Delivery Rate, Uncomplicated (IQI 22)
Numerator:
Number of vaginal births in women with a diagnosis of previous Cesarean delivery. Vaginal delivery DRGs:
372 VAGINAL DELIVERY W/ CC 373 VAGINAL DELIVERY W/O CC 374 VAGINAL DELIVERY W/ STERILIZATION OR D&C 375 VAGINAL DELIVERY W/ OTHER O.R. PROCEDURE

Version 2.1 A-29 Revision 3 (July 21, 2004)
Vaginal Birth After Cesarean Delivery Rate, Uncomplicated (IQI 22)
Denominator:
All deliveries with a previous cesarean delivery diagnosis in any diagnosis field.
All delivery DRGs: 370
CESAREAN SECTION W CC 373 VAG DELIVERY W/O COMPL
371 CESAREAN SECTION W/O CC 374 VAG DELIV W STERIL OR DC 372 VAGINAL DELIVERY W COMPL 375 VAG DELIV W OTH OR PROC
ICD-9-CM previous cesarean delivery diagnosis codes: 65420
PREV C-SECT NOS-UNSPEC
65421 PREV C-SECT NOS-DELIVER 65423 PREV C-SECT NOS-ANTEPART
Exclude:
Patients with abnormal presentation, preterm delivery, fetal death, multiple gestation diagnosis codes, or breech procedure codes.
ICD-9-CM abnormal presentation, preterm, fetal death and multiple gestation diagnosis codes:
65220 BREECH PRESENTAT-UNSPEC 65130 TWINS W FETAL LOSS-UNSP 65221 BREECH PRESENTAT-DELIVER 65131 TWINS W FETAL LOSS-DEL 65223 BREECH PRESENT-ANTEPART 65133 TWINS W FETAL LOSS-ANTE 66960 BREECH EXTR NOS-UNSPEC 65140 TRIPLETS W FET LOSS-UNSP 66961 BREECH EXTR NOS-DELIVER 65141 TRIPLETS W FET LOSS-DEL 65230 TRANSV/OBLIQ LIE-UNSPEC 65143 TRIPLETS W FET LOSS-ANTE 65231 TRANSVER/OBLIQ LIE-DELIV 65150 QUADS W FETAL LOSS-UNSP 65233 TRANSV/OBLIQ LIE-ANTEPAR 65151 QUADS W FETAL LOSS-DEL 65240 FACE/BROW PRESENT-UNSPEC 65153 QUADS W FETAL LOSS-ANTE 65241 FACE/BROW PRESENT-DELIV 65160 MULT GES W FET LOSS-UNSP 65243 FACE/BROW PRES-ANTEPART 65161 MULT GES W FET LOSS-DEL 64420 EARLY ONSET DELIV-UNSPEC 65163 MULT GES W FET LOSS-ANTE 64421 EARLY ONSET DELIVERY-DEL 65180 MULTI GESTAT NEC-UNSPEC 65640 INTRAUTERINE DEATH-UNSP 65181 MULTI GESTAT NEC-DELIVER 65641 INTRAUTER DEATH-DELIVER 65183 MULTI GEST NEC-ANTEPART 65643 INTRAUTER DEATH-ANTEPART 65190 MULTI GESTAT NOS-UNSPEC V271 DELIVER-SINGLE STILLBORN 65191 MULT GESTATION NOS-DELIV V273 DEL-TWINS, 1 NB, 1 SB 65193 MULTI GEST NOS-ANTEPART V274 DELIVER-TWINS, BOTH SB 65260 MULT GEST MALPRESEN-UNSP V276 DEL-MULT BRTH, SOME LIVE 65261 MULT GEST MALPRES-DELIV V277 DEL-MULT BIRTH, ALL SB 65263 MULT GES MALPRES-ANTEPAR 65100 TWIN PREGNANCY-UNSPEC 66050 LOCKED TWINS-UNSPECIFIED 65101 TWIN PREGNANCY-DELIVERED 66051 LOCKED TWINS-DELIVERED 65103 TWIN PREGNANCY-ANTEPART 66053 LOCKED TWINS-ANTEPARTUM 65110 TRIPLET PREGNANCY-UNSPEC 66230 DELAY DEL 2ND TWIN-UNSP 65111 TRIPLET PREGNANCY-DELIV 66231 DELAY DEL 2ND TWIN-DELIV 65113 TRIPLET PREG-ANTEPARTUM 66233 DELAY DEL 2 TWIN-ANTEPAR 65120 QUADRUPLET PREG-UNSPEC 7615 MULT PREGNANCY AFF NB 65121 QUADRUPLET PREG-DELIVER V272 DELIVER-TWINS, BOTH LIVE 65123 QUADRUPLET PREG-ANTEPART V275 DEL-MULT BIRTH, ALL LIVE
ICD-9-CM breech procedure codes:
7251 PART BRCH EXTRAC W FORCP 7253 TOT BRCH EXTRAC W FORCEP 7252 PART BREECH EXTRACT NEC 7254 TOT BREECH EXTRAC NEC

Version 2.1 A-30 Revision 3 (July 21, 2004)
Vaginal Birth After Cesarean (VBAC) Delivery, All (IQI 34)
Numerator:
Number of vaginal births in women with a diagnosis of previous Cesarean delivery. Vaginal delivery DRGs:
372 VAGINAL DELIVERY W/ CC 373 VAGINAL DELIVERY W/O CC 374 VAGINAL DELIVERY W/ STERILIZATION OR D&C 375 VAGINAL DELIVERY W/ OTHER O.R. PROCEDURE
Denominator:
All deliveries with a previous cesarean delivery diagnosis in any diagnosis field. All delivery DRGs:
370 CESAREAN SECTION W CC 373 VAG DELIVERY W/O COMPL 371 CESAREAN SECTION W/O CC 374 VAG DELIV W STERIL OR DC 372 VAGINAL DELIVERY W COMPL 375 VAG DELIV W OTH OR PROC
ICD-9-CM previous Cesarean delivery diagnosis codes:
65420 PREV C-SECT NOS-UNSPEC 65421 PREV C-SECT NOS-DELIVER 65423 PREV C-SECT NOS-ANTEPART
Laparoscopic Cholecystectomy Rate (IQI 23)
Numerator:
Number of laparoscopic cholecystectomies (any procedure field). ICD-9-CM laparoscopic cholecystectomy procedure code:
5123 LAPAROSCOPIC CHOLE

Version 2.1 A-31 Revision 3 (July 21, 2004)
Laparoscopic Cholecystectomy Rate (IQI 23)
Denominator:
All discharges with cholecystectomy in any procedure field. ICD-9-CM procedure cholecystectomy codes:
5122 CHOLECYSTECTOMY 5123 LAPAROSCOPIC CHOLE
Include:
Only discharges with uncomplicated cases: cholecystitis and/or cholelithiasis in any diagnosis field.
ICD-9-CM uncomplicated cholecystitis and/or cholelithiasis diagnosis codes:
57400 CHOLELITH W AC CHOLECYS 5750 ACUTE CHOLECYSTITIS 57401 CHOLELITH/ AC GB INF-OBST 5751 CHOLECYSTITIS NEC OCT96- 57410 CHOLELITH W CHOLECYS NEC 57510 CHOLECYSTITIS NOS OCT96- 57411 CHOLELITH/GB INF NEC-OBS 57511 CHRON CHOLECYSTITIS OCT96- 57420 CHOLELITHIASIS NOS 57512 AC/CHR CHOLECYSTITIS OCT96- 57421 CHOLELITHIAS NOS W OBSTR
Exclude:
MDC 14 (pregnancy, childbirth, and puerperium) and MDC 15 (newborns and other neonates).
Incidental Appendectomy Among the Elderly Rate (IQI 24)
Numerator:
Number of incidental appendectomies (any procedure field). ICD-9-CM incidental appendectomy procedure codes:
471 INCIDENTAL APPENDECTOMY OCT96- 4711 LAPAROSCOP INCID APPEND OCT96- 4719 OTH INCID APPEND OCT96-
Denominator:
All discharges age 65 years and older with intra-abdominal procedure. Intra-abdominal procedure DRGs:
146 RECTAL RESECTION W CC 193 BILIARY PROC W/ CC 147 RECTAL RESECTION W/O CC 194 BILIARY PROC W/O CC 148 MAJ BOWEL PROC W CC 195 CHOLE W/ CDE W/ CC 149 MAJ BOWEL PROC W/0 CC 196 CHOLE W/ CDE W/O CC 150 PERITONEAL ADHES W CC 197 CHOLE W/ CC 151 PERITONEAL ADHES W/O CC 198 CHOLE W/O CC 152 MIN BOWEL PROC W CC 201 OTH BILIARY/PANC PROC 153 MIN BOWEL PROC W/O CC 354 UTER PROC MALIG W/ CC 154 UGI PROC AGE >17 W CC 355 UTER PROC MALIG W/O CC 155 UGI PROC AGE >17 W/O CC 356 FEMALE REPROD RECONSTR 170 OTH GI OR PROC W CC 357 UTER PROC OVARIAN MALIG
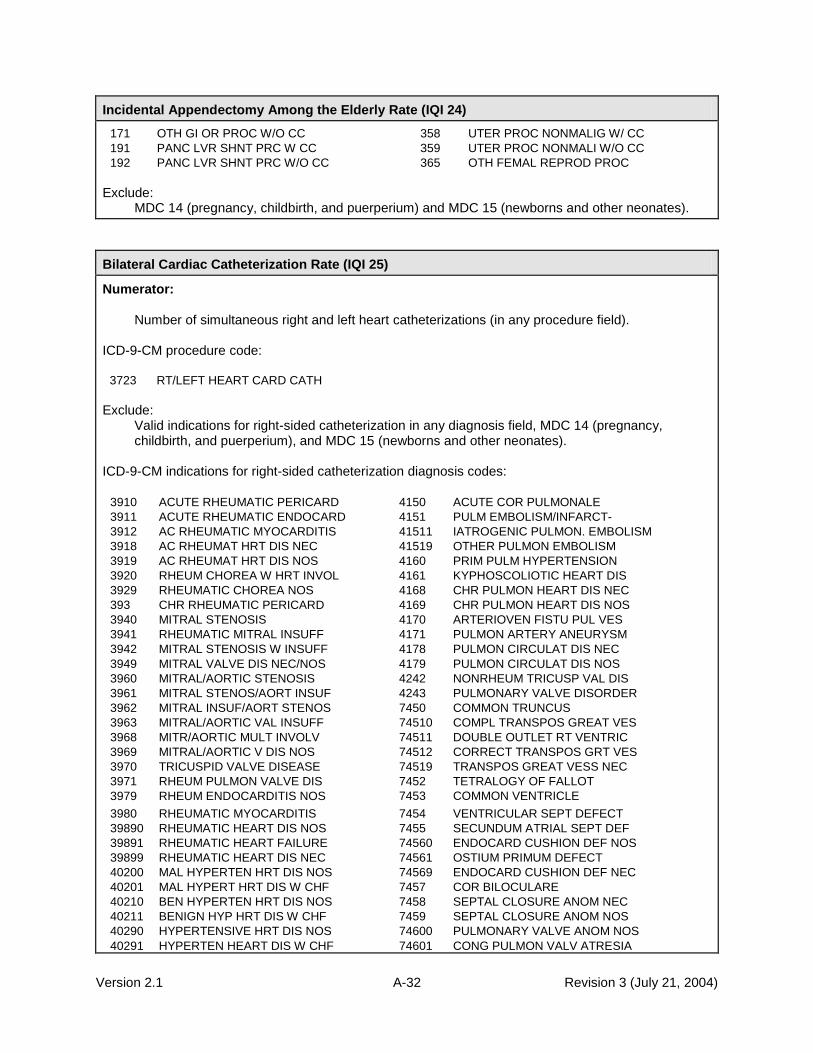
Version 2.1 A-32 Revision 3 (July 21, 2004)
Incidental Appendectomy Among the Elderly Rate (IQI 24)
171 OTH GI OR PROC W/O CC 358 UTER PROC NONMALIG W/ CC 191 PANC LVR SHNT PRC W CC 359 UTER PROC NONMALI W/O CC 192 PANC LVR SHNT PRC W/O CC 365 OTH FEMAL REPROD PROC
Exclude:
MDC 14 (pregnancy, childbirth, and puerperium) and MDC 15 (newborns and other neonates).
Bilateral Cardiac Catheterization Rate (IQI 25)
Numerator:
Number of simultaneous right and left heart catheterizations (in any procedure field). ICD-9-CM procedure code:
3723 RT/LEFT HEART CARD CATH Exclude:
Valid indications for right-sided catheterization in any diagnosis field, MDC 14 (pregnancy, childbirth, and puerperium), and MDC 15 (newborns and other neonates).
ICD-9-CM indications for right-sided catheterization diagnosis codes:
3910 ACUTE RHEUMATIC PERICARD 4150 ACUTE COR PULMONALE
3911 ACUTE RHEUMATIC ENDOCARD 4151 PULM EMBOLISM/INFARCT-
3912 AC RHEUMATIC MYOCARDITIS 41511 IATROGENIC PULMON. EMBOLISM
3918 AC RHEUMAT HRT DIS NEC 41519 OTHER PULMON EMBOLISM
3919 AC RHEUMAT HRT DIS NOS 4160 PRIM PULM HYPERTENSION
3920 RHEUM CHOREA W HRT INVOL 4161 KYPHOSCOLIOTIC HEART DIS
3929 RHEUMATIC CHOREA NOS 4168 CHR PULMON HEART DIS NEC
393 CHR RHEUMATIC PERICARD 4169 CHR PULMON HEART DIS NOS
3940 MITRAL STENOSIS 4170 ARTERIOVEN FISTU PUL VES
3941 RHEUMATIC MITRAL INSUFF 4171 PULMON ARTERY ANEURYSM
3942 MITRAL STENOSIS W INSUFF 4178 PULMON CIRCULAT DIS NEC
3949 MITRAL VALVE DIS NEC/NOS 4179 PULMON CIRCULAT DIS NOS
3960 MITRAL/AORTIC STENOSIS 4242 NONRHEUM TRICUSP VAL DIS
3961 MITRAL STENOS/AORT INSUF 4243 PULMONARY VALVE DISORDER
3962 MITRAL INSUF/AORT STENOS 7450 COMMON TRUNCUS
3963 MITRAL/AORTIC VAL INSUFF 74510 COMPL TRANSPOS GREAT VES
3968 MITR/AORTIC MULT INVOLV 74511 DOUBLE OUTLET RT VENTRIC
3969 MITRAL/AORTIC V DIS NOS 74512 CORRECT TRANSPOS GRT VES
3970 TRICUSPID VALVE DISEASE 74519 TRANSPOS GREAT VESS NEC
3971 RHEUM PULMON VALVE DIS 7452 TETRALOGY OF FALLOT
3979 RHEUM ENDOCARDITIS NOS 7453 COMMON VENTRICLE
3980 RHEUMATIC MYOCARDITIS 7454 VENTRICULAR SEPT DEFECT
39890 RHEUMATIC HEART DIS NOS 7455 SECUNDUM ATRIAL SEPT DEF
39891 RHEUMATIC HEART FAILURE 74560 ENDOCARD CUSHION DEF NOS
39899 RHEUMATIC HEART DIS NEC 74561 OSTIUM PRIMUM DEFECT
40200 MAL HYPERTEN HRT DIS NOS 74569 ENDOCARD CUSHION DEF NEC
40201 MAL HYPERT HRT DIS W CHF 7457 COR BILOCULARE
40210 BEN HYPERTEN HRT DIS NOS 7458 SEPTAL CLOSURE ANOM NEC
40211 BENIGN HYP HRT DIS W CHF 7459 SEPTAL CLOSURE ANOM NOS
40290 HYPERTENSIVE HRT DIS NOS 74600 PULMONARY VALVE ANOM NOS
40291 HYPERTEN HEART DIS W CHF 74601 CONG PULMON VALV ATRESIA

Version 2.1 A-33 Revision 3 (July 21, 2004)
Bilateral Cardiac Catheterization Rate (IQI 25)
40400 MAL HY HT/REN W/O HF/RF 74602 CONG PULMON VALVE STENOS
40401 MAL HYPER HRT/REN W HF 74609 PULMONARY VALVE ANOM NEC
40402 MAL HY HT/REN W REN FAIL 7461 CONG TRICUSP ATRES/STEN
40403 MAL HYP HRT/REN W HF/RF 7462 EBSTEIN'S ANOMALY
40410 BEN HY HT/REN W/O HF/RF 7463 CONG AORTA VALV STENOSIS
40411 BEN HYPER HRT/REN W HF 7464 CONG AORTA VALV INSUFFIC
40412 BEN HY HT/REN W REN FAIL 7465 CONGEN MITRAL STENOSIS
40413 BEN HYP HRT/REN W HF/RF 7466 CONG MITRAL INSUFFICIENC
40490 HY HT/REN NOS W/O HF/RF 7467 HYPOPLAS LEFT HEART SYND
40491 HYPER HRT/REN NOS W HF 74681 CONG SUBAORTIC STENOSIS
40492 HY HT/REN NOS W REN FAIL 74682 COR TRIATRIATUM
74684 OBSTRUCT HEART ANOM NEC 74683 INFUNDIB PULMON STENOSIS
74685 CORONARY ARTERY ANOMALY 74741 TOT ANOM PULM VEN CONNEC
74686 CONGENITAL HEART BLOCK 74742 PART ANOM PULM VEN CONN
74687 MALPOSITION OF HEART 74749 GREAT VEIN ANOMALY NEC
74689 CONG HEART ANOMALY NEC 7475 UMBILICAL ARTERY ABSENCE
7469 CONG HEART ANOMALY NOS 74760 UNSP PRPHERL VASC ANOMAL
7470 PATENT DUCTUS ARTERIOSUS 74761 GSTRONTEST VESL ANOMALY
74710 COARCTATION OF AORTA 74762 RENAL VESSEL ANOMALY
74711 INTERRUPT OF AORTIC ARCH 74763 UPR LIMB VESSEL ANOMALY
74720 CONG ANOM OF AORTA NOS 74764 LWR LIMB VESSEL ANOMALY
74721 ANOMALIES OF AORTIC ARCH 74769 OTH SPCF PRPH VSCL ANOML
74722 AORTIC ATRESIA/STENOSIS 74781 CEREBROVASCULAR ANOMALY
74729 CONG ANOM OF AORTA NEC 74782 SPINAL VESSEL ANOMALY
7473 PULMONARY ARTERY ANOM 74783 PERSISTENT FETAL CIRC OCT02-
74740 GREAT VEIN ANOMALY NOS 74789 CIRCULATORY ANOMALY NEC
40493 HYP HRT/REN NOS W HF/RF 7479 CIRCULATORY ANOMALY NOS
Denominator:
All discharges with heart catheterization in any procedure field. ICD-9-CM heart catheterization procedure codes:
3722 LEFT HEART CARDIAC CATH 3723 RT/LEFT HEART CARD CATH
Include:
Only coronary artery disease. ICD-9-CM coronary artery disease diagnosis codes:
41000 AMI ANTEROLATERAL, UNSPEC 41082 AMI NEC, SUBSEQUENT
41001 AMI ANTEROLATERAL, INIT 41090 AMI NOS, UNSPECIFIED
41002 AMI ANTEROLATERAL, SUBSEQ 41091 AMI NOS, INITIAL
41010 AMI ANTERIOR WALL, UNSPEC 41092 AMI NOS, SUBSEQUENT
41011 AMI ANTERIOR WALL, INIT 4110 POST MI SYNDROME
41012 AMI ANTERIOR WALL, SUBSEQ 4111 INTERMED CORONARY SYND
41020 AMI INFEROLATERAL, UNSPEC 41181 CORONARY OCCLSN W/O MI
41021 AMI INFEROLATERAL, INIT 41189 AC ISCHEMIC HRT DIS NEC
41022 AMI INFEROLATERAL, SUBSEQ 412 OLD MYOCARDIAL INFARCT
41030 AMI INFEROPOST, UNSPEC 4130 ANGINA DECUBITUS
41031 AMI INFEROPOST, INITIAL 4131 PRINZMETAL ANGINA
41032 AMI INFEROPOST, SUBSEQ 4139 ANGINA PECTORIS NEC/NOS
41040 AMI INFERIOR WALL, UNSPEC 4140 COR ATHEROSCLEROSIS OCT94-
41041 AMI INFERIOR WALL, INIT 41400 COR ATH UNSP VSL NTV/GFT OCT94-

Version 2.1 A-34 Revision 3 (July 21, 2004)
Bilateral Cardiac Catheterization Rate (IQI 25)
41042 AMI INFERIOR WALL, SUBSEQ 41401 CRNRY ATHRSCL NATVE VSSL OCT94-
41050 AMI LATERAL NEC, UNSPEC 41402 CRN ATH ATLG VN BPS GRFT OCT94-
41051 AMI LATERAL NEC, INITIAL 41403 CRN ATH NONATLG BLG GRFT OCT94- 41052 AMI LATERAL NEC, SUBSEQ 41404 COR ATH ARTRY BYPAS GRFT OCT96-
41060 TRUE POST INFARCT, UNSPEC 41405 COR ATH BYPASS GRAFT NOS OCT96-
41061 TRUE POST INFARCT, INIT 41406 COR ATH NATV ART TP HRT OCT02-
41062 TRUE POST INFARCT, SUBSEQ 41407 COR ATH BPS GRAFT TP HRT OCT03-
41070 SUBENDO INFARCT, UNSPEC 41410 ANEURYSM, HEART (WALL)
41071 SUBENDO INFARCT, INITIAL 41411 CORONARY VESSEL ANEURYSM
41072 SUBENDO INFARCT, SUBSEQ 41412 DISSECTION COR ARTERY OCT02-
41080 AMI NEC, UNSPECIFIED 41419 ANEURYSM OF HEART NEC
41081 AMI NEC, INITIAL 4148 CHR ISCHEMIC HRT DIS NEC
4149 CHR ISCHEMIC HRT DIS NOS Exclude:
MDC 14 (pregnancy, childbirth, and puerperium) and MDC 15 (newborns and other neonates).
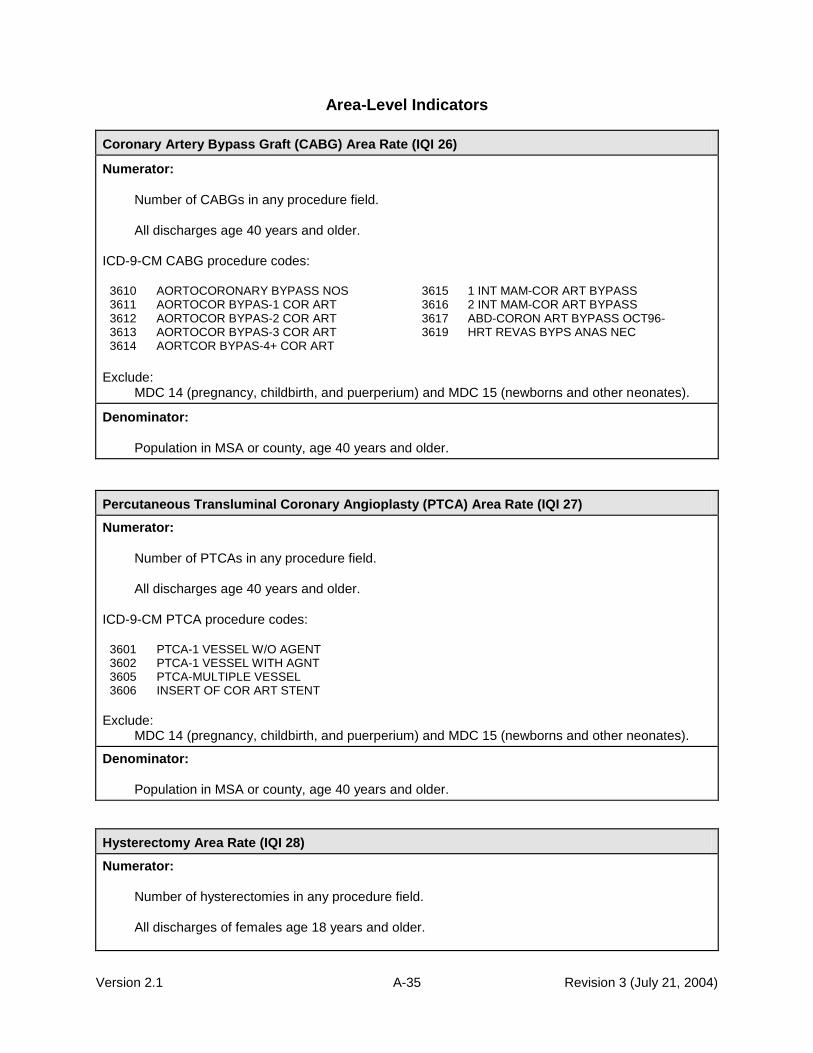
Version 2.1 A-35 Revision 3 (July 21, 2004)
Area-Level Indicators
Coronary Artery Bypass Graft (CABG) Area Rate (IQI 26)
Numerator:
Number of CABGs in any procedure field.
All discharges age 40 years and older. ICD-9-CM CABG procedure codes:
3610 AORTOCORONARY BYPASS NOS 3615 1 INT MAM-COR ART BYPASS 3611 AORTOCOR BYPAS-1 COR ART 3616 2 INT MAM-COR ART BYPASS 3612 AORTOCOR BYPAS-2 COR ART 3617 ABD-CORON ART BYPASS OCT96- 3613 AORTOCOR BYPAS-3 COR ART 3619 HRT REVAS BYPS ANAS NEC 3614 AORTCOR BYPAS-4+ COR ART
Exclude:
MDC 14 (pregnancy, childbirth, and puerperium) and MDC 15 (newborns and other neonates).
Denominator:
Population in MSA or county, age 40 years and older.
Percutaneous Transluminal Coronary Angioplasty (PTCA) Area Rate (IQI 27)
Numerator:
Number of PTCAs in any procedure field.
All discharges age 40 years and older. ICD-9-CM PTCA procedure codes:
3601 PTCA-1 VESSEL W/O AGENT 3602 PTCA-1 VESSEL WITH AGNT 3605 PTCA-MULTIPLE VESSEL 3606 INSERT OF COR ART STENT
Exclude:
MDC 14 (pregnancy, childbirth, and puerperium) and MDC 15 (newborns and other neonates).
Denominator:
Population in MSA or county, age 40 years and older.
Hysterectomy Area Rate (IQI 28)
Numerator:
Number of hysterectomies in any procedure field.
All discharges of females age 18 years and older.

Version 2.1 A-36 Revision 3 (July 21, 2004)
Hysterectomy Area Rate (IQI 28)
ICD-9-CM hysterectomy procedure codes:
683 SUBTOT ABD HYSTERECTOMY 6851 LAPAR ASSIST VAG HYS OCT96- 6831 LAP SCERVIC HYSTERECTOMY OCT03- 6859 OTH VAG HYS OCT96- 6839 OTH SUBTOT ABD HYSTERECT OCT03- 686 RADICAL ABD HYSTERECTOMY 684 TOTAL ABD HYSTERECTOMY 687 RADICAL VAG HYSTERECTOMY 685 VAGINAL HYSTERECTOMY OCT96- 689 HYSTERECTOMY NEC/NOS
Exclude:
Discharges with genital cancer or pelvic or lower abdominal trauma in any diagnosis field, MDC 14 (pregnancy, childbirth, and puerperium), and MDC 15 (newborns and other neonates).
ICD-9-CM female genital cancer diagnosis codes:
179 MALIG NEOPL UTERUS NOS 1839 MAL NEO ADNEXA NOS
1800 MALIG NEO ENDOCERVIX 1840 MALIGN NEOPL VAGINA
1801 MALIG NEO EXOCERVIX 1841 MAL NEO LABIA MAJORA
1808 MALIG NEO CERVIX NEC 1842 MAL NEO LABIA MINORA
1809 MAL NEO CERVIX UTERI NOS 1843 MALIGN NEOPL CLITORIS
181 MALIGNANT NEOPL PLACENTA 1844 MALIGN NEOPL VULVA NOS
1820 MALIG NEO CORPUS UTERI 1848 MAL NEO FEMALE GENIT NEC
1821 MAL NEO UTERINE ISTHMUS 1849 MAL NEO FEMALE GENIT NOS
1828 MAL NEO BODY UTERUS NEC 2331 CA IN SITU CERVIX UTERI
1830 MALIGN NEOPL OVARY 2332 CA IN SITU UTERUS NEC
1832 MAL NEO FALLOPIAN TUBE 2333 CA IN SITU FEM GEN NEC
1833 MAL NEO BROAD LIGAMENT 2360 UNCERT BEHAV NEO UTERUS
1834 MALIG NEO PARAMETRIUM 2361 UNC BEHAV NEO PLACENTA
1835 MAL NEO ROUND LIGAMENT 2362 UNC BEHAV NEO OVARY
1838 MAL NEO ADNEXA NEC 2363 UNC BEHAV NEO FEMALE NEC ICD-9-CM pelvic or lower abdominal trauma diagnosis codes:
8674 UTERUS INJURY-CLOSED 86819 INTRA-ABDOM INJ NEC-OPEN 8675 UTERUS INJURY-OPEN 8690 INTERNAL INJ NOS-CLOSED 8676 PELVIC ORGAN INJ NEC-CL 8691 INTERNAL INJURY NOS-OPEN 8677 PELVIC ORGAN INJ NEC-OPN 8796 OPEN WOUND OF TRUNK NEC 8678 PELVIC ORGAN INJ NOS-CL 8797 OPEN WND TRUNK NEC-COMPL 8679 PELVIC ORGAN INJ NOS-OPN 8798 OPEN WOUND SITE NOS 86800 INTRA-ABDOM INJ NOS-CLOS 8799 OPN WOUND SITE NOS-COMPL 86803 PERITONEUM INJURY-CLOSED 9060 LT EFF OPN WND HEAD/TRNK 86804 RETROPERITONEUM INJ-CL 9081 LATE EFF INT INJ ABDOMEN 86809 INTRA-ABDOM INJ NEC-CLOS 9082 LATE EFF INT INJURY NEC 86810 INTRA-ABDOM INJ NOS-OPEN 9391 FOREIGN BODY UTERUS
86813 PERITONEUM INJURY-OPEN 9474 BURN OF VAGINA & UTERUS 86814 RETROPERITONEUM INJ-OPEN
Denominator:
Female population in MSA or county, age 18 years and older.

Version 2.1 A-37 Revision 3 (July 21, 2004)
Laminectomy or Spinal Fusion Area Rate (IQI 29)
Numerator:
Number of laminectomies or spinal fusions in any procedure field.
All discharges age 18 years and older. ICD-9-CM laminectomy or spinal fusion procedure codes:
0302 REOPEN LAMINECTOMY SITE 8130 SPINAL REFUSION NOS OCT01- 0309 SPINAL CANAL EXPLOR NEC 8131 REFUSION OF ATLAS-AXIS OCT01- 8050 EXC/DEST INTVRT DISC NOS 8132 REFUSION OF OTH CERV ANT OCT01- 8051 EXCISION INTERVERT DISC 8133 REFUS OF OTH CERV POST OCT01- 8059 OTH EXC/DEST INTVRT DISC 8134 REFUSION OF DORSAL ANT OCT01- 8100 SPINAL FUSION NOS 8135 REFUSION OF DORSAL POST OCT01- 8101 ATLAS-AXIS FUSION 8136 REFUSION OF LUMBAR ANT OCT01- 8102 OTH CERV FUSION, ANTER 8137 REFUSION OF LUMBAR LAT OCT01- 8103 OTH CERV FUSION, POSTER 8138 REFUSION OF LUMBAR POST OCT01- 8104 DORSAL FUSION, ANTERIOR 8139 REFUSION OF SPINE NEC OCT01- 8105 DORSAL FUSION, POSTERIOR 8161 360 SPINAL FUSION OCT02-
8106 LUMBAR FUSION, ANTERIOR 8162 FUS/REFUS 2-3 VERTEBRAE OCT03- 8107 LUMBAR FUSION, LATERAL 8163 FUS/REFUS 4-8 VERTEBRAE OCT03- 8108 LUMBAR FUSION, POSTERIOR 8164 FUS/REFUS 9 VERTEBRAE OCT03- 8109 REFUSION OF SPINE 8451 INS SPINAL FUSION DEVICE OCT02-
Exclude:
MDC 14 (pregnancy, childbirth, and puerperium) and MDC 15 (newborns and other neonates).
Denominator:
Population in MSA or county, age 18 years and older.

Version 2.1 B-1 Revision 3 (July 21, 2004)
B.
Appendix B: Detailed Methods This appendix describes the methods used by the University of California-San Francisco (UCSF) Evidence-based Practice Center to refine the Healthcare Cost and Utilization Project (HCUP) quality indicators.
A.
Semi-structured Interviews
The project team and previous developers of the HCUP Quality Indicators (HCUP QIs) developed a contact list of individuals associated with hospital associations, business coalitions, State data groups, and Federal agencies. This list was designed to include QI users and potential users from a broad spectrum of organizations in both the public and private sectors; it was not intended as a representative sample. All contacts were faxed an introductory letter and asked to participate as advisors on the project with a short telephone interview. This request was well received; only six out of 37 declined participation themselves without suggesting an alternative respondent. Overall, the 31 contacts phoned expressed interest in the study, offering many suggestions and comments. The composition of the 31 interviewees is as follows: three consultants, two Federal agency employees, one health plan medical director, five representatives of hospital associations, one international academic researcher, four representatives of private accreditation groups, two representatives of private data groups, two members of professional organizations, five representatives of provider and other private organizations, three representatives of State data groups, and three representatives of other health care organizations. The semi-structured interviews were designed to identify potential indicators, concerns of end users, and other factors important in the development of quality indicators that may not be captured in the published literature. Thus, academic researchers, whose work is more likely to appear in peer-reviewed journals, were reserved as peer reviewers for the final document. As a result, the results of the semi-structured interviews are not intended to be a non-biased representation of the opinions regarding quality indicators, but rather a sampling of those opinions not likely to be available in the peer-reviewed literature. The interviewers solicited information on the development and use of quality indicators by the targeted organizations, as well as other known measures and additional contacts. Interviewers used a semi-structured interview and recorded information from the interview on a data-collection form. Further, some advisors provided the project team with materials regarding quality indicators and the use of HCUP QIs.
Quality Indicators Evaluation Framework
Six areas were considered essential for evaluating the reliability and validity of a proposed quality indicator. Several sources contributed to the development of the evaluation criteria framework: (1) results of the semi-structured interviews, including the interests and concerns of HCUP QI users, (2) task order document describing the Agency for Healthcare Research and Quality‘s (AHRQ) interests, (3) evidence available in the policy and research literature and (4) evidence available through statistical analyses. The six criteria were quite similar to the criteria for ―testing the scientific strength of a measure‖ proposed by McGlynn and Asch. [1] They describe a measure as reliable ―if, when repeatedly applied to the same population, the same result is obtained a high proportion of the time.‖ They propose evaluating validity in terms of face validity, criterion validity (―an objective assessment of the ability of the measure to predict a score on some other measure that serves as the evaluation criterion‖), and construct validity (―whether the correlations between the measure and other measures are of the right magnitude and in the right direction‖). Criterion validity was viewed as an assessment of bias (criterion #3), where the ―gold standard‖ measure is purged of bias due to severity of illness. Face validity captures a variety of

Version 2.1 B-2 Revision 3 (July 21, 2004)
concepts discussed by McGlynn and Siu, including the importance of the condition, the efficacy of available treatments (e.g., the ability of providers to improve outcomes), and the potential for improvement in quality of care. [2] Evidence supporting the use of current and candidate quality indicators was assembled in terms of the following six areas. 1. Face validity: Does the indicator capture an aspect of quality that is widely regarded as
important and subject to provider or public health system control? 2. Precision: Is there a substantial amount of provider or community level variation that is not
attributable to random variation? 3. Minimum bias: Is there either little effect on the indicator of variations in patient disease
severity and comorbidities, or is it possible to apply risk adjustment and statistical methods to remove most or all bias?
4 Construct validity: Does the indicator perform well in identifying true (or actual) quality of care
problems? 5. Fosters real quality improvement: Is the indicator insulated from perverse incentives for
providers to improve their reported performance by avoiding difficult or complex cases, or by other responses that do not improve quality of care?
6. Application: has the measure been used effectively in practice? Does it have potential for
working well with other indicators? In addition to the above framework, the Donabedian paradigm of structure, process, and outcome was followed to categorize current (HCUP) and candidate QIs. [3, 4] For example, potentially inappropriate utilization falls into the category of process, while in-hospital mortality, adverse events, and complication rates represent outcome measures. Three broad audiences for the quality measures were considered: health care providers and managers, who would use the quality measures to assist in initiatives to improve quality; public health policy-makers, who would use the information from indicators to target public health interventions; and health care purchasers and consumers, who would potentially use the measures to guide decisions about health policies and providers. Because of the limitations of quality indicators derived based on administrative data, the focus was primarily on applications oriented to ―screening for potential quality problems.‖ For the purpose of the Evaluation Framework, indicators must at least pass tests indicating that they are appropriate for the use of screening. The rest of this section provides a more detailed explanation of each part of the Evaluation Framework, considering these three audiences wherever differences have been noted in the literature. 1. Face validity: does the indicator capture an aspect of quality that is widely regarded as
important and subject to provider or public health system control? This question considers the degree to which potential users view the quality indicator as important and informative. There are two parts to this question: Does the indicator relate to an aspect of health care that users regard as important? And does performance on the measure credibly indicate high-quality care? Obviously, face validity will be influenced by how well the indicator performs in the other areas covered in the Evaluation Framework. Clinicians tend to distrust outcome measures because of concerns over the adequacy of risk adjustment and the multiple factors beyond providers‘ control that contribute to poor outcomes. Other critics add that outcome measures suffer from imprecision (with random noise outweighing provider differences) and important selection biases (e.g., due to variations in admitting practices). Addressing this issue at the outset serves as a point of reference for the findings of the literature review and empirical analysis.

Version 2.1 B-3 Revision 3 (July 21, 2004)
Broadly speaking, consumers, health care payers, regulators, and public health officials are likely to be most interested in measures based on outcomes that are relatively frequent, costly, or have serious implications for an individual‘s health. In addition, there should be reason to believe that the outcome may be (at least somewhat) under providers‘ control (in other words, controlled trials or well-designed cohort studies have shown that specific diagnostic or therapeutic modalities may reduce its frequency or severity). Outcome measures might include operative mortality rates or mortality after hospitalization with serious acute illnesses such as a heart attack. These measures seem most intuitive, since they assess the main outcomes that medical treatments are intended to affect. Perhaps surprisingly, however, reports of hospital mortality rates appear to have little effect on where patients seek their care. [5, 6] One reason may be that many patients describe difficulty in interpreting indicators involving mortality and morbidity rates, and consequently view them as unhelpful. [7] Another reason may be that providers prefer measures of process, particularly if there is reason to believe (generally from randomized controlled trials) that certain processes truly lead to better patient outcomes. Patients appear to prefer reports of other patients‘ satisfaction with care, and especially informal recommendations from family, friends, and their own physicians. [7] Thus, developing indicators with high face validity for patients may require active participation from patients, targeting aspects of care identified as important in patient surveys, or taking additional steps to enhance provider perceptions about the validity of outcome measures. [8-17] Many providers view outcome-based QIs with considerable skepticism. [18] For most outcomes, the impacts of random variation and patient factors beyond providers‘ control often overwhelm differences attributable to provider quality. [19-24] Consequently, providers tend to support measures of quality based on processes of care that have been documented in clinical trials to lead to better health outcomes in relatively broad groups of patients — for example, the processes of acute MI care measured in the Cooperative Cardiovascular Project. [25-30] Such process measures focus precisely on the aspects of care under providers‘ control. As long as the process measures are based on evidence of effectiveness, they serve as useful proxies for outcome measures that would otherwise be difficult to observe or measure. For example, when using inpatient discharge data only, it is not possible to ascertain out-of-hospital mortality. In general, process measures are not as noisy as outcome measures, because they are less subject to random variation. They also suggest specific steps that providers may take to improve outcomes or reduce costs — even if such outcome improvements are difficult to document at the level of particular providers. The relationship between some structural quality measures and important outcomes has been well-documented, although some concerns remain about the interpretation of the measures. [3, 4, 31, 32] These measures include measures of hospital volume for volume-sensitive conditions, technological capabilities (e.g., ability to perform certain intensive procedures like coronary angioplasty), and teaching status. [33-61] All of these measures have limited face validity, because they are widely acknowledged to be weak surrogates for true quality of care. [62] For example, many low-volume hospitals have been shown to achieve excellent outcomes, whereas many high-volume hospitals have surprisingly poor outcomes. 2. Precision: is there a substantial amount of provider or community level variation that
is not attributable to random variation? The impact of chance on apparent provider or community health system performance must be considered. Unobserved patient and environmental factors may result in substantial differences in performance among providers in the absence of true quality differences. Moreover, the same providers may appear to change from year to year, in the absence of changes in the care they deliver. Thus, using ―raw‖ quality data will often result in poorly reproducible, or imprecise, measurements, giving an incorrect impression of provider quality. An extensive literature on the importance of random variations in quality measures now exists. [19, 21-24, 63-68] In general, random variation is most problematic when there are relatively few observations per provider, when adverse outcome rates are relatively low, and when providers have little
Version 2.1 B-4 Revision 3 (July 21, 2004)
control over patient outcomes or when variation in important processes of care is minimal. If a large number of patient factors that are difficult to observe influence whether or not a patient has an adverse outcome, it may be difficult to separate the ―quality signal‖ from the surrounding noise. The evidence on the precision of each of the evaluated QIs was reviewed. Empirical methods can be used to assess both the importance of sample size and the importance of provider effects (versus patient and area effects) in explaining observed variation in the measure. But this is not entirely a statistical question, and considerations of mechanisms and concerns related to face validity can also be helpful in assessing the precision of a measure. For example, if better hospitals invariably admit sicker patients, then the apparent variation in a measure at the hospital level will be significantly less than the true variation (see the discussion of unbiasedness below). In such a case, other sources of evidence suggesting that a measure is valid or that such bias exists can be helpful in assessing the quality measure. The literature review encompasses both empirical and other sources of evidence on measure precision, and the empirical analysis presents systematic evidence on the extent of provider-level or area-level variation in each quality measure. Statistical techniques can account for random variations in provider performance by estimating the extent to which variation across providers appears to be clustered at the provider level, versus the extent to which it can be explained by patient and area effects. [68-71] Under reasonable statistical assumptions, the resulting estimates of the extent to which quality truly varies at the provider or area level can be used to ―smooth‖ or ―shrink‖ estimates of the quality of specific providers or areas. The methods are Bayesian: the data used to construct the quality measures are used to update a ―prior‖ distribution of provider quality estimates, so that the ―posterior‖ or smoothed estimate of a provider‘s (or area‘s) quality is a best guess, reflecting the apparent patient- and provider-level (or area-level) variance of measure performance. 3. Minimum Bias: is there either little effect on the indicator of variations in patient
disease severity and comorbidities, or is it possible to apply risk adjustment and statistical methods to remove most or all bias?
A QI may exhibit precision, but nonetheless yield inaccurate results due to systematic measurement biases. Extensive research has documented the importance of selection problems in interpreting many quality measures, especially measures related to mortality. [72-76] Such biases may have two basic forms: differences in admitting practices between two hospitals produce non-random samples from the same underlying patient population (selection biases) or the patient populations may in fact contain different case-mixes. Selection effects presumably exert a greater influence on measures involving elective admissions and procedures, for which physician admission and treatment practice styles show marked variation. [56. 57] Nonetheless, selection problems exist even for conditions involving urgent ―non-discretionary‖ admissions, likely due to modest practice variation, and non-random distribution of patient characteristics across hospital catchment areas. [59, 77] The attention of researchers and quality analysts has focused on developing valid models to adjust for patient factors, especially when comparing hospital mortality. [72, 74] The principal statistical approach to address concerns about bias is risk adjustment. [78, 79, 60, 61, 80-86] Numerous risk adjustment instruments currently exist, but current methods are far from perfect. [79, 87] In general, risk adjustment methods are based on data drawn from administrative data and medical chart reviews. [78] Previous studies suggest that administrative data have at least two major limitations. First, coding errors and variations are common; some diagnoses are frequently entered with errors and with some inconsistency across hospitals. [88-90] Factors affecting the accuracy of these codes include restrictions on the number of secondary diagnoses permitted, as well as systematic biases in documentation and coding practices introduced by awareness that risk-adjustment and reimbursement are related to the presence of particular complications. [91-96] Second, most administrative data sources do not distinguish disorders that can be in-hospital complications from pre-existing comorbidities. [78, 97] To the extent that diagnoses such as shock and pulmonary edema may result from poor quality of care, their incorporation in prediction models may bias

Version 2.1 B-5 Revision 3 (July 21, 2004)
estimates of expected mortality, and even favor hospitals whose care results in more complications. One proprietary risk-adjustment system has been shown to be significantly biased by its inclusion of conditions that actually developed after admission, but this study was limited to one condition (acute MI) and its conclusions are somewhat controversial. [98, 99] In another study, estimates of mortality differences between municipal and voluntary hospitals in New York City were substantially affected by whether potential complications were excluded from risk-adjustment. [61] New York and California have recently added a ―6th digit‖ to ICD-9-CM codes to distinguish secondary diagnoses present at admission from those that developed during hospitalization. This refinement may allow valid comparisons of risk-adjusted mortality using administrative data for certain conditions, although the accuracy of the ―6th digit‖ has not been established. [100] Clinically based risk adjustment systems supplement hospital discharge data with information available from medical records. Because exact clinical criteria can be specified for determining whether a diagnosis is present, coding errors are diminished. In addition, complications can be distinguished from comorbidities focusing on whether the diagnosis was present at admission. [79] Because the number of clinical variables that may potentially influence outcomes is small, and because these factors differ to some extent across diseases and procedures, progress in risk-adjustment has generally occurred by focusing on patients with specific conditions. Thus, sophisticated chart-based risk adjustment methods have been developed and applied for interpreting mortality rates for patients undergoing cardiac surgery and interventional cardiology procedures; critically ill patients; patients undergoing general surgery; and medical patients with acute myocardial infarction, community-acquired pneumonia, and upper gastrointestinal hemorrhage. [29, 36, 85, 101-107] However, chart-based risk adjustment methods are not without their own limitations. First, especially for severely ill patients and those who die soon after admission — some of the most important patients for computing many quality measures — complete diagnosis information may not have been ascertained prior to death, and therefore would not be in the patient‘s medical record. Important observations might be missing for such patients, resulting in biased estimates in the risk-adjusted model. Second, medical chart reviews are very costly, and so routine collection of detailed risk information is not always feasible. As a result, the impact of chart-based risk adjustment may vary across measures. For some measures, its impact is modest and does not substantially alter relative rankings of providers. [113-116] For others, it is much more important. [79, 97, 108-112] Of course, because all risk adjustment methods generally leave a substantial amount of outcome variation unexplained, it is possible that unmeasured differences in patient mix are important even in the most detailed chart-based measures. For each quality measure, this report reviews the evidence on whether important systematic differences in patient mix exist at the provider and community level, and whether various risk adjustments significantly alter the quality measure for particular providers. A distinction is made between risk adjustment methods that rely only on administrative data and have been validated with clinical data, and those that are not validated. Risk adjustment methods requiring clinical data cannot be applied to the HCUP data, and therefore are not covered in this report. The empirical analysis then assesses whether a common approach to risk adjustment using administrative data — the All Patient Refined Diagnosis Related Groups (APR-DRG) system developed by 3M™ — significantly alters the quality measure for specific providers. Emphasis is placed on the impact on relative measures of performance (whether risk adjustment affects which hospitals are regarded as high- or low-quality) rather than absolute measures of performance (whether risk adjustment affects a hospital‘s quantitative performance on the quality measure). As noted above, this system is not ideal, because it provides only four severity levels within each base APR-DRG, omits important physiologic and functional predictors, and potentially misadjusts for iatrogenic complications. A remaining methodological issue concerns the appropriateness of adjusting for certain ―risk factors.‖ [117-126] For example, ―Do Not Resuscitate‖ status may be associated with differences in care that not only reflect patient preferences (e.g., less use of intensive treatments) but also true differences in quality of care (e.g., inadequate physician visits), resulting in increased complications that would result in a ―Do Not Resuscitate‖ order, and increased mortality. [127] Importantly, the prevalence of patients with

Version 2.1 B-6 Revision 3 (July 21, 2004)
DNR status may vary nonrandomly between hospitals, with large referral centers having greater percentages of patients seeking (and receiving) aggressive medical care. [128] Adjusting for race implies that patients of different races respond differently to the same treatments, when patients of different races may actually receive different treatments. A substantial literature documents systematic differences in the care delivered to patients by race and gender. [116, 129-135] For example, African-American diabetics undergo limb amputations more often than do diabetics of other races. [136] Thus, wherever possible it is noted if review of the literature indicates particularly large differences in a quality measure by race or gender. Some gender or race differences may be due to either patient preference or physiological differences that would be appropriate to include in a risk adjustment model. In other cases, differences denote lower quality care, and in this case race and gender should not be included in the risk adjustment model. Where applicable, this is noted in the literature review. 4. Construct validity: does the indicator perform well in identifying providers with quality
problems? Ideally, a hospital will perform well on a quality measure if and only if it does not have a significant quality problem, and will perform poorly if and only if it does. In practice, of course, no measure performs that well. The analyses of noise and bias problems with each measure are intended to assess two of the principal reasons why a hospital might appear relatively good or bad (or not appear so) when it really is not (or really is). Detecting quality problems is further complicated by the fact that adverse outcomes are often the result of the course of an illness, rather than an indication of a quality problem at a hospital. Formally, one would like to know the sensitivity and specificity of a quality measure, or at least the positive predictive value (PPV) of a quality measure for detecting a true hospital quality problem.
237
When available, for each measure, any existing literature was reviewed on its sensitivity or PPV for true provider quality problems. In most cases, however, no true gold standard, or ideal measure of quality, was found. Therefore, construct validity was tested – i.e., the construct is that different measures of quality, on the same patients, should be related to each other at the provider level, even if it is not always clear which measure is better. It may be easier to ask ―is the indicator correlated with other, accepted measures of quality at the provider level?‖ rather than ―does the indicator perform well in identifying providers with quality problems?‖ For example, studies have validated survey rankings of ―best‖ hospitals by examining the relation with actual process and outcome measures for AMI, and peer review failure rates with HCFA risk-adjusted mortality rates. [137, 138] 5. Fosters real quality improvement: Is the indicator insulated from perverse incentives
for providers to improve their reported performance by avoiding difficult or complex cases, or by other responses that do not improve quality of care?
Ideally, when quality measures are used to guide quality improvement initiatives or reward good providers, the best way for a provider to perform well on the measure is to provide high-quality care. Unfortunately, many quality indicators appear to at least leave open the possibility of improving measured performance without improving true quality of care. In measures that are risk-adjusted, measured performance can be improved by ―upcoding‖ — including more comorbid diagnoses in order to increase apparent severity of illness. [68. 96] Systematic biases in diagnostic codes were observed after the introduction of the Prospective Payment System and may also explain much of the apparent reduction in adjusted mortality attributed to the Cardiac Surgery Reporting System in New York. [93-96] The extent to which upcoding is a problem probably increases with the ambiguity of the specific data element, and decreases when auditing programs maximize the
237
The PPV represents that the chance that a positive test result reflects a ―true positive.‖ It combines the
properties of the test itself (e.g., sensitivity and specificity for detecting quality problems) with the prevalence of true quality problems in the target population.

Version 2.1 B-7 Revision 3 (July 21, 2004)
reliability and validity of submitted data. In recent years, an aggressive auditing program has significantly reduced the extent to which comorbidities not substantiated by the medical chart are recorded for Medicare patients, leading some analysts to conclude that ―upcoding‖ is no longer as substantial of a problem for Medicare patients. [139] However, such audit standards have generally not been imposed on the State discharge databases used in the HCUP project. In this review, indicators for which risk adjustment appears to be important are noted, and thus upcoding is a potentially important problem. Indicators capturing patient morbidity, such as adverse events and complications, must overcome a reporting bias in the reverse direction (i.e., toward under-reporting). With some exceptions, most hospitals in most States rely on voluntary incident reporting for adverse events. Such methods are known to detect only a fraction of true adverse drug events (ADEs). [140] The Institute of Medicine has recently recommended mandatory reporting systems for adverse events emanating from certain egregious errors. [141] However, the JCAHO‘s sentinel reporting system tracks many of these same errors (e.g., operating on the wrong patient or body part, suicide or rape of an inpatient), and it was received very negatively by hospitals, despite being a voluntary system. Thus, the degree to which mandatory reporting requirements alleviate or exacerbate reporting bias for adverse events remains to be seen. In addition, high-quality hospitals with sophisticated error detection systems may report errors more frequently, leading to high apparent complication rates in hospitals that may have superior quality in other dimensions. [142-144] Perverse incentives may arise from the criteria used to define or identify the target patient population. For instance, restricting mortality measures to inpatient deaths potentially allows hospitals to lower their mortality rates simply by discharging patients to die at home or in other institutions. [91, 100, 145, 146] Measures of surgical site infections and other complications of hospital care that only capture in-hospital events will similarly reward hospitals that merely reduce length of stay by discharging or transferring high-risk cases. [147-149] Early concerns that surgeons in New York avoided operating on high-risk patients may have proved unfounded, though this issue remains unsettled. [150-153] In general, the incentive for providers to avoid treating sicker patients remains a significant concern for outcome-based quality measures. [68] The available evidence on each of these possible undesirable responses to the use of each quality measure was reviewed. For the most part, evidence was lacking on responses to indicators, particularly since many of the proposed indicators have not been subjected to public reporting. Potential responses were noted when appropriate. 6. Prior use: Has the measure been used effectively in practice? Does it have potential
for working well with other indicators? While important problems exist with many specific applications of HCUP QIs and other quality indicators, they have been applied in a range of settings. As noted in the section on face validity, these applications broadly include initiatives to improve provider quality and initiatives to provide quality-related information to providers and consumers. Studies describing its use in these activities were reviewed for each quality indicator. However, a thorough review of the non-peer reviewed literature was not conducted. Therefore, indicators may have been adopted, and may continue to be used, by many provider organizations or Government agencies. A recent systematic review more comprehensively summarizes the literature on the impact of performance reports on consumers, providers, and purchasers. [154] Useful and accurate information on quality remains a desirable goal for consumers and providers alike. The interest in quality and the resulting data and research has had some impact on the field of health services research. For instance, the HCUP project has provided a valuable resource for a number of studies in health services research. [124-126, 155-169]

Version 2.1 B-8 Revision 3 (July 21, 2004)
Literature Review of Quality Indicators
A literature review was conducted to identify quality indicators reported as such and potential quality measures. The result of this first stage was a comprehensive list of measures that could be defined based on routinely collected hospital discharge data. In the second phase, the literature was searched for further evidence on these indicators to provide information on their suitability for the new QI set. This second phase resulted in a comprehensive bibliography for each indicator. In addition, a sub-set of the entire indicator list was selected for detailed review using specific evaluation criteria. The entire process for this systematic review of the literature is described in the following sections. Phase 1: Identification of Indicators Step 1: Selecting the articles. To locate literature pertaining to quality indicators, a strategic literature search was conducted using the Medline database. Over 30 search strategies were compared using Medical Subject Headings (MeSH) based on their ability to retrieve a set of key articles known to the project team. Successful combinations of MeSH term searches returned all the key articles. The final MeSH terms used were ―hospital, statistic and methods‖ and ―quality indicators.‖ Articles were also limited to those published in 1994 or later. Articles prior to 1994 had been reviewed for the original QI development. This search returned approximately 2,600 articles — the highest number of known key articles in the most concise manner. Articles were screened using the titles and abstracts for preliminary abstraction. To qualify for preliminary abstraction, the articles must have described a potential indicator or quality relationship that could be adequately defined using administrative data, and be generalizable to a national data set. For the purpose of this study, a quality indicator was defined as an explicit measure (defined by the developer) of some aspect of health care quality. Some literature defines only a quality relationship, in that the article expounds on a process or structural aspect of a health care provider that is related to better outcomes. However, the author does not specifically define or recommend that the relationship be used as a quality measure. In this case, the article only describes a quality relationship, not a quality indicator. Only 181 articles met the criteria for preliminary abstraction. This reflects the small number of quality indicators with published formal peer-reviewed evaluations. Step 2: Preliminary abstraction. The preliminary round was designed to screen articles for applicability and quality, to obtain and assess the clinical rationale of the indicators, and to identify those articles with enough detail for a more comprehensive abstraction. Nine abstractors participated in this phase. Five of these abstractors were medical doctors with health services research training. The remaining four abstractors were familiar with the project and the literature, and included a project manager, the research coordinator, and two undergraduate research assistants. The articles were sorted into clinical groupings. The research coordinator rated these clinical groupings according to the amount of clinical knowledge required to abstract the articles. Those requiring the most clinical knowledge were assigned to physicians, while those requiring the least clinical knowledge were assigned to the undergraduate research assistants. Abstractors selected clinical groupings that were of interest or that corresponded to their clinical specialties. Abstractors recorded information about each article on a one-page abstraction form. Information coded included:
Indicator type (i.e. mortality, readmission, potentially overused procedures)
Clinical domain (i.e. medical, surgical, obstetric, pediatric, and psychiatric)
Measure category (i.e. structure, process, proxy-outcome, and outcome)
Clinical rationale for the indicators.
Use of longitudinal data.
Use of data beyond hospital discharge data.

Version 2.1 B-9 Revision 3 (July 21, 2004)
Strengths and weaknesses identified by the author.
Strengths and weaknesses not identified by the author. Each abstraction form was reviewed by the research coordinator for quality of the abstraction and for accuracy of the coding. All data were then entered into a Microsoft Access database. Step 3: Full abstraction. The purpose of the full abstraction phase was to identify potential indicators for the new QI set, and to assess the evidence for validity of existing indicators. To accomplish this, only articles that described an indicator in conjunction with specific and comprehensive information on its validity were fully abstracted. Four of the original abstractors participated in this phase of the abstraction. Three of these abstractors were medical doctors, the fourth a master‘s level research coordinator. Each of the articles for preliminary abstraction and the corresponding abstraction form was reviewed by both the research coordinator and the project manager independently. To qualify for full abstraction, the articles needed to meet the previously noted criteria and the following criteria:
Define a quality indicator, as opposed to only a relationship that was not formulated or explicitly proposed as a measurement tool.
Discuss a novel indicator, as opposed to indicators defined elsewhere and used in the article only to discuss its relationship with another variable (i.e., socioeconomic status, race, urbanization).
Define an indicator based on administrative data only. Only 27 articles met these formal criteria. This highlights an important aspect of the literature on quality indicators: most indicators are based on published clinical literature to identify important patient and provider characteristics and processes of care for specific clinical conditions; there is also a substantial literature on technical aspects such as severity adjustment, coding, and data collection. It should be noted that, while only 27 articles qualified for formal abstraction, these are not the only useful articles. Many articles provide important information about quality measurement. However, few quality indicators are specifically defined, evaluated, and reported in the literature besides descriptive information on the process of development. (The Complication Screening Program is a noteworthy and laudable exception that has been extensively validated in the published literature, mostly by the developers). This evidence report will be an important contribution to the paucity of literature on indicator validation. An abstraction form was filled out for each indicator defined in an article. The abstraction form coded the following information:
All the information coded in the preliminary abstraction form.
Measure administrative information (i.e. developer, measure set name, year published).
Level of care (primary (prevention), secondary (screening or early detection) or tertiary (treatment to prevent mortality/morbidity)).
Scoring method (i.e. rate, ratio, mean, proportion).
A priori suggested quality standard (i.e. accepted benchmark, external comparison, and internal comparison).
Indicator definition (numerator, denominator statements, inclusions, and exclusions).
Extent of prior use.
Current status (i.e. measure defined, pilot tested, implemented, discontinued).
Scientific support for measure (i.e. published guidelines, clinician panel, literature review, revision of pre-existing instruments, theory only).
Other essential references for the measure.
Validity testing.
Risk adjustment.

Version 2.1 B-10 Revision 3 (July 21, 2004)
If the measure included risk adjustment, a separate form for the risk adjustment method was filled out. This included:
Method administrative information.
Adjustment rationale.
Classification or analytic approach (i.e. stratification, logistic or linear regression)
System development method (i.e. logistic regression, score based on empirical model, a priori/clinical judgement).
Published performance for discrimination and calibration.
Use of comorbidities, severity of illness, or patient demographics.
Use of longitudinal data, or additional data sources beyond discharge data.
Extent of current use.
Other essential references for the method.
Abstractor comments. The abstraction forms were reviewed by the research coordinator and entered into a Microsoft Access database. Parallel Step: Supplementing literature review using other sources. Because the literature in this area is not the primary source for reporting the use of quality indicators, a list of suitable indicators was compiled from a variety of sources. As previously noted, the phone interviews with project advisors led to information on some indicators. In addition, the Internet sites of known organizations using quality indicators; the CONQUEST database; National Library of Healthcare Indicators (NLHI), developed by the Joint Commission on Accreditation of Healthcare Organizations (JCAHO); and a list of ORYX-approved indicators provided by the JCAHO were searched. Indicators that could be defined using administrative data were recorded in an indicator database. Breakdown of indicators by primary source. During Phase 1, no one literature search was sufficiently sensitive for the purpose of identifying either quality indicators or quality relationships. In addition, there was relatively little literature defining quality indicators. Web sites, organizations, and additional literature describing quality indicators were searched to be confident that a large percentage of the quality indicators in use were identified. In general, most volume, utilization, and ACSC indicators have been described primarily in the literature. On the other hand, the primary sources for most mortality and length of stay indicators were current users or databases of indicators. However, many indicators found in the literature were also reported by organizations, and vice versa. Thus, it is difficult to delineate which indicators were derived only from the literature and which were derived from the parallel step described above. Phase 2: Evaluation of Indicators The result of Phase 1 was a list of potential indicators with varied information on each depending on the source. Since each indicator relates to an area that potentially screens for quality issues, a structured evaluation framework was developed to determine measurement performance. A series of literature searches were then conducted to assemble the available scientific evidence on the quality relationship each indicator purported to measure. Due to limited resources, not all of the indicators identified in Phase 1 could be reviewed, and therefore some were selected for detailed review using the evaluation framework. The criteria used to select these indicators are described later. Step 1. Development of evaluation framework. As described previously, a structured evaluation of each indicator was developed and applied to assess indicator performance in six areas:
Face validity
Precision
Minimum bias
Construct validity

Version 2.1 B-11 Revision 3 (July 21, 2004)
Fosters real quality improvement
Prior use Step 2. Identification of the evidence. The literature was searched for evidence in each of the six areas of indicator performance described above, and in the clinical areas addressed by the indicators. The search strategy used for Phase 2 began with extensive electronic searching of MEDLINE, PsycINFO, and the Cochrane Library. [170-172] (A decision was made not to search EMBASE on the grounds that the studies of quality measurement necessarily must take into account the particular health care system involved. [173]) In contrast to conducting systematic reviews of purely clinical topics, it was reasoned that the European literature not captured in the Medline database or Cochrane Library would almost certainly represent studies of questionable relevance to the U.S. health system. The extensive electronic search strategy involved combinations of MeSH terms and keywords pertaining to clinical conditions, study methodology, and quality measurement (Figure B-1). Additional literature searches were conducted using specific measure sets as ―keywords‖. These included ―Maryland Quality Indicators Project,‖ ―HEDIS and low birth weight, or cesarean delivery, or frequency, or inpatient utilization,‖ ―IMSystem,‖ ―DEMPAQ,‖ and ―Complications Screening Program.‖ The bibliographies of key articles were searched, and the Tables of Contents of general medical journals were hand searched, as well as journals focusing in health services research or in quality measurement. This list of journals included Medical Care, Health Services Research, Health Affairs, Milbank Quarterly, Inquiry, International Journal for Quality in Healthcare, and the Joint Commission Journal on Quality Improvement. These literature searches and on-line screening for relevancy retrieved over 2,000 additional articles, which were added to the project database. These articles were used for evaluations of individual indicators. The use of medical literature databases likely eliminated much of the ―gray literature‖ that may be applicable to this study. Given the limitations and scope of this study, a formal search of the ―gray literature‖ was not completed beyond that which was previously known by the project team or resulted from telephone interviews.

Version 2.1 B-12 Revision 3 (July 21, 2004)
Figure B-1. Example Search
Mortality Following Stroke Number of References Medline Search StringRetrieved 1.Cerebrovascular disorders [MeSH terms] 47,264 2.Epidemiologic studies [MeSH terms] OR clinical trials [MeSH terms] 32,630 3.Search mortality [MeSH Terms] OR prognosis [MeSH terms] 18,460 4.#1 AND #2 AND #3 2,410 5.#4 AND stroke [title] 524 6.Quality of health care [MeSH term] 852,714 7.#1 AND #2 AND (#3 OR #6) 1,988 8.Reproducibility of results [MeSH terms] OR sensitivity and specificity [MeSH terms] 110,384 9.Records [MeSH terms] OR hospitalization [MeSH terms] 55,739 10.#8 AND #9 3,835 11.#1 AND #10 106 Note: The results of searches 5 and 11 were scanned (titles and abstracts) to pull relevant studies, and the bibliographies of these studies were hand-searched for additional references.
All searches included limits: Publication date from 1990 to 2000 and language English.
Step 3. Selection of a sub-set of indicators. Since there were too many indicators identified in Phase 1 (literature search and parallel steps) for detailed evaluation using the Evaluation Framework , criteria were developed to select a group for further evaluation. These criteria were intended to be top-level evaluations of the face validity and precision of the indicators. A subset of indicators was selected for preliminary empirical evaluation. To do this, first the indicators related to complications were disqualified for this particular report, since they will be included in an expansion to the report that will include patient safety indicators. Second, all of the current HCUP QIs (except those related to complications of care) were selected for empirical evaluation. Third, the priority of clinical areas well covered by the current HCUP indicator set was lowered (for example, obstetrical indicators). Finally, a set of criteria for selection was applied to the remaining indicators. The following were specific criteria for evaluation for all indicators:
Indicator must be definable with HCUP data (i.e., uses only administrative data available in HCUP data set).
Conditions that affect at least 1% of hospitalized patients or 20% of providers, as tested using the Nationwide Inpatient Sample data set.
Conditions that are the subject of public reporting, previous use, or large dollar volume.
Clear relationship to quality apparent as evaluated by clinical judgment of health services researchers and medical doctors.

Version 2.1 B-13 Revision 3 (July 21, 2004)
In addition, several specific criteria were noted for the indicator types:
Volume:
Widely documented volume-outcome relationship
Recent evidence regarding volume-outcome relationship
Utilization rates:
Condition must have an alternative surgical or medical therapy with lower/higher morbidity or mortality
Ambulatory care sensitive conditions:
Differences in patient management practices for that condition
Existence of treatment guidelines, and evidence of failure to comply
In-hospital mortality
Relatively homogenous group When selecting between competing alternatives that met all the above criteria, the choice was made to evaluate clinical areas in depth rather than evaluating a large breadth of indicators. To do this, multiple aspects in one clinical domain were evaluated (i.e., evaluations of CABG, PTCA, and AMI; stroke and carotid endarterectomy). In these clinical areas, at least two different types of indicators were evaluated (i.e., mortality and utilization). The selected indicators were then evaluated empirically, using preliminary tests of precision. Those demonstrating adequate precision were then evaluated by a literature review (Phase 2), as well as further empirical analysis. Step 4. Evaluation of evidence. The abstracts from relevant articles for each indicator were reviewed and selected according to the following criteria:
The article addressed some aspect of the six areas of indicator performance.
The article was relevant to a national sample, rather than a local population. Based on this literature, a team member or clinician developed a draft write-up of the indicator following the evaluation framework. The literature review strategy is depicted in the flow diagram in Figure 2.
Risk Adjustment of HCUP Quality Indicators
―Raw‖ unadjusted measures of hospital or area performance for each indicator are simple means constructed from the HCUP discharge data and census population counts. Obviously, simple means do not account for differences in the indicators that are attributable to differences in patient mix across hospitals that are measured in the discharge data, or demographic differences across areas. In general, risk adjustment involves conducting a multivariate regression to adjust expected performance for these measured patient and population characteristics. Although complex, multivariate regression methods are the standard technique for risk-adjustment because they permit the simultaneous consideration of multiple patient characteristics and interaction among those characteristics. The interpretation of the risk-adjusted estimate is straightforward: it is the value of the indicator expected at that hospital if the hospital had an ―average‖ patient case-mix. This section contains the methods for the evaluation of risk adjustment systems, leading to the decision to use APR-DRGs. The purpose of this evaluation is to briefly outline the evidence regarding the use of risk adjustment systems for evaluating potential bias in indicators and for risk adjusting established indicators to compare provider performance. The first section discusses criteria used to evaluate the risk adjustment systems. Such criteria arise from the literature-based evidence on risk adjustment systems, as well as user criteria obtained through the semi-structured telephone interviews. Second, the methods

Version 2.1 B-14 Revision 3 (July 21, 2004)
used to implement APR-DRGs empirically in the new QI set are outlined. The methods for risk-adjustment of the hospital level quality indicators are described. An analogous method was used for the area level quality indicators. However, the area level indicators account only for demographic differences. Risk Adjustment Literature Review Methods The literature review for risk adjustment of the HCUP QIs combined evaluation criteria common to evidence studies on the performance of risk adjustment systems with additional considerations of importance to the potential HCUP QI users. These considerations were determined through semi-structured interviews with users, discussed earlier in this report. In general, users viewed risk adjustment as an important component of the HCUP QIs‘ refinement. State data organizations and agencies involved in reporting of hospital performance measures especially tended to view risk-adjustment as essential for the validity of the results and acceptance by participating hospitals. Concerns that patient severity differed systematically among providers, and that this difference might drive the performance results, was frequently mentioned as a reason for limited reporting and public release of the HCUP QIs to date, especially for outcome-oriented measures like mortality following common elective procedures. Literature-based Criteria for Evaluating Risk Adjustment Systems HCUP QI users were concerned about the validity or performance of possible risk adjustment systems. Evidence was assessed on the performance of risk-adjustment systems from published reports using the following commonly applied criteria. [79, 87, 174] 1. Classification and analytic approach. Risk adjustment systems have been developed to
predict complications, resource use, and mortality. Alternative analytic approaches included stratification (assigning individuals to mutually exclusive cells), logistic regression, or linear regression (calculating an expected level of medical utilization based on a statistical model). Methods based on logistic or linear statistical models are generally able to consider more dimensions of patient characteristics than stratification. Even more effective approaches might involve combining multivariate adjustment and stratification through propensity score methods and accounting for the relationship between aspects of disease severity that are measured and those that are not. [175, 176] However, no currently available risk adjustment systems are based on these analytic methods.
2. System development method. Risk adjustment classifications may be based either on an
empirical model clinical judgment or some combination. For example, an assessment of whether two heart attack patients are expected to have similar outcomes can be based on statistical tests or clinical expertise or both. [79]
3. Feasibility. Feasibility is largely determined by the data requirements of the risk-adjustment
method. The research team reviewed whether a system required hospital data elements other than those found on the discharge abstract (e.g., data from medical charts or laboratory data) or non-hospital data (e.g., outpatient hospital or physician data). They also evaluated whether the method was likely to be enhanced with discharge data that included a unique patient identifier, so that risk adjusters could be developed based on data from multiple hospitalizations or encounters. Because only a subset of the States participating in HCUP collect supplementary data beyond discharge abstracts or unique patient identifiers for use in longitudinal analyses, a risk adjustment system was selected that did not depend on such information.
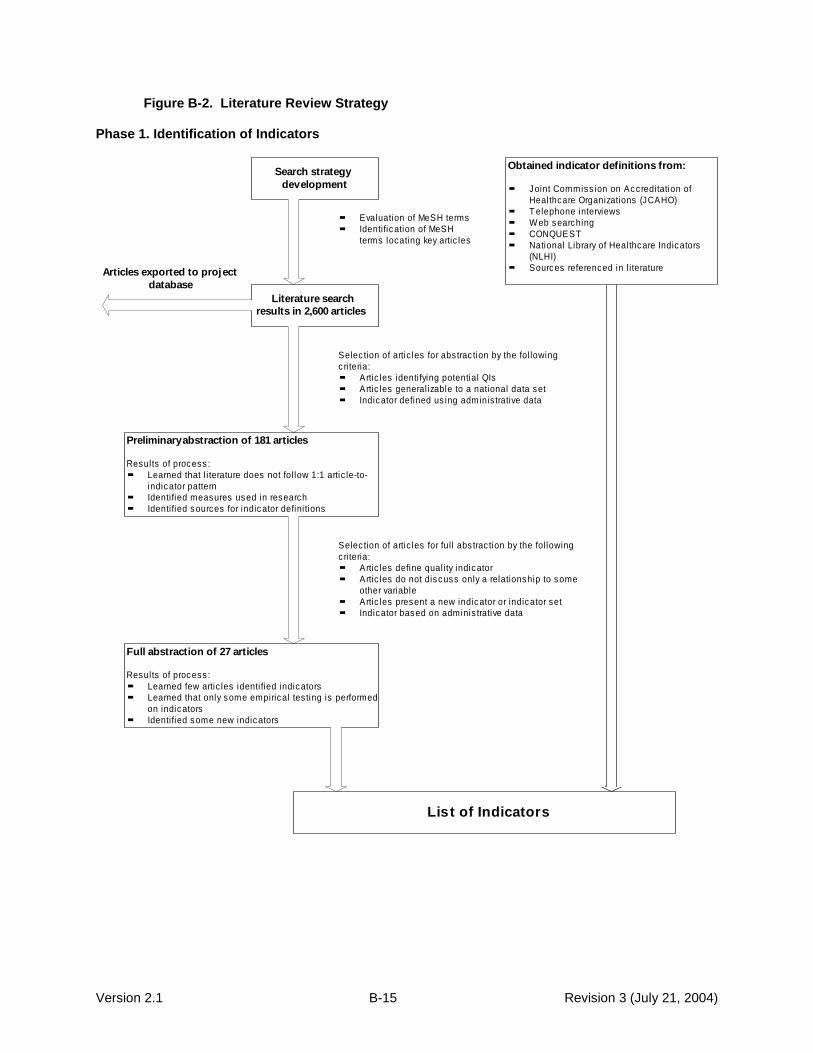
Version 2.1 B-15 Revision 3 (July 21, 2004)
Figure B-2. Literature Review Strategy Phase 1. Identification of Indicators
Search strategy
development
Literature search
results in 2,600 articles
Obtained indicator definitions from:
Joint Commiss ion on Accreditation of
Healthcare Organizations (JCAHO)
T elephone interviews
W eb searching
CONQUEST
National Library of Healthcare Indicators
(NLHI)
Sources referenced in l iterature
Preliminary abstraction of 181 articles
Results of process :
Learned that l i terature does not fol low 1:1 artic le-to-
indicator pattern
Identified measures used in research
Identified sources for indicator defini tions
Full abstraction of 27 articles
Results of process :
Learned few artic les identi fied indicators
Learned that only some empirical tes ting is performed
on indicators
Identified some new indicators
List of Indicators
Evaluation of MeSH terms
Identification of MeSH
terms locating key artic les
Selec tion of artic les for abstrac tion by the fol lowing
c ri teria:
Artic les identi fying potential QIs
Artic les general izable to a national data set
Indicator defined us ing adminis trative data
Selec tion of artic les for ful l abs trac tion by the following
c ri teria:
Artic les define qual ity indicator
Artic les do not discuss only a relationship to some
other variable
Artic les present a new indicator or indicator set
Indicator based on adminis trative data
Articles exported to project
database

Version 2.1 B-16 Revision 3 (July 21, 2004)
Phase 2. Evaluation of Indicators
Development of evaluation frameworkFace validity
Precision
M inimum bias
Construct validity
Fosters real quality improvement
Application
Identificaton of evidenceLiterature search results in additional 2,000 articles
Selection of subset of indicators
Indicators must be definable with HCUP
data
Conditions that affect at least 1% of
hospitalized patients or 20% of providers
Conditions that are the subject of public
reporting , previous use, or larg e dollar
volume
Clear relationship to q uality apparent
Criteria for specific indicator types as
described above
Project database
Final EndNote database includes 4,600 citations for
articles relating to q uality, derived from both Phase 1
and Phase 2 searches.
Preliminary empirical tests of precision
Selected measures with adequate performance
on tests of precision (1% provider-level variation
for provider indicators, 0.1% for area-level
indicators) for full evaluation with literature
review.
Evaluation
Used relevant articles from project database to evaluate evidence for
each selected indicator according to the evaluation framework
Literature search to identify literature-based evidence for
selected indicators, using multiple search strateg ies and
screening
Articles exported to project database

Version 2.1 B-17 Revision 3 (July 21, 2004)
4. Empirical performance: discrimination. A critical aspect of the performance of a risk-
adjustment model is the extent to which the model predicts a higher probability of an event for patients who actually experience the event. The statistical test of discrimination is generally expressed as a C-statistic or R
2 (how much of the variation in the patient level data the model
explains). In general, systems that discriminate more have the potential to influence QI measures more substantially. Many severity-adjustment systems were designed primarily to predict in subsequent periods (e.g., resource consumption next year). However, for purposes of evaluating QI performance, the estimation of concurrent risk is more important (i.e., differences in the likelihood of experiencing an outcome in the current time period). Ideally, discrimination would be assessed using an R
2 or other statistic of predicted variation that is
computed on a separate data source from the one used to develop the model, to avoid ―over-fitting‖ (i.e., the model might appear do well in part because it explains nonsystematic variations in the data used to develop it).
5. Empirical performance: calibration. Calibration is a measure of whether the mean of the
predicted outcomes equals the mean of the actual outcomes for the entire population and for population subgroups. The statistical test is often expressed as a Chi-square or ―goodness-of-fit‖ for the equivalence of means of population subgroups. Even if the severity-adjustment system does not predict well at the level of individuals, it may predict well at the aggregate (group) level of, say, women, 70-74 years of age. Over-fitting will be an issue here as well, unless a different data source is used to validate the model than was used to estimate the model.
Not many risk-adjustment systems have been evaluated in published reports using all of these criteria, nor have they been evaluated using consistent data sources. These limitations of the literature on risk adjustment complicate comparisons of risk adjustment systems based on performance criteria. In the end, the user-specified criteria determined a narrow set of potential risk adjustment systems to consider. The performance criteria delineated between these potential systems and informed the empirical evaluation of the impact of risk adjustment on the assessment of provider and area quality. User-specified Criteria for Evaluating Risk Adjustment Systems Evidence on the performance of a risk adjustment system is a primary consideration for HCUP QI users, and is essential to the validity of reported performance measures. However, users also cited other factors as potentially important determinants of the acceptance of HCUP QIs reporting by hospitals, State regulators and State legislatures, and other potential consumers of hospital performance data. These factors included the following: 1. ―Open‖ systems preferable to ―black box‖ systems. Although there was no specific prohibition
against using proprietary systems vs. systems in the public domain, there was a preference for using ―open‖ systems where the risk adjustment logic was published and available for scrutiny by interested parties.
2. Data collection costs minimized and well-justified. The widespread recognition that data
collection was costly for hospitals meant that any risk-adjustment system that would be imposed on hospitals had to justify the cost of data collection by documenting that the additional information led to substantially different and more accurate inferences about performance. At least one State had stopped using a risk adjustment system that required medical chart review because the high cost of implementation was not considered worth the efficiency gained from improved accuracy.
3. Multiple-use coding system. Some risk adjustment systems were designed to categorize
patients according to expected resource use, defined either as charges or length of stay, while others were designed to categorize patients according to expected health outcomes, including mortality and complications. For example, several States calculated and reported

Version 2.1 B-18 Revision 3 (July 21, 2004)
mortality rates by diagnosis-related group (DRG). These users generally believed that a risk-adjustment system for health outcomes based on discharge records that relied on the same diagnostic groups used for reimbursement was more likely to be accurate than a system that relied on codes used for quality and health outcome comparisons only, since there would be less financial and audit incentives to record codes accurately for the latter. Thus, coding systems that affected reimbursement for at least some patients were likely to capture diagnoses and procedures reported in medical charts.
One potentially important limitation of relying on codes that are also used for payment is that changes in reimbursement-related coding practices (e.g., as a result of tighter Medicare rules implemented in 1996) may alter apparent severity. However, because of the financial implications of changes in coding practices, any significant changes are likely to be identified and reported by payers, and so can be considered in interpreting variations and trends in reported quality measures.
4. Official recognition. Many users indicated that systems that had been supported or otherwise
recognized by Government agencies such as AHRQ were preferable to other systems, because such support facilitated acceptance by legislative and hospital groups. Adoption of the HCUP QIs themselves was often justified in part by their sponsorship by AHRQ. State agencies, especially those from smaller States, often cited the lack of staff resources and expertise needed to make independent evaluations of competing indicator sets and risk adjustment methods.
Risk Adjustment Empirical Methods The APR-DRG system, with severity and risk of mortality classifications, was used in two ways:
To evaluate the impact of measured differences in patient severity on the relative performance of hospitals and areas, by comparing QI measures with and without risk adjustment.
To risk-adjust the hospital- and area-specific measures. The available literature on the impact of risk adjustment on indicator performance is limited, but suggests that at least in some cases different systems may give different results. Problems of incomplete or inconsistent coding across institutions are probably important contributing factors to the differences in results. Thus, definitive risk adjustment for some indicators may require detailed reviews of medical charts and additional data sources (charts may also be incomplete), just as definitive quality measures for many indicators may require additional sources of information. However, the importance of random variations in patients means that whatever risk adjustment and quality measurement system is chosen should be used in conjunction with statistical methods that seek to minimize other sources of noise and bias. The empirical analysis is intended to illustrate the approach of combining risk adjustment with smoothing techniques, including suggestive evidence on the importance of risk adjustment for potential new QIs, using a risk adjustment system that can be implemented on discharge data by most HCUP QI users. The empirical analysis is supplemented with a review of the clinical literature to identify additional clinical information that is important to consider for certain indicators. In particular, the literature review highlights a few indicators where risk adjustment with additional clinical data has been shown to be particularly important, and where important differences in case mix seem less likely to be related to the secondary diagnoses used to risk-adjust discharge data. This section describes how risk-adjustment is implemented using patient demographics (age and sex) along with the APR-DRG classification system. The next section describes statistical methods used to account for additional sources of noise and bias not accounted for by observed patient characteristics.

Version 2.1 B-19 Revision 3 (July 21, 2004)
By applying these methods to all of the potential new QIs, the relative importance of both risk adjustment and smoothing can be evaluated in terms of the relative performance of hospitals (or areas) compared to the ―raw‖ unadjusted QIs based on simple means from NIS discharge data. The simple means fail to account both for differences in the indicators that are attributable to systematic differences in measured and unmeasured patient mix across hospitals/areas that are measured in the discharge data, and for random variations in patient mix. A multivariate regression approach was adopted to adjust performance measures for measured differences in patient mix, which permits the inclusion of multiple patient demographic and severity characteristics. Specifically, if it is denoted whether or not the event associated with a particular indicator Υ
k
(k=1,…,K) was observed for a particular patient i at hospital/area j (j=1,…,J) in year t (t=1,…,T), then the regression to construct a risk-adjusted ―raw‖ estimate of a hospital or area‘s performance on each indicator can be written as:
(1) εΠΖΜΥk
ijt
k
tijt
k
jt
k
ijt where
Υk
ijt
is the kth
quality indicator for patient i discharged from hospital/area j in year t (i.e., whether or not the event associated with the indicator occurred on that discharge);
Μk
jt
is the ―raw‖ adjusted measure for indicator k for hospital/area j in year t (i.e., the hospital/area ―fixed effect‖ in the patient-level regression);
Ζijt is a vector of patient covariates for patient i discharged from hospital/area j in year t (i.e.,
the patient-level measures used as risk adjusters);
Πk
t
is a vector of parameters in each year t, giving the effect of each patient risk adjuster on indicator k (i.e., the magnitude of the risk adjustment associated with each patient measure); and
εk
ijt is the unexplained residual in this patient-level model.
The hospital or area specific intercept Μ
kjt is the ―raw‖ adjusted measure of a hospital or area‘s
performance on the indicator, holding patient covariates constant. In most of the empirical analysis that follows, the patient-level analysis is conducted using data from all hospitals and areas. (The model shown implies that each hospital or area has data for all years, and with each year has data on all outcomes; however, this is not essential to apply risk adjustment methods.) These patient-level regressions were estimated by linear ordinary least-squares (OLS). In general, the dependent variables in the regressions are dichotomous, which raises the question of whether a method for binary dependent variables such as logit or probit estimation might be more appropriate. However, previous work by McClellan and Staiger has successfully used OLS regression for similar analyses of hospital/area differences in outcomes. In addition, estimating logit or probit models with hospital or area fixed effects cannot be done with standard methods; it requires computationally intensive conditional maximum likelihood methods that are not easily extended to multiple years and multiple measures. [177] A commonly used ―solution‖ to this problem is to estimate a logit model without hospital or area effects, and then to use the resulting predictions as estimates of the expected outcome. However, this method yields biased estimates and predictions of hospital performance. In contrast, it is easy to incorporate hospital or area fixed effects into OLS regression analysis, the resulting estimates are not biased, and the hospital or area fixed effects provide direct and easily-interpretable estimates of the outcome rate for a particular hospital or area measure in a particular year, holding constant all observed patient characteristics.

Version 2.1 B-20 Revision 3 (July 21, 2004)
Of course, it is possible that a linear probability model is not the correct functional form. However, as in earlier work, a very flexible functional form is specified, including full interactions among age and sex covariates as well as a full set of APR-DRG risk adjusters. In the sensitivity analyses for selected quality measures, this flexible linear probability model produced estimates of the effects of the risk adjusters that did not differ substantially from nonlinear (logit and probit) models. Another potential limitation of the OLS approach is that it may yield biased estimates of confidence intervals, because the errors of a linear probability model are necessarily heteroskedastic. Given the large sample sizes for the parameters estimated from these regressions (most indicators involve thousands of ―denominator‖ discharges per year), such efficiency is not likely to be an important concern. Nevertheless, models were estimated using Weighted Least Squares to account for heteroskedasticity, to see if estimates were affected [178]. Very similar estimates of adjusted indicator performance were obtained. Specifically, in addition to age, sex, and age*sex interactions as adjusters, the model also included the APR-DRG category for the admission and the APR-DRG constructed severity subclass (or risk-of-mortality subclass for mortality measures). APR-DRGs are a refinement of the DRGs used by the Centers for Medicare and Medicaid Services (formerly the Health Care Financing Administration), with additional classifications for non-Medicare cases (e.g., neonates). The severity subclass evaluates the episode of care on a scale of 1 (minor) to 4 (extreme). In the APR-DRG Version 12, Severity of Illness is defined as the ―extent of physiologic de-compensation or organ system loss of function.‖ The APR-DRG severity of illness subclass was designed principally to predict resource use, particularly length-of-stay. As such, because this risk-adjustment system was not designed to predict utilization rates, for example, the evaluation of each indicator does not consider lack of impact of risk-adjustment to be evidence of lack of real bias. However, impact of risk-adjustment is considered to be evidence of problems of potential bias. The literature review further informs potential sources of bias, and the prior use of each indicator may require collection of supplemental data for confounding clinical conditions. For each indicator, the APR-DRG groupings in the Major Diagnostic Category (MDC) related to that indicator were excluded from the risk adjustment model. The groupings are either medical (based on diagnoses) or surgical (based on procedures), and groupings in the MDC of the same type were excluded. For example, for the Coronary Artery Bypass Graft rate indicator, all surgical APR-DRGs in MDC ‗05‘ (‗Diseases and Disorders of the Circulatory System‘) were excluded. For GI Hemorrhage mortality, all medical APR-DRGs in MDC ‗06‘ (‗Diseases and Disorders of the Digestive System‘) were excluded. Some of the indicators fall into only a few DRG categories. All discharges with carotid endarterectomy, for example, were within DRG ‗005‘, (‗Extracranial Vascular Procedures‘). These indicators relied primarily on the severity subclass, which is independent of the DRG. Actual implementation of the model involves running a regression with potentially a few thousand variables (each DRG divided into four severity subclasses) on millions of observations, straining the capacity of most statistical software and computer systems. In order to limit the number of covariates (DRG groups) in the model, the total number was restricted to 165 categories (DRG by severity), which was for all indicators sufficient to include 80% of discharges. All severity or risk-of-mortality subgroups were maintained for each APR-DRG included in the model in the construction of the raw adjusted estimates. The adjusted estimates of hospital performance are reported and used to compute descriptive statistics for each indicator in each year. They are also used to construct smoothed estimates of each indicator. The risk-adjusted estimates of hospital performance (age, gender, APR-DRG) and area performance (age, gender only) were used to construct descriptive statistics and smoothed estimates for each QI.

Version 2.1 B-21 Revision 3 (July 21, 2004)
Empirical Methods
Analysis Approach Data sources. The data sources used in the empirical evaluation were the 1995-97 Nationwide Inpatient Sample (NIS), which has been used for previous HCUP QI development, and the complete State Inpatient Data (SID) for five HCUP participating States (California, Florida, Illinois, New York, and Pennsylvania). The annual NIS consists of about 6 million discharges and over 900 hospitals. The NIS contains all-payer data on hospital inpatient stays from selected States (Arizona, California, Colorado, Connecticut, Florida, Georgia, Hawaii, Illinois, Iowa, Kansas, Maryland, Massachusetts, Missouri, New Jersey, New York, Oregon, Pennsylvania, South Carolina, Tennessee, Utah, Washington, and Wisconsin). All discharges from sampled hospitals are included in the NIS database. The NIS is designed to approximate a 20% sample of U.S. community hospitals, defined as all non-Federal, short-term, general, and other specialty hospitals, excluding hospital units of institutions. Included among community hospitals are specialty hospitals such as obstetrics-gynecology, ear-nose-throat, short-term rehabilitation, orthopedic, and pediatric. Excluded are long-term hospitals, psychiatric hospitals, and alcoholism/chemical dependency treatment facilities. A complete description of the content of the NIS, including details of the participating States discharge abstracts, can be found on the Agency for Healthcare Research and Quality Web site (http://www.ahrq.gov/data/hcup/hcupnis.htm). The SID sample consisted of 10 million discharges and over 1,300 hospitals in over 200 metropolitan areas. Only the SID empirical results are reported, because the provider-level results were similar in both data sources, and the SID data were needed for the direct construction of area measures. All of the quality indicators can be constructed from the NIS with two caveats: first, the area measures are based on a weighted sample of discharges and are less precise than if complete State discharge data are used, and second, even though hospital sampling for the NIS was supposed to allow construction of a representative sample at the State level, it is possible that the Metropolitan Service Area (MSA)-level samples are not representative (i.e., biased). These limitations are not applicable when using the software on the full data from the SID to construct measures based on complete data from area hospitals. Reported quality indicators. All potential indicators were assessed empirically by developing and conducting statistical tests for evaluation framework criteria of precision, bias, and construct validity. For each statistical test, up to four different estimates of indicator performance were calculated. First, the raw indicator was the simple observed value (e.g., the rate or volume) for each provider or area. Second, the adjusted indicator was based on the use of multivariate regression to account for differences among providers in demographics and comorbidities (defined using the 3M APR-DRG) of patients, and among areas in demographics of the population. Third, univariate smoothing techniques were applied to estimate the amount of random error relative to the true difference in performance (the ―reliability‖) for each indicator. [68] Fourth, new multivariate signal extraction methods were applied by combining information from multiple indicators over several years to extract more quality signal from each individual indicator than is possible with the univariate methods. [179] Overview of empirical analysis. The approach included several stages and generated a series of analyses on potential quality indicators that sequentially assessed some of the problems identified in the literature review. For reference, the ―raw‖ or minimally adjusted indicator was constructed, based on the discharge data for each hospital and census data for each area. This measure was then ―risk-adjusted‖ through a discharge-level regression that included controls for patient mix. The hospital-level and area-level fixed effects in these regressions are the estimates of quality indicators that are typically reported for particular hospitals and areas, and they typically reflect substantial noise. In the second stage of the analysis, these estimates were then ―smoothed‖ using a Bayesian procedure to yield a best-guess estimate of true hospital or area performance on the indicator — the ―signal‖ in the observed noisy measure. This was done in two ways. First, a univariate approach was used, in which the distribution of the indicator itself is used to construct the best guess. This is the smoothing or shrinkage approach most widely used in the literature on provider quality. [69-71] Second, a multivariate approach was used, in which the joint distribution of a large number of indicators (and the indicator of interest in previous time

Version 2.1 B-22 Revision 3 (July 21, 2004)
periods) is used to construct the best-guess estimate of performance. In general, the covariation among different indicators and within each indicator over time implies that much more precise estimates of true hospital or area quality can be generated using this multivariate signal extraction approach. All of the estimates of factor loadings and correlations are based on smoothed estimates, which helps to improve the ability to detect correlations, thereby addressing the multidimensionality of quality. Finally, summary statistics are reported describing the performance of the indicator in terms of the principal domains described in the literature review: precision, bias, and construct validity. Intuition Behind Univariate and Multivariate Methods An important limitation of many quality indicators is their imprecision, which complicates the reliable identification of persistent differences among providers in performance. The imprecision in quality indicators arises from two sources. The first is sampling variation, which is a particular problem for indicators based on small numbers of patients per provider (where the particular patients treated by the provider in a given year are considered a ―sample‖ of the entire population who might have been treated or will be treated in the near future). The amount of variation due to the particular sample of patients is often large relative to the total amount of provider-level variation that is observed in any given quality indicator. A second source of imprecision arises from non-persistent factors that are not sensitive to the size of the sample; for example, a severe winter results in higher than usual rates of pneumonia mortality. Both small samples and other one-time factors that are not sensitive to sample size can add considerable volatility to quality indicators. Also, it is not the absolute amount of imprecision that matters, but rather the amount of imprecision relative to the underlying signal (i.e., true provider-level variation) that dictates the reliability of any particular indicator. Even indicators based on relatively large samples with no non-persistent factors at work can be imprecise if the true level of variation among providers is negligible. The approach to account for the imprecision or lack of reliability is a generalization of the idea of applying a ―shrinkage factor‖ to each provider‘s estimate so that less reliable estimates are shrunk toward the national average. These ―reliability-adjusted‖ estimates are sometimes referred to as ―smoothed‖ estimates (because provider performance is less volatile over time) or ―filtered‖ estimates (because the methods filter out the non-systematic noise, much like a radio filters our background noise to improve the radio signal). If the observed provider variation = signal variation + noise variation, then the shrinkage
factor would be (signal variation (signal variation + noise variation). For example, suppose that the observed variation among providers in the in-hospital pneumonia mortality rate was a standard deviation of 10.2 percentage points, and the signal variation was a standard deviation of 5.0 percentage points. Then the shrinkage factor for this indicator is 0.240 = (0.050^2) (0.102^2). The generalization of this approach seeks to extract additional signal using information on the relationship among multiple indicators over time. Many of the key ideas behind the reliability-adjusted or filtered estimates are illustrated through a simple example. Suppose that one wants to evaluate a particular provider‘s performance based on in-hospital mortality rates among patients admitted with pneumonia, and data are available for the most recent 2 years. Consider the following three possible approaches: (1) use only the most recent mortality rate, (2) construct a simple average of the mortality rates from the 2 recent years, or (3) ignore the provider‘s mortality rate and assume that mortality is equal to the national average. The best choice among these three approaches depends on two important considerations: the signal-to-noise ratio in the provider‘s data and how strongly correlated performance is from one year to the next. For example, suppose that the mortality rate for the provider was based on only a few patients, and one had reason to believe that mortality did not vary much across providers. Then one would be tempted to choose the last option and ignore the provider‘s own data because of its low reliability (e.g., low signal-to-noise ratio). This is the idea of simple shrinkage estimators, in which less reliable estimates are shrunk toward the average for all providers. Alternatively, if one had reason to believe that provider mortality changed very slowly over time, one might choose the second option in hopes that averaging the data over 2 years would reduce the noise in the estimates by effectively increasing the sample size in the provider. Even with large numbers of patients, one might want to average over years if idiosyncratic factors (such as a bad winter) affected mortality rates from any single year. Finally, one would tend to

Version 2.1 B-23 Revision 3 (July 21, 2004)
choose the first option, and rely solely on mortality from the most recent year, if such idiosyncratic factors were unimportant, if the provider admitted a large number of patients each year, and if mortality was likely to have changed from the previous year. The method of creating filtered estimates formalizes the intuition from this simple example. The filtered estimates are a combination of the provider‘s own quality indicator, the national average, and the provider‘s quality indicators from past years or other patient outcomes. As suggested by the example, to form the optimal combination, one must know the amount of noise and signal variance in each indicator, as well as the correlation across indicators in the noise and signal variance. The noise variance (and covariance) is estimated in a straightforward manner for each provider, based on the number of patients on which each indicator is based. To estimate the signal variance (and covariance) for each quality indicator, the noise variance is subtracted from the total variance observed in each indicator across providers (which reflects both signal and noise variance). In other words, the observed variation in quality indicators is sure to overstate the amount of actual variation across providers (because of the noise in the indicators). Therefore, the amount of true variation in performance is estimated based on how much the observed variation exceeded what would have been expected due to sampling error. Importantly, this method does not assume that provider performance is correlated from one year to the next (or that performance is correlated across indicators). Instead, these correlations are estimated directly from the data, and information from past years or other indicators is incorporated only to the extent that these empirically estimated correlations are large. Smoothed Estimates of Hospital Performance For each hospital, a vector of K adjusted indicator estimates was observed over T years from estimating the patient-level regressions (1) run separately by year for each indicator as described in the preceding section. Each indicator is a noisy estimate of true hospital quality; in other words, it is likely that hospitals that performed especially well or badly on the measure did so at least in part due to chance. This fact is incorporated in Bayesian methods for constructing best-guess ―posterior‖ estimates of true provider performance based on observed performance and the within-provider noise in the measures. In particular, let Mj be the 1xTK vector of estimated indicator performance for hospital j. Then:
(2) εμM j,jj
Where μj is a 1xTK vector of the true hospital intercepts for hospital j, and εj is the estimation error (which has a mean zero and is uncorrelated with μj). Note that the variance of εj can be estimated from the patient-level regressions, since this is simply the variance of the regression estimates Mj. In particular,
E(εjt’ εjt) = jt and E(εjt’ εjs) = 0 for t s, where jt is the covariance matrix of the intercept estimates for hospital j in year t. A linear combination of each hospital‘s observed indicators must be created in such a way that it
minimizes the mean-squared prediction error. In other words, the following hypothetical regression
should be run:
(3) νβMμk
jt
k
jtj
k
jt
but cannot be run directly, since is unobserved and the optimal varies by hospital and year. While
equation (3) cannot be directly estimated, it is possible to estimate the parameters for this hypothetical
regression. In general, the minimum mean squared error linear predictor of is given by Mj , where =
[E(Mj’Mj)]-1
E(Mj’j). This best linear predictor depends on two moment matrices:

Version 2.1 B-24 Revision 3 (July 21, 2004)
(4.1) εεΕμμΕΜΜΕ jjjjjj'''
(4.2) μμΕμΜΕ jjjj''
The required moment matrices are estimated directly as follows:
Estimate Ε(εj'εj) with the patient-level OLS estimate of the covariance matrix for the parameter estimates Mj. Call this estimate Ѕj. Note that Ѕj varies across hospitals.
Estimate E(j’j) by noting that E(Mj’Mj-Ѕj) = E(j’j). If assumed that E(j’j) is the same for all hospitals, then it can be estimated by the sample average of Mj’Mj-Ѕj. Note that it is easy
to relax the assumption that E(j’j) is the same for all hospitals by calculating Mj’Mj-Ѕj for subgroups of hospitals.
With estimates of E(j’j)and Ε(εj'εj), one can form least squares estimates of the parameters in equation 3 which minimize the mean squared error. Analogous to simple regression, the prediction of a hospital‘s true intercept is given by:
(5) μμΕεεΕμμΕΜμΜΕΜΜΕΜμjjjjjjjjjjjjj
'''''11
ˆ
using estimates of E(j’j)and Ε(εj'εj) in place of their true values. One can use the estimated moments to calculate other statistics of interest as well, such as the standard error of the prediction and the r-squared for equation 3, based on the usual least squares formulas. Estimates based on equation (5) are referred to as ―filtered‖ estimates, since the key advantage of such estimates is that they optimally filter out the estimation error in the raw quality indicators. Equation 5 in combination with estimates of the required moment matrices provides the basis for estimates of hospital quality. Such estimates of hospital quality have a number of attractive properties. First, they incorporate information in a systematic way from many outcome indicators and many years into the predictions of any one outcome. Moreover, if the moment matrices were known, the estimates of hospital quality represent the optimal linear predictors, based on a mean squared error criterion. Finally, these estimates maintain many of the attractive aspects of existing Bayesian approaches, while dramatically simplifying the complexity of the estimation. [69] It is possible to construct univariate smoothed estimates of hospital quality, based only on empirical estimates for particular measures, using the models just described but restricting the dimension of Mj to only a particular indicator k and time period t. Of course, to the extent that the provider indicators are correlated with each other and over time, this will result in a less precise (efficient) estimate.
With many years of data, it helps to impose some structure on E(j’j) for two reasons. First, this improves the precision of the estimated moments by limiting the number of parameters that need to be estimated. Second, a time series structure allows for out-of-sample forecasts. A non-stationary, first-order Vector Autoregression structure (VAR) is used. The VAR model is a generalization of the usual autoregressive model, and assumes that each hospital‘s quality indicators in a given year depend on the hospital‘s quality indicators in past years plus a contemporaneous shock that may be correlated across
quality indicators. In most of what follows, a non-stationary first-order VAR is assumed for jt (1xK), where:
(6) ΓμVΣυVυΦμμjjtjtj,tjt
andwith, 11
Thus, estimates are needed of the lag coefficient (Φ), the variance matrix of the innovations (Σ), and the initial variance condition (Γ), where Σ and Γ are symmetric ΚxΚ matrices of parameters and Φ is a

Version 2.1 B-25 Revision 3 (July 21, 2004)
general ΚxΚmatrix of parameters, for a total of 2Κ2+Κ parameters. For example, 10 parameters must be
estimated for a VAR model with two outcomes (Κ=2).
The VAR structure implies that E(Mj’Mj-Ѕj) = E(j’j) = f(Φ,Σ,Γ). Thus, the VAR parameters can be estimated by Optimal Minimum Distance (OMD) methods, i.e., by choosing the VAR parameters so that the theoretical moment matrix, f(Φ,Σ,Γ), is as close as possible to the corresponding sample moments from the sample average of Mj’Mj-Ѕj. More specifically, let dj be a vector of the non-redundant (lower triangular) elements of Mj’Mj-Ѕj and let δ be a vector of the corresponding moments from the true moment matrix, so that δ=g(Φ,Σ,Γ). [177] Then the OMD estimates of (Φ,Σ,Γ) minimize the following OMD objective function:
(7)
Γ,Σ,ΦgdVΓ,Σ,ΦgdΜq 1
where V is the sample estimate of the covariance matrix for d, and d is the sample average of d. If the
VAR model is correct, the value of the objective function, g, will be distributed Χ2 (p) where p is the
degree of over-identification (the difference between the number of elements in d and the number of parameters being estimated). Thus, q provides a goodness of fit statistic that indicates how well the VAR model fits the actual covariances in the data. Finally, estimated R
2 statistics are used to evaluate the filtered estimates‘ ability to predict (in
sample) and forecast (out-of-sample) variation in the true intercepts, and to compare methods used to conventional methods (e.g., simple averages, or univariate shrinkage estimators). If true hospital intercepts (μ) were observed, a natural metric for evaluating the predictions would be the sample R-squared:
(8)
N
jj
N
jjuR
1
2
1
22
1 ˆ
where ˆˆjjju
is the prediction error. Of course μis not observed. Therefore, an estimate is constructed using the
estimate of E(j’j) for the denominator, and the estimate of
μμμμΕ jjjj
ˆˆ
for the terms in the numerator (where this can be constructed from the estimated moment matrices in equations 4.1 and 4.2). Finally, a weighted R-squared is reported (weighting by the number of patients treated by each hospital).
As in earlier work using this method for cardiac care in the adult population, the indicators are validated using out-of-sample performance, based on forecasts (e.g., using the first 2 years of data to predict in subsequent year) and based on split-sample prediction (e.g., using one-half of the patient sample to predict outcome indicators in the other half of the sample). For evaluating out-of-sample forecasts, a modified R-squared of the forecast is constructed that estimates the fraction of the systematic (true) hospital variation in the outcome measure (M) that was explained:

Version 2.1 B-26 Revision 3 (July 21, 2004)
(9)
N
jjj
N
jjj SSR
1
2
1
22
1 ˆ~
where ˆˆ jjj
is the forecast error and Sj is the OLS estimate of the variance of the estimate Mj. This modified R-squared estimates the amount of variance in the true hospital effects that has been forecast. Note that because these are out-of-sample forecasts, the R-squared can be negative, indicating that the forecast performed worse than a naive forecast in which one assumed that quality was equal to the national average at all hospitals. Empirical Analysis Statistics Using the methods just described, a set of statistical tests was constructed to evaluate precision, bias, and construct validity. Each of the key statistical test results for these evaluation criteria was summarized and explained in the beginning of this appendix. Tables B1-B3 provides a summary of the statistical analyses and their interpretation. Indicators were tested for precision first, and ones that performed poorly were eliminated from further consideration. Bias and construct validity were assessed for all recommended indicators.
Table B-1. Precision Tests
Measure Statistic Interpretation
Precision. Is most of the variation in an indicator at the level of the provider? Do smoothed estimates of quality lead to more precise measures?
a. Raw variation in indicator
Provider Standard Deviation Signal Standard Deviation Provider/Area Share
Unadjusted Age-sex adjusted Age-sex + APR-DRG adjusted
Provider variation is signal variation + noise variation. What percentage of the total variation (patient + provider) is between-provider variation (a measure of how much variation is subject to provider control). Risk adjustment can either increase or decrease true variation.
b. Univariate smoothing
Signal/Signal-to-noise ratio: Unadjusted Age-sex adjusted Age-sex + APR-DRG adjusted
Estimates what percentage of the observed variation between providers reflects ―true‖ quality differences versus random noise. Risk adjustment can increase or decrease estimates of ―true‖ quality differences.
c. MSX methods In-sample R-squared: Unadjusted Age-sex adjusted Age-sex + APR-DRG adjusted
To the extent that indicators are correlated with each other and over time, MSX methods can extract more ―signal‖ (a higher percentage of observed variation between providers that reflects ―true‖ quality).

Version 2.1 B-27 Revision 3 (July 21, 2004)
Table B-2. Bias Tests
Measure Statistic Interpretation
Bias. Does risk-adjustment change the assessment of relative provider performance, after accounting for reliability? Is the impact greatest among the best or worst performers, or overall? What is the magnitude of the change in performance?
a. MSX methods: unadjusted vs. age, sex, APR-DRG risk adjustment
Rank correlation coefficient (Spearman) Risk-adjustment matters to the extent that it alters the assessment of relative provider performance. This test determines the impact overall.
Average absolute value of change relative to mean
This test determines whether the absolute change in performance was large or small relative to the overall mean.
Percentage of the top 10% of providers that remains the same
This test measures the impact at the highest rates (in general, the worse performers, except for measures like VBAC).
Percentage of the bottom 10% of providers that remains the same
This test measures the impact at the lowest rates (in general, the best performers, except for measures like VBAC).
Percentage of providers that move more than two deciles in rank (up or down)
This test determines the magnitude of the relative changes.
Table B-3. Construct Validity Tests
Measure Statistic Interpretation
Construct validity. Is the indicator related to other indicators in a way that makes clinical sense? Do methods that remove noise and bias make the relationship clearer?
a. Correlation of indicator with other indicators
Pearson correlation coefficient Are indicators correlated with other indicators in the direction one might expect?
b. Factor loadings of indicator with other indicators
Factor loadings Do indicators load on factors with other indicators that one might expect?

Version 2.1 B-28 Revision 3 (July 21, 2004)
References for Appendix B
1. McGlynn EA, Asch SM. Developing a clinical performance measure. Am J Prev Med 1998;14(3
Suppl):14-21.
2. Siu AL, McGlynn EA, Morgenstern H, et al. Choosing quality of care measures based on the expected impact of improved care on health. Health Serv Res 1992;27(5):619-50.
3. Donabedian A. Explorations in Quality Assessment and Monitoring. The definition of quality and approaches to its assessment. Ann Arbor, MI: Health Administration Press; 1980.
4. Donabedian A. The quality of care: how can it be assessed? JAMA 1988;260(12):1743-1748.
5. Schneider EC, Epstein AM. Influence of cardiac-surgery performance reports on referral practices and access to care. A survey of cardiovascular specialists. N Engl J Med 1996;335(4):251-6.
6. Mennemeyer ST, Morrisey MA, Howard LZ. Death and reputation: how consumers acted upon HCFA mortality information. Inquiry 1997;34(2):117-28.
7. Hibbard JH, Jewett JJ. Will quality report cards help consumers? Health Aff (Millwood) 1997;16(3):218-28.
8. Normand SL, McNeil BJ, Peterson LE, et al. Eliciting expert opinion using the Delphi technique: identifying performance indicators for cardiovascular disease. Int J Qual Health Care 1998;10(3):247-60.
9. Veroff DR, Gallagher PM, Wilson V, et al. Effective reports for health care quality data: lessons from a CAHPS demonstration in Washington State. Int J Qual Health Care 1998;10(6):555-60.
10. Delbanco TL, Stokes DM, Cleary PD, et al. Medical patients' assessments of their care during hospitalization: insights for internists. J Gen Intern Med 1995;10(12):679-85.
11. Laine C, Davidoff F. Patient-centered medicine. A professional evolution. JAMA 1996;275(2):152-6.
12. Allen HM, Jr., Rogers WH. Consumer surveys of health plan performance: a comparison of content and approach and a look to the future. Jt Comm J Qual Improv 1996;22(12):775-94.
13. Cleary PD, Edgman-Levitan S. Health care quality. Incorporating consumer perspectives. JAMA 1997;278(19):1608-12.
14. Eye on patients: excerpts from a report on patients' concerns and experiences about the health care system. American Hospital Association and the Picker Institute. J Health Care Finance 1997;23(4):2-11.
15. Calnan MW. The patient's perspective. Int J Technol Assess Health Care 1998;14(1):24-34.
16. Tye L. Patient surveys show how Massachusetts hospitals stack up. Boston Globe 1998 November 13, 1998;Sect. A1, A34.
17. Finkelstein BS, Harper DL, Rosenthal GE. Patient assessments of hospital maternity care: a useful tool for consumers? Health Serv Res 1999;34(2):623-40.
Version 2.1 B-29 Revision 3 (July 21, 2004)
18. Berwick DM, Wald DL. Hospital leaders' opinions of the HCFA mortality data. JAMA 1990;263(2):247-9.
19. Jencks SF, Daley J, Draper D, et al. Interpreting hospital mortality data. The role of clinical risk adjustment. JAMA 1988;260(24):3611-6.
20. Park RE, Brook RH, Kosecoff J, et al. Explaining variations in hospital death rates. Randomness, severity of illness, quality of care. JAMA 1990;264(4):484-90.
21. Localio AR, Hamory BH, Sharp TJ, et al. Comparing hospital mortality in adult patients with pneumonia. A case study of statistical methods in a managed care program. Ann Intern Med 1995;122(2):125-32.
22. Localio AR, Hamory BH, Fisher AC, et al. The public release of hospital and physician mortality data in Pennsylvania. A case study. Med Care 1997;35(3):272-286.
23. Hofer TP, Hayward RA. Identifying poor-quality hospitals. Can hospital mortality rates detect quality problems for medical diagnoses? Med Care 1996;34(8):737-53.
24. Thomas JW, Hofer TP. Accuracy of risk-adjusted mortality rate as a measure of hospital quality of care. Med Care 1999;37(1):83-92.
25. Mant J, Hicks N. Detecting differences in quality of care: the sensitivity of measures of process and outcome in treating acute myocardial infarction. BMJ 1995;311(7008):793-6.
26. Palmer RH. Process-based measures of quality: the need for detailed clinical data in large health care databases. Ann Intern Med 1997;127(8 Pt 2):733-8.
27. Eddy DM. Performance measurement: problems and solutions . Health Aff (Millwood) 1998;17(4):7-25.
28. Harr DS, Balas EA, Mitchell J. Developing quality indicators as educational tools to measure the implementation of clinical practice guidelines. Am J Med Qual 1996;11(4):179-85.
29. Ellerbeck EF, Jencks SF, Radford MJ, et al. Quality of care for Medicare patients with acute myocardial infarction. A four-state pilot study from the Cooperative Cardiovascular Project . JAMA 1995;273(19):1509-14.
30. Marciniak TA, Ellerbeck EF, Radford MJ, et al. Improving the quality of care for Medicare patients with acute myocardial infarction: results from the Cooperative Cardiovascular Project . JAMA 1998;279(17):1351-7.
31. Donabedian A. Evaluating the quality of medical care. Milbank Mem Fund Q 1966;44(3):Suppl:166-206.
32. Brook RH, McGlynn EA, Cleary PD. Quality of health care. Part 2: measuring quality of care. N Engl J Med 1996;335(13):966-70.
33. Luft HS, Bunker JP, Enthoven AC. Should operations be regionalized? The empirical relation between surgical volume and mortality. N Engl J Med 1979;301(25):1364-9.
34. Hughes RG, Garnick DW, Luft HS, et al. Hospital volume and patient outcomes. The case of hip fracture patients. Med Care 1988;26(11):1057-67.

Version 2.1 B-30 Revision 3 (July 21, 2004)
35. Hannan EL, JF OD, Kilburn H, Jr., et al. Investigation of the relationship between volume and mortality for surgical procedures performed in New York State hospitals. JAMA 1989;262(4):503-10.
36. Hannan EL, Kilburn H, Jr., Bernard H, et al. Coronary artery bypass surgery: the relationship between inhospital mortality rate and surgical volume after controlling for clinical risk factors. Med Care 1991;29(11):1094-107.
37. Stone VE, Seage GRd, Hertz T, et al. The relation between hospital experience and mortality for patients with AIDS. JAMA 1992;268(19):2655-61.
38. Hosenpud JD, Breen TJ, Edwards EB, et al. The effect of transplant center volume on cardiac transplant outcome. A report of the United Network for Organ Sharing Scientific Registry. JAMA 1994;271(23):1844-9.
39. Jones A, O'Driscoll K, Luke LC. Head injuries and the observation ward [letter; comment]. J Accid Emerg Med 1995;12(2):160-1.
40. Phibbs CS, Bronstein JM, Buxton E, et al. The effects of patient volume and level of care at the hospital of birth on neonatal mortality. JAMA 1996;276(13):1054-9.
41. Ellis SG, Weintraub W, Holmes D, et al. Relation of operator volume and experience to procedural outcome of percutaneous coronary revascularization at hospitals with high interventional volumes. Circulation 1997;95(11):2479-84.
42. Jollis JG, Peterson ED, Nelson CL, et al. Relationship between physician and hospital coronary angioplasty volume and outcome in elderly patients. Circulation 1997;95(11):2485-91.
43. Hannan EL, Racz M, Ryan TJ, et al. Coronary angioplasty volume-outcome relationships for hospitals and cardiologists. JAMA 1997;277(11):892-8.
44. Dardik A, Burleyson GP, Bowman H, et al. Surgical repair of ruptured abdominal aortic aneurysms in the state of Maryland: factors influencing outcome among 527 recent cases. J Vasc Surg 1998;28(3):413-20.
45. Rosenthal GE, Shah A, Way LE, et al. Variations in standardized hospital mortality rates for six common medical diagnoses: implications for profiling hospital quality. Med Care 1998;36(7):955-64.
46. Cebul RD, Snow RJ, Pine R, et al. Indications, outcomes, and provider volumes for carotid endarterectomy. JAMA 1998;279(16):1282-7.
47. Begg CB, Cramer LD, Hoskins WJ, et al. Impact of hospital volume on operative mortality for major cancer surgery. JAMA 1998;280(20):1747-51.
48. Thiemann DR, Coresh J, Oetgen WJ, et al. The association between hospital volume and survival after acute myocardial infarction in elderly patients . N Engl J Med 1999;340(21):1640-8.
49. Pratt R, Burr G, Leelarthaepin B, et al. The effects of All-RN and RN-EN staffing on the quality and cost of patient care. Aust J Adv Nurs 1993;10(3):27-39.
50. Archibald LK, Manning ML, Bell LM, et al. Patient density, nurse-to-patient ratio and nosocomial infection risk in a pediatric cardiac intensive care unit. Pediatr Infect Dis J 1997;16(11):1045-8.
51. Blegen MA, Goode CJ, Reed L. Nurse staffing and patient outcomes. Nurs Res 1998;47(1):43-50.

Version 2.1 B-31 Revision 3 (July 21, 2004)
52. Czaplinski C, Diers D. The effect of staff nursing on length of stay and mortality. Med Care 1998;36(12):1626-38.
53. Kovner C, Gergen PJ. Nurse staffing levels and adverse events following surgery in U.S. hospitals. Image J Nurs Sch 1998;30(4):315-21.
54. McCloskey JM. Nurse staffing and patient outcomes. Nurs Outlook 1998;46(5):199-200.
55. Bond CA, Raehl CL, Pitterle ME, et al. Health care professional staffing, hospital characteristics, and hospital mortality rates. Pharmacotherapy 1999;19(2):130-8.
56. Wennberg J, Gittelsohn. Small area variations in health care delivery. Science 1973;182(117):1102-8.
57. Wennberg J, Gittelsohn A. Variations in medical care among small areas. Sci Am 1982;246(4):120-34.
58. Markowitz JS, Pashko S, Gutterman EM, et al. Death rates among patients hospitalized with community-acquired pneumonia: a reexamination with data from three states. Am J Public Health 1996;86(8 Pt 1):1152-4.
59. Hofer TP, Wolfe RA, Tedeschi PJ, et al. Use of community versus individual socioeconomic data in predicting variation in hospital use. Health Serv Res 1998;33(2 Pt 1):243-59.
60. Jencks SF, Dobson A. Refining case-mix adjustment. The research evidence. N Engl J Med 1987;317(11):679-86.
61. Shapiro MF, Park RE, Keesey J, et al. The effect of alternative case-mix adjustments on mortality differences between municipal and voluntary hospitals in New York City. Health Serv Res 1994;29(1):95-112.
62. Halm EA, Lee C, Chassin MR. How is volume related to quality in health care? A systematic review of the research literature: Institute of Medicine, National Academy of Sciences, Division of Health Care Services, Committee on Quality of Care in America; 2000 May 1.
63. Thomas J, Holloway J, Guire K. Validating risk-adjusted mortality as an indicator for quality of care. Inquiry 1993;30(1):6-22.
64. Hofer TP, Hayward RA. Can early re-admission rates accurately detect poor-quality hospitals? Med Care 1995;33(3):234-45.
65. Thomas JW. Does risk-adjusted readmission rate provide valid information on hospital quality? Inquiry 1996;33(3):258-70.
66. Normand ST, Glickman ME, Sharma RG, et al. Using admission characteristics to predict short-term mortality from myocardial infarction in elderly patients. Results from the Cooperative Cardiovascular Project . JAMA 1996;275(17):1322-8.
67. Thomas JW, Hofer TP. Research evidence on the validity of risk-adjusted mortality rate as a measure of hospital quality of care. Med Care Res Rev 1998;55(4):371-404.
68. Hofer TP, Hayward RA, Greenfield S, et al. The unreliability of individual physician "report cards" for assessing the costs and quality of care of a chronic disease . JAMA 1999;281(22):2098-105.

Version 2.1 B-32 Revision 3 (July 21, 2004)
69. Normand S, Glickman M, Gastonis C. Statistical methods for profiling providers of medical care: Issues and applications. JASA 1997;92(439):803-814.
70. O'Hagan A. Bayesian Inference. In: al. GPe, editor. Kendall's Advanced Theory of Statistics. New York: Halstead Press; 1994.
71. Goldstein H. Multilevel Statistical Models. 2nd ed. New York: Halstead Press; 1995.
72. Wennberg JE, Freeman JL, Shelton RM, et al. Hospital use and mortality among Medicare beneficiaries in Boston and New Haven. N Engl J Med 1989;321(17):1168-73.
73. Fisher ES, Wennberg JE, Stukel TA, et al. Hospital readmission rates for cohorts of Medicare beneficiaries in Boston and New Haven. N Engl J Med 1994;331(15):989-95.
74. Miller MG, Miller LS, Fireman B, et al. Variation in practice for discretionary admissions. Impact on estimates of quality of hospital care . JAMA 1994;271(19):1493-8.
75. Rosenthal GE, Harper DL, Shah A, et al. A regional evaluation of variation in low-severity hospital admissions. J Gen Intern Med 1997;12(7):416-22.
76. Fisher ES, Wennberg JE, Stukel TA, et al. Associations among hospital capacity, utilization, and mortality of US Medicare beneficiaries, controlling for sociodemographic factors. Health Serv Res 2000;34(6):1351-62.
77. McClellan M, McNeil BJ, Newhouse JP. Does more intensive treatment of acute myocardial infarction in the elderly reduce mortality? Analysis using instrumental variables. JAMA 1994;272(11):859-66.
78. Iezzoni LI, Ash AS, Shwartz M, et al. Judging hospitals by severity-adjusted mortality rates: the influence of the severity-adjustment method. Am J Public Health 1996;86(10):1379-87.
79. Iezzoni LI. The risks of risk adjustment. JAMA 1997;278(19):1600-7.
80. Iezzoni LI, Heeren T, Foley SM, et al. Chronic conditions and risk of in-hospital death. Health Serv Res 1994;29(4):435-60.
81. Jones RH, Hannan EL, Hammermeister KE, et al. Identification of preoperative variables needed for risk adjustment of short-term mortality after coronary artery bypass graft surgery. The Working Group Panel on the Cooperative CABG Database Project. J Am Coll Cardiol 1996;28(6):1478-87.
82. Khuri SF, Daley J, Henderson W, et al. Risk adjustment of the postoperative mortality rate for the comparative assessment of the quality of surgical care: results of the National Veterans Affairs Surgical Risk Study. J Am Coll Surg 1997;185(4):315-27.
83. Wray NP, Hollingsworth JC, Peterson NJ, et al. Case-mix adjustment using administrative databases: a paradigm to guide future research. Med Care Res Rev 1997;54(3):326-56.
84. Kuttner R. The risk-adjustment debate. N Engl J Med 1998;339(26):1952-6.
85. Block PC, Peterson EC, Krone R, et al. Identification of variables needed to risk adjust outcomes of coronary interventions: evidence-based guidelines for efficient data collection. J Am Coll Cardiol 1998;32(1):275-82.
86. Richardson D, Tarnow-Mordi WO, Lee SK. Risk adjustment for quality improvement. Pediatrics 1999;103(1 Suppl E):255-65.

Version 2.1 B-33 Revision 3 (July 21, 2004)
87. Iezzoni LI. Risk adjustment for measuring healthcare outcomes. 2nd ed. Chicago, Ill.: Health Administration Press; 1997.
88. Iezzoni LI, Foley SM, Daley J, et al. Comorbidities, complications, and coding bias. Does the number of diagnosis codes matter in predicting in-hospital mortality? JAMA 1992;267(16):2197-203.
89. Green J, Wintfeld N. How accurate are hospital discharge data for evaluating effectiveness of care? Med Care 1993;31(8):719-31.
90. Malenka DJ, McLerran D, Roos N, et al. Using administrative data to describe casemix: a comparison with the medical record. J Clin Epidemiol 1994;47(9):1027-32.
91. Jencks SF, Williams DK, Kay TL. Assessing hospital-associated deaths from discharge data. The role of length of stay and comorbidities. JAMA 1988;260(15):2240-6.
92. Romano PS, Mark DH. Bias in the coding of hospital discharge data and its implications for quality assessment. Med Care 1994;32(1):81-90.
93. Simborg DW. DRG creep: a new hospital-acquired disease. N Engl J Med 1981;304(26):1602-4.
94. Keeler EB, Kahn KL, Draper D, et al. Changes in sickness at admission following the introduction of the prospective payment system. JAMA 1990;264(15):1962-8.
95. Hsia DC, Krushat WM, Fagan AB, et al. Accuracy of diagnostic coding for Medicare patients under the prospective-payment system. N Engl J Med 1988;318(6):352-355.
96. Green J, Wintfeld N. Report cards on cardiac surgeons. Assessing New York State's approach. N Engl J Med 1995;332(18):1229-32.
97. Hannan EL, Racz MJ, Jollis JG, et al. Using Medicare claims data to assess provider quality for CABG surgery: does it work well enough? Health Serv Res 1997;31(6):659-78.
98. Romano PS, Chan BK. Risk-adjusting acute myocardial infarction mortality: are APR-DRGs the right tool? Health Serv Res 2000;34(7):1469-89.
99. Goldfield N, Averill R. On "risk-adjusting acute myocardial infarction mortality: are APR-DRGs the right tool"? [comment]. Health Serv Res 2000;34(7):1491-5; discussion 1495-8.
100. Jollis JG, Romano PS. Pennsylvania's Focus on Heart Attack--grading the scorecard. N Engl J Med 1998;338(14):983-7.
101. O'Connor GT, Plume SK, Olmstead EM, et al. Multivariate prediction of in-hospital mortality associated with coronary artery bypass graft surgery. Northern New England Cardiovascular Disease Study Group. Circulation 1992;85(6):2110-8.
102. O'Connor GT, Plume SK, Olmstead EM, et al. A regional intervention to improve the hospital mortality associated with coronary artery bypass graft surgery. The Northern New England Cardiovascular Disease Study Group. JAMA 1996;275(11):841-6.
103. Hannan EL, Kilburn H, Jr., Racz M, et al. Improving the outcomes of coronary artery bypass surgery in New York State. JAMA 1994;271(10):761-6.
104. Knaus WA, Draper EA, Wagner DP, et al. An evaluation of outcome from intensive care in major medical centers. Ann Intern Med 1986;104(3):410-8.

Version 2.1 B-34 Revision 3 (July 21, 2004)
105. Knaus WA, Wagner DP, Zimmerman JE, et al. Variations in mortality and length of stay in intensive care units. Ann Intern Med 1993;118(10):753-61.
106. Fine MJ, Auble TE, Yealy DM, et al. A prediction rule to identify low-risk patients with community-acquired pneumonia. N Engl J Med 1997;336(4):243-50.
107. Cooper GS, Chak A, Harper DL, et al. Care of patients with upper gastrointestinal hemorrhage in academic medical centers: a community-based comparison. Gastroenterology 1996;111(2):385-90.
108. Iezzoni LI, Ash AS, Shwartz M, et al. Predicting who dies depends on how severity is measured: implications for evaluating patient outcomes. Ann Intern Med 1995;123(10):763-70.
109. Iezzoni LI, Shwartz M, Ash AS, et al. Predicting in-hospital mortality for stroke patients: results differ across severity-measurement methods. Med Decis Making 1996;16(4):348-56.
110. Iezzoni LI, Shwartz M, Ash AS, et al. Using severity-adjusted stroke mortality rates to judge hospitals. Int J Qual Health Care 1995;7(2):81-94.
111. Iezzoni LI, Shwartz M, Ash AS, et al. Severity measurement methods and judging hospital death rates for pneumonia. Med Care 1996;34(1):11-28.
112. Iezzoni LI, Shwartz M, Ash AS, et al. Using severity measures to predict the likelihood of death for pneumonia inpatients. J Gen Intern Med 1996;11(1):23-31.
113. Pine M, Norusis M, Jones B, et al. Predictions of hospital mortality rates: a comparison of data sources. Ann Intern Med 1997;126(5):347-54.
114. Krumholz HM, Chen J, Wang Y, et al. Comparing AMI mortality among hospitals in patients 65 years of age and older: evaluating methods of risk adjustment. Circulation 1999;99(23):2986-92.
115. Luft H, Romano P, Remy L, et al. Second Report of the California Hospital Outcomes Project: Acute Myocardial Infarction. ,Office of Statewide Health Planning and Development.
116. Iezzoni LI, Ash AS, Shwartz M, et al. Differences in procedure use, in-hospital mortality, and illness severity by gender for acute myocardial infarction patients: are answers affected by data source and severity measure? Med Care 1997;35(2):158-71.
117. Hibbard JH, Jewett JJ, Legnini MW, et al. Choosing a health plan: do large employers use the data? Health Aff (Millwood) 1997;16(6):172-80.
118. Hibbard JH, Jewett JJ, Engelmann S, et al. Can Medicare beneficiaries make informed choices? Health Aff (Millwood) 1998;17(6):181-93.
119. Schneider EC, Epstein AM. Use of public performance reports: a survey of patients undergoing cardiac surgery. JAMA 1998;279(20):1638-42.
120. Booske BC, Sainfort F, Hundt AS. Eliciting consumer preferences for health plans. Health Serv Res 1999;34(4):839-54.
121. Rainwater JA, Romano PS, Antonius DM. The California Hospital Outcomes Project: how useful is California's report card for quality improvement? Jt Comm J Qual Improv 1998;24(1):31-9.
122. Romano PS, Rainwater JA, Antonius D. Grading the graders: how hospitals in California and New York perceive and interpret their report cards. Med Care 1999;37(3):295-305.

Version 2.1 B-35 Revision 3 (July 21, 2004)
123. Palmer RH, Louis TA, Peterson HF, et al. What makes quality assurance effective? Results from a randomized, controlled trial in 16 primary care group practices. Med Care 1996;34(9 Suppl):SS29-39.
124. Duffy SQ, Farley DE. Patterns of decline among inpatient procedures. Public Health Rep 1995;110(6):674-81.
125. Rutledge R. Can medical school-affiliated hospitals compete with private hospitals in the age of managed care? An 11-state, population-based analysis of 351,201 patients undergoing cholecystectomy. J Am Coll Surg 1997;185(3):207-17.
126. Maynard C, Chapko MK, Every NR, et al. Coronary angioplasty outcomes in the Healthcare Cost and Utilization Project, 1993-1994. Am J Cardiol 1998;81(7):848-52.
127. Shepardson LB, Youngner SJ, Speroff T, et al. Increased risk of death in patients with do-not-resuscitate orders. Med Care 1999;37(8):727-37.
128. Layde PM, Broste SK, Desbiens N, et al. Generalizability of clinical studies conducted at tertiary care medical centers: a population-based analysis. J Clin Epidemiol 1996;49(8):835-41.
129. Hannan EL, Kilburn H, Jr., O'Donnell JF, et al. Interracial access to selected cardiac procedures for patients hospitalized with coronary artery disease in New York State. Med Care 1991;29(5):430-41.
130. Buckle JM, Horn SD, Oates VM, et al. Severity of illness and resource use differences among white and black hospitalized elderly. Arch Intern Med 1992;152(8):1596-603.
131. McBean AM, Gornick M. Differences by race in the rates of procedures performed in hospitals for Medicare beneficiaries. Health Care Financ Rev 1994;15(4):77-90.
132. McBean AM, Warren JL, Babish JD. Continuing differences in the rates of percutaneous transluminal coronary angioplasty and coronary artery bypass graft surgery between elderly black and white Medicare beneficiaries. Am Heart J 1994;127(2):287-95.
133. Williams JF, Zimmerman JE, Wagner DP, et al. African-American and white patients admitted to the intensive care unit: is there a difference in therapy and outcome? Crit Care Med 1995;23(4):626-36.
134. Phillips RS, Hamel MB, Teno JM, et al. Race, resource use, and survival in seriously ill hospitalized adults. The SUPPORT Investigators. J Gen Intern Med 1996;11(7):387-96.
135. Romano PS, Campa DR, Rainwater JA. Elective cervical discectomy in California: postoperative in-hospital complications and their risk factors. Spine 1997;22(22):2677-92.
136. Huber TS, Wang JG, Wheeler KG, et al. Impact of race on the treatment for peripheral arterial occlusive disease. J Vasc Surg 1999;30(3):417-25.
137. Chen J, Radford MJ, Wang Y, et al. Do "America's Best Hospitals" perform better for acute myocardial infarction? N Engl J Med 1999;340:286-92.
138. Hartz AJ, Gottlieb MS, Kuhn EM, et al. The relationship between adjusted hospital mortality and the results of peer review. Health Serv Res 1993;27(6):765-77.
139. Hsia DC, Ahern CA, Ritchie BP, et al. Medicare reimbursement accuracy under the prospective payment system, 1985 to 1988. JAMA 1992;268(7):896-899.

Version 2.1 B-36 Revision 3 (July 21, 2004)
140. Cullen DJ, Bates DW, Small SD, et al. The incident reporting system does not detect adverse drug events: a problem for quality improvement. Jt Comm J Qual Improv 1995;21(10):541-8.
141. Kohn L, Corrigan J, Donaldson M, et al., editors. To Err Is Human: Building a Safer Health System. Washington, D.C.: National Academy Press; 2000.
142. Silber JH, Rosenbaum PR, Schwartz JS, et al. Evaluation of the complication rate as a measure of quality of care in coronary artery bypass graft surgery. JAMA 1995;274(4):317-23.
143. Silber JH, Rosenbaum PR, Ross RN. Comparing the contribution of predictors: which outcomes vary with hospital rather than patient characteristics? J Am Stat Assoc 1995;90:7-18.
144. Silber JH, Rosenbaum PR, Williams SV, et al. The relationship between choice of outcome measure and hospital rank in general surgical procedures: implications for quality assessment. Int J Qual Health Care 1997;9:193-200.
145. Kahn KL, Brook RH, Draper D, et al. Interpreting hospital mortality data. How can we proceed? JAMA 1988;260(24):3625-8.
146. Mullins RJ, Mann NC, Hedges JR, et al. Adequacy of hospital discharge status as a measure of outcome among injured patients. JAMA 1998;279(21):1727-31.
147. Sands K, Vineyard G, Platt R. Surgical site infections occurring after hospital discharge. J Infect Dis 1996;173(4):963-70.
148. Sands K, Vineyard G, Livingston J, et al. Efficient identification of postdischarge surgical site infections: use of automated pharmacy dispensing information, administrative data, and medical record information. J Infect Dis 1999;179(2):434-41.
149. Iezzoni LI, Mackiernan YD, Cahalane MJ, et al. Screening inpatient quality using post-discharge events. Med Care 1999;37(4):384-98.
150. Omoigui NA, Miller DP, Brown KJ, et al. Outmigration for coronary bypass surgery in an era of public dissemination of clinical outcomes. Circulation 1996;93(1):27-33.
151. Hannan EL, Siu AL, Kumar D, et al. Assessment of coronary artery bypass graft surgery performance in New York. Is there a bias against taking high-risk patients? Med Care 1997;35(1):49-56.
152. Petersen LA, Orav EJ, Teich JM, et al. Using a computerized sign-out program to improve continuity of inpatient care and prevent adverse events. Jt Comm J Qual Improv 1998;24(2):77-87.
153. Dranove. Information is good except when its bad. ,Stanford University Working Paper.
154. Marshall MN, Shekelle PG, Leatherman S, et al. The public release of performance data: what do we expect to gain? A review of the evidence. JAMA 2000;283(14):1866-74.
155. Johantgen M, Elixhauser A, Bali JK, et al. Quality indicators using hospital discharge data: state and national applications. Jt Comm J Qual Improv 1998;24(2):88-105.
156. Olfson M, Marcus S, Sackeim HA, et al. Use of ECT for the inpatient treatment of recurrent major depression. Am J Psychiatry 1998;155(1):22-9.
157. Meurer JR, Kuhn EM, George V, et al. Charges for childhood asthma by hospital characteristics. Pediatrics 1998;102(6):E70.

Version 2.1 B-37 Revision 3 (July 21, 2004)
158. Lanska DJ, Hartz AJ. Measurement of quality in health care. Neurology 1998;50(3):584-7.
159. Lanska DJ, Kryscio RJ. In-hospital mortality following carotid endarterectomy. Neurology 1998;51(2):440-7.
160. Schnitzler MA, Lambert DL, Mundy LM, et al. Variations in healthcare measures by insurance status for patients receiving ventilator support. Clin Perform Qual Health Care 1998;6(1):17-22.
161. Niederman MS, McCombs JS, Unger AN, et al. The cost of treating community-acquired pneumonia. Clin Ther 1998;20(4):820-37.
162. Zhao SZ, Wong JM, Davis MB, et al. The cost of inpatient endometriosis treatment: an analysis based on the Healthcare Cost and Utilization Project Nationwide Inpatient Sample. Am J Manag Care 1998;4(8):1127-34.
163. Rentz AM, Halpern MT, Bowden R. The impact of candidemia on length of hospital stay, outcome, and overall cost of illness. Clin Infect Dis 1998;27(4):781-8.
164. Ritchie JL, Maynard C, Chapko MK, et al. Association between percutaneous transluminal coronary angioplasty volumes and outcomes in the Healthcare Cost and Utilization Project 1993-1994. Am J Cardiol 1999;83(4):493-7.
165. Best AE. Secondary data bases and their use in outcomes research: a review of the area resource file and the Healthcare Cost and Utilization Project. J Med Syst 1999;23(3):175-81.
166. Krumholz HM, Chen YT, Bradford WD, et al. Variations in and correlates of length of stay in academic hospitals among patients with heart failure resulting from systolic dysfunction. Am J Manag Care 1999;5(6):715-23.
167. Seifeldin R, Hantsch JJ. The economic burden associated with colon cancer in the United States. Clin Ther 1999;21(8):1370-9.
168. Williams GR, Jiang JG, Matchar DB, et al. Incidence and occurrence of total (first-ever and recurrent) stroke. Stroke 1999;30(12):2523-8.
169. Kirsner RS, Yang DG, Kerdel FA. Dermatologic disease accounts for a large number of hospital admissions annually. J Am Acad Dermatol 1999;41(6):970-3.
170. MEDLINE [database online]. Bethesda (MD),National Library of Medicine.1985-Updated weekly.Available from: National Library of Medicine; BRS Information Technologies, McLean, VA; DIALOG information Services, Inc., Palo Alto, CA.
171. PsycINFO. Washington (DC),American Psychological Association.1887-Updated monthly (journals), 1987-current (books and chapters).Available from: American Psychological Association, Washington DC; Ovid Technologies, New York, NY; Silverplatter Information, Norwood, MA.
172. The Cochrane Library. Oxford, England, Update Software, Ltd. Available from: Update Software, San Diego, CA.
173. EMBASE. The Netherlands, Elsevier Science Publishers B.V.1974-Updated weekly. Available from: Elsevier Science, Secondary Publishing Division, New York, NY.
174. Ingber MJ. The current state of risk adjustment technology for capitation. J Ambulatory Care Manage 1998;21(4):1-28.

Version 2.1 B-38 Revision 3 (July 21, 2004)
175. Rosenbaum P, Rubin D. Reducing bias in observational studies using subclassification on the propensity score. J Am Stat Assoc 1894;79:516-24.
176. Glazer J, McGuire T. Minimum variance optimal risk adjustment. American Economic Review 1999; In Press.
177. Chamberlain G. Panel Data. In: Griliches Z, Intriligator M, editors. Handbook of Economics. New York: Elsevier Science; 1984. p. 1247-1318.
178. Green. Economic Analysis. 2nd ed. New Jersey: Prentice Hall; 1997.
179. McClellan M, Staigner D. The quality of health care providers. National Bureau of Economic Research Working Paper #7327.

Version 2.1 C-1 Revision 3 (July 21, 2004)
C.
Appendix C: Log of Revisions to IQI Documentation and Software Version 2.1, Revision 3 The following table summarizes the revisions made to the IQI software, software documentation and the Guide to Inpatient Quality Indicators (Guide) document in release version 2.1, revision 3. The table lists the component(s) affected by the change and a short summary of the changes that were made.
Component Changes
Guide
1. Modified documentation to reflect changes in indicators associated with ICD-9-CM coding updates for FY 2004 (effective 10-1-2003). See Appendix B for specific details.
1
2. Implemented changes to IQI #3, Pediatric Heart Surgery Volume Indicator, both in
its inclusion criteria and its exclusion criteria. Inclusion is now defined to be discharges with ICD-9-CM procedure codes for congenital heart disease (1P) in any field or non-specific heart surgery (2P) in any field with ICD-9-CM diagnosis of congenital heart disease (2D) in any field. Exclusions now include MDC 14 (pregnancy, childbirth and pueperium); patients with transcatheter interventions (either 3AP, 3BP, 3CP, 3DP, 3EP with 3D, or 3FP) as single cardiac procedures, performed without bypass (5P) but with catheterization (6P); patients with septal defects (4P) as single cardiac procedures without bypass (5P); heart transplant (7P); premature infants (4D) with PDA closure (3D and 3EP) as only cardiac procedure; age less than 30 days with PDA closure as only cardiac procedure; missing discharge disposition (DISP=missing); and transferring to another short-term hospital (DISP=2). These changes were the result of research by the original developers of this indicator
2, and are designed to increase the sensitivity and
specificity of the indicator. Note: Due to the large number of changes to the pediatric heart surgery indicators, comparing results with past versions is cautioned.
3. Implemented changes to IQI #10, Pediatric Heart Surgery Mortality Indicator, both in
its inclusion criteria and its exclusion criteria. Inclusion is now defined to be discharges with ICD-9-CM procedure codes for congenital heart disease (1P) in any field or non-specific heart surgery (2P) in any field with ICD-9-CM diagnosis of congenital heart disease (2D) in any field. Exclusions now include MDC 14 (pregnancy, childbirth and pueperium); patients with transcatheter interventions (either 3AP, 3BP, 3CP, 3DP, 3EP with 3D, or 3FP) as single cardiac procedures, performed without bypass (5P) but with catheterization (6P); patients with septal defects (4P) as single cardiac procedures without bypass (5P); heart transplant (7P); premature infants (4D) with PDA closure (3D and 3EP) as only cardiac procedure; age less than 30 days with PDA closure as only cardiac procedure; missing discharge disposition (DISP=missing); and transferring to another short-term hospital (DISP=2). These changes were the result of research by the original
1 Updates to Version 2.1, Revision 3 – ICD-9-CM Coding Updates,"
http://www.qualityindicators.ahrq.gov/iqi_download.htm 2 Kathy Jenkins et al., Boston Children‘s Hospital and Harvard University. See Center-specific differences
in mortality: preliminary analyses using the Risk Adjustment in Congenital Heart Surgery (RACHS-1) method. J Thorac Cardiovasc Surg. 2002 Jul;124(1):97-104

Version 2.1 C-2 Revision 3 (July 21, 2004)
Component Changes
developers of this indicator (see footnote 2), and are designed to increase the sensitivity and specificity of the indicator.
4. Eliminated MDC 14 (pregnancy, childbirth and pueperium) and MDC 15 (newborns
and other neonates) from exclusion criteria for IQI #15, Acute Myocardial Infarction (AMI) Mortality Indicator. This change was made since these patients are at low risk for AMI and removing these patients brings the indicator into alignment with other national efforts. The estimated impact is low.
5. Established a new indicator (IQI #32), AMI Mortality Indicator – Without Transfer
Cases. Unlike the existing indicator for AMI mortality (IQI #15), it excludes patients transferring from another short-term hospital and patients with missing admission source. This indicator is closely related to the JCAHO indicator for AMI mortality
3
however it is NOT risk adjusted in the same manner as the JCAHO indicator and does not exclude hospice patients (due to inability to identify hospice patients in hospital discharge data).
6. Implemented a change to IQI #21, Cesarean Section Delivery Rate to exclude
patients with abnormal presentation, preterm delivery, fetal death, or multiple gestation. These changes create an indicator that closely mirrors indicators used by Healthy People 2010
4.
7. Created a new indicator (IQI #33), Primary Cesarean Delivery Rate which closely
mirrors the JCAHO measure for Cesarean Delivery5. This indicator excludes patients
with abnormal presentation, preterm delivery, fetal death, multiple gestation, and patients with a prior Cesarean Section.
8. Implemented a change to IQI #22, Vaginal Birth After Cesarean Section (VBAC),
Uncomplicated to exclude patients with diagnoses describing abnormal presentation, preterm delivery, fetal death or multiple gestation.
9. Created new indicator (IQI #34), Vaginal Birth After Cesarean Section (VBAC) All,
which does not exclude patients with diagnoses of abnormal presentation, preterm delivery, fetal death, or multiple gestation.
10. Implemented a change to IQI #13, Craniotomy Mortality Rate. Restructuring of the
DRGs for craniotomy occurred in FY 2003. As a result, the including definition of craniotomy was revised to include both DRG 001 and DRG 002 (Craniotomy with and without comorbidities and complications, >17 years), 528, 529, and 530. To maintain comparability with previous years of data, patients with a principle diagnosis of head trauma are now excluded from this indicator. Empirical analyses demonstrate minimal impact of these changes for this indicator.
Software (SAS and SPSS)
1. Implemented syntax changes associated with ICD-9-CM coding updates from FY 2004 (effective 10-1-2003). See separate documentation on ICD-9 coding updates for specific details.
3 http://www.jcaho.org/pms/core+measures/information+on+final+specifications.htm. See AMI-9 and
Appendix A. 4 http://www.healthypeople.gov/Document/html/tracking/od16.htm#obstetcare. See 16-9.
5 http://www.jcaho.org/pms/core+measures/information+on+final+specifications.htm. See PR-1 and
Appendix A.

Version 2.1 C-3 Revision 3 (July 21, 2004)
Component Changes
2. Implemented the option to aggregate all area-based indicators by Metropolitan
Statistical Area (MSA) and County or just by County. 3. Implemented all syntax changes required to implement the indicator modifications
(noted above under Guide) and incorporated the related documentation in the Software manuals.
4. County-based population files are now distributed with the SAS and SPSS software,
and the names of the population files now have the letters ―cty‖ in their third, fourth and fifth positions instead of the letters ―pop‖.
5. Converted mean-centering routine for risk-adjustment to use population case-mix of
APR-DRG as reference population for Age-Sex only risk-adjustment. This change resulting in the age-sex only risk adjustment scaling closer to the mean.
Software (SAS)
1. Implemented changes to all mortality indicators excluding cases for which the value for the variable ―disposition of patient‖ (DISP) is missing, unknown or invalid. The SAS software is now consistent with the SPSS versions that have always excluded cases with missing, unknown or invalid disposition.
2. Inserted ―IQ‖ in format names for age, sex and APR-DRG aggregations in SAS
programs to distinguish these formats from similarly named formats used by other indicator software.

Version 2.1 D-1 Revision 3 (July 21, 2004)
D.
Appendix D: ICD-9-CM Coding Updates in IQI Release Version 2.1, Revision 3
The following changes were implemented in version 2.1, revision 3, of the IQI software (both SAS and SPSS) and reflect changes to indicator definitions based on updates to ICD-9-CM codes for Fiscal Year 2004 (effective 10-1-2003). All changes noted below have been incorporated into the software syntax, software documentation and the Guide to Inpatient Quality Indicators. With this software update, the IQI software definitions now incorporate ICD-9-CM codes valid from October 1, 1994 through September 30, 2004.
Indicator Name (#) Component Change
Pediatric Heart Surgery Volume (IQI #3)
Numerator (Inclusion, Congenital Heart Disease)
Code (FY 2004) 37.5 ―heart transplantation‖ was modified to require a fourth digit. As a result, new codes 37.51 ―heart transplantation‖ and 37.52 ―implantation of total replacement heart system‖ were added to the base definition (congenital heart disease procedures 1P) for pediatric heart surgery volume. ICD-9 code 37.5 remains in the definition for compatibility with earlier years of data, but is no longer valid as of October 1, 2003.
Pediatric Heart Surgery Mortality (IQI #10)
Denominator (Exclusion, Heart Transplant)
Code (FY 2004) 37.5 ―heart transplantation‖ was modified to require a fourth digit. As a result, new codes 37.51 ―heart transplantation‖ and 37.52 ―implantation of total replacement heart system‖ were added to the exclusions for pediatric heart surgery mortality.
Gastrointestinal Hemorrhage Mortality Rate (IQI #18).
Denominator (Inclusion, Gastrointestinal Hemorrhage)
New code (FY 2004) 530.21 ―ulcer of esophagus with bleeding‖ was added to the denominator definition. This change may result in a comparability issue with preceding years since 530.2 was not previously included in the definition of GI hemorrhage.
Pneumonia Mortality Rate (IQI #20)
Denominator (Inclusion, Pneumonia)
New code (FY 2004) 480.3 ―Pneumonia due to SARS-associated coronavirus‖ was added to the denominator definition for viral pneumonia.
Bilateral Cardiac Cathererization Rate (IQI #25).
Denominator (Inclusion, Coronary Artery Disease)
New code (FY 2004) 414.07 ―coronary atherosclerosis of bypass graft of transplanted heart‖ was added to the denominator definition for coronary artery disease.
Hysterectomy Area Rate (IQI #28)
Numerator (Inclusion, Hysterectomy)
New category (68.3: subtotal abdominal hysterectomy) and new codes (FY 2004) 68.31 ―laparoscopic supracervical hysterectomy‖ and 68.39 ―other subtotal abdominal hysterectomy‖ were added to the numerator definition for hysterectomy area rate.
Laminectomy Area Rate (IQI #29)
Numerator (Inclusion, Laminectomy)
New codes (FY 2004) available to specify the number of vertebrae fused (81.62, 81.63 and 81.64) were added to the numerator for laminectomy area rate. These codes should appear when code 81.61 is used, since 81.61 includes a ―code also‖ instruction.