Assessment for psychotherapy: clinical indicators of self-cohesion and self-pathology
Upload
khangminh22Category
view
1download
0
Linköping University Medical DissertationNo 671
Development of Strategic and Clinical Quality
Indicators in Postoperative Pain Management
Ewa Idvall
Department of Medicine and Care, Division of Nursing Science,Faculty of Health Sciences, Linköpings universitet
SE-581 85 Linköping, Sweden
Linköping 2001

2
Development of Strategic and Clinical Quality Indicators inPostoperative Pain Management
© Idvall Ewa, 2001ISBN 91-7219-966-0ISSN 0345-0082Printed in Sweden by Unitryck, Linköping 2001

3
To Jan and Patrik
4
Idvall E. 2001. Development of Strategic and Clinical Quality Indicators inPostoperative Pain Management. Linköping University Medical Dissertation No 671.Department of Medicine and Care, Division of Nursing Science, Faculty of HealthSciences, Linköpings universitet, SE-581 85 Linköping, Sweden. ISBN 91-7219-966-0,ISSN 0345-0082.
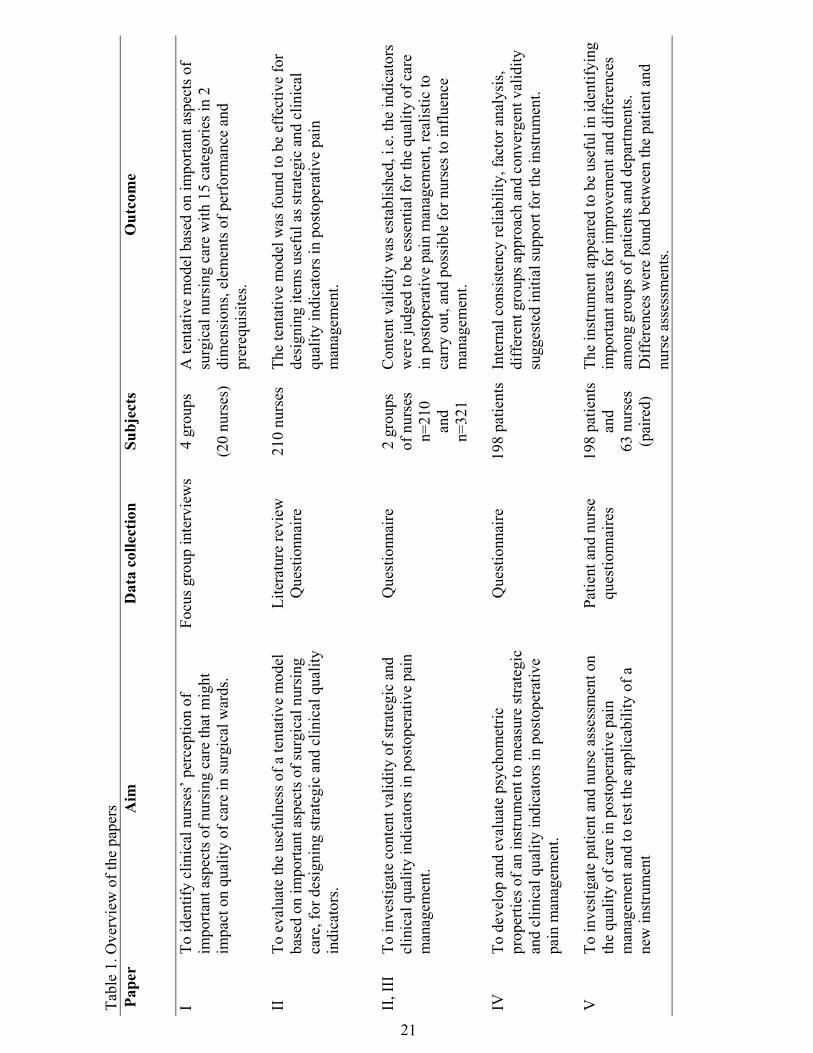
ABSTRACTThe aim of this thesis was to identify important aspects of surgical nursing care,designing strategic and clinical quality indicators in postoperative pain management,investigate content validity, develop and evaluate psychometric properties of aninstrument to measure the indicators, test the applicability of the instrument andinvestigate patient and nurse assessment.
To identify the important aspects of nursing care which might impact onquality of care in surgical wards, it was conducted 4 focus group interviews withclinical nurses (n=20). A tentative model with 15 categories in 2 dimensions, elementsof performance and prerequisites, emerged from the data analysis. The categories were,e.g. detecting and acting on signs and symptoms, informing and educating, promotingrelationships, responsibility and attitudes. The model was used as a foundation fordeveloping indicators in postoperative pain management, one in each category, eachsupported by a literature review. To assess the content validity of the indicators, aquestionnaire was compiled and sent to registered nurses with a special interest in pain(n=210) and to a random sample of clinical nurses working in surgical wards (n=321).The groups assessed the indicators as essential for achieving high quality, realistic tocarry out and possible for nurses to influence management. The first group validated 14of the 15 indicators and the second group validated 12 as “major” factors in terms ofbeing essential to achieve high quality of care. The remaining factors were classified as“supportive”. No indicator was discarded.
To measure the indicators, an instrument was developed and psychometricproperties were evaluated. The indicators were converted to statements suitable for apatient questionnaire and were scored on a 5-point scale with higher values indicatinghigher quality of care. Patients (n=198) answered the questionnaire on their secondpostoperative day. The inter-item and item-total correlation coefficients were in asatisfactory range, and Cronbach’s coefficient alpha (0.84) supported internalconsistency reliability. Four sub-scales, entitled communication, action, trust andenvironment emerged from the factor analysis with a total variance of 61.4%. The totalscale correlated (rs=0.53) with the single item pain-relief-satisfaction question. Thepatients who reported more pain than expected scored lower on the total scale and thepatients who received epidural analgesia reported higher scores on the total scale. Anurse questionnaire, similar to the patient questionnaire, was compiled. The responsiblenurse at the time (n=63) answered 196 questionnaires paired with the individual patient.The new instrument appeared to be useful in identifying important areas forimprovement both from the patients’ and nurses’ perspectives, based on the number ofdisagreements (1 and 2). Differences were found among departments. The patients’assessments on the environment sub-scale and the overall satisfaction question werehigher than the nurses’ assessments. The findings suggest initial support for theinstrument as a means to measure the quality of nursing care in postoperative painmanagement. Key words: quality indicators; health care, pain; postoperative, focusgroups, psychometrics, questionnaires, nursing care.
5
ORIGINAL PAPERS
This thesis is based on the following papers
I. Idvall E. & Rooke L. Important aspects of nursing care insurgical wards as expressed by nurses. Journal of ClinicalNursing 1998; 7: 512-520.
II. Idvall E., Hamrin E., Rooke L. & Sjöström B. A tentativemodel for developing strategic and clinical nursing qualityindicators: postoperative pain management. InternationalJournal of Nursing Practice 1999; 5: 216-226.
III. Idvall E., Hamrin E., Sjöström B. & Unosson M. Qualityindicators in postoperative pain management: a validationstudy. Scandinavian Journal of Caring Sciences 2001; 15: 331-338.
IV. Idvall E., Hamrin E. & Unosson M. Development of aninstrument to measure strategic and clinical quality indicators inpostoperative pain management. Journal of Advanced Nursing2002; 37: 532-540.
V. Idvall E., Hamrin E., Sjöström B. & Unosson M. Patient andnurse assessment on quality of care in postoperative painmanagement. Quality & Safety in Health Care 2002 (accepted).
6
ABBREVIATIONS
AHCPR The Agency for Health Care Policy and Research
ANA American Nurses Association
APS American Pain Society
DySSSy Dynamic Standard Setting System
IASP International Association for the Study of Pain
JCAHO Joint Commission on Accreditation of HealthcareOrganizations
NIC Nursing Interventions Classification
NOC Nursing Outcomes Classification
RN Registered Nurse
7
CONTENTS
INTRODUCTION 9
Concepts and definitions 10
Assessment of quality of care 13
Research on quality of care 15
Pain 16
SPECIFIC AIMS OF THE THESIS 20
METHODS AND RESULTS 20
Statistics 20
Qualitative analysis 22
Ethics 22
Step one: To identify clinical nurses’ perceptions of important aspects ofsurgical nursing care 22Subjects 22Method 23Result 24Conclusion 25
Step two: To evaluate the usefulness ofthe tentative model for designing strategicand clinical quality indicators and toinvestigate content validity 25Subjects 25Method 25Result 27Conclusion 30
Step three: To develop and evaluatepsychometric properties of an instrument 30Subjects 30Method 31
8
Result 31Conclusion 35
Step four: To investigate patient andnurse assessment and to test theapplicability of the instrument 35Subjects 35Method 35Result 39Conclusion 44
DISCUSSION 44
Methodological considerations 44
The tentative model of important aspects ofsurgical nursing care 47
Strategic and clinical quality indicators inpostoperative pain management 48
CLINICAL CONSIDERATIONS 52
CONCLUSIONS 54
ACKNOWLEDGEMENTS 55
REFERENCES 56
APPENDIX I 67
9
INTRODUCTION
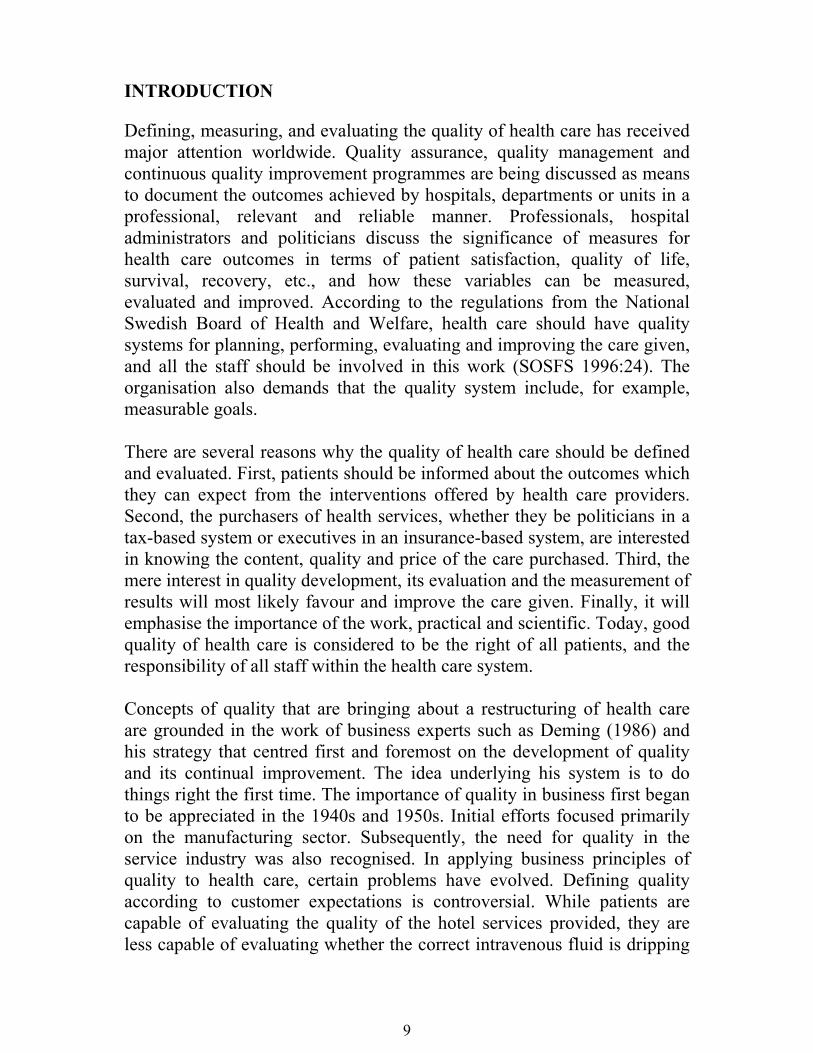
Defining, measuring, and evaluating the quality of health care has receivedmajor attention worldwide. Quality assurance, quality management andcontinuous quality improvement programmes are being discussed as meansto document the outcomes achieved by hospitals, departments or units in aprofessional, relevant and reliable manner. Professionals, hospitaladministrators and politicians discuss the significance of measures forhealth care outcomes in terms of patient satisfaction, quality of life,survival, recovery, etc., and how these variables can be measured,evaluated and improved. According to the regulations from the NationalSwedish Board of Health and Welfare, health care should have qualitysystems for planning, performing, evaluating and improving the care given,and all the staff should be involved in this work (SOSFS 1996:24). Theorganisation also demands that the quality system include, for example,measurable goals.
There are several reasons why the quality of health care should be definedand evaluated. First, patients should be informed about the outcomes whichthey can expect from the interventions offered by health care providers.Second, the purchasers of health services, whether they be politicians in atax-based system or executives in an insurance-based system, are interestedin knowing the content, quality and price of the care purchased. Third, themere interest in quality development, its evaluation and the measurement ofresults will most likely favour and improve the care given. Finally, it willemphasise the importance of the work, practical and scientific. Today, goodquality of health care is considered to be the right of all patients, and theresponsibility of all staff within the health care system.
Concepts of quality that are bringing about a restructuring of health careare grounded in the work of business experts such as Deming (1986) andhis strategy that centred first and foremost on the development of qualityand its continual improvement. The idea underlying his system is to dothings right the first time. The importance of quality in business first beganto be appreciated in the 1940s and 1950s. Initial efforts focused primarilyon the manufacturing sector. Subsequently, the need for quality in theservice industry was also recognised. In applying business principles ofquality to health care, certain problems have evolved. Defining qualityaccording to customer expectations is controversial. While patients arecapable of evaluating the quality of the hotel services provided, they areless capable of evaluating whether the correct intravenous fluid is dripping

10
at the appropriate time and rate. Quality in the context of health care ismore than the consequence of consumer satisfaction since the expectationsof consumers may be low or their knowledge limited (Redfern & Norman1990, Katz & Green 1992). The different perspectives are of course,important and it is necessary to consider them in quality development.
The selection of quality indicators is an important part of qualitydevelopment which requires careful consideration. It is assumed thatclinical indicators should be pointers towards quality and if one particulartarget is successfully reach many others will hopefully follow (Kitson1986). Different approaches, such as clinical areas, generic aspects of care,specific aspects of care/nursing diagnosis, and medical diagnosis have beenused to develop quality indicators (Idvall et al. 1997). However, indicatorsthat were strategic, professional and of particular importance for the qualityof nursing care were seldom discussed.
The major purpose of this thesis was to develop strategic and clinicalquality indicators in postoperative pain management and to measure theseindicators.
Concepts and definitionsGenerally, quality signifies characteristic or merit and is a neutral conceptderived from the Latin word qualitas (Nationalencyklopedin 1993).According to the National Swedish Board of Health and Welfare (SOSFS1996:24), quality is described as the sum of all characteristics of a product(service) giving it the capacity to satisfy all expressed and unexpressedneeds.
In the United States, the Joint Commission on Accreditation of Health CareOrganizations (JCAHO) describes quality of care as ”the degree to whichhealth services for individuals and populations increase the likelihood ofdesired health outcomes and are consistent with current professionalknowledge” (JCAHO 1993, p.264). Some important attributes that lead usto a judgement that care is of good or poor quality are effectiveness,efficiency, optimality, acceptability, legitimacy and equity (Donabedian1992). The quality of care that is expected from a health care facility can bemade explicit by written standards, and then the standards define quality(Katz & Green 1992). There are several definitions or variants of quality,and each definition is legitimate in its appropriate context (Donabedian1980). The pursuit of an all-embracing definition of quality has beenelusive, and it does not appear that a universal definition of quality is

11
forthcoming (Katz & Green 1992). Nevertheless, even in the absence of aformal definition, a patient or a provider can certainly identify its absence,substandard care or less-than-optimal results. There are different opinionson the actual meaning of the concept, and the definitions of quality of careare reflections of the current health care system and of the goals and valuesof society, which of course change over time (Andersson 1995).
A generally accepted definition of a clinical indicator as “a quantitativemeasure that can be used as a guide to monitor and evaluate the quality ofimportant patient care and support service activities”, which was adopted inseveral studies and derived from JCAHO (JCAHO 1989, p. 330), wasfound in a literature review of quality indicators (Idvall et al. 1997).JCAHO also expressed an indicator as “a valid and reliable quantitativeprocess or outcome measure related to one or more dimensions ofperformance such as effectiveness and appropriateness and a statisticalvalue that provides an indication of the condition or direction over time ofan organisation’s performance of a specified outcome” (JCAHO 1993, p.255). Indicators are of two general types, sentinel event and rate-based, andcan address structure, process of patient care or patient outcome. A sentinelevent indicator measure a serious, undesirable and often avoidable processor outcome, and a rate-based indicator measures patient care events forwhich a certain rate of occurrence is acceptable (JCAHO 1993). Thesentinel events are usually of low frequency and so undesirable that eachoccurrence must always be evaluated. However, the rate-based indicatormeasures desirable (or undesirable) events that require further review onlyif the rate of occurrence shows a significant trend over time or differenceswhen compared with other institutions. The type of event measured by anindicator is categorised by Katz and Green (1992) as clinical, professionalor administrative. A clinical indicator relates to a key aspect of patient care,a professional indicator relates to an aspect of professional practice and anadministrative indicator relates to organisational factors.
This thesis proposes the concept of strategic indicator. Strategy wasoriginally used in the military field and implied the science of military andother forcible means to reach political goals (Nationalencyklopedin 1995).This concept was then transferred to other areas such as sales promotion,negotiation and politics. Direct strategy represents actions which aredirectly focused on the final goal, while indirect strategy is aimed at aseries of restricted but successful actions which will eventually reach theproposed final goal. In psychology and cognition research, strategy is ascientific method of reasoning with a sequence of mental operations. A
12
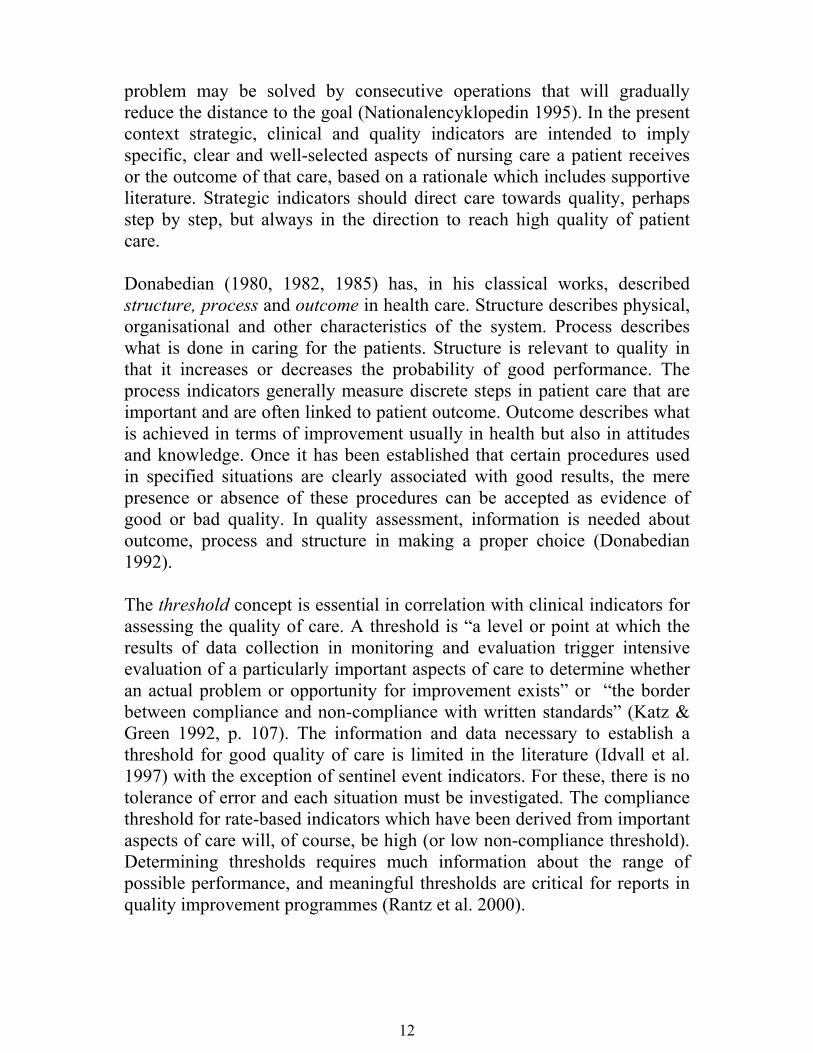
problem may be solved by consecutive operations that will graduallyreduce the distance to the goal (Nationalencyklopedin 1995). In the presentcontext strategic, clinical and quality indicators are intended to implyspecific, clear and well-selected aspects of nursing care a patient receivesor the outcome of that care, based on a rationale which includes supportiveliterature. Strategic indicators should direct care towards quality, perhapsstep by step, but always in the direction to reach high quality of patientcare.
Donabedian (1980, 1982, 1985) has, in his classical works, describedstructure, process and outcome in health care. Structure describes physical,organisational and other characteristics of the system. Process describeswhat is done in caring for the patients. Structure is relevant to quality inthat it increases or decreases the probability of good performance. Theprocess indicators generally measure discrete steps in patient care that areimportant and are often linked to patient outcome. Outcome describes whatis achieved in terms of improvement usually in health but also in attitudesand knowledge. Once it has been established that certain procedures usedin specified situations are clearly associated with good results, the merepresence or absence of these procedures can be accepted as evidence ofgood or bad quality. In quality assessment, information is needed aboutoutcome, process and structure in making a proper choice (Donabedian1992).
The threshold concept is essential in correlation with clinical indicators forassessing the quality of care. A threshold is “a level or point at which theresults of data collection in monitoring and evaluation trigger intensiveevaluation of a particularly important aspects of care to determine whetheran actual problem or opportunity for improvement exists” or “the borderbetween compliance and non-compliance with written standards” (Katz &Green 1992, p. 107). The information and data necessary to establish athreshold for good quality of care is limited in the literature (Idvall et al.1997) with the exception of sentinel event indicators. For these, there is notolerance of error and each situation must be investigated. The compliancethreshold for rate-based indicators which have been derived from importantaspects of care will, of course, be high (or low non-compliance threshold).Determining thresholds requires much information about the range ofpossible performance, and meaningful thresholds are critical for reports inquality improvement programmes (Rantz et al. 2000).
13
Assessments of quality of careThroughout history, nurses have demonstrated their commitment toevaluating clinical practice patterns and identifying opportunities toimprove care. Credit for the first documented study in nursing care isusually given to Florence Nightingale who, in the middle of the nineteenthcentury, reduced the mortality rate of sick and wounded soldiers during theCrimean War in a remarkable way. She introduced standards of infectioncontrol and used statistical tests to evaluate the care provided (Nightingale1863).
During the 1950s, 1960s and 1970s in the United States, process auditswere introduced in an attempt to measure the quality of care provided bynurses, for example, the Phaneuf Audit, the Quality Patient Care Scale andthe Rush Medicus Nursing Process Quality Monitoring Instrument(Duquette 1991). The quality of care is examined using patient records,patient observation, patient interviews, staff interviews, staff observation,patient environment observation, observer inference and managementobservation. Audit tools allow for a comprehensive review of the processof providing care.
The Agenda for Change started by JCAHO in the late 1980s aimed, amongother things, to refine and test clinical indicators (Nadzam 1991). In 1997,the JCAHO presented the National Library of Healthcare Indicators: HealthPlan and Network Edition (JCAHO 1997), which provides a classificationsystem and individual profiles for 225 performance measures. Aperformance measure is described as “a quantitative tool (for example, rate,ratio, index, percentage) that provides an indication of an organisation’sperformance in relation to a specified process or outcome” (JCAHO 2001).An indicator is explained as a performance measure. The National SwedishBoard of Health and Welfare has recently presented a proposal consistingof about 60 general quality indicators in health care (2001).
The American Nurses Association (ANA) (1996) initiated a project onnursing quality indicators and has presented 10 key indicators of nursingquality for example, patient injury rate, maintenance of skin integrity andpatient satisfaction with pain management. The National Database ofNursing Quality Indicators (ANA 2001) advances this initiative bydeveloping an information resource that will be used to quantify thespecific role of nursing intervention in patient outcomes. Today, data arebeing collected from hospitals across the United States.
14
To help health professionals on their way to quality development, the Ten-Step Monitoring and Evaluation Process has been developed by theJCAHO (1989, 1993) and described by Katz and Green (1992) in a guide tomonitoring and evaluating nursing services. The 10 steps are: (1) assignresponsibility, (2) delineate scope of care, (3) identify important aspects ofcare, (4) identify indicators, (5) establish a threshold, (6) collect data, (7)evaluate care when indicated by threshold, (8) take action, (9) assess theoutcome of action and (10) communicate with those responsible for thequality assurance program. Important aspects of care must be identifiedbefore developing indicators, and they can be discussed under the 4categories: (a) high volume (aspects of care which occur frequently oraffect a large number of patients), (b) high risk (aspects of care whichinvolve risks), (c) high problem areas (aspects of care which tend toproduce problems for patients and staff) and (d) high cost (aspects of carewhich generate costs). Added to these 4 categories are: (e) high priority and(f) of significant potential to lead to improvement in health care (JCAHO2001). The structure of the 10-step model and the different categories seempractical to use in quality development and will be considered in thepresent thesis.
The Dynamic Standard Setting System (DySSSy) is a dynamic method forformulating standards or goals for quality improvement. Kitson (1989)developed this method in Great Britain at the Royal College of Nursing.DySSSy is based in part on Lang’s quality cycle (1975) and Donabedian’s(1988) concept of structure, process and outcome, and on the principle thatstaff participation and involvement are necessary to improve the quality ofpatient care. The method involves three phases viz. the describing phase,the monitoring phase, and the phase of taken action. In 1990, the SwedishNurses Association started a project on health care quality improvementand one of its purposes was to disseminate knowledge about the DySSSy-method. Educational material was developed which supported theeducational programs (Hellung Strohl 1996). In Quality Indicators inNursing (Idvall 1997), the DySSSy-method is suggested as a starting pointfor developing indicators. By using the triad structure, process and outcometo describe how quality goals can be achieved, one or more of thesecharacteristics can be selected for use as quality indicators.
Pike et al. (1993) has called nurse-physician collaboration a newarchitecture for quality assurance. They concluded that this approachprovides an effective means of evaluating patient outcomes and improvingthe quality of care because the outcome of patient care is often the result of
15
integrated professional knowledge. The term nursing outcome should rarelybe used (Hegyvary 1991) as outcomes cannot be evaluated independentlyfor just one profession (Mize et al. 1991). However, several authorsindicate the importance for the nursing discipline of finding their ownimpact on patient outcomes (Marek 1989, McCloskey & Bulechek 1992,Johnson & Maas 1997), and this is probably a prediction of an equalcollaboration with other professionals. If the goal is to measure theinfluence of just one discipline, it might be easier to evaluate the process.
Research on quality of careResearch on quality of care is an important field and has its own agendaand must take place alongside health services and clinical research (Grol1996). Grol (1996) provides a reflection on the role of research anddevelopment in quality of care and suggest that this area is characterised byits own subjects and research questions. The topics which need to beconsidered in research are described from three different angles: the actorsin quality improvement, the methods and procedures used in qualityimprovement and the management of quality improvement: systems andconditions. These perspectives are not independent of each other. Researchmethods and procedures should focus on the most relevant aspects of carewith the greatest impact on patients, for example, crucial indicators toevaluate the quality of care which best predict differences in quality,particularly finding indicators for the outcome of care. This is in agreementwith the earlier mentioned 10-step process model that suggest identifyingthe important aspects of care for indicator development. Ibrahim (2000)discussed that information from quality projects is undervalued becausequality projects are seen as unscientific and suggest a more rigorousapproach conducting and presenting quality activities in the standardscientific format.
In quality development, it is common to request information on clinicaloutcomes. In some cases, on the other hand, information on the process ofpatient care can be more helpful in identifying specific shortcomings andpointing the way towards change. Measuring well-supported processes maybe more enlightening than monitoring outcomes when the processes inquestion are supported by research evidence because of difficulties with theinterpretation of the outcome (Davies & Crombie 1995). According to theNational Swedish Board of Health and Welfare (2001) outcome indicatorsare generally difficult to define and interpret while the process indicatorsare practical and easier to interpret but are often an indirect measure. It is ahigh priority to find valid and reliable indicators to assess the quality of
16
care in a clinical setting and that can be compared with others and followedover time.
PainPain is a universal human experience, and relief from pain has probablybeen a concern of mankind since the beginning of time. Indeed it is evenolder, for there is reason to believe that pain is inherent in any life linkedwith consciousness. In a historical perspective there have been severalconcepts of pain, for example, Plato (427-347 B.C.) who observed thatpleasure is often derived from pain relief, and he deduced that pain andpleasure, although opposite sensations, are linked together as originatingfrom the heart as passions of the soul. The use of analgesics derived fromplants and herbs was widespread in ancient Greece. Among earlierreferences to the use of pain-relieving drugs are those found in the writingsof Homer (800 B.C.), and the first authentic reference to the use of opiumfor pain relief is found in the writing of Theophrastus in the third centuryB.C. (Bonica 1990). Today, pain theories have been developed from thesimple one-to-one relationship between injury and pain to the gate controltheory (Melzack & Wall 1965) and the body-self neuromatrix (Melzack1999), which emphasises the concept of pain as a multidimensionalexperience produced by multiple influences.
The study of pain, i.e. algology, is in its infancy. Until the early 1970s, thescientific community failed to take advantage of great advances in medicalresearch, medical science and technology and apply them to pain research,according to Bonica (1990). A study by Marks and Sachar (1973) revealedthat, in about 73% of the patients with acute and chronic pain, the painremained unrelieved following administration of narcotic analgesics. Inrecent decades several studies have reported that patients still suffer frompain after a surgical procedure (Donovan 1983, Warfield & Kahn 1995,Svensson et al. 2000) although the tools necessary to manage postoperativepain are often available, including new drugs and advances in technology(Rawal & Berggren 1994). The reasons for insufficient pain control arecomplex and multifactorial and include knowledge deficits, inadequateassessments in rest and moving, lack of communication between staff andpatients, divergent attitudes, absence of systematic recordings and lack ofpublic awareness (Paice et al. 1995, Sjöström et al. 1997, Klopfenstein etal. 2000).
According to the International Association for the Study of Pain (IASP1979, p. 250), pain is defined as “an unpleasant sensory and emotional
17
experience associated with actual or potential tissue damage, or describedin terms of such damage”. Pain is a personal, subjective experienceinfluenced by cultural learning, the meaning of the situation, attention andother psychological variables (Melzack & Katz 1994). “The person withpain is the only authority about the existence and nature of that pain sincethe sensation of pain can be felt only by the person who has it” (McCaffery& Beebe 1994, p. 14), and it stands to reason that management of suchphenomena should be evaluated by patients themselves. Both clinicians andresearchers are presented with the challenge of capturing patient opinionsabout pain management as a criterion of quality of care. Satisfaction ratingsare subjective, and an aspect of care that cannot be evaluated in anobjective fashion. Satisfaction ratings do not reflect what really happened,but rather patients’ evaluations of their satisfaction with what happened(Ward & Gordon 1994).
There are some significant goals for postoperative pain management, forexample, minimising or eliminating discomfort, facilitating the recoveryprocess and avoiding complications (IASP 1992). It is also presumed thatthese objectives are reached with a positive cost-effectiveness. Moreover, itmust be regarded as unethical to let patients suffer from pain withoutadequate efforts to provide treatment. However, pain relief itself is notenough to improve postoperative outcome because of several confoundingrisk factors (Breivik 1998), but it is a prerequisite for all other measures toimprove the outcome. Postoperative pain impairs organ functions anddelays mobilisation and overall recovery (Kehlet 1997, Breivik 1998).
Many different team members care for the patient with pain, but it is aclose and highly significant problem for nurses who probably spend moretime with patients in pain than any other team member. Potential positiveeffects may be achieved on postoperative outcome by collaboration amongthe patient, surgical nurse, surgeon and anaesthetist (Kehlet 1994). Thereseems to be considerable overlap in the functioning of team members, aswell there should be if a multidisciplinary approach is being used. Thenurses’ role most often includes carrying out pain-relief methods with andfor the patients, identifying the need for change and additional methods,implementing them and assessing the impact on the patient (McCaffery &Beebe 1994). Thus, in most cases, nursing care is the cornerstone, and painmanagement should be the very core of nursing practice (Soafer 1983,McCaffery & Beebe 1994). McCaffery and Beebe (1994) stated that theybelieve that pain control: (1) is a legitimate therapeutic goal, (2) contributessignificantly to the patient’s physical and emotional well-being, (3) must
18
rank high in the list of priorities in patient care and (4) is patient-controlled,i.e. the patient is the final authority about assessment of pain and allmethods of pain control to the extent that is safe and that communication,including the non-verbal kind, is possible.
Several studies have reported quality development in postoperative painmanagement by using the Quality Improvement Guidelines for theTreatment of Acute Pain and Cancer Pain published by the American PainSociety (APS) and the Acute Pain Management Guideline Panel (1992).The APS Patient Outcome Questionnaire (1995) has been compiled fromitems developed by the APS and items adapted from various instruments,e.g. the Brief Pain Inventory (Daut et al. 1983). Items may be selected,modified or added to suit the needs of the particular clinical setting, patientpopulation and the intention of the survey. Several studies have been basedon the APS Patient Outcome Questionnaire and modified, and the resultshave been reported on each individual item (Miaskowski et al. 1994, Ward& Gordon 1996, Lin 2000). Psychometric properties, such as internalconsistency reliability and validity have been reported in some studies(Boström et al. 1997, Calvin et al. 1999). The APS (1995), which hascompiled this questionnaire addressed some important questions worthconsidering for future research, such as what are the essential items for abrief patient outcome questionnaire and what determines patientsatisfaction with pain treatment.
It has been found that many patients who experience severe pain also reportsatisfaction with the overall pain management and pain relief (Donovan1983, Miaskowski et al.1994, Pellino & Ward 1998, Svensson et al. 2001).One possibility for this paradox is that pain is well tolerated. An alternativeexplanation is that while pain troubled the patients, they were satisfied withthe caring attitude of the staff (APS 1995). A study by Gaston-Johansson etal. (1998) reported that patient satisfaction with nurses’ treatment of painwas the most important factor influencing patient satisfaction with painrelief and pain management.
Postoperative pain management is important for the quality of care insurgical wards and an activity that is characterised as high-volume, high-risk, problem-prone, high-cost, high priority and of potential to lead toimprovement. These different categories have been suggested to considerwhen identifying the important aspects of care (Katz & Green 1992,JCAHO 2001). Quality improvement efforts must be discussedcontinuously. Therefore, it is valuable to develop measures that assess
19
quality in a reproducible and valid fashion, and to measure the key aspectsor the essential items. A uniform instrument to evaluate the quality of carein postoperative pain management should be valuable, and could givebaseline data to identify possible areas for quality improvement efforts tobe followed over time by patients and staff on different levels in theorganisation.
An instrument can be described as the device or technique that a researcheruses to collect data (e.g., questionnaires, tests, observation schedules, etc)(Polit & Hungler 1991). Many instruments used in health care arecomposites made up of the sum of scores from a series of items. A generalgoal is to develop an instrument of minimal length while achieving supportfor its reliability and validity (Ferketich 1991).
The first step in constructing a questionnaire is devising the items bylooking at what has been done in the past. Another source of items can bethe research subjects themselves by, for example, using focus groupinterviews (Streiner & Norman 1995). Their task would not be to generatethe specific items, but rather to suggest themes which can be used. Therehas also been increasing appreciation for the role that theory can play ininstrument development, because if a model has any validity, then it wouldmake sense for the instrument to include items from each of these areas(Streiner & Norman 1995, p. 18). Validity and reliability are central ininstrument development. No measure is useful without evidence for itsvalidity, which deals with how well it measures what it purports to measurein the context in which it is to be applied (Nunnlly & Bernstein 1994).Essentially, the reliability of an instrument is the degree of consistency ordependability with which it measures the attribute it is designed to measure(Polit & Hungler 1991, p.653). Both validity and reliability have manydifferent aspects and assessment approaches.
In summary, it seems reasonable and of high priority to provide strategicmeasures or quality indicators in daily clinical nursing practice. The qualityindicators should be valid and reliable to be useful in comparing differentunits and identifying quality improvement efforts, which should be open tocontinuously evaluation. Indicators that are potentially useful incollaborating with other health professionals should be an advantage.Postoperative pain management is appropriate for quality assessments insurgical nursing care, and is an area where nursing makes a difference andwhere there is a need for research on essential items for qualitydevelopment.
20
SPECIFIC AIMS OF THE THESIS
The specific aims were
♦ to identify clinical nurses’ perceptions of important aspects of nursingcare that might impact on quality of care in surgical wards
♦ to evaluate the usefulness of a tentative model, based on importantaspects of surgical nursing care, for designing strategic and clinicalquality indicators
♦ to investigate content validity of strategic and clinical quality indicatorsin postoperative pain management
♦ to develop and evaluate psychometric properties of an instrument tomeasure strategic and clinical quality indicators in postoperative painmanagement
♦ to investigate patient and nurse assessment on the quality of care inpostoperative pain management and to test the applicability of a newinstrument
An overview of the papers appears in Table 1.
METHODS AND RESULTS
The different specific aims of the studies were dependent on each other inthe sense that the result from the first study provided the foundation for thesecond study and so on. Four different steps in the process of developingstrategic and clinical quality indicators in postoperative pain managementcould be distinguished. The methods and the results from each of thesesteps are presented together, followed by a short conclusion to help guidethe readers through the development of this thesis.
StatisticsData were analysed using the computer program “Statistica”, version 5.51999 (StatSoft, Tulsa, Oklahoma, USA). Descriptive statistics are
21
Tabl
e 1.
Ove
rvie
w o
f the
pap
ers
Pape
rA
imD
ata
colle
ctio
nSu
bjec
tsO
utco
me
ITo
iden
tify
clin
ical
nur
ses’
per
cept
ion
ofim
porta
nt a
spec
ts o
f nur
sing
car
e th
at m
ight
impa
ct o
n qu
ality
of c
are
in su
rgic
al w
ards
.
Focu
s gro
up in
terv
iew
s4
grou
ps
(20
nurs
es)
A te
ntat
ive
mod
el b
ased
on
impo
rtant
asp
ects
of
surg
ical
nur
sing
car
e w
ith 1
5 ca
tego
ries i
n 2
dim
ensi
ons,
elem
ents
of p
erfo
rman
ce a
ndpr
ereq
uisi
tes.
IITo
eva
luat
e th
e us
eful
ness
of a
tent
ativ
e m
odel
base
d on
impo
rtant
asp
ects
of s
urgi
cal n
ursi
ngca
re, f
or d
esig
ning
stra
tegi
c an
d cl
inic
al q
ualit
yin
dica
tors
.
Lite
ratu
re re
view
Que
stio
nnai
re21
0 nu
rses
The
tent
ativ
e m
odel
was
foun
d to
be
effe
ctiv
e fo
rde
sign
ing
item
s use
ful a
s stra
tegi
c an
d cl
inic
alqu
ality
indi
cato
rs in
pos
tope
rativ
e pa
inm
anag
emen
t.
II, I
IITo
inve
stig
ate
cont
ent v
alid
ity o
f stra
tegi
c an
dcl
inic
al q
ualit
y in
dica
tors
in p
osto
pera
tive
pain
man
agem
ent.
Que
stio
nnai
re2
grou
psof
nur
ses
n=21
0an
dn=
321
Con
tent
val
idity
was
est
ablis
hed,
i.e.
the
indi
cato
rsw
ere
judg
ed to
be
esse
ntia
l for
the
qual
ity o
f car
ein
pos
tope
rativ
e pa
in m
anag
emen
t, re
alis
tic to
carr
y ou
t, an
d po
ssib
le fo
r nur
ses t
o in
fluen
cem
anag
emen
t.
IVTo
dev
elop
and
eva
luat
e ps
ycho
met
ricpr
oper
ties o
f an
inst
rum
ent t
o m
easu
re st
rate
gic
and
clin
ical
qua
lity
indi
cato
rs in
pos
tope
rativ
epa
in m
anag
emen
t.
Que
stio
nnai
re19
8 pa
tient
sIn
tern
al c
onsi
sten
cy re
liabi
lity,
fact
or a
naly
sis,
diff
eren
t gro
ups a
ppro
ach
and
conv
erge
nt v
alid
itysu
gges
ted
initi
al su
ppor
t for
the
inst
rum
ent.
VTo
inve
stig
ate
patie
nt a
nd n
urse
ass
essm
ent o
nth
e qu
ality
of c
are
in p
osto
pera
tive
pain
man
agem
ent a
nd to
test
the
appl
icab
ility
of a
new
inst
rum
ent
Patie
nt a
nd n
urse
ques
tionn
aire
s19
8 pa
tient
san
d63
nur
ses
(pai
red)
The
inst
rum
ent a
ppea
red
to b
e us
eful
in id
entif
ying
impo
rtant
are
as fo
r im
prov
emen
t and
diff
eren
ces
amon
g gr
oups
of p
atie
nts a
nd d
epar
tmen
ts.
Diff
eren
ces w
ere
foun
d be
twee
n th
e pa
tient
and
nurs
e as
sess
men
ts.
22
presented as arithmetic means and standard deviation for the sake ofclarity, although the different questionnaires are referred to as ordinalscales. Non-parametric unpaired data were tested with Kruskall-WallisANOVA, Chi2–test with Yates correction, and Mann-Whitney U-testadjusted for ties and Bonferroni correction. For non-parametric paired data,the Friedman two-way ANOVA, Wilcoxon’s rank test and Bonferronicorrection were used. For correlation between non-parametric data,Spearman rank order correlation was used. The backward stepwise multipleregression analysis was used.
Fehring’s methodology (1987) was used for content validation. ThePearson Product-Moment Correlation was used for inter-item and item-total correlations and Cronbach’s coefficient alpha was used to test internalconsistency reliability (Cronbach 1951, Streiner & Norman 1995). Anexplorative factor analysis was performed on patients' scores through aprincipal component analysis followed by varimax orthogonal rotation(Gorsuch 1983).
Qualitative analysisThe qualitative data were analysed by unitising and categorising whichwere inspired by the constant comparative method described by Lincolnand Guba (1985).
EthicsThis thesis was designed and implemented in compliance with commonprinciples in human research, i.e. the principle of respect for autonomy, theprinciple of nonmaleficience, the principal of beneficience and theprinciple of justice (Beauchamp 1994). Written information was given toall participants, and it was emphasised that participation was voluntary.The studies which included study groups four and five, were examined andapproved by the Research Ethics Committee, Faculty of Health Sciences,Linköping University.
STEP ONE: To identify clinical nurses’ perceptions of importantaspects of surgical nursing careSubjectsStudy group one included 4 focus group interviews with 4 to 6 registerednurses (RN) in each group, 20 in a total and all at the same hierarchicallevel. The interviews were conducted at 2 university hospitals and at 2central county hospitals in Sweden. The age of the participants rangedbetween 24 and 53 years (mean age 35 years), and they had been working

23
in surgical wards between 1 and 29 years. Each focus group includednurses from different surgical wards, and they had been asked by theirrespective head nurses to participate in a group interview concerning thequality of nursing care. The nurses did not know the interviewers.
MethodFocus group interviewA qualitative approach, using focus group interviews, was chosen to elicitnurses’ opinions of important aspects of surgical nursing care. Theinterview is a carefully planned and guided interactional discussion. Thefocus underpinning the discussions is anything that engages the group in acollective activity, such as debating a particular set of questions (Kingry etal. 1990, Krueger 1994, Powell & Single 1996). In the present focus groupinterviews, preselected and open-ended questions were used based on ananalysis of the subject quality, important aspects, and surgical nursing care(Appendix I). The author (EI) was the moderator of all focus groupinterviews (n=4) while assistant moderators differed. They were, however,all familiar with the technique of group processes. The moderator wasprimarily concerned with directing the discussions and keeping theconversation flowing, while the assistants, for example, tookcomprehensive notes and handled the environmental conditions. Eachinterview lasted about 90 minutes, and was tape-recorded by permissionand transcribed verbatim. The interviews took place at the hospital andwere characterised by natural speech and interaction between theparticipants. Naturally, some individuals talked more than others, but thiswas handled by the moderator and did not appear to pose a problem. Beforeand after the interviews there was some discussion to establish a morerelaxed atmosphere.
Analysis of the focus group interviewThe tape-recorded interviews were transcribed verbatim by the author (EI).The first step in the data analysis was unitising, which implies that the datawere examined line by line to identify units of information. According toLincoln & Guba (1985) a unit should have two characteristics viz. (1) itshould be heuristic, that is, aimed at some understanding or some actionthat the inquirer needs to have, and (2) it must be the smallest piece ofinformation about something that can stand by itself. The units derivedwere formulated in words used by the nurses themselves. This unitisingserved, as a second step, as a basis for defining categories. The essentialtask of categorising was to bring together units of information that relatedto the same content. This was done by continuous comparisons between
24
possible categories and the units obtained. Finally, the categories werefurther condensed into 2 dimensions.
The author (EI) and another researcher familiar with qualitative analysisseparately performed the initial unitising. The units of information werecompared and discussed. Categories and dimensions were identified andthen reasoned with the other researcher, and the findings were evaluateduntil final agreement was reached. Then, a theoretical interpretation wasperformed using Carper’s (1978) 4 fundamental patterns of knowing as aframework to assess whether the findings relate to each other. The patternsare (1) empirics, the science of nursing which is descriptive and based onfacts, (2) esthetics, the art of nursing which can involve empathy, (3) thecomponent of personal knowledge, for example, to understand the meaningof the sick person, and (4) ethics, the component of moral knowledge.These 4 patterns together constitute the essence of nursing care accordingto Carper.
ResultFrom the data analysis of the focus group interviews 15 different categoriesemerged, which the nurses considered as important aspects for the qualityand effects of surgical nursing care. These categories become perceptible as2 dimensions; firstly, the conditions to make good quality of nursing carepossible; and secondly a set of activities between the nurses and thepatients. Here they are called “prerequisites” and “elements of perform-ance”. The 15 categories in the 2 dimensions frame a tentative model ofimportant aspects of surgical nursing care. The 8 categories in elements ofperformance are "detecting and acting on signs and symptoms", "perform-ing prescriptions", "performing pre- and postoperative care", "performinggeneral care", "informing and educating", "promoting relationships", "act-ing on behalf of patients" and "protecting the privacy of patients". The 7categories in prerequisites are "staffing", "environment/equipment",competence/knowledge", "routines", "responsibility", "attitudes" and "teamwork".
The 8 categories in the dimension ”elements of performance” were inter-preted by means of Carper’s 4 patterns of knowing (1978). Three of thepatterns could be found viz. empirics in the categories ”detecting and act-ing on signs and symptoms”, ”performing prescriptions”, ”performing pre-and postoperative care”, ”performing general care” and ”informing andeducating”, personal knowledge in the categories ”informing and educat-ing” and ” promoting relationships”, and ethics in the categories ”acting on
25
behalf of patients” and ”protecting the privacy of patients”. However, thefourth pattern, esthetics, could not be identified in the analysis of the data.
ConclusionImportant aspects of surgical nursing care were distinguished andsummarised in a tentative model.
STEP TWO: To evaluate the usefulness of the tentative model fordesigning strategic and clinical quality indicators and to investigatecontent validitySubjectsStudy group two included all RNs who were registered to participate intwo-days intensive courses in acute pain management between 1995 and1997 (n=233) arranged by the Swedish Nurses Association for PainManagement and Abbott Scandinavia, Inc. This population was selected toanswer a questionnaire because of their obvious special interest and clinicalexperience in pain management. The response rate was 90% (n=210).Study group three included a random sample of clinical RNs working insurgical wards, i.e. general surgery, orthopaedics, gynaecology, andurology (n=404). The participants were recruited from the SwedishAssociation of Health Officers, which represents more than 90% of theRNs in Sweden. The response rate of the questionnaire was 80% (n=321).The non-respondents came from different parts of the country. Backgroundvariables for study groups two and three are reported in Table 2. Thequestionnaire was mailed to the nurses along with a stamped, self-addressed return envelope. Two reminders were sent to non-respondents.
MethodConstruction of strategic and clinical quality indicatorsThe tentative model of important aspects of surgical nursing care was usedas a basis for designing items to be effective as strategic and clinicalnursing quality indicators in postoperative pain management. Postoperativepain management was chosen as an area characterised by high volume,high risk, high problem, high cost, high priority and of significant potentialto lead to improvement in health care, and where nursing makes adifference. Supportive literature gave a rationale for the indicators(VanDalfsen & Syrjala 1990, AHCPR 1992, Closs 1992, Rawal &Berggren 1994, Meehan et al. 1995, Sjöström 1995, Francke et al. 1996,Segesten 1997). One item was formulated in each of the 15 categories. Thetentative model covered different well-selected important aspects ofsurgical nursing care, rendering these strategic aspects.
26
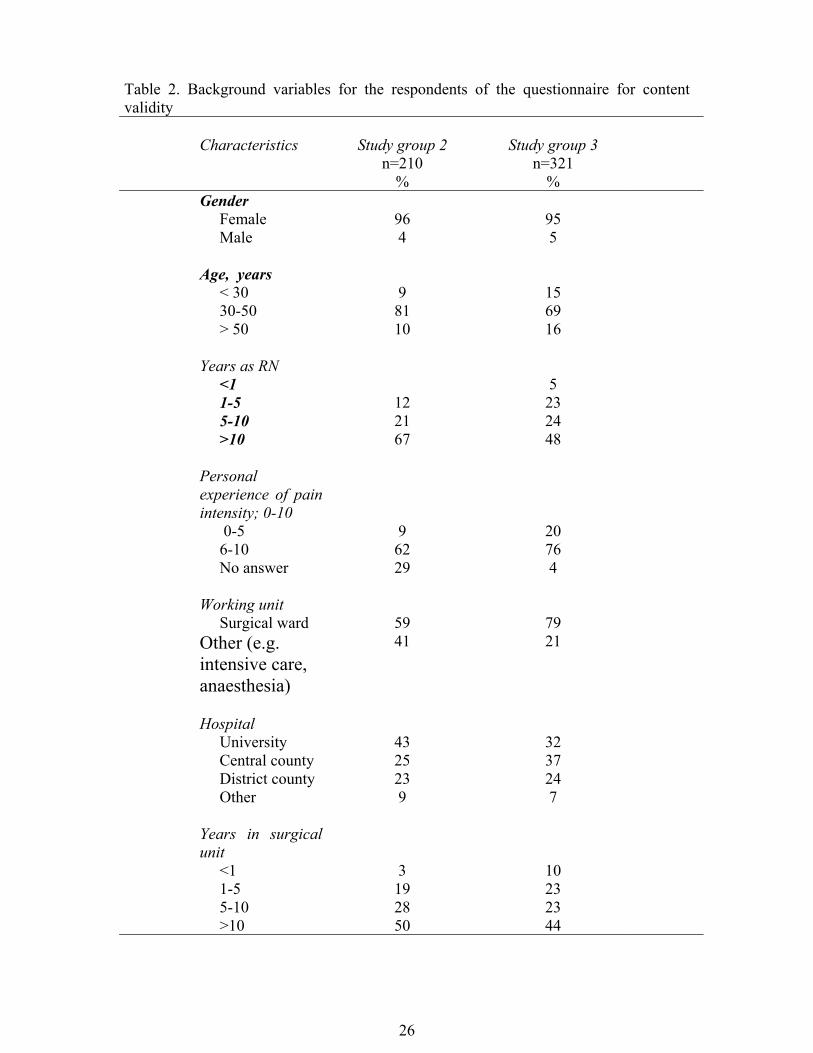
Table 2. Background variables for the respondents of the questionnaire for contentvalidity
Characteristics Study group 2n=210
%
Study group 3n=321
%Gender Female 96 95 Male 4 5
Age, years < 30 9 15 30-50 81 69 > 50 10 16
Years as RN <1 5 1-5 12 23 5-10 21 24 >10 67 48
Personalexperience of painintensity; 0-10 0-5 9 20 6-10 62 76 No answer 29 4
Working unit Surgical ward 59 79Other (e.g.intensive care,anaesthesia)
41 21
Hospital University 43 32 Central county 25 37 District county 23 24 Other 9 7
Years in surgicalunit <1 3 10 1-5 19 23 5-10 28 23 >10 50 44

27
Content validityTo establish content validity, a questionnaire was compiled that includedthe 15 strategic and clinical quality indicators. These were assessed from 3points of view; (1) whether it was essential to achieve high qualitypostoperative pain management in adult patients in a surgical ward, (2)whether it was realistic to carry out and (3) whether it was possible fornurses to influence management. A 5-point scale was used with theresponse alternatives strongly disagree (1), disagree (2), uncertain (3),agree (4), strongly agree (5). The nurses were also asked to choose 3indicators in each of the 2 dimensions in the tentative model, which theyconceived to be the most crucial factors for achieving high quality inpostoperative pain management.
Fehring’s methodology (1987) for content validation was adopted forvalidation of the quality indicators. Using the responses provided by thestudy groups two and three, mean weighted ratios were calculated for eachindicator as essential, realistic to carry out and possible for nurses toinfluence management. The weighted scores were 5=1, 4=0.75, 3=0.5, 2=0.25 and 1= 0. These weights are provided to give a maximum score of 1.0.No score is given to a defining characteristic judged to be not at allindicative. Defining indicators with weighted mean ratios greater than orequal to 0.80 were considered as “major”, and indicators with mean ratiosless than 0.80 but greater than 0.50 were “supportive”. The indicators withmean ratios less than or equal to 0.50 should be discarded.
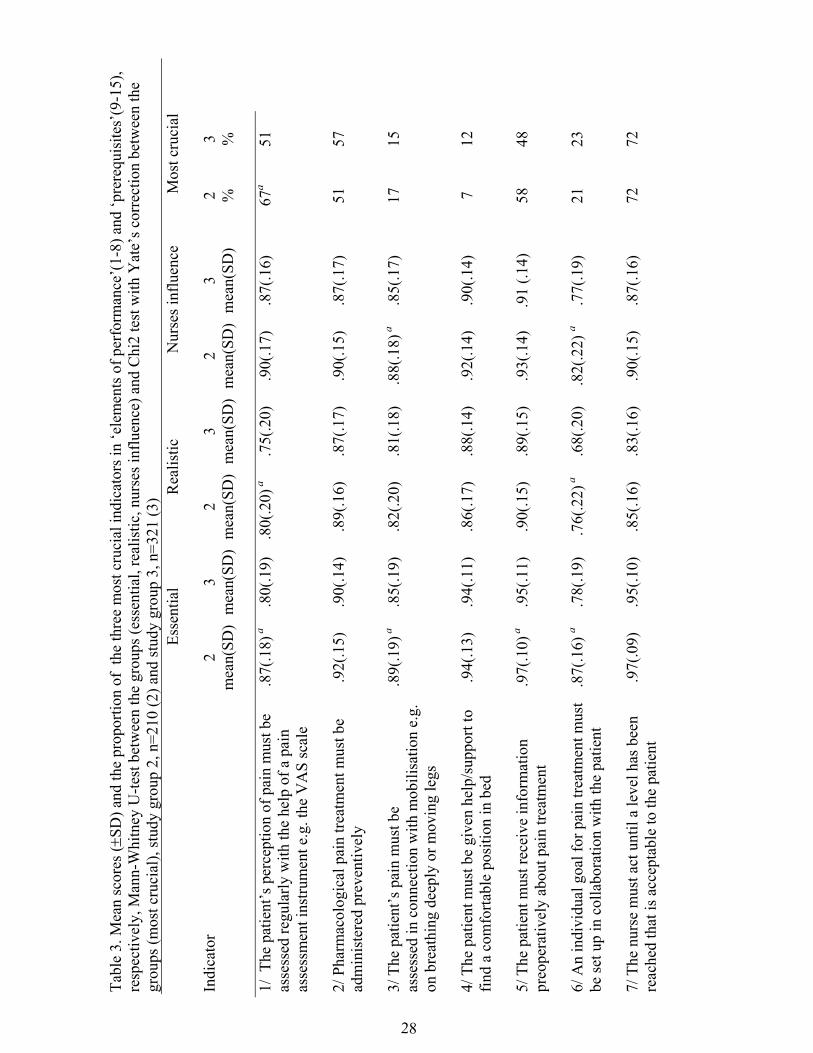
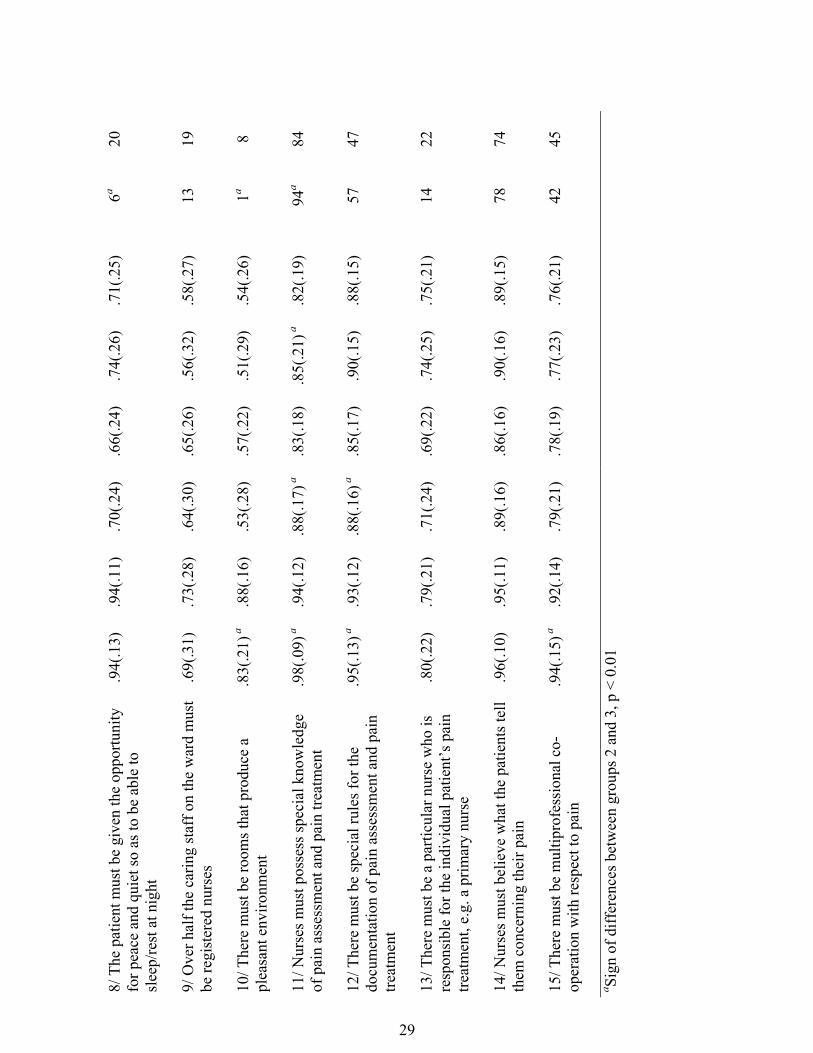
ResultEssentialStudy group two validated 14 of the 15 indicators and study group threevalidated 12 as “major” factors in terms of being essential to achieve highquality. The remaining indicators were considered to be “supportive”. Thenurses in group two scored 7 indicators higher than group three as essentialand just 1 indicator was scored higher by group three, i.e. the indicator inthe “environment” category (number 10) (Table 3).
RealisticStudy group two validated 9 of the 15 indicators and study group threevalidated 8 as “major” factors in terms of being realistic to carry out in asurgical ward. The remaining indicators were considered to be“supportive”. The nurses in group two scored 4 indicators higher thangroup three as realistic to carry out (Table 3).
28
Tabl
e 3.
Mea
n sc
ores
(±SD
) and
the
prop
ortio
n of
the
thre
e m
ost c
ruci
al in
dica
tors
in ‘e
lem
ents
of p
erfo
rman
ce’(
1-8)
and
‘pre
requ
isite
s’(9
-15)
,re
spec
tivel
y, M
ann-
Whi
tney
U-te
st b
etw
een
the
grou
ps (e
ssen
tial,
real
istic
, nur
ses i
nflu
ence
) and
Chi
2 te
st w
ith Y
ate’
s cor
rect
ion
betw
een
the
grou
ps (m
ost c
ruci
al),
stud
y gr
oup
2, n
=210
(2) a
nd st
udy
grou
p 3,
n=3
21 (3
)Es
sent
ial
R
ealis
tic
N
urse
s inf
luen
ce
M
ost c
ruci
al
Indi
cato
r2
mea
n(SD
)3
mea
n(SD
)2
mea
n(SD
)3
mea
n(SD
)2
mea
n(SD
)3
mea
n(SD
)2 %
3 %
1/ T
he p
atie
nt’s
per
cept
ion
of p
ain
mus
t be
asse
ssed
regu
larly
with
the
help
of a
pai
nas
sess
men
t ins
trum
ent e
.g. t
he V
AS
scal
e
.87(
.18)
a.8
0(.1
9).8
0(.2
0) a
.75(
.20)
.90(
.17)
.87(
.16)
67a
51
2/ P
harm
acol
ogic
al p
ain
treat
men
t mus
t be
adm
inis
tere
d pr
even
tivel
y.9
2(.1
5).9
0(.1
4).8
9(.1
6).8
7(.1
7).9
0(.1
5).8
7(.1
7)51
57
3/ T
he p
atie
nt’s
pai
n m
ust b
eas
sess
ed in
con
nect
ion
with
mob
ilisa
tion
e.g.
on b
reat
hing
dee
ply
or m
ovin
g le
gs
.89(
.19)
a.8
5(.1
9).8
2(.2
0).8
1(.1
8).8
8(.1
8) a
.85(
.17)
1715
4/ T
he p
atie
nt m
ust b
e gi
ven
help
/sup
port
tofin
d a
com
forta
ble
posi
tion
in b
ed.9
4(.1
3).9
4(.1
1).8
6(.1
7).8
8(.1
4).9
2(.1
4).9
0(.1
4)7
12
5/ T
he p
atie
nt m
ust r
ecei
ve in
form
atio
npr
eope
rativ
ely
abou
t pai
n tre
atm
ent
.97(
.10)
a.9
5(.1
1).9
0(.1
5).8
9(.1
5).9
3(.1
4).9
1 (.1
4)58
48
6/ A
n in
divi
dual
goa
l for
pai
n tre
atm
ent m
ust
be se
t up
in c
olla
bora
tion
with
the
patie
nt.8
7(.1
6) a
.78(
.19)
.76(
.22)
a.6
8(.2
0).8
2(.2
2) a
.77(
.19)
2123
7/ T
he n
urse
mus
t act
unt
il a
leve
l has
bee
nre
ache
d th
at is
acc
epta
ble
to th
e pa
tient
.97(
.09)
.95(
.10)
.85(
.16)
.83(
.16)
.90(
.15)
.87(
.16)
7272
29
8/ T
he p
atie
nt m
ust b
e gi
ven
the
oppo
rtuni
tyfo
r pea
ce a
nd q
uiet
so a
s to
be a
ble
tosl
eep/
rest
at n
ight
.94(
.13)
.94(
.11)
.70(
.24)
.66(
.24)
.74(
.26)
.71(
.25)
6a20
9/ O
ver h
alf t
he c
arin
g st
aff o
n th
e w
ard
mus
tbe
regi
ster
ed n
urse
s.6
9(.3
1).7
3(.2
8).6
4(.3
0).6
5(.2
6).5
6(.3
2).5
8(.2
7)13
19
10/ T
here
mus
t be
room
s tha
t pro
duce
apl
easa
nt e
nviro
nmen
t.8
3(.2
1) a
.88(
.16)
.53(
.28)
.57(
.22)
.51(
.29)
.54(
.26)
1a8
11/ N
urse
s mus
t pos
sess
spec
ial k
now
ledg
eof
pai
n as
sess
men
t and
pai
n tre
atm
ent
.98(
.09)
a.9
4(.1
2).8
8(.1
7) a
.83(
.18)
.85(
.21)
a.8
2(.1
9)94
a84
12/ T
here
mus
t be
spec
ial r
ules
for t
hedo
cum
enta
tion
of p
ain
asse
ssm
ent a
nd p
ain
treat
men
t
.95(
.13)
a.9
3(.1
2).8
8(.1
6) a
.85(
.17)
.90(
.15)
.88(
.15)
5747
13/ T
here
mus
t be
a pa
rticu
lar n
urse
who
isre
spon
sibl
e fo
r the
indi
vidu
al p
atie
nt’s
pai
ntre
atm
ent,
e.g.
a p
rimar
y nu
rse
.80(
.22)
.79(
.21)
.71(
.24)
.69(
.22)
.74(
.25)
.75(
.21)
1422
14/ N
urse
s mus
t bel
ieve
wha
t the
pat
ient
s tel
lth
em c
once
rnin
g th
eir p
ain
.96(
.10)
.95(
.11)
.89(
.16)
.86(
.16)
.90(
.16)
.89(
.15)
7874
15/ T
here
mus
t be
mul
tipro
fess
iona
l co-
oper
atio
n w
ith re
spec
t to
pain
.94(
.15)
a.9
2(.1
4).7
9(.2
1).7
8(.1
9).7
7(.2
3).7
6(.2
1)42
45
a Sign
of d
iffer
ence
s bet
wee
n gr
oups
2 a
nd 3
, p <
0.0
1
30
Nurses influenceStudy group two validated 10 of the 15 indicators and study group threevalidated 9 as “major” factors in terms of the possibilities for nurses toinfluence management. The remaining indicators were considered to be“supportive”. The nurses in group two scored 3 indicators higher thangroup three as regards the possibility for nurses to influence management(Table 3).
Differences between matched assessmentsAmong the nurses in study groups two and three, respectively, the ANOVAshowed higher scores (p<0.01) for the assessment “essential” compared to“realistic” for 13 of the 15 indicators in group two (except for indicatorsnumbered 2 and 9) and for all indicators in group three. Higher scores werealso given for “essential” than for “nurses influence” (p<0.01) for 11indicators in group two (except for numbers 1, 2, 3, and 4) and for 11indicators in group three (except for numbers 2, 3, 6, and 13).
Most crucialThe most crucial indicators ranked in both groups were in the categoriesdetecting and acting on signs and symptoms, performing prescriptions,informing and educating, acting on behalf of the patients, competence/knowledge and attitudes (Table 3)
ConclusionThe tentative model was found to be effective for designing items useful asstrategic and clinical quality indicators in postoperative pain management.Content validity was established, i.e. essential for the quality of care,realistic to carry out and possible for nurses to influence management.
STEP THREE: To develop and evaluate psychometric properties of aninstrumentSubjectsStudy group four consisted of 209 inpatients from 5 orthopaedic,gynaecological and general surgical wards in a central county hospital inSweden. The patients answered a questionnaire on their secondpostoperative day and inclusion criteria were patients scheduled for electivesurgery, oriented to person and place, able to understand Swedish, at least18 years of age and spent at least 24 hours in the wards after the surgicalprocedure before answering the questionnaire. Data were collected 2 or 3weekdays per week over 4 months, September through December 1999.The response rate was 96% (n=200), but 2 questionnaires were omitted
31
because they were incomplete. The patients (n=198) were undergoing avariety of surgical procedures in orthopaedics (36.4%), gynaecology(19.7%) and general surgery (43.9%). The mean age was 62 years(SD=14.9, range 20-87), and 120 (61%) patients were female. Sixty-onepatients (31%) received epidural analgesia for postoperative pain relief.Paracetamol, cetobemidon, and tramadol, intramuscularly, intravenously ororally, were the most commonly ordered analgesics. Three patientsreceived no postoperative analgesia. Demographic variables were collectedfrom the patient records.
The researcher, with no affiliation with the hospital, conducted the studyand recruited the patients in study group four. They were all informed bothverbally and in writing. The questionnaire was given to the patient andcollected after about 20 to 30 minutes. Thirty-six patients (18%) asked theresearcher to read the questions and complete their answers.
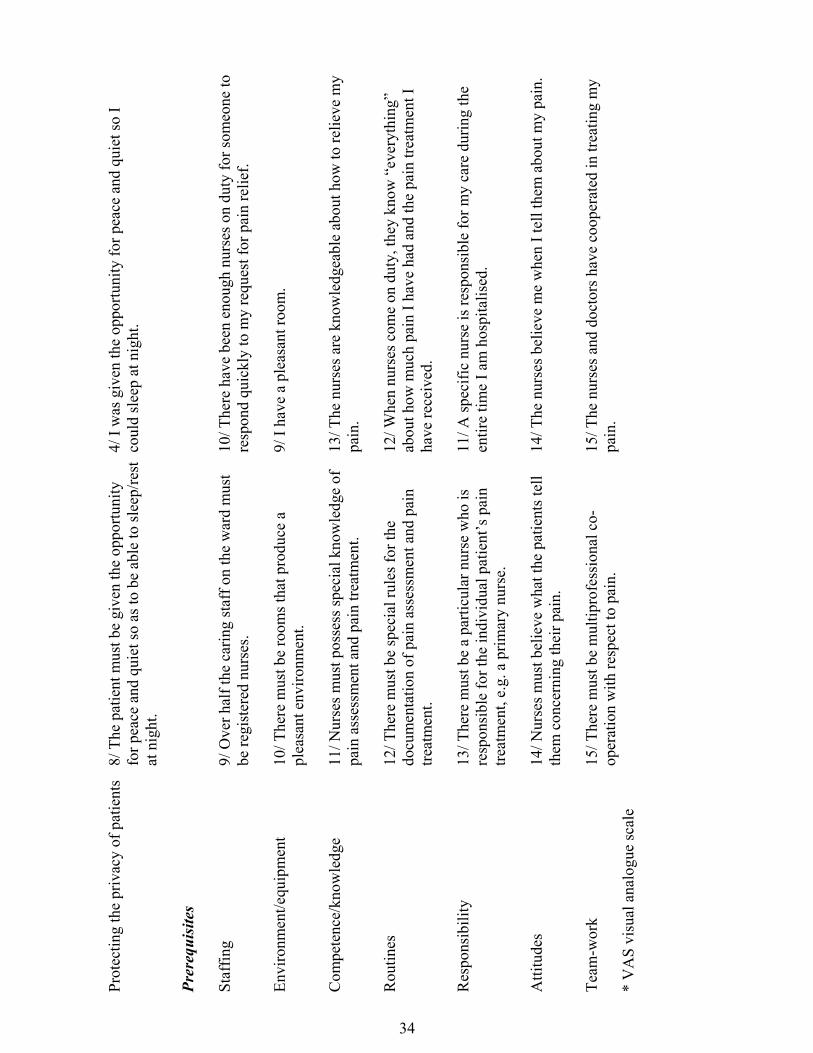
MethodDeveloping an instrumentAn instrument was compiled to measure the strategic and clinical qualityindicators for achieving high quality in postoperative pain managementwhich were found to have content validity. The indicators were convertedby the researcher to statements suitable for a patient questionnaire (Table4). The statements were scored on a 5-point scale with the endpoints:1=strongly disagree and 5=strongly agree. The total score could varybetween 15 and 75 with higher values indicating a higher quality of care.Complementary questions were “Worst pain you have had in the last24hours”, “Lowest level of pain in the last 24hours”, and “Pain you haveright now” from the Brief Pain Inventory (Daut et al. 1983). An 11-pointscale was used with the end points 0=no pain and 10=worst possible pain.“Did you have more pain after the operation than expected” as a Yes/Noquestion and the overall satisfaction question “How dissatisfied or satisfiedare you with the pain relief after the surgical procedure” (11-point scalewith 0=very dissatisfied and 10=very satisfied) were also asked.
ResultInternal consistency reliabilityThe proportion of times each individual item correlated with other items inthe range 0.20 to 0.70 (p<0.05) varied between 3/14 and 14/14. No inter-item correlation coefficients were >0.70. The average inter-item correlationcoefficients were >0.20 for all items, except item number 11. The item-total correlation coefficients (without respective item) were between 0.24
32
and 0.67. Item number 11 was the only item with a correlation coefficient<0.30. For the total scale the Cronbach’s coefficient alpha was 0.83 and theaverage inter-item correlation coefficient was 0.30. If item number 11 wasdeleted the coefficient alpha and average correlation coefficient would be0.84 and 0.32, respectively.
Item number 11 was deleted due to the results from the reliability analysis,viz. several inter-item correlation coefficients <0.20, item-total correlationcoefficient <0.30 and increasing Cronbach’s coefficient alpha (0.01) whendeleted.
Factor analysisA principal component factor analysis was performed with the remaining14 items from the scale to explore underlying structures. The scree-test plotand eigenvalues >1.0 in the unrotated explanatory factor analysis supportedthe 4-factor solution with a cumulative variance of 61.44%. A rotation toorthogonal transformation was performed, and the loading of the items onthe 4 factors are reported in Table 5. The salient loading for each itemexceeded 0.40. Cross-loading was found between factors, but the highestloading was considered salient. Items with loading which were close toequal in 2 factors were placed in the factor where the content seemed mostlogical.
The 4 factors were named according to the essential content of the itemsCommunication”, “Action”, “Trust” and “Environment that all areimportant parts of postoperative pain management. Correlation coefficientsbetween 0.34 and 0.58 (p<0.05) were found among the 4 factors. TheCronbach’s coefficient alpha for the total scale was 0.84 and for the 4factors 0.65, 0.65, 0.75, and 0.56, respectively.
Different groups approachThe criteria “Epidural-analgesia (EDA)” and “More pain than expected”were used to divide patients into groups to determine whether the scalecould distinguish between (1) patients who received EDA or not, andbetween (2) patients who experienced more pain than expected or not. Thepatients who received EDA had higher scores on the total scale and theaction sub-scale but lower scores on the environment sub-scale. Those whoexperienced more pain than expected had lower scores for both the totalscale and the 4 sub-scales (Table 6). The differences between groupssuggest some degree of support for construct validity.

33
Tabl
e 4.
The
cat
egor
ies,
the
indi
cato
rs fo
r con
tent
val
idat
ion
and
item
s in
the
patie
nt q
uest
ionn
aire
Cat
egor
ies i
n th
e te
ntat
ive
mod
el (I
)In
dica
tors
for
cont
ent v
alid
ity (I
I, II
I)It
ems i
n th
e pa
tient
que
stio
nnai
re (I
V, V
)
Elements
of performance
Det
ectin
g an
d ac
ting
on si
gns a
ndsy
mpt
oms
1/ T
he p
atie
nt’s
per
cept
ion
of p
ain
mus
t be
asse
ssed
regu
larly
with
the
help
of a
pai
nas
sess
men
t ins
trum
ent e
.g. t
he V
AS*
scal
e.
7/ T
o de
term
ine
my
leve
l of p
ain,
a m
embe
r of t
he st
aff
aske
d m
e to
pic
k a
num
ber b
etw
een
0 an
d 10
(or m
ake
am
ark
on a
stra
ight
line
) at l
east
onc
e ev
ery
mor
ning
,af
tern
oon,
and
eve
ning
.
Perf
orm
ing
pres
crip
tions
2/ P
harm
acol
ogic
al p
ain
treat
men
t mus
t be
adm
inis
tere
d pr
even
tivel
y.5/
Eve
n if
I did
not
alw
ays a
sked
for i
t, I w
as g
iven
pai
nm
edic
atio
n.
Perf
orm
ing
pre-
and
post
oper
ativ
e ca
re3/
The
pat
ient
’s p
ain
mus
t be
asse
ssed
in c
onne
ctio
n w
ith m
obili
zatio
n e.
g.on
bre
athi
ng d
eepl
y or
mov
ing
legs
.
6/ T
he st
aff a
sked
me
abou
t the
pai
n I h
ad w
hen
I bre
athe
dde
eply
, sat
up,
or m
oved
aro
und.
Perf
orm
ing
gene
ral c
are
4/ T
he p
atie
nt m
ust b
e gi
ven
help
/sup
port
tofin
d a
com
forta
ble
posi
tion
in b
ed.
3/ I
rece
ived
supp
ort o
r hel
p in
find
ing
a co
mfo
rtabl
epo
sitio
n in
bed
to h
elp
avoi
d pa
in.
Info
rmin
g an
d ed
ucat
ing
5/ T
he p
atie
nt m
ust r
ecei
ve in
form
atio
npr
eope
rativ
ely
abou
t pai
n tre
atm
ent.
1/ B
efor
e m
y op
erat
ion
I was
told
abo
ut th
e ty
pe o
f pai
ntre
atm
ent I
wou
ld b
e of
fere
d af
ter s
urge
ry.
Prom
otin
g re
latio
nshi
ps6/
An
indi
vidu
al g
oal f
or p
ain
treat
men
t mus
tbe
set u
p in
col
labo
ratio
n w
ith th
e pa
tient
.2/
Afte
r my
oper
atio
n I t
alke
d w
ith a
nur
se a
bout
how
Iw
ante
d m
y pa
in to
be
treat
ed.
Act
ing
on b
ehal
f of p
atie
nts
7/ T
he n
urse
mus
t act
unt
il a
leve
l has
bee
nre
ache
d th
at is
acc
epta
ble
to th
e pa
tient
.8/
The
nur
ses h
elpe
d m
e w
ith p
ain
treat
men
t unt
il I w
assa
tisfie
d w
ith th
e ef
fect
s of p
ain
relie
f.
34
Prot
ectin
g th
e pr
ivac
y of
pat
ient
s8/
The
pat
ient
mus
t be
give
n th
e op
portu
nity
for p
eace
and
qui
et so
as t
o be
abl
e to
slee
p/re
stat
nig
ht.
4/ I
was
giv
en th
e op
portu
nity
for p
eace
and
qui
et so
Ico
uld
slee
p at
nig
ht.
Prerequisites
Staf
fing
9/ O
ver h
alf t
he c
arin
g st
aff o
n th
e w
ard
mus
tbe
regi
ster
ed n
urse
s.10
/ The
re h
ave
been
eno
ugh
nurs
es o
n du
ty fo
r som
eone
tore
spon
d qu
ickl
y to
my
requ
est f
or p
ain
relie
f.
Envi
ronm
ent/e
quip
men
t10
/ The
re m
ust b
e ro
oms t
hat p
rodu
ce a
plea
sant
env
ironm
ent.
9/ I
have
a p
leas
ant r
oom
.
Com
pete
nce/
know
ledg
e11
/ Nur
ses m
ust p
osse
ss sp
ecia
l kno
wle
dge
ofpa
in a
sses
smen
t and
pai
n tre
atm
ent.
13/ T
he n
urse
s are
kno
wle
dgea
ble
abou
t how
to re
lieve
my
pain
.
Rou
tines
12/ T
here
mus
t be
spec
ial r
ules
for t
hedo
cum
enta
tion
of p
ain
asse
ssm
ent a
nd p
ain
treat
men
t.
12/ W
hen
nurs
es c
ome
on d
uty,
they
kno
w “
ever
ythi
ng”
abou
t how
muc
h pa
in I
have
had
and
the
pain
trea
tmen
t Iha
ve re
ceiv
ed.
Res
pons
ibili
ty13
/ The
re m
ust b
e a
parti
cula
r nur
se w
ho is
resp
onsi
ble
for t
he in
divi
dual
pat
ient
’s p
ain
treat
men
t, e.
g. a
prim
ary
nurs
e.
11/ A
spec
ific
nurs
e is
resp
onsi
ble
for m
y ca
re d
urin
g th
een
tire
time
I am
hos
pita
lised
.
Atti
tude
s14
/ Nur
ses m
ust b
elie
ve w
hat t
he p
atie
nts t
ell
them
con
cern
ing
thei
r pai
n.14
/ The
nur
ses b
elie
ve m
e w
hen
I tel
l the
m a
bout
my
pain
.
Team
-wor
k15
/ The
re m
ust b
e m
ultip
rofe
ssio
nal c
o-op
erat
ion
with
resp
ect t
o pa
in.
15/ T
he n
urse
s and
doc
tors
hav
e co
oper
ated
in tr
eatin
g m
ypa
in.
* V
AS
visu
al a
nalo
gue
scal
e

35
Convergent validityThe correlation coefficient between the overall score and the single-itempain relief satisfaction assessment was 0.53 (p<0.001), which providessupport for some degree of convergent validity.
ConclusionThe findings suggest initial support for the new instrument to measure thestrategic and clinical quality indicators in postoperative pain management.
STEP FOUR: To investigate patient and nurse assessment and to testthe applicability of the instrumentSubjectsThe answers from study group four (n=198 patients) in the “third step”were also used in this fourth step. Study group five consisted of 63registered nurses. The nurses answered 196 of 198 possible questionnaires(99%), which were all paired with a patient questionnaire. Each nurseanswered, on average, three questionnaires (SD 2.3, range 1-11). Mean agefor the nurses was 38 years (SD=8.9, range 23-57) and 59 (94%) nurseswere female. On average, the nurses had been a registered nurse for 13years (SD 9.4, range 0.5-33) and in surgical nursing care for 12 years (SD8.7, range 0.5-33). Twenty nurses (32%) had a special education andtraining in pain management. In 97% of the 196 possible times aquestionnaire was completed, the nurse had been responsible for the patientduring the last 4 hours and 86% also at least one shift (about 8 hours)during the last 24 hours.
The researcher, with no affiliation with the hospital, conducted the studyand recruited the nurses in study group five. They were all informed bothverbally and in writing. At the time the patient agreed to answer thequestionnaire, the nurse responsible for this individual patient was asked tocomplete the nurse questionnaire. It took about 10 minutes to complete thequestionnaire.
MethodThe patient and nurse questionnaireThe patient questionnaire was the same as that used in step three whendeveloping the instrument to measure strategic and clinical qualityindicators. Twelve of the 14 items in the instrument were used andconverted to be answered by the nurses, e.g. “I received support or help tofind a comfortable position in bed to help avoid pain” (patientquestionnaire) to “The patient received support or help to find a
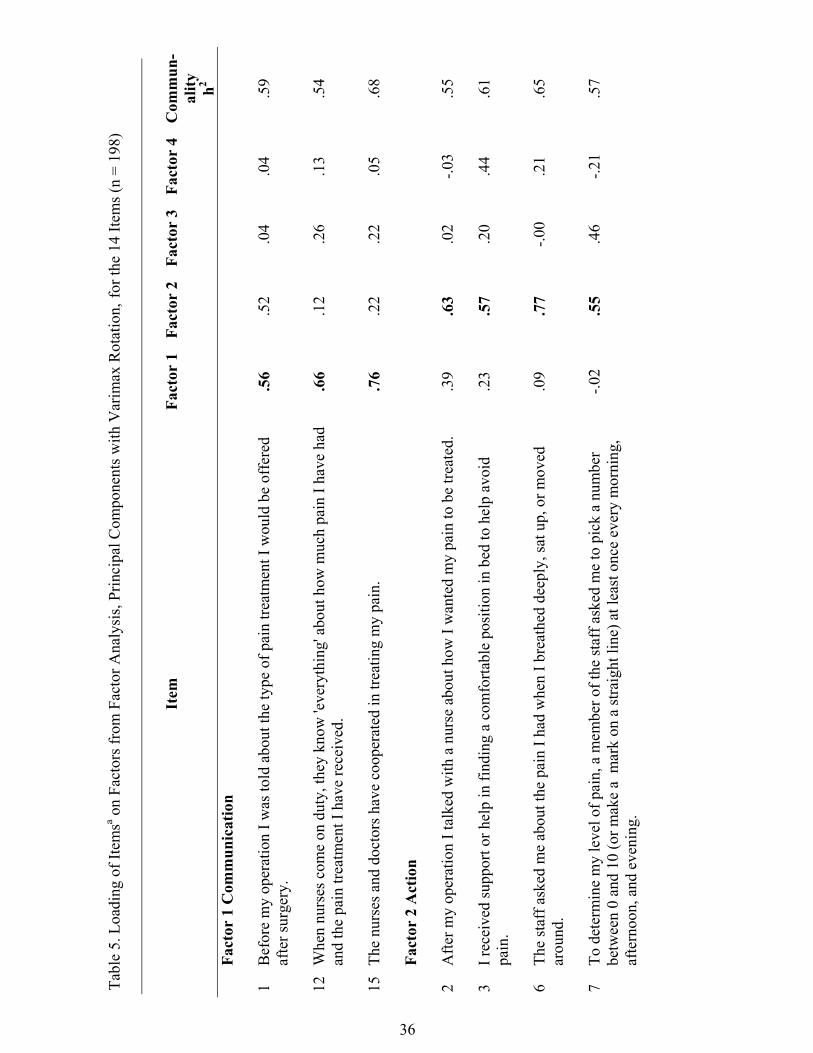
36
Tabl
e 5.
Loa
ding
of I
tem
sa on
Fact
ors f
rom
Fac
tor A
naly
sis,
Prin
cipa
l Com
pone
nts w
ith V
arim
ax R
otat
ion,
for t
he 1
4 Ite
ms (
n =
198)
Item
Fact
or 1
Fact
or 2
Fact
or 3
Fact
or 4
Com
mun
-al
ity h2
Fact
or 1
Com
mun
icat
ion
1B
efor
e m
y op
erat
ion
I was
told
abo
ut th
e ty
pe o
f pai
n tre
atm
ent I
wou
ld b
e of
fere
daf
ter s
urge
ry.
.56
.52
.04
.04
.59
12W
hen
nurs
es c
ome
on d
uty,
they
kno
w 'e
very
thin
g' a
bout
how
muc
h pa
in I
have
had
and
the
pain
trea
tmen
t I h
ave
rece
ived
..6
6.1
2.2
6.1
3.5
4
15Th
e nu
rses
and
doc
tors
hav
e co
oper
ated
in tr
eatin
g m
y pa
in.
.76
.22
.22
.05
.68
Fact
or 2
Act
ion
2A
fter m
y op
erat
ion
I tal
ked
with
a n
urse
abo
ut h
ow I
wan
ted
my
pain
to b
e tre
ated
..3
9.6
3.0
2-.0
3.5
5
3I r
ecei
ved
supp
ort o
r hel
p in
find
ing
a co
mfo
rtabl
e po
sitio
n in
bed
to h
elp
avoi
dpa
in.
.23
.57
.20
.44
.61
6Th
e st
aff a
sked
me
abou
t the
pai
n I h
ad w
hen
I bre
athe
d de
eply
, sat
up,
or m
oved
arou
nd.
.09
.77
-.00
.21
.65
7To
det
erm
ine
my
leve
l of p
ain,
a m
embe
r of t
he st
aff a
sked
me
to p
ick
a nu
mbe
rbe
twee
n 0
and
10 (o
r mak
e a
mar
k on
a st
raig
ht li
ne) a
t lea
st o
nce
ever
y m
orni
ng,
afte
rnoo
n, a
nd e
veni
ng.
-.02
.55
.46
-.21
.57
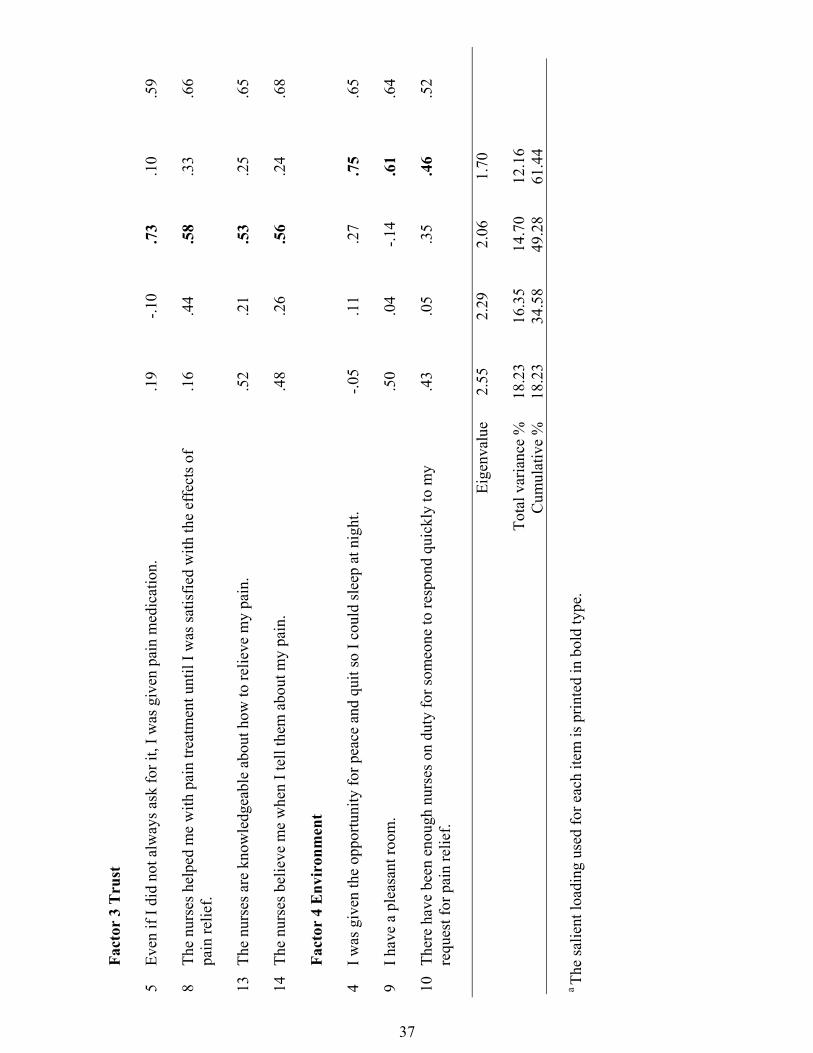
37
Fact
or 3
Tru
st
5Ev
en if
I di
d no
t alw
ays a
sk fo
r it,
I was
giv
en p
ain
med
icat
ion.
.19
-.10
.73
.10
.59
8Th
e nu
rses
hel
ped
me
with
pai
n tre
atm
ent u
ntil
I was
satis
fied
with
the
effe
cts o
fpa
in re
lief.
.16
.44
.58
.33
.66
13Th
e nu
rses
are
kno
wle
dgea
ble
abou
t how
to re
lieve
my
pain
..5
2.2
1.5
3.2
5.6
5
14Th
e nu
rses
bel
ieve
me
whe
n I t
ell t
hem
abo
ut m
y pa
in.
.48
.26
.56
.24
.68
Fact
or 4
Env
iron
men
t
4I w
as g
iven
the
oppo
rtuni
ty fo
r pea
ce a
nd q
uit s
o I c
ould
slee
p at
nig
ht.
-.05
.11
.27
.75
.65
9I h
ave
a pl
easa
nt ro
om.
.50
.04
-.14
.61
.64
10Th
ere
have
bee
n en
ough
nur
ses o
n du
ty fo
r som
eone
to re
spon
d qu
ickl
y to
my
requ
est f
or p
ain
relie
f..4
3.0
5.3
5.4
6.5
2
Eige
nval
ue2.
552.
292.
061.
70
Tota
l var
ianc
e %
18.2
316
.35
14.7
012
.16
Cum
ulat
ive
%18
.23
34.5
849
.28
61.4
4
a Th
e sa
lient
load
ing
used
for e
ach
item
is p
rinte
d in
bol
d ty
pe.
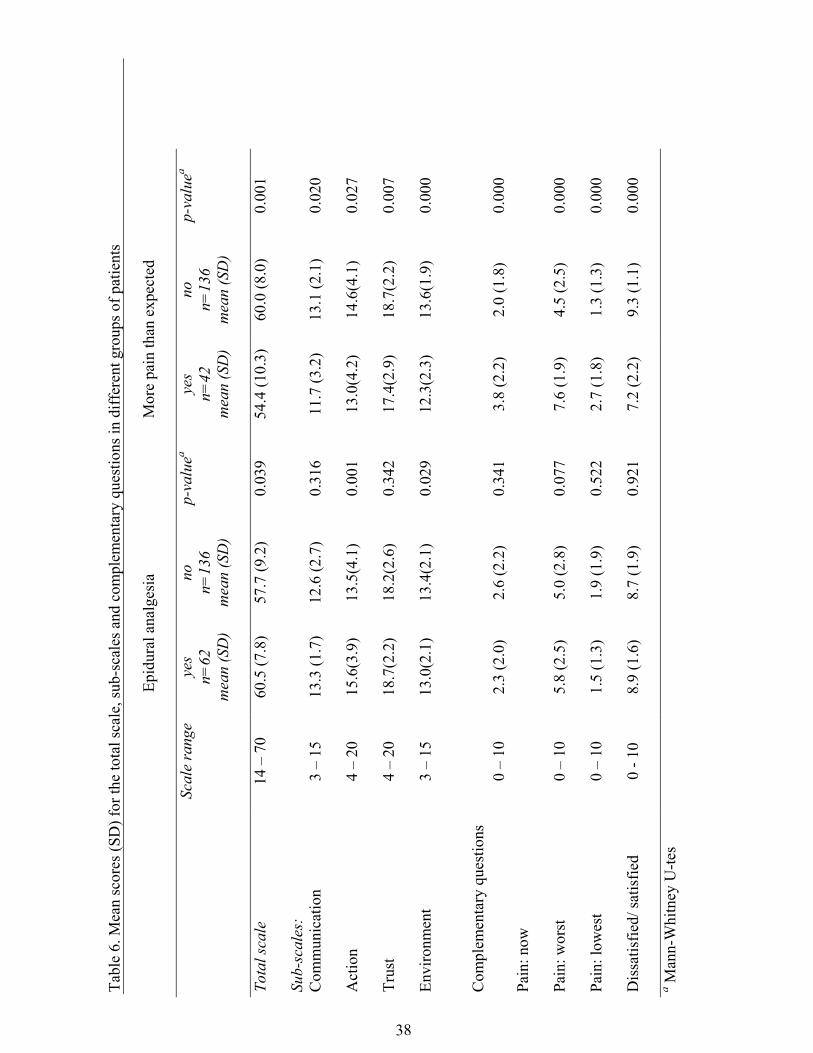
38
Tabl
e 6.
Mea
n sc
ores
(SD
) for
the
tota
l sca
le, s
ub-s
cale
s and
com
plem
enta
ry q
uest
ions
in d
iffer
ent g
roup
s of p
atie
nts
Epi
dura
l ana
lges
ia
Mor
e pa
in th
an e
xpec
ted
Scal
e ra
nge
yes
n=62
mea
n (S
D)
non=
136
mea
n (S
D)
p-va
luea
yes
n=42
mea
n (S
D)
non=
136
mea
n (S
D)
p-va
luea
Tota
l sca
le
Sub-
scal
es:
14 –
70
60.5
(7.8
)57
.7 (9
.2)
0.03
954
.4 (1
0.3)
60.0
(8.0
)0.
001
Com
mun
icat
ion
3 –
1513
.3 (1
.7)
12.6
(2.7
)0.
316
11.7
(3.2
)13
.1 (2
.1)
0.02
0
Act
ion
4 –
2015
.6(3
.9)
13.5
(4.1
)0.
001
13.0
(4.2
)14
.6(4
.1)
0.02
7
Trus
t4
– 20
18.7
(2.2
)18
.2(2
.6)
0.34
217
.4(2
.9)
18.7
(2.2
)0.
007
Envi
ronm
ent
3 –
1513
.0(2
.1)
13.4
(2.1
)0.
029
12.3
(2.3
)13
.6(1
.9)
0.00
0
Com
plem
enta
ry q
uest
ions
Pain
: now
0 –
102.
3 (2
.0)
2.6
(2.2
)0.
341
3.8
(2.2
)2.
0 (1
.8)
0.00
0
Pain
: wor
st0
– 10
5.8
(2.5
)5.
0 (2
.8)
0.07
77.
6 (1
.9)
4.5
(2.5
)0.
000
Pain
: low
est
0 –
101.
5 (1
.3)
1.9
(1.9
)0.
522
2.7
(1.8
)1.
3 (1
.3)
0.00
0
Dis
satis
fied/
satis
fied
0 - 1
08.
9 (1
.6)
8.7
(1.9
)0.
921
7.2
(2.2
)9.
3 (1
.1)
0.00
0
a Man
n-W
hitn
ey U
-tes

39
position in bed to help avoid pain” (nurse questionnaire). Items numbered12 and 15 (Table 4) were excluded because it was difficult to findacceptable similar items. Furthermore, 2 questions were asked: “Worst painthe patients have experienced in the last 24 hours and “How dissatisfied orsatisfied are the patients with their pain relief after the surgical procedure”.The same 5- and 11- point scales, respectively, as in the patientquestionnaire, were used. Data on demographic variables were also askedin the nurse questionnaire. An individual nurse was paired with anindividual patient.
ResultPatient assessmentThe mean scores (SD) for the total instrument (scale range 14-70, highervalues indicating a higher quality of care) was 58.6 (SD 8.9). The meanscores for the individual items were between 2.8 and 4.7 (scale range 1-5)and the number of patients who scored an item 1or 2 (disagreement) variedbetween 0.5% and 52% (Table 7). The mean scores for the sub-scales andcomplementary questions are reported in Table 8.
The patients >70 years had higher (p<0.001) mean scores (14.0 SD 1.5) onthe environment sub-scale compared to the patients <70 years (12.9 SD2.3). Females had lower (p<0.01) mean scores (13.6 SD 4.0) than males(15.1 SD 4.2) on the action sub-scale, and females had higher (p<0.05)mean pain intensity scores (2.0 SD 1.9) on the question about lowest painlevel compared to males (1.4 SD 1.5). Patients with epidural analgesia hadhigher mean scores than those without epidural analgesia on the total scaleand the action sub-scale, but lower scores on the environment sub-scale(Table 6). Forty-two patients (24%) reported more pain than they expectedThese patients had lower scores than those who reported no more pain thanthey expected on the total scale and on the 4 sub-scales. Moreover, theyhad experienced higher pain-levels on worst, lowest and “right now pain”,and were less satisfied with overall pain relief (Table 6).
In a multiple regression model using the backward stepwise method, thetotal scale and the 4 sub-scales were used as outcome variables(dependent). The explanatory variables (independent) were “sex”, “age”,“epidural analgesia” and “more pain than expected”. The outcome variable“total scale” was associated with the explanatory variable “more pain thanexpected” (p<0.001), viz. if you reported more pain than expected you hadlower scores. The communication, trust and environment sub-scales wereall associated with “more pain than expected” (p<0.01, p<0.01 and

40
Table 7. Patients’ and nurses’ mean scores(SD) for the individual items (5-point-scale,1–5) and number of patients and nurses (of total) scoring 1 or 2 on each item
Item Patients’mean (SD)
n=198
Number ofpatients
scoring 1 or2
(of total) %
Nurses’mean(SD)
n=196
Number ofnurses
scoring 1or 2
(of total)%
Sub-scale: Communication1. Before my operation I was told about the type of paintreatment I would be offered after surgery
4.0(1.4) 16.2 3.9(1.1) 11.1
12. When nurses come on duty, they know 'everything'about how much pain I have had and the pain treatment Ihave received
4.3(0.9) 5.6 - -
15. The nurses and doctors have co-operated in treating mypain
4.5(0.8) 3.5 - -
Sub-scale: Action2. After my operation I talked with a nurse about how Iwanted my pain to be treated
3.4(1.5) 29.3 3.3(1.2) 21.2
3. I received support or help in finding a comfortableposition in bed to help avoid pain
4.3(1.1) 9.1 4.2(0.9) 4.5
6. The staff asked me about the pain I had when I breatheddeeply, sat up, or moved around
3.7(1.5) 22.7 3.3(1.2) 18.7
7. To determine my level of pain, a member of the staffasked me to pick a number between 0 and 10 (or make amark on a straight line) at least once every morning,afternoon, and evening
2.8(1.8) 52.0 3.3(1.7) 34.8
Sub-scale: Trust5. Even if I did not always ask for it, I was given painmedication
4.5(1.0) 6.6 4.4(1.0) 6.6
8. The nurses helped me with pain treatment until I wassatisfied with the effects of pain relief
4.5(0.9) 7.1 4.5(0.7) 0.5
13. The nurses are knowledgeable about how to relieve mypain
4.6(0.7) 2.5 4.5(0.6) 0.5
14. The nurses believe me when I tell them about my pain 4.7(0.6) 0.5 4.8(0.4) 0.0
Sub-scale: Environment4. I was given the opportunity for peace and quit so I couldsleep at night
4.3(1.1) 8.1 4.0(0.9) 5.1
9. I have a pleasant room 4.3(1.1) 8.6 3.6(1.1) 14.6
10. There have been enough nurses on duty for someone torespond quickly to my request for pain relief
4.7(0.7) 3.0 4.1(0.9) 4.1
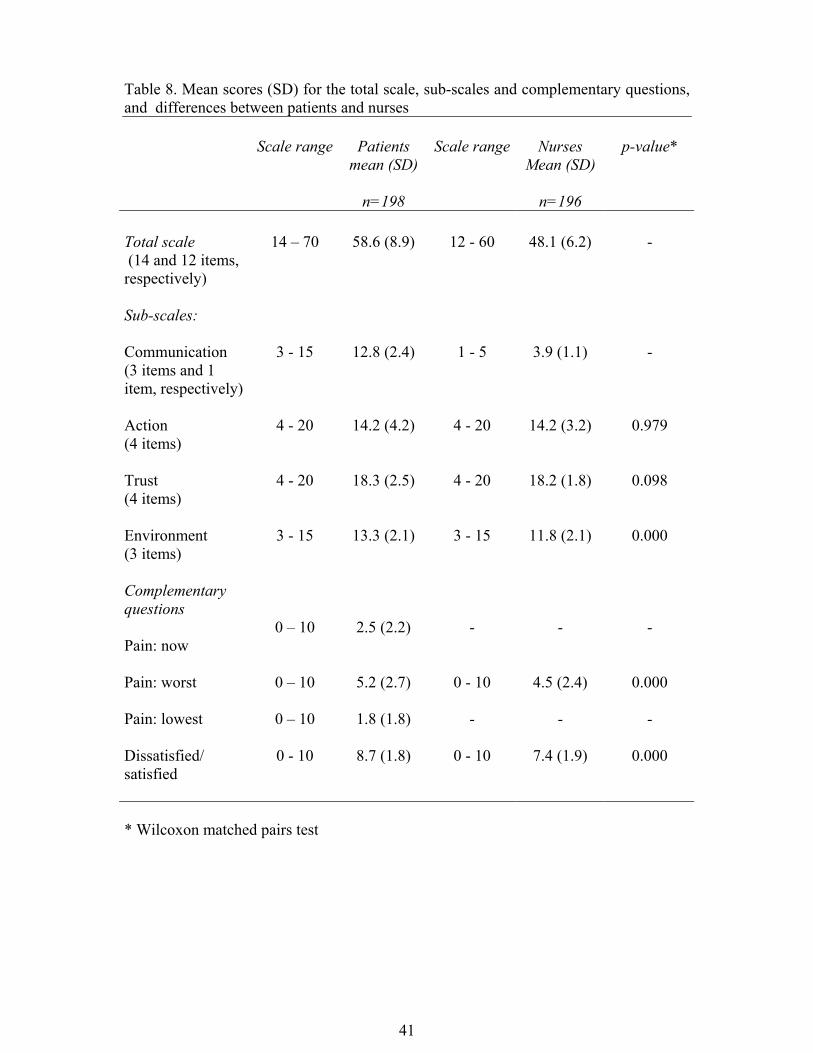
41
Table 8. Mean scores (SD) for the total scale, sub-scales and complementary questions,and differences between patients and nurses
Scale range Patientsmean (SD)
n=198
Scale range NursesMean (SD)
n=196
p-value*
Total scale (14 and 12 items,respectively)
14 – 70 58.6 (8.9) 12 - 60 48.1 (6.2) -
Sub-scales:
Communication(3 items and 1item, respectively)
3 - 15 12.8 (2.4) 1 - 5 3.9 (1.1) -
Action(4 items)
4 - 20 14.2 (4.2) 4 - 20 14.2 (3.2) 0.979
Trust(4 items)
4 - 20 18.3 (2.5) 4 - 20 18.2 (1.8) 0.098
Environment(3 items)
3 - 15 13.3 (2.1) 3 - 15 11.8 (2.1) 0.000
Complementaryquestions
Pain: now0 – 10 2.5 (2.2) - - -
Pain: worst 0 – 10 5.2 (2.7) 0 - 10 4.5 (2.4) 0.000
Pain: lowest 0 – 10 1.8 (1.8) - - -
Dissatisfied/satisfied
0 - 10 8.7 (1.8) 0 - 10 7.4 (1.9) 0.000
* Wilcoxon matched pairs test
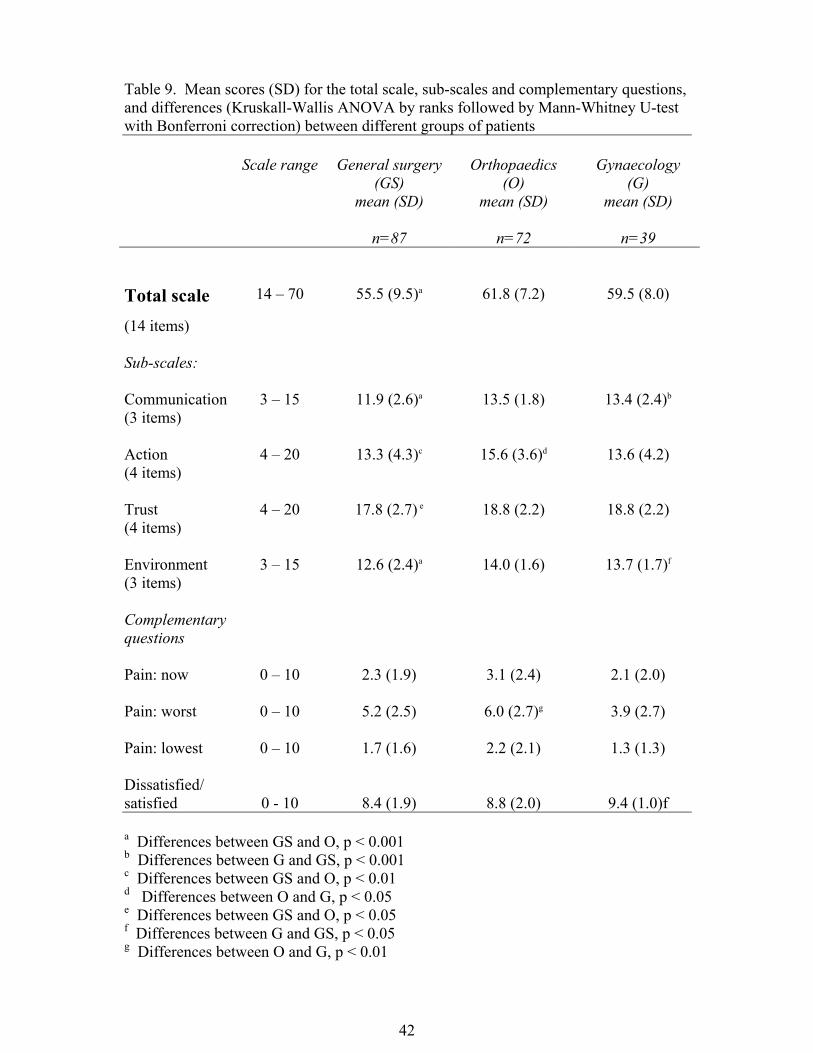
42
Table 9. Mean scores (SD) for the total scale, sub-scales and complementary questions,and differences (Kruskall-Wallis ANOVA by ranks followed by Mann-Whitney U-testwith Bonferroni correction) between different groups of patients
Scale range General surgery(GS)
mean (SD)
n=87
Orthopaedics(O)
mean (SD)
n=72
Gynaecology(G)
mean (SD)
n=39
Total scale(14 items)
14 – 70 55.5 (9.5)a 61.8 (7.2) 59.5 (8.0)
Sub-scales:
Communication(3 items)
3 – 15 11.9 (2.6)a 13.5 (1.8) 13.4 (2.4)b
Action(4 items)
4 – 20 13.3 (4.3)c 15.6 (3.6)d 13.6 (4.2)
Trust(4 items)
4 – 20 17.8 (2.7) e 18.8 (2.2) 18.8 (2.2)
Environment(3 items)
3 – 15 12.6 (2.4)a 14.0 (1.6) 13.7 (1.7)f
Complementaryquestions
Pain: now 0 – 10 2.3 (1.9) 3.1 (2.4) 2.1 (2.0)
Pain: worst 0 – 10 5.2 (2.5) 6.0 (2.7)g 3.9 (2.7)
Pain: lowest 0 – 10 1.7 (1.6) 2.2 (2.1) 1.3 (1.3)
Dissatisfied/satisfied 0 - 10 8.4 (1.9) 8.8 (2.0) 9.4 (1.0)f
a Differences between GS and O, p < 0.001b Differences between G and GS, p < 0.001c Differences between GS and O, p < 0.01d Differences between O and G, p < 0.05e Differences between GS and O, p < 0.05f Differences between G and GS, p < 0.05g Differences between O and G, p < 0.01
43
p<0.001, respectively). The environment sub-scale was also related to“sex” (p<0.05) and “age” (p<0.01), viz. females and increased age hadhigher scores, respectively. The action sub-scale was related to “epiduralanalgesia” (p<0.01) and “sex” (p<0.05), viz. those receiving epiduralanalgesia and males had higher scores, respectively.
The group of patients in orthopaedics scored higher on the total scale andalso on the 4 sub-scales compared to the group of patients in generalsurgery, but there were no differences in worst-, now-, and lowest painlevels or how dissatisfied/ satisfied the patients were (Table 9). The groupof patients in gynaecology scored higher on 2 sub-scales compared to thepatients in general surgery and they were more satisfied with the overallpain relief. The patients in gynaecology were younger than the patients inorthopaedics (p<0.001) and naturally there were more females compared tothe patients in both general surgery and orthopaedics (p<0.001). Therewere no differences between the number of patients both with more painthan they expected and receiving epidural analgesia in the different wards.The complementary question “Worst pain you have had the last 24hours”correlated negatively with the 2 sub-scales, trust (r=-0.18, p<0.009) andenvironment (r=-0.15, p<0.036), and the overall satisfaction question (r=-0.43, p<0.000). The overall satisfaction question correlated with the totalscale (r=0.53, p<0.001) and also on the 4 sub-scales.
Nurse assessmentThe mean score for the instrument (scale range 12-60, higher valuesindicating a higher quality of care) was 48.1 (SD 6.2). The mean scores forthe individual items were between 3.3 and 4.8 (scale range 1-5) and thenumber of nurses who scored an item 1 or 2 (disagreement) varied between0.0% and 34.8% (Table 7). The mean scores for the sub scales andcomplementary questions are reported in Table 8.
The total scale and the action, trust and environment sub-scales were usedas outcome variables in the multiple linear regression model. Theexplanatory variables were “number of years working in surgical nursingcare” and “special education and training in pain management”. The totalscale (p<0.01), the sub-scales action (p<0.01) and trust (p<0.01) wereassociated with “numbers of years working in surgical nursing care”, viz.the nurses with many years reported higher scores.

44
Patient versus nursesThere were differences between the patient and nurse assessments on theenvironment sub-scale with higher scores for the patients. The patients alsoscored higher on the complementary question concerning dissatisfied/satisfied than did the nurses. According to the question about worst painintensity level the patients reported higher scores than the nurses thoughtthey had experienced (Table 8).
ConclusionThe instrument to measure strategic and clinical quality indicators appearedto be useful in identifying important areas for improvement and differencesamong groups of patients and departments. Differences were foundbetween patient and nurse assessments.
DISCUSSION
Methodological considerationsTo find the important aspects of surgical nursing care, an exploratorymethod with focus group interviews was chosen. This interview techniquewas originally developed in sociology and was found valuable as many ofthe decisions people make often grow out of discussions with others(Patton 1990). The advantage of this method is the possibility ofstimulating a spontaneous exchange of ideas, thoughts, and attitudes thatmay be more easily expressed in a crowd (Fitzpatrick & Boulton 1994,Krueger 1994, Sim 1998). A collective view was sought rather thanindividual views, but the purpose was not to reach consensus. Thomas et al.(1995) compared focus groups with individual interviews. They found thatcertain concepts were more likely to occur in focus group interviewscompared with individual ones, but they found no difference in the depth ofthe data generated. Fern (1982) indicated that focus groups did not producesignificantly more or better ideas than individual interviews. However, itmay be an effective use of time to use focus group interviews if one isinterested in group rather than individual opinions. According to Krueger(1994), focus groups are valid if they are used carefully for a problemsuitable for focus group inquiry and if they follow the establishedprocedures, which was the case in this thesis. He has also stated that thegreatest amount of information usually comes in the first two groups, andby the third and fourth session a fair amount has already been covered.More groups are advisable when, for example, the group of participants isheterogeneous, but the respondents in the present thesis were homogeneousin that they were all female, belonged to the same professional group in a
45
similar area and were at the same hierarchical level. A disadvantage of thefocus group interviews could be that one person dominates the group orthat one person will not speak at all. In the present thesis this was not aproblem.
The strategic and clinical quality indicators in postoperative painmanagement were generated from the tentative model of important aspectsof surgical nursing care. The stages, domain identification andjudgement/quantification have been described as fundamental andconstitute the difference between content validity and face validity (Lynn1986). Developing and determining quality indicators from theories,models and frameworks are seldom discussed in the literature (Idvall et al.1997), but, for example, Orem’s concept of self-care has been used todetermine whether outcome criteria were congruent with the concept(Gallant & McLane 1979). Wilde et al. (1993, 1994) developed thequestionnaire, Quality of Care from the Patient’s Perspective, from agrounded theory model of quality of care. This model was generated fromin-depth interviews, and indicators were identified and grouped intocategories and dimensions.
When formulating indicators that should be useful in clinical practice, it isimportant that they are supported by the literature and to decide if they areessential for achieving high quality, are realistic to carry out and if thenurses believed they were empowered to influence how they were carriedout. These aspects have been described by Kitson et al. (1994), whoemphasised professional experience and research-based knowledge assources of information and the fact that the items formulated should beboth relevant and achievable.
This thesis used the content validation model proposed by Fehring (1987),which was originally developed to validate nursing diagnosis. This modelhas also been used to validate nursing interventions in the IowaIntervention Project: NIC (Nursing Interventions Classification) (Closkey& Bulechek 1992) and a revised model (Sparks & Lien-Gieshen 1994) forvalidating the nursing-sensitive patient outcomes in the Iowa OutcomesClassification: NOC (Nursing Outcomes Classification) (Johnson & Maas1997). Content validation models are often based on obtaining experts’opinions, and the experts selected will depend on the concept beingvalidated (Lynn 1986, Fehring 1987, Slocumb & Cole 1991, Sparks &Lien-Gieshen 1994). Two groups of nurses, study groups two and three,were used to judge the indicators in the present study. Study group two was
46
composed of nurses with special knowledge, interest and clinicalexperience while study group three was composed of a representativesample of general clinical nurses working in surgical wards. Both groupswere deemed important for the purpose – study group three, as a randomsample, especially for judging if the indicators were realistic to carry outand if nurses felt empowered to influence management. There is noconsensus on the number of experts needed for a content validationprocess, but some authors suggested 10 to 20 participants (Lynn 1986,Slocumb & Cole 1991). However, the NIC and NOC-projects used about200 experts. In this thesis, realistic to carry out and nurse influence, areclinical items which have not been previously validated, and it wasconsidered important to validate them with a large sample (n=210, 321).
After content validity was established for the indicators, psychometric testswere performed with data gathered from a sample of respondents for whomthe new instrument was designed . The sample size (n=198) was consideredsufficient for examining psychometric properties on a 15-item scale.Different ratio rules are recommended in multivariate analyses (Knapp &Campbell-Heider 1989), but Knapp & Cambell-Heider (1989, p. 640)concluded that “for the most multivariate analyses the number ofobservations should be at least 10 times the number of variables andexceed the number of variables by at least 30”. Another recommended ruleis five times as many subjects as items or at least 200 to 300 (Gorsuch1983, Ferketich 1991).
It was decided to delete one of the 15 items because of average inter-itemcorrelation coefficient <0.20, item-total correlation coefficient <0.30 andincreasing coefficient alpha (0.01) when deleted. Inter-item correlationcoefficients in the range 0.30 to 0.70 are desired (Ferketich 1991, Knapp &Brown 1995), but Ferketich also suggested that a sufficient coefficientalpha can be reached with an average inter-item correlation coefficient of0.20 if there are more than 10 items. Item-total correlation coefficient isrecommended to be >0.30 (Ferketich 1991, Knapp & Brown 1995), but a“rule of thumb” suggests >0.20 (Streiner & Norman 1995). In this thesis,inter-item correlation coefficients in the 0.20 to 0.70 range were used, andall remaining items had an average inter-item correlation coefficient >0.20and an item-total correlation coefficient >0.30. There were no inter-item oritem-total correlation coefficient >0.70, which could indicate redundant andprobably unnecessary items. According to Streiner and Norman (1995, p.62), the best coefficient to use is the Pearson Product-Moment Correlation,
47
even for an ordinal scale when data are not normally distributed, if thereare more than 2 response alternatives in the scale.
The Cronbach’s coefficient alpha was satisfactory for the 15 items, butincreased slightly (0.01) when item number 11 was deleted. In an earlystage of scale development, a coefficient alpha of 0.70 is discussed assatisfactory reliability (Nunnally & Bernstein 1994, Knapp & Brown 1995,Streiner & Norman 1995). The coefficient alpha decreased in the sub-scalesprobably because there are few items (3 or 4) in each sub-scale.
The remaining 14 items loaded in 4 factors. Two criteria were used todecide how many factors to extract: scree test and eigenvalues >1.0, whichhave been suggested by Gorsuch (1983). The magnitude of the factorloadings exceeded 0.40, which can be used as a “cut-off” (Knapp & Brown1995). There were some cross-loadings between the factors, but all itemswere retained because they seemed important and suitable in one of thefactors (Gorsuch 1983). An item that has been carefully constructed tomeasure a single construct, but statistically appears to be measuring 2 ormore constructs, should not be automatically discarded according to Knappand Brown (1995). There were inter-correlation coefficients among the 4factors but they were all <0.70 and hence low enough to indicate that thefactors were not redundant (Ferketich 1991).
Tentative model of important aspects in surgical nursing careThe tentative model of important aspects in surgical nursing care describeselements of performance and prerequisites for achieving the goal of highquality, and predicts that the goal will be reached if the prescriptionssuggested are fulfilled. A model is a symbolic representation of an empiricexperience, an attempt to objectify the concept it represents and replicates areality with various degrees of precision, according to Chinn and Kramer(1991). Conceptual models give direction to search for relevant questionsabout phenomena, and they point out solutions to practical problems(Fawcett 1984). Walker and Avant (1995) state that a model can bedeveloped pretheoretically.
The tentative model of important aspects in surgical nursing care fordesigning strategic and clinical quality indicators emerged from thefindings of the focus group interviews. The main findings were 15 differentcategories, and these were divided into 2 dimensions called prerequisitesand elements of performance. As early as 1955, Shep assessed hospitalquality by examining prerequisites, or desiderata, for adequate care,
48
indexes of elements of performance, indexes of the effects of care andqualitative clinical evaluations. This influenced Donabedian’s (1980)thinking and the development of the trilogy of structure, process andoutcome. In this thesis, both prerequisites and elements of performancewere found to be important aspects of nursing care, which is in agreementwith the approaches to quality assessment illustrated by Shep andDonabedian. The outcomes, or the effects, of care such as patientsatisfaction, safety and well-being were considered as a starting point forthe interviews, which is why the interviews were focused on how to reachthese goals rather than the goals themselves. In a study aimed to understandnursing home quality of care, by using focus group interviews, the analyseswere carried out within the context of structure, process and outcome(Schirm 1999). Some of the categories identified, i.g. team-work, staff,communication and relationships were similar to those in the present thesis.
The tentative model of important aspects of care has been used in a studywith a phenomenological approach (Söderhamn & Idvall unpublished data)to analyse text from nurses’ narratives concerning a complex postoperativepain situation where their actions essentially influenced the outcome.Different categories from the model could be identified in the nurses’narratives, such as detecting and acting on signs and symptoms, performingprescription, competence/knowledge and attitudes.
Carper (1978) has proposed that the fundamental patterns of knowing maybe conceived as necessary to achieve mastery in the nursing discipline. IfCarper’s model is applied to this thesis, only 3 patterns of knowing couldbe identified. The esthetics pattern of knowing was not distinguished in theanalysis. Nurses working in ordinary surgical care would probably find itdifficult to express the esthetics pattern of knowing, e.g. intuition, empathyand the knowing of a unique particular as important aspects for the qualityand effects of care, even if they consider it to have an important impact onpatient care. The nurses are occupied the entire day with practical activities,which might explain the fact that the empirical pattern is more prominentand easier to illustrate. Hence, it could be argued that an aspect thatrepresenting the esthetics pattern of knowing will not be identified in thetentative model.
Strategic and clinical quality indicators in postoperative painmanagementA new instrument to measure strategic and clinical quality indicators inpostoperative pain management was developed and used in this thesis. The
49
result from the clinical study could offer useful baseline data to evaluatethe quality of care in surgical wards. The indicators were, not surprisingly,deemed to be essential but also both realistic to carry out and possible fornurses to influence management. However, these scores were generallylower than the scores for essential. Nevertheless, the nurses’ opinion oftheir high impact on postoperative pain management is convincing. Whichscore or threshold constitutes high quality of care? A threshold is discussedas a level or point at which the results of data collection in monitoring andevaluation trigger intensive evaluation of a particular important aspect ofcare to determine whether an actual problem or opportunity forimprovement exists (Katz & Green 1992). As the indicators studied havebeen derived from important aspects of care, the threshold will be high,leaving only a small percentage of non-conformances due to uncontrollablefactors. A baseline threshold is defined as a starting point for the process ofcontinual improvement, which should be compared to the ideal thresholdthat has been established by, e.g. a panel of experts (Katz & Green 1992).An expert panel (n=15) was convened in a study aimed at setting thresholdsfor quality indicators from data for nursing home quality (Rantz et al.2000). The thresholds should be realistic, reflect what providers thoughtnursing homes would be able to achieve and would alert staff to potentialproblems. Panel members individually determined lower and upperthreshold scores and completed a follow-up Delphi of the final results.
In this thesis, a mean score for each item, which exceeds 4.5 (scale range 1-5) could, e.g. be discussed as a desired level for high quality of care. If thismean score is not obtained it would be important to scrutinise the quality ofcare and suggest quality improvement efforts. The number of patients whoscored an item 1 or 2 (disagreement) could be discussed as an area forimprovement. Looking at the items with a mean score exceeding 4.5, thenumber of patients scoring 1 or 2 were between 0.5% and 3% (Table 7).This could be regarded as a reasonably small percentage of non-conformances. On ward level, it is most valuable to evaluate and discussthe individual items in quality development. The total scale and sub-scalesscores should be valuable to follow on hospital level or national level.
Thus, the desired mean score for the total scale should exceed 63.0 (14items x 4.5), for the communication and environment sub-scales 13.5 (3items x 4.5) and for the action and trust sub-scales 18.0 (4 items x 4.5).These desired mean scores could be compared to the baseline data. Thedesired mean scores for the total scale and the 3 sub-scales –communication, action and environment- were not reached by the patients
50
which indicates that an intensive evaluation should be performed of thedifferent sub-scales and/or their items to determine whether an actualproblem or opportunity for improvement exists. Looking at the number ofpatients scoring 1 or 2 on the sub-scales, there obviously exist possibilitiesfor improvement, especially on the action sub-scale. Setting threshold asabsolutes is, of course, not recommended although there is variability ineverything (Katz & Green 1992). Threshold parameters, which in thisthesis should define the lower limit of acceptance for the result could bediscussed and set statistically in retrospective analysis when further studieshave been performed. When evaluating the different departments accordingto the desired mean scores, the orthopaedics and gynaecology departmentsreached that level for high quality of care on the trust and environment sub-scales. This also points out that an absolute score for high quality of careshould not be set even though, e.g. there was no significant differencebetween general surgery and gynaecology in the scores for the trust sub-scale, but the desired mean score was reached only in gynaecology.
The total scale and the communication, trust and environment sub-scaleswere associated with the patients who reported more pain than expected. Itseems reasonable that the patients who reported more pain than expectedhad lower scores. The action sub-scale was related to the patients receivingepidural analgesia who scored higher on this sub-scale. This could beexplained by the special and distinct routines explicit for these patients,such as using a pain assessment instrument. The differences betweengroups of patients must be considered when further evaluating the qualityof care and quality improvement efforts, e.g. pain assessments in rest andmoving and discussing the patient’s individual pain treatment.
The overall satisfaction question correlated with the total scale and the sub-scales, which implies that the new instrument indicated the patients’general satisfaction with the pain relief. However, the instrument alsomapped out important areas for improvement. There was no differencebetween how the patients in general surgery and orthopaedics scored theoverall satisfaction question, but there were differences between the scoreson the total scale and the 4 sub-scales. From this point of view, the overallsatisfaction question is inadequate to indicate necessary qualityimprovements and differences between departments and groups of patients.The validity of patient satisfaction as an optimal outcome variable inquality assurance was also questioned in a study by Svensson et al. (2001).Bruster et al. (1994) suggested that the results from a national survey in the
51
UK strengthened the view that specific questions were better thansatisfaction questions.
An inverse correlation was found between the worst pain intensity leveland the trust and environment sub-scales, and the overall satisfactionquestion. Another study (Jamison et al. 1997) also reported that patientswith low pain ratings were most satisfied, and that patients whoexperienced less pain than expected were more satisfied than patients whoexperienced more pain. However, many patients who experience severepain also report satisfaction with overall pain management (Donovan 1983,Miaskowski et al. 1994, Pellino & Ward 1998). The pattern of pain relief,not pain severity per se, has been discussed as a critical determinant ofsatisfaction. The patients are satisfied even though they are in pain becausethey experience a commonly expected peak (Ward & Gordon 1994). Astudy by Pellino and Ward (1998) found that the perception of havingcontrol over pain was highly related to satisfaction even in the presence ofsevere pain.
The nurses’ scores did not reach the desired threshold suggested earlier forhigh quality of care on 2 sub-scales, which may indicate their awareness ofnon-compliance to a general standard for high quality of care inpostoperative pain management. The reasons for this may vary, but theindividual items concerning enough nurses on duty and whether nurses areknowledgeable exceeded 4.0, and obviously do not appear to represent themajor problems for the nurses involved. The total scale and the action andtrust sub-scales were associated with the number of years working insurgical wards. This could be attributable to clinical experience givingmore knowledge and confidence on how to act, and these nurses scoredhigher. The scores for the environment sub-scale differed between nursesand patients, with higher scores for the patients. The nurses scored onlyfew percent 1 or 2 (disagreement) on the trust sub-scale, as did the patients.No difference was found between nurses’ and patients’ scores on the actionsub-scale, but the number of nurses scoring 1 or 2 (disagreement) was thehighest, as it was for the patients. Opportunities for improvement in thequality of care from the nurses’ perspective could be identified, which wasin line with the patients’ assessments. It must be an advantage, andfacilitate quality improvement efforts, if both patients and nurses havesimilar opinions about the quality of care delivered. Perhaps a nursequestionnaire also could be useful to evaluate the quality of care.
52
The patients in the present thesis reported a higher pain intensity level on“worst pain” than the nurse’s thought they had experienced. Several studieshave reported a discrepancy between nurse and patient assessments of thepatients’ pain intensity level both at rest and on coughing, and thediscrepancy increased with the level of pain (Sjöström et al. 1997, Hall-Lord et al. 1998, Rundshagen et al. 1999, Klopfenstein et al. 2000). Thenurses in this thesis, however, scored the complementary questiondissatisfied/satisfied lower than did the patients, which may indicate thatthe nurses were aware that pain management could be better from theirprofessional perspective. A study concerning satisfaction with the generalquality of care also found that the staff perceived that the patients were lesssatisfied than they actually were (Lövgren et al. 1998). The authorssuggested that the staff probably based their assessments on professionalexperience, while the patients expressed personal non-professionalopinions. The result from another study on the quality of care showed thatelderly home care users evaluated most care components more favourablethan did their caregivers (Larsson & Wilde-Larsson 1998).
One can reflect on the best occasion for delivering a patient questionnaireto evaluate postoperative pain management. The present thesis used thesecond postoperative day. The American Pain Society-questionnaire(1995), which includes some similar questions as in the presentquestionnaire, has been used on different days, e.g. on discharge and on thesecond postoperative day (Boström et al. 1997, Calvin et al. 1999, Lin2000). This may influence the responses and make it difficult to compareresults. It has been reported that a patient’s pain intensity level is mostsevere about 37 hours after surgery (Svensson et al. 2000). If a response isgiven near this occasion a more critical view on pain management might beexpected than on discharge when there is probably less pain. It is alsoimportant to obtain honest, unbiased responses from the patients, which canbe a problem if the patients are concerned that their answers mightinfluence their ongoing care. Miaskowski et al. (1994) recommended usingunbiased surveyors, and that caution must be taken to insure that patientsunderstand that their responses will not influence the care they receive.This was considered in the present thesis.
CLINICAL CONSIDERATIONS
The outcomes of this thesis should be valuable to consider in the clinicalsettings where postoperative pain management is discussed as an importantarea for quality assessment and quality development. The strategic and
53
clinical quality indicators being validated could provide a foundation whenimplementing a strategy to achieve high quality in postoperative painmanagement and when planning to evaluate the quality of care. A Modelfor Symptom Management (Larson et al. 1994) suggests 3 majordimensions for a broader perspective on symptoms: symptom experience,symptom management and symptom outcomes. The conceptual modeloffers ideas for a comprehensive approach to, e.g. pain. Certain indicatorsin this thesis could potentially fit into the context of the 3 dimensionssuggested, e.g. “the patient’s perception of pain must be assessed regularlywith the help of a pain assessment instrument” in the dimension ofsymptom experience, “an individual goal for pain treatment must be set upin collaboration with the patient” in the dimension of symptommanagement strategies and “the nurses must act until a level has beenreached that is acceptable to the patient” in the dimension of symptomoutcomes.
The strategic and clinical quality indicators were assessed by clinicalnurses as essential, realistic and possible for them to influencemanagement, which could be an advantage for enabling implementation inclinical practice. Implementation of research into practice is a complex anddifficult task, and is currently on the agenda (Kitson et al. 1998,McCormack et al. 1999, Retsas 2000). Kitson et al. (1998) have proposed amultidimensional framework for implementing research into practice thatemerged from the equation: SI=f(E,C,F) where SI=successful implem-entation, E=evidence, C=context, F=facilitation, and f=function of. Theinterplay of these 3 core elements - the level and the nature of evidence, thecontext or environment into which the research is to be placed and themethod or way in which the process is facilitated - are important.Conditions for evidence (E) are research, clinical experience and patientpreferences, for context (C) culture, leadership and measurement and forfacilitation (F) characteristics, role and style. All of these elements are mostimportant in the implementation process. In the present thesis, fulfilling theconditions for evidence, research, clinical experience and patientpreferences could be discussed, but good conditions for context andfacilitation must be enabled in the clinical setting to succeed and reach thegoal of high quality for patients. Leadership and facilitation were alsoemphasised as important factors for moving evidence into practice, asreported in a study by Wallin et al. (2000) that evaluated clinical guidelinesfor neonatal nursing care in Sweden.
54
CONCLUSIONS
♦ Important aspects of surgical nursing care were identified andsummarised in a tentative model with 15 categories in 2 dimensions,elements of performance and prerequisites. The categories weredetecting and acting on signs and symptoms, performing prescriptions,performing pre- and postoperative care, performing general care,informing and educating, promoting relationships, acting on behalf ofpatients, protecting the privacy of patients, staffing, environment/equipment, competence/knowledge, routines, responsibility, attitudesand team-work.
♦ From the tentative model, 15 strategic and clinical quality indicators inpostoperative pain management were developed. It was established thatthe indicators were essential for the quality of care, realistic to carry outand possible for nurses to influence management.
♦ An instrument was developed to measure the strategic and clinicalquality indicators in postoperative pain management and consisted of 14items in 4 sub-scales, communication, action, trust and environment.Internal consistency reliability, factor analysis, different groupsapproach and convergent validity suggested beginning support for theinstrument.
♦ The instrument identified areas for improvement such as painassessments in rest and moving, discussing the patient’s individual paintreatment and differences between departments and groups of patients,e.g. patients who received epidural analgesia compared to those who didnot.
♦ There were differences between patient and nurse assessmentsconcerning the environment sub-scale and the overall satisfactionquestion, with higher mean scores for the patients. The patients alsoreported higher worst pain intensity level than the nurses thought theyhad experienced.
♦ The instrument appeared to be useful in clinical settings to measure thequality of nursing care in postoperative pain management, but must befurther refined, tested and evaluated to determine if the instrument iscomprised of the best essential items.
55
ACKNOWLEDGEMENTS
This study was carried out at the Department of Medicine and Care,Division of Nursing Science, Faculty of Health Sciences, Linköpingsuniversitet, Sweden, which is gratefully acknowledged.
I also express my sincere gratitude to:
Elisabeth Hamrin, professor emeritus, my scientific tutor through all theyears, for recruiting me into the world of nursing science and for hercontinuous encouragement and constructive advice,
Mitra Unosson, PhD, my main scientific tutor, for guidance, stimulatingdiscussions and constructive advice,
Liselotte Rooke, associate professor, co-author, for valuable inspiration,
Björn Sjöström, associate professor, co-author, for support and “painful”discussions,
Anna-Christina Ek, professor, for support and providing optimal facilitiesnecessary for scientific work at the department,
Gunwor Weinmann, hospital librarian in Västervik, for excellent service,
Patrik, my son, for his love and sometimes cruel criticism, and
Jan, my husband, best friend and informal tutor, for all stimulatingdiscussions, encouragement and his love and care.
I also acknowledge
my employer at Västervik's hospital, who has let me perform this studyandthe Health Research Council in the Southeast of Sweden, the SwedishFoundation for Health Care Sciences and Allergy Research, AbbottScandinavia Inc, Searle Scandinavia and Lion's Research Fund for financialsupport.
56
REFERENCES
AHCPR, Acute Pain Management Guideline Panel. 1992. Acute painmanagement: operative or medical procedures and trauma. Clinical practiceguideline. AHCPR Pub. No. 92-0032. Rockville, MD: Agency for HealthCare Policy and Research, Public Health Services, U.S. Department ofHealth and Human Services.
American Pain Society Quality of Care Committee (APS). 1995. Qualityimprovement guidelines for the treatment of acute pain and cancer pain.JAMA, 274(23), 1874-1880.
American Nurses Association (ANA). 1996. Nursing quality indicators.Definitions and implications. American Nurses Publishing, Washington.
American Nurses Association (ANA). 2001. National database of nursingquality indicators. Online, www.mriresearch.org/health/ndnqi.html.
Andersson, I. 1995. Utveckling av mätmetoder för mätning av vårdkvalitet- med inriktning mot omvårdnad. (Dissertation with English summary).Linköping, Institutionen för omvårdnadsforskning, Hälsouniversitetet,Medical Dissertations, No 464.
Beauchamp, T.L. & Childress, J.F. 1994. Principles of biomedical ethics.Fourth edition. Oxford University Press, New York.
Bonica, J. 1990. History of pain concepts and therapies. In Bonica, J., ed.The management of pain. 2nd ed. Lea & Febiger, USA, 2-17.
Boström, B.M., Ramberg, T., Davis, B.D. & Fridlund, B. 1997. Survey ofpostoperative patients’ pain management. Journal of Nursing Management,5, 341-349.
Breivik, H. 1998. Postoperative pain management: why is it difficult toshow that it improves outcome? European Journal of Anaesthesiology,15(6), 748-751.
Bruster, S., Jarman,B., Bosanquet, N., Weston, D., Erens, R. & Delbanco,T. 1994. National survey of hospital patients. British Medical Journal, 309,1542-1546.
57
Calvin, A., Becker, H., Biering. P., & Grobe, S. 1999. Measuring patientopinion of pain management. Journal of Pain and Symptom Management,18(1), 17-26.
Carper, B. 1978. Fundamental patterns of knowing in nursing. Advances inNursing Science, 1(1), 13-23.
Chinn, P. & Kramer, M. 1991. Theory and nursing a systematic approach.3rd ed. Mosby Year Book, S:t Louis.
Closs, J. 1992. Patients’ night-time pain, analgesic provision and sleep aftersurgery. International Journal of Nursing Studies, 29(4), 381-392.
Cronbach, L. J. 1951. Coefficient alpha and the internal structure of tests.Psychometrika, 16(3), 297-334.
Daut, R. L., Cleeland, C. S., & Flanery, R. C. 1983. Development of theWisconsin Brief Pain Questionnaire to assess pain in cancer and otherdiseases. Pain, 17, 197-210.
Davies, H. T., & Crombie, I. K. 1995. Assessing the quality of care:measuring well supported processes may be more enlightening thanmonitoring outcomes. British Medical Journal, 311, 766.
Deming, W.E. 1986. Out of the crisis. Cambridge, Cambridge UniversityPress, Cambridge, MA.
Donabedian, A. 1980. Explorations in quality assessment and monitoringvolume I. The definition of quality and approaches to its assessments.Health Administration Press, Ann Arbor, Michigan.
Donabedian, A.1982. Explorations in quality assessment and monitoringvolume II. The criteria and standards of quality. Health AdministrationPress, Ann Arbor, Michigan.
Donabedian, A. 1985. Explorations in quality assessment and monitoringvolume III. The methods and findings of quality assessment andmonitoring: an illustrated analysis. Health Administration Press, AnnArbor, Michigan.

58
Donobedian, A. 1988. The quality of care: how can it be assessed? JAMA,260(12), 1743-1748.
Donbedian, A. 1992. The role of outcomes in quality assessment andassurance. Quality Review Bulletin, November, 356-360.
Donovan, B.D. 1983. Patient attitudes to postoperative pain relief.Anaesthesia Intensive Care, 11(2), 125-129.
Duquette, A-M. 1991. Approaches to monitoring practice: getting started.In: Schroeder, P., ed. Monitoring and evaluation in nursing. AspenPublication, Maryland, 7-26.
Fawcett, J. 1984. Analysis and evaluation of conceptual models of nursing.F.A. Davis Compamy, Philadelphia.
Fehring, R. 1987. Methods to validate nursing diagnosis. Heart & Lung,16(6), 625-629.
Ferketich, S. 1991. Focus on psychometrics. Aspects on item analysis.Research in Nursing & Health, 14, 165-168.
Fern, E. 1982. The use of focus groups for idea generation: the effects ofgroup size, acquaintanceship, and moderator on response quantity andquality. Journal of Marketing Research, 19, 1-13.
Fitzpatrick, R, & Boulton, M. 1994. Qualitative methods for assessinghealth care. Quality in Health Care, 3, 107-113.
Francke, A., Garssen, B. & Abu-Saad, H. 1996. Continuing pain educationin nursing: a literature review. International Journal of Nursing Studies,33(5), 567-578.
Gallant, B. & McLane, A. 1979. Outcome criteria: A process for validationat the unit level. Journal of Nursing Administration, 9(1), 14-21.
Gaston-Johansson, F., Colburn, K., Walrath, J., Johansson, C., Johansson,F. & Johansson, N. 1998. Factors influencing patient satisfaction with painmanagement. Smärta, 1, 12-18.

59
Gorsuch, R. L. 1983. Factor analysis. 2nd ed. Lawrence ErlbaumAssociates, New Jersey.
Grol, R. 1996. Research and development in quality of care: establishingthe research agenda. Quality in Health Care, 9(4), 239-242.
Hall-Lord, M.L., Larsson, G. & Steen, B. 1998. Pain and distress amongelderly intensive care unit patients: comparison of patients’ experiences andnurses’ assessments. Heart & Lung , 27(2), 123-132.
Hegyvary, S. 1991. Issues in outcomes research. Journal of Nursing CareQuality, 5(2), 1-6.
Hellung-Strohl, E., ed. 1996. DySSSy: en dynamisk metod för kvalitets-säkring i vården. Omvårdnad 2, Svensk sjuksköterskeförening: Spri,Stockholm. (In swedish).
Ibrahim, J. 2000. Translating quality into research: Do we need moreresearch into quality or should quality activities be conducted usingprinciples and methodological rigour of scientific research? Journal ofQuality in Clinical Practice, 20, 63-64.
Idvall, E., ed. 1997. Quality indicators in nursing. Swedish NursesAssociation; Spri Publications, Stockholm.
Idvall, E., Rooke, L. & Hamrin, E. 1997. Quality indicators in clinicalnursing: a review of the literature. Journal of Advanced Nursing, 25(1), 6-17.
International Association for the study of Pain (IASP) Subcommittee onTaxonomy. 1979. Pain terms: a list with definitions and notes on usage.Pain, 6, 249-252.
International Association for the study of Pain (IASP). 1992. Managementof acute pain: a practical guide. IASP publications, Seattle.
Jamison, R. N., Ross, M. J., Hoopman, P., Griffin, F., Levy, J., Daly, M., &Scaffer, J. L. 1997. Assessment of postoperative pain management: patientsatisfaction and perceived helpfulness. The Clinical Journal of Pain, 13(3),229-236.
60
Johnson, M. & Maas, M., eds. 1997. Nursing outcomes classification(NOC). Mosby – Year Book, S:t Louis.
Joint Commission on Accreditation on Health Care Organizations(JCAHO). 1989. Characteristics of clinical indicators. Quality ReviewBulletin, 15(11), 330-339.
Joint Commission (JCAHO). 1993. The measurement mandate: On theroads to performance improvement in health care. Joint Commission onAccreditation on Health Care Organizations, Illinois.
Joint Commission on Accreditation on Health Care Organizations(JCAHO). 1997. National library of healthcare indicators. JointCommission on Accreditation of healthcare Organizations, OakbrookTerrace.
Joint Commission on Accreditation on Health Care Organizations(JCAHO). 2001. Glossary of terms, call for performance measures. Online,www.jcaho.org/perfmeas/coremeas/cm_gloss.html.
Katz, J. & Green, E. 1992. Managing quality: A guide to monitoring andevaluating nursing services. Mosby Year Book, S:t Louis.
Kehlet, H. 1994. Postoperative pain relief – what is the issue? (editorial).British Journal of Anaesthesia, 72(4), 375-378.
Kehlet, H. 1997. Multimodal approach to control postoperativepathophysiology and rehabilitation. British Journal of Anaesthesia, 78, 606-617.
Kingry, M., Tiedje, L. & Friedman, L. 1990. Focus group: a researchtechnique for nursing. Nursing Research, 39(2), 124-125.
Kitson, A 1986. The methods of measuring quality. Nursing Times,82(35), 32-34.
Kitson, A. 1989. The role of professional organization in setting standardsfor nursing. Vård i Norden, 14(1), 13-23.

61
Kitson, A., Harvey, G., Hyndman, S. & Yerrell, P. 1994. Criteriaformulation and application: an evaluative framework. InternationalJournal of Nursing Studies, 31(2), 155-167.
Kitson, A., Harvey, G. & McCormack, B. 1998. Enabling theimplementation of evidence based practice: a conceptual framework.Quality in Health Care, 7, 149-158.
Klopfenstein, C.E., Herrmann, F.R., Mamie, C., Van Gessel, E. & Foster,A. 2000. Pain intensity and pain relief after surgery. ActaAnaesthesiologica Scandinavica, 44, 58-62.
Knapp, T. R., & Campbell-Heider, N. 1989. Numbers of observations andvariables in multivariate analysis. Western Journal of Nursing Research,11(5), 636-641.
Knapp, T. R. & Brown, J. K. 1995. Focus on psychometrics. Tenmeasurement commandments that often should be broken. Research inNursing & Health, 18, 465-469.
Krueger, R. 1994. Focus groups. A practical guide for applied research.2nd ed. Sage Publication, Thousand Oaks.
Lang, N. 1975. Quality assurance in nursing. American Association ofOperating Room Nurses Journal, 22(2), 180-186.
Larsson, PJ., Carrieri-Kohlman, V., Dodd, MJ., Faucette, J., Froelicher,ES., Gortner, SR., Halliburton, PI., Janson, S., Miasowski, C., Savedra, M.,Stotts NA., Taylor, D. & Underwood PR. 1994. A model for symptommanagement. IMAGE: Journal of Nursing Scholarship, 4, 272-276.
Larsson, G. & Wilde-Larsson, B. 1998. Quality of care: relationshipbetween the perceptions of elderly home care users and their caregivers.Scandinavian Journal of Social Welfare, 7, 252-258.
Lin, C-C. 2000. Applying the American Pain Society’s QA standards toevaluate the quality of pain management among surgical, oncology, andhospice inpatients in Taiwan. Pain, 87, 43-49.
Lincoln, Y. & Guba, E. 1985. Naturalistic inquiry. Sage Publication,Beverly Hills.
62
Lynn, M. 1986. Determination and quantification of content validity.Nursing Research, 35(6), 382-385.
Lövgren, G., Sandman, P.O., Engström, B., Norberg, A. & Eriksson, S.1998. The view of caring among patients and personnel. ScandinavianJournal of Caring Science, 12, 33-41.
Marek, K. 1989. Outcome measurement in nursing. Journal of NursingQuality Assurance, 4(1), 1-9.
Marks, R.M. & Sachar, J.S. 1973. Undertreatment of medical inpatientswith narcotic analgesics. Annals of Internal Medicine, 78(2), 173-181.
McCaffery, M. & Beebe, B. 1994. Pain. Clinical manual for nursingpractice. UK edition, ed by Latham, J. Times Mirror InternationalPublishers Limited. London.
McCloskey, J. & Bulechek, G. 1992. Nursing interventions classification(NIC). Mosby Year Book, S:t Louis.
McCormick, B., Manley, K., Kitson, A., Titchen A. & Harvey, G. 1999.Towards practice development – a vision in reality or a reality withoutvision? Journal of Nursing Management, 7, 255-264.
Meehan, D., McRae, M., Rourke, D., Eisenring, C. & Imperial, F. 1995.Analgesic administration, pain intensity, and patient satisfaction in cardiacsurgical patients. American Journal of Critical Care, 4,(6), 435-442.
Melzack, R. & Wall, P.D. 1965. Pain mechanisms: a new theory. Science,150, 971-979.
Melzack, R. & Katz, J. 1994. Pain measurement in persons in pain. In:Wall, P.D. & Melzack, R., eds. Textbook of pain. 3rd ed. ChurcillLivingstone, New York, 337-351.
Melzack, R. 1999. From the gate to the neuromatrix. Pain supplement 6,121-126.
Miaskowski, C., Nichols, R., Brody, R., & Synold, T. 1994. Assessment ofpatient satisfaction utilizing the American Pain Society’s quality assurance
63
standards on acute and cancer-related pain. Journal of Pain and SymptomManagement, 9 (1), 5-11.
Mize, C., Bently, G. & Hubbard, S. 1991. Standards of care: integratingnursing care plans and quality assurance activities. Clinical Issues, 2(1), 63-68.
Nadzam, D.M. 1991. The agenda for change: Update on indicatordevelopment and possible implications for the nursing profession. Journalof Nursing Quality Assurance, 5(2), 18-22.
National Swedish Board of Health and Welfare. 2001. Övergripandekvalitetsindikatorer inom hälso- och sjukvården, Socialstyrelsens förslag.Online, www.sos.se/fulltext/2001-110-1/2001-110-1.htm. (In swedish).
National Swedish Board of Health and Welfare. SOSFS 1996:24.Kvalitetsystem i hälso- och sjukvården. Socialstyrelsens författnings-samling. (In swedish).
Nationalencyklopedin. 1993. Bokförlaget Bra Böcker AB, Höganäs, nr 11.(In swedish).
Nationalencyklopedin. 1995. Bokförlaget Bra Böcker AB, Höganäs, nr 17.(In swedish).
Nightingale, F. 1863. Notes on hospital. 3rd ed. Longman, Green, Robertsand Green, London.
Nunnally, J. C., & Bernstein, I. H. 1994. Psychometric theory. 3rd ed.McGraw-Hill, New York.
Paice, J., Mahon, S. & Faut-Callahan, M. 1995. Pain control in hospitalizedpostsurgical patients. MEDSURG Nursing, 4(5), 367-372.
Patton, M. 1990. Qualitative evaluation and research methods. 2nd ed. SagePublications, Newbury Park.
Pellino, T. A., & Ward, S. E. 1998. Perceived control mediates therelationship between pain severity and patient satisfaction. Journal of Painand Symptom Management 15(2), 110-116.
64
Pike, A., McHugh, M., Canney, K., Miller, N., Reiley, P. & Seibert, C.1993. A new architecture for quality assurance. Journal of Nursing CareQuality, 7(3), 1-8.
Polit, D.F. & Hungler, B.P. 1991. Nursing research – principles andmethods. 4th ed. J.B.Lippincott Company, Philadelhia, Pennsylvania.
Powell, R. & Single, H. 1996. Focus groups. International Journal forQuality in Health Care, 8(5), 499-504.
Rantz, M., Petroski, G., Madsen, R., Mehr, D., Popejoy, L., Hicks, L.,Porter, R., Zwygart-Stauffacher, M. & Grando, V. 2000. Setting thresholdfor quality indicators derived from MDS data for nursing homes qualityimprovement reports. Journal on Quality Improvement, 26(2), 101-110.
Rawal, N. & Berggren, L. 1994. Organization of acute pain services: a low-cost model. Pain, 57, 117-123.
Retsas, A. 2000. Barriers to using research evidence in nursing practice.Journal of Advanced Nursing, 31(3), 599-606.
Redfern, S. & Norman, I. 1990. Measuring the quality of nursing care: aconsideration of different approaches. Journal of Advanced Nursing, 15,1260-1271.
Rundshagen, I., Schnabel, K., Standl, T. & Sculte am Esch, J. 1999.Patients’ vs nurses’ assessments of postoperative pain and anxiety duringpatient- and nurse-controlled analgesia. British Journal of Anaesthesia,82(3), 374-378.
Schirm, V, Albanese, T & Garland, N. 1999. Understanding nursing homequality of care: incorporating caregivers’ perceptions through structure,process, and outcome. Quality Management in Health Care, 8(1), 55-63.
Segesten, K. 1997. The dream-team: bemanning och arbetsmodeller påvårdavdelning. Socialstyrelsens rapport 1997:1. (In swedish).
Shep, M. 1955. Approaches to quality of hospital care. Public HealthReports, 70(9), 877-886.
65
Sim, J. 1998. Collecting and analysing qualitative data: issues raised by thefocus group. Journal of Advanced Nursing, 28(2), 345-352.
Sjöström, B. 1995. Assessing acute postoperative pain: assessmentstrategies and quality in relation to clinical experience and professionalrole. (Dissertation). Educational Sciences 98, Acta UniversitatisGothoburgensis, Göteborg.
Sjöström, B., Haljamae, H., Dahlgren, L.O. & Lindström, B. 1997.Assessment of postoperative pain: impact of clinical experience andprofessional role. Acta Anaesthesiolica Scandinavica, 41, 339-344.
Slocumb, E. & Cole, F. 1991. A practical approach to content validation.Applied Nursing Research, 4(4), 192-200.
Soafer, B. 1983. Pain relief - the core of nursing practice. Nursing Times,23, 38-42.
Sparks, S. & Lien-Gieschen, T. 1994. Modification of the diagnosticcontent validity model. Nursing Diagnosis, 5(1), 31-35.
Streiner, D. L. & Norman, G. R. 1995. Health measurement scales. Apractical guide to their development and use. 2nd ed.. Oxford UniversityPress, New York.
Svensson, I., Sjöström, B. & Haljamäe, H. 2000. Assessment of painexperiences after elective surgery. Journal of Pain and SymptomManagement, 20(3),193-201.
Svensson, I., Sjöström, B. & Haljamäe, H. 2001. Influence of expectationsand actual pain experiences on satisfaction with postoperative painmanagement. European Journal of Pain (accepted).
Söderhamn, O. & Idvall, E. Unpublished data. Nurses’ influence on qualityof care in postoperative pain management: a phenomenological study.
Thomas, L., MacMillan, J., McColl, E., Hale, C. & Bond, S. 1995.Comparison of focus group and individual interview methodology inexamining patient satisfaction with nursing care. Social Sciences in Health,1(4), 206-220.
66
VanDalfsen, P. & Syrjala, K. 1990. Psychological strategies in acute painmanagement. Critical Care Clinics, 6(2), 421-431.
Walker, L. & Avant, K. 1995. Strategies for theory construction in nursing.3rd ed. Appleton & Lange, Norwalk.
Wallin, L., Boström, A.M., Harvey, G., Wikblad, K. & Ewald, U. 2000.National guidelines for Swedish neonatal nursing care: evaluation ofclinical application. International Journal for Quality in Health Care, 12(6),465-474.
Ward, S.E., & Gordon, D. 1994. Application of the American Pain Societyquality assurance standards. Pain, 56, 299-306.
Ward, S.E. & Gordon, B. 1996. Patient satisfaction and pain severity asoutcomes in pain management: a longitudinal view of one setting’sexperience. Journal of Pain and Symptom Management, 11, 242-250.
Warfield, C.A. & Kahn, C.H. 1995. Acute pain management: programs inU.S. hospitals and experiences and attitudes among U.S. adults.Anesthesiology, 83, 1090-1094.
Wilde, B., Starrin, B., Larsson, G. & Larsson M. 1993. Quality of carefrom a patient perspective: a grounded theory study. Scandinavian Journalof Caring Sciences, 7, 113-120.
Wilde, B., Larsson, G., Larsson, M. & Starrin, B. 1994. Quality of care:development of a patient-centred questionnaire based on a grounded theorymodel. Scandinavian Journal of Caring Sciences, 8, 39-48.
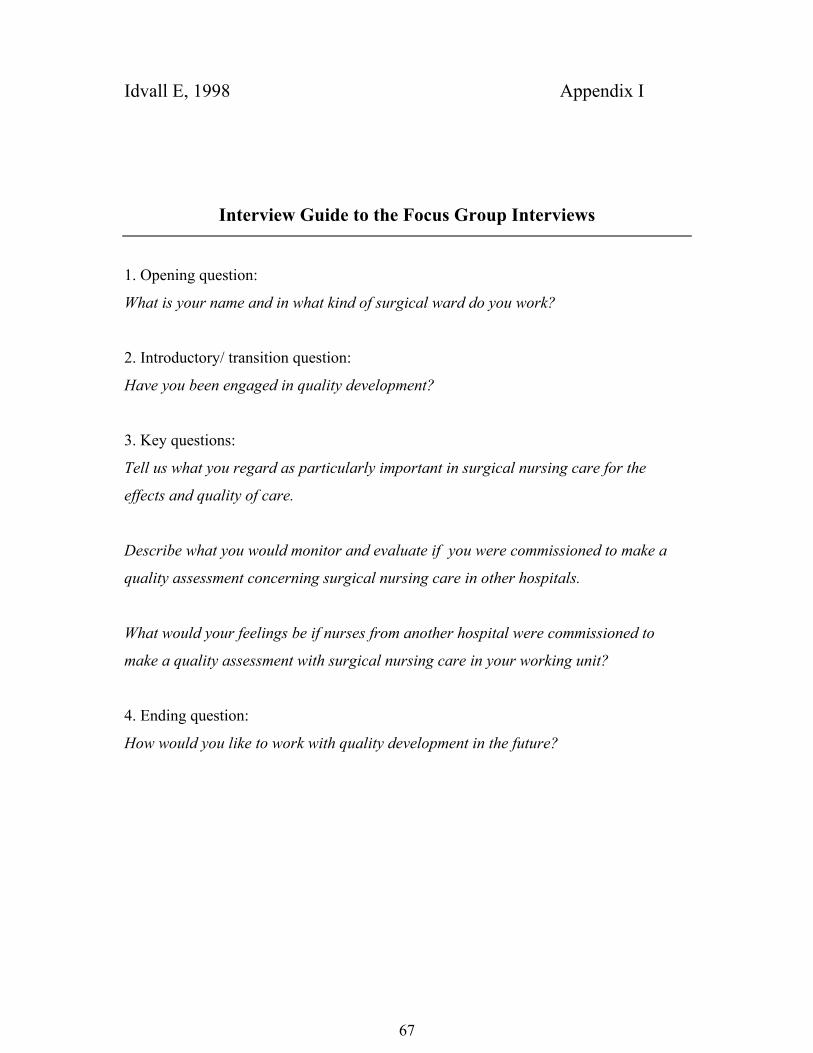
67
Idvall E, 1998 Appendix I
Interview Guide to the Focus Group Interviews
1. Opening question:
What is your name and in what kind of surgical ward do you work?
2. Introductory/ transition question:
Have you been engaged in quality development?
3. Key questions:
Tell us what you regard as particularly important in surgical nursing care for the
effects and quality of care.
Describe what you would monitor and evaluate if you were commissioned to make a
quality assessment concerning surgical nursing care in other hospitals.
What would your feelings be if nurses from another hospital were commissioned to
make a quality assessment with surgical nursing care in your working unit?
4. Ending question:
How would you like to work with quality development in the future?
Copyright © 2022 FDOKUMEN