Analysis of Business Intelligence on Strategic Decision Making
Upload
khangminh22Category
view
2download
0
University of Nebraska - Lincoln University of Nebraska - Lincoln
DigitalCommons@University of Nebraska - Lincoln DigitalCommons@University of Nebraska - Lincoln
Educational Administration: Theses, Dissertations, and Student Research Educational Administration, Department of
9-2012
FINANCIAL INDICATORS IN STRATEGIC DECISION MAKING: FINANCIAL INDICATORS IN STRATEGIC DECISION MAKING:
RECOMMENDED PRACTICES FOR FINANCIAL OFFICERS AT RECOMMENDED PRACTICES FOR FINANCIAL OFFICERS AT
SMALL PRIVATE COLLEGES AND UNIVERSITIES IN THE SMALL PRIVATE COLLEGES AND UNIVERSITIES IN THE
MIDWESTERN UNITED STATES MIDWESTERN UNITED STATES
Beth Reissenweber University of Nebraska-Lincoln, [email protected]
Follow this and additional works at: https://digitalcommons.unl.edu/cehsedaddiss
Part of the Higher Education Administration Commons
Reissenweber, Beth, "FINANCIAL INDICATORS IN STRATEGIC DECISION MAKING: RECOMMENDED PRACTICES FOR FINANCIAL OFFICERS AT SMALL PRIVATE COLLEGES AND UNIVERSITIES IN THE MIDWESTERN UNITED STATES" (2012). Educational Administration: Theses, Dissertations, and Student Research. 109. https://digitalcommons.unl.edu/cehsedaddiss/109
This Article is brought to you for free and open access by the Educational Administration, Department of at DigitalCommons@University of Nebraska - Lincoln. It has been accepted for inclusion in Educational Administration: Theses, Dissertations, and Student Research by an authorized administrator of DigitalCommons@University of Nebraska - Lincoln.
FINANCIAL INDICATORS IN STRATEGIC DECISION MAKING:
RECOMMENDED PRACTICES FOR FINANCIAL OFFICERS AT SMALL PRIVATE
COLLEGES AND UNIVERSITIES IN THE MIDWESTERN UNITED STATES
by
Beth Reissenweber
A DISSERTATION
Presented to the Faculty of
The Graduate College at the University of Nebraska
In Partial Fulfillment of Requirements
For the Degree of Doctor of Philosophy
Major: Educational Studies
(Educational Leadership and Higher Education)
Under the Supervision of Professor Brent D. Cejda
Lincoln, Nebraska
September 2012
FINANCIAL INDICATORS IN STRATEGIC DECISION MAKING:
RECOMMENDED PRACTICES FOR FINANCIAL OFFICERS AT SMALL PRIVATE
COLLEGES AND UNIVERSITIES IN THE MIDWESTERN UNITED STATES
Beth Reissenweber, Ph.D.
University of Nebraska, 2012
Adviser: Brent Cejda
This study explored whether financial leaders and institutional governing boards
use financial indicators as a tool to inform decision making, solely as a compliance
measurement tool, or not at all. The purpose of this qualitative study was two-fold to:
(a) identify the use of financial indicators in strategic decision making, and (b) investigate
how institutions use financial indicators to support governing boards in making strategic
decisions. The data were obtained from a survey of 214 financial officers to identify the
use of financial indicators, and in-depth interviews with leaders from six institutions who
indicated strategic use of financial indicators to inform governing boards.
The findings indicated that most financial officers compute financial ratios which
measure tuition dependency, enrollment trends, and institutional discount rates. The
majority of financial officers, however, do not use financial indicators to inform decision
making with their governing boards. A number of barriers confront financial officers
including: lack of time, understanding and interest of the president and governing board,
“traditional think,” and a culture that is slow to change.
Financial officers must obtain approval from the institution’s president as the
gatekeeper in order to focus on a specific financial indicator with the governing board.
The financial indicator must be presented to the board in a consistent, clear, and
transparent manner. The financial officer must be an excellent communicator in his/her
delivery of financial data. The study supported findings from the literature that financial
indicators must be linked to planning to promote strategy and create meaning in order to
inform decision making.
These findings should be of interest to institutional leaders who seek ways to
improve the use of financial indicators to inform strategic decision making. Additionally,
the study contributed to identifying best practices to share with financial officers who
persevere in advocating the use of financial indicators to create meaning and promote
institutional financial health.
ACKNOWLEDGEMENTS
My gratitude is unbounded for those who have allowed me the opportunity to
pursue this life-long dream. From Provost James Gandre who came to me rather
unexpectedly to propose that I attend the University of Nebraska (UNL) for a doctoral
program, to Dr. Sheldon Stick who set the bar high, both as my first adviser and my
professor at UNL, in pursuing this dream. My passion for the purpose and place of the
small private institution in solving the problems of higher education in the United States
has been nurtured by my boss at Aurora University, President Rebecca L. Sherrick; she is
an authentic leader in honoring the soul of higher education.
How grateful I am for Dr. Brent Cejda, who was willing to take up the torch from
Dr. Stick, when Dr. Stick retired, and to guide me through the rest of my doctoral
program. I extend deep appreciation to my committee members, Drs. Miles Bryant,
David Brooks, and Donald Uerling, who offered their expertise and wisdom in my
research study and aided me in achieving this dream.
On a personal note, I offer a deep and enduring embrace to my family: To my
husband, who gave me the courage and support to dedicate myself to this incredible and
time-consuming journey, and to my children, who cheered me on at the end. Finally, this
dissertation is dedicated to the memory of my parents, who instilled in me the desire to
pursue excellence, and who remain in my heart and mind — always.
i
TABLE OF CONTENTS
Chapter I—Introduction .............................................................................................. 1
Context and Financial Indicators ......................................................................... 3
Problem Statement ............................................................................................... 6
Purpose of the Study ............................................................................................ 7
Research Questions .............................................................................................. 10
Grand Tour Question ..................................................................................... 10
Research Sub-questions ........................................................................... 10
Assumptions ......................................................................................................... 10
Delimitations ........................................................................................................ 11
Limitations ........................................................................................................... 11
Definitions and Terms.......................................................................................... 12
Significance of the Study ..................................................................................... 15
Summary .............................................................................................................. 16
Chapter II—Review of Literature ................................................................................... 19
Overview ................................................................................................................... 19
Selection Process ....................................................................................................... 19
Context of the Problem ............................................................................................. 19
Inflation in Higher Education ............................................................................. 22
Student Expectations in Higher Education ......................................................... 26
Decline in Governmental Support ...................................................................... 27
Increasing Tuition Rates ..................................................................................... 30
The Private Institution ......................................................................................... 32
Managing Tuition Increases through Cost Control ............................................. 34
Financial Indicators as a Tool in Strategic Decision Making ............................. 36
ii
Major Works ............................................................................................................. 39
Summary ................................................................................................................... 62
Chapter III—Methodology .............................................................................................. 64
Overview ................................................................................................................... 64
Research Design ........................................................................................................ 64
Site and Sample Selection ......................................................................................... 67
Role of the Researcher .............................................................................................. 76
Data Collection .......................................................................................................... 76
Managing and Recording Data .................................................................................. 80
Ethical Considerations............................................................................................... 81
Data Analysis ............................................................................................................ 82
Credibility ................................................................................................................. 83
Verification ............................................................................................................... 84
Summary ................................................................................................................... 85
Chapter IV—Data Results ............................................................................................... 86
Overview ................................................................................................................... 86
Phase I Online Survey ............................................................................................... 86
Phase II Interviews .................................................................................................... 93
Coded Qualitative Data ....................................................................................... 93
Shaping the Use of Financial Data ...................................................................... 97
The Financial Environment ................................................................................. 97
The Financial Officer’s Background................................................................... 99
The Financial Officer’s Perspective .................................................................... 99
The Board Perspective ........................................................................................ 109
The President’s Perspective ................................................................................ 117
iii
Summary ................................................................................................................... 123
Chapter V—Conclusions and Discussion ....................................................................... 126
Overview ................................................................................................................... 126
Research Study Synopsis .......................................................................................... 126
Conclusions and Discussions .................................................................................... 128
The Use of Financial Indicators in Strategic Decision Making .......................... 140
Research Questions Answered ............................................................................ 141
Grand Tour Question: Do Small Private Colleges and Universities
in the Midwestern United States Gather Data, Including Financial
and Key Performance Indicators? ................................................................. 141
Research Sub-question #1: What Financial and Key Performance
Indicators do Institutions Gather and How do Institutional Leaders
Use this Data to inform Strategic Decision-making? ................................... 143
Research Sub-question #2: How do Small Private Universities and
Colleges Create Awareness and Understanding from Financial
and Key Performance Indicators? ................................................................. 146
Recommendations for Best Practice ......................................................................... 148
Focus on a Specific Financial Indicator to Measure Financial Health ............... 149
Ensure Governing Boards are Educated and Understand the Financial
Indicator .............................................................................................................. 149
Communicate Effectively with the Governing Board ......................................... 150
Share Financial Indicators as Part of a Story Tied to Planning .......................... 150
Recommendations for Future Research .................................................................... 152
Motivators to President to Promote Financial Indicator use ............................... 152
Time as an Ongoing Barrier ................................................................................ 153
Competency of Staff ........................................................................................... 153
Technology to Support Financial Indicator Use ................................................. 154
Limitations ................................................................................................................ 154
Conclusions ............................................................................................................... 155

iv
References ....................................................................................................................... 157
Appendices ...................................................................................................................... 167
v
LIST OF TABLES
Table 2-1 Financial Ratios in Buddy (1999) Research ........................................... 47
Table 2-2 Financial Ratios Used in Not-for-Profit Service Industry
(Buddy, 1999) ......................................................................................... 48
Table 2-3 CFI Core Financial Ratios and Weighting Factors Example ................. 51
Table 2-4 Ratios Used in Talboys’ Study (1995) ................................................... 61
Table 4-1 Online Survey- Ratio Use in Rank Order ............................................... 87
Table 4-2 Categories of Coded Qualitative Data .................................................... 94
vi
LIST OF FIGURES
Figure 2-1 Inflation of Tuition and Fees, Medical Costs, and Cost of
Living, 1978-2008 .................................................................................. 21
Figure 2-2 Cumulative Education Debt at Graduation, 1992-2011 ......................... 21
Figure 2-3 Growth Rates for Professional Staff 1976, 1993 and 2003 .................... 25
Figure 2-4 Average Public and Private 4-year College Tuition Rates,
1993-2004 ............................................................................................... 31
Figure 2-5 Consolidated Financial Index (CFI) Graphical Presentation .................. 50
Figure 3-1 Map of Study Population ........................................................................ 74
Figure 4-1 Distribution of CFI Scores Compared to Overall Average
Score ....................................................................................................... 89
Figure 4-2 Distribution of Health Index Scores Compared to Overall
Average Score ........................................................................................ 90
vii
LIST OF APPENDICES
Appendix A Visual Model for Explanatory Design .................................................... 167
Appendix B Online Survey Participation by State ..................................................... 169
Appendix C Sample Recruitment Email for Online Survey ....................................... 171
Appendix D Sample Electronic Invitation for Online Survey .................................... 173
Appendix E Follow-up Email Reminder for Online Survey ...................................... 175
Appendix F Initial Recruitment Letter ....................................................................... 177
Appendix G Informed Consent Letter ......................................................................... 179
Appendix H Unobtrusive Data Request ...................................................................... 182
Appendix I Online Survey Questionnaire ................................................................. 184
Appendix J Interview Guide ...................................................................................... 189
Appendix K Transcription Agreement Template ........................................................ 191
Appendix L Institutional Review Board Approval ..................................................... 193
1
Chapter I
Introduction
Institutional leaders face threatening headwinds in managing the financial
resources at small, private colleges and universities in the United States. Although
managing during times of economic stress is not a new phenomenon for leaders in higher
education, institutional financial health becomes increasingly difficult to maintain over
the long-term. This is especially true for institutions that rely heavily on tuition revenue
and do not have substantial endowments to mitigate sudden shifts in enrollment (Martin
& Samels, 2009).
Such institutions also find themselves in competition with community colleges
that can charge substantially lower tuition due to local tax support that provides the
majority of community college revenue (CollegeBoard, 2008). To make college tuition
more affordable for students and their families, small private institutions rely on
enrollment pricing strategies such as discounting tuition through unfunded institutional
aid (Bonham, 1997; McPherson & Schapiro, 1999).
With a heavy reliance on tuition revenue — and competition from low-cost
alternatives — these small private institutions must allocate expenditures strategically to
those activities that promote mission. The reality is that certain expenditures are driven
by escalating factors frequently outside of the control of institutional leaders. Three
examples of escalating cost factors include: (a) employee health-care costs, which have
increased at double-digit rates; (b) the cost of governmental compliance with increasing
disclosure and reporting requirements; and (c) expanded student needs and expectations,
especially as technology has become the norm of communication and learning (Kaiser
2
Family Foundation, 2011; Springer, 2010; U.S. Department of Labor, 2011; Wellman,
2008).
Competition, tuition dependency, and escalating cost factors threaten the ability of
institutional leaders to readily navigate financial challenges, but there are specific tools
available to help them achieve financial health. Financial indicators can provide useful
information to management for strategic decision making. Two examples are student
discount rate and debt burden ratio.
The student discount rate measures the amount of institutional aid, or discount,
that an institution awards to attract student enrollment. The discount rate is computed by
dividing institutional aid awarded to full-time undergraduate students by total full-time
undergraduate tuition. A rate of 42% would indicate that for every dollar of
undergraduate tuition charged, 42 cents is being reduced from the “sticker price” by the
institution. Comparing that rate internally over time, and against other institutions, would
provide management with an understanding of growth in student need, market pressure
from competition, and price elasticity.
The debt burden ratio measures the institution’s dependence on debt as well as
cost of borrowing to over-all expenditures. The ratio is computed by dividing total
interest expense and principal payments by total expenses. A ratio of 7% would indicate
that an institution uses 7 cents of every dollar towards debt related expense. The greater
the percent paid to service debt, the less budget the institution has for other initiatives and
mission-driven activities. This ratio can be readily applied to the public’s increasing
concern of the Federal government’s debt burden, which has been growing at an alarming
rate of almost $4 billion per day since September 2007 (U.S. National Debt Clock, 2011).
3
Besides the two financial indicators described above, there are many other ratios
and financial indicators that institutional leaders can use to guide strategic decision
making and inform governing boards. The focus of this study is how financial leaders
and their governing boards use financial indicators effectively for strategic decision
making.
Context and Financial Indicators
Initially in the 1970s, financial indicators for higher education were developed to
provide an early warning notice to institutional leaders charged with managing the
financial health of a college or university (Chabotar, 1989). Financial indicators evolved
over the past 30 years in both number and use. With hundreds of financial indicators to
choose from, financial leaders can be overwhelmed by the sheer number and breadth of
variety (Brubacker, 1979; Lee, 2008; Taylor & Massy, 1996). Identifying a select group
of financial indicators and monitoring the results based on historic data can be time-
consuming. Institutional leaders and their governing boards can capture the meaning and
value that historical reporting overlooks simply by expanding the use of financial
indicators to facilitate strategic decision making (Chabotar, 2006).
Barriers to understanding financial data have caused financial indicators not to be
used for strategic purposes. Wellman explained that “The nature of cost analysis invites
presentation of information at a level of detail that is confounding to all but a few
researchers and academic economists” (2008, p. 14). Wellman supported her assessment
in a survey conducted in 2006-07 by the National Association of College and University
Business Officers (NACUBO). Instead of financial officers providing data that may
4
“confound,” Wellman noted the lack of data being presented to governing boards and the
resulting lack of capacity for “strategic financial oversight” (Wellman, 2008, p. 5).
Today, financial indicators enable decision makers to make an honest assessment
of an institution’s strategic position. These are derived from audited financial data using
a standardized methodology referred to as Generally Accepted Accounting Principles
(GAAP) (Kieso, Weygandt, & Warfield, 2008). In the early use of financial indicators,
accounting methodology was less proscribed and subject to the preference of institutional
financial management that could distort the comparability of financial indicator outcomes
between institutions (Chabotar, 1989). Since the mid-1990s however, GAAP standards
were introduced that systematized not-for-profit financial reporting and the way certain
financial transactions were to be recorded. With GAAP standards in place, financial
indicators now offer a tool that is methodically based on relevant and comparable data.
MacTaggart (2007) defined financial indicators as “empirical tools such as ratio,
trend, and marginal analysis . . . for discovering financial weaknesses and strengths” (pp.
66-67). An advantage to using financial indicators is that their results focus decision-
makers on areas most likely to affect an institution’s success and long-term viability
(Buddy, 1999). In order for decision-makers to understand and draw meaning from
financial indicators, results “must be deconstructed to define the problems and to guide
development of a strategic plan to deal with problems” (MacTaggart, 2007, p. 67).
Chabotar (2006) confirms MacTaggart’s assessment and notes the need to “link”
the use of indicators to a strategic plan in order to “promote the use of data for decision-
making” (p. 45). Without the link or connection between data and planning, financial
indicators simply present trend data without further understanding and analysis to inform
5
and support decision-making. If financial indicators are to be employed to guide
institutional leaders in strategic decision-making, the financial indicators need to inform
unequivocally while presenting a story of an institution’s performance, condition, and
aspiration.
The objective of employing financial indicators is because indicators serve as a
vehicle to improve effectiveness and enhance an institution’s financial health (Chabotar,
1989). Presenting financial data in a manner that discloses an institution’s “evolving
position in the world” does not always materialize because “data that institutions collect
are not presented in ways that are strategically useful” (Morrill, 2007, p. 95). More often,
financial indicators are used to describe the institution’s financial story from a historical
basis instead of promoting decision-making through future planning and analysis
(Wellman, 2008).
A strategic approach incorporates financial indicators in the planning process to
determine whether proposed programs and activities will improve the institution’s
financial health over time (Wellman, 2008). Based on financial indicator results,
institutional leaders should be able to answer simple questions about the financial
standing of the institution (Talboys, 1995). To develop a great awareness however,
institutional leaders must understand the factors that improve financial indicator results,
as well as educate governing boards on those factors to enhance strategic decision
making.
This study explored whether financial leaders and institutional governing boards
use financial indicators as a tool to inform decision-making, solely as a compliance
measurement tool, or not at all. The researcher sought to identify three things: (a) the
6
perceptions financial officers hold in using financial indicators, (b) barriers to the
strategic use of such indicators, and (c) factors that influence decision-makers in
implementing financial indicators. The study also assessed the context in which financial
indicators are presented to create a meaningful story for effective decision-making by
institutional governing boards through compelling examples of actual use. The intent of
the study included development of a set of recommended practices in using financial
indicators to guide financial leaders at small private institutions in the United States in
managing financial health and navigating through the financial headwinds that threaten
their financial future.
Problem Statement
Managing limited financial resources to maximize mission is an ongoing
challenge for financial leaders at small private institutions that lack substantial
endowments. While institutional leaders can use tools such as financial indicators to
assess and manage the financial health of a college or university, the rate at which such
information is shared with governing boards is surprisingly low. According to Wellman,
less than 25% of financial leaders present “strategic spending data to their governing
boards” (2008, p. 1). At private institutions that are heavily reliant on tuition revenue
with small endowments, maximizing the effective use of available financial indicators
becomes even more important to achieve financial sustainability. Accordingly, linking
financial indicators to decision-making creates awareness and understanding and supports
strategy. As part of the study, the researcher sought to understand and define how
financial leaders can increase use of financial tools to educate governing boards to make
informed decisions and support strategy in long-term planning.
7
Financial indicators were developed primarily as early warning devices —
triggers to alert institutional leaders of financial distress. Today, financial indicators are
still used in large part that way. The United States Department of Education requires
institutions that receive Title IV financial grant and aid funding to achieve a certain ratio
level in computing its annual financial health score (Blumenstyk & Richards, 2010). For
institutions with low scores, the U.S. Department of Education can readily identify
struggling institutions and pursue possible intervention efforts, policy initiatives, and in
more serious situations, cease Title IV funding of the particular institution, which would
effectively terminate an institution’s operation.
Using financial indicators solely as an early warning device, however, does not
support strategy and long-term decision-making. And while the focus for financial
indicators is frequently left for compliance and historic reporting purposes, such limited
use of financial tools falls short of supporting financial leaders and governing boards
during economic stress. Instead, financial management can use ratios, trends, and
marginal analysis tools for a “workable financial turnaround strategy” to improve
financial health (Chabotar, 1989; MacTaggart, 2007, p. 67).
Purpose of Study
The purpose of this study was twofold. First, the study identified the use of
financial indicators in strategic decision making by institutional leaders entrusted with
guiding the fiscal health of small private four-year institutions with long-term
investments less than $100 million and accredited in the United States (Creswell, 2007).
Second, the study investigated how six institutions used financial indicators to support
strategic decision making with their governing boards. The maximum long-term
8
investment amount for institutions in the study was based on two factors: (a) Ranges as
applied in the annual NACUBO endowment survey conducted by the Commonfund, and
(b) the effective, maximum budget support of approximately $5.0 million that would be
generated by a $100 million endowment using an average 5% spending rate. Endowment
spending of $5 million, while helpful, would not significantly reduce the institution’s
dependence on tuition as the main source of revenue.
To accomplish the first purpose of the study, an on-line survey was sent to all
financial officers of the 214 institutions that comprise the population of institutions in the
North Central Association region of the Higher Learning Commission, which covers 19
Midwestern states. The on-line survey used the University of Nebraska’s on-line survey
tool “Qualtrics.” The survey instrument questions were based on the literature and
included open-ended questions. The draft survey was reviewed by two experts to
confirm clarity of questions and ease of format and presentation. The researcher used the
on-line survey as a means to identify participants for the second purpose of this study, to
share compelling stories from institutions that had used financial indicators in strategic
decision making.
From the list of respondents that agreed to share their stories, the researcher used
purposeful sampling to select six institutions that appeared “intrinsically interesting” in
order to obtain a full understanding of the phenomenon under study (Merriam, 1998, p.
28; Patton, 1990). Each institution represented a case within the multiple case-study
approach.
A panel of experts assisted the researcher in refining the Interview Guide
(Appendix J) of in-depth semi-structured interview questions that addressed the use of
9
financial indicators in decision-making. The panel also reviewed and critiqued the
researcher’s proposed interview questions related to the use of financial indicators in
strategic decision-making in higher education. From their review, the panel offered
additional relevant approaches in capturing the phenomenon that the researcher had not
considered (DeVellis, 2003). After the interview questions were developed, the
researcher interviewed each member of the panel to determine whether respondents
would comprehend the proposed interview questions as intended and whether the
questions could be answered accurately (Dillman, Smythe, & Christian, 2009).
Based on the questions developed, the researcher conducted semi-structured
interviews with three key decision makers at each of the selected institutions including
the president, financial officer, governing board member, and in one instance the chief
academic officer who had been directly involved in the development and use of the
financial indicator under exploration.
The researcher identified six institutions that offered compelling stories to share.
Each key decision maker or financial leader represented a subcase of the case, or
institution, being studied. Telephone interviews allowed the researcher to collect a rich,
“thick” description of the use of financial indicators in decision-making (Hatch, 2002;
Merriam, 1998). Semi-structured interviews provided standard data across respondents
and allowed the researcher to probe more deeply and obtain additional information.
Besides conducting semi-structured interviews, the researcher reviewed other
available document from the institution’s website, directly from research participants, and
from other online resources. These documents constituted a form of unobtrusive data
from the six selected institutions to expand data collection and triangulate findings. The
10
findings from this investigation are intended to benefit financial officers and their
respective presidents, governing boards, and other institutional stakeholders interested in
and entrusted with assessing and maintaining the financial health and viability of small,
private institutions in the Midwestern United States.
Research Questions
Grand tour question. Do small private colleges and universities in the
Midwestern United States gather data, including financial and key performance
indicators?
Research sub-questions.
What financial and key performance indicators do institutions gather and how
do institutional leaders use this data to inform strategic decision-making?
How do small private colleges and universities create awareness and
understanding from financial and key performance indicators?
Assumptions
The researcher held the following assumptions in implementing the study:
1. The researcher assumed financial indicators can support strategic decision-
making.
2. The researcher assumed that there is a shared language within the community
of financial officers in higher education. A financial nomenclature is
important for respondents to correctly interpret and respond to interview
questions in the study.
3. The researcher assumed that size of institution student enrollment and total of
long-term investments is relatively static from year-to-year.
11
Delimitations
The following delimitations applied to this study:
1. The study was delimited to six private institutions in the Midwestern United
States.
2. The study excluded public institutions.
3. This study was confined to accredited small private not-for-profit institutions
located in the United States that had long-term investments less than $100
million. Small institutions are defined as having total full-time equivalent
(FTE) enrollments of 4,000 or fewer students inclusive of both undergraduate
and graduate levels.
4. Data were collected in the spring of 2012 from presidents, financial officers,
governing board members, and other related decision makers at small private
four-year institutions. What with the long-running economic turbulence and
market instability that began in late 2008, it is clear that perceptions of
presidents and financial officers might be different if this information were to
be collected during a more stable economic time.
5. The researcher acted as the primary instrument in data collection for the
proposed qualitative study. The researcher sought to minimize any potential
bias that may result from her particular understanding and experience working
in financial management in higher education in conducting the research
(Merriam, 1998).
Limitations
The following limitations applied to this study:
12
1. The study included interviews with a limited number of decision makers from
the six institutions such as the president, financial officer, governing board
member, and other related institutional decision maker.
2. The study population was based on IPEDs data from fiscal year 2010.
3. The researcher recognized potential response bias as participants might hold
positions that encourage or discourage certain perspectives at their
institutions.
4. The study was subject to the respondents’ answering interview questions
based upon how they think questions should be answered, and not based on
actual experience. Respondents were instructed to answer questions honestly
and candidly. The researcher reminded respondents during the interviews that
all responses would be kept completely confidential to promote openness.
Definitions and Terms
Specific terms defined below introduce and explain the concepts, terms, and
variables used in this study.
Balanced Scorecard. Performance measurement framework that includes non-
financial performance measures with traditional, financial metrics to provide
management with more “balanced” view of organizational performance (Balanced
Scorecard Institute, 2012).
Composite Financial Index. Combines four financial ratios into a single number
or score to measure an institution’s health.
Financial health. Ability of an institution to perform its mission by raising and
maintaining the resources to fund and develop quality programs that attract students, thus
13
leading to a positive public perception that the institution is worthy of support (Talboys,
1995).
Financial indicators. Represent measures of financial performance and assess the
level of financial reserves available to fund ongoing operations, meet payment of debt
requirements, and monitor fiscal trends. Financial indicators can be compared against
other institutions and benchmarks to assess financial health of the institution. “Financial
indicators” is a term used interchangeably with “financial ratios” defined below.
Financial leaders. Financial leaders traditionally include the following titles:
Chief financial officer, vice president for finance, treasurer, and/or controller. At a
college or university, these positions provide vision and leadership for the over-all
strategic direction related to budget and planning, accounting, investments, human
resources, business and auxiliary services, facilities, public safety and parking, and
information technology.
Financial ratios. The purpose of financial ratios is to provide insight and
direction for performance improvement. Financial ratios help assess whether an
institution has sufficient reserves to meet current and future operational and capital
spending requirements and sufficient flexibility in its resources to meet changing
demands and increased pressures on those resources.
Financial ratios first were used in the early 20th
century by Moody’s Investor
Service to analyze the finances of colleges and universities to determine whether or not
the financial condition of a college was adequate to support its mission and its long-term
debt obligations. Financial ratios and trend analysis can be combined to see if the college
is maintaining, building, or depleting financial resources.
14
Financial sustainability. The ability of an entity to operate at a level where
revenues equal or exceed expenses on an on-going, long-term basis.
Full-time equivalent (FTE). FTE refers to the number of students enrolled at an
institution as defined by the National Center for Education Statistics (NCES). One FTE
is equivalent to a single full-time student or three part-time students (NCES, 2009).
Institutional viability. A college or university’s ability to operate and fulfill its
mission.
Institutions of higher education. Includes any institution classified by the
Carnegie Foundation as: an associate’s college, a master’s college, university,
baccalaureate college, doctorate-granting university, or special focus institution (Carnegie
Foundation, 2009).
Ratio analysis. Ratio analysis is an attempt to express the relationship between
two or more accounts or variables in a simpler, more comprehensive way. Ratios usually
are derived from financial statements as a basis of comparison, evaluation, and
prediction.
Small private institutions. Colleges and universities chartered or licensed in the
United States that are not governmental entities and that have 4,000 or fewer full-time
equivalent students as defined by the National Association of College and University
Business Officers (NACUBO) (NACUBO, 2009).
Strategic decision-making. The practice of making high-quality decisions as a
means of enhancing organizational performance. Effectiveness in decision-making
depends in part on financial management’s cooperativeness in providing information and
15
in fully airing differences of assumptions and interpretations (Korsgaard, Schweiger, &
Sapienza, 1995).
Significance of the Study
Identifying characteristics and themes that guide institutional leaders at small,
private four-year institutions to manage effectively and strategically their financial data
during trying economic times is pivotal to their sustainability, and concomitantly to the
well-being of the United States. The United States is one of many nations competing in a
global arena. Ensuring that its human capital is competitive is paramount to continue and
enhance its citizen’s quality of life, while contributing to the well-being of persons in
other countries.
To explore how institutional leaders use financial indicators to educate their
governing boards in support of strategic decision-making — and ensure long-term
sustainability — elevates financial indicators from historic reporting devices to strategic
financial tools. For example, institutional leaders who use financial indicators in strategic
decision-making have a greater capacity for awareness of factors influencing financial
health and can quantify the factors within an informed approach to their governing boards
(Chabotar, 2006). Institutional leaders also gain from the knowledge of a more expanded
use of financial indicators to support future planning. Such knowledge creates a
foundation of understanding to guide institutional leaders to enhance strategic decision-
making with their governing boards.
The researcher conducted an in-depth examination of six institutions that have
demonstrated use of financial indicators in decision-making. From the data collected, the
16
researcher developed a set of recommended practices institutions can use to navigate the
financial headwinds that threaten long-term viability and support institutional health.
As part of the study, the researcher explored how these institutions have
overcome any barriers to using financial indicators as a decision-making tool
(Redenbaugh, 2005). This knowledge can be used to address limitations in the literature
of how institutional leaders use financial indicators to support decision-making with their
governing boards. Additionally, this knowledge also enables financial leaders to increase
their understanding and use of financial indicators and an opportunity to improve
decision-making for senior management and the governing board. Improved use will
connect financial indicators to strategic thinking, seeking long-term solutions to current
financial threats (Chabotar, 2006).
Summary
Institutions of higher education are under increasing public scrutiny to manage
costs and provide students an affordable, high-quality education. Doing so has become
increasingly difficult as the regulatory and compliance requirements intensify, expenses
escalate, and available resources change decrementally. Today’s long-running national
economic recession has created a number of stressors on managing financial health in
higher education. Three stresses include: (a) diminished state funding to post-secondary
institutions on a per student basis; (b) increased pressure from other areas of society (i.e.,
law enforcement, penal institutions, health and welfare, K−12 education); and (c) the
highest rate of unemployment in decades, with 9% unemployment in 2011 (Moody’s
Investors Service, 2010; U.S. Bureau of Labor Statistics, 2011).
17
With the existence of economic hardship on a national level, students and their
families, especially those from the less privileged classes of society, tend to be more
cautious about assuming debt obligations in order to go to college (Stimpert, 2004;
Williams, 2006). Furthermore, even among those who complete a degree program, the
prospects for gainful employment in the area of study are less assured during economic
recessions and times of high unemployment, which impact a graduate’s ability to repay
their debt obligations.
Alternatively, recessions tend to bring students back to college campuses,
especially low-cost community colleges, for retooling skills, obtaining advanced degrees,
or completing long-desired degrees or certificate programs. Demand for higher education
can be high during economic recessions. With the beginning of the most recent
economic downturn, for example, the percent of 18 – 24 year olds attending post-
secondary education reached an all-time high in October 2008 at 39.6% or just under 11.5
million students (Fry, 2009).
To attract and retain students at small private institutions that charge premium
tuition rates, financial leaders must effectively manage the value proposition while
keeping a measure of affordability. In order to compete with lower-cost alternatives,
private institutions must manage costs carefully. Financial leaders, in tandem with their
governing boards, need to use all available tools for the institution to be financially
viable. For institutional leaders at small private institutions, using tools such as financial
indicators to maximize financial resources is tantamount to long-term financial health for
the institution.
18
The importance of understanding an institution’s financial health requires an
assiduous approach to the task of making calculated long-term determinations that impact
financial sustainability. This study explored how financial leaders and their governing
boards best use selected barometers of economic viability such as financial indicators to
manage an institution’s financial health successfully.
The remainder of this dissertation is organized into four additional chapters.
Chapter II reviews the literature relevant to the study. Chapter III presents a detailed
description of the methodology used in the study. Chapter IV presents the results, and
Chapter V includes a discussion of the findings and implications for further research and
practice.
19
Chapter II
Review of Literature
Overview
The sequence of information presented in this chapter begins with the resources
used to obtain relevant literature in support of the study; discussion of the problem;
published research to form the context of the development and current understanding of
the use of financial indicators; and a summary discussion of the need for further research
to aid institutional leaders in managing small private institutions through difficult
economic times.
Selection Process
The primary database used in the literature review for this study is the Education
Resources Information Center (ERIC) database. ERIC (2010) is sponsored by the
Institute of Education Sciences through the United States Department of Education and
offers an online digital library of education research and documents. Additionally, the
study used the online repository of dissertations available from the University of
Nebraska-Lincoln library system. Secondary data sources in the literature review
included books, articles, and research presentations written on the subject of financial
ratios and indicators, ratio analysis, strategic planning, educational finance, planning and
policy, higher education, institutional performance, and budget and analysis.
Context of the Problem
Two overarching financial trends in higher education make attendance at a small
private college and university increasingly difficult to afford for students and their
families: (a) escalating costs, driven by a higher inflationary rate in higher education,
20
along with costs associated with meeting the increasing expectations and needs of
students, and (b) declining governmental support to both students in the form of grant and
aid, and to institutions in direct appropriations. Escalating costs have increased the
sticker price of tuition dramatically, while the decline in governmental student aid and
institutional support has placed a greater share of financing a college education on
students and their families. These two overarching financial trends threaten access and
affordability for students who seek a college education. Given the institution’s high level
of reliance on tuition revenue, maintaining student access and affordability is essential to
ensure institutional viability.
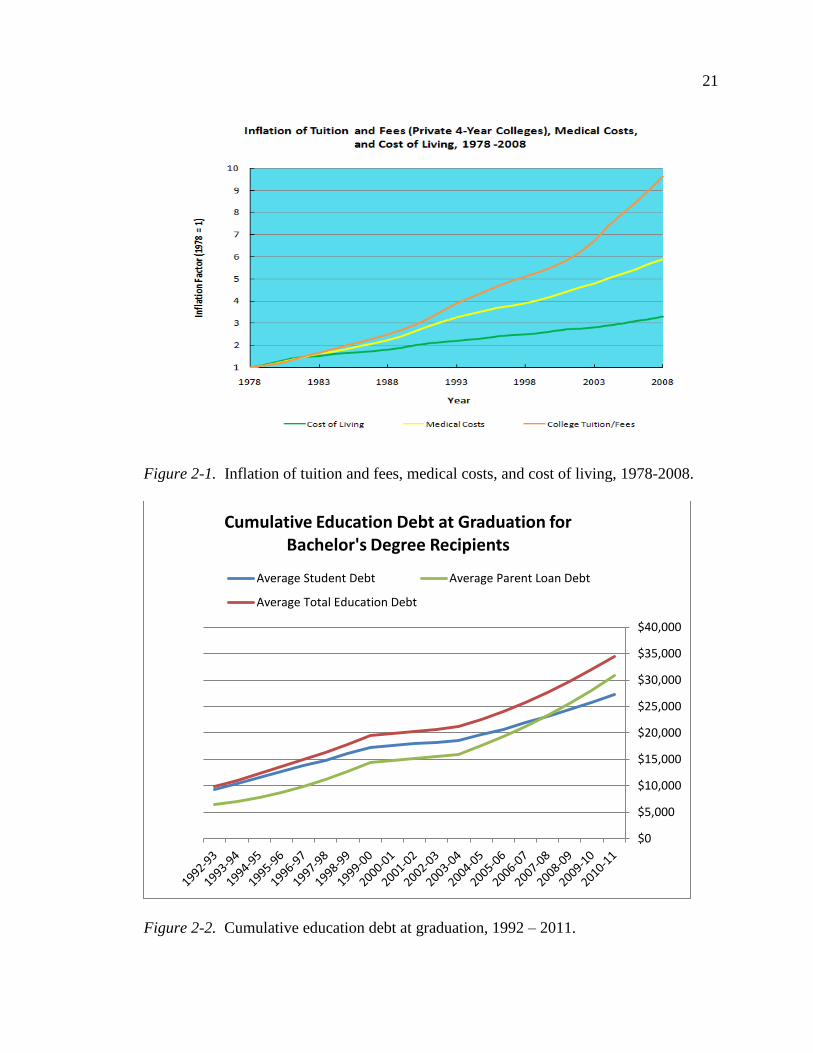
To balance the budget, financial officers have relied increasingly upon raising
tuition rates to cover escalating costs. The following graph (Fig. 2-1) notes the dramatic
yearly rise in tuition and fees charged at private four-year colleges, as compared with
medical cost increases and over-all cost-of-living increases over the past 40 years.
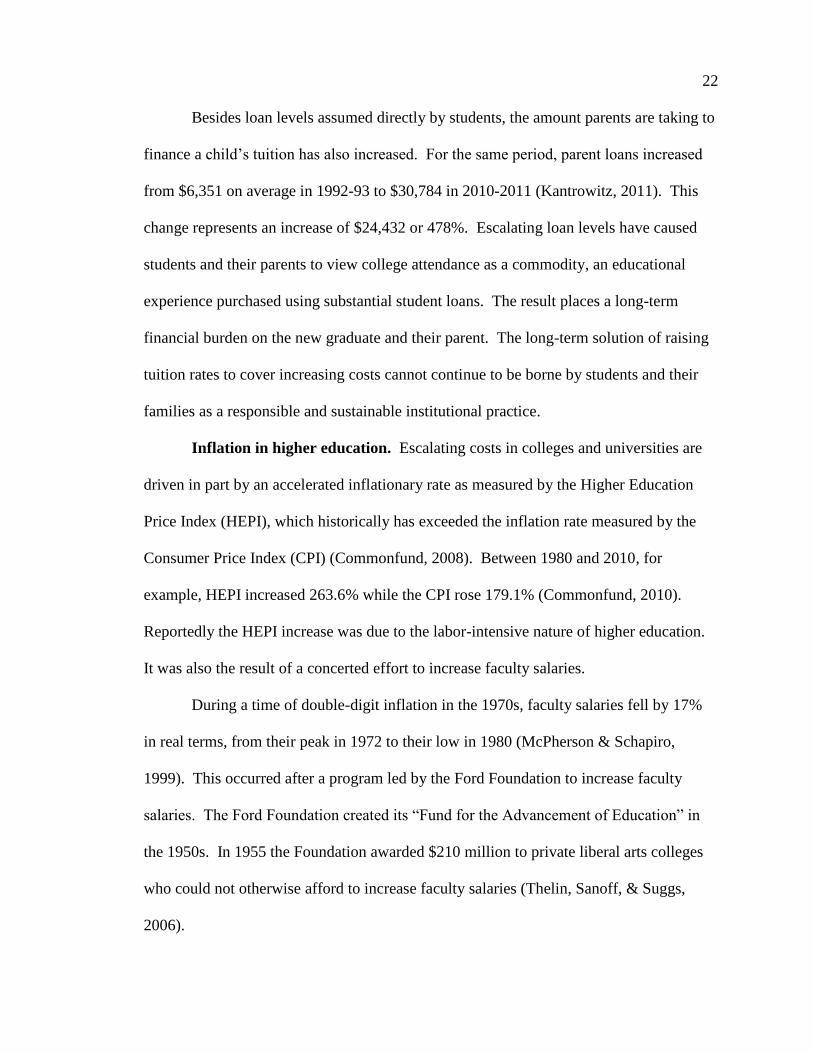
With the dramatic rise in tuition rates, students and their parents have had to
assume increasing debt to finance a college education. The percentage of students
financing their college educations has increased from 45.5% in 1992-93 to 66.0% in
2010-2011 (Kantrowitz, 2011). The more significant change has been in the size of loans
students are taking: The average of $27,204 in 2010-11 represents an increase of $17,884
or 192% from $9,320 in 1992-93. Student loans include both federal and private loans.
The graph below (Fig. 2-2) demonstrates the increasing debt burden for students and
parents during the 18-year period from 1992-93 to 2010-2011.
21
Figure 2-1. Inflation of tuition and fees, medical costs, and cost of living, 1978-2008.
Figure 2-2. Cumulative education debt at graduation, 1992 – 2011.
$0
$5,000
$10,000
$15,000
$20,000
$25,000
$30,000
$35,000
$40,000
Cumulative Education Debt at Graduation for Bachelor's Degree Recipients
Average Student Debt Average Parent Loan Debt
Average Total Education Debt
22
Besides loan levels assumed directly by students, the amount parents are taking to
finance a child’s tuition has also increased. For the same period, parent loans increased
from $6,351 on average in 1992-93 to $30,784 in 2010-2011 (Kantrowitz, 2011). This
change represents an increase of $24,432 or 478%. Escalating loan levels have caused
students and their parents to view college attendance as a commodity, an educational
experience purchased using substantial student loans. The result places a long-term
financial burden on the new graduate and their parent. The long-term solution of raising
tuition rates to cover increasing costs cannot continue to be borne by students and their
families as a responsible and sustainable institutional practice.
Inflation in higher education. Escalating costs in colleges and universities are
driven in part by an accelerated inflationary rate as measured by the Higher Education
Price Index (HEPI), which historically has exceeded the inflation rate measured by the
Consumer Price Index (CPI) (Commonfund, 2008). Between 1980 and 2010, for
example, HEPI increased 263.6% while the CPI rose 179.1% (Commonfund, 2010).
Reportedly the HEPI increase was due to the labor-intensive nature of higher education.
It was also the result of a concerted effort to increase faculty salaries.
During a time of double-digit inflation in the 1970s, faculty salaries fell by 17%
in real terms, from their peak in 1972 to their low in 1980 (McPherson & Schapiro,
1999). This occurred after a program led by the Ford Foundation to increase faculty
salaries. The Ford Foundation created its “Fund for the Advancement of Education” in
the 1950s. In 1955 the Foundation awarded $210 million to private liberal arts colleges
who could not otherwise afford to increase faculty salaries (Thelin, Sanoff, & Suggs,
2006).
23
After reaching a low point in 1980, faculty salaries for all types of institutions
rebounded between 1980 and 2009. Much of the growth occurred during the 1980s, with
an increase of 14%, adjusted for inflation (NCES, 2010c). During the 1990s the pace
slowed to an average of 5% per year, and through 2009, 4% adjusted for inflation. At
private four-year colleges, salaries increased only 9% over the past decade, evidencing
the continued difficulty of small private colleges to compensate their faculties at market
levels.
Aside from the costs related to salary increases, the shift towards specialization
and scholarship of faculty also caused salary costs on campus to rise. The cost of salaries
over all increased as faculty moved towards greater specialization and scholarly activity,
and away from classroom instruction and other institutional responsibilities. Professional
administrative positions were added to fill the gap left by faculty in areas such as
advising, tutoring, and student development.
This phenomenon can be seen in the shift from faculty to nonfaculty and non-
professional to professional staff during the period from 1976 to 2009. In 1976 at four-
year institutions, while 60.8% of staff were faculty, with 39.2% nonfaculty, over-all
professional employees constituted 56.7% of total employees and 43.3% for non-
professional (NCES, 1998, 2011). By 2009, faculty and nonfaculty ratios had shifted
with 53.2% faculty and 46.7% nonfaculty. Professional employees had grown to 76.0%
of total employees, with only 24.0% classified as nonprofessional. Today’s campus is
staffed with a greater percent of professional employees, and of the professional
employees, a greater percent represented by non-faculty, compared with 1976.
24
The historical development of this phenomenon is worth considering further given
the substantial costs involved in personnel in higher education. There was a time when
private institutions were able to recruit faculty from nearby graduate institutions at
relatively modest salaries (McPherson & Schapiro, 1999). The faculty members spent
much of their time with students either in the classroom or on campus advising, coaching,
or tutoring.
Today, while new faculty members expect a certain level of teaching
responsibility, they also want to pursue scholarly research and publication. And as
institutions seek to improve their academic reputations, faculty members are expected to
be actively engaged in scholarship and other research activities as a condition of tenure
and promotion (Stimpert, 2004). Given the specialization of the faculty and dual focus of
teaching and scholarship, faculty members have left much of the day-to-day
administrative and governance tasks to an expanding cadre of professional
administrators. Indirectly and directly this has raised the total cost of salaries on campus.
Directly, the specialization of faculty has increased faculty salary rates in
technical areas where there is an undersupply of faculty and an expectation of reduced
course loads to support research activities. Indirectly, as faculty shifted their focus to
research and publication and away from instructional, advising, and other duties, the
resulting professionalization of administration has had a dramatic impact on salary
expense. New staff positions have been added on campus, including counselors in
wellness centers, professional advisors to assist students in monitoring academic
progress, and professional tutors in learning centers.
25
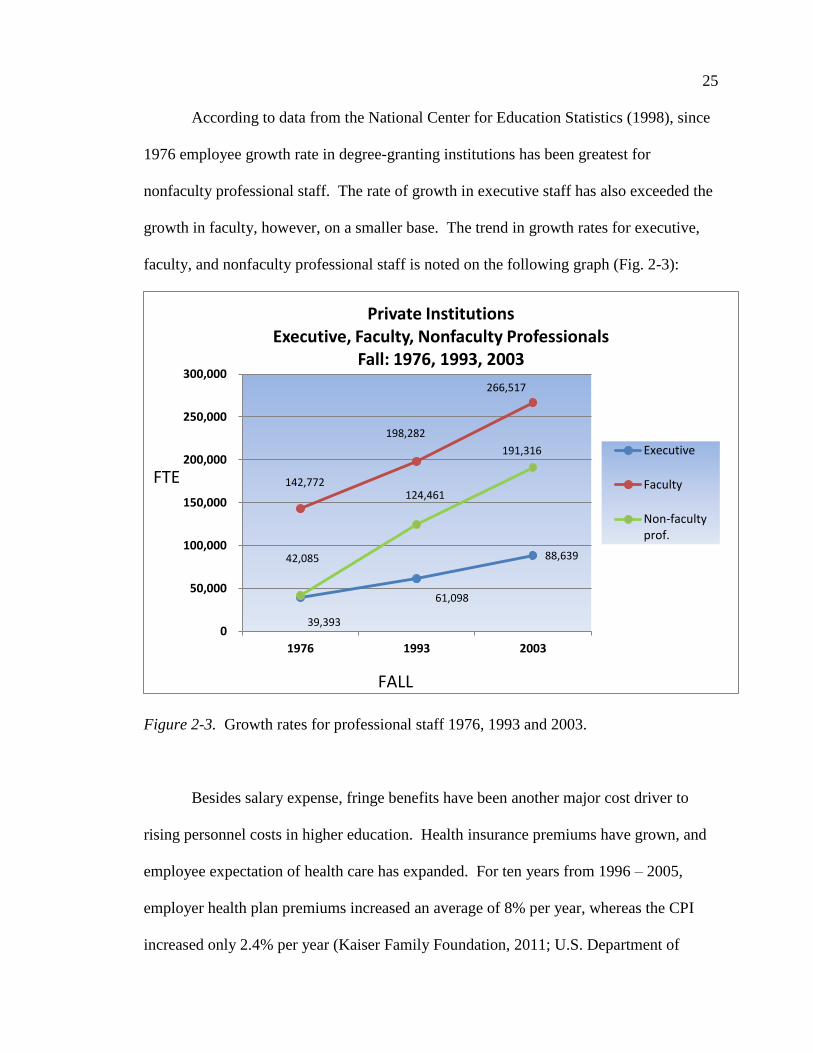
According to data from the National Center for Education Statistics (1998), since
1976 employee growth rate in degree-granting institutions has been greatest for
nonfaculty professional staff. The rate of growth in executive staff has also exceeded the
growth in faculty, however, on a smaller base. The trend in growth rates for executive,
faculty, and nonfaculty professional staff is noted on the following graph (Fig. 2-3):
Figure 2-3. Growth rates for professional staff 1976, 1993 and 2003.
Besides salary expense, fringe benefits have been another major cost driver to
rising personnel costs in higher education. Health insurance premiums have grown, and
employee expectation of health care has expanded. For ten years from 1996 – 2005,
employer health plan premiums increased an average of 8% per year, whereas the CPI
increased only 2.4% per year (Kaiser Family Foundation, 2011; U.S. Department of
39,393
61,098
88,639
142,772
198,282
266,517
42,085
124,461
191,316
0
50,000
100,000
150,000
200,000
250,000
300,000
1976 1993 2003
Private Institutions Executive, Faculty, Nonfaculty Professionals
Fall: 1976, 1993, 2003
Executive
Faculty
Non-faculty prof.
FTE
FALL
26
Labor, 2011). Given health insurance premium amounts of $4,024 for single coverage
and $10,880 for family coverage in 2005, medical insurance can comprise a substantial
expense to an institution depending on the level of employer-funded benefit.
For higher education in particular, faculty benefits have grown substantially faster
than salary increases. For faculty fringe benefit costs, the average increase adjusted for
inflation from 1979 – 80 to 2008 – 09 was 78%. This compares with the average salary
increase during the same time period of 24% (NCES, 2010c). Salary and benefit costs
represent a large, fixed component of a small college operating budget. Given the rate of
increase and growth in both salary and benefit costs, and the substantial portion of costs
associated with salary and benefits, institutional costs in higher education have increased
at a significant rate with no apparent end in sight.
Student expectations in higher education. Besides salary and benefit costs,
escalating costs are also driven by student expectations and needs. Over the past
40 years, there are a number of identifiable factors that have increased institutional costs
as colleges and universities have sought to meet growing student expectations and needs.
Technology in particular has made a dramatic impact on college and university
campuses, with $48 billion spent on information technology in education in 2009 and $56
million projected in 2012 (Springer, 2010). In the span of time from 1998 to 2009,
student demand for an enhanced living experience including fitness centers and amenities
similar to high-end apartment buildings, increased the cost structure for providing
residence halls by 200% (Hershey, 2009).
Adding to the increased cost factors driven by student demands are expectations
and requirements related to campus safety (at the institutional level and nationwide,
27
through the implementation of mass-notification systems), as well as compliance
demands in high levels of regulatory reporting required by governmental and investment
rating agencies such as Moody’s Investor Services. Such escalating costs, if not provided
for by other sources, are passed on to the student in the form of increased tuition rates.
Decline in governmental support. Government support to higher education has
been a major factor in students’ ability to attend college and for institutions to focus on
research and public service activities. With the establishment of the Guaranteed Student
Loan program in 1965, President Lyndon B. Johnson’s “Great Society” provided
supplemental aid to students who could not otherwise afford to attend college. This
program has had dramatic effects, with total funds loaned from 1965 – 1978 at $12
billion, while in 2002 – 2003 over $34.4 billion was loaned in a single year (NCES,
2010d; Williams, 2006).
Over-all government support at the federal level went from virtually non-existent
in the early 1960s to $769.5 billion by FY2003, with state support increasing from $.02
billion to $2.1 billion (NCES, 2004). With the growth in support, higher education
institutions have come to rely on government support for their operating budgets. Even
private institutions rely on the support from federal and state grant and aid programs that
provide students with the means to pay for tuition, as well as from state appropriations to
fund general campus operations.
The general trend today however is a decline in state appropriations, especially
for public universities that rely heavily on state support. While in the academic year
1981 – 1982, public four-year institutions received 44% of their funding from the state,
by 2007 – 08 the percentage had dropped to 32.7 (Moody’s Investors Services, 2010,
28
p. 7; Trow, 1989). State appropriations continue to decline in general, with a reduction of
1% in 2008 – 2009 and an estimated 5% in 2009 – 2010, with the continuance of an
economic recession nationwide (Moody’s Investors Services, 2010, p. 7).
As governmental support declines, especially at the state level, institutions are
forced to increase tuition, given no other offsetting funding source. From 1980 to 1998,
tuition and fees at public institutions increased 107% in constant dollars, compared with
an increase in appropriations of 13% from state governments (National Center for Public
Policy and Higher Education, 2002). Owing to the dramatic increase in enrollment
during this time, from 12,097,000 to 15,312,000 or 26.6%, institutions receiving less
government support have had to raise tuition to cover costs (NCES, 2010a). For public
institutions, affordability and access are directly related to the decline in governmental
support, which becomes exacerbated by significant enrollment growth. For private
institutions, a decline in government support has less impact but still results in rising
tuition rates.
At the federal level, the American Recovery and Reinvestment Act of 2009
(ARRA) provided 2.2 billion dollars of stimulus funds for the academic year 2008 – 09
and $3.2 billion in 2009 – 2010 (Moody’s Investors Services, 2010). Such Federal
financial support however is an artificial short-term solution to offset the decline in state
funding. Because ARRA provides one-time funding, it presumes that states will be able
to find solutions to fill the gap after ARRA funds are fully expended. Going forward, it
is clear that the federal government’s ability to support higher education at the same level
is overstrained, owing to increasing costs in health services, social security, and interest
29
expense on debt, never mind the fact that such educational costs are not within the
express authority of the United States Constitution (Dennis, 2000).
Unlike state governments, the Federal government’s authority to financially
support higher education is obtained indirectly. It uses its powers to encourage States to
become conduits for national policy, rather than depend upon the Federal government to
implement programs directly. For example, the Tenth Amendment of the United States
Constitution empowers the Federal government’s indirect impact on education through
taxation, commerce, as well as civil rights enforcement. “Whenever an education activity
falls within the scope of one of these federal powers, the federal government has
authority over it” (Kaplin & Lee, 2007, p. 613). So while the federal government
contributes substantial financial support to higher education, it does so not through direct
constitutional authority, but through indirect avenues that support the national
educational agenda.
The federal budget is comprised of 35% discretionary and 65% obligatory
spending. The President and Congress appropriate discretionary funds through 13 bills
while obligatory spending is mandated by law (U. S. Department of Education, 2011).
For the U.S. Department of Education, 88% of its budget comes from discretionary
funds, with the balance coming from obligatory funding that provides direct student loan
programs. By law the Federal government is mandated to cover the cost of guaranteeing
and making direct student loans.
The federal government greatly expanded its student loan programs through the
Middle Income Student Assistance Act of 1978, which made all students eligible for
subsidies regardless of need (NCES, 2010d). Besides student assistance, the federal
30
government provides substantial funding for research at educational institutions through
such agencies as the National Science Foundation and Health and Human Resources.
From 1965 to 2003, federal funding in constant dollars rose from $7 billion to $28 billion
for postsecondary education, and $10 billion to $28 billion for research (NCES, 2010d).
The problem, however, has been the shift from student grants and direct
appropriations to student aid and either a reduction or an elimination of state
appropriations. This shift has directly resulted in increasing tuition rates, as well as
student loan levels, over the past forty years.
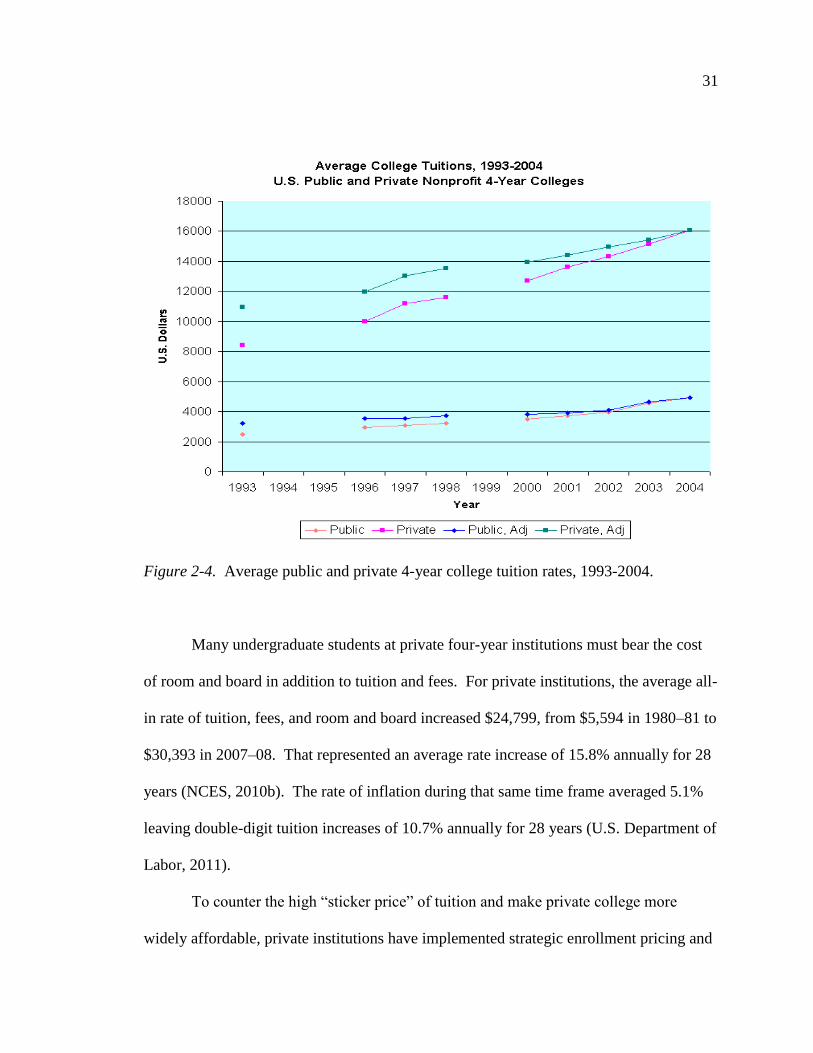
Increasing tuition rates. In order to balance the budget with escalating costs and
declining government support, institutions have had to raise tuition. The graph on the
next page (Fig. 2-4) compares average undergraduate tuition and fees charged by about
600 public and 1,350 private, non-profit four-year colleges in the U.S. during years from
1993 through 2004, both unadjusted and adjusted to the year 2004 by using the CPI.
Data were not available for years 1994, 1995 and 1999 (Wikipedia, 2011).
For small private institutions that are heavily tuition dependent, increasing tuition
is the most direct method to increase revenue and cover rising costs. According to Taylor
and Massy, “Student charges have risen faster than either wages or the rate of
inflation . . . This rise in charges has produced both a ‘crisis of affordability’ and the
perception in some quarters that higher education is greedy and wasteful” (1996, p. 5).
The CollegeBoard (2008) reported that between academic years 1994–1995 and 2008–
2009, the average private four-year tuition and fee costs, excluding room and board,
books, and related materials, had increased an average of $14,646; from $10,497 to
$25,143. That translated into a 10% per year average increase for 15 years.
31
Figure 2-4. Average public and private 4-year college tuition rates, 1993-2004.
Many undergraduate students at private four-year institutions must bear the cost
of room and board in addition to tuition and fees. For private institutions, the average all-
in rate of tuition, fees, and room and board increased $24,799, from $5,594 in 1980–81 to
$30,393 in 2007–08. That represented an average rate increase of 15.8% annually for 28
years (NCES, 2010b). The rate of inflation during that same time frame averaged 5.1%
leaving double-digit tuition increases of 10.7% annually for 28 years (U.S. Department of
Labor, 2011).
To counter the high “sticker price” of tuition and make private college more
widely affordable, private institutions have implemented strategic enrollment pricing and
32
discount policies. This strategy began in the 1980s in an effort to maximize revenues and
fill class seats. It also allowed private institutions the ability to compete with public
institutions that have the advantage of lower tuition pricing due to state funding support.
As part of the enrollment pricing and discount strategy, complex financial matrices were
used to identify merit aid levels to attract high-income students, and aid for middle-
income students in order to keep tuition somewhat affordable.
Using financial aid matrices to fill seats in class is referred to as “strategic
maximization” (McPherson & Schapiro, 1999, p. 55). The typical student aid package
now includes financial grant-in-aid, loans, and work-study jobs for qualified students.
For those full-paying students who do not receive grants, their tuition dollars essentially
offset students receiving discounts, also referred to as “unfunded aid.” According to
Bonham (1997), there are “perils inherent in so-called unfunded aid” (p. 12). That peril
for private institutions is that much of the tuition discounting is unfunded, and not
supported by real dollars such as endowment earnings, but go essentially from the full-
paying student to the student with discounted tuition.
The private institution. Private institutions struggle financially to maintain a
presence in the higher education market. With public institutions being supported by
more substantial governmental appropriations, private institutions are at a distinct
disadvantage. For-profit institutions also have an advantage over private institutions in
that their business model relies heavily on adjunct faculty, who are paid substantially less
than full-time faculty at private institutions. As of Fall 2009, full-time faculty at a private
four-year for-profit institutions constituted only 14.7% of total faculty, while at not-for-
profit institutions full-time faculty constituted 55.6% of total faculty. While an average
33
pay rate for adjunct faculty is $2,500 to $3,000 per course, an average salary for a full-
time full professor in education is $82,919; the difference in instructional cost between
adjunct faculty and full-time faculty is substantial (Chronicle, 2010). Furthermore,
adjunct faculty salaries do not include the fringe-benefit packages and corresponding
costs that full-time faculty members receive.
While the private four-year institution represents a large percentage of institutions
of higher education in the United States, they do not have a large percentage of the total
enrollments. As of 2006, there were 4,301 degree-granting institutions of higher
education in the United States, including two-year institutions that confer associate
degrees only (NCES, 2010a). Small private four-year institutions represented 2,164 of
the total (50.3%). In terms of enrollment, there were 17,758,870 students enrolled in
degree-granting institutions in 2006. The small private four-year institutions enrolled
1,286,613, or 7.2% of the total enrollment.
The small private institutions do appear to succeed in the basic mission of higher
education: graduating students. Between 1981 and 2001, private colleges enrolled 21%
of first-year students in the United States, but conferred 37% of the nation’s bachelor’s
degrees (Thelin et al., 2006). Additionally, more than 70% of students at independent
colleges graduate in four years and this success applies to students of all racial and ethnic
backgrounds. A major part of the success for private not-for-profit institutions is
attributed to the close interaction between students and faculty (Thelin et al., 2006). The
small size of private institutions promotes the close interaction that proponents claim
leads to academic success.
34
So while successful in graduating students, small private institutions cannot
continue to increase tuition rates at an unsustainable pace without the risk of losing
enrollment. Solutions need to be considered. One major focus in board governance and
institutional leadership has been managing tuition increases through cost control.
Managing tuition increases through cost control. Organizations such as the
Association of Governing Boards (AGB) provide institutional leaders with research on
efforts to combat the trends of escalating higher education costs. The Cost Project
(Wellman, 2008), sponsored by the AGB and funded by the Robert W. Woodruff
Foundation, sought to shed light on the dynamics of rising higher education expenditures.
Additionally, the study sought to show how institutional leaders and associated boards of
trustees might better manage accelerating expenditures by enhanced and strategically
focused activities.
The Costs Project’s agenda aimed to improve both the interest in and
qualifications of boards of trustees on curbing expenditures. To assist boards of trustees
and associated institutional administrators successfully navigating the turbulent waters of
higher education finances was deemed to be of paramount importance. Historical
profiles on all aspects of higher education showed continuously incremental variations,
and there was no indication of braking being inherent in the escalating costs. The direct
result of escalating costs for small private institutions has been to increase tuition rates at
an unsustainable pace.
The focus in managing the steep increase in tuition rates has been to examine
institutional expenses through cost management. In 2006–07, the Cost Project conducted
a stratified survey of 2,131 AGB member institutions. That survey was made in
35
collaboration with the National Association of College and University Business Officers
(NACUBO) and sampled 733 institutions. There were 151 respondents who claimed that
cost management was a very high priority, while another 272 affirmed cost management
to be a priority. Twenty-five percent of the responding institutions (N = 183) reported
they had provided strategic spending data to their governing boards (Wellman, 2008), and
that such data were important to decision-making. Interestingly, only 10 institutions said
that cost management was not a priority.
The study findings (Wellman, 2008) did not provide guidance on factors that
might increase the usage of data, but disclosed the following four reasons as
impediments: (a) insufficient time allocated at board meetings for cost management
discussion, (b) other priorities preempted board attention, (c) board members were not
prepared sufficiently for meetings, and (d) that the time and effort for institutional
management to prepare cost information was deemed to be overly burdensome
(Association of Governing Boards, n.d.). Absent the 25% of institutions claiming that
they prepared and effectively utilized strategic spending data, the remaining 75% (N =
550) cited multiple reasons for not being engaged in such activities.
Despite acknowledgment that cost management was important, there existed an
absence of attention and effort to deliver meaningful cost data to decision makers
entrusted with ensuring the institution’s financial solvency. Thus the posture adopted by
those 550 institutions was tantamount to a rationalized negative attitude toward the
process of providing strategic spending data to their boards to support strategic decision
making. That finding evoked the metaphor of an ostrich hiding its head in the sand,
ostensibly hiding entirely, as a means for ignoring real or potential problems and hoping
36
the dilemma would vanish. Just as this metaphor is a fanciful interpretation of reality, so
is the ignoring the financial data’s importance. Financial indicators can provide tools for
making cost data more meaningful in strategic decision making.
Financial indicators as a tool in strategic decision making. The use of
financial indicators began in earnest in the 1970s with studies conducted by Dickmeyer.
By the 1990s, the use of financial indicators had been established formally in higher
education with the U.S. Department of Education compliance requirements, as well as
debt covenants within banking agreements for bond issues. Financial indicators were
being used for compliance requirements and not necessarily for strategic decision
making. To expand financial indicator use in strategic decision making would require
further investigation and study.
In 1996, Taylor and Massy conducted a study to further the understanding of
financial indicators in higher education. The study reported on the utilization of more
than 100 strategic financial indicators customarily used during the early 1990s. At the
time, higher education was under enormous financial stress due to public pressure to
restructure and reform. Tuition rates had increased dramatically, and the tide had shifted
from governmental grants for need-based aid to student loans. In order to pay for a
college education, students began to take on increasing debt to finance their college
experience.
In assuming greater debt to finance a college education, students and their
families wanted assurance that superior outcomes justified the tuition rates charged,
particularly at private institutions, and the debt students accumulated (Stimpert, 2004).
Students and their families also wanted institutions to employ restructure and reform
37
measures, which would lighten the financial burden of college attendance from students
and their families. The approach to regain prior levels of financial access and
affordability without diminishing quality became a subject of debate, with tuition pricing
driven by governmental support, student expectations, and rising costs at its center.
In response, higher education leaders identified the metaphor of an “Iron
Triangle” to explain the quandary of managing cost, quality, and access, where each side
of the triangle reacts to changes to another side of the triangle (Immerwahr, Johnson, &
Gasbarra, 2008). For example, hiring specialized faculty in a specific discipline to raise a
program’s quality will increase salary costs. All things being equal, tuition rates will
increase to offset the increased salaries. This has the negative impact of reducing access,
as less affluent students find it more difficult to finance the higher tuition.
Students and their families, however, did not accept the metaphor of an Iron
Triangle, but instead attributed rising costs to a wasteful and mismanaged higher
education structure (Immerwahr et al., 2008). The public argued that with better fiscal
oversight more students could participate in and benefit from postsecondary education
with no decline in quality.
Higher education leaders recognized limitations of family income and turned to
government and business leaders to increase their support as a means to offset increasing
tuition rates. Like the public, government and business leaders also did not accept the
Iron Triangle metaphor. Many believe there is too much bureaucracy in higher education
and that institutions need to become more efficient. Efficiency, however relative, has
different meanings in the for-profit and not-for-profit world. Business leaders especially
identify with a for-profit model, which seeks to maximize economies of scale and

38
productivity. Achieving economies of scale and productivity in higher education has
unique barriers.
For public institutions, economies of scale can be achieved more readily than at
small private institutions owing to their size. Public institutions utilize large classrooms
to reduce costs on a per-student basis while employing low-cost graduate assistants to
instruct large classes. Students accept larger class sizes and the use of graduate or
teaching assistants because they appreciate the lower tuition rates public institutions
charge. And graduate or teaching assistants desire the valuable experience that actual
teaching responsibilities provide to their educational programs.
Private institutions, however, are constrained by their promise of full-time faculty
instruction, greater personal attention, and service. This promise is funded and made
possible by the higher tuition rate charged at private institutions.
The smaller scale of the residential experience also does not lend itself to
economies of scale. Finding large class spaces on campus to host larger class sizes can
be difficult. And for the small liberal arts colleges that do not have substantial graduate
programs, if any, graduate and teaching assistants are unavailable to instruct lower level
classes.
How to address the issue, in part, is limited within the varying expectations of the
small private institution and the large public institution. Private institutions promote
small class size and greater interaction between full-time faculty and their students.
Institutions argue that increasing class size to reduce costs would reduce quality, in part
due to the increased faculty workload and resulting lesser opportunity for student-faculty
interaction. Full-time faculty are often expected to pursue scholarly research. While
39
teaching is correlated to productivity in the classroom and revenue generation, scholarly
research offers indirect benefits such as institutional reputation, faculty engagement, and
opportunities for student research. This further limits opportunities to achieve economies
of scale that could otherwise make instructional activities less expensive on a per-student
basis.
Both public and private institutions struggle with maximizing the use of their
physical plant. With faculty and students leaving the campus en masse for the summer, a
large facility goes underutilized for a few months each year, even though a full-cost of
overhead continues with costs such as utilities, landscaping, cleaning, and administrative
staff salaries. This is also true for winter and spring breaks, when faculty and students
leave campus and the campus becomes in large part an underutilized facility with a full
composite of maintenance costs.
Despite the noted reasons for greater expense and overhead factors in higher
education, the public, government, and business community continue to blame college
and university leaders for the high cost of attending college today. To enhance
transparency and tell an institution’s financial story, university leaders can utilize
financial indicators to promote a shared meaning and understanding with the public,
government, and the business community as to the key financial issues in higher
education.
Major Works
In the 1970s, Peat Marwick Mitchell & Co., a major national accounting firm,
published the first edition of Ratio Analysis in Higher Education to assist institutional
leaders in using financial ratio analysis to understand financial statements of colleges and
40
universities (KPMG Peat Marwick, 1995). Financial ratio analysis provides a tool for
managers and institution stakeholders to measure financial health using available
financial data. With each subsequent edition, KPMG provided more information to
higher education administrators in order to form an in-depth understanding of ratio
analysis that could be applied to their respective institutions.
The purpose of financial ratios was developed to measure the financial resources
of an institution, to answer questions about the use such financial resources, and to focus
on trends and benchmarks for comparative purposes. Ratio analysis was noted as a
“yardstick to measure the use of financial resources to achieve the institution’s mission”
(KPMG Peat Marwick, 1995, p. VI).
External users, such as banks and investor rating agencies, use ratio analysis as a
means to measure relative credit strength as well as an institution’s financial health.
Measuring credit strength is especially important to institutions that access credit markets
for long-term debt financing of campus facility projects. The benefit of successfully
managing financial ratios is that improved ratios result in lower interest expense on long-
term debt. Credit markets will assess a lower interest rate for higher quality institutions
as measured by financial ratios. The improved financial ratio indicates a lower perceived
risk of default. This reduces the costs of debt expense to the institution and provides
financial resources for other mission-centered purposes. Besides reducing the rate of
interest on long-term debt, improved ratios also allow institutions to expand debt capacity
and access additional debt financing to enhance campus and academic programs.
Dickmeyer and Farmer (1979) were early pioneers in ratio analysis. They created
a model of institutional financial flows predicated on the subject of financial indicators in
41
higher education. The Federal Office of Education supported their study, which claimed
the following three uses for financial indicators: (a) to compare and evaluate one
institution with another, or against a group of peer institutions; (b) to understand trends
within the industry of higher education by national postsecondary institutions; and (c) to
forecast potential problems in order to mitigate them through timely political responses,
as appropriate, within the constraints established by federal and state governments.
When exploring the use of financial indicators for predicting institutional health,
Dickmeyer and Farmer (1979) noted the Gross National Product (GNP) as a single
indicator of fiscal health on a national level. Dickmeyer and Farmer (1979) contended
that higher education, however, did not have such a broad indicator of its fiscal health.
Instead, Dickmeyer and Farmer (1979) suggested the use of a composite of financial
indicators to form a basis for assessing respective fiscal health for colleges and
universities. The authors commented that the production of graduates in higher education
may be considered an equivalent to GNP. Unexplainably that research did not generate
additional scholarship on the topic.
In 1984, Gilmartin found that financial ratios were invaluable for federal and state
policy makers. That claim was made on the basis of a longitudinal study of colleges and
universities in the United States. The author studied the efficacy of 61 selected indicators
of financial viability to validate whether the indicators were correlated to institutional
stress. The indicators were selected in coordination with Nathan Dickmeyer, director of
the Financial Conditions Project of the American Council on Education at the time.
Additionally, the selected indicators were being used in other major research studies to
assess the financial position of colleges and universities.
42
Using discriminant analysis, Gilmartin (1984) developed a composite index of
viability as a summary measure to identify financial stress. Using a two-step process,
Gilmartin first validated indicators that identified financial distress. The composite used
the validated indicators for each sector and weighted them to best identify institutional
distress. The composite index was tested for reliability in identifying colleges known to
be in distress. For the years 1977 and 1976 the index captured 58% and 83% of the
colleges known to be in distress.
Gilmartin (1984) recommended that further research explore three issues as a
result of the study: (a) actions colleges may take to become more viable in the future;
(b) governmental policies that could be pursued to benefit colleges in distress; and (c) the
quality of education students receive at colleges with low viability scores. Future
research suggested that institutions need to understand the actionable steps that can be
taken to improve institutional health and to understand whether quality is affected by
viability. Essentially, financial indicators provide information, but do not necessarily
develop sufficient understanding to support strategic decision making.
Chabotar (1989) was another early leader in applying financial ratios previously
used by for-profit industry to not-for-profit organizations. The for-profit industry
historically had used financial ratios to provide a better understanding of financial
condition and institutional priorities. Return on investment and net earnings were two
key ratios that corporate leaders used to monitor trends and assess financial performance.
Other ratios included the debt-to-equity ratio to measure financial flexibility, as well as
the analysis of receivables inventory and turnover to monitor cash flow from the sale of
products and services.
43
Chabotar (1989) compared and contrasted the use of ratio analysis by for-profit
business with not-for-profit organizations, especially colleges and universities. While
both for-profit and not-for-profit entities need to monitor long-term financial stability and
trends that indicate operating effectiveness and financial health, not-for-profit
organizations do not share the objective of enhancing shareholder wealth. In this
instance, not-for-profit organizations have no shareholders or owners who can buy or sell
shares. Instead, not-for-profits are motivated by fulfilling a mission unrelated to
shareholder wealth.
To fulfill mission, institutional leaders need to generate financial resources, funds
remaining after total expenditures have been paid. The greater the available financial
resources, the more the institution can support new and expanding activities aligned to
the mission of the organization. At the same time, however, the converse is true. With
limited financial resources, the institution is constrained in its pursuit of mission-centered
activities.
Because of the varied focus of not-for-profits, Chabotar (1989) described several
types of ratios that can be used to measure institutional financial health. The types
focused on liquidity or institutional financial flexibility, debt or institution borrowing
capacity, and net operating results to generate financial resources.
The first type, liquidity ratios, measure the institution’s cash levels for meeting
payroll and paying bills. Three frequently used liquidity ratios include: (a) Current Ratio,
(b) Quick Ratio, and (c) Available Funds Ratio. The Current Ratio measures the level of
ability the organization has to pay its bills on time without depleting cash reserves. It is
computed by dividing unrestricted current assets by unrestricted current liabilities. While
44
a ratio of 1.0 to 1.0 is recommended, a higher ratio of 2.0 to 1.0 may indicate an overly
cautious use of reserves could otherwise be diverted to further promote the institution’s
mission.
Debt was another important area Chabotar (1989) described for financial analysis
use by not-for-profits. Two standard ratios include the Debt-Equity Ratio and the Debt-
Service Ratio. The Debt Equity Ratio measures the level of debt to fixed assets and is
computed by dividing Plant Debt from Net Investment in Plant. The Debt-Service Ratio
is computed by dividing Debt Service (principal and interest payments) from Total
Operating Revenue. The use of debt can help institutional leaders smooth the cyclical
nature of cash flows and finance capital projects such as new residence halls and
classroom buildings.
The third type, net operating results ratios, measures the ongoing financial health
of an institution. The ratio is computed by dividing Net Total Revenues by Total
Revenues. As discussed earlier, not-for-profits do not exist to increase shareholder
wealth and maximize profits, but to generate financial resources within a balanced budget
where revenues meet or exceed operating expenses over the long term. Net operating
results provide an indication of the rate of operating performance; a positive rate results
from revenues that exceed expense.
Chabotar (1989) found in not-for-profit institutions, including the majority of
colleges and universities, that ratio analysis was invaluable to stewardship and
accountability. Ratio analysis was used as a tool to guide management in strategic
decision making. It was found more useful in a comparative basis with like
organizations, or over time in observing trends for the same organization.
45
Chabotar (1989) noted that ratios by themselves however do not determine
financial health or financial decline, but serve instead as an “early warning system” of
institutional financial stress (p. 189). Early indications, however, do not answer or
resolve financial issues. They only provide management with symptoms for further
review and action.
Chabotar (1989) explored the use of financial ratios through use of a case study
that featured an actual not-for-profit university. After significant financial stress in the
1970s due to excessive debt and unfunded pension liabilities, the institution’s president in
the case study claimed that the university’s financial performance had improved.
Through ratio analysis, Chabotar demonstrated how such claims could be verified using
financial ratios based on university financial statements.
Chabotar (1989) cautioned that ratio analysis is limited for drawing conclusions
on institutional financial condition and making comparisons with like institutions. When
Chabotar wrote his article in 1989, not-for-profit organizations did not have a set of
uniform accounting practices. The lack of uniform or standardized accounting practices
resulted in difficulty when comparing ratios among institutions. In fact, ratio analysis
could produce misleading results.
This disparity in accounting practices was mitigated with the adoption by the
Financial Accounting Standards Board (FASB) of Financial Account Statement (FAS)
116 and 117 in 1993, and FAS 124 in 1997. FAS 116, 117 and 124 went a long way in
improving the comparability of not-for-profit financial statements (FASB, 1993a, 1993b,
1995).
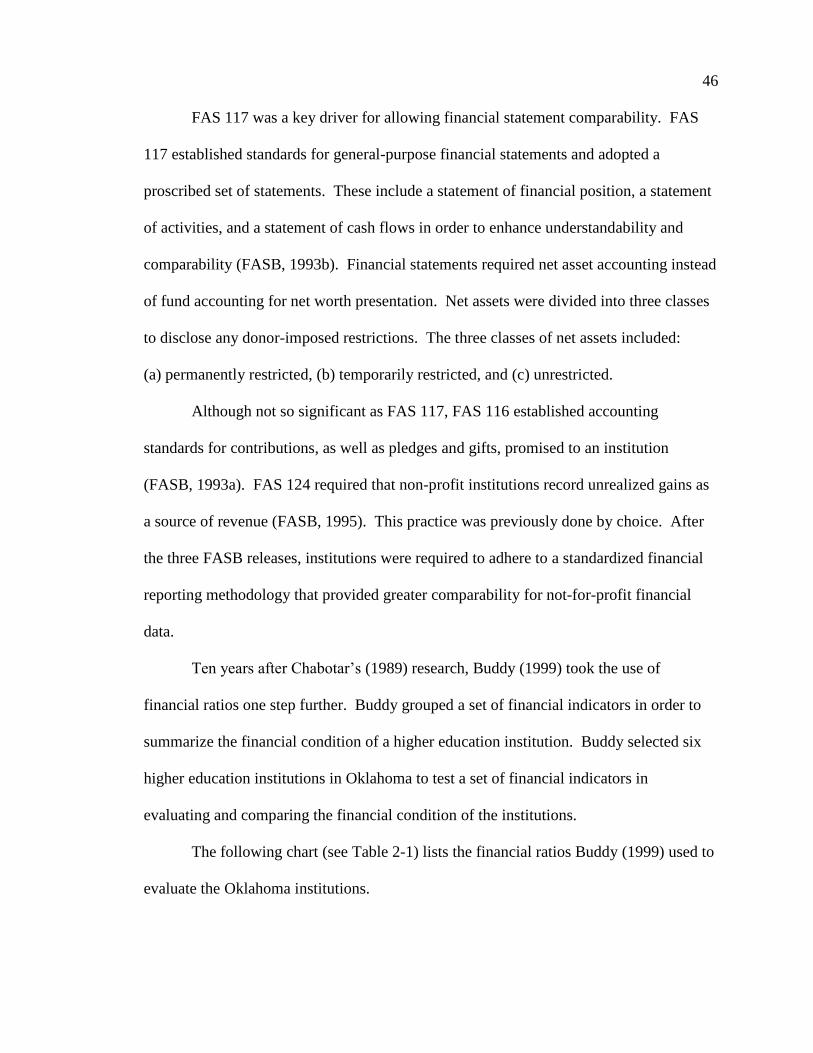
46
FAS 117 was a key driver for allowing financial statement comparability. FAS
117 established standards for general-purpose financial statements and adopted a
proscribed set of statements. These include a statement of financial position, a statement
of activities, and a statement of cash flows in order to enhance understandability and
comparability (FASB, 1993b). Financial statements required net asset accounting instead
of fund accounting for net worth presentation. Net assets were divided into three classes
to disclose any donor-imposed restrictions. The three classes of net assets included:
(a) permanently restricted, (b) temporarily restricted, and (c) unrestricted.
Although not so significant as FAS 117, FAS 116 established accounting
standards for contributions, as well as pledges and gifts, promised to an institution
(FASB, 1993a). FAS 124 required that non-profit institutions record unrealized gains as
a source of revenue (FASB, 1995). This practice was previously done by choice. After
the three FASB releases, institutions were required to adhere to a standardized financial
reporting methodology that provided greater comparability for not-for-profit financial
data.
Ten years after Chabotar’s (1989) research, Buddy (1999) took the use of
financial ratios one step further. Buddy grouped a set of financial indicators in order to
summarize the financial condition of a higher education institution. Buddy selected six
higher education institutions in Oklahoma to test a set of financial indicators in
evaluating and comparing the financial condition of the institutions.
The following chart (see Table 2-1) lists the financial ratios Buddy (1999) used to
evaluate the Oklahoma institutions.
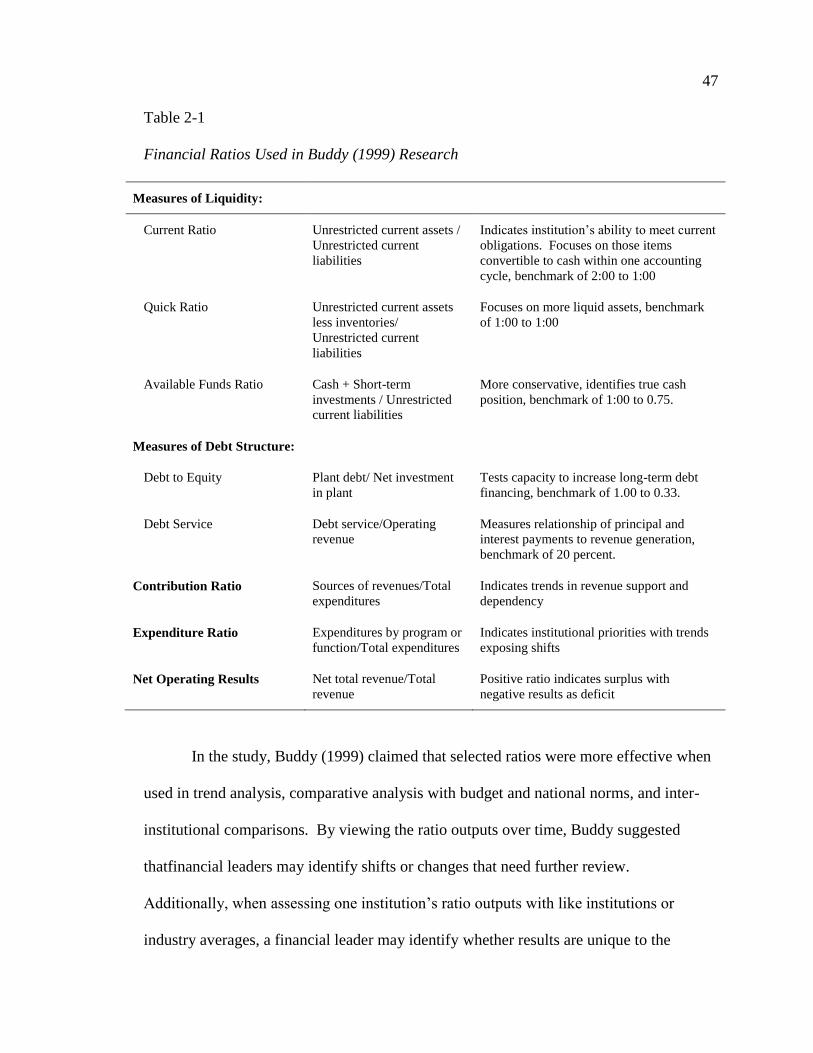
47
Table 2-1
Financial Ratios Used in Buddy (1999) Research
Measures of Liquidity:
Current Ratio Unrestricted current assets /
Unrestricted current
liabilities
Indicates institution’s ability to meet current
obligations. Focuses on those items
convertible to cash within one accounting
cycle, benchmark of 2:00 to 1:00
Quick Ratio Unrestricted current assets
less inventories/
Unrestricted current
liabilities
Focuses on more liquid assets, benchmark
of 1:00 to 1:00
Available Funds Ratio Cash + Short-term
investments / Unrestricted
current liabilities
More conservative, identifies true cash
position, benchmark of 1:00 to 0.75.
Measures of Debt Structure:
Debt to Equity Plant debt/ Net investment
in plant
Tests capacity to increase long-term debt
financing, benchmark of 1.00 to 0.33.
Debt Service Debt service/Operating
revenue
Measures relationship of principal and
interest payments to revenue generation,
benchmark of 20 percent.
Contribution Ratio Sources of revenues/Total
expenditures
Indicates trends in revenue support and
dependency
Expenditure Ratio Expenditures by program or
function/Total expenditures
Indicates institutional priorities with trends
exposing shifts
Net Operating Results Net total revenue/Total
revenue
Positive ratio indicates surplus with
negative results as deficit
In the study, Buddy (1999) claimed that selected ratios were more effective when
used in trend analysis, comparative analysis with budget and national norms, and inter-
institutional comparisons. By viewing the ratio outputs over time, Buddy suggested
thatfinancial leaders may identify shifts or changes that need further review.
Additionally, when assessing one institution’s ratio outputs with like institutions or
industry averages, a financial leader may identify whether results are unique to the
48
institution, are driven by external factors, or are experienced in general at a national level
in higher education. Buddy concluded that the results from the study justified attempts
“to bring the cause-and-effect ratio analysis from the business world into the higher
education arena” (1999, p. 63). The cause and effect ratios included 15 key financial
relationships where financial position would be the result of particular cause or causes.
The study found that five of the nine effect ratios and three of the six cause ratios could
be applied to the not-for-profit service industry for making policy decisions. The chart
(see Table 2-2) on the next page lists the ratios applicable to not-for-profits:
Table 2-2
Financial Ratios Used in Not-for-Profit Service Industry
Effects Ratios (5)
Current Ratio Can measure margin of safety in meeting current obligations and
ability to achieve institutional goals.
Current Liabilities to Net
Worth
Can measure operating freedom while high ratios may indicate greater
financial distress.
Total Liabilities to Net Worth Measures level of claim creditors have on the institution.
Receivables to working capital Represents dependence on receivables in working capital
Long-term Liabilities to
Working Capital
Measures extent of borrowing for current operations.
Cause Ratios (3)
Fixed assets to net worth Measures level of institution value invested in non-liquid assets.
Revenues to net worth Measures extent that current operating funds are supported by
institution’s value. High ratio may indicate stretching resources or
being highly leveraged.
Miscellaneous assets to net
worth
Indicates possible restriction on working capital or lost productivity if
high ratio.
49
While Buddy’s (1999) analysis discussed issues to consider in a cause and effect
relationship, it did not examine how such analysis is used to make meaning of the ratios,
or for strategic decision making by institutional leaders. Buddy explained that computing
the financial ratios was only a first step in analyzing financial position. Besides
quantitative ratio analysis, Buddy suggested adding nonfinancial performance data such
as enrollment trends to enhance understanding of institutional financial condition.
From the study results, Buddy confirmed that ‘no single measure captures the
“financial health” of an institution’ (1999, p. 13). Buddy did not address how such ratios
could form a composite index or be grouped for further analysis and meaning. Nor did
she indicate how such ratios could be presented to create greater meaning to further
strategic decision making.
In a study conducted by Lee (2008), financial health was assessed using a blended
ratio analysis. The survey queried 766 private colleges and universities to determine if
financial ratios provided discriminating capabilities in relationship to using a blended
group of ratios.
The study used the Composite Financial Index (CFI) developed by Prager, Sealy
& Co. and KPMG (2005). In its third edition on ratio analysis, Peat Marwick, now
KPMG, LLP, and Prager, Sealy & Co., LLC, (1995) focused on financial ratios for
private institutions. This effort resulted from the issuance of FAS 116, 117, and 124.
The new standards promulgated a shared meaning of accounting rules to be applied to
not-for-profit entities. KPMG (1995) proposed that a select few ratios could be blended
into a composite ratio to measure how well an institution was doing in achieving its goals
and mission.
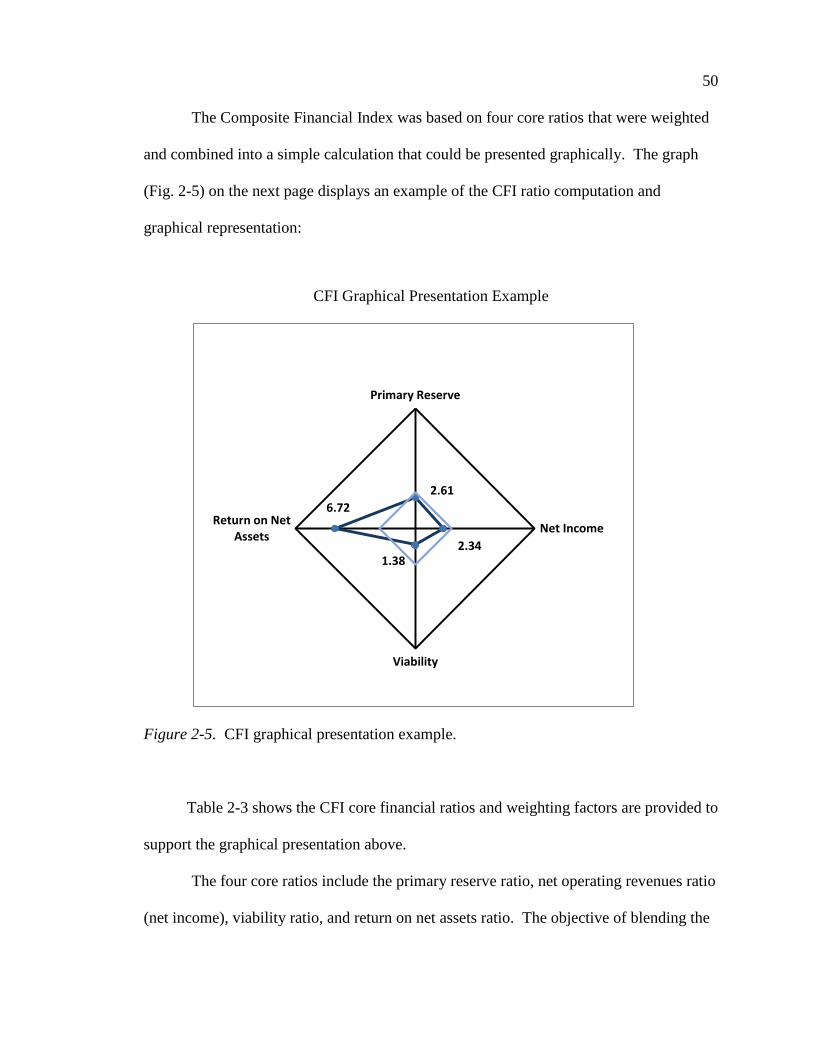
50
The Composite Financial Index was based on four core ratios that were weighted
and combined into a simple calculation that could be presented graphically. The graph
(Fig. 2-5) on the next page displays an example of the CFI ratio computation and
graphical representation:
CFI Graphical Presentation Example
Figure 2-5. CFI graphical presentation example.
Table 2-3 shows the CFI core financial ratios and weighting factors are provided to
support the graphical presentation above.
The four core ratios include the primary reserve ratio, net operating revenues ratio
(net income), viability ratio, and return on net assets ratio. The objective of blending the
2.61
2.34 1.38
6.72
Primary Reserve
Net Income
Viability
Return on Net Assets
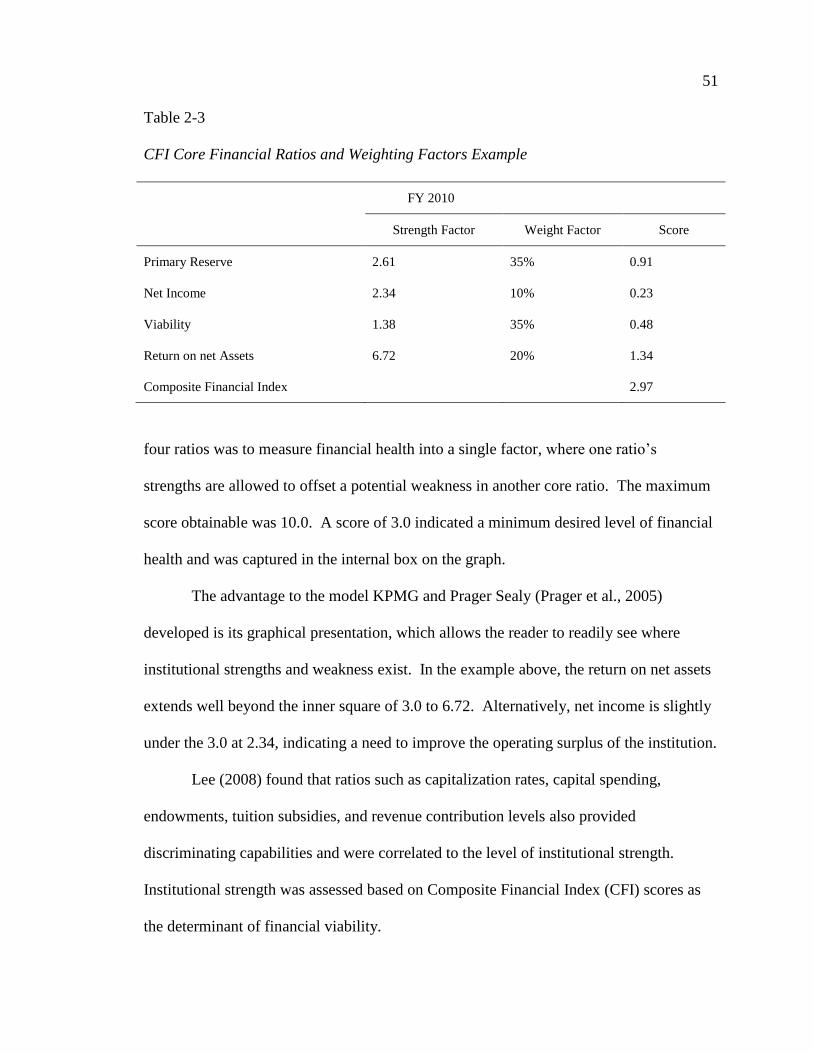
51
Table 2-3
CFI Core Financial Ratios and Weighting Factors Example
FY 2010
Strength Factor Weight Factor Score
Primary Reserve 2.61 35% 0.91
Net Income 2.34 10% 0.23
Viability 1.38 35% 0.48
Return on net Assets 6.72 20% 1.34
Composite Financial Index 2.97
four ratios was to measure financial health into a single factor, where one ratio’s
strengths are allowed to offset a potential weakness in another core ratio. The maximum
score obtainable was 10.0. A score of 3.0 indicated a minimum desired level of financial
health and was captured in the internal box on the graph.
The advantage to the model KPMG and Prager Sealy (Prager et al., 2005)
developed is its graphical presentation, which allows the reader to readily see where
institutional strengths and weakness exist. In the example above, the return on net assets
extends well beyond the inner square of 3.0 to 6.72. Alternatively, net income is slightly
under the 3.0 at 2.34, indicating a need to improve the operating surplus of the institution.
Lee (2008) found that ratios such as capitalization rates, capital spending,
endowments, tuition subsidies, and revenue contribution levels also provided
discriminating capabilities and were correlated to the level of institutional strength.
Institutional strength was assessed based on Composite Financial Index (CFI) scores as
the determinant of financial viability.
52
Lee (2008) referred to Brubacker’s (1979) daunting list of 300 usable ratios when
he noted that selecting the most pertinent and meaningful group of ratios can be
overwhelming for most college administrators. In his study, Lee (2008) identified
specific ratios to target specific emerging trends in higher education, such as the growth
in minority students, and to assess areas known to affect financial health such as usage of
debt and capital spending levels.
Lee (2008) used capital ratios to predict financially viable and non-viable four-
year not-for-profit colleges grouped by CFI results. Lee found that capitalization and
capital spending rates were significant predictors of financial viability. The capital
spending ratio measured the annual investment in capital facilities compared to the level
of annual depreciation expense. The higher ratio indicated that the institution was
investing and increasing the book value of property, plant, and equipment, compared with
the level of depreciation expense.
Lee’s (2008) realization in using the capitalization rate was the need to
disaggregate capitalization between financial net assets and physical net assets. Although
capitalization rates were found to be a significant indicator in predicting financial
viability, institutions with higher financial net assets were more likely to be financially
viable than institutions with higher physical assets to net assets. Without further analysis
into the type of capitalization, however, a misleading result may have been obtained.
This point of note demonstrates the complexity of ratio analysis in drawing accurate
conclusions.
Besides disaggregating the capitalization rate to ensure accurate financial ratio
outcomes and corresponding meaning, Lee (2008) suggested that different periods of
53
time may result in different findings due to the volatility of the investment markets, or the
cyclical rate of capital spending. While Lee described the potential caveats of drawing
conclusions from ratio analysis, he did not suggest how institutions may avoid any
misinterpretation of results through improved understanding or how to achieve a greater
understanding for strategic decision making.
While Lee used the CFI in his study to assess financial health, another similar
composite measure had been developed in the 1990s for use by the U.S. Department of
Education to assess institutional financial health. The U.S. Department of Education
ratio is known as the “Composite Score” and uses three ratios to measure financial health:
(a) the primary reserve ratio; (b) equity ratio; and (c) net income ratio. Based on a
weighting of the three ratios, the resultant composite score measures financial health. A
score of 1.5 or higher indicates financial responsibility. Scores less than 1.5 but 1.0 or
higher, require oversight. Scores less than 1.0 indicate that the institution is not
financially responsible and requires further action by the U. S. Department of Education
(e.g., cash monitoring and provisional certification to participate in Title IV programs).
In a recent article in The Chronicle of Higher Education (Blumenstyk & Richards,
2010), there were 149 not-for-profit institutions whose Composite Scores were less than
1.0, as measured using FY2009 financial data. The entire list of institutional scores is
available from the Federal Student Aid Gateway. Given the added financial stress on
institutions beginning Fall 2008 with the liquidity crisis and economic downturn, it is not
surprising that institutions that failed the test increased over the prior year, or 23 more
than 126 in FY2008.
54
The U.S. Department of Education uses the Composite Index to monitor over-all
financial health of higher education as an industry. The Higher Education Act of 1965 as
amended requires all for-profit and not-for-profit institutions to submit audited financial
statements to the U.S. Department of Education on an annual basis. The financial
statements are used as a basis to demonstrate institutional financially responsibility in
administering Title IV programs. From the audited financial statements, the U.S.
Department of Education computes an institution’s Composite Score. The U. S.
Department of Education uses the Composite Scores as an alert mechanism to monitor
actions it may need to pursue to ensure educational policy objectives are managed at a
national or state level.
Redenbaugh’s study (2005) explored the use of management accounting tools for
planning and cost control. Management accounting tools differ from financial indicators
because they function as an expanded multi-tiered financial ratio. An example is break-
even analysis or variance analysis, which leads more directly to strategic decision
making. In a break-even analysis, the potential revenues and expenses are charted on an
annual basis to determine the length of time required until revenues equal total expenses
and the program “breaks even.” Knowing this time length permits decision makers to
decide if the program should be implemented or if it is not financially viable and not to
be pursued any further. Financial ratios, on the other hand, need to be considered with
other ratios and even in a composite grouping to indicate a particular financial profile or
condition. Financial ratios do not lend themselves to strategic decision making as readily
as management accounting tools.
55
The purpose of Redenbaugh’s study was to understand the perceived usefulness
and effectiveness of management accounting tools and the potential or actual barriers to
their application in institutional management. A total of 400 chief financial officers of
Carnegie classification of Baccalaureate College-General and Master’s II institutions
participated in the study.
Redenbaugh (2005) found that financial officers did not use management
accounting tools to any great extent. Private institutions of higher education were found
to place greater emphasis on such tools than public institutions. Financial officers in
small private colleges and universities found variance analysis to be effective, while
financial officers with prior accounting experience in private companies or public
accounting firms used Return on Investment analysis for plant decisions and RCM
(Revenue Cycle Management) more so than did their non-profit counterparts.
The findings also indicated that the educational background of financial officers
and institutional characteristics were not correlated in the use of management accounting
tools. Professional certifications such as a Certified Management Accountant (CMA) or
Certified Public Accountant (CPA), as well as accounting experience either in a private
company or public accounting firm, however, were significant factors in the use of
management accounting tools.
Hiring qualified accountants with CPA designations in higher education has
become increasingly difficult. Most states increased the credit hour requirements from
120 to 150 credit hours in 2008. There is also increased corporate demand since the
passage of the Sarbanes-Oxley Act of 2004.
56
Besides such barriers to employing qualified accountants, there are also barriers to
using the management accounting tools in practice. Redenbaugh (2005) cited barriers
such as shortage of time and resources, culture of the institution, lack of interest,
competency of staff, and unwillingness to change.
In order to increase the use of management accounting tools by financial officers,
Redenbaugh (2005) proposed professional development and hiring experienced
accountants from private companies or public accounting firms. Additionally,
Redenbaugh suggested educating the board on the value in using such tools. In
addressing cultural reluctance to change, Redenbaugh recommended the financial officer
become a change agent in communicating the value of management accounting tools to
colleagues. Ultimately, Redenbaugh suggested that additional research was warranted to
explore this apparent disconnect between perceived value as a decision-making tool and
lack of use by financial officers.
Prinvale (1992) focused her study on strategic planning in higher education. She
wanted to understand how formal planning can support positive change as measured by
financial ratios. Prinvale focused on three areas in her quantitative study: (a) lack of
clarity in defining what was meant by strategic planning; (b) effectiveness and efficiency
in using strategic planning; and (c) correlation between decision making in higher
education with that of strategic planning.
The goal of the research was to test the hypothesis that improvement in the
financial condition of an institution was not affected by institution-wide strategic
planning efforts. The study included 873 four-year private colleges and universities in
57
the United States. The independent variable was institution-wide strategic planning and
the dependent variables are noted next to the following financial ratios:
total assets to total liabilities (financial strength),
endowment income to total educational and general revenues (financial
independence),
tuition and fee revenues to total educational and general revenues (tuition
dependence), and
unrestricted funds balances to total educational and general expenditures
plus mandatory transfers (liquidity).
Study results indicated no significant predictive ability when strategic planning
was regressed on each financial ratio examined. There were no statistically significant
differences in average percent changes in fiscal condition between those that had
institution-wide strategic planning and those that did not. An interesting finding
indicated that the level of involvement in institution-wide planning was somewhat high
for senior level administrators but not for faculty. Similarly, 80% of institutions reported
that their senior management and boards agreed strongly that planning should be
conducted, while only 40% of their faculty agreed strongly. Involvement in the planning
process was especially low among faculty members, due in part to planning being too
time-consuming. Another discovery was that planning was not incorporated into the
internal structure and process of the institution.
There was evidence that the lack of predictive ability probably was related to a
“mismatch of assumptions concerning decision-making behavior” (Prinvale, 1992, p. x).
That mismatch appeared in the different goals a postsecondary administration and its
58
faculty had with institutional performance a goal of the administration, versus scholarship
and new learning as goals of the faculty.
Advocates for strategic planning in Prinvale’s (1992) study argued that such
activity benefits an organization through its improved financial condition. Involvement
in the planning process by participating faculty members was regrettably low, which
Prinvale attributed to the existence of conflicting goals in higher education (Prinvale,
1992). Administrators focused on “bottom line” solvency regardless of their area of
specialty (i.e., student services, finance, building and grounds, physical plant, academics),
with faculty persons displaying loyalty to their disciplines rather than to an institution as
a whole. Furthermore, within disciplines there was variation among faculty members,
with some projecting the view that it was more important to consider the local
neighborhood (institution and community), while others sought to advance a national and
international reputation. Thus the Prinvale study began with a faulty assumption that all
members of the faculty supported the belief that institutional goals took priority.
Prinvale’s (1992) study was conducted at a time when strategic planning was
beginning to be in vogue in higher education. There was limited if any consideration
allocated to measurable outcomes and promotion of change and financial health of an
institution. The author did not explore how financial ratios could be used to overcome
the mismatch of conflicting goals between the administration and faculty and improve
financial condition.
In another study, DeLegge Grandgenett (2007) investigated whether relationships
existed between strategies deployed at small not-for-profit private institutions and
financial performance as measured by the CFI score. In a longitudinal study from 1998
59
to 2005, DeLegge Grandgenett tested hypotheses of relationships between institutional
strategies, leadership and governance, innovative strategies, and financial performance.
Strategies were the independent variables, while financial performance was the
dependent variable.
The quantitative phase of the study used the survey instrument Small Institution
Survey Inventory (SISI) to identify and rank the extent to which institutional leaders
deployed specific strategies. The longitudinal study included institutions with 200 to
2,999 students in the Midwest. Where the Chief Financial Officer (CFO) position had a
new incumbent, the institution’s president was asked to complete the survey.
The purpose of the study was to explore relationships among strategies including
enrollment management, and curriculum and instruction on institutional financial
performance. From the 161 institutions that participated in the study, findings did not
indicate relationships among changes in strategies and external factors and change in
financial performance in the CFO score.
While all institutions in the sample reported changes in strategies, financially
stronger institutions changed strategies the least. This finding supported earlier research
by Kraatz and Zajac that found institutions less likely to react strategically to competitive
pressures if they had stable resources and better reputations.
DeLegge Grandgenett (2007) noted that a limitation of the study was the lack of
adequate time to capture any relationship from strategic planning to effect institutional
change. The findings also indicated insufficient evidence to conclude that any particular
strategy or external factor affected financial performance.
60
DeLegge Grandgenett (2007) proposed further research to determine if
insufficient resources, “historical academic inertia,” ineffective governance models, or
out-of-date consultant recommendations guided the strategies chosen (p. 164). This
implied that the strategies selected were ineffective in improving financial performance
rather than any lack of institutional commitment in carrying out the strategy.
A case study conducted by Talboys (1995) examined the fiscal health of four
private religious universities in the Southwestern United States through the use of
financial ratios. The author related the use of specific financial ratios to strategic
planning and the subsequent allocation of resources. The ratios chosen for the study were
selected because of their computational ease and readily available data.
The ratios focused on areas with the most impact on institutional performance,
such as enrollment growth, as well as financial health over the long-term. The following
chart (see Table 2-4) lists those ratios Talboys (1995) selected for the case study.
Talboys (1995) used the ratios to assess financial health from a historical
perspective noting that such indicators cannot predict future performance. As a
limitation, Talboys noted that ratios need to be considered in context with the entire
institutional environment, as well as on a comparative basis with similar institutions and
industry averages.
Talboys (1995) explained that ratio analysis should readily allow institutional
leaders to “easily see the answers to simple questions about the financial standing of the
institution” (p. 16). To support ratio analysis, the presentation of data should be
organized to be useful to decision makers as well as descriptive of the “financial story” of
the institution.
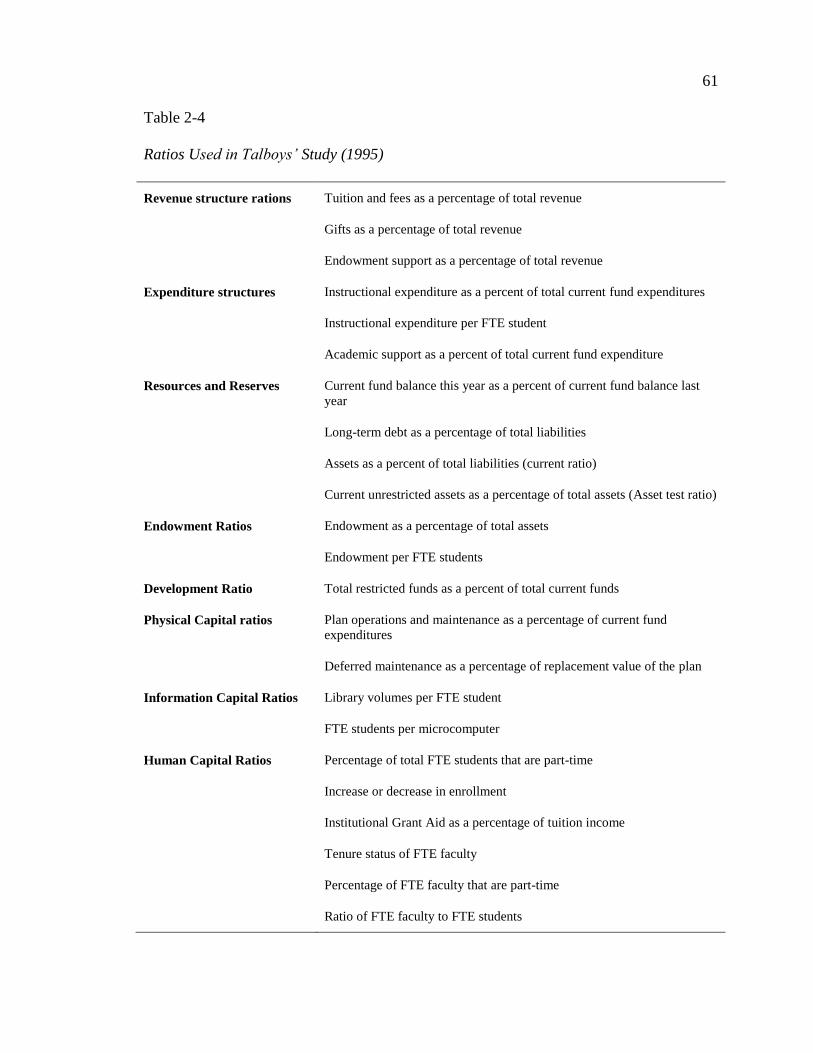
61
Table 2-4
Ratios Used in Talboys’ Study (1995)
Revenue structure rations Tuition and fees as a percentage of total revenue
Gifts as a percentage of total revenue
Endowment support as a percentage of total revenue
Expenditure structures Instructional expenditure as a percent of total current fund expenditures
Instructional expenditure per FTE student
Academic support as a percent of total current fund expenditure
Resources and Reserves Current fund balance this year as a percent of current fund balance last
year
Long-term debt as a percentage of total liabilities
Assets as a percent of total liabilities (current ratio)
Current unrestricted assets as a percentage of total assets (Asset test ratio)
Endowment Ratios Endowment as a percentage of total assets
Endowment per FTE students
Development Ratio Total restricted funds as a percent of total current funds
Physical Capital ratios Plan operations and maintenance as a percentage of current fund
expenditures
Deferred maintenance as a percentage of replacement value of the plan
Information Capital Ratios Library volumes per FTE student
FTE students per microcomputer
Human Capital Ratios Percentage of total FTE students that are part-time
Increase or decrease in enrollment
Institutional Grant Aid as a percentage of tuition income
Tenure status of FTE faculty
Percentage of FTE faculty that are part-time
Ratio of FTE faculty to FTE students
62
The author (Talboys, 1995) found that basic financial data needed for routine
planning often was unavailable and that financial information provided to trustees and
decision makers was too complicated, out-of-date, or lacked a consistent format. Talboys
proposed a simplified presentation for a ready understanding of financial data. A
combination of indicators was identified that presumably provided the most accurate
assessment of an institution’s financial condition. However, the study concluded that
institutional diversity precludes a simple, standardized use of ratio analysis and instead
must be selected based on the specific characteristics of the institution under review.
Summary
Over the past 40 years, the use of financial indicators in higher education has
developed and expanded. The U.S. Department of Education uses a Composite Score to
measure financial health and gauge institutional responsibility regarding Title IV funds.
Institutions can also use such composite ratios, or access the variety of individual ratios
to manage institutional viability. There does not seem however to be consensus on how
best to use such financial ratios, or on their value to decision makers.
As accounting standards have been refined and reformed, a major hurdle to using
financial ratios for comparative purposes has been lessened. With the standardization of
accounting principles in 1995, financial data is more readily comparable among non-
profit private institutions in higher education. Based on the annual audited financial
statements, such data is also readily available.
Using the data for strategic decision making, however, seems to be impeded by a
number of assumed variables. These include the complexity and number of financial
ratios, the limitation of resources available to support use, the lack of interest,
63
understanding, or shared use among financial officers in higher education, and finally
some indifference to the usefulness of application. None of these variables seems to have
been researched to the point of any significant and actionable findings. This study seeks
to examine the use of financial indicators in decision making so as to aid their use or
expel the myth of their value.
64
Chapter III
Methodology
Overview
This chapter describes the research methodology that was utilized in the research
study. Included is a discussion of the research design, site and sample selection, role of
the researcher, data collection, managing and recording data, ethical considerations, data
analysis, credibility, and verification in conducting the study.
Research Design
According to Creswell, “We conduct qualitative research when we want to
empower individuals to share their stories” (2007, p. 40). Additionally, qualitative
research allows the researcher to “understand the contexts or settings in which
participants in a study address a problem or issue” (Creswell, 2007, p.40). The researcher
used a qualitative multiple case study design to answer the primary and supporting
research questions. This served to explore how institutional leaders use financial
indicators in strategic decision making, as well as to inform their governing boards of the
institution’s financial health.
The primary research question or “grand tour question” asked, “Do small private
colleges and universities in the Midwestern United States gather data, including financial
and key performance indicators?” To explore the primary research question in greater
depth, the researcher added the following two supporting questions in the study:
(a) What financial and key performance indicators do institutions gather and how do
institutional leaders use this data to inform strategic decision-making? and (b) How do
65
small private colleges and universities create awareness and understanding from financial
and key performance indicators?
The researcher selected the case study design for the study in order to obtain an
in-depth understanding of the situation, since the interest is in process and context instead
of outcomes and confirmation (Merriam, 1998). Case study design allows the researcher
to explore the problem “through one or more cases within a bounded system” (Creswell,
2007, p. 73). Each institution selected for the study represented a case or “portrait” to
allow the researcher a representation and understanding of the phenomenon (Merriam,
1998). According to Merriam (1998), “the more cases included in a study, the more
compelling an interpretation is likely to be” (p. 40). Using a multiple case study
approach allowed the researcher to compare and contrast her findings between
institutions and between key financial leaders at each institution using cross-case
analysis.
The case study methodology used for the research study was both descriptive and
interpretative. The case study design provided the researcher access to explore a detailed
account of the phenomenon as well as suggest relationships between variables in order to
construct theory. Interpretive case studies are also known as analytical case studies based
on their complexity, depth, and theoretical orientation (Merriam, 1998, p. 39; Shaw,
1978). Important in case study design is the recognition that context is inseparable from
the phenomenon’s variables (Yin, 1994). Through intensive descriptions, the researcher
can explore the variables and settings in a much more intimate manner.
The descriptive nature of a case study also allowed the researcher to capture the
personalities that influence the phenomenon. The researcher conducted telephone
66
interviews with each institution representing a case in the research study, and each of the
three key individuals interviewed from each institution as subcases. As anticipated prior
to the study, the researcher found a level of commonality in the cases selected in how
institutional leaders manage financial health (Nagy Hesse-Biber & Leavy, 2011).
While the case study design provided the researcher the depth of study desired,
the researcher also understood the limitations of case study research. Because case
studies focus on a single or limited number of cases, case studies can oversimplify or
exaggerate the phenomenon as the sample size is limited and only a small part of the
whole is under investigation. The limited scope of case studies also reduces the
generalizability of the study. By using a multiple case study, the researcher employed a
cross-case analysis to aid in improved generalizations about institutional leader’s use of
financial indicators in strategic planning (Merriam, 1998). The use of multiple cases also
enhanced the external validity or generalizability of findings and served to mitigate an
oversimplification or exaggeration of the phenomenon (Merriam, 1998).
Alternatively, Erickson found that the goal of interpretive research is not
generalizability, but instead for the researcher to apply specific findings from a particular
situation to a similar situation thereafter (Merriam, 1998). This is analogous to applying
learned behavior to support and improve future experiences. Merriam explained that the
application of learned behavior is how people “cope with everyday life” (1998, p. 210).
Although interested in discovering generalizations of how institutions may use financial
indicators for strategic decision making, the researcher was also interested in developing
a set of best practices that can be transferred to other private institutions and “support and
improve future experiences” towards financial health.
67
Besides the lack of generalizability, another weakness in case study design is the
potential effects from researcher bias. Bias results from researcher subjectivity and can
reduce the level of rigor in the quality of case study research. At its worst, researcher bias
can distort data findings during the observation, collection, and interpretation of data
resulting in inaccurate conclusions. During the study, the researcher consciously strove
to set aside preconceived ideas and understandings during data collection and while
interpreting results to protect the accuracy of the data. At the same time, the researcher’s
personal filters as a financial officer at a small, private institution enhanced her
understanding of the data collected and expanded her ability to merge findings.
The time and effort required of the researcher to conduct case study research can
be both time consuming and costly. With a multiple case study, the time and effort
required to conduct the study increases commensurate with the number of cases selected.
The use of telephone interviews allowed the researcher to collect a thick, rich description
of the phenomenon and provide meanings and intentions for context while minimizing
time and costs associated with in-person, on-campus interviews (Gall, Gall, & Borg,
2003).
Site and Sample Selection
In this multi-case qualitative study, two phases provided the funnel for the
researcher to identify and study in depth a select group of institutions. First through an
online survey, financial officers at 214 small, private institutions (N = 214) in the
Midwestern United States were surveyed on their level of use of a variety of financial
indicators. The second phase was based on responses obtained from the survey tool
68
where institutional leaders self-identified their use of financial indicators in strategic
decision making and to inform their governing boards of institutional health.
In order to first identify institutions that purported to use financial indicators in
decision-making, the researcher used an on-line survey tool. An online and web-based
survey was chosen as it provides ready access to a population. Additionally, results can
be captured in real-time as respondents complete surveys 24/7.
The survey population was obtained using the benchmarking service provided by
the Association of Governing Boards (AGB). Included in the population were private
institutions with enrollments of 4,000 or less FTE (full-time equivalent), with long-term
investments of less than $100 million, which were located in the Midwestern United
States as defined by the North Central Association region of the Higher Learning
Commission (HLC). The North Central Association region includes 19 states: Arkansas,
Arizona, Colorado, Iowa, Illinois, Indiana, Kansas, Michigan, Minnesota, Missouri,
North Dakota, Nebraska, New Mexico, Ohio, Oklahoma, South Dakota, Wisconsin, West
Virginia and Wyoming. Based on the AGB benchmarking service, the population list
resulted in 214 institutions (see Appendix B). Institutions that are under special
monitoring by the HLC were excluded from the sample (Higher Learning Commission,
2011).
The names and contact data for the financial officers of the 214 institutions such
as e-mail address and phone number were identified in the 2011 Higher Education
Directory (Burke & Rodenhouse, 2011); a resource listing all institutions in the United
States and their respective officers. This total excluded Aurora University since the
69
researcher was employed as its Vice President for Finance (although the university met
the selection criteria).
The survey tool was developed based on the literature and specifically Talboys’
(1995) study of financial ratio use in examining institutional health. The researcher used
the application software Qualtrics, as provided by the University of Nebraska – Lincoln,
to conduct the online survey. The draft survey tool was reviewed by two financial
experts for clarity and understandability of questions as well as ease of use and question
flow. One financial expert was a current president at a small private institution in the
Eastern United States. The president was an expert in financial management in higher
education and has done substantial research on the subject. The second financial expert
had been a vice president for finance at a small private institution in the Eastern United
States. He was currently a senior consultant with the Association of Governing Boards
and recently wrote a booklet on Audit Committees structures and best practices.
Both experts provided feedback on the clarity and flow of the survey tool, added
questions that may be informative to the study, and tested the survey as it appeared in
Qualtrics. The first financial expert suggested the researcher “probe” respondents as to
why they may not use financial indicators, and when used, whether financial indicators
are linked to strategic priorities within a strategic plan.
The second financial expert also had a number of valuable comments and
suggestions. Regarding questions on physical capital, he suggested the researcher use
“Age of Facilities” instead of deferred maintenance as a percentage of replacement value
due to ease of calculation. He also noted that Information Capital metrics are less
relevant in an age of digital information. Accordingly, the researcher removed questions
70
related to Information Capital. Questions regarding net revenue analysis were added,
along with an open-ended question on Key Performance Indicators to assess their
utilization by financial officers. Finally, the second financial expert thought that having a
check-off list would provide a higher response rate in considering financial indicators
instead of having a completely open-ended question format.
The researcher revised the survey tool based on the comments received from the
two financial experts, who later were asked to review the revised survey and offer final
comments. The link to the survey tool in Qualtrics was shared with them so they could
review the online survey tool. After review, the first financial expert noted that any
special instructions or deadlines should appear in a prominent location within the survey.
The second financial expert suggested revised wording on the question regarding
instructional expense, and question flow improvements. The final of the on-line survey
questionnaire is included in Appendix H.
A pre-notice communication was e-mailed February 7, 2012 (Appendix C) to the
financial officers of each institution in the population. The researcher used her student
e-mail account at the University of Nebraska - Lincoln (UNL), and included contact
information for both the researcher as primary investigator and her advisor as secondary
investigator to add a level of trust and professionalism to the on-line survey and as
required by the Institutional Review Board (IRB) of UNL.
A second e-mail went on February 14, 2012 that included a survey invitation
(Appendix D). The invitation explained why the financial officers and their institutions
were selected and why they should participate in the survey. The financial officer
(participant) was notified of the estimated time it might take to complete the survey and
71
of the fact that responses would be kept confidential. The communication also provided
the contact information of the researcher as primary investigator and advisor as secondary
investigator, and closed with a statement of sincere appreciation to enlist respondent
participation. A brief e-mail reminder was sent on February 28, 2012 (Appendix E). A
final notice was sent to non-respondents to notify them that the online survey would close
effective March 14, 2012, essentially one month after the survey was first opened to
respondents.
From a population of 214, 87 financial officers (n = 87) or 40.7% responded to
the survey. Using purposeful sampling, the researcher chose 6 institutions to study in
depth from the responses of these financial officers. Two key questions in the online
survey prompted financial officers to self-identify their use of financial indicators. From
the survey, 31 respondents shared examples of how they used financial indicators in
strategic decision making.
The six institutions were selected based on the example of use of financial
indicators as provided in questions #19 and #20: “Do you have an example that
demonstrates how you have used financial indicators and/or ratios in setting strategic
priorities and/or in making strategic decisions?” and “Please fully explain your example
of how you have used financial indicators in strategic decision making.” Of the 31
respondents to questions 19 and 20, only 15 indicated they would be willing to participate
in Phase II of the study, 8 would not, and 8 were unsure.
The researcher reviewed the 31 responses and selected 6 institutions as
compelling examples to study in greater depth. The researcher wanted to obtain a
minimum of 5 institutions for Phase II of the study. Given 5 institutions, the researcher
72
intended to obtain a thick, rich description of the phenomenon and “saturate” the
categories or themes that were discovered (Creswell, 2007; Hatch, 2002). As she
conducted interviews, the researcher found that she accomplished this goal, as interviews
did not provide further insight into the categories but only served to confirm findings
already obtained from other respondents (Creswell, 2007).
The researcher selected six institutions instead of five, however, in case one
institution decided to opt out of the research study. Of the six institutions selected, five
had indicated in the survey they would be willing to participate, with one respondent
unsure. The researcher sent a request to each institution’s financial officer requesting
their participation. The recruitment letter sent to the institution’s financial officer is
included in Appendix F.
A week after the recruitment letter was sent, the researcher contacted the
institution’s financial officer to discuss any questions or concerns, as well as to confirm
participation. The researcher reiterated that confidentiality would be maintained, that
specific institutional names would not be used in the study, and that data would not be
made available to other study participants. The respondent, who was originally unsure of
their participation agreed to participate after confirming that all shared data would be
held in complete confidence. As the study progressed, the researcher found that
confidentiality was a critical factor with respondents.
From the beginning of the study, one goal was to formulate a series of best
practices that other financial officers at small private institutions in the Midwestern
United States could implement at their own institutions. Alternatively, the researcher
hoped to understand how financial officers successfully addressed barriers discussed in
73
the literature review that prohibit the use of financial data in strategic decision making,
such as lack of time and resources, level of interest, unwillingness to change, culture of
the institution, and competency of staff (Redenbaugh, 2005).
The researcher desired a response rate from the online survey that was
representative of the distribution of small private institutions amongst the nineteen states
included in the North Central Region of the Higher Learning Commission. Additionally,
the researcher hoped that the institutions that were selected for the qualitative phase of
the study reflected the participant pool in terms of state representation and even gender.
Included in Appendix B is an analysis of participation by state that shows the total
population, number of respondents and non-respondents, and percentage of participation.
The data are shown both in a chart and in graphical formats. Responses for the most part
were greater in states with larger populations of small private institutions, (Ohio, Illinois,
Iowa, and Michigan having the greatest numbers of institutions, with 30, 25, 20, and 19
institutions, respectively). Participation rates were also high (except for Michigan at
43.3%, 56.0%, 40.0% and 21.1%, respectfully). The average participation rate over all
was 40.7%.
The map on the next page (Fig. 3-1) highlights the area of the North Central
Region of the Higher Learning Commission in the United States. The number of small
private institutions and the response rate for the online survey are shown by state, with
the numerator representing participants, and the denominator representing the state’s
population of small private institutions. The notation of a star within a state indicates
those institutions selected for in-depth study.
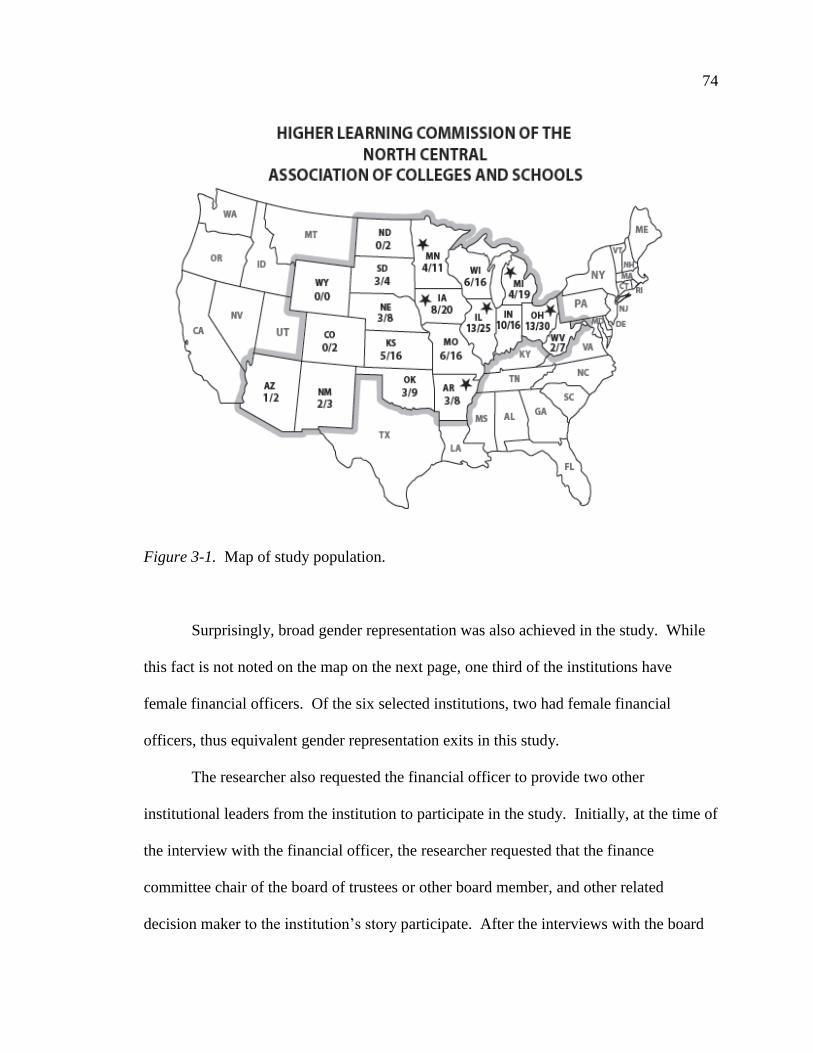
74
Figure 3-1. Map of study population.
Surprisingly, broad gender representation was also achieved in the study. While
this fact is not noted on the map on the next page, one third of the institutions have
female financial officers. Of the six selected institutions, two had female financial
officers, thus equivalent gender representation exits in this study.
The researcher also requested the financial officer to provide two other
institutional leaders from the institution to participate in the study. Initially, at the time of
the interview with the financial officer, the researcher requested that the finance
committee chair of the board of trustees or other board member, and other related
decision maker to the institution’s story participate. After the interviews with the board
75
members, the research requested interviews with institutional presidents as the “bridge”
between the administration and governing board perspectives.
After confirming the additional participants from each institution, the researcher
sent an Informed Consent letter to each participant (Appendix G) along with the
Interview Guide. The Informed Consent letter was slightly revised from the initial letter
to the institution’s financial officer since the financial officer had agreed to participate in
the study and recommended the researcher contact the additional participants in the
study. The revised letter confirmed the institution’s participation and notified the
additional institutional leaders that they were recommended for inclusion by their
institution’s financial officer.
Before all interviews occurred, the researcher obtained unobtrusive data as shown
in Appendix H that was available either on the institution’s website or other public data
bases. During interviews with the respondents, further data were obtained relative to the
discussion. For example, formal PowerPoint presentations made by the financial officers
to their institution’s governing board on ratio analysis were received from participants.
Also, the researcher accessed the most recent Form 990 “Information Return for Not-for-
profit Institutions” as available using GuideStar.org. GuideStar is an on-line database
resource for philanthropic information that provides a variety of not-for-profit financial
data including the Form 990 (GuideStar.org).
By having some data in advance, the researcher had a greater awareness and
understanding of the institution to form a context for probing questions during the
telephone interviews. The various documents requested as shown in Appendix H include
financial reports, board committee meeting agenda and materials, and any related
76
presentation materials shared by financial management with board members that
discussed financial ratios.
Role of the Researcher
The researcher acted as the primary instrument in the research study and
conducted the interviews, performed data collection, and analyzed and summarized the
findings. The researcher currently is employed at a small, private institution in the
Midwestern United States as the Vice President for Finance and Treasurer of its board of
trustees. As an insider to the subject being explored, the researcher informed participants
of her current position and how measures would be taken to ensure confidentiality of the
data collected. In her professional life, the researcher works under a standard of strict
confidentiality in managing the financial affairs of an institution and assured participants
that she would apply these same standards in conducting the research study; data would
not be shared with the public, between institutions participating in the study, or even
within institutions between the three institutional leaders to promote openness with the
researcher.
Data Collection
According to Creswell, data collection in a case study “builds an in-depth picture
of the case” (2007, p. 132). In order to gather sufficient data in which to develop a
detailed account of the phenomenon being studied, the researcher used unobtrusive data,
semi-structured interviews, and personal journaling (Creswell, 2007). Each source of
data provided further understanding of the research problem and together allowed the
researcher greater insight into the phenomenon.
77
Prior to telephone calls, publicly available unobtrusive data was gathered on
behalf of each institution. The researcher requested specific data from each institution
during the interview mainly with the institution’s financial officer. Unobtrusive data
included such items as financial reports and records, PowerPoint presentations made to
the Board of trustees, and minutes and materials from Board committee and full Board
meetings. A list of various documents requested in the study is included in Appendix H.
Unlike data obtained during personal interviews, unobtrusive data is not modified
or altered by the filters and perceptions of the participants. According to Hatch, such
documents provide a sense of history and context, and are “powerful indicators of the
value systems operating within institutions” (2002, p. 117).
Besides unobtrusive data, the researcher used semi-structured, telephone
interviews for data collection. For each institution, three key financial decision makers
were interviewed including the president, chief financial officer, and finance committee
chair or other board of trustee member. In one case, the institution’s provost was
included as intrinsically key to the specific use of financial indicators in strategic decision
making at that institution. Creswell recommends selecting participants who “are not
hesitant to speak and share ideas” and for the researcher to conduct the interviews in a
space conducive to such open discussion (2007, p. 133). By including participants most
knowledgeable in the use of financial indicators at the institution, and providing
assurance of complete confidentiality, the researcher was able to promote the “space”
Creswell recommends.
During the interviews, the researcher used specific guiding questions that were
flexible enough to invite participants to share how they make meaning of their social
78
worlds and how they organize their cultural knowledge (Hatch, 2002). The researcher
developed an interview guide preliminarily based on her professional knowledge of the
subject and from the literature as shown in Appendix J. The interview guide consisted of
a list of questions to ask in the interview based on four question types: essential, extra,
throw-away, and probing questions (Berg, 1998).
The essential questions targeted the central focus of the research study and
generated key data of the study (Merriam, 1998). Extra questions explored similar focus
but used an alternative approach to the subject. Throw away questions frequently start an
interview and can obtain basic demographic data as well as increase dialogue between the
investigator and the respondent. The researcher chose to explore the respondents’
financial backgrounds and how their relationships with their institutions began. Probing
questions are difficult to define prior to the interview but arose as part of the discussion
and created greater flexibility for exploration by the researcher.
In order to test the interview guide, Merriam recommends a “ruthless review” of
questions by the researcher in order to refine the proposed questions (1998, p. 79). The
researcher answered the questions as if an actual respondent in the study in order to
assess the reasonableness and appropriateness of the questions given the research
problem. Besides a ruthless review, the researcher used pilot interviews to test the
questions to evaluate the clarity and understandability of the questions, to determine
whether the questions yield useless data, and to find if there were questions the researcher
may not have considered for inclusion in the interview guide (Merriam, 1998).
The pilot interviews were conducted in the winter 2011/12 with two financial
management experts in higher education. Each expert was interviewed in-person as if an
79
actual participant in the study to vet each question carefully. The experience was
debriefed contemporaneously with each expert during the interview as each question was
considered. This provided an opportunity for the researcher to improve and clarify the
questions, to enhance flow of the dialogue by question placement, and to improve a
shared understanding of the language of each question and avoid unnecessary use of
financial and higher education jargon. The experts were retired financial executives
and/or board members in higher education. One expert was a retired financial and senior
corporate executive as well as finance committee chair of a small private university. The
second expert had recently retired after 19 years as senior vice president and CFO of a
private university in the Midwestern United States.
Actual interviews with case study participants were conducted in the spring of
2012. The researcher interviewed the institution’s financial officer, a member of the
board of trustees, the president, and in one case the academic officer involved in the
specific use of financial indicators in decision-making. Interview strategies involved
30 minute to 1-hour interviews that were audio-taped and transcribed. The researcher
asked probing questions in order to gain a richer understanding of the participant’s views
of using financial indicators in strategic decision making and in educating the governing
board to support informed decisions. Probing questions ask for more details and
clarification and can be explored through silence, a single word, or even a simple sound
(Merriam, 1998). (The preliminary interview guide is included in Appendix J.)
Merriam (1998) noted that the value an investigator brings to the interview
process is in part based on the knowledge of the investigator to ask meaningful questions
that are understandable by the participant. Based on the researcher’s experience as the
80
feature editor of her college newspaper and professional experience interviewing job
applicants, the researcher has developed sensitive skills in the art of interviewing. In the
proposed study, the researcher acted as the primary instrument of data collection and
benefited from her experience and skills in interviewing.
Managing and Recording Data
Privacy measures were conveyed in the Informed Consent Letter sent to each
participant prior to the interview session. (The Informed Consent Letter is included in
Appendix G.) The techniques the researcher used to ensure that all data collected
remains confidential were explained in the letter and again at the time of the interview.
Participants were asked for their oral approval at the start of the interview to allow the
researcher to audio-tape the interview. The researcher assured participants that she
would protect the identities of the participants as well as the names of their institutions
throughout the study. Position classifications however have been referred to in order to
add context to the perception from which the participant’s experience is drawn, such as
financial officer, president, and trustee.
It is important that the participants respond voluntarily and all data is kept
confidential at all times. Such confidentiality is critical as it promotes openness during
the interview between the participant and researcher. During qualitative research studies,
it is not unusual to develop close relationships with participants. According to Hatch
(2002), “we ask participants to reveal what goes on behind the scenes in their everyday
lives” (p. 65). At the end of the interview, the researcher reminded participants that data
will be securely maintained until destroyed two years after completion of the study.
81
Specifically, all data were to be stored in a metal cabinet housed in the
researcher’s work office and locked when not in use. Coding was to be used to obscure
identification of participants, and the code retained by the researcher. Data collected
from the study were to be safeguarded until the study is complete. Preservation of the
information was to be maintained for purposes of presenting it to the professional
community but only in aggregate form; no individual or institution was to be identified.
The researcher considers these steps to be effective in protecting the identities of the
participants and their institutions and in ensuring confidentiality.
Ethical Considerations
The researcher secured Institutional Review Board (IRB) approval from the
University of Nebraska-Lincoln prior to initiating any aspect of this study. An expedited
review process was received as anticipated by the researcher, as the study hold no
apparent risk to participants and confidentiality of respondents was to be maintained
(Hatch, 2002).
The researcher is “sensitive to ethical considerations” to conduct responsible
research (Hatch, 2002, p. 44). A number of studies have had major lapses in ethical
considerations leading the Federal government and a number of professional social
science associations to establish codes of ethics to protect the welfare of human subjects
(Tashakkori & Teddlie, 2003). Accordingly, the researcher endeavored to uphold ethical
standards in protecting the privacy and confidentially of the participants and research
sites as required by the UNL IRB protocol.
82
Data Analysis
The researcher analyzed the qualitative data using an iterative process. Coding
continually occurred throughout the researcher’s gathering of data, review of transcribed
tapes, and multiple readings of each transcription until the researcher identified several
emergent themes related to the research questions.
The audio-taped interviews were transcribed verbatim by a paid transcriptionist.
The transcriptionist signed a confidentiality agreement to protect the privacy of the data
and identity of the respondents and their institutions (Appendix L). Transcriptions were
compared with the audio-taped interviews to ensure accuracy. The researcher reviewed
the transcriptions multiple times, line-by-line, using an open-coding system. The
transcribed interviews were analyzed for recurrent themes, concepts, and events (Ruben
& Rubin, 2005). The researcher created a table from the transcriptions using Excel
spreadsheet software. This facilitated the researcher’s repeated “combing” of the data
sources until conclusions were reached on the qualitative data. Actual coded
transcriptions are not included as an appendix to the study in order to protect the
confidentiality of each institution and respondent.
The researcher looked for similarities in themes between institutions and between
interviews for the same institution in order to develop meaningful interpretation of the
findings. “Interpretation is about giving meaning to data” (Hatch, 2002, p. 180). Hatch
added that data analysis is “about making sense of social situations by generating
explanations for what’s going on within them”
In order to confirm that the themes emerging from the interviews were accurate
and complete, the researcher engaged an independent researcher knowledgeable in
83
qualitative research methodology to review the themes. The researcher provided the
independent researcher with four transcriptions, the draft table of “Categories of Coded
Qualitative Data,” and draft dissertation study. From a detail review of the transcriptions,
the independent researcher noted the impact institutional stress had on financial officers
in selecting financial indicators to implement at their institutions. The independent
researcher reiterated the consistent corporate work experience of the financial officers but
noted that there was little mention within the research study of this common factor.
These comments were incorporated in the study.
Data collected through the researcher’s own observations from unobtrusive data
was also analyzed using an Excel spreadsheet table to capture any relationships, themes,
or discrepancies with the transcribed data. From the three data sources -- semi-structured
interviews, personal journaling, and unobtrusive data -- the researcher analyzed and
compared the data to understand the themes that participants experience in their use of
financial indicators to support strategic decision making and inform their governing
boards about institutional health.
Credibility
In order to answer Creswell’s (2007) question, “Are the results an accurate
interpretation of the participants’ meaning?” the study included two credibility strategies
(p. 134). The strategies included peer debriefing and member checking. These strategies
were used to increase the probability that the findings would be found credible and that
the findings would be approved by the “constructors of the multiple realities being
studied” (Lincoln & Guba, 1999, p. 403).
84
In peer debriefing, the researcher solicited an independent researcher,
knowledgeable in qualitative research methodology, but disinterested in the particular
study problem. Peer debriefing clarified the researcher’s interpretations and exposed any
researcher bias that may exist.
Member checking required the researcher to take the findings back to participants
in the study to confirm that such findings “are an accurate reflection of their
expectations” (Creswell & Plano Clark, 2007, p. 135). The researcher shared summary
findings with participants to ensure accuracy of their responses. This allowed the
participant to provide a stamp of integrity, helping to validate the study. It also reduced
the possibility that the researcher did not misinterpret or misrepresent the data that was
collected.
Verification
The researcher used triangulation as the main verification form for the proposed
study. Triangulation utilizes multiple data sources and theoretical schemes in an effort to
ensure validity during qualitative studies and is recommended as an effective form of
verification (Lather, 1991). Unobtrusive data for example provides data that is
nonreactive and free of participant’s intervening interpretations (Hatch, 2002). The
researcher reviewed various unobtrusive data available from public sources prior to
actual telephone interviews to let the facts collaborate statements made by participants
during interviews.
In order to avoid reactive effects where errors result from the respondent’s
awareness that they are the target of study, the researcher asked probing questions to
clarify and confirm the respondent’s answers. In particular, respondents may answer
85
questions in stereotyped ways or may prefer extreme responses to moderate ones
(Tashakkori & Teddlie, 2003). Probing questions helped to mitigate formulated or
stereotyped responses.
Having the data and financial reports discussed during telephone interviews
corroborated respondent statements use of financial indicators by the institution. During
the interviews, the researcher was better prepared to ask probing questions to clarify
answers and minimize managed or inaccurate responses. By bridging unobtrusive data
with the respondent’s answers, and probing where answers seemed unclear or to conflict
with unobtrusive data, the researcher was able to triangulate data and improve the
accuracy of the findings.
Summary
The researcher used a multiple case qualitative study design to explore six
Midwestern institutions that use financial indicators in managing institutional resources
and how financial indicators can support strategic decision making. Given the economic
stress that continues to threaten the financial viability of small private institutions,
managing financial resources is critical to achieving institutional mission and ensuring
access and affordability for students. The researcher’s intent is to share how institutions
use financial indicators to support strategic decision making and inform their governing
boards in order to help other institutions navigate the financial headwinds facing higher
education and promote financial sustainability.
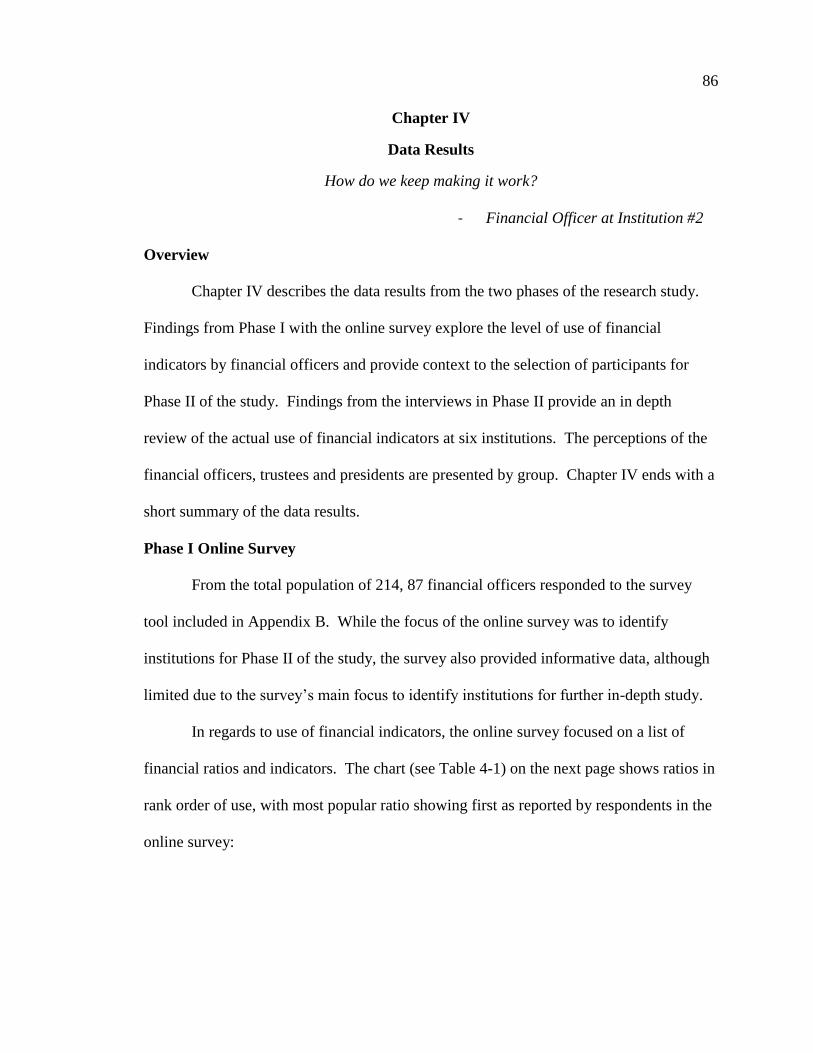
86
Chapter IV
Data Results
How do we keep making it work?
- Financial Officer at Institution #2
Overview
Chapter IV describes the data results from the two phases of the research study.
Findings from Phase I with the online survey explore the level of use of financial
indicators by financial officers and provide context to the selection of participants for
Phase II of the study. Findings from the interviews in Phase II provide an in depth
review of the actual use of financial indicators at six institutions. The perceptions of the
financial officers, trustees and presidents are presented by group. Chapter IV ends with a
short summary of the data results.
Phase I Online Survey
From the total population of 214, 87 financial officers responded to the survey
tool included in Appendix B. While the focus of the online survey was to identify
institutions for Phase II of the study, the survey also provided informative data, although
limited due to the survey’s main focus to identify institutions for further in-depth study.
In regards to use of financial indicators, the online survey focused on a list of
financial ratios and indicators. The chart (see Table 4-1) on the next page shows ratios in
rank order of use, with most popular ratio showing first as reported by respondents in the
online survey:
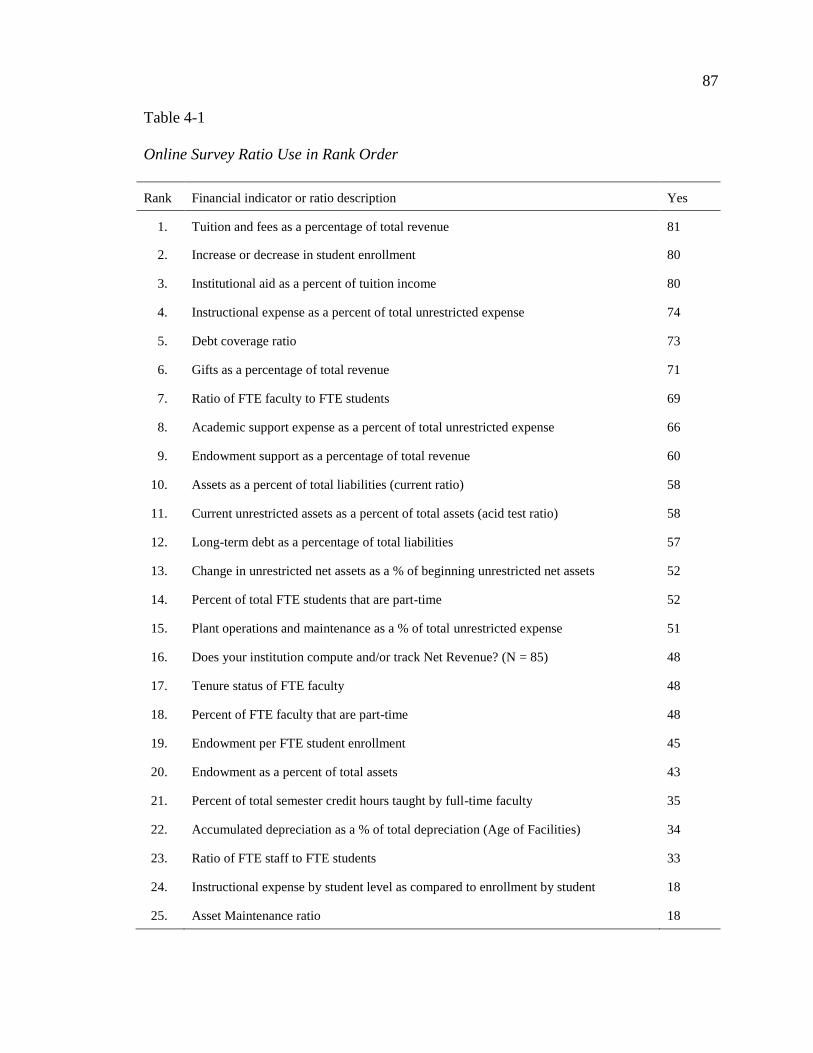
87
Table 4-1
Online Survey Ratio Use in Rank Order
Rank Financial indicator or ratio description Yes
1. Tuition and fees as a percentage of total revenue 81
2. Increase or decrease in student enrollment 80
3. Institutional aid as a percent of tuition income 80
4. Instructional expense as a percent of total unrestricted expense 74
5. Debt coverage ratio 73
6. Gifts as a percentage of total revenue 71
7. Ratio of FTE faculty to FTE students 69
8. Academic support expense as a percent of total unrestricted expense 66
9. Endowment support as a percentage of total revenue 60
10. Assets as a percent of total liabilities (current ratio) 58
11. Current unrestricted assets as a percent of total assets (acid test ratio) 58
12. Long-term debt as a percentage of total liabilities 57
13. Change in unrestricted net assets as a % of beginning unrestricted net assets 52
14. Percent of total FTE students that are part-time 52
15. Plant operations and maintenance as a % of total unrestricted expense 51
16. Does your institution compute and/or track Net Revenue? (N = 85) 48
17. Tenure status of FTE faculty 48
18. Percent of FTE faculty that are part-time 48
19. Endowment per FTE student enrollment 45
20. Endowment as a percent of total assets 43
21. Percent of total semester credit hours taught by full-time faculty 35
22. Accumulated depreciation as a % of total depreciation (Age of Facilities) 34
23. Ratio of FTE staff to FTE students 33
24. Instructional expense by student level as compared to enrollment by student 18
25. Asset Maintenance ratio 18

88
Other ratios that respondents reported computing, as required by letter of credit
agreements with banks for debt compliance, included the liquidity ratio (n = 10),
expendable cash and investments to debt ratio (n = 3), debt service coverage ratio (n = 2),
viability ratio (n = 1), change in net assets to change in CPI (n = 1), fixed charge
coverage ratio (n = 1), leverage ratio (n = 1), and capital expense ratio (n = 1).
The Composite Financial Index (CFI), which was developed in the mid-1990s by
Prager Sealy and KPMG, was used by sixty respondents, representing 72% of the
respondents (N = 83). In order to understand the level of financial health of the survey
respondents, the online survey asked those respondents who indicated that they did
compute the CFI to provide the most recent ratio. Figure 4-1 displays the responses
against the average score of the respondents of 3.56.
The U.S. Department of Education Composite score, also known as the
“financial-responsibility test,” was included as Question #15 of the online survey. The
Composite Score is required to be reported to the U.S. Department of Education each
year by all recipients of Title IV funds. According to the respondents, 57 financial
officers or their auditors compute the ratio, representing 69% of respondents (N = 83), 12
answered that they did not compute the ratio, and 14 were unsure. Figure 4-2 below
displays the responses against the average score of all respondents or 2.55.
It is interesting to note that the U.S. Department of Education Composite Score
must be reported by all institutions who receive Title IV funds. Based on the responses
of the survey, the financial officer is not always aware of this requirement, did not
necessarily understand the question, or the auditors may prepare the ratio and submit the
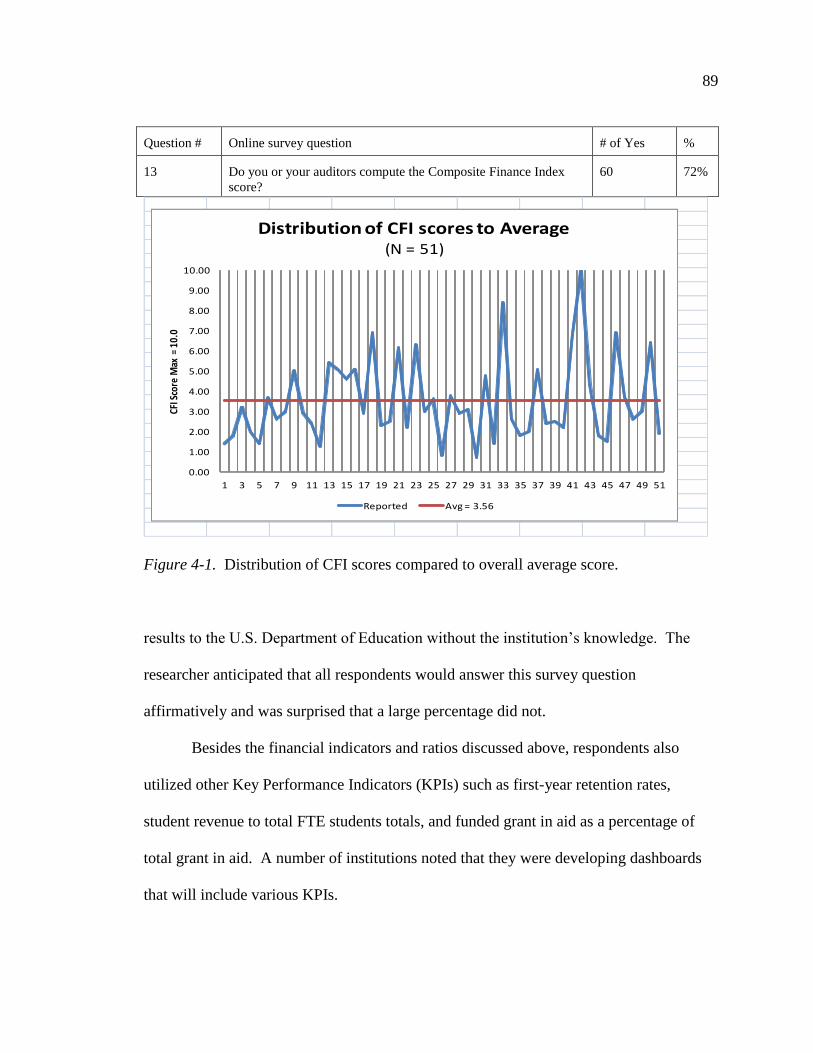
89
Question # Online survey question # of Yes %
13 Do you or your auditors compute the Composite Finance Index
score?
60 72%
Figure 4-1. Distribution of CFI scores compared to overall average score.
results to the U.S. Department of Education without the institution’s knowledge. The
researcher anticipated that all respondents would answer this survey question
affirmatively and was surprised that a large percentage did not.
Besides the financial indicators and ratios discussed above, respondents also
utilized other Key Performance Indicators (KPIs) such as first-year retention rates,
student revenue to total FTE students totals, and funded grant in aid as a percentage of
total grant in aid. A number of institutions noted that they were developing dashboards
that will include various KPIs.
0.00
1.00
2.00
3.00
4.00
5.00
6.00
7.00
8.00
9.00
10.00
1 3 5 7 9 11 13 15 17 19 21 23 25 27 29 31 33 35 37 39 41 43 45 47 49 51
CFI S
core
Max
= 1
0.0
Distribution of CFI scores to Average(N = 51)
Reported Avg = 3.56
90
Question # Online survey question # of Yes %
15 Do you or your auditors compute the annual U.S. Department of
Education Health Index score “financial-responsibility test”?
57 69%
Figure 4-2. Distribution of health index scores to overall average score.
One of the final questions in the online survey asked respondents to note any
barriers that they find in using financial indicators. Barriers were discussed in a study
done by Redenbaugh (2005) on the use of management accounting tools. Respondents
reported six barriers: Lack of understanding and need for education (n = 10), time to
prepare financial indicators (n = 4), financial indicators cannot be used alone (n = 1), the
lack of comparability between institutions (n = 2), lack of interest (n = 1), and push-back
from measured accountability of employees (n = 1).
1.00
1.50
2.00
2.50
3.00
3.50
1 3 5 7 9 11 13 15 17 19 21 23 25 27 29 31 33 35 37 39 41 43 45 47 49 51 53
US
De
pt
of
Ed H
eal
th I
nd
ex
Sco
re M
ax =
3.0
0
Distribution of Health Index scores to average(N = 53)
Reported Avg = 2.55
91
In order to select the institutions that would form Phase II of the study, the
researcher reviewed the responses to question # 19, which queried whether the financial
officer could cite an example of their use of financial indicators and/or ratios in strategic
decision making (n = 79). Of the 31 examples shared, 15 respondents indicated that they
would be willing to share their examples in Phase II of the research study, 8 would not,
and 8 were unsure.
The researcher reviewed the examples for institutions that would be willing to
share or were unsure if they would participate in the study (n = 23). The researcher used
purposeful sampling to select 6 compelling examples of the use of financial indicators to
inform strategic decision making. The researcher’s review was based on her experience
as a financial officer with 15 years’ experience working in higher education financial
management, as well as her review of the literature.
The six institutions were selected without the researcher knowing the institution’s
name, the financial officer’s name that responded, or any other identifying factors. Of
the six institutions selected, the researcher was only familiar with one institution. She
had met the respondent at a few events for business officers in the West Suburban
Chicago area where her institution is located. She had never visited this campus. Five of
the six institutions were religious institutions, which was not surprising to the researcher
given the original founding purpose of small private institutions in the Midwestern
United States to train the clergy.
Although one of the six institutional representatives indicated in the online survey
that they were unsure if they would participate in Phase II of the study, that financial
officer agreed to do so after further communication with the researcher. This was based
92
on the assurance that all data collected and reported would be done confidentially and
anonymously.
The need for confidentiality was very important to respondents, as they would be
asked to share private financial data, along with personal observations and perceptions
about their work, their institutions, and those they work with such as the institutions’
presidents and governing boards. The researcher maintained complete confidentiality for
each institution as well as with each respondent as the researcher desired to achieve
openness and candor in exploring the subject with all respondents.
The researcher sent email requests to the financial officers at each of the six
institutions to request participation in Phase II of the research study (Appendix F). The
researcher found financial officers very busy during spring, with board meetings and
budget preparation work, that delayed the scheduling of interviews somewhat. Financial
officers sought approval to participate from their respective presidents. During
interviews with these financial officers, the researcher requested unobtrusive data as per
Appendix H that was applicable to the discussion. Such documents shared included
PowerPoint presentations for new board orientation, board meeting agendas, vice
president executive reports to the Board, balanced score card summaries, cash-flow
analysis, and contribution margin analysis with supporting detail.
Over all, the documents shared substantiated the work of the financial officer,
besides providing a wealth of best practice examples to the researcher. Financial officers
shared the documents only after an assurance that such data would not be used as
examples or exhibits within this study. Accordingly, none are being used in the study.
Other unobtrusive data were obtained from the institution’s website, Guidestar.org, and
93
public internet. These data formed a means of triangulation to manage bias in the
qualitative study, as well as confirm statements made by the financial officers of the
institution.
The next section outlines the findings from Phase II of the study, beginning with
an outline of the themes that emerged from the interviews as presented in a table. The
section continues with a discussion of how financial officers use financial indicators to
inform strategic decision making at their institutions, how governing board members
receive, use, and understand the data, and how the president of the institution supports or
leads the use of such data. Each institution’s name is replaced by a simple number to
ensure confidentiality. To further protect anonymity, the state where the institution
resides is also not referenced.
Phase II: Interviews
Coded qualitative data. Analysis of the interview transcripts offered the
researcher an opportunity to identify these institutional decision makers’ perceptions,
based on their experience using financial indicators. For each transcript, data were coded
into categories that represented a theme. Themes were based on the question asked or
specific term used in the answer. From the coding analysis, five themes emerged. These
major themes or categories are outlined in the chart (see Table 4-2) on the next page.
As shown in the chart, a number of perceptions by the financial officer, trustees,
and president align, while differences can be explained as arising from the unique roles
each group performs. For example, each group had substantial tenure with the institution.
There was not a lot of turnover, as evidenced by tenures spanning from 4 to 19 years for
financial officers, 4 to 14 years for presidents, and 5 to 18 years for trustees.
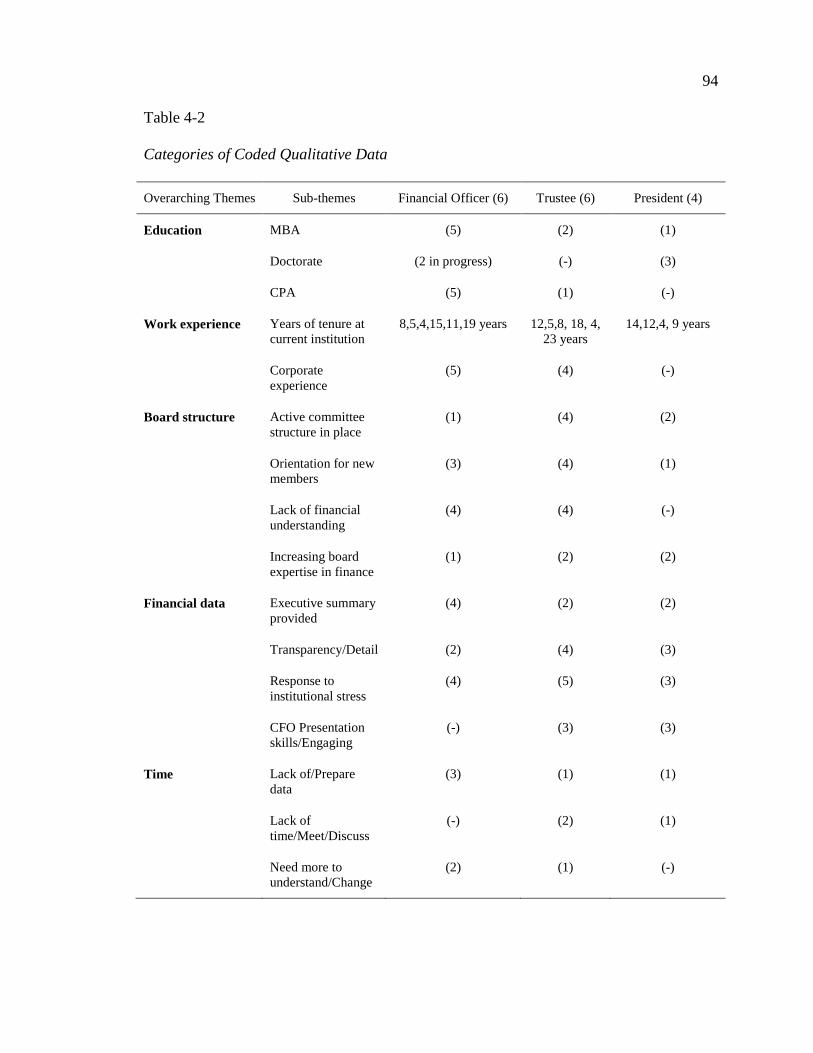
94
Table 4-2
Categories of Coded Qualitative Data
Overarching Themes Sub-themes Financial Officer (6) Trustee (6) President (4)
Education MBA (5) (2) (1)
Doctorate (2 in progress) (-) (3)
CPA (5) (1) (-)
Work experience Years of tenure at
current institution
8,5,4,15,11,19 years 12,5,8, 18, 4,
23 years
14,12,4, 9 years
Corporate
experience
(5) (4) (-)
Board structure Active committee
structure in place
(1) (4) (2)
Orientation for new
members
(3) (4) (1)
Lack of financial
understanding
(4) (4) (-)
Increasing board
expertise in finance
(1) (2) (2)
Financial data Executive summary
provided
(4) (2) (2)
Transparency/Detail (2) (4) (3)
Response to
institutional stress
(4) (5) (3)
CFO Presentation
skills/Engaging
(-) (3) (3)
Time Lack of/Prepare
data
(3) (1) (1)
Lack of
time/Meet/Discuss
(-) (2) (1)
Need more to
understand/Change
(2) (1) (-)
95
The financial expertise was formidable. Out of six institutions, five had financial
officers who held double credentials (MBA and CPA). Financial officers, as with all the
trustees, had worked in corporate enterprise as well. Presidents, on the other hand, were
academics, and did not have corporate experience. Only one president, who recognized a
need for greater business acumen as a CEO, had returned to college to attain more
expertise through an MBA program.
On the matter of board structure, trustees and presidents emphasized the important
role of committees in funneling financial data through the finance committee, as the
group of board members had greater financial acumen than the rest of the board.
Trustees recognized the need for board orientations in order to develop an understanding
of board structure and the workings of higher education. Trustees also admitted to not
understanding the financial data of the institution. While financial officers recognized
this lack of understanding in the trustees, presidents did not necessarily agree.
All groups mentioned the need for transparency, providing full financial detail,
along with an executive summary to facilitate a board-level focus. Institutional stress
was an important factor in which financial indicator the financial officer selected and the
level of motivation financial officers felt in promoting financial health at their
institutions. While financial officers did not self-assess their own presentation skills,
both trustees and presidents commented on the importance of financial officers’ having
strong communication and presentation skills. They need to be engaging, have a sense of
humor, and have a vision for their work. Each president noted that his or her own
institution’s financial officers were unique in having strong presentation skills, whereas
other financial officers they had met typically did not.
96
Time was an important theme for all groups, but from varied perspectives.
Financial officers noted the lack of time available for preparing financial data. They also
agreed that it took a long time to introduce and implement a new financial indicator. The
specific financial indicator they used took many years to develop and to incorporate into
the understanding of their boards. Financial officers agreed that the work pace they
experienced in higher education was substantially slower than in corporate environments.
This pace contributed to the slow rate of change at the institution, which the financial
officer at Institution #4 referred to as a result of “traditional thinking.”
Trustees, on the other hand, saw time shortages evidenced in having insufficient
meeting time or not enough meetings for full discussion of financial topics. Time
constraints were addressed by each institution, either through holding lengthier finance
committee meetings, or by scheduling additional meetings as necessary. One trustee
recognized the lack of time their financial officer had for preparing new data, with one
president noting the “machinery” or systems were “daunting” in preparing that data.
The different themes that emerged from interviews with financial officers,
presidents, and trustees began to shape an understanding for the researcher of the use of
financial indicators in higher education by the three groups. In-depth discussion of the
findings below serve to further develop answers to the grand tour question and research
sub-questions.
97
Shaping the use of financial data.
How do we keep making it work?
- Financial Officer at Institution #1
Prior to exploring the specific use of financial indicators with the financial
officers and trustees, the researcher thought it was important to establish the level of
financial expertise and knowledge of higher education for both groups. Out of respect for
the limitations on the president’s time and availability, the researcher reviewed each
president’s background based on institutional website data and focused instead on the
actual use of financial indicator prepared by the CFOs for informing the governing
boards with the president acting as the “bridge” between the two constituencies.
One of the opening background questions for each financial officer and trustee
was “What attracted you to this institution?” This question gave the researcher a
foundation for understanding each respondent’s individual experience and motivation in
serving a not-for-profit or “for-purpose” (Chaite & First, 2011) organization. With a
focus on mission as compared to a profit motive found in corporate America, small
private institutions have a different emphasis. Institutional leaders in “for-purpose”
institutions bring unique interests in serving the mission. From the financial officer who
saw working as a Chief Financial Officer (CFO) in higher education as “an opportunity to
make a difference” to the trustee who captured the meaning of higher education service
by noting that “at the end of the day, we’re not doing this for ourselves, we’re doing it for
the benefit of young men and women, to give them every opportunity to be successful.”
The financial environment. The researcher asked the financial officers general
financial questions related to the institution and explored with respondents the challenges
98
facing higher education, both at the institutional level and nationwide. The answers
formed the basic context for level of financial resources available, and the internal and
external pressures that institutional leaders confront in managing financial health.
Over all, the institutions were described as highly tuition dependent, with small
endowments ranging from $1 million to $70 million. Competition was overwhelmingly
cited as an ongoing challenge, with pressures on the operating budget from enrollment
levels below capacity. Institution #3 was located in a state threatened with a shrinking
high school student population, reducing the enrollment funnel for new undergraduates.
Institution #5 had already seen a drop in its undergraduate enrollment. The financial
officer at Institution #6 summarized the financial environment for their small private
institution as “still in a very financially restrained environment.”
Minimizing costs and promoting affordability were constant challenges for these
institutions. The financial officer at Institution #3 noted keeping tuition levels affordable
was a “huge issue for students throughout higher education.” Keeping costs low was
directly related to managing affordability in college attendance. Student demands for
technology however were growing, thus driving costs higher. The financial officer at
Institution #6 explained, “Keeping up with the ever increasing need for technology and
delivery, that’s a challenge.” The financial officer at Institution #2 summarized the
challenges they faced: “You can’t just hang on to the old inefficient ways of doing
business. You really have to keep pushing the envelope in improving your processes,
lowering your costs, doing things a little bit differently, to offer value for the students.”
While the financial officer at Institution #1 described their financial situation as
“very strong,” the president expressed the concern to find a sustainable financial model.
99
And the trustee of Institution #1 expressed the ongoing challenge that market pressures
presented as a “distraction” from the goal of serving students. The complexity and
ongoing challenge of managing financial health at these small private institutions was a
shared story deserving in-depth review and understanding.
The financial officer’s background. The researcher explored with each
financial officer his or her level of financial expertise based on educational and other
professional credentials, work experience, and number of years worked in higher
education. The researcher also explored how the financial officer came to work at that
particular institution and when that occurred.
Five of the six financial officers were Certified Public Accountants (CPAs), with
three having worked in public accounting. All six financial officers worked in corporate
America in for-profit organizations, with one financial officer acting as president of a
manufacturing company. Five of the financial officers had masters’ degrees in business,
with two currently pursuing a doctoral degree. Years of service in higher education
ranged from 4 years to just upwards of 25 years, with an average tenure of 13 years.
The financial officer’s perspective.
There is no mystery as to where my numbers come from.
- Financial Officer at Institution #4
Each financial officer interviewed uses financial indicators to guide and educate
members of the governing board as part of the strategic decision making process. This
effort was done through collaboration and support of the president by focusing on a select
financial indicator or combination of financial indicators. The financial officer took the
lead role in creating the awareness and understanding of the use of the selected financial
100
indicator. The financial officer accomplished this through ongoing education and
consistent use and presentation of the financial indicator with both the president and
governing board. In order to use the financial indicator for strategic decision making, the
financial officer linked the financial indicator within strategic planning and assessment.
Financial officers required perseverance, however, to address the barriers that inhibited
such use. The following findings provide insights into the ways financial officers were
successful in using financial indicators to drive institutional mission with their governing
boards.
The financial officer was found to be the individual who prepares financial data
for sharing with the president and governing board. Financial officers stressed the need
to provide high-level narrative data for the full governing board, with further detail for
those trustees wanting to have more information. Financial data was shared more
regularly with their president by monthly budget reporting than with the governing board,
which occurred quarterly or annually at formal full-board and board committee meetings.
The need for summarized financial data was confirmed by all financial officers.
Upon first assuming the role of financial officer at Institution #4, that individual changed
the way data had been reported. Instead of lengthy and detailed financial reports, the
financial officer provided summary data in a “user-friendly way,” explaining, “I try to
keep it really, really high level . . . I give them the information that they need to be able to
make those decisions that the board makes.” Through focused and summarized
presentation of financial indicator data, the financial officer promoted a more ready
understanding of otherwise complex financial information.
101
Overall, each financial officer focused on a specific financial indicator or
financial management tool to use to inform his or her governing boards of the financial
health of the institution. Three institutions relied on the Composite Financial Index
(CFI), two on contribution margin (C/M) analysis, and one on a balanced scorecard
financial management tool. All financial officers found that it took time to develop the
use and understanding of their financial indicator before it became institutionalized in the
financial management of the institution. The financial officer at Institution #1 touched on
the experience that all financial officers encountered in their use of financial data by
commenting on board understanding, “So it’s just like anything, you have to hear it for
years and years.” To create awareness and understanding, the financial officer found it
necessary to present the select financial indicators in a consistent and ongoing manner
year-over-year to board members.
The researcher explored how financial officers started using the specific financial
indicator with their governing boards. From these interviews, it became apparent that
time was a significant barrier to usage. In other words, the use of the financial indicator
evolved over time and began with the administration prior to being implemented at the
board level.
The theme of time would play out in various forms across the study. A shortage
of time poses a barrier to the financial officer who needs to prepare financial data. Then
it takes time to process a level of understanding with other constituents in the institution,
and even more time to effect change in a culture or tradition. One financial officer from
Institution #5 exclaimed, “If I had known what higher education was like before I came
here, I would have never have come!” The financial officer went on to explain:
102
I mean we have a strategic planning process here, and it took a year, and when
they told me that at the start of it, I said, ‘You guys are nuts.’ I said, ‘In
manufacturing, if it took us a year to figure out our strategic plan, we would have
been out of business.’
The financial officer from Institution #6 had an alternative viewpoint on
managing in higher education within the limitations of time. The financial officer
explained, “Everybody is so pressed for time that they think their own business
experience translates into running a university.” The financial officer acknowledged,
however, that people need to understand “what makes higher education click on the
business side. We are businesses; there is no other term for it. We may be mission-
driven, but we are businesses and we have to operate like businesses.” This conflict
captures the complexity in higher education given shared governance amongst many
constituents, along with the need to address the financial and economic stress of
managing tuition-dependent institutions that do not have ample endowments or reserves
to fall back on when enrollments drop.
For the financial officer at Institution #4 who developed a balanced scorecard
tool, the process was an evolution that began with a single page of six measurements they
had developed, which grew over the past two to three years into a page of performance
indicators developed in collaboration with the president’s cabinet. The scorecard uses
standard red light, yellow light, and green light indicators for easy interpretation of
performance levels.
In explaining how the scorecard developed, the financial officer replied, “What
the board needed is something that demonstrated that we were actually executing the
strategic plan, so kind of carrying it out. So that was the idea of the balanced scorecard.”
103
The balanced scorecard established goals and measured the outcomes of performance
against benchmarks.
In order to promote awareness and understanding of the financial indicators, the
scorecard is shared with employees on the institution’s intranet and at town hall meetings.
The purpose of the sharing is to support “transparency,” a theme that ran throughout
interviews at each institution and with each group, financial officer, trustee, and
president. And, transparency in effect promotes wider and more expansive understanding
with an institution’s community.
The need for financial transparency was highlighted during the period leading up
to passage of the Sarbanes-Oxley Act of 2002 upon the implosion of Arthur Andersen
and the downfall of Enron. While Sarbanes-Oxley does not specifically apply to not-for-
profit entities, a number of best practices have been developed and promoted by such
organizations as the National Association of College and University Business Officers
(NACUBO) as a result of the legislation. One example is having a separate audit
committee. Transparency also allows for shared understanding of financial information
important to managing in a collaborative environment such as higher education. One
financial officer began working in higher education in the summer of 2008, right before
the credit crisis in the United States began. That financial crisis had serious
consequences for many colleges and universities, especially in regard to financial
liquidity, endowment values, and meeting debt covenants, all of which had serious
implications for financial officers trying to manage small private institutions at the time.
Thinking back on the experience, the financial officer at Institution #1
commented, “We’re very enrollment-dependent, you know, so I think it [the financial
104
difficulty imposed on higher education during the national economic downturn] is going
through what I went through in 2008-2009, that I just can’t go back there personally.”
The impetus for monitoring financial health through use of select financial indicators was
reinforced for the financial officer after that institution’s financial health was threatened.
In using the Composite Financial Index (CFI) to build transparency, the financial
officer of Institution #1 goes on to explain, “It has to be simple, it has to be clear, here’s
the shortfall, here’s what it means . . . and you know, people make decisions based on
poorly presented information, and so that is what I feel a huge passion for.” The effective
presentation of data was something that all institutions and all groups discussed during
their interviews in order to promote financial indicators as part of the institutional
decision-making process.
One president commented, “I think a good Chief Financial Officer helps us by
summarizing a lot of data in very pertinent and useful ways.” One board member noted
the importance of the financial officer’s ability to report information succinctly, adding
that summary data was shared with the full board, while greater detail was shared with
the finance committee to raise understanding. Over all, financial officers provided
highlights to financial data, offered an oral report at board meetings, and then answered
questions to clarify and address financial information.
Besides delivering ongoing and regular reporting of financial indicators to
governing boards, most financial officers were directly involved in new board member
orientations to educate and inform new board members as to the use of financial
indicators in strategic decision making at the institution, as well as general financial
matters in higher education. These orientations in large part were a new activity for these
105
institutions, or had been restored after not being implemented for some time. At
Institution #1, the financial officer presents to new board members a complete overview,
which includes a discussion of the CFI. At Institution #6, the financial officer also
provides a complete history of the college. The financial officer at Institution #3 also
prepares a formal presentation, and said that the institution is continually looking for
ways to improve orientation. This activity appeared to be driven by the institution’s
president, according to the financial officer, who explained, “Under our president’s
leadership, we’ve improved, I would say, the experience level on our board
significantly.”
After reading the literature, which described a disconnect between the financial
officer and board in regards to the understanding and use of financial data, specifically
cost data from Jane Wellman’s Delta Cost Project (2008), the researcher included a few
questions to explore this issue in detail. The researcher asked all respondents how
financial indicators were reported to the board, if there might be a better way to share
financial indicators with the board, and what barriers existed to using such data.
Essentially and often times, the researcher simply posed the question, “Does the board
understand the financial data?”
Responses to this simple question were insightful into the nature of these boards,
the expertise of these boards, and how reputation and trust become apparent factors for
each financial officer in successfully serving a small private institution, and more
specifically, using financial indicators in strategic decision making. The financial officer
at Institution #1 responded, “I think they understand in general, they certainly don’t
understand every ratio” At Institution #4 the financial officer replied, “They don’t have
106
the depth of financial knowledge to really probe and hold me accountable and kind of
challenge me on those things.” The financial officer at Institution #6, however, said,
“They may not know all the terms, but, believe me, they understand the cash flow and
how to identify your source of revenue and your main expenses. We get a lot of good
questions from the board that we used to not get.”
The financial officer at Institution #6, however, captured the nature of the
problem and expressed how institutional leaders can raise the board’s level of
understanding that is not necessarily immediate or intuitively gained. When the
researcher queried the financial officer as to the level of understanding of the board on
the use of the contribution-margin analysis, the financial officer replied, “Yes, and no.
It’s difficult for them to understand the difference between the academic and corporate
environment.”
The financial officer from Institution #5 agreed that their board members do not
necessarily understand the industry of higher education. In order to aid board member
understanding, however, the financial officer from Institution #5 explained concepts to
the board in terms of the corporate environment. Drawing awareness and understanding
from financial indicators required the financial officer to be creative in educating and
informing board members new to higher education, and not necessarily experts in
university financial matters. The financial officer explained, “So I can take it out of the
context of higher education, the college, and, you know, put it into a context of an
industry that they maybe can understand a little bit better.” This financial officer also
acknowledged that the financial officer’s experience in corporate America served the
107
individual well in bringing management tools from corporate America to higher
education.
The use of the financial indicators that the financial officers had selected to use
with their governing boards were intentionally linked to strategic planning and
institutional mission. According to the financial officer at Institution #2, the use of the
balanced scorecard formed a strategic summary that “give[s] them [the board] the
information they need to make those decisions that the board makes.”
In May 2011, the financial officer at Institution #2 presented a PowerPoint
presentation on the balanced scorecard to the full governing board. In that presentation,
the financial officer described the balanced scorecard as “a strategic planning and
management system” that “transforms an organization’s strategic plan from an attractive
but passive document into the ‘marching orders’ for the organization on a daily basis.”
The financial officer concluded, “It enables executives to truly execute their strategies.”
According to Chabotar (2006), linking financial indicators to strategic planning is a
critical element in the effective use of financial data in strategic decision making.
Institution #2 did this through their use of the balanced scorecard.
At Institution #4, the financial officer focused on the contribution margin to gauge
direct revenue and expense levels, and on the resulting financial resources in which to
cover institutional overhead. The contribution margin was included in annual budget
reports to the governing board, and measured the specific levels necessary to balance
operating performance. To improve understanding and meaning, the financial officer
included historical, current, and three-year projections of the contribution margin in order
to provide trend and comparative data. The financial officer explained, “Once again, it is
108
the benefit of the trends. Like any component in ratio analysis, static data is not very
useful.” The finance committee and full board both receive contribution margin
information on a regular basis. The financial officer added that the use of trend and
comparative data “enhances the discussions and lets the Board have a good quick sense
of where we stand and where we’ve been moving.”
Institution #3 provided a useful example of linking financial indicators to strategy
for improved financial health and to promote institutional mission. After starting in
higher education in 2008, the financial officer at Institution #3 found their CFI score in
the “danger zone” and at a level less than the 3.0 score Prager Sealy established as
representing minimal financial health. Through intentional planning, the financial
officer, president, and board set a goal of achieving a ratio of 3.0 or above. This goal was
met in fiscal year 2011.
Presently, the financial officer at Institution #3 is developing an expanded five-
year forecasting model with a consultant. In the model, assumptions can be altered to
assess how changes in operations may affect the CFI score. The financial officer
explained that they are “trying to build a model that is accurate and predictive, which is
hard to do.” The CFI continues to be an important financial indicator at Institution #3 to
guide strategic decision making and promote mission there. The CFI is shared with the
board, in greater detail with the finance committee of the board, and with faculty and
staff at various forums. The financial officer noted, “You know it is not my job to get
this place financially secure. It is all of our jobs.”
109
The board perspective.
The balanced scorecard clearly has gotten our board engaged at a higher level.
- Trustee Institution #2
Phase II of the study included interviews with trustees at each of the six
institutions. In exploring board perspectives on how the governing board uses financial
indicators, and how they are informed and educated to such use, the researcher was
interested in the level of financial expertise and professional background that the trustees
brought to their roles on the board. All the trustees that the researcher interviewed had
been or currently acted, as chair of the finance committee at the institution. Two had
become the vice-chair of the full board of trustees and were therefore next in line for the
chair position of the board. One trustee was currently chairman of the board. Three of
the six trustees were alumni of their institutions.
In regards to work experience, all trustees held senior executive finance positions
in corporate organizations from health care, banking, telephone, and construction
management. Three trustees held master’s degrees, with one holding a CPA. Three
trustees were chief executive officers, with two owning their own companies. All
trustees interviewed were men.
After obtaining an overview of the board members’ financial acumen, the
researcher focused on the specific financial indicators shared by the financial officer with
the board of trustees. The first question in the Interview Guide (Appendix J) focused on
how financial data were shared with the governing board. This question was important in
answering the research question as to whether financial indicators were being used as part
of institutional decision-making by the board.
110
The trustee at Institution #3 provided a clear example of how financial indicators
were used in strategic decision making. The example also answered the research sub-
questions as to how the financial indicators were used to form strategy and drive
institutional mission. Following financial stress from the national economic downturn
that began in 2008, the institution used the CFI to bring financial performance back to a
balanced budget. The trustee explained, “We went from losing money a couple of years
ago, to being in the black the last two years, and we’re projecting a budget surplus this
year.”
In order to create awareness and understanding of the CFI at the board level, the
financial officer presents the CFI to the full board each October as the trustee at
Institution #3 noted. The trustee added that the executive committee of the board reviews
financial performance “very carefully.” Earlier, the trustee had asked the financial officer
for an executive summary report to be provided accompanied by the seven or eight page
more thorough report. In the summarized report, the financial officer includes
benchmark and comparative data along with the CFI in this report. In addressing the
subject of managing the level of detail provided to the board, the trustee noted, “If you
give them too much information, they can get disengaged.” In using the summary
format, the trustee explained, “You can read the pages and get a real good handle on
where we are.”
The trustee at Institution #6 confirmed the need to provide succinct financial data
to the governing board. The trustee noted, “They’d either get lost in the numbers because
they’re not numbers-oriented, or it’s just too much data for the time you’ve got allotted to
use it.” Institution #6 continues to struggle financially given increased competition from
111
local, low-cost public institutions, and the growing costs of technology for on-line
learning at the institution.
Because of more pressing financial constraints, Institution #6 focuses on cash
flow as a key financial indicator to promote financial health and guide strategic decision
making. The trustee explained, “[The financial officer] does another nice report that is
very detailed, which is the cash flow projection for approximately one year.” For the
trustee, cash flow is critical to making payrolls and paying bills. The trustee exclaimed,
“I am sitting there saying, how can you not care about the cash flow statement?!” The
cash flow projection also combines contribution margin analysis by programs at the
institution. This allows the board to understand trends over a two- to three-year period
for each program’s operating performance. The trustee summarized the use of the cash
flow projection and contribution margin analysis as “a very useful tool.”
Not all trustees, however, were satisfied in the level of understanding and use of
financial information available for strategic decision making at their institutions. Being
new to governing boards in higher education, the trustee at Institution #5 struggled to
understand financial management at the institution, and to relate this understanding
within the trustee’s experience in corporate financial management. (The institution
focuses on the CFI.) The trustee voiced a need for further data and understanding. The
trustee added, “All this fund accounting stuff is really quite confusing, even to somebody
like me who’s supposed to understand some of that.” The trustee explained, “And when
you don’t ask the question, you never get the answer.” The culture seemed to limit
discussion and to require conformity. The trustee was interested in obtaining more detail
but “not to the point of paralysis.”
112
In Chapter II, the literature review on governing boards’ use of financial
indicators and cost data points to a number of additional factors that impede the use of
such data in strategic decision making. Factors cited included that insufficient time was
allocated at board meetings, that the board members were not adequately prepared for
meetings, and that other priorities superseded the boards’ attention that would otherwise
be focused on financial data. As noted earlier, the manner in which financial data is
reported to the board may be unwieldy in its detail, or may not even be shared with the
governing board (Wellman, 2008). The researcher explored these factors in depth with
the board members at the six institutions to understand if such impediments existed or if
the factors had been overcome in ways that may be utilized by other institutions.
When asked if the trustees had encountered barriers to using financial data in
strategic decision making, the responses revolved around taking more time when time
was needed. The trustee at institution #1 found that “there is ample time and
information,” noting that they will have pre-board meeting discussions of up to three
hours in length when necessary. At Institution #4, the trustee added, “Sometimes too
much has to be covered at one meeting, and we will say, you know, we need to table this
item, and we need to have a separate meeting on it.” All institutions seemed to take
additional time to address any time constraints on financial matters either through longer
meetings, or by adding special meetings to appropriate more time for discussion.
And although trustees found that they had sufficient time, or allocated additional
time to financial matters, trustees did recognize that the barrier of time existed for
administrative staff. At Institution #6 the trustee noted, “if I ask him [the financial
officer] to go in and do something different, that would be very difficult, not because he
113
doesn’t know how to do it, he knows how to do it, it’s a question of does he have time to
do it.”
In discussing the issue of time as a barrier with trustees, two sub-themes
developed regarding financial data use by the governing board: (a) transparency in
sharing and communicating financial data, and (b) the use of committees within the
governing board structure.
The first sub-theme relates to the level of detail and the manner in which financial
data are presented to the governing board. This sub-theme addresses the literature review
issue of financial data either not shared with the governing board, or not presented in a
manner that is readily understandable.
Trustees emphasized the importance of transparency at their institutions.
Transparency was perceived as promoting awareness and understanding of financial data
at the institutions. For example, the trustee at Institution #2 explained the benefits of
using the balanced scorecard in sharing key financial and performance data. The trustee
noted, “All of a sudden, the board members are more knowledgeable than they used to be
about the key components of what are the success factors in the organization.”
Transparency was also evidenced by allowing student government leaders to
attend all board meetings, by the fact that the same level of financial data was shared with
all board members, and that board members had the opportunity to ask questions directly,
either to the financial officer, or to the institution’s president in private executive
sessions. The transparency theme emerged in discussion with financial officers,
presidents, and the provost. The trustee at Institution #1 found that “we have an
114
opportunity to look at as much detail as we want.” The trustee at Institution #2 explained
this further:
What ‘our Financial Officer’ has come up with here is, in my judgment, clearly
the best way to share information. Because it makes information available at any
depth, at any level, that as an individual you’re interested in going to. It really
puts right in front of you, what is going well, and what is not going well, from a
finance standpoint.
According to the trustee, the use of financial indicators, in this case the balanced
scorecard, has elevated the knowledge level of the board while focusing on key
components of what the success factors are in the organization. But when respondents
were asked about the level of understanding of the board on financial data, their
responses were mixed.
At Institution #2, the trustee noted that many members do not have a high level of
financial understanding, adding that members not on the finance committee are less
interested in the financial situation. Institution #3 responded, “I think some do,” while
Institution #6 added, “imagine that about half, probably more than half, are not
particularly financially oriented.” The trustee at Institution #6 raised the issues of time
and understanding when explaining, “They’d either get lost in the numbers anyway,
because they’re not numbers oriented, or it’s just too much data for the time you’ve got
allotted to do it.”
One of the ways in which institutions have addressed this apparent gap in
financial understanding is through the second sub-theme, board committee structure.
Institution #1 explained the need for developing expertise on board committees because
of the increasing compliance issues and regulations institutions must address. The board
member noted, “the Board has specifically sought expertise in that area because of those
115
much more stringent kinds of requirements.” The trustee at Institution #1 explained “not
only has the pressure increased on “the financial officer” and the financial staff but we’ve
recognized we need more expertise on the audit committee and we’ve actually gone out
and recruited at least three other trustees.”
Besides building expertise, the committee structure assigns board members
knowledgeable in financial matters to focus specifically on finance issues thus improving
the board’s effectiveness. The trustee from Institution #1 explains, “It’s hard to do
business with 30 people sitting around the table together, so it’s helpful to have the
reliance, in our case, on the committee structure and expertise and time that those
committees put in.” For Institution #5, committees provide a channel for sharing data
with those board members better suited to understand the data. The trustee exclaimed,
“Throwing all these ratios at pastors or things like that on our board is just going to be a
complete waste of time.” The trustee at Institution #2 noted that board members not on
the finance committee are less interested in the financial situation of the university. The
trustee added that many board members do not have a high level of understanding in
financial matters.
But even with focused recruitment to develop greater expertise at the board
committee level, the financial data still can be difficult to understand. The trustee from
Institution #5 finds that fund accounting, which is used in not-for-profit institutions, is
“quite confusing.” Because of the confusion, the trustee thought that more data should be
shared.
116
Over all, Institution #3 agrees, commenting that the board committee structure
makes board governance more efficient. For Institution #4, the trustees summed it up in
a few words, “It’s really committees that drive things.”
For one institution, reliance on the finance committee can become burdensome.
At Institution #5, the board defers to the finance committee to such a degree that if the
finance committee chair recommends or proposes something, the board will support it.
The trustee commented, “If I get up in front of the board and say it’s OK, most people are
going to say, ‘OK, it’s OK, because the ‘Trustee’ is saying [so].” The respondent’s
apparent discomfort with this may be from his newness to the role of finance chair and
the board, as evidenced by his comment, “I am trying to figure out how the Board
operates.” Or it may be due to the trustee’s comment that “there are going to be some
hard decisions to be made.” Considering the statement made earlier by the financial
officer at Institution #3, “You know it’s not my job to get this place financially secure, it
is all of our jobs,” the trustee may be seeking the collective strategic decision making role
of the board.
At the conclusion of the trustee interviews, the researcher asked for ideas on how
financial officers can improve the financial data that are shared with the governing board
in order to enhance awareness and understanding in decision, and better promote
institutional mission. Responses varied from very specific requests to broader concepts.
The trustee from Institution #6 felt that there should be more financial data shared on the
capital budget process. At Institution #5, the trustee asked for more ratio analysis
regarding staffing levels to serve students in order to understand an apparent disconnect
between the strength of the balance sheet and the lack of capacity on the income
117
statement. Institution #3 thought more forecasting would be useful, noting that the
corporate standard is to present forecasts on a monthly basis. The trustee at Institution #3
also offered the suggestion, “Ask the board, what do you want to see? You know, what is
most helpful to you?”
The president’s perspective.
We’ve been very open, honest, transparent with our budgeting process and
our reporting.
- President Institution #6
After conducting the interviews with board members, the researcher contacted
financial officers to request an interview with the institutions’ presidents. The stated
purpose of these interviews was to understand how each president, as a “bridge” between
the administrative and governing boards, affected the use of financial indicators. Each
institution’s financial officer in collaboration with his or her president had identified
specific financial indicators to use with their governing boards to inform strategic
decision making and to guide strategy in support of the institution’s mission. The
president, as chief executive officer (CEO) of a college or university, holds a critical role
in providing strategic leadership to an institution and contributes or preempts the use of
financial indicators. Understanding the president’s perception of the use of financial
indicators in strategic decision making would provide a more complete story of how
institutions do this.
Four institutional presidents were interviewed through in-depth telephone
interviews. One institutional president declined, due to an already full schedule and lack
of availability and time. One of the four presidents was emeritus of the institution and
118
continued to serve on the institution’s governing board. For purposes of the study, and
based on their actual comments during the interview, the individual maintained a
perspective of an institutional president even though now a trustee. Accordingly, each
individual’s responses are included in the data results from a president’s perspective.
The presidents’ perspectives had developed over years of leading their institution
as president and working with the board of trustees. Presidential tenure ranged from 5 to
14 years. The presidents emphasized transparency and measures they had taken to
expand board understanding, to increase the financial data shared with the board, and to
promote an opportunity for the board to ask questions. The presidents also focused on
the effective use of board committee structure, funneling issues through the committees
for full review and discussion before reaching the full board for approval. Additionally,
institutions used new board member orientation programs to acclimate new trustees to the
culture of the board and provide knowledge of the institution and higher education.
Finally, institutions have engaged in targeted recruitment efforts to increase specific
board expertise when identifying new board members for the institution. This intentional
recruitment has been going on for many years to build board capacity to serve the
institution’s growing needs for accountability and compliance.
To understand how each institution created awareness and understanding of the
financial indicators, the researcher asked the presidents a number of open-ended
questions to gauge the extent of knowledge within the governing board. For example,
when asked if the board members understand the financial data that are shared with them
by the financial officer, the presidents collectively agreed that there were different levels
of understanding, with greater capacity residing with board members on the finance
119
committee. The president from Institution #6 was the most positive in their response,
explaining:
I think about 85% of them do. Because we’ve educated them, very, very carefully
and I think they’re comfortable if they don’t understand something, those that
may not be as financially astute as others, they are now willing to ask those
questions.
The presidents, as with both the financial officers and trustees, agreed that there is
a need to educate board members concerning financial matters of the institution. The
president at Institution #1 noted, “Trustees do need help focusing on what’s the important
number here. . . . .My impression is that the board members don’t always know what I
should be looking at.” In order to provide a starting point for educating new board
members on the financial matters of the organization, all six institutions hold orientation
programs for new board members. The financial officer at each institution studied took
the lead role in educating and informing new board members at orientation sessions to
develop awareness and understanding of both the general financial health of the
institution and the focused use of the financial indicators in strategic decision making.
Communication was noted as a key characteristic found in successful financial
officers needing to educate and inform the board on financial matters. The president at
Institution #6 explained, “CFOs need to be great communicators, and they’ve got to be
willing to share the information to keep the Board informed and to keep, certainly, the
president and his or her cabinet informed.” The president went on to explain that the
financial officer needs to “stay on top of your figures on a daily basis. It’s got to be
accurate, it’s got to be timely, and I think it’s got to be transparent.”
Institution #1’s president noted that the ideal financial officer needs to both have a
great grasp of financial details and be able to lead and facilitate a board retreat.
120
Institution #5 added that an effective financial officer is able to present the financial data
in a manner that makes it as simple as possible and as easy to understand as possible.
To facilitate new board members’ understanding of financial management in
higher education, new board member orientations included formal presentations by
financial officers. Institution #5 includes a discussion on fund accounting, which is
unique to not-for-profit organizations. The president explained, “In the last few years, we
have tried to institute a good orientation program. . . . Just to give the board, new board
members, a starting point for how we do accounting in a college setting.”
To effectively meet the challenges in higher education, the presidents agreed that
financial data were critical. The president at Institution #6 summarized this as follows:
The CFO is at the center of the strengthening effort. I don’t mind the challenges,
I just want to make sure I have the information that allows me to make some
decisions and perhaps provide a bit of leadership for the team that can address the
issues.
The president at Institution #1 looked at the challenges in higher education as a
shift in the business model and the need to develop a sustainable financial model. The
president described the current business model by saying, “Most companies don’t rely on
loans to 18 year olds with no credit history and no income to sustain their business
model, so it’s a little different.” Institution #2 added, “I don’t think small privates are
going to remain competitive if they can’t have processes that bring greater clarity to
efficiencies and effectiveness.”
In utilizing financial indicators to guide and educate the governing board as part
of the strategic decision making, the impetus came from the president, the financial
officer, or a combination of the two. At Institution #2, the president brought a unique
perspective based on an “inherent interest in analytics and statistics.” Already holding
121
terminal degree, this president sought a master’s degree in business administration five
years earlier. The president explained, “Colleges are very complex places with multi-
million dollar budgets and there about the only place that would hire an unqualified
[candidate] as their CEO, with little or any financial background. And you know how
complex schools are becoming finance-wise these days.” From his business education,
the president noted that the financial officer and the president “were able to talk in the
same language and [were on] the same wavelength.”
This shared understanding provided a foundation to further the use of financial
data, and specific financial indicators, at the institution. The president noted:
These innovate approaches are not going to work without the president’s
leadership. Because I think that specifically most boards are not going to require
it [specific financial data] in opposition of the president and I don’t think that
most CFO’s are going to be able to pull it off without the support of the president.
So I think the president does play a key role.
Presidents recognize that introducing new financial tools such as financial
indicators, takes time to develop a level of awareness and understanding and is a process.
Small private institutions lack the human resources of large institutions. For example, the
president at Institution #2 noted that large institutions with twenty thousand, thirty
thousand, or forty thousand students have business officers who focus solely on
forecasting. The limited spread sheeting skills reside mainly with the financial officer,
with the controller being next in line. At a small private teaching college, analytics is
“thin” when compared to a large research institution.
The process for implementing a new financial tool can be described by the
president of Institution #2 as follows, “I’m a pretty strong advocate in saying, let’s take
three steps forward, one step back, so we would press ahead, and press ahead. And then
122
we’d say, OK, I guess that data we’re going to have to wait a year to put together.”
Given these limitations, however, the president added that the small college is “actually
more agile” than the larger institution, or even a corporation, in being able to make
changes.
The president at Institution #2 was a major advocate for using financial indicators
at their institution in strategic decision-making. The president found that “senior officers
of any college have to move from being merely operational, to being more visionary and
strategic, and it’s not common.” Besides promoting the use of the balanced scorecard at
their institution, the president actively shares this tool with other institutions recognizing
the financial challenges that all small private institutions face. The president explained,
“It [balanced scorecard] has been powerfully, transformational in our campus, and in our
governance, and in our strategic advance. And so, I would love to see more people adopt
it.”
Institution #1 on the other hand uses the CFI to guide the governing board in
focusing on specific financial data pertinent to strategic decision making. The president
explained, “Trustees do need help focusing on OK, what’s the important number here.
My impression is that board members don’t always know what they should be looking
at.” The financial officer at Institution #1 provides this needed guidance through
“summarizing a lot of data in very pertinent and useful ways.”
As with Institution #1, the financial officer at Institution #5 provides focus to
important financial data to the governing board. In using the CFI at Institution #5, the
president elaborated on the financial indicator’s value in strategic decision making at the
board level. The president explained, “It has been something that we, the board, have
123
continued to refer back to, as we’ve been having strategic discussion about moving
forward. We do keep referring back to our strength and how do we tap that strength for
strategic growth?” Institution #5 has achieved the maximum CFI score of 10.0, placing it
in well into the category to allow innovation.
The CFI has been incorporated and accepted at Institution #5 as an important
financial indicator to guide the governing board in strategic decision making and
influence strategic direction of the institution. According to the president, discussions
with the governing board currently focus on “How do we use those strengths that we
have in terms of our financial position to help further the mission of the college?” The
use of the CFI at Institution #5 is a clear example of how financial indicators provide a
vehicle for driving institutional mission based on the awareness and understanding of the
level of financial health that the financial indicator measures for institutional leaders.
Summary
Chapter IV presents an analysis of data collected in this multi-case qualitative
study about the use of financial indicators in strategic decision making. Interviews with
six institutions representing six financial officers, four presidents, a provost, and six
trustees offer insights into the perceptions of each group in the effective use of financial
data. These findings provided the researcher with an in depth understanding to answer
the Grand Tour Question and research sub-questions in this study as presented in
Chapter V.
Financial officers, trustees, and presidents of all six institutions studied confirmed
that financial indicators are used to guide and educate members of their governing boards
as part of the institutional decision-making process. Each institution did this through
124
focusing on a specific financial indicator or combination of financial indicators. This
focused attention effectively addressed barriers that have been found to hamper use such
as lack of time, understanding, and interest as found in the literature.
One example of such a barrier was the lack of time. The data from financial
officers indicated that there is substantial time required to prepare the financial indicators
and that it takes substantial time to introduce and use such data for strategic decision
making with their governing boards. The use evolved over the course of many years, and
the financial indicators used are narrowly defined. Another barrier was the complexity of
financial data. Accordingly, the presentation of the financial data needs to be done in a
clear and simple manner, both at a high summary level and with sufficient detail to
support transparency and important element in promoting understanding.
Trustees reiterated the importance of simple and clear presentation with full detail
to aid transparency. A board committee structure that placed financial experts on the
finance committee contributed to a higher level of understanding and a greater capacity to
ask questions. Both trustees and presidents noted increased intentionality in their
strategic recruitment of new board members. This was in the interest of building
financial capacity to address the institution’s increasing regulatory and compliance needs.
New board members also brought an increased level of financial understanding and
experience in using financial indicators in strategic decision making.
Serving as the bridge between the financial officers and governing boards, the
institutional presidents promoted transparency in sharing financial data with the board to
increase understanding in strategic decision making, as well as to limit surprises from
adverse financial issues. Additionally, the president supported interaction between
125
finance committee chairs and the financial officer to address questions and plan finance
committee meetings. All presidents supported board engagement and noted the
importance of the committee structure in facilitating board strength and directing
financial expertise towards the use of financial indicators on the finance committee.
Chapter V continues with further discussion on how the financial officer, trustee,
and president perceptions promote the effective use of financial indicators to educate and
inform the governing board in strategic decision-making. Conclusions and
recommendations for helping financial officers at other small, private institutions
promote best practices in using financial indicators are also key components to
Chapter V.
126
Chapter V
Conclusions and Discussion
The CFO has to have his or her finger on the pulse, the financial health of the
institution.
- President at Institution #6
Overview
This chapter presents the conclusions and discussion of the research study.
Included is a synopsis of the study, discussion of key findings, answers to the research
questions, recommendations for best practice and further research, limitations to the
study findings, and brief concluding remarks.
Research Study Synopsis
Chapter I presents the concept of using financial and key performance indicators
in strategic decision making and provides a framework for understanding the difficulties
in managing small private institutions in today’s economic environment. The first
chapter defines the study’s purpose: To identify the use of financial and key performance
indicators in strategic decision making by institutional leaders entrusted with guiding the
fiscal health of small private four-year institutions with long-term investments less than
$100 million and accredited in the United States. Furthermore, the study investigated
how six institutions use financial indicators in order to identify best practices that can be
shared with other financial officers to improve the use of financial data to inform
strategic decision making. The first chapter explains why this study has significance, in
that it can provide a map for financial officers to guide them in providing meaningful
financial data to their governing boards that will support strategic decision making.
127
In Chapter II, the history of financial indicators is provided to explain the
development of financial ratio analysis in the not-for-profit sector in the 1970s and how it
has evolved in higher education since that time. Various research studies are presented to
illustrate the themes in using financial indicators and the barriers that have inhibited
greater and more effective use.
A detailed description of the research methodology is found in Chapter III. The
researcher provides a thorough review of this multi-case qualitative study, which uses a
two-phase explanatory design. It is based on an online survey to identify the sub-
population of financial officers who self-identify as using financial indicators in strategic
decision making.
The online survey was sent to 214 financial officers who represent private
institutions in the North Central Region of the Higher Learning Commission with student
enrollment levels of 4,000 and less, and endowment levels less than $100 million. This
population was seen as more vulnerable to external factors of financial stress. They are
highly tuition-dependent with inadequate reserves to weather long-term financial storms,
making any downward shift in enrollment more difficult to manage financially.
The second phase of the research study explored six institutions selected by the
researcher using purposeful sampling. The researcher selected the institutions based on
compelling examples provided in the online survey of how the respondents use financial
indicators in strategic decision making. Besides in-depth telephone interviews with each
institution’s financial officer, trustee, and president, the researcher also obtained
unobtrusive data such as financial analyses and reports from the financial officers,
128
strategic plans, histories, and leadership profiles from the institution’s website, as well as
other financial data available on other public websites.
Chapters IV and V describe the findings and themes that emerged from the study,
as well as key conclusions and recommendations for best practice and further research.
Conclusions and Discussion
This section provides conclusions to the study by answering each research
question while incorporating findings from the literature review. These conclusions form
a foundation for later recommendations the researcher hopes will assist financial officers
in promoting institutional financial health.
From the online survey, respondents indicated that all institutions gather data,
including financial and key performance indicators, but not all utilized data for decision
making. The ratios most survey respondents computed measured level of tuition revenue
dependency, enrollment trends, and institutional aid rates. Less than half of all
respondents, however, computed ratios to measure endowment levels. Given that the
population represented institutions heavily tuition dependent with small endowments, the
respondents computed financial indicators measuring those factors with the greatest
impact on an institutions’ financial health: tuition, enrollment, and discount.
From the online survey, 31 respondents, or 39%, indicated that they had an
example of using financial indicators to inform decision making. This meant that 61% of
respondents did not such an example. Accordingly, the majority of respondents indicated
that they did not utilize financial indicators for strategic decision making with the
institution’s governing board.
129
For the six institutions in Phase II of the study, financial indicators were used in a
joint effort with the financial officer in a supporting and educating role and the president
in a leadership and gatekeeper role. The outcomes were still mixed, however, in regards
to depth and extent of use. Financial officers struggled with barriers of lack of time,
limited understanding and interest by the president and governing board, as well as an
institutional culture that accepts change slowly and works from a basis of tradition. The
financial officers at each of the six institutions initiated the use of financial indicators and
persevered in navigating the barriers as an institutional “change agent.”
Overall, financial officers are responsible for preparing accurate, timely financial
data that includes focused use of selected financial indicators and presenting it to decision
makers (such as the institution’s president and governing board) in a manner that is
understandable and supports strategic decision making. Financial officers, however,
defer to the president in which financial indicators are allowed to flow to the governing
board. And whereas the financial officer has the highest level of expertise in financial
management in higher education, the president, with the least financial expertise, is the
gatekeeper to financial indicator use.
To create awareness and understanding from financial indicators, a number of
barriers as defined in the literature were addressed. These barriers were found at each of
the six institutions studied but were managed effectively in order to promote financial
indicator use. Financial officers however had to persevere to be successful and were
surprised to find the slow pace, lack of willingness to change, and traditional think that
exists in higher education. Overall, the use of financial indicators is a team effort based
130
on the financial officer’s expertise, president’s support, and focused attention by the
finance committee of the board of trustees in planning and decision making.
The results indicated that financial officers at the six institutions brought the
expertise and experience that Redenbaugh (2005) found was significant in promoting the
use of financial indicators at small private institutions. Significant factors included
certifications such as a CPA or CMA, and private or public accounting experience. In the
study, all financial officers held master’s degrees in business and had worked in corporate
for-profit enterprises in accounting or financial positions. Five were CPAs and two were
continuing their education at the doctoral level. The average tenure of these individuals
within the institutions studied ranged from 4 to 19 years.
The financial background of the six financial officers supported Redenbaugh’s
(2005) recommendation from the literature review to hire experienced accountants from
public or private accounting firms. Such work experience was found to address the
barriers that inhibited the use of financial indicators and was a significant factor in using
management accounting tools, management accounting tools simply being expanded
multi-tiered financial ratio analysis.
In order for financial officers to be effective in promoting the use of financial
indicators and management tools in decision-making, Redenbaugh (2005) recommended
that financial officers become a “change agent” in communicating the value of such use
with colleagues and through education of the board of trustees. The study results
revealed, however, that the financial officer does not act alone as the change agent.
Instead, the president must support the financial officer’s use of financial indicators and
131
allow such use with the trustees. In this manner, the president acts as a gate keeper to the
use of financial indicators in strategic decision making by the board.
While presidents noted that they hired financial officers who were qualified to
lead the financial function of the institution, the president still acted in large part as
catalyst and proponent of the use of financial data within the governing board.
The president at Institution #2 best expressed this when the president
explained:
These innovative approaches are not going to work without the president’s
leadership. Because I think that specifically most boards are not going to require
it in opposition of the president and I don’t think most CFOs are going to be able
to pull it off without the president’s support.
When the president does support the use of financial indicators with the board, to
succeed in providing useful financial data to the president and governing board, the
financial officer must work within a culture that accepts change slowly, and work from a
basis of tradition. Redenbaugh (2005) found the static culture of the institution and lack
of willingness to change as two barriers to using financial indicators. The results of the
study revealed that all six financial officers experienced these two barriers that prolonged
the introduction and acceptance of the use of financial indicators. These barriers however
did not stop the financial officer from their efforts in using financial indicators. Through
an intentional and ongoing management of barriers, the financial officer persevered in
using financial indicators at the six institutions.
The financial officer at Institution #4, for example, referred to these barriers as
“traditional thinking” while at Institution #5 the financial officer found such barriers a
“hamstring” to innovation and creativity. In order to manage such barriers, the financial
officer at Institution #4 found that the addition of a new compliance officer freed the
132
financial officer to be more “refreshed” and allowed to pursue creative thinking that they
could share at board meetings.
The frustration of these barriers, however, can be heard in Institution #5 financial
officer’s statement, “If I had known what higher education was like before I came here, I
would never have come.” At Institution #3, there was both a level of awareness and
acceptance of these barriers as the financial officer explained, “So it’s just like anything,
you have to hear it for years, over and over again.” The trustee at Institution #2 affirmed
the existence of these barriers by the statement, “It’s not common to have something like
this [balanced scorecard] available. I think it is just going to take some time for board
members to get comfortable with it.”
Besides promoting use of financial indicators with the institution’s president and
board, the financial officer must address cultural reluctance to change both within faculty
and staff. Part of this communication is in explaining the value of such tools. For
example, the use of the balanced scorecard at Institution #2 began at a small level with
the governing board, but as the scope of the scorecard grew to cover a broader area of
performance indicators, the president’s cabinet of senior management needed to
understand the benefits to the institution in putting such a tool in place. Additionally, the
financial officer needed to consider the natural inclination not to want to be “measured”
by faculty and staff. This was also noted by Institution #2’s trustee. In order to create
greater buy-in, the financial officer had to promote realistic goals and develop a
streamlined method to compute performance measures each quarter.
Besides cultural tradition and lack of willingness to change, the financial officer
must have an ability to explain financial data in a manner that is understandable to
133
presidents and trustees who do not have the same level of financial expertise in higher
education. In the study, the financial officer was found to have the highest level of
business acumen for financial management in higher education. The chair of the finance
committee was second with substantial financial expertise, but in corporate rather than
not-for-profit organizations. And the president was third in level of financial
management expertise in higher education, having professional experience and academic
credentials in non-financial areas.
To manage the varying levels of financial expertise, the board of trustees directed
those members with business acumen to the finance committee. In the study, of the six
board members interviewed, five were the current or past chair of the finance committee
with one a long-standing member of the finance committee. All were corporate
executives. Four were presidents and/or owned their own companies. Three had either
an MBA degree or a CPA. None had professional experience working in higher
education or non-profit organizations, except for their role as board members.
New trustees were sought for their specific financial and accounting expertise in
order to build greater strength in the finance committee to manage the increasing
compliance and regulatory requirements placed on higher education today. At Institution
#1, the financial officer explained, “Under our president’s leadership, we’ve improved
the experience level of our board significantly.” The trustee at Institution #1 noted, “If
you’re serving on the finance committee, the first thing would be for the membership
committee to really place folks that have a bent or some form of expertise on it.”
Institution #5 actively recruits expertise for its finance committee. The president noted,
134
“We try to recruit people with specific expertise and not just have anybody on the finance
committee.”
The placement of board members with financial acumen on the finance committee
was part of an overall strategic committee structure of the board. The trustee at
Institution #1 explains this phenomenon. “It’s hard to do business with 30 people sitting
around the table together, so it’s helpful to have the reliance in our case on the committee
structure, and expertise and time that those committees put in.” And as the trustee from
Institution #2 acknowledged when considering the full board, “Many do not have a high
level of understanding of financial matters” thus the importance of assigning those with
financial acumen to the finance committee.
The practice of targeted assignments also served to address the barrier
Redenbaugh (2005) noted as lack of interest in using financial indicators and
management accounting tools. The trustee at Institution #2 conferred, “Board members
not on finance are less interested in financial matters.” At Institution #3, the trustee
provided this summary, “Committee structure makes board governance more efficient,”
with the trustee at Institution #4 adding, “It is really [board] committees that drive
things.”
While an institution aggregates its financial interest and expertise on the board to
receive and use financial data, study results indicated the importance of financial officers
preparing summarized and succinct financial reports. Talboys (1995) found that the
presentation of financial data needed to be organized and that basic financial data
provided to the board was too complicated, out-of-date, or lacked a consistent format. In
135
presenting the financial data in a meaningful way, financial officers often used graphical
displays, comparative analysis with peer and other institutions, and trend data over time.
As Talboys (1995) recommended in the literature review, financial data need to
be organized to be useful to decision makers, as well as descriptive of the “financial
story” of the institution. All financial officers in the study reiterated these two points in
various ways. The financial officer at Institution #1 noted, “It has to be simple, it has to
be clear.” At Institution #3, the financial officer uses graphics to present financial data,
especially for comparative analysis and trend data. The financial officer explained their
use of graphs by saying, “The graph tells the story, so to speak.”
As Lee (2008) advocated, financial data were prepared using a limited number of
financial indicators that had been selected as most meaningful to understand and track.
Two institutions focused their attention on the Composite Financial Indicator (CFI) (a
financial measure based on a blending of four key financial ratios), two on the
contribution margin, and one on a balanced scorecard (a management tool that includes
impact, learning, retention, and affordability indicators). This narrow focus then allowed
financial officers to direct the time and attention of the governing board on the financial
indicator(s) seen as an “independent and respected management tool” as noted by the
financial officer at Institution #2. The end result was to streamline understanding and
allow institutional leaders to answer simple questions about the institutions’ fiscal health
based on a specific financial indicator.
For Institution #2 with a maximum CFI score of 10.0 trustees understood the
score represented an institution with a strong balance sheet that could innovate. Thus, the
136
financial officer, president, and trustee were all able to be aligned in their focus to
promote innovation at the institution, driven by the results of the CFI.
The literature did not however address how the financial data was explained to
decision makers, nor the skills required for effective delivery. The study findings
indicated that for all the institutions studied, the financial officers were seen as effective
in their presentation skills. As the key educators in creating the awareness and
understanding of financial indicators, such communication and presentation skills are
critical.
The president at Institution #1 captured the level of a financial officer’s success as
being able to lead and facilitate a board retreat. The president at Institution #2 clarified
why such presentation skills were viewed as unusual for financial officers. The president
noted, “Andrew [pseudonym] is unique in his personable, engaging leadership level that
is not the norm of CFOs I have met.” At Institution #3, the trustee noted that their
financial officer is a very good public speaker. So besides the financial expertise from
credentials and professional experience that Redenbaugh (2005) found, today’s financial
officer has additional skill sets required for the position.
Both Talboys (1995) and Lee (2008) found the need for financial officers’ to
provide high-level, but simple summaries of complex financial data. Study results
however, found that institutional decision makers still require detail data to be available
along with the summaries in order to support full disclosure or “transparency.” This was
noted by all three groups interviewed in the study.
The financial officer at Institution #4 explained, “There is no mystery to where
my numbers come from.” The financial officer provides detail for summary data and was
137
unique in the collaborative approach and joint effort with the provost office in developing
such financial data. The president at Institution #5 found transparency is especially
important in today’s management of higher education. The president explained:
I think the biggest thing is probably transparency and Boards can’t help you if
they do not know the condition of things financially. . . . Boards don’t like
surprises, and I think transparency, being forthright with the Board.
The trustee at Institution #1 confirmed, “We have the opportunity to look at as
much detail as we want.” Additionally, the same financial data is shared with all board
members and not just the finance committee members. Institution #3 uses an appendix to
provide financial data for board members who want to drill further into the details.
Redenbaugh (2005) also noted the shortage of time and resources as barriers to
use of financial indicators and management tools. From the study results, financial
officers rely mainly on themselves to prepare and deliver the financial reports to the
Board. The theme of time was a very real impediment to the financial officer. It was not
a problem for the president or trustees, who appropriated more time either within meeting
agendas or in adding more meetings to provide for sufficient discussion.
The available time of the financial officer, however, would be impacted by longer
board meetings or an increased number of meetings given that the financial officer
prepares the financial data and materials for the board. The barrier of time accordingly
became a catch-22 for the financial officer as insufficient time at the board level resulted
in more meetings or longer meetings, taking away the already limited availability of time
from the financial officer required to provide financial data and reports to the board.
In the literature, financial indicators must be tied to planning to be considered
strategic (Chabotar, 2006). At Institution #3, the financial officer tracked the CFI to
138
improve the ratio. The financial officer noted that the budget was intentionally prepared
so that analysis of financial results would tie back to the CFI. This allowed decision
makers to understand institutional progress as measured by the CFI, and to chart goals to
further improve financial health. This was done through an intentional process presented
by the financial officer, supported by the president, with buy-in by the governing board.
As discussed previously, without the president’s support, a financial officer would not be
able to promote the use of a new financial indicator with the governing board.
This was clear in the use of the balanced scorecard, which Institution #2’s
president prioritized. The financial officer then led the development and implementation
of the management tool at the institution based on the financial officer’s expertise and
ability. Informing the governing board, however, took many years. The process started
with a short list of six financial indicators that grew into a full-fledged balanced score
card based on financial and performance indicators that drove the success of the
institution.
Promoting the use of the tool by the faculty and staff required small steps of buy-
in. Demonstrating the usefulness of the tool allowed the financial officer to expand the
scope of the balanced scorecard to use in a more comprehensive manner. The institution
is now considering the expanded use of the balanced scorecard at the division,
department, and desk level, referred to as the 3-Ds by both the institution’s president and
its financial officer.
Shortage of time (Redenbaugh, 2005) continued to come up as a barrier for
financial officers throughout the study. To combat the time and effort involved for
management to prepare data, the financial officer at Institution #2 was in the process of
139
implementing a new financial system to be completed the summer of 2012 that will
provide the means of easier access to data. This was important to staff, who found it
burdensome to prepare financial data that was hard to access. Additionally, a change was
made to compute financial data quarterly instead of monthly. This was expected to
reduce the burden of more frequent computation and reporting. Since the data did not
change substantially from month to month, the extra effort was not worth the time.
Trustees also acknowledged the limitation of time on the financial officer in
pursuing new ideas and suggesting expanded or different financial indicators. Trustees
noted that the limitation did not reflect on the financial officer’s capabilities, but the lack
of available time the financial officer had to devote to something new. Institution #6
explained, “If I asked the financial officer to go in and do something different, that is
very difficult, not because the financial officer doesn’t know how to do it, it’s a question
of does the financial officer have the time to do it.” The barrier of time continued as a
loud and clear obstacle to be managed by the financial officer.
In Chapter IV, the researcher discussed the data collected in the study organized
around the perceptions of the three types of participants: financial officers, trustees, and
institutional presidents. The researcher also reviewed the data to offer insight into
practices that work for the six financial officers in providing meaningful financial data to
their governing boards and how the three groups address and/or overcome the barriers in
the literature review that prohibit such use. This Chapter offers conclusions by answering
each of the research questions with supportive findings from the literature review. These
conclusions offer a foundation upon which the researcher will later recommend best
140
practices for financial officers to use at other small private institutions. Lastly, the
researcher provides recommendations for future research at the end of the chapter.
The use of financial indicators in strategic decision making. The early
research questions of this study focused on what financial and key performance indicators
institutions use and how institutional leaders employ this data to inform strategic decision
making and create awareness and understanding. Through exploring the perceptions of
three groups -- financial officers, trustees and institutional presidents -- the researcher
hoped to understand how the three groups came together in using financial data for
strategic decision making.
In general, financial officers are responsible for preparing and delivering the
financial data to the president and governing board. The financial data, however, must be
presented in a manner that is clear and easily understood. Financial officers are also
expected to educate and inform their boards as to what the data mean and what is
important to know. In partnership with the president, the financial officer can create
meaning from financial indicators. Without the president’s support, the financial officer
would not be able to promote such use at the board level.
Essentially, the financial officer is the facilitator of financial indicator use, while
the president is the gatekeeper that allows the flow of financial data to the governing
board. The board is the ultimate user in approving strategic direction based on the
financial indicators. Together the three groups combine to use financial indicators more
effectively for strategic decision making in guiding institutional health.
Through in-depth interviews, the researcher explored the unique role of each
group and how the groups worked together to use financial indicators effectively at their
141
institutions. The findings from these interviews allowed the researcher to answer the
research questions as outlined in Chapter I and presented below.
Research questions answered.
Grand tour question: Do small private colleges and universities in the
Midwestern United States gather data, including financial and key performance
indicators? Results revealed that presidents and their financial officers recognize the
value of financial indicators in educating their governing boards to make informed
decisions. These results support Chabotar (1989), who reported ratio analysis as
invaluable to stewardship and accountability, as well as Redenbaugh (2005), who
recommended that financial officers become change agents and educate the board on the
value of financial tools.
While the targeted use of financial indicators in strategic decision making may not
have been the case in earlier years with the financial officers under study, each institution
interviewed reiterated the current importance of focused financial data in strategic
decision making. Such focused use conforms to Talboys (2005) research, which
advocates ratio analysis be presented in a format that is simple, consistent, and selected
based on the specific characteristics of the institution due to institutional diversity. When
financial indicators were ignored however, resulting decisions could have far reaching
negative outcomes.
At Institution #6, for example, the governing board had made a significant
decision, more than a decade earlier, with complete disregard to the financial officer’s
ratio analysis. The financial officer recalled the board’s “ignoring financial ratios,
142
trustees overrode me, and they overrode our audit firm, and ignored and used for-profit
ratios to determine the value of the entity we were buying so we grossly overpaid for it.”
After years of work to recover from that decision (which resulted in financial
hardship on the institution), the financial officer reported that the situation has completely
changed. The financial officer currently provides a traditional package of financial
statements with a summary narrative and contribution margin analysis to the board. At
board meetings, the financial officer also provides oral highlights on the financial data
and answers questions. The financial officer noted, “They may not know all the terms,
but believe me, they understand the cash flow and how to identify your source of revenue
and your main expenses. We get a lot of good questions from the board that we used not
to get.”
From the president’s perspective of Institution #6: “We’ve created a very, very
transparent financial reporting system here that the university never had, and a lot of
universities don’t adopt.” After taking over from a long-term president who
unexpectedly passed away, the president found a board that was neither informed nor
functioning. The new president outlined for the board the nature of their governance role.
The president then directed the business office to provide financial reports to budget
managers to monitor spending data, to the president to inform financial health on a
regular basis, and to the governing board for strategic decision-making. Financial data
was an essential part of the strategic decision making process.
The trustee from Institution #6 confirmed the outcome of the change in strategy.
The trustee noted the importance of the cash flow projection that the financial officer
143
prepares annually, along with the contribution margin analysis. And the trustee noted the
distinct role in governance at an institution when explaining as follows:
But here’s the thing, you cannot, as good as the CFO might be, I’ve got more
responsibility, I think as a director or trustee, to not only trust that he is doing it
right, but to at least provide some kind of oversight in saying did he miss
something here? Because we all make mistakes and it is easy, as something as
complex as a financial institution, it is easy to miss something. So I would not at
all be happy to just hear, oh, everything’s OK. I’ve heard that before, and it
doesn’t flow well with me.
The situation had changed from a governing board that did not use financial
indicators to inform decisions to one where the financial data became essential and the
board’s role clear that good decisions were being made for the institution on complete
financial data.
Research sub-question #1: What financial and key performance indicators do
institutions gather and how do institutional leaders use this data to inform strategic
decision-making? The use of financial indicators has influenced strategic decision
making by informing the president and governing board of the financial health of the
institution. When the financial health is shown as unsatisfactory, based on levels of
computed ratios, the institutional leadership will make decisions that strategically
promote improved financial health. Monitoring financial indicator outcomes is an
effective way to track the progress and success of the strategies set in place and measure
financial health (Chabotar, 1989).
At Institution #3, for example, the Composite Financial Index (CFI) was used to
promote increased financial health. The institution’s chair of the governing board noted
that the CFI was used to bring the institution back to a balanced budget. The trustee
144
explained, “we went from losing money a couple of years ago, to being in the black the
last two years – and we’re projecting a budget surplus as well for this year.”
The advantage to the institution of the CFI is that a consortium (to which the
institution belongs) monitors the CFI for its members and shares detailed data each year
with all members. This allows member institutions to compare their own financial
health, as measured by the CFI, with other member institutions, and to track this
measurement over time.
The financial officer at Institution #2 recently sat a panel for a webinar presenting
the CFI and discussing how the CFI can inform strategic decision making. The financial
officer referred to the CFI as “an independent and respected measurement tool that
everybody else is watching, too.”
At Institution #5, which also focuses on the CFI, the financial officer presented a
PowerPoint presentation to the full board at its semi-annual meeting in the spring of
2011. This presentation provided a full understanding of the CFI and a review of the four
financial ratios that comprise the CFI, along with peer data rankings. Because the CFI
score at this institution indicates an institution with the capacity to innovate, the president
and the board focused their attention on innovation, and how increasing innovation can
be accomplished given declining enrollments and constraints within the tuition-dependent
operating budget.
The trustee from Institution #5 explained a dilemma that had surfaced in using the
CFI. “We have a strong balance sheet and our balance sheet would support additional
debt. The conflicting area, though, is that our income statement doesn’t seem to reflect
the capacity to expand interest expense.” According to Lee (2008), the CFI computation
145
needs to be disaggregated because the complexity of ratio analysis makes drawing
accurate conclusions difficult.
Chabotar (1989) also cautioned the use of ratio analysis in drawing conclusions
without further analysis. Institution #5 is at the threshold of considering how the
conclusion based on the results of the CFI conflicts with apparent limitations. Thus, the
use of financial indicators influences strategic decision making, but as Talboys (1995)
also noted could present a limitation. Ratios need to be considered in context with the
entire institutional environment to be more fully understood by decision makers.
Accordingly, the ratio or financial indicator is not necessarily the end of the story.
Institutional decision-makers must link financial data to planning to form context
and create a meaningful story. Chabotar (1989) explained that without a connection
between the financial indicators and strategic plans, financial indicators simply present
trend data without providing further understanding that would inform and support
strategic decision making. This lack of connection leaves financial indicators as a mere
historic measurement tool and not one that informs the governing board in setting the
future direction of the institution.
In using the balanced scorecard at Institution #2, the president noted the important
tie between this management tool and strategy at the institution. The president explained,
“we’d like alignment so that things that happen in a department and on someone’s
individual desk align with the strategic direction, as demonstrated by your institutional
scorecard.”
The trustee at Institution #2 confirms that president’s assessment of the
importance of the balanced scorecard in driving mission. The trustee noted,

146
but all of a sudden, through a tool like this, their accountabilities are much more
brought out in the open, and I think that, over time, that really helps to improve
the sense of team, the sense of collaboration among the various pieces of the
organization.
The president at Institution #2 goes on to examine how this financial tool was
developed and why it is remarkable and effective in driving mission at the institution.
The president recalled in talking to the financial officer:
You have a remarkable ability to consolidate the financial health and strength and
perspective on a single side of a single sheet of paper. He said (you know), when
we were a 40 billion dollar organization at ABC Corporation [pseudonym], we
would put the entire perspective on one piece of paper.
The president concluded, “I don’t think that the small privates are going to remain
competitive if they can’t have processes that bring greater clarity to efficiencies and
effectiveness.” The president found that having a balanced scorecard builds capacity for
small private institutions to think strategically.
The trustee at Institution #3 summarized the reason small private institutions are
committed to institutional mission. “This is really a people business. And our devotion
to students, that’s what drives all of us.” For the researcher, that is the beginning and the
end of the story.
Research sub-question #2: How do small private universities and colleges
create awareness and understanding from financial and key performance indicators?
Financial indicators need to tell a story. From the literature, that story can include
blended ratio analysis such as the Composite Financial Index (CFI) (Lee, 2008) or
comparative and trend analysis (Buddy, 1999; Chabotar, 1989), while presented in a
format specific to the institution’s needs and characteristics (Lee, 2008; Talboys, 1995).
All six institutions in the study presented their financial health using such tools, but in a
147
manner and format applicable to their institution due to the institution’s unique
characteristics, or “diversity” (Talboys, 1995).
Part of the way financial officers told that story in the study was through graphical
presentations, comparative analysis, trend data, and benchmarking. The financial
indicators were shared with the university community through presentations to faculty
and staff at town hall meetings, and was made available on the intranet for 24/7 employee
access, in dashboards shared with the trustees, and in presentations at full board meetings
and in new board member orientations.
The theme of transparency was stressed by a number of financial officers and
presidents during their interviews. This theme was new to the literature, and may have
resulted from the passage of the Sarbanes-Oxley Act in 2002 as a result of a number of
corporate and accounting scandals in the United States.
To promote transparency, Institution #1 board meetings included student
representatives. Additionally, members of the university community outside of the
president’s cabinet were able to attend and present at board meetings to keep the
governing board informed. This was noted as important, as board members do not
necessarily come from academia or understand the higher education industry. Opening
attendance at board meetings to more community members enhanced the story shared
with the board and improved the understanding of all attendees.
In one example, at Institution #4 the provost had presented four priorities to the
governing board that were the focus for academic function. These priorities were
supported by contribution margin analysis that was used by the administration and
prepared in cooperation and collaboration with the academic provost and faculty. The
148
provost had opened up the presentation to include various faculty members, academic
deans, and students. After the presentation, the vice chair of the board exclaimed, “You
know, this has been wonderful because for the first time I understand the product!” The
respondent explained, “It was such an epiphany for him, and one for me too, and for our
president.”
This institution appears to have successfully addressed many of the weaknesses in
the literature review in the use of financial indicators. The institution used financial
indicators to present a story, and did so with various players participating in that story as
part of the presentation to the governing board. Additionally, the data was presented to
the governing board, when too often the data (particularly cost data) is not shared
(Wellman, 2008). The financial indicators were linked to a strategy of focused priorities.
Institutional leadership had overcome the barrier of struggling to identify which financial
indicator to use. This institution chose and implemented contribution margin analysis to
inform strategic decision making.
Talboys (1995) found that the presentation of data must be organized to be useful
as well as descriptive of the “financial story” of the institution. At Institution #4, the use
of financial indicators supported that story so well that it achieved a level of board
understanding not previously reached even by the vice-chair of the board.
Recommendations for Best Practice
The following recommendations for best practice were developed from the
findings. They are intended for financial officers at small private institutions to promote
the use of financial indicators in strategic decision making and to understand the
environment that supports their effective use. The findings from the study promote the
149
following best practices for financial officers working in higher education: (a) focus on a
specific financial indicators such as the Composite Financial Index (CFI), contribution
margin, or balanced scorecard tool to measure financial health at the institution;
(b) ensure that the governing board is educated about the financial indicator so that they
understand the meaning and feel confident in asking questions; (c) be engaging to
promote effective communication of financial indicator data with the governing board;
and (d) share the financial indicator in a context that creates a story tied to the planning of
the institution.
Focus on a specific financial indicator to measure financial health. When
financial officers focus on a specific financial indicator, they are able to concentrate their
time and effort more effectively on creating meaning from financial data. In turn, the
financial data becomes more important in forming a shared understanding to support
strategic decision making.
In the study, financial officers focused on one of the following three financial
indicators to inform strategic decision making: (a) the CFI, a composite of four ratios to
measure financial health; (b) a contribution margin analysis, a tool to gauge operating
performance by program within an institution; and (c) a balanced scorecard, a summary
of non-financial performance drivers and financial ratios. Each was supported by a
combined focus of the financial officer, the president, and the governing board.
Ensure governing boards are educated and understand the financial
indicator. Assuming that the institution has chosen to focus on a specific financial
indicator, the financial officer is best suited to explain and educate the governing board
on the purpose and meaning of the financial indicator. This understanding can be
150
presented in a formal PowerPoint presentation to the full board of trustees and/or through
presentations made at new board orientations. Regular reporting to the board of the
financial indicator, with summary narrative on its meaning, will continue to develop the
financial story that this financial indicator informs. Greater detail regarding the use of
the financial indicator should be shared with the board’s finance committee, whose
members bring a greater depth of financial expertise to the board members in general.
Communicate effectively with the governing board. An important measure of
success for financial officers is whether they are effective in communicating with their
boards. Too much data can be overwhelming to the board, especially when many do not
have the interest in or inclination for financial matters. Thus financial data must be
succinct and meaningful.
More importantly, the financial officer needs to present financial data in an
engaging manner through high-level communication ability. Public speaking and being
able to facilitate board discussion are important skills for an effective financial officer.
Share financial indicators as part of a story tied to planning. Financial
indicators alone do not create a story. Financial indicators must be presented within a
context that tells a story. Part of the story is linking past, current, and future forecasted
financial indicator performance to planning to create a complete story.
In order to effectively tie the use of financial indicators to planning, the financial
officer must incorporate the financial indicators within the goals and objectives of the
institution. In the study for example, financial officers use the Composite Financial
Index (CFI) to promote a balanced budget, the balanced scorecard to increase
accountability and measure outcomes, and the contribution margin analysis to understand
151
operating performance of various instructional programs. Each financial indicator was
intertwined in the story by including it in the planning and using it to measure the
outcomes of the story.
For financial officers that do not use financial indicators in strategic decision
making presently, the best way to begin is to select a small number of ratios to share with
the president and board. As the trustee from Institution #2 recalled, the Institution started
with six financial ratios on a single page which ultimately developed into the balanced
scorecard analysis. The trustee from Institution #3 offered that financial officers ask their
governing boards: “What do you want to see? What’s most helpful to you?” in order to
understand the need and interest of the board. And, as the financial officer at institution
#5 recalled from finding a book on the CFI in the office, “I started learning about it [the
CFI].” With support from a state consortium, the financial officer was also able to obtain
peer data and increase use through comparative analysis.
The key, however, is for the financial officer to take the first step in using
financial indicators. As the “change agent” and as the most knowledgeable in financial
management in higher education, the financial officer must lead the use of financial
indicators (Redenbaugh, 2005). Based on research, over time the financial officer,
president, and board will increase their understanding in the use of financial indicators in
strategic decision making. And as understanding is increased, the use of financial
indicators will expand. When connected to planning, the use of financial indicators will
support strategic decision making.
These recommendations for best practice are practical ways that financial officers
can use financial indicators more effectively in supporting strategic decision making with
152
their presidents and governing boards. For other financial officers who work in small
private institutions, thoughtful attention must be given to how best to serve their
institutions in promoting financial sustainability during these difficult economic times.
Recommendations for Future Research
As the researcher reviewed the literature, it became apparent that there was a
disconnect between the actual use of financial indicators and the perceived value of use in
guiding strategic decision making. Based on data collected from institutions that were
using financial indicators to guide strategic decision making with their presidents and
governing boards, new questions emerged for future research. Four main areas could be
studied: (a) motivators to a president to promote financial indicator use in strategic
decision making, (b) barriers imposed by time constraints experienced by financial
officers in using financial indicators, (c) competency levels of staff who support the
financial officer’s preparing and reporting of financial indicators, and (d) the use of
technology to streamline use of financial indicators.
Motivators to president to promote financial indicator use. In this study,
presidents facilitated the use of financial indicators and extent and direction of that use.
While this finding makes logical sense, given the role of the president in leading the
institution and in being the bridge between the financial officer and the governing board,
it was surprising to the researcher. The importance of using financial indicators was not
driven home to the board by the financial officer who brings the highest level of business
acumen to an institution’s administration. Instead, the president acts as gatekeeper to the
board as to what goes over the bridge and the financial data that is shared with the board
to inform strategic decision making. Because the president can be a major proponent or
153
inhibitor of using financial indicators, further understanding of what motivates presidents
to use financial indicators would be useful in guiding their use in strategic decision
making.
Time as an ongoing barrier. Because the theme of time seems to be a continued
barrier for financial officers who use financial indicators to inform their governing
boards, exploring in greater detail how time limitations can be overcome may provide
financial officers with an ability to utilize financial indicators more effectively and more
often.
When governing boards had insufficient time to discuss financial issues, they
tended to address the time barrier by adding meetings or lengthening meeting times.
However, trustees did voice their need for sufficient time to understand the financial
indicators being reported. In referring to the use of the balanced scorecard, the trustee
from Institution #2 noted, “It’s not common to have something like this available. I think
it is just going to take some time for board members to get comfortable with it.” This
concern may also involve the board’s level of financial understanding, and may touch on
the idea of “traditional thinking” noted earlier in the study by a financial officer at
Institution #4.
Competency of staff. This is a noted barrier in the literature (Redenbaugh, 2005)
with a recommendation for further professional development and hiring experienced
accountants from public and private accounting firms. While this study did not explore
professional development issues, it did, however, explore basic demographic data
provided by the financial officers in regards to financial credentials and work experience.

154
Specifically, five of the six institutions had hired chief financial officers who had
experience in public and private accounting firms. These financial officers also held
CPAs and MBAs. The depth of expertise within the finance office, however, was not
examined beyond that of the financial officer. Given that the financial officers in this
study prepare and report financial data to their boards, it is unclear whether this is due to
the lack of expertise on staff, or whether financial officers prefer to prepare the data
themselves. Understanding this further may address and alleviate the financial officers’
barrier of time that inhibits the use of financial indicators at their institutions.
Technology to support financial indicator use. Only one financial officer in the
study noted that a new computer system was being implemented that would provide more
ready access to data and would result in greater ease in computing financial indicators.
While the subject of technology did not come up except in this one case, the opportunity
afforded by automated systems may be an untapped solution to financial indicator use.
The literature review did not note technology as a barrier, although the focus in the
literature has been on people and not necessarily computer systems. Given the rapid
technological improvements in the past ten years, this may be an area deserving further
study.
Limitations
This study had two main limitations: (a) use of an online survey to identify
institutions for Phase II of the study, and (b) the in-depth study of only six institutions.
The researcher used an online survey to identify the institutions for the in-depth research
in Phase II. The online survey was conducted based on a population of 214 institutions,
of which 87 institutions responded. From the 87 respondents, 31 financial officers
155
answered questions #19 and #20, which formed the basis upon which the selection for
Phase II of the qualitative study was derived. Financial officers that responded to the
survey, but who did not answer questions #19 and #20, may not have taken the time to
provide an example of their use of financial indicators even though they may have had
one to share. Additionally, had more financial officers participated in the online survey,
there might have been more compelling stories than the ones the researcher chose for in-
depth study. Phase II of the study was limited to the results of the online survey.
Phase II of this study focused on 6 institutions in the Midwestern United States.
While there was diversity in states represented, only 6 out of 19 states in the Midwestern
Region of the North Central Association of the Higher Learning Commission were
included in the study. And the Midwestern region represents a subset of the 52 states in
the United States. Expanding the study to further regions of the Higher Learning
Commission may result in similar or different findings. Additionally, expanding the
study to understand how larger institutions, including public ones, use financial indicators
to support strategic decision making may add new understanding to the literature.
Conclusions
For financial officers to use financial indicators in strategic decision making,
financial officers focus on a specific financial indicator that has the president’s support.
The financial officer must present the data in a manner that provides a simple, easily
understood format, while providing supporting detail to aid transparency. The financial
officer bears the responsibility for accurate and timely financial data that will inform the
president and governing board of the ongoing financial health of the institution. The data
must provide historic information, current information, and forecasts. To be successful
156
the financial officer must avoid surprises. Good news and bad news must be
communicated early so that strategic decisions can be made proactively instead of
reactively.
The financial officer can navigate the headwinds, but not alone. The financial
officer is raising the sails, swabbing the decks, and keeping the galley stocked on a daily
basis. Through regular meetings, the financial officer informs the president of the speed
of the ship, conditions of the waters, and threats of mutiny. At regular intervals on the
journey, the financial officer and president work with the trustees in charting the course.
The strategic direction of the institution is set by a collaborative effort of the three
groups, with the financial officer in both a supporting and co-leadership role, the
president in a directing role, and the governing board in a confirming and validating role.
Together, they can navigate a sustainable course in promoting institutional mission.
157
REFERENCES
Association of Governing Boards. (n.d.). The cost project. Retrieved on August 14,
2010, from http://www.agb.org/cost-project
Balanced Scorecard Institute. (2012). Balanced scorecard basics. Retrieved on June 4,
2012, from http://www.balancedscorecard.org/BSCResources/
AbouttheBalancedScorecard/tabid/55/Default.aspx
Berg, B. (1998). Qualitative research methods for the social sciences (3rd ed.). Boston:
Allyn & Bacon.
Blumenstyk, G., & Richards, A. (2010, August 11). 149 nonprofit colleges fail
Education Department’s test of financial strength. The Chronicle of Higher
Education. Retrieved on August 18, 2010, from http://chronicle.com/article/150-
Nonprofit-Colleges-Fail/123878/
Bonham, G. W. (1977). New developments in measuring financial conditions of colleges
and universities: A compilation of papers from a conference. Conference held in
Washington, DC, October 20-21, 1977 sponsored by ACE, NACUBO and NCES.
Brubaker, P. (1979, November). Financial health indicators for institutions of higher
learning: A literature review and synthesis. Technical Report No. 13. Palo Alto,
CA: American Institutes for Research in the Behavioral Sciences.
Buddy, N. J. (1999). Analyzing the financial condition of higher education institutions
using financial ratio analysis. Unpublished doctoral dissertation, University of
North Texas.
Burke, J. M., & Rodenhouse, M. P. (Eds.). (2011). 2011 higher education directory.
Reston, VA: Higher Education.
158
Carnegie Foundation. (2009). Classification description. Retrieved on December 22,
2009, from http://classifications.carnegiefoundation.org/descriptions/basic.php
Chabotar, K. J. (1989, March - April). Financial ratio analysis comes to nonprofits. The
Journal of Higher Education, 60(2), 188-208.
Chabotar, K. J. (2006). Strategic finance: Planning and budgeting for boards, chief
executives, and finance officers. Washington, DC: Association of Governing
Boards of Universities and Colleges.
Chait, R. P., & First, Z. (2011, November-December). Bullish on private colleges.
Harvard Magazine.com. Retrieved on June 4, 2012, from
http://harvardmagazine.com/2011/11/bullish-on-private-colleges
Chronicle. (2010, March 8). Average faculty salaries by field and rank at 4-year colleges
and universities, 2009-10. Retrieved on May 27, 2011, from
http://chronicle.com/article/Chart-Average_Faculty/64500
CollegeBoard. (2008). 2008-09 College prices. Retrieved on December 22, 2008, from
http://www.collegeboard.com/student/pay/add-it-up/4494.html?...
Commonfund. (2008). 2008 HEPI Higher education price index update. Retrieved on
December 22, 2008, from
http://www.commonfund.org/Common/PrintArticle.aspx?918D...
Commonfund. (2010). 2010 HEPI Higher Education Price Index: Table A “Historical
Summary of Higher Education Price Index and Consumer Price Index FY1961 to
FY2010.” Retrieved on May 25, 2011 from
http://www.commonfund.org/CommonfundInstitute/HEPI/HEPI%20Documents/2
010/CF_HEPI_2010.pdf
159
Creswell, J. (2007). Qualitative inquiry & research design: Choosing among five
approaches (2nd ed.). Thousand Oaks, CA: Sage.
Creswell, J. (2009). Research design: Qualitative, quantitative and mixed methods
approaches (3rd ed). Thousand Oaks, CA: Sage.
Creswell, J. W., & Plano Clark, V. L. (2007). Designing and conducting mixed methods
research. Thousand Oaks, CA: Sage.
DeLegge Grandgenett, L. (2007). A quantitative analysis of strategic financial changes
in small private higher education institutions. Unpublished doctoral dissertation,
University of Phoenix.
Dennis, R. (2000). The role of the federal government in public education in the United
States. Retrieved on September 6, 2012, from
http://www.departments.bucknell.edu/edu/ed370/federal.html
DeVellis, R. (2003). Scale development theory and applications (2nd
ed.). Thousand
Oaks, CA: Sage.
Dickmeyer, N., & Farmer, J. (1979, October 1). A design for higher education panel
survey on trends affecting the financial condition of higher education.
Washington, DC: Office of Education.
Dillman, D., Smyth, J., & Christian, L. (2009). Internet, mail and mixed-mode surveys:
The tailored design method (3rd
ed.). Hoboken, NJ: Wiley & Sons.
Education Resources Information Center. (2010). About the ERIC program. Retrieved
on August 13, 2010, from
http://www.eric.ed.gov/ERICWebPortal/resources/html/about/about_eric.html
160
Financial Accounting Standards Board (FASB) of the Financial Accounting Foundation.
(1993a, June). Statement of Financial Accounting Standards No. 116: Accounting
for contributions received and contributions made. Norwalk, CT: FASB.
Financial Accounting Standards Board (FASB) of the Financial Accounting Foundation.
(1993b, June). Statement of Financial Accounting Standards No. 117: Financial
statements of not-for-profit organizations. Norwalk, CT: FASB.
Financial Accounting Standards Board (FASB) of the Financial Accounting Foundation.
(1995, November). Statement of Financial Accounting Standards No. 124:
Accounting for certain investments held by not-for-profit organizations. Norwalk,
CT: FASB.
Fry, R. (2009, October 29). College enrollment hits all-time high fueled by community
college surge. Pew Research Center Publications on-line. Retrieved on February
5, 2011, from http://pewresearch.org/pubs/1391/college-enrollment-all-time-high-
community-college-surge
Gall, M. D., Gall, J. P., & Borg, W. R. (2003). Educational research: An introduction
(7th ed.). Boston, MA: Person.
Gilmartin, K. J. (1984, Spring). Measuring the viability of colleges? Who is really in
distress? American Educational Research Journal, 21(1), 79-101.
Hatch, J. (2002). Doing qualitative research in education settings. Albany, NY: State
University of New York Press.
Hershey, T. (2009). Student housing making the grade with investors. Marcus &
Millichap, National Multi Housing Group. Retrieved on May 27, 2011, from
161
http://www.nnninvestor.com/links/National_Student_Housing_Research_Report.
Higher Learning Commission. (2011). Special conditions affecting affiliation. Retrieved
on December 8, 2011, from http://www.ncahlc.org/Information-for-
Institutions/special-conditions-for-monitoring.html.
Immerwahr, J., Johnson, J., & Gasbarra, P. (2008, October). The iron triangle: College
presidents talk about costs, access, and quality. San Jose, CA: National Center
for Public Policy and Higher Education.
Kaiser Family Foundation. (2011). Trends and indicators in the changing health care
marketplace. Retrieved on February 5, 2011, from
http://www.kff.org/insurance/7031/print-sec3.cfm
Kantrowitz, M. (2011). Debt at graduation for bachelor’s degree recipients. Retrieved
on May 24, 2011, from www.finaid.org/loans/DebtAtGraduation.xlsx
Kaplin, W., & Lee, B. (2007). The law of higher education (4th ed.) San Francisco:
John Wiley & Sons.
Kieso, D. E., Weygandt, J. J., & Warfield, T. D. (2008). Intermediate accounting (12th
ed.). Hoboken, NJ: John Wiley & Sons.
Korsgaard, M. A., Schweiger, D. M., & Sapienza, H. J. (1995, February). Building
commitment, attachment, and trust in strategic decision-making teams: The role
of procedural justice. The Academy of Management Journal, 38(1), 60-84.
KPMG Peat Marwick & Prager, McCarthy & Sealy (1995). Ratio analysis in higher
education: Measuring past performance to chart future direction (3rd ed.).
Amstelveen, Netherlands: Author.
162
Lather, P. (1991). Getting smart: Feminist research and pedagogy with/in the post
modern. New York: Routledge.
Lee, R. A. (2008). Examining financial and non-financial indicators for predicting
private higher education viability. Unpublished doctoral dissertation,
Northcentral University, Arizona.
Lincoln, Y., & Guba, E. (1999). Establishing trustworthiness. In A. Bryman &
R. Burgess (Eds.), Qualitative research: Vol. III (pp. 397-444). Thousand Oaks,
CA: Sage.
MacTaggart, T. (2007). Academic turnarounds: Restoring vitality to challenged
American colleges and universities. Westport, CT: Praeger.
Martin, J., & Samels, J. E. (2009). Turnaround: Leading stressed colleges and
universities to excellence. Baltimore, MD: The Johns Hopkins University Press.
McPherson, M. S., & Schapiro, M. O. (1999, Winter). The future economic challenges
for the liberal arts colleges. Daedalus, 128(1), 47-75.
Merriam, S. B. (1998). Qualitative research and case study applications in education.
San Francisco, CA: Jossey-Bass.
Moody’s Investors Services. (2010, January). Annual sector outlook for U.S. higher
education for 2010. Retrieved on August 12,2010, from
http://www.cic.edu/conferences_events/presidents/2010/resources/US%20Higher
%20Education%20Sector%20Outlook%202010.pdf
Morrill, R. (2007). Strategic leadership: Integrating strategy and leadership in colleges
and universities. Westport, CT: Praeger.
163
Nagy Hesse-Biber, S., & Levy, P. (2011). The practice of qualitative research (2nd ed.).
Los Angeles, CA: Sage.
National Association of College and University Business Officers. (2009). Small
institutions. Retrieved on December 20, 2009 from
http://www.nacubo.org/Membership_and_Community/Small_Institutions.html
National Center of Education Statistics. (1998, March). Fall staff in postsecondary
institutions, 1995. Retrieved on May 24, 2011, from
http://nces.ed.gov/pubs98/98228.pdf
National Center of Education Statistics. (2004, August). Federal support for education
FY 1980 to FY 2003. Retrieved on May 27, 2011, from
http://nces.ed.gov/pubs2004/2004026.pdf
National Center of Education Statistics. (2009). FTE. Retrieved on December 20, 2009,
from nces.ed.gov/pubs98/web/98275.asp
National Center of Education Statistics. (2010a). Table 234. Number of degree-granting
institutions and enrollment in these institutions, by size, type, and control of
institution: Fall 2006. Retrieved on August 13, 2010, from
http://nces.ed.gov/programs/digest/d08/tables/dt08_234.asp
National Center of Education Statistics. (2010b). Average undergraduate tuition and fees
and room and board rates charged for full-time students in degree-granting
institutions. Retrieved on August 13, 2010, from
http://nces.ed.gov/fastfacts/display.asp?id = 76
164
National Center of Education Statistics. (2010c). The condition of education 2010:
Section 5 Contexts of postsecondary education. Retrieved on February 4, 2011,
from http://nces.ed.gov/pubsearch/pubsinfor.asp?pubik = 2010028
National Center of Education Statistics. (2010d). Federal support for education: Fiscal
years 1980 to 2003. Retrieved February 4, 2011, from
http://nces.ed.gov/pubsearch/pubsinfo.asp?pubid = 2003026
National Center of Education Statistics. (2011). Digest of Education Statistics, Table
255. Employees in degree-granting institutions, by employment status, sex,
control and type of institution, and primary occupation: Fall 2009. Retrieved on
May 27, 2011, from http://nces.ed.gov/programs/digest/d10/tables/dt10_255.asp
National Center for Public Policy and Higher Education. (2002). Losing ground: A
national status report on the affordability of American higher education.
Retrieved on August 14, 2010, from
http://www.highereducation.org/reports/losing_ground/affordability_report_final_
bw.pdf
Patton, M. Q. (1990). Qualitative evaluation and research methods (2nd ed.). Newbury
Park, CA: Sage.
Prager, Sealy & Co., LLC. & KPMG Peat Marwick. (2005). Strategic financial analysis
for higher education (6th ed.). Amstelveen, Netherlands, Author.
Prinvale, J. M. (1992). What happens when colleges plan? The use of strategic planning
in four-year colleges and universities. Unpublished doctoral dissertation,
Stanford University.
165
Redenbaugh, M. J. (2005). The use of management accounting tools by chief financial
officers of baccalaureate college-general and master’s colleges and universities
II. Unpublished doctoral dissertation, The University of South Dakota.
Ruben, H. J., & Rubin, I. S. (2005). Qualiative interviewing: The art of hearing data
(2nd ed.). Thousand Oaks, CA: Sage.
Shaw, K. E. (1978). Understanding the curriculum: The approach through case studies.
Journal of Curriculum Studies, 10(1), 1-17.
Springer, G. B. (2010). Creating adaptable universities. Innovative Higher Education,
35(2), 91-99.
Stimpert, J. L. (2004, July/August). Turbulent times. Change, 36(4), 42-49.
Talboys, W. M. (1995). Using financial ratios in the analysis of four private universities
in the southwest U.S.: A case study. Unpublished doctoral dissertation, Colorado
State University.
Tashakkori, A., & Teddlie, C. (Eds.). (2003). Handbook of mixed methods in the social
and behavioral sciences. Thousand Oaks, CA: Sage.
Taylor, B., & Massy, W. (1996). Strategic indicators for higher education, 1996.
Princeton, NJ: Peterson’s Guides, Inc.
Thelin, J. R., Sanoff, A. P., & Suggs, W. (2006). Meeting the challenge: Independent
colleges and universities since 1956. Washington, DC: The Council of
Independent Colleges.
Trow, M. A. (1989). American higher education: Past, present, and future. In L. F.
Goodchild & H. S. Wechsler (Eds.), ASHE Reader on the history of higher
education (pp. 571-586). Needham Heights, MA: Ginn.

166
U.S. Bureau of Labor Statistics. (2011). Economic news release: Employment situation
summary. Retrieved on May 27, 2011, from
http://www.bls.gov/news.release/empsit.nr0.htm
U.S. Department of Education. (2011). Budget process in the U. S. Department of
Education. Retrieved on February 5, 2011, from
http://www2.ed.gov/about/overview/budget/process.html
U.S. Department of Labor. (2011). Consumer price index: All urban consumers.
Retrieved on February 4, 2011, from
ftp:/ftp.bls.gov/pub/special.requests/cpi/cpiai.txt
U.S. National Debt Clock. (2011). Outstanding public debt. Retrieved on December 8,
2001, from http://www.brillig.com/debt_clock/.
Wellman, J. (2008). Strengthening board capacity for strategic financial oversight.
Washington, DC: American Association of State Colleges and Universities.
Wikipedia. (2011). College tuition: Recent trends. Retrieved on May 27, 2011, from
http://en.wikipedia.org/wiki/College_tuition
Williams, J. (2006, Fall). The pedagogy of debt. College Literature, 33(4), 155-169.
Yin, R. (1994). Case study research: Design and methods (2nd ed.). Beverly Hills, CA:
Sage.

167
Appendix A
Visual Model for Explanatory Design
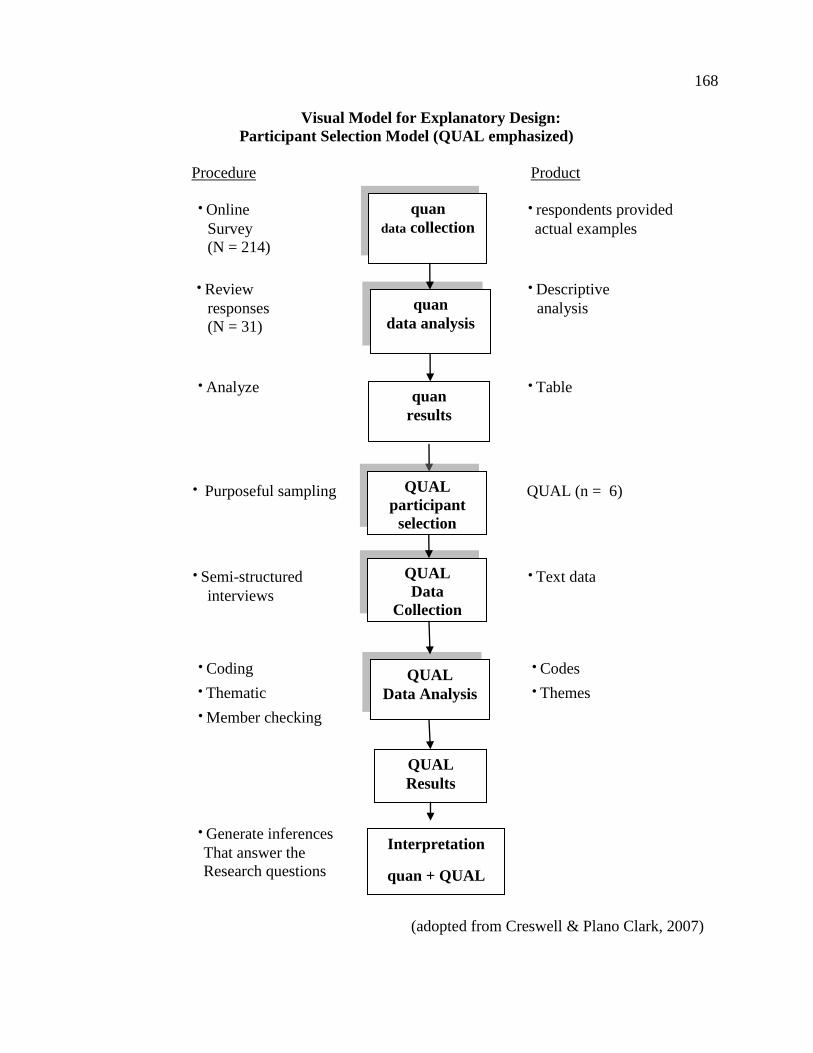
168
Visual Model for Explanatory Design:
Participant Selection Model (QUAL emphasized)
Procedure Product
· Online · respondents provided
Survey actual examples
(N = 214)
· Review · Descriptive
responses analysis
(N = 31)
· Analyze · Table
· Sample for
· Purposeful sampling QUAL (n = 6)
· Semi-structured · Text data interviews
· Coding · Codes
· Thematic · Themes · Member checking
· Generate inferences
That answer the
Research questions
(adopted from Creswell & Plano Clark, 2007)
quan
data collection
QUAL
Data
Collection
quan
data analysis
QUAL
Data Analysis
Interpretation
quan + QUAL
Model
quan
results
QUAL
Results
QUAL
participant
selection
169
Appendix B
Online Survey Participation by State
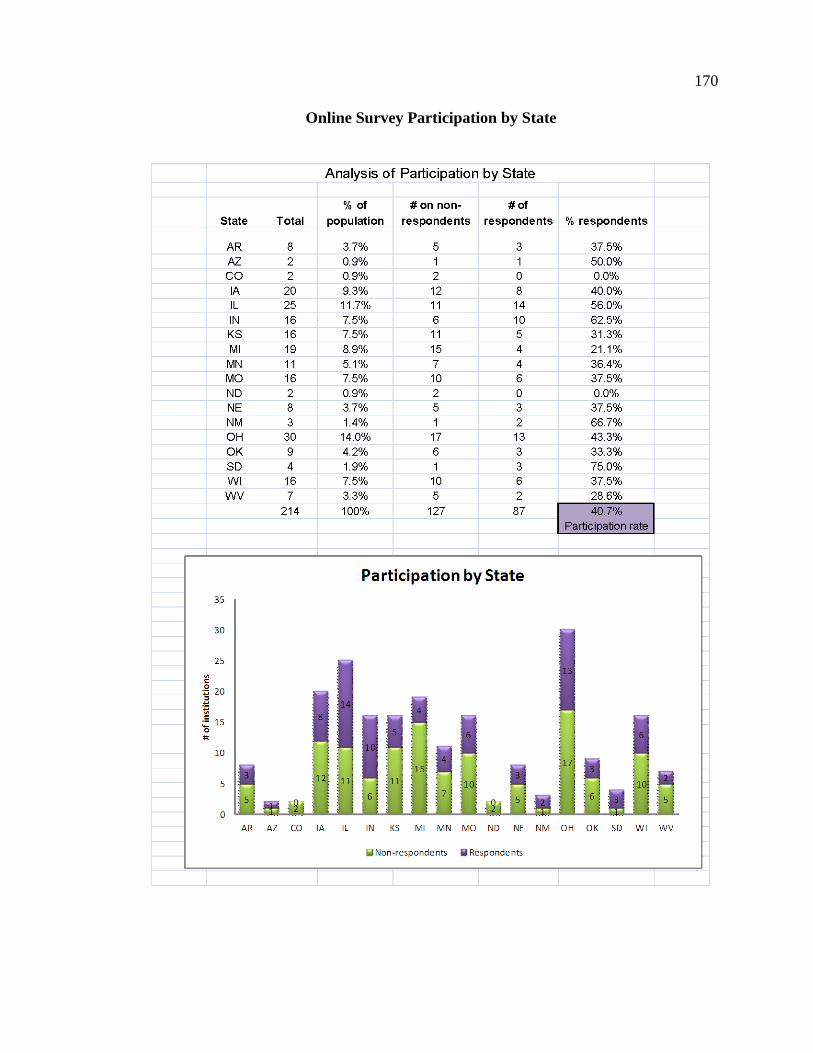
170
Online Survey Participation by State

171
Appendix C
Sample Recruitment Email for Online Survey
172
Recruitment Email for Online Survey (Final)
February 7, 2012
Dear Financial Officer,
My name is Beth Reissenweber. I am a doctoral candidate at the University of Nebraska
– Lincoln in Educational Administration in Higher Education, and the VP for Finance at
Aurora University. As a doctoral candidate, I am conducting a research study to
understand the use of financial indicators and ratios in strategic decision making by
leaders who are responsible for the financial health of private colleges and universities in
the United States.
In the next few days you will receive an email with instructions to participate in this
study by answering questions about your experience at your institution. My intention is
to make your participation in this study easy and enjoyable. I am writing in advance
because many people like to know ahead of time that they will be asked to complete an
on-line survey. This research can only be successful with the generous help of people
like you.
To say thanks, the survey results and findings will be shared with respondents. I hope
you will take approximately 10 minutes of your time to assist me in this study.
Throughout this study, your responses and your institution will be held in strict
confidence, and anonymity. Please note: There are no known risks involved in this
research.
If you have any questions, please do not hesitate to contact me. Thank you for your
consideration to participate in this important survey and effort.
Very truly yours,
Beth Reissenweber, Primary Investigator
Doctoral Candidate in Educational Administration
University of Nebraska – Lincoln
(630) 844-5490
Brent D. Cejda Ph.D., Secondary Investigator
University of Nebraska-Lincoln
(402) 472-0989
173
Appendix D
Sample Electronic Invitation for Online Survey
174
Electronic Online Survey Invitation (Final)
February 14, 2012
Dear Financial Officer,
My name is Beth Reissenweber. I am a doctoral candidate at the University of Nebraska
– Lincoln in Educational Administration in Higher Education, and the VP for Finance at
Aurora University. I am writing to you for your assistance in a research project I am
conducting to understand the use of financial indicators in strategic decision making by
leaders who are responsible for the financial health of private colleges and universities in
the United States.
The best way to explore this issue is by asking leaders, like you, to share their thoughts
and opinions. The questions should take approximately 10 minutes to complete.
Participation in this study is voluntary. You can refuse to participate or withdraw at any
time without harming your relationship with the researchers or the University of
Nebraska-Lincoln, or your institution. Please note: There are no known risks involved.
This study has been reviewed and approved by the University of Nebraska-Lincoln
Institutional Review Board. If you have any questions about this survey, please contact
me at [email protected]. If you prefer to speak with someone else,
please call the UNL Research Compliance Services Office at (402) 472-6929.
By taking time to share your thoughts and opinions about use of financial indicators in
strategic decision making in higher education, you will be helping to advance the
knowledge of this important subject to other leaders. For your participation, a summary
of the results of the survey findings will be made available to you.
Click here to go to the survey now: https://new.qualtrics.com/SE/?SID = SV_bax
J1qchEvvsY9C&Preview = Survey&BrandID = unleducation
I greatly appreciate your time and effort in participating in this important research study.
Very truly yours,
Beth Reissenweber, Primary Investigator
Doctoral Candidate in Educational Administration
University of Nebraska – Lincoln
(630) 844-5490
Brent D. Cejda Ph.D., Secondary Investigator
University of Nebraska-Lincoln
(402) 472-0989
175
Appendix E
Follow-up Email reminder for Online Survey
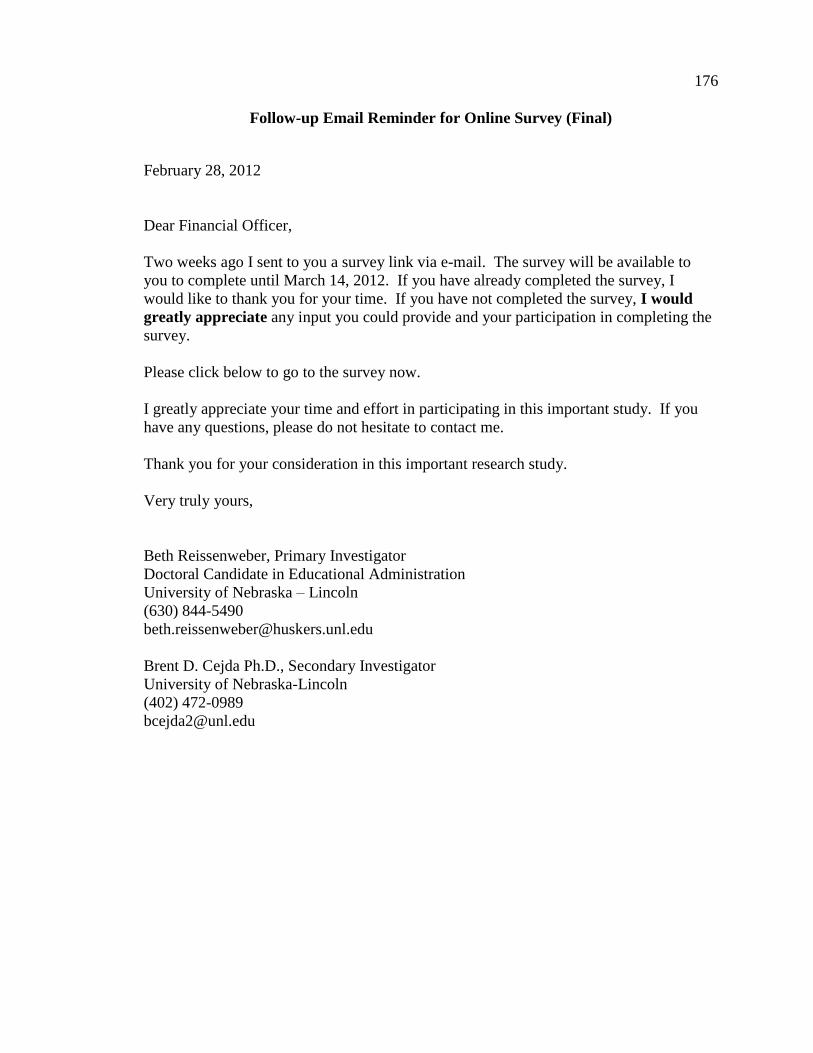
176
Follow-up Email Reminder for Online Survey (Final)
February 28, 2012
Dear Financial Officer,
Two weeks ago I sent to you a survey link via e-mail. The survey will be available to
you to complete until March 14, 2012. If you have already completed the survey, I
would like to thank you for your time. If you have not completed the survey, I would
greatly appreciate any input you could provide and your participation in completing the
survey.
Please click below to go to the survey now.
I greatly appreciate your time and effort in participating in this important study. If you
have any questions, please do not hesitate to contact me.
Thank you for your consideration in this important research study.
Very truly yours,
Beth Reissenweber, Primary Investigator
Doctoral Candidate in Educational Administration
University of Nebraska – Lincoln
(630) 844-5490
Brent D. Cejda Ph.D., Secondary Investigator
University of Nebraska-Lincoln
(402) 472-0989

177
Appendix F
Initial Recruitment Letter
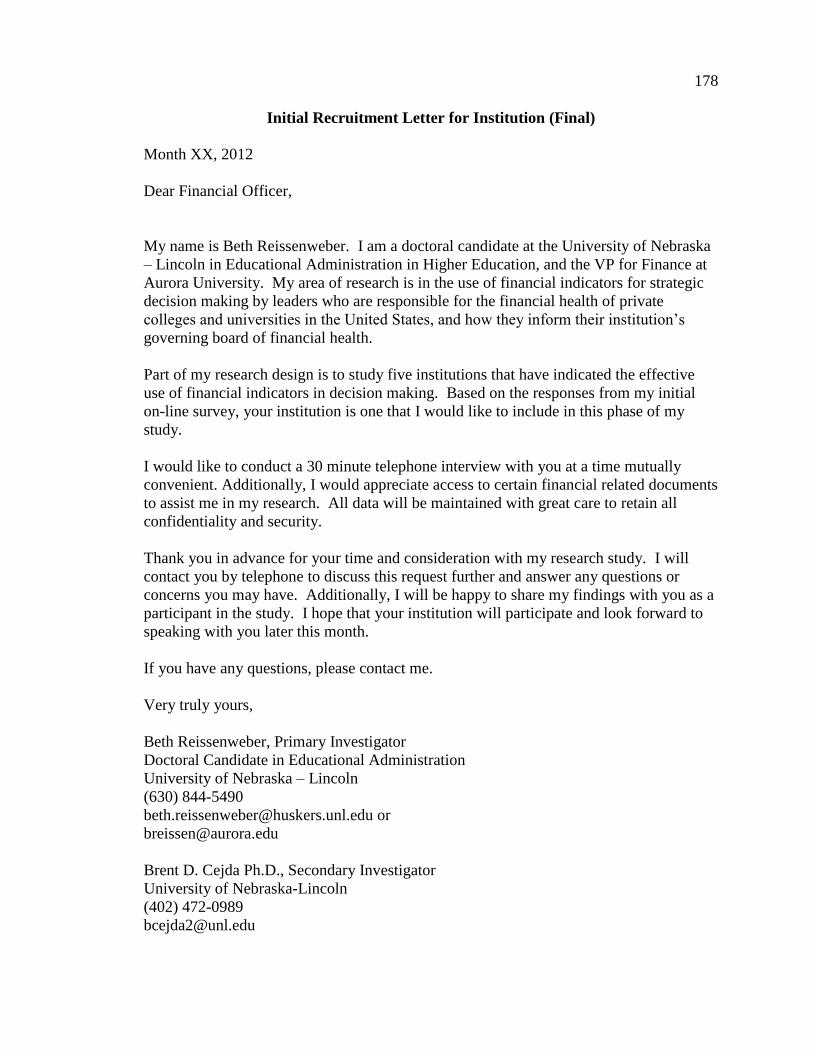
178
Initial Recruitment Letter for Institution (Final)
Month XX, 2012
Dear Financial Officer,
My name is Beth Reissenweber. I am a doctoral candidate at the University of Nebraska
– Lincoln in Educational Administration in Higher Education, and the VP for Finance at
Aurora University. My area of research is in the use of financial indicators for strategic
decision making by leaders who are responsible for the financial health of private
colleges and universities in the United States, and how they inform their institution’s
governing board of financial health.
Part of my research design is to study five institutions that have indicated the effective
use of financial indicators in decision making. Based on the responses from my initial
on-line survey, your institution is one that I would like to include in this phase of my
study.
I would like to conduct a 30 minute telephone interview with you at a time mutually
convenient. Additionally, I would appreciate access to certain financial related documents
to assist me in my research. All data will be maintained with great care to retain all
confidentiality and security.
Thank you in advance for your time and consideration with my research study. I will
contact you by telephone to discuss this request further and answer any questions or
concerns you may have. Additionally, I will be happy to share my findings with you as a
participant in the study. I hope that your institution will participate and look forward to
speaking with you later this month.
If you have any questions, please contact me.
Very truly yours,
Beth Reissenweber, Primary Investigator
Doctoral Candidate in Educational Administration
University of Nebraska – Lincoln
(630) 844-5490
Brent D. Cejda Ph.D., Secondary Investigator
University of Nebraska-Lincoln
(402) 472-0989

179
Appendix G
Informed Consent Letter
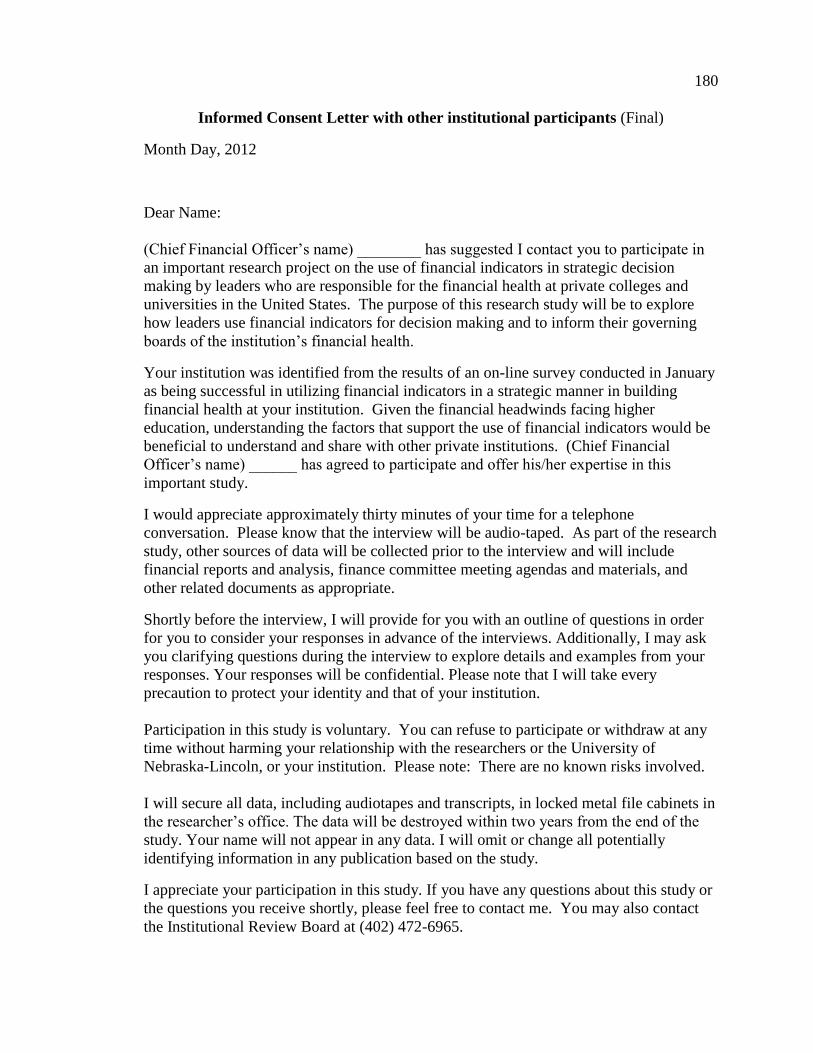
180
Informed Consent Letter with other institutional participants (Final)
Month Day, 2012
Dear Name:
(Chief Financial Officer’s name) ________ has suggested I contact you to participate in
an important research project on the use of financial indicators in strategic decision
making by leaders who are responsible for the financial health at private colleges and
universities in the United States. The purpose of this research study will be to explore
how leaders use financial indicators for decision making and to inform their governing
boards of the institution’s financial health.
Your institution was identified from the results of an on-line survey conducted in January
as being successful in utilizing financial indicators in a strategic manner in building
financial health at your institution. Given the financial headwinds facing higher
education, understanding the factors that support the use of financial indicators would be
beneficial to understand and share with other private institutions. (Chief Financial
Officer’s name) ______ has agreed to participate and offer his/her expertise in this
important study.
I would appreciate approximately thirty minutes of your time for a telephone
conversation. Please know that the interview will be audio-taped. As part of the research
study, other sources of data will be collected prior to the interview and will include
financial reports and analysis, finance committee meeting agendas and materials, and
other related documents as appropriate.
Shortly before the interview, I will provide for you with an outline of questions in order
for you to consider your responses in advance of the interviews. Additionally, I may ask
you clarifying questions during the interview to explore details and examples from your
responses. Your responses will be confidential. Please note that I will take every
precaution to protect your identity and that of your institution.
Participation in this study is voluntary. You can refuse to participate or withdraw at any
time without harming your relationship with the researchers or the University of
Nebraska-Lincoln, or your institution. Please note: There are no known risks involved.
I will secure all data, including audiotapes and transcripts, in locked metal file cabinets in
the researcher’s office. The data will be destroyed within two years from the end of the
study. Your name will not appear in any data. I will omit or change all potentially
identifying information in any publication based on the study.
I appreciate your participation in this study. If you have any questions about this study or
the questions you receive shortly, please feel free to contact me. You may also contact
the Institutional Review Board at (402) 472-6965.
181
Very truly yours,
Beth Reissenweber, Primary Investigator
Doctoral candidate in Educational Administration
University of Nebraska – Lincoln
(630) 844-5490
Brent D. Cejda Ph.D., Secondary Investigator
University of Nebraska-Lincoln
(402) 472-0989

182
Appendix H
Unobtrusive Data Request
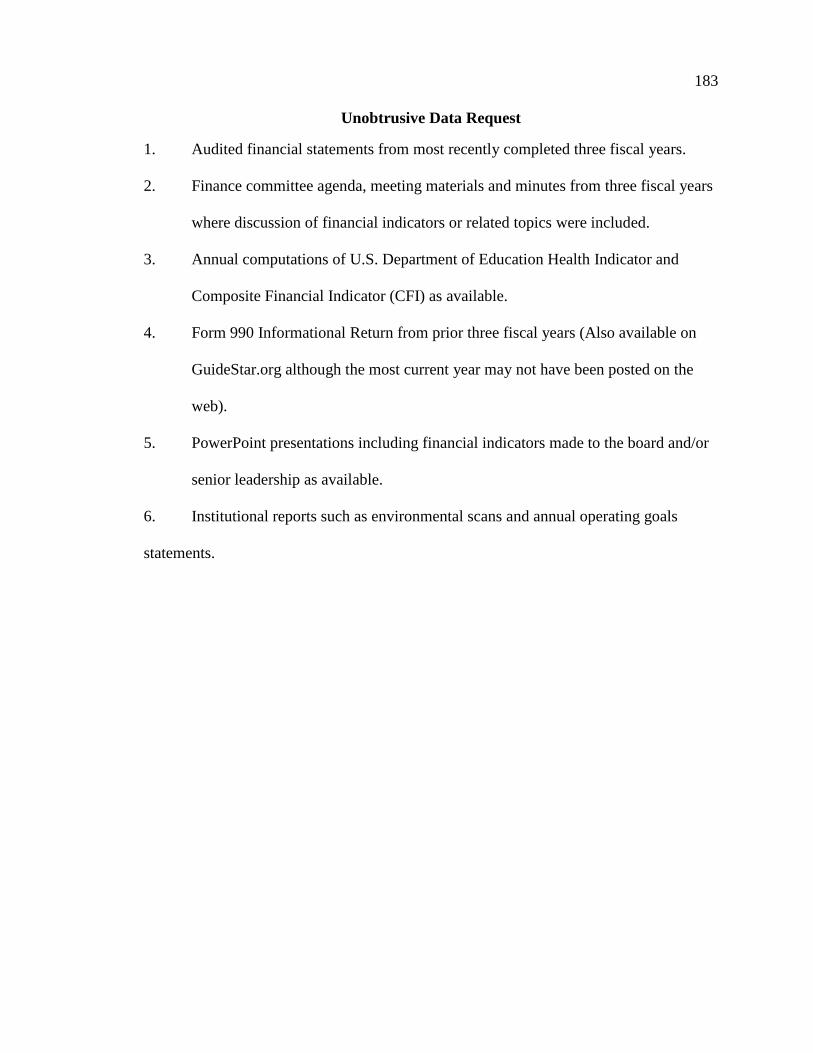
183
Unobtrusive Data Request
1. Audited financial statements from most recently completed three fiscal years.
2. Finance committee agenda, meeting materials and minutes from three fiscal years
where discussion of financial indicators or related topics were included.
3. Annual computations of U.S. Department of Education Health Indicator and
Composite Financial Indicator (CFI) as available.
4. Form 990 Informational Return from prior three fiscal years (Also available on
GuideStar.org although the most current year may not have been posted on the
web).
5. PowerPoint presentations including financial indicators made to the board and/or
senior leadership as available.
6. Institutional reports such as environmental scans and annual operating goals
statements.

184
Appendix I
Online Survey Questionnaire
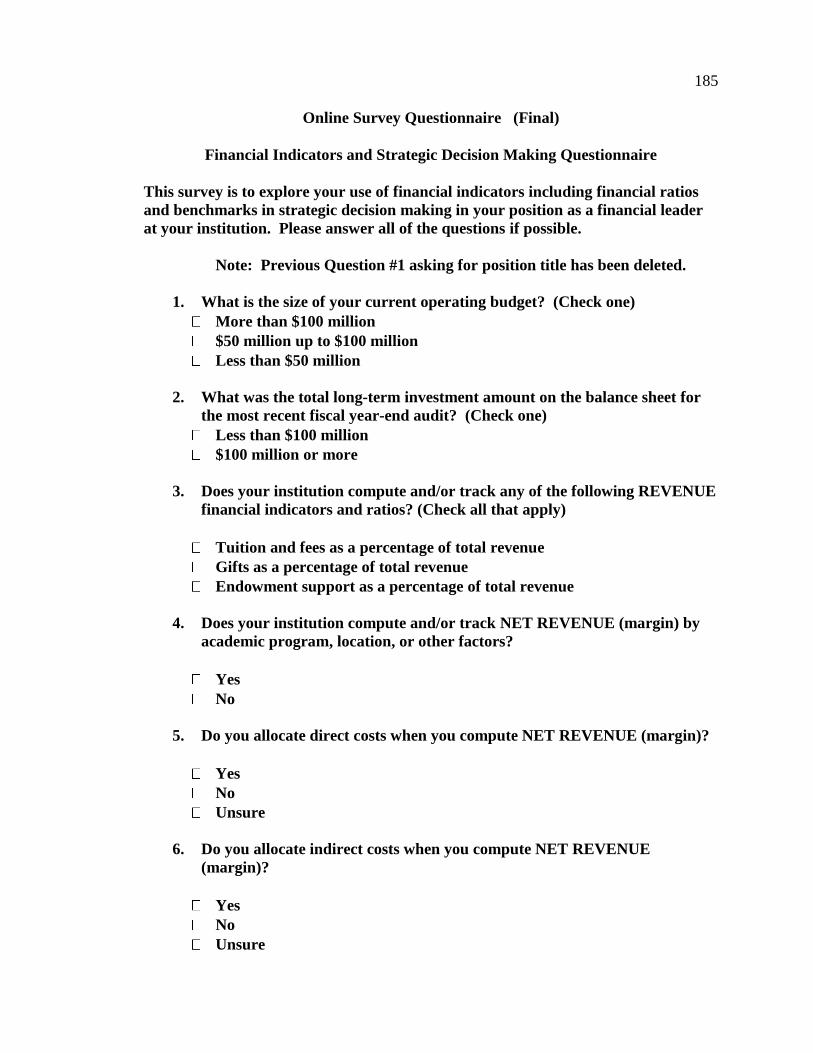
185
Online Survey Questionnaire (Final)
Financial Indicators and Strategic Decision Making Questionnaire
This survey is to explore your use of financial indicators including financial ratios
and benchmarks in strategic decision making in your position as a financial leader
at your institution. Please answer all of the questions if possible.
Note: Previous Question #1 asking for position title has been deleted.
1. What is the size of your current operating budget? (Check one)
More than $100 million
$50 million up to $100 million
Less than $50 million
2. What was the total long-term investment amount on the balance sheet for
the most recent fiscal year-end audit? (Check one)
Less than $100 million
$100 million or more
3. Does your institution compute and/or track any of the following REVENUE
financial indicators and ratios? (Check all that apply)
Tuition and fees as a percentage of total revenue
Gifts as a percentage of total revenue
Endowment support as a percentage of total revenue
4. Does your institution compute and/or track NET REVENUE (margin) by
academic program, location, or other factors?
Yes
No
5. Do you allocate direct costs when you compute NET REVENUE (margin)?
Yes
No
Unsure
6. Do you allocate indirect costs when you compute NET REVENUE
(margin)?
Yes
No
Unsure
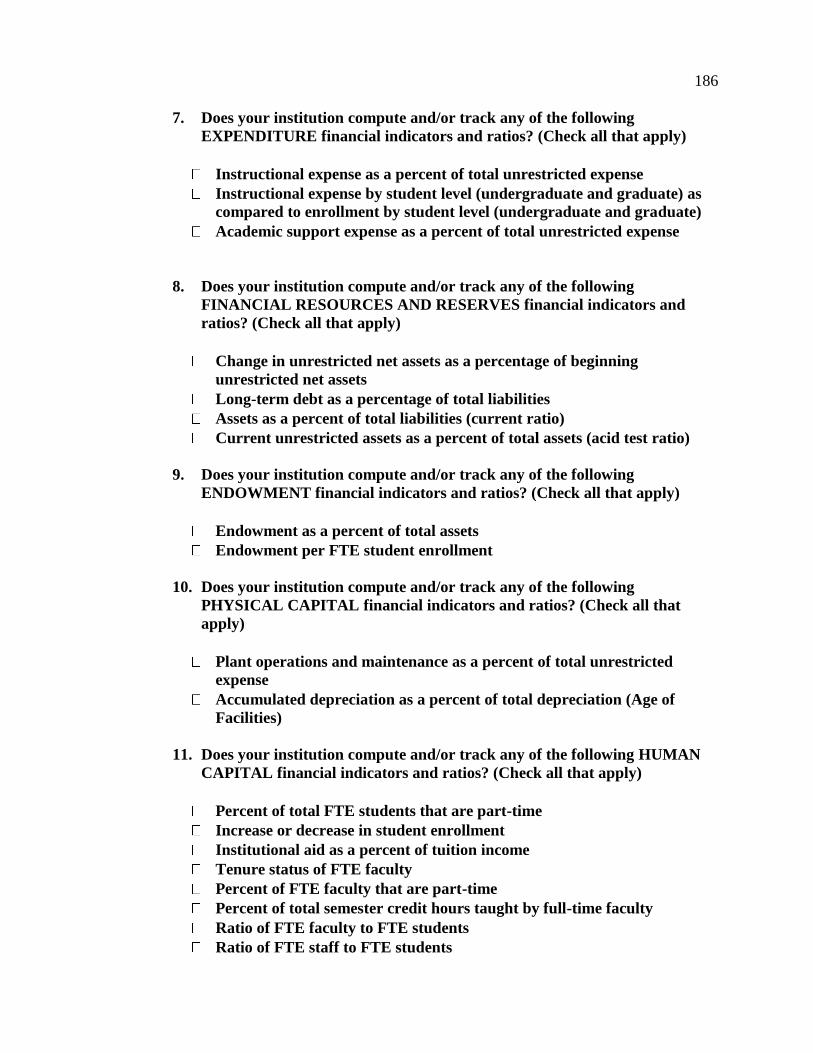
186
7. Does your institution compute and/or track any of the following
EXPENDITURE financial indicators and ratios? (Check all that apply)
Instructional expense as a percent of total unrestricted expense
Instructional expense by student level (undergraduate and graduate) as
compared to enrollment by student level (undergraduate and graduate)
Academic support expense as a percent of total unrestricted expense
8. Does your institution compute and/or track any of the following
FINANCIAL RESOURCES AND RESERVES financial indicators and
ratios? (Check all that apply)
Change in unrestricted net assets as a percentage of beginning
unrestricted net assets
Long-term debt as a percentage of total liabilities
Assets as a percent of total liabilities (current ratio)
Current unrestricted assets as a percent of total assets (acid test ratio)
9. Does your institution compute and/or track any of the following
ENDOWMENT financial indicators and ratios? (Check all that apply)
Endowment as a percent of total assets
Endowment per FTE student enrollment
10. Does your institution compute and/or track any of the following
PHYSICAL CAPITAL financial indicators and ratios? (Check all that
apply)
Plant operations and maintenance as a percent of total unrestricted
expense
Accumulated depreciation as a percent of total depreciation (Age of
Facilities)
11. Does your institution compute and/or track any of the following HUMAN
CAPITAL financial indicators and ratios? (Check all that apply)
Percent of total FTE students that are part-time
Increase or decrease in student enrollment
Institutional aid as a percent of tuition income
Tenure status of FTE faculty
Percent of FTE faculty that are part-time
Percent of total semester credit hours taught by full-time faculty
Ratio of FTE faculty to FTE students
Ratio of FTE staff to FTE students
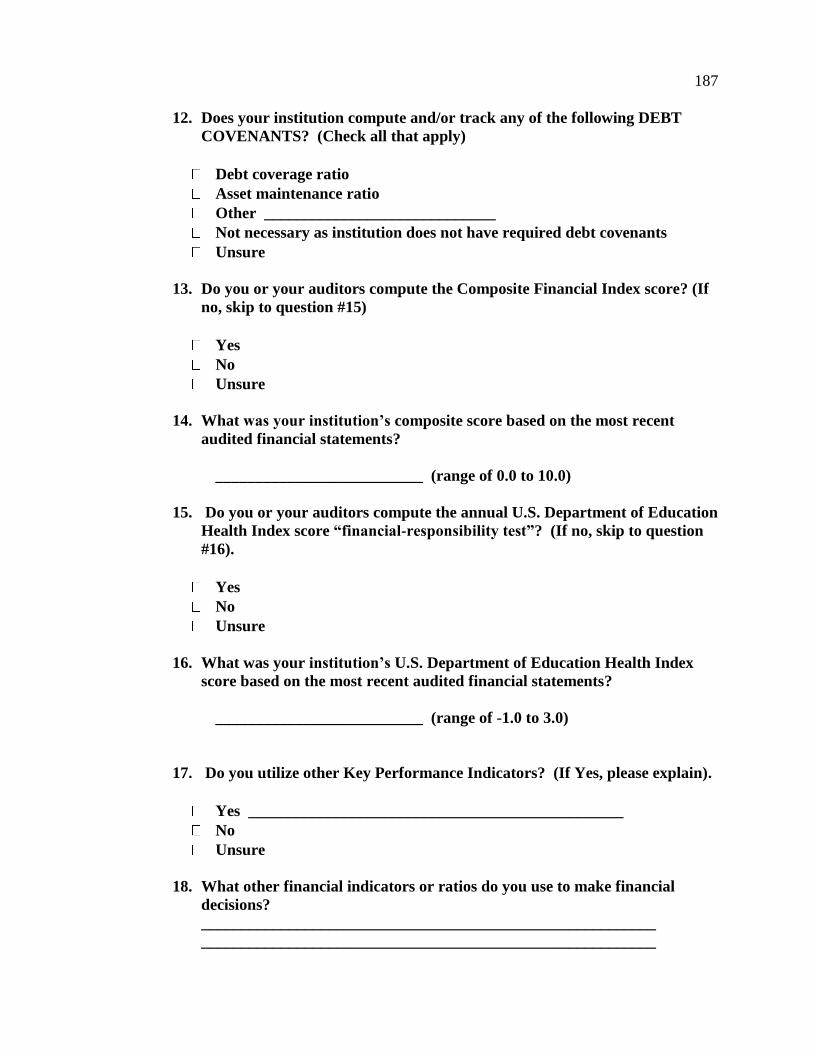
187
12. Does your institution compute and/or track any of the following DEBT
COVENANTS? (Check all that apply)
Debt coverage ratio
Asset maintenance ratio
Other _____________________________
Not necessary as institution does not have required debt covenants
Unsure
13. Do you or your auditors compute the Composite Financial Index score? (If
no, skip to question #15)
Yes
No
Unsure
14. What was your institution’s composite score based on the most recent
audited financial statements?
__________________________ (range of 0.0 to 10.0)
15. Do you or your auditors compute the annual U.S. Department of Education
Health Index score “financial-responsibility test”? (If no, skip to question
#16).
Yes
No
Unsure
16. What was your institution’s U.S. Department of Education Health Index
score based on the most recent audited financial statements?
__________________________ (range of -1.0 to 3.0)
17. Do you utilize other Key Performance Indicators? (If Yes, please explain).
Yes _______________________________________________
No
Unsure
18. What other financial indicators or ratios do you use to make financial
decisions?
_________________________________________________________
_________________________________________________________
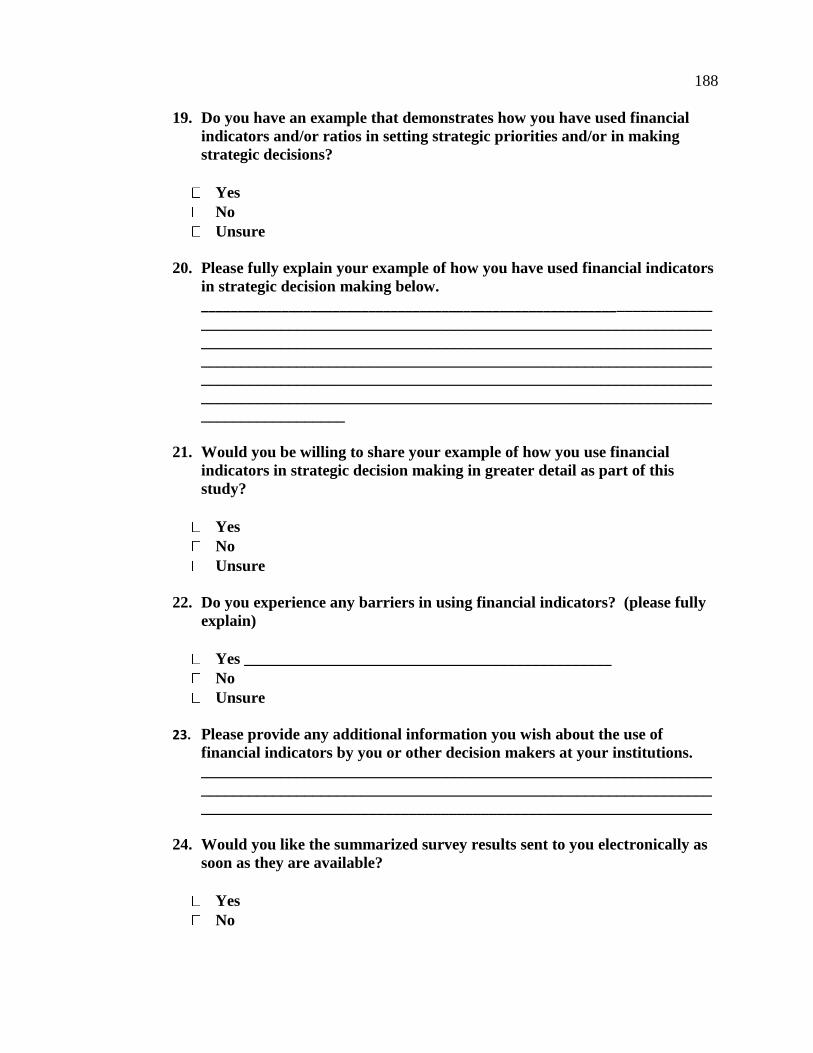
188
19. Do you have an example that demonstrates how you have used financial
indicators and/or ratios in setting strategic priorities and/or in making
strategic decisions?
Yes
No
Unsure
20. Please fully explain your example of how you have used financial indicators
in strategic decision making below.
_____________________________________________________________________
________________________________________________________________
________________________________________________________________
________________________________________________________________
________________________________________________________________
________________________________________________________________
__________________
21. Would you be willing to share your example of how you use financial
indicators in strategic decision making in greater detail as part of this
study?
Yes
No
Unsure
22. Do you experience any barriers in using financial indicators? (please fully
explain)
Yes ______________________________________________
No
Unsure
23. Please provide any additional information you wish about the use of
financial indicators by you or other decision makers at your institutions. ________________________________________________________________
________________________________________________________________
________________________________________________________________
24. Would you like the summarized survey results sent to you electronically as
soon as they are available?
Yes
No

189
Appendix J
Interview Guide
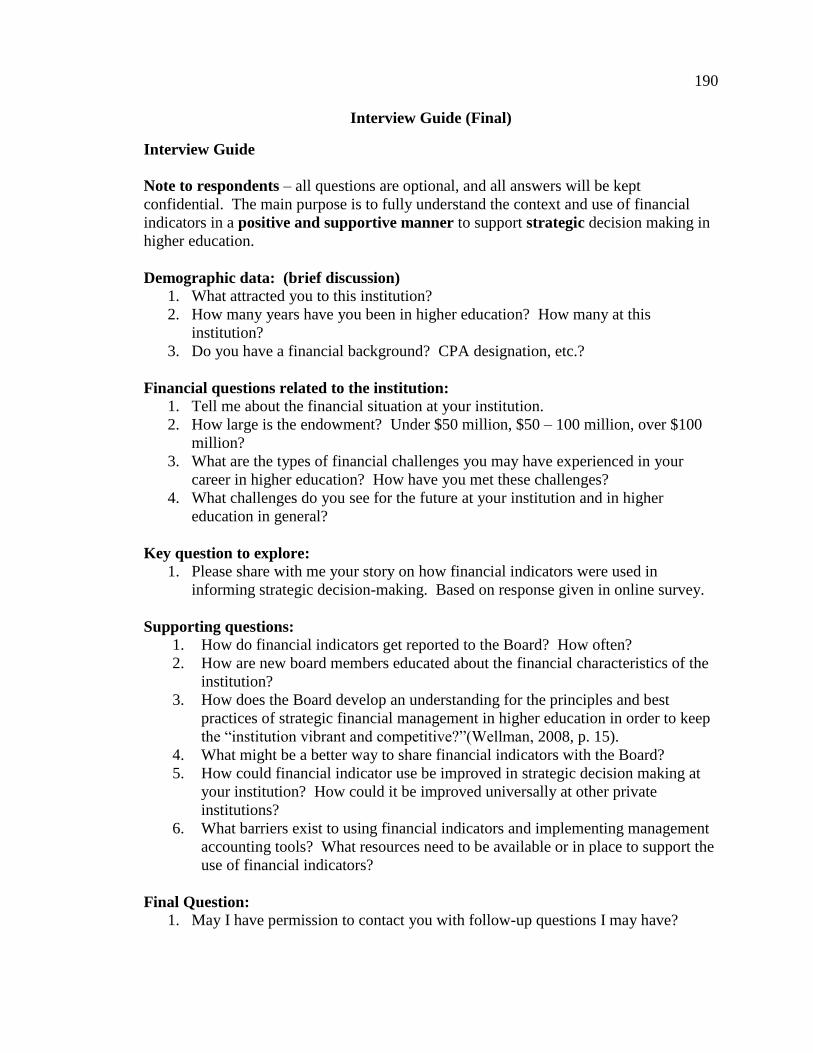
190
Interview Guide (Final)
Interview Guide
Note to respondents – all questions are optional, and all answers will be kept
confidential. The main purpose is to fully understand the context and use of financial
indicators in a positive and supportive manner to support strategic decision making in
higher education.
Demographic data: (brief discussion)
1. What attracted you to this institution?
2. How many years have you been in higher education? How many at this
institution?
3. Do you have a financial background? CPA designation, etc.?
Financial questions related to the institution:
1. Tell me about the financial situation at your institution.
2. How large is the endowment? Under $50 million, $50 – 100 million, over $100
million?
3. What are the types of financial challenges you may have experienced in your
career in higher education? How have you met these challenges?
4. What challenges do you see for the future at your institution and in higher
education in general?
Key question to explore:
1. Please share with me your story on how financial indicators were used in
informing strategic decision-making. Based on response given in online survey.
Supporting questions:
1. How do financial indicators get reported to the Board? How often?
2. How are new board members educated about the financial characteristics of the
institution?
3. How does the Board develop an understanding for the principles and best
practices of strategic financial management in higher education in order to keep
the “institution vibrant and competitive?”(Wellman, 2008, p. 15).
4. What might be a better way to share financial indicators with the Board?
5. How could financial indicator use be improved in strategic decision making at
your institution? How could it be improved universally at other private
institutions?
6. What barriers exist to using financial indicators and implementing management
accounting tools? What resources need to be available or in place to support the
use of financial indicators?
Final Question:
1. May I have permission to contact you with follow-up questions I may have?

191
Appendix K
Transcription Agreement Template
192
Transcription Agreement Template
Transcriptionist Confidentiality Statement
I, ________________________________ (name of transcriptionist) agree to hold all
information contained on audio recorded tapes/ and in interviews received from
Beth Reissenweber, primary investigator for the research study on Financial
Indicators in Strategic Decision Making, in confidence with regard to the individual
and institutions involved in the research study. I understand that to violate this
agreement would constitute a serious and unethical infringement on the informant’s
right to privacy.
I also certify that I have completed the CITI Limited Research Worker training in
Human Research Protections.
______________________________________ ________________
Signature of Transcriptionist Date
______________________________________ ________________
Signature of Principal Investigator Date

193
Appendix L
Institutional Review Board Approval
194
Institutional Review Board Approval
February 8, 2012
Beth Reissenweber
Department of Educational Administration
Brent Cejda
Department of Educational Administration
129 TEAC, UNL, 68588-0360
IRB Number:
Project ID: 12351
Project Title: Financial Indicators in Strategic Decision making: Recommended Practices
at Small, Private Colleges and Universities in the Midwestern United States
Dear Beth:
The Institutional Review Board for the Protection of Human Subjects has completed its
review of the Request for Change in Protocol submitted to the IRB.
1. The final survey instrument has been approved.
2. The final recruitment email and electronic invitation emails have been approved.
Please include the IRB approval number (IRB# 20120112351 EX) in the on-line consent
documents. Please email a copy of these messages to [email protected] for our records. If you
need to make changes to the messages please submit the revised messages to the IRB for
review and approval prior to using them.
3. The list of the recruitment population is also acknowledged.
We wish to remind you that the principal investigator is responsible for reporting to this
Board any of the following events within 48 hours of the event:
* Any serious event (including on-site and off-site adverse events, injuries, side effects,
deaths, or other problems) which in the opinion of the local investigator was
unanticipated, involved risk to subjects or others, and was possibly related to the research
procedures;
* Any serious accidental or unintentional change to the IRB-approved protocol that
involves risk or has the potential to recur;
* Any publication in the literature, safety monitoring report, interim result or other
finding that indicates an unexpected change to the risk/benefit ratio of the research;
* Any breach in confidentiality or compromise in data privacy related to the subject or
others; or
* Any complaint of a subject that indicates an unanticipated risk or that cannot be
resolved by the research staff.

195
This letter constitutes official notification of the approval of the protocol change. You are
therefore authorized to implement this change accordingly.
If you have any questions, please contact the IRB office at 472-6965.
Sincerely,
Becky R. Freeman, CIP
for the IRB
Copyright © 2022 FDOKUMEN