
Analysis of the Classification Criteria for Inpatient ... - CMS
Upload
independentCategory
view
1download
0
From the New England Society for Vascular Surgery
Understanding trends in inpatient surgicalvolume: Vascular interventions, 1980-2000Patrice L. Anderson, MD,a,b Annetine Gelijns, PhD,a Alan Moskowitz, MD,a Ray Arons, DrPH,a LopaGupta, MPH,a Alan Weinberg, MS,a Peter L. Faries, MD,b Roman Nowygrod, MD,b and K. Craig Kent,MD,b New York, NY
Objective: To help understand past and future trends in vascular intervention, we examined changes in the rate ofutilization, patient demographics, and length of stay from 1980 to 2000.Methods: We reviewed the ICD-9 codes for all vascular procedures using the National Hospital Discharge Survey ofnon-federal United States hospitals (1980-2000).Results: The number of vascular procedures performed in this country increased from 412,557 in 1980 to 801,537 in2000 (per capita increase of >50%). This increase was most evident in elderly patients (>75 years, 67% per capita increasein discharges). Long hospital stays (>7 days) for vascular procedures fell 41%, and short hospital stays (<24 hours)increased 15% over the period of study. The frequency of abdominal aortic aneurysm repairs remained relatively constant.Except for an interval in the late 1980s, and a minor decrease from 1997 to 2000, the frequency of carotidendartarectomy rose dramatically (69%). Lower extremity revascularizations increased steadily until 1990 but thendeclined 12%. From 1995 to 2000, there was a 27% per capita decrease in the number of renal-mesenteric operations.Correspondingly, over the past 5 years there has been a 979% growth in the number of percutaneous/endovascularinterventions. Despite a substantial number of interventions for lower extremity vascular disease, there was a concomitantincrease in the number of major and minor amputations.Conclusion: Interventions for vascular disease have increased dramatically, with a major shift toward less invasivetreatments, particularly for the renal and mesenteric vessels and the lower extremities. These trends in procedural usesuggest that vascular surgeons need to embrace catheter-based approaches if they want to remain leaders in the treatmentof peripheral vascular diseases. (J Vasc Surg 2004;39:1200-8.)
The past two decades have brought great change tovascular surgery. Over the 20 years from 1980 to 2000there was a 24% increase in the US population and ademographic shift toward older age.1 During this periodthe number of persons older than 75 years increased by67%.1 In addition, the way we approach vascular disease hasbeen undergoing rapid change. Minimally invasive opera-tions were introduced that have the potential to replaceopen surgery. Accompanying this has been the entranceinto the field of other specialists with catheter skills and theability to treat vascular disease. The effect of these variousfactors on our individual practices has varied. However,collective national trends in the treatment of vascular dis-ease have not been recently studied. Moreover, predictingfuture trends in the treatment of vascular disease is ofparamount importance, and has implications for vascular
From the InCHOIR-International Center for Health Outcomes and Inno-vation Researcha and the Columbia Weill Cornell Division of VascularSurgery, New York Presbyterian Hospital.
Competition of interest: none.Presented at the Thirtieth Anniversary Meeting of the New England Society
for Vascular Surgery, Newport, RI, Sep 19-21, 2003.Additional material for this article may be found online at www.mosby.
com/jvs.Reprint requests: Patrice L. Anderson, MD, New York Presbyterian Hospi-
tal, Department of Surgery, 600 W 168th St, 7th Floor c/o INCHOIR,New York, NY 10032 (e-mail: [email protected]).
0741-5214/$30.00Copyright © 2004 by The Society for Vascular Surgery.doi:10.1016/j.jvs.2004.02.039
1200
surgeons in terms of the number of surgeons whom wetrain and training paradigms.
To help understand these trends we surveyed the vol-ume of major vascular interventions performed in theUnited States for the years 1980 to 2000. We used theNational Hospital Discharge Survey (NHDS) to evaluateeight major inpatient vascular categories. In addition, weevaluated changes in the population of patients undergoingthese interventions. Our goal was to gain an in-depthunderstanding of how vascular intervention has changedover these 20 years and to use the data to predict futuretrends.
METHODS
Data source. Discharge data for patients who under-went a vascular procedure requiring hospitalization wereextracted from the NHDS database for the years 1980 to2000. The NHDS is conducted annually by the NationalCenter for Health Statistics (NCHS). This database con-tains medical and demographic information from a sampleof discharge records selected from a national sample ofacute care hospitals, exclusive of federal, military, and Vet-erans Administration hospitals. The NHDS provides datafor calculating trends in medical care. Eligible hospitalsinclude institutions with at least six beds in which theaverage length of stay (LOS) for patients is less than 30days. From the nation’s approximately 6000 hospitals,about 500 are selected each year for inclusion in theNHDS. Hospital discharge data are collected by means of a

JOURNAL OF VASCULAR SURGERYVolume 39, Number 6 Anderson et al 1201
stratified system, on the basis of annual number of dis-charges and geographic location of each institution. Thereports from this data set serve as the principal source forestimating hospital use in the United States. Publicationsbased on the data can be obtained from the NCHS websiteat (http://www.cdc.gov/nchs/about/major/hdasd/listpubs.htm). Hospital data in the survey include but are notlimited to birth date, gender, ethnicity, marital status, zipcode, payment source, in-hospital mortality, LOS, anddischarge status. Using the ICD-9-CM system (Interna-tional Classification of Diseases, ninth revision, ClinicalModification),2 trained medical personnel code each pa-tient with a maximum of seven diagnoses and four proce-dures per hospital stay.
NHDS sampling and estimates. The NHDS cur-rently uses a three-stage probability design, introduced in1988; primary sampling units (counties, groups of coun-ties, county equivalents, towns), hospitals within primarysampling units, and discharges within hospitals. TheNHDS sample includes at least 26 primary sampling unitswith the largest populations, and additional primary sam-pling units are randomly selected each year. In the secondstage a proportional number of hospitals are surveyed.Hospitals with 1000 or more beds are always selected forinclusion (certainty hospitals), and other hospitals are se-lected by means of systematic random sampling. In 1997there was a total of 501 hospitals, of which 474 (94.6%)responded. Sixty percent of responses were manual, andforty percent were automated. In the third stage a system-atic random sampling technique is used to generate asample of discharges. In 1997, 300,464 discharges weresampled.3 Initially the coding is done by coders at theindividual hospitals. Subsequently, to ensure quality, anNHDS coder independently reevaluates 5% to 10% of thedata sets each year, to assess accuracy. Discrepancies areadjudicated by a chief coder, and the rate of discrepancy isrecorded. The overall error rate for the 1997 data year was0.7% for surgical and diagnostic procedures. Statistics fromthe NHDS are derived by a multistage estimation proce-dure that produces unbiased national estimates by means ofthree techniques: inflation by reciprocals of the probabilityof sample selection, adjustment for nonresponse, and pop-ulation weighting ratio adjustment.3
Study population. Our patient population was ex-tracted from the NHDS database using ICD-9-CM proce-dural codes. Discharges were grouped into eight proce-dural groups: carotid, thoracic-subclavian, abdominalaortic aneurysm (AAA), renal-mesenteric, catheter-based,amputation, lower extremity revascularization, and allother procedures. A complete list of procedure groups,with the ICD-9-CM codes subsumed by each, is providedin Table I, online only. The “catheter-based” categoryincludes angioplasty, noncoronary stent placement, andintraluminal thrombolytic therapy, including carotid stent-ing. Diagnostic angiography without any other interven-tion was not included in this category, because many ofthese procedures are performed in outpatients and were notdetected in our patient population. Before the advent in
October 2000 of a separate endovascular code for AAArepair,4 endovascular repairs were included under ICD-9-CM code 39.52. The “amputation” category was furthersubdivided into major and minor amputations. The “lowerextremity revascularization” category included both in-frainguinal revascularization and aortoiliac reconstruction.The “all other” category included abdominal vein recon-struction, arm vessel reconstruction, leg vein reconstruc-tion, trauma treatment, and other procedures. We did notinclude procedures to treat varicose veins or angiographicaccess, because both are often outpatient interventions thatwould be greatly underestimated by the NHDS, whichincludes inpatients only.
Estimates of total inpatient procedures for2030. Using 2030 population estimates from the USCensus Bureau, we created two projections for the numberof vascular procedures that might be performed in 2030.Our projections were based on evaluation of the effect ofoverall increase in population, an evaluation related tochanges in the age distribution of the population, andpotential changes in use of vascular interventions. To eval-uate the effect of changes in population number and age weused the per capita admissions per age for 2000 and multi-plied these values by the estimated population for that agegroup in 2030. The resultant number of admissions wasthen multiplied by 1.2 vascular procedures per admission,which was the average ratio for both 1980 and 2000. Thisstraightforward projection assumes that the only changesover the next 30 years will be in growth of the populationand age distribution. To evaluate the effect of potentialchanges in usage we determined the rate of growth of percapita admissions from 1990 to 2000, and calculated usewith the assumption that the same rate would continueover the next 30 years. Thus our second projection takesinto account an incremental rate of use of vascular interven-tions, as well as growth in the US population and changes inage. We assumed that the number of procedures per admis-sion remained 1.2. Many factors may increase or decreasethe rate of growth, and new developments in the fieldwould result in revision of our estimates. However, wesuspect that the real usage rate will be somewhere betweenthese two estimates, which we think offer a reasonable set ofbounds for workforce planning.
Statistical analysis. Statistical estimates were used tographically display trends over time. For the per capitacalculations, annual nationwide census information wasobtained from the National Census Bureau for the years1980 to 2000. The per capita rates for the total number ofdischarges, total number of vascular procedures, and eachindividual vascular category were calculated by dividing thetotal number of discharges or procedures by the nationalpopulation. All rates are expressed as the rate of the proce-dure per 100,000 population. These calculations were stan-dardized for the respective subgroups studied, that is, age,race, gender. Variables were analyzed by univariate analysisusing t tests for continuous variables and by the Fisher exacttest for dichotomous variables. We used Poisson linearregression techniques to analyze trends between years. All

JOURNAL OF VASCULAR SURGERYJune 20041202 Anderson et al
data were analyzed with the SAS statistical program, version8.0 (SAS Institute, Cary, NC).
RESULTS
Growth in vascular interventions across the UnitedStates. Over the 20-year study period, the number ofcommon vascular procedures performed in the UnitedStates nearly doubled, increasing from 412,557 in 1980 to801,537 in 2000 (Fig 1, A). This increase was not entirelythe result of a growing population, inasmuch as the percapita numbers also reflect a change, from 182 to 284procedures per 100,000 population (Fig 1, B). Nor werethese changes the result of an increase in the number ofprocedures per admission. During this period the averagenumber of procedures performed per admission remainedconstant at 1.2 per discharge. By virtue of the size of thenational population, these trends are all statisticallysignificant.
Trends in selected vascular procedures. We also ob-served a major change in the distribution of vascular pro-cedures performed during this period (Table II). Nation-ally, the rate of AAA interventions minimally increased,
Fig 1. A, Growth in total number of vascular procedure1980 to 2000.
Table II. Most common procedure categories, in descend
1980
Rank Category Total no. PC*
1 Lower extremity revascularization 111,560 49.12 Amputation 108,547 47.83 Other procedure 84,607 37.24 Carotid 61,088 26.95 AAA 34,237 15.16 Thoracic-subclavian 9,197 4.07 Renal-mesenteric 3,196 1.48 Catheter-based 125 0.1
PC, Per capita; AAA, abdominal aortic aneurysm.*Number of procedures per 100,000 population.
from 15.1 per 100,000 in 1980 to 16.5 per 100,000 in2000 (Fig 2, A); the total number of AAA interventions isshown in Fig 3, A, online only. There was a biphasic patternin the use of carotid endarterectomy (CEA; Fig 2, B); thetotal number of carotid procedures is shown in Fig 3, B,online only. From 1980 to 2000 the overall number ofCEA procedures increased, from 26.9 to 45.5 per 100,000,but there were two interval peaks in 1985 and 1995. Percapita trends for renal and mesenteric surgeries are shownin Fig 2, C. Although the number of actual interventionsremained small relative to the other categories, there was a37% per capita increase in these interventions from 1980 to2000 (from 1.4 per 100,000 to 1.9 per 100,000). Of note,however, from 1995 to 2000 there was a 27% decrease inrenal and mesenteric interventions. (Fig 3, C, online only,depicts the total number of renal-mesenteric interven-tions.) The use of lower extremity revascularization, includ-ing both aortoiliac and infrainguinal reconstructions,reached a peak in 1990, then subsequently declined toalmost the 1980 number by 2000 (49.1 vs 51.3 proceduresper 100,000, respectively; Fig 2, D, and Fig 3, D, onlineonly). The most dramatic change over time occurred in the
rowth in per capita rate for all vascular procedures from
rder: 1980 and 2000
2000
ank Category Total no. PC*
1 Catheter-based 164,417 58.32 Amputation 163,648 58.03 Lower extremity revascularization 144,626 51.34 Carotid 128,464 45.55 Other procedure 126,812 44.96 AAA 46,542 16.57 Thoracic-subclavian 21,731 7.78 Renal-mesenteric 5,297 1.9
s. B, G
ing o
R

JOURNAL OF VASCULAR SURGERYVolume 39, Number 6 Anderson et al 1203
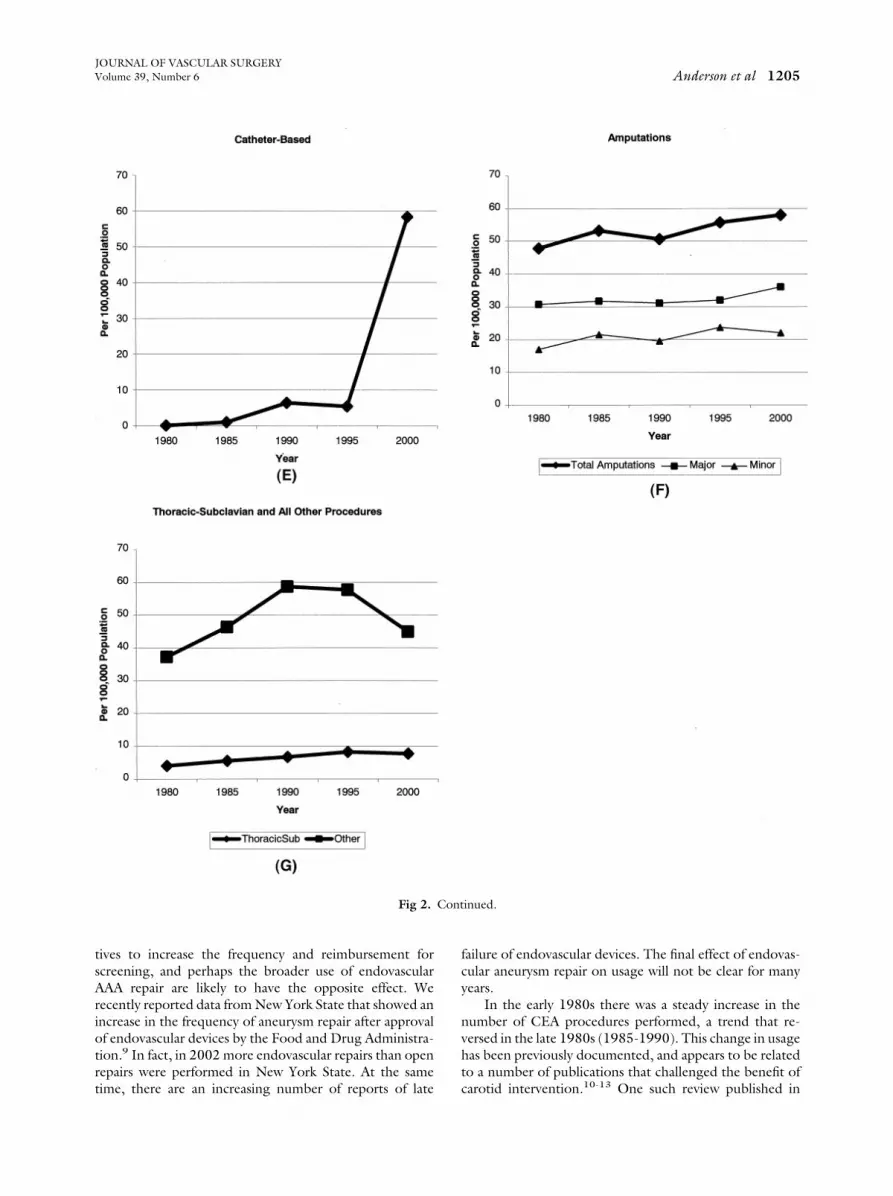
category of catheter-based interventions; in 1980, 0.1 pro-cedures per 100,000 population were performed, but by2000 this number had increased substantially, to 58.3 per100,000 (total of 164,417 procedures; Fig 2, E and Fig 3,E online only). The per capita rate of total amputationsincreased from 47.8 per 100,000 in 1980 to 58.0 per100,000 in 2000. This increase was evident for both minorand major amputations (Fig 2, F, and Fig 3, F, online only).Trends in thoracic and subclavian surgery, for which num-bers remain relatively small, are depicted in Fig 2, G, andFig 3, G, online only. The number of interventions in theother category, which includes procedures that range fromvenous reconstruction to trauma, increased continuouslyover the 20 years studied.
Target population. Changes in demographic data forthe patient population undergoing vascular interventionsfrom 1980 to 2000 are shown in Table III. Although in2000 men were admitted more often than women forvascular interventions (P � .0001), there was a more rapidgrowth rate in per capita admissions for women (42% percapita increase in men vs 77% increase in women). In 2000the per capita admission rate in black patients was higherthan in white patients (P � .0001). There was substantialgrowth in the number of elderly patients treated over time.Whereas the number of admissions remained stable for thecohorts 15 to 44 and 45 to 64 years of age, the admissionrate increased significantly for patients in the cohorts 65 to74 years of age and 75 years or older. For patients 65 to 74years of age there was a 55% increase in per capita admis-sions over the 20-year study period, and for patients olderthan 75 years, the number of admissions increased by 69%(Fig 4).
Length of stay. There was a marked difference in LOSin 1980 compared with 2000 (Fig 5, A). We observed adownward trend in LOS among all of the major vascularprocedures except catheter-based procedures, which re-mained relatively stable, with a mean of 4 to 5 days from1996 to 2000. In 1980 approximately 80% of all patientswere hospitalized for 7 days or more, whereas in 2000 only38% remained in the hospital for this duration. By 2000 thenumber of patients discharged in 24 hours or less hadincreased to 17%, from 2.5% in 1980. In 1980 the meanLOS across all age groups was 19 days, ranging from 13days in the cohort aged 15 to 44 years to 22 days forpatients 75 years old or older. By 2000 the mean LOSdecreased to 7.7 days across all age groups. The mostdramatic decrease in LOS was seen in the group older than75 years. LOS decreased in this group to an average of 7.9days, which in 2000 was essentially equivalent to that in theyounger age groups. Annual mean LOS as a function of ageis shown in Fig 5, B.
Estimate of total inpatient procedures for2030. We used these data to project future usage of vas-cular interventions. Our first projection, based solely onestimated changes in population size and age distribution,yielded an estimated 1,085,694 admissions or 1,331,813procedures in 2030. In a second calculation we determinedchanges in usage of vascular procedures over the 10 years
from 1990 to 2000. Applying this same trend to the alreadycalculated changes in the US population and age, we esti-mated that there would be 1,809,721 admissions or2,171,666 procedures performed in the United States in2030.
DISCUSSION
In 2000 an estimated 40 million interventions wereperformed on hospital inpatients,5 and 801,537 of thesewere vascular procedures. Moreover, over the past 20 yearsthe number of vascular interventions performed in theUnited States has almost doubled (�50% increase percapita). Several interrelated factors are responsible for thisgrowth. In addition to the overall increase in the census, theaging of the population has contributed substantially to theincrease in the number of vascular interventions. It is wellestablished that the prevalence of vascular disease increaseswith patient age. Indeed, the United States has an increas-ingly older population; the number of persons older than75 years increased 67% from 1980 to 2000.1 However,neither the overall increase in the population nor the in-crease in the elderly completely explains the changes invascular volume that have occurred. We found that whenwe stratified patients by age the per capita rate of vascularintervention still increased. Thus the overall use of vascularprocedures is also increasing; that is, the frequency ofinterventions has increased. There are several possible rea-sons for this. Perhaps in recent years vascular specialistshave become more aggressive in using vascular interven-tions, because of the increased availability of “minimallyinvasive” techniques. Our data corroborate this hypothesis,as evidenced by the dramatic growth in catheter-basedinterventions. There may also have been an increased use ofopen surgical procedures related to improvement in theirsafety profile. Or perhaps the current payer system encour-ages increased usage. With few exceptions, physicians nowpractice in an environment of diminishing reimbursement,and the increased rate of usage could in part be economi-cally motivated.
Table III. Per capita* changes in patient demographicdata: 1980-2000
1980 1985 1990 1995 2000% Increase1980-2000
GenderMale 194 231 230 251 275 42Female 114 166 165 186 202 77
RaceWhite 135 183 160 179 179 33Black 150 179 188 219 193 29
Age (y)15-44 40 48 48 39 47 1845-64 267 311 289 280 306 1565-74 620 874 819 1043 958 55�75 771 1013 1006 1133 1300 69
*Number of procedures per 100,000 population.

JOURNAL OF VASCULAR SURGERYJune 20041204 Anderson et al
These changes in vascular procedure volume were notuniform, and varied with the intervention. For example, thefrequency of elective AAA repair did not change over the20-year period of evaluation. In a previous study we re-ported that over a similar period (1979-1997) the numberof patients with ruptured AAAs treated at US hospitalsremained constant.6 If we assume that the goal of treatinganeurysms is to prevent rupture, these data would suggestthat we have made little, if any, progress from 1980 to 2000
Fig 2. Per capita rates for abdominal aortic aneurysinterventions (C), lower extremity revascularization pro(F), and thoracic-subclavian and other interventions (G
in our ability to treat this disease process. Together, thesetwo findings are surprising and disappointing. One can onlysurmise that a more active program of screening for AAAwould serve to increase the number of elective repairs anddecrease the number of ruptures. Moving forward, threefactors are likely to affect the use of elective AAA repair.Recent reports recommending AAA repair in only thosepatients with aneurysms greater than 5.5 cm7,8 may welldecrease the rate of intervention. However, current initia-
), carotid endarterectomy (B), renal and mesentericres (D), catheter-based interventions (E), amputations
m (Acedu
).
JOURNAL OF VASCULAR SURGERYVolume 39, Number 6 Anderson et al 1205
tives to increase the frequency and reimbursement forscreening, and perhaps the broader use of endovascularAAA repair are likely to have the opposite effect. Werecently reported data from New York State that showed anincrease in the frequency of aneurysm repair after approvalof endovascular devices by the Food and Drug Administra-tion.9 In fact, in 2002 more endovascular repairs than openrepairs were performed in New York State. At the sametime, there are an increasing number of reports of late
Fig 2.
failure of endovascular devices. The final effect of endovas-cular aneurysm repair on usage will not be clear for manyyears.
In the early 1980s there was a steady increase in thenumber of CEA procedures performed, a trend that re-versed in the late 1980s (1985-1990). This change in usagehas been previously documented, and appears to be relatedto a number of publications that challenged the benefit ofcarotid intervention.10-13 One such review published in
inued.
Cont
cular
JOURNAL OF VASCULAR SURGERYJune 20041206 Anderson et al
1988 suggested that 32% of CEA procedures in the UnitedStates were performed for inappropriate indications.14
However, after completion of several well-structured ran-domized prospective studies clarifying the indications forand benefits of CEA, the frequency of this procedure beganto increase again. Our data reveal that the rate of CEAreached a peak in 1997, but declined over the subsequent 3years. Since completion of this analysis, data have becomeavailable for 2001 that demonstrate that the decline con-tinues. Perhaps this is related to the increased use of carotidangioplasty with stenting (CAS). CAS in the NHDS database is categorized as a catheter-based procedure.
Although the number of aortoiliac and infrainguinalreconstructions increased significantly from 1980 to 1990,from 1990 to 2000 there was a decline in the frequency ofopen surgical interventions to treat lower extremity vascu-lar disease. This corresponded with a nearly 1000% increasein the number of catheter-based interventions. Althoughthe NHDS does not provide specific information on whichvessels were treated percutaneously, many of these inter-ventions were designed to treat lower extremity vasculardisease and carotid artery stenosis. This same trend wasobserved with renal and mesenteric surgical interventions.There was a 27% per capita decrease in the number of renaland mesenteric bypass procedures performed between1995 and 2000. Although it is impossible to establish causeand effect, it seems plausible that the increase in peripheraland renal artery angioplasty and stenting had a role in thisdecline. It is difficult to predict from these data the future ofopen surgical revascularization of the renal, mesenteric, andlower extremity arteries; however, it is likely that the use ofopen surgery will continue to diminish. These data shouldserve as a reminder to all vascular surgeons of the impor-tance of gaining competence in catheter interventions usedto treat all vascular territories.
One might anticipate that an increase in frequency ofvascular interventions would be accompanied by a decrease
Fig 4. Per capita use of vas
in the undesirable disease outcomes that these interven-tions were designed to prevent. Of interest, this relation-ship is not obvious for any of the interventions we studied.The incidence of patients with ruptured AAAs has notdecreased, although this may be partially due to the factthat the number of elective aneurysm repairs has not in-creased substantially. The number of CEA procedures hasincreased, and thus one might anticipate a decrease in theincidence of stroke. In fact, according to the AmericanHeart Association, the incidence of stroke is slowly rising.15
Moreover, according to the NCHS, stroke was the thirdleading cause of death in 1980, and it remained the thirdleading cause of death in 2000.16 However, because carotidstenosis is only one of the many causes of stroke, it isdifficult to directly relate treatment of carotid stenosis tothe stroke rate. Last, despite an increase in the overallnumber of surgical and catheter-based lower extremityinterventions, our data from the NHDS demonstrate thatthere has been no decrease in the incidence of minor ormajor amputation. In contrast, in Europe an increase inlower extremity revascularization in the 1980s was thoughtto result in the decreased rate of amputation in the early1990s.17-19 Moreover, in Canada an increase in the use oflower extremity angioplasty appears to correlate with adecrease in the frequency of amputation.20 There are sev-eral possible reasons for our findings. Many lower extremityrevascularization procedures are designed to treat claudica-tion, and thus would have no effect on limb salvage. It isalso possible that interventions for lower extremity occlu-sive disease are delaying, but not eventually preventing,amputation, albeit this is still a desirable result.
There were interesting changes in the target populationfor vascular interventions over the 20-year observationperiod. Most notably, there was rapid growth in per capitaadmissions for women and black patients. Of no surprise,LOS for patients who underwent treatment of vasculardisease decreased significantly across all major categories
procedures, by patient age.

JOURNAL OF VASCULAR SURGERYVolume 39, Number 6 Anderson et al 1207
except catheter-based, a finding not unique to vascularsurgery. Of interest, the decrease in LOS for vascular pa-tients during the study period was 60% (from 19 days to 7.7days), whereas the national average for all hospitalizationsdecreased only 37% (from 7.3 days to 4.6 days)21 (Fig 5,C).
Several qualifications need to be made regarding theforegoing data. The data set addresses only inpatient pro-cedures. Thus a number of vascular interventions that canbe performed on outpatients were excluded from the anal-ysis, including varicose vein surgery, arteriovenous dialysisaccess, and diagnostic angiography. Data for patients un-dergoing endovascular interventions who were not admit-ted to the hospital were excluded as well. Using the Na-tional Ambulatory Medical Care Survey, we estimated thatthese interventions may number as many as 200,000 peryear, and contribute significantly to the overall volume ofprocedures performed by vascular surgeons. There areclearly limitations to drawing conclusions from a weighteddischarge database. Information derived from large datasets such as the NHDS are based on sampling rather than a
Fig 5. Vascular procedures, by length of stay (A), lengthversus national (C). *National data from Hall et al.21
complete census. Results are subject to nonsampling mea-surement errors, which include errors due to hospital non-response, missing discharge abstracts, information incom-pletely or inaccurately recorded on abstract forms, andprocessing errors. Another limitation of data sets such asthe NHDS is the potential for error in coding. Neverthe-less, large data sets are the only valid method available forrecognizing national trends in usage and outcomes in med-icine, and consequently are widely used for that purpose.
Perhaps the most interesting aspect of this analysis isthe use of the data to predict future volume of vascularinterventions. In 1996 the Committee on Workforce Issuesfor the Society for Vascular Surgery and the InternationalSociety for Cardiovascular Surgery predicted that in 2020there would be 1,020,067 vascular operations performed inthe United States.22 We predict that in 2030 the number ofprocedures will range from a minimum of 1.33 million to amaximum of 2.17 million. In projecting future use ofvascular interventions three potential factors are important:growth in the population, change in age distribution, andchange in usage. Using the first two of these factors, we
ay stratified by age (B), and mean length of stay, vascular
of st
JOURNAL OF VASCULAR SURGERYJune 20041208 Anderson et al
predict the number of vascular procedures in 2030 to be1,331,813. This rather significant increase in the number ofprocedures is related largely to the importance of aging ofthe “baby boomers.” Adding in potential changes in usage,we predicted this number to be as high as 2,171,666.
Trends in usage are extremely difficult to predict. Per-haps a new drug that maintains durable patency after femo-ralpopliteal or tibial angioplasty will encourage more ag-gressive use of endovascular techniques. Alternatively, ifoutpatient injection of growth factors (angiogenesis)emerges as an effective intervention it could eliminate theneed for most lower extremity revascularization proce-dures. The importance of these changes in volume, specif-ically to vascular surgeons, is difficult to predict vis-a-vis theinvolvement of other specialists in catheter-based interven-tion for vascular disease. Trends in renal and lower extrem-ity revascularization interventions indicate a major shifttoward less invasive treatments. Despite the rapid growth ofCEA, a shift toward catheter-based alternatives to treatcarotid disease would have a substantial effect on CEA.Thus the overall predicted increase in volume and trends inprocedural use suggest that vascular surgeons must em-brace catheter-based approaches if they want to remainleaders in the treatment of peripheral vascular diseases.
REFERENCES
1. http://www.census.gov/.2. International Classification of Diseases. 9th revision. Clinical modifica-
tion. 6th Edition. 2003.3. US Department of Health and Human Services. Design and operation
of the National Hospital Discharge Survey: 1988 redesign. Vital HealthStat [1] 2000;39:1-13.
4. National Hospital Discharge Survey, 2001. Public use data file docu-mentation. Atlanta (GA): US Department of Health and Human Ser-vices, Centers for Disease Control and Prevention, National Center forHealth Statistics, Division of Health Care Statistics ([email protected]).
5. Hall MJ, Owings MF. 2000 National Hospital Discharge Survey.Advance data from vitaland health statistics, no. 329. Hyattsville (Md):National Center for Health Statistics; 2002. Available from: URL:http://www.cdc.gov/nchs/products/pubs/pubd/ad/321-330/ad329.htm.
6. Heller JA, Weinberg A, Arons R, Krishnasatry KV, Lyon RT, Seitch JS,et al. Two decades of abdominal aortic aneurysm repair: have we madeany progress? J Vasc Surg 2000;32:1091-1100.
7. Lederle FA, Wilson SE, Johnson GR, Reinke DB, Littooy FN, AcherCW, et al. Immediate repair compared with surveillance of small ab-dominal aortic aneurysms. N Engl J Med 2002;346:1437-44.
8. United Kingdom Small Aneurysm Trial Participants. Long-term out-comes of immediate repair compared with surveillance of small abdom-inal aortic aneurysms. N Engl J Med 2002;346:1445-52.
9. Anderson PL, Arons RR, Moskowitz AJ, Gelijns A, Magnell C, Clair D,et al. A statewide experience with endovascular AAA repair: rapiddiffusion with excellent early results. J Vasc Surg 2004;39:10-8.
10. Brott T, Thalinger K. The practice of carotid endartarectomy in a largemetropolitan area. Stroke 1984;15:950-5.
11. Muuronen A. Outcome of surgical treatment of 110 patients withtransient ishchemic attack. Stroke 1984;15:959-64.
12. Chambers BR, Norris JW. The case against surgery for asymptomaticcarotid stenosis. Stroke 1984;15:964-7.
13. Warlow C. Carotid endartarectomy: does it work? Stroke 1984;15:1068-76.
14. Winslow CM, Solomon DH, Chassin MR, Kosecoff J, Merrick NJ,Brook RH. The appropriateness of carotid endartarectomy. N EnglJ Med 1988;318:721-7.
15. Strokes and “mini-strokes” on the rise; total may exceed 1.2 million.Accessed Feb 11, 2004. www.americanheart.org.
16. National Center for Health Statistics. Health, United States, 2002[Table 32]. http://www.cdc.gov/nchs/hus.htm.
17. Eickhoff JH. Changes in the number of lower limb amputations duringa period of increasing vascular surgical activity: results of a nation-widestudy, Denmark, 1997-1990. Eur J Surg 1993;159:469-73.
18. Luther M. The influence of arterial reconstructive surgery on theoutcome of critical leg ischemia. Eur J Vasc Surg 1994;8:682-9.
19. Pell JP, Fowkes FG, Ruckley CV, Kendrick CJ, Boyd JH. Decliningincidence of amputation for arterial disease in Scotland. Eur J Vasc Surg1994;8:602-6.
20. Al-Omran M, Tu JV, Johnston KW, Mamdani MM. Use of interven-tional procedures for peripheral arterial occlusive disease between 1991and 1998: a population-based study. J Vasc Surg 2003;38:289-95.
21. Hall MJ, DeFrances CJ. 2001 National Hospital Discharge Survey:advance data. Vital Health Stat 2003;332:1-20.
22. Stanley JC, Barnes RW, Ernst CB, Hertzer NR, Mannick JA, MooreWS. Vascular surgery in the United States: workforce issues. J Vasc Surg1996;23:172-81.
Submitted Jan 21, 2004; accepted Feb 27, 2004.Available online Apr 28, 2004.
Additional material for this article may be found onlineat www.mosby.com/jvs.
Copyright © 2022 FDOKUMEN