Variable-ratio schedules as variable-interval schedules with linear feedback loops

Accounting for Inpatient Wards When DevelopingMaster Surgical SchedulesPeter T. Vanberkel, MASc,*† Richard J. Boucherie, PhD,* Erwin W. Hans, PhD,†Johann L. Hurink, PhD,* Wineke A. M. van Lent, MSc,‡ and Wim H. van Harten, MD, PhD‡
BACKGROUND: As the demand for health care services increases, the need to improve patientflow between departments has likewise increased. Understanding how the master surgicalschedule (MSS) affects the inpatient wards and exploiting this relationship can lead to adecrease in surgery cancellations, a more balanced workload, and an improvement in resourceutilization. We modeled this relationship and used the model to evaluate and select a new MSSfor a hospital.METHODS: An operational research model was used in combination with staff input to developa new MSS. A series of MSSs were proposed by staff, evaluated by the model, and thenscrutinized by staff. Through iterative modifications of the MSS proposals (i.e., the assignedoperating time of specialties), insight is obtained into the number, type, and timing of wardadmissions, and how these affect ward occupancy.RESULTS: After evaluating and discussing a number of proposals, a new MSS was chosen thatwas acceptable to operating room staff and that balanced the ward occupancy. After implement-ing the new MSS, a review of the bed-use statistics showed it was achieving a balanced wardoccupancy. The model described in this article gave the hospital the ability to quantify theconcerns of multiple departments, thereby providing a platform from which a new MSS could benegotiated.CONCLUSION: The model, used in combination with staff input, supported an otherwisesubjective discussion with quantitative analysis. The work in this article, and in particular themodel, is readily repeatable in other hospitals and relies only on readily available data. (AnesthAnalg 2011;112:1472–9)
Netherlands Cancer Institute–Antoni van Leeuwen-hoek Hospital (NKI-AVL) is a comprehensive can-cer center that provides hospital care and research
and is located in Amsterdam, The Netherlands. The hospi-tal has 150 inpatient beds and the outpatient clinic receivesapproximately 24,000 appointment requests every year,making it approximately the size of a midsized generalhospital. As with many Dutch hospitals, NKI-AVL is eagerto improve access and increase capacity. To this end, thehospital has expanded its operating capacity from 5 to 6operating rooms (ORs). The hospital welcomed this expan-sion as an opportunity to develop a new master surgicalschedule (MSS). Developing a good MSS is a complex taskthat requires the commitments and concessions of manycompeting stakeholders.
Typically, and as is the case at NKI-AVL, the yearlyamount of operating time allotted to each specialty reflectspatient demand and hospital priorities. To implement achosen allotment, and to make the surgical departmentmore manageable, many hospitals divide their surgicalcapacity into OR blocks over a certain planning period. One
OR block of capacity typically represents a full day of ORtime. This assignment of the surgical specialties to each ORblock is referred to as the MSS.1 Once developed, the MSSis simply repeated throughout the year. At NKI-AVL, theMSS represents a 1-week period in which the surgeonsfrom the 6 surgical specialties are assigned to 1 or more ofthe 5 operating days. An example MSS for 5 ORs is shownin Figure 1.
Developing a good MSS can be a complicated task.2
There are many restrictions within the department ofsurgery, such as limited specialized equipment and physi-cian availability, which need to be adhered to. Theserestrictions are, for the most part, known in advance.However, the relationship between the MSS and the wardis much less direct and plagued with uncertainties. Forexample, it may be known that every patient from a givenspecialty will be admitted to the ward after surgery;however, the number of patients who receive surgeryduring 1 OR block changes from week to week and it is notknown with certainty how long each patient will stay.Because of this uncertainty, MSSs are often developedwithout explicit consideration for the wards. Notable ex-ceptions (discussed in Vanberkel et al.3) used models fromoperations research to define and emulate the relationshipbetween the ORs and the ward.
The use of industrial engineering and operations re-search in health care4–8 is not new. However, authors havenoted that the implementation rates in health care settingshas lagged behind that of other industries.9–11 More spe-cifically, as is related to the development of MSSs, theliterature is replete with studies12–15 that use complexmathematics to derive optimal MSSs; however, the rate ofimplementation for this type of study is unknown but
From the *Department of Applied Mathematics, †Operational Methodsfor Production and Logistics, and ‡Health Technology and ServicesResearch, University of Twente, Enschede, The Netherlands.
Accepted for publication February 4, 2011.
Funding: Internally by participating institutions.
The authors declare no conflicts of interest.
Reprints will not be available from the authors.
Address correspondence to Peter T. Vanberkel, MASc, University of Twente,PO Box 217, 7500 AE Enschede, The Netherlands. Address e-mail [email protected].
Copyright © 2011 International Anesthesia Research SocietyDOI: 10.1213/ANE.0b013e3182159c2f
1472 www.anesthesia-analgesia.org June 2011 • Volume 112 • Number 6

presumed low.16 To overcome this, Cardoen et al.16 “en-courage the provision of additional information on thebehavioral factors that coincide with the actual implemen-tation. Identifying the causes of failure or the reasons thatlead to success, may be of great value to the researchcommunity.”
In this article, we describe the process of developing anew MSS for NKI-AVL and the first results observedafter its implementation. The development process,which combined an operational research model and staffinput, led to an MSS that was agreeable to staff from boththe wards and the OR. Staff selected and implemented anMSS that the model predicted would result in a balancedward occupancy.
METHODSThe development of the new MSS was completed over 3months in an iterative manner. A team was formed consist-ing of a team leader from the surgical department, a teamleader from the inpatient wards, the manager of bothgroups, and 2 of this article’s authors who work in thehospital’s operations improvement group. The team mem-bers from the surgical department ensured MSS proposalsdid not cause conflicts within the OR, such as with physi-cian schedules and available equipment. The projectedimpact that each MSS proposal would have on the wardswas evaluated with the operational research model de-scribed below. Each new MSS proposal represented a newscenario to be evaluated by the model. From the modeloutput, staff decided whether the MSS was acceptable or iffurther modifications to the MSS were necessary.
The original MSS was roughly developed as follows.Based on production targets, the number of OR blocks to beassigned to each specialty during the 1-week MSS cycle wasdetermined. Next, the physicians’ commitments elsewhere
in the hospital were determined and their preferred oper-ating days were considered. Potential equipment and re-source conflicts were addressed; for example, it would beproblematic to assign 2 specialties to the same operatingday when both routinely require the same specialized OR.Considering these restrictions, OR staff proposed the origi-nal MSS.
To determine how the original MSS affected the wards,the operational research model described in the followingsubsection was used. As illustrated in the Results section,the original MSS results in an unbalanced ward occupancy(the motivation for this metric is also provided in theResults section). As such, the team decided the originalMSS was not acceptable.
Next, modifications to the original MSS were made anda new MSS proposal was put forth. Given that in thisproject we were not asking surgical specialties to changehow they operate (e.g., the number of procedures theyperform in an OR block and/or the invasiveness of theirprocedures, which can dictate length of stay), modificationsto the MSS were limited to changes in the assignment ofsurgery specialties to OR blocks. Essentially, modificationsconsisted of swapping a specialty operating on one daywith a specialty operating on a different day. Decidingwhich blocks to swap followed at first, from OR staffknowledge of what was possible within the constraints ofthe OR, and second, by intuition gained from seeing resultsfrom several MSS proposals. Figure 2 illustrates the type ofmodifications made.
A number of MSSs were proposed, and the impact thateach would have on the ward was evaluated by the model.This process of modifying and evaluating MSSs continueduntil an MSS was found that satisfied staff from both theOR and the wards. A schematic overview for this process isdisplayed in Figure 3.
Mon Tue Wed Thu Fri Sat Sun OR 1 Surg. 1 Surg. 3 Surg. 3 HIPEC Surg. 2 OR 2 ENT 1 Surg. 4 Urology Urology Urology OR 3 ENT 2 Plas. Surg. ENT 1 ENT 2 Plas. Surg. OR 4 Surg. 2 Gyne. ENT 2 Plas. Surg. Gyne. OR 5 RT Surg. 5 RT RT Urology
Figure 1. Example master surgical sched-ule for 5 operating rooms (OR) and a1-week cycle.
Mon Tue Wed Thu FriOR 1 Surg. 1 Surg. 3 Surg. 3 HIPEC Surg. 2OR 2 ENT 1 Surg. 4 Urology Surg. 2 UrologyOR 3 ENT 2 Plas. Surg. ENT 1 ENT 2 Plas. Surg.OR 4 Urology Gyne. ENT 2 Plas. Surg. Gyne.OR 5 RT Surg. 5 RT RT UrologyOR 6 Surg. 3 RT Surg. 1 Gyne. RT
Mon Tue Wed Thu FriOR 1 Surg. 1 Surg. 3 Surg. 3 HIPEC Surg. 2OR 2 ENT 1 Surg. 4 Urology Urology UrologyOR 3 ENT 2 Plas. Surg. ENT 1 ENT 2 Plas. Surg.OR 4 Surg. 2 Gyne. ENT 2 Plas. Surg. Gyne.OR 5 RT Surg. 5 RT RT UrologyOR 6 Surg. 3 RT Surg. 1 Gyne. RT
Modification Swapped
Figure 2. Illustration of master surgical schedulemodification.
June 2011 • Volume 112 • Number 6 www.anesthesia-analgesia.org 1473

The MSS chosen by the team was implemented concur-rently with the opening of the new OR in March of 2009.The new OR was phased in over several months, and onceit became fully utilized, ward occupancy statistics werecollected. The data, observed over a 33-week period whenall 6 ORs were being regularly scheduled, were comparedwith what was projected from the model. The purpose, toensure a more balanced ward occupancy, was indeed beingachieved with the implemented MSS. In this way, we couldvalidate the model output and confirm that the imple-mented MSS was resulting in the desired ward occupancy.
Model DescriptionThe intuition for the model follows from the intended flowof surgical patients from the OR to the ward, and finally, tobeing discharged. Using 12 months of historical data fromthe year 2008, we determined, for each surgical specialty,the probabilities for 1, 2, 3, … inpatient procedures beingcompleted in 1 OR block. These numbers express thenumber of patients admitted to the ward designated to anOR block of that specialty. Every day after surgery, each ofthese patients has a probability of being discharged. Thesedischarge probabilities are specific for each surgical spe-cialty and for each day after surgery. They were likewisederived from the historical data.
From probability theory it is known that when multipleexperiments have 2 (and only 2) possible outcomes, thenthe probability for the number of experiments resulting ineach outcome can be computed with a binomial distribu-tion (assuming experiments are independent and identi-cally distributed). For example, say we know that given thechoice between a vegetarian and a nonvegetarian dinner,20% of people will choose vegetarian and the other 80%will choose nonvegetarian. Say that 200 people arrive todinner, then the binomial distribution can tell us theprobability that exactly 60 (or any number �200) vegetar-ian dinners will be requested. The “experiment” in this caseis the person’s choice and the “outcomes” are vegetarianand nonvegetarian dinners. It is easy to imagine the valueof such information to a caterer.
In our case, consider the patient as the experiment with2 outcomes, “stay” or “be discharged.” From the dataabove, we know the probability of being discharged andconversely the probability of staying. If we know thenumber of inpatients hospitalized today (i.e., the number ofexperiments), then we can use the binomial distribution tocompute the number of discharges and conversely weknow the number of beds needed tomorrow.
The inherent assumption of using the binomial distribu-tion for this purpose is that all patients (experiments) haveequal probability of each outcome and that the outcome isindependent of other patients, i.e., it is assumed that the
patients are identically distributed and independent. Theindependence assumption is natural because it implies thatthe amount of time one patient is in the hospital does notinfluence the amount of time another patient is in thehospital. The identically distributed requirement meansthat we must compute the number of beds needed tomor-row (and the number of cases completed in 1 OR block), forall identically distributed cohorts of patients separately. Inother words, the parameters of the binomial distributionmust reflect all of the patients in a given cohort (for adiscussion on defining statistically equivalent patient co-horts, see the article by Harper17). Finally, because patientsare independent, the total number of beds needed tomor-row is computed by adding the beds needed by eachcohort. Because we are adding distributions and not themean, the additions are computed using discrete convolu-tions (we provided a formal model description in theAppendix).
Because this project considers tactical planning (plan-ning decisions made over the intermediate planning hori-zon and without complete knowledge of what is to come),a certain level of aggregation is required. When an MSS isbeing developed, not all of the details about the planninghorizon are known, i.e., which patients will arrive, whichdoctors will be available, etc. What is known is that acertain volume of patients with a certain case mix isexpected. Hence, the assignment of surgical specialties (notindividual patients) to OR blocks is the primary factorcontrolled by the OR planners. We reflect this in our modelby aggregating patient data such that each surgical spe-cialty is a single patient cohort.
To use the binomial distribution as discussed above, thepatients within each surgical specialty should not be tooinhomogeneous. If a somewhat inhomogeneous populationis grouped together, this causes the ward census distribu-tion to have longer tails (although the mean remains thesame) and will overestimate the bed requirements whenstaffing for a certain percentile of demand. Conversely,however, less aggregation (such as dividing a specialty byshort- and long-stay patients) decreases the sample sizefrom which to derive the parameters, which in turn reducesthe statistical confidence of the estimated parameters. Inour case, aggregating the data by specialty allowed forenough data to have a sufficient sample size and resulted inrelatively homogeneous patient cohorts. As discussed inthe following paragraph, in nonspecialty hospitals wherethis may not be true, the model can still be used.
In cases in which patients of a surgical specialty are tooinhomogeneous to be aggregated into a single cohort, themodel can still be used. First, the inhomogeneous specialtyhas to be divided into multiple homogeneous cohorts and
Evaluation by the Model
Model output discussed by team
Modifications to MSS necessary?
Original MSS Proposal
ImplementMSS
Yes
No
Modify MSS
Ensure MSS fits within operating room restrictions
Figure 3. Master surgical schedule (MSS) de-velopment schematic.
Surgical Schedules and Inpatient Wards
1474 www.anesthesia-analgesia.org ANESTHESIA & ANALGESIA
then these cohorts can be treated as if they were assignedtheir own OR block. Using this, the binomial distribution isapplied as described above to determine the bed require-ments of each cohort. Again, using the independenceassumptions, these cohorts can be added (with discreteconvolutions) to determine the total bed requirements forthe complete surgical specialty.
Historical records indicate the number of inpatient pro-cedures completed by a specialty assigned to an OR block.This provides the probability of the number of beds neededon the day of surgery (i.e., the number of experiments).With this information, and using the binomial distribution,we can determine the probability for the number of bedsneeded each day after surgery. In this way, the modelcreates an explicit relationship between each OR block andthe inpatient wards. Finally, by including all OR blocks andby taking care to account for patients overlapping from oneMSS cycle to the next, the overall need for beds for a givenMSS can be computed. The formal model is outlined in theAppendix and is described in detail in Vanberkel et al.18
The model is depicted graphically for a single OR block inFigure 4.
Although it is changing, health care management isnotorious for making planning decisions based on aver-ages.19 However, if the caterer in our example would onlyprepare the average amount of vegetarian meals expectedfrom the crowd of 200, a shortage would be realized 46% ofthe time. In the same way, a hospital that staffs only theaverage number of beds will quickly realize similar short-ages. With our model, hospital management can indicatetheir risk aversion for having a bed shortage, and from themodel output, we can determine the number of bedsrequired to achieve it.
The data used for the model were extracted from thehospital’s patient management system for the calendar year2008. The model calculations were facilitated with Mi-crosoft Visual Basic.
Inherent to the model are a number of assumptions thatare discussed to provide perspective on what the model canand cannot be used for. Patients are counted as “occupyinga bed” on the day of admission, not on the day of discharge;thus, issues with overlapping patients on the same day arenot quantified. Emergency patients are not explicitly mod-eled; however, using historical data, their impact is addedto model output. Furthermore, because this project iscompleted at a specialty cancer hospital, the presence ofemergency patients is low. It is assumed that the MSS doesnot change from week to week. In reality, the MSS doesoccasionally change to reflect seasonal patterns. Duringthese periods, certain OR blocks are canceled, meaning ourmodel overestimates the ward occupancy during theseweeks, but nevertheless still may be helpful as an upperbound.
Finally, the model assumes that there is always a bedavailable for a patient after surgery. This implies thatprocedures are never canceled because of bed shortages.
This is perhaps an idealized situation, although it is repre-sentative of hospitals that call in additional staff whendemand is higher than expected (as is the practice of thehospital in this case study). The frequency of “calling inadditional staff” follows from the model. Because, in prac-tice, additional staff may not always be available (andprocedures are occasionally canceled as a result), the modeloutput may overestimate the bed requirements, althoughonly slightly when cancellations are uncommon.
RESULTSThis section is divided into 2 subsections. The first subsec-tion discusses ward occupancy projected by the modelduring the MSS development process. We show wardoccupancy projections from the original MSS proposal andfrom the MSS proposal that staff chose to implement(which we refer to as the implemented MSS). In the secondsubsection, we compare the ward occupancy projected bythe model for the implemented MSS with the ward occu-pancy observed after it was implemented.
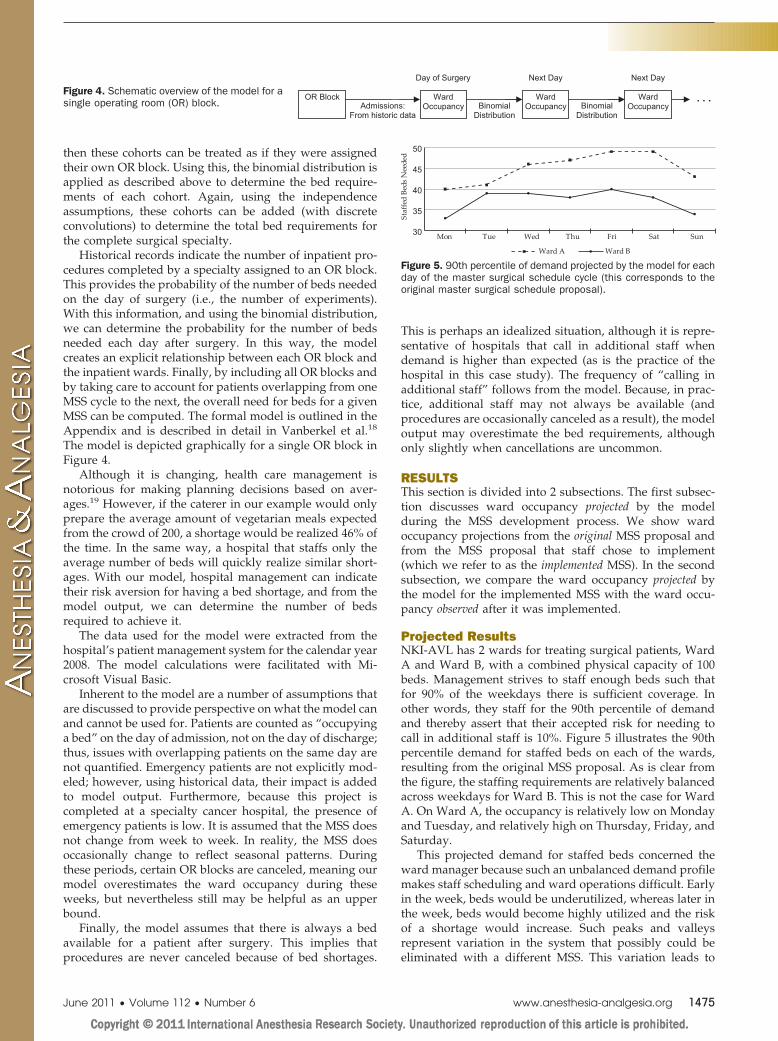
Projected ResultsNKI-AVL has 2 wards for treating surgical patients, WardA and Ward B, with a combined physical capacity of 100beds. Management strives to staff enough beds such thatfor 90% of the weekdays there is sufficient coverage. Inother words, they staff for the 90th percentile of demandand thereby assert that their accepted risk for needing tocall in additional staff is 10%. Figure 5 illustrates the 90thpercentile demand for staffed beds on each of the wards,resulting from the original MSS proposal. As is clear fromthe figure, the staffing requirements are relatively balancedacross weekdays for Ward B. This is not the case for WardA. On Ward A, the occupancy is relatively low on Mondayand Tuesday, and relatively high on Thursday, Friday, andSaturday.
This projected demand for staffed beds concerned theward manager because such an unbalanced demand profilemakes staff scheduling and ward operations difficult. Earlyin the week, beds would be underutilized, whereas later inthe week, beds would become highly utilized and the riskof a shortage would increase. Such peaks and valleysrepresent variation in the system that possibly could beeliminated with a different MSS. This variation leads to
Admissions: From historic data
Ward Occupancy
Day of Surgery
Ward Occupancy
Next Day
. . . Binomial
Distribution
OR Block
Next Day
BinomialDistribution
Ward Occupancy
Figure 4. Schematic overview of the model for asingle operating room (OR) block.
Figure 5. 90th percentile of demand projected by the model for eachday of the master surgical schedule cycle (this corresponds to theoriginal master surgical schedule proposal).
June 2011 • Volume 112 • Number 6 www.anesthesia-analgesia.org 1475

significant problems, particularly as the wards approachpeak capacity. For example, when inpatient wards reachtheir peak capacity and a patient admission is pending,staff often scramble to try to make a bed available. If onecannot be made available, additional staff are called in (orin rare cases when additional staff cannot be found, theelective surgery is canceled), which causes extra work forOR planners, wasted time for surgeons, and extra anxietyfor patients. When a bed was made available, it oftenmeans a patient was transferred from one ward to another(often to a ward capable of caring for the patient but not thedesignated one) or discharged. Either way, extra work isrequired by ward staff and there is a disruption in patientcare. Although completely eliminating such problems islikely not possible without an exorbitant amount of re-sources (because of the variance), sound planning ahead oftime may help to minimize occurrences.
Upon discussing the model output, all project teammembers agreed that the original MSS, although appropri-ate for the OR, was not ideal for the wards. The discussionthen moved to how to correct the imbalance across theweekdays by changing the assignment of OR blocks tospecialties. Modifications to the original MSS were made byconsidering what changes were possible within the restric-tions of the OR.
Eventually, after considering several MSS proposals, theprocess led to an MSS (the implemented MSS) that wasagreeable to all staff members. The implemented MSS fitwithin the restrictions of the OR (e.g., physician schedulesand equipment availability) and, as illustrated in Figure 6,resulted in a more balanced ward occupancy. Comparingthe implemented MSS with the original MSS, the imple-mented MSS dampened the fluctuation on Ward A bydecreasing occupancy on Thursday, Friday, and Saturday,and increasing it on Monday and Tuesday. With theimplemented MSS, the model predicted that no days wouldrequire �47 staffed beds, which reduced the maximumfrom 49 (predicted for the original MSS). Furthermore, theimplemented MSS ensured that the staffing requirementsremained relatively balanced across the working days forboth wards.
Observed ResultsThe ward occupancy was observed over a 33-week periodafter OR 6 was fully operational and when the imple-mented MSS was in use. From these data, probabilitydistributions of beds used for each day of the MSS cyclewere derived. Using �2 goodness-of-fit tests,20 these ob-served distributions were compared with those projectedby the model. For Ward B, 6 of the 7 projected distributions
(one for each day of the MSS cycle) were found to be a goodfit for the observed data at a level � � 0.05, whereas for theseventh day, this was true at a level � � 0.2. For Ward A,the tests found the projected distributions to be a good fit atlevels � � 0.15 (for 3 days), 0.25 (for 2 days), and 0.35 (for2 days). At these � levels, we conclude that the observedward occupancy is well predicted by the model. Explana-tions for the poorer fit of Ward A data are discussed in thefollowing paragraphs where the 90th percentiles (desiredstaffing level) are compared for the observed and projectedresults.
Figures 7 and 8 compare the projected ward occupancywith the observed ward occupancy during the 33-weekperiod. Figure 7 displays results for Ward A and Figure 8for Ward B.
As is observable in Figures 7 and 8, the data indicate thatboth wards are indeed experiencing a balanced wardoccupancy across the weekdays. However, it is also observ-able that our model overestimated the number of bedsrequired, in Ward A by approximately 16%. The overesti-mate is attributable to an unexpected increase in short-staypatients during the period of measurement. Had thischange in patient mix been expected at the time theprojections were made (and model input altered to reflectit), the overestimate would not have been observed. Thishighlights how process variables may change over timeand the importance of estimating this and reflecting it in themodel input.
As a final note on the model results, consider if hospitalmanagement decided to staff only for the average numberof beds projected to be needed for 6 ORs. In this case, 32beds would be assigned to Ward A and 29 beds to Ward B.This would have led to a bed shortage on 51% of the days.This illustrates the importance of considering probabilitydistributions in hospital planning.
DISCUSSIONWith the approach discussed in this article, a new MSS wasdeveloped for NKI-AVL that reduced the fluctuations in
Figure 7. Comparison of the projected and observed (90th percen-tile) bed occupancies on Ward A.
Figure 8. Comparison of the projected and observed (90th percen-tile) bed occupancies on Ward B.
Figure 6. 90th percentile of demand projected by the model for eachday of the master surgical schedule cycle (this corresponds to theimplemented master surgical schedule).
Surgical Schedules and Inpatient Wards
1476 www.anesthesia-analgesia.org ANESTHESIA & ANALGESIA

the daily ward census, creating a more balanced workloadon the wards. The roll-out of the new MSS correspondedwith the opening of an additional OR, which was expectedto overwhelm the wards. By using the process describedherein to develop an MSS that accounted for the inpatientwards, peaks in ward occupancy were reduced. As such,capacity will be used more efficiently and the hospital isgiven the means to support the additional OR without amajor expansion in the wards.
The main benefit of using the model was to be able toquantify the concerns of ward staff, thereby providing aplatform from which they could begin to negotiate asolution. Staff was quick to embrace the model output,particularly after seeing several modifications to the origi-nal MSS, at which point they were able to roughly predictmodel output for a given modification. For example, onThursdays and Fridays the wards tended to be crowdedwith patients. To remedy this, specialties that completedmany cases per OR block were removed from Thursdayand Friday OR blocks and assigned to OR blocks earlier inthe week. To accommodate these changes, specialties thatcomplete a relatively small number of cases per OR blockwere moved to Thursday and Friday. Once staff couldforesee the impact of swapping one surgical OR blockassignment with another, the implemented MSS camequickly.
The process and the case study illustrate how conceptsfrom operations research and industrial engineering cancontribute to hospital operations. The close collaborationbetween the clinical staff and modelers was of benefit toboth groups. The clinical staff was able to directly see howthe model results were affected by the model input. Thisinsight helped to build their understanding and interest inthe model, which in turn led to its credibility. For themodelers, the day-to-day involvement of clinical staff en-sured that a valid model was developed, giving themfirsthand knowledge of the actual system. This workingrelationship ensured model validity and credibility, whichcontributed a great deal toward implementation.
In this project we treated the equipment and physicianschedule restrictions as unchangeable. It is possible thatfurther improvements in the ward occupancy could havebeen achieved if these restrictions were relaxed. In thisway, the model can be used to illustrate the benefits ofbuying an extra piece of equipment or of changing physi-cians’ schedules. An additional restriction, which if relaxedmay have allowed further improvements, is the assignmentof wards to surgical specialties. In other words, in additionto changing when a specialty operates, it may proveadvantageous to change which ward the patients are ad-mitted to after surgery. Finally, we chose the best MSS fromthose created through swapping OR block and surgicalspecialty assignments. It is possible that a search heuris-tic may have found a better MSS, although it would haverequired the many surgical department restrictions to bemodeled and the more complex model may not havegarnered the same level of staff understanding andsupport.
The work in this article, and in particular the model,provides a basis for future redesign of the MSS whenconditions change and further adaptations are necessary. It
is also readily repeatable in other hospitals and relies onlyon readily available data. The model is sufficiently robustto accommodate a number of different circumstances thatmay be found at different hospital settings. Examples ofsuch circumstances and how to cope with them include:larger hospitals by increasing the number of OR blocks,specialties with presurgical lengths of stay by allowing n(see Appendix) to be a negative number, patients switchingwards by allowing hn
j �x� (see Appendix) to be ward spe-cific, and specialties with highly varying patient popula-tions by changing how patient cohorts are defined (seediscussion in Methods section).
The method in which MSS modifications are proposedcan be different than the manner described in this article.Our approach amounted to trial and error, which wasappropriate given that there are only 6 ORs and a limitednumber of possible MSS proposals due to the restrictions ofthe OR. Other hospitals, particularly larger hospitals, mayprefer a more structured method such as a search heuristicas discussed above.
Finally, variants of this model have been applied in 3other Dutch hospitals. At 2 of the hospitals, the model wasused to improve the workload balance on the inpatientwards. In the third hospital, it was used to evaluate theallocation of beds to wards. Furthermore, the possibility ofimplementing the model as part of the hospital’s businessintelligence software to allow management to indepen-dently evaluate changes to the MSS based on the mostrecent data is explored.
APPENDIXThe formal model described in this Appendix is explainedin greater detail in the article by Vanberkel et al.18 Let themaster surgical schedule (MSS) be defined such that bi,q isan operating room (OR) block where i � 1,2, …,I indexesthe ORs and q � 1,2, …,Q the days in a cycle. Let eachsurgical specialty j be characterized by 2 parameters cj anddj
n, where cj is a discrete distribution for the number ofprocedures performed in 1 OR block and dj
n the probabilitythat a patient, who is still in the ward on day n, is to bedischarged that day (n � 0,1,…,Lj, where Lj denotes themaximum length of stay for specialty j).
Using cj and djn as model inputs, for a given MSS, the
probability distribution for the number of recovering pa-tients on each day q can be computed. The required numberof beds is computed with the following 3 steps. Step 1computes the distribution of recovering patients from asingle OR block of a specialty j; i.e., we essentially precal-culate the distribution of recovering patients expected froman OR block of a specialty. In step 2, we consider a givenMSS and use the result from step 1 to compute thedistribution of recovering patients given a single cycle ofthe MSS. Finally, in step 3, we incorporate recurring MSSsand compute the probability distribution of recoveringpatients on each day q.
Step 1For each specialty j we use the binomial distribution tocompute the number of beds required from the day ofsurgery n � 1 until n � Lj. Because we know the probabilitydistribution for the number of patients having surgery (cj),
June 2011 • Volume 112 • Number 6 www.anesthesia-analgesia.org 1477

which equates to the number of beds needed on day n � 0,we can use the binomial distribution to iteratively computethe probability of needing beds on all days n� 0. Formally,the distribution for the number of recovering patients onday n is recursively computed by:
hnj �x� � � cj�x� when n � 0
�k�x
cj �kx� �dn�1
j �k�x�1 � dn�1j �xhn�1
j �k� otherwise.
Step 2We calculate for each OR block bi,q the impact this OR blockhas on the number of recovering patients in the hospital ondays q, q � 1, …. If j denotes the specialty assigned to ORblock bi,q, then let h� m
i,q be the distribution for the number ofrecovering patients of OR block bi,q on day m � 1,2, …,Q,Q � 1, Q � 2, …. It follows that,
h�mi,q � � hm�q
j if q � m � Lj � q0 otherwise
where 0 means h� mi,q�0� � 1 and all other probabilities
h� mi,q�l� � 0, l � 0.
Let Hm be a discrete distribution for the total number ofrecovering patients on day m resulting from a single MSScycle. Because recovering patients do not interfere witheach other, we can simply iteratively add the distributionsof all the OR blocks corresponding to the day m to get Hm.Adding 2 independent discrete distributions is done bydiscrete convolutions, which we indicated by “*”. Forexample, let A and B be 2 independent discrete distribu-tions. Then C � A*B, which is computed by:
C�x� � �k�0
A�k�B�x � k�
where is equal to the largest x value with a positiveprobability that can result from A*B (e.g., if the maximumvalue of A is 3 and the maximum value of B is 4, then whenconvoluted, the maximum value of the resulting distribu-tion is 7; therefore, in this example � 7).Using thisnotation, Hm is computed by:
Hm�x� � h�m1,1 � h�m
1,2 � … � h�m1,Q � h�m
2,1 � … � h�ml,Q
Step 3We now consider a series of MSSs to compute the steady-state probability distribution of recovering patients. Thecyclic structure of the MSS implies that patients receivingsurgery during one cycle may overlap with patients fromthe next cycle. In the case of a small Q, patients from manydifferent cycles may overlap.
In step 2, we have computed Hm for a single MSS inisolation. Let M be the last day in which there is still apositive probability that a recovering patient is present inHm. To calculate the overall distribution of recoveringpatients when the MSS is repeatedly executed, we mustconsider M/Q consecutive MSSs. Let Hq
SS denote theprobability distribution of recovering patients on day q ofthe MSS cycle, resulting from the consecutive MSSs. Be-cause the MSS does not change from cycle to cycle, Hq
SS isthe same for all MSS cycles. Such a result, where the
probabilities of various states remain constant over time, isreferred to as a steady-state result. Using discrete convolu-tions, Hq
SS is computed by:
Hqss�x� � Hq � Hq�Q � Hq�2Q � … � Hq� M/Q Q
To determine the demand for ward beds from the variableHq
SS, consider the following example. Let the staffing policyof the hospital be such that they staff for the 90th percentileof demand and let Dq denote the 90th percentile of demandon day q. It follows that Dq is also the number of staffedbeds needed on day q, and is computed from Hq
SS asfollows:
Dq � max�x�Hqss�x� �0.9
DISCLOSURESName: Peter T. Vanberkel, MASc.Contribution: This author helped design the study, conductthe study, analyze the data, and write the manuscript.Attestation: Peter T. Vanberkel has seen the original studydata, reviewed the analysis of the data, approved the finalmanuscript, and is the author responsible for archiving thestudy files.Name: Richard J. Boucherie, PhD.Contribution: This author helped design the study, conductthe study, and write the manuscript.Attestation: Richard J. Boucherie approved the finalmanuscript.Name: Erwin W. Hans, PhD.Contribution: This author helped design the study, conductthe study, and write the manuscript.Attestation: Erwin W. Hans approved the final manuscript.Name: Johann L. Hurink, PhD.Contribution: This author helped design the study, conductthe study, and write the manuscript.Attestation: Johann L. Hurink approved the final manuscript.Name: Wineke A. M. van Lent, MSc.Contribution: This author helped design the study, conductthe study, analyze the data, and write the manuscript.Attestation: Wineke A. M. van Lent has seen the original studydata, reviewed the analysis of the data, and approved the finalmanuscript.Name: Wim H. van Harten, MD, PhD.Contribution: This author helped design the study, conductthe study, and write the manuscript.Attestation: Wim H. van Harten approved the finalmanuscript.
REFERENCES1. Blake JT, Carter MW. Surgical process scheduling: a structured
review. J Soc Health Syst 1997;5:17–302. Belien J, Demeulemeester E, Cardoen B. A decision support
system for cyclic master surgery scheduling with multipleobjectives. J Sched 2009;12:147–61
3. Vanberkel PT, Boucherie RJ, Hans EW, Hurink JL, Litvak N. Asurvey of health care models that encompass multiple depart-ments. Int J Health Manage Inf 2010;1:37–69
4. Brandeau ML. Operations Research and Health Care: A Hand-book of Methods and Applications. New York: Springer, 2004
5. Roberts MS. Industrial engineering and the practice of medi-cine. Med Decis Making 2001;21:248–9
6. Jun JB, Jacobson SH, Swisher JR. Application of discrete-eventsimulation in health care clinics: a survey. J Oper Res Soc1999;50:109–23
Surgical Schedules and Inpatient Wards
1478 www.anesthesia-analgesia.org ANESTHESIA & ANALGESIA
7. Klein RW, Dittus RS, Roberts SD, Wilson JR. Simulationmodeling and health-care decision making. Med Decis Making1993;13:347–54
8. Shechter SM, Bryce CL, Alagoz O, Kreke JE, Stahl JE, SchaeferAJ, Angus DC, Roberts MS. A clinically based discrete-eventsimulation of end-stage liver disease and the organ allocationprocess. Med Decis Making 2005;25:199
9. Brailsford SC, Harper PR, Patel B, Pitt M. An analysis of theacademic literature on simulation and modelling in healthcare. J Simul 2009;3:130–40
10. Lagergren M. What is the role and contribution of models tomanagement and research in the health services? A view fromEurope. Eur J Oper Res 1998;105:257–66
11. Wilson JCT. Implementation of computer simulation projectsin health care. J Oper Res Soc 1981;32:825–32
12. Belien J, Demeulemeester E. Building cyclic master surgeryschedules with leveled resulting bed occupancy. Eur J OperRes 2007;176:1185–204
13. van Oostrum JM, van Houdenhoven M, Hurink JL, Hans EW,Wullink G, Kazemier G. A master surgical scheduling ap-proach for cyclic scheduling in operating room departments.OR Spectrum 2008;30:355–74
14. Blake JT, Donald J. Mount Sinai Hospital uses integer program-ming to allocate operating room time. Interfaces 2002;32:63–73
15. Belien J, Demeulemeester E, Cardoen B. Visualizing the de-mand for various resources as a function of the master surgeryschedule: a case study. J Med Syst 2006;30:343–50
16. Cardoen B, Demeulemeester E, Belien J. Operating roomplanning and scheduling: a literature review. Eur J Oper Res2010;201:921–32
17. Harper PR. A framework for operational modelling of hospitalresources. Health Care Manag Sci 2002;5:165–73
18. Vanberkel PT, Boucherie RJ, Hans EW, Hurink JL, Lent WAM,Harten WH. An exact approach for relating recovering surgicalpatient workload to the master surgical schedule. J Oper ResSoc epub ahead of print (6 October 2010) http://dx.doi.org/10.1057/jors.2010.141
19. Harper PR, Shahani AK. Modelling for the planning andmanagement of bed capacities in hospitals. J Oper Res Soc2002;53:11–8
20. McDonald JH. Handbook of Biological Statistics. 2nd ed.Baltimore: Sparky House Publishing, 2009
June 2011 • Volume 112 • Number 6 www.anesthesia-analgesia.org 1479
Copyright © 2022 FDOKUMEN