Soil macrofauna as indicators of soil quality and land use impacts in smallholder agroecosystems of...
12
Author's personal copy Ecological Indicators 27 (2013) 71–82 Contents lists available at SciVerse ScienceDirect Ecological Indicators jo ur nal homep age: www.elsevier.com/locate/ecolind Soil macrofauna as indicators of soil quality and land use impacts in smallholder agroecosystems of western Nicaragua Laurent Rousseau a , Steven J. Fonte b,∗ , Orlando Téllez c , Rein van der Hoek c , Patrick Lavelle a,b a Institut de Recherche pour le Développement (IRD), 93143 Bondy Cedex, France b Centro Internacional de Agricultura Tropical (CIAT), Tropical Soil Biology and Fertility Program, Latin American and Caribbean Region, Cali, Colombia c Centro Internacional de Agricultura Tropical (CIAT), Tropical Forages Program, Managua, Nicaragua a r t i c l e i n f o Article history: Received 11 July 2012 Received in revised form 26 November 2012 Accepted 29 November 2012 Keywords: Bioindicators Forest conversion Indicator Value Index Quesungual slash-and-mulch agroforestry system Soil ecosystem services Soil invertebrates a b s t r a c t The tropical dry forest region along the western slope of Central America represents a biodiverse and fragile area that is under increasing pressure from agricultural production, thus threatening the provi- sion of ecosystem services, the integrity of these landscapes, and the rural communities who depend on them. To address this issue, we evaluated the influence of common agricultural management practices (cropping and livestock systems) vs. the Quesungual slash-and-mulch agroforestry system (QSMAS) on diverse parameters of soil quality and function. We then used this information to identify soil inver- tebrate bioindicators that represent key aspects of soil quality (chemical fertility, physical properties, aggregate morphology, and biological functioning). In February of 2011 soil sampling was conducted on six hillside farms near the town of Somotillo in western Nicaragua to assess soil properties and the abun- dance and diversity of soil macrofauna within four management systems: (1) QSMAS, based on maize production, (2) traditional maize cropping system with few trees (TC), (3) silvopastoral system with low tree density (SP), and (4) secondary forest (SF), used as a reference. The conversion of forest to agriculture demonstrated the greatest impact of management in this study. For example, SF presented significantly higher diversity of soil invertebrate taxonomic groups than either TC or SP (P < 0.03), and demonstrated the lowest level of soil compaction, significantly less than SP (P < 0.05). Additionally, SF demonstrated the highest value of soil quality according to a synthetic indicator that integrates chemical, physical and biological aspects of soil quality. Although overall soil quality under QSMAS was lower than SF, this sys- tem demonstrated the highest abundance (number of individuals) of soil macrofauna, and appeared to at least partially mitigate the negative consequences of forest conversion on soil functioning. Using the Indicator Value Index, which ranks species according to their specificity and fidelity across sites, along with farmer consultation we found seven indicator taxa of soil quality that could greatly facilitate future evaluation of land management impacts by farmers and technicians in the region. We suggest that the methodology applied is robust and adaptable to diverse agroecological contexts and would allow for more rapid responses to evolving land use issues as they arise. © 2012 Published by Elsevier Ltd. 1. Introduction Overuse of land and poor management practices have led to extensive degradation of biodiversity and ecosystem services glob- ally (Foley et al., 2005; Giller et al., 1997). This trend is particularly concerning in smallholder agroecosystems of Central America that are often located on highly susceptible hillside soils and dominated by biologically diverse tropical dry forests. Traditional management in this region (including slash and burn) typically eliminates soil cover and organic matter inputs prior to planting, thus leaving soils ∗ Corresponding author at: CIAT, A.A. Postal 6713, Cali, Colombia. Tel.: +57 2 445 0100x3517; fax: +57 2 445 0073. E-mail address: [email protected] (S.J. Fonte). exposed to erosion and soil organic matter (SOM) loss. Under such conditions crop yields can decrease considerably after only a few years. Production plots must then be abandoned and left to fal- low for long intervals to allow adequate soil regeneration (Szott et al., 1999). A growing trend of shortening fallows along with increased grazing pressure in these systems inhibits the recovery of soils and forests (Lopez Hernandez et al., 1997; Netuzhilin et al., 1999) and thus, severely threatens long-term agricultural produc- tivity, food security, and the provision of ecosystem services in the region. In addressing this threat, farmers, researchers and technicians must find adequate ecologically-based management alternatives to control soil erosion, maintain soil functioning, and enhance agroe- cosystem resilience and biodiversity (Perfecto and Vandermeer, 2008). The Quesungual slash-and-mulch agroforestry system 1470-160X/$ – see front matter © 2012 Published by Elsevier Ltd. http://dx.doi.org/10.1016/j.ecolind.2012.11.020
-
Upload
independent -
Category
Documents
-
view
1 -
download
0
Transcript of Soil macrofauna as indicators of soil quality and land use impacts in smallholder agroecosystems of...
Author's personal copy
Ecological Indicators 27 (2013) 71–82
Contents lists available at SciVerse ScienceDirect
Ecological Indicators
jo ur nal homep age: www.elsev ier .com/ locate /eco l ind
Soil macrofauna as indicators of soil quality and land use impacts in smallholderagroecosystems of western Nicaragua
Laurent Rousseaua, Steven J. Fonteb,∗, Orlando Téllezc, Rein van der Hoekc, Patrick Lavellea,b
a Institut de Recherche pour le Développement (IRD), 93143 Bondy Cedex, Franceb Centro Internacional de Agricultura Tropical (CIAT), Tropical Soil Biology and Fertility Program, Latin American and Caribbean Region, Cali, Colombiac Centro Internacional de Agricultura Tropical (CIAT), Tropical Forages Program, Managua, Nicaragua
a r t i c l e i n f o
Article history:Received 11 July 2012Received in revised form26 November 2012Accepted 29 November 2012
Keywords:BioindicatorsForest conversionIndicator Value IndexQuesungual slash-and-mulch agroforestrysystemSoil ecosystem servicesSoil invertebrates
a b s t r a c t
The tropical dry forest region along the western slope of Central America represents a biodiverse andfragile area that is under increasing pressure from agricultural production, thus threatening the provi-sion of ecosystem services, the integrity of these landscapes, and the rural communities who depend onthem. To address this issue, we evaluated the influence of common agricultural management practices(cropping and livestock systems) vs. the Quesungual slash-and-mulch agroforestry system (QSMAS) ondiverse parameters of soil quality and function. We then used this information to identify soil inver-tebrate bioindicators that represent key aspects of soil quality (chemical fertility, physical properties,aggregate morphology, and biological functioning). In February of 2011 soil sampling was conducted onsix hillside farms near the town of Somotillo in western Nicaragua to assess soil properties and the abun-dance and diversity of soil macrofauna within four management systems: (1) QSMAS, based on maizeproduction, (2) traditional maize cropping system with few trees (TC), (3) silvopastoral system with lowtree density (SP), and (4) secondary forest (SF), used as a reference. The conversion of forest to agriculturedemonstrated the greatest impact of management in this study. For example, SF presented significantlyhigher diversity of soil invertebrate taxonomic groups than either TC or SP (P < 0.03), and demonstratedthe lowest level of soil compaction, significantly less than SP (P < 0.05). Additionally, SF demonstratedthe highest value of soil quality according to a synthetic indicator that integrates chemical, physical andbiological aspects of soil quality. Although overall soil quality under QSMAS was lower than SF, this sys-tem demonstrated the highest abundance (number of individuals) of soil macrofauna, and appeared toat least partially mitigate the negative consequences of forest conversion on soil functioning. Using theIndicator Value Index, which ranks species according to their specificity and fidelity across sites, alongwith farmer consultation we found seven indicator taxa of soil quality that could greatly facilitate futureevaluation of land management impacts by farmers and technicians in the region. We suggest that themethodology applied is robust and adaptable to diverse agroecological contexts and would allow formore rapid responses to evolving land use issues as they arise.
© 2012 Published by Elsevier Ltd.
1. Introduction
Overuse of land and poor management practices have led toextensive degradation of biodiversity and ecosystem services glob-ally (Foley et al., 2005; Giller et al., 1997). This trend is particularlyconcerning in smallholder agroecosystems of Central America thatare often located on highly susceptible hillside soils and dominatedby biologically diverse tropical dry forests. Traditional managementin this region (including slash and burn) typically eliminates soilcover and organic matter inputs prior to planting, thus leaving soils
∗ Corresponding author at: CIAT, A.A. Postal 6713, Cali, Colombia.Tel.: +57 2 445 0100x3517; fax: +57 2 445 0073.
E-mail address: [email protected] (S.J. Fonte).
exposed to erosion and soil organic matter (SOM) loss. Under suchconditions crop yields can decrease considerably after only a fewyears. Production plots must then be abandoned and left to fal-low for long intervals to allow adequate soil regeneration (Szottet al., 1999). A growing trend of shortening fallows along withincreased grazing pressure in these systems inhibits the recoveryof soils and forests (Lopez Hernandez et al., 1997; Netuzhilin et al.,1999) and thus, severely threatens long-term agricultural produc-tivity, food security, and the provision of ecosystem services in theregion.
In addressing this threat, farmers, researchers and techniciansmust find adequate ecologically-based management alternatives tocontrol soil erosion, maintain soil functioning, and enhance agroe-cosystem resilience and biodiversity (Perfecto and Vandermeer,2008). The Quesungual slash-and-mulch agroforestry system
1470-160X/$ – see front matter © 2012 Published by Elsevier Ltd.http://dx.doi.org/10.1016/j.ecolind.2012.11.020
Author's personal copy
72 L. Rousseau et al. / Ecological Indicators 27 (2013) 71–82
(QSMAS), originating in south-western Honduras (Lempira Dept.),represents such a management alternative that holds great promisefor hillside farmers throughout the region. This system relies upon adiverse assemblage of native tree species interspersed with annualcrops (corn, beans and sorghum) to stabilize hillsides, promote soilfertility, and conserve vital soil moisture (Hellin et al., 1999). Ratherthan clearing or burning, trees are pruned annually and the residuesleft on the soil surface as mulch to promote soil biological activityand SOM accumulation (Fonte and Six, 2010). In addition to greatlyextending the productive phase of these agroecosystems (from 1 to3 years under slash-and-burn to more than 7 years under QSMAS),the Quesungual system has shown remarkable resilience in the faceof hurricanes and drought, thus facilitating its adoption and adap-tation throughout similar climate zones of Mesoamerica (Ayarzaand Welchez, 2004).
While the existence and successful dissemination of systemssuch as QSMAS is encouraging, much work remains in under-standing the biophysical drivers of ecosystem degradation and theeffectiveness of alternative management practices to mitigate theseimpacts under diverse socioeconomic and environmental condi-tions. In addition, simple monitoring tools are needed to quicklyand inexpensively evaluate key ecosystem parameters and func-tions (Dale and Beyeler, 2001). Bioindicators (species or taxa usedfor monitoring ecosystem health or function) offer a promisingmeans for scientists, technicians and farmers to quickly gaugethe effectiveness of new alternative land management strate-gies and allow for a better informed response in addressing newissues as they arise (Lobry de Bruyn, 1997; McGeoch, 1998).Much of the past research on identifying bioindicator species hasfocused on characterizing particular habitats or land use condi-tions (Cristofoli et al., 2010; Dufrêne and Legendre, 1997; Ruizet al., 2011). Substantially less effort has sought to link indicatortaxa with targeted ecosystem functions and services. We addressthis issue by relating invertebrate taxa to synthetic indicatorsof soil quality that combine a suite of statistically selected soilattributes that embody key soil functions (e.g., chemical fertility,hydrologic services). We then validate these bioindicators againstlocal knowledge of these species and their role in agroecosys-tems.
In this study, we focus on soil macrofauna for evaluating impactsof agroecosystem management and in their use as potential biolog-ical indicators of soil quality. The emphasis on soil macrofauna isbased on several criteria. First, this group is sensitive to changesin their environment and shifts in their community structure offeran integrative assessment (i.e., combining changes in multiple soilproperties into a single measure) of ecosystem impacts over time(Lobry de Bruyn, 1997; Mathieu et al., 2005; Paoletti, 1999). Sec-ond, soil macrofauna, particularly ecosystem engineers (e.g. ants,earthworms), can have significant influences on soil and ecosystemfunctioning and thus their populations reflect key ecological pro-cesses within agroecosystems (Lavelle et al., 2006). Finally, largesoil invertebrates are relatively simple to measure, ubiquitous, andfamiliar to farmers, as they are frequently encountered during soilpreparation and field maintenance.
The research presented here sought to address two main objec-tives. First, we sought to examine the impacts of traditional landmanagement on soil quality and functioning and to better under-stand the potential of the Quesungual agroforestry system toameliorate the deleterious impact of agriculture in this region onsoil-based ecosystem services and biodiversity. Second, we soughtto associate soil macrofauna taxa, indentified using the IndicatorValue Index method (IndVal; Dufrêne and Legendre, 1997), withdifferent states of soil biological, chemical and physical quality(Velasquez et al., 2007a) and then to validate these bioindicatorswith local land managers for potential use in monitoring changesin soil quality and function.
2. Materials and methods
2.1. Sites description and experimental design
The study was conducted in the community of La Danta, locatedin western Nicaragua, near Somotillo, in the Chinandega Depart-ment (13◦09′09′′N, 86◦51′32′′W). Classified as a tropical dry forestzone according to Holdridge (1947), rainfall varies between 700 and1500 mm year−1 and occurs largely between May and October, witha pronounced dry season from November to April. Average temper-atures range from 24 ◦C in the wet season to 35 ◦C in the dry season.The topography is hilly with elevations ranging from 200 to 350 m.The landscape is comprised of approximately 25% forested areas,30% crops (including agroforestry components) and 45% pastures(INTA, 2005). Soils are mainly sandy-textured with a high stonecontent and are represented by a mix of alfisols (28%), entisols(23%), molisols (44%), inceptisols/vertisols (5%) (Calero Calderón,2008).
Six replicate farms were chosen for the study, each contain-ing four common types of land use management (treatments)in the region: (1) traditional cropping system (TS) – with fewtrees and low organic matter inputs, (2) silvopastoral system(SP) – with naturalized pastures, low densities of native treesand shrubs and frequent livestock entry, (3) Quesungual slash-and-mulch agroforestry system (QSMAS) and (4) secondary forest(SF), as a reference system. Within each replicate farm, four plotsrepresenting the above management types (roughly 1 ha each)were selected for all measurements. In the two cropping sys-tems (TS and QSMAS), maize (Zea mays) is typically sown inearly May and common bean (Phaseolus vulgaris) in August withharvest of both crops in late November. Both cropping systemsalso receive moderate amounts of fertilizer (average 70 kg NPKand 70 kg urea ha−1 year−1) and pesticides (typically Glyphosate atmaize planting and insecticides as needed), while SP only receivesherbicides prior to seeding.
The majority of the soil sampling was conducted over a twoweek period in February of 2011, during the dry season. Soilsamples were taken at three equally-spaced points along a 30 mtransect cutting diagonally through the middle of each plot. In total,72 points were sampled in 24 plots within the landscape. A secondpartial sampling was undertaken at the start of the wet season tobetter evaluate key soil physical properties (penetration resistanceand shear strength).
2.2. Soil macrofauna abundance and biodiversity
In February 2011, sampling of soil macroinvertebrates (>2 mmin size; Lavelle and Spain, 2001) was carried out using the TSBFmethod (Tropical Soil Biology and Fertility; Anderson and Ingram,1993). In brief, a pit (25 cm × 25 cm × 30 cm deep) was excavatedand soil macrofauna were collected by hand from the litter layerand 3 soils depths (0–10 cm, 10–20 cm and 20–30 cm), placedin 70% alcohol (or 4% formalin for earthworms) and taken tothe lab for identification. Given the low occurrence below 10 cm,we report only the sum of macrofauna encountered in all soil-litter layers. Additionally, pitfall traps were used to collect anddetermine the relative abundance of macroinvertebrates mov-ing on the soil surface. These traps consisted of buried plasticcups (dia. 10 cm) with the upper rim of the cup level with thesoil surface. Three traps were placed around each TSBF sam-pling point and partially filled with a mixture of water, detergentand table salt (Souza et al., 2012). After one week, specimenswere collected from each cup and taken to the lab for iden-tification. Macrofauna from both collection methods (TSBF andpitfall traps) were counted and identified at the order, genusand species level (when possible). Diversity was assessed using

Author's personal copy
L. Rousseau et al. / Ecological Indicators 27 (2013) 71–82 73
both specific richness (S – the number of species and/or taxo-nomic groups distinguished) and the Shannon index (H; Shannon,1948).
2.3. Soil morphology
Adjacent to each macrofauna pit, a soil monolith(10 cm × 10 cm × 10 cm) was removed using a square metalframe, while ensuring to keep the soil structure intact duringtransfer to the lab for morphological separation (Velasquez et al.,2007b). This monolith was used for estimation of bulk density(BD) and the contents were separated visually into 6 categories(according to Velasquez et al., 2007b): (1) physicogenic macroag-gregates – formed by physico-chemical or bacterial processes andcomprised of rather brittle and geometric shapes, (2) biogenicmacroaggregates – formed by the soil invertebrates, dense andmore rounded shapes with clear evidence of biological activity,(3) root-associated macroaggregates – those adhering to the rootsafter gentle shaking, (4) organic debris – course decaying remainsof plants and other organisms, (5) aggregates and non-aggregatedsoil smaller than 4 mm, and (6) stones with range between 0.5and 10 cm. The fractions were air-dried and weighed to deter-mine the proportion of whole soil in each and stone weight permonolith.
2.4. Soil chemical and physical properties
At each point, soil samples (0–15 cm) were air-dried for analy-sis of pH, organic matter, and plant available nutrients. Soil organicmatter (SOM) content was determined with the Walkley–Blackmethod, pH by potentiometric method in water, total nitrogenconcentration (TN) by the Kjeladhl method, available phosphorus(Pavail) by Olsen method, calcium (Ca), potassium (K) and magne-sium (Mg) contents (mg 100 g−1 of dry soil) by atomic absorptionspectrometry (Perkin Elmer, Model 3100). These samples werealso used to determine soil texture according to the Bouyoucosmethod and relative soil humidity (RH) (Houba et al., 1989; USDA,2004).
Penetration resistance (PR) and shear strength (SS) were mea-sured at each point with a cone penetrometer and a handtorcometer in May 2011 (once the first rains had thoroughly wet-ted the soil). At each point soil compaction (with bulk density) wasevaluated averaging three subsamples (Velasquez et al., 2007a).
2.5. Indicators of soil quality
To provide an integrated assessment of the effects of the differ-ent management systems on soil health and functioning, data weresummarized in one general indicator of soil quality (GISQ), by usingmethods adapted from Velasquez et al. (2007a). In brief, the indi-cator was calculated by first conducting a principal componentsanalysis (PCA) individually for the four data sets of soil variables(macrofauna, aggregate morphology, chemical fertility and soilphysical properties) to identify the soil parameters that best differ-entiate treatments and explain the overall variability within eachdata set. Variables with significant contribution (>50% of the max-imum value) to either of the first two principal component axeswere selected. For each selected variables, its contribution to axes1 and 2 were multiplied by the overall variability explained byeach principal component axis in order to generate a weight fac-tor for each variable. Values for each variable were then multipliedby their corresponding weight factor and summed to generate araw sub-indicator value. This value was then scaled to a num-ber ranging from 0.1 to 1.0 by a homothetic transformation, forcomparability across sub-indicators. This procedure was conductedfor each of the four sets of soil variables, thus resulting in: (1)
a biological sub-indicator, (2) a morphological sub-indicator, (3)a chemical sub-indicator, and (4) a physical sub-indicator. Thesefour sub-indicators were then combined to generate the over-all GISQ by submitting them to the same process as describedabove, whereby the sub-indicator values were examined with PCA,weighted according to their contribution to the first 2 PCA axes,and then combined by summing these contributions. Soil macro-fauna collected in pitfall traps were not included in this calculationso as to maintain consistency with prior application of the GISQ(Velasquez et al., 2007a) and to avoid redundancy in the biologi-cal aspects of soil health. For subsequent analyses with the IndValmethod (see below) each sampling point was ranked among thefour sub-indicators and the GISQ such that values between 0.1and 0.4 were considered to represent low quality, 0.4–0.7 mediumquality, and 0.7–1.0 high soil quality for each indicator consid-ered.
2.6. Indicator species via the IndVal method
In order to find representative species or taxonomic groups ofthe different soil conditions, we applied the Indicator Value Indexmethod (IndVal; Dufrêne and Legendre, 1997) which quantifies theextent to which each species meets the criteria of specificity (pres-ence of a species in the samples of a particular category) and fidelity(frequency of this species in these samples). We considered eachspecies as a bioindicator of low, medium or high quality within thefour sub-indicators and the overall GISQ described above. A speciesor taxonomic group is a bioindicator if it is typical of a group of sam-ples (and therefore absent from the other groups of samples) andalso present in all samples of this group. IndVal is calculated asfollows:
Specificity = Aij = N.ind (ij)N.ind (i)
Fidelity = Bij = N.samples (ij)N.samples (j)
IndValij = Aij × Bij
where Aij represents specificity, N.ind (ij) is the mean number ofindividuals of species (i) across sample group (j) and N.ind (i) isthe sum of the mean numbers of individuals of species (i) over allsample groups in the data set. Fidelity is represented by Bij, whereN.samples (ij) is the number of samples in group (j) where species(i) is present and N.samples (j) is the total number of samples inthat group. Aij is at a maximum when a species is present in onlyone group of samples and Bij is at a maximum when this species ispresent in all samples of this group. IndVal Index is the product ofthese two terms and its value is between 0 and 1. Finally, a permu-tation test is performed (random-test of Monte Carlo; McGeoch andChown, 1998) to test if a species is significantly associated with agroup of samples (P < 0.05). Each selected indicator species (or tax-onomic group) is then presented as an indicator of quality (low,medium or high) relevant to each soil sub-indicator and/or theGISQ. Both the macrofauna collected from the TSBF method andpitfall traps were used in the calculation of indicator species.
In May 2011, a workshop was held with local farmers to presentthe results of this research and evaluate the applicability of theindicator species determined by the IndVal method. Fresh sampleswere excavated in the field together with farmers, while preservedspecimens were used to support field identification or for indica-tor taxa not encountered in the field on the day of the workshop.For each taxa identified by the IndVal method, farmers were askedif they recognized the species, what perceptions they held aboutit and in which management systems and conditions they were

Author's personal copy
74 L. Rousseau et al. / Ecological Indicators 27 (2013) 71–82
Table 1Mean abundance and diversity of soil macrofauna according to the TSBF method in four management systems in farmers’ fields near Somotillo, Nicaragua, sampled in Februaryof 2011. Standard errors are included below each value in italics and the P-value to the right of each row. Values with different letters indicate statistically significant differencesbetween treatments according to Tukey’s test.
Macrofauna group or variable SFa (ind. m−2) SP (ind. m−2) QSMAS (ind. m−2) TS (ind. m−2) P-valueb
Hymenoptera254.2 240.0 296.0 104.9 ns120.6 151.6 116.5 57.5
Arachnida20.4a 3.6b 11.6ab 3.6b 0.016
3.8 1.1 5 1.1
Diplopoda6.2 0.9 6.2 3.6 ns8.5 2.2 4.0 4.4
Chilopoda8.0 0 4.4 2.7 ns3.3 0 2.5 1.2
Coleoptera43.6 20.4 25.8 21.3 ns
6.5 3.8 11 6.2
Lepidoptera4.4 0.9 4.4 1.8 ns2.1 0.9 1.6 1.1
Hemiptera10.7 5.3 2.7 5.3 ns
5.2 2.8 1.8 1.9
Diptera0 2.7 0.9 0 ns0 1.8 0.9 0
Orthoptera2.7 0.9 0 0 ns2.7 0.9 0 0
Isoptera133.3 17.8 304.0 33.8 ns
81.1 5.8 144.3 26.8
Total abundance488.0ab 293.3ab 656.9a 176.9b 0.012113.5 153 153.5 83.6
Specific richness (S)8.0a 4.1b 5.5ab 3.4b 0.0032.0 0.7 2.7 0.6
Shannon index (H)1.5a 1.0ab 1.0ab 0.9b 0.0260.2 0.1 0.1 0.1
a SF, secondary forest; SP, silvopastoral system; QSMAS, Quesungual slash-and-mulch agroforestry system; TS, traditional cropping system.b ns = not significant (P > 0.05).
encountered. The information gathered from this workshop wasalso supplemented by semi-structured interviews, similar to thoseoutlined by Pauli et al. (2012).
2.7. Comparison of management systems and covariationbetween data sets
Soil biological, morphological, chemical and physical propertiesand associated sub-indicators were compared between manage-ment systems using the average value of the three transect pointsin each plot, for a total of 24 independent samples. One-way ANOVAand a multiple comparison test (Tukey’s Honestly Significant Dif-ference) were used to examine differences between the four landuse systems. Natural log transformations were applied to meet theassumptions of ANOVA (normality, homoscedasticity) when neces-sary. When these assumptions could not be met, a non-parametricKruskal–Wallis test was used to compare land-use systems in thecase of non-normal distributions, while a Welch’s ANOVA was usedto compare non-equal variances.
Principal component analyses were also performed to explorerelationships between variables within each data set (macrofauna,morphology, chemical and physical properties). Additionally,between-class PCA was used to examine multivariate differencesbetween management systems via permutation tests, comparingthe observed test statistic with a distribution obtained by a randompermutation of the data (Random Monte-Carlo test; Zerbino, 2010).Co-inertia analyses were then conducted using the above PCA datato examine covariation and similarities in data structure amongthe different data sets with the matrix coefficient of covariation(Rv; Dray et al., 2003).
All statistical analyses were carried out using the software R (RDevelopment Core Team, 2010). The IndVal method was conductedusing specific packages (labdsv, Akima, MASS, vegan and mgcv),while PCA and co-inertia analyses were conducted using the ade4package (Dray et al., 2003; Thioulouse et al., 1997).
3. Results
3.1. Management system impacts on macrofauna
Sixty one species and taxonomic groups were identified fromthe excavation of soil monoliths using the TSBF method, includ-ing 11 species of ants, two termite species and 16 species of theorder Coleoptera. Overall, the samples were dominated by ants andtermites, comprising over 85% of the macrofauna collected. Onlyfive earthworms were found during sampling (in QSMAS and TS)and not considered in the statistical analysis. Between manage-ment systems the most pronounced differences were observed forthe order Arachnida, SF containing nearly six times higher abun-dance than TS or SP (P = 0.016; Table 1), with QSMAS in between.Total abundance of macrofauna was highest under QSMAS, with657 ind. m−2 and significantly higher than TS or SP (P = 0.012). Spe-cific richness (S) was significantly higher in SF than in TS or SP(P = 0.003), and similarly the Shannon index of diversity (H) wassignificantly higher in SF than in TS (P = 0.026), with QSMAS inbetween.
Pitfall traps captured 83 species and taxonomic groups includ-ing 12 species of ants (Hymenoptera), two species of termites(Isoptera) and 14 species of Coleoptera. Ants alone comprised over85% of the macrofauna collected in the pitfall traps and werefound to be highest under SP, with significantly more Hymenoptera(P = 0.011), as well as total macrofauna (P = 0.029) in SP than inSF (Table 2). Blattaria (cockroaches) were also found to be sig-nificantly higher under SF than in SP or TS (P = 0.019), whileChilopoda (centipedes) was only observed in pitfall traps in SF.There were no significant management effects on species richness(S) for macrofauna collected in pitfall traps, but the Shannon Indexwas significantly higher under SF than for SP (P = 0.017). Total rel-ative abundance of macrofauna collected in these samples washighest under SP (153.6 ind. per trap), followed by QSMAS, andwas significantly higher than observed for SF (71 ind. per trap;P = 0.029).

Author's personal copy
L. Rousseau et al. / Ecological Indicators 27 (2013) 71–82 75
Table 2Mean abundance and diversity of soil macrofauna abundance according to the pitfall traps method in four management systems in farmers’ fields near Somotillo, Nicaragua,sampled during one week in February of 2011. Standard errors are included below each value in italics and the P-value to the right of each row. Values with different lettersindicate statistically significant differences between treatments according to Tukey’s test.
Macrofauna group or variable SFa (ind. per trap) SP (ind. per trap) QSMAS (ind. per trap) TS (ind. per trap) P-valueb
Hymenoptera50.5a 138.1b 93.9ab 62.8ab 0.01111.4 20.8 27.8 10.8
Arachnida4.3 3.2 6.5 2.6 ns0.6 0.8 1.4 0.4
Chilopoda0.1 0 0 0 ns0.1 0 0 0
Coleoptera2.1 0.5 0.4 0.4 ns0.8 0.2 0.2 0.2
Lepidoptera0.4 0.2 0.1 0.2 ns0.2 0.1 0.1 0.2
Hemiptera4.1 5.2 1.8 1.7 ns2.3 2.5 0.7 0.8
Diptera0.3 0.9 0.1 0.7 ns0.2 0.8 0.1 0.4
Orthoptera5.8 2.0 1.8 2.3 ns2.3 0.9 0.4 0.9
Trichoptera0.5 0.3 0.3 0.4 ns0.2 0.2 0.1 0.3
Blattaria2.6a 0.3b 1.7ab 0.9b 0.0190.8 0.1 0.5 0.8
Isoptera0.3 2.9 1.8 0.1 ns0.1 1.8 1.0 0.1
Total abundance71a 153.6b 108.3ab 72.2ab 0.029
14.5 20.2 28.8 12.2
Specific richness (S)15.2 13.1 13.9 11.3 ns
1.1 0.6 1.4 1.4
Shannon index (H)2.1a 1.6b 1.8ab 1.7ab 0.0170.1 0.1 0.1 0.1
a SF, secondary forest; SP, silvopastoral system; QSMAS, Quesungual slash-and-mulch agroforestry system; TS, traditional cropping system.b ns = not significant (P > 0.05).
3.2. Impacts on soil physical, chemical and morphologicalvariables
Of the soil physical variables measured (Table 3), penetrationresistance (PR) and shear strength (SS) demonstrated the greatestimpacts of management, such that shear strength was significantlyhigher under SP than SF or QSMAS (P = 0.001) and penetration resis-tance (PR) significantly higher under SP than under SF or QSMAS(P = 0.04). No other soil physical variables demonstrated a signifi-cant (P > 0.05) management effect. Soil morphology was impactedto the extent that the proportion of physicogenic macroaggregateswas significantly higher under SP and TS than under SF and QSMAS(P = 0.001; Table 3). While no significant impacts of managementwere observed for the soil chemical variables measured, SF tendedto show higher contents of SOM and Ca (Table 3).
3.3. Synthetic indicators of soil quality
Comparison of land management systems according to the GISQand the four sub-indicators revealed relatively small, but importantdifferences between systems. For example, the biological sub-indicator was significantly higher under SF than TS (P = 0.042), withQSMAS and SP having intermediate values. While not significantlydifferent from the other systems, SF suggested a trend of higher soilquality for the chemical, physical and morphological sub-indicators(Table 4). These trends are reflected in the overall GISQ, where SFwas found to have soils of significantly higher overall quality thaneither SP or TS (P = 0.002), with QSMAS intermediate in value.
3.4. Multivariate system differences and co-inertia between datasets
Permutation tests demonstrated significant multivariate sepa-ration between management systems for all five of the soil data
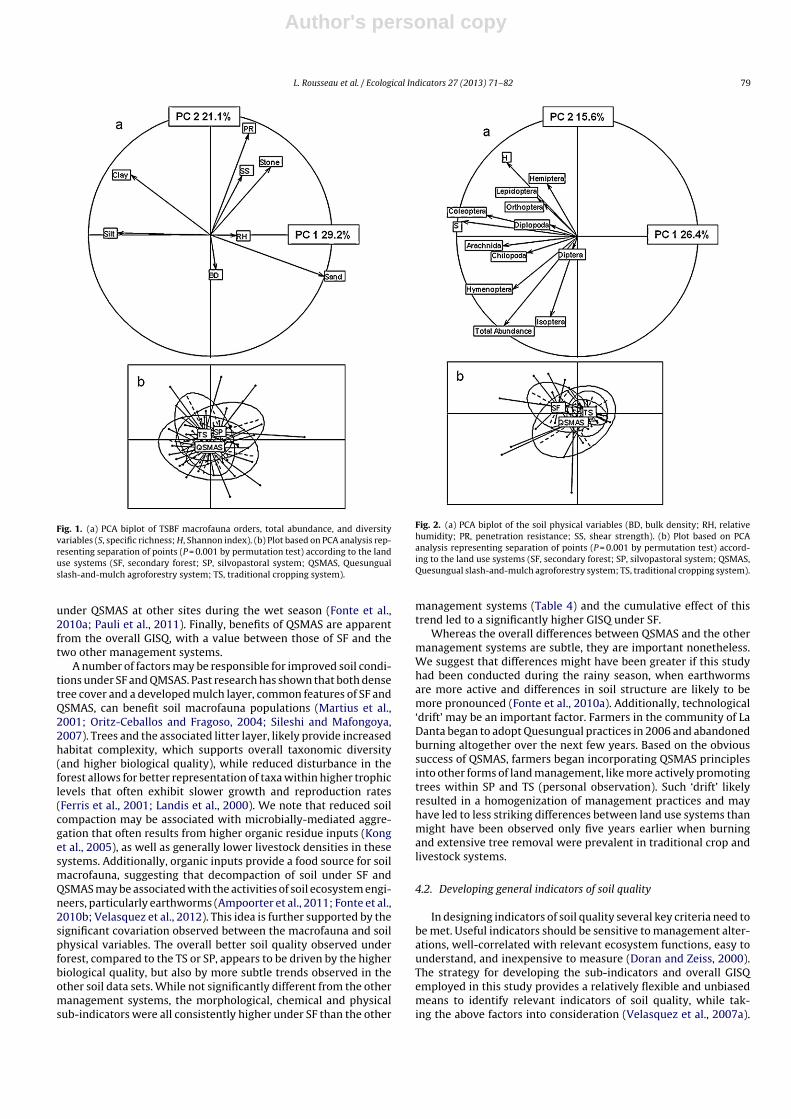
sets (Figs. 1 and 2; results not shown for all data sets). Manage-ment systems were clearly differentiated by the between-classPCA of macrofauna data sets associated with both TSBF and pit-fall traps (PT) methods (P < 0.001). For macrofauna assessed by theTSBF method (Fig. 1), systems were best separated along the firstaxis which explains variability associated with species richness andabundance of Arachnida. The second axis was largely associatedwith total macrofauna abundance, which was largely driven by theabundance of ants (Hymenoptera) and termites (Isoptera; Fig. 1).Very similar trends were found for macrofauna collected in pitfalltraps (data not shown).
System differentiation by soil physical and morphological vari-ables using between-class PCA was also significant (P < 0.001). Forphysical soil variables, axis 1 was largely associated with tex-ture, while axis 2 was related to soil compaction, with penetrationresistance exerting the largest influence (Fig. 2). Although the soilchemical data was also able to significantly differentiate the man-agement systems (P = 0.04), differences were small and explanationfor these patterns was less clear (data not shown). Managementsystem differences highlighted by morphological variables appearto be driven largely by the second PCA axis that is associatedwith physicogenic aggregates and organic debris (data not shown).In accordance with the above PCA results, key parameters wereidentified within each data set and used to generate the four sub-indicators as well as the overall GISQ (Table 5). For example, thephysical sub-indicator was largely determined by soil textural com-ponents, penetration resistance and the stone content of the soil,while the biological sub-indicator was formulated based on totalabundance, elements of taxonomic diversity, and the abundance ofColeoptera.
Coinertia analyses revealed significant covariation between alldata sets except between the soil macrofauna from TSBF methodand soil morphological data tables (Fig. 3). For example, signifi-cant covariation between macrofauna and soil physical variables

Author's personal copy
76 L. Rousseau et al. / Ecological Indicators 27 (2013) 71–82
Table 3Mean of soil physical and chemical properties and morphological variables under four management systems in farmers’ fields near Somotillo, Nicaragua, sampled in Februaryand May of 2011. Standard errors are included below each value in italics and the P-value to the right of each row. Values with different letters indicate statistically significantdifferences between treatments according to Tukey’s test.
Variableb SFa SP QSMAS TS P-valuec
BD (g cm−3)1.1 1.2 1.1 1.1 ns0.1 0 0 0.07
RH (% of dryweight)
8.2 6.4 6.4 4.7 ns1.2 1.1 0.7 0.6
PR (kPa)69.7a 93.3b 71.9a 87.4ab 0.040
9.9 7.1 4.9 5.9
SS (kPa)45.1a 85.6b 51.3a 56.0a 0.001
5.2 8.9 6.4 5.8
Clay (%)31 29 29 32 ns
3 2 1 3
Silt (%)33 33 34 34 ns
3 1 2 3
Sand (%)36 38 37 34 ns
6 2 2 3
Stone (g/soil monolith)181.6 185.2 198.5 190.4 ns
49.9 68.5 56.9 34.6
pH6.1 5.9 6.1 6.0 ns0.1 0.1 0.2 0.1
SOM (% of dry soil)4.5 3.3 3.1 3.6 ns0.7 0.3 0.3 0.7
TN (% of dry soil)0.2 0.2 0.2 0.2 ns0 0 0 0
Pavail (ppm)2.5 2.7 2.5 5.5 ns0.7 0.6 0.4 2.8
K (mg/100 g)0.3 0.3 0.3 0.3 ns0.1 0 0.1 0.1
Ca (mg/100 g)11.5 8.5 9.9 9.3 ns
1.4 1.1 2.2 0.9
Mg (mg/100 g)2.3 1.7 2 1.9 ns0.6 0.3 0.5 0.3
BIO (%)41 39 43 42 ns
5 4 5 6
PHYS (%)2a 12b 2a 9b 0.001
1 2 1 2
ROOT (%)5 5 3 3 ns1 1 1 1
NA (%)50 44 52 45 ns
6 4 5 5
OD (%)1 1 1 1 ns0 0 0 0
a SF, secondary forest; SP, silvopastoral system; QSMAS, Quesungual slash-and-mulch agroforestry system; TS, traditional cropping system.b BD, bulk density; RH, relative humidity; PR, penetration resistance; SS, shear strength; SOM, soil organic matter; TN, total nitrogen; Pavail , phosphorus available; BIO,
biogenic macroaggregates; PHYS, physical macroaggregates; ROOT, root-associated macroaggregates; NA, non-macroaggregated soil; OD, fragments of organic debris.c ns = not significant (P > 0.05).
suggests that total macrofauna abundance and diversity (richnessand Shannon index) are negatively associated with soil compaction,particularly penetration resistance (Figs. 1 and 2).
3.5. Determination of indicator species and farmer validation
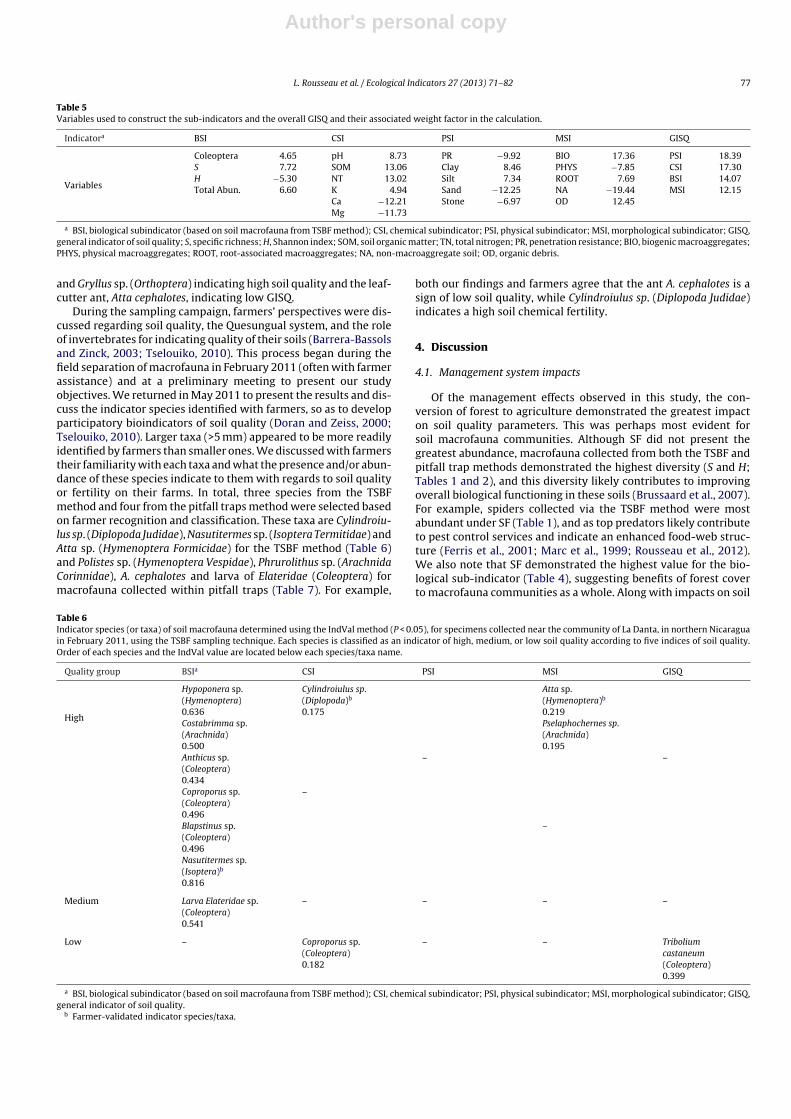
Applying the IndVal method to the soil macrofauna data col-lected via the TSBF sampling, twelve species (or taxonomic groups)were identified as bioindicators of soil quality (Table 6). For exam-ple, six taxa were found to indicate high biological quality of soils,including three species of Coleoptera, and one each of Arachnida,Hymenoptera and Isoptera. Other species were found to indicatehigh quality in terms of the chemical and morphological soil qual-ity sub-indicators. Two macrofauna taxa recovered by the TSBFmethod were found to indicate low soil quality, Coproporus sp. (lowCSI) and Tribolium castaneum (bioindicator of low GISQ).
Macrofauna collected in pitfall traps yielded 26 indicator taxa(Table 7). Nine taxa were found to indicate high biological quality,including five taxa of Hymenoptera, two Coleoptera, one Arachnida,and one Hemiptera. At the same time, six taxa were found to bebioindicators of low chemical quality, including two species ofHymenoptera, two Arachnida and three Hemiptera. Three taxa werefound to be bioindicators of the GISQ, with Pardosa sp. (Arachnida)
Table 4Mean values for sub-indicators and overall general indicator of soil quality withfour management systems in farmers’ fields near Somotillo, Nicaragua, sampledin February and May of 2011. Standard errors are included below each value initalics and the P-value to the right of each row. Values with different letters indicatestatistically significant differences between treatments according to Tukey’s test.
Variable SFb SP QSMAS TS P-valuec
BSIa 0.37a 0.24ab 0.31ab 0.23b 0.0420.04 0.04 0.05 0.06
CSI0.58a 0.54a 0.52a 0.56a ns0.09 0.04 0.06 0.06
MSI0.61a 0.53a 0.56a 0.54a ns0.05 0.05 0.03 0.05
PSI0.73a 0.63a 0.71a 0.71a ns0.10 0.05 0.06 0.04
GISQ0.66a 0.52b 0.58ab 0.56b 0.0020.06 0.02 0.03 0.05
a BSI, biological subindicator (based on soil macrofauna from TSBF method); CSI,chemical subindicator; PSI, physical subindicator; MSI, morphological subindicator;GISQ, general indicator of soil quality.
b SF, secondary forest; SP, silvopastoral system; TS, traditional system; QSMAS,Quesungual slash-and-mulch agroforestry system.
c ns = not significant (P > 0.05).
Author's personal copy
L. Rousseau et al. / Ecological Indicators 27 (2013) 71–82 77
Table 5Variables used to construct the sub-indicators and the overall GISQ and their associated weight factor in the calculation.
Indicatora BSI CSI PSI MSI GISQ
Variables
Coleoptera 4.65 pH 8.73 PR −9.92 BIO 17.36 PSI 18.39S 7.72 SOM 13.06 Clay 8.46 PHYS −7.85 CSI 17.30H −5.30 NT 13.02 Silt 7.34 ROOT 7.69 BSI 14.07Total Abun. 6.60 K 4.94 Sand −12.25 NA −19.44 MSI 12.15
Ca −12.21 Stone −6.97 OD 12.45Mg −11.73
a BSI, biological subindicator (based on soil macrofauna from TSBF method); CSI, chemical subindicator; PSI, physical subindicator; MSI, morphological subindicator; GISQ,general indicator of soil quality; S, specific richness; H, Shannon index; SOM, soil organic matter; TN, total nitrogen; PR, penetration resistance; BIO, biogenic macroaggregates;PHYS, physical macroaggregates; ROOT, root-associated macroaggregates; NA, non-macroaggregate soil; OD, organic debris.
and Gryllus sp. (Orthoptera) indicating high soil quality and the leaf-cutter ant, Atta cephalotes, indicating low GISQ.
During the sampling campaign, farmers’ perspectives were dis-cussed regarding soil quality, the Quesungual system, and the roleof invertebrates for indicating quality of their soils (Barrera-Bassolsand Zinck, 2003; Tselouiko, 2010). This process began during thefield separation of macrofauna in February 2011 (often with farmerassistance) and at a preliminary meeting to present our studyobjectives. We returned in May 2011 to present the results and dis-cuss the indicator species identified with farmers, so as to developparticipatory bioindicators of soil quality (Doran and Zeiss, 2000;Tselouiko, 2010). Larger taxa (>5 mm) appeared to be more readilyidentified by farmers than smaller ones. We discussed with farmerstheir familiarity with each taxa and what the presence and/or abun-dance of these species indicate to them with regards to soil qualityor fertility on their farms. In total, three species from the TSBFmethod and four from the pitfall traps method were selected basedon farmer recognition and classification. These taxa are Cylindroiu-lus sp. (Diplopoda Judidae), Nasutitermes sp. (Isoptera Termitidae) andAtta sp. (Hymenoptera Formicidae) for the TSBF method (Table 6)and Polistes sp. (Hymenoptera Vespidae), Phrurolithus sp. (ArachnidaCorinnidae), A. cephalotes and larva of Elateridae (Coleoptera) formacrofauna collected within pitfall traps (Table 7). For example,
both our findings and farmers agree that the ant A. cephalotes is asign of low soil quality, while Cylindroiulus sp. (Diplopoda Judidae)indicates a high soil chemical fertility.
4. Discussion
4.1. Management system impacts
Of the management effects observed in this study, the con-version of forest to agriculture demonstrated the greatest impacton soil quality parameters. This was perhaps most evident forsoil macrofauna communities. Although SF did not present thegreatest abundance, macrofauna collected from both the TSBF andpitfall trap methods demonstrated the highest diversity (S and H;Tables 1 and 2), and this diversity likely contributes to improvingoverall biological functioning in these soils (Brussaard et al., 2007).For example, spiders collected via the TSBF method were mostabundant under SF (Table 1), and as top predators likely contributeto pest control services and indicate an enhanced food-web struc-ture (Ferris et al., 2001; Marc et al., 1999; Rousseau et al., 2012).We also note that SF demonstrated the highest value for the bio-logical sub-indicator (Table 4), suggesting benefits of forest coverto macrofauna communities as a whole. Along with impacts on soil
Table 6Indicator species (or taxa) of soil macrofauna determined using the IndVal method (P < 0.05), for specimens collected near the community of La Danta, in northern Nicaraguain February 2011, using the TSBF sampling technique. Each species is classified as an indicator of high, medium, or low soil quality according to five indices of soil quality.Order of each species and the IndVal value are located below each species/taxa name.
Quality group BSIa CSI PSI MSI GISQ
High
Hypoponera sp.(Hymenoptera)0.636
Cylindroiulus sp.(Diplopoda)b
0.175
Atta sp.(Hymenoptera)b
0.219Costabrimma sp.(Arachnida)0.500
Pselaphochernes sp.(Arachnida)0.195
Anthicus sp.(Coleoptera)0.434
– –
Coproporus sp.(Coleoptera)0.496
–
Blapstinus sp.(Coleoptera)0.496
–
Nasutitermes sp.(Isoptera)b
0.816
Medium Larva Elateridae sp.(Coleoptera)0.541
– – – –
Low – Coproporus sp.(Coleoptera)0.182
– – Triboliumcastaneum(Coleoptera)0.399
a BSI, biological subindicator (based on soil macrofauna from TSBF method); CSI, chemical subindicator; PSI, physical subindicator; MSI, morphological subindicator; GISQ,general indicator of soil quality.
b Farmer-validated indicator species/taxa.

Author's personal copy
78 L. Rousseau et al. / Ecological Indicators 27 (2013) 71–82
Table 7Indicator species (or taxa) of soil macrofauna determined using the IndVal method (P < 0.05), for specimens collected near the community of La Danta, in northern Nicaraguain February 2011, using the pitfall traps sampling technique. Each species is classified as an indicator of high or low soil quality according to five indices of soil quality (noindicators of medium soil quality were identified for this dataset). Order of each species and the IndVal value are located below each species/taxa name.
Quality group BSIa CSI PSI MSI GISQ
High
Crematogaster sp.(Hymenoptera)0.753
Pardosa sp.(Arachnida)0.425
Gryllus sp.(Orthoptera)0.352
Pardosa sp.(Arachnida)0.522
Stenopolybia sp.(Hymenoptera)0.775
Gryllus sp.(Orthoptera)0.440
Gryllus sp.(Orthoptera)0.512
Polistes sp.(Hymenoptera)b
0.670Augochlora sp.(Hymenoptera)0.823Anoplius sp.(Hymenoptera)0.844
– –
Phrurolithus sp.(Arachnida)0.880
– –
Larva Elateridae(Coleoptera)b
IV = 0.500Blapstinus sp.(Coleoptera)IV = 0.815Heterogaster sp.IV = 0.551
Low
– Crematogaster sp.(Hymenoptera)0.255
Atta cephalotes(Hymenoptera)b
0.719
Larva Tenebrionidae(Coleoptera)0.181
Atta cephalotes(Hymenoptera)b
IV = 0.801Augochlora sp.(Hymenoptera)0.367
Eleodes sp.(Coleoptera).IV = 0.432
Phrurolithus sp.(Arachnida)b
0.206
Larva Diptera(Diptera)0.194
Didymocentrus sp.(Scorpionida)0.312Augocoris gonesii(Heteroptera)IV = 0.243
– –
Madura sp.(Heteroptera)0.269
–
Chariesterus sp.(Heteroptera)0.269
a BSI, biological subindicator (based on soil macrofauna from TSBF method); CSI, chemical subindicator; PSI, physical subindicator; MSI, morphological subindicator; GISQ,general indicator of soil quality.
b Farmer-validated indicator species/taxa.
biological parameters, SF had the lowest levels of soil compactionand suggested marginally higher (P < 0.1) levels of humidity, SOMand key nutrients such as Ca and Mg (Table 3). The overall benefitsof forest cover are reflected in the GISQ, where SF had significantlyhigher values than both SP and TS (Table 4). These findings are con-sistent with past research suggesting a negative impact of forestconversion on soil compaction and SOM dynamics within tropi-cal hillside agroecosystems (Fonte et al., 2010a; McDonald et al.,2002; Rivera Pena, 2008). These studies indicate that degradationis largely driven by a decrease in organic inputs and a loss of topsoil due to erosion.
While the three production systems generally exhibited lowersoil quality than SF, important differences exist between thesesystems. In particular, QSMAS appeared to support improved soilfunctioning in several aspects. For example, QSMAS demonstratedthe highest overall abundance of soil macrofauna collected usingthe TSBF method (Table 1). While not significantly different fromthe other systems (P > 0.05), we note that the abundance of key
taxonomic groups (i.e., top predators Arachnida and Chilopoda) aswell as overall species richness were consistently higher for QMSASthan for SP and TS (Netuzhilin et al., 1999). These results cor-roborate past findings suggesting a higher presence of predators(Arachnida and Chilopoda) and overall macrofauna abundance inQMSAS as compared to other management systems at a similarsite in Honduras (Pauli et al., 2011). Improved soil quality underQSMAS is also apparent for measures of soil compaction (penetra-tion resistance and shear strength), where QSMAS was significantlyless compacted than SP and generally intermediate between SFand TS (Table 3). We note that the higher compaction under SPis most likely associated with the greater presence of livestock,which can be particularly detrimental to the hillside soils in theregion (Sepúlveda and Nieuwenhuyse, 2011). In agreement withthe benefits for soil physical properties, QSMAS had a significantlylower proportion of physicogenic aggregates and tended towardsmore biogenic aggregates than in other systems, which is reflectedby the higher populations of earthworms that have been observed
Author's personal copy
L. Rousseau et al. / Ecological Indicators 27 (2013) 71–82 79
Fig. 1. (a) PCA biplot of TSBF macrofauna orders, total abundance, and diversityvariables (S, specific richness; H, Shannon index). (b) Plot based on PCA analysis rep-resenting separation of points (P = 0.001 by permutation test) according to the landuse systems (SF, secondary forest; SP, silvopastoral system; QSMAS, Quesungualslash-and-mulch agroforestry system; TS, traditional cropping system).
under QSMAS at other sites during the wet season (Fonte et al.,2010a; Pauli et al., 2011). Finally, benefits of QSMAS are apparentfrom the overall GISQ, with a value between those of SF and thetwo other management systems.
A number of factors may be responsible for improved soil condi-tions under SF and QMSAS. Past research has shown that both densetree cover and a developed mulch layer, common features of SF andQSMAS, can benefit soil macrofauna populations (Martius et al.,2001; Oritz-Ceballos and Fragoso, 2004; Sileshi and Mafongoya,2007). Trees and the associated litter layer, likely provide increasedhabitat complexity, which supports overall taxonomic diversity(and higher biological quality), while reduced disturbance in theforest allows for better representation of taxa within higher trophiclevels that often exhibit slower growth and reproduction rates(Ferris et al., 2001; Landis et al., 2000). We note that reduced soilcompaction may be associated with microbially-mediated aggre-gation that often results from higher organic residue inputs (Konget al., 2005), as well as generally lower livestock densities in thesesystems. Additionally, organic inputs provide a food source for soilmacrofauna, suggesting that decompaction of soil under SF andQSMAS may be associated with the activities of soil ecosystem engi-neers, particularly earthworms (Ampoorter et al., 2011; Fonte et al.,2010b; Velasquez et al., 2012). This idea is further supported by thesignificant covariation observed between the macrofauna and soilphysical variables. The overall better soil quality observed underforest, compared to the TS or SP, appears to be driven by the higherbiological quality, but also by more subtle trends observed in theother soil data sets. While not significantly different from the othermanagement systems, the morphological, chemical and physicalsub-indicators were all consistently higher under SF than the other
Fig. 2. (a) PCA biplot of the soil physical variables (BD, bulk density; RH, relativehumidity; PR, penetration resistance; SS, shear strength). (b) Plot based on PCAanalysis representing separation of points (P = 0.001 by permutation test) accord-ing to the land use systems (SF, secondary forest; SP, silvopastoral system; QSMAS,Quesungual slash-and-mulch agroforestry system; TS, traditional cropping system).
management systems (Table 4) and the cumulative effect of thistrend led to a significantly higher GISQ under SF.
Whereas the overall differences between QSMAS and the othermanagement systems are subtle, they are important nonetheless.We suggest that differences might have been greater if this studyhad been conducted during the rainy season, when earthwormsare more active and differences in soil structure are likely to bemore pronounced (Fonte et al., 2010a). Additionally, technological‘drift’ may be an important factor. Farmers in the community of LaDanta began to adopt Quesungual practices in 2006 and abandonedburning altogether over the next few years. Based on the obvioussuccess of QSMAS, farmers began incorporating QSMAS principlesinto other forms of land management, like more actively promotingtrees within SP and TS (personal observation). Such ‘drift’ likelyresulted in a homogenization of management practices and mayhave led to less striking differences between land use systems thanmight have been observed only five years earlier when burningand extensive tree removal were prevalent in traditional crop andlivestock systems.
4.2. Developing general indicators of soil quality
In designing indicators of soil quality several key criteria need tobe met. Useful indicators should be sensitive to management alter-ations, well-correlated with relevant ecosystem functions, easy tounderstand, and inexpensive to measure (Doran and Zeiss, 2000).The strategy for developing the sub-indicators and overall GISQemployed in this study provides a relatively flexible and unbiasedmeans to identify relevant indicators of soil quality, while tak-ing the above factors into consideration (Velasquez et al., 2007a).

Author's personal copy
80 L. Rousseau et al. / Ecological Indicators 27 (2013) 71–82
Fig. 3. Schematic summary of the co-inertia analyses between 4 data tables, with the Rv (matrix coefficient of covariation) and levels of significance (P-value) for each pairof data sets.
The approach first seeks to summarize the overall variability foreach data table by identifying a subset of variables within eachtable that best explain patterns in the data. This information isthen combined with practical knowledge of laboratory tests andecosystem functioning to determine indicators that are sensitiveand easy to measure by local land managers and technicians. Forexample, sand content and soil penetration resistance offer rela-tively easy to measure and influential determinants of the physicalsub-indicator. Thus, future assessments which focus solely on thesetwo parameters would likely be adequate for evaluating impactsof management and/or environmental conditions on soil physi-cal quality in the study region. Similarly, SOM (reflected by totalC and N) appears to be the most important variable in calculat-ing the chemical sub-indicator, while Ca also plays an importantrole (Table 5). Measurement of these specific variables must bedone in a laboratory or with technical field equipment and thuscannot be carried out directly by farmers. This knowledge is, how-ever, still valuable since it can greatly reduce the resources requiredto assess soil chemical fertility. The morphological sub-indicatoris driven largely by the biogenic and non-macroaggregated mor-phological fractions, while the biological sub-indicator reflectstaxonomic richness and total abundance of macrofauna to a largeextent (Table 5). These variables do not necessarily require labo-ratory facilities, but still demand a fair level of technical capacity.Overall, we note that the GISQ was more strongly influenced bysoil physical and chemical parameters and less by macrofauna andmorphology (Table 5).
While the biological sub-indicator may have contributed rela-tively less to the calculation of the GISQ, we note that this was theonly sub-indicator to demonstrate significant differences betweenland use types (Table 4), and that the management impacts weregenerally more pronounced for macrofauna than for other soilparameters. Thus, soil invertebrates appear to offer an early andsensitive indicator of management impacts on soil quality (Barroset al., 2002) and could provide information about the trajectoryof soil quality changes, while soil chemical and physical parame-ters better reflect changes that have already occurred. The use ofmacrofauna as an early indicator is in agreement with a numberof other studies suggesting their use as means to assess short-termmanagement impacts on soil function and ecosystem health (Lobryde Bruyn, 1997; Paoletti, 1999). For example, Mathieu et al. (2005)
found soil invertebrates to quickly respond to forest clearance andregrowth in the Brazilian Amazon. Similarly, Blanchart et al. (2007)examined the recovery of soil C stocks and biological communi-ties following conversion of conventionally tilled systems to no-tillagriculture in Brazil, and found soil macrofauna to increase signif-icantly in the first year of no-till, while measurable differences insoil C did not appear until much later (>5 years). Velasquez et al.(2007a) also observed macrofauna to be highly sensitive to landuse change in a more humid region of Nicaragua, and found signifi-cant covariation between biological and soil physical, chemical andmorphological attributes. This is not the case here and this is likelydue to the considerable influence of earthworms on the biogenicaggregate soil fraction, and the near absence of earthworm activityand presence in the dry season. The high abundance of macrofaunacollected here and assessment of seasonal macrofauna dynamicsfrom similar conditions in Honduras (Pauli et al., 2011) suggestthat, in contrast to earthworms, a number of soil taxa remain activethroughout the dry season. While many of these organisms may notbe as important as earthworms in terms of their ecosystem engi-neering activities (Lavelle et al., 1997), they nonetheless respond tochanges in the soil environment and can provide valuable informa-tion about management impacts at a time when farmer labor andtime constraints are less restrictive to soil quality evaluation.
4.3. Participatory identification of bioindicator species
The efforts to identify indicators of soil quality discussed aboveare relevant, particularly when technical assistance is availablelocally to facilitate access to standardized soil analyses and helpwith interpretation of the results. Apart from this, it is also neces-sary to identify simple soil bioindicators that farmers can measureand evaluate independently, as technical support is not alwaysavailable at times when information is most needed (Tselouiko,2010). In our study, we combined a rigorous statistical selection ofindicator taxa (using the IndVal method) together with a participa-tory process involving farmer knowledge and local experience, inorder to determine relevant bioindicator species of distinct phys-ical, chemical and biological soil states. While others have usedsimilar approaches to identify indicator species for differentiatingland use types (McGeoch, 1998; Ruiz et al., 2011) and assessingecosystem degradation or restoration (Nahmani et al., 2006; Rossi
Author's personal copy
L. Rousseau et al. / Ecological Indicators 27 (2013) 71–82 81
et al., 2010), our study is unique in linking specific indicator taxawith synthetic indicators of soil quality. In relating specific taxa toa range of soil properties that best explain local variability in soilfunctions and represent distinct aspects of soil quality, this researchintends to provide farmers and local land managers with simpleand powerful tools for evaluation of land management impacts onspecific components of soil function. For example, stink beetles ofthe genus Eleodes, collected from pitfall traps were found to be abioindicator of poor soil physical quality (Table 7). Thus, a farmerwho encounters this insect on particular plot of land will know thatthere is a high probability that the soil is compacted in this partof his/her farm and that corrective actions should be taken (e.g.,reduced grazing, addition of organic residues to attract decompact-ing fauna such as earthworms). Similarly, a farmer who encountersspiders within the genus Pardosa may conclude that soil in that areapossesses relatively good chemical fertility (high in SOM and keymacronutrients) and overall soil quality (Table 7), thus indicatingthat the need for fertilizer input may be lower than elsewhere onhis/her farm.
The bioindicators presented here offer a robust preliminary setof taxa for evaluating the impacts of land management on soil qual-ity; however, we urge several points of caution at this stage. Whilethe methodology employed is applicable across a broad array of sit-uations and agricultural landscapes, the bioindicators developedhere are currently useful only at the local scale in this study andare likely to be most accurate during the dry season. Inter-seasonaland inter-annual variability as well as differences among sites areamong factors suggested by McGeoch and Chown (1998) that war-rant further testing of indicators in subsequent years and acrossdifferent sites to fully understand their potential value. Addition-ally, while our indicator taxa were discussed and validated by localfarmers, we note that this activity was rather informal and includeda relatively small number of farmers (<10). Thus, further develop-ment of these indicators should attempt to encompass a broadertemporal and spatial diversity, and to better integrate the perspec-tives of a greater number of farmers with more diverse knowledgeon land management issues and local bioindicators of soil quality.
5. Conclusions
The findings presented here help to elucidate our understand-ing of how agricultural expansion and common land managementpractices contribute to the degradation of soil resources in the trop-ical dry forest region of Central America. We found conversionof forest to traditional agricultural systems to reduce biodiversityand increase compaction of hillside soils of the region. Inclusionof native trees, active pruning and mulch management, and abol-ishment of burning associated with the Quesungual agroforestrysystem appear to mitigate some of the deleterious impacts ofagriculture, as this system was shown to improve macrofaunaabundance and diversity as well as reduce compaction relativeto traditional cropping and pasture systems. The calculation ofsynthetic indicators of soil quality provided a robust and inte-grative assessment land management impacts and indentified keyparameters of soil variability for reducing future investment in soilquality evaluation. Of these parameters, soil macrofauna appearedto provide a sensitive and early indicator or land use impacts onsoil quality. Drawing upon these synthetic indicators, we indenti-fied bioindicator species that were validated by farmers to offer asimple and powerful tool for local land managers to quickly assessand react to land management impacts in the region. While ourfindings remain preliminary and are not immediately applicable toother regions, we provide a basic methodology that is broadly appli-cable for developing bioindicators for diverse socio-environmentalcontexts.
Acknowledgments
We thank all the people that participated in field and labora-tory operations, especially the farmers and their families in thecommunity of La Danta. We also greatly appreciate the support ofAracely Castro, Juan-Carlos Mercado, and other CIAT staff for theircollaboration and assistance with technical and logistical issues.Additionally, we thank Eva Gutiérrez for assistance with equip-ment, Mirna Ortiz for help with macrofauna identification, andLeonardo Garcia Centero for support with soil analyses at UNA-Managua. This work was part of the project “Eco-efficient crop andlivestock production for the poor farmers in the sub-humid hill-side areas of Nicaragua” coordinated by the International Centerfor Tropical Agriculture (CIAT) in collaboration with University ofNatural Resources and Applied Life Sciences (BOKU – Austria), Insti-tuto Nicaragüense de Tecnología Agropecuario (INTA – Nicaragua),Universidad Nacional Agraria (UNA – Nicaragua), Consorcio para elManejo Integrado de Suelos (MIS – Nicaragua) and funded in part bythe Federal Ministry of Finance (BMF) of the Republic of Austria andthe Austrian Development Agency (ADA). Additional funding sup-port was provided by the INDICS project from the French Fondationpour la Recherche sur la Biodiversité.
References
Ampoorter, E., De Schrijver, A., De Frenne, P., Hermy, M., Verheyen, K., 2011. Exper-imental assessment of ecological restoration options for compacted forest soils.Ecol. Eng. 37, 1734–1746.
Anderson, J., Ingram, J., 1993. Tropical Soil Biology and Fertility: A Handbook ofMethods. CAB International, Wallingford, UK.
Ayarza, M.A., Welchez, L.A., 2004. Drivers effecting the development and sustaina-bility of the Quesungual Slash and Mulch Agroforestry System (QSMAS) onhillsides of Honduras. Comprehensive Assessment Bright Spots Project FinalReport, CIAT.
Barrera-Bassols, N., Zinck, J.A., 2003. Ethnopedology: a worldwide view on the soilknowledge of local people. Geoderma 111, 171–195.
Barros, E., Pashanasi, B., Constantino, R., Lavelle, P., 2002. Effects of land-use sys-tem on the soil macrofauna in western Brazilian Amazonia. Biol. Fertil. Soils 35,338–347.
Blanchart, E., Bernoux, M., Sarda, X., Siqueira Neto, M., Cerri, C.C., Piccolo, M., Douzet,J.M., Scopel, E., Feller, C., 2007. Effect of direct seeding mulch-based systems onsoil carbon storage and macrofauna in central Brazil. Agric. Conspect. Sci. 72,81–87.
Brussaard, L., de Ruiter, P., Brown, G.G., 2007. Soil biodiversity for agricultural sus-tainability. Agric. Ecosyst. Environ. 12, 233–244.
Calero Calderón, A., 2008. Estudio detallado de suelos en áreas de laderas por topose-cuencia de la microcuenca la Danta. UNA de Managua, Somotillo-Chinandega.
Cristofoli, S., Mahy, G., Kekenbosch, R., Lambeets, K., 2010. Spider communities asevaluation tools for wet heathland restoration. Ecol. Ind. 10, 773–780.
Dale, V.H., Beyeler, S.C., 2001. Challenges in the development and use of ecologicalindicators. Ecol. Ind. 1, 3–10.
Doran, J.W., Zeiss, M.R., 2000. Soil health and sustainability: managing the bioticcomponent of soil quality. Appl. Soil Ecol. 15, 3–11.
Dray, S., Chessel, D., Thioulouse, J., 2003. Co-inertia analysis and the linking of eco-logical data tables. Ecology 84, 3078–3089.
Dufrêne, M., Legendre, P., 1997. Species assemblages and indicator species: the needfor a flexible asymmetrical approach. Ecol. Monogr. 67, 345–366.
Ferris, H.T., Bongers, T., de Goede, R.G.M., 2001. A framework for soil food web diag-nostics: extension of the nematode faunal analysis concept. Appl. Soil Ecol. 18,13–29.
Foley, J.A., DeFries, R., Asner, G.P., Barford, C., Bonan, G., Carpenter, S.R., Chapin, F.S.,Coe, M.T., Daily, G.C., Gibbs, H.K., Helkowski, J.H., Holloway, T., Howard, E.A.,Kucharik, J., Monfreda, C., Patz, J.A., Prentice, I.C., Ramankutty, N., Snyder, P.K.,2005. Global consequences of land use. Science 309, 570–574.
Fonte, S.J., Six, J., 2010. Earthworms and litter management contributions to ecosys-tem services in a tropical agroforestry system. Ecol. Appl. 20, 1061–1073.
Fonte, S.J., Barrios, E., Six, J., 2010a. Earthworms, soil fertility and aggregate-associated soil organic matter dynamics in the Quesungual agroforestry system.Geoderma 155, 320–328.
Fonte, S.J., Barrios, E., Six, J., 2010b. Earthworm impacts on soil organic matter andfertilizer dynamics in tropical hillside agroecosystems of Honduras. Pedobiolo-gia 53, 327–335.
Giller, K.E., Beare, M.H., Lavelle, P., Izac, A.-M.N., Swift, M.J., 1997. Agricultural inten-sification, soil biodiversity and agroecosystem function. Appl. Soil Ecol. 6, 3–16.
Hellin, J., Welchez, L.A., Cherrett, I., 1999. The Quezungual System: anindigenous agroforestry system from western Honduras. Agrofor. Syst. 46,229–237.
Author's personal copy
82 L. Rousseau et al. / Ecological Indicators 27 (2013) 71–82
Holdridge, L.R., 1947. Determination of world plant formations from simple climaticdata. Science 105, 367–368.
Houba, V.J.G., Van der Lee, J.J., Novozamsky, I., Walinga, I., 1989. Soil and Plant Anal-ysis: A Series of Syllabi: Part 5. Soil Analysis Procedures. Wageningen Agric.University.
INTA, 2005. Diagnostico SubCuenca Tecomapa. Oficina de extensión Somotillo, Paci-fico norte. Chinandega, Nicaragua, 121 pp.
Kong, A.Y.Y., Six, J., Bryant, D.C., Denison, R.F., van Kessel, C., 2005. The relation-ship between carbon input, aggregation, and soil organic carbon stabilization insustainable cropping systems. Soil Sci. Soc. Am. J. 69, 1078–1085.
Landis, D.A., Wratten, S.D., Gurr, G.M., 2000. Habitat management to conserve natu-ral enemies of arthropod pests in agriculture. Annu. Rev. Entomol. 45, 175–201.
Lavelle, P., Spain, A.V., 2001. Soil Ecology. Kluwer Academic Publishers, Dordrecht,The Netherlands, 654.
Lavelle, P., Bignell, D., Lepage, M., Wolters, V., Roger, P., Ineson, P., Heal, O.W., Dhillion,S., 1997. Soil function in a changing world: the role of invertebrate ecosystemengineers. Eur. J. Soil Biol. 33, 159–193.
Lavelle, P., Decaëns, T., Aubert, M., Barot, S., Blouin, M., Bureau, F., Margerie, P., Mora,P., Rossi, J.-P., 2006. Soil invertebrates and ecosystem services. Eur. J. Soil Biol.42, S3–S15.
Lobry de Bruyn, L.A., 1997. The status of soil macrofauna as indicators of soil healthto monitor the sustainability of Australian agricultural soils. Ecol. Econ. 23,167–178.
Lopez Hernandez, D., Garcia-Gaudilla, M.P., Torres, F., Chacon, P., Paoletti, M.G.,1997. Identification, characterization and preliminary evaluation of Venezue-lan Amazon production systems in Puerto Ayacucho Savanna – Forest Ecotone.Interciencia 22, 307–314.
Marc, P., Canard, A., Ysnel, F., 1999. Spiders (Araneae) useful for pest limitation andbioindication. Agric. Ecosyst. Environ. 74, 229–273.
Martius, C., Höfer, H., Garcia, M.V.B., Römbke, J., Förster, B., Hanagarth, W., 2001.Microclimate in agroforestry systems in central Amazonia: does canopy closurematter to soil organisms? Agrofor. Syst. 60, 291–304.
Mathieu, J., Rossi, J.-P., Mora, P., Lavelle, P., Da, S., Martins, P.F., Rouland, C., Grimaldi,M., 2005. Recovery of soil macrofauna communities after forest clearance ineastern Amazonia, Brazil. Conserv. Biol. 19, 1598–1605.
McDonald, M.A., Healey, J.R., Stevens, P.A., 2002. The effects of secondary forest clear-ance and subsequent land-use on erosion losses and soil properties in the BlueMountains of Jamaica. Agric. Ecosyst. Environ. 92, 1–19.
McGeoch, M.A., 1998. The selection, testing and application of terrestrial insects asbioindicators. Biol. Rev. 73, 181–201.
McGeoch, M.A., Chown, S.L., 1998. Scaling up the value of bioindicators. Trends Ecol.Evol. 13, 46–47.
Nahmani, J., Lavelle, P., Rossi, J.-P., 2006. Does changing the taxonomical resolutionalter the value of soil macroinvertebrates as bioindicators of metal pollution?Soil Biol. Biochem. 38, 385–396.
Netuzhilin, I., Cerda, H., López-Hernández, D., Torres, F., Chacon, P., Paoletti, M.G.,1999. Biodiversity tools to evaluate Sustainability in Savanna-forest Ecotonein the Amazonas (Venezuela). In: Reddy, M.V. (Ed.), Management of TropicalAgroecosystems and the Beneficial Soil Biota. Science Publishers Inc., Enfield,NH, pp. 291–352.
Oritz-Ceballos, A.I., Fragoso, C., 2004. Earthworm populations under tropical maizecultivation: the effect of mulching with velvetbean. Biol. Fertil. Soils 39, 438–445.
Paoletti, M.G., 1999. Using bioindicators based on biodiversity to assess landscapesustainability. Agric. Ecosyst. Environ. 74, 1–18.
Pauli, N., Barrios, E., Conacher, A.J., Oberthür, T., 2011. Soil macrofauna in agriculturallandscapes dominated by the Quesungual slash-and-mulch agroforestry system,Western Honduras. Appl. Soil Ecol. 47, 119–132.
Pauli, N., Barrios, E., Conacher, A.J., Oberthür, T., 2012. Farmer knowledge of the rela-tionships among soil macrofauna, soil quality and tree species in a smallholderagroforestry system of western Honduras. Geoderma 189–190, 186–198.
Perfecto, I., Vandermeer, J., 2008. Biodiversity conservation in tropical agrosystems:a new conservation paradigm. Ann. N. Y. Acad. Sci. 1134, 173–200.
R Development Core Team, 2010. R: A Language and Environment for StatisticalComputing. R Foundation for Statistical Computing, Vienna, Austria.
Rivera Pena, M., 2008. Determinación de la dinámica del agua en el Sistema Agrofore-stal Quesungual e identificación de factores suelo-planta para el mejoramientode la productividad del agua en los cultivos. Ph.D. Dissertation. UniversidadNacional de Colombia, Cali, Colombia.
Rossi, J.-P., Celini, L., Mora, P., Mathieu, J., Lapied, E., Nahmani, J., Ponge, J.-F., Lavelle,P., 2010. Decreasing fallow duration in tropical slash-and-burn agriculture alterssoil macro-invertebrate diversity: a case study in southern French Guiana. Agric.Ecosyst. Environ. 135, 148–154.
Rousseau, G.X., Deheuvels, O., Rodriguez Arias, I., Somarriba, E., 2012. Indicatingsoil quality in cacao-based agroforestry systems and old-growth forests: thepotential of soil macrofauna assemblage. Ecol. Ind. 23, 535–543.
Ruiz, N., Mathieu, J., Célini, L., Rollard, C., Hommay, G., Iorio, E., Lavelle, P., 2011. IBQS:a synthetic index of soil quality based on soil macro-invertebrate communities.Soil Biol. Biochem. 43, 2032–2045.
Sepúlveda, R.B., Nieuwenhuyse, A., 2011. Influence of topographic and edaphic fac-tors on vulnerability to soil degradation due to cattle grazing in humid tropicalmountains in northern Honduras. Catena 86, 130–137.
Shannon, C.E., 1948. A mathematical theory of communication. Bell Syst. Tech. J. 27,379–423, 623–656.
Sileshi, G., Mafongoya, P.L., 2007. Quantity and quality of organic inputs from cop-picing leguminous trees influence abundance of soil macrofauna in maize cropsin eastern Zambia. Biol. Fertil. Soils 43, 333–340.
Souza, J.L.P., Baccaro, F.B., Landeiro, V.L., Franklin, E., Magnusson, W.E., 2012.Trade-offs between complementarity and redundancy in the use of differentsampling techniques for ground-dwelling ant assemblages. Appl. Soil Ecol. 56,63–73.
Szott, L.T., Palm, C.A., Buresh, R.J., 1999. Ecosystem fertility and fallow function inthe humid and subhumid tropics. Agrofor. Syst. 47, 163–196.
Thioulouse, J., Chessel, D., Dolédec, S., Olivier, J.M., 1997. ADE-4: a multivariateanalysis and graphical display software. Stat. Comput. 7, 75–83.
Tselouiko, S., 2010. De l’échange des savoirs pour une gestion interactive desterritoires: Etude ethnographique d’un projet de développement chez une com-munauté d’agriculteurs familiaux du Km 338 sud de la Transamazonienne,municipalité de Pacajà-Pa (Brésil). Mémoire de Master 2, Ecole Pratique desHautes Etudes en sciences sociales de Paris.
USDA (United States Department of Agriculture), 2004. Soil survey laboratory meth-ods manual. Rebecca Burt, Editor. Soil Survey Investigations Report No. 42,version 4.0.
Velasquez, E., Lavelle, P., Andrade, M., 2007a. GISQ, a multifunctional indicator ofsoil quality. Soil Biol. Biochem. 39, 3066–3080.
Velasquez, E., Pelosi, C., Brunet, D., Grimaldi, M., Martins, M., Rendeiro, A.C., Barrios,E., Lavelle, P., 2007b. This ped is my ped: visual separation and near infraredspectra allow determination of the origins of soil macroaggregates. Pedobiologia51, 75–87.
Velasquez, E., Fonte, S.J., Barot, S., Grimaldi, M., Desjardins, T., Lavelle, P., 2012. Soilmacrofauna-mediated impacts of plant species composition on soil functioningin Amazonian pastures. Appl. Soil Ecol. 56, 43–50.
Zerbino, M.S., 2010. Evaluación de la macrofauna del suelo en rotaciones cultivos-pasturas con laboreo convencional. Acta Zool. Mex. 2, 189–202.