Validation of soil quality index in soil using bioindicator plant
11
http://journal.unoeste.br/index.php/ca/index DOI: 10.5747/ca.2021.v17.n3.a440 ISSN on-line 1809-8215 Colloquium Agrariae, v. 17, n.3, Mai-Jun, 2021, p. 59-69 Submetido: 01/03/2021 Revisado: 20/04/2021 Aceito: 28/04/2021 Validation of soil quality index in soil using bioindicator plant Ronaldo Toshiaki Oikawa, Amanda Silva Custódio, Fábio Fernando Araújo Universidade do Oeste Paulista – UNOESTE, Presidente Prudente, SP. E-mail: [email protected] Abstract Soils provide a broad set of vital ecosystem services and sustains the production of food and fibers, balancing the ecosystem. Thus, from the perspective of soil quality, it is defined as an ability to balance within the ecosystem to sustain biological productivity, promoting the health of plants and animals, being evaluated by traditional indicators as physical, chemical and biological indicators, so the present work aims to estimate the soil quality index using multivariate models using soil biological attributes and validation with growth variables of the bioindicator plant. The study was developed in the agricultural area in P. Prudente, SP, the points collected were georeferenced, collections in depth of 0 - 20 cm, microbiological analysis, microbial carbon and nitrogen biomass, dehydrogenase, respiration and microbial coefficient, having a bioindicator plant curly lettuce (Lucy Brown) as a validator of the soil. The results were discovered using the PCA model for the identification of autos vectors and autos values, grouping and identifying their collinearities, linear regression, r-pearson validation and cluster heuristic analysis. The microbial attributes and the bioindicator plant discriminated the agricultural areas evaluated with establishment and validation of SQI. The metabolic coefficient and N of the microbial biomass dissipation of the highest covariance values by multivariate analysis. The reforestation area with native species (SQI 0.782%) and the livestock crop integration system (SQI 0.765%) were evaluated as areas with better soil quality. Keywords: PCA; soil health; pastures; soil microbiology; multivariate model. Validação do índice da qualidade do solo com planta bioindicadora Resumo O solo fornece o conjunto de serviços ambientais vitais e dinâmico que condiciona e sustenta a produção de alimentos e fibras, balanceando o ecossistema, dessa forma, sob a ótica da qualidade do solo é definida como a capacidade de se equilibrar dentro do ecossistema para sustentar a produtividade biológica, promovendo a saúde das plantas e animais, sendo avaliada pelos indicadores tradicionais como indicadores físicos, químicos e biológicos, assim o presente trabalho tem como objetivo estimar índice qualidade do solo com uso de modelos multivariados utilizando-se de atributos biológicos do solo e validação com variáveis de crescimento da planta bioindicadora. O estudo foi desenvolvido na área agrícola da universidade do Oeste Paulista, campus II, os pontos coletados foram georreferenciados, coletatos em profundidade de 0 – 20 cm, realizado as análises microbiológicas, biomassa microbiana do carbono e nitrogênio, desidrogenase, respiração e coeficiente microbiano, tendo a planta bioindicadora alface crespa (Lucy Brown) como validador do solo. Os resultados foram submetidos ao modelo de PCA para a identificação dos autos vetores e autos valores agrupando e identificando suas colinearidades, regressão linear, validação r-pearson e análise heurística de cluster. Os atributos microbianos e a planta bioindicadora discriminaram as áreas agrícolas avaliadas com atribuição e validação de SQI. O coeficiente metabólico e N da biomassa microbiana apresentaram os maiores valores de covariância pela análise multivariada. A área de reflorestamento com espécies nativas (SQI 0,782%) e o sistema de integração lavoura pecuária (SQI 0,765%) foram consideradas as áreas com melhor qualidade de solo. Palavras chaves: PCA; solo saudável; pastagens; microbiologia do solo; análise multivariada.
-
Upload
khangminh22 -
Category
Documents
-
view
0 -
download
0
Transcript of Validation of soil quality index in soil using bioindicator plant

http://journal.unoeste.br/index.php/ca/index DOI: 10.5747/ca.2021.v17.n3.a440 ISSN on-line 1809-8215
Colloquium Agrariae, v. 17, n.3, Mai-Jun, 2021, p. 59-69
Submetido: 01/03/2021 Revisado: 20/04/2021 Aceito: 28/04/2021
Validation of soil quality index in soil using bioindicator plant Ronaldo Toshiaki Oikawa, Amanda Silva Custódio, Fábio Fernando Araújo Universidade do Oeste Paulista – UNOESTE, Presidente Prudente, SP. E-mail: [email protected]
Abstract Soils provide a broad set of vital ecosystem services and sustains the production of food and fibers, balancing the ecosystem. Thus, from the perspective of soil quality, it is defined as an ability to balance within the ecosystem to sustain biological productivity, promoting the health of plants and animals, being evaluated by traditional indicators as physical, chemical and biological indicators, so the present work aims to estimate the soil quality index using multivariate models using soil biological attributes and validation with growth variables of the bioindicator plant. The study was developed in the agricultural area in P. Prudente, SP, the points collected were georeferenced, collections in depth of 0 - 20 cm, microbiological analysis, microbial carbon and nitrogen biomass, dehydrogenase, respiration and microbial coefficient, having a bioindicator plant curly lettuce (Lucy Brown) as a validator of the soil. The results were discovered using the PCA model for the identification of autos vectors and autos values, grouping and identifying their collinearities, linear regression, r-pearson validation and cluster heuristic analysis. The microbial attributes and the bioindicator plant discriminated the agricultural areas evaluated with establishment and validation of SQI. The metabolic coefficient and N of the microbial biomass dissipation of the highest covariance values by multivariate analysis. The reforestation area with native species (SQI 0.782%) and the livestock crop integration system (SQI 0.765%) were evaluated as areas with better soil quality. Keywords: PCA; soil health; pastures; soil microbiology; multivariate model. Validação do índice da qualidade do solo com planta bioindicadora Resumo O solo fornece o conjunto de serviços ambientais vitais e dinâmico que condiciona e sustenta a produção de alimentos e fibras, balanceando o ecossistema, dessa forma, sob a ótica da qualidade do solo é definida como a capacidade de se equilibrar dentro do ecossistema para sustentar a produtividade biológica, promovendo a saúde das plantas e animais, sendo avaliada pelos indicadores tradicionais como indicadores físicos, químicos e biológicos, assim o presente trabalho tem como objetivo estimar índice qualidade do solo com uso de modelos multivariados utilizando-se de atributos biológicos do solo e validação com variáveis de crescimento da planta bioindicadora. O estudo foi desenvolvido na área agrícola da universidade do Oeste Paulista, campus II, os pontos coletados foram georreferenciados, coletatos em profundidade de 0 – 20 cm, realizado as análises microbiológicas, biomassa microbiana do carbono e nitrogênio, desidrogenase, respiração e coeficiente microbiano, tendo a planta bioindicadora alface crespa (Lucy Brown) como validador do solo. Os resultados foram submetidos ao modelo de PCA para a identificação dos autos vetores e autos valores agrupando e identificando suas colinearidades, regressão linear, validação r-pearson e análise heurística de cluster. Os atributos microbianos e a planta bioindicadora discriminaram as áreas agrícolas avaliadas com atribuição e validação de SQI. O coeficiente metabólico e N da biomassa microbiana apresentaram os maiores valores de covariância pela análise multivariada. A área de reflorestamento com espécies nativas (SQI 0,782%) e o sistema de integração lavoura pecuária (SQI 0,765%) foram consideradas as áreas com melhor qualidade de solo. Palavras chaves: PCA; solo saudável; pastagens; microbiologia do solo; análise multivariada.

60
Colloquium Agrariae, v. 17, n.3, Mai-Jun, 2021, p. 59-69
Introduction
The weathering that occurs in the soil and in the rock, are associated with local hydrology and physical, chemical and biological changes, so the soil is constantly changing because it is directly related to climate activities, local relief, microbiological activities and anthropic activities (MEDEIROS et al., 2017).
In the work of Bünemann et al. (2018) the difficulty of determining a soil quality index (SQI) that represents the totality and reality of these changes is highlighted, however, this search is intrinsically linked to the productivity and sustainability of the balance of the environment inherent in the plant, therefore the need to identify enzymatic variables such as B-glucosidase mentioned by Navas et al. (2011) (VOGEL et al., 2018).
The changes at soil, response to a given condition or management system can only be understood through the integrated analysis of a minimum set of parameters that are affected by different land uses, which can influence the ecological system as a whole (MARTINS et al., 2019; MOREIRA; SIQUEIRA, 2006).
The authors Bone et al. (2014), Moncada et al. (2015) and Paz‐Ferreiro and Fu (2016), reported that physical and chemical indicators are the main indicators used to assess soil quality, however, the biochemical and biological properties of the soil can respond more quickly to management activities and soil disturbances (GIANFREDA; RUGGIERO, 2006; PAZ-FERREIRO et al., 2007).
The biological components of the soil and many ecosystem functions, including the decomposition of organic waste, nutrient cycling, synthesis of humic substances, degradation of xenobiotics and nitrogen fixation, are transformed through microbiological activity, including minimizing soil erosion (GARCÍA-ORENES et al., 2010, 2013; CANEI et al., 2018).
Therefore, there is a growing interest to study parameters that effectively indicate soil changes, and the investigation of suitable methods to improve the index of biological soil quality and guarantee the sustainability of
ecosystems (CHAER et al., 2009; MENDES et al., 2015).
The studies carried out to date, the assessment of soil quality still has a limited approach, which makes it difficult to interpret and validate the values of quality indicators obtained. Therefore, it is essential that the physical, chemical and biological to demonstrate importance soil processes, and that new ways of interpreting the biological quality of the soil are defined, using multivariate analysis and multiple regression models, to suggest new procedures for assessment of soil health.
The goal was to evaluate biological attributes in areas with different agricultural managements to define Soil Quality Indexes (SQI) using mathematical models and validating the results using a bioindicator plant.
Material and Methods
The study was developed at Universidade do Oeste Paulista, specifically on Campus II of Unoeste, and the climatic characteristic of the region is classified as being CWa, and the classification of the region's soil is Argisol Red-Yellowish (ROLIM et al., 2007; EMBRAPA, 1999).
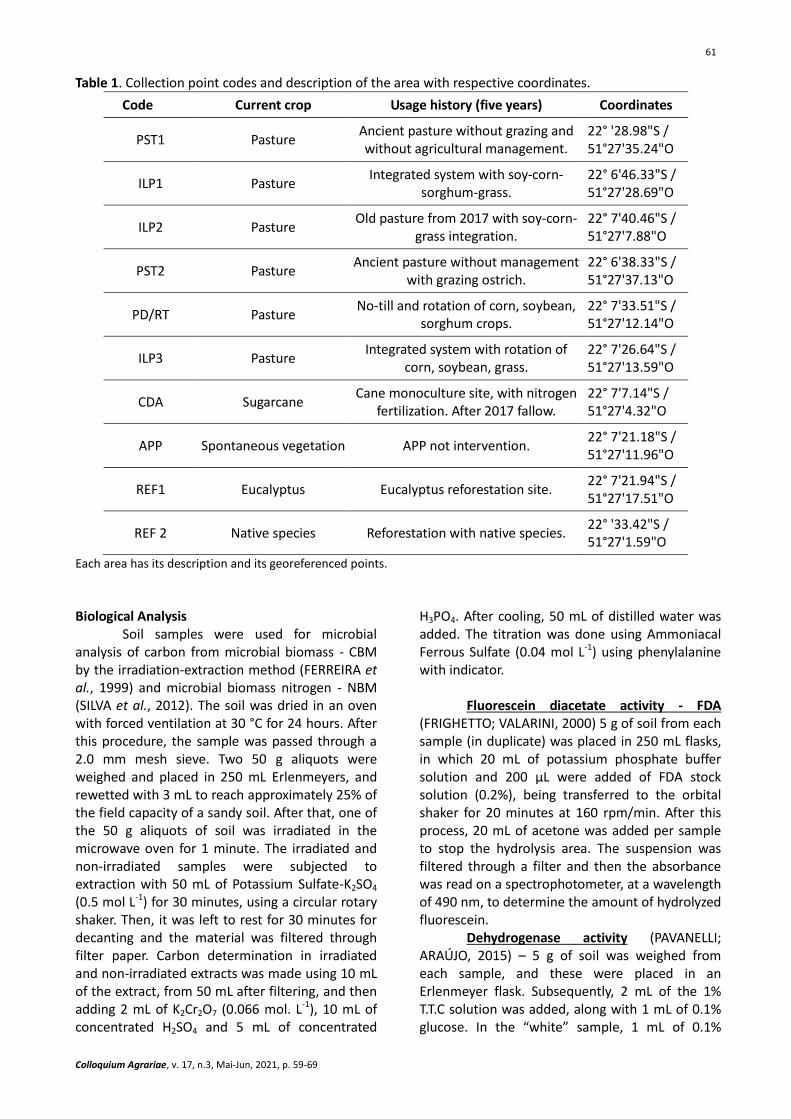
The sample collection sites were chosen in areas with different management histories in the last five years (Table 2), being collected at a depth of 0 to 20 cm. The geographical coordinates were obtained using the OperaMaps GPS (Global Positioning System) application, and from the collection point, four more samples were taken equidistant to five meters from the main coordinate, homogenized, passed through a 2.0 mm mesh sieve. and stored at a temperature of 7 ± 3 °C until the time of the tests. Plant and root residues were carefully removed from the soil, and classified as shown in Table 1. Table 1 contains the description, pasture 1 (PST1); livestock farming integration 1 (ILP1); livestock farming integration 2 (ILP2); pasture 2 (PST2); no-till / rotation (PD / RT); livestock farming integration 3 (ILP3); reforestation of Eucalyptus (REF1), reforestation of Native plants (REF2); permanent preservation area (APP); sugar cane (CDA).
61
Colloquium Agrariae, v. 17, n.3, Mai-Jun, 2021, p. 59-69
Table 1. Collection point codes and description of the area with respective coordinates.
Code Current crop Usage history (five years) Coordinates
PST1 Pasture Ancient pasture without grazing and without agricultural management.
22° '28.98"S / 51°27'35.24"O
ILP1 Pasture Integrated system with soy-corn-
sorghum-grass. 22° 6'46.33"S / 51°27'28.69"O
ILP2 Pasture Old pasture from 2017 with soy-corn-
grass integration. 22° 7'40.46"S / 51°27'7.88"O
PST2 Pasture Ancient pasture without management
with grazing ostrich. 22° 6'38.33"S / 51°27'37.13"O
PD/RT Pasture No-till and rotation of corn, soybean,
sorghum crops. 22° 7'33.51"S / 51°27'12.14"O
ILP3 Pasture Integrated system with rotation of
corn, soybean, grass. 22° 7'26.64"S / 51°27'13.59"O
CDA Sugarcane Cane monoculture site, with nitrogen
fertilization. After 2017 fallow. 22° 7'7.14"S / 51°27'4.32"O
APP Spontaneous vegetation APP not intervention. 22° 7'21.18"S / 51°27'11.96"O
REF1 Eucalyptus Eucalyptus reforestation site. 22° 7'21.94"S / 51°27'17.51"O
REF 2 Native species Reforestation with native species. 22° '33.42"S / 51°27'1.59"O
Each area has its description and its georeferenced points.
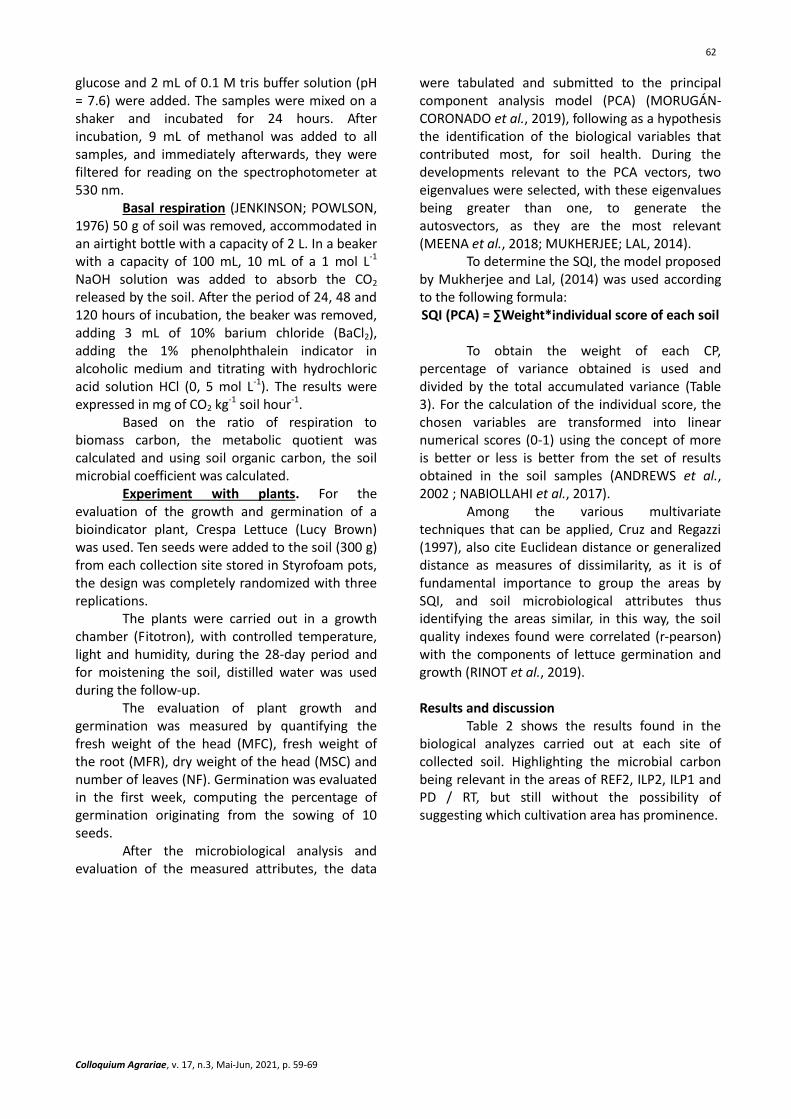
Biological Analysis
Soil samples were used for microbial analysis of carbon from microbial biomass - CBM by the irradiation-extraction method (FERREIRA et al., 1999) and microbial biomass nitrogen - NBM (SILVA et al., 2012). The soil was dried in an oven with forced ventilation at 30 °C for 24 hours. After this procedure, the sample was passed through a 2.0 mm mesh sieve. Two 50 g aliquots were weighed and placed in 250 mL Erlenmeyers, and rewetted with 3 mL to reach approximately 25% of the field capacity of a sandy soil. After that, one of the 50 g aliquots of soil was irradiated in the microwave oven for 1 minute. The irradiated and non-irradiated samples were subjected to extraction with 50 mL of Potassium Sulfate-K2SO4 (0.5 mol L-1) for 30 minutes, using a circular rotary shaker. Then, it was left to rest for 30 minutes for decanting and the material was filtered through filter paper. Carbon determination in irradiated and non-irradiated extracts was made using 10 mL of the extract, from 50 mL after filtering, and then adding 2 mL of K2Cr2O7 (0.066 mol. L-1), 10 mL of concentrated H2SO4 and 5 mL of concentrated
H3PO4. After cooling, 50 mL of distilled water was added. The titration was done using Ammoniacal Ferrous Sulfate (0.04 mol L-1) using phenylalanine with indicator.
Fluorescein diacetate activity - FDA
(FRIGHETTO; VALARINI, 2000) 5 g of soil from each sample (in duplicate) was placed in 250 mL flasks, in which 20 mL of potassium phosphate buffer solution and 200 μL were added of FDA stock solution (0.2%), being transferred to the orbital shaker for 20 minutes at 160 rpm/min. After this process, 20 mL of acetone was added per sample to stop the hydrolysis area. The suspension was filtered through a filter and then the absorbance was read on a spectrophotometer, at a wavelength of 490 nm, to determine the amount of hydrolyzed fluorescein.
Dehydrogenase activity (PAVANELLI; ARAÚJO, 2015) – 5 g of soil was weighed from each sample, and these were placed in an Erlenmeyer flask. Subsequently, 2 mL of the 1% T.T.C solution was added, along with 1 mL of 0.1% glucose. In the “white” sample, 1 mL of 0.1%
62
Colloquium Agrariae, v. 17, n.3, Mai-Jun, 2021, p. 59-69
glucose and 2 mL of 0.1 M tris buffer solution (pH = 7.6) were added. The samples were mixed on a shaker and incubated for 24 hours. After incubation, 9 mL of methanol was added to all samples, and immediately afterwards, they were filtered for reading on the spectrophotometer at 530 nm.
Basal respiration (JENKINSON; POWLSON, 1976) 50 g of soil was removed, accommodated in an airtight bottle with a capacity of 2 L. In a beaker with a capacity of 100 mL, 10 mL of a 1 mol L-1 NaOH solution was added to absorb the CO2 released by the soil. After the period of 24, 48 and 120 hours of incubation, the beaker was removed, adding 3 mL of 10% barium chloride (BaCl2), adding the 1% phenolphthalein indicator in alcoholic medium and titrating with hydrochloric acid solution HCl (0, 5 mol L-1). The results were expressed in mg of CO2 kg-1 soil hour-1.
Based on the ratio of respiration to biomass carbon, the metabolic quotient was calculated and using soil organic carbon, the soil microbial coefficient was calculated.
Experiment with plants. For the evaluation of the growth and germination of a bioindicator plant, Crespa Lettuce (Lucy Brown) was used. Ten seeds were added to the soil (300 g) from each collection site stored in Styrofoam pots, the design was completely randomized with three replications.
The plants were carried out in a growth chamber (Fitotron), with controlled temperature, light and humidity, during the 28-day period and for moistening the soil, distilled water was used during the follow-up.
The evaluation of plant growth and germination was measured by quantifying the fresh weight of the head (MFC), fresh weight of the root (MFR), dry weight of the head (MSC) and number of leaves (NF). Germination was evaluated in the first week, computing the percentage of germination originating from the sowing of 10 seeds.
After the microbiological analysis and evaluation of the measured attributes, the data
were tabulated and submitted to the principal component analysis model (PCA) (MORUGÁN-CORONADO et al., 2019), following as a hypothesis the identification of the biological variables that contributed most, for soil health. During the developments relevant to the PCA vectors, two eigenvalues were selected, with these eigenvalues being greater than one, to generate the autosvectors, as they are the most relevant (MEENA et al., 2018; MUKHERJEE; LAL, 2014).
To determine the SQI, the model proposed by Mukherjee and Lal, (2014) was used according to the following formula: SQI (PCA) = ∑Weight*individual score of each soil
To obtain the weight of each CP,
percentage of variance obtained is used and divided by the total accumulated variance (Table 3). For the calculation of the individual score, the chosen variables are transformed into linear numerical scores (0-1) using the concept of more is better or less is better from the set of results obtained in the soil samples (ANDREWS et al., 2002 ; NABIOLLAHI et al., 2017).
Among the various multivariate techniques that can be applied, Cruz and Regazzi (1997), also cite Euclidean distance or generalized distance as measures of dissimilarity, as it is of fundamental importance to group the areas by SQI, and soil microbiological attributes thus identifying the areas similar, in this way, the soil quality indexes found were correlated (r-pearson) with the components of lettuce germination and growth (RINOT et al., 2019). Results and discussion
Table 2 shows the results found in the biological analyzes carried out at each site of collected soil. Highlighting the microbial carbon being relevant in the areas of REF2, ILP2, ILP1 and PD / RT, but still without the possibility of suggesting which cultivation area has prominence.

63
Colloquium Agrariae, v. 17, n.3, Mai-Jun, 2021, p. 59-69
Table 2. Description of results related to soil biological analyzes from different locations.
Description C microbial (mg kg-1)
qMIC (%)
Breathing μg CO2 24H
qCO2 (mg
Kg.h/g.kg)
N microbial (µg/g)
Dehydrogenase (µg TTF/g)
PST1 66,441 2,354 0,776 0,511 10,879 5,272
ILP1 162,761 3,688 0,924 0,248 12,527 5,990
ILP2 119,704 3,642 2,896 1,043 13,648 4,536
PST2 43,285 0,914 4,019 2,885 18,835 6,745
PD/RT 97,248 2,263 0,678 0,303 9,231 2,721
ILP3 60,131 1,630 1,121 0,770 7,605 1,933
REF1 50,851 0,981 3,162 2,939 6,286 3,481
REF2 397,159 7,013 1,516 0,159 12,813 3,026
APP 48,809 1,266 2,551 2,556 12,198 2,479
CDA 65,513 1,740 2,773 1,989 10,395 2,871
Areas and their respective average values of each microbiological attribute.
With the data already prepared to submit
to the PCA model, in the subsequent processes a matrix f(X) = Y is generated, which organizes the data in such a way as to list the self-value (ERNAKOVICH et al., 2015). Figure 1 shows that, due to the multivariate analysis performed with biological data, only two main components have
eigenvalues above one and can be used in the most representative mathematical models (MUKHERJEE; LAL, 2014; ERNAKOVICH et al., 2015; XIAO et al., 2020).
Figure 1. Eigenvalues of the main components found.
In Table 3, shows the weight of the vectors
of each analyzed variable, to choose the highest value of the coefficient within each main component. The variables chosen were the metabolic coefficient qCO2 (PC1 - 0.527) and nitrogen from the microbial biomass NBM (PC2 - 0.636), as it was identified as the most relevant
among the values and will serve as input for the calculations and index of soil quality (SQI) (JUHOS et al., 2019; MUKHERJEE; LAL, 2014; PANDEY et al., 2019).

64
Colloquium Agrariae, v. 17, n.3, Mai-Jun, 2021, p. 59-69
Table 3. Results of the analysis of main components.
Components PC1 PC2
Eigenvalue 2,772 1,770 Percentage Change 46,20% 29,50% Cumulative Percentage 46,20% 75,70% Variables analyzed CBM -0,456 0,376 qMIC -0,472 0,375 Breathing 0,472 0,221 qCO2 0,527 0,058 NBM 0,195 0,636 Dehydrogenase 0,176 0,511
Values in bold that most stood out as significant vectors, and underlined values were used to obtain the SQI weight.
Figure 2 shows the grouping of areas
within each studied PC. The analysis of CP 1 and 2 was responsible for explaining 75% of the variation found (JUHOS et al., 2019). To obtain the weight of the SQI equation, the following calculation is performed: PC1 WEIGHT = Percentage Change PC1 / Cumulative Percentage PC2 WEIGHT = Percentage Change PC2 / Cumulative Percentage
46.20% / 75.20% = 0.610 PC1 WEIGHT referring to the qCO2 attribute 29.50% / 75.20% = 0.390 PC2 WEIGHT referring to the NBM attribute
With the value of the weights, the
average of the biological analyzes of each point and the PC's that stood out the most in the PCA model, it is possible to assemble the equation.
Figure 2. Groupings of areas by the PCA. Eucalyptus (REF1), Native (REF2), Pasture (PST), Livestock Crop Integration (ILP), No-till / Rotation (PDRT) and Sugarcane (CDA).
To arrive at the result in Table 4, the
following calculation is performed: (PC1 WEIGHT * AVERAGE OF EACH POINT (qCO2))
+ (PC2 WEIGHT * AVERAGE OF EACH POINT (NBM))
Table 4 was adjusted in descending order, and it can be seen that the area of reforestation
with native species (REF2) obtained the highest index, while the area of reforestation with eucalyptus (REF1) the lowest index.

65
Colloquium Agrariae, v. 17, n.3, Mai-Jun, 2021, p. 59-69
Table 4. QSI found for different areas in decreasing order.
Code QSI
REF2 0,782 ILP1 0,765 PST1 0,698
PD/RT 0,691 ILP2 0,684 ILP3 0,598 PST2 0,550 CDA 0,496 APP 0,459 REF1 0,291
The analysis of the growth variables of the
indicator plant shows that it is possible to use the results of growth found in all variables because the variance between the autos vectors are quite close
and significant (MORALES-LONDOÑO et al., 2019; SILVA et al., 2020).
Table 5. Representation of PC1 and PC2 in relation to the percentage of variation, cumulative percentage and average variation of each plant growth variable.
Variables Principal Component
Percentage of Variance
Cumulative Percentage
Cumulative Average
Ger PC1 40,00% 70,49% 70,41% PC2 30,49%
MFC PC1 46,39% 71,67% PC2 25,28%
MFR PC1 42,73% 68,28% PC2 25,55%
MSC PC1 46,26% 71,57% PC2 25,31%
NF PC1 44,60% 70,05% PC2 25,45%
GEN: Germination; MFC: fresh pasta from the head; MFR: fresh root mass; MSC: dry mass of the head; and NF: number of sheets.
The validation of the SQI obtained in the
different evaluated sites (Table 6), were correlated with the values found in the bioindicator plant that include germination (GER), fresh head mass (MFC), fresh root mass (MFR), dry mass of the head (MSC) and number of leaves
(NF), Table 6. With emphasis on germination and head mass and fresh head mass, with a significant correlation of 5%.
Table 6. Correlation matrix (r-pearson) between the SQI and the bioindicators of the plant.
Correlation Matrix
SQI MFC MFR MSC NF Ger
SQI 0,032545* 0,11023 0,026735* 0,090611 0,015694* MFC 0,67412 0,00070469 8,02E-06 0,0002847 0,34913 MFR 0,53603 0,88324 0,012761 0,0038995 0,27553 MSC 0,69158 0,96279 0,74846 0,00031278 0,49674 NF 0,56236 0,90762 0,81712 0,90535 0,75586 Ger 0,73383 0,33169 0,38235 0,24409 0,11304 GEN: Germination; MFC: fresh pasta from the head; MFR: fresh root mass; MSC: dry mass of the head; and NF: number of sheets. * Significant at 5% probability.

66
Colloquium Agrariae, v. 17, n.3, Mai-Jun, 2021, p. 59-69
Figure 3 demonstrates that the
dendrogram grouped two clusters representing two groups of more significant SQI, with significant SQI being the areas PST1, PD / RT, ILP2, Mata Nativa (REF2) and ILP1, against group 2 ILP3, PST2,
Mata Nativa ( REF1), Preservation Area (APP) and Sugarcane (CDA).
Figure 3. Dendrogram based on hierarchical analysis of clusters grouped by areas, SQI and biological analysis of the soil.
The PCA as a reducer of the number of components to be used in models for calculating soil quality indexes was promising, since it grouped the areas and presented a significant correlation with plant growth parameters. The biological attributes of the soil were also shown to be robust for use in this model. The area with reforestation of native species stood out as being of higher quality and grouped with other sites with agricultural management (ERNAKOVICH et al., 2015; MUKHERJEE; LAL, 2014).
According to Moncada et al. (2015), Mukherjee and Lal (2014), Ernakovich et al. (2015), Morugán-Coronado et al. (2019), using the PCA model and analyzing the soil quality referenced by the physical and chemical attributes, satisfactory results were obtained, as using only biological indicators. This study shows that using the biological analyzes of the soil, SQI can be calculated, achieving considerable results with a high degree of correlation validated with the use of a bioindicator plant sensitive to soil changes, with models of statistical equivalence (VILČEK; KOCO, 2018).
Bioindicator plants used by Júnior et al. (2015), to assess soil contamination with different chemicals. The statistical model by hierarchical
cluster (SILVA et al., 2018), shown in Figure 3, allows to verify the division of the collected areas and their similarities, due to the analysis of microbial C, qMIC, Soil Respiration, qCO2, microbial N and dehydrogenase , which is reported in Table 2, thus, the pasture areas (PST1), direct planting / crop rotation (PD / RT), livestock crop integration 1 (ILP1), livestock crop integration 2 (ILP2) and native forest ( REF2) show similarity in their characteristic, evaluated by microbial parameters.
Soil degradation processes, as a result of agricultural activity, are generally linked to inadequate management and mono-cultivation, in the case of pastures, the main agricultural activity in Western São Paulo, their degradation processes may have nutritional deficiency as the main cause of the plants, in this way, the rotation of the pasture with other annual fertilized crops can be the efficient solution for a good production (GONÇALVES; FRANCHINI, 2007; LOURENZANI; CALDAS, 2014).
The area studied with the livestock crop integration system was satisfactory in terms of the soil quality measured by the model. This may direct future studies with the adoption of this technology to classify the biological health of the
67
Colloquium Agrariae, v. 17, n.3, Mai-Jun, 2021, p. 59-69
soil, and assist in the recovery of degraded soils in the western region of São Paulo.
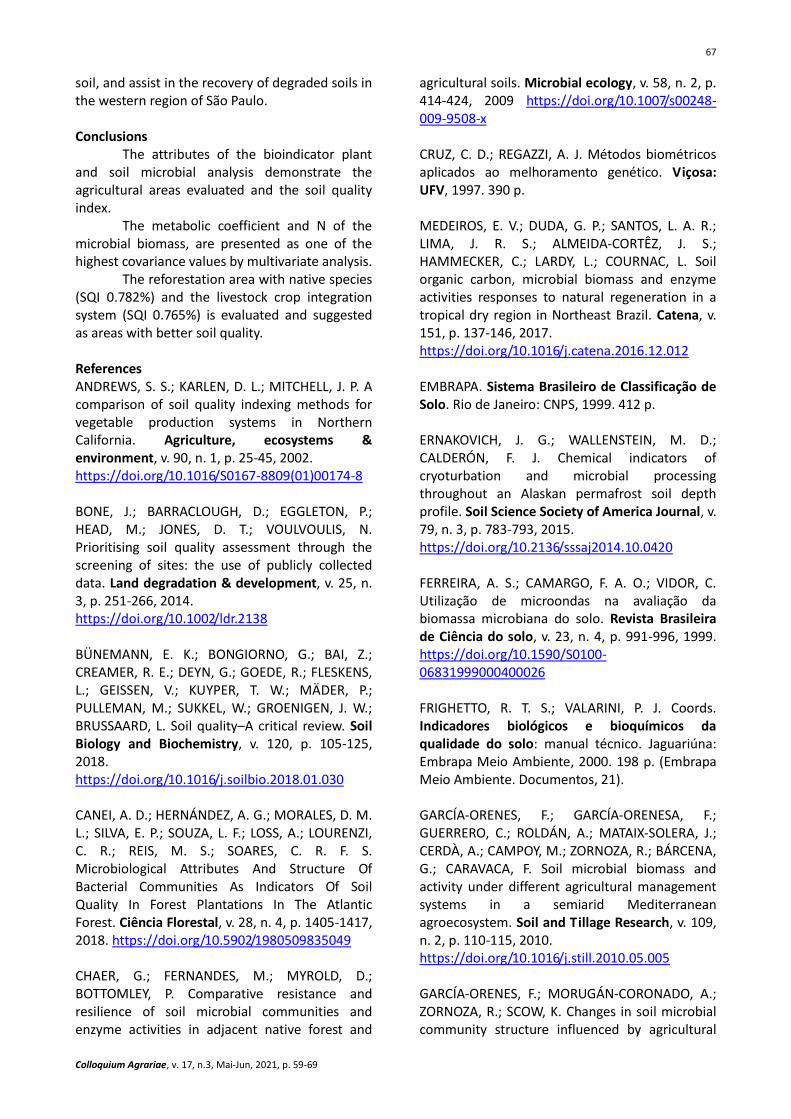
Conclusions
The attributes of the bioindicator plant and soil microbial analysis demonstrate the agricultural areas evaluated and the soil quality index.
The metabolic coefficient and N of the microbial biomass, are presented as one of the highest covariance values by multivariate analysis.
The reforestation area with native species (SQI 0.782%) and the livestock crop integration system (SQI 0.765%) is evaluated and suggested as areas with better soil quality.
References ANDREWS, S. S.; KARLEN, D. L.; MITCHELL, J. P. A comparison of soil quality indexing methods for vegetable production systems in Northern California. Agriculture, ecosystems & environment, v. 90, n. 1, p. 25-45, 2002. https://doi.org/10.1016/S0167-8809(01)00174-8 BONE, J.; BARRACLOUGH, D.; EGGLETON, P.; HEAD, M.; JONES, D. T.; VOULVOULIS, N. Prioritising soil quality assessment through the screening of sites: the use of publicly collected data. Land degradation & development, v. 25, n. 3, p. 251-266, 2014. https://doi.org/10.1002/ldr.2138 BÜNEMANN, E. K.; BONGIORNO, G.; BAI, Z.; CREAMER, R. E.; DEYN, G.; GOEDE, R.; FLESKENS, L.; GEISSEN, V.; KUYPER, T. W.; MÄDER, P.; PULLEMAN, M.; SUKKEL, W.; GROENIGEN, J. W.; BRUSSAARD, L. Soil quality–A critical review. Soil Biology and Biochemistry, v. 120, p. 105-125, 2018. https://doi.org/10.1016/j.soilbio.2018.01.030 CANEI, A. D.; HERNÁNDEZ, A. G.; MORALES, D. M. L.; SILVA, E. P.; SOUZA, L. F.; LOSS, A.; LOURENZI, C. R.; REIS, M. S.; SOARES, C. R. F. S. Microbiological Attributes And Structure Of Bacterial Communities As Indicators Of Soil Quality In Forest Plantations In The Atlantic Forest. Ciência Florestal, v. 28, n. 4, p. 1405-1417, 2018. https://doi.org/10.5902/1980509835049 CHAER, G.; FERNANDES, M.; MYROLD, D.; BOTTOMLEY, P. Comparative resistance and resilience of soil microbial communities and enzyme activities in adjacent native forest and
agricultural soils. Microbial ecology, v. 58, n. 2, p. 414-424, 2009 https://doi.org/10.1007/s00248-009-9508-x CRUZ, C. D.; REGAZZI, A. J. Métodos biométricos aplicados ao melhoramento genético. Viçosa: UFV, 1997. 390 p. MEDEIROS, E. V.; DUDA, G. P.; SANTOS, L. A. R.; LIMA, J. R. S.; ALMEIDA-CORTÊZ, J. S.; HAMMECKER, C.; LARDY, L.; COURNAC, L. Soil organic carbon, microbial biomass and enzyme activities responses to natural regeneration in a tropical dry region in Northeast Brazil. Catena, v. 151, p. 137-146, 2017. https://doi.org/10.1016/j.catena.2016.12.012 EMBRAPA. Sistema Brasileiro de Classificação de Solo. Rio de Janeiro: CNPS, 1999. 412 p. ERNAKOVICH, J. G.; WALLENSTEIN, M. D.; CALDERÓN, F. J. Chemical indicators of cryoturbation and microbial processing throughout an Alaskan permafrost soil depth profile. Soil Science Society of America Journal, v. 79, n. 3, p. 783-793, 2015. https://doi.org/10.2136/sssaj2014.10.0420 FERREIRA, A. S.; CAMARGO, F. A. O.; VIDOR, C. Utilização de microondas na avaliação da biomassa microbiana do solo. Revista Brasileira de Ciência do solo, v. 23, n. 4, p. 991-996, 1999. https://doi.org/10.1590/S0100-06831999000400026 FRIGHETTO, R. T. S.; VALARINI, P. J. Coords. Indicadores biológicos e bioquímicos da qualidade do solo: manual técnico. Jaguariúna: Embrapa Meio Ambiente, 2000. 198 p. (Embrapa Meio Ambiente. Documentos, 21). GARCÍA-ORENES, F.; GARCÍA-ORENESA, F.; GUERRERO, C.; ROLDÁN, A.; MATAIX-SOLERA, J.; CERDÀ, A.; CAMPOY, M.; ZORNOZA, R.; BÁRCENA, G.; CARAVACA, F. Soil microbial biomass and activity under different agricultural management systems in a semiarid Mediterranean agroecosystem. Soil and Tillage Research, v. 109, n. 2, p. 110-115, 2010. https://doi.org/10.1016/j.still.2010.05.005 GARCÍA-ORENES, F.; MORUGÁN-CORONADO, A.; ZORNOZA, R.; SCOW, K. Changes in soil microbial community structure influenced by agricultural

68
Colloquium Agrariae, v. 17, n.3, Mai-Jun, 2021, p. 59-69
management practices in a Mediterranean agro-ecosystem. PloS one, v. 8, n. 11, p. e80522, 2013. https://doi.org/10.1371/journal.pone.0080522 GIANFREDA, L.; RUGGIERO, P. Enzyme activities in soil. In: Nucleic acids and proteins in soil. Springer, Berlin, Heidelberg, 2006. p. 257-311. https://doi.org/10.1007/3-540-29449-X_12 GONÇALVES, S. L.; FRANCHINI, J. C. Integração lavoura-pecuária. Londrina: Embrapa Soja, 2007. JENKINSON, D. S.; POWLSON, D. S. The effects of biocidal treatments on metabolism in soil—V: A method for measuring soil biomass. Soil biology and Biochemistry, v. 8, n. 3, p. 209-213, 1976. https://doi.org/10.1016/0038-0717(76)90005-5 JUHOS, K.; CZIGÁNY, S.; MADARÁSZ, B.; LADÁNYI, M. Interpretation of soil quality indicators for land suitability assessment–A multivariate approach for Central European arable soils. Ecological Indicators, v. 99, p. 261-272, 2019. https://doi.org/10.1016/j.ecolind.2018.11.063 LOURENZANI, W. L.; CALDAS, M. M. Land use change from the sugar cane expansion in the western region of São Paulo state, Brazil. Ciência Rural, v. 44, n. 11, p. 1980-1987, 2014. https://doi.org/10.1590/0103-8478cr20140186 MARTINS, A. F.; SALCEDO, I. H.; OLIVEIRA, F. P. Physical, Chemical, and Microbiological Properties of Soil under Different Plant Covers in the Seridó Desertification Region in the Brazilian Semiarid. Rev. Bras. Ciênc. Solo, v. 43, 2019. https://doi.org/10.1590/18069657rbcs20180162 MEENA, V. S.; MONDAL, T.; PANDEY, B. M.; MUKHERJEE, A.; YADAV, R. P.; CHOUDHARY, M. Land use changes: strategies to improve soil carbon and nitrogen storage pattern in the mid-Himalaya ecosystem, India. Geoderma, v. 321, p. 69-78, 2018. https://doi.org/10.1016/j.geoderma.2018.02.002 MENDES, L. W.; TSAI, S. M.; NAVARRETE, A. A.; HOLLANDER, M.; VEEN, J. A. V.; KURAMAE, E. E. Soil-borne microbiome: linking diversity to function. Microbial ecology, v. 70, n. 1, p. 255-265, 2015. https://doi.org/10.1007/s00248-014-0559-2
MONCADA, P. M.; GABRIELS, D.; CORNELIS, W.; LOBO, D. Comparing aggregate stability tests for soil physical quality indicators. Land degradation & development, v. 26, n. 8, p. 843-852, 2015. https://doi.org/10.1002/ldr.2225 MORALES-LONDOÑO, D. M.; MEYER, E.; KUNZE, A.; GONZALEZ, D.; PRIETO-BENAVIDES, O. O.; ARMAS, R. D.; REIS, M. S.; SOARES, C. R. F. S.; LOVATO, P. Are microbial activity and arbuscular mycorrhizal fungal community influenced by regeneration stages? A case study in Southern Brazil coastal Atlantic Rain Forest. Applied Soil Ecology, v. 138, p. 94-98, 2019. https://doi.org/10.1016/j.apsoil.2019.02.028 MOREIRA, F. M. de S.; SIQUEIRA, J. O. M. Microbiologia e química do solo. 2. ed. Lavras: Editora UFLA, 2006. MORUGÁN-CORONADO, A.; GARCÍA-ORENES, F.; MCMILLAN, M.; PEREG, L. The effect of moisture on soil microbial properties and nitrogen cyclers in Mediterranean sweet orange orchards under organic and inorganic fertilization. Science of The Total Environment, v. 655, p. 158-167, 2019. https://doi.org/10.1016/j.scitotenv.2018.11.174 MUKHERJEE, A.; LAL, R. Comparison of soil quality index using three methods. PloS One, v. 9, n. 8, p. e105981, 2014. https://doi.org/10.1371/journal.pone.0105981 NABIOLLAHI, K.; TAGHIZADEH-MEHRJARDI, R.; KERRY, R.; MORADIAN, S. Assessment of soil quality indices for salt-affected agricultural land in Kurdistan Province, Iran. Ecological indicators, v. 83, p. 482-494, 2017. https://doi.org/10.1016/j.ecolind.2017.08.001 NAVAS, M.; BENITO, M.; RODRÍGUEZ, I.; MASAGUER, A. Effect of five forage legume covers on soil quality at the Eastern plains of Venezuela. Applied soil ecology, v. 49, p. 242-249, 2011. https://doi.org/10.1016/j.apsoil.2011.04.017 PANDEY, B.; MUKHERJEE, A.; AGRAWAL, M.; SINGH, S. Assessment of seasonal and site-specific variations in soil physical, chemical and biological properties around opencast coal mines. Pedosphere, v. 29, n. 5, p. 642-655, 2019. https://doi.org/10.1016/S1002-0160(17)60431-4

69
Colloquium Agrariae, v. 17, n.3, Mai-Jun, 2021, p. 59-69
PAVANELLI, L. E.; ARAÚJO, F. F. Parâmetros químicos e biológicos indicadores de qualidade de solo sob cultivo de braquiárias e soja no oeste paulista. Ceres, v. 57, n. 1, 2015. https://doi.org/10.1590/S0034-737X2010000100019 PAZ‐FERREIRO, J.; TRASAR‐CEPEDA, C.; LEIRÓS, M. C.; SEOANE, S.; GIL‐SOTRES, F. Biochemical properties of acid soils under native grassland in a temperate humid zone. New Zealand Journal of Agricultural Research, v. 50, n. 4, p. 537-548, 2007. https://doi.org/10.1080/00288230709510321 PAZ‐FERREIRO, J., FU, S. Biological indices for soil quality evaluation: perspectives and limitations. Land Degradation & Development, v. 27, n. 1, p. 14-25, 2016. https://doi.org/10.1002/ldr.2262 RINOT, O.; LEVY G.; STEINBERGER, Y.; ESHEL, G. Soil health assessment: A critical review of current methodologies and a proposed new approach. Science of the Total Environment, v. 648, p. 1484-1491, 2019. https://doi.org/10.1016/j.scitotenv.2018.08.259 ROLIM, G. S.; CAMARGO, M. B. P.; LANIA, D. G.; MORAES, J. F. L. Classificação climática de Köppen e de Thornthwaite e sua aplicabilidade na determinação de zonas agroclimáticas para o estado de São Paulo. Bragantia, v. 66, n. 4, p. 711-720, 2007. https://doi.org/10.1590/S0006-87052007000400022 SILVA, A.; OBEDE O.; OLIVEIRA-LONGATTI, S. M.; CAPUTO, C. P. S.; RUFINI, M.; CARVALHO, G. R.; CARVALHO, T. S.; MOREIRA, S. F. M. Microbiological indicators of soil quality are related to greater coffee yield in the Brazilian Cerrado region. Ecological Indicators, v. 113, p. 106-205, 2020. https://doi.org/10.1016/j.ecolind.2020.106205 SILVA, T. C. C. B.; FARIAS, F. J.; MENEZES, B. F.; DANTAS, J. O.; PERIN, L. População microbiana do solo em sistema agroecológico de produção. Cadernos de Agroecologia, v. 13, n. 1, 2018. SILVA, C. F.; PEREIRA, M. G.; MIGUEL, D. L.; FEITORA, J. C. F.; LOSS, A.; MENEZES, C. E. G.; SILVA, E. M. R. Carbono orgânico total, biomassa microbiana e atividade enzimática do solo de áreas agrícolas, florestais e pastagem no médio
Vale do Paraíba do Sul (RJ). Revista Brasileira de Ciência do Solo, v. 36, n. 6, p. 1680-1689, 2012. https://doi.org/10.1590/S0100-06832012000600002 JÚNIOR, A. C. S.; PEREIRA, M. R. R.; MARTINS, D. Evaluating percolation of the herbicide S-metolachlor with bioindicator plants. Revista de Ciências Agrárias Amazonian Journal of Agricultural and Environmental Sciences, v. 58, n. 1, p. 36-44, 2015. https://doi.org/10.4322/rca.1719 VILČEK, J.; KOCO, Š. Integrated index of agricultural soil quality in Slovakia. Journal of maps, v. 14, n. 2, p. 68-76, 2018. https://doi.org/10.1080/17445647.2018.1428233 VOGEL, H.; BARTKE, S.; DAEDLOW, K.; HELMING, K.; KÖGEL-KNABNER, I.; LANG, B.; RABOT, E.; RUSSELL, D.; STÖSSEL, B.; WELLER, U.; WIESMEIER, M.; WOLLSCHLÄGER, U. A systemic approach for modeling soil functions. Soil, v. 4, n. 1, p. 83-92, 2018. https://doi.org/10.5194/soil-4-83-2018 XIAO, L.; YUAN, G.; FENG, L.; BI, D.; WEI, J.; SHEN, G.; LIU, Z. Coupled effects of biochar use and farming practice on physical properties of a salt-affected soil with wheat–maize rotation. Journal of Soils and Sediments, v. 20, n. 8, p. 3053-3061, 2020. https://doi.org/10.1007/s11368-020-02616-0