Indicators for a Circular Economy
42
ce-centre.be Indicators for a Circular Economy Vercalsteren An (VITO) Christis Maarten (VITO) Van Hoof Veronique (VITO) CIRCULAR ECONOMY POLICY RESEARCH CENTRE SUMMA OVAM WE MAKE TOMORROW BEAUTIFUL DEPARTMENT OF ECONOMY SCIENCE & INNOVATION SHORT-TERM ASSIGNMENT
-
Upload
khangminh22 -
Category
Documents
-
view
0 -
download
0
Transcript of Indicators for a Circular Economy

ce-centre.be
Indicators for a Circular EconomyVercalsteren An (VITO)Christis Maarten (VITO)Van Hoof Veronique (VITO)
CIRCULAR ECONOMYPOLICY RESEARCHCENTRE
SUMMA
OVAMWE MAKE
TOMORROWB E AUT I FUL
DEPARTMENT OFECONOMYSCIENCE &INNOVATION
SHORT-TERM ASSIGNMENT

2
Summary Material related indicators are central in this study, however we want to stress the fact that a clear link to other indicators related to climate, water, etc. needs to be taken into account when monitoring the transition to a circular economy.
This short term assignment aims to make an inventory of indicators that are relevant to monitor the transition to a circular economy and to measure effects of new policy and trends. The inventory of indicators is based on scoreboards and monitoring frameworks developed by the EU and reports by JRC and EEA. This list is supplemented with indicators known by the authors and a literature search. This is a first step towards the development of a circular economy index which is one of the objectives of SUMMA. The scope of indicators varies largely, e.g. material flow indicators can focus on global figures, but also on a specific substance content in a component. In this study we distinct between macro, meso and micro level indicators. An extensive list of indicators discussed in literature and related to the circular economy is developed, of which a selection is discussed more in detail in fact sheets. The fact sheets report different aspects of the indicator: definition and scope, data availability, level of detail, future developments, links to circular economy and the availability of a benchmark (policy targets, …). Indicators related to the circular economy can be classified according to different criteria. To have a visual overview of some important characteristics of the indicators assessed in this study, they are classified on 3 axes that represent different criteria:
1. Micro, meso, macro level 2. CE strategies 3. Technology versus socio institutional
The study shows that lack of data (from macro to micro) and time and effort constraints (from micro to macro) are key barriers to link indicators on a macro/meso level on the one hand with indicators on a micro level on the other hand. Another observation is that existing indicators focus primarily on physical parameters, like kilograms, that are more technology-related. Indicators focussing on socio-institutional aspects (e.g. collection systems) are less well-defined and less frequently included in monitoring frameworks. The same applies for high-level circularity strategies. Very few indicators capture the effect of strategies that relate to smarter product use & manufacture and extending the life span of products. A transition to a circular economy may not be looked at from a material perspective only, but should include also other environmental impacts such as climate change. Indicators monitoring environmental impacts exist already and can easily be combined and integrated in a set of indicators for monitoring the circular economy. With respect to future monitoring of developments of circularity indicators, several initiatives are ongoing on a European level to define a set of indicators that are useful for monitoring the circular economy, based on existing indicators. In parallel, researchers are working on the definition and methodology development of additional indicators that focus on specific

3
circular economy aspects that are not yet captured by existing indicators, like reuse and remanufacturing strategies.
4
Table of Contents Summary ...................................................................................................................................... 2
Table of Contents ......................................................................................................................... 4
Chapter 1: Introduction ................................................................................................................ 5
Chapter 2: Definitions .................................................................................................................. 6
2.1 Indicators on the macro, meso and micro level ............................................................ 6
2.2 How to measure an indicator? ...................................................................................... 7
2.3 Include or exclude energy resources ............................................................................. 7
2.4 Measuring GHG-emissions in a CE ................................................................................. 8
Chapter 3: Factsheets ................................................................................................................. 10
3.1 Introduction ................................................................................................................. 10
3.2 Factsheets .................................................................................................................... 12
3.3 Visual categorization of indicators .............................................................................. 31
Chapter 4: Conclusions ............................................................................................................... 33
References .................................................................................................................................. 35
Annex 1: Longlist indicators of a circular economy
5
Chapter 1: Introduction This short term assignment aims to make an inventory of indicators that are relevant to monitor the transition to a circular economy and to measure effects of new policy and trends. The inventory of indicators is based on scoreboards and monitoring frameworks developed by the EU and reports by JRC and EEA. This list is supplemented with indicators known by the authors and a literature search. This is a first step towards the development of a circular economy index which is one of the objectives of SUMMA. This study encompasses a literature review focussing on indicators included in frameworks that allow monitoring of circular economy, by looking a.o. for:
Indicators that can be used directly for measuring aspects of CE; Indicators that have no direct link with CE, but are indirectly related to/affected by CE; Indicators useable or deductible for Flanders.
The inventory considers WHAT is measured by an indicator as well as HOW it is measured. Both frameworks and indicators that are currently available and being developed are included. This inventory will serve as a source of information to identify gaps for measuring CE and ways/indicators to fill these gaps. The selection of indicators for a more in-depth investigation in this report has been based on expert judgement, given the limited time frame for the overall assignment. Material related indicators are central in this study, however we want to stress the fact that a clear link to other indicators related to climate, water, etc. needs to be taken into account when monitoring the transition to a circular economy. Chapter 2 in this report discusses some definitions and other generic issues related to indicators in the context of circular economy. Chapter 3 gives the overview of the indicators considered relevant and includes fact sheets with information for each indicator. Finally some conclusions are formulated regarding the availability and relevance of indicators for a circular economy.
6
Chapter 2: Definitions and context In this chapter some definitions and other generic issues related to indicators in the context of circular economy will be discussed. These elements will feed into the strategic choices to be made for the future development of the CE monitor by SuMMa+.
2.1 Indicators on the macro, meso and micro level
The scope of indicators can vary largely, e.g. material flow indicators can focus on global figures, but also on a specific substance content in a component. In this study we distinct between macro, meso and micro level indicators. Although there is no clear separation between these levels, possibly even an overlap, this categorisation supports the classification of indicators. The type of indicator best suited for any particular case depends on the issues of concern and the questions being addressed as methods and tools for ‘calculating’ indicators can be very divergent. (OECD, 2008) (Daniels & Moore, 2002) First, macro level indicators are useful to support decisions in areas such as economic, trade and environmental policy integration, sustainable development strategies and action plans and national waste management and resource conservation policies. At the macro level, the main emphasis is on (material) exchanges between the economy and the environment, on international trade and on material accumulations in national economies, rather than on flows within the economy. To illustrate, macroeconomic indicators describe the characteristics of a country or larger region mostly in relation to interactions with the rest of the world through trade flows. The indicator can zoom through disaggregation on, for example, a specific material category or emission. Next, meso level indicators enable a more differentiated tracking of information and a more detailed analysis of material flows within the economy, distinguishing not only categories of materials, but also industries or branches of production and categories of consumption. These meso level indicators focus on the industry, consumption activity or particular material level helping to detect waste of materials, pollution sources and opportunities for efficiency gains in specific sectors or consumption domains. To illustrate, mesoeconomic indicators describe the economic, environmental or social performance of a region, a product group or an industry. The indicator can zoom through disaggregation on, for example, a specific material category or emission. Finally, micro level indicators provide detailed information for specific decision processes at business or local level or concerning specific substance or individual products. Micro level
7
indicators support the implementation of policies and decisions in areas such as product policies, energy efficiency, and integrated waste management. To illustrate, microeconomic indicators describe the economic, environmental or social performance of a city, product or company. The indicator can zoom through disaggregation on, for example, a specific material category or emission.
2.2 How to measure an indicator? Apart from the quantitative estimation of the indicator value, several options exist to relate this value to. Not all of them are valid with every indicator. The indicator value can be related to:
Economic output: for example GDP (nation, region) and value added (sector, product) providing information about the productivity (GDP in numerator) or intensity (GDP in denominator) of the economy or economic activity sector.
Capita figures: relating the indicator value to an inhabitant or a household. Per capita figures allow the comparison between cities, regions or countries, avoiding the issue of country size and population.
Input indicators: input indicators (e.g. domestic material input, raw material input) describe the materials mobilised or used for sustaining economic activities, including the production of products for export. They are closely related to the mode of production in a particular country or region and are sensitive to changes in the level and patterns of foreign trade and to other factors such as a country's endowment in natural resources and its level of technology development.
Output indicators: output indicators (e.g. domestic processed output) describe the material outflows related to production and consumption activities of a given country. They account for those materials that have been used in the economy and are subsequently leaving it either in the form of emissions and waste, or in the form of exports.
Consumption indicators: consumption indicators (e.g. raw material consumption, domestic material consumption) describe the materials consumed by economic activities. They are closely related to the mode of consumption but are fairly stable over time. The difference between consumption and input indicators is an indication of the degree of integration of an economy (i.e. the bigger the difference, the larger the global economic integration due to export) with the global economy, which also depends on the size (geographical and population) of the economy.
Most common are indicators related to economic output and capita figures, which enable the comparison (at least on a comparable basis) between f.e. countries. Indicators related to the economic output are often referred to as efficiency and productivity indicators (GDP in numerator) or intensity indicators (GDP in denominator).
2.3 Include or exclude energy resources The general classification of raw materials includes biomass, non-metallic minerals, metals and fossil energy carriers. This classification is extended with two categories, ‘other products’ and ‘waste imported for final treatment and disposal’, to cope with the heterogeneity of
8
products. These additional material groups are mainly used to describe trade flows. Although products are composed of different materials, in this classification they are assigned to their main component or material. Only if this is impossible (e.g. with product categories like watches, binoculars), they are assigned to the ‘other products’ category. This general classification allows to distinct between energy resources and non-energy resources. The energy resources depict all resources used for energetic content. They consist out of a part of (approx. 80%) the biomass category (food, biogas, etc.) and a part of (approx. 96%) the fossil energy carriers category (excluding those for e.g. plastic manufacturing). This is an interesting distinction in the context of CE, as energy resources are after use lost for any CE-strategy, while their increased or decreased use could unnecessarily distort indicator trends. Also, in the context of CE, a better match is obtained between indicator value and the CE-impact. However, the (specific) methodology behind the exclusion of energy resources disturbs the comparability with other regions, as a difference in methodology hampers comparisons.
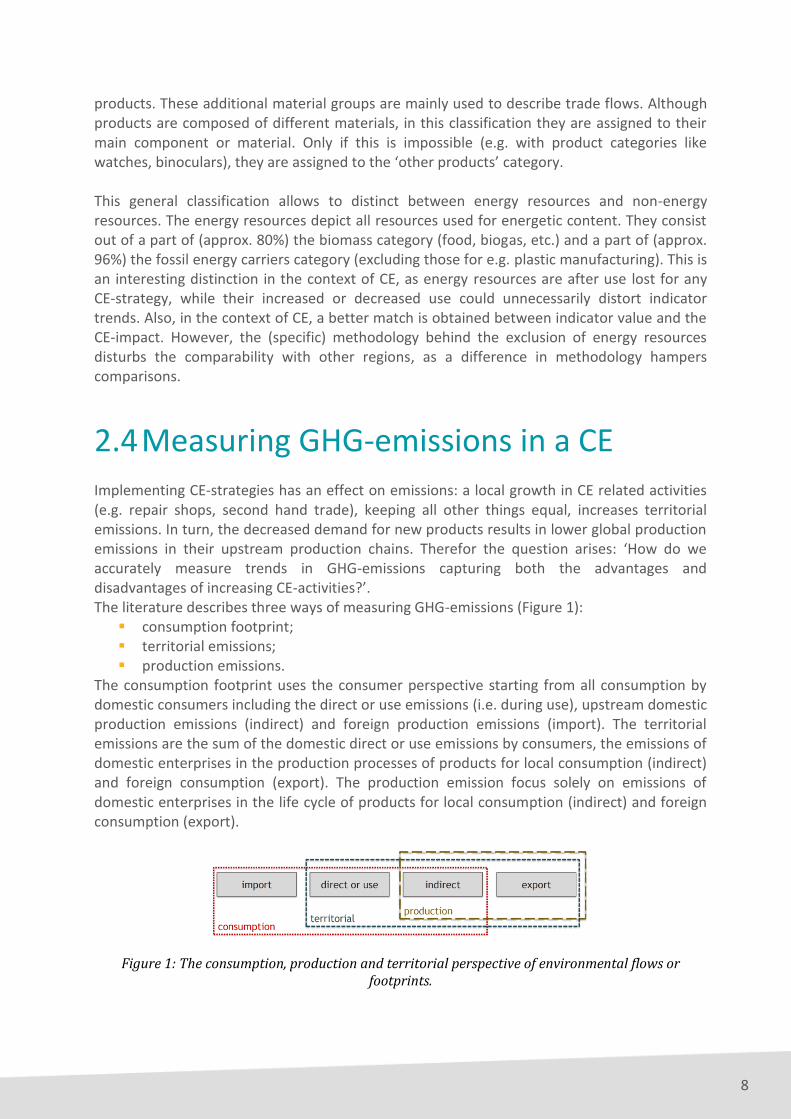
2.4 Measuring GHG-emissions in a CE Implementing CE-strategies has an effect on emissions: a local growth in CE related activities (e.g. repair shops, second hand trade), keeping all other things equal, increases territorial emissions. In turn, the decreased demand for new products results in lower global production emissions in their upstream production chains. Therefor the question arises: ‘How do we accurately measure trends in GHG-emissions capturing both the advantages and disadvantages of increasing CE-activities?’. The literature describes three ways of measuring GHG-emissions (Figure 1):
consumption footprint; territorial emissions; production emissions.
The consumption footprint uses the consumer perspective starting from all consumption by domestic consumers including the direct or use emissions (i.e. during use), upstream domestic production emissions (indirect) and foreign production emissions (import). The territorial emissions are the sum of the domestic direct or use emissions by consumers, the emissions of domestic enterprises in the production processes of products for local consumption (indirect) and foreign consumption (export). The production emission focus solely on emissions of domestic enterprises in the life cycle of products for local consumption (indirect) and foreign consumption (export).
Figure 1: The consumption, production and territorial perspective of environmental flows or footprints.
9
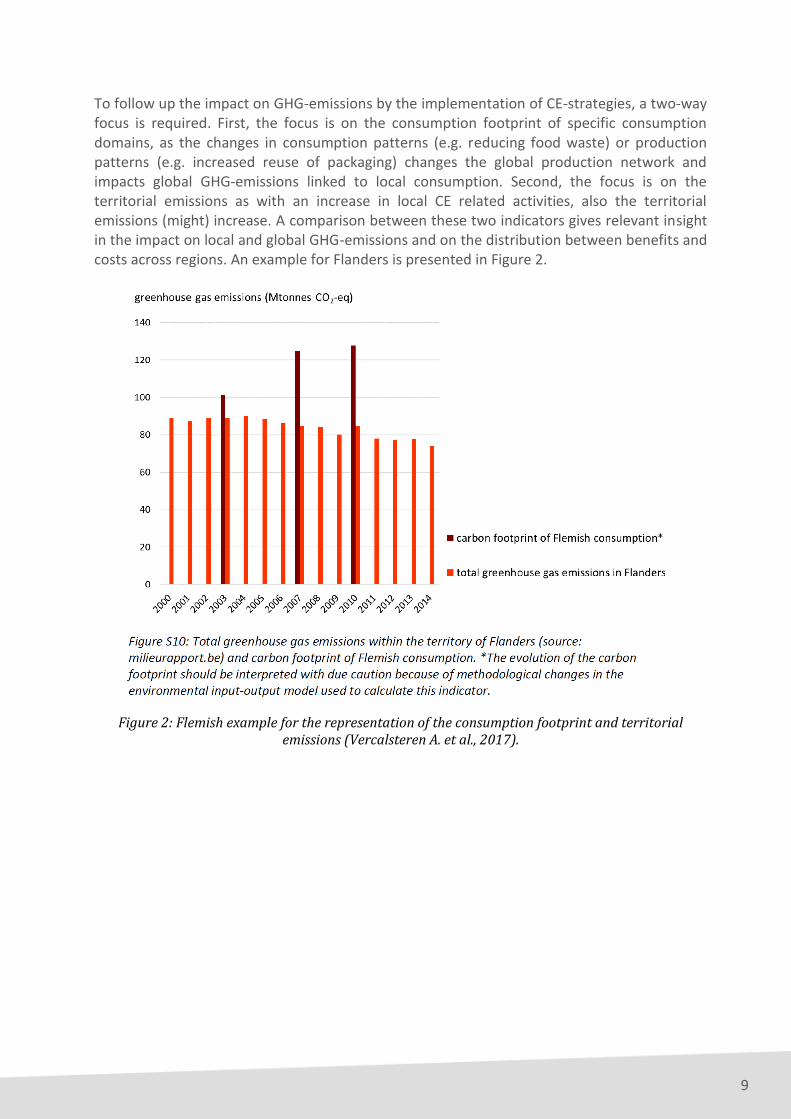
To follow up the impact on GHG-emissions by the implementation of CE-strategies, a two-way focus is required. First, the focus is on the consumption footprint of specific consumption domains, as the changes in consumption patterns (e.g. reducing food waste) or production patterns (e.g. increased reuse of packaging) changes the global production network and impacts global GHG-emissions linked to local consumption. Second, the focus is on the territorial emissions as with an increase in local CE related activities, also the territorial emissions (might) increase. A comparison between these two indicators gives relevant insight in the impact on local and global GHG-emissions and on the distribution between benefits and costs across regions. An example for Flanders is presented in Figure 2.
Figure 2: Flemish example for the representation of the consumption footprint and territorial emissions (Vercalsteren A. et al., 2017).
10
Chapter 3: Factsheets 3.1 Introduction The study focusses on inventorying all indicators relevant for monitoring the CE. An extensive list of indicators discussed in literature and related to the circular economy is included in Annex 1. A selection of 17 indicators is discussed more in detail in a fact sheet. The fact sheet reports different aspects of the indicator: definition and scope, data availability, level of detail, future developments, links to circular economy and the availability of a benchmark (policy targets, …). Some indicators included in annex 1 are not ‘measurable’ but refer to aspects that relate more to socio-institutional aspects (e.g. governance and infrastructure), like:
The degree to which collection, repair, reuse and recycling infrastructure is in place. Degree to which economic incentives, legislation or comparable rules are in place and
enforced regarding product standards, standards for reused or recycled products/raw materials, waste management, better materials management
Degree to which business is involved in managing material cycles in a circular way and is empowered to make the right decisions, either on an obligatory or voluntary basis
Degree to which circular business models are adopted Degree to which citizens are involved in managing material cycles in a circular way and
are empowered to make the right decisions Degree to which systems are in place for making more efficient use of resources, such
as arrangements for sharing products or repairing and reusing them, exchange of information on availability of reusable or recyclable materials (for instance for enhancing industrial symbiosis)
Degree of information, education and awareness about circular economy (integration into school and university curricula, public communication and information campaigns)
Degree to which there are voluntary collaboration schemes in place encouraging value chain and cross-sectoral initiatives and information sharing;
The integration of circular aspects in public procurement schemes Product standards related to the defined circular strategies
Ideally all indicators are structured in a framework according to selected parameters. Without attempting to develop such a framework, the table below categorizes all selected indicators according to 3 criteria:
Is the indicator included in an internationally accepted framework, and is the methodology accepted and available?
Is the indicator related to the micro, meso or macrolevel? Are there linkages to related indicators on another level?
Is the indicator available for Flanders?
11
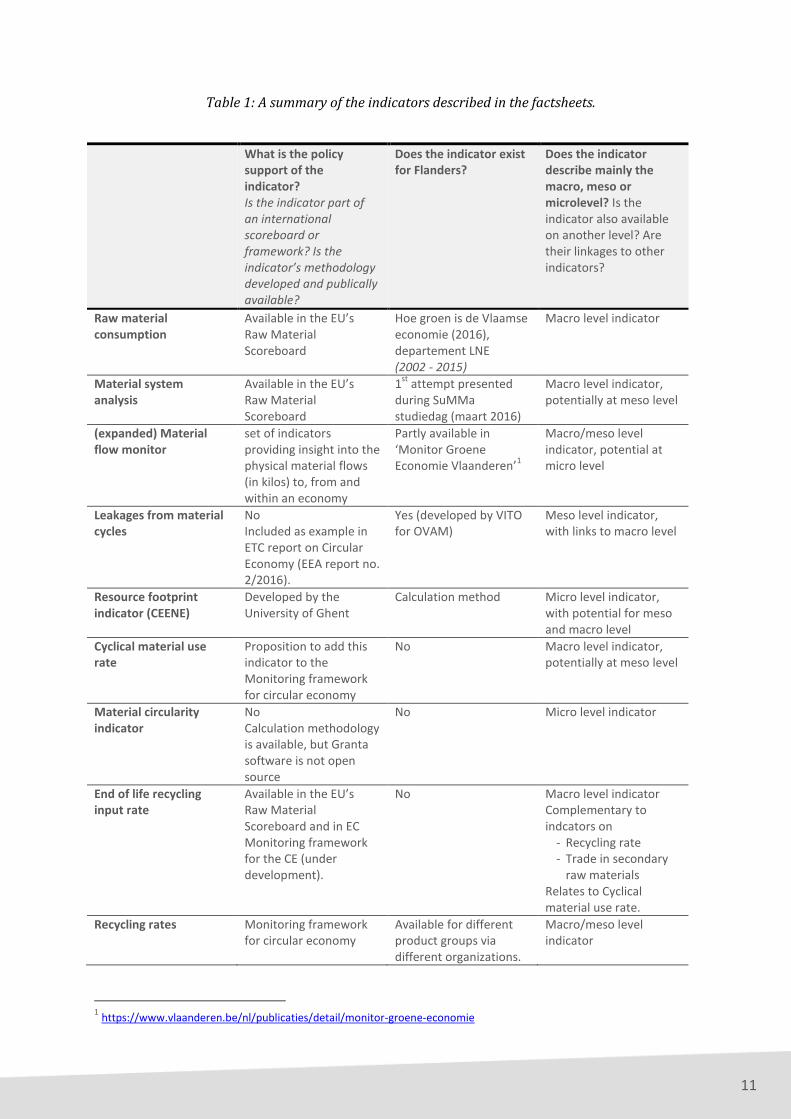
Table 1: A summary of the indicators described in the factsheets.
What is the policy support of the indicator? Is the indicator part of an international scoreboard or framework? Is the indicator’s methodology developed and publically available?
Does the indicator exist for Flanders?
Does the indicator describe mainly the macro, meso or microlevel? Is the indicator also available on another level? Are their linkages to other indicators?
Raw material consumption
Available in the EU’s Raw Material Scoreboard
Hoe groen is de Vlaamse economie (2016), departement LNE (2002 - 2015)
Macro level indicator
Material system analysis
Available in the EU’s Raw Material Scoreboard
1st
attempt presented during SuMMa studiedag (maart 2016)
Macro level indicator, potentially at meso level
(expanded) Material flow monitor
set of indicators providing insight into the physical material flows (in kilos) to, from and within an economy
Partly available in ‘Monitor Groene Economie Vlaanderen’
1
Macro/meso level indicator, potential at micro level
Leakages from material cycles
No Included as example in ETC report on Circular Economy (EEA report no. 2/2016).
Yes (developed by VITO for OVAM)
Meso level indicator, with links to macro level
Resource footprint indicator (CEENE)
Developed by the University of Ghent
Calculation method Micro level indicator, with potential for meso and macro level
Cyclical material use rate
Proposition to add this indicator to the Monitoring framework for circular economy
No Macro level indicator, potentially at meso level
Material circularity indicator
No Calculation methodology is available, but Granta software is not open source
No Micro level indicator
End of life recycling input rate
Available in the EU’s Raw Material Scoreboard and in EC Monitoring framework for the CE (under development).
No Macro level indicator Complementary to indcators on
- Recycling rate - Trade in secondary
raw materials Relates to Cyclical material use rate.
Recycling rates Monitoring framework for circular economy
Available for different product groups via different organizations.
Macro/meso level indicator
1 https://www.vlaanderen.be/nl/publicaties/detail/monitor-groene-economie

12
List of relevant websites available online
2
Recyclability benefit rate
European Commission (JRC) is working on new indicators that assess the benefits of recycling or energy recovery versus landfilling
No Micro level indicator
Energy recoverability benefit rate
No Micro level indicator
Trade in secondary raw materials
Available in the EU’s Raw Material Scoreboard
No Macro/meso level indicator
Waste generation Monitoring framework for circular economy
Available on OVAM website
3
Macro/meso level indicator, potential at micro level
WEEE management Available in the EU’s Raw Material scoreboard
Yes, available on website OVAM
3, Recupel
4, …
Meso level indicator Applicable to other product category flows.
Basket of products Not included in a scoreboard, but currently developed by JRC for the EC
No Combination of micro level life cycle data for products and services and macro level consumption data.
Product environmental footprint
Under pilot testing by EC No Micro level indicator
Private investments, jobs and GVA
Raw materials scoreboard 2016
No Meso level indicators
Others: recycled content, recyclability or repairability
No Methodologies under development
No Mostly micro level indicators
3.2 Factsheets
2 https://www.belgium.be/nl/leefmilieu/duurzaam_consumeren/afval/recycleren
3 http://www.ovam.be/afval-materialen/bedrijfsafval/rapportering-en-consultatie-bedrijfsafval-en-materialengegevens
4 www.recupel.be
pro
con
tra
RMC - Raw Material Consumption
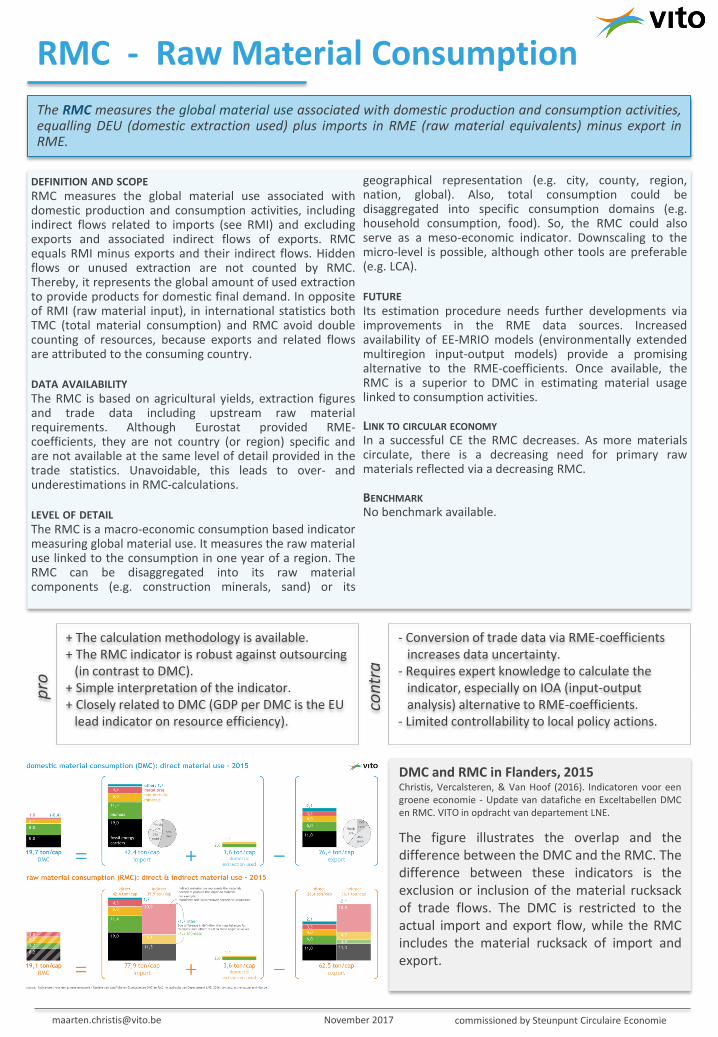
The RMC measures the global material use associated with domestic production and consumption activities, equalling DEU (domestic extraction used) plus imports in RME (raw material equivalents) minus export in RME.
November 2017 [email protected] commissioned by Steunpunt Circulaire Economie
DEFINITION AND SCOPE RMC measures the global material use associated with domestic production and consumption activities, including indirect flows related to imports (see RMI) and excluding exports and associated indirect flows of exports. RMC equals RMI minus exports and their indirect flows. Hidden flows or unused extraction are not counted by RMC. Thereby, it represents the global amount of used extraction to provide products for domestic final demand. In opposite of RMI (raw material input), in international statistics both TMC (total material consumption) and RMC avoid double counting of resources, because exports and related flows are attributed to the consuming country. DATA AVAILABILITY The RMC is based on agricultural yields, extraction figures and trade data including upstream raw material requirements. Although Eurostat provided RME-coefficients, they are not country (or region) specific and are not available at the same level of detail provided in the trade statistics. Unavoidable, this leads to over- and underestimations in RMC-calculations. LEVEL OF DETAIL The RMC is a macro-economic consumption based indicator measuring global material use. It measures the raw material use linked to the consumption in one year of a region. The RMC can be disaggregated into its raw material components (e.g. construction minerals, sand) or its
geographical representation (e.g. city, county, region, nation, global). Also, total consumption could be disaggregated into specific consumption domains (e.g. household consumption, food). So, the RMC could also serve as a meso-economic indicator. Downscaling to the micro-level is possible, although other tools are preferable (e.g. LCA). FUTURE Its estimation procedure needs further developments via improvements in the RME data sources. Increased availability of EE-MRIO models (environmentally extended multiregion input-output models) provide a promising alternative to the RME-coefficients. Once available, the RMC is a superior to DMC in estimating material usage linked to consumption activities. LINK TO CIRCULAR ECONOMY In a successful CE the RMC decreases. As more materials circulate, there is a decreasing need for primary raw materials reflected via a decreasing RMC. BENCHMARK No benchmark available.
DMC and RMC in Flanders, 2015 Christis, Vercalsteren, & Van Hoof (2016). Indicatoren voor een groene economie - Update van datafiche en Exceltabellen DMC en RMC. VITO in opdracht van departement LNE.
The figure illustrates the overlap and the difference between the DMC and the RMC. The difference between these indicators is the exclusion or inclusion of the material rucksack of trade flows. The DMC is restricted to the actual import and export flow, while the RMC includes the material rucksack of import and export.
- Conversion of trade data via RME-coefficients increases data uncertainty.
- Requires expert knowledge to calculate the indicator, especially on IOA (input-output analysis) alternative to RME-coefficients.
- Limited controllability to local policy actions.
+ The calculation methodology is available. + The RMC indicator is robust against outsourcing
(in contrast to DMC). + Simple interpretation of the indicator. + Closely related to DMC (GDP per DMC is the EU
lead indicator on resource efficiency).

pro
con
tra
MSA – Material System Analysis
The MSA measures bulk material flows in a circular economy. It is a socio-metabolic approach to assess the circularity of global material flows.
November 2017 [email protected] commissioned by Steunpunt Circulaire Economie
DEFINITION AND SCOPE A MSA measures the quantity of input and output of the socio-economic system. The input flows (import and domestic extraction) are broken down by material category. The output flows (domestic processed output) detail waste and emissions. The MSA framework has the ability to distinct between flows for energetic use and for material use. Recycling (and backfilling flows) from the waste stream from material use is accounted as a reverse flow. It is an input to the materials input processed category.
DATA AVAILABILITY A combination of data sources including economy-wide material flow analysis (EW-MFA) and EU waste statistics are used to generate a Sankey diagram. The model relies on a variety of assumptions and datasets. However, a full dataset and detail on the methodology is not available.
LEVEL OF DETAIL The MSA is a macro-economic framework. Flows can be broken down to increase the level of detail and the use (represented via the DMC indicator) can be
narrowed to a specific consumption domain.
FUTURE Efforts should be put on the further breakdown of material categories (e.g. to see the share of precious metals in major metal imports) as well as the composition of the waste recycling flow. Another future point of attention could be on the display of in-use stocks. LINK TO CIRCULAR ECONOMY The MSA estimates the overall degree of circularity via the as the part of the recycling flow input in the materials processed (DMI). The link to CE could be improved if the DMI is reduced to its non-energy part. BENCHMARK No benchmark available.
Modelling framework of MSA JRC Technical Report, Circular Economy and Recycling (2016).
The modelling framework of MSA (by JRC) describes the main flows and data sources. The input from other economies (import) and from the own natural environment (domestic extraction) is summed to the materials processed (DMI). Subtracting export results in the domestic material consumption (DMC). The output flows thereof result in waste and emissions and the remainder is addition to stock (NAS). Waste flows can be recycled or discarded.
- not possible to track material categories across all life-cycle stages
- waste generation and treatment statistics are not directly comparable
+ relies on publicly available and regularly updated data
+ Sankey diagrams are easy interpretable visualisations
+ some material and waste flows can be disaggregated
pro
con
tra
MFM(+) - (expanded) material flow monitor
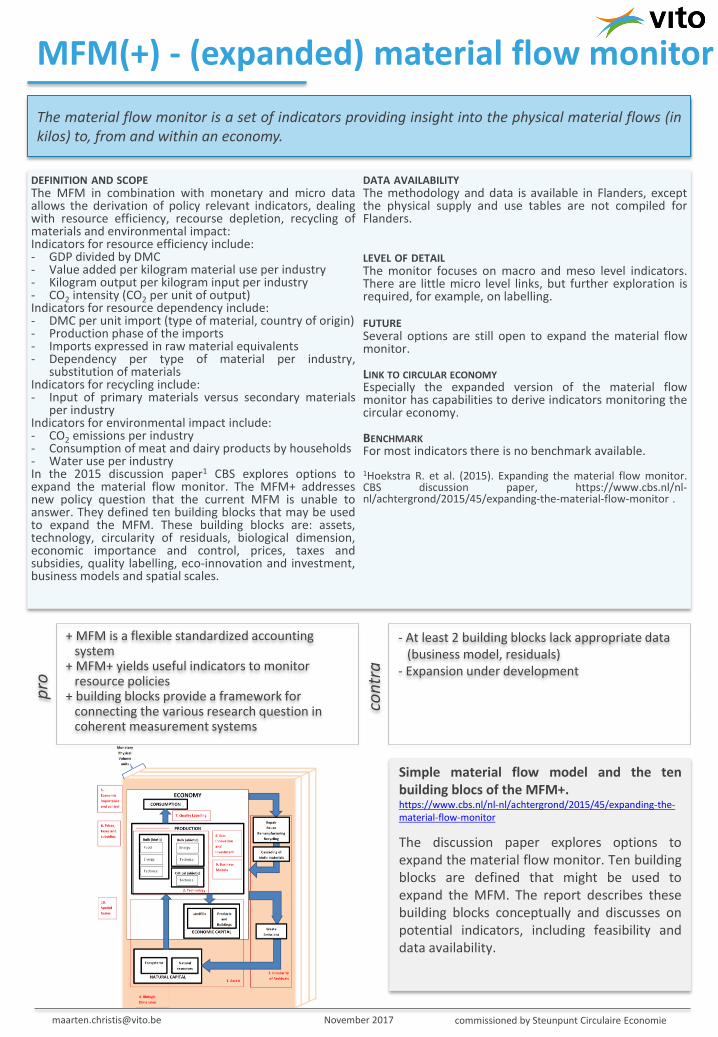
The material flow monitor is a set of indicators providing insight into the physical material flows (in kilos) to, from and within an economy.
November 2017 [email protected] commissioned by Steunpunt Circulaire Economie
DEFINITION AND SCOPE The MFM in combination with monetary and micro data allows the derivation of policy relevant indicators, dealing with resource efficiency, recourse depletion, recycling of materials and environmental impact: Indicators for resource efficiency include: - GDP divided by DMC - Value added per kilogram material use per industry - Kilogram output per kilogram input per industry - CO2 intensity (CO2 per unit of output) Indicators for resource dependency include: - DMC per unit import (type of material, country of origin) - Production phase of the imports - Imports expressed in raw material equivalents - Dependency per type of material per industry,
substitution of materials Indicators for recycling include: - Input of primary materials versus secondary materials
per industry Indicators for environmental impact include: - CO2 emissions per industry - Consumption of meat and dairy products by households - Water use per industry In the 2015 discussion paper1 CBS explores options to expand the material flow monitor. The MFM+ addresses new policy question that the current MFM is unable to answer. They defined ten building blocks that may be used to expand the MFM. These building blocks are: assets, technology, circularity of residuals, biological dimension, economic importance and control, prices, taxes and subsidies, quality labelling, eco-innovation and investment, business models and spatial scales.
DATA AVAILABILITY The methodology and data is available in Flanders, except the physical supply and use tables are not compiled for Flanders. LEVEL OF DETAIL The monitor focuses on macro and meso level indicators. There are little micro level links, but further exploration is required, for example, on labelling. FUTURE Several options are still open to expand the material flow monitor. LINK TO CIRCULAR ECONOMY Especially the expanded version of the material flow monitor has capabilities to derive indicators monitoring the circular economy. BENCHMARK For most indicators there is no benchmark available. 1Hoekstra R. et al. (2015). Expanding the material flow monitor. CBS discussion paper, https://www.cbs.nl/nl-nl/achtergrond/2015/45/expanding-the-material-flow-monitor .
Simple material flow model and the ten building blocs of the MFM+. https://www.cbs.nl/nl-nl/achtergrond/2015/45/expanding-the-material-flow-monitor
The discussion paper explores options to expand the material flow monitor. Ten building blocks are defined that might be used to expand the MFM. The report describes these building blocks conceptually and discusses on potential indicators, including feasibility and data availability.
- At least 2 building blocks lack appropriate data (business model, residuals)
- Expansion under development
+ MFM is a flexible standardized accounting system
+ MFM+ yields useful indicators to monitor resource policies
+ building blocks provide a framework for connecting the various research question in coherent measurement systems
pro
con
tra
Leakages from material cycles
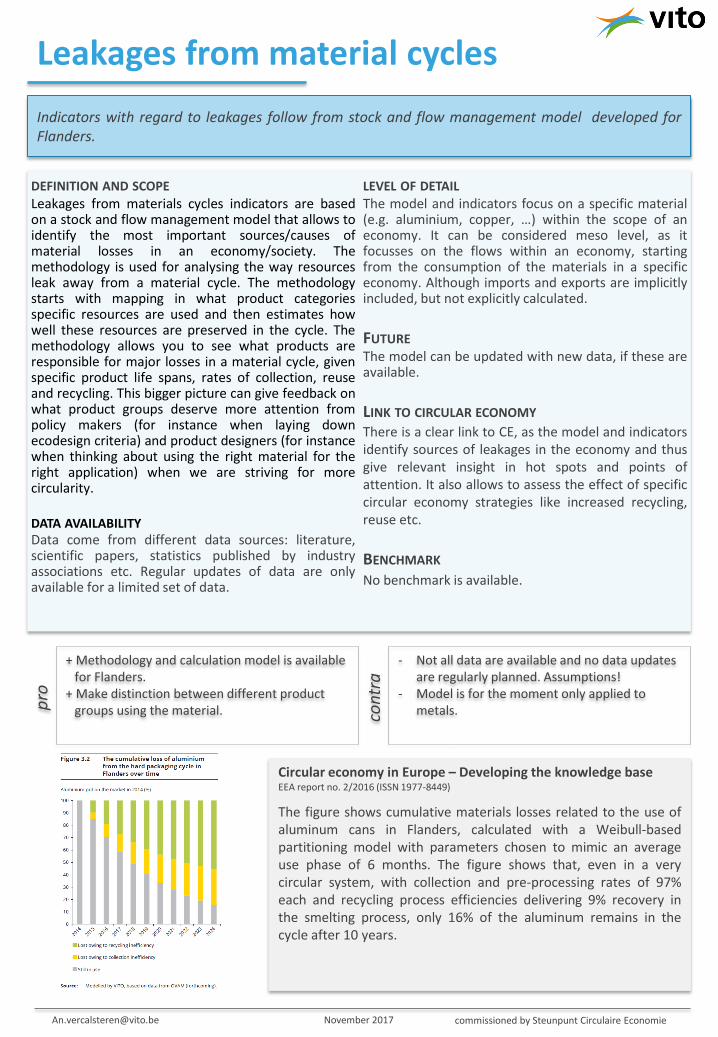
Indicators with regard to leakages follow from stock and flow management model developed for Flanders.
November 2017 [email protected] commissioned by Steunpunt Circulaire Economie
DEFINITION AND SCOPE Leakages from materials cycles indicators are based on a stock and flow management model that allows to identify the most important sources/causes of material losses in an economy/society. The methodology is used for analysing the way resources leak away from a material cycle. The methodology starts with mapping in what product categories specific resources are used and then estimates how well these resources are preserved in the cycle. The methodology allows you to see what products are responsible for major losses in a material cycle, given specific product life spans, rates of collection, reuse and recycling. This bigger picture can give feedback on what product groups deserve more attention from policy makers (for instance when laying down ecodesign criteria) and product designers (for instance when thinking about using the right material for the right application) when we are striving for more circularity. DATA AVAILABILITY Data come from different data sources: literature, scientific papers, statistics published by industry associations etc. Regular updates of data are only available for a limited set of data.
LEVEL OF DETAIL The model and indicators focus on a specific material (e.g. aluminium, copper, …) within the scope of an economy. It can be considered meso level, as it focusses on the flows within an economy, starting from the consumption of the materials in a specific economy. Although imports and exports are implicitly included, but not explicitly calculated.
FUTURE The model can be updated with new data, if these are available.
LINK TO CIRCULAR ECONOMY There is a clear link to CE, as the model and indicators identify sources of leakages in the economy and thus give relevant insight in hot spots and points of attention. It also allows to assess the effect of specific circular economy strategies like increased recycling, reuse etc.
BENCHMARK No benchmark is available.
Circular economy in Europe – Developing the knowledge base EEA report no. 2/2016 (ISSN 1977-8449)
The figure shows cumulative materials losses related to the use of aluminum cans in Flanders, calculated with a Weibull-based partitioning model with parameters chosen to mimic an average use phase of 6 months. The figure shows that, even in a very circular system, with collection and pre-processing rates of 97% each and recycling process efficiencies delivering 9% recovery in the smelting process, only 16% of the aluminum remains in the cycle after 10 years.
- Not all data are available and no data updates are regularly planned. Assumptions!
- Model is for the moment only applied to metals.
+ Methodology and calculation model is available for Flanders.
+ Make distinction between different product groups using the material.

pro
con
tra
Resource footprint indicator based on Cumulative Exergy Extracted from the Natural Environment (CEENE)
IO-CEENE allows one to calculate resource footprints for products or services consumed in different countries as the exergy extracted from nature.
November 2017 [email protected] commissioned by Steunpunt Circulaire Economie
DEFINITION AND SCOPE In CEENE, eight categories of natural resources are distinguished: fossil fuels, nuclear resources, metal ores, minerals, water resources, land resources, abiotic renewable resources, and atmospheric resources. This new framework allows one to calculate resource footprints of products or services consumed in different countries as the exergy extracted from nature. The way the framework is constructed makes it possible to show which resources and countries contribute to the total footprint. This is illustrated by a case study on wheat production. CEENE is an exergy-based method, thus it considers not only the resource quantity but also the extent to which consumption removes resource quality.
DATA AVAILABILITY CEENE extension tables are available for Ecoinvent v2 and v3 and Exiobase v.1.
LEVEL OF DETAIL Process-CEENE is based on a process LCA-model. IO-CEENE establishes geospatial differentiated resource
footprints. The IO-CEENE is a meso/macro level indicator. While process-CEENE is used to investigate systems at micro level, IO-CEENE makes it possible to easily investigate systems at meso and macro level.
FUTURE Future of IO-CEENE is depending on (methodologic) improvements of world input-output tables.
LINK TO CIRCULAR ECONOMY It is a calculation methodology.
BENCHMARK
No benchmark available.
Quantification of spatially differentiated resource footprints for products and services through a macro-economic and thermodynamic approach. Huysman S. Schaubroeck T. and Dewulf J. (2014)
Resource-contribution profiles of IO (input-output) CEENE (cumulative Exergy Extraction from the Natural Environment) results of 1 kg wheat consumption in Australia (AU), Romania (RO), and Germany (DE).
- implicit weighting increases uncertainty andreduces transparency- not widely known (exergy is not a commonmeasurement)
+ different resource uses aggregated in oneindicator+ CEENE factors are publically available
Picture not available
pro
con
tra
Cyclical material use rate
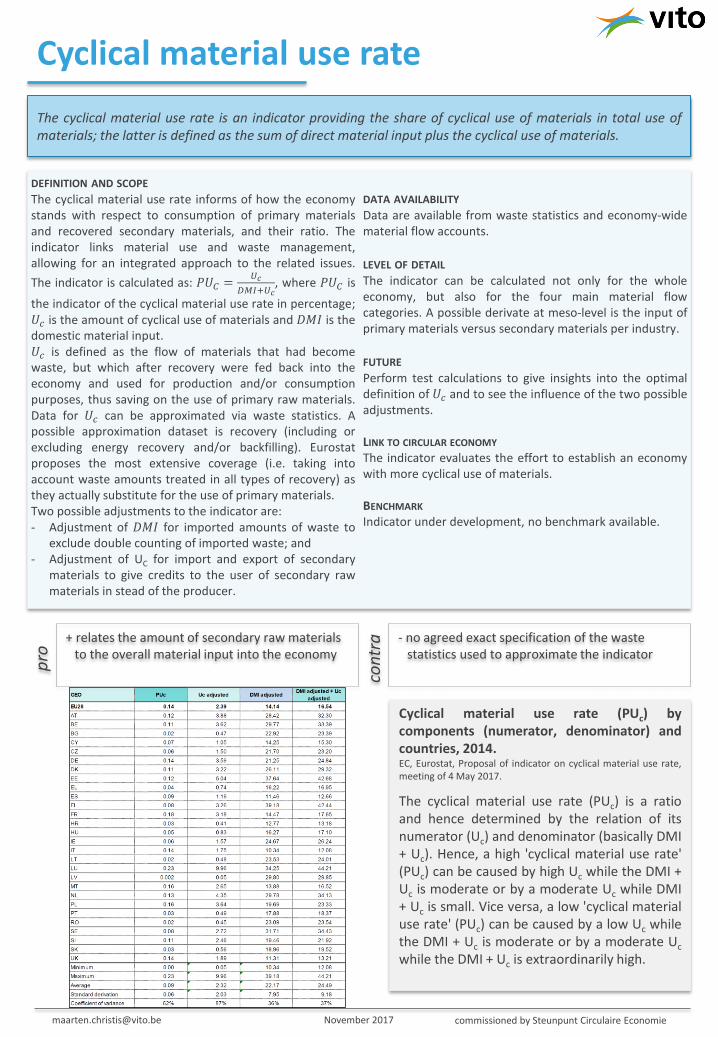
The cyclical material use rate is an indicator providing the share of cyclical use of materials in total use of materials; the latter is defined as the sum of direct material input plus the cyclical use of materials.
November 2017 [email protected] commissioned by Steunpunt Circulaire Economie
DEFINITION AND SCOPE
The cyclical material use rate informs of how the economy stands with respect to consumption of primary materials and recovered secondary materials, and their ratio. The indicator links material use and waste management, allowing for an integrated approach to the related issues.
The indicator is calculated as: 𝑃𝑈𝐶 =𝑈𝑐
𝐷𝑀𝐼+𝑈𝑐, where 𝑃𝑈𝐶 is
the indicator of the cyclical material use rate in percentage; 𝑈𝑐 is the amount of cyclical use of materials and 𝐷𝑀𝐼 is the domestic material input. 𝑈𝑐 is defined as the flow of materials that had become waste, but which after recovery were fed back into the economy and used for production and/or consumption purposes, thus saving on the use of primary raw materials. Data for 𝑈𝑐 can be approximated via waste statistics. A possible approximation dataset is recovery (including or excluding energy recovery and/or backfilling). Eurostat proposes the most extensive coverage (i.e. taking into account waste amounts treated in all types of recovery) as they actually substitute for the use of primary materials. Two possible adjustments to the indicator are: - Adjustment of 𝐷𝑀𝐼 for imported amounts of waste to
exclude double counting of imported waste; and- Adjustment of UC for import and export of secondary
materials to give credits to the user of secondary rawmaterials in stead of the producer.
DATA AVAILABILITY
Data are available from waste statistics and economy-wide material flow accounts.
LEVEL OF DETAIL
The indicator can be calculated not only for the whole economy, but also for the four main material flow categories. A possible derivate at meso-level is the input of primary materials versus secondary materials per industry.
FUTURE
Perform test calculations to give insights into the optimal definition of 𝑈𝑐 and to see the influence of the two possible adjustments.
LINK TO CIRCULAR ECONOMY The indicator evaluates the effort to establish an economy with more cyclical use of materials.
BENCHMARK Indicator under development, no benchmark available.
Cyclical material use rate (PUc) by components (numerator, denominator) and countries, 2014. EC, Eurostat, Proposal of indicator on cyclical material use rate, meeting of 4 May 2017.
The cyclical material use rate (PUc) is a ratio and hence determined by the relation of its numerator (Uc) and denominator (basically DMI + Uc). Hence, a high 'cyclical material use rate'(PUc) can be caused by high Uc while the DMI +Uc is moderate or by a moderate Uc while DMI+ Uc is small. Vice versa, a low 'cyclical materialuse rate' (PUc) can be caused by a low Uc whilethe DMI + Uc is moderate or by a moderate Uc
while the DMI + Uc is extraordinarily high.
- no agreed exact specification of the wastestatistics used to approximate the indicator
+ relates the amount of secondary raw materialsto the overall material input into the economy

pro
con
tra
MCI - Material Circularity Indicator & company level circularity metric
The MCI is a metric tool for measuring circularity that provides an index for the degree of circularity of a specific product: it has a value from 0-100. “Any product that is manufactured using only virgin feedstock and ends up in landfill at the end of its use phase can be considered a fully ‘linear’ product. On the other hand, any product that contains no virgin feedstock, is completely collected for recycling or component reuse, and where the recycling efficiency is 100% can be considered a fully ‘circular’ product.”.
November 2017 [email protected] commissioned by Steunpunt Circulaire Economie
DEFINITION AND SCOPE MCI focuses on the restoration of material flows at product (and company) levels and is based on the following four principles: i) using feedstock from reused or recycled sourcesii) reusing components or recycling materials after the use of theproductiii) keeping products in use longer (e.g. by reuse/redistribution)iv) making more intensive use of products (e.g. via service orperformance models).The methodology so far is based purely on the material present inthe final product. A more complete approach would be to alsotake the material losses that occur throughout the supply chain ofthe product into account – from raw material extraction andrefinement, through all manufacturing stages, to final assembly.While such an approach is to be encouraged, in practice it is oftenlimited by a shortage of available data. For practical reasons, it is therefore not included in the main part of the methodology.
DATA AVAILABILITY This methodology assumes access to a fair amount of internal company data.
LEVEL OF DETAIL MCI = micro (product and company) level. Further developments could also extend the technique to consider Material Circularity Indicators for major projects, such as building a railway line, as well as for geographic regions, like a city or country.
FUTURE The current methodology has focused on technical cycles and materials from non-renewable sources, as their circularity strategies and associated business benefits are better understood. An important next step would be to extend it to embrace biological cycles and materials from renewable sources, including consumables like food. This might also include a proper consideration of conversion of end-of-use materials into energy,
for example, via producing biofuels from food waste or burning wood. The methodology so far is based purely on the material present in the final product. In the future, if companies build up more knowledge about the material flows in their supply chains, it may prove possible for complete chain approaches to become incorporated in a future version of this methodology. The formula developed for the Material Circularity Indicator could be further refined, by for example: • developing a more comprehensive approach on downcycling,
taking into account the level of material quality loss in therecycling process;
• introducing more granular levels of recovery beyond recyclingand reuse, such as remanufacturing or refurbishment.
While the methodology makes allowance to consider the influence of leasing or hiring business models via improvements to the product’s utility, the product-level methodology could further be extended to cover a wide range of business models, for example, performance models and reselling via secondary markets.
LINK TO CIRCULAR ECONOMY Given the scope (micro), it is evident that improving the MCI of a product or a company will not necessarily translate as an improvement of the circularity of the whole system. Nonetheless, a widespread use of this methodology could form part of such a systems improvement.
BENCHMARK No benchmark available globally, possible for companies to benchmark their product range
Diagrammatic representation of material flows (Source: Ellen Mc Arthur and Granta, (Circularityindicators. An approach to measuring circularity. Methodology 2015).
The MCI is essentially constructed from a combination of three product characteristics: the mass V of virgin raw material used in manufacture, the mass W of unrecoverable waste that is attributed to the product, and a utility factor X that accounts for the length and intensity of the product's use. The associated material flows are summarized in Figure on the left.
- Only includes material flows, no toxicity,CO2/energy, scarcity and water
- A circularity indicator on its own is not beatific,it should be seen in the context and be usedwith complementary indicators
- Software is not open source
+ The calculation methodology is available.+ Repair and remanufacture can be included by
adapting the product lifetime and/orcomponent reuse. However, the current MCImethodology does not incorporate a moredetailed modelling of repair or remanufacturing
+ Simple interpretation of the indicator.
Picture not available

pro
con
tra
EOL-RIR (End of Life Recycling Input Rate)
The EOL-RIR is an indication for Recycling’s contribution to meeting materials demand.
November 2017 [email protected] commissioned by Steunpunt Circulaire Economie
DEFINITION AND SCOPEThe end-of-life recycling input rate measures how much of the total material input into the production system comes from recycling of post-consumer scrap. The indicator calculates the ratio of recycled material inputs (coming from the EU) to the EU economy to total material inputs in the EU economy.
The figure above (source: Monitoring framework for CE) illustrates the system boundaries for the calculation of the EOL-RIR: (G1.1+G1.2)/(B1.1+B1.2+C1.3+D1.3+C1.4+G1.1+G1.2) Only materials recycled in the EU are taken into acount.
An important reason for a low EOL-RIR is the higher demand compared to what can be met by recycling . The EOL-RR (see other fact sheet) is a complementary measure which show the efficiency of waste collection and recycling. Several materials have relatively high recycling rates, but due to growing stocks, economic feasibility of recycling and higher demand, recycling is not at all sufficient to meet the EU’s demand (low EOL-RIR).
DATA AVAILABILITY
Eurostat does not have the data needed to calculate the EOL-RIR. No official statistics are available that can be disaggregated per material. Data are taken from the CRM-study (2014, updated in 2017) and Bio by Deloitte (2015, study on data for a raw materials system analysis). The EOL-RIR is part of the methodology to make up the list of CRM to the EU, which is carried out by the Commission every 3 years.
LEVEL OF DETAIL EOL-RIR indicators are available for different materials (27 materials in Raw materials scoreboard 2016, expected to be extended to 78 raw materials in 2018 version). The indicator is calculated on material level, but from an economy perspective including links with the ROW (thus macro level).
FUTURE In the Raw materials scoreboard 2018 it is expected that 78 raw materials are included, based on data from the CRM 2017 study.
LINK TO CIRCULAR ECONOMY In a circular economy, materials that can be recycled are injected back in the economy as new raw materials thus increasing the security of supply. Hence the contribution of recycled materials to raw materials demand is at the core of the circular economy. Recycling is an important source of secondary raw materials. As such recycling can contribute to the security of supply and the transition to a circular economy in EU.
BENCHMARK EU-wide data are available, but indicator is not calculated on a country level (except maybe on a ad hoc basis). Monitoring over time is possible as the EOL-RIR is calculated for EU every 3 years (CRM).
Raw materials scoreboard 2016 16. Recycling’s contribution to meeting materialsdemand
Key points: - Recycling keeps valuable materials within
the economy and contributes to the security of raw materials supply
- Recycling rates for certain materials are relatively high. Nevertheless for most materials EOL-RIR is relatively low because demand is higher than what can be met byrecycling or because high-quality recyclingis not technically or economically feasible.
- Rate of recycling depends on severalfactors, including collection and treatmentefficiencies of products at EOL, technicallimitations, price of scrap and design forEOL recovery.
- The counter includes only in Europe recycledmaterials, and not imported recycledmaterials -> need for an additional indicator?
- Lack of appropriate data for many materials- No info on future potential of recycling
+ Part of methodolgoy to define EU CRM list, thusupdated every 3 years.
+ Indicator can be disaggregated per material+ Very relevant in light of CE+ Indicator included in EU Monitoring framework for
the CE
pro
con
tra
Recycling rates
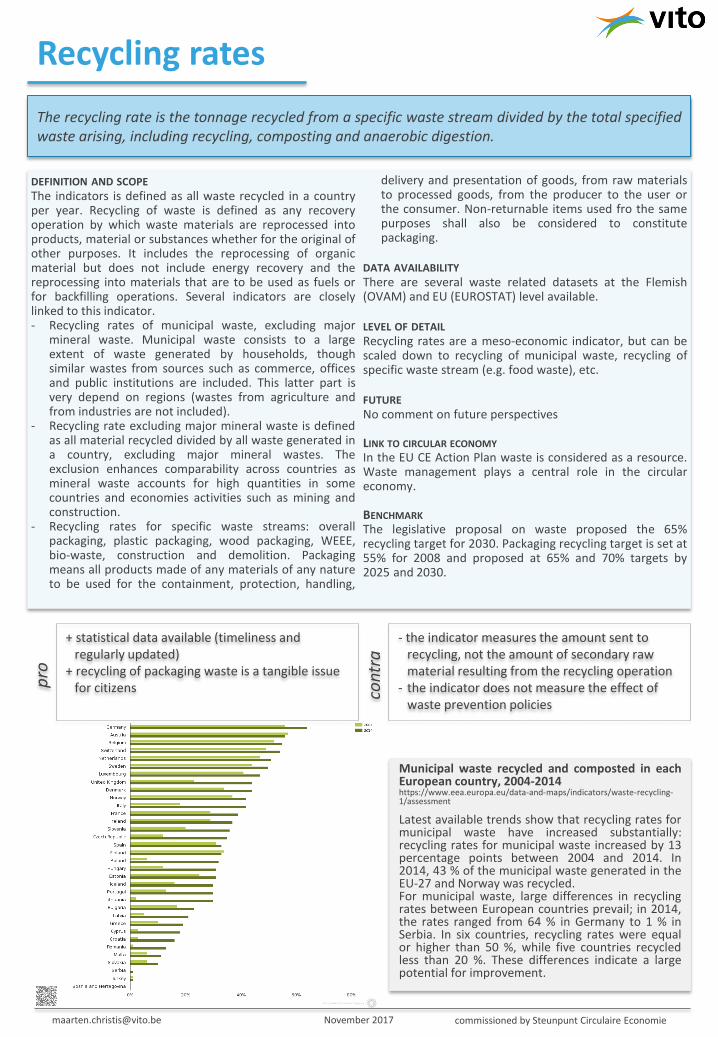
The recycling rate is the tonnage recycled from a specific waste stream divided by the total specified waste arising, including recycling, composting and anaerobic digestion.
November 2017 [email protected] commissioned by Steunpunt Circulaire Economie
DEFINITION AND SCOPE
The indicators is defined as all waste recycled in a country per year. Recycling of waste is defined as any recovery operation by which waste materials are reprocessed into products, material or substances whether for the original of other purposes. It includes the reprocessing of organic material but does not include energy recovery and the reprocessing into materials that are to be used as fuels or for backfilling operations. Several indicators are closely linked to this indicator. - Recycling rates of municipal waste, excluding major
mineral waste. Municipal waste consists to a large extent of waste generated by households, though similar wastes from sources such as commerce, offices and public institutions are included. This latter part is very depend on regions (wastes from agriculture and from industries are not included).
- Recycling rate excluding major mineral waste is definedas all material recycled divided by all waste generated ina country, excluding major mineral wastes. Theexclusion enhances comparability across countries asmineral waste accounts for high quantities in somecountries and economies activities such as mining andconstruction.
- Recycling rates for specific waste streams: overallpackaging, plastic packaging, wood packaging, WEEE,bio-waste, construction and demolition. Packagingmeans all products made of any materials of any natureto be used for the containment, protection, handling,
delivery and presentation of goods, from raw materials to processed goods, from the producer to the user or the consumer. Non-returnable items used fro the same purposes shall also be considered to constitute packaging.
DATA AVAILABILITY
There are several waste related datasets at the Flemish (OVAM) and EU (EUROSTAT) level available.
LEVEL OF DETAIL
Recycling rates are a meso-economic indicator, but can be scaled down to recycling of municipal waste, recycling of specific waste stream (e.g. food waste), etc.
FUTURE
No comment on future perspectives
LINK TO CIRCULAR ECONOMY In the EU CE Action Plan waste is considered as a resource. Waste management plays a central role in the circular economy.
BENCHMARK The legislative proposal on waste proposed the 65% recycling target for 2030. Packaging recycling target is set at 55% for 2008 and proposed at 65% and 70% targets by 2025 and 2030.
Municipal waste recycled and composted in each European country, 2004-2014 https://www.eea.europa.eu/data-and-maps/indicators/waste-recycling-1/assessment
Latest available trends show that recycling rates for municipal waste have increased substantially: recycling rates for municipal waste increased by 13 percentage points between 2004 and 2014. In 2014, 43 % of the municipal waste generated in the EU-27 and Norway was recycled. For municipal waste, large differences in recycling rates between European countries prevail; in 2014, the rates ranged from 64 % in Germany to 1 % in Serbia. In six countries, recycling rates were equal or higher than 50 %, while five countries recycled less than 20 %. These differences indicate a large potential for improvement.
- the indicator measures the amount sent torecycling, not the amount of secondary rawmaterial resulting from the recycling operation
- the indicator does not measure the effect ofwaste prevention policies
+ statistical data available (timeliness andregularly updated)
+ recycling of packaging waste is a tangible issuefor citizens

pro
co
ntr
a
Recyclability benefit rate
Recyclability Benefit rate is an index for the prioritisation of resources based on the potential benefits that can be achieved from their recycling
November 2017 [email protected] commissioned by Steunpunt Circulaire Economie
DEFINITION AND SCOPE
Method for improvement of resources efficiency of products and to support the development of requirements on the performance of products to improve their environmental impact. Requirements should be assessed considering the whole life cycle of the product, including use phase and any other relevant phase, in order to minimize trade-off and optimize global environmental benefits (according also to recommendations of [ISO/TR 14062, 2002]). A set of environmental indices have been developed, named ‘RRR Benefit Rates’. These indices are based on RRR rates (Reusability/Recyclability/Recoverability – fraction in mass of the overall product mass that is reusable/recyclable/recoverable), in addition, the life-cycle data about the manufacturing of the product, the production of primary materials, the impact of recycling and production of secondary materials, the disposal and the transport during each phase. The RRR benefit indices represent the percentage of product life-cycle impacts that can be saved when the product would be reused/recycled/recovered. The objective is the assessment of the environmental impacts of products to identify materials and parts that are relevant in a life-cycle perspective, with particular focus to the EOL. The ‘RRR Benefit Rates’ can be calculated for various life-cycle impact categories, and can be used to identify ‘hot spots’.
Selection of impact categories is important. The prioritization of the resources can in fact substantially change depending on the considered impact category. For example, large amount of plastics and of some common metals (e.g. aluminum, steel) are generally relevant in terms of GWP or energy consumption; on the other side, precious metal and critical raw materials, even if in small quantities, are generally very relevant for resource depletion (as for example the ‘Abiotic Resource Depletion Potential – elements’ [van Oers et al, 2002]. The selection of a set of
representative indicators is therefore of outstanding relevance in the analysis, and has to be defined in line with the priorities and targets of the decision makers. Furthermore, a multi-criteria approach is preferable for a more comprehensive analysis. • Recycling: Means the reprocessing in a production process of the
waste materials for the original purpose or for other purposes, but excluding energy recovery [EU, 2009b].
• Recyclable material: Material of the product that is potentially suitablefor recycling.
• Recyclability: Ability of waste product to be recycled, based on actualpractices [IEC/TR 62635, 2012]
DATA AVAILABILITY
Some of these indices have been developed in the scientific literature, although there are not standardized examples (as for mass-based indices). The report introduces some data-sheets for the indices aimed at simplifying their calculation and verification
LEVEL OF DETAIL = micro product level.
LINK TO CIRCULAR ECONOMY Environmental-based RRR indices should identify priority materials (and components) that are relevant not only in terms of mass but in terms of environmental impacts. These components therefore could be the target of potential requirements, including the improvement of the selective dismantling of the priority material/component.
Source: Guidance document on Recyclability Benefit Rate (in Annex 2 – guidance document on ‘use of priority resources’ in JRC technical report ‘Integration of resource efficiency and waste management criteria in European product policies – second phase’ Report no 3. Refined methods and guidance documents for the calculation of indices concerning Reusability/Recyclability/Recoverability, Recycled content, Use of priority resources, Use of hazardous substances, Durability (final). F. Ardente and F. Mathieux (2012).
- Limitation in data availability, especially concerning therecycling of materials, can seriously limit the application of theRecyclability Benefit rate
- mostly due to the availability of input data, the Recyclabilitybenefit method here described is not directly implementablein product’s requirements unless specific databases and toolswould be developed. However, the method can be used forthe analysis of EoL of products to identify product’s ‘hot spots’(key components and/or product parameters that are relevantin terms of relevant life-cycle impacts and/or improvementpotential).
- RRR benefit rates are affected by the same uncertainties as theRRR rates, including the definition of the EoL scenario(s) andthe availability of the recycling/recovery rates
+ The calculation methodology is available.+ whole life cycle of product is considered in order to minimize
trade-off and optimize global environmental benefits+ RRR indices are ‘mass based’ meaning they are focusing on the
reuse/recycle/recovery of product’s parts with the largest mass (so targeted to the reduction of the overall amount of waste).On the other side it does not focus on the life-cycle impacts ofthe materials. Components with a small mass are in factgenerally negligible for the calculation of these indices, butcould be relevant in terms of contribution to some environmental impacts. The RRR benefit indices are thus ameaningful addition to the RRR indices
The Recyclability Benefit rate can be defined as the ratio between the environmental balance of the energy recovery and the overall life cycle impacts:

pro
co
ntr
a
(Energy) Recoverability Benefit rate
Energy Recoverability Benefit rate is an index for the prioritisation of resources based on the potential benefits that can be achieved from their energy recovery
November 2017 [email protected] commissioned by Steunpunt Circulaire Economie
DEFINITION AND SCOPEMethod for improvement of resources efficiency of products and to support the development of requirements on the performance of products to improve their environmental impact. Requirements should be assessed considering the whole life cycle of the product, including use phase and any other relevant phase, in order to minimize trade-off and optimize global environmental benefits (according also to recommendations of [ISO/TR 14062, 2002]).
A set of environmental indices have been developed, named ‘RRR Benefit Rates’. These indices are based on RRR rates (Reusability/Recyclability/Recoverability – fraction in mass of the overall product mass that is reusable/recyclable/recoverable), in addition, the life-cycle data about the manufacturing of the product, the production of primary materials, the impact of recycling and production of secondary materials, the disposal and the transport during each phase.
The RRR benefit indices represent the percentage of product life-cycle impacts that can be saved when the product would be reused/recycled/recovered.
The objective is the assessment of the environmental impacts of products to identify materials and parts that are relevant in a life-cycle perspective, with particular focus to the EOL.
The ‘RRR Benefit Rates’ can be calculated for various life-cycle impact categories, and can be used to identify ‘hot spots’.
Selection of impact categories is important. The prioritization of the resources can in fact substantially change depending on the considered impact category. For example, large amount of plastics and of some common metals (e.g. aluminum, steel) are generally relevant in terms of GWP or energy consumption; on the other side, precious metal and critical raw materials, even if in small quantities, are generally very relevant for resource depletion (as for example the ‘Abiotic Resource Depletion Potential – elements’ [van Oers et al, 2002]. The selection of a set of representative indicators is therefore of outstanding relevance in the analysis, and has to be defined in line with the priorities and targets of the decision makers. Furthermore, a multi-criteria approach is preferable for a
more comprehensive analysis.
• Recovery: Means any of the applicable operations provided for inAnnex II B to Directive 2006/12/EC of the European Parliament and ofthe Council of 5 April 2006 on waste [EU, 2009b].
• Energy recovery: Means the use of combustible waste as a means togenerate energy through direct incineration with or without other waste but with recovery of the heat [EU, 2009b].
• Energy recoverable material: Material of the product that ispotentially suitable for energy recovery.
• Energy Recoverability Benefit rate: Index for the prioritisation ofresources based on the potential benefits that can be achieved fromtheir energy recovery
Method for the assessment of the energy recovery by incineration. However, the method is potentially extensible also to other energy recovery options (e.g. gasification, pyrolysis, anaerobic digestion (see the methodological discussion in EP1 – Report n° 2 – Section 3.4.2 and 3.4.3.)
DATA AVAILABILITYSome of these indices have been developed in the scientific literature, although there are not standardized examples (as for mass-based indices). The report introduces some data-sheets for the indices aimed at simplifying their calculation and verification
LEVEL OF DETAIL = micro product level.
LINK TO CIRCULAR ECONOMY Environmental-based RRR indices should identify priority materials (and components) that are relevant not only in terms of mass but in terms of environmental impacts. These components therefore could be the target of potential requirements, including the improvement of the selective dismantling of the priority material/component.
Source: Guidance document on Recyclability Benefit Rate (in Annex 2 – guidance document on ‘use of priority resources’ in JRC technical report ‘Integration of resource efficiency and waste management criteria in European product policies – second phase’ Report no 3. Refined methods and guidance documents for the calculation of indices concerning Reusability/Recyclability/Recoverability, Recycled content, Use of priority resources, Use of hazardous substances, Durability (final). F. Ardente and F. Mathieux (2012).
- RRR benefit rates are affected by the same uncertainties as the
RRR rates, including the definition of the EoL scenario(s) andthe availability of the recycling/recovery rates
+ The calculation methodology is available. + whole life cycle of product is considered in order to minimize
trade-off and optimize global environmental benefits+ RRR indices are ‘mass based’ meaning they are focusing on
the reuse/recycle/recovery of product’s parts with the largest mass (so targeted to the reduction of the overall amount ofwaste). On the other side it does not focus on the life-cycle impacts of the materials. Components with a small mass are in fact generally negligible for the calculation of these indices, but could be relevant in terms of contribution to someenvironmental impacts. The RRR benefit indices are thus a meaningful addition to the RRR indices
The Energy Recoverability Benefit rate can be defined as the ratio between the environmental balance of the energy recovery and the overall life cycle impacts:
pro
con
tra
Trade in secondary raw materials
Trade in secondary raw materials measures the movements of waste, regarded as a potential valuable resource, across regional, national and European borders.
November 2017 [email protected] commissioned by Steunpunt Circulaire Economie
DEFINITION AND SCOPE
To provide an accurate picture of the raw materials sector it is fundamental to keep track of the movements of raw materials originating from waste (i.e. secondary raw material) crossing boundaries as import and exports. Recyclables are a significant source of raw material, both in terms of value and volume. It is important to quantify and monitor the movement of secondary raw materials, including the tracking of the amounts of secondary raw materials crossing the intra-EU borders as well as those crossing EU borders. However, it should be noted that this indicators covers only the legal export of waste materials. Due to their nature, illegal waste shipments are by definition not tracked by official reporting systems, but there is extensive evidence that the amount of illegally exported waste is significant, and for some categories of waste (e.g. end-of-life vehicles or WEEE), perhaps even higher than the amount of legal exports.
DATA AVAILABILITY
In the EU, data on waste movements are generated in response to various reporting obligations (e.g. Waste
Shipments Regulation, Basel Convention). These mainly address the hazardous waste flows. Export and import of non-hazardous waste materials (e.g. paper, metals, plastics) can be found in EU trade statistics.
LEVEL OF DETAIL
The trade in secondary raw materials is a macro-economic indicator. The indicator can be broken down to selected waste materials. The trade boundaries can be defined on the level of regions, nations and EU, as long as the data is available.
FUTURE
The indicator is fully developed. The required data is available via Eurostat.
LINK TO CIRCULAR ECONOMY With extensive reuse, remanufacture, repair, etc. waste flows are small, however inevitable. Domestic recycling also reduces trade in waste, while specialisation encourages trade.
BENCHMARK No benchmark available.
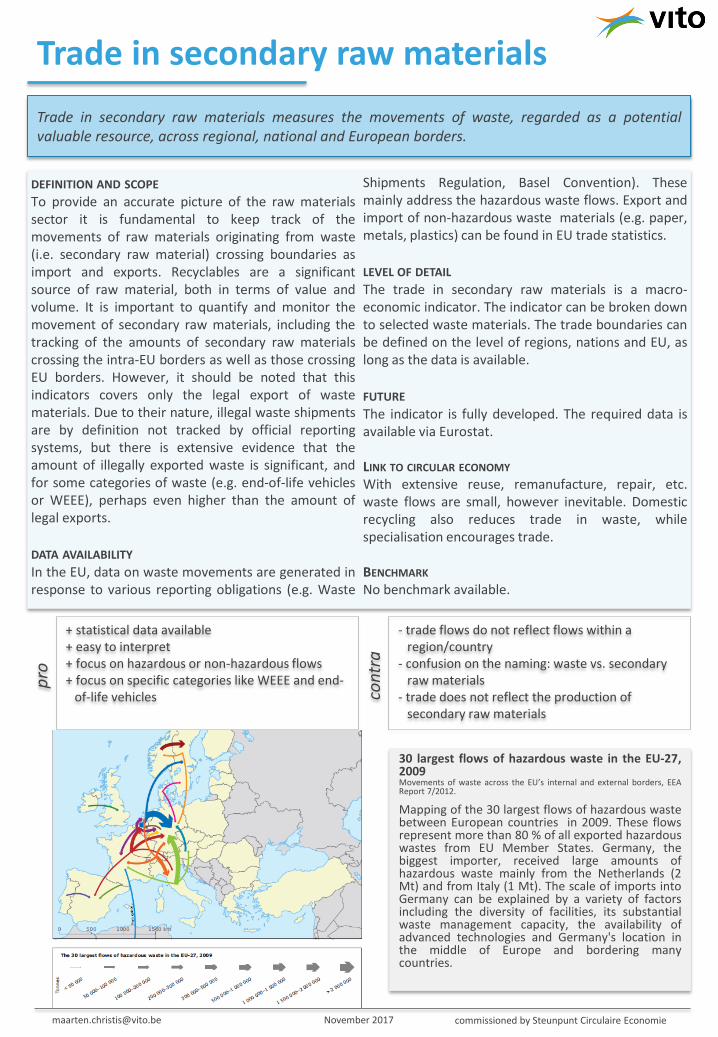
30 largest flows of hazardous waste in the EU-27, 2009 Movements of waste across the EU’s internal and external borders, EEA Report 7/2012.
Mapping of the 30 largest flows of hazardous waste between European countries in 2009. These flows represent more than 80 % of all exported hazardous wastes from EU Member States. Germany, the biggest importer, received large amounts of hazardous waste mainly from the Netherlands (2 Mt) and from Italy (1 Mt). The scale of imports into Germany can be explained by a variety of factors including the diversity of facilities, its substantial waste management capacity, the availability of advanced technologies and Germany's location in the middle of Europe and bordering many countries.
- trade flows do not reflect flows within aregion/country
- confusion on the naming: waste vs. secondaryraw materials
- trade does not reflect the production ofsecondary raw materials
+ statistical data available+ easy to interpret+ focus on hazardous or non-hazardous flows+ focus on specific categories like WEEE and end-
of-life vehicles

pro
con
tra
Waste generation
Waste generation measures the amount of waste generated per year.
November 2017 [email protected] commissioned by Steunpunt Circulaire Economie
DEFINITION AND SCOPEThe indicators is defined as all waste generated in a country per year. Several indicators are closely linked to this indicator. - Municipal waste is mainly produced by households,
though similar wastes from sources such as commerce,offices and public institutions are included. The amountof municipal waste generated consists of wastecollected by or on behalf of municipal authorities anddisposed of through the waste management system.Wastes from agriculture and from industries are notincluded. In the EU, municipal waste only representsabout 10% of the total waste generated or about 30% ofthe generated amount of waste excluding major mineralwaste.
- Generation of waste excluding major mineral wastes.This exclusion enhances comparability across countriesas mineral waste accounts for high quantities in somecountries sand economic activities such as mining andconstruction.
- Food waste is the amount of food waste generated peryear, i.e. food which have been discarded. It takes placeall along the value chain. However, no definition of foodwaste is present in the EU regulatory frameworks.
- WEEE: waste of electric and electronic equipment.
DATA AVAILABILITYThere are several waste related datasets at the Flemish (OVAM) and EU (EUROSTAT) level available.
LEVEL OF DETAILWaste generation is a macro-economic indicator, but can be scaled down to municipal waste, waste generation by
economic activity, company-level, waste stream (e.g. food waste), etc.
FUTUREAgreed definition on food waste required.
LINK TO CIRCULAR ECONOMY In the EU CE Action Plan waste is considered as a resource. Waste management plays a central role in the circular economy.
BENCHMARK One of the objectives in EU waste policy is to reduce waste generation in absolute terms, within the overall goal to decouple economic growth from resource use and environmental impacts. In Flanders, the goal of the ‘Uitvoeringsplan milieuverantwoord beheer van huishoudelijke afvalstoffen’ is to set a maximum, from 2008 onwards, of 150 kg per inhabitant of residual waste and a maximum, from 2009 onwards, of 560kg per inhabitant of municipal waste. SDG 12.3: “by 2030 halve per capita global food waste at the retail and consumer level, and reduce food losses along production and supply chains including post-harvest losses”.
Waste generation by production and consumption activities, EU-28+Norway, 2004-2013. https://www.eea.europa.eu/data-and-maps/indicators/waste-generation-1/assessment
European economic production and consumption have become less waste intensive, even after the economic downturn since 2008 is considered in the analysis. From the production side, waste generation from manufacturing in the EU-28 and Norway declined by 25% in absolute terms between 2004 and 2012, despite an increase of 7% in sectoral economic output. Waste generation by the service sector declined by 23% in the same period, despite an increase of 13% in sectoral economic output. Turning to consumption, total municipal waste generation in EEA countries declined by 2% between 2004 and 2012, despite a 7% increase in real household expenditure.
- no international agreed definitions and datagathering methodologies available for some subindicators of waste generation
+ close link with recycling+ measure of effectiveness of waste prevention
measures+ linked to inhabitants and not to manufacturing
sectors
pro
con
tra
WEEE management
Amount of WEEE collected, recycled and reused.
November 2017 [email protected] commissioned by Steunpunt Circulaire Economie
DEFINITION AND SCOPEWaste of electrical and electronic equipment is one of the fastest growing waste streams in the EU. WEEE might not be significant in terms of mass, but it is a good example of the untapped potential to recover valuable raw materials. Relevant subindicators in this context are: • Amount of WEEE collected (total; from households);• Amount of WEEE recycled;• Amount of WEEE reused.Some dashboards only give these indicators for the totalamount on a yearly basis, but most present the indicatorsper capita.Additional indicators focus on the recycling rate and reuserate (in %), by dividing the amount of recycled and reusedWEEE by the total amount of waste collected.
DATA AVAILABILITYData are reported by Eurostat per Member State for WEEE collected (based on data from EPR schemes). Statistics also include amounts of WEEE recycled and reused, and reused per WEEE category. European research projects like ProSUM contribute to the information about WEEE in the EU-28.
LEVEL OF DETAILIndicators are calculated for the total amount of WEEE, but can also zoom into the 10 WEEE categories as defined in the WEEE Directive e.g. large household appliances, small household appliances, IT and telecommunications, …. Breakdown per WEEE category can be very relevant, since
WEEE may largely differ in terms of material composition, reuse and recycling rate. This indicator focuses on the management of specific product categories within an economy and as such is considered a meso level indicator.
FUTURE Methodology can be applied for other product waste streams as well (C&D waste, batteries, …).
LINK TO CIRCULAR ECONOMY WEEE is a complex waste stream that includes significant amounts of valuable raw materials. So efforts to improve collection, reuse and recycling of WEEE are important to increase the recovery of valuable materials and to strengthen circularity in the economy.
BENCHMARK The WEEE Directive sets targets for the amount of WEEE collected from households, so this can be used at least as a benchmark for collection rates. Indicators related to the amounts of WEEE are calculated on member state level which allows to benchmark with other regions. The WEEE Directive sets targets for recycling rate, which can be used as a benchmark.
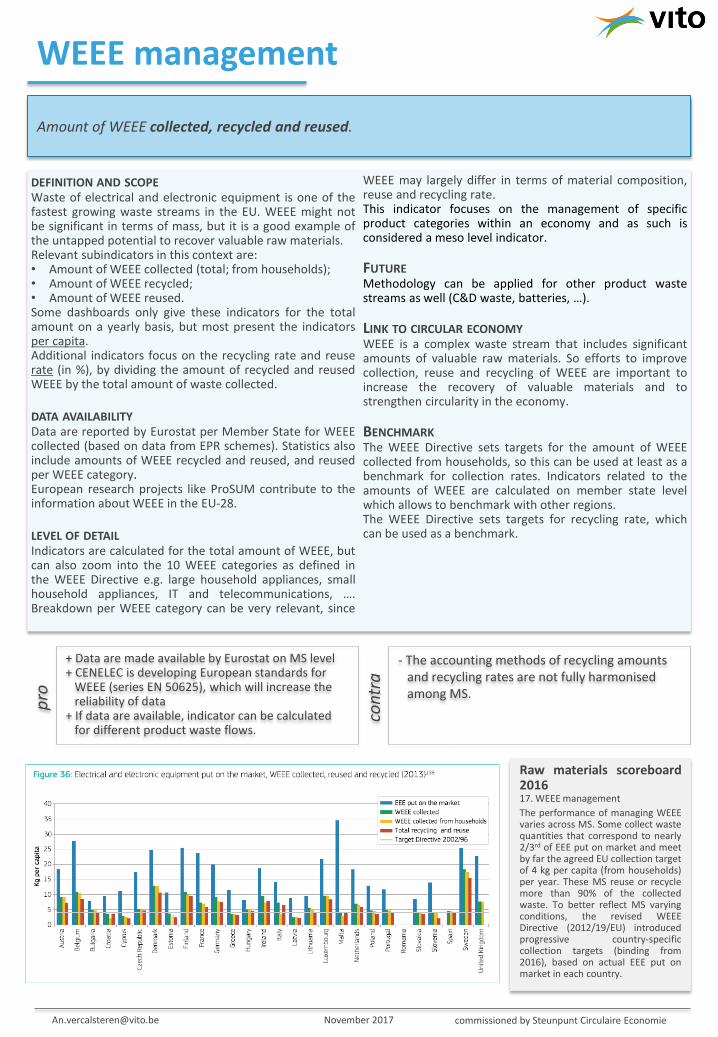
Raw materials scoreboard 2016 17. WEEE management
The performance of managing WEEE varies across MS. Some collect waste quantities that correspond to nearly 2/3rd of EEE put on market and meet by far the agreed EU collection target of 4 kg per capita (from households) per year. These MS reuse or recycle more than 90% of the collected waste. To better reflect MS varying conditions, the revised WEEE Directive (2012/19/EU) introduced progressive country-specific collection targets (binding from 2016), based on actual EEE put on market in each country.
- The accounting methods of recycling amountsand recycling rates are not fully harmonisedamong MS.
+ Data are made available by Eurostat on MS level+ CENELEC is developing European standards for
WEEE (series EN 50625), which will increase thereliability of data
+ If data are available, indicator can be calculatedfor different product waste flows.

pro
con
tra
Basket of Products (BoP)-indicators
The EU Consumer Footprint measures the potential environmental impacts of consumption, based on the LCA of products and services purchased and used in one year by an EU citizen.
November 2017 [email protected] commissioned by Steunpunt Circulaire Economie
DEFINITION AND SCOPE
The basket of products approach matches macro statistics on private consumption per capita with life cycle inventory (LCI) environmental profiles for each product consumed (product = goods and services together). The environmental impacts are defined by the ILCD-methodology and are normalized and weighted into a composite indicator. The indicators represent domestic consumption only, the impacts of domestic production for export are excluded. The impacts of foreign production for domestic consumption are included by using country-specific LCI data for the most significant import countries, as identified by trade statistics. The system boundaries encompass a cradle-to-grave approach. Consumption is split into five key areas, and for each area, a respective Basket of (representative) Products is developed: food, housing, mobility, household goods and electric/electronic appliances. For each of the BoPs a baseline scenario is defined, taking as reference the consumption of an average EU citizen in the baseline year 2010. The Consumer Footprint synthesizes the LCA of products used in one year by an average European and covers goods of the 5 key consumption areas. More than 100 LCAs have been conducted. This allows for a hotspot analysis, which is then used as a basis for the selection of actions (covering both consumption pattern and behavioural changes or implementation of eco-solutions) that can help to reduce the environmental burden of EU consumption. For each of the actions, a scenario is developed, by acting on the baseline model and simulating the changes provided by the action. The LCA results of each scenario are compared to the results of the baseline, to identify potential benefits or drawbacks coming from the implementation of the respective action. The complete set of BoPs will be available from the end of 2017, together with a set of preliminary scenarios in each area of consumption.
DATA AVAILABILITY
An important data source is the Eurostat database (particularly for macro-economic data and trade statistics). Detailed data for the specific key
areas are derived from European projects. LCI data are taken from LCA databases, with preference for the ILCD database. The different data sources are heterogeneous as very few reports cover all information needed. Data are not always related to the baseline year 2010. The calculation of the EU consumer footprint is a very data and time intensive exercise and requires specific data of sufficient quality. A lot of micro-level data are not structurally collected and published.
LEVEL OF DETAIL
This approach allows to consider environmental impacts embodied in imported products and services as well as local products and services. Due to the combination of macro-economic data for consumption with bottom up data for the life cycle of goods. It allows a detailed analysis of the environmental impacts of products and services over their full life cycle, but at a macro-economic level. In theory it is possible to identify important consumption categories and to drill down to those products and flows from/to the environment that are particularly relevant. However such conclusions rely on high-quality data.
FUTURE By incorporating new products into the basket, the indicators can cover close to 100% of citizens’ environmental impacts. By including new life cycle datasets for existing products, it is possible to monitor changes in technological progress over time.
LINK TO CIRCULAR ECONOMY The actions following from the hot spot analysis can include CE strategies. Because environmental impacts are assessed on a micro level (LCA), it allows to include specific CE strategies for specific products. The combination with the macro level consumption data allows to take into account changes in consumption behaviour (e.g. rebound) as well.
BENCHMARK Very recent indicator, no benchmark available except the EU BoP indicator to be published end 2017.
Environmental impacts of food consumption in Europe Notarnicola B. et al, 2017, Journal of Cleaner Production 140 (2017) 753-765
The BoP approach and results can be used to setting targets, through defining improvement scenarios based on the hot spot analysis. In the scenarios the effect of changing some parameters related to possible improvements (e.g. dietary shifts) on the final results of the basket of (food) products. In the example discussed in the paper 2 dietary changes relate to a 25% to 50% reduction in the consumption of beef, dairy, pig meat, poultry and eggs, which is being compensated by a higher intake of cereals.
- Requires expert knowledge and access to all datato calculate the indicator
- Data are only available for limited number ofproducts
- Data are not regularly updated- Time and data intensive exercise
+ Includes wide range of environmental impacts.+ Combines environmental impacts in 1 environmental
score.+ Allows to identify hotspots in our consumption and in
the supply chain of products+ Links micro-level data on life cycle of goods with macro-
level consumption data
Picture not available
pro
co
ntr
a
Product Environmental Footprint
The PEF indicator measures the life cycle environmental performance of products and organisations.
November 2017 [email protected] commissioned by Steunpunt Circulaire Economie
DEFINITION AND SCOPE
Since 2011 the EC has worked towards the development of a harmonized methodology for the calculation of the environmental footprint of products (PEF) over its life cycle (production, use, EOL, transport). Building on a number of existing standards and guidance documents, technical guidelines have been developed that provide requirements on how to calculate a PEF, as well as on how to create product or sector specific methodological rules (PEFCR), to be used for comparisons between products. The PEF methodology builds upon the LCA methodology (goal and scope, data inventory, impact assessment and interpretation) but aims to ensure fair product comparison. Harmonization is mainly related to the following elements: - Requirements for goal and scope definition e.g.
functional unit and system boundaries;- Requirement for modelling of common elements of life
cycles (e.g. electricity);- Rules for modelling different life cycle stages;- Default impact assessment categories and methods.
DATA AVAILABILITYEvery PEFCR includes a list of mandatory processes for which primary data shall be collected. However a company can differentiate the environmental performance of its product by using company-specific data instead of the default datasets available in the ILCD database and other publicly available LCA-databases. Data collection is focussed on hot spots, not on irrelevant processes. Only the collection of foreground and activity data is needed.
The European Commission launched a number of contracts with the goal to provide Life Cycle Inventory (LCI) datasets.
LEVEL OF DETAIL
The PEF indicators start from a product perspective and focusses on the complete life cycle of that product. It is a micro-level indicator (set) that gives information on several aspects like climate change impact, but also depletion of resources.
FUTURE The pilot phase of the PEF is currently in its final stage and the first PEFCR for different sectors are defined.
LINK TO CIRCULAR ECONOMY The indicator focusses on products, and allows to include in the life cycle of the product feedback loops from EoL to either production (recycling, remanufacturing) or use (reuse). It allows to assess the effect of specific circular economy strategies.
BENCHMARK Not available
- Only available for sectors that participated inthe pilot phase
- Development of PEFCR for new sectors is timeconsuming
- Scope of product categories can be too narrowor too broad
+ Less time and cost intensive compared toconventional LCA due to simplification andmethodological rules
+ Background data and models available+ Allows fair comparison due to harmonized
methodology
Picture not available
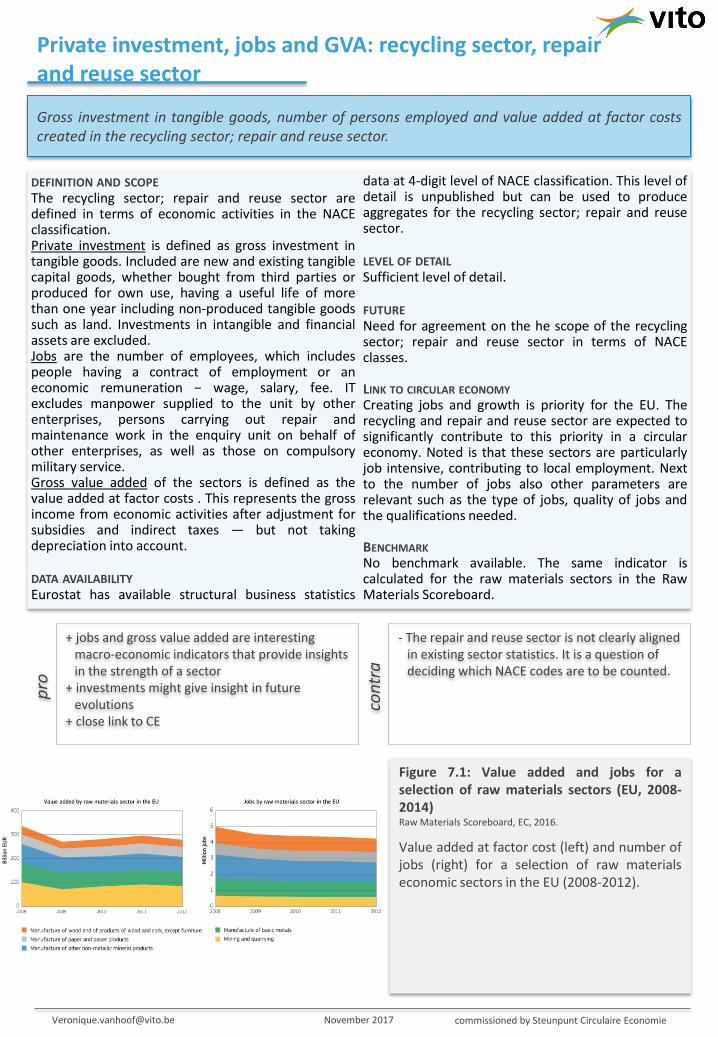
pro
con
tra
Private investment, jobs and GVA: recycling sector, repair and reuse sector
Gross investment in tangible goods, number of persons employed and value added at factor costs created in the recycling sector; repair and reuse sector.
November 2017 [email protected] commissioned by Steunpunt Circulaire Economie
DEFINITION AND SCOPE
The recycling sector; repair and reuse sector are defined in terms of economic activities in the NACE classification. Private investment is defined as gross investment in tangible goods. Included are new and existing tangible capital goods, whether bought from third parties or produced for own use, having a useful life of more than one year including non-produced tangible goods such as land. Investments in intangible and financial assets are excluded. Jobs are the number of employees, which includes people having a contract of employment or an economic remuneration − wage, salary, fee. IT excludes manpower supplied to the unit by other enterprises, persons carrying out repair and maintenance work in the enquiry unit on behalf of other enterprises, as well as those on compulsory military service. Gross value added of the sectors is defined as the value added at factor costs . This represents the gross income from economic activities after adjustment for subsidies and indirect taxes — but not taking depreciation into account.
DATA AVAILABILITY
Eurostat has available structural business statistics
data at 4-digit level of NACE classification. This level of detail is unpublished but can be used to produce aggregates for the recycling sector; repair and reuse sector.
LEVEL OF DETAIL
Sufficient level of detail.
FUTURE
Need for agreement on the he scope of the recycling sector; repair and reuse sector in terms of NACE classes.
LINK TO CIRCULAR ECONOMY Creating jobs and growth is priority for the EU. The recycling and repair and reuse sector are expected to significantly contribute to this priority in a circular economy. Noted is that these sectors are particularly job intensive, contributing to local employment. Next to the number of jobs also other parameters are relevant such as the type of jobs, quality of jobs and the qualifications needed.
BENCHMARK No benchmark available. The same indicator is calculated for the raw materials sectors in the Raw Materials Scoreboard.
Figure 7.1: Value added and jobs for a selection of raw materials sectors (EU, 2008-2014) Raw Materials Scoreboard, EC, 2016.
Value added at factor cost (left) and number of jobs (right) for a selection of raw materials economic sectors in the EU (2008-2012).
- The repair and reuse sector is not clearly alignedin existing sector statistics. It is a question ofdeciding which NACE codes are to be counted.
+ jobs and gross value added are interestingmacro-economic indicators that provide insightsin the strength of a sector
+ investments might give insight in futureevolutions
+ close link to CE

pro
con
tra
Other indicators that are under development measure specific characteristics of a product, such as recycled content, recyclability or repairability
Methodologies under development to measure recycled content, recyclability or repairability in a standardized way
November 2017 [email protected] commissioned by Steunpunt Circulaire Economie
DEFINITION AND SCOPE
They cannot be used as indicators for assessing the global environmental performance of a product, as they focus on only one aspect of circularity. However, they could be used by policy makers to lay down product requirements for specific product groups or by industry when developing standards.
DATA AVAILABILITY
Not yet available For smartphones iFixit has repairability scores (engineers disassembled and analyzed each device, awarding a repairability score between zero and ten. Ten is the easiest to repair)
LEVEL OF DETAIL
Not yet available
FUTURE
The European Commission is doing work together with standardizing bodies as CEN/CENELEC on developing methodologies to measure recycled content, recyclability or repairability in a standardized way. A horizontal standardization request on material efficiency was issued to CEN and CENELEC in 2015. Within a dedicated CEN-CENELEC Joint Working
Group, a few generic European Standards (applicable to any products covered by Directive 2009/125/EC) will be developed by March 2019. They will lay down basic principles for consideration when addressing aspects such as: • extending product lifetime;• ability to re-use components or recycle materials
from products at end-of-life;• the use of re-used components and/or recycled
materials in products.
LINK TO CIRCULAR ECONOMY They cannot be used as indicators for assessing the global environmental performance of a product, as they focus on only one aspect of circularity. However, they could be used by policy makers to lay down product requirements for specific product groups or by industry when developing standards.
BENCHMARK Not available yet For iFixit: rates the repairability of new smartphones and tablets entering the market. By gathering the rates for different companies/models through time, one can assess trends in repairability of these product types, overall or per brand
iFixit smartphone repairability scores https://www.ifixit.com/smartphone-repairability
How iFixit rates devices: A device with a perfect score will be relatively inexpensive to repair because it is easy to disassemble and has a service manual available. Points are docked based on the difficulty of opening the device, the types of fasteners found inside, and the complexity involved in replacing major components. Points are awarded for upgradability, use of non-proprietary tools for servicing, and component modularity.
- Focus on only one aspects of circularity+ Once standardized methodologies available,they could be used by policy makers to lay downproduct requirements for specific productgroups or by industry when developingstandards
Picture not available

31
3.3 Visual categorization of indicators Indicators related to the circular economy can be classified according to different criteria. To have a visual overview of some important characteristics of the indicators assessed in this study, they are classified on 3 axes that represent different criteria:
1. Micro, meso, macro level: see par. 2.1 for a definition of each level. 2. CE strategies: the 10 CE-strategies according to PBL (R0 – R9) are used as a reference
(Potting et al, 2017). 3. Technology versus socio institutional: Technology-related indicators typically measure
‘hard’ parameters expressed in volumes (e.g. kg) or environmental impacts. Socio-institutional indicators refer to governance and infrastructure aspects (e.g. systems in place for sharing, repairing or reusing products).
In Figure 3 the 17 indicators are scored for these 3 criteria. As scoring is not always straightforward, the current and intended use of the indicator is taken as a basis. The dark coloured bars identify the characteristics of the indicator, the light coloured bars indicate the potential of the indicator although it is not developed and used for that purpose. E.g. material system analysis is targeted at a macro level, but might be developed for a meso level as well; recycling rates are technology-driven indicators, but implicitly include the effect of socio-institutional changes like improved collection systems.
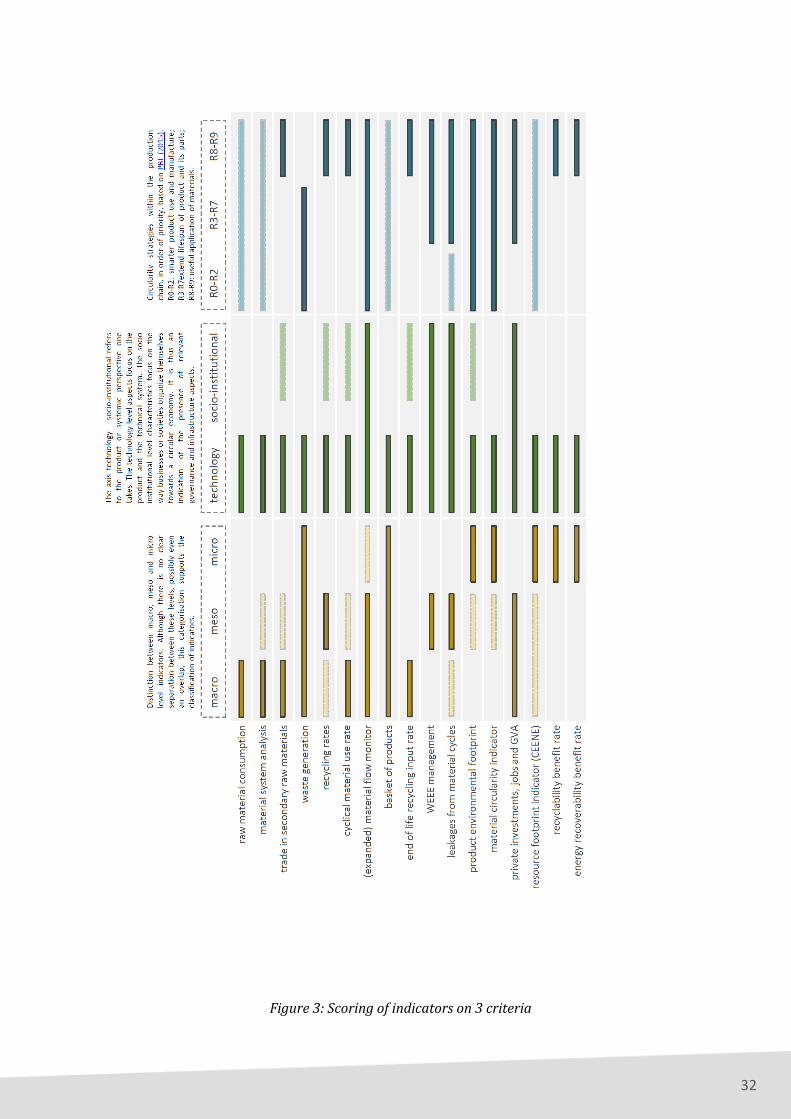
32
Figure 3: Scoring of indicators on 3 criteria
33
Chapter 4: Conclusions The (limited) set of indicators that are assessed in detail show that particularly the indicators in existing dashboards and frameworks are macro level indicators that focus on the flows between economies. The detail of the flows focussed on by the indicator can be quite high though, e.g. end of life recycling input rate (EOL-RIR) which is available on material level. On the other hand, indicators currently under development with a specific focus on circular economy often relate to the micro or meso level, as the potential effect of specific circular economy strategies can only be monitored on these levels. In an ideal world macro level indicators can be disaggregated into meso and micro level indicators (top down) or the other way around, micro level indicators can be aggregated to the meso and macro level (bottom up). However this relation is not possible for all indicators. Some examples:
Top down: An example of a macro level indicator that can be disaggregated is the Raw Material Consumption (RMC). The Raw Materials Scoreboard calculates this indicator for the EU economy (distinguishing between 4 material types), but the methodology allows to go more in detail into final demand categories (households, governments, industry) and consumption activities of households.
Bottom up: The Basket of Products indicator is a good example of an indicator which is based on aggregating micro level data (for specific reference products) for EU consumption. It might also be aggregated to the meso level (indicators for specific regions distinguishing consumption activities). However the calculation of the BoP indicator is very data and time intensive and the same issues can be measured by a combination of more simple indicators as well.
Indicators that enable to make linkages between the macro and meso level are less difficult to identify, as methodologically this link is often easy to define (e.g. relate data between economies to data for one specific economy distinguishing different industries or consumption activities). So the key barriers between indicators on a macro/meso level on the one hand and on a micro level on the other hand are lack of data (from macro to micro) and time and effort constraints (from micro to macro). The existing indicators focus primarily on physical parameters, like kilograms, that are more technology-related. Indicators focussing on socio-institutional aspects and specific high-level circularity strategies are less well-defined and less frequently included in monitoring framenworks e.g. extending the life span of products, reuse of products. A transition to a circular economy may not be looked at from a material perspective only, but should include also other environmental impacts such as climate change. Indicators monitoring environmental impacts exist already and can easily be combined and integrated in a set of indicators for monitoring the circular economy.

34
It is clear that there is a need for a set/combination of indicators on different levels to monitor the transition to a circular economy, as too much aspects are relevant that need to be monitored in order to have a good insight in the progress. For example, the RMC indicator alone is not sufficient since it can’t identify “closed cycles” in an economy, it takes the material cycles into account but not as a separate flow. Therefore, to better visualize the effect of some CE strategies it is necessary to complement the RMC with other indicators e.g. indicators that identify leakage flows or take-back cycles. As many initiatives are currently ongoing on a European level, it is recommended to closely follow some of these for the development of a CE index for Flanders. Particularly of interest are:
- Initiatives related to the EU Circular Economy Action Plan5, f.e. Monitoring framework on circular economy and the European Circular Economy Stakeholder Platform;
- PBL (NL) – Circular Economy - what do we want to know and what can we measure (Report in Dutch - http://www.pbl.nl/publicaties/circulaire-economie-wat-willen-we-weten-en-wat-kunnen-we-meten);
- Development of the Raw Materials Scoreboard 2018; - Basket of Products reporting6; - Work of the European Commission together with CEN/CENELEC on developing
methodologies to measure recycled content, recyclability or repairability in a standardized way.
5 http://ec.europa.eu/environment/circular-economy/index_en.htm
6 http://eplca.jrc.ec.europa.eu/?page_id=1517

35
References Ardente, F. and Mathieux, F. (2012). JRC technical report ‘Integration of resource efficiency and waste management criteria in European product policies – second phase’ Report no 3. Refined methods and guidance documents for the calculation of indices concerning Reusability/Recyclability/Recoverability, Recycled content, Use of priority resources, Use of hazardous substances, Durability (final). Guidance document on Recyclability Benefit Rate and Energy Recoverability Benefit rate (in Annex 2 – guidance document on ‘use of priority resources’.
Potting J., Hekkert M., Worrell E., Hanemaaijer A. (2017), Circular Economy: Measuring innovation in the product chain, PBL, the Netherlands
BIO by Deloitte (2015), Study on Data for a Raw Material System Analysis: Roadmap and Test of the fully operational MSA for Raw Materials, prepared for the EC, DG GROW
Dewulf J. et al (2014), Indicators and targets for the reduction of the environmental impact of EU consumption: Basket-of-Products indicators and prototype targets for the reduction of environmental impact of EU consumption, JRC-IES
EEA-report No 6/2017, Circular by design – Products in the circular economy
EASAC (2016), Indicators for a circular economy, EASAC policy report 30
Ellen Mc Arthur and Granta (2015). Circularity indicators. An approach to measuring circularity. Methodology.
iFixit (2017). https://www.ifixit.com/smartphone-repairability
Nuss P., Blengini G.A., Haas W., Mayer A., Nita V., Pennington D. (2017), Development of a Sankey Diagram of Material Flows in the EU economy based on Eurostat data, EUR 28811 EN, Publications office of the EU, Luxembourg, ISBN 978-92-79-73901-9, doi:10.2760/362116
EU (2016), Raw Materials Scoreboard 2016, European Innovation Partnership on Raw Materials, Publications office of the EU, Luxembourg, ISBN 978-92-79-61700-3

36
Annex 1: Longlist indicators of a circular economy Green: available in factsheet; red: currently not available in factsheet. Naam Indicator Bron Raw Material
Consumption (incl. link DMC)
EU Resource efficiency scoreboard (EURES, 2014) http://ec.europa.eu/environment/resource_efficiency/documents/re_scoreboard_2014.pdf
Material flows in the CE Material System Analysis (MSA)
Raw Materials Scoreboard (EIPrM, 2016) https://publications.europa.eu/en/publication-detail/-/publication/1ee65e21-9ac4-11e6-868c-01aa75ed71a1
Trade in secondary raw materials Gross exports of selected waste materials Trade in selected waste materials to and from the EU Value and volume of selected waste and by products that are shipped across intra- and extra EU borders
Raw Materials Scoreboard (EIPrM, 2016) https://publications.europa.eu/en/publication-detail/-/publication/1ee65e21-9ac4-11e6-868c-01aa75ed71a1 Monitoring framework for CE http://ec.europa.eu/environment/circular-economy/pdf/monitoring-framework.pdf
Recycling’s contribution to meeting materials demand End-of-life recycling input rate (EOL-RIR)
Raw Materials Scoreboard (EIPrM, 2016) https://publications.europa.eu/en/publication-detail/-/publication/1ee65e21-9ac4-11e6-868c-01aa75ed71a1 Monitoring framework for CE http://ec.europa.eu/environment/circular-economy/pdf/monitoring-framework.pdf
WEEE management Reuse and recycling of WEEE per capita EEA put on market, WEEE collected, reused and recycled
Raw Materials Scoreboard (EIPrM, 2016) https://publications.europa.eu/en/publication-detail/-/publication/1ee65e21-9ac4-11e6-868c-01aa75ed71a1
EU self-sufficiency for CRM
Monitoring framework for CE http://ec.europa.eu/environment/circular-economy/pdf/monitoring-framework.pdf
Green Public procurement Share of public procurement procedures above EU tresholds, in number and value, which include environmental elements.
Monitoring framework for CE http://ec.europa.eu/environment/circular-economy/pdf/monitoring-framework.pdf
Waste generation: (municipal waste, food waste, all waste)
Monitoring framework for CE http://ec.europa.eu/environment/circular-economy/pdf/monitoring-framework.pdf
Recycling rates Monitoring framework for CE
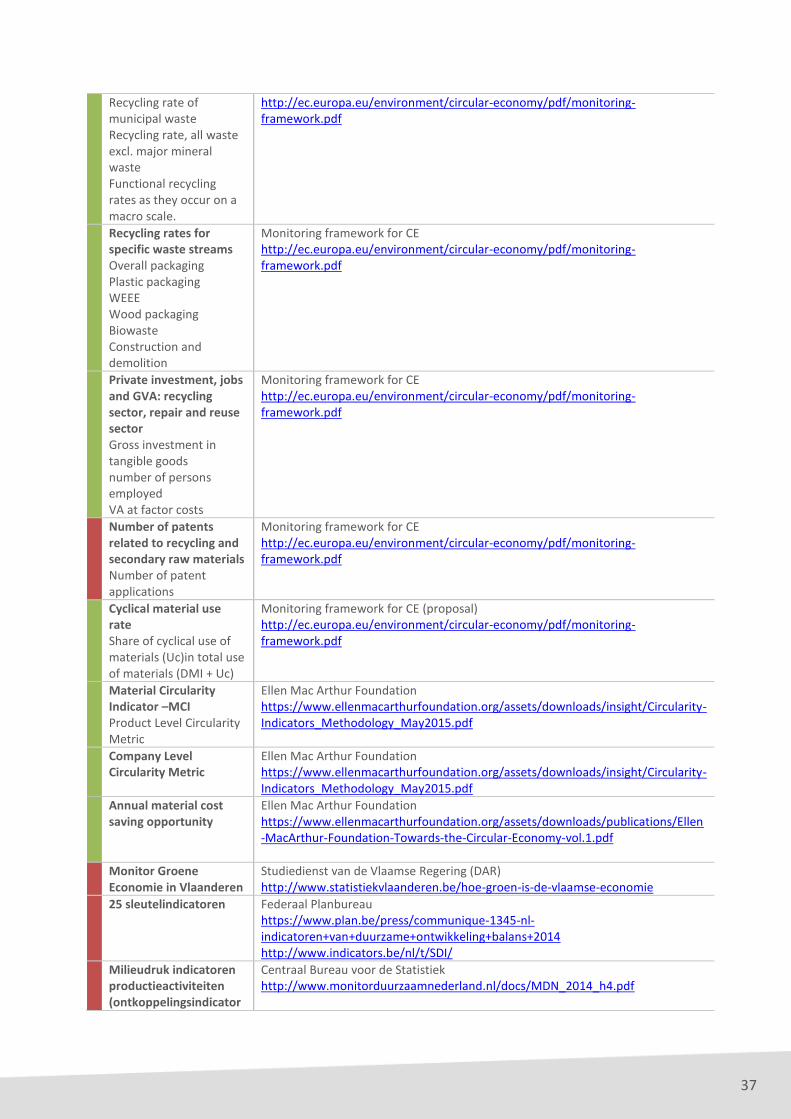
37
Recycling rate of municipal waste Recycling rate, all waste excl. major mineral waste Functional recycling rates as they occur on a macro scale.
http://ec.europa.eu/environment/circular-economy/pdf/monitoring-framework.pdf
Recycling rates for specific waste streams Overall packaging Plastic packaging WEEE Wood packaging Biowaste Construction and demolition
Monitoring framework for CE http://ec.europa.eu/environment/circular-economy/pdf/monitoring-framework.pdf
Private investment, jobs and GVA: recycling sector, repair and reuse sector Gross investment in tangible goods number of persons employed VA at factor costs
Monitoring framework for CE http://ec.europa.eu/environment/circular-economy/pdf/monitoring-framework.pdf
Number of patents related to recycling and secondary raw materials Number of patent applications
Monitoring framework for CE http://ec.europa.eu/environment/circular-economy/pdf/monitoring-framework.pdf
Cyclical material use rate Share of cyclical use of materials (Uc)in total use of materials (DMI + Uc)
Monitoring framework for CE (proposal) http://ec.europa.eu/environment/circular-economy/pdf/monitoring-framework.pdf
Material Circularity Indicator –MCI Product Level Circularity Metric
Ellen Mac Arthur Foundation https://www.ellenmacarthurfoundation.org/assets/downloads/insight/Circularity-Indicators_Methodology_May2015.pdf
Company Level Circularity Metric
Ellen Mac Arthur Foundation https://www.ellenmacarthurfoundation.org/assets/downloads/insight/Circularity-Indicators_Methodology_May2015.pdf
Annual material cost saving opportunity
Ellen Mac Arthur Foundation https://www.ellenmacarthurfoundation.org/assets/downloads/publications/Ellen-MacArthur-Foundation-Towards-the-Circular-Economy-vol.1.pdf
Monitor Groene Economie in Vlaanderen
Studiedienst van de Vlaamse Regering (DAR) http://www.statistiekvlaanderen.be/hoe-groen-is-de-vlaamse-economie
25 sleutelindicatoren Federaal Planbureau https://www.plan.be/press/communique-1345-nl-indicatoren+van+duurzame+ontwikkeling+balans+2014 http://www.indicators.be/nl/t/SDI/
Milieudruk indicatoren productieactiviteiten (ontkoppelingsindicator
Centraal Bureau voor de Statistiek http://www.monitorduurzaamnederland.nl/docs/MDN_2014_h4.pdf

38
en) Voetafdruk indicatoren
Milieurekeningen NL Centraal Bureau voor de Statistiek https://www.cbs.nl/nl-nl/onze-diensten/methoden/onderzoeksomschrijvingen/korte-onderzoeksbeschrijvingen/milieurekeningen
Expanding the material monitor
Centraal Bureau voor de Statistiek https://www.cbs.nl/nl-nl/achtergrond/2015/45/expanding-the-material-flow-monitor
Life Cycle Assessment7
based indicators ETC – VITO https://www.eea.europa.eu/publications/circular-by-design And VITO preparatory work for compiling this report within the framework of the European Topic Centre on Waste and Materials in the Green economy
Product Environmental Footprints (PEF) indicators
EC
Resource footprint indicator based on Cumulative Exergy Extracted from the Natural Environment (CEENE) by a specific product
ETC – VITO https://www.eea.europa.eu/publications/circular-by-design And VITO preparatory work for compiling this report within the framework of the European Topic Centre on Waste and Materials in the Green economy
Recyclability benefit indicator & Energy recoverability benefit rate
EC – JRC http://eplca.jrc.ec.europa.eu/uploads/ecodesign-Refined-methods-and-guidance-documents-final.pdf Guidance document on Recyclability Benefit Rate (in Annex 2 – guidance document on ‘use of priority resources’ in JRC technical report ‘Integration of resource efficiency and waste management criteria in European product policies – second phase’ Report no 3. Refined methods and guidance documents for the calculation of indices concerning Reusability/Recyclability/Recoverability, Recycled content, Use of priority resources, Use of hazardous substances, Durability (final). F. Ardente and F. Mathieux (2012).
Other indicators that are under development measure specific characteristics of a product, such as recycled content, recyclability or repairability
ETC – VITO https://www.eea.europa.eu/publications/circular-by-design And VITO preparatory work for compiling this report within the framework of the European Topic Centre on Waste and Materials in the Green economy
Other indicators that may be of relevance, but focus on more specific aspects: - Amount of
hazardous substances that are
ETC – VITO https://www.eea.europa.eu/publications/circular-by-design And VITO preparatory work for compiling this report within the framework of the European Topic Centre on Waste and Materials in the Green economy
7 Life Cycle Assessment is a method to systematically evaluate the potential environmental impacts of a product, process, or
service. It compiles the material and energy flows (inputs and outputs) of each stage of the life cycle and calculates related environmental impacts. There are numerous environmental impacts to consider in an LCA, such as energy use, water use, land use, toxicity, creation of waste, and emissions to air, water and soil. Commonly used environmental impact categories are for example: Acidification, Climate change, Depletion of abiotic resources, Ecotoxicity, Energy consumption, Eutrophication, Human toxicity, Landfill use, Ozone depletion, Photochemical oxidation, Water use/depletion

39
present in the product: number of different materials in a product: the more complex the composition the harder the safe dismantling/recycling
- Assembly methods of products
- Technical and actual lifespan of products
- iFixit reparability index
Leakages from material cycles:
Urban mining indicators
Life cycle indicators basket of products
EC, JRC http://eplca.jrc.ec.europa.eu/uploads/LC-indicators-Basket-of-products.pdf http://eplca.jrc.ec.europa.eu/uploads/JRC92892_qms_h08_lcind_deliverable5_final_20141125.pdf
Assessment of governance and infrastructure aspects - The degree to which
collection, repair, reuse and recycling infrastructure is in place.
- Degree to which economic incentives, legislation or comparable rules are in place and enforced regarding product standards, standards for reused or recycled products/raw materials, waste management, better materials management
- Degree to which business is involved in managing material cycles in a circular way and is empowered to make the right decisions, either on an obligatory or voluntary basis
- Degree to which circular business models are adopted
- Degree to which citizens are involved
ETC – VITO https://www.eea.europa.eu/publications/circular-by-design And VITO preparatory work for compiling this report within the framework of the European Topic Centre on Waste and Materials in the Green economy
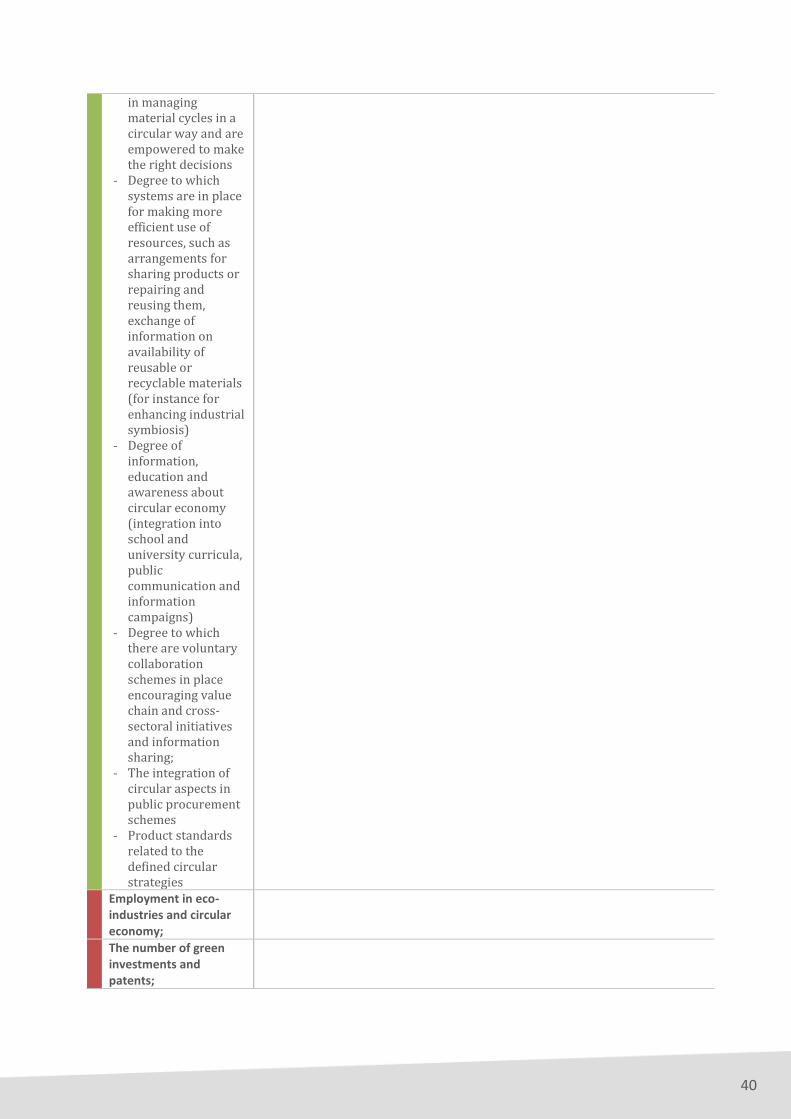
40
in managing material cycles in a circular way and are empowered to make the right decisions
- Degree to which systems are in place for making more efficient use of resources, such as arrangements for sharing products or repairing and reusing them, exchange of information on availability of reusable or recyclable materials (for instance for enhancing industrial symbiosis)
- Degree of information, education and awareness about circular economy (integration into school and university curricula, public communication and information campaigns)
- Degree to which there are voluntary collaboration schemes in place encouraging value chain and cross-sectoral initiatives and information sharing;
- The integration of circular aspects in public procurement schemes
- Product standards related to the defined circular strategies
Employment in eco-industries and circular economy;
The number of green investments and patents;

41

ce-centre.be
CIRCULAR ECONOMYPOLICY RESEARCHCENTRE
OVAMWE MAKE
TOMORROWB E AUT I FUL
DEPARTMENT OFECONOMYSCIENCE &INNOVATION ce-centre.beOVAM
WE MAKETOMORROWB E AUT I FUL
DEPARTMENT OFECONOMYSCIENCE &INNOVATION
CIRCULAR ECONOMYPOLICY RESEARCHCENTRE
SUMMA
Disclaimer:This publication reflects the views only of the author, and the Flemish Government cannot be heldresponsible for any use which may be made of the information contained therein.