Circular Economy - Swachh Bharat Mission
136
-
Upload
khangminh22 -
Category
Documents
-
view
0 -
download
0
Transcript of Circular Economy - Swachh Bharat Mission


ii
Executive Summary Executive Summary
This report attempts to provide a comprehensive, implementable and forward-looking action plan for the management of municipal solid & liquid waste. It also aims to promote India’s transition from a linear ‘take-make-waste’ mindset to a multi lifecycle circular approach.
The report has been divided into five key chapters focusing on dry waste, wet waste, construction and demolition waste, wastewater and municipal sludge. Each chapter highlights current scenario, identifies key challenges, gaps in policy framework & regulations, showcases best practices and makes recommendations for moving towards circular economy.
I. Dry Waste
Dry waste is the most valued waste stream in municipal solid waste owing to high economic value of its components, especially recyclables. India currently generates approximately 1.45 lakh metric tonnes of solid waste per day, 35% of which is dry waste. It consists of different components such as plastic, paper & cardboard, glass & ceramic, metals, textiles, tyres & rubbers, etc. Currently, lack of comprehensive methods for plastic waste management, limited collection & recycling of single use plastic and unscientific methods of recycling by informal sector pose some of the key challenges in this area. Along with this, policy & regulatory gaps such as lack of incentives to encourage recycled products and complex EPR frameworks, amongst others, have inhibited the potential of dry waste in the circular economy.
The sub-committee recommends (i) a comprehensive policy on mandatory use of certain percentage of recycled material in lieu of virgin material, (ii) expeditious implementation of EPR framework and (iii) rebate in tax/ GST on recycled products to increase its competitiveness.
II. Wet Waste
Wet waste, also known as biodegradable waste, includes cooked and uncooked food, waste from fruits and flowers, fallen leaves, and other similar things. Till now, wet waste processing has predominantly relied on aerobic composting and is yet to leverage the advantages of bio-methanation to its fullest. Bio-methanation can be significantly more profitable than traditional composting, especially for towns/ clusters having population of 3 lakhs and above, provided a conducive market is created for the usage of its end-products.
The key to the success of circularity in wet waste lies in effective source segregation of waste. The sub-committee also suggests (i) unbundling of sanitary landfills from SWM functions, (ii) relaxation of environmental clearance for waste processing plants and (iii) incentivizing of biogas plants through SATAT.

iii
III. Construction and Demolition Waste
C&D waste generation normally varies from 5-25% of the MSW generated in ULBs. However, due to inadequate capacity of C&D waste processing facilities, material value of C&D waste is lost into landfills, causing huge environmental and economic losses.
C&D waste management helps to suppress dust generation, thus significantly reducing air pollution. Additionally, it conserves precious resources and minerals and helps in promoting use of recycled products for construction & other infrastructural projects.
Complete circularity in C&D waste management can be achieved by implementing a comprehensive strategy and action plan covering the lifecycle of construction projects, including dismantling phase. The sub-committee recommends (i) reduction in virgin construction raw material usage in different building projects and (ii) extending tax rebates on recycled C&D products.
IV. Wastewater
Water demand is set to increase with India’s rapidly growing urban population. This, however, is not matched by corresponding increase in water resources. Wastewater recycling and reuse offers a reliable, long-term source of water supply to help meet non-potable water demand.
The sub-committee recommends creation of adequate sewage treatment capacity to meet the requirement of sewage generation in a time-bound manner. It also recommends targets for recycle and reuse of treated wastewater in the short, mid and long-term, at 25% by 2026, 35% by 2036 and 50% by 2050 respectively. The sub-committee recommends (i) preparation of new standards for designated reuse, (ii) framing of Wastewater Reuse policy by States/ UTs, (iii) creation of institutional mechanism to promote circular economy in wastewater and (iv) mandatory use of recycled water in industries, especially in thermal power plants.
V. Municipal Sludge
Approximately 60% of India’s population is dependent on on-site sanitation systems and remaining 40% on off-site systems. Sludge is generated from both systems and needs to be managed appropriately, with minimal adverse effects on the environment. Sludge utilisation in India is currently being done in an unscientific manner without adequate regulatory standards, which leads to indiscriminate sludge disposal on land and in water bodies. Due to low levels of awareness, the by-products of sludge have low market demand.
The report attempts to demonstrate how treated sludge can be utilised as a resource. To realize this objective, the sub-committee recommends (i) introducing national policy on sludge reuse/ recycle, (ii) introducing comprehensive standards on recycle and reuse of processed sludge and (iii) incentivising tagging of compost with chemical fertilizers and biogas with SATAT.

iv
Table of Contents
Foreword .......................................................................................................................... i
Executive Summary ........................................................................................................ ii
Table of Contents ............................................................................................................iv
List of Figures ..................................................................................................................vi
List of Tables ................................................................................................................. viii
Chapter I: Introduction ..................................................................................................... 1
Chapter II: Report of Sub-Committee on Dry waste ........................................................ 5
2.1 Introduction ............................................................................................................ 6
2.2 Current Scenario of Dry Waste Management & Challenges .................................. 7
2.3 Potential of Dry Waste in Circular Economy ........................................................ 12
2.4 Gaps in Policy, Regulations and Infrastructure .................................................... 13
2.5 Technology Options and Business Models .......................................................... 16
2.6 Recommendations .............................................................................................. 19
Chapter III: Report of Sub-Committee on Wet waste .................................................... 22
3.1 Introduction .......................................................................................................... 23
3.2 Current Scenario and Challenges ....................................................................... 25
3.3 Challenges in Wet Waste Management .............................................................. 26
3.4 Potential of Wet Waste Management in Circular Economy ................................. 26
3.5 Technology Options and Business Viability Models ............................................ 28
3.6 Recommendations and Action Plans ................................................................... 30
Chapter IV: Report of Sub-Committee on Construction & Demolition waste ................. 35
4.1 Introduction .......................................................................................................... 36
4.2 Current Scenario and Challenges in C&D Waste Management .......................... 38
4.3 Circularity & Potential of C&D Waste................................................................... 42
4.4 Gaps in Policy & Regulatory framework in India .................................................. 46
4.5 Technology Options& Business Viability Models ................................................. 47
4.6 Comprehensive Action Plan & Recommendations .............................................. 50

v
Chapter V: Report of Sub-Committee on Recycle and Reuse of Treated Municipal Sewage (Wastewater) ................................................................................................... 56
5.1 Introduction .......................................................................................................... 57
5.2 Potential for Circularity in Water- wastewater Sector .......................................... 58
5.3 Current Approach and Challenges ...................................................................... 59
5.4 Gaps in Policy and Regulations ........................................................................... 65
5.5 Recommendations and Action Plan .................................................................... 70
Chapter VI: Report of Sub-Committee on Recycle and Reuse of Treated Municipal Sewage ......................................................................................................................... 78
6.1 Introduction .......................................................................................................... 79
6.2 Current Scenario & Challenges ........................................................................... 80
6.3 Potential for Circularity in Sludge ........................................................................ 87
6.4 Gaps & Challenges in Current Approach ............................................................. 88
6.5 Technology Options ............................................................................................ 90
6.6 Recommendations and Action Plans ................................................................... 90
Chapter VII: Conclusion and Recommendations ........................................................... 94
Annexures ................................................................................................................... 100
Annexure 1: Circular Economy for Dry Waste .......................................................... 101
Annexure 2: Circular Economy for Wet Waste ......................................................... 107
Annexure 3: Circular Economy for Construction & Demolition Waste ...................... 110
Annexure 4: Circular Economy for Recycle and Reuse of Treated Municipal Sewage (Wastewater) ............................................................................................................ 112
Annexure 5: Circular Economy for Recycle and Reuse of Treated Sludge .............. 114

vi
List of Figures
Figure 1: Value Realization Potential from Circular Business Models by 2030 ............... 3 Figure 2: Municipal Solid Waste Composition ................................................................. 6 Figure 3: Dry Waste Composition in MSW ...................................................................... 7 Figure 4: Annual Per Capita Plastic Consumption .......................................................... 8 Figure 5: Plastic Waste Composition ............................................................................... 8 Figure 6: Recyclability of Plastic Categories ................................................................... 9 Figure 7: Material flows in the plastic waste value chain system ................................... 12 Figure 8: Automated MRF at Indore .............................................................................. 17 Figure 9: Five Business models for Circular economy .................................................. 17 Figure 10: Circular Economy Business models in Plastics Value Chain ....................... 18 Figure 11: Digital Intervention in Waste Management ................................................... 18 Figure 12: Graphical representation of MSW Composition ........................................... 23 Figure 13: Wet waste processing through Bio-methanation .......................................... 24 Figure 14: Typical Circularity in Biomethanation Process Flow ..................................... 28 Figure 15: A view of 20 TPD Bio-methanation Plant at Indore ...................................... 33 Figure 16: High Rate Biomethanation Plant at Toranagallu (Bellary), Karnataka .......... 33 Figure 17: 3R strategies for Construction & Demolition Waste ..................................... 37 Figure 18: Composition of C&D Waste in India ............................................................. 39 Figure 19: Types of C&D waste .................................................................................... 40 Figure 20: Annual generation & recovery rate of C&D waste in some countries ........... 41 Figure 21: Challenges of C&D Waste Management ...................................................... 42 Figure 22: Circularity in C&DWM -Building life cycle with conventional method and design for deconstruction (DfD) ..................................................................................... 43 Figure 23: C&D waste Handling in India ........................................................................ 45 Figure 24: Economic Potential from C&D Waste ........................................................... 46 Figure 25: Process layout for Wet Processing of C&D waste ........................................ 48 Figure 26: Process Steps for Dry Processing of C&D Waste ........................................ 48 Figure 27: Wastewater in the water cycle (Source: WWAP) ......................................... 57 Figure 28: Water in Circular Economy (Source: Water Reuse Europe Review 2018 ... 58 Figure 29: Incremental Technology interventions to achieve End Use Water Quality Standards (Source: Draft National Policy on the Safe Reuse of Treated Wastewater, India- EU Partnership) ................................................................................................... 60 Figure 30: Aerial view of Sewage Treatment Plant ....................................................... 61 Figure 31: Global water reuse after advanced (tertiary) treatment: Market share by application (Source: Lautze et al. (2014)) ...................................................................... 61 Figure 32: EU - Timeline of regulatory initiatives relating to water reuse (Source: Water Reuse Europe Review 2018) ........................................................................................ 62 Figure 33: Water consumption pattern in water scarce state California, USA ............... 63 Figure 34: Regulatory Framework for Wastewater Recycling & Reuse ......................... 64

vii
Figure 35: Case studies of wastewater reuse projects in India ..................................... 66 Figure 36: Goals set for Wastewater Recycling & Reuse .............................................. 71 Figure 37: Composting .................................................................................................. 79 Figure 38: 345 MLD Lucknow UASB based STP along with Sludge Drying Bed .......... 80 Figure 39: Nutrient/energy recovery from various FSTPs ............................................. 80 Figure 40: Bio-Gas Plant ............................................................................................... 81 Figure 41: Land Application of sludge ........................................................................... 85 Figure 42: Faecal-oral transmission of pathogen .......................................................... 87 Figure 43: Sludge Drying Bed ....................................................................................... 90

viii
List of Tables Table 1: Recommendations for Dry waste .................................................................... 19 Table 2: Indicative Economic Benefit for 50TPD Wet Waste Processing ...................... 27 Table 3: Types and scale of composting process ......................................................... 29 Table 4: Recommendations and Action Plans for Wet waste circularity ........................ 30 Table 5: C&D waste generation with respect to population categories* ........................ 40 Table 6: Benefits of C&D Waste Management .............................................................. 41 Table 7: Approaches for introducing Circularity ............................................................. 43 Table 8: Applications of C&D Waste Recycled Material ................................................ 44 Table 9: Comprehensive Action Plan for C&D Waste Circularity .................................. 50 Table 10: Recommendations for C&D Waste Circularity ............................................... 54 Table 11: Detailed Action Plan – National Level ........................................................... 72 Table 12: Detailed Action Plan – State Level and including ULBs ................................ 73 Table 13: Detailed Action Plan – National and State Level – co-ordinated ................... 74 Table 14: Estimates for financial, economic and environmental benefits ...................... 75 Table 15: Estimates for GHG reduction ......................................................................... 75 Table 16: Legal initiatives of Germany .......................................................................... 86 Table 17: Actionable points for Recycle and Reuse of Treated Sludge......................... 91


2
Introduction "……it is our conviction that we have no right to snatch from our future generations their right to have a clean and beautiful earth. It is part of our thinking and for that reason we do not believe in exploitation of nature. We people do not have the right to take more than necessary from nature."
—Prime Minister, Shri Narendra Modi St Petersburg International Economic Forum, 2017
Since time immemorial, Indian civilization has focused on conservation of resources. This has been an integral aspect of the Indian psyche and is reflected in our religious practices, folklore, art and culture permeating every aspect of the daily lives of people. The principles of sustainable development and climate consciousness can be traced back to our heritage of treating ‘waste as wealth’, with commodities being reused and recycled in multiple ways through a circular economy approach.
However, unprecedented levels of urbanization in India and emergence of new mega-cities, along with growth in population has resulted in massive increase in consumption and subsequently, generation of waste. Economic boom in India has witnessed a six-fold rise in annual material consumption between 1970 and 2015, from 1.18 billion to 7 billion tonnes, and expected to rise further to about 14.2 billion tonnes by 20301. This has led to a significant increase in waste generation. Efficiently managing this waste in an economically and environmentally beneficial manner poses several operational challenges and requires investment of significant resources. In this backdrop, the principles of circular economy - that integrates economic activity and environmental wellbeing in a sustainable way - are being mainstreamed now and are gaining global popularity in various fields, including in solid and liquid waste management. A typical linear economy adopts a ‘take-make-waste’ approach, whereas circular economy places emphasis on ‘true recycling’ of materials, i.e. converting the waste resource back to its original form, without sacrificing quality or integrity in the process. This, in turn, not only contributes to the development of sustainable business models but also reduces emissions and increases efficient use of natural resources.
1 https://www.orfonline.org/expert-speak/india-rebuilds-economy-time-make-circular-sustainable/

3
Circular economy-based development approach is one of the key strategies being adopted for achieving the 2030 Agenda for Sustainable Development Goals (SDGs). The economic advantages of this model are also evident in the numbers. A recent study by Accenture suggested that India can unlock approximately half-a-trillion dollars of economic value by 2030 through adoption of Circular Economy business models. As shown in Figure 1, this can be achieved by a combination of strategies - reduction in waste generation and energy consumption, improved utilization of products/ assets, product life extension, and value recovery from waste streams.
Figure 1: Value Realization Potential from Circular Business Models by 2030 (Source-Accenture 2019)
In India, an estimated 55 million tonnes of Municipal Solid Waste is generated annually by 377 million citizens residing in urban areas. India’s urban population is expected to grow to 600 million by 2030 & to 814 million by 2050. Accordingly, India is set to generate 165 million tonnes of waste by 2030 and 436 million tonnes by 2050. As a result, the annual greenhouse gas emissions from Municipal Solid Waste are expected to go up to 41.09 million tonnes by 20302. The need of the hour is therefore a development model based on the circular economy approach that looks at sustainable waste management and optimum utilization of resources - key to an AatmaNirbhar Bharat. Municipal solid waste may be categorized into wet waste, dry waste and construction and demolition waste. An analysis by MoHUA identifies significant potential for resource recovery from these waste categories through circular economy. For example, dry waste recycling has a potential to generate approximately ₹11,836 crores per annum, and compost and Bio- CNG from wet waste can generate revenues of nearly ₹365 crores and
2 https://www.nama-facility.org/projects/india-waste-solutions-for-a-circular-economy/
4
₹1,679 crores per annum respectively. Similarly, C&D waste has the potential to generate revenues of approximately ₹416 crores per annum. A similar trend is seen in the liquid waste space with revenues amounting to ₹6,570 crores and ₹3,285 crores per annum for treated sludge and wastewater respectively3. In recent times, the Government has been actively formulating policies and promoting projects to drive the country towards a circular economy. In the area of municipal solid & liquid waste, a variety of policies and rules4 have been notified to encourage scientific processing of waste along with resource recovery. The circular economy agenda in municipal solid & liquid waste received significant push at the national, state and city levels with the launch of Swachh Bharat Mission-Urban (SBM-U) in 2014. The Mission built upon the foundation of the 3R principles (reduce, reuse, recycle), has been able to successfully increase urban India's solid waste treatment capacity from 18% in 2014 to 68% today (including recycling). Success stories abound with states like Chhattisgarh having attained zero-landfill status and cities like Indore practising 100% source segregation of waste. In the next phase of SBM-U, it is planned to scale up and institutionalize these processes across urban India for greater economic, environmental and social benefits. In the backdrop of the above, NITI Aayog had identified 11 focus areas in waste generation that pose considerable challenges and need to be addressed holistically through a comprehensive circular economy framework. This report, which forms part of a larger document on ‘Transitioning from a Linear to Circular Economy: An Impetus for India’s AatmaNirbhar Bharat Abhiyan’ by NITI Aayog, attempts to identify and recommend financially viable and sustainable business models for reusing solid and liquid waste and thus create a conducive ecosystem for circular economy to thrive. Municipal solid & liquid waste has been further divided into five sub-categories viz. dry waste, wet waste, construction and demolition waste, wastewater and treated sludge. Five sub-Committees were formed to give shape to the recommendations in each of the sub-categories. The study involved multiple stakeholder consultations with concerned ministries and departments, public and private sector, States and Urban Local Bodies, think tanks and industry voices. The holistic approach suggested in this report identifies challenges, opportunities, best practices and suggests an actionable roadmap for circular economy in municipal solid & liquid waste that would lead to economic, social and environmental benefits for the country. In summary, a combination of robust policies coupled with effective on-ground implementation and the commitment of people to move towards a sustainable way of life holds key to future success of waste management and circular economy programs.
3 The projections are based on the assumption of 100% segregation and processing at existing market rates 4 Solid Waste Management Rules 2016, Plastic Waste Management Rules 2016, Construction and Demolition Waste Management Rules 2016, Policy on Promotion of City Compost, National Faecal Sludge and Septage Management Policy 2017


6
2.1 Introduction Dry waste consists of recyclables such as plastic, paper, cardboard, metals, glass, rubber, non-recyclables and other combustible. It is the most valued waste stream in municipal solid waste owing to high economic value of its components, especially recyclables. Rapid urbanization and economic growth have led to changing consumption patterns. Economic prosperity has also resulted in increase in potential value of recyclable fractions necessitating the adoption of circular economy principles for resource recovery.
Figure 2: Municipal Solid Waste Composition
Considering India’s massive domestic needs due to growing population and economic advancement, resource offsetting measures are required to reduce environmental pollution and climate change effects. These twin challenges of dry waste management and growing resource requirements can be converted into an opportunity. Dry waste management using circularity principles can help India decouple its growth from consumption of primary resources and materials, thus ensuring efficient resource recovery from dry waste. India currently generates approximately 1.45 Lakh metric tonnes of solid waste, 35% of which is dry waste. Thanks to India’s informal sector, a majority of the plastic waste is recycled. India can take inspiration from countries with high recycling rates: Germany (66.1%), Singapore (60.6%), South Korea (59.0%)5 and further improve its resource recovery and recycling. This report focuses on developing a roadmap for implementing circularity principles in dry waste management and help in identifying the regulatory, policy, infrastructural and citizen-centric interventions in dry waste collection, segregation, sorting, processing and recovery of materials for reuse, thus reducing the use of virgin materials.
5 https://comparecamp.com/recycling-statistics/

7
2.2 Current Scenario of Dry Waste Management & Challenges Swachh Bharat Mission (U), launched by Hon’ble Prime Minister Shri Narendra Modi in October 2014 laid out a well-defined roadmap for scientific waste management in the country. As India’s waste composition is changing with increase in dry waste over the last few years and recovery potential that dry waste presents, it is vital to focus on scientific management of all dry waste components shown in the figure 3 below:
Figure 3: Dry Waste Composition in MSW
Out of dry waste components shown above, Plastic is the major component. India generates approximately 9.4 million tonnes per annum plastic waste, (which amounts to 26,000 tonnes per day), and out of this approximately 5.6 million tonnes per annum plastic waste is recycled (i.e. 15,600 tonnes per day) and 3.8 million tonnes per annum plastic waste is left uncollected or littered (9,400 tonnes per day)6. Though plastic recycling in India is almost 3 times the global average, there are no comprehensive methods in place for plastic waste management7. While India’s per capita plastic consumption at 11 kg is much below the global average of 28 kg and just about 10% of per capita consumption in the US8, by 2031, plastic waste generation in India is expected to grow by more than 3 times from current levels.
6 Plastic Waste Management Issues, Solutions & Case Studies, MoHUA, March 2019 7 ibid 8 ibid

8
Figure 4: Annual Per Capita Plastic Consumption
The composition of plastic waste in India among seven basic plastic categories is depicted in the figure 5 9:
Figure 5: Plastic Waste Composition
2.2.1 Challenges in plastic waste management
• Degradation of plastic due to recycling. Plastic deteriorates and its life span is reduced with recycling. The recycling of a virgin plastic material can be done 2-3 times only and
9 CPCB 2015

9
recycled plastic is of lower quality than virgin plastic. Hence recycling is not a safe and permanent solution for plastic waste disposal.
• Recyclability of Plastic Categories. Of the 7 categories of plastics, PET bottles and HDPE are the easiest to recycle, hence leading to higher demand and more recycling of PET and HDPE products. PVC and PS on the other hand are difficult to recycle and therefore there is less collection and recycling of PVC and PS waste. Current regulations do not take these aspects into consideration leading to dumping of plastic waste into the environment, reduced recovery and recycling.
Figure 6: Recyclability of Plastic Categories
• Collection and Recycling of Single Use Plastics (SUPs) and Multilayer & laminated plastics (MLPs)
o Single use plastics (SUPs) are cheap, convenient, and easily available, but over dependence on SUP items has led to manifold adverse consequences on the environment (land, air, water pollution) and society due to low economic value leading to poor collection and recycling.
o Multilayer & laminated plastics (MLPs) include snack packets, biscuit packets etc. made from heterogeneous materials making it difficult to recycle as there are no sustainable and reliable recycling options of such materials.
• Marine Plastic. India is considered the twelfth-largest source of marine litter and is projected to become the fifth largest by 2025. Of the 8 million tonnes of plastic waste that ends up in the world’s oceans annually, Meghna-Brahmaputra-Ganges river system dumps close to 73 thousand tonnes making it the 6th most polluting river system contributing to marine plastic waste in the world10.
• Bioplastics. Bioplastics are made wholly or in part from renewable biomass sources such as sugarcane and corn, or from microbes such as yeast. With the directive of banning
10 https://www.unenvironment.org/interactive/beat-plastic-pollution/

10
single use plastics, bioplastics are a good alternative to single use plastics but there are following risks and challenges with use of bioplastics: • Significant GHG emissions from processing bio-feedstocks into plastics • Some bioplastics are chemically identical to fossil-fuel based plastic and non-
biodegradable • Problematic if not identified and collected separately, resulting in getting mixed with
recyclable plastics • Modified recycling and recovery infrastructure required to process bioplastics 2.2.2 Challenges in Other Dry Waste Components
i. Processing of Tetra Pak. Commonly used compound packaging such as Tetra Pak comprises three recyclable components i.e. 75% paper, 20% polyethylene and 5% aluminium thereby making its recycling difficult and cost intensive.
ii. Segregation of metals and unscientific recycling by informal sector. Contamination of metals with bio-degradable waste is a critical matter of concern due to toxicity of metals. Though segregation of metals from other waste streams is relatively easy due to high density of metals, small metal scraps are often lost due to inefficient segregated waste collection and waste tracking, resulting in loss of valuable metal resources.
iii. Issues in recycling of glass and ceramic waste: Approximately 45% of glass is recycled in India11. Risks of injuries and issue of breakages while handling glass and ceramics makes it less attractive to recyclers and handlers. Though glass segregated by colours has an established market, yet lack of segregation and availability of glass is neither reported nor is there an established mechanism of communication between cities and the glass recycling industry.
iv. Segregated collection and processing of textile waste. A McArthur Report estimates that globally the production of clothes has doubled in the last 15 years while the time duration for which clothing is worn before it is thrown away has fallen by approximately 40% leading to more textile waste12. The Indian Textiles industry in India reports that more than 1 million tons of textiles are discarded every year, with most of this coming from household sources. While the industry has a recycling potential of 50%, at present only 25% is being recycled/ reused. Even though age-old circular (reuse and refurbish) barter system still exists in small towns, there is limited collection and recycling system for textiles.
11 https://greensutra.in/glass-recycling-process/ 12 https://www.ellenmacarthurfoundation.org/explore/fashion-and-the-circular-economy

11
v. Processing of tyres and rubber. With the growth of automobile sector, the tyre industry is also growing fast. It is estimated that India currently produces about 6,50,000 tyres and discards 2,75,000 every day13, generating over a million tonnes of ELTs (End of Life Tyres) each year14. Currently, there is no tracking of discarded tyres and monitoring of their disposal across India. Though re-treading of tyres by unorganized sector is a common practice, a large portion of the scrap tyres are dumped in landfills.
vi. Localized processing facilities for Thermocol. Thermocol (Expanded polystyrene) finds wide scale application as packaging goods (especially electronic goods) and is an excellent material for the construction and decorating industry due to its insulating properties and light weight. Though it is a technically recyclable material, its transportation is a challenge due to its ultra-low density and high volume resulting in limited processing/recycling.
vii. Recycling of coconut waste. With 72% of world’s production in India and coconut’s role in Indian culture, it is an important waste component. In recent years, due to increased demand for recycling, coconut shells are being segregated and shredded by informal workers. But in smaller and remote cities segregation, transportation and logistics cost of coconut waste act as significant barrier for coconut recycling.
viii. Collection and processing of human hair waste. Despite a large-scale economy running around human hair, there is limited scientific management of human hair waste. The collection system is often limited to large generators of hair waste like large temple complexes, whereas small units generating hair waste such as salons, beauty parlours, etc. are not connected to the collection system. The efficient and environmentally safe utilization of human hair also requires appropriate technologies for different uses of hair waste.
ix. Coverage of Extended Producers Responsibility (EPR). EPR has become the guiding principle as far as plastics and electronic waste management is concerned for enabling investments in the waste value chain to ensure compliance and reduce the use of virgin materials. Presently, the EPR framework in India is being developed under Plastic Waste Management Rules, 2016.
13 Modi 2016 14 Matade 2016

12
2.2.3 Challenges in mainstreaming of informal sector Informal sector plays a major role in the making the material flow of dry waste value chain (as schematically shown in figure 7 below) resource efficient and circular by sorting the dry waste into different components and recovering valuable resources.
Figure 7: Material flows in the plastic waste value chain system Yet, lack of integration of informal sector into the mainstream recycling industry leads to limiting their involvement to only certain fractions of waste. Furthermore, these workers are plagued with low wages and exposed to significant health risks. 2.3 Potential of Dry Waste in Circular Economy The adoption of circular economy requires a shift in approach - a shift from linear – take-make-waste model to a full multi-life-cycle circular model. According to a KPMG study, the savings from circular economy in India are estimated at US$ 624 billion in year 2050, for the current development trend15. To move towards a circular economy in dry waste, the design and material aspect related to production must be addressed. Recycling is a crucial part of the circular economy, but the goal of “true recycling” is that of converting the waste resource back to its original form, without sacrificing quality or integrity in the process. The recycled material should be at par with what was originally created using virgin raw material, for true circularity.
15 Potential Economic Pay-off of a Circular Economy, 28th April, 2020

13
Material recycling facilities can play significant role in making dry waste management circular. If implemented, material recycling facilities can help improve recovery from ₹5,187 crores/annum to ₹17,023 crores/annum by 2025 thus adding ₹11,836 crores to economy per annum. MRFs will also help to generate employment of 40 Lakh person-days during construction of MRFs and ~80 Lakh person-days in perpetuity for operations & maintenance of these facilities. Detailed calculations are enclosed in Annexure 1.1. Contribution to Climate Change Mitigation The waste sector (including dry waste) accounts for 3.7% of India’s total national-level GHG emissions. Whilst the aggregate contribution may be insignificant when compared to sectors like land energy or land use change, waste sector emissions have risen at a compound annual growth rate (CAGR) of 4.2% during 2005-201516. The GHG emissions per tonne of solid waste disposed have also increased by 2.7 times, rising from 85 kg of CO2 per tonne of solid waste disposed during 1954-60 to 227 kg of CO2 per tonne of solid waste disposed during 2005-2015. Hence scientific waste management can play an important role in mitigation of GHG emissions. Applying circularity principles in dry waste management can help India achieve its GHG emissions reduction commitments faster. For example, if ‘refill’ bottle designs and models were to be applied to all bottles in cosmetics, personal care as well as home cleaning, packaging and transport savings would represent an 80–85% reduction in GHG emissions compared to today’s traditional single-use bottles17. 2.4 Gaps in Policy, Regulations and Infrastructure MoEF&CC have enacted several policies and regulations to implement the solid waste management roadmap, primarily through the Solid Waste Management (SWM) Rules, 2016, Plastic Waste Management (PWM) Rules, 2016 and 2018. Also, MoHUA has brought out comprehensive manual on solid waste management and various advisories for dry waste management:
• Plastic Waste Management Issues, Solutions & Case Studies • Advisory on Material Recovery Facility (MRF) for Municipal Solid Waste • Guidelines on usage of Refuse Derived Fuel in various industries
16 https://www.youthkiawaaz.com/2019/11/what-a-waste-ghg-emissions-from-indias-waste-sector-and-what-can-be-done/ 17 Ellen McArthur Foundation, 2020

14
More recently, National Resource Efficiency Policy (NREP), 2019 was prepared to create a facilitative and regulatory environment to mainstream resource efficiency across all sectors. One of the guiding principles of NREP, 2019 is waste minimization. Dry waste sub-committee assessed these and took into consideration various dry waste streams with the objectives of zero waste, zero burning, zero landfill and zero pollution to identify policy, regulations and infrastructure gaps: Policy Gaps While the current dry waste regulations seek to address the wastes’ life cycles, that is from its generation to the end-of-life disposal, there are opportunities to leverage policy to accelerate the shift from waste management to an integrated circular economy. A circular economy approach entails creating incentives for businesses to innovate models that monetise their efforts in addressing the waste challenge. The existing policies need a relook to explore innovative mechanisms, especially on the following aspects:
• No incentives to encourage recycled products/alternatives o There are no incentives for industry to enter recycling business and/or
research and develop upstream solutions/circular alternatives. o Currently the recycled products and alternatives fall under the same GST
brackets as the products made from virgin materials thus there is no provision to encourage use of recycled products/alternatives.
• Policy for Marine Plastic. The growing marine plastic concern in India requires
more focus yet currently there is no policy, rule or guideline which caters to marine plastic waste entering water bodies.
• Policy for Mainstreaming of informal sector. Even though informal sector plays significant role in making dry waste value chain resource efficient and circular, yet there is no policy mandating the mainstreaming of informal sector.
• EPR limited to Plastic & Electronic Waste. Currently EPR framework is limited to only plastic and electronic waste and yet to be fully effective. Lack of EPR framework for other dry waste streams such as Paper, Textile, Tyres/Rubber, Metal and Glass etc. leads to unscientific disposal of these waste streams while also losing valuable resources. Without EPR no circularity can be obtained.
• Inadequate Labelling. Inadequate labelling on products makes it difficult to segregate and categorize products. Products with low recyclability if mixed with
15
products with better recyclability can cause lesser recovery and sub-standard recycled products.
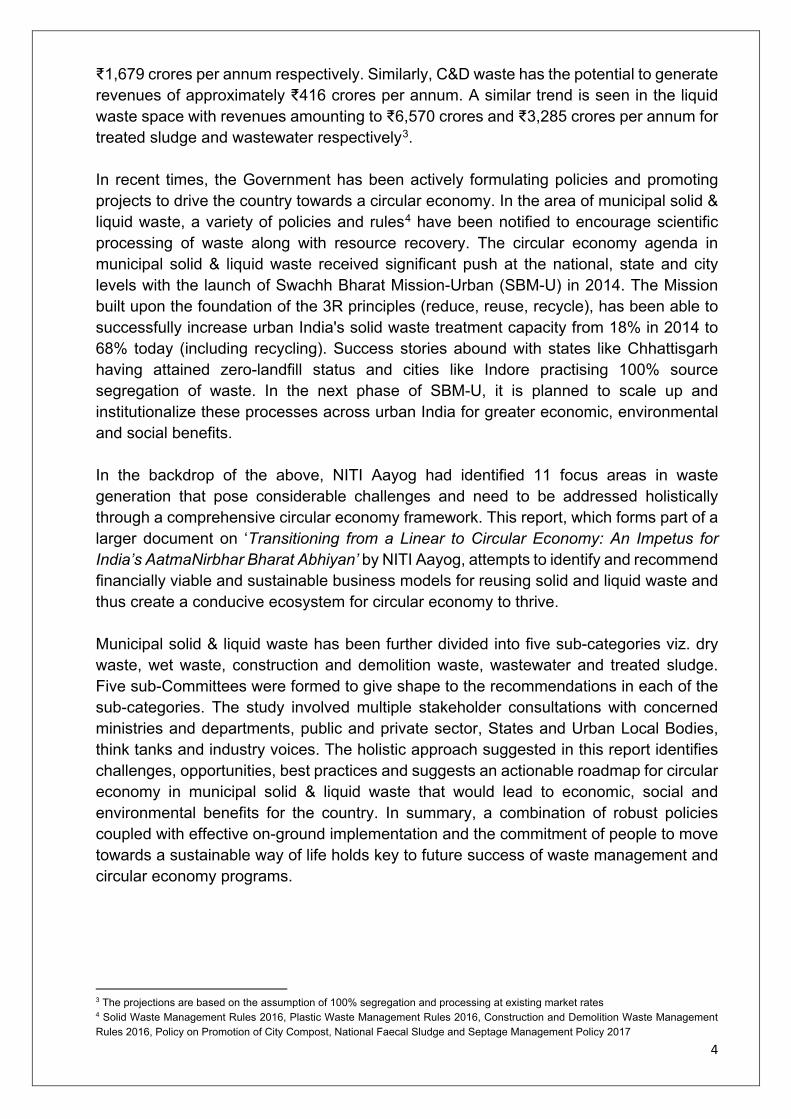
• Inadequate consideration to life cycle impact and recyclability of materials.
Present EPR framework does not take into consideration the environment and life cycle impact of the products or recyclability of the materials used. Such a system does not discourage products such as multi-layered plastics and single-use plastics that are harmful to environment.
• Landfilling of recyclables. At present there is no provision mandating ban on
disposal of recyclables in landfills. Disposing of recyclables in landfills/dumpsites not only leads to loss of valued resources but also causes environment pollution.
Regulatory Gaps
• Complex EPR Framework. Complexity of current EPR framework makes it challenging for manufactures to comply and authorities to monitor making the implementation of EPR framework difficult.
• Lack of unified digital platform for EPR. Currently there is no unified digital
platform to capture end to end operational data and EPR compliance is manually done. Lack of unified digital platform leads to communication gap and processing delays.
• EPR enforcement. The EPR framework is not being enforced, setting a wrong precedent of non-compliance by the industry.
• Compliance by Cement Industry. Some waste processing facilities, generating RDF have not been able to find buyers due to high production cost. As per CERC notification in 2020, RDF was accorded a cost of ₹2084/MT18 to enable RDF plants to recover cost incurred on waste screening and processing cost. But this has not been widely accepted across cement companies. MoHUA has brought out an advisory on use of RDF in cement industry which indicates that the process is viable with payback period of 3-4 year only19.
Infrastructure Gaps
• Limited innovative financing mechanism. There are very few circular businesses, and these require financing support at various stages. Lack of
18 CERC Notification no. RS-14026(11)/4/2020-CERC, 28th April, 2020 19 Guidelines on usage of Refuse Derived Fuel in various industries, September 2018

16
identification of such businesses and extending financial support result in failure of such businesses creating a slip back.
• No single-window clearance. Recycling businesses require multiple clearances
thus delaying the set-up while unorganized sector continue to run their businesses without any clearances.
2.5 Technology Options and Business Models A judicious choice of technology is essential for resource recovery and processing and disposal of municipal solid waste. It is important to utilize the resources by employing a combination of technologies suitable for treating various components of dry waste. Below are some of the technologies for dry waste processing (details enclosed in Annexure 1.2):
• Material Recovery Facilities • Mechanical Recycling • Refuse-Derived Fuel (RDF) for Co-processing • Plastic to Road Construction • Pyrolysis • Gasification • Waste Incineration
Case Study – National: Indore Municipal Corporation’s Material Recovery Facility (MRF) Model (NEPRA Resource Management Pvt. Ltd)
NEPRA Resource Management Pvt. Ltd. is India’s leading dry waste management company that aims to solve several social and environmental challenges through the waste management sector and is working on PPP mode at various locations, including Indore Municipal Corporation (Madhya Pradesh). Its dry waste management achievements in the MRF since 2019 are given in figure 8 below. Such successful MRFs can be replicated in other Metro Cities.

17
Figure 8: Automated MRF at Indore Business Models There are five distinct types of circular business Models that can be adopted20 in dry waste management:
Figure 9: Five Business models for Circular economy21 For example, the five business models for circular economy in the plastic waste value chain (as in Figure 9) can help identify avenues for tackling plastic consumption or even create alternative markets while reducing the need for generating more plastic or producing plastic that has longer life, not aggravating the waste problem.
20 Accelerating India’s Circular Economy Shift. FICCI and Accenture Strategy 2018 21 Accelerating India’s Circular Economy Shift. FICCI and Accenture Strategy 2018

18
Figure 10: Circular Economy Business models in Plastics Value Chain22
Digital Enablement Besides the processing technologies, digital enablement can play a major role in transforming dry waste value chain making it more traceable, accountable, and digitally governed. Below are some of the digital solutions which can improve transparency, traceability and accountability:
Figure 11: Digital Intervention in Waste Management
• Digitization of waste pickers. Waste collectors and waste pickers (Safai Mitras)
are registered in the system and get their ID card suitably authenticated by the concerned Urban Local Body (ULB) and the implementing partner. This will help
22 Making Plastics Circular FICCI Accenture strategy 2019

19
in faster formalisation of informal waste-pickers through digitisation, providing them further access to various Government schemes.
• Digitization of Waste Flow and Material Recovery Facilities. Waste need to be tracked at every stage, from source to concerned waste collector and to material recovery centres. This can be enabled through the unique QR codes, GPS based tracking and role-based access control to ensure security and easy governance.
• Digital Reporting system. Reporting shall be stakeholders’ wise i.e. EPR body, municipal bodies, implementation partners and operations team. Such reports help in analysing waste related data and plan suitable interventions.
• Digital Waste Exchange. App-based waste exchange platform that provides fair price market access to waste pickers, recyclers, companies to transact with each other at fair price.
2.6 Recommendations It is essential to provide direction and monitor actions of each of the stakeholder’s role in the dry waste value chain on a regular basis. In this regard, recommendations (listed below) have been identified in an action-oriented manner to improve circularity in dry waste management by having better material flow efficiencies, cost & material optimization and waste minimization while reducing adverse impacts on human health and environment.
Table 1: Recommendations for Dry waste Policy Interventions
Level Stakeholders Recommendations National MoEF&CC,
MOHUA, CPCB, MoES, MoF, BIS
• Develop circular economy guidelines with circularity targets for each dry waste component
• National policy for marine plastic • Policy for mainstreaming of informal workers,
mandating their formalization • Policy for setting-up Waste Management Parks,
Recycling zones • Make waste management as priority sector for
lending and environmental clearances • Reduce GST to 5% for recycled products and
alternate products • Expand EPR to include other dry-waste
components: Paper, Textile, Rubber, Metals and Glass etc.
• Funding for research & development of product re-design, remanufacturing and alternate materials

20
based on Life Cycle Assessment (LCA) and Material Flow Assessment (MFA)
• Technical guidelines for production, usage, and recycling of bioplastics. Mandate BIS marking
State/ ULBs UDDs, SPCB,
Industry Department
• By-laws and circular economy guidelines in line with national level guidelines
• Introduction of landfill tax for dumping/disposal of any waste in landfill
• Ban on disposal of recyclables in landfills • Focus on Zero Waste to Landfill approach through
the Concessionaire/ RWAs/ WMAs • Regular circularity-based assessments at State
level with ranking system
Regulatory Interventions Type Stakeholders Recommendations
National MoEF&CC, CPCB
• Set up a standing task force to drive and monitor the circular economy initiatives across all dry waste components and value-chain
• Digital platform to capture end to end dry waste material flow data for transparency and traceability
• Mandating use of 25% recycled materials in the non-food grade packaging to ensure uptake of recycled materials.
• Mandate for cement kilns to use 25% RDF (non-recyclable combustible dry waste) replacing coal
• Mandate use of mono-polymers in the production of the packaging products. e.g., PET bottles with HDPE cover/cap and PPP films avoided, to enhance recycling
State/ ULBs UDDs, SPCB
• Mechanism to monitor dry waste processing and rejects at the ULB level to reduce landfilling
• Mandate and enforce segregation, informal sector inclusivity and capacity building initiatives through inclusion in contracts
• Enforcement of penalties in case of non-compliance

21
Infrastructure Interventions Level Stakeholders Recommendations
National MoEF&CC, DPIIT, MoF
• Mechanism for single window clearance • Simplify registration and compliance processes for
recyclers and waste management agencies • Incentives to use RDF in cement kilns to save coal
as a resource and penalties for not using RDF • Land allocation to set-up Waste Management
Parks, Recycling zones • Innovative financing mechanism to support
recycling infrastructure: • Setting up of a Credit Guarantee Fund. • Funding to waste management related start-
ups State/ ULBs UDDs,
SPCB, Industry
Department
• Separate collection systems for SUPs, MLPs etc. • Set up Material Recovery Facilities, connected to
recycling and upcycling facilities • ULB level dashboards for digitally capturing dry
waste collection and management records • Tie-ups with manufacturers under EPR and
cement kilns or waste to energy plants for RDF use
23
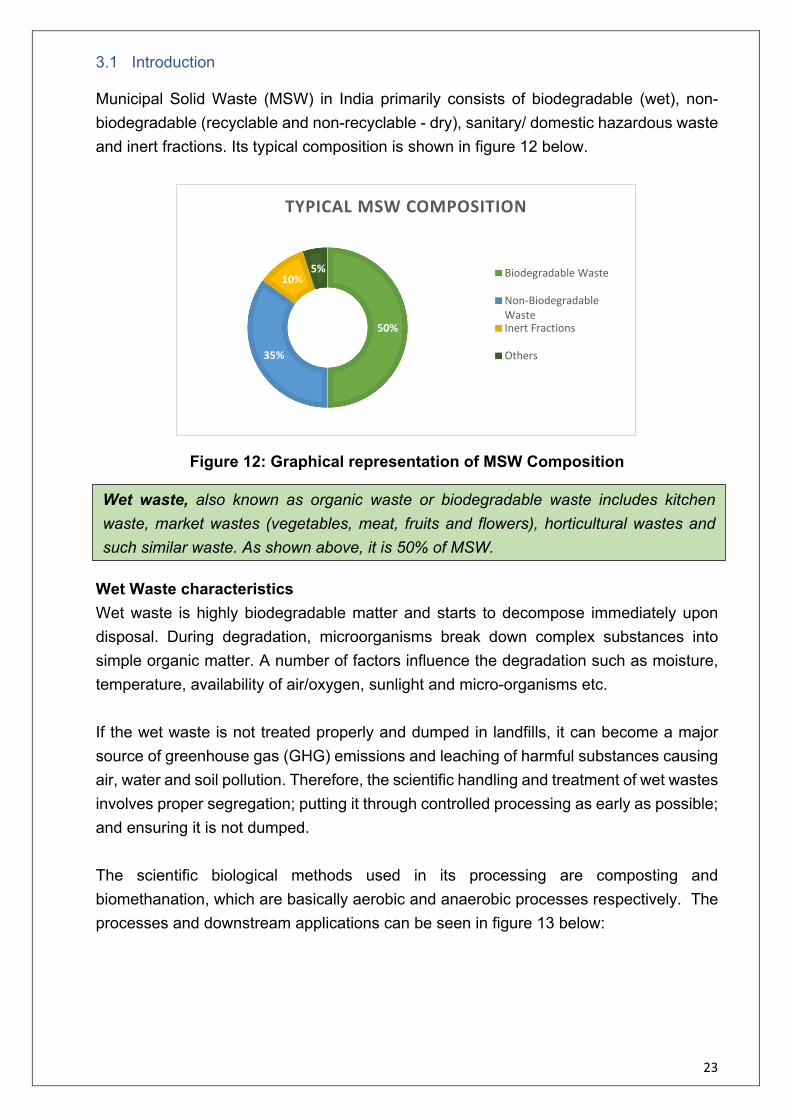
3.1 Introduction Municipal Solid Waste (MSW) in India primarily consists of biodegradable (wet), non-biodegradable (recyclable and non-recyclable - dry), sanitary/ domestic hazardous waste and inert fractions. Its typical composition is shown in figure 12 below.
Figure 12: Graphical representation of MSW Composition
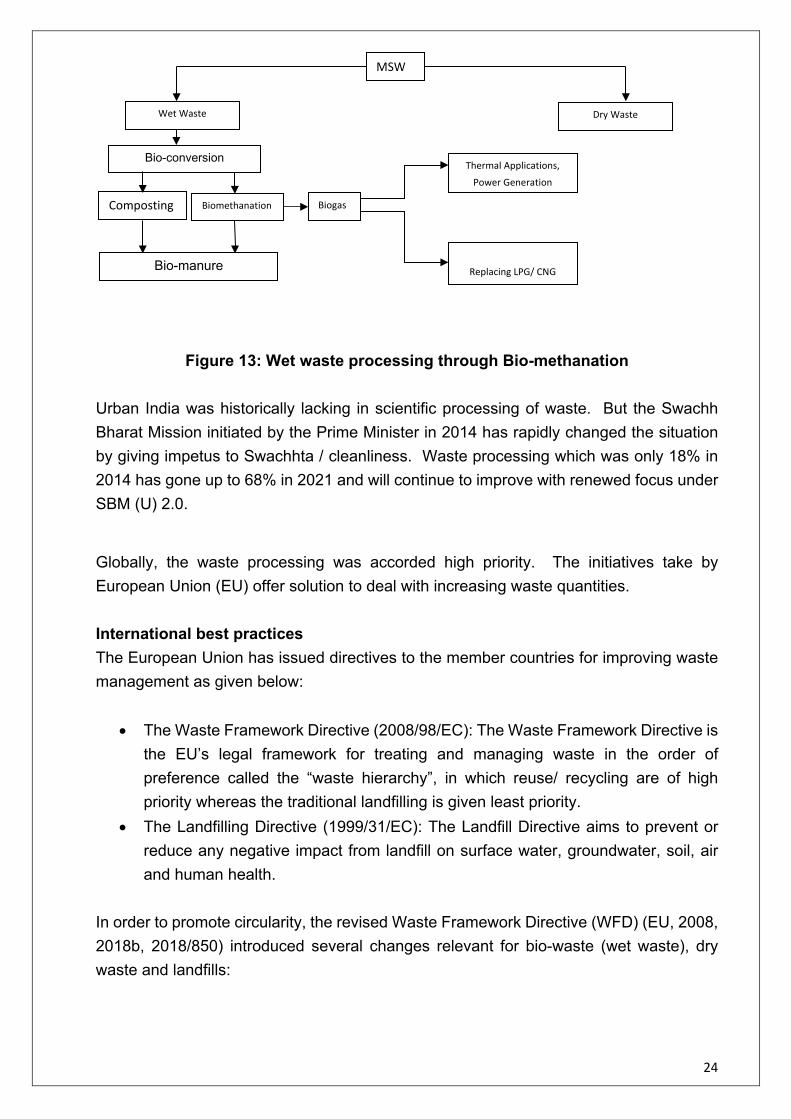
Wet Waste characteristics Wet waste is highly biodegradable matter and starts to decompose immediately upon disposal. During degradation, microorganisms break down complex substances into simple organic matter. A number of factors influence the degradation such as moisture, temperature, availability of air/oxygen, sunlight and micro-organisms etc. If the wet waste is not treated properly and dumped in landfills, it can become a major source of greenhouse gas (GHG) emissions and leaching of harmful substances causing air, water and soil pollution. Therefore, the scientific handling and treatment of wet wastes involves proper segregation; putting it through controlled processing as early as possible; and ensuring it is not dumped. The scientific biological methods used in its processing are composting and biomethanation, which are basically aerobic and anaerobic processes respectively. The processes and downstream applications can be seen in figure 13 below:
50%
35%
10%5%
TYPICAL MSW COMPOSITION
Biodegradable Waste
Non-BiodegradableWasteInert Fractions
Others
Wet waste, also known as organic waste or biodegradable waste includes kitchen waste, market wastes (vegetables, meat, fruits and flowers), horticultural wastes and such similar waste. As shown above, it is 50% of MSW.
24
Figure 13: Wet waste processing through Bio-methanation Urban India was historically lacking in scientific processing of waste. But the Swachh Bharat Mission initiated by the Prime Minister in 2014 has rapidly changed the situation by giving impetus to Swachhta / cleanliness. Waste processing which was only 18% in 2014 has gone up to 68% in 2021 and will continue to improve with renewed focus under SBM (U) 2.0.
Globally, the waste processing was accorded high priority. The initiatives take by European Union (EU) offer solution to deal with increasing waste quantities. International best practices The European Union has issued directives to the member countries for improving waste management as given below:
• The Waste Framework Directive (2008/98/EC): The Waste Framework Directive is the EU’s legal framework for treating and managing waste in the order of preference called the “waste hierarchy”, in which reuse/ recycling are of high priority whereas the traditional landfilling is given least priority.
• The Landfilling Directive (1999/31/EC): The Landfill Directive aims to prevent or reduce any negative impact from landfill on surface water, groundwater, soil, air and human health.
In order to promote circularity, the revised Waste Framework Directive (WFD) (EU, 2008, 2018b, 2018/850) introduced several changes relevant for bio-waste (wet waste), dry waste and landfills:
MSW
Wet Waste
Bio-conversion
Bio-manure
Composting Biomethanation Biogas
Replacing LPG/ CNG
Dry Waste
Thermal Applications,
Power Generation

25
• All EU Member Countries to collect bio-waste separately or ensure recycling at source as other waste management directives are unlikely to be met without proper management of bio-waste;
• an aspirational target to reduce food waste in line with SDG 12.3 • By 2030, waste of any kind suitable for recycling or other recovery contained in
municipal waste, will not be permitted at landfills. • By 2035, the amount of MSW disposed of in landfills is reduced to 10% or less of
the total MSW. Among Asian countries, Japan, Singapore and South Korea have taken up scientific MSWM aggressively and national goals, in the spirit of circularity. In India, the SWM Rules 2016 are on similar lines of waste management policies of EU being enabled under SBM(U) components of scientific MSWM; shared responsibilities for MSWM by private citizens and public authorities, capacity building, innovations for techno-commercial viability and the introduction of healthy competition among ULBs on cleanliness. There is still vast scope for improved MSWM in our country not only in achieving scientific processing, but also by introducing efficient resource recovery and recycling through circular economy principles to become net provider (mine) of input materials to the growing economy. In the subsequent sections, the potential of circularity in wet waste processing along with gaps identified and recommended actions thereof are described. 3.2 Current Scenario and Challenges About 75,000 TPD of wet waste is being generated daily, which continues to grow with population and changing lifestyles. Under SBM (U), about 68% is being processed, leaving a gap of 32%. Projections for SBM (U) 2.0 indicate a requirement of 45,000 TPD processing facilities for wet waste, out of which the compost plants are planned for 30,800 TPD and bio-methanation plants for 15,200 TPD. Current Policy Initiatives In order to encourage scientific processing of wet waste, Government of India has introduced various policy interventions such as:
(i) Market Development Assistance of ₹1,500 per tonne on city compost by M/o Chemicals & Fertilizers to scale up compost production and consumption. For this, compost processing plants have been tagged with fertilizer distribution companies in all States.
(ii) MNRE is providing financial assistance for setting up of Waste to Energy Plants as follows:

26
a. For biogas, capital subsidy of ₹1 crore per 12000m3 biogas/day is provided. [up to Rs.10 crore/project]
b. Under power projects, subsidy of ₹3 crore per MW is provided. [up to ₹10 crore/project]. For existing biogas units switching to power generation, the subsidy is ₹2 crore per MW.
c. For bio-CNG/ enriched biogas (CBG), subsidy of ₹4 crore for 4800kgs/day of CBG generated per day [up to ₹10 crore/project]. For existing biogas units switching to CBG, the subsidy is only ₹3 crore.
Regulatory Initiatives - SWM Rules 2016 SWM Rules 2016 comprehensively cover all aspects of municipal solid waste management, with strong emphasis on segregation, followed by segregated waste processing. Recycling and recovery have also been embedded into rules. Hence the SWM Rules can become the springboard to launch circular economy principles in MSWM. 3.3 Challenges in Wet Waste Management
• Poor segregation of waste at source reduces the efficiency of the processing facility.
• Inadequate infrastructure to transport segregated wet waste to processing facilities • Non-Compliance of SWM Rules 2016 by the Bulk waste generators • Data on waste generation in terms of composition and quantities is still lacking with
cities. This leads to difficulty in designing waste processing facilities. • Models of collection, transportation, processing for wet waste processing lack
financial feasibility. • Production of compost from mixed waste leads to quality challenges in final
product. • Insufficient numbers of testing labs, and monitoring protocols for compost • Lack of logistic supply chain for distribution of compost in rural areas • SWM Rules 2016 lack provisions for testing of Compost (methodology, frequency
of testing etc). • Inadequate awareness regarding compost policy and Market Development
Assistance (MDA) released by GOI among ULBs and compost producers.
3.4 Potential of Wet Waste Management in Circular Economy Wet waste generation will continue to grow along with population and may accelerate with changing lifestyles of eating out and food deliveries. The traditional composting of wet waste, even after MDA intervention under the SBM is still not generating adequate returns to ULBs. With the stabilization of segregation, wet waste processing should use the more

27
beneficial bio-methanation process. According to Center for Analysis and Dissemination of Demonstrated Energy Technologies CADDET, aerobic composting is a net energy user (261 MJ/tonne) while anaerobic digestion is net energy generator (366 MJ/tonne). Existing Compost plants may continue to be operated. The shortage in wet processing capacity, as it arises, may be fulfilled only by Bio-methanation plants, as well as the replacement of old, defunct compost plants. The comparison of economic benefits of composting vis-à-vis bio-methanation is given below.
Table 2: Indicative Economic Benefit for 50TPD Wet Waste Processing
(for a population equivalent of 2.50 Lakh)
Bio-methanation can be significantly more profitable than traditional composting as shown in table above. Applying the circular economy model, wet waste processing through bio-methanation can yield the additional benefits, as follows by 2025 (Annexure 2.1)
1. Net additional contribution to economy of ₹2,460 crores per annum if 50% wet waste is processed by bio-methanation in urban India.
2. Employment generation of about 1 crore man-days during construction and about 0.60 crore man-days for O&M, in perpetuity.
3. Reduction in GHG emissions by about 10.36 million tonnes CO2 equivalent
Process Outputs Yield per 100 Tonne
Rate / MT Revenue O&M costs
NET Economic benefit. Rs.
Windrow Composting
Compost 7.50 TPD
₹2,500 ₹18,750 ₹10,000 @ ₹1,330/ Tonne
₹ 8,750
Biomethanation
Biogas (3%)
1.50 TPD
₹46,000 (SATAT)
₹69,000
₹30,000 @ ₹20,000/ Tonne of Gas
₹ 51,500 Compost from Dried Slurry (10%)
5 TPD ₹2,500* ₹12,500
Total ₹81,500 Extra benefits of Biomethanation over traditional composting for 50 TPD plant, considered as techno-commercially viable. *Considering same rate as compost
₹ 42,750
28
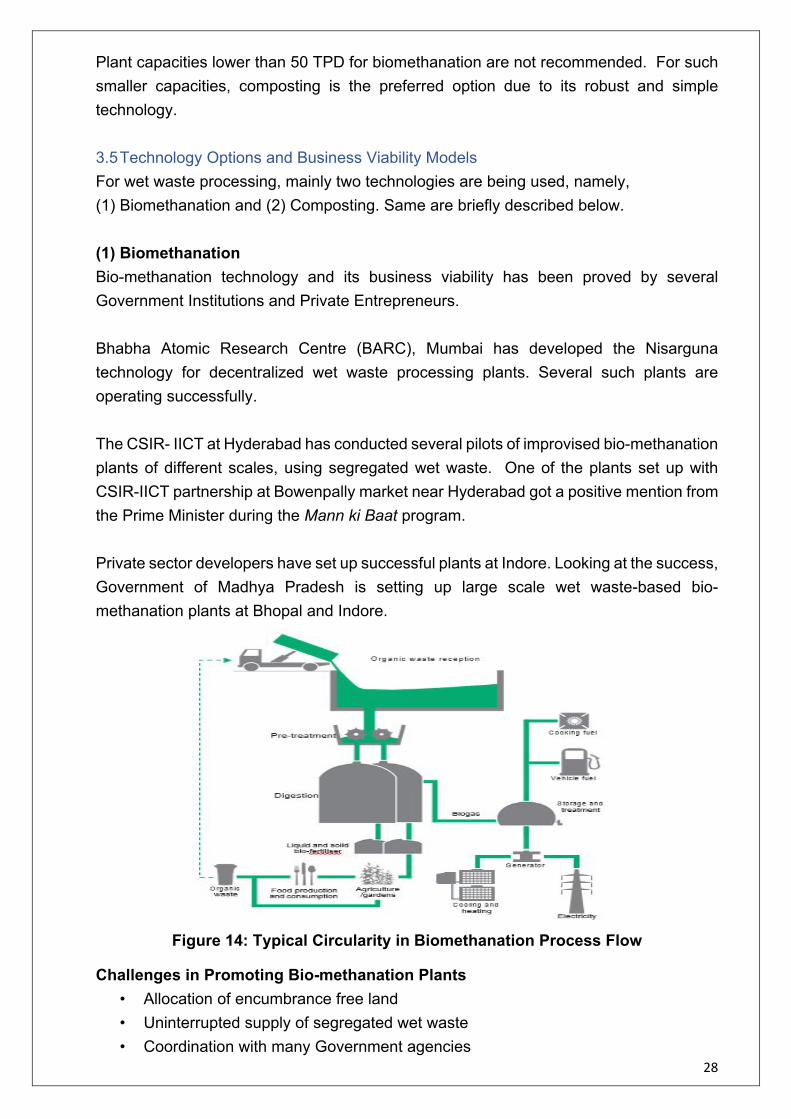
Plant capacities lower than 50 TPD for biomethanation are not recommended. For such smaller capacities, composting is the preferred option due to its robust and simple technology. 3.5 Technology Options and Business Viability Models For wet waste processing, mainly two technologies are being used, namely, (1) Biomethanation and (2) Composting. Same are briefly described below. (1) Biomethanation Bio-methanation technology and its business viability has been proved by several Government Institutions and Private Entrepreneurs. Bhabha Atomic Research Centre (BARC), Mumbai has developed the Nisarguna technology for decentralized wet waste processing plants. Several such plants are operating successfully. The CSIR- IICT at Hyderabad has conducted several pilots of improvised bio-methanation plants of different scales, using segregated wet waste. One of the plants set up with CSIR-IICT partnership at Bowenpally market near Hyderabad got a positive mention from the Prime Minister during the Mann ki Baat program. Private sector developers have set up successful plants at Indore. Looking at the success, Government of Madhya Pradesh is setting up large scale wet waste-based bio-methanation plants at Bhopal and Indore.
Figure 14: Typical Circularity in Biomethanation Process Flow
Challenges in Promoting Bio-methanation Plants • Allocation of encumbrance free land • Uninterrupted supply of segregated wet waste • Coordination with many Government agencies

29
• No long term buy back arrangement by OMCs and FMCs for biogas and compost • Financing as there is no priority lending • Handholding of developers by ULBs. Timely disbursements. • Specialized O&M requiring industrial standards, private developer-operators are
essential Benefits of Bio-methanation
• Less land requirement compared to composting. • Closed process, no odor, dust and leachate issues; no rain interruptions. • Shorter process and lower vulnerability to climatic conditions. • Production of green fuel like Biogas/ Bio-CNG. • Supplements National actions on GHG reductions
(2) Composting Composting of wet waste is a process using microorganisms for degrading the waste to produce compost. It is robust and well-established technology requiring simple O&M that can be provided by semi-skilled personnel. Composting presents problems of high land requirement for higher quantities of waste. The types and scale of composting process are given below (from USEPA):
Table 3: Types and scale of composting process Type of Composting Scale Concerns Resources required On-site Composting Composting on premises using either a bin or a pit in the soil
Very Small
Odour control and vermin
Either a pit or bin
Vermicomposting Composting in bins where worms process organic materials
Small Sensitive to temperature changes
Worm bins, worms
Aerated Windrow Composting Composting outside with organic materials structured in rows and regularly turned/aerated
Large
Siting requirements, zoning, regulatory enforcement (i.e., leachate, odour)
Land, equipment, continual supply of labour
Aerated Static Pile Composting Composting with static piles of organic materials that are aerated internally with blowers
Large
Siting requirements, zoning, regulatory enforcement (i.e., contaminant runoff), odour
Land, large financial resources, equipment including blowers, pipes, sensors and fans
Challenges in composting
• Large land requirement; Siting Problems; Odour and Vector problems

30
• Low level O&M efforts but any slack in O&M generates GHGs • Longer duration process. Requires minimum 6 weeks, followed by maturation
period 2 weeks. • Seasonal Challenges – both in production and in sales. Requires large warehouse
facilities. Monsoon sheds required are costly for large areas. • Low uptake in market due to complicated MDA and quality certification. • Problem of micro plastics even after screening requires high segregation, similar
to biomethanation Benefits of composting
• Simple method adaptable to any ULB, provided adequate land is available. • Low in CAPEX and OPEX, on tonne-to-tonne basis.
3.6 Recommendations and Action Plans Based on the situation analysis of current wet waste processing, the potential economic benefits etc., as given in the previous pages, the gaps in the existing regulatory framework and policy are identified. Actionable points as recommendations against identified gaps are given below, duly categorized as National level, State/ UT level and ULB level, along with the relevant stakeholders, and further categorized as: a) regulations, and b) enablers.
Table 4: Recommendations and Action Plans for Wet waste circularity
S.No Actionable Points Stakeholders Responsibilities
National Level Regulations
1 Segregated MSW Rules for Wet & Dry wastes and for SLFs
MoEF&CC, MoHUA, MoJS
MoHUA and MoJS to prepare the segregated MSW Rules MoEF&CC to notify
2 Unbundling SLF from SWM functions
MoEF&CC, MoHUA, MoJS, States
MoEF&CC to make Sanitary Landfill (SLF) a separate waste management facility outside ULB/ UDD domain, operating on landfill fee model.
3 To relax environmental clearance (EC) for the waste processing plants
MoEF&CC, MoHUA, MoJS, States
MoEF&CC to recognise waste processing plants in GREEN category
4 Amendment in FCO 1985
Mo Agriculture & Farmers Welfare
MoAgFW to workout required amendments in FCO 1985 to include compost from biomethanation; and to set up testing labs in all districts

31
5 Tax holiday for waste processing plants for 5-10 years
MoF MoEF&CC MoHUA MoJS
Ministry of Finance to notify. MoEF&CC, MoHUA and MoJS to provide inputs
6 Waste processing plants listed in priority lending sector
MoF
Ministry of Finance to notify. MoEF&CC, MoHUA and MoJS to provide inputs
7 Defining Business Rules for biomethanation from MSW
Cabinet Sectt., MoF, MoHUA, MoJS, MNRE
Cabinet Secretariat to clarify as MNRE is claiming sole domain which can be detrimental to integrated SWM
8 Centre of Excellence
Research Institutes, Universities
One premier technical institute and agricultural institute maybe recognized as centre of excellence
National Level Enablers
1 Convergence with stakeholder Ministries
MoHUA, MoJS, MoPNG, MoP
For convergent actions promoting biomethanation, a High Power Committee under chairmanship of secretary/ Additional Secretary may be set up
2 Customs and GST exemptions
MoF MoF to exempt customs on imports for biomethanation plants and provide GST relief
3 Incentivizing biogas plants
MoPNG MoPNG to incentivize biomethanation plants; buy out biogas up to 1 tonne/ day instead of 2 tonnes/ day)
4 Incentivize by-products and tag sale with chemical fertilizers
Ministry of Chemicals & Fertilizers
MoCF to extend MDA for city compost to compost produced out of biomethanation and tag sale of compost with chemical fertilizers
5 Inventorization of biomethanation plants by SPCBs/ PCCs / CPCB
MoEF&CC To evaluate performance and to run the plants efficiently & refurbish where necessary
State Level Enablers for infrastructure
1 State Policy & Strategy on biomethanation and biogas
States States to set the way forward for biogas economy by drawing up a policy and strategy for implementation
2 State incentives to biomethanation plants
States States to provide incentives to private developers to invest in the biogas economy

32
Case Study-1: Biogas replacing CNG for Automobiles BioCNG Plant for segregated organic MSW generating automobile Gas The bio-CNG plant on bio-methanation process generates biogas and digestate as products. The biogas is cleaned and enriched to remove hydrogen sulphide, water, particles and CO2 present in the gas, giving methane suitable as fuel for automobiles. The model has been successful in a 20 TPD plant at Indore set up and operated by Mahindra Ecosystems. Besides the bio-CNG, organic fertilizer is also produced which attracts higher selling price than traditional compost. There is near zero discharge from the plant. Details are given in Annexure-2.2.
3 Developing clusters for waste processing
States States to develop district level Waste Processing Parks, under the District Collector for enabling LBs to meet statutory requirements
4 Strengthening segregation at collection level
States and ULBs
Empower safai karamcharis to levy fines/ penalty on unsegregated waste and to refuse collection
5 Tax/fine on dumping wet waste in landfills/ open land
SUDD SPCB
SPCB to impose heavy fines/Taxes on indiscriminate dumping of wet waste
6 Designating Nodal Department
SUDD, Agriculture Deptt., SPCB
A suitable State department may be designated as nodal department to coordinate with other departments through a high-level committee for required infrastructural and policy needs.
7 Compost Testing facilities and Labs
SPCB, SUDD State Agriculture department/UD department set up compost testing facilities
Social Interventions 1 School Curriculum
on Waste Management
States/ CBSE To inculcate good citizen behavior in waste management, it should be made part of curriculum throughout school.
2 Capacity building & dissemination of best practices
SUDD Suitable capacity building and training of personnel engaged in MSWM at State/ULB level. National and international successful models need to be disseminated to ULBs
3 Awareness creation
SUDD Effective strategy for awareness creation on reuse of by-products out of wet waste processing to public
33
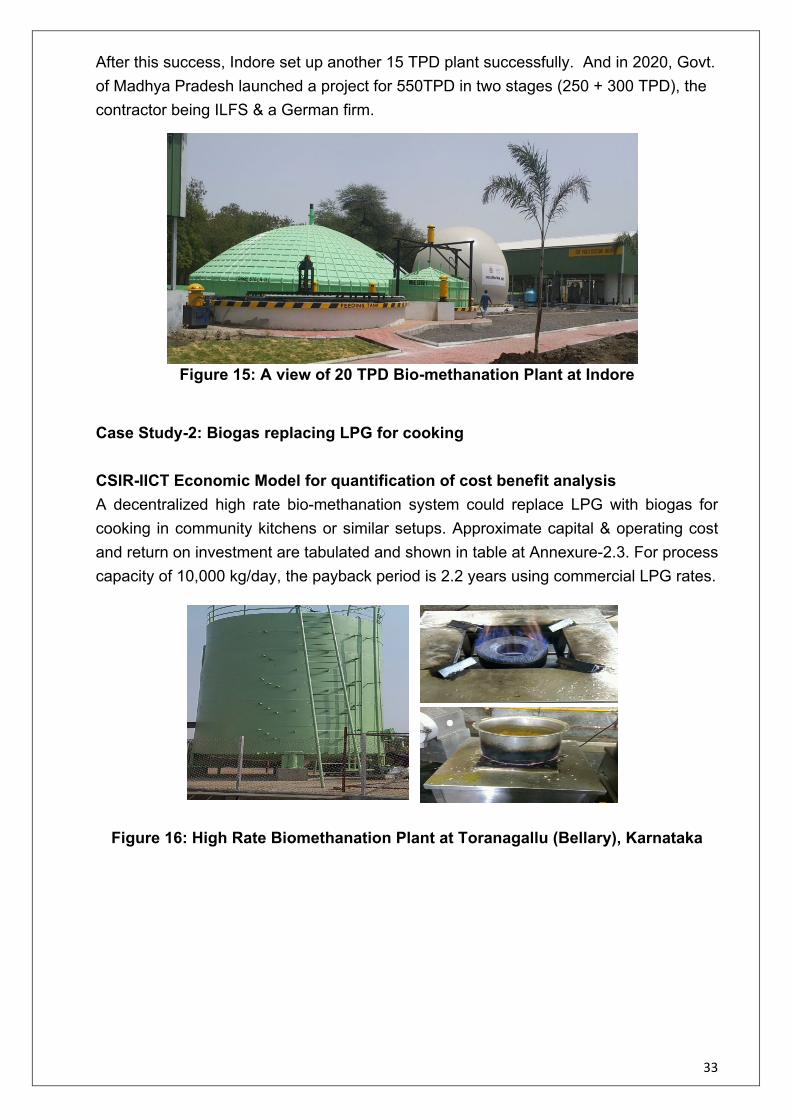
After this success, Indore set up another 15 TPD plant successfully. And in 2020, Govt. of Madhya Pradesh launched a project for 550TPD in two stages (250 + 300 TPD), the contractor being ILFS & a German firm.
Figure 15: A view of 20 TPD Bio-methanation Plant at Indore
Case Study-2: Biogas replacing LPG for cooking CSIR-IICT Economic Model for quantification of cost benefit analysis A decentralized high rate bio-methanation system could replace LPG with biogas for cooking in community kitchens or similar setups. Approximate capital & operating cost and return on investment are tabulated and shown in table at Annexure-2.3. For process capacity of 10,000 kg/day, the payback period is 2.2 years using commercial LPG rates.
Figure 16: High Rate Biomethanation Plant at Toranagallu (Bellary), Karnataka

34
International Case Studies
SWEDEN
NSR Biogas Plant at Helsingborg –Sweden
The NSR biogas plant in Helsingborg (1996) is a regional waste recycling company owned by six local authorities in north-west Skåne (Bjuv, Båstad, Helsingborg, Höganäs, Åstorp and Ängelholm) for treating various organic wastes. Nowadays, the refinement of biogas vehicle fuel is an additional motivation. Upgrading of biogas started in 1997, and capacity doubled by 2007. Another product ‘NSR Bio-manure’ started marketing bio-manure to agriculture and its quality is nowadays recognized under the certification system. Food waste is the primary substrate digested in the reactors with pre-treatment process also. The substrate consists of process waste from the food industry, fresh pig manure and source-sorted food wastes. The plant is designed to accept up to 80,000 tons per year (220 TPD).The plant produces 23,000 MWh of raw biogas, upgraded to vehicle fuel quality. Some of this gas is sold in NSR’s public filling stations and is also used to run refuse lorries. Most biogas is distributed through the gas grid and is used to run buses. Propane is added to this gas to give it the same energy content as natural gas. In total, the biogas produced by NSR runs 100 buses, 20 refuse lorries and a large number of cars both locally and regionally. The biogas produced replaced more than 1.3 million litres of petrol and thereby reduced carbon dioxide emissions by 2800 tons.
CANADA
These are Anaerobic Digestion ( AD) plants digesting food waste as the primary feedstock in Canada, including the City of Toronto’s 2 AD plants (total capacity 130,000 tonnes year-1 i.e., 178 TPD each), five municipal food waste AD plants for Quebec municipalities and three private commercial plants in Ontario. In Ontario there are currently 4 facilities with permitted capacity over 80,000 tonnes per year (55 TPD each) licensed to process domestic food waste. These plants are also co-digesting agricultural manure or sewage sludge. A number of provinces are pursuing policies to support Renewable Natural Gas (RNG) – methane derived from renewable sources including biogas from such AD plants and delivered via the existing gas grid. There are approximately 12 RNG plants currently operating in Canada, many of which are processing some percentage of food waste.

36
4.1 Introduction Construction and Demolition waste comprises of building materials, debris and rubbles generated during construction, re-modelling, and demolition of structures. On segregation C&D waste can be categorized into concrete, soil, steel, wood and plastics, bricks and mortar and other salvaged building components. Estimates suggest that the average generation of C&D waste in India works out to approximately 12 million tonnes per year. The constituents of C&D waste generated, and their quantities vary across cities due to different types of construction practices. Approximately 95% of C&D waste can be reused or recycled if processed scientifically. However, owing to current lack of infrastructure for processing C&D waste, most of the C&D waste are sent to landfills or get mixed with MSW, further adding to processing challenges of MSW. Globally, C&D waste is beneficially recycled to the tune of 50% in EU. Some of the countries like UK (90%), US (70%) & France (48%) are leading C&D waste processing and recycling in the true spirit of circular economy. India possess huge potential in recycling and reusing processed C&D waste as it can be a substitute to virgin construction materials which are in high demand in the country. Realizing this opportunity, NITI Aayog together with relevant ministries are encouraging maximum recycle and reuse of C&D waste. This chapter focuses on the preparation of a practically implementable and dynamic action plan for management of C&D waste in India. It is based on identified challenges and roadblocks in the current scenario of C&D waste management. The various sections of this chapter: • Provides an overview of the regulatory framework and policies that promote a
transition to the circular economy and management of C&D waste • Analyzes the existing scenario of C&D waste management in India and identifies
challenges and roadblocks in this sector • Scopes out specific areas of intervention and priority action areas in the sector • Assesses some best practices and lessons learnt on strengthening the C&D waste
management system from cities or models in India • Makes recommendations for strengthening the waste management system based
on circular economy principles.

37
Integration of Circular Economy concept in C&D Waste Management The waste management sector will have to become a crucial partner in new business models that focus on waste prevention and ‘turn waste into resources’. Circular product design will require feedback from the waste management sector on how products or components could be remanufactured, dismantled, and recycled. Instead of viewing waste as a threat, the waste management sector, in close cooperation with industry, will have to produce high-quality secondary raw materials that can be fed back into production processes.
A linear model of consumption is no longer sustainable as limited resources cannot meet our endless demand. The environmental benefits of avoiding waste far outweigh the environmental impacts of any other waste management options lower down on the waste hierarchy.
The principle of reducing waste, reusing, and recycling resources and products is often called the "3Rs”. Waste management systems often rely on the ‘3R principle’ to conserve resources. The application of 3R concept in the context of C&D waste management is shown in figure below:
3R IN CONSTRUCTION AND DEMOLITION WASTE MANAGEMENT REDUCE REUSE RECYCLE
Regulating/ Standardizing management plan of materials
Promoting Reuse of waste materials thus reducing dependency on virgin materials
Harvesting materials at construction or demolition site
Identifying & quantifying amounts of C&D waste and treatment needs
Production of high-quality recycled aggregate
Recycling waste wood, metal, plastic, gypsum, and other waste materials
Specifying actions for every type of waste
Using same material for same application
Driving innovative recycling opportunities
Defining Responsibilities Reuse of wood and Steel elements
Promoting & creating markets for recycled products
Establishing on-site waste sorting practices
Applying innovative storage and handling practices for reuse
Minimizing cost for recycling processes
Monitoring waste generation establishing waste separation and collection strategies
Reuse of sanitary and electrical fittings
Establishing management plan and SOPs; Applying innovative storage and handling practices
Figure 17: 3R strategies for Construction & Demolition Waste

38
Complete circularity in C&D waste management can only be achieved when a sustainable and comprehensive strategy and action plan is prepared and implemented throughout the lifecycle of construction projects, viz.
• Planning phase (during appraisal of the project and preconstruction activities)
• Construction Phase (during construction) • Operation, Repair and Maintenance Phase (during the lifespan of a
structure) • Dismantling phase (at the end of the service life of a project for recycling
and reuse of demolition waste) • Collection, processing, and recycling of C&D waste. • Production of recycled products and use of recycled material for further
construction activities 4.2 Current Scenario and Challenges in C&D Waste Management
In India, the average generation of C&D waste is about 12 million tonnes per year i.e. 20-25% of total MSW generation in country. Large scale construction projects of housing, industry & infrastructure development are under implementation across the country. Development of economic zones, industrial corridors, redevelopment & rehabilitation works, besides repairs & renovation contributes to the magnitude of C&D waste. Suitable laws are being formulated by the authorities, but enforcement of such laws has its limitations. Private contractors remove this waste to privately owned lands, low-lying areas for a price, or more commonly, dump it in an unauthorized manner along roads or other public areas. C&D waste from individual households finds its way into nearby waste bins making the municipal waste heavy and degrading its quality for treatments such as composting or energy recovery. The activities regarding C&D waste management, processing and re-use have been energized after issuance of C&D Waste Management Rules, 2016 by the Ministry of Environment, Forests and Climate Change (MoEF&CC).

39
General Composition of C&D Waste The constituents of C&D waste generated, and their quantities varies from city-to-city and even regionally due to different types of construction practices. The representative C&D waste in urban areas consists of soil, sand and gravel (47%), bricks & masonry (32%), Concrete (7%), metal (6%), wood (3%) others (5%) as shown in figure 18. Bricks, tiles, wood and metals are sold for reuse/ recycling. The remaining materials are generally sent to landfills.
Figure 18: Composition of C&D Waste in India23 C&D Waste Management in Indian context: Under the Swachh Bharat Mission (Urban), it is assumed that C&D Waste varies from 5-25% of the MSW generated in various ULBs depending upon their economic and developmental scenario. Table 5 shows assumptions of C&D waste generation in different population categories of cities.
23 Utilization of Recycled Produce of Construction & Demolition Waste - Building Materials & Technology Promotion Council, Ministry of Housing & Urban Affairs
Soil, Sand and Gravel
47%
Bricks& Masonry
32%
Concrete7%
Metal6%
Wood3%
Others5%

40
Table 5: C&D waste generation with respect to population categories* Sr No Population
Categories C&D waste Generation
1. More than 10 million Approximately 25% of the Total solid waste generated
2. 1-10 million 20-25% of the Total solid waste generated 3. 0.5- 1 million 15-20% of the Total solid waste generated 4. Less than 0.5 million 10% of the Total solid waste generated *Assumptions based on current trends of C&D waste generation
The amount and character of C&D waste generated is influenced by several factors such as population, rate of urbanization, population density and socio-economic conditions. In most of the ULBs where proper management of C&D waste is not established, it mixes with municipal solid waste which results in increased processing cost and reduced efficiency. Classification of Processed C&D Waste C&D Waste in India are classified into two different types as shown in figure 19:
• Recycled Aggregates (RA) • Recycled Concrete Aggregates (RCA)
RA consists of waste from brick masonry, cement mortar, tiles etc. On the other hand, Recycled Concrete Aggregates (RCA) are produced by crushing of concrete rubble, screening, & removal of contaminants. RCA contains aggregates as well as hydrated cement paste that adheres to its surface. Out of total C&D waste generation, about 90-92% is RA and 8-10% is RCA.
Figure 19: Types of C&D waste
MAJOR CLASSIFICATION
OF C&D WASTE IN INDIA
Recycled Concrete Aggregates
Recycled Aggregates

41
Global Scenario An overview of country wise status of C&D waste generation along with recovery rate as per the latest literature available is given in Figure 20
Figure 20: Annual generation & recovery rate of C&D waste in some
countries24 Benefits of implementation of C&D waste management Potential benefits of implementation of C&D waste management are given in the below table 6.
Table 6: Benefits of C&D Waste Management Economic and social benefits
• Scientific C&D waste management prevents mixing of C&D waste into MSW stream thus reduces processing cost and increases efficiency of MSW.
• C&D waste management prevents clogging of drains and water bodies therefore avert flooding in urban areas
• Proper management and recycling of C&D waste leads to saving of precious land by reduction in volume of inert going to landfill
• C&D waste processing and recycling generates employment through new enterprises.
• Use of C&D recycled products help in reducing the demand and requirement of virgin material and natural resources
Environmental benefits
• Scientific C&D waste management supresses dust generation. Thus, significantly reduces air pollution.
24 Luis Alberto Lopez Ruiz et al., Journal of Cleaner Production 248 (2020)
36
2360
136 220 534 224 924
13.68 118 122.4 74.8 373.8107.52 425.04
0
500
1000
1500
2000
2500
Spain China UK Germany United States France EU-28
Mill
ion
tons
Annual generation & recovery rate of C&D waste
Generation (Million tons) Recovery(Million Tons)

42
• Prevention of unauthorized dumping of C&D waste in drains and hydrological channels reduces chances of flooding
• Utilization of recycled products from processed C&D waste helps in reducing environmental impacts of mining
Challenges of C&D Waste Management The challenges of C&D waste management can be broadly classified into the following four types as shown in figure below
Figure 21: Challenges of C&D Waste Management 4.3 Circularity & Potential of C&D Waste Circular Economy (CE) is promoted by material reuse either by direct use or by repair/refurbishment that ensures use of C&D Waste within the construction industry. Interventions for promoting reuse are already established as mentioned below and shown in Figure 23 : 1. Adaptive reuse—It is a method that reuses whole or part of a structure that is
redundant. 2. Deconstruction—It is the careful dismantling to maximize the recovery of
components to be reused. 3. Design for deconstruction (DfD)—It is a designing method that enables quality and
quantity of materials that can be re-used at the end of a building’s life 4. Design for reuse (DfR)—It incorporates the use of reclaimed components in the
design of new structures. 5. Design for longevity (DfL)- It is a principle that current buildings in planning phase
should be planned for long-term use. The construction material should be of top quality which could enhance the life of the building.
• Estimation and characterization of C&D Waste
• Challenges of collection & transportation
• Land availability • Disposal of waste
OPERATIONAL
• Setting up recycling facilities for all infrastructure projects
• Tracking C&D waste generation and dumping
• Lack of availability of specialized machines
INFRASTRUCT URAL
CONTRACTUAL
• Lack of experienced contractors
• Lack of provision of incentives or penalties
• Non-standardized contracts
• PPP related issues
FINANCIAL
• Under-budgeting of projects
• Low involvement of govt. agencies/departments
• Lack of risk sharing by govt. authorities

43
Figure 22: Circularity in C&DWM -Building life cycle with conventional method
and design for deconstruction (DfD) Introducing Circularity in C&D Waste Management The introduction of a circular economy in the construction sector creates opportunities for innovations in cutting down on raw materials and reducing residual and waste matter, quality improvement and cost reduction throughout the lifecycle of structure and its various components. Different approaches for introducing Circularity in managing C&D waste-
Table 7: Approaches for introducing Circularity Construction approach Waste Management
approach Legislative approach
• Design and construct for recycling and reuse
• Reducing use of virgin materials
• Reduction in the overall waste generation by setting construction practices standards
• Integration of a demolition plan
• Decentralized cluster-based approach for recycling waste
• Data collection through ICT based technology
• Mandate use of certain percentage of recycled waste with the new construction material
• Reduce GST on recycled materials.
• Setting green building standards

44
Construction approach Waste Management approach
Legislative approach
• Life of the structure specified
Application of C&D Waste Recycled Materials To understand the circularity of C&D waste, the approaches include exploring recycling opportunities, products/by products with their applications in the market. Some of the applications identified are given in table below
Table 8: Applications of C&D Waste Recycled Material Sr. No
Description of Item
Specification Size Application
1 Good Earth Produced in the process of filtration & pressing of slurry. Slurry is generated during the washing of C&D waste.
< 75 microns Filling in low lying areas
2 Screened Soil Produced during the screening of C&D waste. It consists of Soil & Aggregate
< 26.5 mm Back filling, Road construction & filling of ramp portion of the flyovers
3 Recycled Aggregate (RA)/ Brick Sub-Base (BSB) / Granular Sub-Base (GSB)
Produced by Crushing & Washing of Brick Aggregate, Stone Aggregate, Tiles etc.
4.75 mm to 26.5/53mm & 11mm-53mm
Lean Concrete (M10, M7.5 grade) & PCC work. Recycled aggregate (RA) up to 100% for lean concrete has been permitted as per IS 383:2016
4 Manufactured Sand
Produced by crushing & washing of C&D waste. It is a fine mixture of Stone & Brick Aggregates. All the properties are same as river sand except more water absorption capacity.
75 micron- 3 mm
Brick work & PCC work

45
5 Recycled Concrete Aggregate (RCA)/ Stone Dust
Produced by crushing concrete-based C&D waste only.
RCA- 5mm to 20 mm Stone Dust- < 5 mm
Up to 25% in Plain Concrete up to 20% In RCC & 100% in Lean Concrete. (As per IS:383)
6 CC Blocks and Bricks
Produced by mixing of recycled aggregate, sand with cement
400X200X100 mm
Used in non-load bearing areas like boundary/ partition walls
C&D Waste Value Chain: The C&D Waste generated in the cities is handled either by ULB on its own or through 3rd Party contracted by ULBs. The process flow of management of waste in different cities is illustrated in the figure below:
Figure 23: C&D waste Handling in India
Economic Potential of C&D Waste Management The potential for circular economy in C&D waste can be explained from an approximate estimation of economic value, which can be derived from existing circumstances. Taking these factors into consideration, the expected economic value of C&D waste is depicted in figure 24:

46
: Figure 24: Economic Potential from C&D Waste Avg. Sale Price of different fractions: (As per prevailing market rates ) • Aggregate: ₹285 per tonne (Total income @12% – ₹10.25 lakh/day) • Sand: ₹550 per tonne (Total income@4% – ₹6.60 lakh/day) • CC block : ₹27 per piece (Total income 3,60,000*27=97.20 lakh/day)
* Considering 50% conversion of raw recycled materials into value added products. # Significant savings to bulk waste generators by utilizing recycled C&D materials in their own consumption.
4.4 Gaps in Policy & Regulatory framework in India Regulatory framework for managing CDW today is as follows:
• Solid Waste Management Rules 2016 (MoEF&CC, 2016). • Construction and Demolition Waste Management Rules 2016 (MoEF&CC,
2016). • Management Manual on Municipal Solid Waste (MoHUA, 2016). • Manual on Municipal Solid Waste Management (MoHUA, 2000). • TAG report on Municipal Solid Waste Management, (MoHUA, 2005). • National Environmental Policy, (MoEF&CC, 2006). • CPWD Manual for Sustainable Habitat, (CPWD,2014). • Green Building Norms, (CPWD,2012).
The existing framework for C&D waste as mentioned above has some management deficiencies. Key suggestions for improving C&D Waste Management should include
• Reinforcing regulatory compliance with strong deterrents
Realizing potential of C&D waste value chains through Circular Economy will lead to revenue of ₹416 Crore/ year
C&D waste management have potential to generate approximately 10,000 jobs which includes Managerial, Supervisory, and unskilled positions.

47
• Government supervision along with an economic incentive approach • Interaction between all Stakeholders for clarity on responsibilities • Active coordination among operational departments • Digital monitoring setup/ Monitoring Committee to ensure fulfilment of
compliances and quality of output. • Continuous development and integration of emerging technologies.
The institutional arrangement for managing C&D waste lies with the ULBs. The main functions of ULBs for managing C&D waste generated as per C&DWM Rules 2016 are as under.
Duties of ULBs Under C&D Waste Management Rules • Make arrangement for collection of C&D waste • Ensure transportation of C&D waste at appropriate site • Examine and approve waste management plan of generators • Establish C&D waste generation database • Device appropriate measures for management/ processing of C&D waste
and use of recycled products and provide incentive/s for use of products made with recycled C&D waste
4.5 Technology Options & Business Viability Models Technology Options Since, C&D waste basically consists of debris of concrete, mortar, bricks and tiles, the processing usually involves segregating, crushing, downsizing, washing and sieving it into uniform size aggregate particles, that can substitute primary aggregates in the construction market. All other materials such as glass, wood, steel is reused or recycled separately. C&D Waste Processing: C&D waste processing can be done through wet and dry processing technologies. Wet processing is achieved through machinery capable of segregating sand from mixed C&D waste and uses water for segregation, while dry processing involves manual separation and crushing without using water for treatment. The simplified process flow for processing C&D waste is depicted in figure 25 below

48
C&D waste -Wet process Flow:
Figure 25: Process layout for Wet Processing of C&D waste
C&D waste- Dry Process Flow
Figure 26: Process Steps for Dry Processing of C&D Waste
Segregation at Source
Storage in separate
containersScreening Crushing Reusing
material

49
Types of C&D waste Processing Plants/Units Stationary processing unit Stationary C&D waste processing unit is mostly Wet Processing unit with assembly of crushing, sieving, and washing machinery interconnected by conveyer belts for material movement. The systems are either semi-automated or completely automated units. The capacity of stationary processing units can vary according to the need from 100 TPD – 2,000 TPD or even more.
Mobile crushing unit Mobile crushing works on dry Processing concept. All the equipment’s are mounted on the top of customised mobile unit/truck. This kind of design provides the flexibility to ensure that the crushing station can be easily transported by and moved to construction/demolition sites. These units are good to process up to 50TPD of C&D waste.
Mini mobile crusher For small cities and towns with lesser quantity of waste, mini mobile crusher units are more viable option. The mini-crushers with processing capacities of around 5 TPD can be maintained by the ULB for processing waste into finer secondary raw material or the mini crushers can be maintained by designated pre-cast concrete building material manufacturers to whom the C&D waste can be delivered as a business model.

50
4.6 Comprehensive Action Plan & Recommendations Comprehensive Action Plan: The following table summarizes the key activities for C&D waste circularity
Table 9: Comprehensive Action Plan for C&D Waste Circularity Sr no Activity Action items Responsibility 1. Quantification of
C&D waste generation and utilization pattern of C&D waste-based aggregates and products
1a. Web-Portal Creation • Creation /updation of Web-Portal to capture
the C&D waste generation data: - Creating the baseline data through concept
like “Material passport” for all the buildings and use of centralized Web -based portal for the estimation of realistic data
• The same web portal shall be used for monitoring the effectiveness of overall C&D waste management. The portal shall be updated on a regular basis as per the requirement.
1b. Quantification of C&D waste – Survey/ Sampling to be conducted in each population categories of cities as mentioned in this report 1c. Utilization pattern of C&D waste-based Aggregates and products • ULB should estimate the construction activity
/ pattern and the possible maximum utilization of C&D Waste based aggregates and products in their construction activity
States / ULBs
2. Collection of low volume C&D Waste at Collection points and its outbound logistics to the processing plant
Number of collection points in a particular ULB depends upon its coverage area and the area of collection & storage point depends upon the population living in the coverage area. It also depends on the projected rate of generation of C&D waste. • It is advisable to have at least one collection
point for a coverage area of 5 sq. km having population of 25,000. Such Collection & storage point should have an area of 200 sq. m (base area).
ULBs
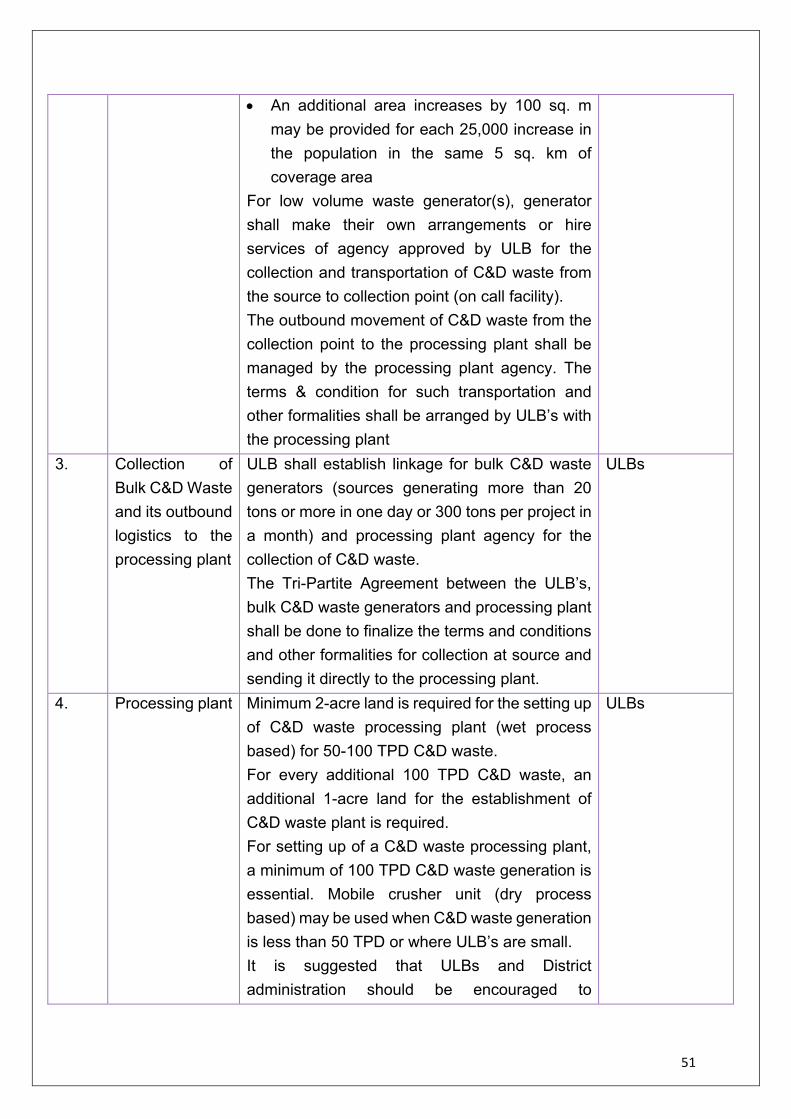
51
• An additional area increases by 100 sq. m may be provided for each 25,000 increase in the population in the same 5 sq. km of coverage area
For low volume waste generator(s), generator shall make their own arrangements or hire services of agency approved by ULB for the collection and transportation of C&D waste from the source to collection point (on call facility). The outbound movement of C&D waste from the collection point to the processing plant shall be managed by the processing plant agency. The terms & condition for such transportation and other formalities shall be arranged by ULB’s with the processing plant
3. Collection of Bulk C&D Waste and its outbound logistics to the processing plant
ULB shall establish linkage for bulk C&D waste generators (sources generating more than 20 tons or more in one day or 300 tons per project in a month) and processing plant agency for the collection of C&D waste. The Tri-Partite Agreement between the ULB’s, bulk C&D waste generators and processing plant shall be done to finalize the terms and conditions and other formalities for collection at source and sending it directly to the processing plant.
ULBs
4. Processing plant
Minimum 2-acre land is required for the setting up of C&D waste processing plant (wet process based) for 50-100 TPD C&D waste. For every additional 100 TPD C&D waste, an additional 1-acre land for the establishment of C&D waste plant is required. For setting up of a C&D waste processing plant, a minimum of 100 TPD C&D waste generation is essential. Mobile crusher unit (dry process based) may be used when C&D waste generation is less than 50 TPD or where ULB’s are small. It is suggested that ULBs and District administration should be encouraged to
ULBs

52
experiment with different models of public-private partnership, small business / start-up services for the set-up and management of C&D waste processing plants
5. Promoting utilization of C&D waste recycled products
The utilization of C&D waste recycled products should be promoted at three levels namely ULB/District level, State Level and National Level. a) ULB’s / District management should aim to
consume 100 % of C&D waste recycled products in their own construction activities and they should include these products in their Schedule of Rates and Construction Tender document(s).
b) In construction activity controlled by State, ULBs should engage with State government agencies like PWD, rural road department, development authority, irrigation department etc. for the utilization of C&D waste recycled products through inclusion of such products in their Schedule of Rates and tender document(s).
c) At National level, MoHUA/ CPCB should engage with agencies like CPWD, MoRTH, NHAI, NRRDA etc. for the promotion of C&D waste products. Efforts should be made to include these products in the Schedule of Rates and tender document(s).
To engage with various stakeholders such as CPWD/PWDs, BIS, GRIHA/IGBC, BMTPC, etc.
6. Policy interventions
• GST for C&D waste products shall be reduced from 18% to 5%.
• Green tax for the transportation of C&D waste products should be waived off for C&D waste products.
• Electricity load in C&D waste plant charged at industrial rate shall be reduced suitably.
• It is suggested to have single window environmental clearance for setting up of a C&D waste processing plant.
Government of India/ State government/ ULBs

53
7. Standardization and Research needs
• Separate BIS / IRC Guidelines for utilization of recycled products produced from C&D Waste should be prepared.
• Research work should be promoted to enhance the usage of C&D waste products for various non-structural and structural applications. For e.g. as per the IS 383 (latest revision), use of recycled concrete coarse aggregate has been permitted as replacement of virgin coarse aggregates up to 25% in plain concrete works, up to 20% in reinforced concrete works (up to M25 grade), and up to 100% in case of lean concrete works.
• Usage of recycled fine aggregates for masonry and plaster works applications should be included in BIS / IRC Guidelines
NCCBM, CRRI and other R&D institutions, BIS, IRC
Remarks
• Issue of segregation of C&D waste can be dealt at the collection point. • The distance between the C&D waste processing plant and collection point
shall be within 40 km. • For the establishment of C&D waste processing plant in ULB with more than 1
lakh population, detailed project report (DPR) should be prepared that must include details regarding the proposal to ensure natural resource’s conservation
• Mobile crusher units are not preferable because of environmental concern. • Eco-Mark label should be adopted • Green certification of a building can be done on the basis of products rating • At the national level, Ministry of MSME may be brought in to promote SMEs
and start-ups in C&D waste conversion businesses, supported with green finance and fiscal benefits as suggested in this report.
Recommendations To develop comprehensive measures for progressing towards a circular economy with efficient strategies, the recommendations are as follows categorized in the table 10 below:

54
Table 10: Recommendations for C&D Waste Circularity C&DWM
Focus Area Recommendation
Building Design and Construction
• Use longer Design Life of buildings with modular approach.
• Reducing virgin material use, e.g. use of 20% secondary materials in new building construction: 40% in Roads and Highways.
• Building products and materials with secondary resources should be given tax rebates
• Reduction in the overall waste generation by setting dismantling standards and SOPs
• Transparency in FAR, demolition plan, data on construction material and declaration of life span of the building from the planning phase.
• Cluster based C&D Waste recycling plants, at least one in cities with >10 lakh population
• Mobile-based data collection system on types of C&D waste being generated.
• Define green building standards on C&D waste utilization, Lifespan of the building, demolition plan, energy usage, natural resource usage, usage of reusables. This could be promoted on incentives and award system
Waste Segregation and Policy Intervention
• Mandatory Segregation and channelizing of the C&D waste
• Waste generators must pay charges for collection, transportation, processing, and disposal as notified by the concerned authorities.
• Concession agreements with processing plants should be for minimum of 15 years.
• Municipal Corporations/ULBs should ensure buy-back of the recycled material from the processing plants through building permit system.
• Reduction of GST on C&D waste processed products from present applicable rate of 18% to 5%.
• Exemption of Green tax on C&D Recycled products and transportation.

55
Data and Resource Assessment:
• Life Cycle Assessment (LCA) and Material Flow Assessment (MFA): To steer the housing and infrastructure development towards resource efficiency.
• MFA will aid LCA based procurement and reduce environmental impacts Combining LCA and MFA is an innovative tool for sustainable decision making.
• Reliable data for assessing environmental cost of material flow and to establish potential of secondary materials.
Factoring Environmental Costs & Leveraging benefits from C&D waste utilization
• Secondary resources to partially replace virgin resources (recycled aggregates and fine aggregates)
• The intent of the national level policy for achieving resource efficiency in the construction sector needs to be translated to a roadmap for action at the State and city level.
Utilization of C&D Wastes in buildings and infrastructure:
• All construction projects – both buildings and infrastructure should prepare demolition plans and segregation plans for C&D waste management as the part of building plan approvals submitted to the municipality/ competent authority, as applicable.
• A threshold level mandatory proportion of C&D waste use in all public and private buildings / infrastructure would be useful to ensure its circularity.
• The utilization of the C&D waste incentivized through reduced GST and or other fiscal incentives.
Recycling and Application of C&D Waste
• For Roads, C&D waste can be recycled to produce aggregates for drainage material; shoulders; stabilized as well as un-stabilized base courses; bituminous concrete; lean mix; sub-bases as well as new concrete pavement.
• Tunnel muck can be used for producing RCA after proper characterization for road applications.
• Potential applications for structural grade concrete produced from RCA could be codified by BIS


57
5.1 Introduction Context India is home to 17% of world’s population while it holds only about 4% of global water stock. The urban and rural areas, along with agriculture and industries are dependent on the same water resource. Agriculture stays as the major consumer of water in the country with net demand of 688 billion cubic meters (bcm) per year which is about 85% of the total water demand. It is followed by industrial sector demand at 9%,25 while the potable water demand (urban and rural) is assessed to be at about 6%.
Ground water and surface water are the only possible sources of obtaining water. To meet the increasing demand, alternate sources of water are being explored. According to the Central Pollution Control Board (CPCB, 2021), currently urban India generates 72,368 MLD of municipal sewage which is estimated to increase to 1,20,000 MLD by 2050.This treated sewage, already available in vicinity of points of use, can be a viable resource to offset part of the increased requirement for non-potable applications of water in agriculture, industry and municipal domains, thus bringing in circularity in water- wastewater sector (Figure 27). This is dependent on the premise that the generated sewage is treated to appropriate level. CPCB has estimated that installed sewage treatment in the country today stands at only 44%.
Figure 27: Wastewater in the water cycle (Source: WWAP)
25 Source: Statista, 2021

58
5.2 Potential for Circularity in Water- wastewater Sector The framework for circular economy for the water - wastewater sector, is based on the general waste mitigation principles, i.e.- reduction, reuse, recycling, and recovery (Figure 28).
The policy recommendations on wastewater recycling and reuse being suggested in succeeding paragraphs are expected to yield several benefits, including, but not limited to, the following:
• Recycled wastewater can be an additional source of water to free up freshwater used for non- potable use.
• Source of revenue for utilities through sale of secondary treated wastewater can recover some of the O&M costs of STPs.
• Economic and environmental benefits due to reduced extraction of groundwater, and conveyance of water over extended distances which reduces pumping energy requirement and costs.
• Incentives for ULBs to strengthen sewerage and treatment infrastructure by realizing the value of collection, treatment, and recycling of sewage.
• Social benefits through improvements in productivity and wellbeing of citizens because of obvious health and environmental benefits.
Figure 28: Water in Circular Economy (Source: Water Reuse Europe Review 2018

59
*The above-mentioned estimates are taken from ‘Recycling and Reuse of Treated Wastewater in Urban India’ advisory published by IWMI.
5.3 Current Approach and Challenges General approach to treatment of wastewater for reuse The Manual on Sewerage and Sewage Treatment Systems (2013) discusses in detail the different types of treatment technologies suitable under different conditions, including decentralized wastewater treatment technologies. In the case of wastewater reuse projects, the quality of treated water will vary based on the type of end use and the related standards prescribed. An overview of additional incremental technology interventions required to achieve different end uses of recycled water mentioned in (Figure 29).
• Financial benefits o The sale of treated sewage has potential to generate revenue ₹3,285 crore annually in
India (conservative estimate). o Every hectare that is irrigated through treated wastewater can increase farmer’s earning
by ₹17,000 per hectare annually. o Considering the substitution potential of wastewater irrigation and assuming a reduction
of pumping use by at least a third of the current use in the wastewater-irrigated areas, the savings in grid electricity supply requirements would be significant and are estimated to save (the state government and the electricity utility) about ₹600 crores annually or ₹1.6 crore daily.
o The economic value of nutrients recovered from sewage is approximately ₹1,095 – 1,460 crore per annum.
• Environmental benefits o An estimate suggests that use of wastewater for irrigation instead of pumping of
ground water has the potential to save about 1.75 million MWh of electricity annually, which is equivalent to reducing about 1.5 million tons of CO2 e (tCO2) GHG emissions.
o Replacing chemical fertilizer usage by 20% in 2-million-hectare irrigated land, alone leads to reduction of 4,71,237 tons of CO2 equivalent (Refer to Table 15).
o Approximately 3,888– 5,256 tons of nutrients can be recovered from the generated sewage every day (Refer to Table 14).
• Employment generation o An estimated 1800 people can be directly employed to undertake the additional tasks
related to management of supply of treated wastewater.
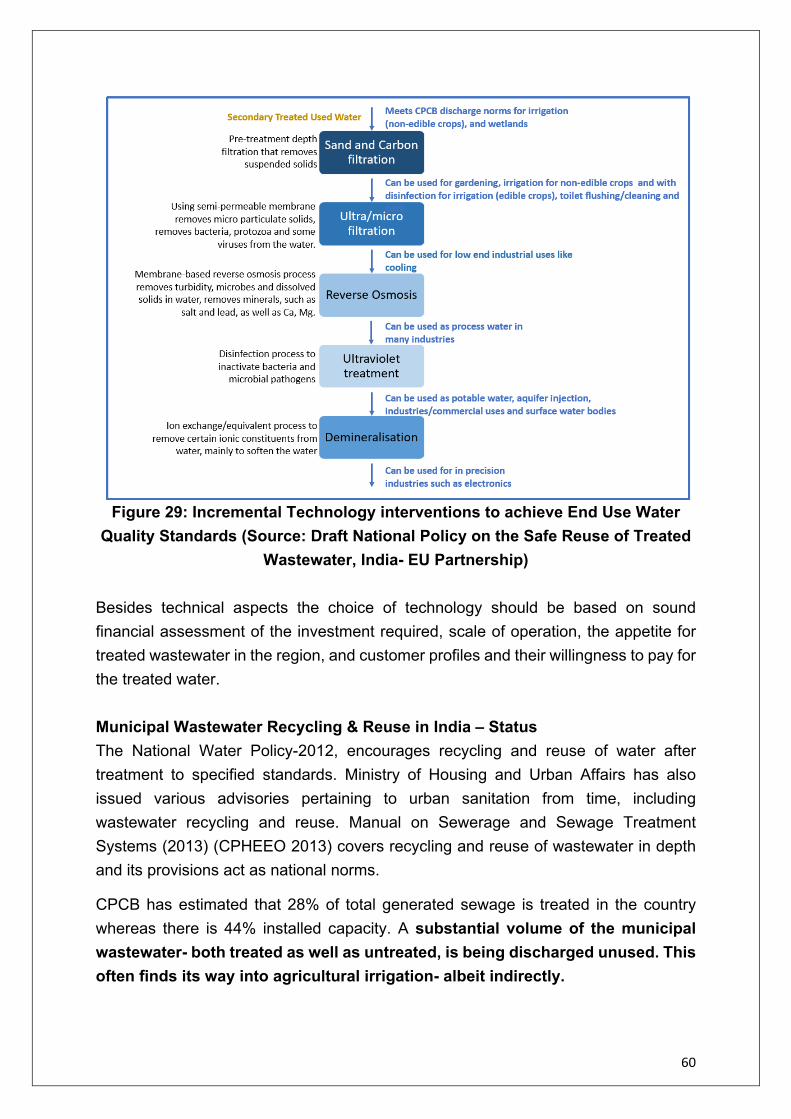
60
Figure 29: Incremental Technology interventions to achieve End Use Water Quality Standards (Source: Draft National Policy on the Safe Reuse of Treated
Wastewater, India- EU Partnership) Besides technical aspects the choice of technology should be based on sound financial assessment of the investment required, scale of operation, the appetite for treated wastewater in the region, and customer profiles and their willingness to pay for the treated water. Municipal Wastewater Recycling & Reuse in India – Status The National Water Policy-2012, encourages recycling and reuse of water after treatment to specified standards. Ministry of Housing and Urban Affairs has also issued various advisories pertaining to urban sanitation from time, including wastewater recycling and reuse. Manual on Sewerage and Sewage Treatment Systems (2013) (CPHEEO 2013) covers recycling and reuse of wastewater in depth and its provisions act as national norms.
CPCB has estimated that 28% of total generated sewage is treated in the country whereas there is 44% installed capacity. A substantial volume of the municipal wastewater- both treated as well as untreated, is being discharged unused. This often finds its way into agricultural irrigation- albeit indirectly.

61
Recently, some progressive ULBs and concerned authorities have been trying to focus on planned reuse of treated wastewater in horticulture, irrigation, industrial processes, construction activities etc.
State Governments of Gujarat, Haryana, Maharashtra, Rajasthan, Chhattisgarh, Karnataka, and Madhya Pradesh have either adopted, or are moving forward with, treated wastewater reuse policies that seek to reduce dependency on freshwater resources.
Figure 30: Aerial view of Sewage Treatment Plant
There are very few examples of successful municipal wastewater recycling and reuse projects, implemented in India. Some cities such as Chennai, Nagpur, Udaipur, and Surat are supplying recycled water to local industries. International Approaches towards Wastewater Recycling & Reuse Globally, almost one third of reclaimed water (32%) is used for agricultural irrigation (Figure 31). This is followed by landscape irrigation26 (20%) and industrial uses (19%).27
Figure 31: Global water reuse after advanced (tertiary) treatment: Market share by application (Source: Lautze et al. (2014) 28)
Landscape irrigation refers to usage of treated wastewater in maintaining parks, lawns, green patches, horticulture, etc. 27 Global Water Intelligence, 2016 in Ohkuma N, 2016 28 www.iwmi.cgiar.org/Publications/wle/rrr/ resource_recovery_and_reuse-series_4.pdf

62
Experience of European Countries Over the years, the European Union (EU) has developed a portfolio of directives to regulate the water cycle which are of major importance for implementing water reuse schemes. Water Reuse Europe is the central body monitoring the water reuse sector in the EU. It has identified 787 reuse schemes the year 2017, distributed across 16 countries up from 350 schemes identified in 2006. Until year 2000, EU regulations, standards or guidelines to regulate water reuse were almost non- existent. The evolution of regulatory adopted by EU is presented in Figure 32.
Figure 32: EU - Timeline of regulatory initiatives relating to water reuse
(Source: Water Reuse Europe Review 201829) Experience of USA US Environment Protection Agency (US- EPA) has been the pioneering global agency to promote various developments in water- wastewater sector and has published considerable techno-managerial literature on the subject of water reuse.
Beneficial use of wastewater has been practised in California since 1890s, when raw sewage was applied on 'sewer farms'. Recently, to further accelerate the consideration of water reuse approaches and build on existing science, research, policy, technology, and national and international experiences, US- EPA has engaged stakeholders to develop a National Water Reuse Action Plan (Figure 33)30.
29https://www.water-reuse-europe.org/about-water-reuse/policy-and-regulations/#page-content 30https://www.epa.gov/sites/production/files/2020-02/documents/national-water-reuse-action-plan-collaborative-implementation-version-1.pdf

63
Figure 33: Water consumption pattern in water scarce state California, USA Other Global Instances: Some of the other widely known international practices of wastewater recycling and reuse are as follows -
• Singapore successfully commissioned “the Newater system” (recycled water) to fulfil 40% of national water demand including non-potable use such as industrial and air-cooling purposes as well as for indirect potable usage by blending it with water reservoirs.
• Comprehensive wastewater recycling and reuse programmes are being executed in the USA, the EU and more recently China over the last 20-30 years. These nations have taken several steps, learning from successes and failures. India may take advantage of their experience and devise long term plans to achieve CE in wastewater recycling and reuse.
Policy and Regulatory Framework in India Existing Regulations on Municipal Wastewater Recycling & Reuse There is no dearth of policy initiatives focussing directly or indirectly on wastewater reuse in India (Figure 34). The awareness at national level had commenced back in 1974, however, the intensity of executing reuse plans has been as recent as in 2013. Based on CPHEEO norms on reuse of wastewater, cities have taken various policy decisions with respect to wastewater recycling and reuse.

64
Figure 34: Regulatory Framework for Wastewater Recycling & Reuse
State-level policies and regulations: Many states have come out with their own policies on wastewater recycling and reuse loosely based on the CPHEEO 2013 guidelines. Further, some states have prepared Action Plans on wastewater recycling and reuse as per the recent NGT directives. These states include Chhattisgarh, Delhi, Andhra Pradesh, Gujarat, Jammu and Kashmir, Jharkhand, Karnataka, Madhya Pradesh, Punjab, Haryana, Rajasthan, Puducherry, Telangana, and Daman. Tamil Nadu has also prepared the Draft Reuse Policy. • Andhra Pradesh Action Plan recommends mapping of bulk users to quantify their
demand, and promotion of use of recycled water for industrial parks. Whereas Telangana Action Plan on wastewater recycling and reuse (Aug 2019)largely focuses on the reuse potential in and around Hyderabad Metropolitan area.
• Some of these differences stem from differing priorities of states based on current water availability and use. Punjab Action Plan for Reuse of Treated water (June 2020) specifically gives the first preference for reuse of treated wastewater for irrigation while other states did not specify irrigation as primary option for reuse.
• Delhi Jal Board prepared the Action Plan on wastewater recycling and reuse in April 2019. It mentions about provision of incentives such as reduction of sewerage O&M charges from 60% to 10% for the institutions that plan to set up decentralised STPs and reuse recycled water.
• The Tamil Nadu Draft Reuse Order (June 2014) focuses on sale of Secondary Treated Effluent Water (STEW) to different end users. The tariff of STEW shall be fixed as per prevailing rate of Chennai Metropolitan Water Supply & Sewerage Board for the base year (2014) with annual escalation of 5%.

65
5.4 Gaps in Policy and Regulations Gaps in policy and regulations are as follows-
• While policy and guiding frameworks in India recognize the need for wastewater recycling and reuse, there has been little in terms of detailed guidance.
• Overlapping of mandates of institutions leading to operational issues on ground. • Lack of appropriate regulatory standards for treated water quality dependent on
intended reuse • Lack of adequate monitoring and quality control systems • State action plans or policies need to be further co-ordinated/ modified to align
with the national action plan- • It is expected that the proposed action plan leads to the development of
guidance material on planning, development and implementation of successful projects and interventions in wastewater recycling and reuse and create an enabling environment for innovation in technologies and institutional arrangements
Potential Users of Recycled Water: Agricultural irrigation for crops not likely to be eaten raw, followed by cooling needs of thermal power plants and urban landscaping remain the major potential users of treated water in terms of volumes engaged. There could be a great variety of other potential users at any specific place. A few examples are mentioned in (Figure 35). Potential Industrial Users: The Power sector is a major consumer of water. In 2010, the water demand of industry and energy sectors was 17 billion cubic meters (bcm) which was expected to increase to 63 bcm in 2025 and 130 bcm in 2050. However, at many places, especially in organised industrial estates, due to enforcement of the Zero Liquid Discharge policy, net water demand for industrial reuse could have since reduced/ stagnated.
Conventional ‘once through’ type thermal power plants are expected to be the principal consumers among industries. The thermal power plants take up almost 88% of water needs of the industry. Other major water guzzling industries like pulp and paper (2.2 %), textiles (2%), steel, (1.3%), sugar (0.5%), fertiliser (0.2%) have a combined intake of less than 5% of the overall water consumption. Almost 90%of India’s thermal power generation is dependent on freshwater for cooling. Some of the larger thermal power plants have potential to consume almost 400-500 MLD of recycled water per day. In December 2015, however the MoEF&CC has brought out a notification that sets limit on water use per unit of electricity generated. This notification has directed power

66
plants to set up water cooling and reclamation facility at the site itself thus significantly reducing the requirement of treated municipal water in times to come.
The pulp and paper industry is the second major consumer of water within industrial sector. Approximately 72% of India’s pulp and paper industries are concentrated in Andhra Pradesh, Gujarat, Odisha, Karnataka, Maharashtra, and West Bengal31.
Textile Industry is the third largest consumer of water of industrial sector. Major textile processing hubs in India are located in Surat, Saurashtra, Ahmedabad, Tirupur, Coimbatore, Erode, Ludhiana, Kanpur, Solapur, Ichalkaranji, etc
Figure 35: Case studies of wastewater reuse projects in India India’s experience in Reuse for industries: There are a few exemplary wastewater recycling projects in India. Some are highlighted hereunder: Chennai Metropolitan Water Supply and Sewerage Board (CMWWSB), in 1991, started supplying 36 MLD of secondary treated effluent from Kodungaiyur STP to the Chennai Petroleum Corporation Ltd., Madras Fertilizer Ltd., and Manalo Petro Chemicals. In 2019, it commissioned two Tertiary Treatment Reverse Osmosis (TTRO) projects of 45 MLD each at Kodungaiyur and Koyambedu which supplies water to industries around Chennai.
Surat Municipal Corporation (SMC) has replaced its potable water supply to Textile industries with 40 MLD of recycled water. Currently, Surat is recycling 302 MLD i.e., 32% of total treated sewage and supplying it for industrial, agriculture and
31https://forum.valuepickr.com/t/jk-paper-best-bet-in-paper-sector/19880

67
gardening purposes. SMC has prepared a comprehensive plan to upscale reuse with a target of consuming 79% of treated sewage.
Reuse Standards for Industrial uses The industrial applications majorly include - cooling water, re-circulating or evaporative cooling water, boiler feed water, process water and irrigation and maintenance of landscape. The CPHEEO manual on Sewerage and Sewage Treatment Systems, provides details of input water quality guidelines for above mentioned various uses. Indian standards for quality tolerances for a few industrial uses are noted below:
• IS: 201 Water quality tolerances for the textile industry • IS: 2724 Water quality tolerances for the pulp and paper industry
Generally, all the processes in an industry do not require water of the relatively high quality given in the above noted Indian Standards. There are always several unit processes and operations where water of lower quality can be accepted.
Agriculture Uses In 2010, the agricultural irrigation sector consumed 688 billion cubic metre (BCM) (1885 Billion litres per day) compared to wastewater generation of just 72.368 Billion litres per day. This sector is expected to remain the highest water consuming sector even in the future, despite improved irrigation techniques. It is estimated that agricultural irrigation will require 910 and 1,072 BCM of water in 2025 and in 2050, respectively.
While the agricultural fields needing irrigation as well as the agro-industries are spread over vast geographical areas in the country, but are fields catering for human consumption are more concentrated in fringes of Municipal Areas. The share of agricultural sector in overall water demand is 88%. Around 25% of this irrigation demand- in areas adjacent to urban centres and in fields catering for crops not to be eaten raw can easily be met and which will exhaust the entire treated municipal wastewater discharge. This treated water can also be ponded and stored for dry weather use.
Bangalore: The minor irrigation department of Karnataka pumps 440 MLD of secondary treated wastewater from Koramangala and Challaghatta valley (KC Valley) STPs to the drought-prone districts of Kolar and Chikkaballapur. The treated wastewater is pumped to fill up 137 tanks in two districts for irrigation. This project is one of its kind in Indian agricultural sector.
Phagwara, Punjab: Under this project, approximately 12 kilometres of sewer network has been laid from STP to supply recycled water for irrigation purpose. The farmers

68
were well trained to operate the project which is now led by water user association formed amongst beneficiaries of the project.
Reuse Standards Legal restrictions on growing crops and vegetation in agricultural land using sewage water are generally based on possible pollutants and pathogens which pose threat to health of the farmers as well as the consumers. CPCB has identified water quality requirements in terms of a few chemical characteristics, known as primary water quality criteria. Further, Bureau of Indian Standards also recommended water quality parameters for different uses in the standard IS 2296:1992. Guidelines are available to evaluate quality of water for irrigation. However, there are no standards available on maximum permissible concentration of toxic trace elements in irrigation water in Indian standard for irrigation water quality.
Under such situation, India may adopt maximum permissible concentration of toxic trace elements (As, Cd, Co, Cr, Cu, Ni, Pb, Se, Zn) in treated wastewater as recommended by FAO. No standards are available to monitor permissible concentration of pathogenic microorganisms in irrigation water in India.
Municipal Uses The non-potable water uses in municipal areas includes (i) Landscape irrigation (ii) Impoundments/ lakes (iii) construction activities, (iv) recreational activities such as golf course, parks, playgrounds, and stadiums, and (v) other uses such as washing of vehicles, dust suppression on roads, flushing of toilets, firefighting, social forestry, and road-side plantations.
Landscape irrigation is a major consumer of treated wastewater in modern growing urban centres and smart cities. With an aim to increase the green-blue spaces in urban centres, treated wastewater in bulk can be consumed in such developments along with urban impoundments and lakes.
Construction activities: Construction activities within cities (buildings townships, roads, railways, and metro-rail, bus depots, and airports) has a potential to use recycled water. Additionally, recycled water can be supplied for other non-potable uses in railways, airports, and townships etc. The total real estate stock added in India during 2019 was 200 million sq.ft.32. The total estimated water demand of the real estate sector in India was 37.2 million m3 in 2019 (101.9 MLD). Ready mix concrete
32https://www.ibef.org/industry/real-estate-india.aspx

69
plants (RMC), utilised 6,740 Million Litres of water to achieve estimated concrete production of 22,46,262 cum/month in India.
Private townships: A large number of private townships have come up during the last decade. These townships consume recycled water for non-potable purposes such as construction activities, toilet flushing, gardening, HAVAC, dust control, car wash, misting and others.
Nanded City is a 700-acre private township situated in Pune, housing more than 30,000 residents. It recycles and reuse around 22.75 MLD of wastewater for toilet flushing, horticulture, and HVAC cooling make up water. More than 50% of total water demand is met through recycled wastewater33.
Delhi and Mumbai Airports have demonstrated reuse for non-potable purposes such as horticulture. Southern Railways is using recycled water for washing of wagons. In case of Coimbatore, a portion of treated effluent from Ukkadam STP is transported through pipeline to Vellalore lagoon and from there around 300 KLD of the treated effluent is supplied to the Golf Club. In Bangalore, 4MLD of wastewater is recycled and reused for gardening in Cubbon park that is spread over 177 acres.
Reuse standards: Recycled water can also be used for municipal uses like landscaping, parks, toilet flushing and firefighting. However, as these activities may involve close human contact appropriate norms are required to be per prescribed by CPCB. Environmental Use The environmental uses include recharge of lakes and water bodies, and aquifer recharge. The Government of India (GoI) has prioritized conservation of water bodies by creating the new Jal Shakti Ministry and announcing the Jal Shakti Abhiyan which is a mission-mode water conservation campaign. The five intervention areas cover – rainwater harvesting, renovation of water bodies and tanks, reuse and recharge structures, watershed development and intensive afforestation. In addition, the National Mission for Clean Ganga (NMCG) released a manual cum concise guide for River Restoration and Conservation.
Water body/ lake rejuvenation. Mahadevapura Lake in Bangalore is rejuvenated jointly by the government, private players, community and national and international non-profit organizations. A DEWATS based wastewater treatment plant of 1 MLD
33 Application for Amendment & Extension of Validity in Environmental Clearance for Construction of Proposed Township Project “Nanded City”

70
capacity is constructed to treat the incoming wastewater. Tertiary treated wastewater is used to fill the lake. This case also elicits the principle of co-funding where multiple stakeholders jointly funded the rejuvenation project.
Key Findings: Industrial Use
• Cities have multiple options; sale of secondary or tertiary treated sewage or combination of both depending upon the user
• Assured demand by industries both in terms of quality and quantity is essential • Government funding plays a critical role in catalysing private investment • Viability gap funding or blended finance model could boost PPP
Municipal Use
• Many municipal (non-potable) uses are under ULBs’ control where they can make it mandatory to use recycled water
• States while issuing Environmental Clearance for construction projects, can mandate use of recycled water for construction related activity
• User-based reuse standards are provided in CPHEEO manual 2013, which needs to be revisited
Agriculture
• Key barriers for using recycled water are (i) free electricity offered to farmers for running the tube wells installed at farms individually, (ii) no prohibition in extraction of ground water in states like Punjab, (iii) many regions like Punjab and western parts of Maharashtra have good accessibility to the surface water options for irrigation purpose, (iv) fragmented land holding resulting into smaller and distributed demand and (v) pricing the treated water for agriculture use is difficult.
5.5 Recommendations and Action Plan
While the benefits of wastewater recycling and reuse may be known to different stakeholders, there are very few initiatives and projects on ground. This needs to be addressed through coordinated efforts at national, state and city levels of administration.

71
Action Plan Setting Goals for municipal wastewater recycling and reuse a) Availability of Treated Sewage including potential availability As per CPCB:
• Total 1,631 STPs (including proposed STPs) with a total capacity of 36,668MLD • Sewage generation from urban centres estimated as 72,368 MLD. • Estimated sewage generation: 94,773 MLD by 2036 and 1,20,000 MLD by
2050. • Installed treatment capacity (2020): 31,841 MLD and treated quantity: 20,236
MLD b) Defining Goals With potential demand of 876billion m3/year in agriculture sector followed by 31 billion m3/year in thermal power plant the goals are set. Other industry may need approximately 4.5 billion m3/year. The short term (2026) target of 25%, mid-term (2036) target of 35% and the long term (2050) target of 50% are set based on the quantity of municipal wastewater generation and potential utilization of sewage (Figure 36).These targets are average percentages for each state to achieve considering the regional diversity, uneven user concentration across regions, and non-uniform availability of treated wastewater across cities/ towns.
Figure 36: Goals set for Wastewater Recycling & Reuse

72
Key Actions and Roles of Key Stakeholders a) Detailed Action Plan A detailed Action Plan for National/ State / joint initiatives is given in Table 11, Table 12, and Table 13.
Table 11: Detailed Action Plan – National Level SN Actions Required Responsible agencies Nodal 1 Establish institutional
mechanism at national and state level for circular economy in wastewater recycling& reuse.
Ministry of Jal Shakti, MoHUA, Mo Industries, Mo Agriculture,
Ministry of Jal Shakti, MoHUA
2 Preparation of new standards for designated reuse of the treated wastewater and guidelines for the reuse
CPCB, MoEF&CC with experts from institutes like NEERI, IITs
CPCB/ MoEF&CC
3 Assessment of current and future availability of treated sewage, particularly post implementation of SBM.
Ministry of Jal Shakti, SBM cells, CPCB
Ministry of Jal Shakti
5 Formulate a NATIONAL Scheme to promote and finance wastewater recycling &reuse
Ministry of Jal Shakti, MoEF&CC, MoHUA, Ministry of Industries, MoF, MSMEs
--
9 Strengthen existing mechanism for stringent implementation of restricting discharge of polluted wastewater
CPCB, MoEF&CC CPCB
10 Preparation of technology compendium on wastewater recycling
CPHEEO, NEERI, CPCB
CPHEEO, Ministry of Jal Shakti
9 Preparing safety guidelines for transportation, utilization of treated sewage and promote water safety audits
CPCB, MoEF&CC --
11 Updating the bidding norms – giving weightage to quality and cost.
State Sewerage Boards, Ministry of Jal Shakti, expert institutions
State Sewerage Boards, Jal Shakti,
12 Tax concession/ incentives to setup STPs, including tax reductions on equipment, policy to be prepared.
MoF, Jalshakti --
13 Creating PPP mode models for STPs and reuse of treated wastewater in different sectors.
Ministry of Jalshakti, MoHUA, With inputs from experts
--

73
SN Actions Required Responsible agencies Nodal 14 Research and Development
projects in field of innovative methods for reuse/recycle of treated wastewater
CSIR laboratories, DST, DBT, NRF, IITs, NITs
DST, DBT, NRF, CSIR, Private. Enterprises/ business, incubators.
15 Activities for improving acceptability of treated sewage for reuse– prepare and disseminate guidelines and framework for Information, Education and Communication (IEC) Activities
State governments with CPCB, MoEF&CC, reputed NGOs
CSR funds
16 Create a digital platform for treated sewage trade and ecosystem for transportation and supply
State sewerage boards, water supply department, NIC, private partners
State sewerage boards, water supply department,
17 Incorporate/ mainstream the concept of Circular Economy in wastewater recycling & reuse in existing missions such as SBM, Smart City etc. and take up project along that.
Jal Shakti, MoEF&CC, MoHUA,
MoHUA
18 Implementation/ Upgradation of STPs and improve coverage of sewerage network and connectivity in existing STPs to meet the 100% treatment capacity and proper O&M
State Governments/ UTS, ULBs, Sewerage Boards, Jal Shakti (SBM coordinators)
Multilateral, bilateral , Central schemes AMRUT, SMART cities SBM (U&G), other funds,
Table 12: Detailed Action Plan – State Level and including ULBs SN Actions Required Responsible agencies Nodal
1 Set up a State level Steering Committee on circular economy in municipal wastewater recycling & reuse
State Governments State Urban Development Dept.
2 Assessment of current and future availability of treated sewage, particularly post implementation of SBM and create a mechanism to routinely update it. Including mapping of sectoral demand
Ministry of Jal Shakti, SBM cells, CPCB, State governments/UTs
Jal Shakti, FY plan of ULBs/States
6 Preparation of State Wastewater Reuse policy including industry specific business models
State Depts. - Industries, Urban Dev., Agriculture
State Urban Development Dept.

74
SN Actions Required Responsible agencies Nodal
7 Set up a State level Wastewater Recycling & Reuse Fund
State Governments --
8 Incentives (such as municipal tax benefits) for residential societies with Environmental Clearance and having in-situ STPs with reuse capacity upto 40% of treated wastewater
State / ULBs --
10 Low hanging fruits–Identify and develop wastewater recycling and reuse projects in pipeline on priority.
State Industries, Urban Dev., Agriculture & Environment depts.
--
11 Align with National policies on updating the bidding norms, digital treated water trade platform, improving coverage of sewerage network, treatment capacities
State Sewerage Boards, water supply department, Ministry of Jal Shakti, expert institutions
State Sewerage Boards, Ministry of Jal Shakti
12 Activities for improving acceptability of treated sewage for reuse– carry out IEC activities.
State governments with CPCB, MoEF&CC, reputed NGOs
SPCB
14 Implementation/ Upgradation of STPs and improve coverage of sewerage network and connectivity in the existing STPs to meet the 100% treatment capacity and do proper O&M.
State Governments/ UTS, ULBs, Sewerage Boards, Ministry of Jal Shakti(SBM coordinators)
Central schemes AMRUT, SMART cities SBM (U&G), other funds,
Table 13: Detailed Action Plan – National and State Level – co-ordinated
SN Actions Required Responsible agencies Nodal 1 Strengthen monitoring of wastewater
management system including generation (quality/ quantity), reuse and safe disposal within urban and peri-urban areas by setting up an independent mechanism apart from CPCB and SPCBs.
Ministry of Jal Shakti, MoHUA, State Govts.
CPCB
2 Strengthening capacities of the various intuitions and stakeholders
NEERI State Training Institutes, CPCB
GoI programs
3 Plan national wide campaigns for information dissemination, communications, and educational outreach
Ministry of Jal Shakti, MoHUA, State Govts.
4 Recognition, awards acknowledging the best performing water reuse projects
Ministry of Jal Shakti, MoEF&CC, MoHUA, State Govts.

75
Table 14: Estimates for financial, economic and environmental benefits Total quantity of untreated sewage 72,000 MLD Target to reuse treated sewage by 2030 18,000 MLD Quantity of treated sewage to be sold to industries 4,500 MLD Revenue generated out of sale of sewage (@20₹/KLD) 9,00,00,000 Total nutrient value per MLD of sewage (tons/day) 0.054 - 0.073
Estimated nutrient value for 18,000 MLD of sewage (tons/day) 3,888 – 5,256
Total economic value of nutrients (minimum) ₹ 3,11,04,000 Total economic value of nutrients (maximum) ₹ 4,20,48,000 Total number of hectares/ day that can be irrigated with the recovered nutrients 24,923 *Estimated the nutrient potential in wastewater which ranges from 0.054 to 0.073 tonnes MLD-1 (adapted from Minhas 2002; Silva and Scott 2002; CPCB 2009b; WII 2006) *Assuming 1 tonne of nutrient load is 8,000 ₹/ton34 *One hectare of farmland consumes 156 Kg of fertilizer35
Table 15: Estimates for GHG reduction
Potential for treated wastewater irrigation (TWW)36 2 million hectares At 25% use 0.5 million hectares Assuming 50% TWW is used for wheat 0.25 million hectares
At emission rate of 977.15 kg per ha37 2,44,287.5 tons of CO2 equivalent
Assuming 50% of TWW is used for rice 0.25 million hectares
At emission rate of 8447.59 kg per ha 21,11,898 tons of CO2 equivalent
Assuming potential reduction in fertilizer use of 20% due to TWW
Potential reduction in GHGs 4,71,237 tons of CO2 equivalent
*Projected reduction of 40% in chemical fertilizer use, only 20% considered for conservative estimate
Key Interventions to implement the action plan National level interventions Following policy actions and reforms need to be taken up by the central government in promoting wastewater recycling and reuse:
34 http://www.iwmi.cgiar.org/Publications/wle/rrr/resource_recovery_and_reuse-series_8.pdf 35 http://www.iwmi.cgiar.org/Publications/wle/rrr/resource_recovery_and_reuse-series_8.pdf 36 http://www.iwmi.cgiar.org/Publications/wle/rrr/resource_recovery_and_reuse-series_8.pdf 37 https://www.ncbi.nlm.nih.gov/pmc/articles/PMC5268357/

76
• Develop comprehensive policy and regulations on wastewater recycling & reuse in agriculture, non-potable municipal use and in various industries
• Prioritize, incentivize, and integrate wastewater recycle & reuse in various programs and missions of ministries and earmark funds and monitor implementation
• Constitute an inter-ministerial National Steering Committee – MoEF&CC, MoHUA, MoAFW, MoH&FW, MoF, MoJS, DIPP38. National Steering Committee shall promote and monitor capacity building program and further facilitate infrastructure development for wastewater recycle and reuse in domain of various ministries/ departments like urban, industry, railways, highways, defence etc. – integrate principles of circular economy in respective missions/ programs of
ministries and prioritise infrastructure development outside urban areas to utilise treated wastewater.
– Suitable coordination also to be established with the states to facilitate faster clearances from central ministries while laying infrastructure.
• Set up central innovation fund to promote technology development, deployment, and validation along with impetus to entrepreneurship to start-ups.
State level interventions There is regional diversity in India in terms of geographical settings, availability of water resources, demand- supply scenario and socio-economic fabric.
• Each state needs to have its own wastewater recycling & reuse policy in line with the national policy and guidelines or amend existing policy that could encourage a shift to treated wastewater as an alternate source to freshwater.
• Set up a State Level Cross-sectoral or Cross-agency Committee • Upgrade and strengthen existing STPs to meet effluent quality for recycle and
reuse • Carry out activities to promote reuse of wastewater and develop the market • Financing and incentivisation, set up a State Level Wastewater Recycling & Reuse
Fund • Develop a capacity building program on wastewater recycling and reuse for
government agencies and private sector-actors on project development, contracting, treatment technologies, monitoring, and O&M needs of wastewater recycling & reuse.
38 The Ministry of Environment, Forest, and Climate Change, Ministry of Housing and Urban Affairs, Ministry of Agriculture and Farmer’s Welfare, Ministry of Health & Family Welfare, Ministry of Finance, Ministry of Jal Shakti, Department for Promotion of Industry, and Internal Trade.

77
In the United States, private industry has traditionally financed industrial water treatment and reuse systems through a combination of commercial loans and corporate bonds, while public water utilities have had access to government subsidized financing through the Clean Water State Revolving Fund (CWSRF).
The 2014 Water Resources Reform and Development Act (WRRDA) allows private companies to obtain CWSRF loans to support onsite industrial water recycling and reuse projects and other privately-owned facilities that reuse or recycle wastewater, storm water, or subsurface drainage water39.
39https://watereuse.org/wp-content/uploads/2015/01/Industrial-Reuse-CWSRF-WP.pdf


79
6.1 Introduction
Sludge has for long been viewed as a resource rather than merely as a by-product of liquid waste, since it contains valuable nutrients that promote the growth of crops. Hence, the need of the hour is to develop sustainable sludge management and reuse strategies that are both economically and technically sound and environmentally feasible integrating circular economy principles.
Many countries such as USA and EU member countries are mainstreaming extraction of energy from sludge process and are promoting the concept of circularity in sludge management.
In comparison, sludge utilisation in India is currently being done in an unregulated manner, with little regulatory or eco-system support & standards. In fact, we are yet to recognise and exploit opportunities in sludge & wastewater recycle and reuse. If circular economy principle is mainstreamed in sludge processing and its utilisation, it will result in achieving significant outcomes like improved health, environmental, social, economic benefits etc.
This document will lead to the development of guidance material on successful business models and create an enabling environment for recycle and reuse using innovative technologies.
In the following section, a comprehensive analysis of the current situation of sludge management, gaps in current approach, policies and regulations are given along with recommendations & action plans to mainstream circular economy concepts in planning and implementation.
Figure 37: Composting

80
Figure 38: 345 MLD Lucknow UASB based STP along with Sludge Drying Bed
6.2 Current Scenario & Challenges Current Scenario of sludge utilisation
Till recently, there was hardly any formal system for using treated sludge in a beneficial manner in India. Majority of septic tanks were desludged only when they were completely filled up, and often led to choking of the on-site system. Similarly, sludge from STPs were often dumped or used in agricultural fields without any regulation. Currently, around 80% of sludge is being utilised in India.40
Figure 39: Nutrient/energy recovery from various FSTPs
40 Promoting beneficial sewage sludge utilization by ADB
3 %7 %
4 9 %1 4 %
3 %
2 1 %
3 %
F S T P ' s b y t y p e o f r e s o u r c e r e c o v e r e d i n I n d i a
E n erg y E n erg y & Water Non eNu trien ts & Water E n erg y & n u trien ts Nu trien tsE n erg y , w ater & n u trien ts

81
The share of nutrient/energy recovery from various FSTPs in India is shown in the figure 39.
In addition to above, Ministry of Petroleum & Natural Gas has recently launched an initiative titled “Sustainable Alternative Towards Affordable Transportation (SATAT)” aiming at providing compressed biogas (CBG) as an alternative to CNG in automobiles. This initiative has the potential to reduce dependence of country on importing CNG for use in automobiles. This initiative holds great promise for efficient municipal solid waste & sewage sludge management by converting it into compressed biogas (CBG). CBG has the potential to replace CNG in automotive, industrial and commercial uses in the coming years. It is planned to roll out 5,000 CBG plants across India by 2025.
Figure 40: Bio-Gas Plant
However, the focus of MoPNG is presently on those areas which are generating huge biomass such as crop residue etc. and sewage sludge/ solid waste are to pick-up in coming times. Existing regulatory framework in India
Over the past years, substantial development has taken place in India in the field of waste management and relevant regulatory frameworks have evolved to deal with various types of waste. Moreover, legal instruments, related to environmental pollution, also provide for safe collection and disposal of wastewater and sludge. However, a comprehensive dedicated regulatory framework for recycle and reuse of municipal sludge is yet to evolve in India and is much needed in the present context.

82
The following section summarises the existing Acts, Policies and Advisories that comprise the current regulatory framework in India.
1. Environment (Protection) Act, 1986 At national level, the Environment (Protection) Act was enacted in 1986 (with subsequent amendments) empowering the Central Government to establish authorities charged with the mandate of preventing environmental pollution in all its forms and to tackle specific environmental problems that are peculiar to different parts of the country. Some of the relevant clauses include preventing harm to the environment by restricting discharge of untreated sewage/ environment pollutants, Polluter Pays Principle which emphasizes on collecting user charges for wastewater processing and power to make rules etc.
2. The Environment (Protection) Rules, 1986 These regulations were drawn up by the government under the powers conferred on it in terms of the Environment Protection Act 1986, as discussed above. The first provision of concern to companies and factories is contained in Section 3 which discusses Standards for emissions or discharge of environmental pollutants. It refers to the standards laid down for emission or discharge of environmental pollutants from the industries. However, there are no specific standards notified for sludge application for agricultural purposes including those for various other by-products.
3. The Water (Prevention and control of pollution) Act, 1974, amended 1988
The Act was introduced to provide for the prevention and control of water pollution and the maintaining or restoring of wholesomeness of water. The act also prohibits the disposal of polluting matter (as defined by the state pollution control board standards) into streams, wells or sewers or on land. The Act also provides for penalty for those violating the act.
4. The Fertiliser (control) Order, 1985 The order was enacted in 1985 by Ministry of Agriculture and Rural Development which empowers the Central and State Governments for the regulation of fertilisers in the country in respect of grant of permission for production, import and export, price and mixtures of fertilisers. In schedule IV (Part A & Part B) of this act, characteristics of compost are defined along with the tolerance limits of various parameters in the organic fertilisers, which can act as guiding tool for the reuse of sludge as a bio-fertiliser for land applications.
5. Hon’ble National Green Tribunal orders

83
In the recent past, the Hon’ble NGT has often acted as a driving agency for enacting the standards for various wastes. In this regard, Hon’ble NGT has from time to time given its observations and orders for the proper management of sludge and sanitation practices.
• On 17.02.2020, the Yamuna pollution monitoring committee, appointed by Hon’ble NGT gave its observations on various methods of sewage and sludge treatment and emphasized on scheduling of desludging from septic tanks and other treatment facilities.
• Hon'ble NGT in para no. 16 of its order dated 16.7.2019 in OA no. 916 of 2018 in the matter of Sabha Singh and Others V/s State of Punjab stated that “The industry shall dispose of its sludge from physio chemical treatment, secondary clarifier sludge and other waste material in an environmentally sound manner, and the industry shall install multi effect evaporator followed by dryer and the dried sludge may be sent to Treatment, Storage and Disposal facility TSDF, Nimbua
International Practices for Sludge Management and Utilisation For years, sewage sludge treatment has been considered a secondary issue compared to main wastewater treatment. However, importance of sludge management, is on the rise due to the fast increase of sludge generation owing to sewage network extensions, new installations, and upgrading of facilities. United States, Europe and East Asia are leaders in sludge utilisation.
The practices of sludge management in these countries/areas are briefly mentioned below:
Policy Initiatives
• National Advisory on Septage Management in Urban India
• Manual on Sewerage and Sewage Treatment, 2013 published by CPHEEO, MoHUA. It describes various sludge treatment processes so that it can be reused as a resource material into other forms.
• National Policy on Faecal Sludge and Septage Management (FSSM), 2017
• Advisory on On-Site and Off-Site Sewage Management Practices, 2020

84
USA As per United States Environment Protection Agency (USEPA), guidance and regulations are the best way to promote good practices for sludge reuse, recycle and disposal that minimize the potential adverse impacts on public health and the environment and maximize the potential benefits. The benefits potentially gained through sludge use include energy and nutrient recovery, soil improvement, and conservation of valuable natural resources.
The American regulations contain very specific directions for sludge treatment before disposal including requirements for pathogens and vector attraction reduction. There were several laws (e.g. Clean Water Act; Clean Air Act; Resource Conservation and Recovery Act: Marine Protection, Research and Sanctuaries Act: Toxic Substances Control Act: and the National Environmental Policy Act) which laid emphasis on environmentally sound management of municipal sludge and several of these laws stressed the need for sludge utilization and reuse. Because there was no single legislative approach, a framework for integrating the various Federal laws and regulations was needed to ensure that sludge is used or disposed of in a consistent, environmentally acceptable, and economically feasible manner.
To comprehensively address the issues of sludge management, EPA brought out its final edition part 503 which contains ‘Standards for the Use or Disposal of Waste water sludge’ on 25 November 1992. As a result, the sludge utilisation reached to 55 % as per ADB report (201241), mostly in form of land application.
In 1977, section 405 of the Federal Water Pollution Control Act was amended to add a new section, 405(d), that required EPA to develop regulations containing guidelines for the use and disposal of sewage sludge on land as well as in water.
Recognizing the health concern of pathogenic microorganisms in sludge, USEPA, based on the level of pathogen reduction, classified bio-solids into Class A and Class B. • In Class A bio-solids, the pathogens are below detectable limits: this is achieved
by methods such as heat drying, composting, and high-temperature aerobic digestion.
41https://www.adb.org/sites/default/files/publication/29785/promoting-sustainable-sewage-utilization-prc.pdf

85
• In Class B bio-solids, pathogens are present, but the levels are low enough not to pose risk to human health and the environment.
Figure 41: Land Application of sludge
While Class A bio-solids can be bagged and sold, Class B bio-solids can only be used in bulk in controlled sites (e.g. agricultural and forest lands, reclamation sites etc.). For land application of both Class A and Class B bio-solids, all parameters in Part 503 sludge rule e.g. vector, pollutant, and management practice requirements have to be met.If the treatment plant’s solids will be disposed in municipal solid waste landfills or used as landfill cover material, they must comply with the requirements of 40 CFR 258 (municipal solid waste landfill regulations) rather than with Part 503.
European Union
To address the problems of sludge management, European Union came out with waste policy based on the hierarchy of minimisation, recycling, incineration with energy recovery and landfilling.
Using the above hierarchy, EU gives various directives to the Member States for sludge management, as given below:

86
Germany
The legal initiatives of Germany can be tabulated as below:
Table 16: Legal initiatives of Germany
The new German Sewage Sludge Regulation requires sewage plant operators to recycle phosphates. Pursuant to the new German Sewage Sludge Regulation in force since 3rd October 2017, sewage sludge must now be recycled to recover phosphorus. The aim is to gradually close the phosphorus cycle and reduce Germany’s dependence on phosphorus imports. This will save phosphorus resources and reduce soil contamination.
• In article 14 this directive emphasises that Sludge arising from waste water treatment shall be re-used whenever appropriate. Disposal routes shall minimize the adverse effects on the environment.
• In article 16 it directs Member States to ensure that every two years the relevant authorities or bodies shall publish situation reports on the disposal of urban wastewater and sludge in their areas, and communicated to the Commission.
Directive 91/271/EC Urban Wastewater Treatment:
• This directive aims to:• (a) regulate the agricultural use of sewage sludge by avoiding
deleterious effects on soil, vegetation, plants and livestock, and at the same time, and
• (b) promote sound sludge use practices.
Directive 86/278/EC
Act Purpose Act for Promoting Closed Substance Cycle Waste Management
Promotion of closed substance cycle economy, resource protection, environmentally sound waste disposal
Sewage Sludge ordinance Sludge application to agricultural land (limiting values for quantities, soil, sludge parameters and nutrient demand)
Fertilizer Ordinance/ Ordinance on the Principles of Good Professional Practice During the Application of Fertilizers
German Federal Soil Protection and Contaminated Sites ordinance
Additionally, for sewage sludge used in landscaping, recultivation and land reclamation
Technical Instructions on Waste from Human Settlements
Landfilling of sludge

87
6.3 Potential for Circularity in Sludge
Approximately 60% of India’s population is dependent on on-site sanitation systems, the balance 40% being covered with off-site systems. Sludge is generated from both systems and needs to be managed appropriately, with minimal adverse effects on the environment. However, in contrast to on-site sludge, sludge from off-site systems might contain heavy metals, industrial waste, kitchen waste, runoff, emerging contaminants etc. that would require special attention while using the treated sludge.
As per the CPCB report on National Inventory of Sewage Treatment Plants (2021),42 sewage generation from urban centres is about 72,368 MLD. The total sludge potential in the country is approximately 18,000 tonnes per day. This estimated quantity of sludge contains phosphorous, potassium, nitrogen &carbon which are vital for crops/plants. After removal of pathogens and other pollutants, this can be beneficially utilised and promote circular economy. It is estimated that out of sludge recycle & reuse, annual return will be of order of ₹6,700 crore due to the generation of 82.5 Lakh cubic meter of biogas and 3,600 metric tonne of compost per day. It will also save an estimated land area of approximately 450 acres costing about ₹350 Crores.
It is also estimated to generate employment @ 5,000 persons per year. The estimated return involving circularity in sludge management is given at Annexure 5.1. A case study of Chennai is given at Annexure 5.2.
Figure 42: Faecal-oral transmission of pathogen
As per MoEF&CC’s India Second Biennial Update Report to the United Nations Framework Convention on Climate Change, emissions from domestic and commercial
42https://cpcb.nic.in/openpdffile.php?id=UmVwb3J0RmlsZXMvMTIyOF8xNjE1MTk2MzIyX21lZGlhcGhvdG85NTY0LnBkZg==

88
wastewater treatment and disposal were 366 Lakh tonne of CO2 in 201443. Thus, scientific treatment of sludge is expected to result in saving of 400 Lakh tonne of CO2.
6.4 Gaps & Challenges in Current Approach
With the implementation of circular economy, it is important to evaluate constituents that may impact both humans and the environment. On the basis of analysis of the different approaches in different countries, some gaps and issues in India have been identified, as given below:
i. MoPNG is presently considering huge biomass resources such as crop residue, cow dung etc. Thus, its lack of focus on sewage sludge/solid waste represents a gap in current scenario.
ii. Social stigma towards by-products of sludge treatment is also a major issue, due to which there is a lack of market to sell the treated sludge.
iii. Lack of intra-country studies on various pollutant transfers in the soils when the sludge is applied on agricultural lands and appropriate application rates of sludge creates aversion among farmers to dispose the fully or partially treated sludge in their lands.
iv. Lack of research in enriching the by-products with additional nutrients by adding other wastes and microorganisms in the products, so that they are viewed as replacement for chemical fertilizers.
v. Absence of successful case studies or successful business models within the country makes the sludge treatment a lesser preferred option by stakeholders as there is no guarantee for payback.
vi. There is no proper accounting and monitoring of sludge from small scale decentralised STPs, which makes it absent from the National/ States’ radar.
Gaps in regulations & policy
i. Lack of dedicated standards on discharge of sewage sludge, recycle and reuse: Though various guidelines/standards have been brought out by the Centre and State Governments regarding waste disposal in the past, there are no dedicated
43https://moef.gov.in/wp-content/uploads/2019/04/India-Second-Biennial-Update-Report-to-the-United-Nations-Framework-Convention-on-Climate-Change.pdf

89
comprehensive discharge standards for sewage sludge. ii. Lack of dedicated quality standards for treated sludge in Fertilizer Control
Order: Maximum limits in respect of various contaminants in organic compost had been prescribed in the subsequent amendments of Fertilizer (control) Order, 1985. However, the order does not have any dedicated standards for treated sludge to be used as manure as the nature and concentration of contaminants vary widely in sewage sludge when compared to other wastes.
iii. Lack of guidelines or standards for alternative uses of treated faecal sludge: There are no guidelines/standards for various treatment/disposal options for sludge such as alternative fuel in cement industry, thermal processing etc.
iv. Lack of integrated policy for treatment and reuse of faecal sludge: No comprehensive policy exists currently for the collection, conveyance, treatment, recycle and reuse of sludge, except for that of the faecal sludge.
v. Lack of integrated user charges for sewage and sludge management: Although sludge accountsforonly1 -2 % of sewage volume, the cost of treatment of sludge accounts for approximately 20-60 % of wastewater treatment cost. However, the current user charges collected by the ULBs are at older rates and does not account for the sludge treatment costs.
vi. Lack of monitoring framework on recycle and reuse of sludge: There is no regulatory framework in the country that considers risk associated with the recycle and reuse of municipal sludge including rigorous and continuous monitoring.
vii. Lack of Market based incentives for sewage sludge: Subsidy/Market Development Assistance, as in case of city compost, does not exist in case of sewage sludge.
viii. Lack of mandatory sale of sewage sludge products: There is no obligatory framework for fertilizer companies to sell/buy the by-products out of sludge management.
ix. Lack of standard guidelines on reuse of sludge: Standards /guidelines for reusing sludge as a fuel needs to be developed so that the carbon foot print of industries can be reduced.
x. Lack of national policy on sewage sludge management policy: Unlike the NPDES programme in USA, there is an absence of any national level sewage sludge management policy, program, circular economy model or regulation to enhance resource efficiency for treated sludge reuse and recycling.
xi. Absence of Penalizing mechanisms: penalty clause for strict enforcement action including fine against a person or wastewater treatment plant (WWTP)
90
manager who does not meet the requirements of reuse or recycling of sludge is also missing currently.
xii. Lack of SLB for Sludge recycling and reuse: Like in case of wastewater targets there is no Service Level Benchmark (SLB) for the recycling and reuse of sludge for placing the component in forefront.
xiii. Lack of tax benefits: There is no GST exemptions or tax holidays for sludge recycle and reuse.
6.5 Technology Options
There are many proven technologies to treat sludge vis-à-vis composting, hygienisation, thickening, dewatering, incineration, gasification, pyrolysis etc. given in the Manual of Sewerage & Sewage Treatment Systems, 2013 published by Ministry.
6.6 Recommendations and Action Plans
Based on analysis of current situation of sludge processing, recycling and reuse, as mentioned in the foregoing sections, the gaps in the existing system, viz. regulatory framework and policy are already identified. Recommendations against identified gaps and action plans are given in the table below. The table maps all recommendations/ actionable points, categorized at National level, State/ UT level and ULB level, along with the responsibilities of relevant stakeholders to achieve desired objectives of sludge recycling/reuse in the spirit of circular economy. The interventions are further categorized as: a) regulations, and b) enablers.
Figure 43: Sludge Drying Bed

91
Table 17: Actionable points for Recycle and Reuse of Treated Sludge S.N Actionable points Stakeholders Responsibilities
National Level Regulations
1. Policy on sludge reuse/recycle
MoHUA/ CPHEEO, MoJS
• MoHUA to prepare national policy including rural perspective and urban-rural linkages to achieve scale of economy
2. Comprehensive standards on recycle and reuse of processed sludge
MoA&FW, MoEF&CC/ CPCB, MoHUA/ CPHEEO, MoJS
• MoA&FW to incorporate standards for compost out of treated sludge in FCO 1985 for usage in different types of edible/non-edible crops/agroforestry, etc.
• MoEF&CC/ CPCB to develop standards for sludge/septage for application on land
• MoHUA/ MoJS to provide inputs from rural perspective
• MoPNG to develop standards/ buying of biogas
3. Extraction of phosphorous at STPs
CPHEEO, MoHUA, CPCB, MoJS
• MoHUA to provide technological guidance
• MoEF&CC/CPCB to develop standards
National level enablers 1. Convergence of
stakeholders MoHUA, MoA&FW, MoJS, MoP& NG, MoP
• For convergence of policy and program, a High Power Committee under chairmanship of Secretary/Additional Secretary may be set up
2. Centre of Excellence
Research Institutes, Universities
• One premier technical institute and agricultural institute maybe recognized as centre of excellence

92
3. Capacity building at State/ULB
CPHEEO, SUDD
• Develop course curriculum on capacity building of various stakeholders
4. Customs/GST exemption on equipment
Ministry of Finance & Expenditure
• MoF to exempt Custom/GST on use of plants/ machinery to make biogas, to electricity plants and sludge dewatering equipment (screw press, etc.)
5. Incentivise by-products and tag sale with chemical fertilizers
Ministry of Chemicals & Fertilizers
• MoC&F to extend MDA for city compost to compost produced out of sludge
• MoC&F tag sale of compost out of sludge with chemical fertilizers
6. Incentivise biogas generated out of sludge
MoPNG • MoPNG to incentivise through a mechanism buying of biogas produced out of Sludge. For STPs with capacity < 50 MLD set up plant for biogas generation on cluster basis
7. Inventorization of STPs by CPCB
CPCB • CPCB while inventorizing STPs also to collect data on sludge processing plants & it’s end use
State Level Regulations 1. Policy on Sludge
Recycle & Reuse SUDD • State specific sludge recycle &
reuse policy to promote its circularity
2. Tax/fine on dumping sludge in landfills/open land
SUDD SPCB
• SPCB to impose heavy fine/Tax on indiscriminate dumping of sludge
3. State strategy on recycle and reuse of sludge
SUDD • SUDD to develop suitable strategy to achieve the policy objectives of recycle & reuse of treated sludge
State Level Enablers 1. Designating Nodal
Department SUDD, • State UD may be designated as
nodal department to coordinate
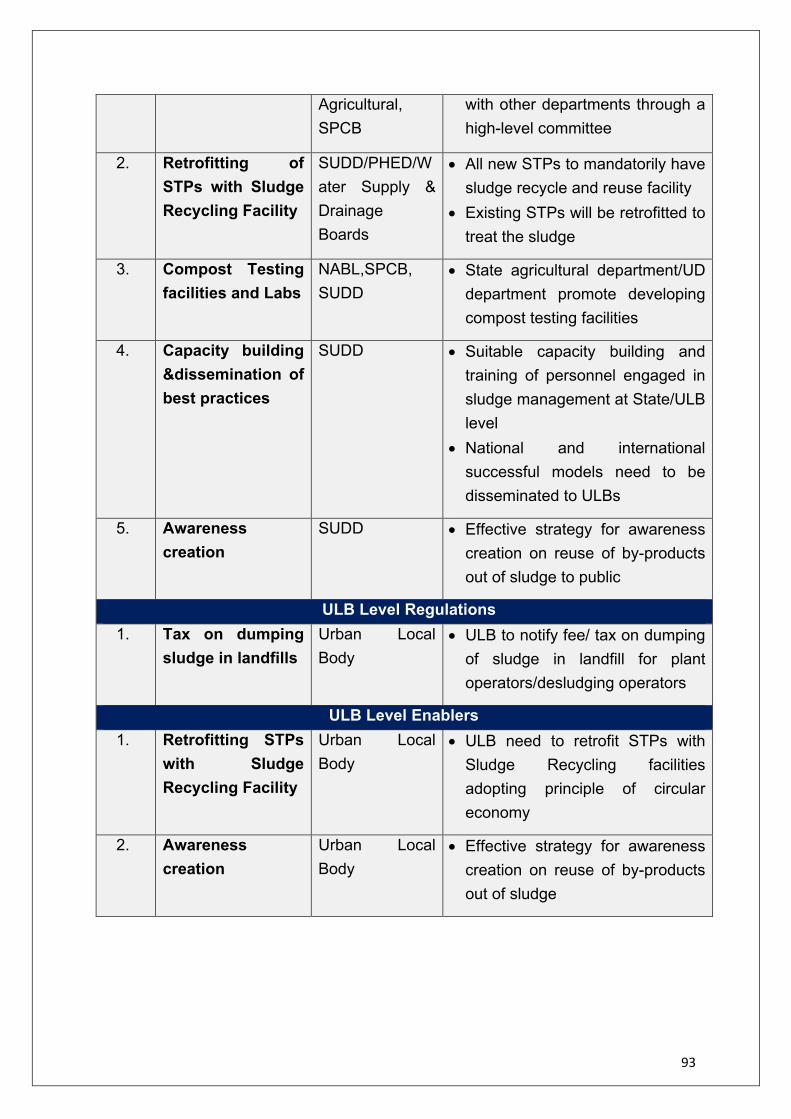
93
Agricultural, SPCB
with other departments through a high-level committee
2. Retrofitting of STPs with Sludge Recycling Facility
SUDD/PHED/Water Supply & Drainage Boards
• All new STPs to mandatorily have sludge recycle and reuse facility
• Existing STPs will be retrofitted to treat the sludge
3. Compost Testing facilities and Labs
NABL,SPCB, SUDD
• State agricultural department/UD department promote developing compost testing facilities
4. Capacity building &dissemination of best practices
SUDD • Suitable capacity building and training of personnel engaged in sludge management at State/ULB level
• National and international successful models need to be disseminated to ULBs
5. Awareness creation
SUDD • Effective strategy for awareness creation on reuse of by-products out of sludge to public
ULB Level Regulations 1. Tax on dumping
sludge in landfills Urban Local Body
• ULB to notify fee/ tax on dumping of sludge in landfill for plant operators/desludging operators
ULB Level Enablers 1. Retrofitting STPs
with Sludge Recycling Facility
Urban Local Body
• ULB need to retrofit STPs with Sludge Recycling facilities adopting principle of circular economy
2. Awareness creation
Urban Local Body
• Effective strategy for awareness creation on reuse of by-products out of sludge


95
Conclusion In recent years, the concept of circular economy has gained increasing prominence across the world as an approach that presents solutions to some of the world’s most pressing sustainable development challenges44, including that of waste management. In circular economy, waste and pollution are minimised by design; products and materials have a longer life cycle; and natural systems are regenerated using a 3R (Reduce, Reuse, Recycle) approach. This is becoming an increasingly popular strategy to accelerate implementation of the SDG 2030 Agenda. The introduction of Swachh Bharat Mission, rooted in the 3R principles, was a major step in this direction, where, for the first time, the issue of waste management on a Mission mode was brought to the centre of the nation’s development agenda. Parallelly, the promulgation of the SWM Rules 2016, Plastic Waste Management Rules 2016, 2018, National Fecal Sludge and Septage Management Policy 2017 etc. have helped to further strengthen this focus and realign the country’s commitment to a greener environment and zero-waste future. Over the last few years, a number of good practices in reuse of Solid and Liquid waste to value added products have emerged, both in India and abroad. However, in the absence of a conducive eco-system comprising of a strong regulatory framework, structured process of knowledge transfer, and adequate participation from private sector and citizens, such good practices have remained as islands of excellence, rather than being scaled up and mainstreamed to become an accepted norm. Clearly, despite significant success having been achieved in India in the area of Solid and Liquid waste management, a lot more remains to be done, especially if circular economy in waste management has to be institutionalized as a practice. In this backdrop, NITI Aayog had identified 11 EoL products/ recyclable material / wastes that pose considerable challenges and need to be addressed holistically through a comprehensive circular economy framework. This report, which forms part of a larger document on ‘Transitioning from a Linear to Circular Economy: An Impetus for India’s AatmaNirbhar Bharat Abhiyan’ by NITI Aayog, has looked at the Municipal Solid and Liquid Waste component. Within Municipal Solid Waste, the potential for circularity has been examined for three sub-categories of waste, viz. (i) Dry waste, (ii) Wet waste, (ii) Construction & Demolition waste. For Municipal Liquid waste, the report has looked at two sub-categories, viz. (iv) Wastewater, and (v) Municipal Sludge. Specifically, the report has attempted to identify and recommend financially viable and
44 https://www.un.org/en/ga/second/73/jm_conceptnote.pdf

96
sustainable business models for reusing solid and liquid waste (across these 5 categories) and thus create an enabling environment for circular economy to thrive. Recommendations For each of the 5 waste sub-categories of Municipal Solid and Liquid waste, the report has come out with some key recommendations & action plans – for both national & State/ UT levels - for maximising the circular economy potential in the sector. Some of the key recommendations on Municipal Solid and Liquid waste include:
• Strengthening of existing policies & regulations integrating circular economy principles in implementation of programs/ schemes/ projects.
• Promoting innovations & research to accelerate pace of circularity in processes.
• Promoting priority lending to private/ public sector to attract higher investment in waste management sector.
• Reduction of GST on recycled products to 5% to make them competitive with virgin materials.
• Fee-based landfilling of waste products
In addition to the above, some category wise recommendations are summarised as follows: 1: Dry Waste 1a) Key recommendations
• Inclusion of dry-waste streams in the ambit of Extended Producer Responsibility (EPRs): Paper, Textile, Rubber, Metals and Glass etc. in alignment with ‘polluter pays’ principle.
• Mandating use of 25% recycled materials in the non-food grade packaging to ensure uptake of recycled materials.
• Mandating that cement kilns use 25% RDF (non-recyclable combustible dry waste) to replace coal
• Mandating use of mono-polymers in the production of the packaging products. e.g., PET bottles with HDPE cover/ cap and PPP films avoided, to enhance recycling
1b) Estimated benefits from circularity Material recycling facilities can play a significant role in ensuring circularity in dry waste management. If implemented, material recycling facilities can help

97
improve recovery from ₹5,187 crores/ annum to ₹17,023 crores/ annum by 2025, thus adding ₹11,836 crores to the economy annually. MRFs will also help to generate employment of 40 Lakh person-days during construction, and ~80 Lakh person-days in perpetuity for operations & maintenance of these facilities.
2: Wet Waste 2a) Key recommendations
• Unbundling SLF from SWM functions • Relaxing environmental clearance (EC) for setting up waste processing
plants • Incentivizing biogas plants • Incentivizing by-products and tag sale with chemical fertilizers
2b) Estimated benefits from circularity
• Net additional contribution to economy is estimated at ₹2,460 crores per annum if 50% wet waste is processed by bio-methanation in urban India.
• Employment generation of about 1 crore man-days is estimated during construction and about 60 lakh man-days for O&M, in perpetuity.
3: Construction & Demolition Waste 3a) Key recommendations
• Reducing virgin material use, e.g. use of 20% secondary materials in new building construction, 40% in Roads & Highways.
• Providing tax rebates to building products & materials with secondary resources
• Buy-back of recycled material from processing plants through building permit system by ULBs.
• Exemption of Green tax on C&D Recycled products and transportation, wherever applicable
• Mandating a threshold level proportion of C&D waste use in all public and private buildings/ infrastructure
3b) Estimated benefits from circularity Realizing potential of C&D waste value chains through Circular Economy is expected to lead to revenue of ₹416 crore per year along with generating employment for around 10,000 persons per day.

98
4: Wastewater 4a) Key recommendations
• Establishing institutional mechanism at national and state level for circular economy in wastewater recycling & reuse
• Preparation of new standards for designated reuse of the treated wastewater and guidelines for the reuse
• Preparation of State Wastewater Reuse policy including industry specific business models
• Creating PPP mode business models for STPs and reuse of treated wastewater in different sectors.
• Mandating use of recycled water in thermal power plants located within 50 km of ULB
4b) Estimated benefits from circularity The sale of treated sewage has potential to generate revenue of ₹3,285 crore per year in India. Additionally, nearly 5,400 people can be directly employed in operation and maintenance of treatment infrastructure assuming 25% of treated sewage is reused.
5: Municipal sludge 5a) Key recommendations
• Introducing national policy on sludge reuse/ recycle • Introducing comprehensive standards on recycle & reuse of processed
sludge • Incentivising by-products and tagging sale with chemical fertilizers • Incentivising biogas generated out of sludge • Imposing tax/ fine on dumping sludge in landfills/open land
5b) Estimated benefits from circularity
The annual return from sludge recycle & reuse is estimated to be in the order of ₹6700 Crore through utilization of 82.5 lakh cubic meter of gas and 3600 metric tonne of compost per day. This is also expected to save an estimated land area of approximately 450 acres costing about ₹350 crores.
The initial steps have been taken in integrating circular economy approach to waste management. The need of the hour now is to mainstream the principles of circular economy into the entire waste management value chain. A multi-pronged approach is recommended for this, which would include: (i) strengthened regulatory framework, (ii)
99
expanded scope of existing waste management policies along with strict enforcement mechanism for compliance, (iii) creation of a conducive environment for encouraging private sector participation and citizen engagement, and (iv) awareness generation among citizens, along with capacity building of all stakeholders, in order to maximise the benefits of circular economy and make it a way of life.


101
Annexure 1: Circular Economy for Dry Waste
Annexure – 1.1
Tentative Gross Economic Benefits of MRFs (in Urban India)
Note:
1. Dry waste generation taken as 33% (132gms/capita) of the total waste generated (400gms/capita)
2. Current Scenario with available MRF Facilities 3. Scenario after incorporating CE principles 4. The quantum of materials recovered from MRF and details of their fractions are
captured in next page. Employment Generation
Capacity of Material Recovery Facilities to be installed (2025) 67,650 TPD Personnel Required for construction of MRF Manual/Hybrid (@25 persons/100TPD) 16,912 Nos
Number of Days (Duration of Construction 8 Months) 240 Days
Number of Person-days 40,59,000 Person-Days Say 0.4 Crore person-days during the Construction Phase
Capacity of Material Recovery Facilities to be installed (2025) 67,650 TPD
Personnel Required for O&M (@31 persons/100TPD) 20,971 Nos Number of Days 365 Days Number of Person-days/Annum 76,54,415 Person-Days
Say 0.8 Crore person-days in perpetuity for O&M
20212 20253
Dry Waste Generation in TPD1 47,850 67,650 Quantum of Materials Recovered at MRFs in TPD4 24,945 50,231
Estimate of Cost Recovered /day Rs in Crores 14.21 46.64
Estimated Cost Recovered per annum ₹ in Crores 5,187 17,023
Net Benefit after incorporating CE principles is ₹11,836 Crores per annum
An additional revenue of ₹11,836 Crores per annum can be added to the economy through installation of Material Recovery Facilities in line with the Principle of Circularity for total dry waste generation of 67,650 TPD

102
Current Scenario of Dry Waste (2021)
S No WASTE
TOTAL WASTE GENERATED DAILY (TPD)
CONTENT IN MSW, %
DAILY GENERATION, TPD
CURRENT RECOVERY, %
QTY RECOVERED, TPD
CURRENT VALUE, RUPEES PER MT
VALUE RECOVERED DAILY, ₹ in Crore
1 Plastic
145,000
15% 21,750 60% 13,050 6,000 7.83 2 Paper & cardboard 7% 10,150 60% 6,090 6,000 3.65 3 Glass & Ceramics 1% 1,450 20% 290 4,000 0.12 4 Metal 1% 1,450 50% 725 5,000 0.36 5 Textiles 5% 7,250 30% 2,175 4,000 0.87 6 Tyres & Rubber 1% 1,450 80% 1,160 6,000 0.70
7
Others (Human Hair, Coconut, Tetrapack, Footwear)
3% 4,360.15 33% 1,455.08 4,700 0.68
TOTAL 33% 47,860.15 24,945.08 14.21
Per Annum 5,187.52
Scenario after implementation of Circular Economy Principles (2025)
S No WASTE
TOTAL WASTE GENERATED DAILY (TPD)
CONTENT IN MSW, %
DAILY GENERATION, TPD
CE RECOVERY, %
QTY RECOVERED, TPD
CE VALUE, RUPEES PER MT
VALUE RECOVERED DAILY, ₹ in Crores
1 Plastic
205,000
15% 30,750 80% 24,600 10,000 24.60 2 Paper & cardboard 7% 14,350 80% 11,480 10,000 11.48 3 Glass & Ceramics 1% 2,050 50% 1,025 10,000 1.03 4 Metal 1% 2,050 80% 1,640 10,000 1.64 5 Textiles 5% 10,250 60% 6,150 5,000 3.08 6 Tyres & Rubber 1% 2,050 80% 1,640 10,000 1.64
7
Others (Human Hair, Coconut, Tetrapack, Footwear)
3% 6,150 60% 3,696.15 8,600 3.18
TOTAL 33% 67,650 50,231.15 46.64
Per Annum 17,023.12

103
Annexure – 1.2 Material Recovery Facility Material Recovery Facilities are the foundation for resource recovery and recycling. These facilities follow the sustainable hierarchy of waste management i.e., collection of source segregated waste, classification of dry waste into different categories (paper, cardboard, plastics of all types, glass, metal etc.) and also depending on their commercial usage and value. The segregated waste is a ready raw material for scrap dealers, recyclers and industries where these may serve as input materials. Depending on the scale of operations, type of operations and the level of mechanization in the facility, MRFs may be classified in three categories45: • Manual: In manual MRFs, sorting process is carried out manually. This type of
MRFs are suitable for small quantities of MSW like 5-10 TPD only and are suited for cities with population less than 1 Lakh.
• Semiautomatic: This type of Material Recovery Facilities has combination of manual and mechanized operations. Semi-automated MRF can cater for 10- 100 TPD of segregated waste and are suited for cities with population of 1 Lakh – 10 Lakh.
• Automatic: Mechanized material recovery facilities are fully mechanized/ automated facilities for material recovery in large quantities (>100 TPD) with least human intervention. These facilities are best suitable for segregation of recyclables/ non-recyclables/ RDF/ inert for cities with population more than 10 Lakhs, when only source segregated dry waste is coming to the facility.
Figure: Mechanized material recovery facilities
Mechanical Recycling It refers to the processing of waste into secondary raw material or products without changing the chemical structure using mechanical processes (i.e. grinding, washing, separating, drying, re-granulating and compounding). As part of mechanical recycling, material is melted and extruded into the form of pellets which are then used to manufacture other products.
45 Advisory on Material Recovery Facility (MRF) for Municipal Solid Waste, MoHUA, June 2020

104
Figure: Mechanical Recycling
Refuse-Derived Fuel (RDF) for Co-processing RDF typically consists of the residual dry combustible fraction of the MSW including paper, textile, rags, leather, rubber, non-recyclable plastic, jute, multi-layered packaging and other compound packaging, thermocol, coconut shells etc. Co-processing refers to use of waste materials in industrial processes (cement and thermal power stations etc.) as alternative fuels or raw material to recover energy and material from them. It is a sustainable method of waste disposal as compared to land filling and incineration because of reduced emissions.
Figure: RDF Generation

105
Plastic to Road Construction The implementation of plastics in roads opens a new option for recycling post- consumer plastics. The types of plastic that can be used for construction of roads are Polystyrene (PS) (Hard packaging, cartons, plates, vending cups etc.); Polypropylene (PP) (ketchup bottles, yogurt cups etc.); Polyethylene (PE) (both high and low density) (plastic bags, water bottle, shampoo bottle etc.). Poly Vinyl Chloride (PVC) sheets or Flux sheets should not be used. The Ministry of Road Transport & Highways, Government of India has made it mandatory for road developers to use waste plastic along with bituminous mixes for road construction to overcome the problem of disposal of plastic waste in India’s urban centres46.
Table: Cost Comparison between Plain bitumen road & Plastic Bitumen Road47
Sr. No. Material Needed Plain Bitumen Process Plastic Bitumen Road 1 Road
Construction Cost ₹21.00 lakhs ₹18.90 lakhs
2 Maintenance Cost @Rs./ km per year
₹14,000 per km year for rural roads. Thus, for five years, ₹70,000
No Maintenance cost for a minimum of five years; Maintenance not needed up to 10 years
3 Road Renewal Cost
Roads renewed after 5 years costing ₹3.5 lakhs
Nil
4 Total Cost for minimum service of five years
₹25.2 lakhs ₹18.9 lakhs
5 Use of Waste Plastics
Nil One tonne per km
Pyrolysis Pyrolysis uses heat to break down combustible polymeric materials in the absence of oxygen, producing a mixture of combustible gases liquids and solid residues. The products of pyrolysis process are: (i) a gas mixture; (ii) a liquid (bio-oil/tar); (iii) a solid residue (carbon black). The proportion and composition of the various fractions depends on a variety of parameters. Two technologies exist and differ on the method of heat transfer: fast pyrolysis for production of bio-oil and slow pyrolysis for production of charcoal called carbon black.
46 Plastic Waste Management Issues, Solutions & Case Studies, MoHUA, March 2019 47 Plastic Waste Management Issues, Solutions & Case Studies, MoHUA, March 2019

106
Table: Process details of conversion technologies48 Conversion
Process Air (or steam) supply Temp (◦C) Products
Gasification Less than stoichiometric oxygen required
800-1200 Heat, Syngas fuel, Char
Incineration In excess 800-1200 Heat Pyrolysis Total absence 300-600 Heat, fuel oil, Combustible
Gas, Char Gasification Gasification is the partial combustion of organic or fossil based carbonaceous material, plastics, etc. into carbon monoxide, hydrogen, carbon dioxide, and methane. This is
achieved at high temperature (650°C and above), with controlled amount of air, oxygen, or steam. The process is largely exothermic, and the main product is syngas, which contains carbon monoxide, hydrogen, and methane. The other main product is a solid residue of non-combustible material (ash).
Waste Incineration Waste incineration, or controlled burning, is a disposal method that involves combustion of waste at very high temperatures in the presence of oxygen and results in the production of ash, flue gas, and heat.
Figure: Waste Incineration
48 Report of the Task Force on Waste to Energy (Volume I), May 2014
Figure: Gasification

107
Annexure 2: Circular Economy for Wet Waste
Annexure – 2.1
Tentative Gross Economic Benefits of Bio-methanation (in Urban India)
Note:
5. Wet Waste Generation taken as 50% (200gms/capita) of the total waste generated (400gms/capita)
6. Present capacity of Biomethanation Plants as per MIS of SBM (Urban). 7. Under Circular Economy initiative 50% of wet waste processing by Biomethanation by
2025 can be aimed in a dedicated mission
Employment Generation Potential
Capacity of Biomethanation Plants to be installed (2025) 51,250 TPD Manpower Required for construction (@35 persons/ 100TPD) 17,938 Nos
Number of Days (Duration of Construction 18 Months) 547 Days
Number of Man-days 98,11,813 Man-Days Say 1.00 Crore man-days during the Construction Phase
Capacity of Bio-methanation Plants to be installed (2025) 51,250 TPD Manpower Required for O&M (@31 persons/ 100TPD) 15,888 Nos Number of Days 365 Days Number of Man-days/Annum 57,98,938 Man-Days
Say 60 lakh man-days in perpetuity for O&M
Annexure – 2.2
Year 2021 2025 Wet waste Generation1(TPD) 72,500 1,02,500
Biomethanation plants (setup)(TPD) 2,3002 (MIS, Actual) 51,250
Development TARGET %(for CE) 3% 50%3 Potential Gas Generation @ 3% CBG 69 1,538 Gas Generated , in MMTPA 0.025 0.561 Estimated Revenue Generation @ ₹46.00/kg ( ₹in Crores) 115.85 2,581.46
Net Contribution to the Economy ₹ 2,460 Crores
From the above it may be seen that the Wet Waste processing by Biomethanation can contribute about ₹2, 460 Crores additionally to the Economy by 2025 (Per Annum)
Bio-methanation Processing targeting higher capacities for processing Wet Waste under Circular Economy initiatives can generate about 1.00 Crore man-days during construction phase and about 60 lakh man-days in perpetuity for O&M
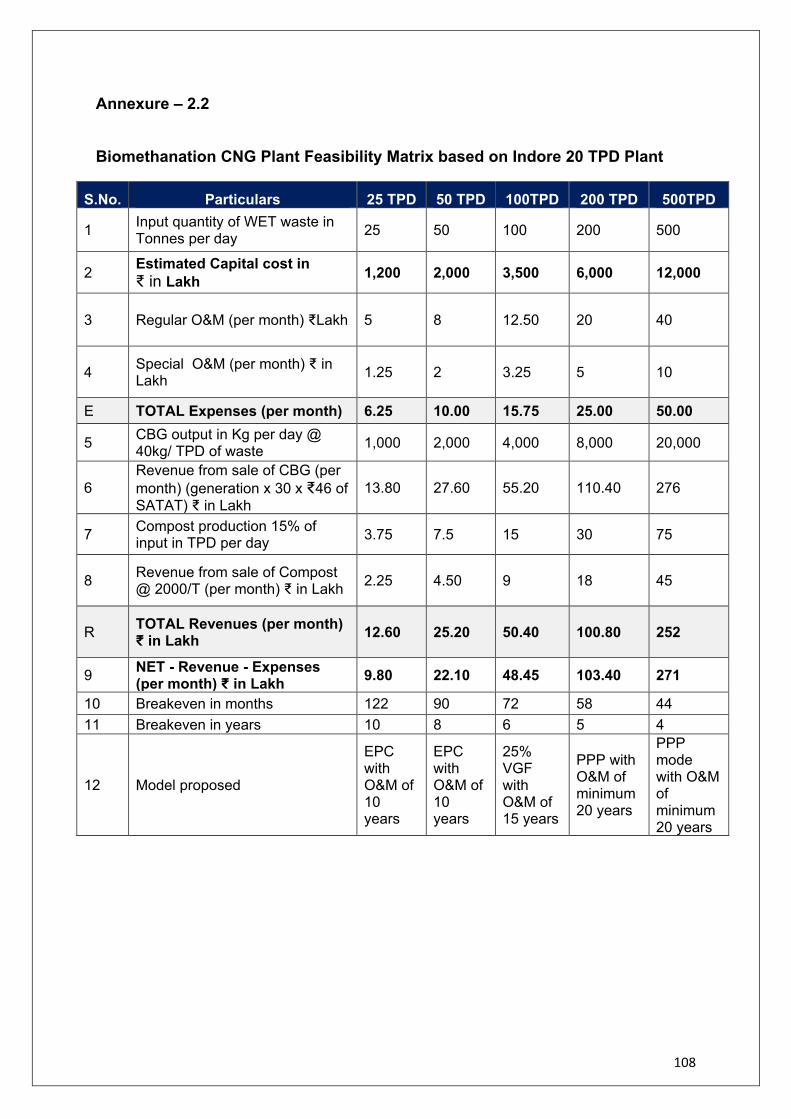
108
Annexure – 2.2
Biomethanation CNG Plant Feasibility Matrix based on Indore 20 TPD Plant
S.No. Particulars 25 TPD 50 TPD 100TPD 200 TPD 500TPD
1 Input quantity of WET waste in Tonnes per day 25 50 100 200 500
2 Estimated Capital cost in ₹ in Lakh 1,200 2,000 3,500 6,000 12,000
3 Regular O&M (per month) ₹Lakh 5 8 12.50 20 40
4 Special O&M (per month) ₹ in Lakh 1.25 2 3.25 5 10
E TOTAL Expenses (per month) 6.25 10.00 15.75 25.00 50.00
5 CBG output in Kg per day @ 40kg/ TPD of waste 1,000 2,000 4,000 8,000 20,000
6 Revenue from sale of CBG (per month) (generation x 30 x ₹46 of SATAT) ₹ in Lakh
13.80 27.60 55.20 110.40 276
7 Compost production 15% of input in TPD per day 3.75 7.5 15 30 75
8 Revenue from sale of Compost @ 2000/T (per month) ₹ in Lakh 2.25 4.50 9 18 45
R TOTAL Revenues (per month) ₹ in Lakh 12.60 25.20 50.40 100.80 252
9 NET - Revenue - Expenses (per month) ₹ in Lakh 9.80 22.10 48.45 103.40 271
10 Breakeven in months 122 90 72 58 44 11 Breakeven in years 10 8 6 5 4
12 Model proposed
EPC with O&M of 10 years
EPC with O&M of 10 years
25% VGF with O&M of 15 years
PPP with O&M of minimum 20 years
PPP mode with O&M of minimum 20 years

109
Annexure – 2.3
Decentralized High rate Biomethanation Systems CSIR-IICT Hyderabad
Quantity of
Organic waste
(kg/day)
Food print area
required for plant
installation (m2)
Power consumption
(kWh)
Average Biogas and bio manure
generation per day Equivalent
LPG replacement
(Kg/day)
Revenue due to LPG
(₹ per annum)
Revenue due to sale of
bio manure (₹ per
annum)
Gross Revenue
(₹)
Approximate Operating Cost (₹ per
annum) Net Revenue (₹/annum)
Approximate Capital Cost
(₹)
Return on Investment
(Years)
Biogas Bio manure
(m3/day) (Kg/day)
50 10 2 6 8 2 71,280 24,750 96,030 40,000 56,030 5,00,000 8.9 100 12 4 12 15 5 1,42,560 49,500 1,92,060 40,000 1,52,060 9,00,000 5.9 150 12 8 18 23 7 2,13,840 75,900 2,89,740 40,000 2,49,740 13,00,000 5.2 200 15 10 24 30 10 2,85,120 99,000 3,84,120 40,000 3,44,120 17,00,000 4.9 250 20 10 30 45 12 3,56,400 1,48,500 5,04,900 50,000 4,54,900 20,00,000 4.4 500 26 12 60 75 24 7,12,800 2,47,500 9,60,300 60,000 9,00,300 32,00,000 3.6 750 30 15 90 112 36 10,69,200 3,69,600 14,38,800 2,00,000 12,38,800 40,00,000 3.2
1,000 50 20 120 150 48 14,25,600 4,95,000 19,20,600 2,50,000 16,70,600 45,00,000 2.7 5,000 600 60 600 750 240 71,28,000 24,75,000 96,03,000 20,00,000 76,03,000 1,85,00,000 2.4
10,000 1,200 120 1,200 1,500 480 1,42,56,000 49,50,000 1,92,06,000 30,00,000 1,62,06,000 3,50,00,000 2.2 Assumptions 1. Cost of commercial LPG = ₹90 per kg 2. Cost bio manure = ₹10 per kg 3. Working days in year = 330 days

110
Annexure 3: Circular Economy for Construction & Demolition Waste
Case Studies of successful models in India
Case Study: Burari C&D Waste Management Plant, North Delhi Basic Details 1. State Name Delhi 2. ULB Name & No. Of Wards North Delhi Municipal Corporation, 104 Wards 3. Total Estimated C&D waste
Generation/Day in the ULB
2000 TPD (approx.)
4. Quantity of C&D by Bulk waste generators
1300 TPD (approx.)
5.
Ownership Public Private Partnership (PPP)
6.
Types of outputs/By products
Paver Blocks, Cement Bricks, Kerb Stone, Tiles, Recycled Aggregates, Recycled Concrete Aggregates
7. Area of Plant (Land area) 7 Acre On lease provided by NDMC
8. Current Status Operational 9. Month/Year of
Commencement of operation (MM/YY)
07/2009 (Burari Plant)
Operational Details 10. Designed Capacity of Plant
(TPD) 2000 TPD
11. Average Daily Waste Intake/Processing (FY 2019-20)
1869 TPD
12. Mechanism for Collection & Transportation of C&D wastes
ULB and Private Operator both.
13 Collection Centre North DMC have notified 87 locations/sites as local dumping sites in its jurisdiction. Malba in small quantity can be dumped by general public at these sites from where the same is transported to C&D waste recycling plant by the concessionaire of recycling plant in coordination with Zonal officials of North DMC
14. Fee charged by ULB/ Operator against Collection & Transportation if any
Private parties - ULB At present, ₹239.44 / MT with 5% annual
increase is paid to concessionaire by North DMC
Govt. Agencies transport the C&D waste to processing site directly

111
Bulk Generators transport the C&D waste to processing site directly
15. Types of Process- Wet/Dry Wet and Dry 16. Percentage of Inert/
Processing Rejects going to Landfill
Less than 5%
Contractual/Financial Details 17.
Total Capital Expenditure ₹26 Crore (incurred by concessionaire) Buy back of products Instructions have been issued for taking
mandatory provision of the items based on C&D waste recycled produce in all development works of North DMC and also recycled material is procured for departmental use at all 104 Municipal stores. These products are also being utilized by various other Govt. agencies.
Other support Some products are listed in Delhi Schedule of rates Review meeting taken by MOHUA to promote utilization of recycled produce
18.
Fee charged, if any, for processing (per ton)
₹205/- per MT is collected and retained by concessionaire (No processing fee is paid to concessionaire for waste of North DMC)
19.
Sales of products (FY 2019-20)
5,14,484 MT
To private parties 2,14,048 MT To ULB 1,12,493 MT To other Govt. Agencies 1,87,943 MT
Learnings from Local Best Practices CDW Processing Plant in East Kidwai Nagar, New Delhi M/s Enzyme India Pvt Ltd has set up 150 TPD CDW recycling plant in 2014 on PPP model with 100% buyback by NBCC. The plant is set up at the project site of redevelopment of East Kidwai Nagar. The process is dust free and eco-friendly. The plan is to produce 30,000 bricks/ kerbstones per day which would be used at the construction site. Supreme Court of India Additional Office Complex for Supreme Court of India was constructed by Central Public Works Department near Pragati Maidan, New Delhi on a land area measuring 12.19 acres. The building complex was designed to be a state of the art, environment friendly, centrally air-conditioned office complex with all modern facilities. The blockwork was to be done for exterior wall masonry works where C&D blocks were used. Size of C&D block used was 400X 200 X 100 mm, grade of concrete was M-10 having compressive strength of 10 to 15 N/mm2. This C&D block weight was 15 kg as compared to 3 kg for traditional brick however only 125 m3/block was consumed as compared to 500 bricks/m3.

112
Annexure 4: Circular Economy for Recycle and Reuse of Treated Municipal Sewage (Wastewater)
Case Study on Surat - Municipal wastewater recycling and reuse as process water for Pandesara Textile Industrial Estate in Surat
Background: Surat city, located in western part of India, is known as the economic capital of the Gujarat State. It is managed by Surat Municipal Corporation (SMC), spread over an area of 326.51 sq.km. and population of 44 lakhs as per census 2011. Pandesara is a notified industrial estate (PIE), which was established by Gujarat Industrial Development Corporation (GIDC) and falls within SMC limits.
Demand and Supply: In 2010, the water demand at Pandesara was estimated at approximately 90 MLD, comprising about 75-80 MLD of process water requirement and 10-15 MLD of potable water demand. Of the total demand, nearly 50% (around 45 MLD) was met through SMC potable water supply at the rate of ₹16/ kl in the year 2010 which was increased to ₹21/ kl in the year 2011-12. The remaining demand was met through private sources including bore wells and water tankers. Hence SMC was not able to meet entire demand of major industrial area such as PIE.
Project Concept: There is a Sewage Treatment plant at Bamroli (100 MLD capacity), which receives wastewater from houses through a sewage network and processes it for secondary treatment. The Bamroli STP was based on UASB plus extended aeration technology. The solution ADB and SMC proposed, involved setting up a Tertiary Treatment Plant (40 MLD capacity) to further treat secondary-treated sewage water from the Bamroli STP to produce and supply Industrial Grade water to the PIE. This would enable SMC to reduce pressure on ground water resources in the city and free up potable water supplied to PIE by SMC.
Project Cost: The capital cost of the project was ₹85.1 crore in 2012 and the project completion time was 18 months. The capacity of Tertiary Treatment Plant is 40 MLD with an option to scale up in a modular fashion to 80 MLD in future. The project was implemented and commissioned in May 2014.
The prevalent freshwater charges for industries were ₹ 18/ kl which were increased to ₹24/ kl in the later period. The recycled water tariff was ₹18.20/ kl in the year 2014 with annual escalation.
Project features: PIE prescribed their water quality requirement which included TDS at <500 mg/ lit. This required use of Reverse Osmosis technology and to blend the tertiary treated water with the potable water to reduce the average TDS of the industrial grade water. SMC was supplying 55 MLD of potable water to PIE and it did not want to forego the revenue it was generating from it. At the same time, PIE’s water demand

113
was more than 90 MLD including their potable use demand. Hence, a mid-solution was proposed, to set up 40 MLD of tertiary treatment plant, then blending that water with potable water of equal capacity to reduce overall TDS and to ensure revenue to SMC. This blended water is called industrial grade water. And to address the perception of not using recycled water for human usage, a separate distribution network of 15 MLD was proposed for potable or other human usage at PIE.
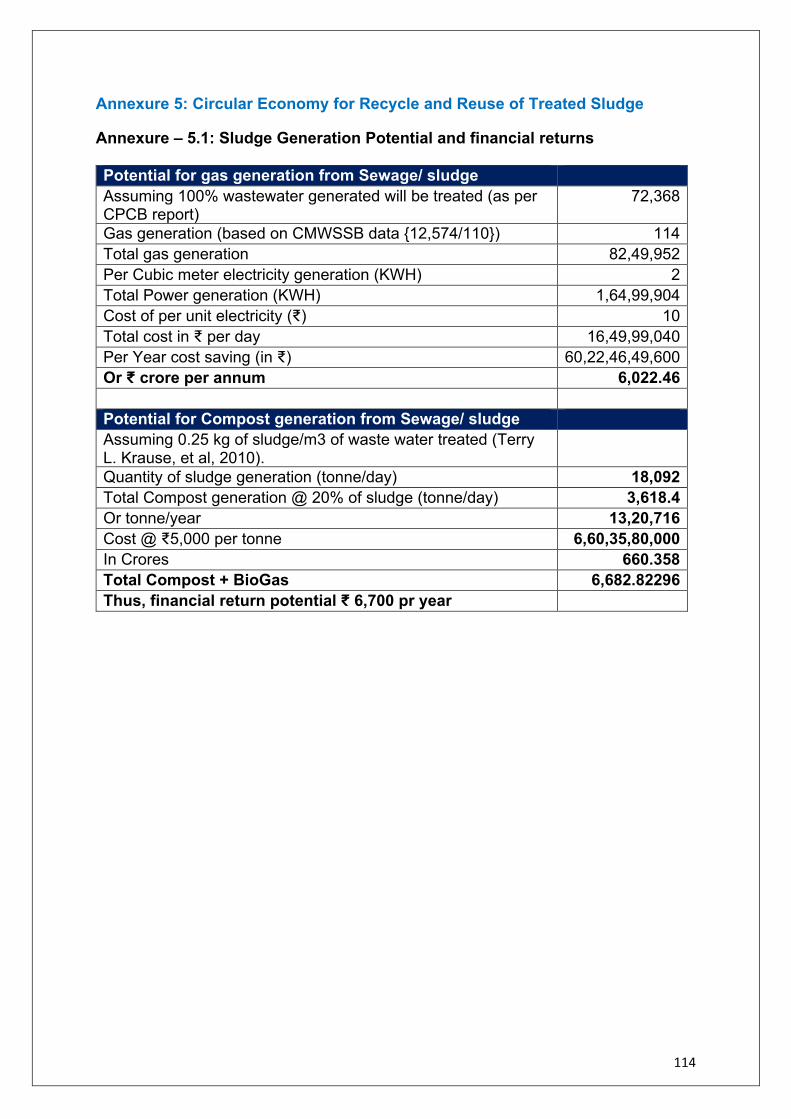
114
Annexure 5: Circular Economy for Recycle and Reuse of Treated Sludge
Annexure – 5.1: Sludge Generation Potential and financial returns Potential for gas generation from Sewage/ sludge Assuming 100% wastewater generated will be treated (as per CPCB report)
72,368
Gas generation (based on CMWSSB data {12,574/110}) 114 Total gas generation 82,49,952 Per Cubic meter electricity generation (KWH) 2 Total Power generation (KWH) 1,64,99,904 Cost of per unit electricity (₹) 10 Total cost in ₹ per day 16,49,99,040 Per Year cost saving (in ₹) 60,22,46,49,600 Or ₹ crore per annum 6,022.46 Potential for Compost generation from Sewage/ sludge Assuming 0.25 kg of sludge/m3 of waste water treated (Terry L. Krause, et al, 2010).
Quantity of sludge generation (tonne/day) 18,092 Total Compost generation @ 20% of sludge (tonne/day) 3,618.4 Or tonne/year 13,20,716 Cost @ ₹5,000 per tonne 6,60,35,80,000 In Crores 660.358 Total Compost + BioGas 6,682.82296 Thus, financial return potential ₹ 6,700 pr year

115
Annexure – 5.2: Case Study- Biogas Generation from STP Sludge by CMWSSB, Chennai Chennai Metropolitan Water Supply & Sewerage Board in Chennai anaerobically digests sludge to produce bio-gas from it. Volume of gas produced is in the range of 523.92 m3 per hr (12,574 m3 per day) and is being utilized for production of power through biogas engine. The average electrical energy production from bio-gas is 2 KWh / m3 of biogas. The digested sludge removed from the digester is passed to the sludge balancing tank at the rate of 20 m3 per hour for dewatering 5% digested sludge. The dried sludge is collected and refilled in the low-lying area inside sewage treatment plant. Details of Bio-Gas Power Production & Power Savings Cost in 7 STPs are as detailed below: S. N Location of
STP STP Capacity
(MLD)
Capacity of Bio-Gas
Engine (KW)
Bio-Gas Engine Commissioned
on
Total power generated
upto March 2021 (KWH)
TNEB power savings
upto March- 2021 (₹ in Lakhs)
1 Kodungaiyur
110 1064 Nov-06 60,849,420 2,949.43
2 Koyambedu 60 625 Oct-05 15,330,310 648.59 3 Koyambedu 120 2 x 836 Aug-15 9,197,740 584.06 4 Nesapakkam
40 469 May-06 15,508,776 656.26
5 Nesapakkam
54 1064 Nov-13 1,353,690 68.65
6 Perungudi 54 1064 Aug-06 36,197,700 1,488.26 7 Perungudi 60 1064 Jan-12 10,386,374 682.65 TOTAL 498 7022 KW 148,824,010
7,077.90
Say 70.77 Crore

Dry waste
Name Designation & Organization 1 Shri Prabhjot Sodhi
Chairman Head Circular Economy, UNDP India
2 Prof. Babu J Alappat Professor Civil Engg. Dept., IIT Delhi
3 Shri Hiten Beda All India Plastic Manufacturers Association (AIPMA) 4 Shri Vinit Kapur Secretary
All India Glass Manufacturers Federation (Glass Waste) 5 Shri Lalit Garg Secretary
Federation of Indian Paper Recyclers (Paper Waste) 6 Shri Bharat Bhushan
Nagar IOSH, CWMP, IWM
7 Shri P K Kheruka Chairman Glass Panel Capexil and CMD Borosil Renewables Ltd
8 Shri Rajesh Pahwa CEO 21st Century
9 Shri Siddarth Hande CEO Kabadiwala Connect
10 Shri Rahul Podar MD Shakti Plastic Industries (Plastic Waste)
11 Shri Abhay Deshpande Founder Recykal
12 Shri Sandeep Patel CEO NEPRA, Ahmedabad
13 Shri Vignesh Nagle General Manager SCM, Piramal Glass
14 Dr Syed Asad Warsi Director Eco Pro Env. Solutions, Indore
15 Ms. Shalini Goyal Bhalla International Council for Circular Economy 16 Shri Sandip Dutt Plant Head
Jindal Waste to Energy Plant 17 Dr Mercy Samuel Associate Professor
CEPT University, Ahmedabad 18 Dr Amit Love Scientist E
MoEFCC 19 Shri Dharmesh Makwana Director
Ministry of Consumer Affairs, Food & Public Distribution 20 Shri Jagat Narayan Superintending Engineer
MoRTH 21 Representative Ministry of Heavy Industries
(Dealing with Cement Industries) 22 Representative Ministry of Petroleum and Natural Gas

Name Designation & Organization 23 Ms. Divya Sinha Additional Director
CPCB 24 Ms. Vaishali Nandan Head Projects
GIZ India, Delhi 25 Dr Ashish Chaturvedi Director
Climate Change, GIZ 26 Representative CIPET, Chennai 27 Shri J. B. Ravinder Joint Adviser (PHEE)
CPHEEO, MoHUA 28 Shri Ankit Jain Asst. Adviser (PHE)
CPHEEO, MoHUA 29 Shri Pankaj Arora Dry Waste Management Expert
SBM(U) PMU, MoHUA 30 Ms. Archita Jain SBM(U) PMU, MoHUA

Wet Waste Name Designation & Organization 1 Dr Syed Asad Warsi
Chairman Director Eco Pro Env. Solutions, Indore
2 Dr A. Gangagni Rao
Chief Scientist CSIR-IICT, Hyderabad
3 Prof. Babu J Alappat Professor Civil Engg. Dept., IIT Delhi
4 Col. Suresh Rege (Retd) Director Mailhem Group
5 Dr Malini Balakrishnan Senior Fellow Env. & Waste, Mgmt., TERI, Delhi
6 Dr Mercy Samuel Associate Professor CEPT Univ., Ahmedabad
7 Shri P. Palaniappan CEO Mahindra Waste to Energy Solutions Limited.
8 Ms. Divya Sinha Additional Director CPCB
9 Dr Amit Love Scientist E MoEFCC
10 Shri Ambarish Karunanithi
Team Lead JJM, M/o Jal Shakti
11 Shri Saurabh Shah Excel Industries, Ahmedabad 12 Ms. Vaishali Nandan Head Projects
GIZ India, Delhi 13 Shri Varun Karad GPS Renewables 14 Shri J.B. Ravinder Joint Adviser (PHEE)
CPHEEO, MoHUA 15 Ms. Sravanthi Jeevan K
Member Secretary Asst. Adviser (PHE) CPHEEO, MoHUA
16 Dr Himanshu Chaturvedi SWM Expert SBM(U) PMU, MoHUA
17 Ms. Tanvi Mittal SBM(U) PMU, MoHUA

Construction & Demolition waste
Name Designation & Organization 1 Dr Bibekananda
Mohapatra Chairman
Director General National Council for Cement and Building Materials (NCCBM)
2 Shri Harish Kumar Dy. Director General Central Public Works Department
3 Shri Sanjay Panth Head (Civil Engineering) Bureau of Indian Standards (BIS)
4 Shri S.S. Gaharwar Sr. Pr. Scientist Central Road Research Institute (CRRI)
5 Ms. Divya Sinha Additional Director CPCB
6 Dr Amit Love Scientist E MoEFCC
7 Shri Jagat Narayan Superintending Engineer MoRTH
8 Shri Sandeep Malhotra Project Head IL&FS
9 Ms. Shalini Goyal Bhalla International Council for Circular Economy 10 Smt. Zeenat Niazi Vice President
Development Alternatives Group 11 Shri PN Ojha NCCBM Ballabhgarh 12 Shri Anupam NCCBM Ballabhgarh 13 Shri J.B. Ravinder Joint Adviser (PHEE)
CPHEEO, MoHUA 14 Ms. Ritu Pachori Tech. Officer (PHE)
CPHEEO, MoHUA 15 Dr Himanshu Chaturvedi SWM Expert
SBM(U) PMU, MoHUA

Wastewater
Name Designation & Organization 1. Shri. Rajesh Biniwale
Chairman Sr. Scientist and Head NEERI
2. Dr V K Chaurasia JA(PHEE) MoHUA
3. Dr Malini Balakrishnan Senior Fellow TERI
4. Prof. Vivek Kumar Professor IIT Delhi
5. Shri Prashant Bhamare SE MJP, Maharashtra
6. Shri R. K. Pankaj S. E. (Ganga) UPJN
7. Shri Lingamoorthy Deputy Chief Engineer TWAD Board, Tamil Nadu
8. Shri Vijay Dhawan Executive Engineer PWSSB, Punjab
9. Dr Pradip Tewari Professor IIT Jodhpur
10. Shri Sanjeev Kumar Kassi
Chief Engineer (Thermal) Ministry of Power
11. Dr J.K. Saha Principal Scientist Division of Environmental Sciences Indian Institute of Soil Science, Bhopal
12. Dr Amit Love Scientist E MoEFCC
13. Shri Rajneesh Chopra Global Head - Business Development VA Tech WABAG
14. Shri Mukesh Grover Director-Technical SUEZ
15. Shri Shikhar Jain Principal Counsellor CII
16. Shri Georg Jhansen Urban Planner & Project Manager GIZ-SUDSC project
17. Shri. Rohit Kakkar Member Secretary
Deputy Adviser MoHUA
18. Shri Anand Rudra Senior Adviser, WASH USAID India
19. Shri R.K. Srinivasan Project Management Specialist, WASH USAID India

Municipal Sludge
Name Organization 1 Dr. Rajesh Biniwale Pr. Scientist and Head
Clean Tech & Modelling Division, NEERI 2 Dr.V. K. Chaurasia JA (PHEE)
CPHEEO 3 Dr. Malini Balkrishnan Senior Fellow
TERI 4 Prof. Vivek Kumar Professor
IIT Delhi 5 Dr. Pradip Tewari Professor
IIT Jodhpur 6 Shri. Prashant Bhamare SE
MJP, Maharashtra 7 Shri. R. K. Pankaj SE (Ganga)
UPJN 8 Er. Lingamoorthy Deputy Chief Engineer
TWAD Board, TN 9 Shri. Vikas Dhawan EE
PWSSB. Punjab 10 Shri. SK Kassi Chief Engineer (Thermal)
Ministry of Power 11 Dr. SK Chaudhari DDG(NRM)
ICAR, Ministry of Agriculture 12 Dr. Amit Love Scientist E
HSM Division MoEF & CC 13 Shri. Rajneesh Chopra Global Head - Business Development
VaTech Wabag 14 Shri. Mukesh Grover Director-Technical
SUEZ 15 Shri. Shikhar Jain Principal Counsellor
CII 16 Shri. V. Venugopal GIZ 17 Shri. Mahesh Harhare GIZ – Independent Expert 18 Shri Rohit Chandragiri WASH Institute 16 Shri. Rohit Kakkar Deputy Adviser (PHE)
CPHEEO