Tirunelveli_Smart City Proposal.pdf - Swachh FSSM
66
1 | Page
-
Upload
khangminh22 -
Category
Documents
-
view
0 -
download
0
Transcript of Tirunelveli_Smart City Proposal.pdf - Swachh FSSM

1 | P a g e
2 | P a g e
Table of Contents 1. Smart City- An Introduction ................................................................. 4
1.2. Our Core Philosophy ......................................................................... 5
1.3. Approach and Methodology ............................................................. 6
2. City Profile ............................................................................................ 8
2.1. About the City- An Overview ....................................................... 8
2.2. History .......................................................................................... 8
2.3. Geography .................................................................................... 9
2.4. Climate and Rainfall ................................................................... 10
2.5. Overview of the ULB and Demographics ................................... 10
2.6. Employment ............................................................................... 13
2.7. Land Use Pattern ........................................................................ 14
2.8. Road Network ............................................................................ 16
2.9. Water Supply .............................................................................. 18
2.10. Sewerage ................................................................................ 19
2.11. Storm Water Drainage System ............................................... 20
2.12. Housing .................................................................................. 21
2.13. Slums ...................................................................................... 21
2.14. Commercial ............................................................................ 21
2.15. Education ............................................................................... 21
2.16. Health Care ............................................................................ 22
3. Stakeholder Consultation ................................................................... 23
3.1. Citizen Engagement ................................................................... 23
3.2. Developing Smart City Vision .................................................... 26
4. Identifying Sectors for Improvement .................................................... 36
5. Pan City Initiative ................................................................................... 38
5.1. Employment .............................................................................. 39
5.2. Emergency Response and Monitoring System (EMRS) ............. 43
5.3. Integrated Water Management Systems ....................................... 45
5.3.1. Water Quality Management System ..................................... 52
6. Area Based Initiatives ........................................................................ 57
6.1. City Characteristics .................................................................... 57
7. Programme Convergence for Smart City Funding ............................. 64
Key Contacts .............................................................................................. 66

3 | P a g e
List of Figures
Figure 1. Developing Smart City Proposal .................................................... 4
Figure 2. MoUDs Assessment Criteria.......................................................... 4
Figure 3. Core Philosophy- Smart City Plan .................................................. 5
Figure 6. Developing Area Based Initiative .................................................. 7
Figure 7. Tirunelveli ...................................................................................... 8
Figure 8. Nellaiappar Temple ....................................................................... 9
Figure 9. Population Growth in Tirunelveli ................................................ 12
Figure 10. Gender wise Employment characteristics ................................ 13
Figure 11. Working Population in Tirunelveli ............................................ 13
Figure 12. Break up of the Developed Area ............................................... 14
Figure 13. Existing and Proposed Land Use Plan in Tirunelveli .................. 15
Figure 14. Map showing the road network in Tirunelveli .......................... 16
Figure 15. Maintenance of Roads .............................................................. 17
Figure 16. Map showing the Major Water Head works in the City ........... 18
Figure 17. Map showing the gradients in the City ..................................... 20
Figure 18. Breakup of Health Care Facilities .............................................. 22
Figure 19. Map showing the healthcare facilities in Tirunelveli District .... 22
Figure 20. Citizen Engagement .................................................................. 23
Figure 21. SWOT Analysis ........................................................................... 25
Figure 22. Developing Smart City Vision .................................................... 26
Figure 23. Vision Statement ....................................................................... 27
Figure 24. Open Group Discussion- Community ........................................ 33
Figure 25. Open Group Discussions- Students and Officials ...................... 34
Figure 26. Engagement with Leadership.................................................... 35
Figure 27. Identified Sectors for Improvement based on Citizen and
Leadership Engagement ............................................................................. 36
Figure 28. Variation of Water Pressure in the Area ................................... 46
Figure 29. Critical Point in the Water Distribution System ....................... 47
Figure 30. Valve Chamber ......................................................................... 48
Figure 31. Interface for Monitoring Pressure in the Water Distribution
System ....................................................................................................... 48
Figure 32. Automatic SMS Alert Systems to Valve Operators ................... 49
Figure 33. Data Logger .............................................................................. 50
Figure 34. Dashboard for Central Water Distribution System .................. 51
Figure 35 Water Quality Monitoring- Process ........................................... 53
Figure 36. Bio Sentry ................................................................................. 53
Figure 37. Hydrobox .................................................................................. 53
Figure 38. Water Quality Monitoring System Dashboard ......................... 54
Figure 39. Illustrative MIS Dashboard for Septage Management ............. 55
Figure 40. Areas Identified for Area Based Interventions in Tirunelveli ... 62
List of Tables
Table 1. About Tirunelveli ......................................................................... 11
Table 2. Population growth in Tirunelveli ................................................. 11
Table 3. Employment Characteristics ........................................................ 13
Table 4. Length of Road in the City ........................................................... 17
Table 5. Sewer System in Tirunelveli ......................................................... 19
Table 6. Storm Water Drainage in the City................................................ 20
Table 7. Status of Education- Schools ....................................................... 21

4 | P a g e
Figure 1. Developing Smart City Proposal
Figure 2. MoUDs Assessment Criteria
1. Smart City- An Introduction
A Smart City Plan must build upon the City’s Current Realities,
Future Aspirations and align with MoUD’s Assessment Criteria.
The Smart City Proposal should consist of
a. Smart City Vision – How do City Government and
Citizens visualize the city’s growth in the near future?
b. Pan-City Initiative(s) – Application of smart solution to
existing city-wide infrastructure to benefit entire
population in the City.
c. Area Based Initiative(s) – City can either improve its
existing infrastructure (retrofitting), renew
(Redevelopment) or extend the city (Greenfield)
Figure 2 describes MoUD’s basic assessment criteria for
selection of cities in “Smart City Challenge.

5 | P a g e
Figure 3. Core Philosophy- Smart City Plan
1.2. Our Core Philosophy
6 | P a g e
Government/Corporation
Citizen
Vision for
Smart City
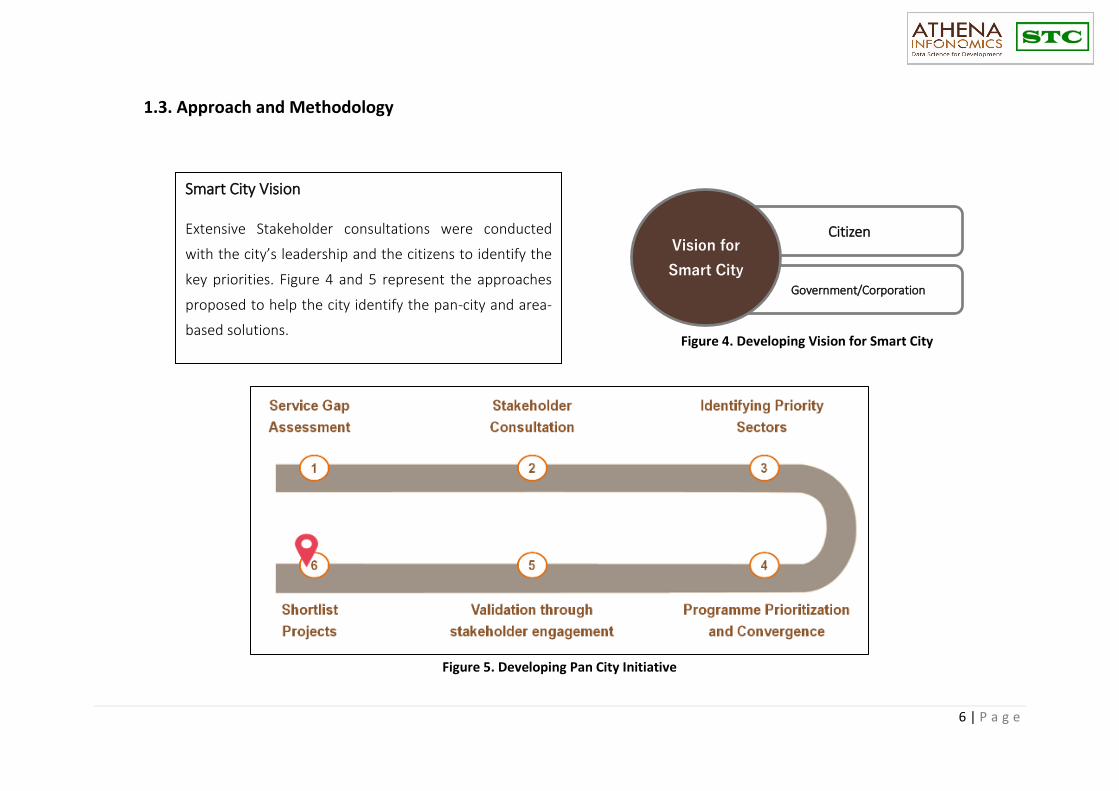
Figure 4. Developing Vision for Smart City
Figure 5. Developing Pan City Initiative
1.3. Approach and Methodology
Smart City Vision
Extensive Stakeholder consultations were conducted
with the city’s leadership and the citizens to identify the
key priorities. Figure 4 and 5 represent the approaches
proposed to help the city identify the pan-city and area-
based solutions.

7 | P a g e
Figure 4. Developing Area Based Initiative

8 | P a g e
2. City Profile
2.1. About the City- An Overview
Tirunelveli Municipal Corporation (TMC) commands a
pivotal position in the southern region of Tamil Nadu. The
city is a popular pilgrimage and educational centre. It was
known as the ‘Oxford of Tamil Nadu’ in the sixties of the
last century, because of the establishment of several
colleges and other educational centres in the city. It is
also known as one of the twin towns - Tirunelveli and
Palayamkottai. The river Thamarabharani bifurcates these
two towns. The entire city consists of four distinct urban
settlements that are separated by agriculture fields. The
city’s growth has been stifled due to the lack of proper
planning efforts and untapped revenue generation
potential across sectors. The city has taken up measures
to improve the existing situation, but it has met with
limited success, as it lacks an integrated approach to town
development.
2.2. History
The history of Tirunelveli was researched by Robert
Caldwell, one of the Christian missionaries who visited the
area in the nineteenth century for the purpose of both
promoting their religious beliefs and educating the
people. Tirunelveli had been under the prominence of the
Pandya kings, serving as their secondary capital while
Madurai remained its primary capital. It was an important
city of the Chola kingdom (c.900-1200) and of the
Vijayanagar Empire. The city was the chief commercial
town in the period of Arcot Nawabs and Nayaks. They
were among the various ruling dynasties of Tamil Nadu. In
fact, they called the city "Nellai Seemai", with Seemai
meaning a developed foreign town. It was the Nayaks
Figure 5. Tirunelveli
9 | P a g e
who, in 1781, granted its revenues and local
administration to the British. In 1801, it was annexed by
the British, who governed it until India achieved
independence in 1947.
On acquisition from the Nawab of Arcot in 1801, the
British anglicized its name as Tinnevelly and made it the
headquarters of Tirunelveli district. This happened
despite the fact that their administrative and military
headquarters was located in Palayamkottai (which was
also anglicized as Palankottah), during their operations
against the Palayakars. Post-independence, both towns
reverted to their original names.
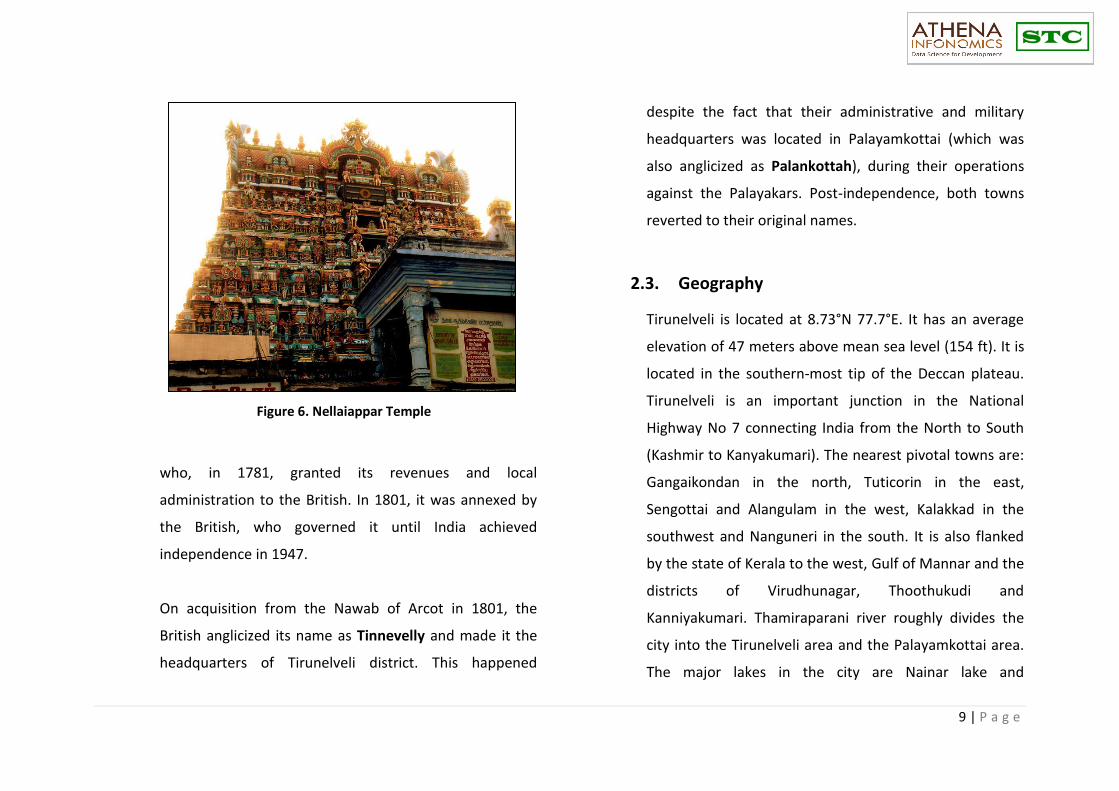
2.3. Geography
Tirunelveli is located at 8.73°N 77.7°E. It has an average
elevation of 47 meters above mean sea level (154 ft). It is
located in the southern-most tip of the Deccan plateau.
Tirunelveli is an important junction in the National
Highway No 7 connecting India from the North to South
(Kashmir to Kanyakumari). The nearest pivotal towns are:
Gangaikondan in the north, Tuticorin in the east,
Sengottai and Alangulam in the west, Kalakkad in the
southwest and Nanguneri in the south. It is also flanked
by the state of Kerala to the west, Gulf of Mannar and the
districts of Virudhunagar, Thoothukudi and
Kanniyakumari. Thamiraparani river roughly divides the
city into the Tirunelveli area and the Palayamkottai area.
The major lakes in the city are Nainar lake and
Figure 6. Nellaiappar Temple

10 | P a g e
Udayarpetti lake. Three rivers (Chitraru, Thamirabarani
and Kothandarama river) converge at a place called
Sivalai, making the area very fertile. The closest town to
this location is Alangaraperi.
2.4. Climate and Rainfall
The climate of Tirunelveli is generally hot, humid and said
to be equable. The average temperature during summer
(March to June) ranges from 25 to 41° Celsius and 18 to
29°C during the rest of the year. The mean daily minimum
in these months is about 22 to 23°C. The average annual
rainfall is 680 mm, most of which occurs during the
northeast monsoon. Since the economy of the district is
primarily based on agriculture, fluctuations in the
monsoon rains or flooding of the Thamarabarani river has
an immediate impact on the livelihood in the area.
2.5. Overview of the ULB and Demographics
Tirunelveli and Palayamkottai are the important towns of
the Tirunelveli Corporation limit. Tirunelveli is situated on
the left bank of Tamiraparani River and Palayamkottai on
the right bank. Palayamkottai as administrative
headquarters and with the establishment of educational
institutions industries and government offices, exhibited
remarkable development. In the year 1948, a portion of
Melepalayam village was deleted from this limit of
Palayamkottai Town and was constituted as a separate
Municipal Town with effect from 1.10.1948. These three
Municipal Towns with few surrounding villages have been
merged together to form Tirunelveli Municipal
Corporation. The corporation of Tirunelveli was
constituted in 1994 by merging Tirunelveli, Palayamkottai,
Melapalayam municipality, Thatchanallur town
panchayats and 11 village panchayats.
For administrative purposes, the city is divided in to four
zones viz. Tirunelveli, Palayamkottai, Melapalayam and
Thatchanallur. Further, these four zones are divided into
55 wards. As of 2001 the India census Tirunelveli had a
population of 411,298. Males constitute 49% of the
population and females 51%. As of 2011 census of India,
Tirunelveli had a total population of 473,637. Males

11 | P a g e
constitute 49% of the population and females 51%. The
city has an average literacy rate of 78%, higher than the
national average of 59.5%: male literacy is 83%, and
female literacy is 73%. In Tirunelveli, 10% of the
population is under six years of age.
About Tirunelveli
1 Area of the Municipal Corporation (sq.km) 108.65
2 Area of the Urban Development Authority
(sq.km)
306
3 Number of Zones 4
4 Number of Wards 55
5 Total Population as per Census 2011 473637
6 Total Number of Households as per
Census 2011
120466
Table 1. About Tirunelveli
Among the Municipal Corporations, Tirunelveli has been
identified with a gender ratio skewed towards females,
with 1,024 females for every 1,000 males. The growth
rate of urban agglomeration is 20.22%. Table 2.1 provides
the complete information about the ULB. Table 2.2 shows
the population growth in the Tirunelveli Corporation, it
can be seen that on rise and fall is noticed from decade to
decade. However, as evident from the graph on
population growth in Tirunelveli City, the growth has
been slowing over the past decade.
Year Population
%
Population
Growth
Population
Density (Person
sq.km.)
1971 241013 2218
1981 291104 20.78 2679
1991 321454 10.43 2958
2001 411831 28.12 3790
2011 473637 15.29 4370
Table 2. Population growth in Tirunelveli
Over the last decade, the population of the town has
increased from 321,454 in 1991 to 474,838 in 2011. The
town is spread over an area of 108.65 sq. km covering 55
wards. The gross population density has increased to
4370 persons per sq. kilometre (km) in 2011 from 2218

12 | P a g e
1971 1981 1991 2001 20112021
(Projected)2031
(Projected)
Population 241013 291104 321454 411831 473637 561653 666025
0
100000
200000
300000
400000
500000
600000
700000P
op
ula
tio
n
Year
Population Growth in Tirunelveli
persons per sq. km in 1971.
There had been some considerable fluctuations in
population growth, during the past decades. It has
registered a steep variation during the decades 1971-
1981, 1991-2001 as 20.78% and 28.12% respectively in
Corporation area. This may be attributable to the various
aspects like the formation of the Corporation and other
public and private offices and Institutions etc., The steep
down in variation noted in 1981 to 2001 is due to the
residential growth moved to outside three Municipal limit
at that period.
Figure 7. Population Growth in Tirunelveli

13 | P a g e
Male70%
Female30%
Working Population
127710
54761
105949
185217
Male
Female
Employed Unemployed
2.6. Employment
Employment Characteristics in the City
Male Female
Total Population= 473637 233659 239978
Working Population= 182471 127710 54761
% Employment out of the Total
Population 54.66% 22.82%
% Unemployed 45.34% 77.18%
Overall Unemployment Rate 61.47%
Table 3. Employment Characteristics
• The City has a high unemployment rate of 61.47%
out of the total population in the city
• Workforce participation rate is only 38.5% in the
total city population
• Women contribute to a significant chunk of the
unemployment share - 77.18% of the total women
are unemployed as per Census 2011.
Figure 9. Working Population in Tirunelveli
Figure 8. Gender wise Employment characteristics
14 | P a g e
Residential59%
Commercial4%
Industrial11%
Educational12%
Public and Semi Public
14%
Developed Area- Breakup
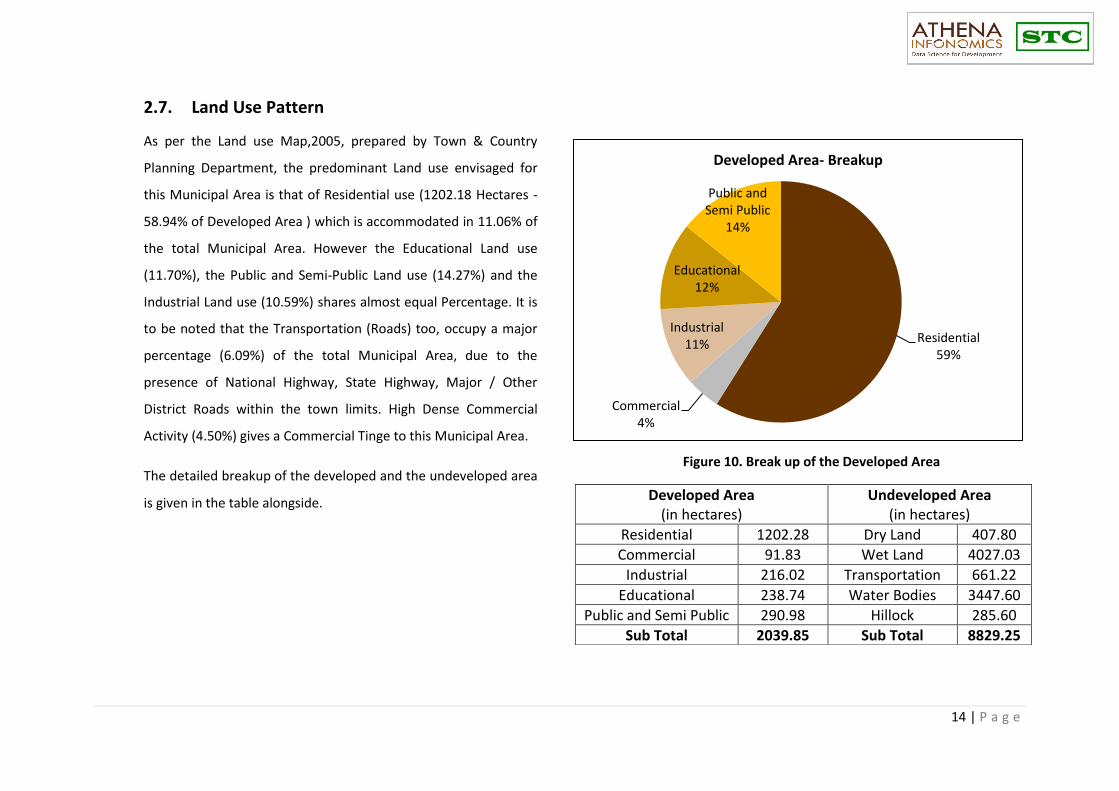
2.7. Land Use Pattern
As per the Land use Map,2005, prepared by Town & Country
Planning Department, the predominant Land use envisaged for
this Municipal Area is that of Residential use (1202.18 Hectares -
58.94% of Developed Area ) which is accommodated in 11.06% of
the total Municipal Area. However the Educational Land use
(11.70%), the Public and Semi-Public Land use (14.27%) and the
Industrial Land use (10.59%) shares almost equal Percentage. It is
to be noted that the Transportation (Roads) too, occupy a major
percentage (6.09%) of the total Municipal Area, due to the
presence of National Highway, State Highway, Major / Other
District Roads within the town limits. High Dense Commercial
Activity (4.50%) gives a Commercial Tinge to this Municipal Area.
The detailed breakup of the developed and the undeveloped area
is given in the table alongside.
Developed Area (in hectares)
Undeveloped Area (in hectares)
Residential 1202.28 Dry Land 407.80
Commercial 91.83 Wet Land 4027.03
Industrial 216.02 Transportation 661.22
Educational 238.74 Water Bodies 3447.60
Public and Semi Public 290.98 Hillock 285.60
Sub Total 2039.85 Sub Total 8829.25
Figure 10. Break up of the Developed Area

15 | P a g e
Comparison of the Existing Master Plan 2005 with the Proposed Land Use Plan 2021
• The comparison of the existing land use plan 2005 with the proposed land use plan for the year 2021, clearly shows that
there has been a significant decrease in the agriculture land use and a corresponding increase in the residential land use
• This shows that there might be significant pressure on the existing infrastructure in the future if no considerable
improvements are being carried out.
Figure 11. Existing and Proposed Land Use Plan in Tirunelveli
16 | P a g e
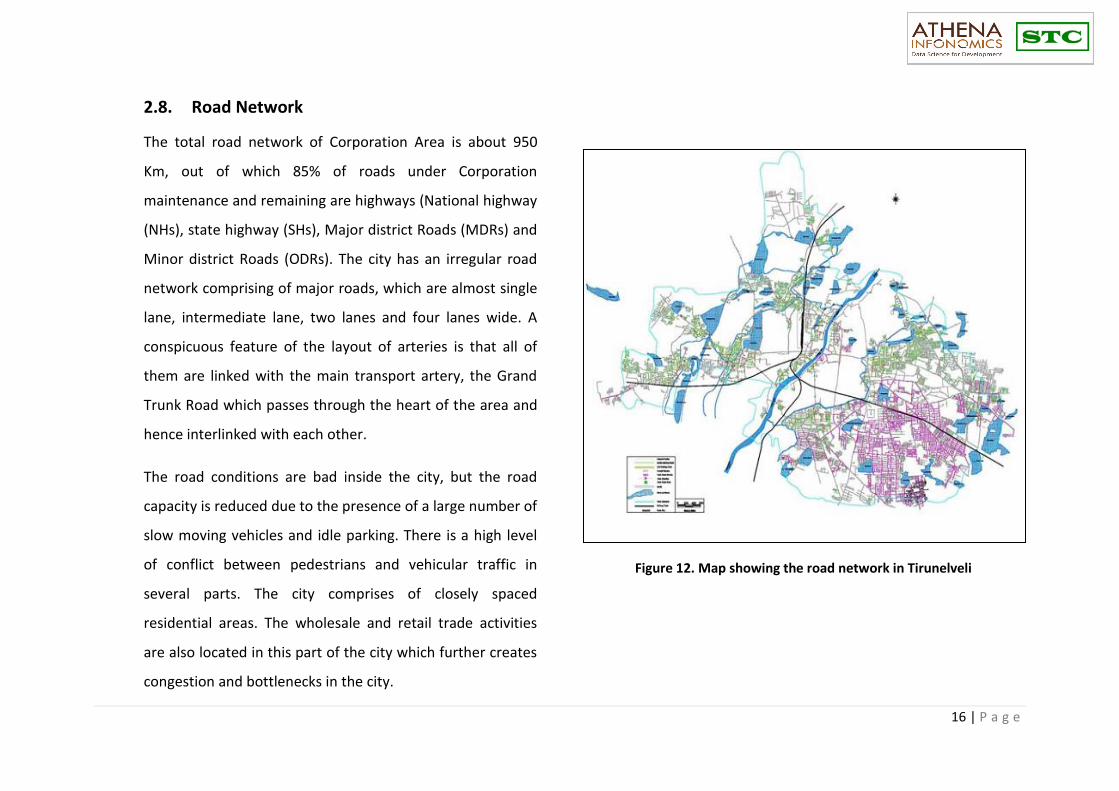
2.8. Road Network
The total road network of Corporation Area is about 950
Km, out of which 85% of roads under Corporation
maintenance and remaining are highways (National highway
(NHs), state highway (SHs), Major district Roads (MDRs) and
Minor district Roads (ODRs). The city has an irregular road
network comprising of major roads, which are almost single
lane, intermediate lane, two lanes and four lanes wide. A
conspicuous feature of the layout of arteries is that all of
them are linked with the main transport artery, the Grand
Trunk Road which passes through the heart of the area and
hence interlinked with each other.
The road conditions are bad inside the city, but the road
capacity is reduced due to the presence of a large number of
slow moving vehicles and idle parking. There is a high level
of conflict between pedestrians and vehicular traffic in
several parts. The city comprises of closely spaced
residential areas. The wholesale and retail trade activities
are also located in this part of the city which further creates
congestion and bottlenecks in the city.
Figure 12. Map showing the road network in Tirunelveli

17 | P a g e
Corporation91%
Highway Department
9%
Road Maintenance
Description Length (km)
NH (National Highway) 15.00
SH (State Highway) 30.30
MDR (Major District Road) 30.30
ODR (Other District Road) 7.00
Roads maintained by the Corporation
857.73
Table 4. Length of Road in the City
As evident from the above figure, more than 90% of the roads in the city are under the Corporation
Figure 13. Maintenance of Roads

18 | P a g e
2.9. Water Supply
Tirunelveli Municipal Corporation area consists of four-
distinct urban settlements as zones separated by the
agriculture fields. Constituent Local Bodies got its own
protected water supply scheme before formation of
Municipal Corporation in 1994.
• 11 Nos. of water supply systems have been implemented
under different periods from 1955 to 2005 to the then
Urban Local Bodies viz., Palayamkottai, Melapalayam,
Thachanallur and Tirunelveli
• After 1994, Two water supply schemes were implemented.
There are 11 nos of water supply systems with separate
Head works, Pumping systems, and Service Reservoirs and
Distribution systems. Combined Designed capacity and
present quantum of supply is about 67.15
MLD and 23 MLD respectively.
• All the Head works for the 11 systems are located at
Thamirabharani River
• 100% Ward Coverage by the Existing Water Supply System
• An average of 116 lpcd of water is supplied through the
system in the city
• Some of the issues in the existing water supply system
include:
➢ Present water sources are inadequate to meet the
present and the future demand
➢ Varying water supply quantity over the city
Figure 14. Map showing the Major Water Head works in the City
19 | P a g e
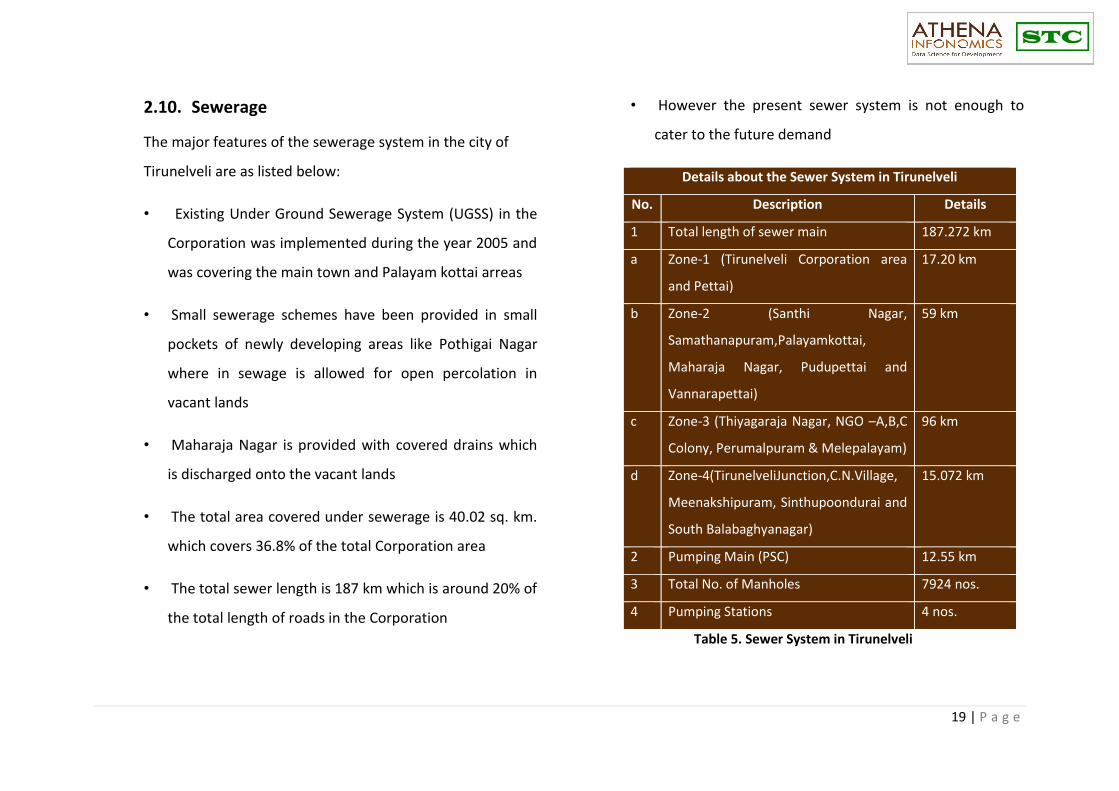
2.10. Sewerage
The major features of the sewerage system in the city of
Tirunelveli are as listed below:
• Existing Under Ground Sewerage System (UGSS) in the
Corporation was implemented during the year 2005 and
was covering the main town and Palayam kottai arreas
• Small sewerage schemes have been provided in small
pockets of newly developing areas like Pothigai Nagar
where in sewage is allowed for open percolation in
vacant lands
• Maharaja Nagar is provided with covered drains which
is discharged onto the vacant lands
• The total area covered under sewerage is 40.02 sq. km.
which covers 36.8% of the total Corporation area
• The total sewer length is 187 km which is around 20% of
the total length of roads in the Corporation
• However the present sewer system is not enough to
cater to the future demand
Details about the Sewer System in Tirunelveli
No. Description Details
1 Total length of sewer main 187.272 km
a Zone-1 (Tirunelveli Corporation area
and Pettai)
17.20 km
b Zone-2 (Santhi Nagar,
Samathanapuram,Palayamkottai,
Maharaja Nagar, Pudupettai and
Vannarapettai)
59 km
c Zone-3 (Thiyagaraja Nagar, NGO –A,B,C
Colony, Perumalpuram & Melepalayam)
96 km
d Zone-4(TirunelveliJunction,C.N.Village,
Meenakshipuram, Sinthupoondurai and
South Balabaghyanagar)
15.072 km
2 Pumping Main (PSC) 12.55 km
3 Total No. of Manholes 7924 nos.
4 Pumping Stations 4 nos.
Table 5. Sewer System in Tirunelveli

20 | P a g e
2.11. Storm Water Drainage System
• Tirunelveli city has three major canals which carries
storm water during rainy season’s viz., Kodagan Channel,
Tirunelveli channel and Palayam channel
• A few areas only have been covered by the Storm Water
Drainage system of which most of them are inner roads
and along the newly constructed PCC roads
• The contours in the city are such that the run off gets
directed to the Tamirabharani River
• Some of the issues faced by the system are:
• Deposition of grit
• Blockages in the system
Details about the Storm Water Drainage in the Corporation
Zone Length (km)
Tirunelveli 87.2
Palayamkottai 84.9
Melapalayam 83.2
Thatchanulur 31.6
Total Length 286.9 Table 6. Storm Water Drainage in the City
Figure 15. Map showing the gradients in the City
21 | P a g e
Other Sectors- A Snapshot
2.12. Housing
• Residential area occupies 1202.28 hectares which
contributes 58.94% of the developed area and
11.06% of developed area
• Residential developments are mainly concentrated
in the heart of Tirunelveli town, Pettai,
Kokkirakulam, Vannarapettai and the area between
Tiruchendur Road and Trivandrum Road
2.13. Slums
• The city has 68 pockets of slums spread across 36
wards out of the 55 wards
• Slum population constitutes nearly one-fourth
(22.55%) of the total population in the Corporation
• Thatchanallur zone has the highest share wherein
40% consists of slum
2.14. Commercial
• Commercial institutions in the Corporation can be
classified into three categories
✓ Wholesale trading centers
✓ Retail shops
✓ Private offices and other commercial
establishments
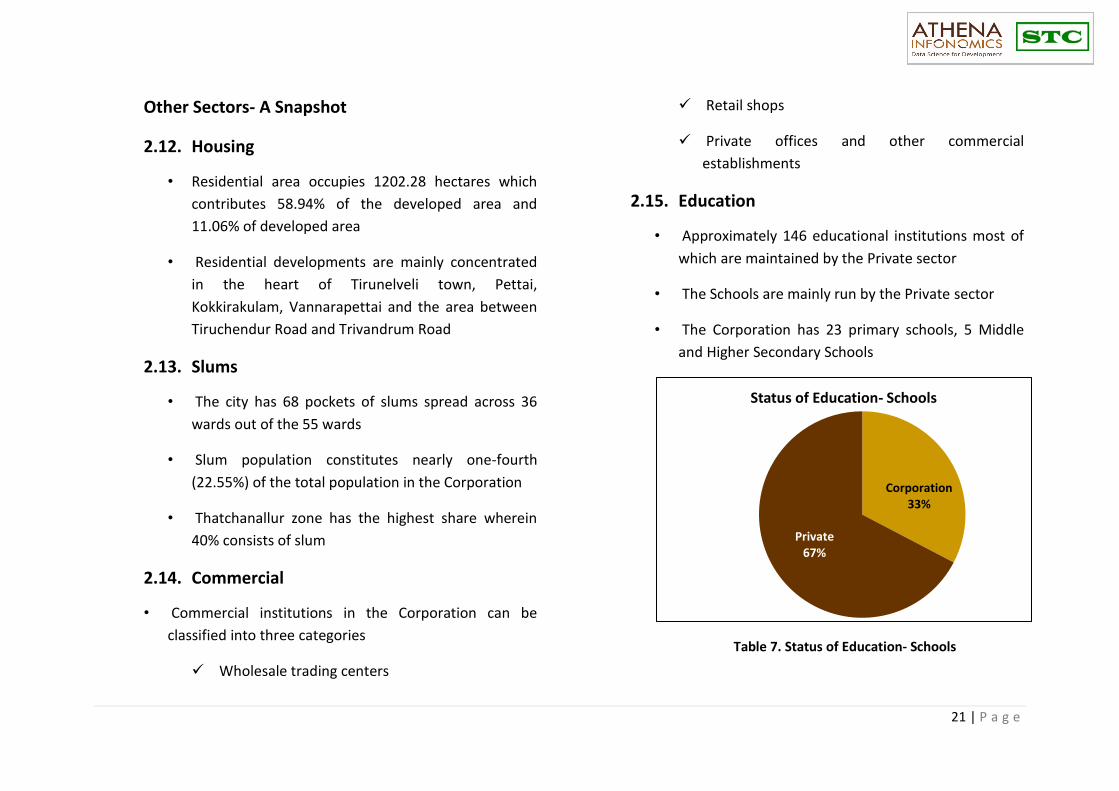
2.15. Education
• Approximately 146 educational institutions most of
which are maintained by the Private sector
• The Schools are mainly run by the Private sector
• The Corporation has 23 primary schools, 5 Middle
and Higher Secondary Schools
Table 7. Status of Education- Schools
Corporation33%
Private67%
Status of Education- Schools

22 | P a g e
2.16. Health Care
• Corporation maintains two hospitals, four Allopathic
dispensaries, two Sidda dispensaries and eight Maternity
centers
• The major hospital in the Tirunelveli Corporation area Is
the Tirunelveli Medical College Hospital which is located
in an extensive area of about 300 acres land
• Majority of the health care facilities are in the Private
sector as given in the figure below:
Figure 16. Breakup of Health Care Facilities
Figure 17. Map showing the healthcare facilities in Tirunelveli District
Public12%
Private88%
Health Care Facilities
23 | P a g e
3. Stakeholder Consultation
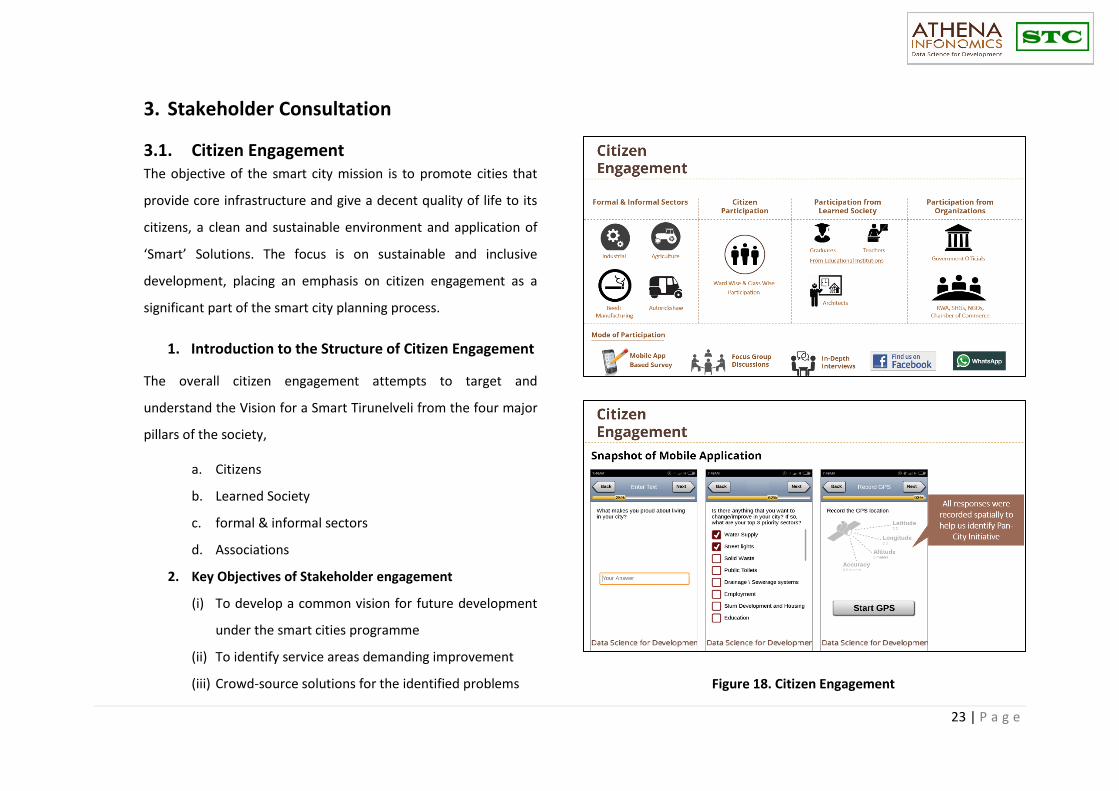
3.1. Citizen Engagement The objective of the smart city mission is to promote cities that
provide core infrastructure and give a decent quality of life to its
citizens, a clean and sustainable environment and application of
‘Smart’ Solutions. The focus is on sustainable and inclusive
development, placing an emphasis on citizen engagement as a
significant part of the smart city planning process.
1. Introduction to the Structure of Citizen Engagement
The overall citizen engagement attempts to target and
understand the Vision for a Smart Tirunelveli from the four major
pillars of the society,
a. Citizens
b. Learned Society
c. formal & informal sectors
d. Associations
2. Key Objectives of Stakeholder engagement
(i) To develop a common vision for future development
under the smart cities programme
(ii) To identify service areas demanding improvement
(iii) Crowd-source solutions for the identified problems
Figure 18. Citizen Engagement

24 | P a g e
3. Types of Participants Interviewed and Mode(s) of
interview/discussion
The Smart city guidelines specify Citizen Engagement
as an essential part of the planning process. The
citizen engagement for Tirunelveli, was started (as
per the recommendations of the Corporation
commissioner) by interacting with residents who
were on their morning walk at V.O.C grounds in
Pallayamkottai. This was an initial dipstick survey
undertaken in order to gain a basic understanding of
the resident’s needs, aims and aspirations before
devising a more comprehensive questionnaire.
a. To develop a common vision for future
development under the smart cities
programme
Participant Type Mode of Outreach
Residents Interview
Community Semi structured interviews across Tirunelveli City in 46 Major Locations
Questions were asked to identify the smart city vision of the
citizens. The questions are designed based on identity, icon,
culture and attitude and by comparison.
During this interaction it was felt that the needs of the
residents were divided based on their gender. While men
spoke of traffic congestion and lack of employment
opportunities as key issues, the concerns of women were
irregularity in water supply and poor sanitation in the city.
Following this a detailed questionnaire was drawn up and
ward wise survey was conducted.
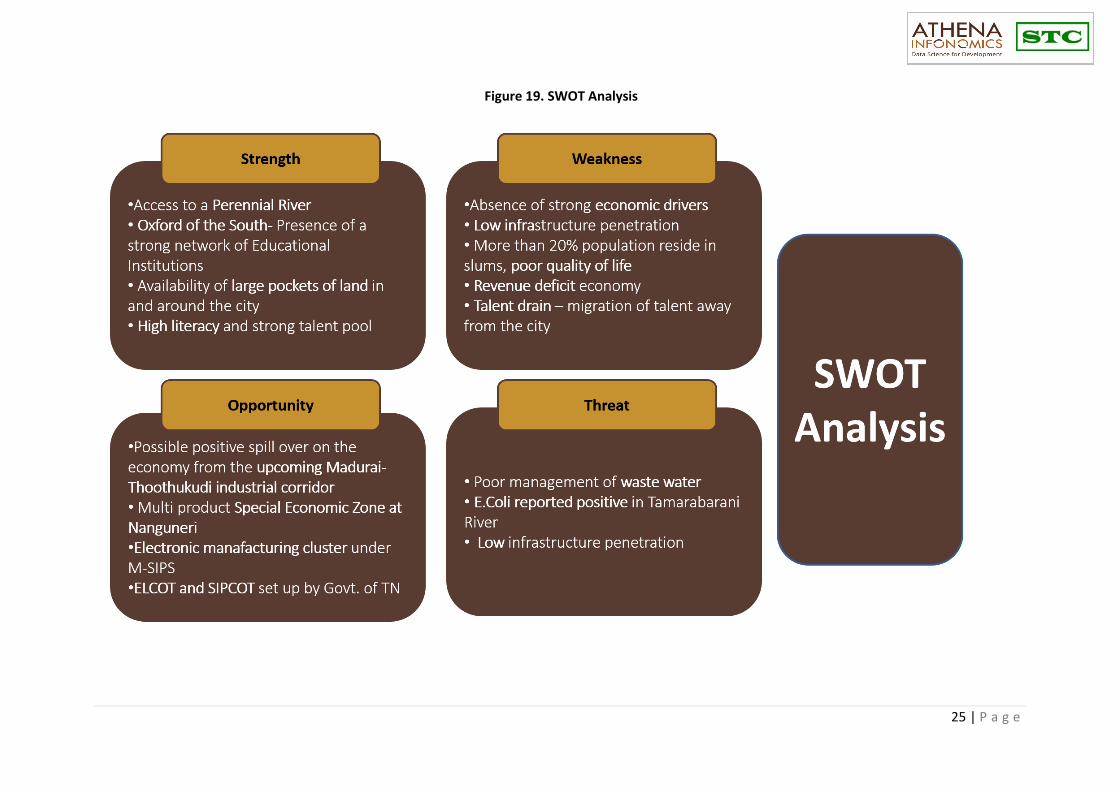
Based on these discussions and review of the secondary
literature a SWOT analysis was performed and the city vision
statement was drawn from the SWOT analysis. The
outcomes of the SWOT analysis and the City Vision are
outlined below:
25 | P a g e
Figure 19. SWOT Analysis

26 | P a g e
3.2. Developing Smart City Vision
Figure 20. Developing Smart City Vision
27 | P a g e
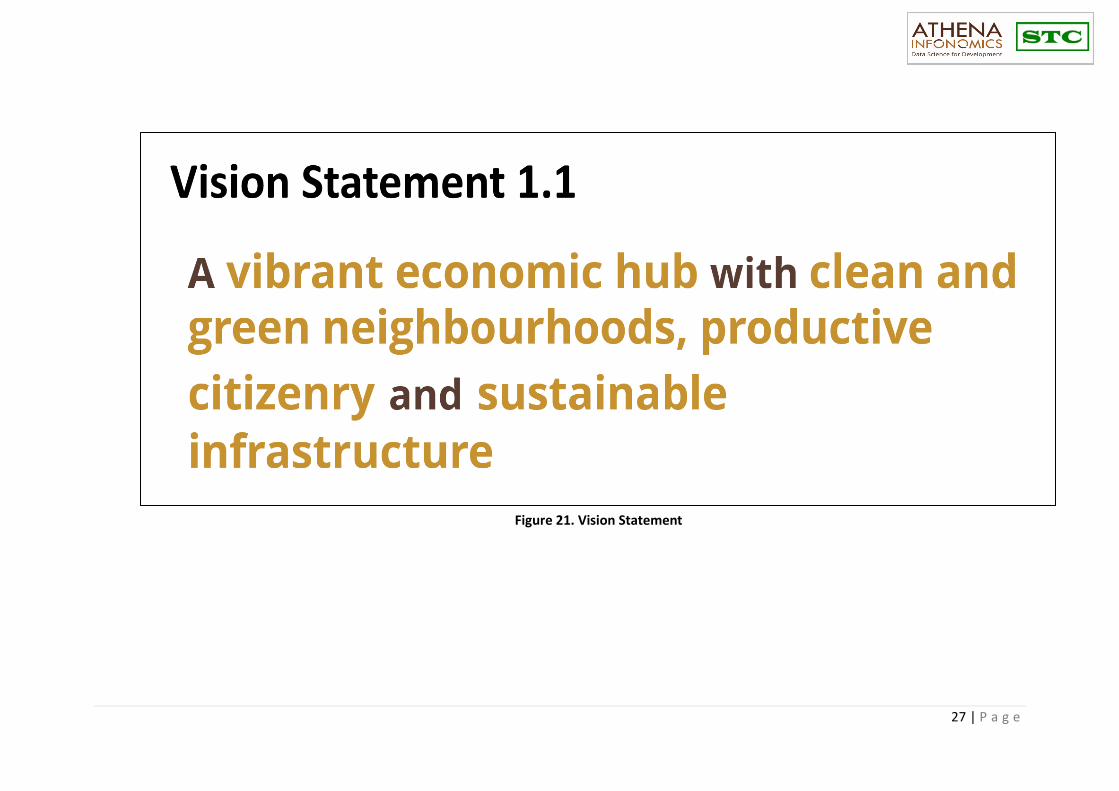
Figure 21. Vision Statement
28 | P a g e
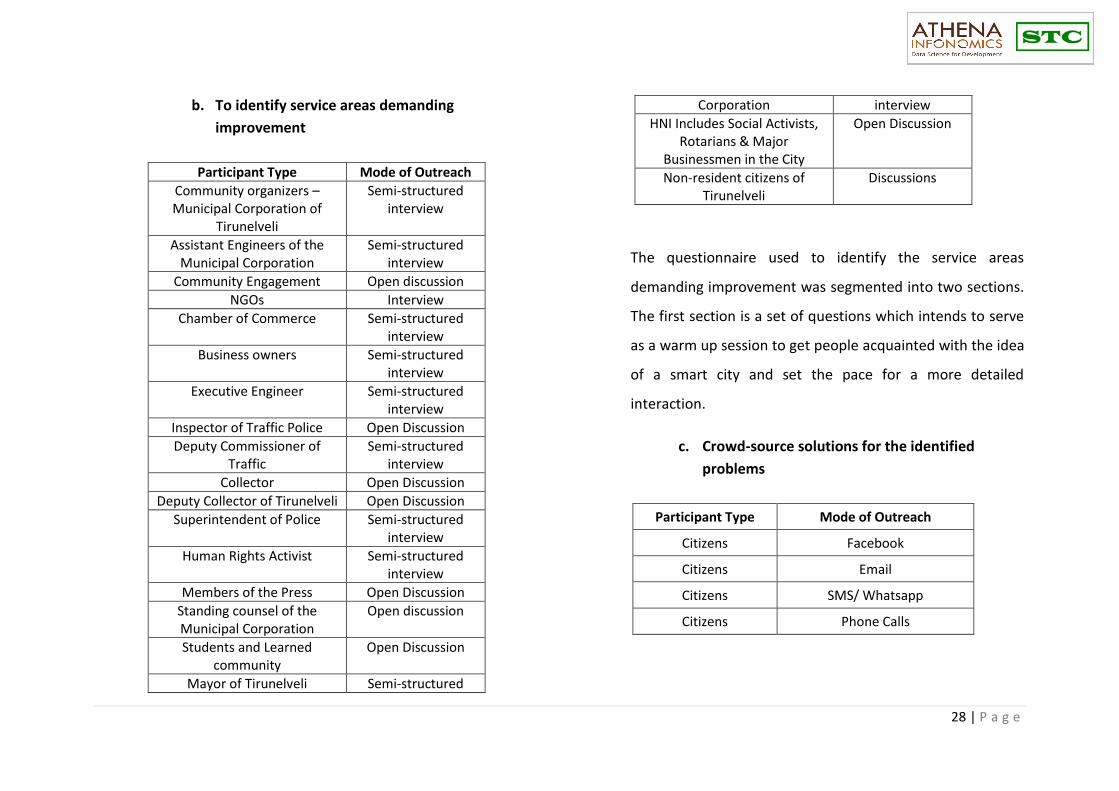
b. To identify service areas demanding
improvement
Participant Type Mode of Outreach
Community organizers – Municipal Corporation of
Tirunelveli
Semi-structured interview
Assistant Engineers of the Municipal Corporation
Semi-structured interview
Community Engagement Open discussion
NGOs Interview
Chamber of Commerce Semi-structured interview
Business owners Semi-structured interview
Executive Engineer Semi-structured interview
Inspector of Traffic Police Open Discussion
Deputy Commissioner of Traffic
Semi-structured interview
Collector Open Discussion
Deputy Collector of Tirunelveli Open Discussion
Superintendent of Police Semi-structured interview
Human Rights Activist Semi-structured interview
Members of the Press Open Discussion
Standing counsel of the Municipal Corporation
Open discussion
Students and Learned community
Open Discussion
Mayor of Tirunelveli Semi-structured
Corporation interview
HNI Includes Social Activists, Rotarians & Major
Businessmen in the City
Open Discussion
Non-resident citizens of Tirunelveli
Discussions
The questionnaire used to identify the service areas
demanding improvement was segmented into two sections.
The first section is a set of questions which intends to serve
as a warm up session to get people acquainted with the idea
of a smart city and set the pace for a more detailed
interaction.
c. Crowd-source solutions for the identified
problems
Participant Type Mode of Outreach
Citizens Facebook
Citizens Email
Citizens SMS/ Whatsapp
Citizens Phone Calls
29 | P a g e
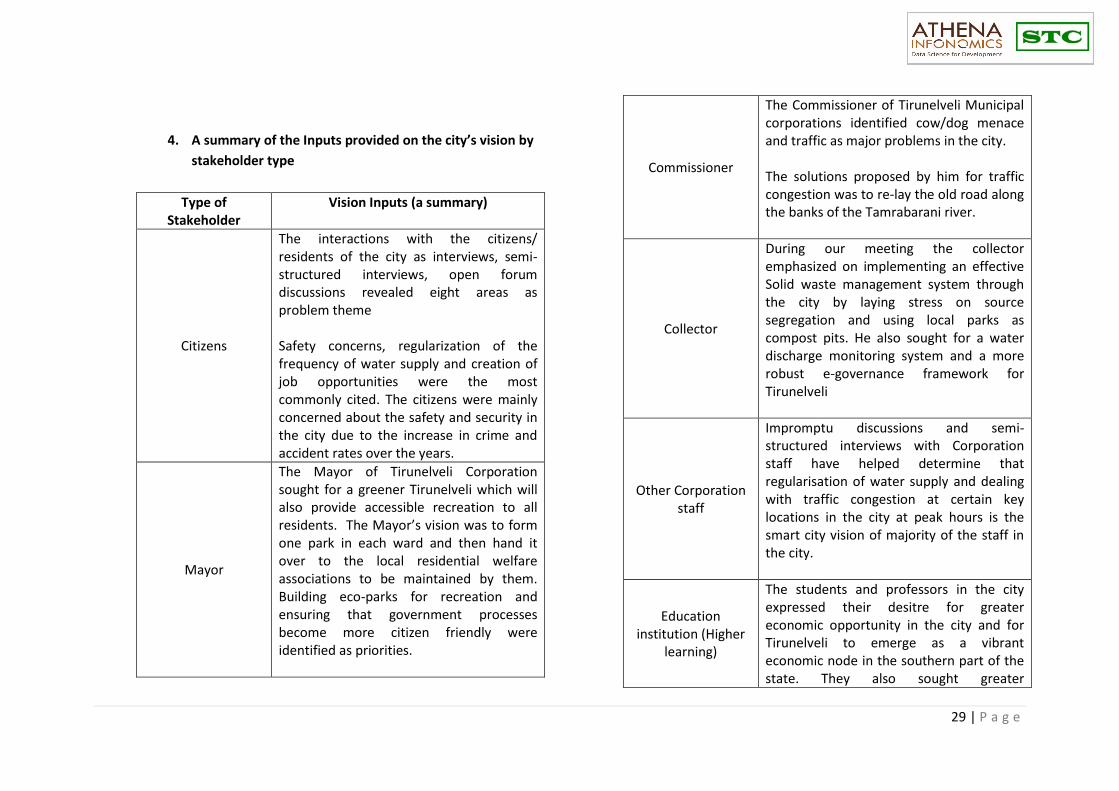
4. A summary of the Inputs provided on the city’s vision by
stakeholder type
Type of Stakeholder
Vision Inputs (a summary)
Citizens
The interactions with the citizens/ residents of the city as interviews, semi-structured interviews, open forum discussions revealed eight areas as problem theme Safety concerns, regularization of the frequency of water supply and creation of job opportunities were the most commonly cited. The citizens were mainly concerned about the safety and security in the city due to the increase in crime and accident rates over the years.
Mayor
The Mayor of Tirunelveli Corporation sought for a greener Tirunelveli which will also provide accessible recreation to all residents. The Mayor’s vision was to form one park in each ward and then hand it over to the local residential welfare associations to be maintained by them. Building eco-parks for recreation and ensuring that government processes become more citizen friendly were identified as priorities.
Commissioner
The Commissioner of Tirunelveli Municipal corporations identified cow/dog menace and traffic as major problems in the city. The solutions proposed by him for traffic congestion was to re-lay the old road along the banks of the Tamrabarani river.
Collector
During our meeting the collector emphasized on implementing an effective Solid waste management system through the city by laying stress on source segregation and using local parks as compost pits. He also sought for a water discharge monitoring system and a more robust e-governance framework for Tirunelveli
Other Corporation staff
Impromptu discussions and semi-structured interviews with Corporation staff have helped determine that regularisation of water supply and dealing with traffic congestion at certain key locations in the city at peak hours is the smart city vision of majority of the staff in the city.
Education institution (Higher
learning)
The students and professors in the city expressed their desitre for greater economic opportunity in the city and for Tirunelveli to emerge as a vibrant economic node in the southern part of the state. They also sought greater
30 | P a g e
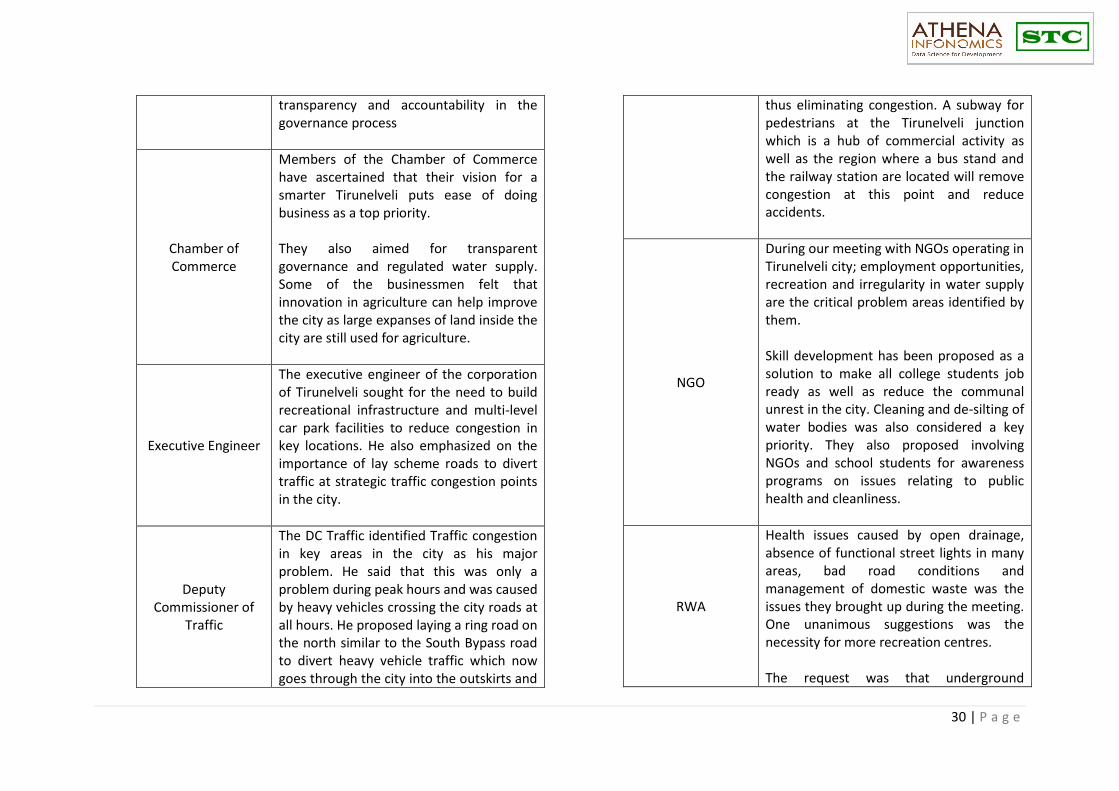
transparency and accountability in the governance process
Chamber of Commerce
Members of the Chamber of Commerce have ascertained that their vision for a smarter Tirunelveli puts ease of doing business as a top priority. They also aimed for transparent governance and regulated water supply. Some of the businessmen felt that innovation in agriculture can help improve the city as large expanses of land inside the city are still used for agriculture.
Executive Engineer
The executive engineer of the corporation of Tirunelveli sought for the need to build recreational infrastructure and multi-level car park facilities to reduce congestion in key locations. He also emphasized on the importance of lay scheme roads to divert traffic at strategic traffic congestion points in the city.
Deputy Commissioner of
Traffic
The DC Traffic identified Traffic congestion in key areas in the city as his major problem. He said that this was only a problem during peak hours and was caused by heavy vehicles crossing the city roads at all hours. He proposed laying a ring road on the north similar to the South Bypass road to divert heavy vehicle traffic which now goes through the city into the outskirts and
thus eliminating congestion. A subway for pedestrians at the Tirunelveli junction which is a hub of commercial activity as well as the region where a bus stand and the railway station are located will remove congestion at this point and reduce accidents.
NGO
During our meeting with NGOs operating in Tirunelveli city; employment opportunities, recreation and irregularity in water supply are the critical problem areas identified by them. Skill development has been proposed as a solution to make all college students job ready as well as reduce the communal unrest in the city. Cleaning and de-silting of water bodies was also considered a key priority. They also proposed involving NGOs and school students for awareness programs on issues relating to public health and cleanliness.
RWA
Health issues caused by open drainage, absence of functional street lights in many areas, bad road conditions and management of domestic waste was the issues they brought up during the meeting. One unanimous suggestions was the necessity for more recreation centres. The request was that underground
31 | P a g e
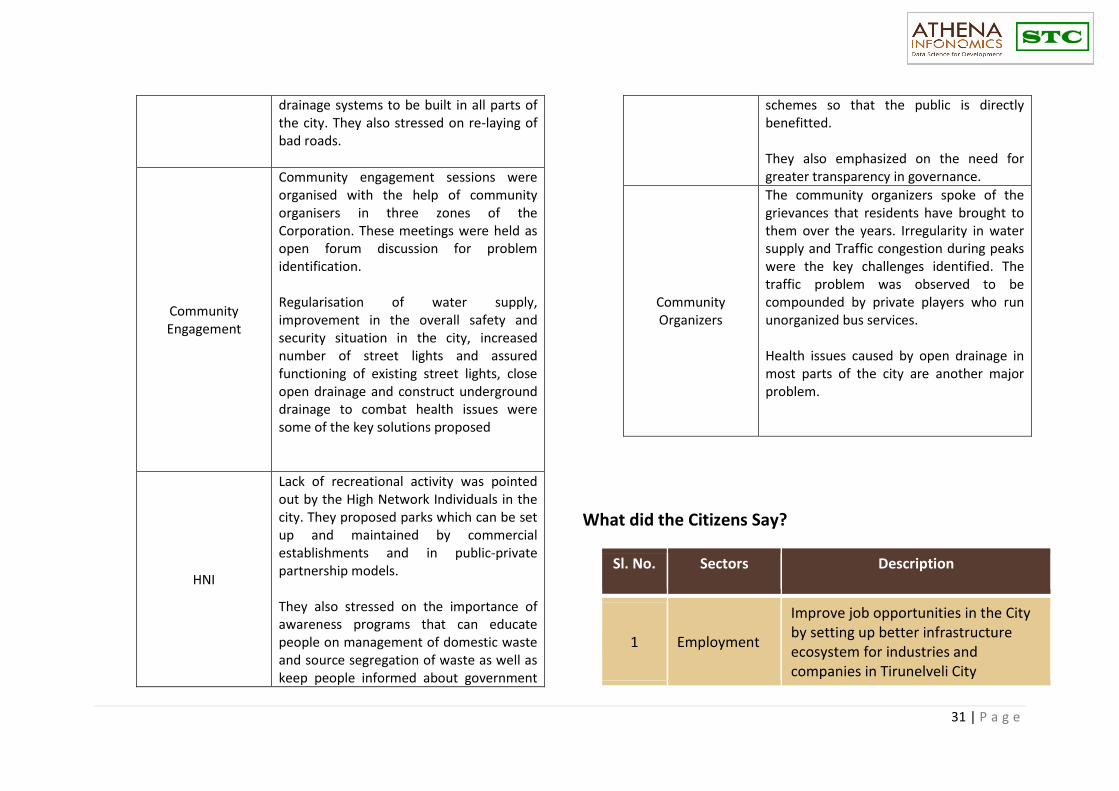
drainage systems to be built in all parts of the city. They also stressed on re-laying of bad roads.
Community Engagement
Community engagement sessions were organised with the help of community organisers in three zones of the Corporation. These meetings were held as open forum discussion for problem identification. Regularisation of water supply, improvement in the overall safety and security situation in the city, increased number of street lights and assured functioning of existing street lights, close open drainage and construct underground drainage to combat health issues were some of the key solutions proposed
HNI
Lack of recreational activity was pointed out by the High Network Individuals in the city. They proposed parks which can be set up and maintained by commercial establishments and in public-private partnership models. They also stressed on the importance of awareness programs that can educate people on management of domestic waste and source segregation of waste as well as keep people informed about government
schemes so that the public is directly benefitted. They also emphasized on the need for greater transparency in governance.
Community Organizers
The community organizers spoke of the grievances that residents have brought to them over the years. Irregularity in water supply and Traffic congestion during peaks were the key challenges identified. The traffic problem was observed to be compounded by private players who run unorganized bus services. Health issues caused by open drainage in most parts of the city are another major problem.
What did the Citizens Say?
Sl. No. Sectors Description
1 Employment
Improve job opportunities in the City by setting up better infrastructure ecosystem for industries and companies in Tirunelveli City

32 | P a g e
2 Law & Order, Safety and Security
Improve the overall safety and security in the city. Decrease in overall crime rates in the city
3 Water Supply (A) Frequency; (B) Quantity Delivered; (C) Water Leakage; (D) Improper Timings
4 Drainage (A) Absence of Drainage; (B) Blockage in Drainage
5 Recreation Absence of (A) Parks, (B) Playgrounds; (C) Public Places
6 Road Improvement
Improvement in Road Infrastructure
7 Solid Waste Management
(A) Poor road cleaning; (B) Waste on road sides; (C) Lack of Hygiene
8 Connectivity by public transport
Poor bus frequency; (B) Absence of nearby Bus Route
9 Traffic Congestion
Need for alternative roads/routes to avoid congestion in the city

33 | P a g e
Figure 22. Open Group Discussion- Community
34 | P a g e
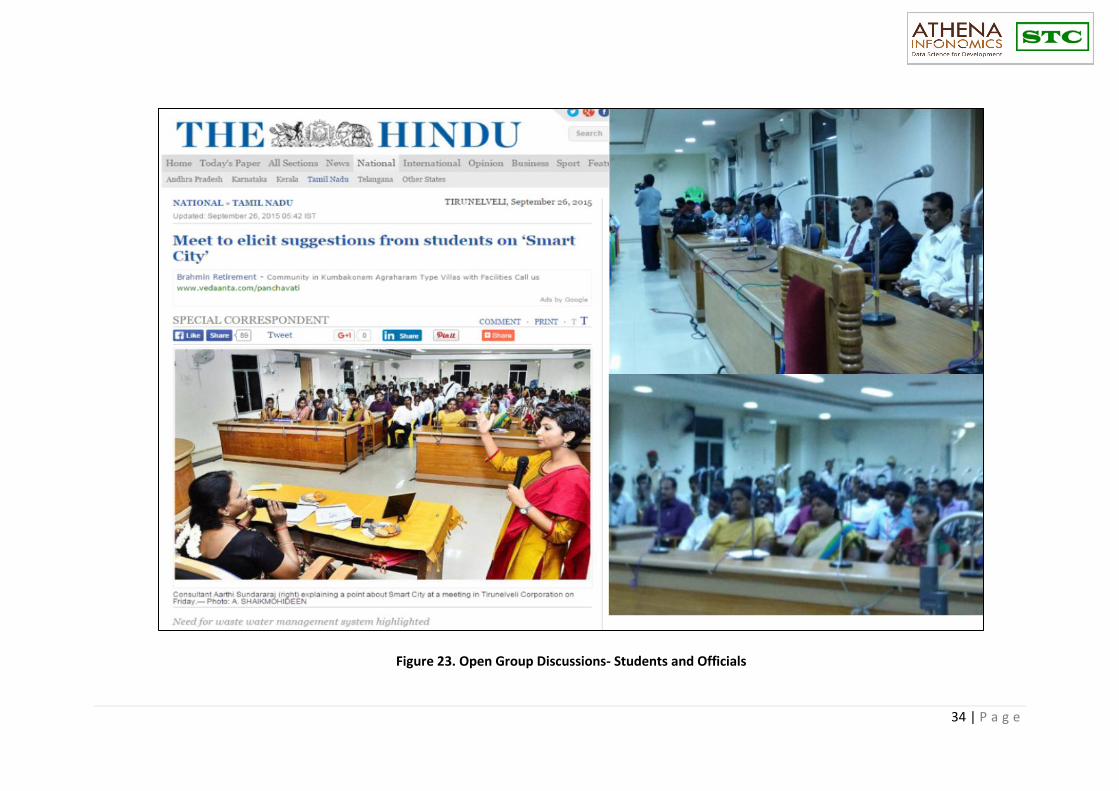
Figure 23. Open Group Discussions- Students and Officials

35 | P a g e
Figure 24. Engagement with Leadership
Leadership Engagement included discussions with various officials of the Government and the Civil Society was conducted to identify
the sectors for improvement. This is given in the following figure:
3.3. Leadership Engagement

36 | P a g e
4. Identifying Sectors for Improvement
Figure 25. Identified Sectors for Improvement based on Citizen and Leadership Engagement
Based on the consultations with the citizen and the leadership, the following sectors were for improvement were prioritized.
The sectors which are in Red are accorded High Priority, whereas Orange is for Medium Priority.

37 | P a g e
Pan City Initiatives

38 | P a g e
5. Pan City Initiative

39 | P a g e
5.1. Employment
Citizen’s access to job/employment was highlighted in the citizen
engagement process. Approach to improving various aspects of
employment can be classified as three fold approach
A. Demand -
Creating an enabling environment for employers
B. Supply -
Improving the employability of the candidates
C. Eco System
Create an eco system where the demand and supply are
matching

40 | P a g e
A. Demand
➢ Create an enabling environment for setting up business
➢ Single Window Clearance for Businesses
• Avoiding repetitive submission of same piece of information to various Government
agencies
41 | P a g e
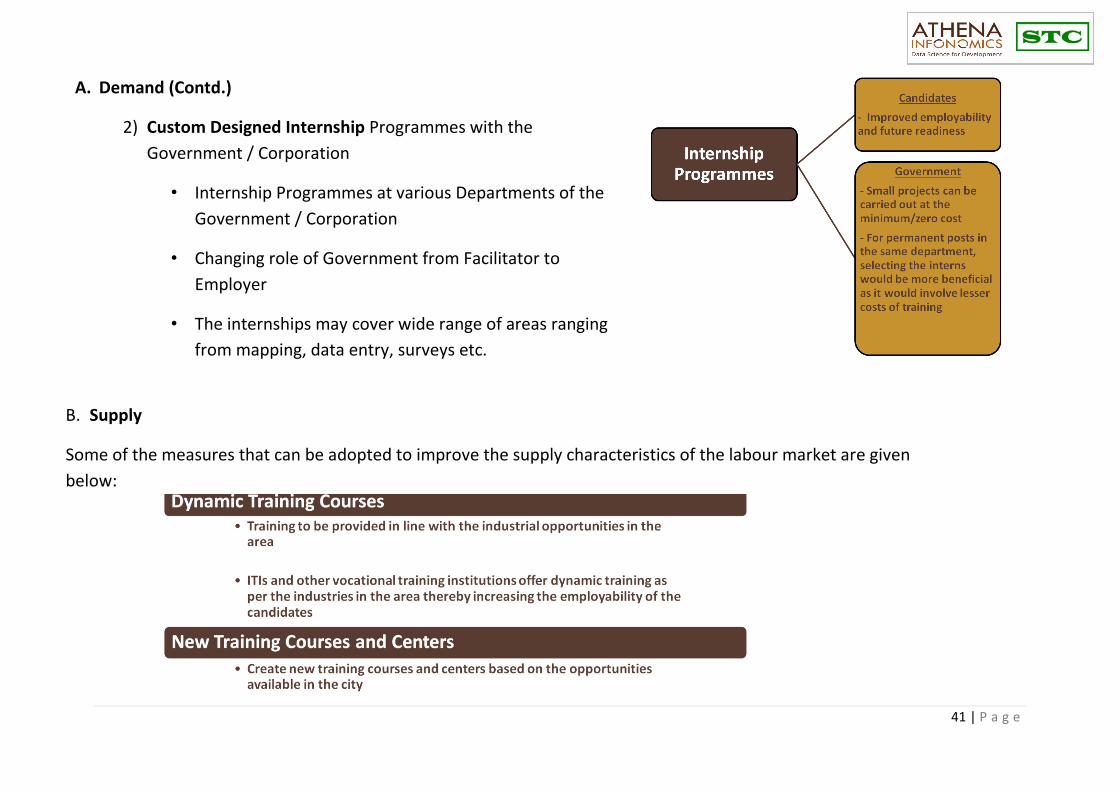
A. Demand (Contd.)
2) Custom Designed Internship Programmes with the
Government / Corporation
• Internship Programmes at various Departments of the
Government / Corporation
• Changing role of Government from Facilitator to
Employer
• The internships may cover wide range of areas ranging
from mapping, data entry, surveys etc.
B. Supply
Some of the measures that can be adopted to improve the supply characteristics of the labour market are given
below:
42 | P a g e
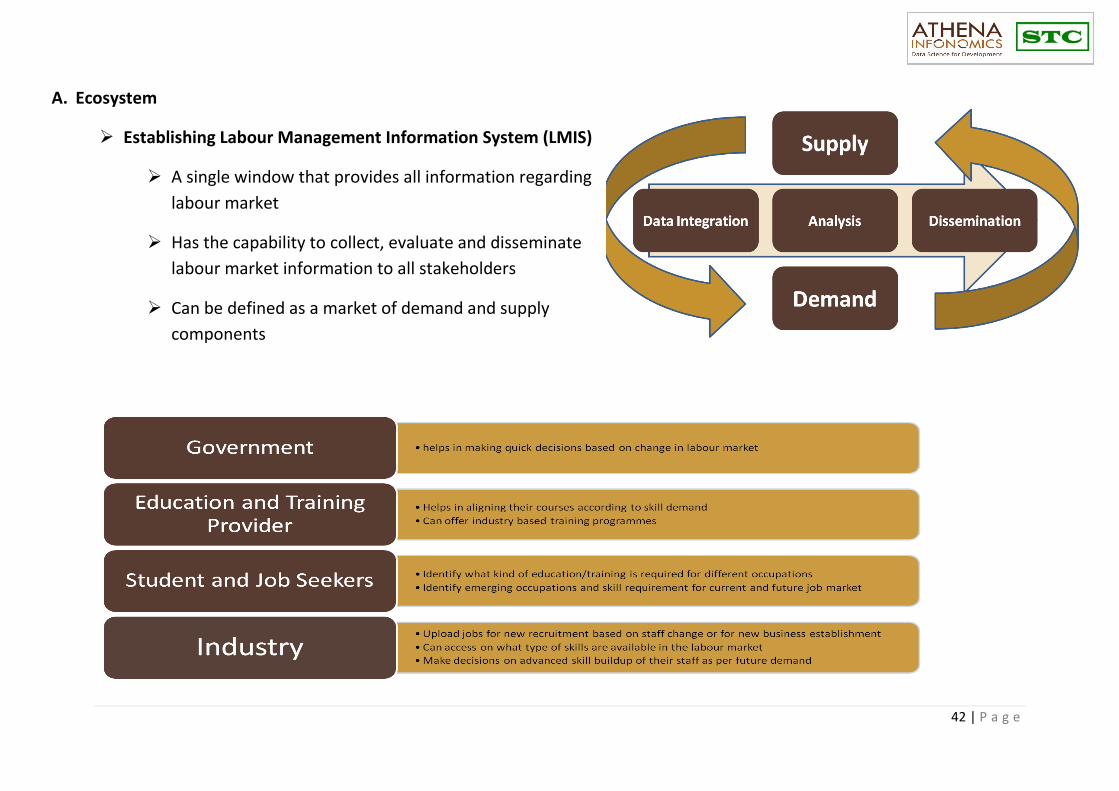
A. Ecosystem
➢ Establishing Labour Management Information System (LMIS)
➢ A single window that provides all information regarding
labour market
➢ Has the capability to collect, evaluate and disseminate
labour market information to all stakeholders
➢ Can be defined as a market of demand and supply
components

43 | P a g e
5.2. Emergency Response and Monitoring System
(EMRS)
Tirunelveli is vulnerable to a variety of emergencies and
anti-social activities with unknown situational variables,
unpredictable temporal and spatial constraints that
potentially threaten ecosystem in the city. The proposed
pan city initiative involves the establishment of an
Integrated Emergency Monitoring and Response System
(EMRS) which provides a systematic, proactive approach to
guide departments to co-ordinate and work seamlessly to
prevent protect and respond to emergencies. The system
involves Incident Monitoring, Multiagency Co-ordination
and Public Information. EMRS integrates historical and real
time data on incidents and supplementing the City’s
response capabilities. EMRS aims to reduce crime rates,
fatalities and ensure citizen safety and security in Tirunelveli
City.

44 | P a g e
Unified Public Information and Reporting
System-
Mobile app and Single window Emergency Call
System
Integrates existing reporting system at different
department levels and combines them into one single
system
GIS based Reporting System—
The incident will be recorded spatially through GIS
and nearest point of emergency services would be
contacted thereby reducing the response time to
attend to the emergency
Historical data would also be recorded to create
crime heat maps, fire hazard spots and health care
facilities which help the public in better decision
making

45 | P a g e
5.3. Integrated Water Management Systems
Existing Situation:
The Corporation is supplying 116 LPCD, ranking 4th best among
other Corporations in water supply in Tamil Nadu. However
citizens do not receive sufficient water at the receiving end. The
reasons could be attributed to
• Unequal Distribution of Water across the city
• Lack of accountancy and transparency in
Water Supply Distribution Levels in the system
One of the main reasons that is causing the unequal distribution
of water in the city as identified by the Corporation is due to the
variation in pressure in the system. In some areas, there is high
water pressure where as in some areas there is really low
pressure. This has been explained in the next page.

46 | P a g e
Water Pressure Management
• One of the major reasons for unequal water distribution and
leakages is due to the absence of a proper pressure
management in the system
• Water pressure management involves adjusting water
pressure levels in the water supply system to save water
and improve service levels to the customers
• High water pressure results in water main bursts, leaks and
wastages
• Water pressure varies in the zone depending on the
distance and the elevation with respect to the reservoir
Figure 26. Variation of Water Pressure in the Area
Water pressure management is the use of pressure
regulating valves and system monitoring points to
achieve more consistent and lower water pressure
levels across the water supply network
47 | P a g e
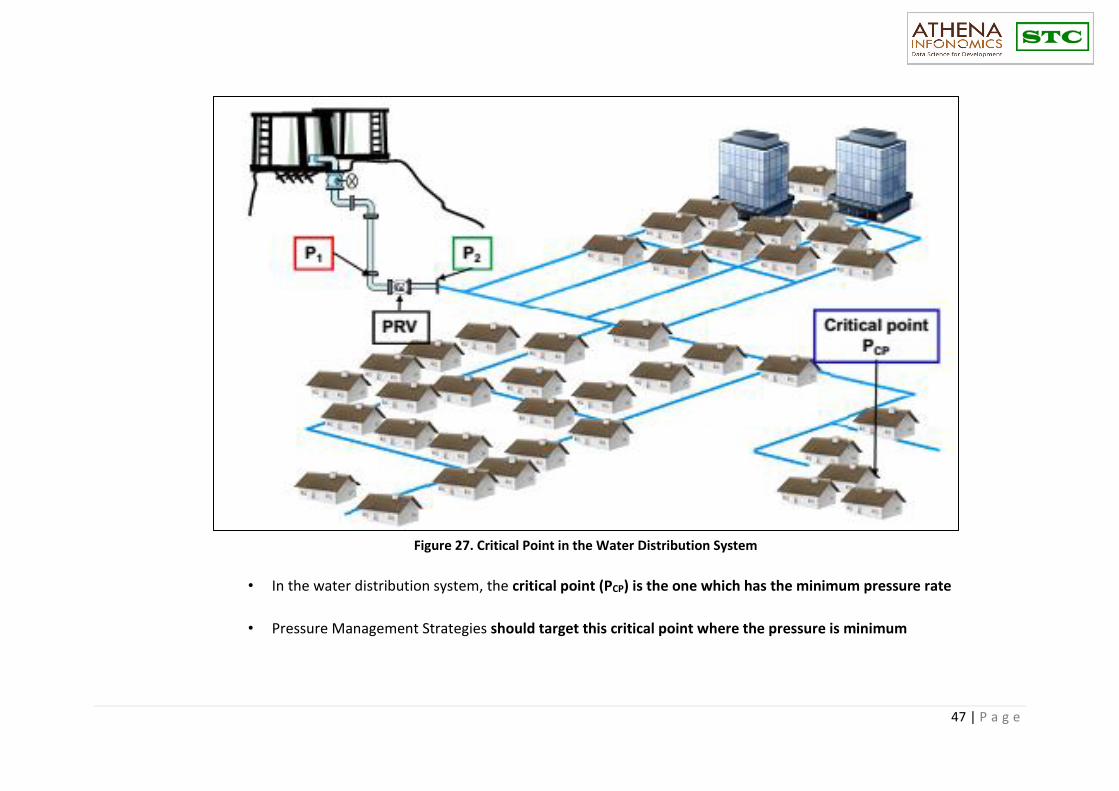
• In the water distribution system, the critical point (PCP) is the one which has the minimum pressure rate
• Pressure Management Strategies should target this critical point where the pressure is minimum
Figure 27. Critical Point in the Water Distribution System

48 | P a g e
Figure 28. Valve Chamber
Figure 29. Interface for Monitoring Pressure in the Water Distribution System
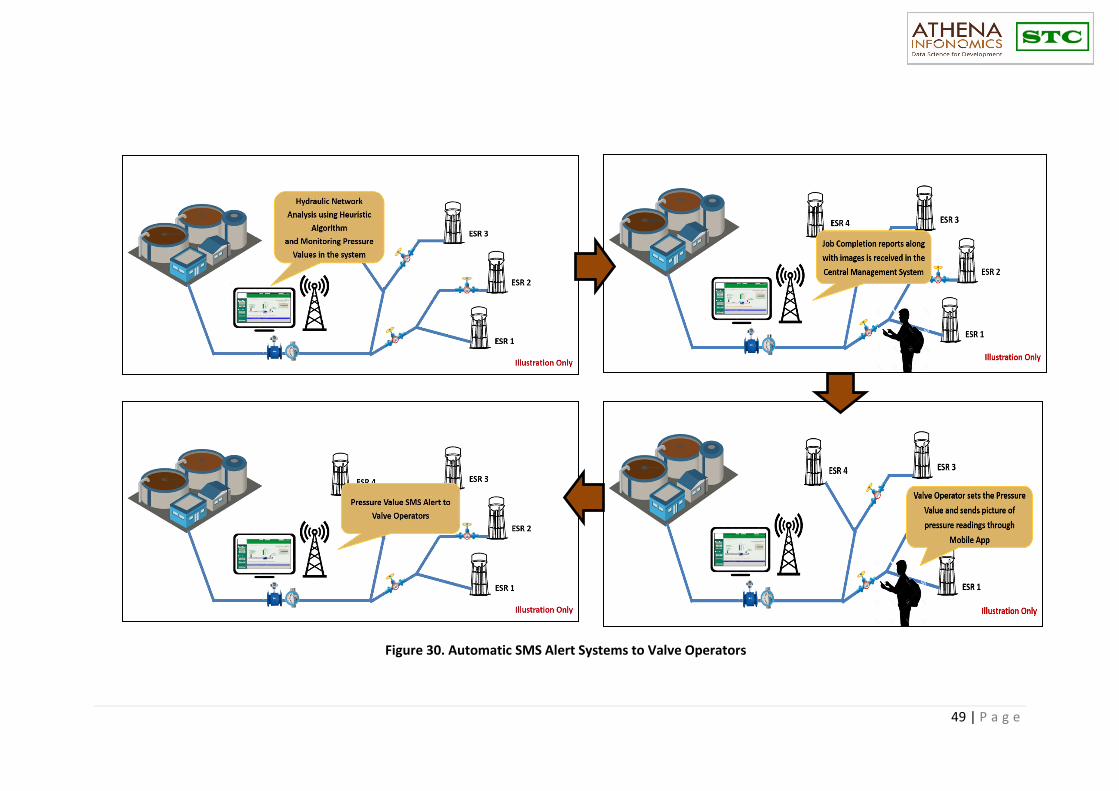
• Low cost monitoring units will be
installed at major valve points and critical
pressure points of the water distribution
system
• The pressure at these points will be
monitored regularly and adjustments will
be made manually such that an optimum
pressure is maintained at major points
• Critical pressure values will be set in the
software interface and an SMS will be
sent to the concerned valve operator and
engineer when the critical pressure has
been reached
49 | P a g e
Figure 30. Automatic SMS Alert Systems to Valve Operators

50 | P a g e
• The Water Pressure and Flow Rate readings
can be read through the display units
• Pressure Data loggers can be fitted along
with the display unit, typically has a large
memory buffer to store over 81,000 water
pressure readings with user defined
intervals from 1 per second to more than 1
per year
• Pressure Log Audits can be conducted
monthly once to authenticate the factual
accuracy of Mobile App Image readings sent
daily.
Figure 31. Data Logger
51 | P a g e
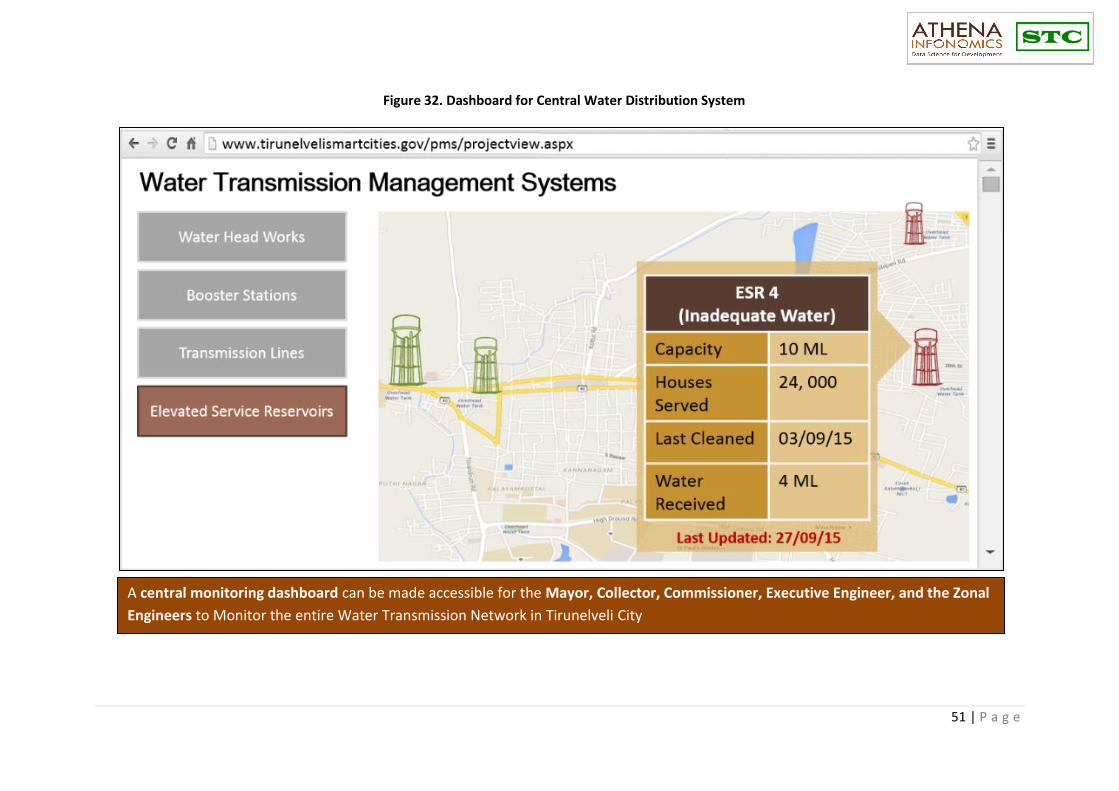
A central monitoring dashboard can be made accessible for the Mayor, Collector, Commissioner, Executive Engineer, and the Zonal
Engineers to Monitor the entire Water Transmission Network in Tirunelveli City
Figure 32. Dashboard for Central Water Distribution System
52 | P a g e
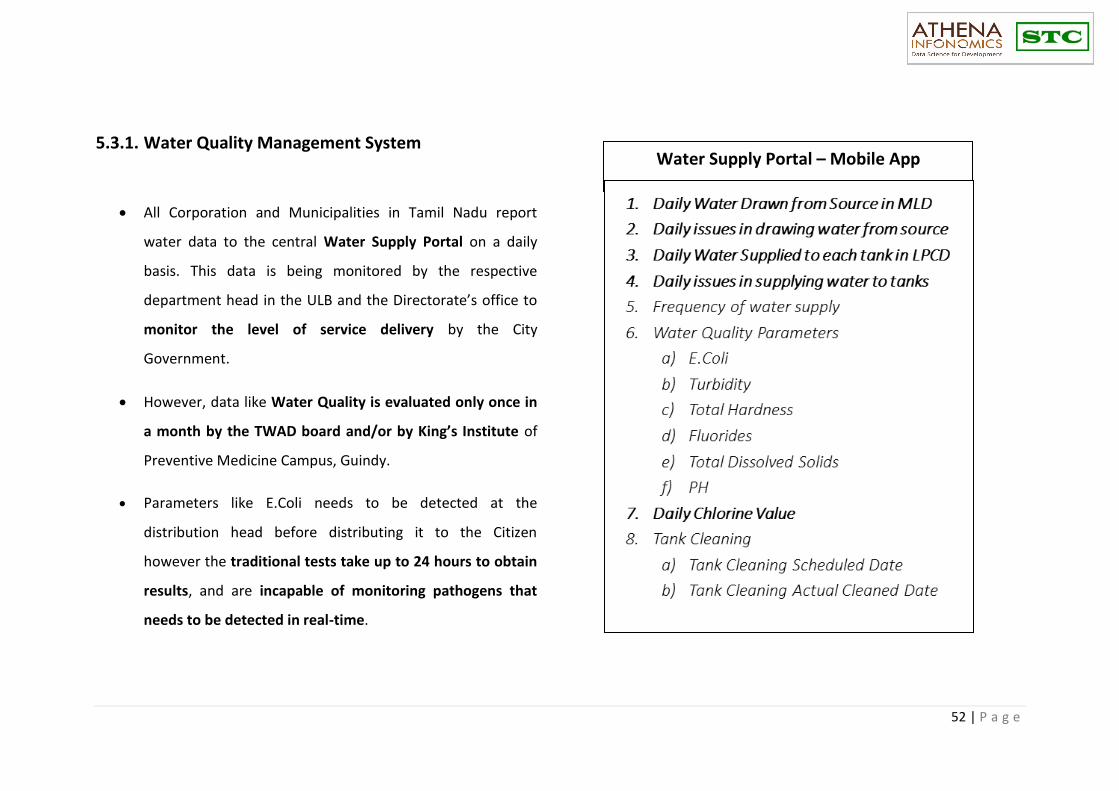
Water Supply Portal – Mobile App
5.3.1. Water Quality Management System
• All Corporation and Municipalities in Tamil Nadu report
water data to the central Water Supply Portal on a daily
basis. This data is being monitored by the respective
department head in the ULB and the Directorate’s office to
monitor the level of service delivery by the City
Government.
• However, data like Water Quality is evaluated only once in
a month by the TWAD board and/or by King’s Institute of
Preventive Medicine Campus, Guindy.
• Parameters like E.Coli needs to be detected at the
distribution head before distributing it to the Citizen
however the traditional tests take up to 24 hours to obtain
results, and are incapable of monitoring pathogens that
needs to be detected in real-time.

53 | P a g e
HydroBox to measure Temperature, Turbidity,
Conductivity, O2 content, pH, Redox Potential / ORP,
Chlorine, Chloroxide, Ozone, Hydrocarbons, NO3,
NO3-N
BioSentry to measure E.coli, Salmonella,
Shigella, Pseudomonas, Legionella
Figure 33 Water Quality Monitoring- Process
Figure 35. Hydrobox
Figure 34. Bio Sentry

54 | P a g e
• The use of integrated and intelligent sensors to operate in real-time, with the ability to recognize and diagnose day-to-day
and perhaps minute-to-minute water quality disturbances can monitor water quality through the detection of intentional
or operational intrusion events, thus improving water security.
• When contamination events are recognized in real-time, a rapid response can minimize the impact of these contamination
events and limit the potential for adverse effects
Figure 36. Water Quality Monitoring System Dashboard
55 | P a g e
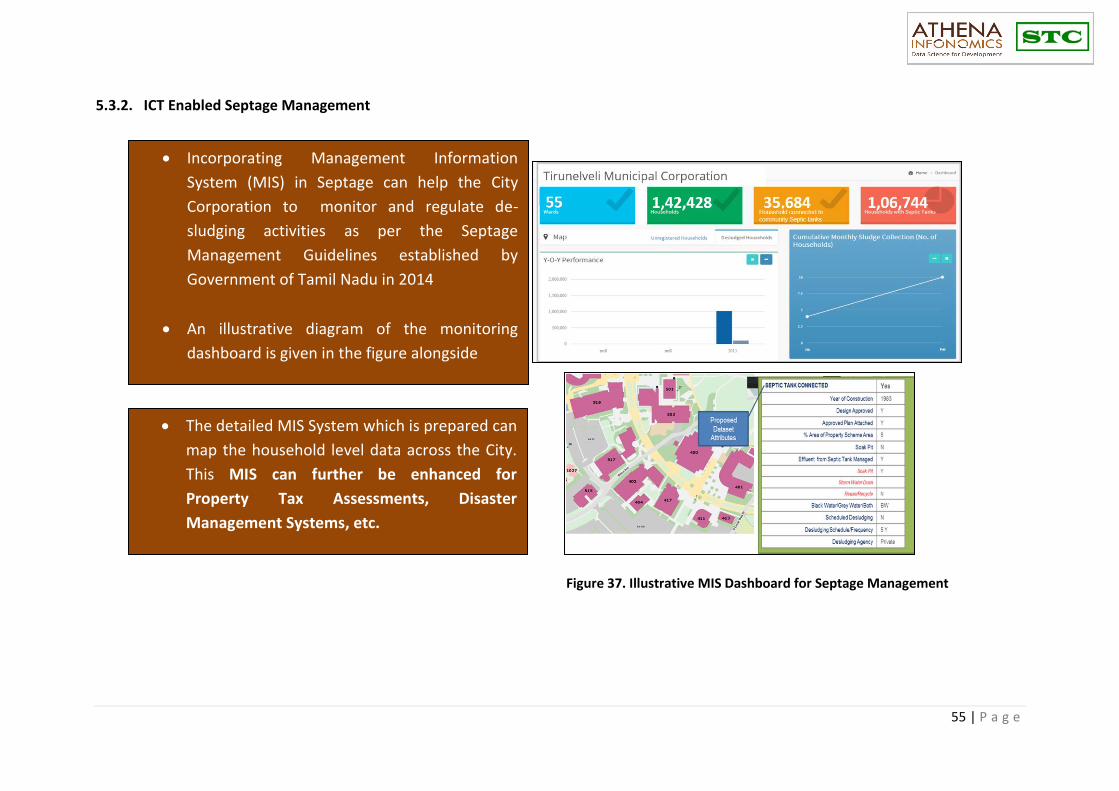
• Incorporating Management Information
System (MIS) in Septage can help the City
Corporation to monitor and regulate de-
sludging activities as per the Septage
Management Guidelines established by
Government of Tamil Nadu in 2014
• An illustrative diagram of the monitoring
dashboard is given in the figure alongside
• The detailed MIS System which is prepared can
map the household level data across the City.
This MIS can further be enhanced for
Property Tax Assessments, Disaster
Management Systems, etc.
5.3.2. ICT Enabled Septage Management
Figure 37. Illustrative MIS Dashboard for Septage Management

56 | P a g e
Area Based Initiatives

57 | P a g e
6. Area Based Initiatives
6.1. City Characteristics
58 | P a g e
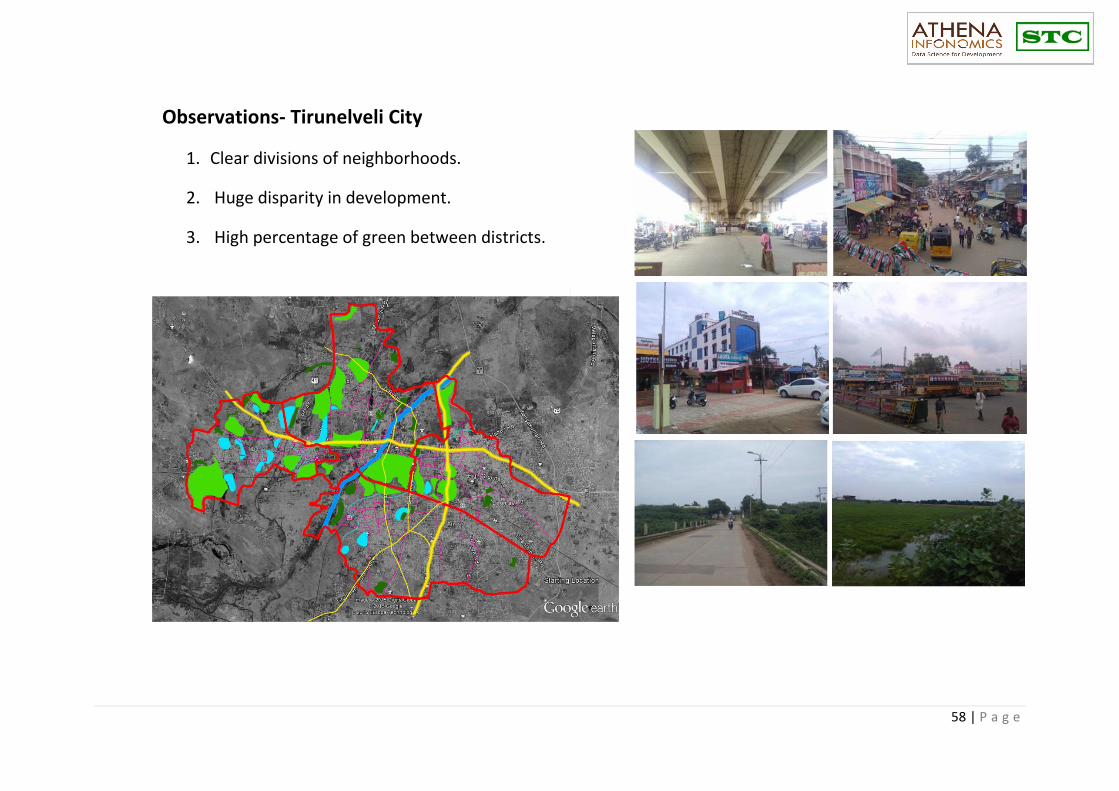
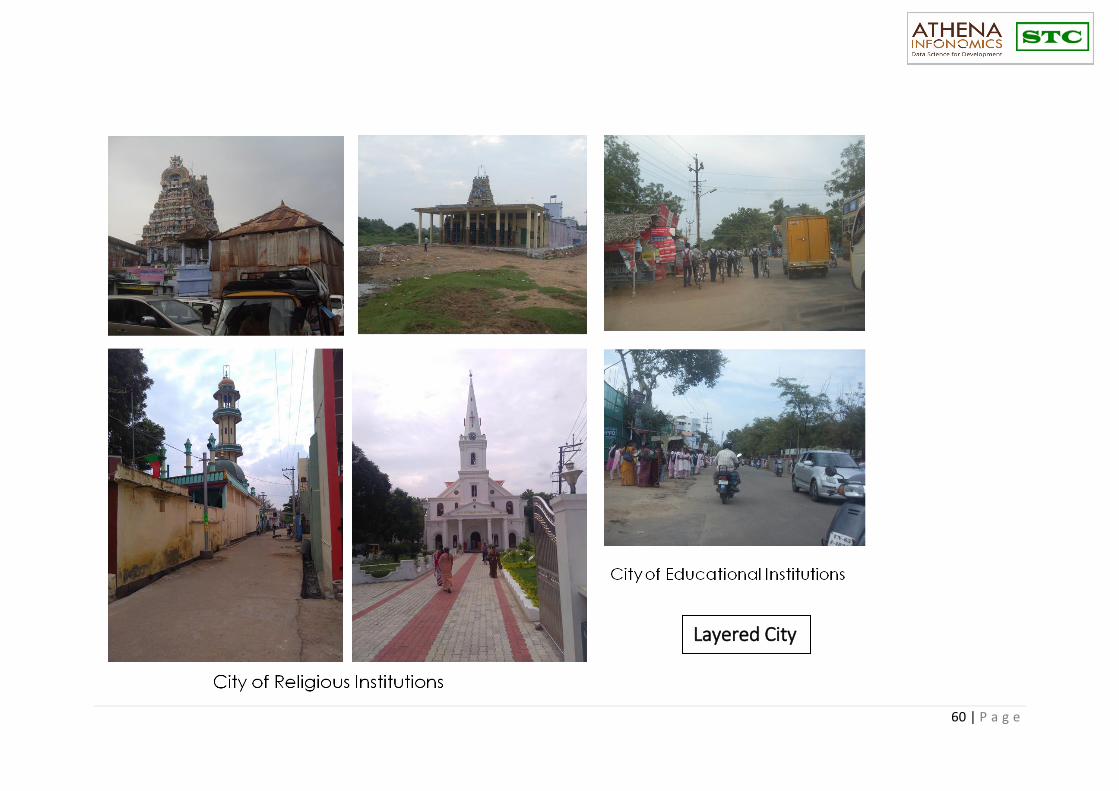
Observations- Tirunelveli City
1. Clear divisions of neighborhoods.
2. Huge disparity in development.
3. High percentage of green between districts.

59 | P a g e
City Potential:
• The indigenous features are very strong
.
• Untapped layers of open space, which
could be a unifying factor
• The Network system between the
districts and within themselves are very
strong
• Presence of a natural Eco-system can be
converted to revenue generators for
the city
• The availability of large parcels of vacant
land within the core, set amidst
abundant greenery, well connected
roads, has great real estate potential
• Future development can create new
layers of revenue, employment and
tourism Potential Areas for Area Based Development
60 | P a g e
Layered City

61 | P a g e
• Based on the various stakeholder consultations including discussions with the Corporation officials, were carried out to
determine the area based interventions in the City
• Area based interventions are mainly carried out in three models:
▪ Retrofitting
▪ Redevelopment
▪ Greenfield development
• However based on the city characteristics and preliminary stakeholder discussions, green field development will not be
possible in the city considering various factors such as availability of land and other socio economic and political factors.
• Hence a Retrofitting and Redevelopment model of area based development is being evaluated for the city

62 | P a g e
Figure 38. Areas Identified for Area Based Interventions in Tirunelveli

63 | P a g e
Programme Convergence for Smart
City Funding
I

64 | P a g e
7. Programme Convergence for Smart City
Funding
Comprehensive development occurs in areas by integrating the
physical, institutional, social and economic infrastructure. Many of
the sectoral schemes of the Government converge in this goal,
although the path is different. There is a strong complementarity
between the Atal Mission for Rejuvenation and Urban
Transformation (AMRUT) and Smart Cities Mission in achieving
urban transformation. While AMRUT follows a project-based
approach, the Smart Cities Mission follows an area-based strategy.
Similarly, great benefit can be derived by seeking convergence of
other Central and State Government Programs/Schemes with the
Smart Cities Mission. At the planning itself the convergence of
various proposed projects of the Smart City Project needs to be
explored further by comparing with AMRUT, Swachh Bharat
Mission (SBM), National Heritage City Development and
Augmentation Yojana (HRIDAY), Digital India, Skill development,
Housing for All, construction of Museums funded by the Culture
Department
and other programs connected to social infrastructure such as
Health, Education and Culture.
The proposed Smart City initiatives viz., Pan city and Area based
projects were compared with other Government programmes such
that maximum benefits can be obtained by the City.
• The City’s present gradient does not allow to have a
centralized sewer system as the variation in the gradient is
highly uneven across the city
• Hence to carry the sewage against the gradient, a lot of
pumping is needed in the sewer system to counter the
slope
• It is highly uneconomical over the longer periods to sustain
this
• To cover the entire the city through a centralized sewer
system requires a very high Operation and Maintenance
cost which is highly unsustainable over a long period of
65 | P a g e
Key Contacts

66 | P a g e
Key Contacts
Ms. Deepa Karthykeyan Director Athena Infonomics India Private Limited 113-114, 6th Floor, B Block Mena Kampala Arcade Sir Theagaraya Road T. Nagar Chennai – 600 0017 Mobile: +91 99401 74545 Email: [email protected]
Mr. Sridhar
Business Development Manager Shah Technical Consultants Private Limited Old No. 43/2, New No.24/6, Vijyaraghava Road T. Nagar Chennai – 600017 Tel: +91 44 28150573, 74 [email protected]
•