adbi-transitioning-linear-circular-economy-developing-asia ...
157
Edited by Linda Arthur, Derek Hondo, Maria Hughes, and Reetta Kohonen ASIAN DEVELOPMENT BANK INSTITUTE PROSPECTS FOR TRANSITIONING FROM A LINEAR TO CIRCULAR ECONOMY IN DEVELOPING ASIA
-
Upload
khangminh22 -
Category
Documents
-
view
3 -
download
0
Transcript of adbi-transitioning-linear-circular-economy-developing-asia ...
Edited by Linda Arthur, Derek Hondo, Maria Hughes, and Reetta Kohonen
ASIAN DEVELOPMENT BANK INSTITUTE
PROSPECTS FOR TRANSITIONING FROM A LINEAR TO CIRCULAR ECONOMY IN DEVELOPING ASIA

Prospects for Transitioning from a Linear to Circular Economy in Developing Asia
Edited by Linda Arthur, Derek Hondo, Maria Hughes, and Reetta Kohonen
ASIAN DEVELOPMENT BANK INSTITUTE

© 2022 Asian Development Bank Institute
All rights reserved.
ISBN 978-4-89974-247-0 (Print) ISBN 978-4-89974-248-7 (PDF)
The views in this publication do not necessarily reflect the views and policies of the Asian Development Bank Institute (ADBI), its Advisory Council, ADB’s Board or Governors, or the governments of ADB members.
ADBI does not guarantee the accuracy of the data included in this publication and accepts no responsibility for any consequence of their use. ADBI uses proper ADB member names and abbreviations throughout and any variation or inaccuracy, including in citations and references, should be read as referring to the correct name.
By making any designation of or reference to a particular territory or geographic area, or by using the term “recognize,” “country,” or other geographical names in this publication, ADBI does not intend to make any judgments as to the legal or other status of any territory or area.
Users are restricted from reselling, redistributing, or creating derivative works without the express, written consent of ADBI.
The Asian Development Bank recognizes “China” as the People’s Republic of China, “Korea” as the Republic of Korea, and “Vietnam” as Viet Nam.
Note: In this publication, “$” refers to US dollars.
Asian Development Bank Institute Kasumigaseki Building 8F 3-2-5, Kasumigaseki, Chiyoda-ku Tokyo 100-6008, Japan www.adbi.org

iii
CONTENTS
Tables and Figures iv
Acknowledgments v
Contributors vi
Introduction 1Derek Hondo and Linda Arthur
Part I Regional and Country Policies for a Circular Economy
1 Toward a Regional Circular Economy Policy for East Asia and the Association of Southeast Asian Nations 9
Michikazu Kojima
2 A Road Map to a Circular Economy in Viet Nam 22 Tho Dinh Nguyen, Manh Van Lai, Huyen Anh Pham, and Hanh Trong Nguyen
3 Design–Reality Gap in Promoting a Circular Economy in the Private Sector: Case of Waste Management and Recycling in Bangladesh 36
Suborna Barua
Part II Regulatory and Legal Frameworks for Plastics: Extended Producer Responsibility
4 Closing the “Circularity Gaps”: Practical Strategies to Address Key Challenges Undermining the Collective Goal of a Global Circular Economy of Plastics 63
Nicholas Kolesch, Steve Sikra, and Martyn Tickner
5 Circular Economy Policy Initiatives and Experiences in the Philippines: Lessons for Asia and the Pacific and Beyond 78
Gregorio Rafael P. Bueta
6 Extended Producer Responsibility: Lessons for Realizing and Implementing a Circular Economy for Plastics in Asia 93
Anurodh Sachdeva and Arpit Srivastava
Part III Business Cases and Innovations for a Circular Economy
7 Circular Economy Financing: Investment Cases from Turkey 113 Emine Eda Ünal
8 The Case of Waste to Energy in Bangladesh 127 Laura Marsiliani, Sakib Amin, Tooraj Jamasb, Manuel Llorca, and Thomas I. Renström
Conclusion 145Linda Arthur

iv
TABLES AND FIGURES
TABLES1.1 Laws on Circular Economy in East and Southeast Asia 101.2 Trade Dependency Rate in ASEAN and East Asian Countries 141.3 Trade Matrix, 2019 151.4 Production, Imports, and Exports of Recovered Paper, 2019 151.5 Examples of Japanese Industrial Standards on Recycled and Remanufactured Products 172.1 Gross National Product by Economic Sector, 2017–2019 232.2 National Strategies and Programs Mentioning Circular Economy 272.3 Priority Road Map for Implementing a Circular Economy for Waste 312.4 Road Map for Integration of a Circular Economy in Economic Sectors 322.5 Road Map for Implementation of a Circular Economy at the Meso Level 333.1 Policies and Regulations Reflecting Circular Economy Principles 413.2 Major Suppliers and Buyers of Azizu and Their Waste Types and Origin 453.3 Major Suppliers and Buyers of Digital Vangariwala and Their Waste Types and Origin 473.4 Major Suppliers and Buyers of Junk Enterprise and Their Waste Types, Origin, and Business Share 493.5 Major Waste Suppliers and Buyers of Garbageman 503.6 Challenges Identified by the 3R-Oriented Private Sector Business Enterprises 515.1 National Solid Waste Management Strategy for 2012–2016 805.2 Relevant Proposed Measures in the Philippine Congress, 2010–2021 845.3 Proposed Bills in the 18th Philippine Congress, 2019–Present 856.1 Comparative Analysis between For-Profit and Not-for-Profit Producer Responsibility Organizations 956.2 Cost and Revenue Streams 986.3 Categorization of the Informal Sector 1037.1 Projects and Impacts 1217.2 Projects and Investments 1228.1 Parameters 1358.2 Electricity and Fuel Prices 1368.3 Steady-State Values 137
FIGURES2.1 Projected Population of Viet Nam to 2049 232.2 VACB model in Viet Nam 253.1 Linear vs Circular Economy 383.2 Salient Features of the Bangladesh National 3R Strategy for Waste Management 423.3 Azizu’s E-waste Recycling Activities and Scopes 443.4 Major Suppliers and Buyers of Azizu and Their Business Share 454.1 Plastic Waste Hierarchy 644.2 Managing Plastic Waste in a Circular Economy 654.3 Variations in Polymer Translucency and Color from Virgin to Post-Consumer Recycled Plastic 686.1 Case Study: Financials of a Belgian Producer Responsibility Organization 996.2 Schematic Description of the Flow of Plastics and Contract Mechanisms 1006.3 Schematic Description of the Flow of Plastic Packaging and Contract Mechanisms 1016.4 Schematic Description of Different Approaches for Informal Sector Integration 1046.5 Implementation Road Map and Way Forward 1078.1 Impulse Responses to an Oil Price Shock in the Benchmark Model 1388.2 Impulse Responses to an Oil Price Shock in the Waste-to-Energy Model 139

v
ACKNOWLEDGMENTS
This report provides an overview of circular economy principles, highlighting the challenges and opportunities for driving a sustainable recovery in developing Asia. It is published in association with the virtual conference Circular Economy in Emerging Markets: Unlocking the Potential for
Green Recovery in Developing Asia, organized as a regional side event of the World Circular Economy Forum. The conference and this report are products of a collaboration between the Asian Development Bank Institute (ADBI) team led by Linda Arthur, Derek Hondo, and Izumi Shimura, and the Finnish Innovation Fund Sitra team led by Maria Hughes and Reetta Kohonen. The conference was also made possible with the support of Tomi Särkioja, former Private Sector Development Specialist at the Asian Development Bank, who played an instrumental role in convening the group of institutions, and the Institute of Strategy and Policy on Natural Resources and Environment (ISPONRE), Viet Nam.
The editors would like to express their gratitude to Tetsushi Sonobe (Dean and CEO, ADBI), Seungju Baek (Deputy Dean, ADBI), Mika Sulkinoja (Leading Specialist, Global Collaboration, Sustainability Solutions, Sitra), Nani Pajunen (Leading Specialist, Sustainability Solutions, Sitra), Marleena Ahonen (Specialist, Circular Economy for Biodiversity, Sitra), Tuula Sjöstedt (Specialist, Communications and Public Affairs, Sitra), Tho Dinh Nguyen (President, ISPONRE), Toan The Mai (Vice President, ISPONRE), and Manh Van Lai (Director of Economic of Natural Resources and Environment, ISPONRE). Sincere appreciation also goes to Matti Tervo (Senior Specialist, Embassy of Finland, Ha Noi) for his efforts to include the participation of the Government of Finland. Finally, the editors would like to thank the authors, presenters, panelists, moderators, and discussants for their contributions to the conference and the report.
The editing and publication processes were coordinated by Adam Majoe and David R. Hendrickson (ADBI), with the support of Kae Sugawara for editing, Aileen Magparangalan for typesetting, and Patricia Wada for proofreading.

vi
CONTRIBUTORS
Sakib Amin is an associate professor at the School of Business and Economics, North South University, Dhaka, Bangladesh.
Linda Arthur is a senior specialist at the Asian Development Bank Institute, Japan.
Suborna Barua is an associate professor at the Department of International Business, University of Dhaka, Bangladesh.
Gregorio Rafael P. Bueta is a faculty member at the School of Law, Ateneo de Manila University, Philippines.
Derek Hondo is a capacity building and training coordinator at the Asian Development Bank Institute, Japan.
Maria Hughes is a global collaboration specialist at the Finnish Innovation Fund Sitra, Finland.
Tooraj Jamasb is a professor and director at the Copenhagen School of Energy Infrastructure, Department of Economics, Copenhagen Business School, Denmark.
Reetta Kohonen is a global collaboration project coordinator at the Finnish Innovation Fund Sitra, Finland.
Michikazu Kojima is a chief senior researcher at the Institute of Developing Economies, Japan External Trade Organization, Japan, and a research fellow at the Economic Research Institute for ASEAN and East Asia, Indonesia.
Nicholas Kolesch is vice president of projects at the Alliance to End Plastic Waste, Singapore.
Manh Van Lai is head of the Department of Economics of Natural resources and Environment, Institute of Strategy and Policy on Natural Resources and Environment (ISPONRE), Viet Nam.
Manuel Llorca is a postdoctoral fellow at the Copenhagen School of Energy Infrastructure, Department of Economics, Copenhagen Business School, Denmark.
Laura Marsiliani is an associate professor at Durham University Business School and a fellow at the Durham Energy Institute, United Kingdom.
Hanh Trong Nguyen is a researcher at the Department of Economics of Natural resources and Environment, ISPONRE, Viet Nam.
Tho Dinh Nguyen is president of ISPONRE, Viet Nam.
Huyen Anh Pham is a researcher at the Department of Minerals and Water Resources, ISPONRE, Viet Nam.
Thomas I. RenstrÖm is an associate professor at Durham University Business School, United Kingdom.
Anurodh Sachdeva is a German chancellor fellow at the Ecologic Institute, Germany.

vii
CONTRIBUTORS
Steve Sikra is vice president and head of Americas at the Alliance to End Plastic Waste, Singapore.
Arpit Srivastava is a German chancellor fellow at the Fraunhofer Institute for Material Flow and Logistics, Germany.
Martyn Tickner is head of project sourcing and development at the Alliance to End Plastic Waste, Singapore.
Emine Eda Ünal is an investment banking associate at the Development and Investment Bank of Turkey, Istanbul, Turkey.


1
INTRODUCTION
Derek Hondo and Linda Arthur
In recent decades, Asia and the Pacific has made significant progress in reducing extreme poverty and increasing well-being and life expectancy, among many other advancements. However, the region’s rapid economic growth and industrialization have led to degradation of its ecosystems and acceleration of climate change. According to a report released by the United Nations Environment Programme and International Resource Panel (2019), approximately half of greenhouse gas (GHG) emissions and 90% of water stress and biodiversity loss are due to the extraction and processing of natural resources. Years of linear consumption have had far-reaching negative implications for global climate, scarce natural resources, and already declining biodiversity. The global economy is highly dependent on resource extraction, making it vulnerable to unstable supply chains and continue as consumption and wealth increase together with population growth and urbanization.
Transitioning to a circular economy can build better growth and create more value with fewer materials. Three key principles underpin the concept of circular economy: 1) designing out waste and reducing pollution; 2) keeping products and materials in use by slowing flows (e.g., extending the use of products), narrowing flows (e.g., changing utilization patterns through the adoption of new business models), and creating loops to additional life cycles for products; and 3) regenerating natural ecosystems (Ellen MacArthur Foundation 2021). As well, a circular economy will be an important component in the recovery from the coronavirus disease 2019 (COVID-19) pandemic for building more resilient economies, creating new jobs, and harnessing innovations in technology.
Circular Economy Opportunities in Asia and the Pacific
Developing Asia still heavily relies on fossil fuels and raw materials for manufacturing, which continues to put stress on already fragile ecosystems. The region currently accounts for as much as 53% of global emissions, and as urbanization continues to increase, so too will pollution and GHG emissions, creating irreversible environmental impacts. A circular economy could serve as a critical component in improving resource efficiency and lowering GHGs by extending and creating additional product life-cycles, thereby reducing the extraction of virgin materials such as fossil fuels, minerals, metals, and biomass.
While a circular economy approach extends beyond solid waste management and the 3Rs (reduce, reuse, recycle), both are precursors and remain major challenges for the region. Seventeen of the world’s 50 largest landfills are located in Asia and are indicative of an entrenched linear economy that poses signifcant environmental and health risks (World Atlas 2014). Waste generation will remain a major issue as the region's population, currently comprising just over 60% of the world's share, increases from around 1.8 billion people in 2017 to an expected 3.0 billion in 2050. Current estimates indicate that the 1.2 billion tons of municipal solid waste generated in 2016 will increase to 1.5 billion tons by 2030 and 1.9 billion tons by 2050 (World Bank 2018).
Cities serve as a good starting point for a circular economy, as hubs of economic and social development. Currently, 20 of the world’s 33 megacities are located in Asia and the Pacific, and the Asian Development Bank (2021) predicts that this number will rise to 27 by 2030. The region urgently needs city-level actions and commitments for a green recovery and sustainable practices to address the environomental impacts of unsustainable consumption. Local governments must look to adopt circular economy principles through the entire value chain to achieve a decoupling of economic growth from environmental degradation.

2
INTRODUCTION
The transition to circularity also presents many economic opportunities through savings from a reduction in the extraction of virgin materials, the creation of new jobs, and the redesign of more cohesive value chains. It presents significant potential for global economic growth and could generate $4.5 trillion by 2030 (Lacy and Rutqvist 2015). By reducing the need for virgin materials, producers can obtain greater value from fewer materials through service-based business models and longer product life-cycles.
Structure of the Report
Prospects for Transitioning from a Linear to Circular Economy in Developing Asia brings together submissions from a call for policy papers conducted by the Asian Development Bank Institute and the Finnish Innovation Fund Sitra in early 2021. The report provides an introduction to circular economy and guidance for policy makers to better understand circular economy concepts, opportunities, and challenges, along with recommendations for policies to drive sustainable growth while significantly reducing material extraction and waste. It opens with an overview of regional policies and progress toward a circular economy in developing Asia. Next, authors investigate the regulatory and legal frameworks for promoting the circularity of plastics, a sector that relies heavily on the extraction of raw materials and contributes significantly to mismanaged waste and pollution. Finally, the report explores country examples of business cases and innovations for a circular economy. While these discussions cover many crucial circular economy topics, they provide only a snapshot of the potential. Further investigation is needed to better understand the different sectors, financing schemes, and other aspects of the transition to circularity.
Part I consists of three chapters that provide a background on regional circular economy policies, covering key initiatives that have led to progress. The authors utilize country-specific case studies to highlight the current challenges and opportunities.
Chapter 1 by Michikazu Kojima investigates various policies that promote a circular economy in the region and examines how the concept has progressed over the years. As direct material consumption has been rapidly increasing in Southeast Asia and East Asia, some countries have promoted a circular economy transition through recycling policies, waste separation, extended producer responsibility (EPR), and other initiatives to help curb the amount of waste generated. To continue the push toward a circular economy, it is imperative that countries throughout the region harmonize policies, improve regional collaboration, and strengthen regulations on the transboundary movement of recyclable waste and extraction of raw materials.
Chapter 2 by Tho Dinh Nguyen, Manh Van Lai, Huyen Anh Pham, and Hanh Trong Nguyen discusses the adoption of a circular economy in Viet Nam, including the challenges and opportunities moving forward. In previous decades, the country's traditional farming models would directly apply circular economy principles based on natural cycles. Each output was recycled back into the system and served as an input, ultimately minimizing the amount of waste produced. Recently, the Government of Viet Nam has been working on developing circular economy initiatives, mainly policies aimed at achieving green and sustainable growth; strengthening natural resource management; reinforcing environmental protection in response to climate change; and increasing the recycling and reuse of waste. Following this, the Law on Environmental Protection 2020 institutionalized new mechanisms and policies to promote a circular economy. The chapter proposes a road map to a circular economy built on the analysis of the so-called DPSIR (driver, pressure, state, impact, response) framework to assess the effectiveness of such policies.

3
INTRODUCTION
Chapter 3 by Suborna Barua investigates the case of Bangladesh, a country with one of the fastest-growing emerging economies globally. Encouraging circular economy models is critical for emerging economies since their economic growth has relied heavily on the extraction of national resources. Barua examines the challenges private firms face in adopting circular principles, particularly at the policy level, in order to help countries design more appropriate measures to promote a circular economy. The chapter also evaluates and explores the existing gaps between the available government frameworks that support circularity and the reality of circular economy practices in the private sector.
Part II consists of three chapters that explore the regulatory and legal frameworks for plastics. The unsustainable use and consumption of plastics have placed enormous stress on natural ecosystems. As well, the production of plastics heavily relies on fossil fuels and contributes to climate change.
Chapter 4 by Nicholas Kolesch, Steve Sikra, and Martyn Tickner highlights practical strategies to address the key challenges undermining a global circular economy for plastics. The authors, all from the Alliance to End Plastic Waste, identify six “circularity gaps” that must be addressed to achieve a circular economy for plastics on a global scale: quantity, quality, design, affordability, data, and alignment. The chapter delves deep into each of the gaps by examining case studies from across the globe on issues such as the lack of waste management infrastructure, appropriate business models for consumer convenience, and the lack of technical solutions and standards for replacing virgin materials. The authors identify practical approaches needed to fill the gaps. The chapter concludes with strategic and actionable recommendations that key stakeholders, including policy makers, investors, communities, industry, and nongovernment organizations, can adopt to shift toward a global circular economy for plastics.
Plastics originating from rivers in the Philippines significantly contribute to the global plastic problem. Annually, the Philippines generates 2.7 million tons of plastic waste, with an estimated 20% of it ending up in the ocean, making it one of the world’s major plastic polluters (World Bank Group 2021). Chapter 5 by Gregorio Rafael P. Bueta discusses circular economy policy initiatives in the Philippines to address the waste management the country has grappled with for years. He examines the country’s current legal framework by analyzing various policies, such as those on the regulation of plastics and EPR schemes implemented within the last decade. He emphasizes that a shift toward circular economy cannot be undertaken solely by the government but rather requires a whole-of-society approach. The chapter concludes with policy recommendations for the Philippines and other emerging economies struggling to tackle waste management issues and mitigate the impacts of climate change.
Chapter 6 by Anurodh Sachdeva and Arpit Srivastava presents policy recommendations for realizing and implementing a circular economy for plastics and explores the role of EPR. Based on the “polluter pays principle,” governments can internalize the cost of environmental externalities by holding the companies that produce the goods accountable and responsible for paying for the management of their products’ life cycles until their end of life (Organisation for Economic Co-operation and Development 2016). EPR has the potential to support the transition to a circular economy, but policies must meet the needs of society, taking into consideration local, geographical, economical, and cultural characteristics. Additionally, the authors recommend that since the informal sector plays a large role in managing plastic and other waste in developing countries, a huge opportunity presents itself to accelerate the formalization of this sector through the implementation of EPR policies. Finally, the chapter explores specific programs to ensure effective monitoring and compliance of EPR, such as producer responsibility organizations, public online packaging registries, and financing mechanisms.

4
INTRODUCTION
Part III covers business cases and innovations for a circular economy. Two country examples showcase opportunities for financing and capitalizing on the outputs of transitioning to a circular economy.
Chapter 7 by Emine Eda Ünal examines investment cases from Turkey and explains how these lessons can be applied to developing Asia. The Government of Turkey has made great progress in embracing circular economy principles as a top priority and making efforts to collaborate with the private sector and civil society in doing so. However, this transition bears a financial cost, which developing countries across the globe need to plan for. The chapter presents case studies from Turkey that highlight the fiscal challenges for implementing a circular economy, their solutions, and ways to maintain successful initiatives. The author analyzes credit allocation processes and investments serving the circular economy transition, funded by the Development and Investment Bank of Turkey. From waste management to energy efficiency, the cases present the funding decisions, project implementation, and projected environmental impacts. Multilateral development banks and other financial institutions should prioritize sustainable and circular economy projects and provide incentive schemes and credit lines for companies to promote sustainable development.
Chapter 8 by Sakib Amin, Tooraj Jamasb, Manuel Llorca, Laura Marsiliani, and Thomas I. RenstrÖm discusses the potential for a circular economy to generate electricity and alleviate the burden from the energy sector, one of the largest contributors to GHG emissions. Through waste to energy (WTE), the authors explain how the installation of a largescale WTE power plant in Dhaka, Bangladesh, has the potential to generate electricity from organic waste. They develop a WTE-augmented dynamic stochastic general equilibrium, or DSGE, model to show that the power plant has the potential to increase overall production, consumption, and gross domestic product in Bangladesh. However, their model shows that WTE has its challenges since the absolute amount of carbon dioxide emissions will increase as WTE displaces natural gas-based electricity generation due to the distortions caused by regulated electricity prices. The authors note that policies must remove existing price distortions and adopt anaerobic digestion-based WTE in order to shift toward a greener, more sustainable future.
Although the term circular economy may not be widely familiar to many policy makers, its principles have long been woven into the informal sector in many societies across the world. With growing understanding that the overconsumption of natural resources is a major driver of the current climate crisis and loss of biodiversity, circular economy principles have been gaining traction in national strategies as countries scramble to find innovative ways to meet the global net zero target. In light of this, it has become evident that a circular economy plays a role in achieving the SDGs. Finally, by shifting the way in which we make, use, and dispose of products and food, our actions can play a huge role in helping to restore natural ecosystems and eliminate waste.
This report provides an overview of the circular economy and includes crucial discussions on regulatory and legal frameworks, regional and country policies, opportunities for the private sector, financing schemes, and innovative models that could help the transition from a linear to circular economy. The report will help guide governments in designing effective policies to support the transition to a circular economy. Although the core elements of a circular economy are clear, innovation in resource efficiency and design is ever evolving. As new research is conducted and more data collected, a better understanding is emerging of what works, what does not, and how to tailor policies to meet the specific needs of countries and regions.

5
INTRODUCTION
ReferencesAsian Development Bank. 2021. 100 Climate Actions from Cities in Asia and the Pacific. Manila.
Ellen MacArthur Foundation. 2021. Circular Economy Introduction. https://ellenmacarthurfoundation .org/topics/circular-economy-introduction/overview (accessed 30 November 2021).
Lacy, P., and J. Rutqvist. 2015. Waste to Wealth: The Circular Economy Advantage. New York/London: Palgrave Macmillan.
Organisation for Economic Co-operation and Development. 2016. Extended Producer Responsibility: Updated Guidance for Efficient Waste Management. Paris.
Ritchie, H., and M. Roser. 2020. CO2 and Greenhouse Gas Emissions. Our World In Data. https ://ourworldindata.org/co2-and-other-greenhouse-gas-emissions
United Nations Environment Programme and International Resource Panel. 2019. Global Resources Outlook 2019: Natural Resources for the Future We Want. Nairobi: United Nations Environment Programme.
World Atlas. 2014. Waste Atlas: The World’s 50 Biggest Dumpsites 2014 Report. D-Waste. https://www .nswai.org/docs/World’s Fifty biggest dumpsites,Waste Atlas 2014.pdf (accessed 1 October 2021).
World Bank. 2018. What a Waste 2.0: A Global Snapshot of Solid Waste Management to 2050. Washington, DC.
World Bank Group. 2021. Market Study for the Philippines: Plastics Circularity Opportunities and Barriers. Washington, DC. https://openknowledge.worldbank.org/handle/10986/35295


PART I
Regional and Country Policies for a Circular
Economy


9
CHAPTER 1
Toward a Regional Circular Economy Policy for East Asia and the Association of Southeast Asian NationsMichikazu Kojima
1.1 IntroductionResource consumption in Asia is expanding rapidly. According to the International Resource Panel (2017), the per capita material footprint in the Asia and Pacific region (excluding Central and West Asia) was estimated to reach 11.4 tons in 2017, up from 4.8 tons in 1990. This is less than 40% of the per capita footprint in North America and about 50% of that in the European Union (EU). However, due to its large population, the Asia and Pacific region accounts for half of the world’s material footprint. To mitigate resource depletion and environmental problems, it is necessary to promote the effective use of resources in the Asian region by promoting a circular economy.
Circular economy has been defined in various ways. Kirchherr, Reike, and Hekkert (2017) gathered 114 definitions and found that circular economy was most frequently depicted as a combination of reduction, reuse, and recycling activities. The Circular Economy Promotion Law of the People’s Republic of China (PRC), enacted in 2008, defines circular economy as “a generic term describing the activities of decrement, recycling and resource recovery in production, circulation and consumption.” Similarly, the European Parliamentary Research Service defined circular economy as “[a]n economic model based inter alia on sharing, leasing, reuse, repair, refurbishment and recycling in an (almost) closed loop, which aims to retain the highest utility and value of products, components and materials at all times.” Likewise, Japan enacted in 2002 the Basic Act on Establishing a Sound Material-Cycle Society, which also emphasized reduction, reuse, and recycling.
The Chinese and Japanese laws both emphasize the importance of upstream actions. For example, Article 19 of the Circular Economy Promotion Law states that
“Any entity or individual engaging in the design of process, equipment, product and packing material shall, in accordance with the requirements of reducing resource consumption and waste generation, give priority in choosing designs and materials that are easy to be recovered, dismantled and degraded, nontoxic and harmless or with low toxic or harm, in addition to complying to the mandatory requirements as prescribed in relevant state standards.”
Although some countries in Asia promote a circular economy, material consumption in the Asian region has increased more rapidly than in other regions. From 1970 to 2017, direct material consumption (DMC) in East and Southeast Asia grew 1.2% annually, while DMC in Europe and North America grew 0.6% and 0.5%, respectively. As a result, East and Southeast Asia account for almost 23.4% of global DMC in 2017, a significant increase from their 7.9% global DMC contribution in 1970 (International Resource Panel 2019).
East Asian countries have adopted some circular economic policies, such as applying extended producer responsibility (EPR) since the 1990s. From 2000, Southeast Asian economies have also gradually adopted circular economy policies (Table 1.1).

10
PROSPECTS FOR TRANSITIONING FROM A LINEAR TO CIRCULAR ECONOMY IN DEVELOPING ASIA
Table 1.1: Laws on Circular Economy in East and Southeast Asia
Economy Law Year Major Content for Circular EconomyJapan Act on the Promotion of Effective
Utilization of Resources1991 Labeling for recycling. Encourage voluntary
initiative by industry. Revised in 2000. Law for Promotion of Sorted Collection and Recycling of Containers and Packaging
1997 Applying EPR to glass containers, plastic packages and containers, and paper cartons and packages.
Law for the Recycling of Specified Kinds of Home Appliances
1998 Applying EPR to televisions, air-conditioners, refrigerators, and washing machines.
Basic Act on Establishing a Sound Material-Cycle Society
2000 Basic act for promoting 3R (reduce, reuse, and recycle).
Construction Material Recycling Law 2000 Contractors are required to sort out and recycle waste generated in demolition work of buildings.
Act on Promotion of Procurement of Eco-Friendly Goods and Services by the State and Other Entities
2000 Require governments and incorporated administrative agencies to procure eco-friendly products including recycled goods.
Law for Promotion of Recycling and Related Activities for Treatment of Cyclical Food Resources
2002 Big generators of food waste should make efforts to reduce and recycle food waste.
Law for the Recycling of End-of-Life Vehicles
2002 Applying EPR to end-of-life vehicles.
Act on Promotion of Recycling of Small Waste Electrical and Electronic Equipment
2012 Promote recycling of small waste electrical and electronic equipment, such as mobile phones, radios, digital cameras, personal computers, and printers.
Korea, Rep. of Waste Control Act 1991revised
Waste deposit-refund system: A deposit is levied on products sold; refunded based on the amounts of products recycled.
Act on the Promotion of Saving and Recycling of Resources
1992 Ban on free supply of single-use products. Waste deposit-refund system.
2000 Applying EPR to packages.Construction Waste Recycling Promotion Act
2003 Responsibilities of stakeholders on construction waste are identified.
Act for Resource Recycling of Electrical and Electronic Equipment and Vehicles
2007 Integrated management to increase recycling rate.
Taipei,China Waste Disposal Act Revised in 1988
Producer responsibilities were mentioned. EPR was implemented effectively in 1998, when the Recycling Fund Management Board was established.
Philippines Ecological Solid Waste Management Act
2001 Material recovery facility, labeling.
continued on next page

11
TOWARD A REGIONAL CIRCULAR ECONOMY POLICY FOR EAST ASIA AND THE ASSOCIATION OF SOUTHEAST ASIAN NATIONS
Table 1.1 continued
Economy Law Year Major Content for Circular EconomyChina, People’s Rep. of
Provisional Management Measures on Packaging Resources
1999 Identify recovery channels, principles for sorting, and requirements for treating packaging materials.
Management Rules of End-of-Life Vehicles Take-Back
2001 Qualification of end-of-life vehicles recycling company. Prohibit reuse of five assemblies (engine, steering, transmission, front and rear axles, and frame).
Interim Measures for Administration of Automotive Parts Remanufacturing
2008 Specify the model companies for remanufacturing.
Circular Economy Promotion Law 2008 Basic law.Regulation on the Administration of Recovery and Disposal of Waste and Discarded Electrical and Electronic Products
2009 Collecting recycling fee from producers of electrical and electronic products, and distributing the funds to recycling companies to cover the cost of recycling.
Viet Nam Prime Minister Decision on Recall and Treatment of Discarded Product
2015 Applying EPR to some e-wastes, tire, and batteries from July 2016, and vehicles from January 2018.
Environmental Protection Law Revised in 2020
EPR is applied to food and beverage, electrical goods, tires, batteries, lubricants, and vehicles sectors.
Singapore Resource Sustainability Act 2019 Applying EPR to e-waste, packages, and containers.
Zero Waste Master Plan 2019 Priority waste stream: food waste, e-waste, and packaging.
Indonesia Regulation of the Minister of Environment and Forestry Regarding Road Map to Waste Reduction by Producers
2019 Require producers to make a plan and report to reduce packaging and containers.
EPR = extended producer responsibility.
Sources: Compiled by the author, based on the Ecolex database (https://www.ecolex.org/) and website of each government.
Although individual countries work to achieve a circular economy, the regional initiative has been limited. There are some forums related to the circular economy, such as (i) Regional 3R and Circular Economy Forum in Asia and the Pacific1 and (ii) Asian Network for Prevention of Illegal Transboundary Movement of Hazardous Wastes. These initiatives are a platform to share good practices in the region. However, there is no formal platform to harmonize policies, regulations, or standards, to facilitate a regional circular economy.
This chapter reviews some circular economy policies in East and Southeast Asia and discusses the necessity of regional policies, especially on recycling and remanufacturing, in the context of East and Southeast Asian countries and regions where economic integration has deepened.2 In addition, some policy measures that facilitate a circular economy in East and Southeast Asia are identified.
1 3R stands for reduce, reuse, and recycle.2 Reduce and share are other pillars of a circular economy, but neither are heavily dependent on international trade. Regional
policy or coordination of policies among Asian countries may not be important.

12
PROSPECTS FOR TRANSITIONING FROM A LINEAR TO CIRCULAR ECONOMY IN DEVELOPING ASIA
1.2 Diffusion of Circular Economy Policies in East and Southeast Asia
1.2.1 Policies with Upstream and Downstream Focus
In Japan, the importance of recycling was recognized in the early 1970s, when resource prices rose due to the oil crisis. At that time, new waste streams, such as plastic wastes, waste aluminum cans, and e-wastes, became a burden of waste management of the local governments. The (then) Ministry of International Trade and Industry identified these types of wastes and supported research and development (R&D) of recycling technologies. In the mid-1970s, some local governments started collecting recyclable waste.
It was in 1991, however, that Japan formulated a national regulation to facilitate recycling—namely, the Act on the Promotion of Effective Utilization of Recycled Resources. The act specified products that should be recycled. It also specified which products should declare their material components, to make it easier to separate waste. The regulation also encourages industries to implement design for recycling, reduce the cost of recycling, and improve recyclability. Various recycling laws, such as on packaging and containers, home appliances, construction waste, food waste, and end-of-life vehicles (ELVs), have been enacted since 1995. Additionally, the Basic Act on Establishing a Sound Material-Cycle Society, enacted in 2000, presents the overarching framework of a circular economy society.
The Republic of Korea enacted recycling-related laws and regulations in the early 1990s. The Waste Control Act, revised in 1991, introduced the country’s waste deposit system in which producers deposit money with the government and receive a refund of the deposit if wastes are collected and recycled. The deposited amount is proportional to the volume of sales, while the refund is proportional to the recycled amount. In 1992, the Act on the Promotion of Saving and Recycling of Resources was enacted. The waste deposit system was managed under this new act, on top of regulating the use of various single-use products. For example, hotels were encouraged not to provide a free supply of toothbrushes.
Taipei,China revised its Waste Disposal Act in 1988, in which producer responsibility was identified. The act was then revised in 1997 to put financial responsibility on producers, such as paying recycling fees to the government. The Recycling Fund Management Board, which the government manages, then disburses the collected fees to recycling companies.
The PRC has made various efforts to improve resource efficiency since the 1960s under the so-called Comprehensive Utilization of Resources. In 1999, the Provisional Management Measures on Packaging Resources were issued. A year later, the PRC started efforts to enact some regulations to promote recycling. In 2001, the Management Rules of End-of-Life Vehicles Take-Back were issued, making qualification necessary for ELV recycling companies. In 2008, the PRC enacted the Circular Economy Promotion Law, which is fundamental to promoting a circular economy in the country. Remanufacturing was also promoted by certifying model companies and by publishing a list of remanufactured products. Then, the Regulation on the Administration of Recovery and Disposal of Waste and Discarded Electrical and Electronic Products was enacted in 2009. It regulates government-subsidized e-waste recycling companies, while the government collects recycling fees from the producers.
Following East Asian countries, Southeast Asian countries gradually started to adopt circular economy policies in 2001. The Philippines enacted the Ecological Solid Waste Management Act in 2001, which mandates local governments to establish a materials recovery facility (MRF) for each barangay or

13
TOWARD A REGIONAL CIRCULAR ECONOMY POLICY FOR EAST ASIA AND THE ASSOCIATION OF SOUTHEAST ASIAN NATIONS
cluster of barangays.3 Simultaneously, the act also has articles on eco-labeling and prohibiting non-environmentally acceptable products. Viet Nam has tried to implement EPR on waste oil, e-waste, and other wastes since 2015, while Indonesia has tried to put the responsibility on producers to reduce packaging and container waste since 2019. Similarly, Singapore issued legislation applying EPR to e-waste in 2019, which was fully enforced in 2021.
1.3 Policies to Stimulate DemandSome East and Southeast Asian countries have made efforts expanding the market for manufactured goods produced from recyclable waste. Furthermore, countries have tried reducing waste by introducing ecolabels and green procurement programs. For example, the Government of Japan supported the initiation of the “eco-mark” program, which was established in 1989. In 2001, mandatory green public procurement commenced. The regulation stemmed from what is known as the Act on Promotion of Procurement of Eco-Friendly Goods and Services by the State and Other Entities, introduced in 2000, which requires central and local governments and incorporated administrative agencies to endeavor in selecting eco-friendly products.
In Malaysia, the government-owned industrial research and technology organization SIRIM has specified various eco-labeling standards including for recycled paper, recycled rubber products, and recycled plastic products.4 Green public procurement is mandatory in Malaysia.5
Other countries in East and Southeast Asia, including Brunei Darussalam, the PRC, Indonesia, the Republic of Korea, the Lao People’s Democratic Republic (Lao PDR), the Philippines, Thailand, Singapore, and Viet Nam, have also introduced eco-labeling programs.
In addition, some countries have developed industrial standards for recycled products because products using recycled materials may not meet the industrial standards compared to products manufactured from virgin resources. In the case of Japan, the Environmental JIS Development Action Program was initiated in 2002 to facilitate the development of various standards of recycled products, such as products containing recyclable materials, labeling and classification for recycled products, and testing methods (Ministry of Economy, Trade and Industry 2002). Such standards are complementary to various regulations.
1.4 Necessity of Regional Circular Economy Policy for ASEAN and East Asia
As mentioned in the previous section, although they have different priorities, many countries in East and Southeast Asia have adopted circular economy policies. These regulations aim to create a circular economy within the country, while, coincidentally, various supply chains of products have been developed beyond national borders in Asia. Hence, to accommodate aspects beyond the border, circular economy policies should consider the deepening of economic integration in the region.
3 A barangay is a small territorial and administrative district, which is the most local level of government in the Philippines. 4 See web page of the eco-labeling scheme at https://www.sirim-qas.com.my/our-services/product-certification/eco
-labelling-scheme/.5 The guideline for green public procurement refers to SIRIM eco-labeling. See web page of the green public procurement
program at https://www.myhijau.my/green-procurement/.

14
PROSPECTS FOR TRANSITIONING FROM A LINEAR TO CIRCULAR ECONOMY IN DEVELOPING ASIA
1.4.1 Deepening Economic Integration
The trade dependency rate (ratio of the sum of export and import of goods and services to gross domestic product) is an indicator of the ease to formulate a circular economy within the country. High trade dependency rates indicate that various industries are not located in the country. Such countries may have difficulties in creating a circular economy because the recycling supply chain might not reside within the country.
The trade dependency rate of Singapore, Viet Nam, Cambodia, Malaysia, Thailand, and Brunei Darussalam exceeded 100% in 2018. Specifically, the rates of Singapore and Viet Nam were 319.1% and 210.4%, respectively. On the other hand, countries with large populations and industries, such as the PRC, Japan, and Indonesia, have lower trade dependency rates of less than 40% (Table 1.2).
Table 1.2: Trade Dependency Rate in ASEAN and East Asian Countries
Exports of Goods and Services in GDP
(%)
Imports of Goods and Services in GDP
(%)
Share of Exports and Imports in GDP
(%)China, People’s Rep. of 18.5 17.3 35.8Japan (2018) 18.5 18.3 36.8Indonesia 18.4 18.9 37.3Myanmar (2018) 30.4 30.3 60.7Philippines 28.3 40.3 68.6Lao People’s Democratic Republic (2016) 33.2 41.9 75.1Korea, Rep. of 39.9 37.0 76.9Brunei Darussalam 57.9 50.6 108.5Thailand 59.8 50.6 110.4Malaysia 65.2 57.8 123.0Cambodia 61.1 62.5 123.6Viet Nam 106.8 103.6 210.4Singapore 173.5 145.6 319.1
GDP = gross domestic product.
Source: Compiled by the author, based on World Development Indicators data (https://databank.worldbank.org/source/world -development-indicators, accessed 18 May 2021).
The Association of Southeast Asian Nations (ASEAN) and East Asia are economically integrated. The share of intra-regional imports in ASEAN and East Asia is 47.0% of total imports. Meanwhile, the share of intra-regional exports is 39.9% of total exports of these regions. To promote a circular economy in ASEAN and East Asia, it is important to have a regional initiative to formulate and coordinate circular economy policy, including the control of the negative impact of international trade of recyclable waste.
The intra-regional import and export shares in ASEAN and East Asia (47.0% of imports and 39.9% of exports) are lower than in the EU (64.2% of imports and 50.1% of exports). ASEAN and East Asian countries are similar in terms of imports to the United States, Canada, and Mexico where they possess a 39.0% share in imports, while the North American countries’ exports are similar to the EU with a 50.1% share (Table 1.3).

15
TOWARD A REGIONAL CIRCULAR ECONOMY POLICY FOR EAST ASIA AND THE ASSOCIATION OF SOUTHEAST ASIAN NATIONS
Table 1.3: Trade Matrix, 2019 ($ million)
Importing/ Exporting World NAFTA EU
ASEAN and East Asia* ASEAN
World 18,684,769 3,274,201 6,213,312 4,585,125 1,407,003NAFTA 2,547,920 1,277,155 394,838 411,581 93,076EU 6,283,415 596,745 3,988,837 518,681 108,440ASEAN and East Asia* 5,398,618 985,463 735,219 2,154,547 942,728ASEAN 1,346,768 183,827 145,886 713,118 329,580
ASEAN = Association of Southeast Asian Nations, EU = European Union, NAFTA = North American Free Trade Agreement.
Notes: The table is based on the trade statistics of 48 countries, as of May 2020.
* ASEAN and East Asia consists of the ASEAN 10 member states, the People’s Republic of China, Japan, the Republic of Korea, and Taipei,China.
Source: Compiled by the author, based on JETRO (2019).
Table 1.4: Production, Imports, and Exports of Recovered Paper, 2019 (’000 tons)
Recovered Paper Production
Recovered Paper Imports
Recovered Paper Exports
Brunei Darussalam 13 6Cambodia 20 4China, People’s Rep. of 53,547 10,363 1Indonesia 3,233 2,988 23Japan 19,609 47 3,141Korea, Rep. of 8,162 1,462 392Lao People’s Democratic Republic 216 152 15Malaysia 1,200 566 6Myanmar 484 66 7Philippines 855 120 73Singapore 8,162 62 452Thailand 2,909 1,643 106Viet Nam 120 2,795 2
Source: Food and Agriculture Organization of the United Nations (2021).
1.4.2 Wastepaper Recycling and International Trade
Small countries in Southeast Asia face challenges in recycling some recyclable wastes in their country. For example, Brunei Darussalam, Cambodia, and Singapore were net exporters of wastepaper in 2019 (Table 1.4).

16
PROSPECTS FOR TRANSITIONING FROM A LINEAR TO CIRCULAR ECONOMY IN DEVELOPING ASIA
Japan was a net importer of wastepaper until the 1990s. However, Japan has turned its track, becoming a net exporter of wastepaper since 2000. One of the reasons might be the dramatic increase of wastepaper imports by the PRC from 1.7 million tons in 1997 to 6.4 million tons in 2001. Demand for paper increased in the 1990s and 2000s in the PRC because of the high rate of paper consumption at the time, including the demand for carton box packaging to be used for export. Although the export of wastepaper increased, Japan concurrently still produced a lot of recycled paper in the country. In recent years, the PRC has reduced its import quota of wastepaper.
The Lao PDR was a net exporter of wastepaper until 2018 but became a net importer of wastepaper in 2019. The country did not export pulp in 2017 but exported 386,000 tons of pulp in 2018 and 471,000 tons in 2019, which might be produced from wastepaper. Most of the pulp produced in the Lao PDR is destined for the PRC.
The PRC also increased pulp import not only from the Lao PDR but also from other countries. In particular, import of pulps of fibers derived from recovered (waste and scrap) paper, paperboard, or other fibrous cellulosic materials increased from 72,000 tons in 2017 to 375,000 tons in 2018 and 994,000 tons in 2019.
There are economies of scale involved in the pulp and paper industries (Lundmark 2002). Therefore, it would be difficult for small countries to have big enough paper recycling plants, where the amount of wastepaper generated is limited.
1.4.3 Remanufacturing and International Trade
Manufacturers of mining equipment, such as Caterpillar and Komatsu, have remanufacturing centers. Cores, worn parts of the heavy equipment used in the mining industry, are sent to remanufacturing centers beyond the border. The centers have various equipment for grading cores, disassembly, component processing, reassembly, and testing. Other goods, such as used data center equipment, copy machines, and tires are internationally traded and remanufactured (Kojima 2017). Some countries prohibit the import of second hand goods such as used tires. Such import restrictions may affect the remanufacturing industries, which need enough cores to function.
1.5 Measures of Regional Circular Economy Policy for ASEAN and East Asia
There are some key regional circular economy policies that can be utilized in ASEAN and East Asian countries.
1.5.1 Promoting and Harmonizing Design for Recycling
Product design affects recycling costs. An example is the polyethylene terephthalate or PET bottle. A transparent PET bottle scrap is more valuable than a colored PET bottle because color removal is costly. Additionally, a transparent PET bottle can be dyed. As a result, the price of a discarded colored PET bottle is 10%–50% of a discarded transparent PET bottle. If colored bottles are mixed with transparent ones, recyclers require additional processing to separate the colored bottles from transparent ones.

17
TOWARD A REGIONAL CIRCULAR ECONOMY POLICY FOR EAST ASIA AND THE ASSOCIATION OF SOUTHEAST ASIAN NATIONS
In addition, if the specific gravity of the label materials is less than 1, it is easy to separate the bottle and its label in the washing process; the specific gravity of PET is around 1.35–1.39. If polyvinyl chloride or PVC is used for labels, PVC and PET are not separated in the washing process.
In the case of Japan, the Council for PET Bottle Recycling, an association of industries using PET bottles, issued voluntary design guidelines that specify the design of PET bottles for easy recycling. The first guideline was developed in 1992 and revised several times (Council for PET Bottle Recycling 2016).
To facilitate the recycling of plastics in the region, region-wide standards or guidelines for recycling should be harmonized.
1.5.2 Harmonizing Industrial Standards of Recycled Products
Regional policy setting the industrial standard of recycled and remanufactured products ensures the quality of recycled products. Products made from recycled materials may lack quality compared to the standard for products made from virgin resources. Remanufactured goods also may not be able to satisfy the conventional standards.
Some industrial standards for recycled and remanufactured goods, such as particleboard and retread tires, have been developed in Japan since the 1950s. Further, under the Environmental JIS Program, new industrial standards related to recycling have been developed since 2002 (Table 1.5).
If the industrial standards within the region are different, producers bear the additional cost to satisfy different standards across countries. Harmonization of industrial standards for recycled products is crucial to reduce the cost to fulfill various industrial standards in the region.
Table 1.5: Examples of Japanese Industrial Standards on Recycled and Remanufactured Products
Code Established ProductA5021 2011 Recycled aggregate for concrete: Class HA5022 2011 Recycled concrete using recycled aggregate: Class MA5031 2006 Melt-solidified slag aggregate for concrete derived from municipal solid waste
and sewage sludgeA5731 2002 Recycled plastics inspection chambers and covers for rainwater A5741 2012 Wood-plastic recycled compositeA9401 2007 Recycled plastics medial strip blockA9402 2007 Recycled plastics buffers for parkingK9797 2006 Unplasticized poly (vinyl chloride) (PVC-U) three-layer pipes with recycled solid coreK9798 2006 Unplasticized poly (vinyl chloride) (PVC-U) three-layer pipes with recycled foamed coreR5214 2002 Eco-cementZ7313 2019 Glass foam recycle materials
Source: Website of Japanese Standards Association (https://webdesk.jsa.or.jp/).

18
PROSPECTS FOR TRANSITIONING FROM A LINEAR TO CIRCULAR ECONOMY IN DEVELOPING ASIA
1.5.3 Trade Restriction on Recyclable Waste
The region needs trade regulations on recyclable waste and cores for remanufactured goods. At the end of 2017, the PRC tightened import restrictions on recycled wastes to reduce the import of contaminated waste and pollution generated from the recycling of imported waste. Instead of the PRC, some parts of trade plastic waste were destined for Thailand, Malaysia, Viet Nam, and Indonesia. These countries have now also tightened their plastic waste import regulations. However, stricter import restrictions mean forcing some producers to stop their voluntary recycling programs (Kojima 2020).
It is indisputable that the international trade of recyclable waste causing environmental pollution in developing countries should be controlled (Basel Action Network 2002). After the PRC banned recyclable waste, Southeast Asian countries suffered from improper import of recyclable waste and pollution from the recycling of imported waste (Global Alliance for Incinerator Alternatives 2019).
Conversely, it is difficult to achieve a high recycling rate without international trade of recyclable waste or recycled materials, under the current global supply chain of various products. Moreover, small countries may not be able to formulate a circular economy within the country.
In the case of plastic waste, segregated and washed plastic waste should be freely traded. International trade of plastic waste with contamination, however, should be controlled with prior notice and a consent mechanism set by the Basel Convention. If it is difficult to enforce pollution control regulation nationwide, governments can allow factories solely located in a bounded area, such as an industrial park, to import recyclable waste. It fulfills a quality standard of imported recyclable waste, similar to the policies that had been applied in the PRC.
1.5.4 Trade Restrictions on Cores for Remanufacturing
Trade restrictions on second hand goods may apply to remanufactured products and cores for remanufactured products. Although prohibiting the putting up of substandard parts in developing country markets could be justified, the trade restriction on cores should not be too strict, because such regulation hampers the remanufacturing business.
Since economic integration has been deepened in ASEAN and East Asia, regional circular economy policy should be formulated to cover the abovementioned areas, especially design for recycling, standards for recycled products, and trade restrictions on recyclable waste. At the same time, governing bodies also need to ensure that the regulation on restricting second hand goods should not apply to cores for remanufacturing.
1.6 Formulation of Regional Circular Economy PolicyIn Asia, some forums exist for countries to share among each other their efforts and lessons on circular economy, such as the Regional 3R Forum, which was established in 2009 and later renamed the Regional 3R and Circular Economy Forum in Asia and the Pacific in 2020. Government officers, experts, industry representatives, and nongovernment organizations have participated in the event and shared good practices in the region. The forum has been jointly organized by the United Nations Centre for Regional Development, the Government of Japan, and a host country.
The Asian Network for Prevention of Illegal Transboundary Movement of Hazardous Wastes is another platform for government officers in charge of the Basel Convention to share their efforts to regulate the import and export of hazardous and other waste. The network was established in 2003, with the

19
TOWARD A REGIONAL CIRCULAR ECONOMY POLICY FOR EAST ASIA AND THE ASSOCIATION OF SOUTHEAST ASIAN NATIONS
support of the Japanese government. Almost every year, a workshop has been organized in a country in the region. Participants share experiences about revising and implementing their regulations. Furthermore, they visit recycling facilities in the host country to learn technologies and management. However, there is no formal body to negotiate harmonized policies, regulations, and standards for a circular economy in the region.
To formulate regional policies, it is necessary to create a platform. The benefit can be seen from examples in Europe and North America, where they can conduct international negotiations and implement mechanisms to promote a circular economy in their respective regions.
In the EU, the European Commission, European Parliament, and European Council take on roles to develop regulations and directives, which are adopted by members. For example, the EU Directive on the Reduction of the Impact of Certain Plastic Products on the Environment mandated member states to regulate single-use plastics. The EU also launched the Green Deal in 2019, which is its policy framework to achieve climate neutrality. The program also includes actions to improve resource efficiency and promote a circular economy.
The EU has in place a system to formulate such regulations, as well as an organization to strengthen enforcement capacity. An international non profit organization called the European Union Network for the Implementation and Enforcement of Environmental Law (IMPEL) conducted various capacity development programs for better enforcement of environmental law, including laws on transboundary movement of waste. The organization comprises countries that are current members of the EU or may become members in the future. Through this network, countries that have already joined the EU and have high enforcement capabilities, such as Germany, the Netherlands, the United Kingdom, and Sweden, have supported the capacity building of new member states (Kojima and Yoshida 2005).
In North America, the Commission for Environmental Cooperation, established in 1994, based on the North American Agreement on Environmental Cooperation, continues some activities to work on environmentally sound management of waste, under the United States-Mexico-Canada Agreement. The commission has created training materials for recycling and refurbishing e-waste and developed the tools for tracking the transboundary movement of hazardous waste. In addition, the board also published reports on the tracked transboundary movement of the harmful waste and created a common policy to manage lead-acid battery recycling (Commission for Environmental Cooperation 2013, 2016).
Currently, ASEAN and East Asia do not have such a commission or organization to formulate regional regulations. Nevertheless, it is necessary and feasible to establish a platform for discussing the harmonization of industrial standards of recycled goods, formulating regional guidelines to design containers that would be easier for recycling, identifying pathways for developing supply chains of recycled products in the region, and coordinating the capacity development program of enforcement officers.
1.7 Conclusion and Policy RecommendationsEconomic integration has been observed between East and Southeast Asian countries. The supply chains of various goods have been formulated beyond borders. In addition, various countries in the region have developed circular economy policies, such as applying EPR and eco-labeling programs.
To further facilitate circular economy development in this region, we need to harmonize policies, such as design for recycling and industrial standards of recycled products, and to improve the management

20
PROSPECTS FOR TRANSITIONING FROM A LINEAR TO CIRCULAR ECONOMY IN DEVELOPING ASIA
of the transboundary movement of recyclable waste and cores for remanufacturing. ASEAN and East Asian countries must discuss the regional cooperation on circular economy policy.
There are a few opportunities to share the efforts of each country among ASEAN and East Asian countries regarding recycling and circular economies, such as the Regional 3R and Circular Forum in Asia and the Pacific. In addition, regarding international trade of hazardous waste, the Asian Network for Prevention of Illegal Transboundary Movement of Hazardous Wastes provides opportunities for government officers to share their good practices in the region. However, these platforms are basically to share good practices in the region, not to harmonize policy. Thus, it is time to create a new platform to formulate regional circular economy policies in ASEAN and East Asia, where economic integration has been deepened. Just as important is to develop the capacity to enforce pollution control of recycling industries and quality control of international trade of recyclable waste.
While various good practices should be shared in the aforementioned platforms, discussion to formulate regional circular economy policies should start in the ASEAN+3 grouping (ASEAN, plus the PRC, Japan, and the Republic of Korea) or another platform such as the Regional Comprehensive Economic Partnership.

21
TOWARD A REGIONAL CIRCULAR ECONOMY POLICY FOR EAST ASIA AND THE ASSOCIATION OF SOUTHEAST ASIAN NATIONS
ReferencesBasel Action Network. 2002. Exporting Harm: The High-Tech Trashing of Asia. https://static1
.squarespace.com/static/558f1c27e4b0927589e0edad/t/55d79060e4b0ff44487f306a /1440190560888/BANsExportingHarm-2002.pdf
Commission for Environmental Cooperation. 2013. Hazardous Trade? An Examination of US-Generated Spent Lead-Acid Battery Exports and Secondary Lead Recycling in Canada, Mexico, and the United States. Montreal, Canada. http://www3.cec.org/islandora/en/item/11220 -hazardous-trade-examination-us-generated-spent-lead-acid-battery-exports-and
____. 2016. Environmentally Sound Management of Spent Lead-Acid Batteries in North America: Technical Guidelines. Montreal, Canada. http://www3.cec.org/islandora/en/item/11665 -environmentally-sound-management-spent-lead-acid-batteries-in-north-america
Council for PET Bottle Recycling, Japan. 2016. Voluntary Design Guidelines for Designated PET Bottles. Revised on 1 March 2016. https://www.petbottle-rec.gr.jp/english/pdf/guidelines2016 _matterial_e.pdf
Food and Agriculture Organization of the United Nations. 2021. Forest Products 2019. http://www.fao .org/3/cb3795m/cb3795m.pdf (accessed 18 May 2021).
Global Alliance for Incinerator Alternatives. 2019. Discarded: Communities on the Frontlines of the Global Plastic Crisis. https://wastetradestories.org/.
International Resource Panel. 2017. Assessing Global Resource Use: A Systems Approach to Resource Efficiency and Pollution Reduction. Nairobi, Kenya: United Nations Environment Programme.
____. 2019. Global Resources Outlook 2019: Natural Resources for the Future We Want. Nairobi, Kenya: United Nations Environment Programme.
JETRO (Japan External Trade Organization). 2019. JETRO Global Trade and Investment Report 2020 (in Japanese). Tokyo.
Kirchherr, J., D. Reike, and M. Hekkert. 2017. Conceptualizing the Circular Economy: An Analysis of 114 Definitions. Resource, Conservation and Recycling. Vol. 127. pp. 221–32.
Kojima, M. 2017. Remanufacturing and Trade Regulation. Procedia CIRP. Vol. 61. pp. 641–4.
____. 2020. The Impact of Recyclable Waste Trade Restrictions on Producer Recycling Activities. International Journal of Automation Technology. Vol. 14(6). pp. 873–81. https://www.fujipress .jp/ijat/au/ijate001400060873/
Kojima, M., and A. Yoshida. 2005. EU Regulations on Transboundary Movements of Wastes and Asia. In M. Kojima, ed. International Trade of Recyclable Resources in Asia. Tokyo: IDE-JETRO. https://www.ide.go.jp/English/Publish/Reports/Spot/29.html
Lundmark, R. 2002. The Role of Wastepaper in the Pulp and Paper Industry: Investment, Technical Changes and Factor Substitution. Doctoral thesis, Lulea University of Technology.
Ministry of Economy, Trade and Industry, Japan. 2002. “Junkangata shakai keisei ni shisuru wagakuni no hyoujunka senryaku” (Strategy on Standardization toward Material Cycle Society), a document for the Committee on Waste and Recycling in the Industrial Structural Council. https://www .meti.go.jp/shingikai/sankoshin/sangyo_gijutsu/haikibutsu_recycle/pdf/005_04_00.pdf (in Japanese).

22
CHAPTER 2
A Road Map to a Circular Economy in Viet NamTho Dinh Nguyen, Manh Van Lai, Huyen Anh Pham, and Hanh Trong Nguyen
2.1 IntroductionCircular economy is becoming an inevitable trend worldwide to meet the requirements of sustainable development in the context of increasingly degraded natural resources, depletion, polluted environments, and severe climate change and biodiversity loss. In a circular economy, the flow of materials used can be maintained for as long as possible, restoring and recreating products and materials at the end of each cycle of production or consumption.
Many countries and regions have come up with their circular economy implementation road maps. The European Union recently launched an action plan to apply a circular economy (European Commission 2020). Along with that, many European countries, including Finland, the Netherlands, and France, have also created their own circular economy road maps. Australia also now has a specific national road map for plastics, tires, glass, and paper (National Science Agency 2021). In Asia, the People’s Republic of China (PRC) has introduced new regulations to improve the effectiveness of its circular economy models and sustainability initiatives (Kennedy and Johnson 2015).
The Communist Party and Government of Viet Nam has given the circular economy model a lot of attention. Accordingly, the Political Report of the Party Central Committee, Session XII, which was submitted to the Congress, proposed to build a circular economy as a key development orientation for the country in the 2021–2030 period. To promote circular economy development in Viet Nam, Article 142 of the Law on Environmental Protection 2020 clearly defines the stakeholders in which ministries, ministry-level agencies, and provincial-level people’s committees integrate circular economy considerations when developing their strategies, plans, programs and projects, waste management, reuse, and recycling. In this context, it is urgent to build a specific road map to apply the circular economy model in Viet Nam.
Against this background, this chapter discusses the current status of institutions and existing models related to circular economy development in Viet Nam to reveal opportunities and challenges to apply circular economy principles through economic activities and environmental protection and management. Transforming the challenges into opportunities requires the clarification of specific road maps in line with party and government orientations. Accordingly, this chapter also provides practical policy recommendations on future approaches that identify the framework and road map for the transition to a circular economy in Viet Nam.
2.2 Motivation to Transition to a Circular Economy in Viet Nam
2.2.1 Overview of the Economy
The country has achieved rapid, stable, and inclusive economic growth in the 3 decades since the start of Doi Moi. Viet Nam is now in the group of high growth countries in the region and the world with annual average gross domestic product (GDP) growth of 6.4% during 2011–2020. Total GDP at constant prices is about two times higher than in 2010, while GDP per capita has increased from $1,332 in 2010 to more than $3,000 in 2020, reaching the strategic target. Growth has gradually shifted to depth, while growth quality has been

23
A ROAD MAP TO A CIRCULAR ECONOMY IN VIET NAM
raised step by step. In recent years, Viet Nam’s economy has grown well. Table 2.1 shows that the GDP in all three sectors of agriculture, industry and construction, and service increased sharply from 2017 to 2019. In particular, the economy has witnessed a positive shift in the direction of increasing the proportion of the service and the industry and construction sectors and gradually decreasing the proportion of the agriculture, forestry, and fishery sector.
Table 2.1: Gross National Product by Economic Sector, 2017–2019 (D billion)
Sector 2017 2018 2019Agriculture, forestry, and fishery 768,161 813,724 842,601Industry and construction 1,671,952 1,897,272 2,082,261Service 2,065,488 2,278,892 2,513,859Total 4,505,601 4,989,888 5,438,721
Source: Vietnam General Statistics Office, 2021.
Figure 2.1: Projected Population of Viet Nam to 2049
Source: Vietnam General Statistics Office, 2021.
0
50,000
100,000
150,000
200,000
250,000
300,000
350,000
2014 2019 2024 2029 2034 2039 2044 2049First scenario Third scenarioSecond scenario
Rapid population growth leads to increasing demand for living needs, education, training, medical care, transportation, housing, and employment. This also changes demand for use of natural resources and increases pressures on the natural and social environment, especially in key economic regions and big cities. The population continues to increase while rural-to-urban migration is a major pressure causing environmental overload (Figure 2.1). To illustrate, the country produces 25.5 million tons of waste annually, of which 75% is buried. Several burial sites in major cities such as Ha Noi, Ho Chi Minh City, and Da Nang are overloaded and negatively affecting citizens’ lives. Moreover, Ha Noi and Ho Chi Minh City are struggling with alarming levels of air pollution since these two cities are now among the top 15 polluted cities in Southeast Asia.

24
PROSPECTS FOR TRANSITIONING FROM A LINEAR TO CIRCULAR ECONOMY IN DEVELOPING ASIA
2.2.2 Motivation to Transition to a Circular Economy
A circular economy has been recognized as an appropriate and practical approach to achieve the Sustainable Development Goals (SDGs) and harmonize the relationship between the economy and the environment. There are more than 100 different definitions of what constitutes a circular economy. In Viet Nam, the Law on Environmental Protection 2020 stipulates that a “circular economy is an economic model which encompasses the design, production, consumption and services activities aimed at reducing raw materials, extending product life, reducing waste generation and minimizing adverse impacts on the environment.” It refers not only to the reuse of waste but also to the connection between economic activities to form a cycle in the whole economy. A circular economy can maintain the material flow in use for as long as possible, restoring and regenerating products and materials at the end of each production or consumption cycle. The transition to a circular economy in Viet Nam is one of the incentives to harmonize the economy and the environment. Over the past 30 years, the social-economic development based on natural resources and cheap labor has helped the country achieve much. Nevertheless, Viet Nam is now facing serious challenges in terms of resource depletion, environmental degradation and pollution, and climate change.
2.3 Manifestations of a Circular Economy Prior to 2020, the term “circular economy” was not officially used in the country’s policy and legislation. Nevertheless, circular economy principles have been integrated in some economic models for a long time, typically circular economy-related models in the agriculture sector, the ecological economic model, and waste recycling craft villages.
2.3.1 Related Models in the Agriculture Sector
In the northern region of Viet Nam, the garden-pond-barn model, which is abbreviated in Vietnamese as VAC, is a well-known domestic agriculture model to integrate orchard development, fish breeding, and animal husbandry in a cycle. The spread of the VAC model began in the early 1980s. It is built and operated by a household to make optimal use of land, water, and solar energy, achieving high economic efficiency for low capital investment. A farmer’s family consumes products made applying the VAC model like meat, eggs, fish, fruit, and vegetables, and in turn they generate waste, which is used as fertilizer in the model.
Each household has a pond for rearing fish. Pond water is also used for irrigating the garden, and pond mud is annually removed and used to manure fruit trees. Various animals, including water buffalo, cattle, pigs, ducks, and chickens, are kept in the farm household. The large cattle are fed farm by-products, while pigs and poultry are fed kitchen wastes or other farm products. Livestock manure is used to fertilize vegetables.
The adoption of the VAC model has resulted in increased farm incomes and reduced environmental impacts. Research has shown that the annual income of farmers from the application of the VAC model in some communes in the Red River Delta has increased to 3–5 times higher than the traditional model (Nguyen 2008). Furthermore, the environmental benefits are undeniable since this model leads to little agricultural pollution. Waste and by-products are used for other farming purposes instead of discharging into the environment.

25
A ROAD MAP TO A CIRCULAR ECONOMY IN VIET NAM
Figure 2.2: VACB model in Viet Nam
VACB = garden-pond-stall-biogas.
Source: Nguyen (2008).
Purchasedfeed
Crop residuesweeds
Paddy and horticulture
Pestcontrol
Pig feed
Pig
Meat
ManureFertilizer
Ducks
MeatEggs
Duck feed
Duckweed
Sludge
Pond
Fish
Biodigester
Cooking fuel
The original VAC model has been modified in other forms to suit the farmers’ needs and conditions: the garden-pond-stall-biogas model (referred to as VACB in Vietnamese) or the garden-pond-stall-forest model (VACR in Vietnamese). Particularly, the VACB model provides a clean energy source from livestock manure. The livestock manure goes through an installed biodigester, which transforms it into fertilizer and methane gas through anaerobic digestion. The methane gas is then normally used for cooking. This model is said to save farmers money by getting rid of the cost of consuming commercial gas or wood. It also contributes to improving users’ health thanks to the clean treatment of animal waste and to reducing indoor air pollution from woodstoves.
The Asian Development Bank (ADB) also supports the replication of the VACB model. Accordingly, ADB coordinated with the Viet Nam Ministry of Agriculture and Rural Development (MARD) to implement the Low Carbon Agriculture Support Project during 2013–2019. The project was implemented in the 10 provinces of Lao Cai, Son La, Phu Tho, Bac Giang, Nam Dinh, Ha Tinh, Binh Dinh, Tien Giang, Ben Tre, and Soc Trang to pilot a new technology for separating and processing agricultural and rural household waste into biogas and bioslurry (also known as a clean organic fertilizer). The project’s results show that the installed biogas plants brought many benefits, including reducing methane emissions, fuel and firewood consumption, environmental pollutants, and human and livestock disease outbreaks, while saving time and money for farmers and increasing the quantity of organic fertilizer.
The VAC model and its variations are a promising initiative for applying circular economy principles in the agriculture sector. Particularly, these models promote environmentally safe and climate-friendly agricultural waste management practices, given that Viet Nam generates about 80 million tons of livestock waste per year, of which around 36% is estimated to be dumped into the environment without proper treatment (DLP-MARD 2015).

26
PROSPECTS FOR TRANSITIONING FROM A LINEAR TO CIRCULAR ECONOMY IN DEVELOPING ASIA
2.3.2 Ecological Economic Model
In Viet Nam, the ecological economic or eco-economic model has been studied and deployed since the 1980s. This economic development model aims to protect the ecological environment and natural landscape. The eco-economic system is conceived as a system of interaction between organisms and the environment under human control to achieve the goals of sustainable development. A specific eco-economic model is designed and built in a defined ecological region where human activities, including production, exploitation, and use of human resources, take place.
In economic development, natural resources are extensively used for many activities that have resulted in ecological imbalance. The eco-economic model is designed to circulate the material flow to bring about high environmental and economic efficiency, ensuring the self-regulation of the entire system.
The eco-economic model has been modified and implemented in many localities to suit the characteristics of each geographical region. It is said to contribute to improving the living standards of local people, protecting the natural ecosystem, and minimizing environmental pollution. This model reflects some circular economy principles, including rational use and regeneration of natural resources, as well as maximization of the circulation of waste and materials. Most pilot models were built under the sponsorship of international organizations, namely, the International Union for Conservation of Nature (IUCN), the Swedish International Development Cooperation Agency (Sida), Children Believe, and Toyota Viet Nam.
2.3.3 Waste Recycling Craft Villages
Waste recycling villages are the most typical example of the existence of a so-called circular economy in Viet Nam. In recent years, along with the development of industries, production in recycling villages has also increased rapidly. There are about 90 scrap recycling villages distributed across the country. Some well-known recycling villages are Trung Van plastic recycling village (Ha Noi city), Dai Bai copper casting village (Bac Ninh province), Vo Hoan plastic recycling village, and Transpose (Binh Yen) aluminum recycling village (Nam Dinh province). In these craft villages, the basic production unit is a household that operates recycling activities such as waste collection, separation, shredding, and extrusion. Most business households perform small-scale recycling operations with outdated recycling technologies (Vietnam Environment Administration 2013).
The typical recycling processes in craft villages have also caused health risks and high potential of environmental pollution due to the lack of modern and clean technologies, limited investment into environmental protection facilities (e.g., wastewater treatment system), and low degree of organization. A major source of contamination is generated from dust and gas emissions (from scrap sorting, shredding, and burning of residuals) and wastewater (from scrap washing and processing).
For example, many households in the Trung Van plastic recycling village (Ha Noi city) have collected or purchased plastic waste such as bags and bottles. This waste is then recycled for producing plastic raw materials, ropes, and bags, or supplying plastic manufacturers. However, the recycling processes discharge waste directly into the environment instead of being treated in compliance with regulations. Bac Ninh province has over 70 craft villages, of which 62 are traditional. For example, Dai Bai bronze casting village is well-known for more than 1,000 years of traditional copper casting and metal laminating with raw materials from nonferrous metal scrap (aluminum, copper, lead) such as wire rods and copper billets. The amount of raw material used is about 5,000 tons per year, while fuel consumption in manufacturing processes, including coal and electricity, is around 2,500 tons per year. Consequently, a large amount of emission and solid waste has been discharged into the environment, causing direct and indirect adverse impacts on the environment and serious soil contamination in Dai Bai village.

27
A ROAD MAP TO A CIRCULAR ECONOMY IN VIET NAM
Table 2.2: National Strategies and Programs Mentioning Circular Economy
No. Name Relevant Content1 National Socio-Economic Development
Plan for the period 2021–2025To build a road map, mechanisms, policies, and regulations to form and operate the circular economy model
2 National Socio-Economic Development Strategy for the period 2021–2030, with a vision to 2045
To encourage the development of the circular economy model for integrated use and efficiency of the output of the production process
3 Sectoral strategies – National strategy on green growth – National strategy on solid waste management – National strategy on livestock – National strategy on renewable energy – National programs on sustainable production and consumption – Scheme of the environmental industry sector – Scheme of environmental services – Scheme of digital economy
Source: Authors.
Similarly, the craft village of Binh Yen (Nam Dinh province) has 304 households recycling aluminum from waste. On average, this village recycles nearly 1,500 tons of aluminum scrap each month. In Binh Yen village, the daily process of casting aluminum from cans generates tens of tons of hazardous solid waste, while the wastewater from product cleaning is up to 500 cubic meters per day. Before 2013, all hazardous solid waste and wastewater were dumped directly into the environment without any treatment. The contaminated water also flowed into the irrigation systems that polluted many hectares of rice fields. According to the monitoring results of the Ministry of Natural Resources and Environment, the concentration of suspended solids in surface water in Nam Ninh Hai River, where wastewater from manufacturing establishments was discharged, is 12.2 times higher than the relevant Vietnamese technical regulations. In 2013, Nam Dinh province invested D85 billion for the pollution remediation and environmental improvement in Binh Yen craft village, including the construction of the solid waste collection and centralized water treatment systems (Centre for Environmental Monitoring 2016).
In general, waste recycling in Viet Nam is a strong and growing sector. However, recycling activities mainly take place in an informal context in craft villages. Although the recycling craft villages contribute to the circulation of raw materials in the economy, their outdated recycling processes generate a great amount of waste, especially solid waste, which is recognized as a great challenge for local authorities. One of the key measures to overcome this is to raise awareness on the environmental protection in craft villages by focusing on communication about the proper treatment of waste in mass media and by improving the capacity of competent government officials, especially at district and commune levels.
2.4 Conditions to Apply a Circular Economy in Viet Nam 2.4.1 Circular Economy in National Development Strategies and Programs
The concept of a circular economy and its principles were first integrated in the 10-Year National Socio-Economic Development Strategy 2021–2030 and the 5-Year National Socio-Economic Development Plan 2021–2025. They outline orientations for national development in the next 10 years, as well as identify key missions and strategic tasks and solutions. Accordingly, the implementation of a circular economy is one of the national tasks and solutions toward sustainable development in the coming period, as specified in Table 2.2.

28
PROSPECTS FOR TRANSITIONING FROM A LINEAR TO CIRCULAR ECONOMY IN DEVELOPING ASIA
2.4.2 Circular Economy in the Law on Environmental Protection 2020
The revised Law on Environmental Protection 2020 was passed by the National Assembly of Viet Nam on 17 November 2020. The law introduces numerous breakthrough policies, particularly the concept of a circular economy. Accordingly, Article 142 stipulates the official term,1 while other articles regulate new policies to gradually promote the transition to a circular economy: (i) application of extended producer responsibility policy to the recovery and recycling of products and packaging (Article 54); (ii) payment for service charges for collection, transportation, and treatment of domestic solid wastes based on the volume of sorted wastes (Article 79); (iii) self-recycling, treatment, and co-treatment of, or recovery of energy from, normal industrial solid wastes (Article 82); (iv) development of an environmental industry (Article 143); and (v) development of environmental services (Article 144).
The revised law further requires the development and issuance of specific criteria and a road map to promote the adoption of circular economy models in Viet Nam. The Ministry of Natural Resources and Environment is assigned to elaborate and submit for government approval the decree detailing the implementation of the revised law, including the specification of Article 142 and other articles mentioned above. The revised law and its decree took effect in 2021, creating a strong legal foundation for the transition to a circular economy.
2.4.3 Opportunities and Challenges to Transition to a Circular Economy
Opportunities
At present, the Government of Viet Nam endeavors to move toward a circular economy. It is necessary to exploit the opportunities for accelerating such a transition. The results can be shown as follows:
First, the transition toward a circular economy is a proven global trend and has seen successful demonstrations and strong government commitments in many countries across the world, including Denmark, Finland, Japan, the PRC, and European countries. As a result, Viet Nam would apply their pioneering experiences when integrating circular economy models in its social-economic development.
Second, Viet Nam also pursues the Sustainable Development Goals (SDGs) in the context of responding to climate change. However, the country has been under the pressures of natural resource depletion and environmental pollution, which require a systemic approach to economic development that is more sustainable than the “take-make-waste” linear model.
Third, in the Fourth Industrial Revolution, the harder competitiveness could push businesses to innovate technologies and apply circularity in their operation (e.g., closed loops of energy and materials in the process of production). This would motivate businesses to invest in implementing circular economy models.
1 “Article 142. Circular economy 1. Circular economy is an economic model in which design, production, consumption and service activities aim to reduce raw
material extraction, extending the product life cycle, reducing generated waste and minimizing negative impacts on the environment.
2. Ministries, branches and Provincial-level People’s Committees integrate circular economy principles in the development of strategies, master plans, plans, programs and projects; management, recycling, and reuse of waste.
3. Production, business and service establishments are responsible for establishing a management system and implementing measures to reduce resource exploitation and generated waste, and increasing the level of reuse and recycling of waste from the stage of project construction and product design to the stages of production and distribution.
4. The Government shall stipulate criteria, roadmaps and mechanisms to encourage the implementation of circular economy in line with the country’s socio-economic development.”
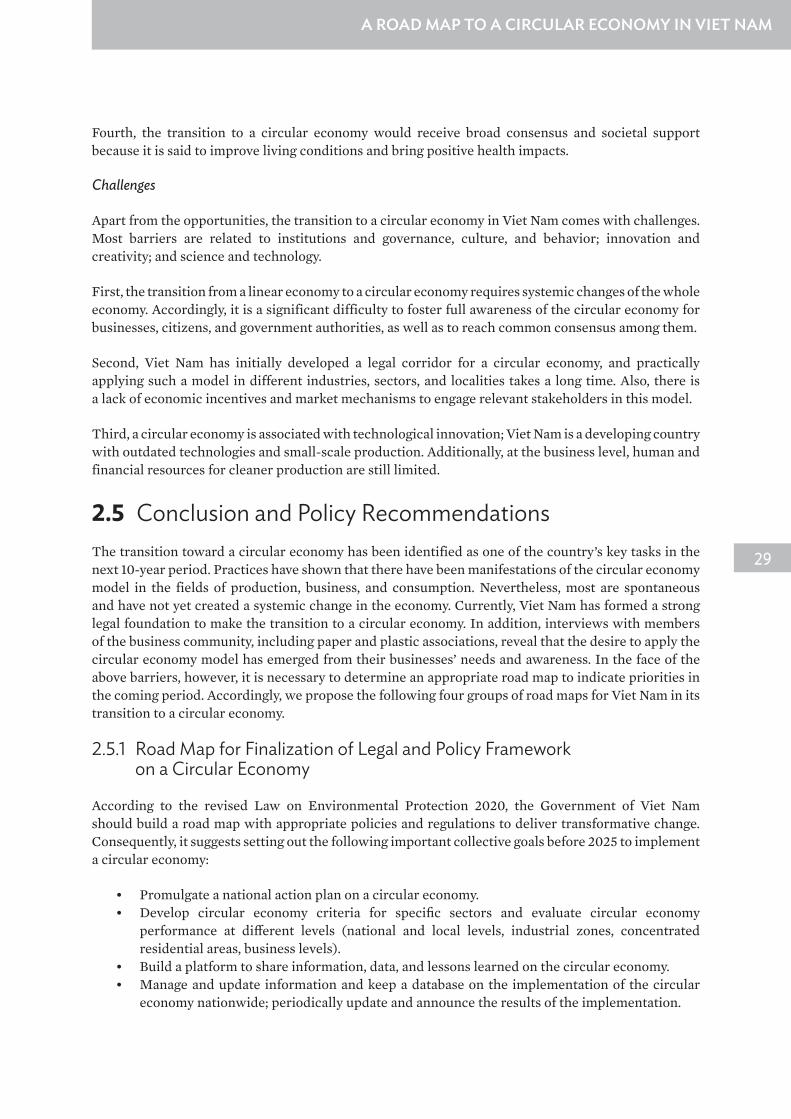
29
A ROAD MAP TO A CIRCULAR ECONOMY IN VIET NAM
Fourth, the transition to a circular economy would receive broad consensus and societal support because it is said to improve living conditions and bring positive health impacts.
Challenges
Apart from the opportunities, the transition to a circular economy in Viet Nam comes with challenges. Most barriers are related to institutions and governance, culture, and behavior; innovation and creativity; and science and technology.
First, the transition from a linear economy to a circular economy requires systemic changes of the whole economy. Accordingly, it is a significant difficulty to foster full awareness of the circular economy for businesses, citizens, and government authorities, as well as to reach common consensus among them.
Second, Viet Nam has initially developed a legal corridor for a circular economy, and practically applying such a model in different industries, sectors, and localities takes a long time. Also, there is a lack of economic incentives and market mechanisms to engage relevant stakeholders in this model.
Third, a circular economy is associated with technological innovation; Viet Nam is a developing country with outdated technologies and small-scale production. Additionally, at the business level, human and financial resources for cleaner production are still limited.
2.5 Conclusion and Policy RecommendationsThe transition toward a circular economy has been identified as one of the country’s key tasks in the next 10-year period. Practices have shown that there have been manifestations of the circular economy model in the fields of production, business, and consumption. Nevertheless, most are spontaneous and have not yet created a systemic change in the economy. Currently, Viet Nam has formed a strong legal foundation to make the transition to a circular economy. In addition, interviews with members of the business community, including paper and plastic associations, reveal that the desire to apply the circular economy model has emerged from their businesses’ needs and awareness. In the face of the above barriers, however, it is necessary to determine an appropriate road map to indicate priorities in the coming period. Accordingly, we propose the following four groups of road maps for Viet Nam in its transition to a circular economy.
2.5.1 Road Map for Finalization of Legal and Policy Framework on a Circular Economy
According to the revised Law on Environmental Protection 2020, the Government of Viet Nam should build a road map with appropriate policies and regulations to deliver transformative change. Consequently, it suggests setting out the following important collective goals before 2025 to implement a circular economy:
• Promulgate a national action plan on a circular economy.• Develop circular economy criteria for specific sectors and evaluate circular economy
performance at different levels (national and local levels, industrial zones, concentrated residential areas, business levels).
• Build a platform to share information, data, and lessons learned on the circular economy.• Manage and update information and keep a database on the implementation of the circular
economy nationwide; periodically update and announce the results of the implementation.

30
PROSPECTS FOR TRANSITIONING FROM A LINEAR TO CIRCULAR ECONOMY IN DEVELOPING ASIA
• Develop technical guidelines for the implementation of a circular economy for production, business, and service establishments.
• Integrate circular economy criteria in standards and technical regulations for products and goods.
• Organize the implementation of preferential and incentive measures in accordance with the Law on Environmental Protection.
• Integrate the circular economy into the development of strategies, master plans, plans, programs and projects, waste management, and reuse and recycling.
• Use communication measures to contribute to effective enforcement of regulations and policies on green procurement, green credit, green bonds, environmental industry, environmental services, and best available technology, as stipulated in the Law on Environmental Protection.
2.5.2 Road Map for Integration of a Circular Economy in Waste Management
The traditional waste hierarchy is a set of priorities for waste management with prevention at the top (the most environmentally preferred option) to reuse, recycle, recover, and then disposal at the bottom (the least environmentally preferred option). In the transition to a circular economy, a new hierarchy should be developed that changes the approach from waste management to resource management.
Currently, Viet Nam has applied the approach of reduce-reuse-recycle (referred to as 3R) in waste management. This approach has been presented in a range of national policies and legal documents, including the National Socio-Economic Development Strategy in the period of 2021–2030, the National Strategy on Environmental Protection to 2030, with a vision to 2045, the National Strategy on Solid Waste Management to 2025, and the revised Law on Environmental Protection 2020 and its legislative documents. Moreover, the integration of a waste hierarchy in a circular system is crucial since circular economy principles mainly refer to waste practices in Viet Nam.
Table 2.3 illustrates the proposed road map for integration of a circular economy in waste management. Accordingly, prior to 2025, it promotes the transition to a circular economy through recycling, reuse, and reduction of certain types of waste—namely, urban domestic waste, ordinary industrial waste, and wastewater in industrial zones. Additionally, it prioritizes the implementation of circular economy principles in the disposal of plastic waste, paper, and e-waste. Prior to 2030, it applies circular economy models in management of rural solid waste, urban water waste, hazardous waste, food waste, construction and demolition waste, and textile waste.
On the other hand, a range of solutions is also indicated to implement the road map as follows:
• Set up technical and environmental standards for secondary materials. • Create a market for secondary materials for reuse and recycling of hazardous waste, organic
waste, construction and demolition waste, plastic waste, and textile waste.• Introduce national and local technical regulations and standards of recycling for different
categories of waste. • Implement extended producer responsibility or EPR schemes for different products, especially
plastic packaging and items, electronics, and batteries.• Apply preferential policies and incentives to organizations and individuals that engage in
the recycling of wastes and products and that invest in the construction of waste recycling facilities.
• Consolidate social and cultural awareness on sustainable lifestyles, especially focusing on the habit of waste sorting and green purchasing.

31
A ROAD MAP TO A CIRCULAR ECONOMY IN VIET NAM
2.5.3 Road Map for Integration of a Circular Economy in Economic Sectors
Specific economic benefits from circular economy policies and strategies are expected. For instance, job creation, a more competitive business environment, more investment in new technologies, and reduction of primary material consumption. The transition to a circular economy would lead to transformative changes in all economic sectors. Based on Decision No. 27/2018/QD-TTg of the Prime Minister on the classification of economic subsectors of Viet Nam and the analysis of application potential of a circular economy by economic sectors, the following key activities are needed to implement the road map:
• Encourage all economic sectors to participate in the implementation of a circular economy. • Prioritize the economic sectors that can adopt circular economy models at lower cost. • Prioritize specific economic sectors owning respective development targets associated with
circular economy principles that are defined in the national strategic orientations and policies, for example the National Strategy on Environmental Protection, the National Target Program on Sustainable Production and Consumption, and the National Socio-Economic Development Strategy for the period of 2021–2030 with a vision to 2045.
Table 2.3: Priority Road Map for Implementing a Circular Economy for Waste
Waste Type Before 2025 Before 2030 Before 20451. Solid waste managementUrban domestic waste XRural domestic waste XOrdinary industrial waste XHazardous waste XOther waste X2. WastewaterUrban area XIndustrial zone XRural area X3. Waste-to-resourcePaper XMetal XHazardous waste XFood waste XConstruction and demolition waste XPlastic waste XTextile waste XElectric waste XOther X
Note: X is the time to kick off solutions in the transition to a circular economy.
Source: Authors.

32
PROSPECTS FOR TRANSITIONING FROM A LINEAR TO CIRCULAR ECONOMY IN DEVELOPING ASIA
Table 2.4: Road Map for Integration of a Circular Economy in Economic Sectors
Economic SectorBefore 2025
Before 2030
Before 2045
A. Agriculture, forestry and fisheryCultivation XLivestock XAquaculture XForestry XB. Mining XC. Manufacturing and processing industryFood and drink XTextile XPaper XLeather, shoes XWood processing and products manufactured from wood, bamboo, straw, and plaiting materials
X
Chemical XPlastic XGlass XSteel and iron XElectronics, computers and optical products, electrical equipment XOther machinery and equipment XCars and other engines XRepair, maintenance, and installation of machines and equipment XD. Electricity, gas, hot water, steam, and air-conditioning XE. Water supply; activities of management and treatment of waste
and wastewaterX
F. Building XG. Wholesale and retail; repair of automobiles, motorbikes,
and other motor vehiclesX
H. Other activities X
Source: Authors.
The road map for the transition to a circular economy by economic sectors is presented in Table 2.4. To maximize the effectiveness of the transition, it would take an in-depth focus on certain core economic sectors. The selection of core sectors is based on their economic growth potential, their environmental and social impacts, and their ease of transformation to circularity. Accordingly, prior to 2025, it focuses on the application of circular economy models in the sectors of livestock; aquaculture; paper; processing wood and producing products from processing wood and from wood, bamboo, straw, and plaiting materials; plastic; steel and iron; repair, maintenance, and installation of machines and equipment; electricity, gas, hot water, steam, and air-conditioning; water supply; and activities of management and treatment of waste and wastewater.

33
A ROAD MAP TO A CIRCULAR ECONOMY IN VIET NAM
Table 2.5: Road Map for Implementation of a Circular Economy at the Meso Level
Areas Before 2025 Before 2030 Before 20451. Industrial parks, industrial clusters, concentrated
production (eco-industrial park)Newly established XExisting ones X2. Craft villages X3. Urban areas (city level)New urban areas XOld urban areas X4. Rural and mountainous areas X
Source: Authors.
2.5.4 Road Map for Implementation of a Circular Economy at the Meso Level
A circular economy usually operates at three levels: macro level (e.g., city, region, nation), meso level (e.g., eco-industrial networks), and micro level (e.g., products, companies, consumers) (Yong 2007). Particularly, at the meso level, it focuses on improving environmental and economic performance in so-called symbiotic associations where waste from one organization becomes raw materials of another.
In Viet Nam, the government also aims to build circular economy models at the meso level, especially for industrial parks, industrial clusters, and concentrated production and business zones. Initially, the promulgation of Decree No. 82/2018/ND-CP of the Government dated 22 May 2018 on management of industrial zones and economic zones provides guidelines to operationalize the development of eco-industrial parks in Viet Nam and their institutional framework in more than 300 industrial zones across the country. Although the term “circular economy” is not mentioned in the decree, the definition of industrial symbiosis reflects circular economy principles.2
The road map for implementation of a circular economy at the meso level is proposed in Table 2.5.
Since a circular economy road map is regarded as a tool to identify the required steps, it also compiles key stakeholders’ views on the essential changes and actions required for the circular economy transformation. Furthermore, it documents a vision as well as goals that accelerate a country’s transition toward a circular economy.
2 According to Article 2 of the Decree No. 82/2018/ND-CP: Industrial symbiosis existing in an industrial park means cooperation between enterprises within an industrial park or with enterprises operating in other industrial parks in order to optimize the use of input and output factors, such as raw materials, water, energy, wastes and waste products, etc., during the manufacturing process. By virtue of cooperation, enterprises can build a network intended for exchanging factors necessary for production activities, share infrastructure and utilities necessary for production, improve the technological process and promote business and production efficiency.
34
PROSPECTS FOR TRANSITIONING FROM A LINEAR TO CIRCULAR ECONOMY IN DEVELOPING ASIA
Having integrated circular economy concepts in its 10-Year National Socio-Economic Development Strategy 2021–2030 and 5-Year National Socio-Economic Development Plan 2021–2025, Viet Nam is pushing ahead with the development of a national circular economy road map. This task is not easy and requires comprehensive analysis of current institutions and resources. In this chapter, we have presented different approaches to building a national circular economy road map that serves as a solid basis for the next steps. Further study is needed to define the focus areas based on the vision and strategic goals with specific and measurable goals.

35
A ROAD MAP TO A CIRCULAR ECONOMY IN VIET NAM
ReferencesCentre for Environmental Monitoring. 2016. http://cem.gov.vn/VN/TINTRANGCHU_Content
/tabid/330/cat/115/nfriend/3750083/language/vi-VN/Default.aspx
DLP-MARD (Department of Livestock Production, Ministry of Agriculture and Rural Development). 2015. Xử lý chất thải trong chăn nuôi (Livestock Production Waste Treatment). Hội thảo xử lý chất thải trong chăn nuôi, thực trang và giải pháp (Workshop on Livestock Production Waste Treatment, Implementation and Solutions). Ha Noi.
European Commission. 2020. A New Circular Economy Action Plan for a Cleaner and More Competitive Europe. Brussels.
Kennedy, S., and C. Johnson. 2015. Perfecting China, Inc.: China’s 13th Five-Year Plan. Lanham, MD: Rowman & Littlefield.
National Science Agency of Australia. 2021. Circular Economy Roadmap for Plastics, Glass, Paper and Tyres. Canberra.
Nguyen, V.M. 2008. Vuon-Ao-Chuong—The Traditional Vietnamese Farm. 4 October. Permaculture Research Institute. https://www.permaculturenews.org/2008/10/04/vuon-ao -chuong-the-traditional-vietnamese-farm/
Vietnam Environment Administration. 2013. http://vea.gov.vn/vn/quanlymt/kiemsoatonhiem /Pages/Nam-%C4%90%E1%BB%8Bnh-M%C3%B4i-tr%C6%B0%E1%BB%9Dng-l%C3%A0ng -ngh%E1%BB%81-B%C3%ACnh-Y%C3%AAn-%C3%B4-nhi%E1%BB%85m-suspect%C3%AAm -tr%E1%BB%8Dng-.aspx
Yong, R. 2007. The Circular Economy in China. Journal of Material Cycles and Waste Management. Vol. 9(2). pp. 121–9. https://doi.org/10.1007/s10163-007-0183-z

36
CHAPTER 3
Design-Reality Gap in Promoting a Circular Economy in the Private Sector: Case of Waste Management and Recycling in BangladeshSuborna Barua
3.1 IntroductionBangladesh is one of the fastest-growing emerging economies globally and is expected to be a global economic leader in the next 20 years. The country is expected to graduate to middle-income status by 2024, having fulfilled all prerequisites. Given the current faster economic growth patterns, several global rankings identify the country as one of the likely global economic powers by 2050 (International Monetary Fund 2016; Lawson, Heacock, and Stupnytska 2007; HSBC 2011; Barua 2021a, 2021b; Barua and Aziz 2021). The current high-growth pattern and massive infrastructure development provide Bangladesh an excellent opportunity for going green. The current take off stage of becoming a global economic powerhouse is perhaps the best time for Bangladesh to transform its growth pattern into a greener one, as it could align its development plans from the beginning and implement them accordingly. It would be much easier, less costly, and more efficient if development needs were greened at the early planning stage than rebuilding them once they are gray and implemented.
One of the main ways of greening the economic development for Bangladesh is following a circular economy model. Encouraging circular economy models is critical for emerging economies like Bangladesh. Their economic growth is mainly driven by massive, unsustainable private sector activities and undermines several Sustainable Development Goals, including Goals 11 and 12. There are two fronts where Bangladesh needs to focus on incentivizing and embracing circular economy principles and models in the private sector: (i) design appropriate and timely government initiatives and supports, and (ii) actively engage the private sector to invest in businesses that build on or support circular economy principles. The need for adopting circular economy principles is critical for Bangladesh as the country, with a large population of 170 million, produces about 8,000 tons of solid waste each day from six of its major cities (Dhaka, Chittagong, Khulna, Rajshahi, Barisal, and Sylhet) (Abedin and Jahiruddin 2015). The adoption of circular economy principles can green the faster growth pattern of Bangladesh and transform its huge waste into resources for earning foreign exchange and creating employment locally.
The idea of promoting the sustainable behavior of firms began with the official launching of green banking frameworks a decade ago (Rahman and Barua 2016). However, Bangladesh’s government policy and regulatory frameworks addressing circularity remain limited and at an infant stage. While it is true that a single regulation is not possible to address all aspects of the multifaceted and multiparty circular economy concept, there is no specific regulation or act available to date that can force producers to align and adopt a circularity-based business model or that incentivizes and promotes a circular economy specifically in the private sector (Yousuf 2014). On the other hand, the private sector in Bangladesh largely follows unsustainable production and business practices; some initiatives appear to swim against the tide. A small but increasing number of private sector enterprises invest in circularity-based businesses, directly and indirectly promoting and supporting the circular economy model. However, the existing enterprises face enormous challenges that make it harder for others to come forward.

37
DESIGN-REALITY GAP IN PROMOTING A CIRCULAR ECONOMY IN THE PRIVATE SECTOR: CASE OF WASTE MANAGEMENT AND RECYCLING IN BANGLADESH
This chapter examines the current policy and regulatory frameworks that particularly address and support circular economy principles directly or indirectly. Given the available government policies and regulations, it looks at five cases that build on or support circularity-based businesses and explores the challenges. Combining both the review of the policies and regulations and the case studies, the chapter identifies the current gaps between the areas that the policies and regulations address, the challenges the circularity-based businesses face, and the policy responses needed to mainstream circularity principles in Bangladesh.
3.2 MethodologyThis chapter adopts a qualitative research method based on documentary reviews and case studies. A comprehensive review of the available policies and regulations that directly or indirectly interact with the circularity model is carried out to explore the current areas they address and the areas that need intervention. As such, the key areas and aims of the policies and regulations are identified and evaluated to determine the extent to which they cover and support businesses based on the circular economy model. In order to identify the on-the-ground challenges in mainstreaming circularity-based businesses, five enterprises are selected that support or are built on the circularity principles. Since the concept of a circular economy is relatively new in Bangladesh and there is no systematic approach to promote these principles, there is no central database or record of circularity-driven firms available with the government offices. After a thorough review of the secondary literature and consultation with relevant experts, eight companies were initially considered that could be classified as supporting circularity principles. Given the coronavirus disease (COVID-19) restrictions and lockdowns, all eight companies were contacted over the phone to conduct case studies; however, three enterprises could not be reached despite repeated efforts due to either invalid contact information, calls not being picked up, or requests for talks and information being denied. The five final selected firms are Azizu Recycling & E-Waste Company, Digital Vangariwala, Pro Recycling Limited, Junk Enterprise, and Garbageman. The list of questions asked for the case studies is provided in Appendix 3.1. Given the usual challenges of time constraints in over-the-phone data collection, best efforts have been made to explore the necessary responses. The responses collected were then analyzed to identify how circularity drives the business model of each firm, the key challenges they encounter in managing and growing their operation, and the policy and regulatory interventions they seek from the government. The challenges and interventions are finally categorized and discussed at length separately.
3.3 Circular vs Linear EconomyA circular economy is fundamentally different from a linear economy. To put it simply, in a linear economy, we mine raw materials and process them into a final product, while any waste from the production process and the product itself are thrown away after use. This model has at least three downsides. First, every time we produce a new final product, we require new raw materials and other resources (e.g., energy, finance), which makes the production process resource intensive and costlier. Second, any waste thrown away generates adverse environmental impacts (e.g., plastic bottles). And third, the overall process results in an unsustainable and less resource-efficient production system. In the long run, the unsustainable approach—being followed by traditional economic systems across the world—impacts not only the environmental quality but also the quality of life and the livability of the earth (Nathaniel et al. 2020; Nathaniel, Barua, and Ahmed 2021).
Many researchers and professionals have defined circular economy from a diverse perspective, which makes it difficult to uniformly measure circularity (Kirchherr, Reike, and Hekkert 2017). However, there is certain consensus in the definitions, as almost all of them focus on a system change while using

38
PROSPECTS FOR TRANSITIONING FROM A LINEAR TO CIRCULAR ECONOMY IN DEVELOPING ASIA
material resources based on a 3R approach: reduce (minimum use of raw materials), reuse (maximum reuse of products and components), and recycle (maximum reuse of materials as inputs). However, with increased attention to moving to a sustainable world, the concept of circularity has also extended its coverage to the use of renewables (Ellen MacArthur Foundation 2021). While the fundamental pillars of the circular economy concept are to reduce, reuse, and recycle material resources, there are many definitions and conceptualizations of circular economy suggested in the literature. Some scholars suggest the inclusion of dimensions beyond the 3Rs. For example, Potting et al. (2017, p. 5) proposes an extended 9R framework that adds together refuse, rethink, repair, refurbish, remanufacture, repurpose, and recover as other dimensions (nine dimensions starting from refuse as the first dimension R0). However, almost all of the proposed additions, in the end, boil down to (or can be viewed as breakdowns of ) the original 3R (reduce, reuse, and recycle) model. All definitions, share the common ground that the main aim of the circular economy is considered to be economic prosperity, followed by environmental quality (Kirchherr, Reike, and Hekkert 2017; Rizos, Tuokko, and Behrens 2017).
According to the Ellen MacArthur Foundation (2021), the circular economy model entails a gradual decoupling of economic activities from the consumption of finite resources and designing waste out of the system, fueled by renewable energy sources. In the end, the model builds sustainable and
Figure 3.1: Linear vs Circular Economy
Source: Author.
Redu
ceRe
use
Reus
e
Reus
e
Recy
cle
Reuse
Take
A. Linear Economy
B. Circular Economy
Material resources(e.g., raw materials
and finishedproducts)
Material resources(e.g., raw materials
and finishedproducts)
Waste (e.g., plastic and glass bottles
and hardcoverpackaging)
Zero orminimal
waste
Zero orminimalpollution
Make Use Pollute
Take Make Use
Driven by fossil fuels(e.g., oil, coral, and natural gas)
Driven by renewable energy(e.g., solar, wind, and hydropower)

39
DESIGN-REALITY GAP IN PROMOTING A CIRCULAR ECONOMY IN THE PRIVATE SECTOR: CASE OF WASTE MANAGEMENT AND RECYCLING IN BANGLADESH
regenerative economic, natural, and social capital based on three key principles: design out waste and pollution, keep products and materials in use, and regenerate natural systems. The model calls for effective and efficient contribution to the three principles by all—large and small businesses, for organizations and individuals, globally and locally. Transitioning to a circular economy does not only amount to adjustments aimed at reducing the negative impacts of the linear economy. Rather, it represents a systemic shift that builds long-term resilience, generates business and economic opportunities, and provides environmental and societal benefits.
As Figure 3.1 shows, the circular economy model closes the cycle by recycling the wastes thrown away and reusing them in the production process. It means any waste generated from each stage of a production process may be recycled and fed back into the same or another production system. It eventually helps producers reduce the use of new resources, making the production process more resource- and cost-efficient. As such, the circular economy model vastly stresses redesigning the products and production processes. While producers are at the heart of the circular economy model, consumers also have a significant role in at least three areas: first, accepting recycled products for consumption (e.g., of bags from recycled paper); second, maximum reuse of materials (e.g., of household appliances); and third, minimizing waste (e.g., of food). In order to make this circularity process effective and efficient, some key aspects need to be particularly addressed at the producer end. First, any product to be produced must be designed initially in such a way that it will require the least amount of material resources and energy throughout its value chain. If products are not designed to be resource-efficient, the later stages of the value chain will be less resource-efficient, leading to no circularity cycle or an inefficient one. Second, production processes must be planned and designed to release the least possible waste. To achieve the best result, circularity-focused product design should accompany production system and process redesign aiming at minimizing waste. Third, production processes should be fueled by renewable energy such as solar, wind, or hydropower by replacing fossil fuels.
All considered, the benefits of the circular economy model stretch out to three key dimensions—environmental, social, and economic—that make it a superior choice to the linear one. Environmental benefits are at the heart of the model as it enables the traditional production and consumption systems to be sustainable and environment-friendly by efficiently utilizing resources, minimizing waste and pollution, and maximizing the use of renewables. It can sustainably preserve the environmental quality for future generations. The environmental benefits also add to the social benefits, i.e., the society as a whole benefits when the environmental quality is preserved and improved. Social benefits also arise as it exposes and designs out the negative impacts of economic activities on human and animal health by minimizing pollution, unhealthy product designs, and release of hazardous wastes (Green Alliance 2015). Furthermore, a circularity- or sustainability-focused production system or process can help improve labor practices, provide decent work, protect human rights, and deliver better social responsibility to organizations and individuals (Padilla-Rivera, Russo-Garrido, and Merveille 2020). From an economic perspective, the model enables products to be easier to repair and longer-lasting with incentives to take old products back, can cut unemployment, and can save people money. As such, it makes both producers and consumers economically more efficient while creating more employment opportunities by allowing the expansion of recycling or repairing industries. The European Commission estimates a reduction in the need for new raw materials by 17% to 24% by 2030, allowing a savings of between €340 billion and €630 billion per year in the European Union alone (approximately 12%–23% of the actual production costs) and creating 178,000 new jobs by 2030 from waste management alone (CESME 2015). At the macroeconomic level, the global economy could grow by $4.5 trillion by 2030 from the circular economy practices (Lacy and Rutqvist 2015).

40
PROSPECTS FOR TRANSITIONING FROM A LINEAR TO CIRCULAR ECONOMY IN DEVELOPING ASIA
3.4 Policies and Regulations Relating to the Circular Economy in Bangladesh
Bangladesh is at an infant stage in terms of promoting and building a circular economy. As such, the policy and regulatory framework with respect to circularity principles is weak and remains at a takeoff stage. As mentioned earlier, no regulation or act specific to the circular economy principles is available to date that can force producers to align and adopt a circularity-based business model or that incentivizes and promotes a circular economy specifically in the private sector (Yousuf 2014). It is perhaps nearly impossible to address the complicated and multifaceted definition and measurement of the circular economy model by a single regulation, which is why any government must take it as a systems approach and make a coordinated move from all necessary dimensions. For example, implementing a circular economy could require a cross-ministry collaboration across many of the offices at the government level, such as the environment, industries, labor, and finance ministries, which is very difficult to put into work. Being at an early stage, Bangladesh has developed a national strategy document launched in 2010 on 3R that specifically addresses promoting a circular economy and several other regulations and acts and addresses exclusively waste management and supports the circular economy principles (Department of Environment 2010).
3.4.1 National 3R (Reduce, Reuse, Recycle) Strategy for Waste Management
The Department of Environment and Forests released its National 3R (Reduce, Reuse, Recycle) Strategy for Waste Management, which is the only government document that directly addresses the circular economy principles. To improve the situation, this strategy was launched in 2010. The document defines reducing as choosing to use items with care to reduce the amount of waste generated, reusing as the repeated use of items or parts of items that still have usable aspects, and recycling as the use of waste itself as resources. Under this strategy, a National 3R Wing has been proposed for the Ministry of Environment and Forests to properly implement waste prevention activities with the help of an interministerial committee to coordinate activities across ministries. A 3R Cell has been constituted within the Department of Environment to monitor the implementation of 3R strategies. Figure 3.2 presents the salient features of the National 3R Strategy. The national goal set out in the strategy document remains far from achieved to date, as both firms and households continue open dumping of waste across the country, and a market for recycled products and an appropriate set of incentives are largely absent. The 16 guiding principles appear comprehensive and specific, covering all dimensions of circularity. Almost all of them are relevant and applicable to any business, including those operating on a traditional model and supporting and promoting the 3R principles.
To promote the 3R principles economy-wide, the strategy document recommends raising public awareness, employing appropriate technology, setting up a 3R secretariat at the Department of Environment, involving all stakeholder groups through public–private partnership, funding through the Clean Development Mechanism, and segregation of waste at the source and special treatment for hazardous waste. It also defines the roles of government agencies, citizens, private sector agencies, nongovernment organizations, and the media. The National 3R Strategy directs the local government authorities to develop their own action plans with setting up quantifiable targets and pursuing organic waste recycling through composting, biogas, and derived fuels.

41
DESIGN-REALITY GAP IN PROMOTING A CIRCULAR ECONOMY IN THE PRIVATE SECTOR: CASE OF WASTE MANAGEMENT AND RECYCLING IN BANGLADESH
3.4.2 Other Regulations and Acts Supporting Circular Economy Principles
Bangladesh has several other environmental regulations and policies that reflect circular economy principles as listed in Table 3.1. These policies and regulations mainly focus on minimizing environmental damage of economic activities through appropriate treatment and management of all kinds of solid wastes, curbing pollution, implementing clean development mechanisms, and encouraging environmentally friendly technology. While the provisions and policies reflect some, they do not fully cover the circular economy principles, such as the 3Rs. In particular, they mainly focus on waste treatment and address less the dimensions of reducing, reusing, and recycling wastes being produced or treated.
Apart from the regulations and policies, the Government of Bangladesh considers environmental sustainability in many of its national-level plans and strategies. Some of the plans and strategies include the Bangladesh Climate Change Strategy and Action Plan 2009, the Bangladesh Environment Climate Change Outlook 2012, the Seventh Five Year Plan (FY2015–FY2020), the Solid Waste Master Plan of Dhaka City (2005), and the Intended Nationally Determined Contributions (2015). In these plans and strategies, the considerations are mainly focused on minimizing environmental degradation through the appropriate treatment and management of solid wastes, while they reflect little to no consideration of circular economy principles. Furthermore, several waste management projects are being implemented by the government with assistance from different agencies, including the World Bank and Waste Concern.
Table 3.1: Policies and Regulations Reflecting Circular Economy Principles
National Renewable Energy Policy, 2008
National Environment Policy, 1992
Bangladesh Environment Conservation Act, 1995
The policy aims to promote the generation of biogas and other environment-friendly energy from waste and to offer incentives for Clean Development Mechanism and green energy projects.
The policy aims to maintain ecological balance and overall development; it identifies the activities that pollute and degrade the environment and outlines the need to ensure sustainable use of the country’s natural resources.
The act is a set of laws with goals to ensure the conservation of the environment (e.g., ecologically critical areas), iwmprovement of environmental standards, and control and mitigation of environmental pollution.
Environmental Court Act, 2000
Environmental Conservation Rules, 1997
Medical Waste (Management and Handling) Rules, 2008
The act provides for the establishment of environmental courts for the trials of offenses relating to environmental pollution and related matters.
A set of rules to implement the Environment Conservation Act, 1995, specifying categorization of real-sector projects with respect to environmental impacts and outlining the procedures for obtaining environmental clearance, ambient standards, and permitted emissions level.
The rules specify and outline the means of source separation, transportation, treatment, and disposal of all kinds of hospital wastes.
Hazardous Waste and Ship Breaking Management Rules, 2011
E-Waste (Electrical and Electronic) Management Rules, 2019
Solid Waste Management Handling Rules (2005, DRAFT)
The rules specify and outline the definition, recycling, and management procedure of all kinds of wastes generated by the ship breaking and recycling industry in Bangladesh.
The rules aim to ensure appropriate management of e-waste and solid waste and to engage the private sector actively in the waste management process.
The rules, yet to be enacted officially, outline the management process of all kinds of solid wastes generated across the country by all parties, including the government and the private sector.
Source: Author.
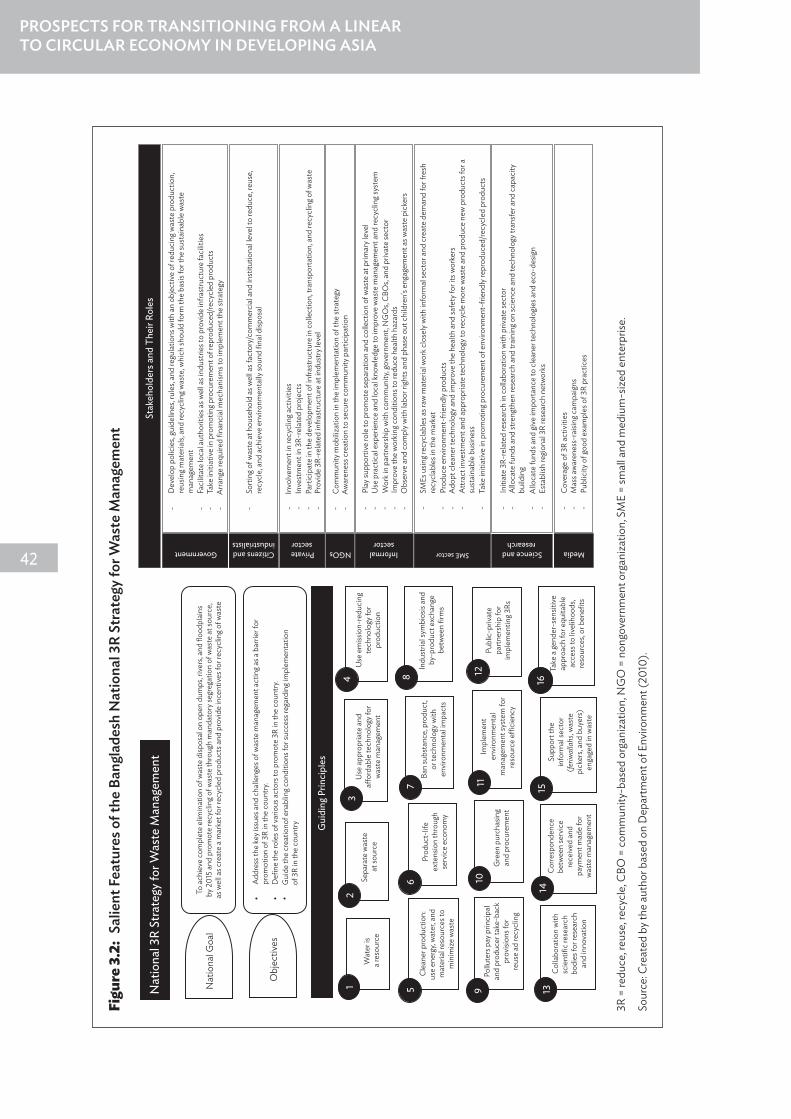
42
PROSPECTS FOR TRANSITIONING FROM A LINEAR TO CIRCULAR ECONOMY IN DEVELOPING ASIA
Figu
re 3
.2:
Salie
nt F
eatu
res o
f the
Ban
glad
esh
Nat
iona
l 3R
Stra
tegy
for W
aste
Man
agem
ent
Nat
iona
l Goa
l
Wat
er is
a
reso
urce
Sepa
rate
was
te
at so
urce
Clea
ner p
rodu
ctio
n:us
e en
ergy
, wat
er, a
nd
mat
eria
l res
ourc
es to
min
imize
was
te
To a
chie
ve c
ompl
ete
elim
inat
ion
of w
aste
disp
osal
on
open
dum
ps, r
iver
s, an
d flo
odpl
ains
by 2
015
and
prom
ote
recy
clin
g of w
aste
thro
ugh
man
dato
ry se
greg
atio
n of
was
te a
t sou
rce,
as w
ell a
s cre
ate
a m
arke
t for
recy
cled
pro
duct
s and
pro
vide
ince
ntiv
es fo
r rec
yclin
g of w
aste
Add
ress
the
key i
ssue
s and
cha
lleng
es o
f was
te m
anag
emen
t act
ing a
s a b
arrie
r for
prom
otio
n of
3R
in th
e co
untry
.D
efine
the
role
s of v
ario
us a
ctor
s to
prom
ote
3R in
the
coun
try.
Gui
de th
e cr
eatio
nof e
nabl
ing c
ondi
tions
for s
ucce
ss re
gard
ing i
mpl
emen
tatio
n of
3R
in th
e co
untry
• • •
Prod
uct-
life
exte
nsio
n th
roug
hse
rvic
e ec
onom
y
Ban
subs
tanc
e, p
rodu
ct,
or te
chno
logy
with
envi
ronm
enta
l impa
cts
Indu
stria
l sym
bios
is an
d by
-pro
duct
exc
hang
ebe
twee
n fir
ms
Gre
en p
urch
asin
gan
d pr
ocur
emen
t
Impl
emen
ten
viro
nmen
tal
man
agem
ent s
yste
m fo
rre
sour
ce e
�ci
ency
Publ
ic-p
rivat
epa
rtner
ship
for
impl
emen
ting 3
Rs
Corre
spon
denc
ebe
twee
n se
rvic
e re
ceiv
ed a
nd
paym
ent m
ade
for
was
te m
anag
emen
t
Pollu
ters
pay
prin
cipa
lan
d pr
oduc
er ta
ke-b
ack
prov
ision
s for
reus
e ad
recy
clin
g
Colla
bora
tion
with
scie
ntifi
c re
sear
ch
bodi
es fo
r res
earc
han
d in
nova
tion
Supp
ort t
hein
form
al se
ctor
(fer
iwal
lahs
, was
te
pick
ers,
and
buye
rs)
enga
ged
in w
aste
Take
a ge
nder
-sen
sitiv
eap
proa
ch fo
r equ
itabl
eac
cess
to liv
elih
oods
,re
sour
ces,
or b
enefi
ts
Use
app
ropr
iate
and
a�or
dabl
e te
chno
logy
for
was
te m
anag
emen
t
Use
em
issio
n-re
duci
ngte
chno
logy
for
prod
uctio
n
Obj
ectiv
es
Nat
iona
l 3R
Stra
tegy
for W
aste
Man
agem
ent
Gui
ding
Prin
cipl
es
12
34
56
78
910
1112
1314
1516
3R =
redu
ce, r
euse
, rec
ycle
, CBO
= c
omm
unity
-bas
ed o
rgan
izatio
n, N
GO
= n
ongo
vern
men
t org
aniza
tion,
SM
E =
smal
l and
med
ium
-size
d en
terp
rise.
Sour
ce: C
reat
ed b
y the
aut
hor b
ased
on
Dep
artm
ent o
f Env
ironm
ent (
2010
).
Dev
elop
pol
icie
s, gu
idel
ines
, rul
es, a
nd re
gula
tions
with
an
obje
ctiv
e of
redu
cing
was
te p
rodu
ctio
n,re
usin
g mat
eria
ls, a
nd re
cycl
ing w
aste
, whi
ch sh
ould
form
the
basis
for t
he su
stai
nabl
e w
aste
man
agem
ent
Faci
litat
e lo
cal a
utho
ritie
s as w
ell a
s ind
ustri
es to
pro
vide
infra
stru
ctur
e fa
cilit
ies
Take
initi
ativ
e in
pro
mot
ing p
rocu
rem
ent o
f rep
rodu
ced/
recy
cled
pro
duct
sA
rrang
e re
quire
d fin
anci
al m
echa
nism
s to
impl
emen
t the
stra
tegy
Invo
lvem
ent i
n re
cycl
ing a
ctiv
ities
Inve
stm
ent i
n 3R
-rel
ated
pro
ject
s
Com
mun
ity m
obiliz
atio
n in
the
impl
emen
tatio
n of
the
stra
tegy
Awar
enes
s cre
atio
n to
secu
re c
omm
unity
par
ticip
atio
n
Play
supp
ortiv
e ro
le to
pro
mot
e se
para
tion
and
colle
ctio
n of
was
te a
t prim
ary l
evel
Use
pra
ctic
al e
xper
ienc
e an
d lo
cal k
now
ledg
e to
impr
ove
was
te m
anag
emen
t and
recy
clin
g sys
tem
Wor
k in
partn
ersh
ip w
ith c
omm
unity
, gov
ernm
ent,
NG
Os,
CBO
s, an
d pr
ivat
e se
ctor
Impr
ove
the
wor
king
con
ditio
ns to
redu
ce h
ealth
haz
ards
Obs
erve
and
com
ply w
ith la
bor r
ight
s and
pha
se o
ut c
hild
ren'
s eng
agem
ent a
s was
te p
icke
rs
SMEs
usin
g rec
ycla
bles
as r
aw m
ater
ial w
ork c
lose
ly w
ith in
form
al se
ctor
and
cre
ate
dem
and
for f
resh
re
cycl
able
s in
the
mar
ket
Prod
uce
envi
ronm
ent-
frien
dly p
rodu
cts
Ado
pt c
lean
er te
chno
logy
and
impr
ove
the
heal
th a
nd sa
fety
for i
ts w
orke
rsAt
tract
inve
stm
ent a
nd a
ppro
pria
te te
chno
logy
to re
cycl
e m
ore
was
te a
nd p
rodu
ce n
ew p
rodu
cts f
or a
su
stai
nabl
e bu
sines
sTa
ke in
itiat
ive
in p
rom
otin
g pro
cure
men
t of e
nviro
nmen
t-fri
endl
y rep
rodu
ced/
recy
cled
pro
duct
s
Initi
ate
3R-r
elat
ed re
sear
ch in
col
labo
ratio
n w
ith p
rivat
e se
ctor
Allo
cate
fund
s and
stre
ngth
en re
sear
ch a
nd tr
aini
ng o
n sc
ienc
e an
d te
chno
logy
tran
sfer
and
cap
acity
bu
ildin
gA
lloca
te fu
nds a
nd gi
ve im
porta
nce
to c
lean
er te
chno
logi
es a
nd e
co-d
esig
nEs
tabl
ish re
gion
al 3
R re
sear
ch n
etw
orks
Cove
rage
of 3
R ac
tiviti
esM
ass a
war
enes
s-ra
ising
cam
paig
nsPu
blic
ity o
f goo
d ex
ampl
es o
f 3R
prac
tices
Prov
ide
3R-r
elat
ed in
frast
ruct
ure
at in
dust
ry le
vel
Parti
cipa
te in
the
deve
lopm
ent o
f inf
rast
ruct
ure
in c
olle
ctio
n, tr
ansp
orta
tion,
and
recy
clin
g of w
aste
Sorti
ng o
f was
te a
t hou
seho
ld a
s wel
l as f
acto
ry/c
omm
erci
al a
nd in
stitu
tiona
l leve
l to
redu
ce, r
euse
,re
cycl
e, a
nd a
chie
ve e
nviro
nmen
tally
soun
d fin
al d
ispos
al
- - - - - - - - - - - -- - - - - - - - - - - - -
Stak
ehol
ders
and
The
ir Ro
les
Government NGOs MediaCitizens andindustrialists
Private sector
Informalsector
SME sector Science and research
- - -

43
DESIGN-REALITY GAP IN PROMOTING A CIRCULAR ECONOMY IN THE PRIVATE SECTOR: CASE OF WASTE MANAGEMENT AND RECYCLING IN BANGLADESH
3.5 Business Cases Directly Supporting Circular Economy Principles in Bangladesh
There is no official count of the number of private business enterprises in Bangladesh supporting circular economy principles or the 3Rs. In addition, there is no specific source where statistics and information about circular economy-based enterprise can be found. After a thorough literature search and discussion with officials from the Ministry of Environment, eight private enterprises could be recognized doing business based on 3R or circular economy principles. There could be some others at a micro or small scale; however, no official inventory or lists are available. Out of the eight, three could not be reached for an interview. Thus, the cases of five enterprises have been examined in developing this chapter: Azizu Recycling & E-Waste Company, Digital Vangariwala, Pro Recycling Limited, Junk Enterprise, and Garbageman. It is important to note that all five companies are engaged in waste recycling—industrial, corporate, and household—and thus, these cases cover only a part of the broader circular economy model. The companies typically collect, process, and resell wastes to their corporate clients, mostly internationally. It means that the other major parts of the circular economy model, such as dedicated production using the recycled materials or product-as-a-service model, are absent in Bangladesh. There are several reasons these business models are absent to date; fundamentally, the lack of official government recognition of the circularity industry; negative public perception about working with waste and recycled materials; and the lack of knowledge, education, and awareness about the business potentials of recycled materials. The fact that the cases presented in this chapter primarily focus on recycling and trading only reflects the infant stage of the circular economy Bangladesh is going through currently.
Due to the intermittent COVID-19 lockdowns and high-level restrictions in physical movement and meetings from April 2020 to today, separate interviews were conducted online with high-level officials of the five companies. The interview questionnaire is provided in Appendix 3.1. As suggested by the company officials, much of the secondary information was obtained from the company websites and published reports. Before detailing the challenges the companies face and the policies necessary to overcome them, it could be helpful to present a brief overview of the five private enterprises.
3.5.1 Azizu Recycling & E-Waste Company
Name Azizu Recycling & E-Waste CompanyAddress Delpara, Chairman Bari Road, Kutubpur, Fatullah, Narayangonj. https://azizu.com/Sector E-wasteYear of establishment 2006 Products/services E-waste recyclingType of company Private companyOwnership Local individual (total shareholding 100%)Initial capital Tk200,000Current value proposition Reduce electronic waste by minimizing the cost of waste disposal management efforts
for companies, industries, and further recyclersCurrent revenue model Selling recycled materials and collecting fees from clients whose waste they collect
With the motto “To Promote a Green Bangladesh as Well as a Green World,” Azizu Recycling & E-Waste Company Ltd. was formed in 2006 as a computer parts and accessories importer and retailer. Azizu started working with Tes-Amm in 2008 as an authorized representative to connect their clients for all

44
PROSPECTS FOR TRANSITIONING FROM A LINEAR TO CIRCULAR ECONOMY IN DEVELOPING ASIA
matters related to electrical and electronic waste management in Bangladesh. Currently, Azizu is the largest of the known waste management companies in the country.
Figure 3.3 summarizes the process Azizu follows in recycling electronic wastes. The company is a leading ISO certified e-waste collector and manager in Bangladesh with separation and dismantling technology for the telecommunication service providers and industries, including medical, information and communication technology (ICT), garments, textiles, mobile devices, vehicles, computers, and motherboards. The company’s service portfolio includes e-waste collection, on-site inspection, on-the-spot disposal, and industrial recycling. As of May 2021, the company has served 589 clients with 256 projects and more than 47 business partners. It is important to note that Azizu is a relatively large and well-known recycling company in Bangladesh, as many of the other waste management companies currently operating sell their collections.
Figure 3.3: Azizu’s E-Waste Recycling Activities and Scope
Source: Created by the author as reported by the company.
Leftover e-Waste or scrapreturned to the factory for recycling
FACTORYProduce metallic/non-metallicpowder or ingot from recycledor virgin metal or a mix of the two
WASTE CARRIERCollect electric and electronicwaste from corporations and/orhouseholds and ship to factory
CORPORATE CONSUMERS
HOUSEHOLD CONSUMERS
LANDFILL
DISTRIBUTIONSupply to finished goodsmanufacturer
WHOLESALERS/RETAILERS/BRAND OWNERSCollect electric and electronicwaste from corporations and/orhouseholds and ship to factory
Leftover e-waste or scrapreturned to the factory for recycling
E-WASTE RECYCLING FLOW CHART

45
DESIGN-REALITY GAP IN PROMOTING A CIRCULAR ECONOMY IN THE PRIVATE SECTOR: CASE OF WASTE MANAGEMENT AND RECYCLING IN BANGLADESH
Azizu has a long-standing relationship with a number of corporate waste suppliers and buyers both home and abroad. Figure 3.4 shows the major industrial suppliers of electronic wastes and international buyers of their processed and recycled wastes. Table 3.2 shows that while the company sources its different categories of e-wastes from local suppliers, all of its major buyers are from Asia. The company’s industrial facility is located in Narayanganj—a port city adjacent to Dhaka. The industrial facility has its own electrical substation, gas generators, profound water siphon, water supply, water treatment plant, most recent apparatus, and master labor force to guarantee naturally protected ideal
Figure 3.4: Major Suppliers and Buyers of Azizu and Their Business Share
Source: Created by the author based on company-provided data.
Step One Group12%
Sofia Magnet7%
MajesticDiversifed Sdn.
Bhd.6%Abriotech
5%Popzki Enterprise
6%
Intrepid AsiaVentures Pte Ltd.
12%
Afro Traders9%Desmond
11%
SupportiveRecycling Gmbh
8%
Other36%
HimanshuEnterprise
6%
SaifanInternational
9%
Ohi Traders6%
Tech Source11%
Shihab Traders7%
LimmoInternational
14%
SM International16%
Other19%
Major Suppliers of Azizu Recycling & E-Waste Company Major Buyers of Azizu Recycling & E-Waste Company
Table 3.2: Major Suppliers and Buyers of Azizu
Supplier Waste Type Origin Buyer Waste Type OriginStep One Group Electronic scrap Bangladesh Sofia Magnet Electronic scrap IndiaHimanshu Enterprise
Computer scrap Bangladesh Majestic Diversified Sdn. Bhd.
Electronic scrap Malaysia
Saifan International
Computer scrap Bangladesh Abriotech Scrap boards Philippines
Ohi Traders Computer scrap, electronic scrap
Bangladesh Popzki Enterprise Computer scrap Philippines
Tech Source Mobile scrap Bangladesh Intrepid Asia Ventures Pte Ltd.
Electronic scrap Singapore
Shihab Traders Catalytic converter scrap
Bangladesh Afro Traders Computer scrap United Arab Emirates
Limmo International
Mobile scrap Bangladesh Desmond Computer scrap Singapore
SM International Cooling fan, air-conditioning
Bangladesh Supportive Recycling Gmbh
Electronic scrap Singapore
Source: Developed by the author based on company-provided data.

46
PROSPECTS FOR TRANSITIONING FROM A LINEAR TO CIRCULAR ECONOMY IN DEVELOPING ASIA
waste reuse. There are five separate units with cutting-edge and environment-friendly technology and machinery for e-waste recycling and reuse: printed circuit board (PCB) reusing unit, link wire reusing unit, copper electrolysis unit, valuable metals reusing unit, and research facility unit. They also have a plastic recycling machine that complements the five recycling units. Azizu collects electronic and electrical wastes as raw materials from imported as well as local sources. The materials are then manually sorted into separate waste streams consisting of similar items, such as PCBs, power boards, riser cards, nonferrous metals (stainless steel, aluminum, etc.), ferrous metals, plastic, copper, and mixed wires. These segregated streams go through separate automated processes of grinding, crushing, hammer mill, electrostatic separation, and chemical processes to obtain plastic resin and other metallic ingots. These plastic and various metals are the final output of the recycling process that is sold to local manufacturers as the raw materials of their production lines.
3.5.2 Digital Vangariwala
Name Digital VangariwalaAddress Digital Vangariwala Pakuriya, Khantek, Sector 14, Uttara, Dhaka. https://bdrecycle.com/Sector Offices, institutions, households, and schools to dispose of their wasteYear of establishment 2018Products/services Receive unused product in bulk Coverage Paper, polybags, cansType of company Sole proprietorship, start-upOwnership structure Local individual (total shareholding 100%)Initial capital Not reportedCurrent value proposition Contributing to sustainability, while offering individuals and companies incentives for
correctly disposing of wastes, by delivering household and office wastes to producers and manufacturers
Current business model Buying or collecting at no cost household and industrial wastes and selling them to producers at wholesale and retail levels
Digital Vangariwala is a state-of-the-art organization that sells users’ household and corporate waste online and pays them for it. The company delivers the opportunity to people to sell their wastes (called vangari in Bengali language) at their doorstep. Vangariwala collects wastes ready for disposal at no cost from offices, factories, households, and schools, and further supplies these wastes to authorized recycling centers, confirming safety and sustainability for the environment. Table 3.3 shows the major suppliers and buyers of Digital Vangariwala—all of which are local. Azizu, the first case study, is a major buyer for the company, occupying about 31% of all its sales, followed by Shovon Group (28%), Universe Style (13%), Grameen Krishok (11%), and Tresa (9%).
Any individual or organization can call and book Vangariwala to collect their wastes ready for disposal. After collection, they separate the wastes into different categories, such as cans, bags, and boxes. Once sorted, the items are then cleaned and refurbished. Vangariwala sells the refurbished items to different organizations that use them as raw materials or inputs for their production or retail businesses. For example, Vangariwala sells disposable papers to packaging or paper manufacture companies, plastic bottles, and pharmaceutical bottle-producing companies. While most sales happen at a bulk or wholesale level, Vangariwala has an online selling platform for the recycled items ready for sale, from where any client can choose and order items and get them delivered to the doorstep. In terms of measurable environmental impacts to date, the company has saved 63.73 kilowatts of energy and 5,959,860.82 liters of oil through a network of more than 40,000 registered users.
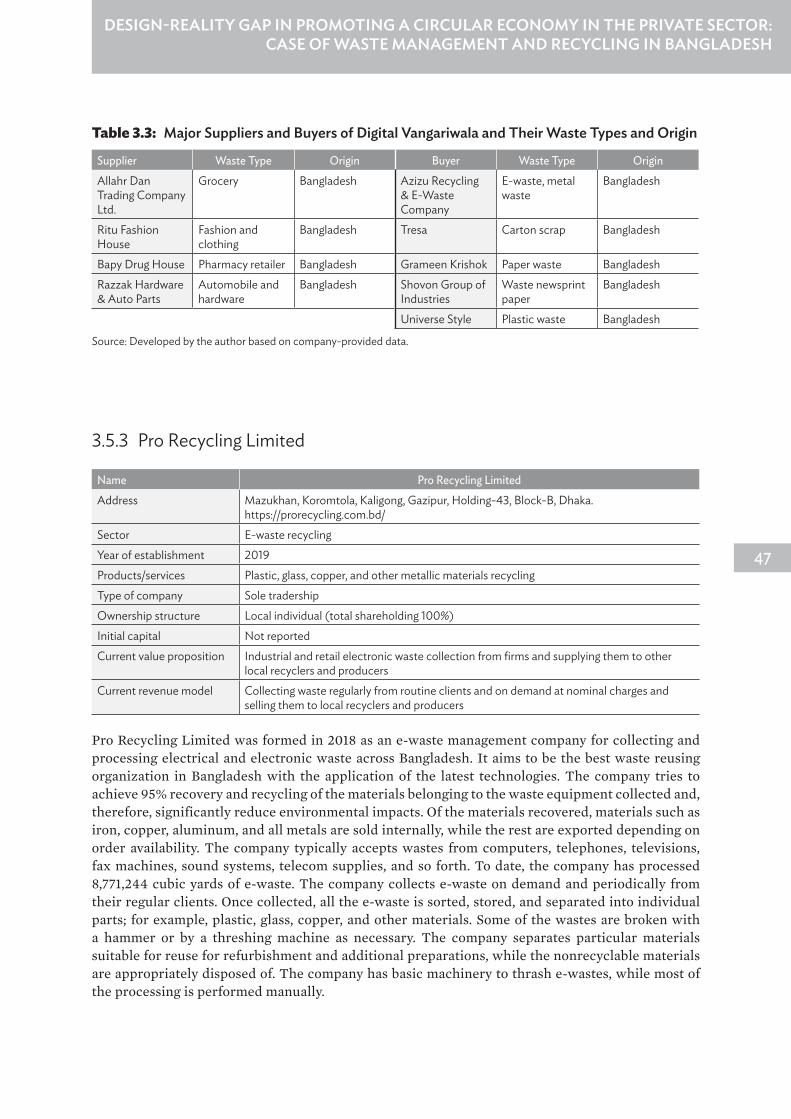
47
DESIGN-REALITY GAP IN PROMOTING A CIRCULAR ECONOMY IN THE PRIVATE SECTOR: CASE OF WASTE MANAGEMENT AND RECYCLING IN BANGLADESH
Table 3.3: Major Suppliers and Buyers of Digital Vangariwala and Their Waste Types and Origin
Supplier Waste Type Origin Buyer Waste Type OriginAllahr Dan Trading Company Ltd.
Grocery Bangladesh Azizu Recycling & E-Waste Company
E-waste, metal waste
Bangladesh
Ritu Fashion House
Fashion and clothing
Bangladesh Tresa Carton scrap Bangladesh
Bapy Drug House Pharmacy retailer Bangladesh Grameen Krishok Paper waste BangladeshRazzak Hardware & Auto Parts
Automobile and hardware
Bangladesh Shovon Group of Industries
Waste newsprint paper
Bangladesh
Universe Style Plastic waste Bangladesh
Source: Developed by the author based on company-provided data.
3.5.3 Pro Recycling Limited
Name Pro Recycling LimitedAddress Mazukhan, Koromtola, Kaligong, Gazipur, Holding-43, Block-B, Dhaka.
https://prorecycling.com.bd/Sector E-waste recycling Year of establishment 2019Products/services Plastic, glass, copper, and other metallic materials recyclingType of company Sole tradershipOwnership structure Local individual (total shareholding 100%)Initial capital Not reportedCurrent value proposition Industrial and retail electronic waste collection from firms and supplying them to other
local recyclers and producersCurrent revenue model Collecting waste regularly from routine clients and on demand at nominal charges and
selling them to local recyclers and producers
Pro Recycling Limited was formed in 2018 as an e-waste management company for collecting and processing electrical and electronic waste across Bangladesh. It aims to be the best waste reusing organization in Bangladesh with the application of the latest technologies. The company tries to achieve 95% recovery and recycling of the materials belonging to the waste equipment collected and, therefore, significantly reduce environmental impacts. Of the materials recovered, materials such as iron, copper, aluminum, and all metals are sold internally, while the rest are exported depending on order availability. The company typically accepts wastes from computers, telephones, televisions, fax machines, sound systems, telecom supplies, and so forth. To date, the company has processed 8,771,244 cubic yards of e-waste. The company collects e-waste on demand and periodically from their regular clients. Once collected, all the e-waste is sorted, stored, and separated into individual parts; for example, plastic, glass, copper, and other materials. Some of the wastes are broken with a hammer or by a threshing machine as necessary. The company separates particular materials suitable for reuse for refurbishment and additional preparations, while the nonrecyclable materials are appropriately disposed of. The company has basic machinery to thrash e-wastes, while most of the processing is performed manually.

48
PROSPECTS FOR TRANSITIONING FROM A LINEAR TO CIRCULAR ECONOMY IN DEVELOPING ASIA
Pro Recycling is the initiator of two environmental initiatives: Greenwise Business program and Zero Waste Business. The mission of the Greenwise Business program is to encourage recycling efforts in the business community by providing businesses with the resources and support needed to improve recycling programs and reward companies that contribute to the environment. On the other hand, through the Zero Waste Business initiative, the company assists any organization in transforming into a “zero waste” facility by recycling over 99% of their waste. Pro Recycling is an affiliated member of Utah-based Business for People, Planet and Profit initiative, the Utah Recycling Alliance, and the American Sustainable Business Council.
3.5.4 Junk Enterprise
Name Junk EnterpriseAddress Shop #15/A, KJH Mansion, 83 Laboratory Road, New Elephant Road, Dhaka-1205,
Bangladesh. https://junksky.com/Sector E-wasteYear of establishment 2018Products/services Recycling of a wide range of metal Type of company Sole tradershipOwnership structure Local individual (total shareholding 100%)Initial capital Not reportedCurrent value proposition Reducing industrial and medical waste, saving the environment, and supplying recycled
industrial parts to manufacturers and recyclersCurrent business model Collecting high-volume industrial electronic and metal wastes at no or nominal cost and
selling them internationally
Junk Enterprise Scrap Metals buys and sells metal scrap of all types, of any quantity, and has a wide variety of service offerings to fit clients’ specific needs. The company processes and sells to world-class recycling companies of scrap metals such as stainless steel, nickel, ferrous and nonferrous metals, and computer, industrial, and telecommunication parts. The company accepts e-wastes arising from a wide range of sources, including telecommunication equipment, all kinds of generators, all types of PCBs, computers and their accessories, industrial machinery, railway equipment, vehicles, mobile phones and accessories, medical equipment and technologies, and batteries (lithium/nonlithium). Table 3.4 presents the list of major suppliers and buyers of Junk Enterprise, alongside their current business share and origin. Like Azizu, the company sources all wastes locally but sells mostly internationally to their Asian buyers. Most of their wastes collected and sold are electronic and mobile scraps.
Junk Enterprise has stable logistic support throughout the country. Every time the company collects scraps from PCBs, mobile phones, computers, and telecommunication parts of all types from local collectors, they send them to designated warehouses and recycling zones. The company can take rapid action on demand for collecting e-waste that is dangerous for the environment and public health. Junk Enterprise offers a complete line of on-site collection services and is well equipped to handle any size pickup, servicing small businesses, large corporations, and entire cities. The company can handle a national-level e-waste collection program.

49
DESIGN-REALITY GAP IN PROMOTING A CIRCULAR ECONOMY IN THE PRIVATE SECTOR: CASE OF WASTE MANAGEMENT AND RECYCLING IN BANGLADESH
3.5.5 Garbageman
Name Garbageman Address H#64, Panna Plaza, Muktijodha Soroni Road, Dokhinkhan, Dhaka-1230.
https://garbageman.com.bd/Sector All kinds of wasteYear of establishment 2018Products/services Compost production through recycling Coverage As much as possible Type of company Private companyOwnership structure Local individual (total shareholding 100%)Initial capital Not reportedCurrent value proposition Recycling organic agricultural wastes into organic fertilizer, and offering hassle-free
door-to-door collection and delivery of wastes by a team of trash collectors and technology platforms
Current business model Collecting office and household nonindustrial wastes door-to-door at no cost and recycling them to sell locally and internationally
Garbageman (or Trash Collector), the first ICT-based reusing start-up in Bangladesh, was established in 2018 with its vision to contribute to making a cleaner and greener Bangladesh by presenting an advanced and logical methodology toward a proficient waste administration framework. Through reuse of natural and inorganic waste into reusable items, Garbageman tries to improve the financial position of the framework. The company has trash collectors who provide “door-to-door” waste
Table 3.4: Major Suppliers and Buyers of Junk Enterprise
Supplier Waste Type Origin Share Buyer Waste Type Origin ShareModern IT Enterprise
Computer scrap
Bangladesh 25% Tech Pro Sdn. Bhd.
Electronic scrap
Malaysia 16%
Maxis Group Electronic scrap
Bangladesh 21% Intrepid Asia Ventures Pte Ltd.
Electronic scrap
Singapore 15%
Tech Source Mobile scrap Bangladesh 19% Max Power Sdn. Bhd.
Scrap boards Philippines 13%
Syed International
Computer scrap
Bangladesh 13% Zay Corp Electronic scrap
India 12%
Talukder Traders
Computer and electronic scrap
Bangladesh 10% Popzki Enterprise
Computer scrap
Philippines 12%
Ilaha Com
Computer scrap
United Arab Emirates
9%
Pro Recycling Corp
Electronic scrap
Singapore 9%
Desmond Computer scrap
Singapore 7%
Source: Developed by the author based on company-provided data.

50
PROSPECTS FOR TRANSITIONING FROM A LINEAR TO CIRCULAR ECONOMY IN DEVELOPING ASIA
collection services exclusively in Dhaka; the company makes it easy for everyone to manage their waste in a fast-moving life. The Trash to Cash online recycling platform of the company allows individual citizens and users to segregate their waste at the source and save the recyclables like plastic, paper, glass, and aluminum from ending up at the landfills. To date, the company has collected 30 tons of waste, of which 99% has been recycled, impacting over 47,000 lives. Table 3.5 shows that the company mainly collects paper and plastic wastes from local suppliers and sells them after recycling locally and internationally.
Table 3.5: Major Waste Suppliers and Buyers of Garbageman
Supplier Waste Type Origin Share Buyer Waste Type Origin ShareKazi Farms Agro Bangladesh 23% AgroMax
Fertilizer Co.Fertilizer Bangladesh 23%
Fateh Dairy Farm
Plastic and paper
Bangladesh 21% Green Nursery
Nursery Bangladesh 18%
Orion Travels
Paper Bangladesh 19% CleanCo Limited
Plastic and paper scrap
Philippines 16%
Talukder Plastic Co.
Plastic Bangladesh 16% Satu Zalan Sdn. Bhd.
Plastic scrap Malaysia 15%
Shoham Distributor
Packaging Bangladesh 9% Nirmila Trash Ltd.
Scrap boards India 13%
Source: Developed by the author based on company-provided data.
The company has a unique product line: a vermicompost fertilizer from the waste collected. Using the organic agricultural waste collected, Garbageman produces Regen Vermicompost, a unique fertilizer for plants solely made of recycled organic waste. It retains soil moisture and boosts plant immunity while providing necessary nutrients to grow faster, greener, and healthier. Regen Vermicompost will ensure plants’ health and nutrient consumption by holding the moisture and maintaining the soil’s pH level. It contains 60 micronutrients such as calcium, magnesium, nitrogen, phosphate, and potash. With Regen Vermicompost, a plant does not require any added pesticides as Regen extracts any toxic fungi and bacteria out of the soil, making the plants greener and more potent. Garbageman sells the fertilizer online and to selected external retailers directly.
Garbageman also administers consultancy services to organizations on making zero waste practices. By conferring rules and techniques on the best way to reduce, reuse and recycle at a cheaper rate, the point is to improve productivity and elevate associated support to bring issues to light. The company is partnered with and supported by ygap, the United Nations Development Programme, the ICT Division of the Government of Bangladesh, TU Delft, YY Goshthi, Monstarlab, and Startup Bangladesh— a Bangladesh government funding initiative for start-ups.
3.6 Challenges and OpportunitiesDuring the interviews, the top management officials of the five enterprises were asked about the challenges they faced in setting up the business initially and those they currently face in running the business profitably and successfully. The companies’ challenges are classified and discussed as per the

51
DESIGN-REALITY GAP IN PROMOTING A CIRCULAR ECONOMY IN THE PRIVATE SECTOR: CASE OF WASTE MANAGEMENT AND RECYCLING IN BANGLADESH
categories presented in Table 3.6. Many of the challenges faced by the recycling companies are at the initial stage of setting up an enterprise, while others arise at both the initial and the operational stage. Overcoming the challenges will likely open up enormous opportunities, not only for the business but also for the economy of Bangladesh as a whole.
Table 3.6: Challenges Identified by the 3R-Oriented Private Sector Business Enterprises
Challenges Initial stage Operational stageCapital-intensive nature √ √
No or limited access to finance √ √
Negative mindset of stakeholders √ √
No government support mechanism √ √
Nonexistence of market for recycled products X √
Lack of education and awareness about waste management √ √
Moral hazard in waste management √ √
Lack of regulation and enforcement X √
Lack of recognition as a formal sector √ √
Lack of trained human resources √ √
3R = reduce, reuse, and recycle.
Source: Based on interviews with the top-level officials of the selected five companies.
3.6.1 Capital-Intensive Nature
Large-scale solid waste recycling often requires the application of high-end and capital-intensive technologies. The companies reported that it is a significant barrier for them, as they cannot introduce high-end waste processing and recycling technologies due to the lack of large capital funding. For example, all five companies perform the waste sorting manually; it would require significant investment if the companies wish to do the job with the help of capital machinery. Due to the capital-intensive nature, the companies interviewed reported that it would be almost impossible to expand their business beyond a certain level. It would be nearly impossible to process and recycle waste manually on a larger scale. This challenge often prevents new entrepreneurs from setting up new recycling ventures and the prevents existing ones from expanding their business to a larger scale. Four of the cases, except Azizu, reported that their revenues and profitability are still not large enough to be able to accumulate cash and purchase capital-intensive equipment.
3.6.2 No or Limited Access to Finance
Access to timely, affordable, and adequate financing is always a key barrier in efforts to go green and adopt sustainable practices in the private sector (Barua 2020a; Barua and Chiesa 2019). All five companies expressed their dissatisfaction about the availability of and access to financing to set up a recycling business. As they reported, it is very difficult to arrange a small amount of seed capital to start an enterprise. In particular, formal financial institutions are very reluctant to provide financing to recycling industries as they are not treated as mainstream business enterprises. The interviews revealed

52
PROSPECTS FOR TRANSITIONING FROM A LINEAR TO CIRCULAR ECONOMY IN DEVELOPING ASIA
that when the companies approached banks for initial and operational stage capital financing, banks denied it, as the recycling industries were not included in their acceptable business list for lending. Four of the cases, except Azizu, reported that banks still do not find their revenues and profits stable enough for offering large-scale credit facilities.
3.6.3 Negative Mindset of Stakeholders
The companies reported that stakeholders still consider businesses where “waste” is the product with a negative mindset. At the initial stage of enterprise setup, entrepreneurs faced a negative mindset from their relatives, friends, and support network. As the companies’ top management officials reported, doing business with “waste” is a “wasteful business” since it is not considered in society as a respected profession. It prevents entrepreneurs and innovators from taking up challenges and starting a company based on circularity principles. The negative public mindset discourages and hurts the existing entrepreneurs and often motivates them to switch to alternative businesses.
3.6.4 No Government Support Mechanism
The government currently offers no support mechanism for businesses that are based on or that support the circularity principles. It does not currently offer any fiscal support to private firms promoting 3R or circular economy principles. As reported by the companies interviewed, fiscal supports, such as tax rebates, tax holidays, or subsidies, could be beneficial for them to expand their existing capacity for a suitable period. Furthermore, such support could encourage more new entrepreneurs to enter into the recycling business. The firms also reported that the absence of fiscal incentives on the purchase of recycled materials in the industrial, manufacturing, and service sectors disallows market creation for recycled outputs. Of course, government support is primarily sought because the firms cannot grow at a large scale and create a sustainable local market. Once a sustainable local market for recycled goods is created, the firms could then diversify their business lines from the existing basic recycling and trading businesses, e.g., producing products using the recycled waste or producing products that could be delivered to the market on a shared basis (product-as-a-service model). It would allow them not only to grow but also to become economically viable and stronger.
3.6.5 Nonexistence of Market for Recycled Products
The companies reported that it is often very difficult to find a market for recycled and refurbished output, as individuals and firms remain shaky about the quality of recycled and refurbished products. In particular, industrial, manufacturing, and service sector firms are often reluctant to procure recycled or refurbished products for use as inputs in their production and operational processes due to confusion and lack of confidence about the outputs’ longevity and quality. As the companies reported, even if the refurbished or recycled items are of high quality, it is difficult to convince potential firm-level clients.
3.6.6 Lack of Education and Awareness about Waste Management
It is often challenging to create a market for recycled and refurbished products due to a lack of appropriate knowledge and awareness about recycling processes. According to the companies, a low level of public awareness in the industrial, manufacturing, and service sectors about waste types and their distinctive disposal processes makes it difficult for them to source the right wastes they need from the right places in a timely manner. It allows many harmful wastes to go directly to the environment and cause significant damage. There is also a lack of understanding among firms across all sectors that wastes can be encashed by selling them to the recycling companies.

53
DESIGN-REALITY GAP IN PROMOTING A CIRCULAR ECONOMY IN THE PRIVATE SECTOR: CASE OF WASTE MANAGEMENT AND RECYCLING IN BANGLADESH
3.6.7 Moral Hazard in Waste Management
The interviews revealed that most firms across the industrial and manufacturing sectors do not follow appropriate waste disposal and management practices and protocols. They deliberately release and throw away waste into the environment, which harms the environment and reduces the availability of valuable waste resources for the recycling firms. Firms often do this to either avoid the responsibility to transfer waste to recycling companies or save the cost of waste management. A few of the companies interviewed reported such irresponsible waste management behavior allows them to collect waste at zero sourcing cost from streets and waste bins placed randomly in business districts and industrial localities. All companies consider that the behavior highlights the need to the public for establishing a systematic waste management culture and process coupled with large-scale recycling efforts from the government and the private sector.
3.6.8 Lack of Regulation and Enforcement
The companies interviewed expressed dissatisfaction about the absence of regulations specific to regulating and facilitating a separate 3R or circular economy sector. Furthermore, the existing environmental legislation is often poorly enforced with minimal proactive government actions on environmental degradation by firms. Industries, manufacturers, and service sector firms must comply with several environmental regulations outlined in section 3.4. The companies reported that the government is often lenient in enforcing waste management rules and protocols on polluting firms, which harms the environment and reduces the supply of reusable and recyclable waste resources to the recycling industries in Bangladesh. While regulations and their enforcement need to be stricter and more timely, they should also offer incentive mechanisms for those who perform better in terms of waste disposal, processing, and management including the firms engaged in the recycling business.
3.6.9 Lack of Recognition as a Formal Sector
Recycling businesses are still not considered a formal sector by law in Bangladesh. The companies interviewed expressed their frustration that even the government still views their business as a part of an informal economy despite their hard work. According to the companies, the lack of appropriate government regulations recognizing recycling businesses as a formal sector is a significant barrier in developing their businesses—and the industry itself. For example, banks often deny lending due to the absence of recognition of their business as a formal sector.
3.6.10 Lack of Trained Human Resources
The companies interviewed reported their significant difficulties finding trained people to collect, sort out, process, and recycle waste. They think it is because the sector is not developed yet; there is a dearth of human resources skilled in waste management. As such, there is minimal opportunity for formal education in this field in Bangladesh. The companies reported that most of their field-level staff in their collection team or at the processing centers have an education background of higher secondary level or less.
While there are significant opportunities, these challenges have not been looked at to date from the ground level, according to the cases studied. The cases studied revealed at least two reasons the challenges remain overlooked. First, there are no comprehensive recycling sector studies available yet that offer complete insights and useful data and information on the recycling industry. The absence of data and information eventually undermines the potential of this industry, and in most cases puts it out of the priority list of the policy makers and regulators. Second, there is no coordinated association of the

54
PROSPECTS FOR TRANSITIONING FROM A LINEAR TO CIRCULAR ECONOMY IN DEVELOPING ASIA
recycling businesses operating in the country. As a result, there is a significant lack of communication and consultation between the government agencies and existing businesses when it comes to the point of facilitating an effective ecosystem for the recycling industry.
3.7 Policy RecommendationsThe challenges identified from the interviews are more or less common in the five cases studied, and addressing the challenges above could offer significant overlapping opportunities. For example, affordable and adequate access to funding opportunities could allow the existing or new entrepreneurs to acquire the capital needed to get the expensive technologies and equipment needed for setting up a business (Chiesa and Barua 2019; Barua 2020b; Chiesa, McEwen, and Barua 2021). It would in turn create employment opportunities, particularly among the growing number of young and innovative entrepreneurs of Bangladesh. Such employment opportunities could be innovation-driven and utilize Bangladesh’s demographic dividend if appropriate skill development opportunities can be created through formal education and training delivery mechanisms (e.g., making it part of the vocational and general school curriculum). Similarly, the introduction of a formal regulatory framework will offer official recognition of the recycling industry, which could help in overcoming the problem of the negative public mindset, creating a market for recycled products, and allowing formal financial institutions to extend credit facilities.
The interviews from the five private sector businesses revealed some policy suggestions, which the government could consider to make the circular economy mainstream. The following key policy considerations outlined by the private sector enterprises are presented.
3.7.1 Active Regulation
To overcome the problems of recognition and public policy supports, it is essential that the recycling industry be recognized as a formal sector and be brought under the purview of specific regulation. Once this is done, businesses supporting or promoting 3R or circularity principles will receive their due credit and acceptance in the government’s fiscal measures. It will also facilitate the sector to grow as part of the formal economy.
3.7.2 Mass Awareness and Education
According to the companies interviewed, the government needs to take up mass awareness and promotional campaigns to make both the producers and the consumers responsible. All government ministries, such as the ministries of industry, commerce, health, and tourism, could take up coordinated efforts to make industries, manufacturers, and service sector firms aware and motivate them to adopt the circular economy principles. Furthermore, appropriate vocational academic or training programs should be introduced to develop human resources skilled in waste handling, processing, and management. Bangladesh is currently one of the top-ranked countries in exporting unskilled and semi-skilled labor to the international market. The country could officially recognize the recycling industry and thus offer official recognition to the informal labor currently working in the industry. Once officially recognized, the informal workforce and the labor currently exported could be turned into highly-skilled human resources for the circular economy, if appropriate education and training can be designed and delivered through formal (e.g., universities and vocational institutes) and informal (e.g., nongovernment organizations and development agencies supporting the labor market) channels. While this approach will reduce or remove the vulnerability of the informal workforce or the unemployed, it could be an essential input in transforming Bangladesh’s linear economy into a circular one

55
DESIGN-REALITY GAP IN PROMOTING A CIRCULAR ECONOMY IN THE PRIVATE SECTOR: CASE OF WASTE MANAGEMENT AND RECYCLING IN BANGLADESH
3.7.3 Examples Set by the Public Sector of Actively Applying Circularity Principles
To promote circular economy principles, the companies urge the government agencies and institutions to set an example by implementing the principles. Bangladesh has several state-owned commercial and nonprofit enterprises in the utilities, manufacturing, industrial, and service sectors. If the government starts implementing circular economy principles successfully, such as procuring recycled products and transferring waste to designated recycling companies, it would eventually motivate the private sector to come forward and join the progress.
3.7.4 Concessional Financing
The companies consider financing a significant barrier in the development of their businesses and the industry. They suggest the government assign the circularity principles a top priority and organize concessional financing for start-ups and mature companies that promote and support the principles. For example, banks in Bangladesh, with Bangladesh Bank (the central bank) funding supports and guidelines, offer concessional green loans for environmentally beneficial projects. Likewise, Bangladesh Bank could introduce special concessional lending facilities for circular economy businesses.
3.7.5 Policy Support for the Recycling Sector
The companies strongly urge the government to provide fiscal incentives (e.g., tax rebates or holidays, and price support and subsidies), allowing them to survive and grow. It would be beneficial for recycling start-ups to strengthen their business foundation and create a market for their products. Furthermore, the existing firms would have incentives to expand more and diversify within the circularity sector, which will be helpful to develop a circular economy ecosystem in Bangladesh. The companies believe that the government should provide continued support for an extended period instead of a one-off incentive.
3.7.6 Market Making by the Government
As reported by the companies, a significant challenge is that they often face a challenge in finding a secondary market for their recycled and refurbished products. Because the market for recycled and refurbished output is yet limited and fragmented, it is essential that the government take the lead and focus on market making. The companies interviewed suggest that the government start procuring recycled products in its official development and revenue projects and programs to create a guaranteed market for the recycled and refurbished products. Once a public market exists, the private sector would eventually feel more confident to start mainstreaming the procurement of recycled and refurbished products. On the other hand, a guaranteed public market would allow the existing firms to grow bigger and new firms to enter the market and develop a circularity-oriented sector in the economy.
3.8 ConclusionBangladesh is currently one of the fast-growing emerging economies of the world and is expected to be a key driver of the world economy by 2050. Feeding the faster economic growth of the country requires large investments in manufacturing and productive sectors alongside increased consumer demands. However, the country’s current production, consumption, and growth patterns are predominantly linear, mostly driven by fossil fuels. As the country aims at achieving the Sustainable Development Goals and becoming a developed economy, it is perhaps the best time for Bangladesh to reconsider

56
PROSPECTS FOR TRANSITIONING FROM A LINEAR TO CIRCULAR ECONOMY IN DEVELOPING ASIA
adopting circularity principles in its growth path. It would be easier, less expensive, and more timely to adopt a circular economy model, as the country is at the take off or developing stage of its progress toward its aims. Adopting the circularity principles would allow the country to not only minimize wastes become resource-efficient, create employment opportunities, and save the environment; but also achieve sustainable economic growth and a sustainable future for future generations. However, Bangladesh’s journey toward a circular economy to date remains at an early stage.
The Government of Bangladesh expressed its intention in 2010 by launching the National 3R (Reduce, Reuse, Recycle) Strategy and reflecting 3R principles in some other plans and projects. While the National 3R Strategy recommends engaging the private sector, it largely remains out of the 3R or circular economy initiatives. As a result, the number of private business enterprises engaged in businesses built on 3R or circular economy principles is very low to date, although an official count is unavailable. The number of private firms in the waste recycling sector remains very limited as the sector cannot grow faced with enormous challenges. Based on stakeholder consultation, five private recycling business enterprises have been identified and studied to explore the challenges the recycling industry encounters. Through case study and interview of top management staff of the five companies, several key challenges are explored; for example, large capital requirement, no or limited access to finance, negative and informal treatment by stakeholders, no government supports, no secondary market for recycled outputs, lack of education and awareness, moral hazard, a lack of human resources, and a lack of specific regulation and enforcement. The chapter explored some policy considerations based on the case studies and the interviews, such as public sector leadership in adopting circularity principles, government-led market making for recycled outputs, introducing concessional lending facilities, offering fiscal incentives, raising awareness and education, and formulating specific regulations and enforcing them effectively. Consideration of the policy recommendations could boost the adoption of circular economy principles in the private sector, which would help Bangladesh green its growth patterns and drive innovation and employment.

57
DESIGN-REALITY GAP IN PROMOTING A CIRCULAR ECONOMY IN THE PRIVATE SECTOR: CASE OF WASTE MANAGEMENT AND RECYCLING IN BANGLADESH
ReferencesAbedin, M.A., and M. Jahiruddin. 2015. Waste Generation and Management in Bangladesh: An
Overview. Asian Journal of Medical and Biological Research. Vol. 1(1). pp. 114–20.
Barua, S. 2020a. Financing Sustainable Development Goals: A Review of Challenges and Mitigation Strategies. Business Strategy and Development. Vol. 3(3). pp. 277–93.
____. 2020b. Principles of Green Banking: Managing Environmental Risk and Sustainability. Berlin: Walter de Gruyter.
____. 2021a. Green Growth, Energy Transition, and Sustainable Development: Are We on the Right Track? In M. Shahbaz, A. Tiwari, and A. Sinha, eds. Energy-Growth Nexus in an Era of Globalization. 1st edition. Amsterdam: Elsevier, the Netherlands. Chapter 15.
____. 2021b. Human Capital, Economic Growth, and Sustainable Development Goals: An Evaluation of Emerging Economies. In M. Shahbaz, M.S. Mubarik, and T. Mahmood, eds. The Dynamics of Intellectual Capital in Current Era. Singapore: Springer. https://doi.org/10.1007/978-981-16 -1692-1_6
Barua, S., and S. Aziz. 2021. Making Green Finance Work for Sustainable Energy Transition and Development. In M. Shahbaz, A. Tiwari, and A. Sinha, eds. Energy-Growth Nexus in an Era of Globalization. 1st edition. Amsterdam: Elsevier, the Netherlands. Chapter 16.
Barua, S., and M. Chiesa. 2019. Sustainable Financing Practices through Green Bonds: What Affects the Funding Size? Business Strategy and the Environment. Vol. 28(6). pp. 1131–47.
CESME. 2015. The CESME White Book on Circular Economy. Circular Economy for SMEs Project, the European Union – European Regional Development Fund. https://www.cesme-book.eu/book /circular-economy-policies-and-framework (accessed 10 July 2021).
Chiesa, M., and S. Barua. 2019. The Surge of Impact Borrowing: The Magnitude and Determinants of Green Bond Supply and Its Heterogeneity across Markets. Journal of Sustainable Finance and Investment. Vol. 9(2). pp. 138–61.
Chiesa, M.A., B. McEwen, and S. Barua. 2021. Does a Company’s Environmental Performance Influence Its Price of Debt Capital? Evidence from the Bond Market. The Journal of Impact and ESG Investing. https://doi.org/10.3905/jesg.2021.1.015
Department of Environment, Bangladesh. 2010. National 3R Strategy for Waste Management. Dhaka: Ministry of Environment, Government of Bangladesh. http://old.doe.gov.bd/publication _images/4_national_3r_strategy.pdf
Ellen MacArthur Foundation. 2021. What Is a Circular Economy? https://www.ellenmacarthur foundation.org/circular-economy (accessed 10 July 2021).
Green Alliance. 2015. The Social Benefits of a Circular Economy: Lessons from the UK. https://green -alliance.org.uk/wp-content/uploads/2021/11/The-social-benefits-of-a-circular-economy.pdf (accessed 12 July 2021).
HSBC. 2011. The World in 2050: Quantifying the Shift in the Global Economy. https://www .institutionalinvestor.com/images/519/95888/hsbc-bwob-theworldin2050-en.pdf (accessed 10 July 2021).
International Monetary Fund. 2016. World Economic Outlook: Too Slow for Too Long. Washington, DC. https://www.imf.org/en/Publications/WEO/Issues/2016/12/31/World-Economic-Outlook-April-2016-Too-Slow-for-Too-Long-43653 (accessed 7 July 2021).

58
PROSPECTS FOR TRANSITIONING FROM A LINEAR TO CIRCULAR ECONOMY IN DEVELOPING ASIA
Kirchherr, J., D. Reike, and M. Hekkert. 2017. Conceptualizing the Circular Economy: An Analysis of 114 Definitions. Resources, Conservation and Recycling. Vol. 127. pp. 221–32.
Lacy, P., and J. Rutqvist. 2015. Waste to Wealth: The Circular Economy Advantage. London: Palgrave Macmillan UK.
Lawson, S., D. Heacock, and A. Stupnytska. 2007. Beyond the BRICS: An Outlook at the Next 11. In J. O’Neill, ed. BRICS and Beyond. Goldman Sachs Research Global Economics Group. http://www.goldmansachs.com/our-thinking/archive/archive-pdfs/brics-book/brics-full-book .pdf (accessed 6 July 2021).
Nathaniel, S., S. Barua, H. Hussain, and N. Adeleye. 2020. The Determinants and Interrelationship of Carbon Emissions and Economic Growth in African Economies: Fresh Insights from Static and Dynamic Models. Journal of Public Affairs. https://doi.org/10.1002/pa.2141
Nathaniel, S.P., S. Barua, and Z. Ahmed. 2021. What Drives Ecological Footprint in Top Ten Tourist Destinations? Evidence from Advanced Panel Techniques. Environmental Science and Pollution Research. https://doi.org/10.1007/s11356-021-13389-5
Padilla-Rivera, A., S. Russo-Garrido, and N. Merveille. 2020. Addressing the Social Aspects of a Circular Economy: A Systematic Literature Review. Sustainability. Vol. 12(19). pp. 7912. https://doi.org/10.3390/su12197912
Potting, J., M. Hekkert, E. Worrell, and A. Hanemaaijer. 2017. Circular Economy: Measuring Innovation in the Product Chain. PBL Publication Number 2544. The Hague: PBL Netherlands Environmental Assessment Agency. https://www.pbl.nl/sites/default/files/downloads/pbl-2016 -circular-economy-measuring-innovation-in-product-chains-2544.pdf (accessed 6 July 2021).
Rahman, S.M.M., and S. Barua. 2016. The Design and Adoption of Green Banking Framework for Environment Protection: Lessons from Bangladesh. Australian Journal of Sustainable Business and Society. Vol. 2(1). pp. 1–19.
Rizos, V., K. Tuokko, and A. Behrens. 2017. The Circular Economy: A Review of Definitions, Processes and Impacts. CEPS Research Reports No. 2017/08, April.
Yousuf, T.B. 2014. 3R (Reduce, Reuse and Recycle) in Bangladesh. In A. Pariatamby and M. Tanaka, eds. Municipal Solid Waste Management in Asia and the Pacific Islands. Environmental Science and Engineering. Singapore: Springer. http://doi.org/10.1007/978-981-4451-73-4

59
DESIGN-REALITY GAP IN PROMOTING A CIRCULAR ECONOMY IN THE PRIVATE SECTOR: CASE OF WASTE MANAGEMENT AND RECYCLING IN BANGLADESH
Appendix 3.1: Online Interview QuestionnaireSection A: Basic Company Information
NameAddressSectorYear of establishmentProducts/servicesType of company (chose one)
Sole tradership/private company/public company/partnership/others
Ownership structureLocal individual (shareholding %):Local institutional (shareholding %):Foreign (shareholding %):
Section B: Questions for Discussion
1. Please describe in detail your business and products/services.2. Please explain the inputs, processing, and outputs of your recycling business.3. Tell us your idea about reduce, recycle, and reuse generally and in the context of your business/
services.4. Explain how your business/services relate to/adopt the principles of designing out waste and
pollution, keeping products and materials in use, and regenerating natural systems.5. What are challenges or barriers you faced while launching the business initially?6. What are the challenges or barriers you face currently in managing and running your business
that can affect your future goal or plan?7. What are challenges or barriers for developing an industry to promote circularity?8. What are challenges or barriers you think lie in developing a circular economy in place of a
linear economy?9. For the overall development of the sector/industry, what policies should be undertaken by the
government?10. Overall, tell us about what role you want the private sector (e.g., firms/producers) and the
public sector (e.g., government) to play in facilitating the recycling industry as a whole.
** Please send us your company’s brochure, financial statements, leaflets, and any other published information sources so that we can highlight your business more.


PART II
Regulatory and Legal Frameworks for Plastics:
Extended Producer Responsibility


63
CHAPTER 4
Closing the “Circularity Gaps”: Practical Strategies to Address Key Challenges Undermining the Collective Goal of a Global Circular Economy of Plastics Nicholas Kolesch, Steve Sikra, and Martyn Tickner
4.1 Introduction: Identifying the Problem Collective action toward a plastic “circular” economy is a guiding vision for the Alliance to End Plastic Waste (hereinafter “Alliance”). Globally, only 15% of plastic waste is recycled, while 11 million tons enter the oceans each year (Briley 2020). Plastic production is projected to double by 2040, and research indicates that without a change in action, the annual flow of plastic waste into the ocean will nearly triple by 2040 (Lau et al. 2020). The most fundamental gap in ensuring plastic waste does not enter the environment, and subsequently the oceans, is the lack of proper waste management infrastructure. The World Bank estimates that roughly 2 billion tons of municipal solid waste is generated annually on a global level, with 33% of that “not managed in an environmentally safe manner” and in low- and middle-income countries, 90% of waste in openly dumped or burned (Kaza 2018).
Asia lies at the heart of the global plastic waste problem. In 2015, researchers estimated that over half of marine plastic waste enters the environment from five countries in Asia: the People’s Republic of China, Indonesia, the Philippines, Thailand, and Viet Nam (Jambeck et al. 2015). Therefore, the Alliance has activated multiple projects across dozens of cities in six countries in Southeast Asia, India, and Africa—all at the front line of the global plastic waste challenge. The global ambition is to work with the private sector, governments, development agencies, local communities, and civil society partners to divert millions of tons of plastic waste in at-risk cities around the world, improve livelihoods for millions, and contribute toward creating a circular economy. Through partnerships, the Alliance aims to demonstrate how successful plastic waste management solutions can help to unlock capital to scale and accelerate the pace of eliminating plastic waste in the environment. Figure 4.1 shows the plastic waste-to-resource hierarchy that supports closing the circularity gap.
In 2020, the coronavirus disease 2019 (COVID-19) pandemic disrupted the waste value chain and increased the amount of medical and other waste, including plastic waste, that is disposed of. However, as the Asian Development Bank (ADB) has noted, this disruption “presents an opportunity to rebuild economies and infrastructure using more sustainable models, create green and resilient livelihoods”, by advancing technology innovation (Bigum 2020).
To achieve the transformational change needed, there must be practical alignment and collaboration among a diverse spectrum of stakeholders. The Alliance has identified six gaps in the plastics circular economy that need to be addressed in order to ensure transformational change.
This chapter identifies practical approaches needed to plug these “circularity gaps” and provides strategic, actionable recommendations that can be adopted by key stakeholders, including policy makers, investors, consumers, the private sector, and others, to unlock actionable gains today toward the circular economy of tomorrow.
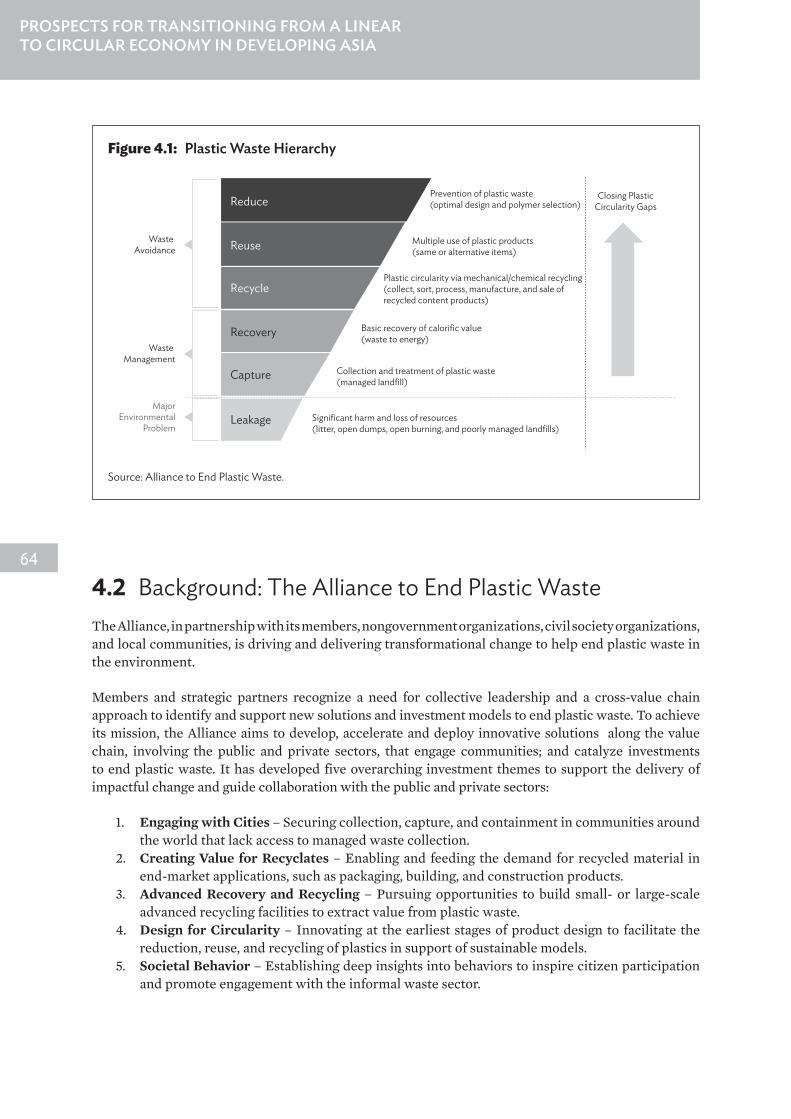
64
PROSPECTS FOR TRANSITIONING FROM A LINEAR TO CIRCULAR ECONOMY IN DEVELOPING ASIA
4.2 Background: The Alliance to End Plastic WasteThe Alliance, in partnership with its members, nongovernment organizations, civil society organizations, and local communities, is driving and delivering transformational change to help end plastic waste in the environment.
Members and strategic partners recognize a need for collective leadership and a cross-value chain approach to identify and support new solutions and investment models to end plastic waste. To achieve its mission, the Alliance aims to develop, accelerate and deploy innovative solutions along the value chain, involving the public and private sectors, that engage communities; and catalyze investments to end plastic waste. It has developed five overarching investment themes to support the delivery of impactful change and guide collaboration with the public and private sectors:
1. Engaging with Cities – Securing collection, capture, and containment in communities around the world that lack access to managed waste collection.
2. Creating Value for Recyclates – Enabling and feeding the demand for recycled material in end-market applications, such as packaging, building, and construction products.
3. Advanced Recovery and Recycling – Pursuing opportunities to build small- or large-scale advanced recycling facilities to extract value from plastic waste.
4. Design for Circularity – Innovating at the earliest stages of product design to facilitate the reduction, reuse, and recycling of plastics in support of sustainable models.
5. Societal Behavior – Establishing deep insights into behaviors to inspire citizen participation and promote engagement with the informal waste sector.
Figure 4.1: Plastic Waste Hierarchy
Source: Alliance to End Plastic Waste.
Waste Avoidance
Waste Management
MajorEnvironmental
Problem
Reduce
Reuse
Recycle
Recovery
Capture
Leakage
Prevention of plastic waste(optimal design and polymer selection)
Multiple use of plastic products(same or alternative items)
Basic recovery of calorific value(waste to energy)
Collection and treatment of plastic waste(managed landfill)
Significant harm and loss of resources(litter, open dumps, open burning, and poorly managed landfills)
Plastic circularity via mechanical/chemical recycling(collect, sort, process, manufacture, and sale of recycled content products)
Closing PlasticCircularity Gaps

65
CLOSING THE “CIRCULARITY GAPS”: PRACTICAL STRATEGIES TO ADDRESS KEY CHALLENGES UNDERMINING THE COLLECTIVE
GOAL OF A GLOBAL CIRCULAR ECONOMY OF PLASTICS
This systematic approach enables accelerated learning, rapid replication, and scaling to meet the commitment of ending plastic waste in the environment and contributing toward achieving the United Nations Sustainable Development Goals (SDGs). In particular, the Alliance’s efforts and interventions are focused on:
• SDG Goal 6: Ensure availability and sustainable management of water and sanitation for all;• SDG Goal 11: Make cities and human settlements inclusive, safe, resilient, and sustainable;• SDG Goal 12: Ensure sustainable consumption and production patterns;• SDG Goal 14: Conserve and sustainably use the oceans, seas, and marine resources for
sustainable development; and • SDG Goal 17: Strengthen the means of implementation and revitalize the Global Partnership
for Sustainable Development.
4.3 Closing the Gaps in the Circularity Value ChainThe circular economy is a powerful guiding vision to end plastic waste in the environment. This mission strives to keep materials in use until they are fully exhausted. Turning this into a reality, however, requires action throughout the life cycle of a material. The Alliance has identified six gaps within the circular economy that must be addressed: the Quantity Gap; the Quality Gap; the Design Gap; the Affordability Gap; the Data Gap; and the Alignment Gap. Perhaps most importantly, the Alliance is investing in projects that demonstrate solutions to help close each gap. Figure 4.2 explains the six circularity gaps within the ecosystem of the circular economy.
Figure 4.2: Managing Plastic Waste in a Circular Economy
Source: Alliance to End Plastic Waste.
Costs to deliver PCR qualityand quantity desired may exceed value derived
Improve end markets
Demonstrate and scaleadvanced recycling
Increase andImprove sorting
Increase education andengagement for citizen
participation in recycling
Increase access
to collection
Optimize reuseand repair
Optimize use and consumption
Optimize packagingand distribution
Optimize production
Design for circularity
PCR must be a ‘fit-for-use’ without contamination. Advanced sorting and advance recycling are needed.
Basic collection and processingsystem are needed in many regions. Advanced sorting enables rigids and flexibles recovery for full circularity.
•
Using recycled resin,optimizing material usage,consider alternatives and design for recycling.
•
PRISM: Improving data at allpoints of the circle
•
Many di�ering opinions existrelative to solutions possible, steps required, and responsibilities.
•
•
•
Managing Plastic Waste in a Circular EconomyGap Analysis RAW MATERIALS
RESIDUAL WASTE
AFFORDABILITY GAP
QUALITY GAP
QUANTITY GAP
DESIGN GAP
DATA GAP
ALIGNMENT GAP

66
PROSPECTS FOR TRANSITIONING FROM A LINEAR TO CIRCULAR ECONOMY IN DEVELOPING ASIA
4.3.1 The Quantity Gap
The Alliance believes that multiple efforts are required to achieve a circular economy with recycling being one of the most significant levers currently available. This requires collecting used plastic to prevent it from being turned into waste. Closing the Quantity Gap means ensuring basic collection and processing systems are in place. Successful efforts must start by increasing the amount of recycled plastic purposefully collected for recycling—diverting it from landfills, open-burning, burying, and indiscriminate litter. To make this happen, expanded collection capabilities are needed for all plastic items, such as thermoforms, flexible films, pouches, etc. Closely following increased collection capabilities, investments must be made in the systems and infrastructure required to sort and recycle used plastics, utilizing different solutions to recycle and offset the need for virgin plastic. Ultimately, society at large will have adequate services of collection and recycling systems in place for all types of waste, including plastic.
The Alliance also has several active feasibility projects supporting new technologies that can be deployed rapidly to address remote and rural island and small urban locations.
Governments, the private sector, and civil society can consider the following actions to close the Quantity Gap:
• increase access to collection systems (including curbside, drop-off, pick-up, etc.);• increase and improve sorting capabilities (manual and semi or fully automated, including new
advanced technologies being developed);• increase recycling capabilities (wash, mechanical, and chemical recycling, etc.);• increase education and engagement of citizen participation in at-source segregation and
recycling; and/or • improve package designs in order to facilitate recycling.
Case Study: Project STOP in Jembrana, Bali, Indonesia
Project STOP Jembrana addresses the Quantity Gap by providing technical expertise for collection, sortation, and recycling as part of an integrated waste management system in Jembrana, Indonesia. Waste is collected from residents, who undertake primary sorting into three bins provided by the project (recyclables, organics, and general waste), once a week, and brought to a new materials recovery facility to be sorted. Recyclable items are separated and processed for sale, while organic waste is composted. Profits from the project are used to cover the facility’s operational costs. Project STOP Jembrana serves as a pilot project to scale this type of collection and recycling system into a larger integrated waste management project within Indonesia in the coming years.
Project STOP Jembrana also introduces new concepts in terms of waste management financing. This project is designed to be economically self-sufficient, where the system can be fully operated by local government and communities. This includes hiring locals at living wages, and under responsible working conditions, to manage and staff the new waste management system.
Outside of Project STOP Jembrana, the Alliance is developing a number of large-scale city-level projects that will address the basics of collection, sortation, and plastic waste aggregation for recycling. The organization is working with other international agencies, such as UN-Habitat’s Waste Wise Cities Programme and ICLEI – Local Governments for Sustainability, to develop citywide strategies that will lead to successive projects founded on a clear masterplan for developing integrated waste management.

67
CLOSING THE “CIRCULARITY GAPS”: PRACTICAL STRATEGIES TO ADDRESS KEY CHALLENGES UNDERMINING THE COLLECTIVE
GOAL OF A GLOBAL CIRCULAR ECONOMY OF PLASTICS
Case Study: Closing the Loop, Accra, Ghana
The Alliance, in collaboration with the ASASE Foundation, is supporting local entrepreneurs in vulnerable communities in Accra, Ghana, through Closing the Loop. Through this program, plastic waste is collected and sold to CASH IT!, an organization that allows individuals to cash in the value of plastic waste. The plastic waste is then reground and sold to be reused in materials such as household products or building materials. The program alleviates waste management issues in Accra and unlocks the value of plastic waste, which is channeled back to the communities in the form of jobs and new income streams. Since its inception, Closing the Loop has created over 150 new jobs in the local recycling sector.
One of the key lessons from implementing Closing the Loop is the importance of adapting to local circumstances. One senior manager working on the project noted, “When looking for solutions, you have to find something that fits the local need. You could bring in expensive equipment from Europe or [the People's Republic of ] China, but once we finish the project, how will the equipment be maintained and used? It’s better to use the materials locally to make something that is fit for purpose and can last.”
Importantly, investments made into the program have catalyzed additional investment. In this case, the European Union subsequently partnered with the ASASE Foundation to increase collection and recycling rates in the Katamanso District of Accra, Ghana. The European Union is now supporting ASASE to scale and replicate the plastic recycling plant in other communities in Accra, which will help create additional jobs supporting a circular economy.
The Alliance is also working on projects that advance and evolve informal sector collection models through integration with municipal collection, use of digital tools, and potential franchising models. This provides the opportunity to showcase different collection models for different regions, including informal and formal collection models. Both types of collection models, particularly the informal collection model, can be integrated into waste management systems over time, and both can serve as key ways to eliminate plastic from the environment.
4.3.2 The Quality Gap
Certain product materials have limited or no technical solutions to achieve quality, recycled materials. Quality, recycled materials can be defined as “fit-for-use” in key applications, including food, hygiene, or high-performance applications. Closing the Quality Gap includes implementing more technical solutions at scale to achieve quality, recycled materials. For example, the private sector is investing in new advanced technologies for accurate sorting, as well as mechanical and chemical recycling.
In a successful circular economy, used plastic can be reused or recycled in a “closed loop,” where plastic is returned to the original application, or at least returned to the same quality as its original application. The next best type of recycling is “cascade recycling,” in which plastic is recycled into an application with less demanding quality requirements. After several recycling loops, it is restored back to the highest quality of virgin plastic via chemical recycling.
Closing the Quality Gap refers to enabling recycled materials to meet the requirements of the intended use; when this occurs, there is no Quality Gap. All materials (recycled or virgin) must meet the performance requirements of the intended use. These performance requirements may often include both functional and aesthetic criteria (for example, tensile/compression strength or color/odor). When the quality of a recycled material is “high,” it can be used in a broader range of applications.

68
PROSPECTS FOR TRANSITIONING FROM A LINEAR TO CIRCULAR ECONOMY IN DEVELOPING ASIA
A few examples where quality can be maximized within different unit operations can include the following:
1. When recycling plastics, separating them by resin type is preferred, as a homogeneous polymer can be more easily used (likely a drop-in replacement) than mixed plastics.
2. Separating resins by color is often preferred – clear or non-colored resins of one type will have more opportunities for reuse than mixed colored resins, for example.
3. Washing resins is also a common method to improve the quality – simply removing the residual product from a package will improve the quality of the material.
There are multiple mechanical means to close the Quality Gap, including sorting, washing, filtering, and solid-stating (raising the intrinsic viscosity of a polyethylene terephthalate or PET resin via temperature). The mechanical recycling industry employs many vital unit operations (beyond those presented), and each of these steps contribute to closing the Quality Gap.
When dealing with mixed colors and/or mixed resins, chemical recycling is considered a major solution when coupled with material from advanced mechanical systems. While it is in nascent industrial stages, physio-chemical recycling or true chemical recycling are promising options to remove colors and contaminants and to enable the separation of polymers at the molecular level. The coupling of mechanical and chemical recycling systems will enable recycled materials to perform with the quality of virgin materials.
It is important to implement the technical solutions necessary to ensure the needed quality of materials and to close the Quality Gap. The challenge remains, however, to implement processes that are cost-effective and at scale to deliver the quality needed for the broadest range of applications. Technical solutions and innovations are still needed in this space. It is well understood, as more efforts are introduced to improve the quality of a recyclate, that as the demand for the recycled material increases, so does the value. Closing the Quality Gap will indeed enable a more circular economy. Figure 4.3 illustrates the variations in polymer color and translucency from virgin to post-consumer recycled plastic. Among these variations, clear and white colored plastics are preferred as they provide greater downstream flexibility. Some of the colored (especially opaque) plastics may be discarded from the recycling stream.
Figure 4.3: Variations in Polymer Translucency and Color from Virgin to Post-Consumer Recycled Plastic
Source: Alliance to End Plastic Waste.

69
CLOSING THE “CIRCULARITY GAPS”: PRACTICAL STRATEGIES TO ADDRESS KEY CHALLENGES UNDERMINING THE COLLECTIVE
GOAL OF A GLOBAL CIRCULAR ECONOMY OF PLASTICS
Governments, the private sector, and civil society can consider the following actions to close the Quality Gap:
• invest in advanced, innovative technologies for accurate sorting, and mechanical and chemical recycling; and
• learn about local waste management systems and engage in activities to help alleviate the burdens on these systems, such as sorting waste at the source.
Potential Solution: Advanced Sorting and Recycling Technologies
As noted, a successful circular economy will avoid contamination and mixing of plastic streams, thereby enabling retailers and brand owners to directly take back their plastic articles for reuse or recycling. This is already happening at scale with PET bottles, but that success needs to be translated to other applications and types of plastics.
Tremendous strides are being made in introducing advanced technologies. For example, in sorting, the use of digital watermarking (invisible barcodes), chemical tracers, or artificial intelligence–enabled object recognition can dramatically improve the ability to separate plastics and enable mechanical recycling. Chemical recycling is also emerging as a new way to recycle plastic waste and complements both the existing and increasingly advanced mechanical recycling solutions that exist today. Chemical recycling enables processing hard-to-recycle plastic waste (multiple layers, small size, flexible films, etc.) to give them value and provide circular solutions for applications that have stringent quality requirements, such as food safety certification. Importantly, environmental as well as economic evaluations must continue along with these important technology developments. Investors, governments, and other stakeholders should consider the use of these new technologies and enable the development of others to address the Quality Gap.
Champions of the circular economy should identify and promote projects that will contribute to:
• de-risking technologies to enable plastic waste feedstocks and chemically recycled products to be easily processed into existing refining and petrochemical infrastructures, or readily usable with the aim to move plastic waste up the waste hierarchy to generate valuable feedstocks and products and promote circularity;
• developing a broad range of business models that demonstrate how recycling can create economic as well as environmental value and enable plastic waste to be managed as a resource;
• developing solutions enabling recycling ecosystems to be rapidly scaled up economically;• taking advantage of the potential for rapid deployment, replication, and scale-up based on
robust technology and market conditions to be able to make an impact on the scale that is needed; and
• creating local community benefits by capturing the economic value of plastic waste that is currently lost.
The rate at which innovations are emerging to provide these technologies and business models is incredible. In addition to promoting new technology through projects, the Alliance is also supporting:
• End Plastic Waste Innovation Platform – This flagship program, developed in partnership with Plug and Play, includes a network of start-ups, world-leading corporations, and hundreds of venture capital firms, universities, and government agencies across multiple industries. The aim is to create an ecosystem designed to develop and implement the technologies of tomorrow. As of this publication, six hubs have been established: Silicon Valley, Paris, Singapore, Shanghai, Sao Paulo, and Johannesburg. More than 100 commercial pilots and projects are underway.

70
PROSPECTS FOR TRANSITIONING FROM A LINEAR TO CIRCULAR ECONOMY IN DEVELOPING ASIA
The accelerated startups have attracted more than $50 million in capital investment, comprising a majority mix of private equity and government grants.
• Nanyang Technological University (NTU) Singapore Grant Call – NTU, through its Global Alliance of Industries (GAIN) initiative, partnered with the Alliance to work on solutions to address the challenge of plastic waste in the environment aligned with the five investment themes noted above. In November 2020, NTU put out a call for proposals for a $1.2 million grant through the Special Accelerating Creativity and Excellence (ACE) Programme, with more than 20 cross-faculty submissions received for novel solutions to the plastic waste challenge.
Case Study: RESIN8 – A Breakthrough Concrete Modifier Made from Mixed Plastic Waste, with CRDC in Costa Rica
The Alliance is partnering with CRDC, an innovative technology company creating value from plastic waste, to convert co-mingled and difficult-to-recycle plastic waste (including materials recovery facility residuals and river/ocean-bound plastic) into a high-value, lightweight aggregate. These high-value aggregates can be utilized as a concrete modifier in structural and non-structural concrete products, enhancing end characteristics such as strength, weight, fire resistance, and thermal resistance.
The technology has currently been proven in three operational pilot facilities, and the company is ready to progress with full commercial scale-up and replication in multiple regions. This project also supports a new generation of products that will create a carbon capture capability—utilizing plastic waste to mitigate the carbon emissions arising from cement and energy production.
Case Study: Planks of Promise with Plastic Flamingo, Manila, Philippines
Social businesses can play a key role in demonstrating the viability of mechanical recycling of plastic waste, typically starting from humble origins. A wonderful example can be seen with the Planks of Promise project undertaken by The Plastic Flamingo (The Plaf ), a social enterprise based in Manila, Philippines, supported with a grant from the Alliance. Recognizing the challenge of managing plastic waste in the mega-city of Metro Manila and the need for low-cost building materials, The Plaf has established a network of plastic collection depots to intercept plastic waste before it gets into the environment, with more than 70 depots in operation since the inception of their business in 2018. All types of plastic are accepted, with the collected plastic segregated and selected fractions (typically high-density polyethylene or HDPE, low-density polyethylene or LDPE, and polypropylene or PP) cleaned and processed into plastic lumber that can be used as a viable construction material. The Plaf has developed plans for the construction of emergency shelters, with technical data sheets and testing undertaken on the first version of the upcycled plastic eco-lumbers to be used in these buildings.
By recognizing that plastic waste has value and proving it through its transformation into eco-lumber, The Plaf is encouraging citizens and businesses in Metro Manila to look differently at plastic waste. The rapid expansion of their collection centers at schools, universities, and private businesses demonstrates that the Quality Gap can be closed through diligent collection and sorting. With proof of their concept in Manila, The Plaf is looking to roll it out to other cities in high-leakage geographies, creating both awareness and tangible products that can be the start of a change in perception and behavior.
4.3.3 The Design Gap
Modern packaging design has evolved to focus on functionality—minimizing food waste, protecting contents, providing retail efficiency, food safety, lightweight options, and low cost, all of which bring important environmental benefits. Additionally, a very strong driver to modern design has

71
CLOSING THE “CIRCULARITY GAPS”: PRACTICAL STRATEGIES TO ADDRESS KEY CHALLENGES UNDERMINING THE COLLECTIVE
GOAL OF A GLOBAL CIRCULAR ECONOMY OF PLASTICS
also been consumer convenience, for example, providing disposable single-use options and brand differentiation (e.g., colored plastics), but with limited focus on a circular economy. And, in areas of poor recovery, these often come at the expense of environmental impact. Designs focused on the best environmental and cost performance during the use phase may not be the best solution when considering the after-use phase of the life cycle. Closing the Design Gap includes investing in improving and simplifying packaging, including mono-material or compatible material solutions where possible.
The private sector can play a pivotal role in redesigning packaging with the full life cycle environmental consequences in mind. Organizations such as the Sustainable Packaging Coalition are working to develop tools, applications, and services to help companies take meaningful steps toward packaging sustainability. It is important that we think critically about the function of packaging and how it fits in the resource economy (Szaky 2019). Addressing the Design Gap is a complementary approach to reducing the Quality Gap with new technology.
Governments, the private sector, and civil society can consider the following actions to close the Design Gap:
• re-evaluate supply chains to consider both producer-to-point of sale (business to business or B2B) and point of sale-to-consumer reuse models (business to consumer or B2C);
• work to reduce and optimize material usage;• choose the optimal material for the job to be done, considering environmental impact, life-
cycle, functionality, and end-of-life solutions;• drive change in product designs to prioritize environmental rather than branding and consumer
convenience;• redesign supply chains to enable product take-back for reuse or recycling (reverse logistics);
and/or• encourage cross-value chain innovation to address the most significant issues, notably multi-
layer films, pouches, and sachets.
In order to close the Design Gap, one area of short-term intervention is to issue a request for project proposals for highly impactful B2C reuse models. Scope for further intervention is being developed, for example, with a grand prize or design workshops to encourage cross-value chain innovation for multi-layer films, pouches, and sachets.
4.3.4 The Affordability Gap
Recycling solutions need to be made economically viable. In many cases, the initial costs to deliver recycled material at the quality and quantity desired may exceed the value derived, or costs may exceed comparative costs to fossil-derived plastic. Closing the Affordability Gap includes capturing the maximum value from used plastic. Economic value is derived not only from the revenue of recyclates sold, but the avoided costs of disposal and environmental impact.
The affordability challenge represents perhaps the most important gap to be closed. About a quarter of the world’s population, or 2 billion people, do not have access to adequately managed waste collection due to the prohibitive cost of household collection as a service (UN 2019). Plastic waste is not the cause, but a symptom, of this lack of affordability.
Technical and design solutions for recycling need to be economically viable. This includes solutions that cover, at a minimum, the additional operating costs, and ideally also the necessary infrastructure costs, to sustainably implement a waste management system. With mature technology, cost-efficient

72
PROSPECTS FOR TRANSITIONING FROM A LINEAR TO CIRCULAR ECONOMY IN DEVELOPING ASIA
operations and stable offtake markets, the recycling industry will be able to compete with virgin plastic. It will also be able to contribute to the cost of collection through the value generated and the elimination of the disposal cost in either engineered landfill or waste-to-energy.
In the interim, as innovative technical solutions are developed for the waste management system, some additional investment is likely needed by governments, development banks, philanthropic organizations, and the private sector.
Governments, the private sector, and civil society can consider the following actions to close the Affordability Gap:
• consider value not only from the revenue of recyclate sold, but also the value in avoiding disposal costs such as collection, transportation, and landfill fees; and
• consider the hidden or social cost of dumpsites or open littering, including the loss of tourism, the cost of pollution remediation, and even health-care issues associated with waste and pollution
Low-cost operations are essential to enable viable economics. The Alliance is exploring several projects that partner with waste management companies and technology service providers to demonstrate the economics by integrating facilities in a single waste processing park.
Case Study: Plastic Recycling Credits
One interesting area of development in the circular economy is the advent of plastics recycling credits, in which a brand owner, retailer, or manufacturer can purchase credits—similar to carbon credits—as a voluntary commitment, or part of a mandated extended producer responsibility system, to financially contribute to the public services cost of their plastic footprint.
Current systems are small scale but may prove an effective mechanism to enable additional revenue to be directed into investments to boost supply, thereby helping brand owners meet the public commitments they have made to the circular economy.
Mechanisms, however, must have the right functionality to ensure full legitimacy, such as no double counting of impact, full traceability of recyclate origin, appropriate social and environmental standards of operation, and pricing that reflects the complexity associated with recycling different plastics and plastic applications.
4.3.5 The Data Gap
Improved data collection relative to plastic waste management and circularity is needed at all points in the global value chain. Closing the Data Gap includes improving the understanding of the cause and effect of plastic waste in different geographies, but also uncovering investable opportunities and best practices. Identifying and sharing investable opportunities and best practices can inform the private sector participants and policy makers to drive the right decisions and investments, speed up progress, and monitor improvements toward a more circular economy.
Governments, the private sector, and civil society can consider the following questions and actions to close the Data Gap:
• Who is working on data? Which companies?• Collate data from definitive sources

73
CLOSING THE “CIRCULARITY GAPS”: PRACTICAL STRATEGIES TO ADDRESS KEY CHALLENGES UNDERMINING THE COLLECTIVE
GOAL OF A GLOBAL CIRCULAR ECONOMY OF PLASTICS
• Identify data gaps• Undertake multidimensional analyses to drive decisions toward a circular economy.
Case Study: PRISM
The Alliance is proud to partner with IBM on the development of the Plastics Recovery Insight and Steering Model (PRISM), which aims to serve as a single source of consistent, actionable data to help inform value chain participants, communities, governments, regulators, non-government organizations, and other organizations to drive optimal waste management decisions and the development of related programs.
The vision for PRISM is to become a global public good, and a trusted resource that provides insights on municipal solid waste and plastic waste at the country and city levels, as well as information on formal and informal waste management infrastructure facilities worldwide.
PRISM targets the establishment of common definitions and harmonized standards and methodologies for the measurement and monitoring of land-originated plastic waste. The system will also serve as a platform to convene stakeholders, bring disparate data sets together, and enable analysis and modeling of solutions. PRISM has the potential to support key public and private stakeholder groups to develop action plans preventing marine litter, provide transparent insights on collection and recycling rates, and measure the success of interventions to reduce mismanaged plastic waste and leakage into the environment.
4.3.6 The Alignment Gap
Unsurprisingly, there are multiple and differing viewpoints on circular economy solutions. Perspectives differ across the value chain depending on location, the state of the local economy, political will of governments, environmental views, cultural norms, profit motives, and more. For example, different stakeholders may prioritize environmental objectives differently (e.g., eliminating plastic waste in the ocean, addressing climate change, or using resources efficiently). Additionally, the preferred technologies and solutions for waste management systems will differ across geographies. Closing the Alignment Gap includes overcoming the multiple and differing viewpoints on the problems and the solutions to end plastic waste, aligning efforts of different participants, and driving economies of scale in our collective efforts to develop a successful circular economy.
Governments, the private sector, and civil society can consider the following actions to close the Alignment Gap:
• align participants (private and public) on priorities;• develop common priorities and road maps to reduce plastic waste in our environment; and• align capital with those priorities.
Case Study: The Alliance to End Plastic Waste
There are three ways the Alliance is actively serving to close the Alignment Gap:
First, with membership from the entire plastics value chain, the Alliance is able to convene companies and stakeholders who have different perspectives on the challenges and together can be a very effective part of the solution to ending plastic waste.

74
PROSPECTS FOR TRANSITIONING FROM A LINEAR TO CIRCULAR ECONOMY IN DEVELOPING ASIA
Second, the Alliance is a forum to bring together various partners to develop and implement solutions. Partners include project developers implementing activities on the ground; co-funders, which include member companies; private investors; development banks; philanthropic institutions; and lastly, those organizations bringing leadership and ideas for solutions to be implemented.
Third, the Alliance recognizes there are many actors active in addressing the challenge of plastic waste and believes that through collective efforts, stakeholders in the circular economy can be more effective, achieving economies of scale, avoiding duplication, and driving scaled implementation for those solutions that are demonstrated to work. Not all active players see eye-to-eye on the origin of the problem or its solution. However, they do all have the same end goal in mind.
4.4 Catalyzing Capital to Eliminate Waste in the Environment
Managing plastic waste is a huge economic challenge, but also serves as an opportunity with $120 billion of value currently foregone per year (Ellen MacArthur Foundation 2017), which requires investment in waste treatment innovation, modern waste collection and segregation systems, and accelerating recycling demand. However, there remains annual revenue gap of over $40 billion globally in financing for the municipal solid waste sector (World Bank 2014). The pool of investors active in solid waste management and recycling space is currently fairly small. Unfortunately, there are many factors that discourage investment, as noted in a 2019 study by Circulate Capital (2019):
• unfavorable legal and regulatory frameworks;• political instability and uncertainty;• capital markets with low liquidity and currency volatility;• illiquid nature of infrastructure assets;• complexity of the asset class, from both governance and operational standpoints; • poorly structured projects without sufficient economic or technical viability; and • lack of data on prior infrastructure projects for benchmarking.
These challenges noted, there is a burgeoning market for environmental, social, and governance (ESG) investment. This has led to a paradigm shift paradigm shift in the investment landscape where financial returns and impact returns are seen as equally important measures, resulting in capital looking to be deployed to address environmental and social challenges. The emergence of sustainable financial policy in Europe is already driving adoption in other major markets (e.g., the United States and Asia). This trend is only accelerating, with PricewaterhouseCoopers estimating that by 2025 (PwC 2020):
• ESG equity funds will have seen compound annual growth rate (CAGR) of 28.8%, with assets under management quadrupling to more than €7.6 trillion; and
• ESG-focused bond funds are expected to grow at CAGR 30.4%, and assets will exceed €1.6 trillion in 5 years.
The approach of the Alliance is to utilize cross-value chain insights and competencies to identify and develop strategic, technical, and business model solutions, which address the identified circularity gaps and identify solution building blocks that address the unmet needs, issues, and opportunities, which can be readily replicated and scaled individually, or in combination as part of a holistic road map and solution. The ambition of the Alliance is to promote interventions that increase scale and impact, mobilize third-party capital financing, and align key stakeholders, to bring about the rapid replication of solutions that is required.

75
CLOSING THE “CIRCULARITY GAPS”: PRACTICAL STRATEGIES TO ADDRESS KEY CHALLENGES UNDERMINING THE COLLECTIVE
GOAL OF A GLOBAL CIRCULAR ECONOMY OF PLASTICS
4.5 ConclusionThere is no silver bullet solution to prevent plastic waste from entering the environment and our oceans, and it is key that changes are founded on scientific fact, not driven by popular opinion. It is not simply about swapping one single-use material for another. It requires the private sector, financial institutions, and governments to work together to unlock the necessary capital and drive the best environmental solutions. Change is already happening: businesses across the entire value chain are pledging to become more circular and reduce their environmental impact, are redesigning packaging, and are using recycled materials in their operations; researchers are developing and improving ways to make, sort, and recycle plastics; and governments are re-evaluating their waste management systems, making recycling available and more accessible for their citizens. A key aspect of closing the Alignment Gap is to ensure that solutions are founded on sound scientific and effective approaches, which can often be different from common public perception. Education of all stakeholders is therefore key. Finally, perhaps most important, is to maintain the determination to ensure plastic waste is addressed by the driving vision of a circular economy and achieving the lowest carbon impact.
As a convener of multiple partners to develop and implement solutions, the Alliance provides the following best practices and lessons learned for consumers, investors, the private sector, and governments:
Best Practices for Consumers1. Learn about your local waste management system and engage in activities to help alleviate
the burden on these systems, for example: separating dry, clean recyclable waste from wet contaminated waste at source (UNEP 2021).
2. When choosing products, opt for those that are reusable, readily recyclable and do not utilize unnecessary packaging; support businesses committed to reducing waste or closing the loop (UNEP 2021).
3. Advocate for recycling and recovery in your community and among your peers (UNEP 2021).4. Let local officials know if you see symptoms of poor waste management in your communities
(UNEP 2021).
Best Practices for Investors1. Integrate circular thinking as a guiding vision alongside pragmatic approaches to investment
concepts in risk assessments and modeling, and explore integrating them in less conventional methods such as green quantitative easing (Morlet et al. 2020).
2. Launch or invest in private equity that focuses on supporting circular economy companies and leverages investments in the necessary infrastructure and replication of proven approaches (Moss, Eidson, and Jambeck 2017).
3. Invest in early-stage circular innovators covering a broad range of opportunities.4. Drive new partnerships within and beyond the private financial sector, including
collaboration with public sector funders, philanthropic investors, and large corporates, to develop a strong pipeline of circular investment opportunities across growth stages and value chains (Morlet et al. 2020).
Best Practices for the Private Sector1. Implement a transparent approach toward reducing or eliminating plastic waste, setting
credible but ambitious targets to drive a corporate agenda founded in environmental science rather than popular appeal.
2. Encourage public–private collaboration, for example, facilitating engagement with policy makers, consumer education, and local community interest.
3. Engage in research and development related to addressing the circularity gaps.

76
PROSPECTS FOR TRANSITIONING FROM A LINEAR TO CIRCULAR ECONOMY IN DEVELOPING ASIA
Best Practices for Governments1. Set ambitious yet attainable waste management targets at the economy-wide and
municipal levels in consultation with relevant stakeholders, consistent with the SDGs, the Paris Agreement on Climate Change, and scientifically sound and pragmatic demonstrated solutions (Ocean Conservancy and the Trash Free Seas Alliance 2017).
2. Support regions, provinces, and municipalities to develop detailed action plans to reach agreed targets (Ocean Conservancy and the Trash Free Seas Alliance 2017).
How to Become Involved with the Alliance
Communities and Civil SocietyWe aim to inspire change and work with you to see how we might best partner with your community and like-minded individuals who have or or aspire toward having an impact an impact by implementing change.
BusinessesWe welcome all companies, whatever their size or geography within or as contributors to the plastics value chain, to join the Alliance and to develop solutions to solve the plastic waste challenge.
Visionaries and InnovatorsWe welcome learning about, and potentially supporting, technology or business models that have the potential to be highly impactful in reducing plastic waste and are ready for demonstration on meaningful commercial scale. Please visit https://endplasticwaste.org/en/request-for-proposal.
GovernmentThe Alliance believes in the power of combining collective efforts to maximize impact, and we continue to develop our own capabilities and partnerships that can bring resources and knowledge to support the right actions across all stakeholders, including institutions.

77
CLOSING THE “CIRCULARITY GAPS”: PRACTICAL STRATEGIES TO ADDRESS KEY CHALLENGES UNDERMINING THE COLLECTIVE
GOAL OF A GLOBAL CIRCULAR ECONOMY OF PLASTICS
References Bigum, M. 2020. A Circular Economy for a Sustainable Plastic Future. Manila: ADB. https://www.adb
.org/news/features/circular-economy-sustainable-plastic-future (accessed 17 May 2021).
Briley, J. 2020. Confronting Ocean Plastic Pollution. Pew Charitable Trusts. 16 November. https://www .pewtrusts.org/en/trust/archive/fall-2020/confronting-ocean-plastic-pollution (accessed 26 April 2021).
Circulate Capital. 2019. Investing to Reduce Plastic Pollution in South & Southeast Asia: A Handbook for Action. https://docs.wixstatic.com/ugd/77554d_3bb19c2c7b75435f8d2817edfc15a28f.pdf
Ellen MacArthur Foundation. 2017. The New Plastics Economy: Rethinking the Future of Plastics & Catalyzing Action. https://www.ellenmacarthurfoundation.org/assets/downloads/publications /NPEC-Hybrid_English_22-11-17_Digital.pdf
Jambeck, J.R., R. Geyer, C. Wilcox, T.R. Siegler, M. Perryman, A. Andrady, R. Narayan, and K.L. Law. 2015. Plastic Waste Inputs from Land into the Ocean. Science. Vol. 347(6223). pp. 768–71. https://doi.org/10.1126/science.1260352
Kaza, S., L.C. Yao, P. Bhada-Tata, and F. Van Woerden. 2018. What a Waste 2.0: A Global Snapshot of Solid Waste Management to 2050. Washington, DC: World Bank. https://openknowledge.worldbank .org/handle/10986/30317
Lau, W., W.W. Y. Lau, Y. Shiran, R.M. Bailey, E. Cook, M.R. Stuchtey, J. Koskella et al. 2020. Evaluating Scenarios towards Zero Plastic Pollution. Science. Vol. 369(6510). pp. 1455–61. https://doi .org/10.1126/science.aba9475
Morlet, A., E. Opsomer, M. De Smet, E. Healy, and G. Moretto. 2020. Financing the Circular Economy: Capturing the Opportunity. Cowes, UK: Ellen MacArthur Foundation. https://www .ellenmacarthurfoundation.org/assets/downloads/Financing-the-circular-economy.pdf
Moss, E., A. Eidson, and J. Jambeck. 2017. Sea of Opportunity: Supply Chain Investment Opportunities to Address Marine Plastic Pollution. New York, NY: Encourage Capital.
Ocean Conservancy and the Trash Free Seas Alliance. 2017. The Next Wave: Investment Strategies for Plastic Free Seas. Washington, DC: Ocean Conservancy.
PricewaterhouseCoopers. 2020. https://www.pwc.lu/en/sustainable-finance/esg-report-the-growth -opportunity-of-the-century.html
Szaky, T. 2019. The Future of Packaging: From Linear to Circular. Oakland, CA: Berrett-Koehler Publishers.
UN (United Nations). 2019. SDG Reports, Goal 11. https://unstats.un.org/sdgs/report/2019/goal-11
UNEP (United Nations Environment Programme). 2021. Neglected: Environmental Justice Impacts of Marine Litter and Plastic Pollution. Nairobi.
World Bank. 2014. Results-Based Financing for Municipal Solid Waste. https://www.worldbank.org /en/topic/urbandevelopment/publication/results-based-financing-for-municipal-solid-waste

78
CHAPTER 5
Circular Economy Policy Initiatives and Experiences in the Philippines: Lessons for Asia and the Pacific and BeyondGregorio Rafael P. Bueta
5.1 IntroductionThe Philippines is facing a waste crisis—perhaps of an unimaginable scale. The issue of solid waste management (SWM) has been one of the main environmental problems of the country for decades. Its archipelagic geographic structure, a rising population, lack of incentives for reform, and weak implementation and enforcement of regulations result in almost 35% of plastics leaking into the open environment (WWF 2020). The problem has once again been thrust into the spotlight due to the increase in waste generation, particularly of plastics and medical waste, due to the ongoing coronavirus disease 2019 (COVID-19) pandemic.
One solution that is slowly being included in the waste management narrative of the country is the concept of a circular economy. This chapter analyzes the current Philippine legal and policy framework related to this. Circular economy policy efforts in the Philippines over the last decade are analyzed, with a focus on measures on regulations of plastics and extended producer responsibility (EPR) schemes. The chapter concludes with lessons from the Philippine experience and gives recommendations on how circular economy policies can be made a reality for developing countries like the Philippines.
5.1.1 The Philippine Waste Crisis
With a projected population of 110 million by July 2021 (PSA 2021), coupled with a poverty rate of 16.7% in 2018 (ADB 2021) and an urbanization rate of 51.2% as of 2015 (PSA 2019), it comes as no surprise that the Philippines is experiencing a waste crisis. More people, and living in dense, often ill-planned urban areas, in poor living conditions, can only result in more waste that cannot be handled by an already stretched and overburdened waste management system.
This crisis has been brewing for several years. Early projections from the National Solid Waste Management Commission (NSWMC) point to a rising trend in solid waste generation: “yearly amount of waste in the country was expected to increase from 13.48 million tons in 2010, to 14.66 million tons in 2014, to 18.05 million tons in 2020” (DENR-EMB 2019). Current figures and projections show that in 2020, waste generated was 21.4 million tons—and this is expected to increase to 23.6 million tons by 2025 (DENR-EMB 2021).
Part of the problem is the inadequate waste management infrastructure around the country. There are only 237 sanitary landfills nationwide to service the 1,634 cities and municipalities in the country; and only 11,625 materials recovery facilities (MRFs) to cater to over 42,000 barangays (villages) (DENR-EMB 2021). SWM is “constantly challenged by the increasing amount of waste with the limited resources and infrastructures in place. Some of the major challenges include inadequacy of waste facilities due to constraints in funding and manpower, and the poorly implemented regulations for the recyclables market” (WWF 2020).

79
CIRCULAR ECONOMY POLICY INITIATIVES AND EXPERIENCES IN THE PHILIPPINES: LESSONS FOR ASIA AND THE PACIFIC AND BEYOND
The above situation leads to dire consequences for people and the environment. Open dumpsites can cause the following harmful effects (DENR-EMB 2019): “Leachate from solid waste can contaminate groundwater tables and surface waters. Insects and pests in open dumpsites are disease vectors. Methane gases from dumpsites can affect the health of exposed populations and contribute to global warming. Coastal and marine litter affects aesthetics, causes pollution, and harms marine organisms. Improperly managed solid wastes also can result in increased flooding and destruction of infrastructures due to clogged waterways.” Poor waste management also placed the Philippines third among the largest contributors of plastic waste with an estimated 0.75 million metric tons of mismanaged plastic entering the ocean every year (Jambeck et al. 2015). A recent study that conducted a plastic material flow analysis also showed that of the 2.150 million tons of plastic consumed in the country, only 9% is recycled, and 35% is leaked into the open environment (WWF 2020).
5.1.2 Solving the Crisis through Circular Economy
“A circular economy is based on the principles of designing out waste and pollution, keeping products and materials in use, and regenerating natural systems” (EMF 2021). According to the Ellen MacArthur Foundation, the current linear economy—where resources are taken from the ground to make products, which are used and thrown away when they are no longer wanted—is no longer working for people, business, and the environment. One study, which analyzed 114 definitions of circular economy, defined the concept as “an economic system that replaces the ‘end-of-life’ concept with reducing, alternatively reusing, recycling and recovering materials in production/distribution and consumption processes. It operates at the micro level (products, companies, consumers), meso level (eco-industrial parks) and macro level (city, region, nation and beyond), with the aim to accomplish sustainable development, thus simultaneously creating environmental quality, economic prosperity and social equity, to the benefit of current and future generations” (Kirchherr, Reike, and Hekkert 2017).
It is within the above context that the circular economy will be discussed as a potential conceptual and overarching solution for the waste crisis in the Philippines. This will be done by analyzing the implications of a circular economy at the micro, meso, and macro levels within society, which informs the analysis and recommendations presented.
5.2 Legal and Policy Framework Related to a Circular EconomyThere is currently no integrated circular economy strategy or policy framework that exists in the Philippines (ADB 2020). Nevertheless, the general waste management laws and policies directly and/or indirectly relate to circular economy concepts and approaches. This section first looks at current and existing frameworks, which comprise policy pronouncements and issuances, and laws and regulations. Legislative proposals over the last decade (with particular focus on current measures) will also be examined and analyzed.
5.2.1 Current/Existing Framework
Policy Pronouncements and Issuances
The current leadership of the Department of Environment and Natural Resources (DENR) under Secretary Roy Cimatu has made addressing SWM a priority (DENR 2019). Key activities include the closure of illegal dumpsites and the establishment of MRFs. Local government units (LGUs) will also be assisted with the implementation of waste management laws, along with technical support for the establishment of waste-to-energy (WTE) facilities.

80
PROSPECTS FOR TRANSITIONING FROM A LINEAR TO CIRCULAR ECONOMY IN DEVELOPING ASIA
Table 5.1: National Solid Waste Management Strategy for 2012–2016
Major Components Cross-cutting ComponentsBridging policy gaps and harmonizing policies Good solid waste management governance Capacity development, social marketing, and advocacySustainable solid waste management financing mechanisms
Caring for vulnerable groups
Creating economic opportunitiesSupport for knowledge management on technology, innovation, and researchOrganizational development and enhancing inter-agency collaboration
Reducing disaster and climate change risks
Compliance monitoring, enforcement, and recognition
Source: Author, based on NSWMC (2012).
The National Solid Waste Management Strategy (NSWMS) for 2012–2016 gives overall guidance for the country’s waste management by outlining medium-term plans to (i) materialize the National Solid Waste Management Framework; (ii) implement the provisions of Republic Act (RA) No. 9003; and (iii) mainstream waste management policies in the Philippines. The strategy consists of seven major and three cross-cutting components (Table 5.1).
As of this writing, the NSWMS has not yet been updated by the NSWMC.
The Philippine Development Plan (PDP) 2017–2022 identifies environmental quality improvement as a subsector outcome. “Stricter implementation of existing legal frameworks will be pursued to promote a clean and healthy environment. Strategies will focus on strengthening compliance with environmental standards and safeguards as well as developing, promoting, and adopting sustainable consumption and production practices” (NEDA 2017).
The PDP targets a national solid waste diversion rate of 80% by 2022. To achieve this, one of the key strategies is to improve SWM through the following:
• enforce compliance of LGUs to RA 9003;• promote the practice of 3Rs (reduce, reuse, and recycle) and proper waste management; • promote strategic clustering of sanitary landfills and SWM technologies to address their large
capital requirement, and allow low-income LGUs to pool their resources to finance such facilities; and
• provide alternative livelihood activities for waste pickers in the remaining dumpsites identified for closure.
In addition, sustainable consumption and production will be promoted through the following activities:
• formulate a “polluters pay” policy and implement corresponding measures; • establish a sustainable market for recyclables and recycled products;• strengthen the certification and establish information systems for green products and services;

81
CIRCULAR ECONOMY POLICY INITIATIVES AND EXPERIENCES IN THE PHILIPPINES: LESSONS FOR ASIA AND THE PACIFIC AND BEYOND
• strengthen the implementation of Philippine Green Jobs Act of 2016 (RA No. 10771);• promote green procurement in the public and private sectors; and • strengthen the promotion, development, transfer, and adoption of eco-friendly technologies,
systems, and practices in the public and private sectors by increasing access to incentives and facilitating ease of doing business and other related transactions, among others” (NEDA 2017).
More recently, and as a response to growing calls to address the waste leakage into oceans and bodies of water, the Government of the Philippines, through the various DENR offices, has drafted the National Plan of Action on Marine Litter (NPOA-ML). It is a “strategic document that will provide overall direction, indicators, and targets to manage and minimize marine debris, including plastics” (WWF 2020). The draft of the NPOA-ML lists the following programmatic cluster of activities (WWF 2020):
• establish science- and evidence-based baseline information on marine litter;• promote circular economy and support sustainable consumption and production (SCP)—
which includes EPR;• enhance recovery and recycling coverage and markets;• prevent leakage from collected or disposed waste;• implement a sea-based litter prevention and management program; and• institutionalize a management program for litter already existing in the marine/riverine
environment.
The plan was officially launched by the DENR last November 2021 and is currently for public dissemination and implementation.
Other policies that are being finalized and for implementation include the Philippine Action Plan for Sustainable Consumption and Production of the National Economic and Development Authority, and the Sustainable Science and Technology for Solid Waste Management Road Map of the Department of Science and Technology.
Laws and Regulations
a) RA No. 9003, The Ecological Solid Waste Management Act of 2000RA 9003 is the Philippines’ primary legislation that governs SWM. It was enacted to provide a systematic, comprehensive, and ecological solid waste management program (Agcaoili 2016; SEPO 2017). Although more than 20 years old and without specific mention of “circular economy” in its provisions, several objectives of the law become relevant for a discussion on circular economy policies:
• set guidelines and targets for solid waste avoidance and volume reduction, which includes recycling and recovery, in accordance with ecologically sustainable development principles;
• encourage greater private sector participation in SWM;• encourage cooperation and self-regulation among waste generators through the application of
market-based instruments; and • strengthen integration of ecological SWM and resource conservation and recovery topics into
the academic curricula.
Other important provisions under RA No. 9003 include (WWF 2020):
• creation of the NSWMC under the Office of the President; • creation of a SWM Board at the city, municipal and provincial levels; • creation of a SWM Committee at the barangay level;
82
PROSPECTS FOR TRANSITIONING FROM A LINEAR TO CIRCULAR ECONOMY IN DEVELOPING ASIA
• submission of a 10-year SWM Plan (city and municipal levels); • MRF establishment per barangay or cluster of barangays, and city and municipal centralized
MRF; • closure of open dumpsites and conversion into controlled dumpsites by 2004 (city and
municipal levels); and • banning of controlled dumpsites by 2006 (city and municipal levels).
The institutional mechanism to implement RA 9003 places responsibility at both the national and local levels of government. The “NSWMC is the main government entity in charge of SWM policy making and monitoring implementation of law and national and local SWM plans” (WWF 2020). Under Section 4 of RA 9003, the Commission is led by the “DENR with fourteen government sectoral members and three private sectoral members (one member each from a non-governmental organization, the recycling industry, and the manufacturing and packaging industries). There is also a National Ecology Center under the DENR” (WWF 2020), which maintains a “SWM database” and is mandated to “facilitate training and education in integrated ecological solid waste management.”
Cities and municipalities are the primary responsible units in the implementation of Philippine waste management laws. Under Section 12 of RA 9003, “they are tasked to, among others: i) prepare local SWM plans; ii) draft waste reduction policies; iii) manage the collection and disposal of various wastes within their jurisdiction” (including waste segregation and transport to disposal facilities); iv) maintain MRFs; and v) adopt revenue generating measures (WWF 2020).
b) Presidential Decree (PD) No. 1152, The Philippine Environment Code of 1977In 1977, one of the first environmental laws in modern Philippine history (which coincides with the emergence of environmental law as a distinct field of law and legal thinking) already made mention of recovery and recycling—an ancient reference to circular economy in the Philippines. Title V of PD 1152 deals with waste management and noted as one of its goals “to encourage, promote and stimulate technological, educational economic and social efforts to prevent environmental damage and unnecessary loss of valuable resources of the nation through recovery, recycling and reuse of wastes and waste products.”
Despite the numerous environmental laws that have been enacted since, PD 1152 is still considered good law and can be the basis for the enactment of circular economy policies and frameworks in the country.
c) RA No. 6969, The Toxic Substances and Hazardous and Nuclear Wastes Control Act of 1990 RA 6969 is the Philippines’ implementing legislation for the Basel Convention. It declares as a policy of the State, among others, to regulate, restrict, or prohibit the importation of chemical substances and mixtures that present unreasonable risk and/or injury to health or the environment. It becomes relevant as it is the primary legislation which governs import and exports of waste into the Philippines. Waste trade flows impact the amount of recyclable waste in the country, and also affects the capacity of local recyclers to deal with both local and imported wastes.
It is worth noting at this point that the Philippines has accepted the Plastic Waste Amendment to the Basel Convention: “The Plastic Waste Amendment aims to make global trade in plastic waste more transparent and better regulated. Exporting countries will now have to obtain consent from countries receiving plastic waste. This ensures quality of plastic waste materials and prevents countries, especially African and Asian nations, to be the dumping ground of developed nations” (WWF 2020). On the other hand, the government has not ratified the Basel Ban Amendment, which came into force in 2020. This results in the continuous entry of so-called recyclable waste for processing or final disposal in the country.

83
CIRCULAR ECONOMY POLICY INITIATIVES AND EXPERIENCES IN THE PHILIPPINES: LESSONS FOR ASIA AND THE PACIFIC AND BEYOND
RA 6969 becomes relevant due to the impact of the waste trade in the Philippines. The continuous entry of foreign waste, and the preference of local recyclers for cheaper imported recyclables over locally-generated waste, is a critical challenge to setting-up a circular economy in the country.
d) RA No. 8749, The Philippine Clean Air Act of 1999The Clean Air Act has always been connected to the implementation of waste management laws as open burning of waste, and now thermal waste-to-energy (WTE) facilities, have been seen as both legal and illegal options to deal with the rising number of waste generated. Section 20 of RA 8749 provides for “a general prohibition on the use of incineration and open burning for the disposal of waste” (WWF, 2020). Incineration is defined as the “burning of municipal, bio-medical and hazardous wastes, which process emits poisonous and toxic fumes” (WWF 2020).
In recent months, the issue regarding the ban on incineration—and allegedly the Philippines is the only country in the world that still has this kind of prohibition—has been reignited given the proposed law on WTE that removes the said ban. This will then allow WTE facilities to use incineration as a means to dispose of waste, so long as no harmful, toxic, or poisonous fumes are emitted. The Speaker of the House of Representatives has called on the Senate of the Philippines to immediately pass its version of the proposed measure and thereby creating the law on WTE (Cervantes 2021). The Speaker said that the government should consider adopting WTE technologies for treating and disposing of solid waste as several landfills in the country will soon be filled up and create worse garbage disposal problems. This has been vehemently opposed by environmental advocates who argue that removing the ban and allowing thermal WTE will bring disastrous effects to the health of people and to the environment (Greenpeace Philippines 2021).
RA 8749 becomes relevant as it impacts what technologies may be used (i.e., incineration and WTE facilities) as part of the overall waste management system forming the so-called loop.
e) Republic Act No. 10771, The Philippine Green Jobs Act of 2016This relatively new legislation can be made to apply to businesses and industries that support circular economy initiatives in the Philippines. The law applies to companies that engage in green jobs—defined as “employment that contributes to preserving or restoring the quality of the environment, be it in the agriculture, industry or services sector.” According to WWF (2020), “[s]pecifically, but not exclusively, this includes jobs that help protect ecosystems and biodiversity, reduce energy, materials and water consumption through high efficiency strategies, decarbonize the economy, and minimize or altogether avoid generation of all forms of waste and pollution.” Under Section 5 of this law, incentives include availment of “a special deduction from taxable income for skills training and research and development, and tax and duty free importation of capital equipment” (WWF 2020).
Local Ordinances
LGUs in the Philippines have the power and legal mandate to maintain ecological balance within their territorial jurisdiction pursuant to the Local Government Code. Thus, over the past decade, several local governments have taken measures to address the waste crisis, usually in the form of plastics regulation. According to the NSWMC, “as of 2019, 489 cities and municipalities (30% of all cities and municipalities in the country) have some form of policy to regulate the use of plastics, particularly plastic bags” (WWF 2020). All regions in the country except in the Bangsamoro Autonomous Region in Muslim Mindanao (BARMM) have local ordinances regulating plastics. In the National Capital Region, 13 out of 17 LGUs in Metro Manila have ordinances that regulate plastics (particularly single-use plastics or SUPs).

84
PROSPECTS FOR TRANSITIONING FROM A LINEAR TO CIRCULAR ECONOMY IN DEVELOPING ASIA
Table 5.2: Relevant Proposed Measures in the Philippine Congress, 2010–2021
Year Plastics Waste and Waste Management Circular EconomyHouse of Representatives
15th Congress (2010–2013) 21 28 016th Congress (2013–2016) 17 33 017th Congress (2016–2019) 26 52 018th Congress (2019–present) 43 79 2TOTAL 107 192 2
Senate 15th Congress (2010–2013) 9 21 016th Congress (2013–2016) 7 20 017th Congress (2016–2019) 6 12 018th Congress (2019–present) 9 30 0TOTAL 31 83 0
Source: Author.
5.2.2 Proposed Measures over the Last Decade
Coming from the previous section on current and existing frameworks, one will immediately notice that, save for the Green Jobs Act of 2016, the main laws and regulations with circular economy relevance are more than 20 years old. As the next paragraphs show and discuss, many measures have been proposed in the Philippine Congress over the last decade, though none have been passed into law.
Summary of Measures from 2010 to the Present
Table 5.2 summarizes the measures filed in both chambers of Congress from July 2010 to January 2022 on plastics, waste and waste management, and the circular economy.
Since 2010, a total of 415 bills and/or resolutions have been filed in the Philippine Congress relating to various aspects of the circular economy. As noted, none of these measures have yet translated into a binding law or policy as of this writing. A review of the measures filed reveal the following categories of proposals:
1. Waste management, particularly of toxic and hazardous substances. One of the most common proposals relate to improved regulation of toxic and hazardous chemicals, as well as the improvement of general waste management laws. This also includes education and information campaigns, particularly in schools and universities. Most of the proposals under this category were during the 15th and 16th Congress sessions. Note, also, that the Environmental Education and Awareness Act was passed in 2008.
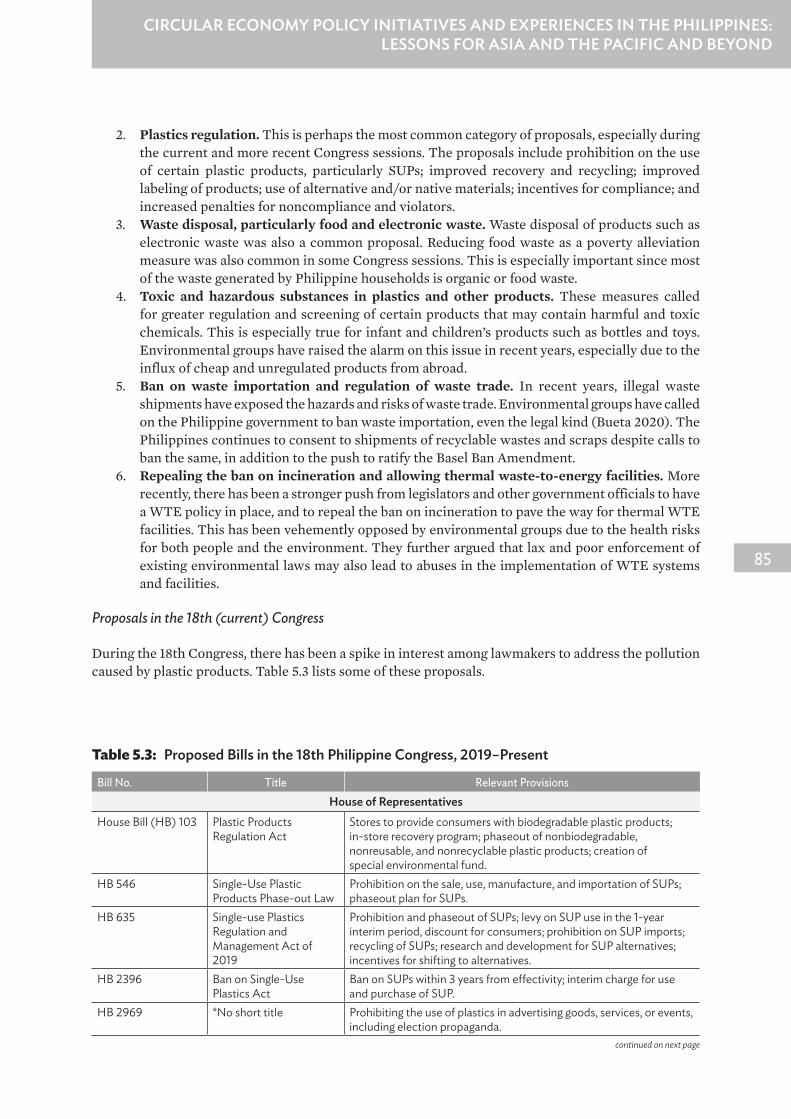
85
CIRCULAR ECONOMY POLICY INITIATIVES AND EXPERIENCES IN THE PHILIPPINES: LESSONS FOR ASIA AND THE PACIFIC AND BEYOND
2. Plastics regulation. This is perhaps the most common category of proposals, especially during the current and more recent Congress sessions. The proposals include prohibition on the use of certain plastic products, particularly SUPs; improved recovery and recycling; improved labeling of products; use of alternative and/or native materials; incentives for compliance; and increased penalties for noncompliance and violators.
3. Waste disposal, particularly food and electronic waste. Waste disposal of products such as electronic waste was also a common proposal. Reducing food waste as a poverty alleviation measure was also common in some Congress sessions. This is especially important since most of the waste generated by Philippine households is organic or food waste.
4. Toxic and hazardous substances in plastics and other products. These measures called for greater regulation and screening of certain products that may contain harmful and toxic chemicals. This is especially true for infant and children’s products such as bottles and toys. Environmental groups have raised the alarm on this issue in recent years, especially due to the influx of cheap and unregulated products from abroad.
5. Ban on waste importation and regulation of waste trade. In recent years, illegal waste shipments have exposed the hazards and risks of waste trade. Environmental groups have called on the Philippine government to ban waste importation, even the legal kind (Bueta 2020). The Philippines continues to consent to shipments of recyclable wastes and scraps despite calls to ban the same, in addition to the push to ratify the Basel Ban Amendment.
6. Repealing the ban on incineration and allowing thermal waste-to-energy facilities. More recently, there has been a stronger push from legislators and other government officials to have a WTE policy in place, and to repeal the ban on incineration to pave the way for thermal WTE facilities. This has been vehemently opposed by environmental groups due to the health risks for both people and the environment. They further argued that lax and poor enforcement of existing environmental laws may also lead to abuses in the implementation of WTE systems and facilities.
Proposals in the 18th (current) Congress
During the 18th Congress, there has been a spike in interest among lawmakers to address the pollution caused by plastic products. Table 5.3 lists some of these proposals.
Table 5.3: Proposed Bills in the 18th Philippine Congress, 2019–Present
Bill No. Title Relevant ProvisionsHouse of Representatives
House Bill (HB) 103 Plastic Products Regulation Act
Stores to provide consumers with biodegradable plastic products; in-store recovery program; phaseout of nonbiodegradable, nonreusable, and nonrecyclable plastic products; creation of special environmental fund.
HB 546 Single-Use Plastic Products Phase-out Law
Prohibition on the sale, use, manufacture, and importation of SUPs; phaseout plan for SUPs.
HB 635 Single-use Plastics Regulation and Management Act of 2019
Prohibition and phaseout of SUPs; levy on SUP use in the 1-year interim period, discount for consumers; prohibition on SUP imports; recycling of SUPs; research and development for SUP alternatives; incentives for shifting to alternatives.
HB 2396 Ban on Single-Use Plastics Act
Ban on SUPs within 3 years from effectivity; interim charge for use and purchase of SUP.
HB 2969 *No short title Prohibiting the use of plastics in advertising goods, services, or events, including election propaganda.
continued on next page

86
PROSPECTS FOR TRANSITIONING FROM A LINEAR TO CIRCULAR ECONOMY IN DEVELOPING ASIA
Bill No. Title Relevant ProvisionsHB 3536 Plastic Straws Ban Act Prohibiting the use of plastic drinking straws in all restaurants, hotels,
inns, fast-food centers, eateries, and similar establishments.HB 4724 Zero Plastics in Tourism
Act of 2019Prohibition on the use and bringing in of SUPs inside tourist sites/destinations; commercial establishments mandated to use alternatives.
HB 5312 Solid Waste Redemption and Recovery Act
Establishing a solid waste redemption and recovery system; incentive for hazardous waste recovery; calls for large-scale system recovery of solid waste.
HB 5383 Straw Regulation Act Regulating the use, recovery, collection, and disposal of plastic drinking straws in commercial establishments and in prepacked beverages; plastic straws to be given only upon request by customer; formulate design for environmentally sustainable pre-packed beverages; provides for a straw-free seal program.
HB 6180 *No short title Mandating all commercial establishments and manufacturing companies to maintain a system of recovery, collection, recycling, and disposal of plastic and other nonbiodegradable materials; system part of corporate social responsibility.
HB 6744 Recyclable and Biodegradable Packaging Act of 2020
Mandating the use of recyclable or biodegradable materials for the packaging of consumer products; incentives for entities that comply.
HB 7309 *No short title Prohibits the importation of plastic waste, whether recyclable or otherwise.
HB 9147 Single-use Plastic Products Regulation Act
This is the consolidated bill approved by the Committee on Ecology that serves as substitute for the related measures.
HB 9171 Plastic Bags Tax Act Provides for an amendment to the tax code to levy a tax on plastic bag use.
Senate Senate Bill (SB) 333 Single-Use Plastic
Product Regulation billAll single-use plastics (SUPs) should be banned after a year of the bill’s passage.Collection, recycling, and disposal by producers of SUPs manufactured and/or in circulation in the general market.For each piece of SUPs already manufactured, in circulation, and for use in transaction, retailers shall charge the consumer a minimum levy of (₱5.00).
SB 40 Single-Use Plastics Regulation and Management bill
Ban on SUPs food establishments, stores, markets, and retailers after a year of the bill’s passage.
SB 114 Regulating the Use of Plastic Bags
Ban on SUP carry-out bags in stores and promotion of biodegradable bags instead.
SB 557 Single-Use Plastics Ban bill
All SUPs in food establishments, stores, markets, and retailers should be banned after a year of this bill’s passage.For SUP materials that cannot be avoided, business enterprises have the responsibility to recycle them.
SB 811 Plastic Straw and Stirrer Ban bill
Ban on plastic straw and stirrers at food service or other service establishments that serve beverages, except for senior citizens and persons with medical conditions.
SB 880 Plastic Products Regulation bill
Phaseout of plastic products.Use of biodegradable plastic bags and in-store recovery program for plastics.
SB 954 Straw Regulation bill Mandatory plastic straw fee of ₱2.00, except for senior citizens and persons with medical conditions.
SB 156 Beverage Container Disposal bill
Brand owners shall implement an effective redemption, transportation, processing, marketing, and reporting system for the reuse and recycling of used beverage containers of the brand owner.Beverage container labeling.
Source: Adapted by the author from WWF (2020 p. 8).
Table 5.3 continued

87
CIRCULAR ECONOMY POLICY INITIATIVES AND EXPERIENCES IN THE PHILIPPINES: LESSONS FOR ASIA AND THE PACIFIC AND BEYOND
Two measures in particular call for the establishment of an extended producer responsibility (EPR) scheme in the Philippines. Senate Bill (SB) 2425, or Extended Producers Responsibility Act of 2021, amends sections of RA 9003 to institutionalize EPR in waste management. The proposed measure calls on producers to take responsibility for the recovery, processing, and disposal of their products (including plastic containers or packaging materials) sold to and used by consumers.
House Bill (HB) 6279, or An Act Mandating The Creation Of An Extended Producer Responsibility Scheme To Address Leakage Of Plastic Waste Into The Environment, And For Other Purposes, mandates all producers to come up with an annual EPR scheme. This includes identifying minimum collection targets, establishing a producer responsibility organization, and charging EPR fees (WWF 2020). Other EPR measures have subsequently been filed in the House of Representatives, in particular HB 8691 and HB 10696. HB 9147, which consolidates various bills on SUPs and waste management, also included provisions on EPR.
Recently in January 2022, both the Senate and the House of Representatives passed on final reading their respective versions of EPR bills (i.e., SB 2425 and HB 10696). The measures amend provisions of RA 9003 mandating obliged companies to collect and recycle plastic waste equivalent to their waste output or footprint, up to 20% within the first year of implementation, and up to 80% upon full implementation of the law. Other provisions provide for the set-up of producer responsibility organizations, incentives for equipment and infrastructure, and penalties for noncompliance. Both houses of Congress will sit in a conference committee and submit a consolidated version for approval of the President.
Perhaps for the first time in the Philippine Congress, a proposed bill specifically calls for mainstreaming and establishing a circular economy in the country. HB 7609, entitled Philippine Circular Economy Act of 2020, was filed by Deputy Speaker and former Senator Loren Legarda. Against the backdrop of the SDGs, climate action, and the COVID-19 pandemic and recovery, the bill calls for mainstreaming circular economy and sustainable consumption and production strategies; a just transition to a low-emissions and resource efficient circular economy; and a zero-waste circular economy program and scheme. The proposal also calls for a phaseout of SUP use and the establishment of an EPR scheme; a life-cycle assessment program; a circular public procurement program; integration of permaculture principles and practices in government; and circular economy mainstreaming in the national budget. The proposed measure, filed in September 2020, is currently pending at the Committee level.
5.2.3 Analysis of Trends in Legal and Policy Frameworks for Circular Economy
The analysis of existing legal frameworks, as well as proposals over the past 10 years, has revealed the following key points:
1. Current and existing laws and policies provide adequate justification to push for specific circular economy policies and regulations
In line with global efforts, circular economy concepts, strategies, and principles are slowly being recognized in the Philippines. Even the decades-old laws may be made a basis for pushing for new and innovative circular economy policies. Though waste management and immediately addressing the waste crisis are priorities, efforts must not be bogged down and stalled in these approaches and move toward more sustainable consumption and production patterns. It does not make sense for a country like the Philippines to keep on trying to deal with the rising amount of waste, since it does not have the luxury of shipping out and exporting its waste, unlike more developed countries.
88
PROSPECTS FOR TRANSITIONING FROM A LINEAR TO CIRCULAR ECONOMY IN DEVELOPING ASIA
2. Piecemeal and ad hoc approach to addressing waste management issues and promoting a circular economy
A review of the proposals shows a piecemeal and ad hoc approach to addressing waste issues. This results in too many proposals that get stuck in the legislative mill (absent a strong push for its passage, or its inclusion in the President’s legislative agenda). Most proposals only address one or a few aspects of waste management, thereby missing the needed elements and strategies to establish a circular economy. For example, there are numerous calls for a SUP ban or tighter regulation, but most proposals do not provide for incentives for alternatives, or how the transition will be made. Proposals also do not cover developing the recycling industry in the country, or promoting a zero-waste, less consumeristic society that leads to a significant reduction in waste generated.
3. Proposals tend to be reactive to current events and “flavor of the times”
The ad hoc approach is further exemplified by the reactive nature of some proposals to current events, or news items that bring airtime and publicity to lawmakers and politicians. Such “flavor of the times” events will result in a flurry or proposals, but once the noise dies down, legislators move to the next high-profile issue to tackle. An example are proposals calling for a ban on waste imports. These only started to appear when journalists and environmental groups exposed large quantities of illegal and mis-declared shipments. Despite the expression of support from lawmakers and government leaders, there has been little concrete action and the proposals have barely moved in Congress.
4. No adequate follow-through on proposals due to a lack of action taken by the government and legislators, extending to civil society
The ad hoc and reactive nature on proposals is further affected by the lack of follow-through on the proponents. The thousands of measures that go through the Congress can lead to proposals being lost and easily forgotten, especially if the proponents do not push hard enough or sustain their initial efforts. The lack of commitment can be either with the sponsor-legislator, the government officials, or even with the civil society advocates. Proposals that have lost their initial steam get shunted out by more high-profile ones, which may not necessarily be the most pressing or important matter to be tackled.
5. No serious momentum driving forward the transition to a circular economy, but recent EPR proposals could be a crucial starting point
Despite the global emergence of circular economy concepts and strategies, and its growing acceptance in many countries, it took decades before more concrete proposals got wind in the Philippine Congress. As this concept was slowly being mainstreamed, no serious push for a law or policy was being made. Putting in place an EPR law through the current proposals can potentially be a starting point for the circular economy journey in the Philippines.
5.3 Conclusion: Lessons and Policy Recommendations This chapter began with a bleak and worrying picture of the Philippine waste crisis—a seemingly insurmountable problem for a developing country beset with a host of other issues and challenges. Yet, as the very definition of “crisis” puts it, this situation is an opportunity to change course and to take that decisive action on waste management. One of these key actions is to establish and enact circular economy policies and regulations.

89
CIRCULAR ECONOMY POLICY INITIATIVES AND EXPERIENCES IN THE PHILIPPINES: LESSONS FOR ASIA AND THE PACIFIC AND BEYOND
This concluding section highlights some lessons learned from the Philippine experience of developing policies and legislation related to a circular economy. Insights will also be based on the author’s own experience in the legal and policy development and reform space in the Philippines. This will be integrated with policy recommendations for the Philippines and other developing countries on creating and establishing circular economy strategies.
5.3.1 Policy Recommendations for the Philippines and Other Developing Countries
1. Have a plan, a blueprint, or strategy in place – for the long run
A circular economy will not happen overnight. A lot of changes and reforms, institutional and policy-wise are needed. Some of these may also not be directly related to waste management at all (financial incentives, taxes, etc.). That is why it is necessary to have a plan or road map for the journey toward a circular economy. This can also begin with an assessment of the current policy landscape to see what current policies already support the circular economy; what the gaps are; and most importantly what resources are needed to make it happen. Lessons and experiences from other countries on developing a road map or comprehensive circular economy strategy can also be starting points.
Doing this will avoid a piecemeal, ad hoc, and reactive approach. A myriad of policies sends a mixed and muddled message. As one author puts it (La Vina 2012):
The legal and institutional framework [of the Philippines], which is supposed to work its way around the problems of pollution and improper waste management, is viewed by several environmentalists, lawyers, and scholars alike as overly complicated as it tries (and thereby fails) to address an even more complex environmental problem brought about by “unknowns” which include the carrying capacity of water bodies, specific sources of pollution, and the particular technological means applicable.
This will also help ensure that the circular economy initiative–which can be through an overarching law or policy–is aligned with other sectors and issues such as climate change, energy, and transport, among others.
2. Proper and effective enforcement of waste management and other environmental laws is crucial
It will be difficult to put in place new policies such as those related to a circular economy if other waste management and related environmental laws are not being properly and effectively implemented. The danger is that the circular economy will just end up as another one of those policies good on paper. Countries like the Philippines fall into this situation, where excellent laws are crafted only to end up not being successfully implemented. Case in point is RA 9003; despite the mandate to close non-sanitary landfills by 2006, these have only been closed in 2021.
As experiences from other countries show, a circular economy needs a full functioning and properly enforced waste management system to work: one that ensures proper segregation, collection, sorting, transport, and disposal or reuse. If these are not in place, investments in funds in circular economy facilities, and all the effort and hard work at reform, will go to waste.

90
PROSPECTS FOR TRANSITIONING FROM A LINEAR TO CIRCULAR ECONOMY IN DEVELOPING ASIA
3. Not just a whole-of-government, but a whole-of-society approach is needed
Most proposals failed to appreciate that a circular economy needs everyone on board and doing their part. That is why a whole-of-society approach that involves all stakeholders must be ensured. The government, through its legislators and politicians, must have the political will to enact bold law and policies for a circular economy. This must be met with an equal commitment to see its full implementation and enforcement. The private sector also must be involved, as investments and innovation cannot solely be done by the government. Nongovernment and civil society organizations, especially those already implementing small-scale and “backyard” circular economy programs, also play an important role. Lastly, the buy-in of citizens must be secured to ensure their participation in the system and compliance with any new regulation.
Identifying champions in the different groups of stakeholders will also be helpful. These individuals, groups, business organizations, or perhaps even career civil servants in government can help shepherd the policies and reforms in the medium and short term. This can also help plug resource and funding gaps, especially in developing countries.
4. A policy shift alongside a cultural and societal shift
It is one thing to put in place the circular economy policies and strategies; the other crucial factor is getting society involved to accept the same and see its successful implementation. One big hurdle is the fact that most policies only focus on dealing with the waste without commensurate efforts at reducing waste generation at source. If rising populations keep on consuming and using in the same business-as-usual manner, any circular economy scheme or system is bound to collapse. That is why proposals need to include a change in consumption and production patterns to close the loop, moving toward near-zero waste, and avoiding nonrecyclable and unsustainable materials, just to name a few. Education and information campaigns are also important to emphasize the longer-term benefits of a circular economy, especially for developing countries.
5. Take note of other critical issues that can bog down reforms
Circular economy initiatives in developing countries need to include other critical issues, particularly jobs and the informal waste sector. One of the sticking points in circular economy policy debates is how it will impact existing jobs and the informal waste sector. Measures often get stuck because an agreement cannot be reached on these issues; sometimes one stakeholder will not budge due to the lack of an assurance that basic needs will still be met, or that no additional costs or burdens will be shifted to already cash-strapped consumers. This is especially true in developing countries that already have to contend with high prices of basic commodities. Any circular economy initiative must take into consideration these challenges, which are usually found, and are not easily addressed in developing countries.

91
CIRCULAR ECONOMY POLICY INITIATIVES AND EXPERIENCES IN THE PHILIPPINES: LESSONS FOR ASIA AND THE PACIFIC AND BEYOND
References Agcaoili, O. 2016. Law on Natural Resources and Rules of Procedure for Environmental Cases. Manila:
Rex Bookstore.
ADB (Asian Development Bank). 2020. Technical Assistance Completion Report: Regional: Supporting Implementation of Environment Related Sustainable Development Goals in Asia and the Pacific (Philippine Subproject). Manila.
____. 2021. Basic Statistics 2021. Manila.
Bueta, G. 2020. Waste Trade and the Philippines: How Local and Global Policy Instruments Can Stop the Tide of Foreign Waste Dumping in the Country. Quezon City: Greenpeace Philippines and EcoWaste Coalition.
Cervantes, F. 2021. Velasco Urges Senate to Pass Waste-to-Energy Bill. https://www.pna.gov.ph /articles/1128872. Philippine News Agency (accessed 16 May 2021).
Department of Environment and Natural Resources (DENR). 2019. Intensified Environmental Protection: Solid Waste Management. https://www.denr.gov.ph/index.php/priority-programs /solid-waste-management (accessed 14 May 2021).
DENR-Environmental Management Bureau (DENR-EMB). 2019. National Solid Waste Management Status Report 2008–2018. Manila: DENR.
____. 2021. Solid Waste Management Statistics. https://emb.gov.ph/solid-waste-management-data/ (accessed 16 May 2021).
EMF (Ellen MacArthur Foundation). 2021. What Is the Circular Economy. https://www .ellenmacarthurfoundation.org/circular-economy/what-is-the-circular-economy (accessed 20 July 2021).
Greenpeace Philippines. 2021. Greenpeace Warns Clean Air Act Under Threat; Calls on Senate to Uphold Law Protecting Filipinos’ Health. https://www.greenpeace.org/philippines/press/10350 /greenpeace-warns-clean-air-act-under-threat-calls-on-senate-to-uphold-law-protecting -filipinos-health/ (accessed 15 May 2021).
House of Representatives of the Philippines. House Bills and Resolutions. https://www.congress.gov .ph/legisdocs/?v=bills (accessed 16 May 2021).
Jambeck, J., R. Geyer, C. Wilcox, T. Siegler, M. Perryman, A. Andrady, R. Narayan, and K. Law. 2015. Plastic Waste Inputs from Land into the Ocean. Science. Vol. 347(6223). pp. 768–71. https://doi .org/10.1126/science.1260352
Kirchherr, J., D. Reike, and M. Hekkert. 2017. Conceptualizing the Circular Economy: An Analysis of 114 Definitions. Resources, Conservation and Recycling. Vol. 127. pp. 221–32. https://doi.org/10.1016/j .resconrec.2017.09.005
La Vina, A. 2012. Philippine Law and Ecology Volume 1: National Laws and Policies. Quezon City: University of the Philippines.
National Solid Waste Management Commission. 2012. National Solid Waste Management Strategy. Manila: DENR.
NEDA (National Economic Development Authority). 2017. Philippine Development Plan 2017–2022. Manila.

92
PROSPECTS FOR TRANSITIONING FROM A LINEAR TO CIRCULAR ECONOMY IN DEVELOPING ASIA
PSA (Philippines Statistics Authority). 2019. Urban Population in the Philippines (Results of the 2015 Census of Population). https://psa.gov.ph/content/urban-population-philippines-results-2015 -census-population (accessed 16 May 2021).
____. 2021. Updated Projected Mid-Year Population for the Philippines Based on the 2015 POPCEN Results: 2020–2025. Manila.
Senate of the Philippines. Bills. http://legacy.senate.gov.ph/lis/leg_sys.aspx?congress=18&type=bill (accessed 17 May 2021).
SEPO (Senate Economic and Planning Office). 2017. Philippine Solid Wastes at a Glance. Pasay City: Senate of the Philippines.
WWF-Philippines. 2020. EPR Scheme Assessment for Plastic Packaging Waste in the Philippines. Quezon City.

93
CHAPTER 6
Extended Producer Responsibility: Lessons for Realizing and Implementing a Circular Economy for Plastics in AsiaAnurodh Sachdeva and Arpit Srivastava
6.1 Introduction and BackgroundExtended producer responsibility (EPR) has been internationally recognized as a key environmental policy to realize circular economy goals by accelerating efforts toward closing material cycles and effective waste management. EPR is based on the “polluter pays principle,” which aims at internalizing the cost of environmental externalities by making producers responsible for managing—or paying for the management of—their products’ life cycle until the end of life (OECD 2016). The concept of EPR was first introduced around the late 1980s and since then has expanded to countries in different parts of the world. A study conducted by the Organisation for Economic Co-operation and Development (OECD) identified over 400 different EPR schemes, most of them in OECD countries (OECD 2016). There is increasing evidence of the significant contribution of EPR to increasing the recycling rates. In Japan, for example, recycling rates of containers and packaging waste increased by 27% between 1997 and 2000 (OECD 2014). In Europe as well, EPR has contributed significantly to an increase in recycling (Watkins et al. 2017).
For this study, we focus on plastic packaging in emerging economies of Asia due to increasing concerns related to plastic pollution. The growth in the economy and rise in income levels in emerging economies has led to rapidly increasing levels of waste generation. The World Bank report What a Waste 2.0 states that the total quantity of the waste generated by low-income countries is expected to increase by three times by 2050, with recyclables including plastics currently constituting 16% of the waste. This percentage share of recyclables is expected to increase further with the rise in income levels and growing consumerism in Asia (Kaza et al. 2018). The problem of increasing amounts of plastic waste generation is exacerbated due to challenges such as low level of segregation, illegal imports, fragmented recycling industry, and, most importantly, insufficient waste management infrastructure. This leads to huge amounts of plastic waste generated either being burnt or ending up in landfills, dump sites, or the environment. Indonesia, for example, generates around 6.8 million tons of plastic every year, which is growing at the rate of 5% annually. Out of the 6.8 million tons of plastic waste generated in 2017, 4.8 million tons is considered mismanaged with 48% being burnt in the open, 13% dumped on land or poorly managed dump sites, and 9% (or 620,000 tons) being leaked into the waterways and the ocean (World Economic Forum 2020). Similarly the Philippines produces 2.7 million metric tons of plastic waste per year, out of which 17% of the collected plastic waste and 31% of the uncollected waste is leaked into the ocean (Engel, Stuchtey, and Vanthournout 2016). Also, according to the study Stemming the Tide, 60% of the plastic waste entering the oceans comes from five Asian countries: the People’s Republic of China, Indonesia, the Philippines, Thailand, and Viet Nam (Ocean Conservancy 2015). If no improvements are made in the waste management, the mismanaged plastic waste generation in Asia is expected to double from 52 megatons (Mt) in 2020 to 129 Mt per year in 2060 (Lebreton and Andrady 2019).
Against this background, with a proven track record of reducing the funding gap for waste management by shifting the burden of managing waste generated by the products from taxpayers to producers,

94
PROSPECTS FOR TRANSITIONING FROM A LINEAR TO CIRCULAR ECONOMY IN DEVELOPING ASIA
EPR can play a crucial role in moving toward a circular economy in Asia. There has been increasing discussion on introducing EPR schemes in different countries of Asia with some countries like Indonesia and India having already introduced EPR schemes for plastic packaging. This study, through inputs gathered from a literature review and expert interviews of diverse stakeholders encompassing industry, government officials, waste management operators, civil society, and academia, builds on experiences of matured EPR schemes in Europe and Asia to draw implementation lessons and identify best practices for emerging economies in the Asian context.
6.2 Assessment of Current Practices in Extended Producer Responsibility
6.2.1 Producer Responsibility Organization Functions and Responsibilities
In systems without EPR, the responsibility for the management of waste generated by the household lies primarily with the municipalities. Municipalities conform with this responsibility either on their own or by outsourcing it to a third-party concessionaire through public–private partnerships (PPPs). With the introduction of EPR, the obligation of managing waste, covered under EPR, shifts to the producers. The producers can dispense this responsibility either on their own or by establishing a supply chain specifically for their own products. This is referred to as individual producer responsibility (IPR). Another common approach is when the producers fulfill their responsibility collectively through the establishment of a new organization called a producer responsibility organization (PRO). This is commonly referred to as collective producer responsibility (CPR). In a CPR system, a number of producers come together to form a PRO, which is then responsible for implementing EPR on behalf of the producers (Pouikli 2020). In most cases, a PRO is led by the industry such as companies, associations, or other organizations from the private sector such as Duales System Deutschland in Germany, or it can be state-led as in the case of Taipei,China. PROs further can be either for-profit or not-for-profit organizations depending on various factors such as legal requirements, as in the case of Germany. Though Germany started with a single monopolistic not-for-profit PRO, due to legal requirements, it evolved into a system of competitive for-profit organizations (Bünemann, Brinkmann, and Löhle 2020). In India as well, there exist several competing for-profit PROs. On the contrary in France, there exists a single monopolistic not-for-profit PRO for packaging called CITEO. CITEO is formed by the obliged industry and is responsible for the overall implementation of the EPR scheme for packaging (Monier et al. 2014). Table 6.1 gives a comparative analysis of for-profit and not-for-profit PROs based on the different criteria: financial aspects, organizational aspects and practicalities, free-rider issues, and monitoring.
The PROs collect the EPR fees based on the quantity and weight of the packaging put on the market from the producers. PROs use this contribution from obligated companies to organize collection, sorting, and recycling of the end-of-life packaging in partnership with waste management operators. Apart from funding the operations, a PRO is also responsible for
• overall coordination among all stakeholders such as municipalities, auditors, and waste management operators;
• maintaining data records of material flowing through its system, ensuring the achievement of collection, sorting, and recycling targets;
• reporting to the regulatory authorities on the targets as well as fulfillment of EPR obligations as per the EPR legislation; and
• creating public awareness by using a wide variety of communication campaigns and tools to encourage all citizens to sort their waste and help member companies improve the recyclability of their packaging.

95
EXTENDED PRODUCER RESPONSIBILITY: LESSONS FOR REALIZING AND IMPLEMENTING A CIRCULAR ECONOMY FOR PLASTICS IN ASIA
6.2.2 Key Extended Producer Responsibility Principles
Types of Responsibility: Financial and Operational
Within the European Union (EU), the experience of EPR implementation encompasses almost 3 decades. Therefore, analysis of EPR schemes in the EU elucidates the different types of EPR implementation models that can exist depending on the local contextual factors. Depending on the share of financial and operational responsibility between producers and municipalities, different types of models emerge (Monier et al. 2014). In some countries, producers have no operational responsibility but to finance the existing waste management channels. They follow the simple financial responsibility model, for example, the packaging recovery note (PRN) system in the United Kingdom (UK), where a recycler can generate “plastic credits” to receive financial incentives. Within simple financial responsibility in some countries such as France, the producers fulfill their financial responsibility through contracts with municipalities. The producers have established contracts with the municipality through a centralized monopolistic PRO. The PRO needs to ensure EPR compliance by meeting the set targets for collection and recycling through municipalities. In other models, the producers along with financial responsibility also partake in the operations of managing waste, in whole or in parts, through PROs.
The PROs could either partially participate in operations of waste management such as sorting and selling of sorted material for recycling (e.g., in Belgium) or, in other cases (e.g., in Germany), producers through PROs take full operational responsibility of collection and sorting by subcontracting the waste management operations to waste management operators (WMOs) (Monier et al. 2014).
Table 6.1: Comparative Analysis between For-Profit and Not-for-Profit Producer Responsibility Organizations
Criteria For-Profit Not-for-Profit Financial aspects Competition leads to high price
pressure. This means that while PROs can make profits, they can also make losses and, in some cases, become insolvent.
The fees collected reflect the costs incurred in implementing and operating the system. They are regularly reviewed based on spending and revenues collected.
Organizational aspects and practicalities
Less transparency as a lot of information is not disclosed. Each PRO is responsible for organizing itself.
The PRO has no economic interest of its own, allowing higher levels of transparency.
Free-rider issues More difficult to make sure that every obliged company pays its EPR fees to the PRO. A separate register is needed. Competing PROs have a vested interest in acquiring companies as participants in their systems, whereas monopolies can survive by increasing prices.
As there is only one PRO, it is easier to identify free riders when obliged companies pay EPR fees to the PRO.
Monitoring A high level of monitoring is necessary as there are multiple, competing PROs and a lower level of transparency.
The effort associated with monitoring is lower than for a for-profit PRO.
EPR = extended producer responsibility, PRO = producer responsibility organization.
Source: Bünemann, Brinkmann, and Löhle (2020, p. 2).

96
PROSPECTS FOR TRANSITIONING FROM A LINEAR TO CIRCULAR ECONOMY IN DEVELOPING ASIA
Full Cost Coverage Principle
The scope of the EPR fees is to cover the full costs related to the management of waste produced from the products covered under the EPR scheme. In general, there is a consensus that the EPR fees should finance the operational costs of managing the product put on the market, including collection, sorting, and treatment costs minus the revenue generated from the sales of the sorted material. In addition, the EPR fee also ideally covers costs related to administration activities such as data collection, enforcement and monitoring costs, and running awareness campaigns (Hogg et al. 2020). For countries with the presence of an informal sector, the EPR fee should also cover costs related to the integration of the informal sector into the EPR system. Now depending on the legislation, the cost coverage can differ. In France, the financial sharing between producers and municipalities for managing packaging waste is on an 80:20 basis, while in Germany the producers have 100% financial responsibility for EPR compliance (Hogg et al. 2020). This, along with other factors, has led to municipalities handling the entire waste management operations in France, while the operational responsibility is handled directly by the PROs in Germany. On the contrary in the UK and Poland, due to the PRN system, the producers’ contributions are as low as 10% of the total EPR fee for the UK and 5% for Poland (Hemkhaus et al. 2018; Grant et al. 2021), which has led to minimal involvement from municipalities and rendered the scheme driven predominantly by recyclers.
Enforcement and Compliance
EPR systems should ensure there is uniform adoption and enforcement among all stakeholders. Systems continuously monitor and report any free riding by the producers. Free riding adds to the financial burden on producers participating in the EPR scheme, as indirectly the participating producers will have to pay for the waste management costs for the free-riding producers. This leads to inefficiencies and low collection rates. With the increase in e-commerce market and online sales, there has been a reported increase in free riding as online sellers might not be registered (Hogg et al. 2020). Therefore, for an EPR system to succeed, it should establish adequate monitoring and enforcement mechanisms such as online platforms, data reporting, and auditing.
6.3 Producer Responsibility Organization Operating Model for Emerging Economies in Asia
As described, there is a plethora of options and models in implementation in different parts of the world. Each model is reflective of the country’s context. We gathered theoretical and practical knowledge through a literature review and field visits to sorting and recycling plants in Germany. This was supplemented by conducting over 25 interviews with experts from Belgium, France, Germany, India, Indonesia, Malaysia, Switzerland, and Thailand. Based on the knowledge acquired, this section envisions to tailor the findings to the Asian context by outlining an operating model for a PRO. Such a model discusses methods of PRO participation in an EPR system along with different steps of the waste value chain—collection, sorting, and recycling and treatment—and with existing waste management stakeholders—namely, local authorities (municipalities) and the informal sector.
6.3.1 Members of an Extended Producer Responsibility Scheme: Obliged Companies
The companies obliged to participate in an EPR scheme are dependent on the scope of the EPR legislation. However, considering the polluter pays principle, which is the basis of the concept of EPR, the companies that pack products themselves or have products packed on their behalf (with own brand or as a neutral product) to put them on a country’s market are responsible for participating and

97
EXTENDED PRODUCER RESPONSIBILITY: LESSONS FOR REALIZING AND IMPLEMENTING A CIRCULAR ECONOMY FOR PLASTICS IN ASIA
contributing to the EPR scheme. This would also include companies that import packed products in order to put them on the market. With the boom in the e-commerce and food delivery industry, the companies which produce service packaging themselves or import service packaging to put on the market are also being included in the EPR schemes. The term “producer” as per the EPR toolbox by PREVENT Waste Alliance is defined as:
It refers to any company that introduces packaged goods for consumption to a national market. Also, the product will be discarded in the same national market (Bünemann, Brinkmann, and Löhle 2020, p. 12).
Considering the dependence of Asia’s economy on micro, small, and medium-sized enterprises (MSMEs), special attention needs to be paid to the plastic manufacturing MSMEs while designing EPR schemes. According to Asia Small and Medium-Sized Enterprise Monitor 2020 by the Asian Development Bank (ADB), “MSMEs in Southeast Asia accounted for or an average 97.2% of all enterprises, 69.4% of the total workforce, and 41.1% of a country’s gross domestic product (GDP) during 2010–2019” (Asian Development Bank 2020, p. 10). Also, in developing economies, a considerable number of the entrepreneurs are in the informal sector, which is not registered. This could pose a challenge for EPR schemes in emerging economies in Asia if the vulnerabilities of the MSMEs involved in the plastic industry are not taken into account. There should be special consideration and allocation of differentiated responsibilities in the proposed EPR schemes for MSMEs involved in plastic manufacturing. This can provide a safety net and avoid compliance complications for MSMEs and the regulatory authorities by giving certain relaxations and exemptions for the initial few years. Presently, since there is no one standardized classification of MSMEs and they are classified using a combination of criteria varying from country to country, the differentiation and categorization will need to be decided through a multi-stakeholder process and market data analysis of the plastic packaging industry (Asian Development Bank 2020). On the basis of the size of the packaging industry, and countries’ classification of industries into large, medium-sized, and small industries (OECD 2005), the obliged companies can be divided into three tiers:
Tier 1: Large enterprises. This segment could include companies that, after market analysis, are producing packaging or generate revenue above a certain threshold to be categorized as large enterprises. The tier 1 obliged enterprises generally would be the companies that are operating at a pan-national level and putting a “considerable” level of packaging in the market. The enterprises in this category pay the licensing fee in accordance with the amount and type of plastic packaging put on the market.
Tier 2: Medium-sized enterprises. This would include enterprises that, after market analysis and based on official categorization of industries, are limited in size and scale of operations. The enterprises in this category could pay a lump-sum amount annually to a corpus fund managed by the PRO to reduce the complexity of compliance. This would reduce enforcement and compliance cost and will also reduce financial and compliance complications for enterprises in this category. The draft Indian EPR guidelines propose setting up a similar corpus fund, which is funded by enterprises that produce packaging below the threshold level decided by the Government of India (Ministry of Environment, Forest and Climate Change 2020).
Tier 3: Exempted—Micro and small enterprises. This would include enterprises that, after market analysis and based on official categorization of industries, are putting packaging volume or earning revenues less than a certain threshold. The industries in this category can be provided an exemption; for example, EPR in the Republic of Korea provides an exemption to small manufacturers and importers (Korea Environment Corporation 2021).

98
PROSPECTS FOR TRANSITIONING FROM A LINEAR TO CIRCULAR ECONOMY IN DEVELOPING ASIA
It is also recommended to include all packaging such as paper, glass, and metal to increase the revenue options for PROs, as internal cross-subsidies can offset fluctuations in the prices for individual materials such as low-value plastic waste. It will also ensure circularity for all the packaging right from the start of implementation of EPR and can open more options for eco-modulation of fees for materials with lower environmental impact.
6.3.2 Financial Model: Costs and Sources of Revenue
As mentioned in the earlier section on the full cost coverage principle, different cost streams need to be covered to fulfill the obligation of the EPR scheme. To ensure financial sustainability, a PRO will have to ensure that the sources of revenue are greater than or equal to the costs incurred. Table 6.2 lists some of the sources of revenue and probable cost heads. The bulk of revenue is generated from primarily licensing fees and the sale of the sorted packaging material. For example, Fost Plus (2017), a Belgium PRO for packaging, reported 54% of revenue generated from EPR fees and 46% from material sales (Figure 6.1). In addition, a PRO can also explore other opportunities to supplement financial sustainability, such as consulting services to the industry for eco-design of packaging or to the municipalities for waste management planning. Additionally, a PRO can leverage the funding and grant options available through international development agencies or bilateral and multilateral organizations to support and expand operations in the initial development years. For the cost heads, operations (i.e., collection and sorting) generally occupy the bulk of the operations costs. Fost Plus (2017), for example, in 2017 spent 78.2% of the budget on operations cost specifically for the collection and sorting of the packaging waste (Figure 6.1).
Table 6.2: Cost and Revenue Streams
Sources of RevenueLicensing fee from member countries
Should be based on full-cost principle (cost of collection, sorting and recycling + administrative, communication, data management costs)
Sales of recyclates Revenue from sale of PRO-owned materials to recyclers and treatment agencies
Consulting fees fom companies
Professional fee for advisory services such as eco-design of packaging, municipal SWM planning
Project-based grants
Funding from international alliances, bilateral/multilaterals for execution of high-priority projects
CAPEX = capital expenditure, IT = information technology, MRF = materials recovery facility, OPEX = operating expense, PRO = producer responsibility organization, SWM = solid waste management.
Source: Authors’ compilation.
Cost HeadsPayment to operators
OPEX support to waste management operators contracted by PRO based on the terms of payment
Payment to nonprofits
For one-time professionalization of informal sector workers in a particular city/district
Employee salaries Compensation to full-time and part-time staff members
Rent and utilities Rent of land, building, and machinery, payment of electricity and water bill
IT platform and maintenance
Development and maintenance of digital backbone
Any CAPEX on project basis
E.g. setting up MRF in a coastal area with high leakage potential or supporting an aggregator for upgrading
Miscellaneous Other expenses

99
EXTENDED PRODUCER RESPONSIBILITY: LESSONS FOR REALIZING AND IMPLEMENTING A CIRCULAR ECONOMY FOR PLASTICS IN ASIA
Two challenges that can be foreseen for emerging economies in Asia are predominantly low to medium rates of waste segregation and waste collection (United Nations Environment Programme 2017). EPR systems in developed economies rely on comparatively well-developed waste segregation and collection systems, which ensure separate collection of waste covered under EPR schemes. Since the emerging economies lack well-developed waste segregation and collection systems, the initial costs associated with developing and ensuring separate collection of EPR relevant waste could be high. However, as will be discussed, due to the presence of the informal sector, there exists a well-developed waste value chain for recyclables operated by the waste pickers. Therefore, the informal sector contributes significantly in managing plastic waste and bringing down the overall waste management costs associated with segregation and collection (United Nations Environment Programme 2017). This can be leveraged by the EPR system to reduce the waste segregation, collection, and sorting costs, while at the same time supporting the formalization of the informal sector involved in waste recycling. Therefore, the cost coverage of EPR schemes in emerging economies in Asia should include the integration of the informal sector into cost accounting, and there should be dedicated fund allocations for supporting formalization with the assistance of not-for-profit organizations.
6.3.3 Producer Responsibility Organization and Its Interaction with Existing Waste Management Stakeholders
In the current waste management system in most emerging economies in Asia, the municipal waste including the plastics is the responsibility of the local municipalities. They fulfill the responsibility either on their own or through contracting waste management services to private waste operators (United Nations Environment Programme 2017). The other equally, if not more, important stakeholder is the informal sector, which contributes significantly toward managing plastic waste. When an EPR scheme is introduced, an additional stakeholder in the waste management system is producers or the PRO. The new stakeholder, the PRO, now needs to become part of the existing waste management system to ensure efficient waste management of the waste covered under the EPR scheme. There are different approaches that a PRO can adopt depending on the social, political, economic, and
Figure 6.1: Case Study: Financials of a Belgian Producer Responsibility Organization
Source: Fost Plus (2017).
Revenue from material sales
46%
Contribution from obligedcompanies
54%
General costs
7%
Litter management
11%
Communications3%
Other costs1%
Collection and sorting
78%
Revenue Cost

100
PROSPECTS FOR TRANSITIONING FROM A LINEAR TO CIRCULAR ECONOMY IN DEVELOPING ASIA
geographical context. This section discusses the different approaches a PRO can adopt in emerging economies in Asia depending on the existing waste management systems.
Channel 1: Door-to-Door Collection of Household Waste
Option 1: PRO contracts with WMOs to run sorting centers from concessionaires
This approach is developed for scenarios characterized by comparatively high segregation and collection rates by the existing formal waste management stakeholders—i.e., the municipality or the contracted private WMOs. To build upon the existing supply chain instead of creating a new one, in this approach, we suggest the primary collection of waste, either door-to-door or curbside collection, be done by the existing stakeholders, which could be either the municipality or a private WMO contracted by the municipality (hereafter referred to as “concessionaire”). A PRO enters into the waste value supply chain at the sorting stage by contracting a private WMO to run a sorting center. The contract award process is for an economically viable collection geography based on competitive bidding. The bidders could be formal waste management companies or large aggregators willing to formalize. A WMO sets up a greenfield sorting center or upgrades its existing materials recovery facility (MRF) as per the requirements of the PRO. Sorting centers enter into contracts with municipalities or concessionaires for the supply of plastic and packaging fractions of solid waste collected. The agency responsible for primary collection (i.e., either municipality or concessionaire) will have to ensure mandatory dry–wet sorting at the source to ensure quality of the plastic and packaging supplied. Sorting centers can also perform preprocessing activities such as baling and crushing, depending on the location and amount of plastic waste handled. The operational ownership, in this case, is transferred from the municipality or concessionaire for the primary collection to the WMO contracted by the PRO at the sorting stage. Post-sorting the waste is then channeled to authorized recyclers or treatment companies in return for revenue. Figure 6.2 gives a schematic description of the same. One thing to note here is that the plastic collected during the primary collection is largely expected to be low value, since in emerging economies it has been observed that high-value plastics are picked by the informal sector (Schuldt et al. 2020).
Figure 6.2: Schematic Description of the Flow of Plastics and Contract Mechanisms
PRO = producer responsibility organization.
Source: Authors.
Sorting Center(SC)
Operational ownership: Contracted waste management operator (funded by PRO)
Operations ownership: Municipality or private waste management companies
Plastic packaging
Largely low-valueplastic waste
Shredding baling can be done prior to selling
Contract
End use of waste:
Recycling or treatment
Contracts waste management operators
PRO
Primary Collection
Preliminary Sorting

101
EXTENDED PRODUCER RESPONSIBILITY: LESSONS FOR REALIZING AND IMPLEMENTING A CIRCULAR ECONOMY FOR PLASTICS IN ASIA
Option 2: Primary collection PRO contracts with WMOs for end-to-end waste management solutions
This approach is developed for scenarios characterized by comparatively low segregation and collection rates by the existing formal waste management stakeholders—i.e., the municipality or the contracted private WMOs. This approach is adapted from a WWF report, Study on EPR Scheme Assessment for Packaging Waste in Malaysia (Schuldt et al. 2020). In this case, a PRO takes the full operational responsibility of the system from collection until ensuring recycling of the relevant waste through WMOs. The PRO is responsible for primary collection as well as for sorting centers. The PRO contracts this responsibility to private waste management companies, which could be a single contract or separate contracts for collection and sorting depending on the capacities of the bidder. Bidders could be formal waste management companies or large aggregators willing to formalize. The waste is collected by WMOs contracted by the PRO and is transferred to the sorting center where it is further sorted into different categories. This sorted waste, depending on its recyclability, is channeled to either authorized plastic recyclers or treatment plants. Figure 6.3 gives a schematic description of the flow of processes and plastic waste.
Figure 6.3: Schematic Description of the Flow of Plastic Packaging and Contract Mechanisms
PRO = producer responsibility organization.
Source: Authors.
Largely low-valueplastic waste
Sorting Center(SC)
End-to-end operation responsibility: PRO
Plastic packaging
Shredding baling canbe done prior to selling
Contract
End use of waste:
Recycling or treatment
Contracts waste management operators
PRO
Primary Collection
Preliminary Sorting
Primary collectionDoor-to-door collection of segregated system
relevant waste
Channel 2: Waste Collection through the Informal Sector
In emerging economies in Asia, a large part of waste management is handled by the informal sector. In Indonesia, for example, the informal sector recycles around 700,000 metric tons of plastic waste every year (World Economic Forum 2020). In Viet Nam, out of 323 kilotons (kt) of plastic waste collected for recycling domestically, 309 kt (more than 95%) is reported to be recycled by the informal sector (IUCN-EA-QUANTIS 2020). Similarly for India, the informal sector contributes to achieving recycling

102
PROSPECTS FOR TRANSITIONING FROM A LINEAR TO CIRCULAR ECONOMY IN DEVELOPING ASIA
rates as high as 50%–70% for all plastics (Nandy et al. 2015). A World Bank study estimated that the informal sector in developing countries handles 15%–20% of the generated waste, which as a collateral benefit reduces the waste management costs for municipalities (Kaza et al. 2018). A study by Wilson et al. (2009) stated that the recycling rates achieved by the informal sector can range from 20% to 50%. Often, in the absence of formal waste management systems, the informal sector is the only stakeholder providing waste management facilities to the residents (Linzner and Lange 2012). Even during the COVID-19 pandemic, the informal sector continued the waste collection when the services across the industry came to a standing halt (Singhal 2021). The informal sector is characterized by no work contracts—meaning no regular income and no access to social benefits such as health insurance. Moreover, the informal workers often work with simple equipment, sometimes with bare hands, and in conditions that pose a grave risk to their health (Shekar and Arora 2021). Thus, considering the social, economic, and environmental benefits stemming from waste managed by the informal sector and the vulnerabilities of the people working in this sector, it is only logical to integrate the informal sector into the EPR system. Some countries have made legal provisions for inclusion of the informal sector in their EPR system. For example, Chile’s legal framework for EPR mandates PROs to make inclusion plans that lay down the mechanisms for full integration of waste pickers (Bünemann, Brinkmann, and Löhle 2020). Similarly, the draft EPR guidelines of India also acknowledge the contribution of the informal sector in plastic waste management but fail to lay out approaches and tangible requirements for formalization (Sachdeva and Srivastava 2020).
The informal sector is mostly interested in the high-value plastic (HVP) waste, which due to its positive market value is extracted and sold to traders or recyclers through an established waste value chain. A study done by GA Circular (2019) informs that for the nine cities analyzed in Southeast Asia, the informal sector is responsible for recycling 97% of the PET bottles due to their high market value. This leaves municipalities and private WMOs mostly with low-value plastic (LVP) waste due to its low to negative market value. This also becomes a point of contention between WMOs or municipalities and the informal sector as they compete for high-value waste (Chaturvedi, Arora, and Saluja 2015) and could also be a potential point of contention for PROs if the informal sector is not properly integrated. Despite the significant contribution by the informal workers in solid waste management their contribution in the decision making and waste policy processes is often ignored. Considering their knowledge and expertise in handling plastic waste, it is only imperative to recognize their contribution and include them in an EPR system. Instead of seeing the informal sector as a conflict with the functioning of an EPR system it should be used as an opportunity to accelerate efforts toward their formalization and integration. This section seeks to recommend models of informal sector integration by understanding the dynamics and nature of the informal sector. For this study, we categorize the informal sector in waste management into three broad categories: waste pickers, small aggregators, and large aggregators, as explained in Table 6.3.
The primary driver for the informal waste collection and recycling is the inherent market value of certain waste fractions. Strictly speaking for plastics, we categorize plastic waste into two broad categories based on their market value. Plastics with a high market value such as PET are often prioritized by the informal sector as they offer high returns (referred to as high-value plastics or HVPs). On the other hand are plastics with low to zero or a negative market value such as flexible packaging (referred to as low-value plastics or LVPs). These are often not recycled and end up in landfills, rivers, or dump sites. The informal sector has developed a robust waste value chain for HVPs due their market value.
This section, through the two approaches described, lays down a step-by-step procedure of how the informal sector can be integrated into an EPR system and how PROs can facilitate and accelerate the process of formalization of the informal sector toward a socially inclusive EPR system (see Figure 6.4 for a schematic description of the two approaches).

103
EXTENDED PRODUCER RESPONSIBILITY: LESSONS FOR REALIZING AND IMPLEMENTING A CIRCULAR ECONOMY FOR PLASTICS IN ASIA
Approach 1: Procurement from small aggregators and waste pickers
The waste pickers and small aggregators register and become members of the PRO in order to get access to sell their materials to the sorting center contracted by the PRO. In parallel, for an initial period of a few months to a year, the PRO contracts a not-for-profit organization with the motive to support the professionalization of the registered informal workers. The not-for-profit organization’s activities could range from providing access to safe working conditions such as personal protective equipment and access to health care to running incubation projects for waste pickers and small aggregators willing to formalize and expand their operations. The not-for-profit organization can also help waste pickers and small aggregators in forming small to medium-sized recycling enterprises or cooperatives through social inclusion projects. A case study published by Saahas Zero Waste, a not-for-profit based out of India, showcases a transition of a waste picker to an entrepreneur with the support of a social inclusion project. The project assisted the waste picker to become an authorized entrepreneur running a small MRF providing further employment to 10 waste pickers as registered employees (Saahas Zero Waste 2021).
The waste collected by the registered waste pickers or small aggregators is purchased at the sorting centers contracted by the PRO. The sorting center decides on the minimum quantity and quality criteria for the waste to be purchased and also announces rates regularly for various fractions. In order to increase the collection rate of LVPs, a preferential rate of 5%–10% higher than the market rates can be given to provide incentives to collect LVPs in addition to HVPs. This can also address the problem of LVP littering in public places, which is a serious problem in emerging economies. Due to high market demand, the HVPs are purchased at the prevailing market rate. To ensure transparency and traceability of the transactions, a waybill is generated for every transaction.
This approach, though difficult and complex in operations and monitoring, can provide increased formalization to a larger number of waste pickers and can also ensure the decentralization of operations, thus generating more job opportunities (Almack 2020). Furthermore, the preferential pricing for the LVPs can drive up recycling and treatment rates for fractions of plastics that otherwise would end up in the environment or be burnt in the open.
Approach 2: Proof of recovery from large aggregators
In this approach, a PRO develops a scheme for the formalization of large aggregators and invites applications. The PRO then enters into a contract with selected large aggregators. The aggregators are
Table 6.3: Categorization of the Informal Sector
Waste pickers Includes individual waste pickers who are involved in door-to-door collection of sorted dry waste such as newspapers, PET bottles, etc. The collected waste is sold either directly to recyclers or to small traders. This category would also include waste pickers who collect recyclable waste from the streets, dump yards, and landfills, and from waste collected by municipalities at materials recovery facilities or during transportation to processing sites.
Small aggregators Consists of junk shops and scavenger cooperatives that are not registered and purchase waste directly from waste pickers operating in their area. They are decentralized and mostly spread out throughout the cities.
Large aggregators Centralized waste collectors operating with large quantities of waste, most often purchasing waste from a number of small aggregators for further sorting and selling it to the recyclers or processing industry. The large aggregators are often involved in preprocessing activities such as shredding and baling.
Source: Authors’ compilation based on study by Wilson et al. (2009).

104
PROSPECTS FOR TRANSITIONING FROM A LINEAR TO CIRCULAR ECONOMY IN DEVELOPING ASIA
allowed to maintain their supply chain as is but agree to implement formalization requirements, such as providing health and safety requirements, and following labor and tax laws. The large aggregators sign up on the information technology (IT) platform of the PRO, make regular entries on mass flow, and provide full-time employment to waste pickers. In return, aggregators receive financial incentives as per the terms of contracts against proof of recovery generated for every ton of plastic recycled or processed as per the standards accepted by the regulatory authorities. This financial assistance could be, for example, a one-time infrastructure upgradation expense or monthly support for operational expenditures based on the quantity of plastic waste managed. Based on the data of plastic waste handled and proof of recovery received from these large aggregators, the PRO reports the compliance of its members to the regulator.
Figure 6.4: Schematic Description of Different Approaches for Informal Sector Integration
HVP = high-value plastic, LVP = low-value plastic, PRO = producer responsibility organization.
Source: Authors.
Sorting Center(SC)
Plastic packaging
Sorted LVPs and HVPs
Contract
End use of waste:
Recycling or treatment
PROIndividual Waste
PickerSmall
Aggregator
Contract with not-for-profit organization to support formalization
Large Aggregator
Sorted HVPs
Approach 1
Approach 2
6.3.4 Ownership of the Material: How to Ensure That the Collected Material Is Recycled
The collected and sorted material can be owned and marketed either by the PRO or by the WMOs contracted by the PRO. It is recommended for PROs to take ownership of the LVPs to absorb the risk against their zero or negative market value and prevent the collected LVPs from ending up dumped in open grounds, landfills, or the environment such as the rivers or oceans. The PRO in this case enters into a long-term strategic contract with recycling companies or processing units such as cement plants, road construction companies, and upcyclers such as plastic-to-roof tiles for the supply of LVPs. The contracting mechanism between the PRO and WMOs takes this into account that the material though stored by WMOs at the sorting centers will be owned by the PRO.

105
EXTENDED PRODUCER RESPONSIBILITY: LESSONS FOR REALIZING AND IMPLEMENTING A CIRCULAR ECONOMY FOR PLASTICS IN ASIA
However, HVPs, considering their positive market prices and demand for recycling, should be owned by WMOs or large aggregators. The WMOs and large aggregators own the materials collected and can sell the materials directly only to accredited recyclers. Only the proof of recovery generated by the accredited recyclers will be accepted as legitimate. A PRO would have no role to play in pickup scheduling, terms of sales, and transportation, thus making it operationally easier. However, a PRO retains the right to audit the mechanism to ensure traceability of the data on the plastic collected and recycled.
6.4 Best PracticesIn addition to the recommendations on the operational aspects of a PRO, there are supporting mechanisms that can be used to ensure the effective implementation of an EPR scheme. The best practices outlined are specifically focused on ensuring the effective monitoring and compliance through a packaging register and achieving a circular economy through eco-modulation of fees.
6.4.1 Packaging Register
A web-based platform maintained by the PRO under the supervision of the respective environment ministry can play a crucial role in ensuring transparency, compliance, and verification of data submitted by various stakeholders. The companies obliged to be a part of the EPR system register on the packaging register and declare the quantity of the packaging put in the market. The PRO collects and reports data, such as quantity of plastic waste handled by the waste management operators contracted to run sorting centers and the amount of plastic recycled or processed, accompanied by supporting documents from stakeholders. The packaging register acts as a one-stop platform for the submission of data reports by the PRO, as well as obliged companies. This can further help in monitoring the progress toward overall collection and recycling rates (Sachdeva and Srivastava 2020). An example of this is the Zentrale Stelle Verpackungsregister (Central Office for Packaging Register) in Germany, which is a public platform founded by the obliged companies in agreement with the German Environmental Ministry for data monitoring and compliance requirements as per the federal packaging law (ZSVR Stiftung 2021).
6.4.2 Eco-Modulation of Fees
EPR schemes, in general, have proven to be effective in improving overall collection and recycling rates of different product streams. Moreover, EPR schemes have reduced the financial burden of the municipalities to handle waste management and shifted the cost burden from taxpayers to the producers. However, looking at EPR holistically, it can also accelerate efforts toward a circular economy by closing the loop, i.e., using the plastic recycled in the production process, and driving producers to improve their product design toward low environmental impact (OECD 2020). This can be done through modulating the fees depending on design criteria that deliver environmental benefits. Eco-modulation of EPR fees creates incentives for the producers to shift to sustainable packaging by charging lower EPR fees for products that have low environmental impact. For example in Sweden, the fee is differentiated into two levels of higher and lower fees depending upon the material’s sorting and processing properties as well as its salability in the market after sorting and processing. Similarly, CITEO, a French PRO, issues a bonus of 12% on the total fee contribution for bottles made of PET, high-density polyethylene (HDPE), or polypropylene (PP), as it meets the French sorting guidelines and has an established recycling channel (Hogg et al. 2020). However, care should be taken while modulating the fees to ensure revenue balance and that modulation of fees is reflective of the true end-of-life management costs.

106
PROSPECTS FOR TRANSITIONING FROM A LINEAR TO CIRCULAR ECONOMY IN DEVELOPING ASIA
6.5 From Voluntary to Mandatory Extended Producer Responsibility Schemes: Transition and Implementation Road Map
With the assistance of two case studies—Malaysia and Indonesia—we conclude with laying down an implementation road map for countries where EPR has either not yet been legislated or has been legislated but without an implementation framework.
Indonesia has passed a regulation introducing EPR and creating a road map to waste reduction by the producers (Ministry of Environment and Forestry of the Republic of Indonesia 2019; Tristiana, Koeswahyono, and Fadli 2018). However, in the absence of an implementation framework, there exist voluntary initiatives by the industry, such as the Indonesia Packaging Recovery Organization (IPRO) being operated by the producers as a not-for-profit voluntary initiative (IPRO 2021). In Malaysia, there is not yet, at the time of writing, an EPR policy, but there are ongoing discussions related to EPR. Also, 10 industry members have come together to form a voluntary PRO called the Malaysian Recycling Alliance (MAREA), which has started some initial pilot projects. MAREA has set a goal for the members to achieve 95% collection rates for recycling of PET, HDPE, and used beverage cartons, and 50% for flexible packaging by 2030 (Malaysian Recycling Alliance 2021). Similarly, IPRO has picked Jawa Timur and Bali as the project target areas for 2021 and has launched three categories of programs for recycling of plastic waste. For category A initiatives, IPRO gives financial incentives to aggregators or recyclers for proof of recycling and collection (similar to approach 2 referred to in section 6.3.3); for category B projects, IPRO provides cofunding for setting up new or upgrading the existing collection and sorting systems. The category C projects are used for scaling up pilot projects implemented as part of categories A and B (IPRO 2021).
In the current as-is situation for both countries, there are only a few motivated partners coming together to run pilot programs. Industry can use this initial period to develop a blueprint of the PRO operating model such as processes, organizational structure, and responsibilities. The municipalities and existing WMOs can support the voluntary PROs in implementing pilot projects and streamlining the waste value chain. Special focus should be given to developing informal sector inclusion schemes and standard operating procedures for processes such as contracting, EPR fee estimation, and data monitoring. Voluntary PROs, as seen in the case of Malaysia and Indonesia, can use the opportunity to stabilize the existing operations and scale up operations in new geographies so that once the EPR scheme is finalized and made mandatory, the industry already is in a stable position to launch a mandatory PRO and comply with collection and recycling targets. This would give the industry a head start. Once a mandatory EPR scheme is in place, the PRO, based on lessons learned during the voluntary stage, can expand the geographical scope to all municipalities and improve the overall collection and recycling rate. Once the EPR scheme matures and PRO operations are stabilized, the PRO can focus on improving compliance, closing the loop of packaging, and introducing eco-modulation of fees (refer to section 6.4.2). Figure 6.5 lays down the step-by-step implementation road map and way forward for emerging economies in Asia where EPR is in the nascent stages of development.

107
EXTENDED PRODUCER RESPONSIBILITY: LESSONS FOR REALIZING AND IMPLEMENTING A CIRCULAR ECONOMY FOR PLASTICS IN ASIA
Figure 6.5: Implementation Road Map and Way Forward
EPR = extended producer responsibility, PRO = producer responsibility organization.
Source: Authors.
• Few motivated partners • Pilots with initial results• Unstandardized processes,
accountabilities, and handovers
CURRENT AS-IS
• Majority of industry onboarded as members
• Predictable policy informed by data and results from initial pilots
• Standardized processes, governance structures, and interfaces
Step 1
• Focus: Design of EPR scheme, launch of voluntary PRO and initial pilots
Step 2
• Focus: Launch of mandatory PRO, scaling operations across geographies, improve overall collection and recycling rate
Step 3
• Focus: Improving compliance, stabilize the implementation, promotion of secondary materials market, and introduce eco-modulation of fees
FUTURE SHOULD-BE

108
PROSPECTS FOR TRANSITIONING FROM A LINEAR TO CIRCULAR ECONOMY IN DEVELOPING ASIA
ReferencesAlmack, A. 2020. Seven Reasons Why Decentralized Waste Management Is Best for Emerging Economies.
Bengaluru: Hasiru Dala.
Asian Development Bank. 2020. Asia Small and Medium-Sized Enterprises Monitor 2020: Volume 1—Country and Regional Reviews. Manila.
Bünemann, A., J. Brinkmann, and D. Löhle. 2020. EPR Toolbox. Bonn: Deutsche Gesellschaft für Internationale Zusammenarbeit (GIZ) GmbH.
Chaturvedi, A., R. Arora, and S.M. Saluja. 2015. Private Sector and Waste Management in Delhi: A Political Economy Perspective. IDS Bulletin. Vol. 46(3) 7–16.
Engel, H., M. Stuchtey, and H. Vanthournout. 2016. Managing Waste in Emerging Markets. Munich: McKinsey & Company.
Fost Plus. 2017. Annual Report 2017. Brussels.
GA Circular. 2019. Full Circle: Accelerating the Circular Economy for Post-Consumer PET Bottles in Southeast Asia. Singapore.
Grant, A., M. Smith, M. Kurth, D. Hogg, and D. Fletcher. 2021. TOMRA Poland Extended Producer Responsibility. Bristol: Eunomia.
Hemkhaus, M., M. Henzler, S. Hibler, G. Mehra, J.K. Gaurav, and F. Eisinger. 2018. Enhancing Resource Efficiency through Extended Producer Responsibility. New Delhi: Deutsche Gesellschaft für Internationale Zusammenarbeit (GIZ) GmbH.
Hogg, D., D. Sherrington, J. Papineschi, M. Hilton, A. Massie, and P. Jones. 2020. Study to Support Preparation of the Commission's Guidance for Extended Producer Responsiblity Schemes. Bristol: Eunomia.
Indonesia Packaging Recovery Organisation (IPRO). 2021. http://www.indonesiapro.org/
IUCN-EA-QUANTIS. 2020. National Guidance for Plastic Pollution Hotspotting and Shaping Action, Country Report Vietnam. Ho Chi Minh City.
Kaza, S., L. Yao, P. Bhada-Tata, and F. Van Woerden. 2018. What a Waste 2.0: A Global Snapshot of Solid Waste Management to 2050. Urban Development Series. Washington, DC: World Bank.
Korea Environment Corporation. 2021. Operation and Management of Resource Circulation System. https://www.keco.or.kr/en/core/operation_extended/contentsid/1980/index.do
Lebreton, L., and A. Andrady. 2019. Future Scenarios of Global Plastic Waste Generation and Disposal. Palgrave Communications. Vol. 5(1). pp. 1–11.
Linzner, R., and U. Lange. 2012. Role and Size of Informal Sector in Waste Management—A Review. Institute of Civil Engineering. pp. 69–83.
Malaysian Recycling Alliance (MAREA). 2021. https://www.marea.com.my/
Ministry of Environment and Forestry of the Republic of Indonesia. 2019. Regulation of the Minister of Environment and Forestry of the Republic of Indonesia Number P.75/Menlhk/Setjen/Kum.1/10/2019 Regarding Road Map to Waste Reduction by Producers. Jakarta.
Ministry of Environment, Forest and Climate Change of India. 2020. Uniform Framework for Extended Producer Responsibility. Delhi.

109
EXTENDED PRODUCER RESPONSIBILITY: LESSONS FOR REALIZING AND IMPLEMENTING A CIRCULAR ECONOMY FOR PLASTICS IN ASIA
Monier, V., S. Mudgal, M. Hestin, J. Cavé, M. Gheoldus, M.V. Acoleyen, et al. 2014. Development of Guidance on Extended Producer Responsibility (EPR). Brussels: European Commission - DG Environment.
Nandy, B., G. Sharma, S. Garg, S. Kumari, T. George, Y. Sunanda, and B. Sinha. 2015. Recovery of Consumer Waste in India—A Mass Flow Analysis for Paper, Plastic and Glass and the Contribution of Households and the Informal Sector. Resources, Conservation and Recycling. Vol. 101. pp. 167–81.
Ocean Conservancy. 2015. Stemming the Tide. Washington, DC.
Organisation for Economic Co-operation and Development (OECD). 2005. OECD SME and Entrepreneurship Outlook: 2005. Paris.
____. 2014. The State of Play on Extended Producer Responsibility (EPR): Opportunities and Challenges. Tokyo.
____. 2016. Extended Producer Responsibility: Updated Guidance for Efficient Waste Management. Paris.
____. 2020. Modulated Fees for Extended Producer Responsibility Schemes (EPR). Paris.
Pouikli, K. 2020. Concretising the Role of Extended Producer Responsibility in European Union Waste Law and Policy through the Lens of the Circular Economy. ERA Forum. Vol. 20. pp. 491–508.
Saahas Zero Waste. 2021. Social Inclusion Project, 2019. https://saahaszerowaste.com/wp-content/uploads/2020/08/SZW-Social-Inclusion-Project-Hassan-Khan.pdf
Sachdeva, A., and A. Srivastava. 2020. India's Draft Uniform EPR Framework Misses the Uniformity It Promised to Bring. Berlin: Ecologic Institute.
Schuldt, T., J. Lee, T. Mohamed, D. Choo, D. Hashim, and D. Ramachandran. 2020. Study on EPR Scheme Assessment for Packaging Waste in Malaysia. Selangor: WWF.
Shekar, N., and K. Arora. 2021. Waste Pickers and Workers in the Informal Waste Industry: The Pillars of Extended Producer Responsibility. Bengaluru: Hasiru Dala.
Singhal, P. 2021. Informal Sector Integral to the Success of India Inc's Waste Management Initiatives. Bengaluru: Hasiru Dala.
Tristiana, E., I. Koeswahyono, and M. Fadli. 2018. Managing Policy of Extended Producer Responsibility (EPR) Implementation to Reduce Plastic Waste in Indonesia. International Journal of Humanities and Social Science Invention. Vol. 7(7). pp. 25–32.
United Nations Environment Programme. 2017. Asia Waste Management Outlook. Osaka.
Watkins, E., S. Gionfra, J.-P. Schweitzer, M. Pantzar, C. Janssens, and P. ten Brink. 2017. EPR in the EU Plastics Strategy and the Circular Economy: A Focus on Plastic Packaging. Brussels: Institute for European Environmental Policy.
Wilson, D.C., A. O. Araba, K.B. Chinwah, and C. Cheeseman. 2009. Building Recycling Rates through the Informal Sector. Waste Management. Vol. 29(2). pp. 629–35.
World Economic Forum. 2020. Radically Reducing Plastic Pollution in Indonesia: A Multistakeholder Action Plan National Plastic Action Partnership. Geneva.
ZSVR Stiftung. 2021. Using the LUCID Packaging Register. https://www.verpackungsregister.org/en /how-to-use-the-lucid-packaging-register


PART III
Business Cases and Innovations for a
Circular Economy


113
CHAPTER 7
Circular Economy Financing: Investment Cases from TurkeyEmine Eda Ünal
7.1 IntroductionThe circular economy (CE) concept has recently been elaborated widely among scholars and practitioners (Kirchherr, Reike, and Hekkert 2017). The topic is also right at the top of the political agenda across Europe and in other developed countries (Ellen MacArthur Foundation and McKinsey & Company 2014). This rapidly growing attention is mainly attributed to the fact that it presents a new economic model based on regenerative and restorative cycles targeting decoupling economic growth from resource exploitation and environmental degradation; recovering the overall system resilience; and preserving economic, environmental, and social development, while maximizing human well-being. Furthermore, CE systems perform more efficiently than linear ones in addressing the potentially excessive use of material and energy as well as product recovery (Masi, Day, and Godsell 2017).
The “linear economy model” as inherited from the Industrial Revolution in the 18th century has been following the same steps since its inception: resource extraction, production, distribution, consumption, and waste. “Take–make–dispose” in brief, the system is heavily dependent on material use without extracting or recovering the useful raw material along the steps, thus leading to material scarcity and negative environmental impact (Rathinamoorthy 2019). Together with the population growth and material consumption, resource exploitation has doubled during 1980–2020 and is expected to triple by 2050 if the linear economy model does not fall out of favor. This trend is particularly significant for countries in Asia as the material and environmental burdens are expected to shift into these regions with expanding manufacturing activities from developed countries (UNEP 2011).
Emerging market economies come into the picture with “growth,” as it is indispensable for their ultimate target of overcoming the “middle income trap.” By boosting production and consumption in order to achieve their targets, these markets dominate future material use at the global level (Arouri, Boubaker, and Nguyen 2014). Combining with demographic and economic expansion, between 2020 and 2026, major emerging market economies (Brazil, India, Indonesia, Mexico, the People’s Republic of China, the Russian Federation, and Turkey) will increase their gross domestic product (GDP) by 7.4% (IMF 2021). Based on the same data, Turkey is projected to grow at an annual average rate of around 6.0%—the fastest among the European countries compared to 4.5% on average for the G7 countries. The country is projected to rank as the seventh-largest economy as of 2026 in purchasing power parity or PPP terms among the emerging markets (IMF 2021).
For redesigning the current production and consumption process relying on ongoing growth and rising resource throughput, CE models have been proposed recently as an option (Ghisellini, Cialani, and Ulgiati 2016). Although CE practices are still at an early stage, the main promise of decoupling the environmental agenda from economic growth is subscribed to by governments and business (Ghisellini, Cialani, and Ulgiati 2016). CE is widely accepted in promoting economic growth by initiating new businesses and job opportunities, leading to less material cost, dampening price volatility, and supporting the security of supply, together with reducing environmental pressures and impacts (Ellen MacArthur Foundation 2013). Companies have increasingly positioned CE in their strategies for sustainable business conduct in addressing these adversities (Ellen MacArthur Foundation 2014). In the scenario of
114
PROSPECTS FOR TRANSITIONING FROM A LINEAR TO CIRCULAR ECONOMY IN DEVELOPING ASIA
the world transitioned to a circular economy, it is possible to reduce consumption of new materials by up to 32% within 15 years and more than 50% by 2050 (Esposito, Tse, and Soufani 2017).
With the majority of academic work on transition focused on cases from developed economies, limited published works focus on emerging market cases under the theme of CE (Garza, Aguiñaga, and Scheel 2021). Beyond CE activities and their technical feasibilities, financing of these projects is also out of the publicly available information loop (Ellen MacArthur Foundation 2021). Especially for Turkey, where CE practices are growing and evolving, academic studies on ongoing CE activities remain relatively insufficient.
In order to aid in the alleviation of this dearth of literature on CE transition in emerging economies, this chapter proposes a relevant literature review and cases from Turkey with the intent of sharing the challenges and learnings pursuant to the emerging and developing market context in Asia and the Pacific. By doing so, we aim to inclusively answer the following questions: (i) What are the challenges for CE initiatives in terms of project feasibility and financial availability? (ii) What are the possible solutions and recommendations to overcome initial problems that hinder CE transition? (iii) What can be done to maintain successful CE initiatives? To find the answers, two CE initiatives in Turkey have been analyzed with respect to operational and financial challenges and solutions during the investment periods. The data were collected through semi-structured interviews with the project groups in financial analysis, economic research, and engineering departments of the Development and Investment Bank of Turkey (TKYB) and with the official permission of the companies that are the subject of the study. Cases are additionally supported with a comprehensive literature review and background information specific to Turkey. Results are particularly important for policy makers and practitioners in coping with barriers to the CE practices and their feasibilities for broader implementation.
7.2 Conceptual Framework 7.2.1 Circular Economy
Although CE is widely accepted as a recent phenomenon in systemic change toward sustainable development, the concept has been elaborated from different angles over the last 50 years. The CE concept was initially introduced by Pearce and Turner in 1989 and practically examined by Stahel and Reday-Mulvey between 1976 and 1982, with a particular focus on life extension of products by creating an “economy of loops” (Stahel and Reday-Mulvey 1976). In these seminal works, two concepts were introduced that are integral to CE implementation: product specific and material specific. The former focuses on product reuse and the latter on post-used waste as resources (Stahel 1981, 1994). As a continuation of CE implementation in the product cycle, Braungart and McDonough (2002) asserted that transition in economic behavior from “cradle-to-grave” to “cradle-to-cradle” promotes the CE movement. “Industrial symbiosis” as a system of exchange with the purpose of achieving economic and environmental benefits has also been regarded as a CE theme as it includes material circularity among industries (Zhang et al. 2015).
Several authors (e.g., Kirchherr, Reike, and Hekkert 2017) claim that the Ellen MacArthur Foundation has provided the most prominent CE definition:
[CE] is an industrial system that is restorative or regenerative by intention and design…. It replaces the “end-of-life” concept with restoration, shifts toward the use of renewable energy, eliminates the use of toxic chemicals, which impair reuse, and aims for the elimination of waste through the superior design of materials, products, systems, and, within this, business models (Ellen MacArthur Foundation 2013, p. 7).

115115
CIRCULAR ECONOMY FINANCING: INVESTMENT CASES FROM TURKEY
Apart from conceptual explanations, the Ellen MacArthur Foundation (2015) also lined up CE principles with action steps:
• Principle 1: Preserve and enhance natural capital by controlling finite stocks and balancing renewable resource flows.
• Principle 2: Optimize resource yields by circulating products, components, and materials at the highest utility at all times in both technical and biological cycles.
• Principle 3: Foster system effectiveness by revealing and designing out negative externalities.
Sustainable development is mentioned as the main aim of CE (e.g., by Ghisellini, Cialani, and Ulgiati 2016; Ellen MacArthur Foundation 2013). In this sense, the practices of CE aim for ecological balance and protection (Patwa et al. 2021) as well as economic prosperity (Kirchherr, Reike, and Hekkert 2017) in combination. Most of the practitioners target economic prosperity in their CE transition understanding as a way to boost growth (Ghisellini, Cialani, and Ulgiati 2016).
A comprehensive and systematic study on various definitions of CE is presented in Kirchherr, Reike, and Hekkert (2017), who analyzed 114 different definitions. According to studies, a CE depicts an economic system that relies on business models which swap the “end-of-life” concept with reducing—otherwise reusing, recycling, and recovering—materials in production, distribution, and consumption processes, thus operating at the micro level (products, companies, consumers), meso level (eco-industrial parks), and macro level (city, region, nation, and beyond), in order to accomplish sustainable development, which in turn could lead to improved environmental quality, economic prosperity, and social equity, to the benefit of current and future generations.
For the rest of the chapter, the definitions from Kirchherr, Reike, and Hekkert (2017) and Ellen MacArthur Foundation (2013) for CE will be taken as guidelines to conceptualize the economic, social, and environmental implications of the attempted CE transition.
7.2.2 Emerging Market Economies
It has been 40 years since a World Bank/International Finance Corporation (IFC) economist coined the term “emerging markets.” In 1981, economist Antoine van Agtmael was preparing to present the first-ever mutual fund investment in developing economies, and “emerging market fund” was used as a replacement for “third world equity fund,” in order to promote investors to participate without negative perceptions (IFC 2016).
With the new designation, country indices have been created under three major country categories: developed, emerging, and frontier. At intervals, Standard & Poor’s (S&P) and Dow Jones publish country classification requirements based on a number of quantitative and qualitative factors (S&P 2020). According to these criteria, in order to get into the emerging markets class, countries are initially required to have a full domestic market capitalization over $2.5 billion, a domestic annual turnover value over $1 billion, and an exchange development ratio over 5% (S&P 2020). After complying with the aforementioned, an emerging market economy then has to possess at least three of following six criteria: full domestic market capitalization over $15 billion, settlement period of T+3 or better, sovereign debt rating of BB+ or above, nonoccurrence of hyperinflation, no significant foreign ownership restrictions, and freely traded foreign currency (S&P 2020). A total of 25 economies made the list for investments in global markets: Brazil; Chile; Colombia; Czech Republic; Egypt; Greece; Hungary; India; Indonesia; Kuwait; Malaysia; Mexico; Pakistan; People’s Republic of China; Peru; Philippines; Poland; Qatar; the Russian Federation; Saudi Arabia; South Africa; Taipei,China; Thailand; Turkey; and the United Arab Emirates (S&P 2020). There are also different but closely related classifications by the International
116
PROSPECTS FOR TRANSITIONING FROM A LINEAR TO CIRCULAR ECONOMY IN DEVELOPING ASIA
Monetary Fund, Organisation for Economic Co-operation and Development, European Union (EU), and United Nations Conference on Trade and Development (Grosse and Meyer 2018). In these classifications, it is observed that the terms emerging countries and emerging market economies are used interchangeably.
Beyond financial investment professionals’ point of view as global risk diversification in investments, there are also theoretical approaches attempting to give several determinative drivers in defining emerging economies other than economic development. With a broader understanding, quality of life is measured by the United Nations Development Programme (UNDP 2016) under the scope of the Human Development Index (HDI). Published annually, the index focuses on the drivers of human development—life expectancy, education, and per capita income—and ranks the countries based on these performance indicators (UNDP 2016).
A more straightforward definition of emerging market economies by emphasizing the growth aspect was given by Carrasco and Williams (2012) as “characterized by significant and rapid economic growth evidenced by rising GDP in an aggregate and per capita basis, increased trade volumes, as well as increased foreign reserves.” While GDP solely is not able to determine whether an economy is among the emerging market economies, GDP growth here is able to indicate where the economy will proceed in the near future.
Considering its economic and demographic indicators, in addition to being included in aforementioned emerging market lists, Turkey is regarded as a part of emerging economies and given as a noteworthy case in this study.
7.2.3 Circular Economy Practices in Turkey
Ambitious Political Agenda on Sustainability and Circular Economy Transition
Similar to other countries, CE practices have been emerging under the umbrella of sustainable development. Turkey had first introduced the concept of sustainable development in its 7th National Development Plan (NDP) in 1996 after the 1992 Rio Conference. Being described as the highest-level national policy action report in Turkey, the NDP sets out all macro-level national policies and priorities and paves the way for monitoring overall development progress including the Sustainable Development Goals (SDGs) on a national level. For monitoring purposes, the Turkish Statistical Institute annually publishes Sustainable Development Indicators based on the 17 SDGs and measures the performance compared to 2010 retrospectively (TURKSTAT 2021). The latest NDP for 2019–2023 sets the high-level actions for the SDGs by forming “Sustainable Development Objectives,” policies, and measures. This 11th NDP proposes establishing a National Sustainable Development Coordination Board, with the participation of related public institutions, local administrations, academia, private sector, and nongovernment organization (NGO) representatives. In order to assess and monitor the political agenda execution in practice, Turkey has released its 2nd Voluntary National Review (VNR) Report on SDGs progress, to which 2,962 people and institutions, including 312 NGOs, 2,000 company representatives, 50 municipality representatives, and 600 experts in total contributed in a participatory preparation process (The Presidency of Strategy and Budget 2019).
In addition to sustainability commitments, CE transition themes also take up an important place in the political agenda. The 11th NDP sets directions for development agencies to treat clean production, energy efficiency, and industrial symbiosis issues as a priority. In the Ministry of Industry and Technology’s Strategic Plan Report 2020–2024, industrial symbiosis was given as a means of transition in green industry projects. The Ministry of Environment and Urbanization’s Strategic Plan Report

117117
CIRCULAR ECONOMY FINANCING: INVESTMENT CASES FROM TURKEY
2019–2023 includes zero waste as a central theme by regarding waste as a resource. In this regard, the Ministry’s National Waste Management and Action Plan 2023 supports municipalities in the mission and frames the necessary steps for minimizing waste at the source; classifying, collecting, and transporting waste; building temporary storage; recycling; disposal; reuse; treatment; producing clean energy; and establishing final storage options. By 2023, 35% of the waste produced in Turkey is projected to be disposed through recycling. The cost of the investments into plants designated under the National Waste Management and Action Plan 2023 are approximated between €1.7 billion and €2.86 billion depending on the technological specifications. The Ministry also fully supports CE platforms and their activities in making CE practices visible, feasible, and accessible. The Ministry of Treasury and Finance in the Economic Reform Program (2021) declared another crucial step on the CE agenda. With the program, it was announced that the first National Circular Economy Action Plan would be prepared led by the Ministry of Environment and Urbanization by 2021 in order to support a green transition in the industry.
With a clear sustainability and CE agenda at the political level, action plans are being implemented toward a green, sustainable, and circular economy in Turkey. In 2018, the Turkish Environmental Law was amended to launch a number of measures to take action on reducing waste and increasing the rate of recycling in the country. Under the scope of these measures, a ban on the free distribution of plastic bags was implemented in 2019, in order to curb plastic pollution. As part of the new rules, stores are required to charge TL0.25 for every single-use plastic bag they offer to their customers (Ministry of Environment and Urbanization 2019). In addition to supporting the recycling leap, the government is also attempting to curb the supply side of the waste ecosystem by pushing producers to come up with innovative ideas to tackle carbon footprint-intensive production habits. Starting from 2020, companies have begun to pay a share, called the Recycling Contribution Fee (GEKAP), which is calculated per kilo or cubic meter of packaging for the production and distribution. Besides packaging materials, the new fee applies to certain materials that are damaging to the environment (tires, batteries, accumulators, electrical and electronic appliances, medicine) if not recycled (Ministry of Environment and Urbanization 2020).
Targeted to address the country’s waste and resource management systems, the Ministry of Environment and Urbanization kicked off a nationwide project under the theme of “Zero-Waste” in 2017. Zero-Waste guidelines were ratified in 2019, and implementation began in 76,000 public buildings immediately. A deadline of 31 December 2021 was set for the municipalities to complete the transition in classified waste collection and management according to waste types: plastics, paper, metal, glass, and organic waste. In 2020, municipalities were provided approximately $15 million by the Ministry of Environment and Urbanization for 86 projects under Zero-Waste activities. In the same year, the share of municipal waste recycled among all the recyclable materials in the waste stream realized a 19% recovery rate, compared to 13% in 2017. For 2023, by operating a “Zero Waste Management System” in 400,000 buildings, the project aims to increase this recovery rate to 35%. Between 2017 and 2020, the project led to savings of 397 million tons of raw material, 315 million kilowatt-hours of energy, 345 million cubic meters of water, and 50 million barrels of oil. Additionally, 17 million tons of usable waste were collected, 2 billion tons of greenhouse gas emissions were avoided, and 209 million trees were saved. The economic savings attained with these actions are calculated at TL17 billion. The project aims for direct employment of 100,000 people and TL20 billion in annual savings (UNDP Turkey 2021).
Collaboration among Business, Financial Institutions, and Civil Society
Beyond legal and political actions, business and civil society platforms in Turkey coordinated keenly to put the economy on a CE transition path at intellectual and participatory levels by closely following the global CE agenda. Ratified in 2020, the EU Action Plan for the Circular Economy under the EU Green
118
PROSPECTS FOR TRANSITIONING FROM A LINEAR TO CIRCULAR ECONOMY IN DEVELOPING ASIA
Deal includes a strict timetable for the implementation of rules, initiatives, and targets to lead the CE transition globally. The prompt execution of these rules and initiatives are matched immediately by business associations and civil society groups in Turkey. In order to account for the compatibility of legal practices in the fields of economy and trade, various business associations have been discussing the impacts of the EU Action Plan in trade relations between the EU and Turkey and studying the harmonization of these actions to keep business going uninterrupted between the EU and Turkey.
Specifically for sustainability, the Business Council for Sustainable Development Turkey (BCSD Turkey) was established in 2004 with the intent of contributing toward the implementation of the basic principles of sustainable development in Turkey. BCSD Turkey has 74 members within 19 different sectors, with the economic contribution of these members representing more than 15% of the country’s GDP. As a global network partner of the World Business Council for Sustainable Development, BCSD Turkey led the formation of the Turkey Circular Economy Platform in collaboration with the European Bank for Reconstruction and Development. The platform provides tools and technical support that empower businesses to migrate from traditionally wasteful practices to a more sustainable way of operating. Among the platform’s initiatives, the Turkey Materials Marketplace is instrumental in creating a CE ecosystem. This cloud-based platform is designed to facilitate cross-industry materials reuse among companies and communities in Turkey and has enabled 15 material transaction deals thus far (BCSD Turkey 2021). TKYB, the subject bank in this study, also has a seat on the board of BCSD Turkey.
7.3 Literature Review on Circular Economy Transition in Emerging Markets
7.3.1 Scope of the Literature Review
For the sake of a comprehensive literature review structure, the study mainly deployed sources from academic peer-reviewed journals; association, foundation, and company websites; policy briefs; government publications; newspapers; and other relevant publications. In line with the study topic and case studies, the main focus was given to CE transition practices and challenges in emerging markets, waste management, textile and plastic recycling, and financing in CE.
7.3.2 Emerging Markets and Circular Economy Transition
Drivers and Barriers
Although CE practices are concentrated in developed markets, several examples illustrate how the adaptation of CE models is still slow at the company level (Guldmann and Huulgaard 2020) and at the urban level (D’Adamo et al. 2021) in developed countries. This transition is particularly difficult in emerging markets where conditions are occasionally challenging. Lack of strong legislation, unavailable and irregular infrastructure, and low environmental literacy are attributed as the main obstacles in CE transitions (Navarro et al. 2019).
Evidently, the CE models from developed countries cannot be imported to the emerging economies without considering the particular context of economic growth pressure and increasing amount of waste in these countries (Patwa et al. 2021). Decoupling economic growth from circular initiatives is difficult yet possible for developing countries, if they are able to (i) reduce the consumption of natural resources via substitution; (ii) produce goods with alternative economic returns; (iii) minimize the negative environmental impacts; and (iv) generate self-sustainable wealth for the economy, the environment, and the social development of most stakeholders (Scheel, Aguiñaga, and Bello 2020).

119119
CIRCULAR ECONOMY FINANCING: INVESTMENT CASES FROM TURKEY
One common observation in developed and emerging economies’ CE transition is that resource and energy efficiency outweigh the environmental concerns in terms of being the main motivation of the practitioner companies (Masi et al. 2018). Economic returns are significant in motivating companies and investors in their CE transition (Ghisellini, Cialani, and Ulgiati 2016). A study on CE transition in Pakistan reveals the three most prominent drivers and barriers on the issue. Based on the answers from practitioners, “profitability/market share/benefit” comes in front with 30%, followed by “cost reduction” with 22%, and lastly “business principle/concern for environment/appreciation” with 19%. When it comes to barriers, “unawareness” (22%), “cost and financial constraint” (20%), and “lack of expertise” (17%) are seen as the main hurdles in implementing CE principles in the Pakistani automobile industry (Agyemang et al. 2019).
Several research studies highlight the importance of the role that governments play in the adaptation of CE practices in emerging countries. These roles include supporting educational programs, initiating platforms for design thinking, and enabling infrastructure needs for sustainable development (Patwa et al. 2021). For emerging countries, the adoption of CE concepts is perceived as burdensome and costly, hence cooperation for information sharing among business, consumers, and civil society is vital to understand the long-term benefits of this transition in society (Patwa et al. 2021). Businesses in these countries are able to adopt CE practices successfully with sufficient collection systems and logistics, as well as guaranteed amounts of material supply and market demand for recycled products. Mobilizing related groups, forming cooperation within the material chain, enabling financing options; circular procurement; and technological innovation can support the process (Cramer 2018).
Opportunities and Benefits
Successful examples from emerging markets are the ones that make the transition fit their specific market conditions, available infrastructure, legal framework, and customer preferences (Garza, Aguiñaga, and Scheel 2021; Navarro et al. 2019). In this context, alignment between business models and external circumstances is required (Sousa-Zomer et al. 2018). CE practices at the global level are mostly in recycling rather than reuse. Critical results are obtained in different areas such as waste management (Ghisellini, Cialani, and Ulgiati 2016). Several leading examples from Azerbaijan, Nepal, Pakistan, the People’s Republic of China, and Viet Nam include the formation of new waste management companies, effective waste collection and separation, and reduction in carbon emissions and natural disasters (Kaza et al. 2018).
Considering profit opportunities, there are areas with waste management potential in emerging markets in terms of the waste volume generated. Most waste generated in emerging economies is mixed-collected and ends up in landfills instead of recycling plants (Garza, Aguiñaga, and Scheel 2021; Pincelli et al. 2021). In Nigeria, approximately 68% of the solid waste generated by cities is dumped in an unorderly fashion, only 21% is disposed of through landfill sites, and 11% is incinerated (Ezeudu and Ezeudu 2019). The informal sector (waste collectors) plays a crucial role in solid waste management (Ezeudu and Ezeudu 2019; Navarro et al. 2019; Pincelli et al. 2021). In 2017, Brazil was only able to recycle 4.5% of the 12 million tons of plastic packaging waste generated, which was for the most part collected by informal waste collectors (Pincelli et al. 2021). With effective guidelines and necessary infrastructure investments, emerging markets can realize their waste management potential in terms of waste volume that can be used as energy or production inputs.
Turkey is no exception when it comes to such potential, as domestic demand for recycled materials has increased considerably. In 2020, 698,407 tons of recycle-ready plastic waste was imported from the EU and the United Kingdom, which is equivalent to 14.7% of total exported plastic waste from these economies. Both recyclable waste and nonrecyclable imports from EU have increased 196 times

120
PROSPECTS FOR TRANSITIONING FROM A LINEAR TO CIRCULAR ECONOMY IN DEVELOPING ASIA
compared to 2004 (EUROSTAT 2021), which indicates a considerable domestic demand for recycled materials. In order to meet the growing demand from the plastic industry, where only 15% of raw materials are provided domestically, producers resort to importing recyclable waste (PAGDER 2020). The business groups in the sector assert that there will be considerable demand for domestic plastic waste if more domestic waste is handled properly and processed for reuse or recycling (PAGDER 2020). As Turkey has increased its waste recovery from 13% to 19% between 2017 and 2020 with the successful implementation of the “Zero-Waste” project, it is highly likely that more recyclable domestic waste will be in use for the plastic industry.
When it comes to finance, governments, multilateral development banks, and development finance institutions are financing CE opportunities all around the world (Ellen MacArthur Foundation 2021). While green finance and sustainable funding portfolios are spreading worldwide, decision makers have to find innovative solutions to minimize risk factors when it comes to credit allocation for the CE-based initiatives. The supply risk appears first on the checklist for the banks. Different cases from emerging markets such as Mexico and Brazil demonstrate that when companies are not able to guarantee the waste quality or quantity, their projects face severe challenges (Garza, Aguiñaga, and Scheel 2021; Sousa-Zomer et al. 2018). In order to solve current supply problems, cooperation within the supply chain is promoted (Garza, Aguiñaga, and Scheel 2021). In the long run, recycled material demand is projected to increase. Due to the changing green regulations and pressure from investors and customers, producers are pushed to use recycled materials. Demand for recycled plastic increased by 17% during 2012–2016, and strong growth projections are expected regarding the textile and plastic recycling sectors (Ellen MacArthur Foundation 2017), raising bankability opportunities for the CE projects. Worldwide, the fashion industry is the second-largest polluter after aviation, accounting for up to 10% of global pollution (Ellen MacArthur Foundation 2017). In 2017, the global fashion agenda was set for a call to action for a circular fashion ecosystem at the Copenhagen Fashion Summit. Fashion brands and retailers were asked to sign a letter of commitment to increase the volume of textile products to be collected, reused, and recycled. Signatories include global well-known textile companies such as Adidas, ASOS, H&M, Inditex, Kering, Marks & Spencer, Target, and VF Corporation (CFDA 2021). As Turkey hosts many of these companies’ production facilities and trade routes, the potential for the recycled textile material attracts entrepreneurs to be part of this circular supply chain of the textile industry.
7.4 Case Studies: Financing the Circular Economy Initiatives 7.4.1 Case Study Scope
The study followed a qualitative approach concerning ongoing explanations of the social phenomena (Baxter and Jack 2008). Particularly, case studies highlighted the relevant contextual conditions. Theoretical work was supported with case studies to understand and explore similarities or differences between and within cases (Baxter and Jack 2008).
The following selection criteria are applied for this study: (i) the company had operations in Turkey, (ii) the company was undergoing a CE initiative, and (iii) the company specifically applied for funding for the initiative.
Cases 1 and 2 are examined through their project and funding phases. Both companies cooperate with TKYB for their financing needs. The bank allocated financial analysis, economic research and engineering departments for the cases in order to measure the bankability, as well as social and environmental impacts of the related investments. Since TKYB acknowledges environmental

121121
CIRCULAR ECONOMY FINANCING: INVESTMENT CASES FROM TURKEY
and social sustainability as a fundamental component of sustainable and inclusive development, impact evaluations of the cases were critical parts of the decision-making process (TKYB 2020).
7.4.2 Circular Economy Initiatives: Biomethanation Plant and Integrated Recycled Yarn Facility
Company 1 aims to develop a project (Project 1) for a biomethanation plant with a waste recycling capacity of 4,000 tons per day and an electric and thermal energy generation plant with 20 megawatts installed capacity. This project is planning to use municipal waste as input material for the plant. Different research findings highlight the direct relationship between biomethane and CE models in terms of the integration of a renewable energy production and effective management of municipal waste (D’Adamo et al. 2021; Fagerström et al. 2018). Project 1 plans to contribute waste management streams while producing 105 million kilowatt-hours of energy, which is equivalent to the yearly electricity consumption of 7,000 houses. The plant is expected to be operational in June 2021.
Company 2 aims to build and operate an integrated recycled yarn facility (Project 2) in a closed area of 48,000 square meters that works with existing facilities. The new facility will produce annually 34,000 tons of recycled textile products, in addition to its existing capacity of 34,000 tons per year. The facility can also produce annually 34,000 tons of recycled thermoplastic products obtained by processing recycled materials called R-Pet Chips. The investment will also be utilized for machinery, lines, and equipment expenditure. It is a project planned in parallel with the high environmental concerns in the world. The potential demand due to the commitments of large-scale companies to use recyclable materials in their products is a central business driver for the investment as well. The plant is expected to be operational in January 2022.
Table 7.1 gives a summary of the two projects and expected impacts.
Table 7.1: Projects and Impacts
Case No. Project Sector Impact ValueRelated Sustainable
Development Goal (SDG)1 Waste management and
renewable energy – 20 megawatts installed
renewable power – 4,000 tons/day waste recycling
capacity – Employment for 80 people
– SDG 7: Affordable and Clean Energy
– SDG 11: Sustainable Cities and Communities
– SDG 12: Responsible Production and Consumption
– SDG 13: Climate Action – SDG 15: Life on Land
2 Plastics and textile – 68,000 tons/year recycled yarn – 34,000 tons/year R-Pet Chips – Employment for 200 people
– SDG 8: Decent Work and Economic Growth
– SDG 9: Industry, Innovation and Infrastructure
– SDG 12: Responsible Production and Consumption
– SDG 13: Climate Action
Source: Development and Investment Bank of Turkey (TKYB), Corporate Banking and Project Finance Division, 2021.

122
PROSPECTS FOR TRANSITIONING FROM A LINEAR TO CIRCULAR ECONOMY IN DEVELOPING ASIA
Along with the return of the loan and the bankability of the investments financially (Table 7.2), the projects are also evaluated based on the contribution to the country’s economy (employment, current account deficit, import substitution, export), energy efficiency, green energy use, and environmental impacts (environmental pollution, criteria such as recycling and waste reduction). Both cases have been through TKYB’s Environmental and Social Risks Assessment Process, which is based on the environmental and social policy of the bank (TKYB 2020). The policy is taken into account in the decision-making process of the credit demands.
Table 7.2: Projects and Investments
Case No. Project Focus Investment Amount Funding Amount by TKYB Project
Operation Date1 Biomethanation, and
electricity and heat generation plant
$32.3 million and $24.8 million
$24.8 million 31 June 2021
2 Integrated recycled yarn facility
TL360 million TL50 million 1 January 2022
TKYB = Development and Investment Bank of Turkey.
Source: TKYB, Corporate Banking and Project Finance Division, 2021.
By applying one of the important conditions for a successful CE transition, Project 1 acted with cooperation and secured the supply materials under long-term agreements with nearby municipalities. From an environmental point of view, Project 1 has been scrutinized in terms of use of landfill techniques and diversion of recyclable materials. A fully automated mechanical sorting facility in the plant sorts biodegradable waste out from recyclable materials. Thus, domestic wastes, which are brought to the site on a daily basis for the purpose of management and disposal of municipal wastes, are separated. An alternative fuel is able to be produced from the separated wastes for nearby cement plants.
In Project 2, as for targeting market demand, the business owner detected an opportunity in the commitments of global textile producers in the ready-to-wear sector for recycled material usage and combined the investment plans with the global CE supply chain dynamics. Utilizing recycled and used textile products as its material inputs, Project 2 also places itself as the main receiver for the outputs of the growing domestic waste management systems. The project will provide import substitution opportunities and contribute to climate action though its waste recycling operations for yarn and chips.
7.5 Conclusion and Policy RecommendationsThanks to technological and organizational innovations and productivity enhancement, the CE transition would generate $1.8 trillion worth of total benefits in various sectors because of the savings in resource costs as well as externalities such as health impacts from air pollution (Ellen MacArthur, SUN, and McKinsey Center for Business and Environment 2015). If emerging and developing economies in Asia and the Pacific act faster and organize, their chances of securing a bigger share of these economic benefits will be higher, offsetting growth concerns. By sharing best practices and forming cooperation agreements among stakeholders, these markets can create differences in the CE transition. Conducting short-term, pilot programs and building partnerships can be helpful in reducing the project risk and

123123
CIRCULAR ECONOMY FINANCING: INVESTMENT CASES FROM TURKEY
shortening the learning period. These clear starting points can help navigate for the companies that are overwhelmed with the cost and operational shift of waste management systems (Romero-Hernández and Romero 2018). Detecting best practices and barriers faced by businesses can lead to further integration of CE stakeholders toward countrywide adoption of sustainable use of industrial processes (Patwa et al. 2021). Collaboration and partnership of different stakeholders such as business groups, government, and universities enable successful implementation (Garza, Aguiñaga, and Scheel 2021; Navarro et al. 2019; Sousa-Zomer et al. 2018). A functioning CE transition needs a holistic approach and systematic transformation (Garza, Aguiñaga, and Scheel 2021).
Turkey has made important progress in embracing the CE transition at the top of its political agenda. Collaboration between government, business, and civil society paved the way for collective awareness for the transition. The majority of financial institutions, including TKYB, prioritize projects with the purpose of sustainability and CE transition for financing as the global investment agenda heads toward greener and more sustainable initiatives. Business associations are also collaborating in sharing learnings and searching for best practices by conducting studies, working groups, and conferences. The National Circular Economy Action Plan, released in 2021, will also guide all stakeholders with a broader perspective and detailed target actions.
With the help of ongoing CE initiatives and funding opportunities, projects in the presented cases were carried out successfully. In order to multiply the number of these successful cases, the following policy recommendations are given for the developing countries in Asia and the Pacific:
• Keep CE actions at the top of the agenda on national and international levels for an urgent and comprehensive transition to a CE.
• Prove incentive schemes in terms of tax, conventional credits, and capital market instruments for the CE initiatives to promote more businesses to be part of the CE and its supply chain.
• Grant exceptions in future carbon taxes for companies operating within the material circularity as the legal frames are growing internationally.
• Cooperate with business and civil society in policy making to efficiently tackle the potential opportunities and challenges on the agenda.
• Promote development banks in sharing experience with commercial banks in credit allocations of CE initiatives.
• Conduct public campaigns for households and industry in waste sorting to increase the quality and quantity of the recycled waste in use for raw material and energy purposes.
As a final remark, financing options for CE initiatives in this study are provided as conventional credit line practices. For future studies, alternative ways to fund the CE investments in emerging and developing markets may be examined further including financial instruments in capital markets.

124
PROSPECTS FOR TRANSITIONING FROM A LINEAR TO CIRCULAR ECONOMY IN DEVELOPING ASIA
ReferencesAgyemang, M., S. Kusi-Sarpong, S.A. Khan, V. Mani, S.T. Rehman, and H. Kusi-Sarpong. 2019. Drivers
and Barriers to Circular Economy Implementation: An Explorative Study in Pakistan’s Automobile Industry. Management Decision. Vol. 57(4). pp. 971–94.
Arouri, M., S. Boubaker, and D. Nguyen. 2014. Emerging Markets and the Global Economy. Oxford: Academic Press.
Baxter, P., and S. Jack. 2008. Qualitative Case Study Methodology: Study Design and Implementation for Novice Researchers. The Qualitative Report. Vol. 13(4). pp. 544–59.
BCSD Turkey. 2021. What Do We Do for Sustainable Development? http://www.skdturkiye.org/en (accessed 15 April 2021).
Braungart, M., and W. McDonough. 2002. Cradle to Cradle: Remaking the Way We Make Things. New York, NY: North Point Press.
Carrasco, E., and S. Williams. 2012. Emerging Economies after the Global Financial Crisis: The Case of Brazil. Northwestern Journal of International Law and Business. Vol. 33(1). pp. 81–119.
CFDA. 2021. Copenhagen Fashion Summit. https://cfda.com/resources/sustainability-resources /detail/copenhagen-fashion-summit (accessed 10 April 2021).
Cramer, J. 2018. Key Drivers for High-Grade Recycling under Constrained Conditions. Recycling. Vol. 3(2). p. 16.
D’Adamo, I., P.M. Falcone, D. Huisingh, and P. Morone. 2021. A Circular Economy Model Based on Biomethane: What Are the Opportunities for the Municipality of Rome and Beyond? Renewable Energy. Vol. 163. pp. 1660–72.
Ellen MacArthur Foundation. 2013. Towards the Circular Economy: Economic and Business Rationale for an Accelerated Transition. https://www.ellenmacarthurfoundation.org/assets/downloads /publications/Ellen-MacArthur-Foundation-Towards-the-Circular-Economy-vol.1.pdf (accessed 8 April 2021).
____. 2017. A New Textiles Economy: Redesigning Fashion’s Future. https://www .ellenmacarthurfoundation.org/assets/downloads/publications/A-New-Textiles-Economy_Full -Report_Updated_1-12-17.pdf (accessed 15 April 2021).
____. 2021. Financing the Circular Economy. https://www.ellenmacarthurfoundation.org/assets /downloads/Financing-the-circular-economy.pdf (accessed 10 April 2021).
Ellen MacArthur Foundation, SUN, and McKinsey Center for Business and Environment. 2015. Growth Within: A Circular Economy Vision for a Competitive Europe. https://www .ellenmacarthurfoundation.org/assets/downloads/publications/EllenMacArthurFoundation _Growth-Within_July15.pdf (accessed 15 April 2021).
Ellen MacArthur Foundation and McKinsey & Company. 2014. Towards the Circular Economy: Accelerating the Scale-up Across Global Supply Chains. http://www3.weforum.org/docs/WEF _ENV_TowardsCircularEconomy_Report_2014.pdf (accessed 9 April 2021).
Esposito, M., T. Tse, and K. Soufani. 2017. Is the Circular Economy a New Fast-Expanding Market? Thunderbird International Business Review. Vol. 59(1). pp. 9–14.
EUROSTAT. 2021. Where Does EU Waste Go? https://ec.europa.eu/eurostat/web/products-eurostat -news/-/ddn-20210420-1 (accessed 12 April 2021).
125125
CIRCULAR ECONOMY FINANCING: INVESTMENT CASES FROM TURKEY
Ezeudu, O.B., and T.S. Ezeudu. 2019. Implementation of Circular Economy Principles in Industrial Solid Waste Management: Case Studies from a Developing Economy (Nigeria). Recycling. Vol. 4(4). p. 42.
Fagerström, A., T. Al Seadi, S. Rasi, and T. Briseid. 2018. The Role of Anaerobic Digestion and Biogas in the Circular Economy. Edited by J.D. Murphy. IEA Bioenergy Task 37.
Ferronato, N., E.C. Rada, M.A.G. Portillo, L.I. Cioca, M. Ragazzi, and V. Torretta. 2019. Introduction of the Circular Economy within Developing Regions: A Comparative Analysis of Advantages and Opportunities for Waste Valorization. Journal of Environmental Management. Vol. 230. pp. 366–78.
Garza, A.C., E. Aguiñaga, and C. Scheel. 2021. The Challenges for Circular Economy Implementation in SMEs in an Emerging Economy. Sustainability. Vol. 13, 1529.
Ghisellini, P., C. Cialani, and S. Ulgiati. 2016. A Review on Circular Economy: The Expected Transition to a Balanced Interplay of Environmental and Economic Systems. Journal of Cleaner Production. Vol. 114(7). pp. 11–32.
Grosse, R., and K.E. Meyer. 2018. Introduction to Managing in Emerging Markets. In R. Grosse and K.E. Meyer, eds. The Oxford Handbook of Management in Emerging Markets. Chapter 1.
Guldmann, E., and R.D. Huulgaard. 2020. Barriers to Circular Business Model Innovation: A Multiple-Case Study. Journal of Cleaner Production. Vol. 243, 118160.
International Finance Corporation (IFC). 2016. History Book. Second Edition. IFC.
International Monetary Fund (IMF). 2021. World Economic Outlook Database. https://www.imf.org /en/Publications/WEO (accessed 20 April 2021).
Kaza, S., L.C. Yao, P. Bhada-Tata, and F. Van Woerden. 2018. What a Waste 2.0: A Global Snapshot of Solid Waste Management to 2050. Urban Development Series. Washington, DC: World Bank.
Kirchherr, J., D. Reike, and M. Hekkert. 2017. Conceptualizing the Circular Economy: An Analysis of 114 Definitions. Resources, Conservation and Recycling. Vol. 127(C). pp. 221–32.
Masi, D., S. Day, and J. Godsell. 2017. Supply Chain Configurations in the Circular Economy: A Systematic Literature Review. Sustainability. Vol. (9)1602.
Masi, D., V. Kumar, J.A. Garza-Reyes, and J. Godsell. 2018. Towards a More Circular Economy: Exploring the Awareness, Practices, and Barriers from a Focal Firm Perspective. Production Planning and Control. Vol. 29(6). pp. 539–50.
Ministry of Environment and Urbanization of Turkey. 2019. Guidelines on Free Plastic Bags. https://www.csb.gov.tr/plastik-poset-beyani-i-90306 (accessed 7 April 2021).
____. 2020. Guidelines on “GEKAP” Tax. https://cygm.csb.gov.tr/gekap-usul-ve-esaslari-yayim lanmistir.-duyuru-406238 (accessed 6 April 2021).
PAGDER. 2020. Plastics Recycling Industry in Turkey. https://pagder.org/eng/haberdetay.php?id=210 (accessed 7 April 2021).
Patwa, N., U. Sivarajah, A. Seetharaman, S. Sarkar, K. Maiti, and K. Hingorani. 2021. Towards a Circular Economy: An Emerging Economies Context. Journal of Business Research. Vol. 122. pp. 725–35.
Pincelli, I.P., A. Borges de Castilhos Júnior, M.S. Matias, and E.W. Rutkowski. 2021. Post-Consumer Plastic Packaging Waste Flow Analysis for Brazil: The Challenges Moving towards a Circular Economy. Waste Management. Vol. 126. pp. 781–90.

126
PROSPECTS FOR TRANSITIONING FROM A LINEAR TO CIRCULAR ECONOMY IN DEVELOPING ASIA
Rathinamoorthy, R. 2019. Circular Fashion. In S.S. Muthu, ed. In Circular Economy in Textiles and Apparel. The Textile Institute Book Series. Duxford: Woodhead Publishing. pp. 13–48.
Romero-Hernández, O., and S. Romero. 2018. Maximizing the Value of Waste: From Waste Management to the Circular Economy. Thunderbird International Business Review. Vol. 60(5). pp. 757–764.
Scheel, C., E. Aguiñaga, and B. Bello. 2020. Decoupling Economic Development from the Consumption of Finite Resources Using Circular Economy: A Model for Developing Countries. Sustainability. Vol. 12(4), 1291.
Sousa-Zomer, T.T., L. Magalhães, E. Zancul, and P.A. Cauchick-Miguel. 2018. Exploring the Challenges for Circular Business Implementation in Manufacturing Companies: An Empirical Investigation of a Pay-Per-Use Service Provider. Resources, Conservation and Recycling. 135. pp. 3–13.
Stahel, W.R. 1981. The Product-Life Factor. In S. Grinton Orr, ed. An Inquiry into the Nature of Sustainable Societies: The Role of the Private Sector. The Woodlands, TX: HARC. pp. 72–96.
____. 1994. The Utilization Focused Service Economy: Resource Efficiency. In B.R. Allenby and D.J. Richards, eds. The Greening of Industrial Ecosystems. Washington, DC: National Academy Press.
Stahel, W.R., and G. Reday-Mulvey. 1976. Jobs for Tomorrow: The Potential for Substituting Manpower for Energy. New York, NY: Vantage Press.
Standard & Poor’s (S&P). 2020. S&P Dow Jones Indices’ 2020 Country Classification Consultation. https://www.spglobal.com/spdji/en/documents/indexnews/announcements /20200819-1206359/1206359_spdji2020countryclassificationconsultation8-19-2020.pdf (accessed 7 April 2021).
The Presidency of Strategy and Budget of Turkey. 2019. Turkey’s 2nd VNR 2019 Sustainable Development Goals: “Strong Ground towards Common Goals.” https://sustainabledevelopment.un.org/content/documents/23862Turkey_VNR_110719.pdf (accessed 1 April 2021).
TKYB (Development and Investment Bank of Turkey). 2020. Environmental and Social Policies. https ://kalkinma.com.tr/en/about-us/environmental-development/environmental-and-social -policies (accessed 5 April 2021).
TURKSTAT. 2021. Sustainable Development Indicators. https://tuikweb.tuik.gov.tr/PreHaber Bultenleri.do?id=37194 (accessed 7 April 2021).
UNDP (United Nations Development Programme). 2016. Human Development Report. http://hdr.undp .org/en/content/human-development-report-2016 (accessed 7 April 2021).
UNDP Turkey. 2021. The First Global Goals Action Award of UNDP Turkey Goes to the Zero Waste Project of the Country. UNDP Turkey News. 25 March. https://www.tr.undp.org/content/turkey /en/home/presscenter/pressreleases/2021/03/sifir-atik-projesi-odul-aldi.html (accessed 7 April 2021).
UNEP (United Nations Environment Programme). 2011. Decoupling Natural Resource Use and Environmental Impacts from Economic Growth. Paris: International Resource Panel. https://www.resourcepanel.org/reports/decoupling-natural-resource-use-and-environmental -impacts-economic-growth (accessed 4 April 2021).
Zhang, Y., H. Zheng, B. Chen, et al. 2015. A Review of Industrial Symbiosis Research: Theory and Methodology. Frontiers of Earth Science. Vol. 9(1). pp. 91–104.

127
CHAPTER 8
The Case of Waste to Energy in Bangladesh
Sakib Amin, Tooraj Jamasb, Manuel Llorca, Laura Marsiliani, and Thomas I. RenstrÖm1
8.1 IntroductionPolicy makers in developing and emerging economies are sensitive to the issue of sustainable development and strive to balance the need for economic growth with protecting the environment for current and future generations. This challenge is acute in the energy sector and in particular in electricity generation, which is at the foundation of economic development.
Waste-to-energy (WTE) power plants can play an important role to foster sustainable development by using waste as a source of energy. A recent study by the Asian Development Bank (ADB) reports that “as of December 2018, there are more than 2,450 WTE plants that are operational worldwide with a total waste input capacity of around 368 million tons per year. It was estimated that more than 2,700 plants will be on-site by 2028” (ADB 2020, p. 1). Significant growth is expected from the People’s Republic of China, India, and Southeast Asian countries (Tun et al. 2020).
Electricity generation from waste can help an emerging economy increase its economic competitiveness and industrial output and at the same time reduce the environmental impact of waste. Nevertheless, several issues have been associated with WTE, among them the potential for crowding out reuse and recycling of waste and the release of toxic pollutants and greenhouse gas (GHG) emissions. Because of these problems, to be part of a circular economy model, it is recommended that WTE only employ residual waste and scraps as inputs and deploy environmentally friendly technologies, such as anaerobic digestion (AD) and gasification (Saveyn et al. 2016).
However, most of the existing WTE power plants use conventional technology based on incineration of waste with or without carbon capture and storage. At present, incinerators provide higher returns to investments, but their sustainability credentials are limited mostly due to the release of significant GHGs (especially from nonorganic waste) and toxic substances harmful to human health and ecosystems, in addition to lower incentives for waste reuse and recycling.
Emerging methods of generating energy from waste include anaerobic digestion and gasification or pyrolysis,2 which are deemed to be better aligned with circular economy principles as waste has to be carefully sorted before entering the energy recovering process. Anaerobic digestion can be used to manage organic domestic and agricultural waste, and it is especially promising for developing and emerging economies whose waste is mostly organic. Gasification methods can be deployed for extracting energy, in the form of syngas, mostly but not exclusively from biomass and other
1 Research support from Farhan Khan from North South University, Bangladesh, is gratefully acknowledged. Tooraj Jamasb and Manuel Llorca acknowledge financial support from the Copenhagen School of Energy Infrastructure. We are grateful to Maria Hughes, Stefan Rau, Matti Tervo, and participants at the ADBI virtual conference on Circular Economy in Emerging Markets, 2 June 2021, for valuable comments and feedback that greatly improved this manuscript.
2 Anaerobic digestion is the process by which microorganisms break down biodegradable material in the absence of oxygen to generate biogas. Gasification converts waste into syngas and other fuels through a thermochemical reaction using oxygen. Pyrolysis converts waste into syngas, biofuel, and feedstock for plastic, also through a thermochemical reaction but at high temperature and in the absence of oxygen. See Lee at al. (2019) for a review of energy conversion technologies.

128
PROSPECTS FOR TRANSITIONING FROM A LINEAR TO CIRCULAR ECONOMY IN DEVELOPING ASIA
organic waste,3 while pyrolysis can be especially useful to turn plastic waste into fuels and provide feedstock for recycled plastic production. The typically low calorific value of organic waste with respect to nonorganic waste and fossil fuels is often advocated as a barrier to the development and implementation of those methods.4 On the other hand, the potential for GHGs and pollution savings with respect to incineration technology can be significant. For example, Bachmaier, Effenberger, and Gronauer (2010) estimated that GHG emissions from anaerobic digestion electricity generation for 10 agricultural power plants ranged between –85 and 251 grams of carbon dioxide equivalent per kilowatt-hour (g CO2 e/kWh),5 with a GHG emissions saving with respect to fossil fuels-based electricity generation between 2.31 and 3.16 kWhfossil/kWhel. The Intergovernmental Panel on Climate Change (IPCC 2012) found that GHG emissions from gasification- and pyrolysis-based electricity generation using biofuel at the plant level ranges between 0 and 360 g CO2 e/kWh with most estimates being lower than 100 g CO2 e/kWh.6 Interestingly, life cycle GHG emissions from direct incineration of biomass are found to be in the same range as from gasification and even lower than from pyrolysis.7 Accordingly, emissions savings with respect to fossil fuel-based electricity generation are significant for most of the case studies. Using the IPCC (2006) calculation methods, CO2 emission estimates from electricity generation using combustion of undifferentiated municipal solid waste (MSW),8 natural gas, and oil are, respectively, in the order of 600, 410, and 970 g CO2 e/kWh. The IPCC (2012) report also highlights that bioenergy is associated with lower pollutants, such as sulfur dioxide (SO2) and nitrogen oxides (NOX), than fossil fuels.
Despite the clear environmental and climate change benefits, nonconventional WTE methods are not widespread, mainly due to their higher cost and lower returns from investments. It is expected that the increasing inclusion of issues of sustainability and circular economy in the regulatory framework for WTE in Europe and other developed countries will spearhead their adoption in the near future.
Indeed, the renewed focus on the idea of a circular economy provides a useful framework for conceptualizing and analyzing the links between environment, economy, and resource use in a unified setting. This integrated system consists of a nexus of food, water, waste, and energy, among other sectors. Lehmann (2018) develops one such framework for case studies of urban areas in Southeast Asia. Kaur, Bharti, and Sharma (2021) find that in developing countries the shortage of waste disposal sites is an increasing problem, and energy recovery is the most common form for waste management.
3 There are currently only 26 gasification WTE power plants worldwide due to their higher cost in comparison to incinerators. 4 Calorific value of fuels can be used to assess energy generation potential with lower values meaning lower generation
potential. Results from several studies from a number of case studies suggest that municipal solid waste (MSW) has approximately half the calorific value of natural gas and oil, with even lower value for organic and biomass waste. The composition of waste is crucial to determine its calorific value; composition varies across countries and locations of waste, and time periods. Therefore, to generate 1 kWh of electricity, one would need a higher quantity of waste with respect to fossil fuels and an even higher quantity if waste is organic or biomass.
5 Estimates of GHG emissions from electricity generation from biogas and biofuels are found from case studies at plant level. In most cases, they include life cycle assessments. As different plants may use different feedstock or biomass waste compositions, the range of the estimates can be large. The negative estimates for anaerobic digestion may be due to the capability of this process to capture methane.
6 The 2012 IPCC report presents GHG estimates from a number of bioenergy studies. GHG emissions are distinguished into emissions from incineration, gasification, and pyrolysis-based electricity generation. However, the report does not specify whether the fuels used come from MSW biomass or other feedstock such as agricultural waste, logging residues, or aquatic biomass.
7 For electricity generation, the fuel derived from anaerobic digestion, gasification, or pyrolysis WTE methods needs to be combusted. Therefore, power plants using those emerging techniques can be considered as combustion plants of some sort. Hence, GHG emission ranges are similar to those from direct combustion (incineration WTE) of biomass. In pyrolysis-based power generation, the syngas also needs to be cleaned, causing further GHG emissions from the cleaning process.
8 Undifferentiated MSW includes not only biomass but also other organic waste such as plastic and nonorganic waste.

129
THE CASE OF WASTE TO ENERGY IN BANGLADESH
Siddiqi, Haraguchi, and Narayanamurti (2020) use Monte Carlo simulations to analyze recovery of energy from MSW in Jakarta, Delhi, and Karachi. They show that a one-sided focus on the cost of municipal waste handling without also considering the revenue streams that can be generated from energy recovery can undermine the benefits of improved waste management practices.
Therefore, while WTE can be part of a circular economy, it requires careful planning, waste analysis and sorting, legislation, choice of technology, environmental impact assessment, and policy commitment. Malav et al. (2020) report a comprehensive survey of the case of India. They then present the main waste management technologies available and review the practices across different regions of India and discuss the various challenges of implementation of WTE projects.
MSW can be a key component of a circular economy and WTE. However, the composition of the waste is important for both the level of energy recovery as well as the environmental impact, which can vary across countries (see, e.g., Li et al. 2021). Appropriate regulatory policies and technologies to manage food waste, including energy recovery, are urgently required in Asia (Joshi and Visvanathan 2019). Despite its relatively low calorific value, energy production from food waste can, due to its volume, be efficient and indeed constitute a significant share of total WTE production in Asia (see Laohalidanond, Chaiyawong, and Kerdsuwan 2015; Joshi and Visvanathan 2019). In general, MSW in Asian cities tends to have a lower calorific value than those in developed economies due to their relative high share of organic waste and the lack of separation.
8.2 Opportunities and Challenges of Waste to Energy for Bangladesh
Bangladesh is the eighth-most populated country in the world and ranks twelfth according to population density. In 2019, the population of Bangladesh was 163.05 million, with an urban population of 60.99 million (37.4% of the total population) (World Bank 2021). Total waste generation in the urban areas of Bangladesh amounts to 25,000 tons per day, which is equivalent to 170 kilograms (kg) per capita per year. Total urban waste generation is expected to reach 47,000 tons per day by 2025 with per capita generation of 0.60 kg per person per day. Dhaka, the capital city, generates about a quarter of the total waste in the country (Ahmed 2019), and, according to the Waste Report 2018–2019 of the Dhaka North City Corporation (2019), average per capita waste generation is already 0.60 kg per person per day. Waste collection varies from 36% to 77% with an average of 55% (Bahauddin and Uddin 2012).9 Islam (2016) calculated on the basis of waste generation trends that in Dhaka and Chittagong cities of Bangladesh, 1,444 and 1,394 gigawatt-hours of electricity, respectively, can be produced via incineration by 2050. Even though the potential of generating electricity from waste is promising, Bangladesh has so far not been successful in establishing waste-based power plants. Recently, the government is focusing on waste-based electricity generation with a view to accelerate the transition toward renewable energy as pledged in the 8th Five-Year Plan. Bangladesh aims to generate 17% of electricity from renewable sources by 2041 from the current 1.53% (on-grid generation).10 The Sustainable and Renewable Energy Development Authority of Bangladesh (2020) has argued that one of the main sources of renewable energy is WTE, as more than 70% of waste is biomass. Therefore, developing a WTE base in the country is becoming of strategic importance for the country.
In Bangladesh, major sources of MSW are households, restaurants, hospitals, vegetable and fish markets, and local factories. Household waste contributes about 90% of the MSW, of which 80%–90%
9 This is also consistent with the 8th Five-Year Plan (Government of Bangladesh 2020).10 For details, see the National Database of Renewable Energy (http://www.renewableenergy.gov.bd/index.php?id=7).

130
PROSPECTS FOR TRANSITIONING FROM A LINEAR TO CIRCULAR ECONOMY IN DEVELOPING ASIA
is organic solid waste. According to Alam and Qiao (2020), the average share of food and vegetable waste in the overall collected waste is 74.5%. Some other sources are paper and paper products (9.1%), polythene and plastic (3.5%), textiles and woods (1.9%), and dust and mud products (5.1%). On average, the calorific value of waste in Bangladesh is 717 kilocalories per kilogram (Hossain et al. 2014), which is the lowest in Asia and a third of the calorific value in developed countries such as the United Kingdom (Kumar and Samadder 2017). As Bangladesh is fast developing, the country’s waste calorific value is expected to increase rapidly. Overall, given the characteristics of the collected waste in Bangladesh, it has the potential to be used as an alternative source in the electricity generation mix.
The Government of Bangladesh of recent has sourced substantial investment to facilitate the installation of one major WTE power plant in Dhaka city to generate around 40 megawatts of electricity. According to a recent report by Byron and Alam (2020), China Machinery Engineering Corporation (CMEC) has shown interest in developing the first large-scale WTE project for the Dhaka North City Corporation area in 2021, contributing a daily power generation of 42.5 megawatts for the next 25 years and selling electricity to the government at Tk18.295 per kilowatt-hour in the initial stage. The plan is to use 3,000 metric tons of organic waste out of the 6,000 metric tons of waste that the capital city generates every day (Byron and Alam 2020). The power plant will use incineration WTE technology (Mamun 2020).
This project could be expanded to the entire country and also include animal waste with the aim to establish a self-sustaining, cost-effective, and sustainable WTE technology in Bangladesh. For the way forward, the government has already conducted a feasibility study on WTE conversion in six municipalities: Mymensingh, Cox’s Bazar, Sirajganj, Dinajpur, Habiganj, and Jessore (UNDP 2018). It is recommended that for the future WTE generation, gasification and anaerobic digestion be considered as the two most promising technologies for Bangladesh, with the first one being recommended for large cities where land acquisition is more difficult.11 Gasification and anaerobic digestion technologies are considered more environmentally friendly than incineration as their CO2 intensity is lower.12 The challenge for Bangladesh is to source substantial investments for those projects, bearing in mind the higher cost of gasification-based WTE power plants.
8.3 Aims of This ChapterIn this chapter, we propose an economic analysis of the policy of introducing WTE power plants in Bangladesh. The introduction of WTE power plants has the potential to create a win–win scenario if it boosts the macroeconomy and has a lower overall environmental impact in comparison to fossil fuels. Previous literature on the economic impact of WTE in developing and emerging economies focus primarily on plant-based case studies (for a compendium, see ADB 2020). To our knowledge, there are no attempts at quantifying the consequences in terms has focused of macroeconomic variables such as gross domestic product (GDP), production and consumption, and carbon emissions of implementing WTE technology in Bangladesh.
The model we use is based on Amin (2015), who developed an electricity sector-augmented dynamic stochastic general equilibrium (DSGE) model for the Bangladesh economy. We focus on CO2 generation to assess the impact of the WTE technology in Bangladesh on the sustainability of the electricity sector. According to the Annual Report of Bangladesh Power Development Board (2020), the shares of natural gas, imported oil, and renewable energies (only grid) in the total net electricity generation are 53.25%,
11 For more details, see UNDP (2018). 12 We focus on the CO2 intensity of different fuels, including waste. Therefore, we limit the environmental impact of WTE
technology on CO2 emissions.

131
THE CASE OF WASTE TO ENERGY IN BANGLADESH
34.05%, and 1.53%, respectively, with the remaining made up of coal.13 Following the IPCC (2006) calculation methods for CO2 emissions, typically WTE has been found to have a CO2 intensity lower than oil but higher than natural gas. If WTE can be used as a substitute for oil, it can be effective in mitigating the impact of electricity generation on climate change. We therefore model CO2 as a function of fossil fuels (natural gas and oil) and waste used in electricity generation and assess the impact of introducing WTE in Bangladesh on the macroeconomy and overall CO2 emissions. The underlying assumptions, in particular, the functional forms of household preferences and technology, follow the seminal work by Kim and Loungani (1992), Dhawan and Jeske (2008), and Amin and Marsiliani (2015). Consistent with the planned economy system of Bangladesh, the government regulates all energy prices. This feature creates market distortions in the economy as prices are often kept below full cost and implicit subsidies emerge (Amin 2015).14 For illustration purposes, we simulate the introduction in the electricity market of a large-scale WTE, incineration-based power plant for Bangladesh consistent with the proposed CMEC plant.15 As Bangladesh has just started to consider WTE technology, our policy analysis has the potential to guide future developments in the WTE power sector in the country.
8.4 Benchmark ModelWe use a DSGE model, explicitly modeling electricity generation. Electricity is produced by using imported oil as well as by using domestically sourced natural gas and, for the purpose of our policy analysis, WTE incineration, as mentioned earlier. We have four main sectors: the industrial sector and the service production sector (in turn using electricity as input), the electricity-producing sector, and the government sector. We also specify an equation for CO2 emissions.
8.4.1 Production of Industrial Output and Services
Final industry output and services are produced under constant elasticity of substitution (CES) technologies, featuring decreasing returns to scale (DRS),16 using capital (k), labor (l), and electricity ( j):
𝐹𝐹𝑖𝑖(𝑙𝑙𝑖𝑖,𝑡𝑡 ,𝑘𝑘𝑖𝑖,𝑡𝑡 , 𝑗𝑗𝑖𝑖,𝑡𝑡) = 𝐴𝐴𝑖𝑖𝑙𝑙𝑖𝑖,𝑡𝑡𝛼𝛼𝑖𝑖[(1 −𝛹𝛹𝑖𝑖)𝑘𝑘𝑖𝑖,𝑡𝑡−𝜈𝜈
𝑗𝑗 + 𝛹𝛹𝑖𝑖𝑗𝑗𝑖𝑖,𝑡𝑡−𝜈𝜈𝑗𝑗]−
(1−𝛼𝛼𝑖𝑖)ύ𝑗𝑗𝑗𝑗 (1)
1 1+νj ύ
𝑗𝑗𝑗𝑗 𝜈𝜈𝑗𝑗ύ𝑗𝑗𝑗𝑗<1
𝑌𝑌𝑡𝑡 = 𝐴𝐴𝑡𝑡𝑌𝑌𝑙𝑙𝑌𝑌,𝑡𝑡𝛼𝛼𝑌𝑌[(1 −𝛹𝛹𝑌𝑌)𝑘𝑘𝑌𝑌,𝑡𝑡
−𝜈𝜈𝑔𝑔 + 𝛹𝛹𝑌𝑌𝑔𝑔𝑡𝑡−𝜈𝜈𝑔𝑔]−
1−α𝑌𝑌ύ𝑔𝑔𝑔𝑔 (2)
𝑋𝑋𝑡𝑡 = 𝑙𝑙𝑋𝑋,𝑡𝑡𝛼𝛼𝑋𝑋[(1 −𝛹𝛹𝑋𝑋)𝑘𝑘𝑋𝑋,𝑡𝑡
−𝜈𝜈𝑠𝑠 + 𝛹𝛹𝑋𝑋𝑠𝑠𝑡𝑡−𝜈𝜈𝑠𝑠]−
1−𝛼𝛼𝑋𝑋ύ𝑠𝑠𝑠𝑠 (3)
𝜋𝜋𝑖𝑖,𝑡𝑡 = max𝑃𝑃𝑡𝑡𝑖𝑖𝐴𝐴𝑖𝑖𝑙𝑙𝑖𝑖,𝑡𝑡𝛼𝛼𝑖𝑖[(1 −𝛹𝛹𝑖𝑖)𝑘𝑘𝑖𝑖,𝑡𝑡−𝜈𝜈
𝑗𝑗 + 𝛹𝛹𝑖𝑖𝑗𝑗𝑖𝑖,𝑡𝑡−𝜈𝜈𝑗𝑗]−
1−𝛼𝛼𝑖𝑖ύjj − 𝑟𝑟𝑡𝑡𝑘𝑘𝑖𝑖,𝑡𝑡 − 𝑤𝑤𝑡𝑡𝑙𝑙𝑖𝑖,𝑡𝑡 − 𝑣𝑣𝑗𝑗 𝑗𝑗𝑖𝑖,𝑡𝑡 (4)
PtY
𝐺𝐺𝑡𝑡 = 𝐴𝐴𝐺𝐺𝑙𝑙𝐺𝐺,𝑡𝑡𝛼𝛼𝐺𝐺[(1 −𝛹𝛹𝐺𝐺)𝑘𝑘𝐺𝐺,𝑡𝑡
−𝜈𝜈𝑚𝑚,𝐺𝐺 + 𝛹𝛹𝐺𝐺𝑚𝑚𝐺𝐺,𝑡𝑡−𝜈𝜈𝑚𝑚,𝐺𝐺]−
1−𝛼𝛼𝐺𝐺𝜈𝜈𝑚𝑚,𝐺𝐺𝐺𝐺 (5)
𝐼𝐼𝑡𝑡 = 𝐴𝐴𝐼𝐼𝑙𝑙𝐼𝐼,𝑡𝑡𝛼𝛼𝐼𝐼[(1 −𝛹𝛹𝐼𝐼)𝑘𝑘𝐼𝐼,𝑡𝑡
−𝜈𝜈𝑚𝑚,𝐼𝐼 + 𝛹𝛹𝐼𝐼𝑚𝑚𝐼𝐼,𝑡𝑡−𝜈𝜈𝑚𝑚,𝐼𝐼]−
1−𝛼𝛼𝐼𝐼𝜈𝜈𝑚𝑚,𝐼𝐼𝐼𝐼 (6)
𝑄𝑄𝑡𝑡 = 𝐴𝐴𝑄𝑄𝑙𝑙𝑄𝑄,𝑡𝑡𝛼𝛼𝑄𝑄[(1 −𝛹𝛹𝑄𝑄)𝑘𝑘𝑄𝑄,𝑡𝑡
−𝜈𝜈𝑄𝑄 + 𝛹𝛹𝑄𝑄ℎ𝑡𝑡−𝜈𝜈𝑄𝑄]−
1−𝛼𝛼𝑄𝑄𝜈𝜈𝑄𝑄,𝑄𝑄𝑄𝑄 (7)
𝑅𝑅𝑡𝑡 = 𝐴𝐴𝑅𝑅𝑙𝑙𝑅𝑅,𝑡𝑡𝛼𝛼𝑅𝑅[(1 −𝛹𝛹𝑅𝑅)𝑘𝑘𝑅𝑅,𝑡𝑡
−𝜈𝜈𝑅𝑅 + 𝛹𝛹𝑅𝑅𝑧𝑧𝑡𝑡−𝜈𝜈𝑅𝑅]−
1−𝛼𝛼𝑅𝑅𝜈𝜈𝑅𝑅,𝑅𝑅𝑅𝑅 (8)
𝜈𝜈𝑚𝑚,𝐺𝐺
vte
ln 𝑣𝑣𝑡𝑡𝑒𝑒 = ′𝛺𝛺𝑣𝑣 + ω ln 𝑣𝑣𝑡𝑡−1𝑒𝑒 + 𝜂𝜂𝑡𝑡𝑂𝑂 (9) Ώ𝑣𝑣 (𝜂𝜂𝑡𝑡𝑂𝑂) 𝑈𝑈(𝑐𝑐𝑡𝑡𝐴𝐴, 𝑙𝑙𝑡𝑡) = 𝜑𝜑 𝑙𝑙𝑙𝑙𝑔𝑔 𝐶𝐶𝑡𝑡𝐴𝐴 + (1 − 𝜑𝜑)𝑙𝑙𝑙𝑙𝑔𝑔 (1 − 𝑙𝑙𝑡𝑡) (10)
𝐶𝐶𝑡𝑡𝐴𝐴 = 𝑋𝑋𝑡𝑡𝛾𝛾(𝜃𝜃𝑐𝑐𝑡𝑡
𝜌𝜌 + (1 − 𝜃𝜃)𝑒𝑒𝑡𝑡𝜌𝜌)
1−𝛾𝛾𝜌𝜌 (11)
𝑘𝑘𝑡𝑡+1 + 𝑐𝑐𝑡𝑡 + 𝑛𝑛.𝑋𝑋𝑡𝑡 + 𝑞𝑞𝑡𝑡𝑒𝑒. 𝑒𝑒𝑡𝑡 = (1 − 𝜏𝜏𝑙𝑙).𝑤𝑤𝑡𝑡 . 𝑙𝑙𝑡𝑡 + ъ + (1 − 𝜏𝜏𝑘𝑘). 𝑟𝑟𝑡𝑡 .𝑘𝑘𝑡𝑡 + (1 − 𝛿𝛿)𝑘𝑘𝑡𝑡 + 𝜋𝜋
𝐿𝐿 = ∑ 𝛽𝛽𝑡𝑡[(𝜑𝜑 𝑙𝑙𝑙𝑙𝑔𝑔 [𝑋𝑋𝑡𝑡𝛾𝛾(𝜃𝜃𝑐𝑐𝑡𝑡
𝜌𝜌 + (1 − 𝜃𝜃)𝑒𝑒𝑡𝑡𝜌𝜌)
1−𝛾𝛾𝜌𝜌 ]) + (1 − 𝜑𝜑) 𝑙𝑙𝑙𝑙𝑔𝑔(1 − 𝑙𝑙𝑡𝑡)] −∞
𝑡𝑡=0 𝜆𝜆𝑡𝑡[𝑘𝑘𝑡𝑡+1 + 𝑐𝑐𝑡𝑡 +𝑛𝑛.𝑋𝑋𝑡𝑡 + 𝑞𝑞𝑡𝑡𝑒𝑒. 𝑒𝑒𝑡𝑡 − (1 − 𝜏𝜏𝑙𝑙).𝑤𝑤𝑡𝑡 . 𝑙𝑙𝑡𝑡 − ъ − (1 − 𝜏𝜏𝑘𝑘). 𝑟𝑟𝑡𝑡 .𝑘𝑘𝑡𝑡 − (1 − 𝛿𝛿)𝑘𝑘𝑡𝑡] (13)
𝑐𝑐𝐺𝐺,𝑡𝑡 = 𝑤𝑤𝑡𝑡 . 𝑙𝑙𝐺𝐺,𝑡𝑡 + 𝑟𝑟𝑡𝑡 .𝑘𝑘𝐺𝐺,𝑡𝑡 + 𝑣𝑣𝑚𝑚.𝑚𝑚𝐺𝐺,𝑡𝑡 − 𝑃𝑃𝐺𝐺𝐴𝐴𝐺𝐺𝑙𝑙𝑡𝑡𝛼𝛼𝐺𝐺 [(1 −𝛹𝛹𝐺𝐺)𝑘𝑘𝐺𝐺,𝑡𝑡
−𝜈𝜈𝑚𝑚,𝐺𝐺 + 𝛹𝛹𝐺𝐺𝑚𝑚𝐺𝐺,𝑡𝑡−𝜈𝜈𝑚𝑚,𝐺𝐺]
− 1−𝛼𝛼𝐺𝐺𝜈𝜈𝑚𝑚,𝐺𝐺𝐺𝐺 (14)
𝑏𝑏 = 𝑃𝑃𝐺𝐺 .𝐺𝐺𝑡𝑡 + 𝑃𝑃𝐼𝐼 . 𝐼𝐼𝑡𝑡 + 𝑃𝑃𝑄𝑄.𝑄𝑄𝑡𝑡 − 𝑞𝑞𝑒𝑒. 𝑒𝑒𝑡𝑡 − 𝑞𝑞𝑠𝑠. 𝑠𝑠𝑡𝑡 − 𝑞𝑞𝑔𝑔.𝑔𝑔𝑡𝑡 (15)
(1)
where Ai is total factor productivity with index i denoting the respective sectors (Y that is the industrial sector or X that is the service sector). αi and Ψi are the labor and electricity shares in production, respectively. The elasticity of substitution (EOS) between capital and electricity is given by
𝐹𝐹𝑖𝑖(𝑙𝑙𝑖𝑖,𝑡𝑡 ,𝑘𝑘𝑖𝑖,𝑡𝑡 , 𝑗𝑗𝑖𝑖,𝑡𝑡) = 𝐴𝐴𝑖𝑖𝑙𝑙𝑖𝑖,𝑡𝑡𝛼𝛼𝑖𝑖[(1 −𝛹𝛹𝑖𝑖)𝑘𝑘𝑖𝑖,𝑡𝑡−𝜈𝜈
𝑗𝑗 + 𝛹𝛹𝑖𝑖𝑗𝑗𝑖𝑖,𝑡𝑡−𝜈𝜈𝑗𝑗]−
(1−𝛼𝛼𝑖𝑖)ύ𝑗𝑗𝑗𝑗 (1)
1 1+νj ύ
𝑗𝑗𝑗𝑗 𝜈𝜈𝑗𝑗ύ𝑗𝑗𝑗𝑗<1
𝑌𝑌𝑡𝑡 = 𝐴𝐴𝑡𝑡𝑌𝑌𝑙𝑙𝑌𝑌,𝑡𝑡𝛼𝛼𝑌𝑌[(1 −𝛹𝛹𝑌𝑌)𝑘𝑘𝑌𝑌,𝑡𝑡
−𝜈𝜈𝑔𝑔 + 𝛹𝛹𝑌𝑌𝑔𝑔𝑡𝑡−𝜈𝜈𝑔𝑔]−
1−α𝑌𝑌ύ𝑔𝑔𝑔𝑔 (2)
𝑋𝑋𝑡𝑡 = 𝑙𝑙𝑋𝑋,𝑡𝑡𝛼𝛼𝑋𝑋[(1 −𝛹𝛹𝑋𝑋)𝑘𝑘𝑋𝑋,𝑡𝑡
−𝜈𝜈𝑠𝑠 + 𝛹𝛹𝑋𝑋𝑠𝑠𝑡𝑡−𝜈𝜈𝑠𝑠]−
1−𝛼𝛼𝑋𝑋ύ𝑠𝑠𝑠𝑠 (3)
𝜋𝜋𝑖𝑖,𝑡𝑡 = max𝑃𝑃𝑡𝑡𝑖𝑖𝐴𝐴𝑖𝑖𝑙𝑙𝑖𝑖,𝑡𝑡𝛼𝛼𝑖𝑖[(1 −𝛹𝛹𝑖𝑖)𝑘𝑘𝑖𝑖,𝑡𝑡−𝜈𝜈
𝑗𝑗 + 𝛹𝛹𝑖𝑖𝑗𝑗𝑖𝑖,𝑡𝑡−𝜈𝜈𝑗𝑗]−
1−𝛼𝛼𝑖𝑖ύjj − 𝑟𝑟𝑡𝑡𝑘𝑘𝑖𝑖,𝑡𝑡 − 𝑤𝑤𝑡𝑡𝑙𝑙𝑖𝑖,𝑡𝑡 − 𝑣𝑣𝑗𝑗 𝑗𝑗𝑖𝑖,𝑡𝑡 (4)
PtY
𝐺𝐺𝑡𝑡 = 𝐴𝐴𝐺𝐺𝑙𝑙𝐺𝐺,𝑡𝑡𝛼𝛼𝐺𝐺[(1 −𝛹𝛹𝐺𝐺)𝑘𝑘𝐺𝐺,𝑡𝑡
−𝜈𝜈𝑚𝑚,𝐺𝐺 + 𝛹𝛹𝐺𝐺𝑚𝑚𝐺𝐺,𝑡𝑡−𝜈𝜈𝑚𝑚,𝐺𝐺]−
1−𝛼𝛼𝐺𝐺𝜈𝜈𝑚𝑚,𝐺𝐺𝐺𝐺 (5)
𝐼𝐼𝑡𝑡 = 𝐴𝐴𝐼𝐼𝑙𝑙𝐼𝐼,𝑡𝑡𝛼𝛼𝐼𝐼[(1 −𝛹𝛹𝐼𝐼)𝑘𝑘𝐼𝐼,𝑡𝑡
−𝜈𝜈𝑚𝑚,𝐼𝐼 + 𝛹𝛹𝐼𝐼𝑚𝑚𝐼𝐼,𝑡𝑡−𝜈𝜈𝑚𝑚,𝐼𝐼]−
1−𝛼𝛼𝐼𝐼𝜈𝜈𝑚𝑚,𝐼𝐼𝐼𝐼 (6)
𝑄𝑄𝑡𝑡 = 𝐴𝐴𝑄𝑄𝑙𝑙𝑄𝑄,𝑡𝑡𝛼𝛼𝑄𝑄[(1 −𝛹𝛹𝑄𝑄)𝑘𝑘𝑄𝑄,𝑡𝑡
−𝜈𝜈𝑄𝑄 + 𝛹𝛹𝑄𝑄ℎ𝑡𝑡−𝜈𝜈𝑄𝑄]−
1−𝛼𝛼𝑄𝑄𝜈𝜈𝑄𝑄,𝑄𝑄𝑄𝑄 (7)
𝑅𝑅𝑡𝑡 = 𝐴𝐴𝑅𝑅𝑙𝑙𝑅𝑅,𝑡𝑡𝛼𝛼𝑅𝑅[(1 −𝛹𝛹𝑅𝑅)𝑘𝑘𝑅𝑅,𝑡𝑡
−𝜈𝜈𝑅𝑅 + 𝛹𝛹𝑅𝑅𝑧𝑧𝑡𝑡−𝜈𝜈𝑅𝑅]−
1−𝛼𝛼𝑅𝑅𝜈𝜈𝑅𝑅,𝑅𝑅𝑅𝑅 (8)
𝜈𝜈𝑚𝑚,𝐺𝐺
vte
ln 𝑣𝑣𝑡𝑡𝑒𝑒 = ′𝛺𝛺𝑣𝑣 + ω ln 𝑣𝑣𝑡𝑡−1𝑒𝑒 + 𝜂𝜂𝑡𝑡𝑂𝑂 (9) Ώ𝑣𝑣 (𝜂𝜂𝑡𝑡𝑂𝑂) 𝑈𝑈(𝑐𝑐𝑡𝑡𝐴𝐴, 𝑙𝑙𝑡𝑡) = 𝜑𝜑 𝑙𝑙𝑙𝑙𝑔𝑔 𝐶𝐶𝑡𝑡𝐴𝐴 + (1 − 𝜑𝜑)𝑙𝑙𝑙𝑙𝑔𝑔 (1 − 𝑙𝑙𝑡𝑡) (10)
𝐶𝐶𝑡𝑡𝐴𝐴 = 𝑋𝑋𝑡𝑡𝛾𝛾(𝜃𝜃𝑐𝑐𝑡𝑡
𝜌𝜌 + (1 − 𝜃𝜃)𝑒𝑒𝑡𝑡𝜌𝜌)
1−𝛾𝛾𝜌𝜌 (11)
𝑘𝑘𝑡𝑡+1 + 𝑐𝑐𝑡𝑡 + 𝑛𝑛.𝑋𝑋𝑡𝑡 + 𝑞𝑞𝑡𝑡𝑒𝑒. 𝑒𝑒𝑡𝑡 = (1 − 𝜏𝜏𝑙𝑙).𝑤𝑤𝑡𝑡 . 𝑙𝑙𝑡𝑡 + ъ + (1 − 𝜏𝜏𝑘𝑘). 𝑟𝑟𝑡𝑡 .𝑘𝑘𝑡𝑡 + (1 − 𝛿𝛿)𝑘𝑘𝑡𝑡 + 𝜋𝜋
𝐿𝐿 = ∑ 𝛽𝛽𝑡𝑡[(𝜑𝜑 𝑙𝑙𝑙𝑙𝑔𝑔 [𝑋𝑋𝑡𝑡𝛾𝛾(𝜃𝜃𝑐𝑐𝑡𝑡
𝜌𝜌 + (1 − 𝜃𝜃)𝑒𝑒𝑡𝑡𝜌𝜌)
1−𝛾𝛾𝜌𝜌 ]) + (1 − 𝜑𝜑) 𝑙𝑙𝑙𝑙𝑔𝑔(1 − 𝑙𝑙𝑡𝑡)] −∞
𝑡𝑡=0 𝜆𝜆𝑡𝑡[𝑘𝑘𝑡𝑡+1 + 𝑐𝑐𝑡𝑡 +𝑛𝑛.𝑋𝑋𝑡𝑡 + 𝑞𝑞𝑡𝑡𝑒𝑒. 𝑒𝑒𝑡𝑡 − (1 − 𝜏𝜏𝑙𝑙).𝑤𝑤𝑡𝑡 . 𝑙𝑙𝑡𝑡 − ъ − (1 − 𝜏𝜏𝑘𝑘). 𝑟𝑟𝑡𝑡 .𝑘𝑘𝑡𝑡 − (1 − 𝛿𝛿)𝑘𝑘𝑡𝑡] (13)
𝑐𝑐𝐺𝐺,𝑡𝑡 = 𝑤𝑤𝑡𝑡 . 𝑙𝑙𝐺𝐺,𝑡𝑡 + 𝑟𝑟𝑡𝑡 .𝑘𝑘𝐺𝐺,𝑡𝑡 + 𝑣𝑣𝑚𝑚.𝑚𝑚𝐺𝐺,𝑡𝑡 − 𝑃𝑃𝐺𝐺𝐴𝐴𝐺𝐺𝑙𝑙𝑡𝑡𝛼𝛼𝐺𝐺 [(1 −𝛹𝛹𝐺𝐺)𝑘𝑘𝐺𝐺,𝑡𝑡
−𝜈𝜈𝑚𝑚,𝐺𝐺 + 𝛹𝛹𝐺𝐺𝑚𝑚𝐺𝐺,𝑡𝑡−𝜈𝜈𝑚𝑚,𝐺𝐺]
− 1−𝛼𝛼𝐺𝐺𝜈𝜈𝑚𝑚,𝐺𝐺𝐺𝐺 (14)
𝑏𝑏 = 𝑃𝑃𝐺𝐺 .𝐺𝐺𝑡𝑡 + 𝑃𝑃𝐼𝐼 . 𝐼𝐼𝑡𝑡 + 𝑃𝑃𝑄𝑄.𝑄𝑄𝑡𝑡 − 𝑞𝑞𝑒𝑒. 𝑒𝑒𝑡𝑡 − 𝑞𝑞𝑠𝑠. 𝑠𝑠𝑡𝑡 − 𝑞𝑞𝑔𝑔.𝑔𝑔𝑡𝑡 (15)
. The degree of homogeneity of the production function is given by
𝐹𝐹𝑖𝑖(𝑙𝑙𝑖𝑖,𝑡𝑡 ,𝑘𝑘𝑖𝑖,𝑡𝑡 , 𝑗𝑗𝑖𝑖,𝑡𝑡) = 𝐴𝐴𝑖𝑖𝑙𝑙𝑖𝑖,𝑡𝑡𝛼𝛼𝑖𝑖[(1 −𝛹𝛹𝑖𝑖)𝑘𝑘𝑖𝑖,𝑡𝑡−𝜈𝜈
𝑗𝑗 + 𝛹𝛹𝑖𝑖𝑗𝑗𝑖𝑖,𝑡𝑡−𝜈𝜈𝑗𝑗]−
(1−𝛼𝛼𝑖𝑖)ύ𝑗𝑗𝑗𝑗 (1)
1 1+νj ύ
𝑗𝑗𝑗𝑗 𝜈𝜈𝑗𝑗ύ𝑗𝑗𝑗𝑗<1
𝑌𝑌𝑡𝑡 = 𝐴𝐴𝑡𝑡𝑌𝑌𝑙𝑙𝑌𝑌,𝑡𝑡𝛼𝛼𝑌𝑌[(1 −𝛹𝛹𝑌𝑌)𝑘𝑘𝑌𝑌,𝑡𝑡
−𝜈𝜈𝑔𝑔 + 𝛹𝛹𝑌𝑌𝑔𝑔𝑡𝑡−𝜈𝜈𝑔𝑔]−
1−α𝑌𝑌ύ𝑔𝑔𝑔𝑔 (2)
𝑋𝑋𝑡𝑡 = 𝑙𝑙𝑋𝑋,𝑡𝑡𝛼𝛼𝑋𝑋[(1 −𝛹𝛹𝑋𝑋)𝑘𝑘𝑋𝑋,𝑡𝑡
−𝜈𝜈𝑠𝑠 + 𝛹𝛹𝑋𝑋𝑠𝑠𝑡𝑡−𝜈𝜈𝑠𝑠]−
1−𝛼𝛼𝑋𝑋ύ𝑠𝑠𝑠𝑠 (3)
𝜋𝜋𝑖𝑖,𝑡𝑡 = max𝑃𝑃𝑡𝑡𝑖𝑖𝐴𝐴𝑖𝑖𝑙𝑙𝑖𝑖,𝑡𝑡𝛼𝛼𝑖𝑖[(1 −𝛹𝛹𝑖𝑖)𝑘𝑘𝑖𝑖,𝑡𝑡−𝜈𝜈
𝑗𝑗 + 𝛹𝛹𝑖𝑖𝑗𝑗𝑖𝑖,𝑡𝑡−𝜈𝜈𝑗𝑗]−
1−𝛼𝛼𝑖𝑖ύjj − 𝑟𝑟𝑡𝑡𝑘𝑘𝑖𝑖,𝑡𝑡 − 𝑤𝑤𝑡𝑡𝑙𝑙𝑖𝑖,𝑡𝑡 − 𝑣𝑣𝑗𝑗 𝑗𝑗𝑖𝑖,𝑡𝑡 (4)
PtY
𝐺𝐺𝑡𝑡 = 𝐴𝐴𝐺𝐺𝑙𝑙𝐺𝐺,𝑡𝑡𝛼𝛼𝐺𝐺[(1 −𝛹𝛹𝐺𝐺)𝑘𝑘𝐺𝐺,𝑡𝑡
−𝜈𝜈𝑚𝑚,𝐺𝐺 + 𝛹𝛹𝐺𝐺𝑚𝑚𝐺𝐺,𝑡𝑡−𝜈𝜈𝑚𝑚,𝐺𝐺]−
1−𝛼𝛼𝐺𝐺𝜈𝜈𝑚𝑚,𝐺𝐺𝐺𝐺 (5)
𝐼𝐼𝑡𝑡 = 𝐴𝐴𝐼𝐼𝑙𝑙𝐼𝐼,𝑡𝑡𝛼𝛼𝐼𝐼[(1 −𝛹𝛹𝐼𝐼)𝑘𝑘𝐼𝐼,𝑡𝑡
−𝜈𝜈𝑚𝑚,𝐼𝐼 + 𝛹𝛹𝐼𝐼𝑚𝑚𝐼𝐼,𝑡𝑡−𝜈𝜈𝑚𝑚,𝐼𝐼]−
1−𝛼𝛼𝐼𝐼𝜈𝜈𝑚𝑚,𝐼𝐼𝐼𝐼 (6)
𝑄𝑄𝑡𝑡 = 𝐴𝐴𝑄𝑄𝑙𝑙𝑄𝑄,𝑡𝑡𝛼𝛼𝑄𝑄[(1 −𝛹𝛹𝑄𝑄)𝑘𝑘𝑄𝑄,𝑡𝑡
−𝜈𝜈𝑄𝑄 + 𝛹𝛹𝑄𝑄ℎ𝑡𝑡−𝜈𝜈𝑄𝑄]−
1−𝛼𝛼𝑄𝑄𝜈𝜈𝑄𝑄,𝑄𝑄𝑄𝑄 (7)
𝑅𝑅𝑡𝑡 = 𝐴𝐴𝑅𝑅𝑙𝑙𝑅𝑅,𝑡𝑡𝛼𝛼𝑅𝑅[(1 −𝛹𝛹𝑅𝑅)𝑘𝑘𝑅𝑅,𝑡𝑡
−𝜈𝜈𝑅𝑅 + 𝛹𝛹𝑅𝑅𝑧𝑧𝑡𝑡−𝜈𝜈𝑅𝑅]−
1−𝛼𝛼𝑅𝑅𝜈𝜈𝑅𝑅,𝑅𝑅𝑅𝑅 (8)
𝜈𝜈𝑚𝑚,𝐺𝐺
vte
ln 𝑣𝑣𝑡𝑡𝑒𝑒 = ′𝛺𝛺𝑣𝑣 + ω ln 𝑣𝑣𝑡𝑡−1𝑒𝑒 + 𝜂𝜂𝑡𝑡𝑂𝑂 (9) Ώ𝑣𝑣 (𝜂𝜂𝑡𝑡𝑂𝑂) 𝑈𝑈(𝑐𝑐𝑡𝑡𝐴𝐴, 𝑙𝑙𝑡𝑡) = 𝜑𝜑 𝑙𝑙𝑙𝑙𝑔𝑔 𝐶𝐶𝑡𝑡𝐴𝐴 + (1 − 𝜑𝜑)𝑙𝑙𝑙𝑙𝑔𝑔 (1 − 𝑙𝑙𝑡𝑡) (10)
𝐶𝐶𝑡𝑡𝐴𝐴 = 𝑋𝑋𝑡𝑡𝛾𝛾(𝜃𝜃𝑐𝑐𝑡𝑡
𝜌𝜌 + (1 − 𝜃𝜃)𝑒𝑒𝑡𝑡𝜌𝜌)
1−𝛾𝛾𝜌𝜌 (11)
𝑘𝑘𝑡𝑡+1 + 𝑐𝑐𝑡𝑡 + 𝑛𝑛.𝑋𝑋𝑡𝑡 + 𝑞𝑞𝑡𝑡𝑒𝑒. 𝑒𝑒𝑡𝑡 = (1 − 𝜏𝜏𝑙𝑙).𝑤𝑤𝑡𝑡 . 𝑙𝑙𝑡𝑡 + ъ + (1 − 𝜏𝜏𝑘𝑘). 𝑟𝑟𝑡𝑡 .𝑘𝑘𝑡𝑡 + (1 − 𝛿𝛿)𝑘𝑘𝑡𝑡 + 𝜋𝜋
𝐿𝐿 = ∑ 𝛽𝛽𝑡𝑡[(𝜑𝜑 𝑙𝑙𝑙𝑙𝑔𝑔 [𝑋𝑋𝑡𝑡𝛾𝛾(𝜃𝜃𝑐𝑐𝑡𝑡
𝜌𝜌 + (1 − 𝜃𝜃)𝑒𝑒𝑡𝑡𝜌𝜌)
1−𝛾𝛾𝜌𝜌 ]) + (1 − 𝜑𝜑) 𝑙𝑙𝑙𝑙𝑔𝑔(1 − 𝑙𝑙𝑡𝑡)] −∞
𝑡𝑡=0 𝜆𝜆𝑡𝑡[𝑘𝑘𝑡𝑡+1 + 𝑐𝑐𝑡𝑡 +𝑛𝑛.𝑋𝑋𝑡𝑡 + 𝑞𝑞𝑡𝑡𝑒𝑒. 𝑒𝑒𝑡𝑡 − (1 − 𝜏𝜏𝑙𝑙).𝑤𝑤𝑡𝑡 . 𝑙𝑙𝑡𝑡 − ъ − (1 − 𝜏𝜏𝑘𝑘). 𝑟𝑟𝑡𝑡 .𝑘𝑘𝑡𝑡 − (1 − 𝛿𝛿)𝑘𝑘𝑡𝑡] (13)
𝑐𝑐𝐺𝐺,𝑡𝑡 = 𝑤𝑤𝑡𝑡 . 𝑙𝑙𝐺𝐺,𝑡𝑡 + 𝑟𝑟𝑡𝑡 .𝑘𝑘𝐺𝐺,𝑡𝑡 + 𝑣𝑣𝑚𝑚.𝑚𝑚𝐺𝐺,𝑡𝑡 − 𝑃𝑃𝐺𝐺𝐴𝐴𝐺𝐺𝑙𝑙𝑡𝑡𝛼𝛼𝐺𝐺 [(1 −𝛹𝛹𝐺𝐺)𝑘𝑘𝐺𝐺,𝑡𝑡
−𝜈𝜈𝑚𝑚,𝐺𝐺 + 𝛹𝛹𝐺𝐺𝑚𝑚𝐺𝐺,𝑡𝑡−𝜈𝜈𝑚𝑚,𝐺𝐺]
− 1−𝛼𝛼𝐺𝐺𝜈𝜈𝑚𝑚,𝐺𝐺𝐺𝐺 (14)
𝑏𝑏 = 𝑃𝑃𝐺𝐺 .𝐺𝐺𝑡𝑡 + 𝑃𝑃𝐼𝐼 . 𝐼𝐼𝑡𝑡 + 𝑃𝑃𝑄𝑄.𝑄𝑄𝑡𝑡 − 𝑞𝑞𝑒𝑒. 𝑒𝑒𝑡𝑡 − 𝑞𝑞𝑠𝑠. 𝑠𝑠𝑡𝑡 − 𝑞𝑞𝑔𝑔.𝑔𝑔𝑡𝑡 (15)
and in order for DRS to hold, we need:
i.
𝐹𝐹𝑖𝑖(𝑙𝑙𝑖𝑖,𝑡𝑡 ,𝑘𝑘𝑖𝑖,𝑡𝑡 , 𝑗𝑗𝑖𝑖,𝑡𝑡) = 𝐴𝐴𝑖𝑖𝑙𝑙𝑖𝑖,𝑡𝑡𝛼𝛼𝑖𝑖[(1 −𝛹𝛹𝑖𝑖)𝑘𝑘𝑖𝑖,𝑡𝑡−𝜈𝜈
𝑗𝑗 + 𝛹𝛹𝑖𝑖𝑗𝑗𝑖𝑖,𝑡𝑡−𝜈𝜈𝑗𝑗]−
(1−𝛼𝛼𝑖𝑖)ύ𝑗𝑗𝑗𝑗 (1)
1 1+νj ύ
𝑗𝑗𝑗𝑗 𝜈𝜈𝑗𝑗ύ𝑗𝑗𝑗𝑗<1
𝑌𝑌𝑡𝑡 = 𝐴𝐴𝑡𝑡𝑌𝑌𝑙𝑙𝑌𝑌,𝑡𝑡𝛼𝛼𝑌𝑌[(1 −𝛹𝛹𝑌𝑌)𝑘𝑘𝑌𝑌,𝑡𝑡
−𝜈𝜈𝑔𝑔 + 𝛹𝛹𝑌𝑌𝑔𝑔𝑡𝑡−𝜈𝜈𝑔𝑔]−
1−α𝑌𝑌ύ𝑔𝑔𝑔𝑔 (2)
𝑋𝑋𝑡𝑡 = 𝑙𝑙𝑋𝑋,𝑡𝑡𝛼𝛼𝑋𝑋[(1 −𝛹𝛹𝑋𝑋)𝑘𝑘𝑋𝑋,𝑡𝑡
−𝜈𝜈𝑠𝑠 + 𝛹𝛹𝑋𝑋𝑠𝑠𝑡𝑡−𝜈𝜈𝑠𝑠]−
1−𝛼𝛼𝑋𝑋ύ𝑠𝑠𝑠𝑠 (3)
𝜋𝜋𝑖𝑖,𝑡𝑡 = max𝑃𝑃𝑡𝑡𝑖𝑖𝐴𝐴𝑖𝑖𝑙𝑙𝑖𝑖,𝑡𝑡𝛼𝛼𝑖𝑖[(1 −𝛹𝛹𝑖𝑖)𝑘𝑘𝑖𝑖,𝑡𝑡−𝜈𝜈
𝑗𝑗 + 𝛹𝛹𝑖𝑖𝑗𝑗𝑖𝑖,𝑡𝑡−𝜈𝜈𝑗𝑗]−
1−𝛼𝛼𝑖𝑖ύjj − 𝑟𝑟𝑡𝑡𝑘𝑘𝑖𝑖,𝑡𝑡 − 𝑤𝑤𝑡𝑡𝑙𝑙𝑖𝑖,𝑡𝑡 − 𝑣𝑣𝑗𝑗 𝑗𝑗𝑖𝑖,𝑡𝑡 (4)
PtY
𝐺𝐺𝑡𝑡 = 𝐴𝐴𝐺𝐺𝑙𝑙𝐺𝐺,𝑡𝑡𝛼𝛼𝐺𝐺[(1 −𝛹𝛹𝐺𝐺)𝑘𝑘𝐺𝐺,𝑡𝑡
−𝜈𝜈𝑚𝑚,𝐺𝐺 + 𝛹𝛹𝐺𝐺𝑚𝑚𝐺𝐺,𝑡𝑡−𝜈𝜈𝑚𝑚,𝐺𝐺]−
1−𝛼𝛼𝐺𝐺𝜈𝜈𝑚𝑚,𝐺𝐺𝐺𝐺 (5)
𝐼𝐼𝑡𝑡 = 𝐴𝐴𝐼𝐼𝑙𝑙𝐼𝐼,𝑡𝑡𝛼𝛼𝐼𝐼[(1 −𝛹𝛹𝐼𝐼)𝑘𝑘𝐼𝐼,𝑡𝑡
−𝜈𝜈𝑚𝑚,𝐼𝐼 + 𝛹𝛹𝐼𝐼𝑚𝑚𝐼𝐼,𝑡𝑡−𝜈𝜈𝑚𝑚,𝐼𝐼]−
1−𝛼𝛼𝐼𝐼𝜈𝜈𝑚𝑚,𝐼𝐼𝐼𝐼 (6)
𝑄𝑄𝑡𝑡 = 𝐴𝐴𝑄𝑄𝑙𝑙𝑄𝑄,𝑡𝑡𝛼𝛼𝑄𝑄[(1 −𝛹𝛹𝑄𝑄)𝑘𝑘𝑄𝑄,𝑡𝑡
−𝜈𝜈𝑄𝑄 + 𝛹𝛹𝑄𝑄ℎ𝑡𝑡−𝜈𝜈𝑄𝑄]−
1−𝛼𝛼𝑄𝑄𝜈𝜈𝑄𝑄,𝑄𝑄𝑄𝑄 (7)
𝑅𝑅𝑡𝑡 = 𝐴𝐴𝑅𝑅𝑙𝑙𝑅𝑅,𝑡𝑡𝛼𝛼𝑅𝑅[(1 −𝛹𝛹𝑅𝑅)𝑘𝑘𝑅𝑅,𝑡𝑡
−𝜈𝜈𝑅𝑅 + 𝛹𝛹𝑅𝑅𝑧𝑧𝑡𝑡−𝜈𝜈𝑅𝑅]−
1−𝛼𝛼𝑅𝑅𝜈𝜈𝑅𝑅,𝑅𝑅𝑅𝑅 (8)
𝜈𝜈𝑚𝑚,𝐺𝐺
vte
ln 𝑣𝑣𝑡𝑡𝑒𝑒 = ′𝛺𝛺𝑣𝑣 + ω ln 𝑣𝑣𝑡𝑡−1𝑒𝑒 + 𝜂𝜂𝑡𝑡𝑂𝑂 (9) Ώ𝑣𝑣 (𝜂𝜂𝑡𝑡𝑂𝑂) 𝑈𝑈(𝑐𝑐𝑡𝑡𝐴𝐴, 𝑙𝑙𝑡𝑡) = 𝜑𝜑 𝑙𝑙𝑙𝑙𝑔𝑔 𝐶𝐶𝑡𝑡𝐴𝐴 + (1 − 𝜑𝜑)𝑙𝑙𝑙𝑙𝑔𝑔 (1 − 𝑙𝑙𝑡𝑡) (10)
𝐶𝐶𝑡𝑡𝐴𝐴 = 𝑋𝑋𝑡𝑡𝛾𝛾(𝜃𝜃𝑐𝑐𝑡𝑡
𝜌𝜌 + (1 − 𝜃𝜃)𝑒𝑒𝑡𝑡𝜌𝜌)
1−𝛾𝛾𝜌𝜌 (11)
𝑘𝑘𝑡𝑡+1 + 𝑐𝑐𝑡𝑡 + 𝑛𝑛.𝑋𝑋𝑡𝑡 + 𝑞𝑞𝑡𝑡𝑒𝑒. 𝑒𝑒𝑡𝑡 = (1 − 𝜏𝜏𝑙𝑙).𝑤𝑤𝑡𝑡 . 𝑙𝑙𝑡𝑡 + ъ + (1 − 𝜏𝜏𝑘𝑘). 𝑟𝑟𝑡𝑡 .𝑘𝑘𝑡𝑡 + (1 − 𝛿𝛿)𝑘𝑘𝑡𝑡 + 𝜋𝜋
𝐿𝐿 = ∑ 𝛽𝛽𝑡𝑡[(𝜑𝜑 𝑙𝑙𝑙𝑙𝑔𝑔 [𝑋𝑋𝑡𝑡𝛾𝛾(𝜃𝜃𝑐𝑐𝑡𝑡
𝜌𝜌 + (1 − 𝜃𝜃)𝑒𝑒𝑡𝑡𝜌𝜌)
1−𝛾𝛾𝜌𝜌 ]) + (1 − 𝜑𝜑) 𝑙𝑙𝑙𝑙𝑔𝑔(1 − 𝑙𝑙𝑡𝑡)] −∞
𝑡𝑡=0 𝜆𝜆𝑡𝑡[𝑘𝑘𝑡𝑡+1 + 𝑐𝑐𝑡𝑡 +𝑛𝑛.𝑋𝑋𝑡𝑡 + 𝑞𝑞𝑡𝑡𝑒𝑒. 𝑒𝑒𝑡𝑡 − (1 − 𝜏𝜏𝑙𝑙).𝑤𝑤𝑡𝑡 . 𝑙𝑙𝑡𝑡 − ъ − (1 − 𝜏𝜏𝑘𝑘). 𝑟𝑟𝑡𝑡 .𝑘𝑘𝑡𝑡 − (1 − 𝛿𝛿)𝑘𝑘𝑡𝑡] (13)
𝑐𝑐𝐺𝐺,𝑡𝑡 = 𝑤𝑤𝑡𝑡 . 𝑙𝑙𝐺𝐺,𝑡𝑡 + 𝑟𝑟𝑡𝑡 .𝑘𝑘𝐺𝐺,𝑡𝑡 + 𝑣𝑣𝑚𝑚.𝑚𝑚𝐺𝐺,𝑡𝑡 − 𝑃𝑃𝐺𝐺𝐴𝐴𝐺𝐺𝑙𝑙𝑡𝑡𝛼𝛼𝐺𝐺 [(1 −𝛹𝛹𝐺𝐺)𝑘𝑘𝐺𝐺,𝑡𝑡
−𝜈𝜈𝑚𝑚,𝐺𝐺 + 𝛹𝛹𝐺𝐺𝑚𝑚𝐺𝐺,𝑡𝑡−𝜈𝜈𝑚𝑚,𝐺𝐺]
− 1−𝛼𝛼𝐺𝐺𝜈𝜈𝑚𝑚,𝐺𝐺𝐺𝐺 (14)
𝑏𝑏 = 𝑃𝑃𝐺𝐺 .𝐺𝐺𝑡𝑡 + 𝑃𝑃𝐼𝐼 . 𝐼𝐼𝑡𝑡 + 𝑃𝑃𝑄𝑄.𝑄𝑄𝑡𝑡 − 𝑞𝑞𝑒𝑒. 𝑒𝑒𝑡𝑡 − 𝑞𝑞𝑠𝑠. 𝑠𝑠𝑡𝑡 − 𝑞𝑞𝑔𝑔.𝑔𝑔𝑡𝑡 (15)
Denoting g and s the electricity use in industry (Y) and services (X), we have:
𝐹𝐹𝑖𝑖(𝑙𝑙𝑖𝑖,𝑡𝑡 ,𝑘𝑘𝑖𝑖,𝑡𝑡 , 𝑗𝑗𝑖𝑖,𝑡𝑡) = 𝐴𝐴𝑖𝑖𝑙𝑙𝑖𝑖,𝑡𝑡𝛼𝛼𝑖𝑖[(1 −𝛹𝛹𝑖𝑖)𝑘𝑘𝑖𝑖,𝑡𝑡−𝜈𝜈
𝑗𝑗 + 𝛹𝛹𝑖𝑖𝑗𝑗𝑖𝑖,𝑡𝑡−𝜈𝜈𝑗𝑗]−
(1−𝛼𝛼𝑖𝑖)ύ𝑗𝑗𝑗𝑗 (1)
1 1+νj ύ
𝑗𝑗𝑗𝑗 𝜈𝜈𝑗𝑗ύ𝑗𝑗𝑗𝑗<1
𝑌𝑌𝑡𝑡 = 𝐴𝐴𝑡𝑡𝑌𝑌𝑙𝑙𝑌𝑌,𝑡𝑡𝛼𝛼𝑌𝑌[(1 −𝛹𝛹𝑌𝑌)𝑘𝑘𝑌𝑌,𝑡𝑡
−𝜈𝜈𝑔𝑔 + 𝛹𝛹𝑌𝑌𝑔𝑔𝑡𝑡−𝜈𝜈𝑔𝑔]−
1−α𝑌𝑌ύ𝑔𝑔𝑔𝑔 (2)
𝑋𝑋𝑡𝑡 = 𝑙𝑙𝑋𝑋,𝑡𝑡𝛼𝛼𝑋𝑋[(1 −𝛹𝛹𝑋𝑋)𝑘𝑘𝑋𝑋,𝑡𝑡
−𝜈𝜈𝑠𝑠 + 𝛹𝛹𝑋𝑋𝑠𝑠𝑡𝑡−𝜈𝜈𝑠𝑠]−
1−𝛼𝛼𝑋𝑋ύ𝑠𝑠𝑠𝑠 (3)
𝜋𝜋𝑖𝑖,𝑡𝑡 = max𝑃𝑃𝑡𝑡𝑖𝑖𝐴𝐴𝑖𝑖𝑙𝑙𝑖𝑖,𝑡𝑡𝛼𝛼𝑖𝑖[(1 −𝛹𝛹𝑖𝑖)𝑘𝑘𝑖𝑖,𝑡𝑡−𝜈𝜈
𝑗𝑗 + 𝛹𝛹𝑖𝑖𝑗𝑗𝑖𝑖,𝑡𝑡−𝜈𝜈𝑗𝑗]−
1−𝛼𝛼𝑖𝑖ύjj − 𝑟𝑟𝑡𝑡𝑘𝑘𝑖𝑖,𝑡𝑡 − 𝑤𝑤𝑡𝑡𝑙𝑙𝑖𝑖,𝑡𝑡 − 𝑣𝑣𝑗𝑗 𝑗𝑗𝑖𝑖,𝑡𝑡 (4)
PtY
𝐺𝐺𝑡𝑡 = 𝐴𝐴𝐺𝐺𝑙𝑙𝐺𝐺,𝑡𝑡𝛼𝛼𝐺𝐺[(1 −𝛹𝛹𝐺𝐺)𝑘𝑘𝐺𝐺,𝑡𝑡
−𝜈𝜈𝑚𝑚,𝐺𝐺 + 𝛹𝛹𝐺𝐺𝑚𝑚𝐺𝐺,𝑡𝑡−𝜈𝜈𝑚𝑚,𝐺𝐺]−
1−𝛼𝛼𝐺𝐺𝜈𝜈𝑚𝑚,𝐺𝐺𝐺𝐺 (5)
𝐼𝐼𝑡𝑡 = 𝐴𝐴𝐼𝐼𝑙𝑙𝐼𝐼,𝑡𝑡𝛼𝛼𝐼𝐼[(1 −𝛹𝛹𝐼𝐼)𝑘𝑘𝐼𝐼,𝑡𝑡
−𝜈𝜈𝑚𝑚,𝐼𝐼 + 𝛹𝛹𝐼𝐼𝑚𝑚𝐼𝐼,𝑡𝑡−𝜈𝜈𝑚𝑚,𝐼𝐼]−
1−𝛼𝛼𝐼𝐼𝜈𝜈𝑚𝑚,𝐼𝐼𝐼𝐼 (6)
𝑄𝑄𝑡𝑡 = 𝐴𝐴𝑄𝑄𝑙𝑙𝑄𝑄,𝑡𝑡𝛼𝛼𝑄𝑄[(1 −𝛹𝛹𝑄𝑄)𝑘𝑘𝑄𝑄,𝑡𝑡
−𝜈𝜈𝑄𝑄 + 𝛹𝛹𝑄𝑄ℎ𝑡𝑡−𝜈𝜈𝑄𝑄]−
1−𝛼𝛼𝑄𝑄𝜈𝜈𝑄𝑄,𝑄𝑄𝑄𝑄 (7)
𝑅𝑅𝑡𝑡 = 𝐴𝐴𝑅𝑅𝑙𝑙𝑅𝑅,𝑡𝑡𝛼𝛼𝑅𝑅[(1 −𝛹𝛹𝑅𝑅)𝑘𝑘𝑅𝑅,𝑡𝑡
−𝜈𝜈𝑅𝑅 + 𝛹𝛹𝑅𝑅𝑧𝑧𝑡𝑡−𝜈𝜈𝑅𝑅]−
1−𝛼𝛼𝑅𝑅𝜈𝜈𝑅𝑅,𝑅𝑅𝑅𝑅 (8)
𝜈𝜈𝑚𝑚,𝐺𝐺
vte
ln 𝑣𝑣𝑡𝑡𝑒𝑒 = ′𝛺𝛺𝑣𝑣 + ω ln 𝑣𝑣𝑡𝑡−1𝑒𝑒 + 𝜂𝜂𝑡𝑡𝑂𝑂 (9) Ώ𝑣𝑣 (𝜂𝜂𝑡𝑡𝑂𝑂) 𝑈𝑈(𝑐𝑐𝑡𝑡𝐴𝐴, 𝑙𝑙𝑡𝑡) = 𝜑𝜑 𝑙𝑙𝑙𝑙𝑔𝑔 𝐶𝐶𝑡𝑡𝐴𝐴 + (1 − 𝜑𝜑)𝑙𝑙𝑙𝑙𝑔𝑔 (1 − 𝑙𝑙𝑡𝑡) (10)
𝐶𝐶𝑡𝑡𝐴𝐴 = 𝑋𝑋𝑡𝑡𝛾𝛾(𝜃𝜃𝑐𝑐𝑡𝑡
𝜌𝜌 + (1 − 𝜃𝜃)𝑒𝑒𝑡𝑡𝜌𝜌)
1−𝛾𝛾𝜌𝜌 (11)
𝑘𝑘𝑡𝑡+1 + 𝑐𝑐𝑡𝑡 + 𝑛𝑛.𝑋𝑋𝑡𝑡 + 𝑞𝑞𝑡𝑡𝑒𝑒. 𝑒𝑒𝑡𝑡 = (1 − 𝜏𝜏𝑙𝑙).𝑤𝑤𝑡𝑡 . 𝑙𝑙𝑡𝑡 + ъ + (1 − 𝜏𝜏𝑘𝑘). 𝑟𝑟𝑡𝑡 .𝑘𝑘𝑡𝑡 + (1 − 𝛿𝛿)𝑘𝑘𝑡𝑡 + 𝜋𝜋
𝐿𝐿 = ∑ 𝛽𝛽𝑡𝑡[(𝜑𝜑 𝑙𝑙𝑙𝑙𝑔𝑔 [𝑋𝑋𝑡𝑡𝛾𝛾(𝜃𝜃𝑐𝑐𝑡𝑡
𝜌𝜌 + (1 − 𝜃𝜃)𝑒𝑒𝑡𝑡𝜌𝜌)
1−𝛾𝛾𝜌𝜌 ]) + (1 − 𝜑𝜑) 𝑙𝑙𝑙𝑙𝑔𝑔(1 − 𝑙𝑙𝑡𝑡)] −∞
𝑡𝑡=0 𝜆𝜆𝑡𝑡[𝑘𝑘𝑡𝑡+1 + 𝑐𝑐𝑡𝑡 +𝑛𝑛.𝑋𝑋𝑡𝑡 + 𝑞𝑞𝑡𝑡𝑒𝑒. 𝑒𝑒𝑡𝑡 − (1 − 𝜏𝜏𝑙𝑙).𝑤𝑤𝑡𝑡 . 𝑙𝑙𝑡𝑡 − ъ − (1 − 𝜏𝜏𝑘𝑘). 𝑟𝑟𝑡𝑡 .𝑘𝑘𝑡𝑡 − (1 − 𝛿𝛿)𝑘𝑘𝑡𝑡] (13)
𝑐𝑐𝐺𝐺,𝑡𝑡 = 𝑤𝑤𝑡𝑡 . 𝑙𝑙𝐺𝐺,𝑡𝑡 + 𝑟𝑟𝑡𝑡 .𝑘𝑘𝐺𝐺,𝑡𝑡 + 𝑣𝑣𝑚𝑚.𝑚𝑚𝐺𝐺,𝑡𝑡 − 𝑃𝑃𝐺𝐺𝐴𝐴𝐺𝐺𝑙𝑙𝑡𝑡𝛼𝛼𝐺𝐺 [(1 −𝛹𝛹𝐺𝐺)𝑘𝑘𝐺𝐺,𝑡𝑡
−𝜈𝜈𝑚𝑚,𝐺𝐺 + 𝛹𝛹𝐺𝐺𝑚𝑚𝐺𝐺,𝑡𝑡−𝜈𝜈𝑚𝑚,𝐺𝐺]
− 1−𝛼𝛼𝐺𝐺𝜈𝜈𝑚𝑚,𝐺𝐺𝐺𝐺 (14)
𝑏𝑏 = 𝑃𝑃𝐺𝐺 .𝐺𝐺𝑡𝑡 + 𝑃𝑃𝐼𝐼 . 𝐼𝐼𝑡𝑡 + 𝑃𝑃𝑄𝑄.𝑄𝑄𝑡𝑡 − 𝑞𝑞𝑒𝑒. 𝑒𝑒𝑡𝑡 − 𝑞𝑞𝑠𝑠. 𝑠𝑠𝑡𝑡 − 𝑞𝑞𝑔𝑔.𝑔𝑔𝑡𝑡 (15)
(2)
𝐹𝐹𝑖𝑖(𝑙𝑙𝑖𝑖,𝑡𝑡 ,𝑘𝑘𝑖𝑖,𝑡𝑡 , 𝑗𝑗𝑖𝑖,𝑡𝑡) = 𝐴𝐴𝑖𝑖𝑙𝑙𝑖𝑖,𝑡𝑡𝛼𝛼𝑖𝑖[(1 −𝛹𝛹𝑖𝑖)𝑘𝑘𝑖𝑖,𝑡𝑡−𝜈𝜈
𝑗𝑗 + 𝛹𝛹𝑖𝑖𝑗𝑗𝑖𝑖,𝑡𝑡−𝜈𝜈𝑗𝑗]−
(1−𝛼𝛼𝑖𝑖)ύ𝑗𝑗𝑗𝑗 (1)
1 1+νj ύ
𝑗𝑗𝑗𝑗 𝜈𝜈𝑗𝑗ύ𝑗𝑗𝑗𝑗<1
𝑌𝑌𝑡𝑡 = 𝐴𝐴𝑡𝑡𝑌𝑌𝑙𝑙𝑌𝑌,𝑡𝑡𝛼𝛼𝑌𝑌[(1 −𝛹𝛹𝑌𝑌)𝑘𝑘𝑌𝑌,𝑡𝑡
−𝜈𝜈𝑔𝑔 + 𝛹𝛹𝑌𝑌𝑔𝑔𝑡𝑡−𝜈𝜈𝑔𝑔]−
1−α𝑌𝑌ύ𝑔𝑔𝑔𝑔 (2)
𝑋𝑋𝑡𝑡 = 𝑙𝑙𝑋𝑋,𝑡𝑡𝛼𝛼𝑋𝑋[(1 −𝛹𝛹𝑋𝑋)𝑘𝑘𝑋𝑋,𝑡𝑡
−𝜈𝜈𝑠𝑠 + 𝛹𝛹𝑋𝑋𝑠𝑠𝑡𝑡−𝜈𝜈𝑠𝑠]−
1−𝛼𝛼𝑋𝑋ύ𝑠𝑠𝑠𝑠 (3)
𝜋𝜋𝑖𝑖,𝑡𝑡 = max𝑃𝑃𝑡𝑡𝑖𝑖𝐴𝐴𝑖𝑖𝑙𝑙𝑖𝑖,𝑡𝑡𝛼𝛼𝑖𝑖[(1 −𝛹𝛹𝑖𝑖)𝑘𝑘𝑖𝑖,𝑡𝑡−𝜈𝜈
𝑗𝑗 + 𝛹𝛹𝑖𝑖𝑗𝑗𝑖𝑖,𝑡𝑡−𝜈𝜈𝑗𝑗]−
1−𝛼𝛼𝑖𝑖ύjj − 𝑟𝑟𝑡𝑡𝑘𝑘𝑖𝑖,𝑡𝑡 − 𝑤𝑤𝑡𝑡𝑙𝑙𝑖𝑖,𝑡𝑡 − 𝑣𝑣𝑗𝑗 𝑗𝑗𝑖𝑖,𝑡𝑡 (4)
PtY
𝐺𝐺𝑡𝑡 = 𝐴𝐴𝐺𝐺𝑙𝑙𝐺𝐺,𝑡𝑡𝛼𝛼𝐺𝐺[(1 −𝛹𝛹𝐺𝐺)𝑘𝑘𝐺𝐺,𝑡𝑡
−𝜈𝜈𝑚𝑚,𝐺𝐺 + 𝛹𝛹𝐺𝐺𝑚𝑚𝐺𝐺,𝑡𝑡−𝜈𝜈𝑚𝑚,𝐺𝐺]−
1−𝛼𝛼𝐺𝐺𝜈𝜈𝑚𝑚,𝐺𝐺𝐺𝐺 (5)
𝐼𝐼𝑡𝑡 = 𝐴𝐴𝐼𝐼𝑙𝑙𝐼𝐼,𝑡𝑡𝛼𝛼𝐼𝐼[(1 −𝛹𝛹𝐼𝐼)𝑘𝑘𝐼𝐼,𝑡𝑡
−𝜈𝜈𝑚𝑚,𝐼𝐼 + 𝛹𝛹𝐼𝐼𝑚𝑚𝐼𝐼,𝑡𝑡−𝜈𝜈𝑚𝑚,𝐼𝐼]−
1−𝛼𝛼𝐼𝐼𝜈𝜈𝑚𝑚,𝐼𝐼𝐼𝐼 (6)
𝑄𝑄𝑡𝑡 = 𝐴𝐴𝑄𝑄𝑙𝑙𝑄𝑄,𝑡𝑡𝛼𝛼𝑄𝑄[(1 −𝛹𝛹𝑄𝑄)𝑘𝑘𝑄𝑄,𝑡𝑡
−𝜈𝜈𝑄𝑄 + 𝛹𝛹𝑄𝑄ℎ𝑡𝑡−𝜈𝜈𝑄𝑄]−
1−𝛼𝛼𝑄𝑄𝜈𝜈𝑄𝑄,𝑄𝑄𝑄𝑄 (7)
𝑅𝑅𝑡𝑡 = 𝐴𝐴𝑅𝑅𝑙𝑙𝑅𝑅,𝑡𝑡𝛼𝛼𝑅𝑅[(1 −𝛹𝛹𝑅𝑅)𝑘𝑘𝑅𝑅,𝑡𝑡
−𝜈𝜈𝑅𝑅 + 𝛹𝛹𝑅𝑅𝑧𝑧𝑡𝑡−𝜈𝜈𝑅𝑅]−
1−𝛼𝛼𝑅𝑅𝜈𝜈𝑅𝑅,𝑅𝑅𝑅𝑅 (8)
𝜈𝜈𝑚𝑚,𝐺𝐺
vte
ln 𝑣𝑣𝑡𝑡𝑒𝑒 = ′𝛺𝛺𝑣𝑣 + ω ln 𝑣𝑣𝑡𝑡−1𝑒𝑒 + 𝜂𝜂𝑡𝑡𝑂𝑂 (9) Ώ𝑣𝑣 (𝜂𝜂𝑡𝑡𝑂𝑂) 𝑈𝑈(𝑐𝑐𝑡𝑡𝐴𝐴, 𝑙𝑙𝑡𝑡) = 𝜑𝜑 𝑙𝑙𝑙𝑙𝑔𝑔 𝐶𝐶𝑡𝑡𝐴𝐴 + (1 − 𝜑𝜑)𝑙𝑙𝑙𝑙𝑔𝑔 (1 − 𝑙𝑙𝑡𝑡) (10)
𝐶𝐶𝑡𝑡𝐴𝐴 = 𝑋𝑋𝑡𝑡𝛾𝛾(𝜃𝜃𝑐𝑐𝑡𝑡
𝜌𝜌 + (1 − 𝜃𝜃)𝑒𝑒𝑡𝑡𝜌𝜌)
1−𝛾𝛾𝜌𝜌 (11)
𝑘𝑘𝑡𝑡+1 + 𝑐𝑐𝑡𝑡 + 𝑛𝑛.𝑋𝑋𝑡𝑡 + 𝑞𝑞𝑡𝑡𝑒𝑒. 𝑒𝑒𝑡𝑡 = (1 − 𝜏𝜏𝑙𝑙).𝑤𝑤𝑡𝑡 . 𝑙𝑙𝑡𝑡 + ъ + (1 − 𝜏𝜏𝑘𝑘). 𝑟𝑟𝑡𝑡 .𝑘𝑘𝑡𝑡 + (1 − 𝛿𝛿)𝑘𝑘𝑡𝑡 + 𝜋𝜋
𝐿𝐿 = ∑ 𝛽𝛽𝑡𝑡[(𝜑𝜑 𝑙𝑙𝑙𝑙𝑔𝑔 [𝑋𝑋𝑡𝑡𝛾𝛾(𝜃𝜃𝑐𝑐𝑡𝑡
𝜌𝜌 + (1 − 𝜃𝜃)𝑒𝑒𝑡𝑡𝜌𝜌)
1−𝛾𝛾𝜌𝜌 ]) + (1 − 𝜑𝜑) 𝑙𝑙𝑙𝑙𝑔𝑔(1 − 𝑙𝑙𝑡𝑡)] −∞
𝑡𝑡=0 𝜆𝜆𝑡𝑡[𝑘𝑘𝑡𝑡+1 + 𝑐𝑐𝑡𝑡 +𝑛𝑛.𝑋𝑋𝑡𝑡 + 𝑞𝑞𝑡𝑡𝑒𝑒. 𝑒𝑒𝑡𝑡 − (1 − 𝜏𝜏𝑙𝑙).𝑤𝑤𝑡𝑡 . 𝑙𝑙𝑡𝑡 − ъ − (1 − 𝜏𝜏𝑘𝑘). 𝑟𝑟𝑡𝑡 .𝑘𝑘𝑡𝑡 − (1 − 𝛿𝛿)𝑘𝑘𝑡𝑡] (13)
𝑐𝑐𝐺𝐺,𝑡𝑡 = 𝑤𝑤𝑡𝑡 . 𝑙𝑙𝐺𝐺,𝑡𝑡 + 𝑟𝑟𝑡𝑡 .𝑘𝑘𝐺𝐺,𝑡𝑡 + 𝑣𝑣𝑚𝑚.𝑚𝑚𝐺𝐺,𝑡𝑡 − 𝑃𝑃𝐺𝐺𝐴𝐴𝐺𝐺𝑙𝑙𝑡𝑡𝛼𝛼𝐺𝐺 [(1 −𝛹𝛹𝐺𝐺)𝑘𝑘𝐺𝐺,𝑡𝑡
−𝜈𝜈𝑚𝑚,𝐺𝐺 + 𝛹𝛹𝐺𝐺𝑚𝑚𝐺𝐺,𝑡𝑡−𝜈𝜈𝑚𝑚,𝐺𝐺]
− 1−𝛼𝛼𝐺𝐺𝜈𝜈𝑚𝑚,𝐺𝐺𝐺𝐺 (14)
𝑏𝑏 = 𝑃𝑃𝐺𝐺 .𝐺𝐺𝑡𝑡 + 𝑃𝑃𝐼𝐼 . 𝐼𝐼𝑡𝑡 + 𝑃𝑃𝑄𝑄.𝑄𝑄𝑡𝑡 − 𝑞𝑞𝑒𝑒. 𝑒𝑒𝑡𝑡 − 𝑞𝑞𝑠𝑠. 𝑠𝑠𝑡𝑡 − 𝑞𝑞𝑔𝑔.𝑔𝑔𝑡𝑡 (15)
(3)
13 For more details, see BPDP (2020). 14 Delpiazzo, Parrado, and Standardi (2015) assess the possible benefits of phasing out fossil fuel subsidies around the world.
Coady, Parry, and Shang (2017) and GSI (2019) review the literature on the environmental and economic benefits of fossil fuel subsidies removal in different countries.
15 For more details, see Byron and Alam (2020).16 CES production with DRS has been used in some of the standard DSGE literature (Rotemberg and Woodford 1996; Jaaskela
and Nimrak 2011).

132
PROSPECTS FOR TRANSITIONING FROM A LINEAR TO CIRCULAR ECONOMY IN DEVELOPING ASIA
All firms, except for the government, are profit-maximizing price takers:
𝜋𝜋𝑖𝑖,𝑡𝑡 = max𝑃𝑃𝑡𝑡𝑖𝑖𝐴𝐴𝑖𝑖𝑙𝑙𝑖𝑖,𝑡𝑡𝛼𝛼𝑖𝑖[(1 −𝛹𝛹𝑖𝑖)𝑘𝑘𝑖𝑖,𝑡𝑡−𝜈𝜈
𝑗𝑗 + 𝛹𝛹𝑖𝑖𝑗𝑗𝑖𝑖,𝑡𝑡−𝜈𝜈𝑗𝑗]−
1−𝛼𝛼𝑖𝑖ύjj − 𝑟𝑟𝑡𝑡𝑘𝑘𝑖𝑖,𝑡𝑡 − 𝑤𝑤𝑡𝑡𝑙𝑙𝑖𝑖,𝑡𝑡 − 𝑣𝑣𝑗𝑗𝑗𝑗𝑖𝑖,𝑡𝑡 (4)
(4)
where Pti, wt, rt, and vj denote the output price, wage rate, the interest rate, and the electricity price,
respectively. Wage and interest rates are assumed to be equalized across all the sectors. The final goods price, Pt
Y, is normalized to 1.
8.4.2 Electricity Generation Sector
As in Amin (2015), we use a CES production function for electricity generation. Our sectors are (i) the government sector (G), using natural gas to produce electricity; (ii) the private independent power producers (I), using natural gas in electricity production; (iii) the privately owned quick rentals (Q), using oil to produce electricity; and (iv) the WTE power plant (R), employing waste.17 Each firm uses labor, capital, and energy (natural gas, m, oil, h and waste, z) in electricity generation:
𝐹𝐹𝑖𝑖(𝑙𝑙𝑖𝑖,𝑡𝑡 ,𝑘𝑘𝑖𝑖,𝑡𝑡 , 𝑗𝑗𝑖𝑖,𝑡𝑡) = 𝐴𝐴𝑖𝑖𝑙𝑙𝑖𝑖,𝑡𝑡𝛼𝛼𝑖𝑖[(1 −𝛹𝛹𝑖𝑖)𝑘𝑘𝑖𝑖,𝑡𝑡−𝜈𝜈
𝑗𝑗 + 𝛹𝛹𝑖𝑖𝑗𝑗𝑖𝑖,𝑡𝑡−𝜈𝜈𝑗𝑗]−
(1−𝛼𝛼𝑖𝑖)ύ𝑗𝑗𝑗𝑗 (1)
1 1+νj ύ
𝑗𝑗𝑗𝑗 𝜈𝜈𝑗𝑗ύ𝑗𝑗𝑗𝑗<1
𝑌𝑌𝑡𝑡 = 𝐴𝐴𝑡𝑡𝑌𝑌𝑙𝑙𝑌𝑌,𝑡𝑡𝛼𝛼𝑌𝑌[(1 −𝛹𝛹𝑌𝑌)𝑘𝑘𝑌𝑌,𝑡𝑡
−𝜈𝜈𝑔𝑔 + 𝛹𝛹𝑌𝑌𝑔𝑔𝑡𝑡−𝜈𝜈𝑔𝑔]−
1−α𝑌𝑌ύ𝑔𝑔𝑔𝑔 (2)
𝑋𝑋𝑡𝑡 = 𝑙𝑙𝑋𝑋,𝑡𝑡𝛼𝛼𝑋𝑋[(1 −𝛹𝛹𝑋𝑋)𝑘𝑘𝑋𝑋,𝑡𝑡
−𝜈𝜈𝑠𝑠 + 𝛹𝛹𝑋𝑋𝑠𝑠𝑡𝑡−𝜈𝜈𝑠𝑠]−
1−𝛼𝛼𝑋𝑋ύ𝑠𝑠𝑠𝑠 (3)
𝜋𝜋𝑖𝑖,𝑡𝑡 = max𝑃𝑃𝑡𝑡𝑖𝑖𝐴𝐴𝑖𝑖𝑙𝑙𝑖𝑖,𝑡𝑡𝛼𝛼𝑖𝑖[(1 −𝛹𝛹𝑖𝑖)𝑘𝑘𝑖𝑖,𝑡𝑡−𝜈𝜈
𝑗𝑗 + 𝛹𝛹𝑖𝑖𝑗𝑗𝑖𝑖,𝑡𝑡−𝜈𝜈𝑗𝑗]−
1−𝛼𝛼𝑖𝑖ύjj − 𝑟𝑟𝑡𝑡𝑘𝑘𝑖𝑖,𝑡𝑡 − 𝑤𝑤𝑡𝑡𝑙𝑙𝑖𝑖,𝑡𝑡 − 𝑣𝑣𝑗𝑗 𝑗𝑗𝑖𝑖,𝑡𝑡 (4)
PtY
𝐺𝐺𝑡𝑡 = 𝐴𝐴𝐺𝐺𝑙𝑙𝐺𝐺,𝑡𝑡𝛼𝛼𝐺𝐺[(1 −𝛹𝛹𝐺𝐺)𝑘𝑘𝐺𝐺,𝑡𝑡
−𝜈𝜈𝑚𝑚,𝐺𝐺 + 𝛹𝛹𝐺𝐺𝑚𝑚𝐺𝐺,𝑡𝑡−𝜈𝜈𝑚𝑚,𝐺𝐺]−
1−𝛼𝛼𝐺𝐺𝜈𝜈𝑚𝑚,𝐺𝐺𝐺𝐺 (5)
𝐼𝐼𝑡𝑡 = 𝐴𝐴𝐼𝐼𝑙𝑙𝐼𝐼,𝑡𝑡𝛼𝛼𝐼𝐼[(1 −𝛹𝛹𝐼𝐼)𝑘𝑘𝐼𝐼,𝑡𝑡
−𝜈𝜈𝑚𝑚,𝐼𝐼 + 𝛹𝛹𝐼𝐼𝑚𝑚𝐼𝐼,𝑡𝑡−𝜈𝜈𝑚𝑚,𝐼𝐼]−
1−𝛼𝛼𝐼𝐼𝜈𝜈𝑚𝑚,𝐼𝐼𝐼𝐼 (6)
𝑄𝑄𝑡𝑡 = 𝐴𝐴𝑄𝑄𝑙𝑙𝑄𝑄,𝑡𝑡𝛼𝛼𝑄𝑄[(1 −𝛹𝛹𝑄𝑄)𝑘𝑘𝑄𝑄,𝑡𝑡
−𝜈𝜈𝑄𝑄 + 𝛹𝛹𝑄𝑄ℎ𝑡𝑡−𝜈𝜈𝑄𝑄]−
1−𝛼𝛼𝑄𝑄𝜈𝜈𝑄𝑄,𝑄𝑄𝑄𝑄 (7)
𝑅𝑅𝑡𝑡 = 𝐴𝐴𝑅𝑅𝑙𝑙𝑅𝑅,𝑡𝑡𝛼𝛼𝑅𝑅[(1 −𝛹𝛹𝑅𝑅)𝑘𝑘𝑅𝑅,𝑡𝑡
−𝜈𝜈𝑅𝑅 + 𝛹𝛹𝑅𝑅𝑧𝑧𝑡𝑡−𝜈𝜈𝑅𝑅]−
1−𝛼𝛼𝑅𝑅𝜈𝜈𝑅𝑅,𝑅𝑅𝑅𝑅 (8)
𝜈𝜈𝑚𝑚,𝐺𝐺
vte
ln 𝑣𝑣𝑡𝑡𝑒𝑒 = ′𝛺𝛺𝑣𝑣 + ω ln 𝑣𝑣𝑡𝑡−1𝑒𝑒 + 𝜂𝜂𝑡𝑡𝑂𝑂 (9) Ώ𝑣𝑣 (𝜂𝜂𝑡𝑡𝑂𝑂) 𝑈𝑈(𝑐𝑐𝑡𝑡𝐴𝐴, 𝑙𝑙𝑡𝑡) = 𝜑𝜑 𝑙𝑙𝑙𝑙𝑔𝑔 𝐶𝐶𝑡𝑡𝐴𝐴 + (1 − 𝜑𝜑)𝑙𝑙𝑙𝑙𝑔𝑔 (1 − 𝑙𝑙𝑡𝑡) (10)
𝐶𝐶𝑡𝑡𝐴𝐴 = 𝑋𝑋𝑡𝑡𝛾𝛾(𝜃𝜃𝑐𝑐𝑡𝑡
𝜌𝜌 + (1 − 𝜃𝜃)𝑒𝑒𝑡𝑡𝜌𝜌)
1−𝛾𝛾𝜌𝜌 (11)
𝑘𝑘𝑡𝑡+1 + 𝑐𝑐𝑡𝑡 + 𝑛𝑛.𝑋𝑋𝑡𝑡 + 𝑞𝑞𝑡𝑡𝑒𝑒. 𝑒𝑒𝑡𝑡 = (1 − 𝜏𝜏𝑙𝑙).𝑤𝑤𝑡𝑡 . 𝑙𝑙𝑡𝑡 + ъ + (1 − 𝜏𝜏𝑘𝑘). 𝑟𝑟𝑡𝑡 .𝑘𝑘𝑡𝑡 + (1 − 𝛿𝛿)𝑘𝑘𝑡𝑡 + 𝜋𝜋
𝐿𝐿 = ∑ 𝛽𝛽𝑡𝑡[(𝜑𝜑 𝑙𝑙𝑙𝑙𝑔𝑔 [𝑋𝑋𝑡𝑡𝛾𝛾(𝜃𝜃𝑐𝑐𝑡𝑡
𝜌𝜌 + (1 − 𝜃𝜃)𝑒𝑒𝑡𝑡𝜌𝜌)
1−𝛾𝛾𝜌𝜌 ]) + (1 − 𝜑𝜑) 𝑙𝑙𝑙𝑙𝑔𝑔(1 − 𝑙𝑙𝑡𝑡)] −∞
𝑡𝑡=0 𝜆𝜆𝑡𝑡[𝑘𝑘𝑡𝑡+1 + 𝑐𝑐𝑡𝑡 +𝑛𝑛.𝑋𝑋𝑡𝑡 + 𝑞𝑞𝑡𝑡𝑒𝑒. 𝑒𝑒𝑡𝑡 − (1 − 𝜏𝜏𝑙𝑙).𝑤𝑤𝑡𝑡 . 𝑙𝑙𝑡𝑡 − ъ − (1 − 𝜏𝜏𝑘𝑘). 𝑟𝑟𝑡𝑡 .𝑘𝑘𝑡𝑡 − (1 − 𝛿𝛿)𝑘𝑘𝑡𝑡] (13)
𝑐𝑐𝐺𝐺,𝑡𝑡 = 𝑤𝑤𝑡𝑡 . 𝑙𝑙𝐺𝐺,𝑡𝑡 + 𝑟𝑟𝑡𝑡 .𝑘𝑘𝐺𝐺,𝑡𝑡 + 𝑣𝑣𝑚𝑚.𝑚𝑚𝐺𝐺,𝑡𝑡 − 𝑃𝑃𝐺𝐺𝐴𝐴𝐺𝐺𝑙𝑙𝑡𝑡𝛼𝛼𝐺𝐺 [(1 −𝛹𝛹𝐺𝐺)𝑘𝑘𝐺𝐺,𝑡𝑡
−𝜈𝜈𝑚𝑚,𝐺𝐺 + 𝛹𝛹𝐺𝐺𝑚𝑚𝐺𝐺,𝑡𝑡−𝜈𝜈𝑚𝑚,𝐺𝐺]
− 1−𝛼𝛼𝐺𝐺𝜈𝜈𝑚𝑚,𝐺𝐺𝐺𝐺 (14)
𝑏𝑏 = 𝑃𝑃𝐺𝐺 .𝐺𝐺𝑡𝑡 + 𝑃𝑃𝐼𝐼 . 𝐼𝐼𝑡𝑡 + 𝑃𝑃𝑄𝑄.𝑄𝑄𝑡𝑡 − 𝑞𝑞𝑒𝑒. 𝑒𝑒𝑡𝑡 − 𝑞𝑞𝑠𝑠. 𝑠𝑠𝑡𝑡 − 𝑞𝑞𝑔𝑔.𝑔𝑔𝑡𝑡 (15)
(5)
𝐹𝐹𝑖𝑖(𝑙𝑙𝑖𝑖,𝑡𝑡 ,𝑘𝑘𝑖𝑖,𝑡𝑡 , 𝑗𝑗𝑖𝑖,𝑡𝑡) = 𝐴𝐴𝑖𝑖𝑙𝑙𝑖𝑖,𝑡𝑡𝛼𝛼𝑖𝑖[(1 −𝛹𝛹𝑖𝑖)𝑘𝑘𝑖𝑖,𝑡𝑡−𝜈𝜈
𝑗𝑗 + 𝛹𝛹𝑖𝑖𝑗𝑗𝑖𝑖,𝑡𝑡−𝜈𝜈𝑗𝑗]−
(1−𝛼𝛼𝑖𝑖)ύ𝑗𝑗𝑗𝑗 (1)
1 1+νj ύ
𝑗𝑗𝑗𝑗 𝜈𝜈𝑗𝑗ύ𝑗𝑗𝑗𝑗<1
𝑌𝑌𝑡𝑡 = 𝐴𝐴𝑡𝑡𝑌𝑌𝑙𝑙𝑌𝑌,𝑡𝑡𝛼𝛼𝑌𝑌[(1 −𝛹𝛹𝑌𝑌)𝑘𝑘𝑌𝑌,𝑡𝑡
−𝜈𝜈𝑔𝑔 + 𝛹𝛹𝑌𝑌𝑔𝑔𝑡𝑡−𝜈𝜈𝑔𝑔]−
1−α𝑌𝑌ύ𝑔𝑔𝑔𝑔 (2)
𝑋𝑋𝑡𝑡 = 𝑙𝑙𝑋𝑋,𝑡𝑡𝛼𝛼𝑋𝑋[(1 −𝛹𝛹𝑋𝑋)𝑘𝑘𝑋𝑋,𝑡𝑡
−𝜈𝜈𝑠𝑠 + 𝛹𝛹𝑋𝑋𝑠𝑠𝑡𝑡−𝜈𝜈𝑠𝑠]−
1−𝛼𝛼𝑋𝑋ύ𝑠𝑠𝑠𝑠 (3)
𝜋𝜋𝑖𝑖,𝑡𝑡 = max𝑃𝑃𝑡𝑡𝑖𝑖𝐴𝐴𝑖𝑖𝑙𝑙𝑖𝑖,𝑡𝑡𝛼𝛼𝑖𝑖[(1 −𝛹𝛹𝑖𝑖)𝑘𝑘𝑖𝑖,𝑡𝑡−𝜈𝜈
𝑗𝑗 + 𝛹𝛹𝑖𝑖𝑗𝑗𝑖𝑖,𝑡𝑡−𝜈𝜈𝑗𝑗]−
1−𝛼𝛼𝑖𝑖ύjj − 𝑟𝑟𝑡𝑡𝑘𝑘𝑖𝑖,𝑡𝑡 − 𝑤𝑤𝑡𝑡𝑙𝑙𝑖𝑖,𝑡𝑡 − 𝑣𝑣𝑗𝑗 𝑗𝑗𝑖𝑖,𝑡𝑡 (4)
PtY
𝐺𝐺𝑡𝑡 = 𝐴𝐴𝐺𝐺𝑙𝑙𝐺𝐺,𝑡𝑡𝛼𝛼𝐺𝐺[(1 −𝛹𝛹𝐺𝐺)𝑘𝑘𝐺𝐺,𝑡𝑡
−𝜈𝜈𝑚𝑚,𝐺𝐺 + 𝛹𝛹𝐺𝐺𝑚𝑚𝐺𝐺,𝑡𝑡−𝜈𝜈𝑚𝑚,𝐺𝐺]−
1−𝛼𝛼𝐺𝐺𝜈𝜈𝑚𝑚,𝐺𝐺𝐺𝐺 (5)
𝐼𝐼𝑡𝑡 = 𝐴𝐴𝐼𝐼𝑙𝑙𝐼𝐼,𝑡𝑡𝛼𝛼𝐼𝐼[(1 −𝛹𝛹𝐼𝐼)𝑘𝑘𝐼𝐼,𝑡𝑡
−𝜈𝜈𝑚𝑚,𝐼𝐼 + 𝛹𝛹𝐼𝐼𝑚𝑚𝐼𝐼,𝑡𝑡−𝜈𝜈𝑚𝑚,𝐼𝐼]−
1−𝛼𝛼𝐼𝐼𝜈𝜈𝑚𝑚,𝐼𝐼𝐼𝐼 (6)
𝑄𝑄𝑡𝑡 = 𝐴𝐴𝑄𝑄𝑙𝑙𝑄𝑄,𝑡𝑡𝛼𝛼𝑄𝑄[(1 −𝛹𝛹𝑄𝑄)𝑘𝑘𝑄𝑄,𝑡𝑡
−𝜈𝜈𝑄𝑄 + 𝛹𝛹𝑄𝑄ℎ𝑡𝑡−𝜈𝜈𝑄𝑄]−
1−𝛼𝛼𝑄𝑄𝜈𝜈𝑄𝑄,𝑄𝑄𝑄𝑄 (7)
𝑅𝑅𝑡𝑡 = 𝐴𝐴𝑅𝑅𝑙𝑙𝑅𝑅,𝑡𝑡𝛼𝛼𝑅𝑅[(1 −𝛹𝛹𝑅𝑅)𝑘𝑘𝑅𝑅,𝑡𝑡
−𝜈𝜈𝑅𝑅 + 𝛹𝛹𝑅𝑅𝑧𝑧𝑡𝑡−𝜈𝜈𝑅𝑅]−
1−𝛼𝛼𝑅𝑅𝜈𝜈𝑅𝑅,𝑅𝑅𝑅𝑅 (8)
𝜈𝜈𝑚𝑚,𝐺𝐺
vte
ln 𝑣𝑣𝑡𝑡𝑒𝑒 = ′𝛺𝛺𝑣𝑣 + ω ln 𝑣𝑣𝑡𝑡−1𝑒𝑒 + 𝜂𝜂𝑡𝑡𝑂𝑂 (9) Ώ𝑣𝑣 (𝜂𝜂𝑡𝑡𝑂𝑂) 𝑈𝑈(𝑐𝑐𝑡𝑡𝐴𝐴, 𝑙𝑙𝑡𝑡) = 𝜑𝜑 𝑙𝑙𝑙𝑙𝑔𝑔 𝐶𝐶𝑡𝑡𝐴𝐴 + (1 − 𝜑𝜑)𝑙𝑙𝑙𝑙𝑔𝑔 (1 − 𝑙𝑙𝑡𝑡) (10)
𝐶𝐶𝑡𝑡𝐴𝐴 = 𝑋𝑋𝑡𝑡𝛾𝛾(𝜃𝜃𝑐𝑐𝑡𝑡
𝜌𝜌 + (1 − 𝜃𝜃)𝑒𝑒𝑡𝑡𝜌𝜌)
1−𝛾𝛾𝜌𝜌 (11)
𝑘𝑘𝑡𝑡+1 + 𝑐𝑐𝑡𝑡 + 𝑛𝑛.𝑋𝑋𝑡𝑡 + 𝑞𝑞𝑡𝑡𝑒𝑒. 𝑒𝑒𝑡𝑡 = (1 − 𝜏𝜏𝑙𝑙).𝑤𝑤𝑡𝑡 . 𝑙𝑙𝑡𝑡 + ъ + (1 − 𝜏𝜏𝑘𝑘). 𝑟𝑟𝑡𝑡 .𝑘𝑘𝑡𝑡 + (1 − 𝛿𝛿)𝑘𝑘𝑡𝑡 + 𝜋𝜋
𝐿𝐿 = ∑ 𝛽𝛽𝑡𝑡[(𝜑𝜑 𝑙𝑙𝑙𝑙𝑔𝑔 [𝑋𝑋𝑡𝑡𝛾𝛾(𝜃𝜃𝑐𝑐𝑡𝑡
𝜌𝜌 + (1 − 𝜃𝜃)𝑒𝑒𝑡𝑡𝜌𝜌)
1−𝛾𝛾𝜌𝜌 ]) + (1 − 𝜑𝜑) 𝑙𝑙𝑙𝑙𝑔𝑔(1 − 𝑙𝑙𝑡𝑡)] −∞
𝑡𝑡=0 𝜆𝜆𝑡𝑡[𝑘𝑘𝑡𝑡+1 + 𝑐𝑐𝑡𝑡 +𝑛𝑛.𝑋𝑋𝑡𝑡 + 𝑞𝑞𝑡𝑡𝑒𝑒. 𝑒𝑒𝑡𝑡 − (1 − 𝜏𝜏𝑙𝑙).𝑤𝑤𝑡𝑡 . 𝑙𝑙𝑡𝑡 − ъ − (1 − 𝜏𝜏𝑘𝑘). 𝑟𝑟𝑡𝑡 .𝑘𝑘𝑡𝑡 − (1 − 𝛿𝛿)𝑘𝑘𝑡𝑡] (13)
𝑐𝑐𝐺𝐺,𝑡𝑡 = 𝑤𝑤𝑡𝑡 . 𝑙𝑙𝐺𝐺,𝑡𝑡 + 𝑟𝑟𝑡𝑡 .𝑘𝑘𝐺𝐺,𝑡𝑡 + 𝑣𝑣𝑚𝑚.𝑚𝑚𝐺𝐺,𝑡𝑡 − 𝑃𝑃𝐺𝐺𝐴𝐴𝐺𝐺𝑙𝑙𝑡𝑡𝛼𝛼𝐺𝐺 [(1 −𝛹𝛹𝐺𝐺)𝑘𝑘𝐺𝐺,𝑡𝑡
−𝜈𝜈𝑚𝑚,𝐺𝐺 + 𝛹𝛹𝐺𝐺𝑚𝑚𝐺𝐺,𝑡𝑡−𝜈𝜈𝑚𝑚,𝐺𝐺]
− 1−𝛼𝛼𝐺𝐺𝜈𝜈𝑚𝑚,𝐺𝐺𝐺𝐺 (14)
𝑏𝑏 = 𝑃𝑃𝐺𝐺 .𝐺𝐺𝑡𝑡 + 𝑃𝑃𝐼𝐼 . 𝐼𝐼𝑡𝑡 + 𝑃𝑃𝑄𝑄.𝑄𝑄𝑡𝑡 − 𝑞𝑞𝑒𝑒. 𝑒𝑒𝑡𝑡 − 𝑞𝑞𝑠𝑠. 𝑠𝑠𝑡𝑡 − 𝑞𝑞𝑔𝑔.𝑔𝑔𝑡𝑡 (15)
(6)
𝐹𝐹𝑖𝑖(𝑙𝑙𝑖𝑖,𝑡𝑡 ,𝑘𝑘𝑖𝑖,𝑡𝑡 , 𝑗𝑗𝑖𝑖,𝑡𝑡) = 𝐴𝐴𝑖𝑖𝑙𝑙𝑖𝑖,𝑡𝑡𝛼𝛼𝑖𝑖[(1 −𝛹𝛹𝑖𝑖)𝑘𝑘𝑖𝑖,𝑡𝑡−𝜈𝜈
𝑗𝑗 + 𝛹𝛹𝑖𝑖𝑗𝑗𝑖𝑖,𝑡𝑡−𝜈𝜈𝑗𝑗]−
(1−𝛼𝛼𝑖𝑖)ύ𝑗𝑗𝑗𝑗 (1)
1 1+νj ύ
𝑗𝑗𝑗𝑗 𝜈𝜈𝑗𝑗ύ𝑗𝑗𝑗𝑗<1
𝑌𝑌𝑡𝑡 = 𝐴𝐴𝑡𝑡𝑌𝑌𝑙𝑙𝑌𝑌,𝑡𝑡𝛼𝛼𝑌𝑌[(1 −𝛹𝛹𝑌𝑌)𝑘𝑘𝑌𝑌,𝑡𝑡
−𝜈𝜈𝑔𝑔 + 𝛹𝛹𝑌𝑌𝑔𝑔𝑡𝑡−𝜈𝜈𝑔𝑔]−
1−α𝑌𝑌ύ𝑔𝑔𝑔𝑔 (2)
𝑋𝑋𝑡𝑡 = 𝑙𝑙𝑋𝑋,𝑡𝑡𝛼𝛼𝑋𝑋[(1 −𝛹𝛹𝑋𝑋)𝑘𝑘𝑋𝑋,𝑡𝑡
−𝜈𝜈𝑠𝑠 + 𝛹𝛹𝑋𝑋𝑠𝑠𝑡𝑡−𝜈𝜈𝑠𝑠]−
1−𝛼𝛼𝑋𝑋ύ𝑠𝑠𝑠𝑠 (3)
𝜋𝜋𝑖𝑖,𝑡𝑡 = max𝑃𝑃𝑡𝑡𝑖𝑖𝐴𝐴𝑖𝑖𝑙𝑙𝑖𝑖,𝑡𝑡𝛼𝛼𝑖𝑖[(1 −𝛹𝛹𝑖𝑖)𝑘𝑘𝑖𝑖,𝑡𝑡−𝜈𝜈
𝑗𝑗 + 𝛹𝛹𝑖𝑖𝑗𝑗𝑖𝑖,𝑡𝑡−𝜈𝜈𝑗𝑗]−
1−𝛼𝛼𝑖𝑖ύjj − 𝑟𝑟𝑡𝑡𝑘𝑘𝑖𝑖,𝑡𝑡 − 𝑤𝑤𝑡𝑡𝑙𝑙𝑖𝑖,𝑡𝑡 − 𝑣𝑣𝑗𝑗 𝑗𝑗𝑖𝑖,𝑡𝑡 (4)
PtY
𝐺𝐺𝑡𝑡 = 𝐴𝐴𝐺𝐺𝑙𝑙𝐺𝐺,𝑡𝑡𝛼𝛼𝐺𝐺[(1 −𝛹𝛹𝐺𝐺)𝑘𝑘𝐺𝐺,𝑡𝑡
−𝜈𝜈𝑚𝑚,𝐺𝐺 + 𝛹𝛹𝐺𝐺𝑚𝑚𝐺𝐺,𝑡𝑡−𝜈𝜈𝑚𝑚,𝐺𝐺]−
1−𝛼𝛼𝐺𝐺𝜈𝜈𝑚𝑚,𝐺𝐺𝐺𝐺 (5)
𝐼𝐼𝑡𝑡 = 𝐴𝐴𝐼𝐼𝑙𝑙𝐼𝐼,𝑡𝑡𝛼𝛼𝐼𝐼[(1 −𝛹𝛹𝐼𝐼)𝑘𝑘𝐼𝐼,𝑡𝑡
−𝜈𝜈𝑚𝑚,𝐼𝐼 + 𝛹𝛹𝐼𝐼𝑚𝑚𝐼𝐼,𝑡𝑡−𝜈𝜈𝑚𝑚,𝐼𝐼]−
1−𝛼𝛼𝐼𝐼𝜈𝜈𝑚𝑚,𝐼𝐼𝐼𝐼 (6)
𝑄𝑄𝑡𝑡 = 𝐴𝐴𝑄𝑄𝑙𝑙𝑄𝑄,𝑡𝑡𝛼𝛼𝑄𝑄[(1 −𝛹𝛹𝑄𝑄)𝑘𝑘𝑄𝑄,𝑡𝑡
−𝜈𝜈𝑄𝑄 + 𝛹𝛹𝑄𝑄ℎ𝑡𝑡−𝜈𝜈𝑄𝑄]−
1−𝛼𝛼𝑄𝑄𝜈𝜈𝑄𝑄,𝑄𝑄𝑄𝑄 (7)
𝑅𝑅𝑡𝑡 = 𝐴𝐴𝑅𝑅𝑙𝑙𝑅𝑅,𝑡𝑡𝛼𝛼𝑅𝑅[(1 −𝛹𝛹𝑅𝑅)𝑘𝑘𝑅𝑅,𝑡𝑡
−𝜈𝜈𝑅𝑅 + 𝛹𝛹𝑅𝑅𝑧𝑧𝑡𝑡−𝜈𝜈𝑅𝑅]−
1−𝛼𝛼𝑅𝑅𝜈𝜈𝑅𝑅,𝑅𝑅𝑅𝑅 (8)
𝜈𝜈𝑚𝑚,𝐺𝐺
vte
ln 𝑣𝑣𝑡𝑡𝑒𝑒 = ′𝛺𝛺𝑣𝑣 + ω ln 𝑣𝑣𝑡𝑡−1𝑒𝑒 + 𝜂𝜂𝑡𝑡𝑂𝑂 (9) Ώ𝑣𝑣 (𝜂𝜂𝑡𝑡𝑂𝑂) 𝑈𝑈(𝑐𝑐𝑡𝑡𝐴𝐴, 𝑙𝑙𝑡𝑡) = 𝜑𝜑 𝑙𝑙𝑙𝑙𝑔𝑔 𝐶𝐶𝑡𝑡𝐴𝐴 + (1 − 𝜑𝜑)𝑙𝑙𝑙𝑙𝑔𝑔 (1 − 𝑙𝑙𝑡𝑡) (10)
𝐶𝐶𝑡𝑡𝐴𝐴 = 𝑋𝑋𝑡𝑡𝛾𝛾(𝜃𝜃𝑐𝑐𝑡𝑡
𝜌𝜌 + (1 − 𝜃𝜃)𝑒𝑒𝑡𝑡𝜌𝜌)
1−𝛾𝛾𝜌𝜌 (11)
𝑘𝑘𝑡𝑡+1 + 𝑐𝑐𝑡𝑡 + 𝑛𝑛.𝑋𝑋𝑡𝑡 + 𝑞𝑞𝑡𝑡𝑒𝑒. 𝑒𝑒𝑡𝑡 = (1 − 𝜏𝜏𝑙𝑙).𝑤𝑤𝑡𝑡 . 𝑙𝑙𝑡𝑡 + ъ + (1 − 𝜏𝜏𝑘𝑘). 𝑟𝑟𝑡𝑡 .𝑘𝑘𝑡𝑡 + (1 − 𝛿𝛿)𝑘𝑘𝑡𝑡 + 𝜋𝜋
𝐿𝐿 = ∑ 𝛽𝛽𝑡𝑡[(𝜑𝜑 𝑙𝑙𝑙𝑙𝑔𝑔 [𝑋𝑋𝑡𝑡𝛾𝛾(𝜃𝜃𝑐𝑐𝑡𝑡
𝜌𝜌 + (1 − 𝜃𝜃)𝑒𝑒𝑡𝑡𝜌𝜌)
1−𝛾𝛾𝜌𝜌 ]) + (1 − 𝜑𝜑) 𝑙𝑙𝑙𝑙𝑔𝑔(1 − 𝑙𝑙𝑡𝑡)] −∞
𝑡𝑡=0 𝜆𝜆𝑡𝑡[𝑘𝑘𝑡𝑡+1 + 𝑐𝑐𝑡𝑡 +𝑛𝑛.𝑋𝑋𝑡𝑡 + 𝑞𝑞𝑡𝑡𝑒𝑒. 𝑒𝑒𝑡𝑡 − (1 − 𝜏𝜏𝑙𝑙).𝑤𝑤𝑡𝑡 . 𝑙𝑙𝑡𝑡 − ъ − (1 − 𝜏𝜏𝑘𝑘). 𝑟𝑟𝑡𝑡 .𝑘𝑘𝑡𝑡 − (1 − 𝛿𝛿)𝑘𝑘𝑡𝑡] (13)
𝑐𝑐𝐺𝐺,𝑡𝑡 = 𝑤𝑤𝑡𝑡 . 𝑙𝑙𝐺𝐺,𝑡𝑡 + 𝑟𝑟𝑡𝑡 .𝑘𝑘𝐺𝐺,𝑡𝑡 + 𝑣𝑣𝑚𝑚.𝑚𝑚𝐺𝐺,𝑡𝑡 − 𝑃𝑃𝐺𝐺𝐴𝐴𝐺𝐺𝑙𝑙𝑡𝑡𝛼𝛼𝐺𝐺 [(1 −𝛹𝛹𝐺𝐺)𝑘𝑘𝐺𝐺,𝑡𝑡
−𝜈𝜈𝑚𝑚,𝐺𝐺 + 𝛹𝛹𝐺𝐺𝑚𝑚𝐺𝐺,𝑡𝑡−𝜈𝜈𝑚𝑚,𝐺𝐺]
− 1−𝛼𝛼𝐺𝐺𝜈𝜈𝑚𝑚,𝐺𝐺𝐺𝐺 (14)
𝑏𝑏 = 𝑃𝑃𝐺𝐺 .𝐺𝐺𝑡𝑡 + 𝑃𝑃𝐼𝐼 . 𝐼𝐼𝑡𝑡 + 𝑃𝑃𝑄𝑄.𝑄𝑄𝑡𝑡 − 𝑞𝑞𝑒𝑒. 𝑒𝑒𝑡𝑡 − 𝑞𝑞𝑠𝑠. 𝑠𝑠𝑡𝑡 − 𝑞𝑞𝑔𝑔.𝑔𝑔𝑡𝑡 (15)
(7)
𝐹𝐹𝑖𝑖(𝑙𝑙𝑖𝑖,𝑡𝑡 ,𝑘𝑘𝑖𝑖,𝑡𝑡 , 𝑗𝑗𝑖𝑖,𝑡𝑡) = 𝐴𝐴𝑖𝑖𝑙𝑙𝑖𝑖,𝑡𝑡𝛼𝛼𝑖𝑖[(1 −𝛹𝛹𝑖𝑖)𝑘𝑘𝑖𝑖,𝑡𝑡−𝜈𝜈
𝑗𝑗 + 𝛹𝛹𝑖𝑖𝑗𝑗𝑖𝑖,𝑡𝑡−𝜈𝜈𝑗𝑗]−
(1−𝛼𝛼𝑖𝑖)ύ𝑗𝑗𝑗𝑗 (1)
1 1+νj ύ
𝑗𝑗𝑗𝑗 𝜈𝜈𝑗𝑗ύ𝑗𝑗𝑗𝑗<1
𝑌𝑌𝑡𝑡 = 𝐴𝐴𝑡𝑡𝑌𝑌𝑙𝑙𝑌𝑌,𝑡𝑡𝛼𝛼𝑌𝑌[(1 −𝛹𝛹𝑌𝑌)𝑘𝑘𝑌𝑌,𝑡𝑡
−𝜈𝜈𝑔𝑔 + 𝛹𝛹𝑌𝑌𝑔𝑔𝑡𝑡−𝜈𝜈𝑔𝑔]−
1−α𝑌𝑌ύ𝑔𝑔𝑔𝑔 (2)
𝑋𝑋𝑡𝑡 = 𝑙𝑙𝑋𝑋,𝑡𝑡𝛼𝛼𝑋𝑋[(1 −𝛹𝛹𝑋𝑋)𝑘𝑘𝑋𝑋,𝑡𝑡
−𝜈𝜈𝑠𝑠 + 𝛹𝛹𝑋𝑋𝑠𝑠𝑡𝑡−𝜈𝜈𝑠𝑠]−
1−𝛼𝛼𝑋𝑋ύ𝑠𝑠𝑠𝑠 (3)
𝜋𝜋𝑖𝑖,𝑡𝑡 = max𝑃𝑃𝑡𝑡𝑖𝑖𝐴𝐴𝑖𝑖𝑙𝑙𝑖𝑖,𝑡𝑡𝛼𝛼𝑖𝑖[(1 −𝛹𝛹𝑖𝑖)𝑘𝑘𝑖𝑖,𝑡𝑡−𝜈𝜈
𝑗𝑗 + 𝛹𝛹𝑖𝑖𝑗𝑗𝑖𝑖,𝑡𝑡−𝜈𝜈𝑗𝑗]−
1−𝛼𝛼𝑖𝑖ύjj − 𝑟𝑟𝑡𝑡𝑘𝑘𝑖𝑖,𝑡𝑡 − 𝑤𝑤𝑡𝑡𝑙𝑙𝑖𝑖,𝑡𝑡 − 𝑣𝑣𝑗𝑗 𝑗𝑗𝑖𝑖,𝑡𝑡 (4)
PtY
𝐺𝐺𝑡𝑡 = 𝐴𝐴𝐺𝐺𝑙𝑙𝐺𝐺,𝑡𝑡𝛼𝛼𝐺𝐺[(1 −𝛹𝛹𝐺𝐺)𝑘𝑘𝐺𝐺,𝑡𝑡
−𝜈𝜈𝑚𝑚,𝐺𝐺 + 𝛹𝛹𝐺𝐺𝑚𝑚𝐺𝐺,𝑡𝑡−𝜈𝜈𝑚𝑚,𝐺𝐺]−
1−𝛼𝛼𝐺𝐺𝜈𝜈𝑚𝑚,𝐺𝐺𝐺𝐺 (5)
𝐼𝐼𝑡𝑡 = 𝐴𝐴𝐼𝐼𝑙𝑙𝐼𝐼,𝑡𝑡𝛼𝛼𝐼𝐼[(1 −𝛹𝛹𝐼𝐼)𝑘𝑘𝐼𝐼,𝑡𝑡
−𝜈𝜈𝑚𝑚,𝐼𝐼 + 𝛹𝛹𝐼𝐼𝑚𝑚𝐼𝐼,𝑡𝑡−𝜈𝜈𝑚𝑚,𝐼𝐼]−
1−𝛼𝛼𝐼𝐼𝜈𝜈𝑚𝑚,𝐼𝐼𝐼𝐼 (6)
𝑄𝑄𝑡𝑡 = 𝐴𝐴𝑄𝑄𝑙𝑙𝑄𝑄,𝑡𝑡𝛼𝛼𝑄𝑄[(1 −𝛹𝛹𝑄𝑄)𝑘𝑘𝑄𝑄,𝑡𝑡
−𝜈𝜈𝑄𝑄 + 𝛹𝛹𝑄𝑄ℎ𝑡𝑡−𝜈𝜈𝑄𝑄]−
1−𝛼𝛼𝑄𝑄𝜈𝜈𝑄𝑄,𝑄𝑄𝑄𝑄 (7)
𝑅𝑅𝑡𝑡 = 𝐴𝐴𝑅𝑅𝑙𝑙𝑅𝑅,𝑡𝑡𝛼𝛼𝑅𝑅[(1 −𝛹𝛹𝑅𝑅)𝑘𝑘𝑅𝑅,𝑡𝑡
−𝜈𝜈𝑅𝑅 + 𝛹𝛹𝑅𝑅𝑧𝑧𝑡𝑡−𝜈𝜈𝑅𝑅]−
1−𝛼𝛼𝑅𝑅𝜈𝜈𝑅𝑅,𝑅𝑅𝑅𝑅 (8)
𝜈𝜈𝑚𝑚,𝐺𝐺
vte
ln 𝑣𝑣𝑡𝑡𝑒𝑒 = ′𝛺𝛺𝑣𝑣 + ω ln 𝑣𝑣𝑡𝑡−1𝑒𝑒 + 𝜂𝜂𝑡𝑡𝑂𝑂 (9) Ώ𝑣𝑣 (𝜂𝜂𝑡𝑡𝑂𝑂) 𝑈𝑈(𝑐𝑐𝑡𝑡𝐴𝐴, 𝑙𝑙𝑡𝑡) = 𝜑𝜑 𝑙𝑙𝑙𝑙𝑔𝑔 𝐶𝐶𝑡𝑡𝐴𝐴 + (1 − 𝜑𝜑)𝑙𝑙𝑙𝑙𝑔𝑔 (1 − 𝑙𝑙𝑡𝑡) (10)
𝐶𝐶𝑡𝑡𝐴𝐴 = 𝑋𝑋𝑡𝑡𝛾𝛾(𝜃𝜃𝑐𝑐𝑡𝑡
𝜌𝜌 + (1 − 𝜃𝜃)𝑒𝑒𝑡𝑡𝜌𝜌)
1−𝛾𝛾𝜌𝜌 (11)
𝑘𝑘𝑡𝑡+1 + 𝑐𝑐𝑡𝑡 + 𝑛𝑛.𝑋𝑋𝑡𝑡 + 𝑞𝑞𝑡𝑡𝑒𝑒. 𝑒𝑒𝑡𝑡 = (1 − 𝜏𝜏𝑙𝑙).𝑤𝑤𝑡𝑡 . 𝑙𝑙𝑡𝑡 + ъ + (1 − 𝜏𝜏𝑘𝑘). 𝑟𝑟𝑡𝑡 .𝑘𝑘𝑡𝑡 + (1 − 𝛿𝛿)𝑘𝑘𝑡𝑡 + 𝜋𝜋
𝐿𝐿 = ∑ 𝛽𝛽𝑡𝑡[(𝜑𝜑 𝑙𝑙𝑙𝑙𝑔𝑔 [𝑋𝑋𝑡𝑡𝛾𝛾(𝜃𝜃𝑐𝑐𝑡𝑡
𝜌𝜌 + (1 − 𝜃𝜃)𝑒𝑒𝑡𝑡𝜌𝜌)
1−𝛾𝛾𝜌𝜌 ]) + (1 − 𝜑𝜑) 𝑙𝑙𝑙𝑙𝑔𝑔(1 − 𝑙𝑙𝑡𝑡)] −∞
𝑡𝑡=0 𝜆𝜆𝑡𝑡[𝑘𝑘𝑡𝑡+1 + 𝑐𝑐𝑡𝑡 +𝑛𝑛.𝑋𝑋𝑡𝑡 + 𝑞𝑞𝑡𝑡𝑒𝑒. 𝑒𝑒𝑡𝑡 − (1 − 𝜏𝜏𝑙𝑙).𝑤𝑤𝑡𝑡 . 𝑙𝑙𝑡𝑡 − ъ − (1 − 𝜏𝜏𝑘𝑘). 𝑟𝑟𝑡𝑡 .𝑘𝑘𝑡𝑡 − (1 − 𝛿𝛿)𝑘𝑘𝑡𝑡] (13)
𝑐𝑐𝐺𝐺,𝑡𝑡 = 𝑤𝑤𝑡𝑡 . 𝑙𝑙𝐺𝐺,𝑡𝑡 + 𝑟𝑟𝑡𝑡 .𝑘𝑘𝐺𝐺,𝑡𝑡 + 𝑣𝑣𝑚𝑚.𝑚𝑚𝐺𝐺,𝑡𝑡 − 𝑃𝑃𝐺𝐺𝐴𝐴𝐺𝐺𝑙𝑙𝑡𝑡𝛼𝛼𝐺𝐺 [(1 −𝛹𝛹𝐺𝐺)𝑘𝑘𝐺𝐺,𝑡𝑡
−𝜈𝜈𝑚𝑚,𝐺𝐺 + 𝛹𝛹𝐺𝐺𝑚𝑚𝐺𝐺,𝑡𝑡−𝜈𝜈𝑚𝑚,𝐺𝐺]
− 1−𝛼𝛼𝐺𝐺𝜈𝜈𝑚𝑚,𝐺𝐺𝐺𝐺 (14)
𝑏𝑏 = 𝑃𝑃𝐺𝐺 .𝐺𝐺𝑡𝑡 + 𝑃𝑃𝐼𝐼 . 𝐼𝐼𝑡𝑡 + 𝑃𝑃𝑄𝑄.𝑄𝑄𝑡𝑡 − 𝑞𝑞𝑒𝑒. 𝑒𝑒𝑡𝑡 − 𝑞𝑞𝑠𝑠. 𝑠𝑠𝑡𝑡 − 𝑞𝑞𝑔𝑔.𝑔𝑔𝑡𝑡 (15)
(8)
The parameter νm,G determines the EOS between capital and energy. αG and ΨG are the shares of labor and energy in production, respectively, where Ψ∈ (0, 1). To capture the logistics in collecting waste for electricity generation, we will assume a fixed level of z (in our computation set its value at 3,000 tons per day), lower than the total waste generated by the households. As this amount is fixed, consistent with the CMEC plan, there is no feedback effect from household, industrial, and service sectors to waste.
Following Amin and Marsiliani (2015), we model a stochastic oil price vte:
𝐹𝐹𝑖𝑖(𝑙𝑙𝑖𝑖,𝑡𝑡 ,𝑘𝑘𝑖𝑖,𝑡𝑡 , 𝑗𝑗𝑖𝑖,𝑡𝑡) = 𝐴𝐴𝑖𝑖𝑙𝑙𝑖𝑖,𝑡𝑡𝛼𝛼𝑖𝑖[(1 −𝛹𝛹𝑖𝑖)𝑘𝑘𝑖𝑖,𝑡𝑡−𝜈𝜈
𝑗𝑗 + 𝛹𝛹𝑖𝑖𝑗𝑗𝑖𝑖,𝑡𝑡−𝜈𝜈𝑗𝑗]−
(1−𝛼𝛼𝑖𝑖)ύ𝑗𝑗𝑗𝑗 (1)
1 1+νj ύ
𝑗𝑗𝑗𝑗 𝜈𝜈𝑗𝑗ύ𝑗𝑗𝑗𝑗<1
𝑌𝑌𝑡𝑡 = 𝐴𝐴𝑡𝑡𝑌𝑌𝑙𝑙𝑌𝑌,𝑡𝑡𝛼𝛼𝑌𝑌[(1 −𝛹𝛹𝑌𝑌)𝑘𝑘𝑌𝑌,𝑡𝑡
−𝜈𝜈𝑔𝑔 + 𝛹𝛹𝑌𝑌𝑔𝑔𝑡𝑡−𝜈𝜈𝑔𝑔]−
1−α𝑌𝑌ύ𝑔𝑔𝑔𝑔 (2)
𝑋𝑋𝑡𝑡 = 𝑙𝑙𝑋𝑋,𝑡𝑡𝛼𝛼𝑋𝑋[(1 −𝛹𝛹𝑋𝑋)𝑘𝑘𝑋𝑋,𝑡𝑡
−𝜈𝜈𝑠𝑠 + 𝛹𝛹𝑋𝑋𝑠𝑠𝑡𝑡−𝜈𝜈𝑠𝑠]−
1−𝛼𝛼𝑋𝑋ύ𝑠𝑠𝑠𝑠 (3)
𝜋𝜋𝑖𝑖,𝑡𝑡 = max𝑃𝑃𝑡𝑡𝑖𝑖𝐴𝐴𝑖𝑖𝑙𝑙𝑖𝑖,𝑡𝑡𝛼𝛼𝑖𝑖[(1 −𝛹𝛹𝑖𝑖)𝑘𝑘𝑖𝑖,𝑡𝑡−𝜈𝜈
𝑗𝑗 + 𝛹𝛹𝑖𝑖𝑗𝑗𝑖𝑖,𝑡𝑡−𝜈𝜈𝑗𝑗]−
1−𝛼𝛼𝑖𝑖ύjj − 𝑟𝑟𝑡𝑡𝑘𝑘𝑖𝑖,𝑡𝑡 − 𝑤𝑤𝑡𝑡𝑙𝑙𝑖𝑖,𝑡𝑡 − 𝑣𝑣𝑗𝑗 𝑗𝑗𝑖𝑖,𝑡𝑡 (4)
PtY
𝐺𝐺𝑡𝑡 = 𝐴𝐴𝐺𝐺𝑙𝑙𝐺𝐺,𝑡𝑡𝛼𝛼𝐺𝐺[(1 −𝛹𝛹𝐺𝐺)𝑘𝑘𝐺𝐺,𝑡𝑡
−𝜈𝜈𝑚𝑚,𝐺𝐺 + 𝛹𝛹𝐺𝐺𝑚𝑚𝐺𝐺,𝑡𝑡−𝜈𝜈𝑚𝑚,𝐺𝐺]−
1−𝛼𝛼𝐺𝐺𝜈𝜈𝑚𝑚,𝐺𝐺𝐺𝐺 (5)
𝐼𝐼𝑡𝑡 = 𝐴𝐴𝐼𝐼𝑙𝑙𝐼𝐼,𝑡𝑡𝛼𝛼𝐼𝐼[(1 −𝛹𝛹𝐼𝐼)𝑘𝑘𝐼𝐼,𝑡𝑡
−𝜈𝜈𝑚𝑚,𝐼𝐼 + 𝛹𝛹𝐼𝐼𝑚𝑚𝐼𝐼,𝑡𝑡−𝜈𝜈𝑚𝑚,𝐼𝐼]−
1−𝛼𝛼𝐼𝐼𝜈𝜈𝑚𝑚,𝐼𝐼𝐼𝐼 (6)
𝑄𝑄𝑡𝑡 = 𝐴𝐴𝑄𝑄𝑙𝑙𝑄𝑄,𝑡𝑡𝛼𝛼𝑄𝑄[(1 −𝛹𝛹𝑄𝑄)𝑘𝑘𝑄𝑄,𝑡𝑡
−𝜈𝜈𝑄𝑄 + 𝛹𝛹𝑄𝑄ℎ𝑡𝑡−𝜈𝜈𝑄𝑄]−
1−𝛼𝛼𝑄𝑄𝜈𝜈𝑄𝑄,𝑄𝑄𝑄𝑄 (7)
𝑅𝑅𝑡𝑡 = 𝐴𝐴𝑅𝑅𝑙𝑙𝑅𝑅,𝑡𝑡𝛼𝛼𝑅𝑅[(1 −𝛹𝛹𝑅𝑅)𝑘𝑘𝑅𝑅,𝑡𝑡
−𝜈𝜈𝑅𝑅 + 𝛹𝛹𝑅𝑅𝑧𝑧𝑡𝑡−𝜈𝜈𝑅𝑅]−
1−𝛼𝛼𝑅𝑅𝜈𝜈𝑅𝑅,𝑅𝑅𝑅𝑅 (8)
𝜈𝜈𝑚𝑚,𝐺𝐺
vte
ln 𝑣𝑣𝑡𝑡𝑒𝑒 = ′𝛺𝛺𝑣𝑣 + ω ln 𝑣𝑣𝑡𝑡−1𝑒𝑒 + 𝜂𝜂𝑡𝑡𝑂𝑂 (9) Ώ𝑣𝑣 (𝜂𝜂𝑡𝑡𝑂𝑂) 𝑈𝑈(𝑐𝑐𝑡𝑡𝐴𝐴, 𝑙𝑙𝑡𝑡) = 𝜑𝜑 𝑙𝑙𝑙𝑙𝑔𝑔 𝐶𝐶𝑡𝑡𝐴𝐴 + (1 − 𝜑𝜑)𝑙𝑙𝑙𝑙𝑔𝑔 (1 − 𝑙𝑙𝑡𝑡) (10)
𝐶𝐶𝑡𝑡𝐴𝐴 = 𝑋𝑋𝑡𝑡𝛾𝛾(𝜃𝜃𝑐𝑐𝑡𝑡
𝜌𝜌 + (1 − 𝜃𝜃)𝑒𝑒𝑡𝑡𝜌𝜌)
1−𝛾𝛾𝜌𝜌 (11)
𝑘𝑘𝑡𝑡+1 + 𝑐𝑐𝑡𝑡 + 𝑛𝑛.𝑋𝑋𝑡𝑡 + 𝑞𝑞𝑡𝑡𝑒𝑒. 𝑒𝑒𝑡𝑡 = (1 − 𝜏𝜏𝑙𝑙).𝑤𝑤𝑡𝑡 . 𝑙𝑙𝑡𝑡 + ъ + (1 − 𝜏𝜏𝑘𝑘). 𝑟𝑟𝑡𝑡 .𝑘𝑘𝑡𝑡 + (1 − 𝛿𝛿)𝑘𝑘𝑡𝑡 + 𝜋𝜋
𝐿𝐿 = ∑ 𝛽𝛽𝑡𝑡[(𝜑𝜑 𝑙𝑙𝑙𝑙𝑔𝑔 [𝑋𝑋𝑡𝑡𝛾𝛾(𝜃𝜃𝑐𝑐𝑡𝑡
𝜌𝜌 + (1 − 𝜃𝜃)𝑒𝑒𝑡𝑡𝜌𝜌)
1−𝛾𝛾𝜌𝜌 ]) + (1 − 𝜑𝜑) 𝑙𝑙𝑙𝑙𝑔𝑔(1 − 𝑙𝑙𝑡𝑡)] −∞
𝑡𝑡=0 𝜆𝜆𝑡𝑡[𝑘𝑘𝑡𝑡+1 + 𝑐𝑐𝑡𝑡 +𝑛𝑛.𝑋𝑋𝑡𝑡 + 𝑞𝑞𝑡𝑡𝑒𝑒. 𝑒𝑒𝑡𝑡 − (1 − 𝜏𝜏𝑙𝑙).𝑤𝑤𝑡𝑡 . 𝑙𝑙𝑡𝑡 − ъ − (1 − 𝜏𝜏𝑘𝑘). 𝑟𝑟𝑡𝑡 .𝑘𝑘𝑡𝑡 − (1 − 𝛿𝛿)𝑘𝑘𝑡𝑡] (13)
𝑐𝑐𝐺𝐺,𝑡𝑡 = 𝑤𝑤𝑡𝑡 . 𝑙𝑙𝐺𝐺,𝑡𝑡 + 𝑟𝑟𝑡𝑡 .𝑘𝑘𝐺𝐺,𝑡𝑡 + 𝑣𝑣𝑚𝑚.𝑚𝑚𝐺𝐺,𝑡𝑡 − 𝑃𝑃𝐺𝐺𝐴𝐴𝐺𝐺𝑙𝑙𝑡𝑡𝛼𝛼𝐺𝐺 [(1 −𝛹𝛹𝐺𝐺)𝑘𝑘𝐺𝐺,𝑡𝑡
−𝜈𝜈𝑚𝑚,𝐺𝐺 + 𝛹𝛹𝐺𝐺𝑚𝑚𝐺𝐺,𝑡𝑡−𝜈𝜈𝑚𝑚,𝐺𝐺]
− 1−𝛼𝛼𝐺𝐺𝜈𝜈𝑚𝑚,𝐺𝐺𝐺𝐺 (14)
𝑏𝑏 = 𝑃𝑃𝐺𝐺 .𝐺𝐺𝑡𝑡 + 𝑃𝑃𝐼𝐼 . 𝐼𝐼𝑡𝑡 + 𝑃𝑃𝑄𝑄.𝑄𝑄𝑡𝑡 − 𝑞𝑞𝑒𝑒. 𝑒𝑒𝑡𝑡 − 𝑞𝑞𝑠𝑠. 𝑠𝑠𝑡𝑡 − 𝑞𝑞𝑔𝑔.𝑔𝑔𝑡𝑡 (15)
(9)
where ω is the degree of persistence of the shocks and Ώv determines the steady-state oil price. We assume that the shocks (ηt
O) are normally distributed with zero mean.
8.4.3 Household
The household consumes standard consumption goods (c), services (x), electricity (e), and leisure (1-l).
The per-period utility function is:
𝐹𝐹𝑖𝑖(𝑙𝑙𝑖𝑖,𝑡𝑡 ,𝑘𝑘𝑖𝑖,𝑡𝑡 , 𝑗𝑗𝑖𝑖,𝑡𝑡) = 𝐴𝐴𝑖𝑖𝑙𝑙𝑖𝑖,𝑡𝑡𝛼𝛼𝑖𝑖[(1 −𝛹𝛹𝑖𝑖)𝑘𝑘𝑖𝑖,𝑡𝑡−𝜈𝜈
𝑗𝑗 + 𝛹𝛹𝑖𝑖𝑗𝑗𝑖𝑖,𝑡𝑡−𝜈𝜈𝑗𝑗]−
(1−𝛼𝛼𝑖𝑖)ύ𝑗𝑗𝑗𝑗 (1)
1 1+νj ύ
𝑗𝑗𝑗𝑗 𝜈𝜈𝑗𝑗ύ𝑗𝑗𝑗𝑗<1
𝑌𝑌𝑡𝑡 = 𝐴𝐴𝑡𝑡𝑌𝑌𝑙𝑙𝑌𝑌,𝑡𝑡𝛼𝛼𝑌𝑌[(1 −𝛹𝛹𝑌𝑌)𝑘𝑘𝑌𝑌,𝑡𝑡
−𝜈𝜈𝑔𝑔 + 𝛹𝛹𝑌𝑌𝑔𝑔𝑡𝑡−𝜈𝜈𝑔𝑔]−
1−α𝑌𝑌ύ𝑔𝑔𝑔𝑔 (2)
𝑋𝑋𝑡𝑡 = 𝑙𝑙𝑋𝑋,𝑡𝑡𝛼𝛼𝑋𝑋[(1 −𝛹𝛹𝑋𝑋)𝑘𝑘𝑋𝑋,𝑡𝑡
−𝜈𝜈𝑠𝑠 + 𝛹𝛹𝑋𝑋𝑠𝑠𝑡𝑡−𝜈𝜈𝑠𝑠]−
1−𝛼𝛼𝑋𝑋ύ𝑠𝑠𝑠𝑠 (3)
𝜋𝜋𝑖𝑖,𝑡𝑡 = max𝑃𝑃𝑡𝑡𝑖𝑖𝐴𝐴𝑖𝑖𝑙𝑙𝑖𝑖,𝑡𝑡𝛼𝛼𝑖𝑖[(1 −𝛹𝛹𝑖𝑖)𝑘𝑘𝑖𝑖,𝑡𝑡−𝜈𝜈
𝑗𝑗 + 𝛹𝛹𝑖𝑖𝑗𝑗𝑖𝑖,𝑡𝑡−𝜈𝜈𝑗𝑗]−
1−𝛼𝛼𝑖𝑖ύjj − 𝑟𝑟𝑡𝑡𝑘𝑘𝑖𝑖,𝑡𝑡 − 𝑤𝑤𝑡𝑡𝑙𝑙𝑖𝑖,𝑡𝑡 − 𝑣𝑣𝑗𝑗 𝑗𝑗𝑖𝑖,𝑡𝑡 (4)
PtY
𝐺𝐺𝑡𝑡 = 𝐴𝐴𝐺𝐺𝑙𝑙𝐺𝐺,𝑡𝑡𝛼𝛼𝐺𝐺[(1 −𝛹𝛹𝐺𝐺)𝑘𝑘𝐺𝐺,𝑡𝑡
−𝜈𝜈𝑚𝑚,𝐺𝐺 + 𝛹𝛹𝐺𝐺𝑚𝑚𝐺𝐺,𝑡𝑡−𝜈𝜈𝑚𝑚,𝐺𝐺]−
1−𝛼𝛼𝐺𝐺𝜈𝜈𝑚𝑚,𝐺𝐺𝐺𝐺 (5)
𝐼𝐼𝑡𝑡 = 𝐴𝐴𝐼𝐼𝑙𝑙𝐼𝐼,𝑡𝑡𝛼𝛼𝐼𝐼[(1 −𝛹𝛹𝐼𝐼)𝑘𝑘𝐼𝐼,𝑡𝑡
−𝜈𝜈𝑚𝑚,𝐼𝐼 + 𝛹𝛹𝐼𝐼𝑚𝑚𝐼𝐼,𝑡𝑡−𝜈𝜈𝑚𝑚,𝐼𝐼]−
1−𝛼𝛼𝐼𝐼𝜈𝜈𝑚𝑚,𝐼𝐼𝐼𝐼 (6)
𝑄𝑄𝑡𝑡 = 𝐴𝐴𝑄𝑄𝑙𝑙𝑄𝑄,𝑡𝑡𝛼𝛼𝑄𝑄[(1 −𝛹𝛹𝑄𝑄)𝑘𝑘𝑄𝑄,𝑡𝑡
−𝜈𝜈𝑄𝑄 + 𝛹𝛹𝑄𝑄ℎ𝑡𝑡−𝜈𝜈𝑄𝑄]−
1−𝛼𝛼𝑄𝑄𝜈𝜈𝑄𝑄,𝑄𝑄𝑄𝑄 (7)
𝑅𝑅𝑡𝑡 = 𝐴𝐴𝑅𝑅𝑙𝑙𝑅𝑅,𝑡𝑡𝛼𝛼𝑅𝑅[(1 −𝛹𝛹𝑅𝑅)𝑘𝑘𝑅𝑅,𝑡𝑡
−𝜈𝜈𝑅𝑅 + 𝛹𝛹𝑅𝑅𝑧𝑧𝑡𝑡−𝜈𝜈𝑅𝑅]−
1−𝛼𝛼𝑅𝑅𝜈𝜈𝑅𝑅,𝑅𝑅𝑅𝑅 (8)
𝜈𝜈𝑚𝑚,𝐺𝐺
vte
ln 𝑣𝑣𝑡𝑡𝑒𝑒 = ′𝛺𝛺𝑣𝑣 + ω ln 𝑣𝑣𝑡𝑡−1𝑒𝑒 + 𝜂𝜂𝑡𝑡𝑂𝑂 (9) Ώ𝑣𝑣 (𝜂𝜂𝑡𝑡𝑂𝑂) 𝑈𝑈(𝑐𝑐𝑡𝑡𝐴𝐴, 𝑙𝑙𝑡𝑡) = 𝜑𝜑 𝑙𝑙𝑙𝑙𝑔𝑔 𝐶𝐶𝑡𝑡𝐴𝐴 + (1 − 𝜑𝜑)𝑙𝑙𝑙𝑙𝑔𝑔 (1 − 𝑙𝑙𝑡𝑡) (10)
𝐶𝐶𝑡𝑡𝐴𝐴 = 𝑋𝑋𝑡𝑡𝛾𝛾(𝜃𝜃𝑐𝑐𝑡𝑡
𝜌𝜌 + (1 − 𝜃𝜃)𝑒𝑒𝑡𝑡𝜌𝜌)
1−𝛾𝛾𝜌𝜌 (11)
𝑘𝑘𝑡𝑡+1 + 𝑐𝑐𝑡𝑡 + 𝑛𝑛.𝑋𝑋𝑡𝑡 + 𝑞𝑞𝑡𝑡𝑒𝑒. 𝑒𝑒𝑡𝑡 = (1 − 𝜏𝜏𝑙𝑙).𝑤𝑤𝑡𝑡 . 𝑙𝑙𝑡𝑡 + ъ + (1 − 𝜏𝜏𝑘𝑘). 𝑟𝑟𝑡𝑡 .𝑘𝑘𝑡𝑡 + (1 − 𝛿𝛿)𝑘𝑘𝑡𝑡 + 𝜋𝜋
𝐿𝐿 = ∑ 𝛽𝛽𝑡𝑡[(𝜑𝜑 𝑙𝑙𝑙𝑙𝑔𝑔 [𝑋𝑋𝑡𝑡𝛾𝛾(𝜃𝜃𝑐𝑐𝑡𝑡
𝜌𝜌 + (1 − 𝜃𝜃)𝑒𝑒𝑡𝑡𝜌𝜌)
1−𝛾𝛾𝜌𝜌 ]) + (1 − 𝜑𝜑) 𝑙𝑙𝑙𝑙𝑔𝑔(1 − 𝑙𝑙𝑡𝑡)] −∞
𝑡𝑡=0 𝜆𝜆𝑡𝑡[𝑘𝑘𝑡𝑡+1 + 𝑐𝑐𝑡𝑡 +𝑛𝑛.𝑋𝑋𝑡𝑡 + 𝑞𝑞𝑡𝑡𝑒𝑒. 𝑒𝑒𝑡𝑡 − (1 − 𝜏𝜏𝑙𝑙).𝑤𝑤𝑡𝑡 . 𝑙𝑙𝑡𝑡 − ъ − (1 − 𝜏𝜏𝑘𝑘). 𝑟𝑟𝑡𝑡 .𝑘𝑘𝑡𝑡 − (1 − 𝛿𝛿)𝑘𝑘𝑡𝑡] (13)
𝑐𝑐𝐺𝐺,𝑡𝑡 = 𝑤𝑤𝑡𝑡 . 𝑙𝑙𝐺𝐺,𝑡𝑡 + 𝑟𝑟𝑡𝑡 .𝑘𝑘𝐺𝐺,𝑡𝑡 + 𝑣𝑣𝑚𝑚.𝑚𝑚𝐺𝐺,𝑡𝑡 − 𝑃𝑃𝐺𝐺𝐴𝐴𝐺𝐺𝑙𝑙𝑡𝑡𝛼𝛼𝐺𝐺 [(1 −𝛹𝛹𝐺𝐺)𝑘𝑘𝐺𝐺,𝑡𝑡
−𝜈𝜈𝑚𝑚,𝐺𝐺 + 𝛹𝛹𝐺𝐺𝑚𝑚𝐺𝐺,𝑡𝑡−𝜈𝜈𝑚𝑚,𝐺𝐺]
− 1−𝛼𝛼𝐺𝐺𝜈𝜈𝑚𝑚,𝐺𝐺𝐺𝐺 (14)
𝑏𝑏 = 𝑃𝑃𝐺𝐺 .𝐺𝐺𝑡𝑡 + 𝑃𝑃𝐼𝐼 . 𝐼𝐼𝑡𝑡 + 𝑃𝑃𝑄𝑄.𝑄𝑄𝑡𝑡 − 𝑞𝑞𝑒𝑒. 𝑒𝑒𝑡𝑡 − 𝑞𝑞𝑠𝑠. 𝑠𝑠𝑡𝑡 − 𝑞𝑞𝑔𝑔.𝑔𝑔𝑡𝑡 (15)
(10)
17 These specifications are based on historical data and regulatory legislation, see Annual Reports of the Bangladesh Power Development Board (https://www.bpdb.gov.bd/bpdb_new/index.php/site/annual_reports).

133
THE CASE OF WASTE TO ENERGY IN BANGLADESH
where
𝐹𝐹𝑖𝑖(𝑙𝑙𝑖𝑖,𝑡𝑡 ,𝑘𝑘𝑖𝑖,𝑡𝑡 , 𝑗𝑗𝑖𝑖,𝑡𝑡) = 𝐴𝐴𝑖𝑖𝑙𝑙𝑖𝑖,𝑡𝑡𝛼𝛼𝑖𝑖[(1 −𝛹𝛹𝑖𝑖)𝑘𝑘𝑖𝑖,𝑡𝑡−𝜈𝜈
𝑗𝑗 + 𝛹𝛹𝑖𝑖𝑗𝑗𝑖𝑖,𝑡𝑡−𝜈𝜈𝑗𝑗]−
(1−𝛼𝛼𝑖𝑖)ύ𝑗𝑗𝑗𝑗 (1)
1 1+νj ύ
𝑗𝑗𝑗𝑗 𝜈𝜈𝑗𝑗ύ𝑗𝑗𝑗𝑗<1
𝑌𝑌𝑡𝑡 = 𝐴𝐴𝑡𝑡𝑌𝑌𝑙𝑙𝑌𝑌,𝑡𝑡𝛼𝛼𝑌𝑌[(1 −𝛹𝛹𝑌𝑌)𝑘𝑘𝑌𝑌,𝑡𝑡
−𝜈𝜈𝑔𝑔 + 𝛹𝛹𝑌𝑌𝑔𝑔𝑡𝑡−𝜈𝜈𝑔𝑔]−
1−α𝑌𝑌ύ𝑔𝑔𝑔𝑔 (2)
𝑋𝑋𝑡𝑡 = 𝑙𝑙𝑋𝑋,𝑡𝑡𝛼𝛼𝑋𝑋[(1 −𝛹𝛹𝑋𝑋)𝑘𝑘𝑋𝑋,𝑡𝑡
−𝜈𝜈𝑠𝑠 + 𝛹𝛹𝑋𝑋𝑠𝑠𝑡𝑡−𝜈𝜈𝑠𝑠]−
1−𝛼𝛼𝑋𝑋ύ𝑠𝑠𝑠𝑠 (3)
𝜋𝜋𝑖𝑖,𝑡𝑡 = max𝑃𝑃𝑡𝑡𝑖𝑖𝐴𝐴𝑖𝑖𝑙𝑙𝑖𝑖,𝑡𝑡𝛼𝛼𝑖𝑖[(1 −𝛹𝛹𝑖𝑖)𝑘𝑘𝑖𝑖,𝑡𝑡−𝜈𝜈
𝑗𝑗 + 𝛹𝛹𝑖𝑖𝑗𝑗𝑖𝑖,𝑡𝑡−𝜈𝜈𝑗𝑗]−
1−𝛼𝛼𝑖𝑖ύjj − 𝑟𝑟𝑡𝑡𝑘𝑘𝑖𝑖,𝑡𝑡 − 𝑤𝑤𝑡𝑡𝑙𝑙𝑖𝑖,𝑡𝑡 − 𝑣𝑣𝑗𝑗 𝑗𝑗𝑖𝑖,𝑡𝑡 (4)
PtY
𝐺𝐺𝑡𝑡 = 𝐴𝐴𝐺𝐺𝑙𝑙𝐺𝐺,𝑡𝑡𝛼𝛼𝐺𝐺[(1 −𝛹𝛹𝐺𝐺)𝑘𝑘𝐺𝐺,𝑡𝑡
−𝜈𝜈𝑚𝑚,𝐺𝐺 + 𝛹𝛹𝐺𝐺𝑚𝑚𝐺𝐺,𝑡𝑡−𝜈𝜈𝑚𝑚,𝐺𝐺]−
1−𝛼𝛼𝐺𝐺𝜈𝜈𝑚𝑚,𝐺𝐺𝐺𝐺 (5)
𝐼𝐼𝑡𝑡 = 𝐴𝐴𝐼𝐼𝑙𝑙𝐼𝐼,𝑡𝑡𝛼𝛼𝐼𝐼[(1 −𝛹𝛹𝐼𝐼)𝑘𝑘𝐼𝐼,𝑡𝑡
−𝜈𝜈𝑚𝑚,𝐼𝐼 + 𝛹𝛹𝐼𝐼𝑚𝑚𝐼𝐼,𝑡𝑡−𝜈𝜈𝑚𝑚,𝐼𝐼]−
1−𝛼𝛼𝐼𝐼𝜈𝜈𝑚𝑚,𝐼𝐼𝐼𝐼 (6)
𝑄𝑄𝑡𝑡 = 𝐴𝐴𝑄𝑄𝑙𝑙𝑄𝑄,𝑡𝑡𝛼𝛼𝑄𝑄[(1 −𝛹𝛹𝑄𝑄)𝑘𝑘𝑄𝑄,𝑡𝑡
−𝜈𝜈𝑄𝑄 + 𝛹𝛹𝑄𝑄ℎ𝑡𝑡−𝜈𝜈𝑄𝑄]−
1−𝛼𝛼𝑄𝑄𝜈𝜈𝑄𝑄,𝑄𝑄𝑄𝑄 (7)
𝑅𝑅𝑡𝑡 = 𝐴𝐴𝑅𝑅𝑙𝑙𝑅𝑅,𝑡𝑡𝛼𝛼𝑅𝑅[(1 −𝛹𝛹𝑅𝑅)𝑘𝑘𝑅𝑅,𝑡𝑡
−𝜈𝜈𝑅𝑅 + 𝛹𝛹𝑅𝑅𝑧𝑧𝑡𝑡−𝜈𝜈𝑅𝑅]−
1−𝛼𝛼𝑅𝑅𝜈𝜈𝑅𝑅,𝑅𝑅𝑅𝑅 (8)
𝜈𝜈𝑚𝑚,𝐺𝐺
vte
ln 𝑣𝑣𝑡𝑡𝑒𝑒 = ′𝛺𝛺𝑣𝑣 + ω ln 𝑣𝑣𝑡𝑡−1𝑒𝑒 + 𝜂𝜂𝑡𝑡𝑂𝑂 (9) Ώ𝑣𝑣 (𝜂𝜂𝑡𝑡𝑂𝑂) 𝑈𝑈(𝑐𝑐𝑡𝑡𝐴𝐴, 𝑙𝑙𝑡𝑡) = 𝜑𝜑 𝑙𝑙𝑙𝑙𝑔𝑔 𝐶𝐶𝑡𝑡𝐴𝐴 + (1 − 𝜑𝜑)𝑙𝑙𝑙𝑙𝑔𝑔 (1 − 𝑙𝑙𝑡𝑡) (10)
𝐶𝐶𝑡𝑡𝐴𝐴 = 𝑋𝑋𝑡𝑡𝛾𝛾(𝜃𝜃𝑐𝑐𝑡𝑡
𝜌𝜌 + (1 − 𝜃𝜃)𝑒𝑒𝑡𝑡𝜌𝜌)
1−𝛾𝛾𝜌𝜌 (11)
𝑘𝑘𝑡𝑡+1 + 𝑐𝑐𝑡𝑡 + 𝑛𝑛.𝑋𝑋𝑡𝑡 + 𝑞𝑞𝑡𝑡𝑒𝑒. 𝑒𝑒𝑡𝑡 = (1 − 𝜏𝜏𝑙𝑙).𝑤𝑤𝑡𝑡 . 𝑙𝑙𝑡𝑡 + ъ + (1 − 𝜏𝜏𝑘𝑘). 𝑟𝑟𝑡𝑡 .𝑘𝑘𝑡𝑡 + (1 − 𝛿𝛿)𝑘𝑘𝑡𝑡 + 𝜋𝜋
𝐿𝐿 = ∑ 𝛽𝛽𝑡𝑡[(𝜑𝜑 𝑙𝑙𝑙𝑙𝑔𝑔 [𝑋𝑋𝑡𝑡𝛾𝛾(𝜃𝜃𝑐𝑐𝑡𝑡
𝜌𝜌 + (1 − 𝜃𝜃)𝑒𝑒𝑡𝑡𝜌𝜌)
1−𝛾𝛾𝜌𝜌 ]) + (1 − 𝜑𝜑) 𝑙𝑙𝑙𝑙𝑔𝑔(1 − 𝑙𝑙𝑡𝑡)] −∞
𝑡𝑡=0 𝜆𝜆𝑡𝑡[𝑘𝑘𝑡𝑡+1 + 𝑐𝑐𝑡𝑡 +𝑛𝑛.𝑋𝑋𝑡𝑡 + 𝑞𝑞𝑡𝑡𝑒𝑒. 𝑒𝑒𝑡𝑡 − (1 − 𝜏𝜏𝑙𝑙).𝑤𝑤𝑡𝑡 . 𝑙𝑙𝑡𝑡 − ъ − (1 − 𝜏𝜏𝑘𝑘). 𝑟𝑟𝑡𝑡 .𝑘𝑘𝑡𝑡 − (1 − 𝛿𝛿)𝑘𝑘𝑡𝑡] (13)
𝑐𝑐𝐺𝐺,𝑡𝑡 = 𝑤𝑤𝑡𝑡 . 𝑙𝑙𝐺𝐺,𝑡𝑡 + 𝑟𝑟𝑡𝑡 .𝑘𝑘𝐺𝐺,𝑡𝑡 + 𝑣𝑣𝑚𝑚.𝑚𝑚𝐺𝐺,𝑡𝑡 − 𝑃𝑃𝐺𝐺𝐴𝐴𝐺𝐺𝑙𝑙𝑡𝑡𝛼𝛼𝐺𝐺 [(1 −𝛹𝛹𝐺𝐺)𝑘𝑘𝐺𝐺,𝑡𝑡
−𝜈𝜈𝑚𝑚,𝐺𝐺 + 𝛹𝛹𝐺𝐺𝑚𝑚𝐺𝐺,𝑡𝑡−𝜈𝜈𝑚𝑚,𝐺𝐺]
− 1−𝛼𝛼𝐺𝐺𝜈𝜈𝑚𝑚,𝐺𝐺𝐺𝐺 (14)
𝑏𝑏 = 𝑃𝑃𝐺𝐺 .𝐺𝐺𝑡𝑡 + 𝑃𝑃𝐼𝐼 . 𝐼𝐼𝑡𝑡 + 𝑃𝑃𝑄𝑄.𝑄𝑄𝑡𝑡 − 𝑞𝑞𝑒𝑒. 𝑒𝑒𝑡𝑡 − 𝑞𝑞𝑠𝑠. 𝑠𝑠𝑡𝑡 − 𝑞𝑞𝑔𝑔.𝑔𝑔𝑡𝑡 (15)
(11)
1/(1-ρ) is the EOS between c and e. This formulation allows for a lower-than-unity substitution elasticity between ordinary consumption and electricity consumption, which is the case when we set ρ to -0.11 (as in Amin and Marsiliani 2015).
The household receives (i) income from capital (r . kt), (ii) income from labor (w . lt), (iii) a lump-sum transfer (ъ) from the government, and (iv) dividends (π).18 The tax rates on capital and labor income denote τk and τl, respectively. We denote the price of services and household electricity n and qe, respectively.
The budget constraint for the household is:
𝐹𝐹𝑖𝑖(𝑙𝑙𝑖𝑖,𝑡𝑡 ,𝑘𝑘𝑖𝑖,𝑡𝑡 , 𝑗𝑗𝑖𝑖,𝑡𝑡) = 𝐴𝐴𝑖𝑖𝑙𝑙𝑖𝑖,𝑡𝑡𝛼𝛼𝑖𝑖[(1 −𝛹𝛹𝑖𝑖)𝑘𝑘𝑖𝑖,𝑡𝑡−𝜈𝜈
𝑗𝑗 + 𝛹𝛹𝑖𝑖𝑗𝑗𝑖𝑖,𝑡𝑡−𝜈𝜈𝑗𝑗]−
(1−𝛼𝛼𝑖𝑖)ύ𝑗𝑗𝑗𝑗 (1)
1 1+νj ύ
𝑗𝑗𝑗𝑗 𝜈𝜈𝑗𝑗ύ𝑗𝑗𝑗𝑗<1
𝑌𝑌𝑡𝑡 = 𝐴𝐴𝑡𝑡𝑌𝑌𝑙𝑙𝑌𝑌,𝑡𝑡𝛼𝛼𝑌𝑌[(1 −𝛹𝛹𝑌𝑌)𝑘𝑘𝑌𝑌,𝑡𝑡
−𝜈𝜈𝑔𝑔 + 𝛹𝛹𝑌𝑌𝑔𝑔𝑡𝑡−𝜈𝜈𝑔𝑔]−
1−α𝑌𝑌ύ𝑔𝑔𝑔𝑔 (2)
𝑋𝑋𝑡𝑡 = 𝑙𝑙𝑋𝑋,𝑡𝑡𝛼𝛼𝑋𝑋[(1 −𝛹𝛹𝑋𝑋)𝑘𝑘𝑋𝑋,𝑡𝑡
−𝜈𝜈𝑠𝑠 + 𝛹𝛹𝑋𝑋𝑠𝑠𝑡𝑡−𝜈𝜈𝑠𝑠]−
1−𝛼𝛼𝑋𝑋ύ𝑠𝑠𝑠𝑠 (3)
𝜋𝜋𝑖𝑖,𝑡𝑡 = max𝑃𝑃𝑡𝑡𝑖𝑖𝐴𝐴𝑖𝑖𝑙𝑙𝑖𝑖,𝑡𝑡𝛼𝛼𝑖𝑖[(1 −𝛹𝛹𝑖𝑖)𝑘𝑘𝑖𝑖,𝑡𝑡−𝜈𝜈
𝑗𝑗 + 𝛹𝛹𝑖𝑖𝑗𝑗𝑖𝑖,𝑡𝑡−𝜈𝜈𝑗𝑗]−
1−𝛼𝛼𝑖𝑖ύjj − 𝑟𝑟𝑡𝑡𝑘𝑘𝑖𝑖,𝑡𝑡 − 𝑤𝑤𝑡𝑡𝑙𝑙𝑖𝑖,𝑡𝑡 − 𝑣𝑣𝑗𝑗 𝑗𝑗𝑖𝑖,𝑡𝑡 (4)
PtY
𝐺𝐺𝑡𝑡 = 𝐴𝐴𝐺𝐺𝑙𝑙𝐺𝐺,𝑡𝑡𝛼𝛼𝐺𝐺[(1 −𝛹𝛹𝐺𝐺)𝑘𝑘𝐺𝐺,𝑡𝑡
−𝜈𝜈𝑚𝑚,𝐺𝐺 + 𝛹𝛹𝐺𝐺𝑚𝑚𝐺𝐺,𝑡𝑡−𝜈𝜈𝑚𝑚,𝐺𝐺]−
1−𝛼𝛼𝐺𝐺𝜈𝜈𝑚𝑚,𝐺𝐺𝐺𝐺 (5)
𝐼𝐼𝑡𝑡 = 𝐴𝐴𝐼𝐼𝑙𝑙𝐼𝐼,𝑡𝑡𝛼𝛼𝐼𝐼[(1 −𝛹𝛹𝐼𝐼)𝑘𝑘𝐼𝐼,𝑡𝑡
−𝜈𝜈𝑚𝑚,𝐼𝐼 + 𝛹𝛹𝐼𝐼𝑚𝑚𝐼𝐼,𝑡𝑡−𝜈𝜈𝑚𝑚,𝐼𝐼]−
1−𝛼𝛼𝐼𝐼𝜈𝜈𝑚𝑚,𝐼𝐼𝐼𝐼 (6)
𝑄𝑄𝑡𝑡 = 𝐴𝐴𝑄𝑄𝑙𝑙𝑄𝑄,𝑡𝑡𝛼𝛼𝑄𝑄[(1 −𝛹𝛹𝑄𝑄)𝑘𝑘𝑄𝑄,𝑡𝑡
−𝜈𝜈𝑄𝑄 + 𝛹𝛹𝑄𝑄ℎ𝑡𝑡−𝜈𝜈𝑄𝑄]−
1−𝛼𝛼𝑄𝑄𝜈𝜈𝑄𝑄,𝑄𝑄𝑄𝑄 (7)
𝑅𝑅𝑡𝑡 = 𝐴𝐴𝑅𝑅𝑙𝑙𝑅𝑅,𝑡𝑡𝛼𝛼𝑅𝑅[(1 −𝛹𝛹𝑅𝑅)𝑘𝑘𝑅𝑅,𝑡𝑡
−𝜈𝜈𝑅𝑅 + 𝛹𝛹𝑅𝑅𝑧𝑧𝑡𝑡−𝜈𝜈𝑅𝑅]−
1−𝛼𝛼𝑅𝑅𝜈𝜈𝑅𝑅,𝑅𝑅𝑅𝑅 (8)
𝜈𝜈𝑚𝑚,𝐺𝐺
vte
ln 𝑣𝑣𝑡𝑡𝑒𝑒 = ′𝛺𝛺𝑣𝑣 + ω ln 𝑣𝑣𝑡𝑡−1𝑒𝑒 + 𝜂𝜂𝑡𝑡𝑂𝑂 (9) Ώ𝑣𝑣 (𝜂𝜂𝑡𝑡𝑂𝑂) 𝑈𝑈(𝑐𝑐𝑡𝑡𝐴𝐴, 𝑙𝑙𝑡𝑡) = 𝜑𝜑 𝑙𝑙𝑙𝑙𝑔𝑔 𝐶𝐶𝑡𝑡𝐴𝐴 + (1 − 𝜑𝜑)𝑙𝑙𝑙𝑙𝑔𝑔 (1 − 𝑙𝑙𝑡𝑡) (10)
𝐶𝐶𝑡𝑡𝐴𝐴 = 𝑋𝑋𝑡𝑡𝛾𝛾(𝜃𝜃𝑐𝑐𝑡𝑡
𝜌𝜌 + (1 − 𝜃𝜃)𝑒𝑒𝑡𝑡𝜌𝜌)
1−𝛾𝛾𝜌𝜌 (11)
𝑘𝑘𝑡𝑡+1 + 𝑐𝑐𝑡𝑡 + 𝑛𝑛.𝑋𝑋𝑡𝑡 + 𝑞𝑞𝑡𝑡𝑒𝑒. 𝑒𝑒𝑡𝑡 = (1 − 𝜏𝜏𝑙𝑙).𝑤𝑤𝑡𝑡 . 𝑙𝑙𝑡𝑡 + ъ + (1 − 𝜏𝜏𝑘𝑘). 𝑟𝑟𝑡𝑡 .𝑘𝑘𝑡𝑡 + (1 − 𝛿𝛿)𝑘𝑘𝑡𝑡 + 𝜋𝜋
𝐿𝐿 = ∑ 𝛽𝛽𝑡𝑡[(𝜑𝜑 𝑙𝑙𝑙𝑙𝑔𝑔 [𝑋𝑋𝑡𝑡𝛾𝛾(𝜃𝜃𝑐𝑐𝑡𝑡
𝜌𝜌 + (1 − 𝜃𝜃)𝑒𝑒𝑡𝑡𝜌𝜌)
1−𝛾𝛾𝜌𝜌 ]) + (1 − 𝜑𝜑) 𝑙𝑙𝑙𝑙𝑔𝑔(1 − 𝑙𝑙𝑡𝑡)] −∞
𝑡𝑡=0 𝜆𝜆𝑡𝑡[𝑘𝑘𝑡𝑡+1 + 𝑐𝑐𝑡𝑡 +𝑛𝑛.𝑋𝑋𝑡𝑡 + 𝑞𝑞𝑡𝑡𝑒𝑒. 𝑒𝑒𝑡𝑡 − (1 − 𝜏𝜏𝑙𝑙).𝑤𝑤𝑡𝑡 . 𝑙𝑙𝑡𝑡 − ъ − (1 − 𝜏𝜏𝑘𝑘). 𝑟𝑟𝑡𝑡 .𝑘𝑘𝑡𝑡 − (1 − 𝛿𝛿)𝑘𝑘𝑡𝑡] (13)
𝑐𝑐𝐺𝐺,𝑡𝑡 = 𝑤𝑤𝑡𝑡 . 𝑙𝑙𝐺𝐺,𝑡𝑡 + 𝑟𝑟𝑡𝑡 .𝑘𝑘𝐺𝐺,𝑡𝑡 + 𝑣𝑣𝑚𝑚.𝑚𝑚𝐺𝐺,𝑡𝑡 − 𝑃𝑃𝐺𝐺𝐴𝐴𝐺𝐺𝑙𝑙𝑡𝑡𝛼𝛼𝐺𝐺 [(1 −𝛹𝛹𝐺𝐺)𝑘𝑘𝐺𝐺,𝑡𝑡
−𝜈𝜈𝑚𝑚,𝐺𝐺 + 𝛹𝛹𝐺𝐺𝑚𝑚𝐺𝐺,𝑡𝑡−𝜈𝜈𝑚𝑚,𝐺𝐺]
− 1−𝛼𝛼𝐺𝐺𝜈𝜈𝑚𝑚,𝐺𝐺𝐺𝐺 (14)
𝑏𝑏 = 𝑃𝑃𝐺𝐺 .𝐺𝐺𝑡𝑡 + 𝑃𝑃𝐼𝐼 . 𝐼𝐼𝑡𝑡 + 𝑃𝑃𝑄𝑄.𝑄𝑄𝑡𝑡 − 𝑞𝑞𝑒𝑒. 𝑒𝑒𝑡𝑡 − 𝑞𝑞𝑠𝑠. 𝑠𝑠𝑡𝑡 − 𝑞𝑞𝑔𝑔.𝑔𝑔𝑡𝑡 (15)
(12)
where δ is the capital depreciation rate. Consequently, the Lagrange function is:
𝐹𝐹𝑖𝑖(𝑙𝑙𝑖𝑖,𝑡𝑡 ,𝑘𝑘𝑖𝑖,𝑡𝑡 , 𝑗𝑗𝑖𝑖,𝑡𝑡) = 𝐴𝐴𝑖𝑖𝑙𝑙𝑖𝑖,𝑡𝑡𝛼𝛼𝑖𝑖[(1 −𝛹𝛹𝑖𝑖)𝑘𝑘𝑖𝑖,𝑡𝑡−𝜈𝜈
𝑗𝑗 + 𝛹𝛹𝑖𝑖𝑗𝑗𝑖𝑖,𝑡𝑡−𝜈𝜈𝑗𝑗]−
(1−𝛼𝛼𝑖𝑖)ύ𝑗𝑗𝑗𝑗 (1)
1 1+νj ύ
𝑗𝑗𝑗𝑗 𝜈𝜈𝑗𝑗ύ𝑗𝑗𝑗𝑗<1
𝑌𝑌𝑡𝑡 = 𝐴𝐴𝑡𝑡𝑌𝑌𝑙𝑙𝑌𝑌,𝑡𝑡𝛼𝛼𝑌𝑌[(1 −𝛹𝛹𝑌𝑌)𝑘𝑘𝑌𝑌,𝑡𝑡
−𝜈𝜈𝑔𝑔 + 𝛹𝛹𝑌𝑌𝑔𝑔𝑡𝑡−𝜈𝜈𝑔𝑔]−
1−α𝑌𝑌ύ𝑔𝑔𝑔𝑔 (2)
𝑋𝑋𝑡𝑡 = 𝑙𝑙𝑋𝑋,𝑡𝑡𝛼𝛼𝑋𝑋[(1 −𝛹𝛹𝑋𝑋)𝑘𝑘𝑋𝑋,𝑡𝑡
−𝜈𝜈𝑠𝑠 + 𝛹𝛹𝑋𝑋𝑠𝑠𝑡𝑡−𝜈𝜈𝑠𝑠]−
1−𝛼𝛼𝑋𝑋ύ𝑠𝑠𝑠𝑠 (3)
𝜋𝜋𝑖𝑖,𝑡𝑡 = max𝑃𝑃𝑡𝑡𝑖𝑖𝐴𝐴𝑖𝑖𝑙𝑙𝑖𝑖,𝑡𝑡𝛼𝛼𝑖𝑖[(1 −𝛹𝛹𝑖𝑖)𝑘𝑘𝑖𝑖,𝑡𝑡−𝜈𝜈
𝑗𝑗 + 𝛹𝛹𝑖𝑖𝑗𝑗𝑖𝑖,𝑡𝑡−𝜈𝜈𝑗𝑗]−
1−𝛼𝛼𝑖𝑖ύjj − 𝑟𝑟𝑡𝑡𝑘𝑘𝑖𝑖,𝑡𝑡 − 𝑤𝑤𝑡𝑡𝑙𝑙𝑖𝑖,𝑡𝑡 − 𝑣𝑣𝑗𝑗 𝑗𝑗𝑖𝑖,𝑡𝑡 (4)
PtY
𝐺𝐺𝑡𝑡 = 𝐴𝐴𝐺𝐺𝑙𝑙𝐺𝐺,𝑡𝑡𝛼𝛼𝐺𝐺[(1 −𝛹𝛹𝐺𝐺)𝑘𝑘𝐺𝐺,𝑡𝑡
−𝜈𝜈𝑚𝑚,𝐺𝐺 + 𝛹𝛹𝐺𝐺𝑚𝑚𝐺𝐺,𝑡𝑡−𝜈𝜈𝑚𝑚,𝐺𝐺]−
1−𝛼𝛼𝐺𝐺𝜈𝜈𝑚𝑚,𝐺𝐺𝐺𝐺 (5)
𝐼𝐼𝑡𝑡 = 𝐴𝐴𝐼𝐼𝑙𝑙𝐼𝐼,𝑡𝑡𝛼𝛼𝐼𝐼[(1 −𝛹𝛹𝐼𝐼)𝑘𝑘𝐼𝐼,𝑡𝑡
−𝜈𝜈𝑚𝑚,𝐼𝐼 + 𝛹𝛹𝐼𝐼𝑚𝑚𝐼𝐼,𝑡𝑡−𝜈𝜈𝑚𝑚,𝐼𝐼]−
1−𝛼𝛼𝐼𝐼𝜈𝜈𝑚𝑚,𝐼𝐼𝐼𝐼 (6)
𝑄𝑄𝑡𝑡 = 𝐴𝐴𝑄𝑄𝑙𝑙𝑄𝑄,𝑡𝑡𝛼𝛼𝑄𝑄[(1 −𝛹𝛹𝑄𝑄)𝑘𝑘𝑄𝑄,𝑡𝑡
−𝜈𝜈𝑄𝑄 + 𝛹𝛹𝑄𝑄ℎ𝑡𝑡−𝜈𝜈𝑄𝑄]−
1−𝛼𝛼𝑄𝑄𝜈𝜈𝑄𝑄,𝑄𝑄𝑄𝑄 (7)
𝑅𝑅𝑡𝑡 = 𝐴𝐴𝑅𝑅𝑙𝑙𝑅𝑅,𝑡𝑡𝛼𝛼𝑅𝑅[(1 −𝛹𝛹𝑅𝑅)𝑘𝑘𝑅𝑅,𝑡𝑡
−𝜈𝜈𝑅𝑅 + 𝛹𝛹𝑅𝑅𝑧𝑧𝑡𝑡−𝜈𝜈𝑅𝑅]−
1−𝛼𝛼𝑅𝑅𝜈𝜈𝑅𝑅,𝑅𝑅𝑅𝑅 (8)
𝜈𝜈𝑚𝑚,𝐺𝐺
vte
ln 𝑣𝑣𝑡𝑡𝑒𝑒 = ′𝛺𝛺𝑣𝑣 + ω ln 𝑣𝑣𝑡𝑡−1𝑒𝑒 + 𝜂𝜂𝑡𝑡𝑂𝑂 (9) Ώ𝑣𝑣 (𝜂𝜂𝑡𝑡𝑂𝑂) 𝑈𝑈(𝑐𝑐𝑡𝑡𝐴𝐴, 𝑙𝑙𝑡𝑡) = 𝜑𝜑 𝑙𝑙𝑙𝑙𝑔𝑔 𝐶𝐶𝑡𝑡𝐴𝐴 + (1 − 𝜑𝜑)𝑙𝑙𝑙𝑙𝑔𝑔 (1 − 𝑙𝑙𝑡𝑡) (10)
𝐶𝐶𝑡𝑡𝐴𝐴 = 𝑋𝑋𝑡𝑡𝛾𝛾(𝜃𝜃𝑐𝑐𝑡𝑡
𝜌𝜌 + (1 − 𝜃𝜃)𝑒𝑒𝑡𝑡𝜌𝜌)
1−𝛾𝛾𝜌𝜌 (11)
𝑘𝑘𝑡𝑡+1 + 𝑐𝑐𝑡𝑡 + 𝑛𝑛.𝑋𝑋𝑡𝑡 + 𝑞𝑞𝑡𝑡𝑒𝑒. 𝑒𝑒𝑡𝑡 = (1 − 𝜏𝜏𝑙𝑙).𝑤𝑤𝑡𝑡 . 𝑙𝑙𝑡𝑡 + ъ + (1 − 𝜏𝜏𝑘𝑘). 𝑟𝑟𝑡𝑡 .𝑘𝑘𝑡𝑡 + (1 − 𝛿𝛿)𝑘𝑘𝑡𝑡 + 𝜋𝜋
𝐿𝐿 = ∑ 𝛽𝛽𝑡𝑡[(𝜑𝜑 𝑙𝑙𝑙𝑙𝑔𝑔 [𝑋𝑋𝑡𝑡𝛾𝛾(𝜃𝜃𝑐𝑐𝑡𝑡
𝜌𝜌 + (1 − 𝜃𝜃)𝑒𝑒𝑡𝑡𝜌𝜌)
1−𝛾𝛾𝜌𝜌 ]) + (1 − 𝜑𝜑) 𝑙𝑙𝑙𝑙𝑔𝑔(1 − 𝑙𝑙𝑡𝑡)] −∞
𝑡𝑡=0 𝜆𝜆𝑡𝑡[𝑘𝑘𝑡𝑡+1 + 𝑐𝑐𝑡𝑡 +𝑛𝑛.𝑋𝑋𝑡𝑡 + 𝑞𝑞𝑡𝑡𝑒𝑒. 𝑒𝑒𝑡𝑡 − (1 − 𝜏𝜏𝑙𝑙).𝑤𝑤𝑡𝑡 . 𝑙𝑙𝑡𝑡 − ъ − (1 − 𝜏𝜏𝑘𝑘). 𝑟𝑟𝑡𝑡 .𝑘𝑘𝑡𝑡 − (1 − 𝛿𝛿)𝑘𝑘𝑡𝑡] (13)
𝑐𝑐𝐺𝐺,𝑡𝑡 = 𝑤𝑤𝑡𝑡 . 𝑙𝑙𝐺𝐺,𝑡𝑡 + 𝑟𝑟𝑡𝑡 .𝑘𝑘𝐺𝐺,𝑡𝑡 + 𝑣𝑣𝑚𝑚.𝑚𝑚𝐺𝐺,𝑡𝑡 − 𝑃𝑃𝐺𝐺𝐴𝐴𝐺𝐺𝑙𝑙𝑡𝑡𝛼𝛼𝐺𝐺 [(1 −𝛹𝛹𝐺𝐺)𝑘𝑘𝐺𝐺,𝑡𝑡
−𝜈𝜈𝑚𝑚,𝐺𝐺 + 𝛹𝛹𝐺𝐺𝑚𝑚𝐺𝐺,𝑡𝑡−𝜈𝜈𝑚𝑚,𝐺𝐺]
− 1−𝛼𝛼𝐺𝐺𝜈𝜈𝑚𝑚,𝐺𝐺𝐺𝐺 (14)
𝑏𝑏 = 𝑃𝑃𝐺𝐺 .𝐺𝐺𝑡𝑡 + 𝑃𝑃𝐼𝐼 . 𝐼𝐼𝑡𝑡 + 𝑃𝑃𝑄𝑄.𝑄𝑄𝑡𝑡 − 𝑞𝑞𝑒𝑒. 𝑒𝑒𝑡𝑡 − 𝑞𝑞𝑠𝑠. 𝑠𝑠𝑡𝑡 − 𝑞𝑞𝑔𝑔.𝑔𝑔𝑡𝑡 (15)
(13)
where β denotes the discount factor and λt the Lagrange multiplier.
8.4.4 Government
The sources of government revenue are labor income tax revenue (τ l . wt . lt), capital income tax revenue (τ r . rt . kt), sales of natural gas to other electricity-generating firms ((v m – δC)(mI,t + mG,t)), and sales of electricity to the national grid (PG . Gt). Government spending are labor cost (wt . lG,t), capital cost (rt . kG,t), and natural gas expenditure (vm . mG,t) for its own electricity production and a lump-sum transfer to households (ъt). The price of natural gas in the local market is denoted v m. Additionally, there is also an extraction cost of natural gas (δ C). On the electricity-generating side, the government seeks to minimize the cost function:
𝐹𝐹𝑖𝑖(𝑙𝑙𝑖𝑖,𝑡𝑡 ,𝑘𝑘𝑖𝑖,𝑡𝑡 , 𝑗𝑗𝑖𝑖,𝑡𝑡) = 𝐴𝐴𝑖𝑖𝑙𝑙𝑖𝑖,𝑡𝑡𝛼𝛼𝑖𝑖[(1 −𝛹𝛹𝑖𝑖)𝑘𝑘𝑖𝑖,𝑡𝑡−𝜈𝜈
𝑗𝑗 + 𝛹𝛹𝑖𝑖𝑗𝑗𝑖𝑖,𝑡𝑡−𝜈𝜈𝑗𝑗]−
(1−𝛼𝛼𝑖𝑖)ύ𝑗𝑗𝑗𝑗 (1)
1 1+νj ύ
𝑗𝑗𝑗𝑗 𝜈𝜈𝑗𝑗ύ𝑗𝑗𝑗𝑗<1
𝑌𝑌𝑡𝑡 = 𝐴𝐴𝑡𝑡𝑌𝑌𝑙𝑙𝑌𝑌,𝑡𝑡𝛼𝛼𝑌𝑌[(1 −𝛹𝛹𝑌𝑌)𝑘𝑘𝑌𝑌,𝑡𝑡
−𝜈𝜈𝑔𝑔 + 𝛹𝛹𝑌𝑌𝑔𝑔𝑡𝑡−𝜈𝜈𝑔𝑔]−
1−α𝑌𝑌ύ𝑔𝑔𝑔𝑔 (2)
𝑋𝑋𝑡𝑡 = 𝑙𝑙𝑋𝑋,𝑡𝑡𝛼𝛼𝑋𝑋[(1 −𝛹𝛹𝑋𝑋)𝑘𝑘𝑋𝑋,𝑡𝑡
−𝜈𝜈𝑠𝑠 + 𝛹𝛹𝑋𝑋𝑠𝑠𝑡𝑡−𝜈𝜈𝑠𝑠]−
1−𝛼𝛼𝑋𝑋ύ𝑠𝑠𝑠𝑠 (3)
𝜋𝜋𝑖𝑖,𝑡𝑡 = max𝑃𝑃𝑡𝑡𝑖𝑖𝐴𝐴𝑖𝑖𝑙𝑙𝑖𝑖,𝑡𝑡𝛼𝛼𝑖𝑖[(1 −𝛹𝛹𝑖𝑖)𝑘𝑘𝑖𝑖,𝑡𝑡−𝜈𝜈
𝑗𝑗 + 𝛹𝛹𝑖𝑖𝑗𝑗𝑖𝑖,𝑡𝑡−𝜈𝜈𝑗𝑗]−
1−𝛼𝛼𝑖𝑖ύjj − 𝑟𝑟𝑡𝑡𝑘𝑘𝑖𝑖,𝑡𝑡 − 𝑤𝑤𝑡𝑡𝑙𝑙𝑖𝑖,𝑡𝑡 − 𝑣𝑣𝑗𝑗 𝑗𝑗𝑖𝑖,𝑡𝑡 (4)
PtY
𝐺𝐺𝑡𝑡 = 𝐴𝐴𝐺𝐺𝑙𝑙𝐺𝐺,𝑡𝑡𝛼𝛼𝐺𝐺[(1 −𝛹𝛹𝐺𝐺)𝑘𝑘𝐺𝐺,𝑡𝑡
−𝜈𝜈𝑚𝑚,𝐺𝐺 + 𝛹𝛹𝐺𝐺𝑚𝑚𝐺𝐺,𝑡𝑡−𝜈𝜈𝑚𝑚,𝐺𝐺]−
1−𝛼𝛼𝐺𝐺𝜈𝜈𝑚𝑚,𝐺𝐺𝐺𝐺 (5)
𝐼𝐼𝑡𝑡 = 𝐴𝐴𝐼𝐼𝑙𝑙𝐼𝐼,𝑡𝑡𝛼𝛼𝐼𝐼[(1 −𝛹𝛹𝐼𝐼)𝑘𝑘𝐼𝐼,𝑡𝑡
−𝜈𝜈𝑚𝑚,𝐼𝐼 + 𝛹𝛹𝐼𝐼𝑚𝑚𝐼𝐼,𝑡𝑡−𝜈𝜈𝑚𝑚,𝐼𝐼]−
1−𝛼𝛼𝐼𝐼𝜈𝜈𝑚𝑚,𝐼𝐼𝐼𝐼 (6)
𝑄𝑄𝑡𝑡 = 𝐴𝐴𝑄𝑄𝑙𝑙𝑄𝑄,𝑡𝑡𝛼𝛼𝑄𝑄[(1 −𝛹𝛹𝑄𝑄)𝑘𝑘𝑄𝑄,𝑡𝑡
−𝜈𝜈𝑄𝑄 + 𝛹𝛹𝑄𝑄ℎ𝑡𝑡−𝜈𝜈𝑄𝑄]−
1−𝛼𝛼𝑄𝑄𝜈𝜈𝑄𝑄,𝑄𝑄𝑄𝑄 (7)
𝑅𝑅𝑡𝑡 = 𝐴𝐴𝑅𝑅𝑙𝑙𝑅𝑅,𝑡𝑡𝛼𝛼𝑅𝑅[(1 −𝛹𝛹𝑅𝑅)𝑘𝑘𝑅𝑅,𝑡𝑡
−𝜈𝜈𝑅𝑅 + 𝛹𝛹𝑅𝑅𝑧𝑧𝑡𝑡−𝜈𝜈𝑅𝑅]−
1−𝛼𝛼𝑅𝑅𝜈𝜈𝑅𝑅,𝑅𝑅𝑅𝑅 (8)
𝜈𝜈𝑚𝑚,𝐺𝐺
vte
ln 𝑣𝑣𝑡𝑡𝑒𝑒 = ′𝛺𝛺𝑣𝑣 + ω ln 𝑣𝑣𝑡𝑡−1𝑒𝑒 + 𝜂𝜂𝑡𝑡𝑂𝑂 (9) Ώ𝑣𝑣 (𝜂𝜂𝑡𝑡𝑂𝑂) 𝑈𝑈(𝑐𝑐𝑡𝑡𝐴𝐴, 𝑙𝑙𝑡𝑡) = 𝜑𝜑 𝑙𝑙𝑙𝑙𝑔𝑔 𝐶𝐶𝑡𝑡𝐴𝐴 + (1 − 𝜑𝜑)𝑙𝑙𝑙𝑙𝑔𝑔 (1 − 𝑙𝑙𝑡𝑡) (10)
𝐶𝐶𝑡𝑡𝐴𝐴 = 𝑋𝑋𝑡𝑡𝛾𝛾(𝜃𝜃𝑐𝑐𝑡𝑡
𝜌𝜌 + (1 − 𝜃𝜃)𝑒𝑒𝑡𝑡𝜌𝜌)
1−𝛾𝛾𝜌𝜌 (11)
𝑘𝑘𝑡𝑡+1 + 𝑐𝑐𝑡𝑡 + 𝑛𝑛.𝑋𝑋𝑡𝑡 + 𝑞𝑞𝑡𝑡𝑒𝑒. 𝑒𝑒𝑡𝑡 = (1 − 𝜏𝜏𝑙𝑙).𝑤𝑤𝑡𝑡 . 𝑙𝑙𝑡𝑡 + ъ + (1 − 𝜏𝜏𝑘𝑘). 𝑟𝑟𝑡𝑡 .𝑘𝑘𝑡𝑡 + (1 − 𝛿𝛿)𝑘𝑘𝑡𝑡 + 𝜋𝜋
𝐿𝐿 = ∑ 𝛽𝛽𝑡𝑡[(𝜑𝜑 𝑙𝑙𝑙𝑙𝑔𝑔 [𝑋𝑋𝑡𝑡𝛾𝛾(𝜃𝜃𝑐𝑐𝑡𝑡
𝜌𝜌 + (1 − 𝜃𝜃)𝑒𝑒𝑡𝑡𝜌𝜌)
1−𝛾𝛾𝜌𝜌 ]) + (1 − 𝜑𝜑) 𝑙𝑙𝑙𝑙𝑔𝑔(1 − 𝑙𝑙𝑡𝑡)] −∞
𝑡𝑡=0 𝜆𝜆𝑡𝑡[𝑘𝑘𝑡𝑡+1 + 𝑐𝑐𝑡𝑡 +𝑛𝑛.𝑋𝑋𝑡𝑡 + 𝑞𝑞𝑡𝑡𝑒𝑒. 𝑒𝑒𝑡𝑡 − (1 − 𝜏𝜏𝑙𝑙).𝑤𝑤𝑡𝑡 . 𝑙𝑙𝑡𝑡 − ъ − (1 − 𝜏𝜏𝑘𝑘). 𝑟𝑟𝑡𝑡 .𝑘𝑘𝑡𝑡 − (1 − 𝛿𝛿)𝑘𝑘𝑡𝑡] (13)
𝑐𝑐𝐺𝐺,𝑡𝑡 = 𝑤𝑤𝑡𝑡 . 𝑙𝑙𝐺𝐺,𝑡𝑡 + 𝑟𝑟𝑡𝑡 .𝑘𝑘𝐺𝐺,𝑡𝑡 + 𝑣𝑣𝑚𝑚.𝑚𝑚𝐺𝐺,𝑡𝑡 − 𝑃𝑃𝐺𝐺𝐴𝐴𝐺𝐺𝑙𝑙𝑡𝑡𝛼𝛼𝐺𝐺 [(1 −𝛹𝛹𝐺𝐺)𝑘𝑘𝐺𝐺,𝑡𝑡
−𝜈𝜈𝑚𝑚,𝐺𝐺 + 𝛹𝛹𝐺𝐺𝑚𝑚𝐺𝐺,𝑡𝑡−𝜈𝜈𝑚𝑚,𝐺𝐺]
− 1−𝛼𝛼𝐺𝐺𝜈𝜈𝑚𝑚,𝐺𝐺𝐺𝐺 (14)
𝑏𝑏 = 𝑃𝑃𝐺𝐺 .𝐺𝐺𝑡𝑡 + 𝑃𝑃𝐼𝐼 . 𝐼𝐼𝑡𝑡 + 𝑃𝑃𝑄𝑄.𝑄𝑄𝑡𝑡 − 𝑞𝑞𝑒𝑒. 𝑒𝑒𝑡𝑡 − 𝑞𝑞𝑠𝑠. 𝑠𝑠𝑡𝑡 − 𝑞𝑞𝑔𝑔.𝑔𝑔𝑡𝑡 (15)
(14)
Through the price schedule, there is an implicit government subsidy, as it purchases electricity from the producers at a higher price and sells it at a lower price. So, the negative of this subsidy is:19
𝐹𝐹𝑖𝑖(𝑙𝑙𝑖𝑖,𝑡𝑡 ,𝑘𝑘𝑖𝑖,𝑡𝑡 , 𝑗𝑗𝑖𝑖,𝑡𝑡) = 𝐴𝐴𝑖𝑖𝑙𝑙𝑖𝑖,𝑡𝑡𝛼𝛼𝑖𝑖[(1 −𝛹𝛹𝑖𝑖)𝑘𝑘𝑖𝑖,𝑡𝑡−𝜈𝜈
𝑗𝑗 + 𝛹𝛹𝑖𝑖𝑗𝑗𝑖𝑖,𝑡𝑡−𝜈𝜈𝑗𝑗]−
(1−𝛼𝛼𝑖𝑖)ύ𝑗𝑗𝑗𝑗 (1)
1 1+νj ύ
𝑗𝑗𝑗𝑗 𝜈𝜈𝑗𝑗ύ𝑗𝑗𝑗𝑗<1
𝑌𝑌𝑡𝑡 = 𝐴𝐴𝑡𝑡𝑌𝑌𝑙𝑙𝑌𝑌,𝑡𝑡𝛼𝛼𝑌𝑌[(1 −𝛹𝛹𝑌𝑌)𝑘𝑘𝑌𝑌,𝑡𝑡
−𝜈𝜈𝑔𝑔 + 𝛹𝛹𝑌𝑌𝑔𝑔𝑡𝑡−𝜈𝜈𝑔𝑔]−
1−α𝑌𝑌ύ𝑔𝑔𝑔𝑔 (2)
𝑋𝑋𝑡𝑡 = 𝑙𝑙𝑋𝑋,𝑡𝑡𝛼𝛼𝑋𝑋[(1 −𝛹𝛹𝑋𝑋)𝑘𝑘𝑋𝑋,𝑡𝑡
−𝜈𝜈𝑠𝑠 + 𝛹𝛹𝑋𝑋𝑠𝑠𝑡𝑡−𝜈𝜈𝑠𝑠]−
1−𝛼𝛼𝑋𝑋ύ𝑠𝑠𝑠𝑠 (3)
𝜋𝜋𝑖𝑖,𝑡𝑡 = max𝑃𝑃𝑡𝑡𝑖𝑖𝐴𝐴𝑖𝑖𝑙𝑙𝑖𝑖,𝑡𝑡𝛼𝛼𝑖𝑖[(1 −𝛹𝛹𝑖𝑖)𝑘𝑘𝑖𝑖,𝑡𝑡−𝜈𝜈
𝑗𝑗 + 𝛹𝛹𝑖𝑖𝑗𝑗𝑖𝑖,𝑡𝑡−𝜈𝜈𝑗𝑗]−
1−𝛼𝛼𝑖𝑖ύjj − 𝑟𝑟𝑡𝑡𝑘𝑘𝑖𝑖,𝑡𝑡 − 𝑤𝑤𝑡𝑡𝑙𝑙𝑖𝑖,𝑡𝑡 − 𝑣𝑣𝑗𝑗 𝑗𝑗𝑖𝑖,𝑡𝑡 (4)
PtY
𝐺𝐺𝑡𝑡 = 𝐴𝐴𝐺𝐺𝑙𝑙𝐺𝐺,𝑡𝑡𝛼𝛼𝐺𝐺[(1 −𝛹𝛹𝐺𝐺)𝑘𝑘𝐺𝐺,𝑡𝑡
−𝜈𝜈𝑚𝑚,𝐺𝐺 + 𝛹𝛹𝐺𝐺𝑚𝑚𝐺𝐺,𝑡𝑡−𝜈𝜈𝑚𝑚,𝐺𝐺]−
1−𝛼𝛼𝐺𝐺𝜈𝜈𝑚𝑚,𝐺𝐺𝐺𝐺 (5)
𝐼𝐼𝑡𝑡 = 𝐴𝐴𝐼𝐼𝑙𝑙𝐼𝐼,𝑡𝑡𝛼𝛼𝐼𝐼[(1 −𝛹𝛹𝐼𝐼)𝑘𝑘𝐼𝐼,𝑡𝑡
−𝜈𝜈𝑚𝑚,𝐼𝐼 + 𝛹𝛹𝐼𝐼𝑚𝑚𝐼𝐼,𝑡𝑡−𝜈𝜈𝑚𝑚,𝐼𝐼]−
1−𝛼𝛼𝐼𝐼𝜈𝜈𝑚𝑚,𝐼𝐼𝐼𝐼 (6)
𝑄𝑄𝑡𝑡 = 𝐴𝐴𝑄𝑄𝑙𝑙𝑄𝑄,𝑡𝑡𝛼𝛼𝑄𝑄[(1 −𝛹𝛹𝑄𝑄)𝑘𝑘𝑄𝑄,𝑡𝑡
−𝜈𝜈𝑄𝑄 + 𝛹𝛹𝑄𝑄ℎ𝑡𝑡−𝜈𝜈𝑄𝑄]−
1−𝛼𝛼𝑄𝑄𝜈𝜈𝑄𝑄,𝑄𝑄𝑄𝑄 (7)
𝑅𝑅𝑡𝑡 = 𝐴𝐴𝑅𝑅𝑙𝑙𝑅𝑅,𝑡𝑡𝛼𝛼𝑅𝑅[(1 −𝛹𝛹𝑅𝑅)𝑘𝑘𝑅𝑅,𝑡𝑡
−𝜈𝜈𝑅𝑅 + 𝛹𝛹𝑅𝑅𝑧𝑧𝑡𝑡−𝜈𝜈𝑅𝑅]−
1−𝛼𝛼𝑅𝑅𝜈𝜈𝑅𝑅,𝑅𝑅𝑅𝑅 (8)
𝜈𝜈𝑚𝑚,𝐺𝐺
vte
ln 𝑣𝑣𝑡𝑡𝑒𝑒 = ′𝛺𝛺𝑣𝑣 + ω ln 𝑣𝑣𝑡𝑡−1𝑒𝑒 + 𝜂𝜂𝑡𝑡𝑂𝑂 (9) Ώ𝑣𝑣 (𝜂𝜂𝑡𝑡𝑂𝑂) 𝑈𝑈(𝑐𝑐𝑡𝑡𝐴𝐴, 𝑙𝑙𝑡𝑡) = 𝜑𝜑 𝑙𝑙𝑙𝑙𝑔𝑔 𝐶𝐶𝑡𝑡𝐴𝐴 + (1 − 𝜑𝜑)𝑙𝑙𝑙𝑙𝑔𝑔 (1 − 𝑙𝑙𝑡𝑡) (10)
𝐶𝐶𝑡𝑡𝐴𝐴 = 𝑋𝑋𝑡𝑡𝛾𝛾(𝜃𝜃𝑐𝑐𝑡𝑡
𝜌𝜌 + (1 − 𝜃𝜃)𝑒𝑒𝑡𝑡𝜌𝜌)
1−𝛾𝛾𝜌𝜌 (11)
𝑘𝑘𝑡𝑡+1 + 𝑐𝑐𝑡𝑡 + 𝑛𝑛.𝑋𝑋𝑡𝑡 + 𝑞𝑞𝑡𝑡𝑒𝑒. 𝑒𝑒𝑡𝑡 = (1 − 𝜏𝜏𝑙𝑙).𝑤𝑤𝑡𝑡 . 𝑙𝑙𝑡𝑡 + ъ + (1 − 𝜏𝜏𝑘𝑘). 𝑟𝑟𝑡𝑡 .𝑘𝑘𝑡𝑡 + (1 − 𝛿𝛿)𝑘𝑘𝑡𝑡 + 𝜋𝜋
𝐿𝐿 = ∑ 𝛽𝛽𝑡𝑡[(𝜑𝜑 𝑙𝑙𝑙𝑙𝑔𝑔 [𝑋𝑋𝑡𝑡𝛾𝛾(𝜃𝜃𝑐𝑐𝑡𝑡
𝜌𝜌 + (1 − 𝜃𝜃)𝑒𝑒𝑡𝑡𝜌𝜌)
1−𝛾𝛾𝜌𝜌 ]) + (1 − 𝜑𝜑) 𝑙𝑙𝑙𝑙𝑔𝑔(1 − 𝑙𝑙𝑡𝑡)] −∞
𝑡𝑡=0 𝜆𝜆𝑡𝑡[𝑘𝑘𝑡𝑡+1 + 𝑐𝑐𝑡𝑡 +𝑛𝑛.𝑋𝑋𝑡𝑡 + 𝑞𝑞𝑡𝑡𝑒𝑒. 𝑒𝑒𝑡𝑡 − (1 − 𝜏𝜏𝑙𝑙).𝑤𝑤𝑡𝑡 . 𝑙𝑙𝑡𝑡 − ъ − (1 − 𝜏𝜏𝑘𝑘). 𝑟𝑟𝑡𝑡 .𝑘𝑘𝑡𝑡 − (1 − 𝛿𝛿)𝑘𝑘𝑡𝑡] (13)
𝑐𝑐𝐺𝐺,𝑡𝑡 = 𝑤𝑤𝑡𝑡 . 𝑙𝑙𝐺𝐺,𝑡𝑡 + 𝑟𝑟𝑡𝑡 .𝑘𝑘𝐺𝐺,𝑡𝑡 + 𝑣𝑣𝑚𝑚.𝑚𝑚𝐺𝐺,𝑡𝑡 − 𝑃𝑃𝐺𝐺𝐴𝐴𝐺𝐺𝑙𝑙𝑡𝑡𝛼𝛼𝐺𝐺 [(1 −𝛹𝛹𝐺𝐺)𝑘𝑘𝐺𝐺,𝑡𝑡
−𝜈𝜈𝑚𝑚,𝐺𝐺 + 𝛹𝛹𝐺𝐺𝑚𝑚𝐺𝐺,𝑡𝑡−𝜈𝜈𝑚𝑚,𝐺𝐺]
− 1−𝛼𝛼𝐺𝐺𝜈𝜈𝑚𝑚,𝐺𝐺𝐺𝐺 (14)
𝑏𝑏 = 𝑃𝑃𝐺𝐺 .𝐺𝐺𝑡𝑡 + 𝑃𝑃𝐼𝐼 . 𝐼𝐼𝑡𝑡 + 𝑃𝑃𝑄𝑄.𝑄𝑄𝑡𝑡 − 𝑞𝑞𝑒𝑒. 𝑒𝑒𝑡𝑡 − 𝑞𝑞𝑠𝑠. 𝑠𝑠𝑡𝑡 − 𝑞𝑞𝑔𝑔.𝑔𝑔𝑡𝑡 (15) (15)
The government budget constraint is as follows:
𝜏𝜏𝑙𝑙 .𝑤𝑤𝑡𝑡 . 𝑙𝑙𝑡𝑡 + 𝜏𝜏𝑘𝑘. 𝑟𝑟𝑡𝑡 .𝑘𝑘𝑡𝑡 + (𝑣𝑣𝑚𝑚 − 𝛿𝛿𝐶𝐶)(𝑚𝑚𝐼𝐼,𝑡𝑡 + 𝑚𝑚𝐺𝐺,𝑡𝑡) + (𝑣𝑣ℎ − 𝑣𝑣𝑒𝑒)ℎ𝑡𝑡𝑃𝑃𝐺𝐺 .𝐺𝐺𝑡𝑡 − 𝑟𝑟𝑡𝑡 .𝑘𝑘𝐺𝐺,𝑡𝑡 − 𝑤𝑤𝑡𝑡 . 𝑙𝑙𝐺𝐺,𝑡𝑡 −𝑣𝑣𝑚𝑚.𝑚𝑚𝐺𝐺,𝑡𝑡 − ъ𝑡𝑡 = 𝑏𝑏𝑡𝑡 (16) 𝑘𝑘𝑡𝑡+1 = 𝑌𝑌𝑡𝑡 − 𝑐𝑐𝑡𝑡 − 𝑣𝑣𝑒𝑒.ℎ𝑡𝑡 + (1 − 𝛿𝛿)𝑘𝑘𝑡𝑡 − 𝛿𝛿𝐶𝐶(𝑚𝑚𝐼𝐼,𝑡𝑡 + 𝑚𝑚𝐺𝐺,𝑡𝑡) (17) 𝑙𝑙 = 𝑙𝑙𝑄𝑄 + 𝑙𝑙𝐼𝐼 + 𝑙𝑙𝐺𝐺 + 𝑙𝑙𝑅𝑅 + 𝑙𝑙𝑌𝑌 + 𝑙𝑙𝑋𝑋 (18) 𝑘𝑘 = 𝑘𝑘𝑄𝑄 + 𝑘𝑘𝐼𝐼 + 𝑘𝑘𝐺𝐺 + 𝑘𝑘𝑅𝑅 + 𝑘𝑘𝑌𝑌 + 𝑘𝑘𝑋𝑋 (19) 𝑒𝑒𝑡𝑡 + 𝑠𝑠𝑡𝑡 + 𝑔𝑔𝑡𝑡 = (𝑄𝑄𝑡𝑡 + 𝐼𝐼𝑡𝑡 + 𝐺𝐺𝑡𝑡 + 𝑅𝑅𝑡𝑡) (20)
𝜏𝜏𝑙𝑙 .𝑤𝑤𝑡𝑡 . 𝑙𝑙𝑡𝑡 + 𝜏𝜏𝑘𝑘. 𝑟𝑟𝑡𝑡 .𝑘𝑘𝑡𝑡 + (𝑣𝑣𝑚𝑚 − 𝛿𝛿𝐶𝐶)(𝑚𝑚𝐼𝐼,𝑡𝑡 + 𝑚𝑚𝐺𝐺,𝑡𝑡) + (𝑣𝑣ℎ − 𝑣𝑣𝑒𝑒)ℎ𝑡𝑡𝑃𝑃𝐺𝐺 .𝐺𝐺𝑡𝑡 − 𝑟𝑟𝑡𝑡 .𝑘𝑘𝐺𝐺,𝑡𝑡 − 𝑤𝑤𝑡𝑡 . 𝑙𝑙𝐺𝐺,𝑡𝑡 −𝑣𝑣𝑚𝑚.𝑚𝑚𝐺𝐺,𝑡𝑡 − ъ𝑡𝑡 = 𝑏𝑏𝑡𝑡 (16) 𝑘𝑘𝑡𝑡+1 = 𝑌𝑌𝑡𝑡 − 𝑐𝑐𝑡𝑡 − 𝑣𝑣𝑒𝑒.ℎ𝑡𝑡 + (1 − 𝛿𝛿)𝑘𝑘𝑡𝑡 − 𝛿𝛿𝐶𝐶(𝑚𝑚𝐼𝐼,𝑡𝑡 + 𝑚𝑚𝐺𝐺,𝑡𝑡) (17) 𝑙𝑙 = 𝑙𝑙𝑄𝑄 + 𝑙𝑙𝐼𝐼 + 𝑙𝑙𝐺𝐺 + 𝑙𝑙𝑅𝑅 + 𝑙𝑙𝑌𝑌 + 𝑙𝑙𝑋𝑋 (18) 𝑘𝑘 = 𝑘𝑘𝑄𝑄 + 𝑘𝑘𝐼𝐼 + 𝑘𝑘𝐺𝐺 + 𝑘𝑘𝑅𝑅 + 𝑘𝑘𝑌𝑌 + 𝑘𝑘𝑋𝑋 (19) 𝑒𝑒𝑡𝑡 + 𝑠𝑠𝑡𝑡 + 𝑔𝑔𝑡𝑡 = (𝑄𝑄𝑡𝑡 + 𝐼𝐼𝑡𝑡 + 𝐺𝐺𝑡𝑡 + 𝑅𝑅𝑡𝑡) (20)
(16)
18 Since the electricity producers operate in decreasing returns to scale, their profit will be handed back to the households.19 qS and qg are the electricity prices for the service and industrial sector, whereas PG is the selling price of electricity by the
government.

134
PROSPECTS FOR TRANSITIONING FROM A LINEAR TO CIRCULAR ECONOMY IN DEVELOPING ASIA
Finally, the economy-wide resource constraint is obtained by combining the household budget constraint, the government budget constraint, and the subsidy equation:
𝜏𝜏𝑙𝑙 .𝑤𝑤𝑡𝑡 . 𝑙𝑙𝑡𝑡 + 𝜏𝜏𝑘𝑘. 𝑟𝑟𝑡𝑡 .𝑘𝑘𝑡𝑡 + (𝑣𝑣𝑚𝑚 − 𝛿𝛿𝐶𝐶)(𝑚𝑚𝐼𝐼,𝑡𝑡 + 𝑚𝑚𝐺𝐺,𝑡𝑡) + (𝑣𝑣ℎ − 𝑣𝑣𝑒𝑒)ℎ𝑡𝑡𝑃𝑃𝐺𝐺 .𝐺𝐺𝑡𝑡 − 𝑟𝑟𝑡𝑡 .𝑘𝑘𝐺𝐺,𝑡𝑡 − 𝑤𝑤𝑡𝑡 . 𝑙𝑙𝐺𝐺,𝑡𝑡 −𝑣𝑣𝑚𝑚.𝑚𝑚𝐺𝐺,𝑡𝑡 − ъ𝑡𝑡 = 𝑏𝑏𝑡𝑡 (16) 𝑘𝑘𝑡𝑡+1 = 𝑌𝑌𝑡𝑡 − 𝑐𝑐𝑡𝑡 − 𝑣𝑣𝑒𝑒.ℎ𝑡𝑡 + (1 − 𝛿𝛿)𝑘𝑘𝑡𝑡 − 𝛿𝛿𝐶𝐶(𝑚𝑚𝐼𝐼,𝑡𝑡 + 𝑚𝑚𝐺𝐺,𝑡𝑡) (17) 𝑙𝑙 = 𝑙𝑙𝑄𝑄 + 𝑙𝑙𝐼𝐼 + 𝑙𝑙𝐺𝐺 + 𝑙𝑙𝑅𝑅 + 𝑙𝑙𝑌𝑌 + 𝑙𝑙𝑋𝑋 (18) 𝑘𝑘 = 𝑘𝑘𝑄𝑄 + 𝑘𝑘𝐼𝐼 + 𝑘𝑘𝐺𝐺 + 𝑘𝑘𝑅𝑅 + 𝑘𝑘𝑌𝑌 + 𝑘𝑘𝑋𝑋 (19) 𝑒𝑒𝑡𝑡 + 𝑠𝑠𝑡𝑡 + 𝑔𝑔𝑡𝑡 = (𝑄𝑄𝑡𝑡 + 𝐼𝐼𝑡𝑡 + 𝐺𝐺𝑡𝑡 + 𝑅𝑅𝑡𝑡) (20)
(17)
8.4.5 Equilibrium Conditions
The equilibrium conditions for the labor, capital, and electricity markets are:
𝜏𝜏𝑙𝑙 .𝑤𝑤𝑡𝑡 . 𝑙𝑙𝑡𝑡 + 𝜏𝜏𝑘𝑘. 𝑟𝑟𝑡𝑡 .𝑘𝑘𝑡𝑡 + (𝑣𝑣𝑚𝑚 − 𝛿𝛿𝐶𝐶)(𝑚𝑚𝐼𝐼,𝑡𝑡 + 𝑚𝑚𝐺𝐺,𝑡𝑡) + (𝑣𝑣ℎ − 𝑣𝑣𝑒𝑒)ℎ𝑡𝑡𝑃𝑃𝐺𝐺 .𝐺𝐺𝑡𝑡 − 𝑟𝑟𝑡𝑡 .𝑘𝑘𝐺𝐺,𝑡𝑡 − 𝑤𝑤𝑡𝑡 . 𝑙𝑙𝐺𝐺,𝑡𝑡 −𝑣𝑣𝑚𝑚.𝑚𝑚𝐺𝐺,𝑡𝑡 − ъ𝑡𝑡 = 𝑏𝑏𝑡𝑡 (16) 𝑘𝑘𝑡𝑡+1 = 𝑌𝑌𝑡𝑡 − 𝑐𝑐𝑡𝑡 − 𝑣𝑣𝑒𝑒.ℎ𝑡𝑡 + (1 − 𝛿𝛿)𝑘𝑘𝑡𝑡 − 𝛿𝛿𝐶𝐶(𝑚𝑚𝐼𝐼,𝑡𝑡 + 𝑚𝑚𝐺𝐺,𝑡𝑡) (17) 𝑙𝑙 = 𝑙𝑙𝑄𝑄 + 𝑙𝑙𝐼𝐼 + 𝑙𝑙𝐺𝐺 + 𝑙𝑙𝑅𝑅 + 𝑙𝑙𝑌𝑌 + 𝑙𝑙𝑋𝑋 (18) 𝑘𝑘 = 𝑘𝑘𝑄𝑄 + 𝑘𝑘𝐼𝐼 + 𝑘𝑘𝐺𝐺 + 𝑘𝑘𝑅𝑅 + 𝑘𝑘𝑌𝑌 + 𝑘𝑘𝑋𝑋 (19) 𝑒𝑒𝑡𝑡 + 𝑠𝑠𝑡𝑡 + 𝑔𝑔𝑡𝑡 = (𝑄𝑄𝑡𝑡 + 𝐼𝐼𝑡𝑡 + 𝐺𝐺𝑡𝑡 + 𝑅𝑅𝑡𝑡) (20)
(18)
𝜏𝜏𝑙𝑙 .𝑤𝑤𝑡𝑡 . 𝑙𝑙𝑡𝑡 + 𝜏𝜏𝑘𝑘. 𝑟𝑟𝑡𝑡 .𝑘𝑘𝑡𝑡 + (𝑣𝑣𝑚𝑚 − 𝛿𝛿𝐶𝐶)(𝑚𝑚𝐼𝐼,𝑡𝑡 + 𝑚𝑚𝐺𝐺,𝑡𝑡) + (𝑣𝑣ℎ − 𝑣𝑣𝑒𝑒)ℎ𝑡𝑡𝑃𝑃𝐺𝐺 .𝐺𝐺𝑡𝑡 − 𝑟𝑟𝑡𝑡 .𝑘𝑘𝐺𝐺,𝑡𝑡 − 𝑤𝑤𝑡𝑡 . 𝑙𝑙𝐺𝐺,𝑡𝑡 −𝑣𝑣𝑚𝑚.𝑚𝑚𝐺𝐺,𝑡𝑡 − ъ𝑡𝑡 = 𝑏𝑏𝑡𝑡 (16) 𝑘𝑘𝑡𝑡+1 = 𝑌𝑌𝑡𝑡 − 𝑐𝑐𝑡𝑡 − 𝑣𝑣𝑒𝑒.ℎ𝑡𝑡 + (1 − 𝛿𝛿)𝑘𝑘𝑡𝑡 − 𝛿𝛿𝐶𝐶(𝑚𝑚𝐼𝐼,𝑡𝑡 + 𝑚𝑚𝐺𝐺,𝑡𝑡) (17) 𝑙𝑙 = 𝑙𝑙𝑄𝑄 + 𝑙𝑙𝐼𝐼 + 𝑙𝑙𝐺𝐺 + 𝑙𝑙𝑅𝑅 + 𝑙𝑙𝑌𝑌 + 𝑙𝑙𝑋𝑋 (18) 𝑘𝑘 = 𝑘𝑘𝑄𝑄 + 𝑘𝑘𝐼𝐼 + 𝑘𝑘𝐺𝐺 + 𝑘𝑘𝑅𝑅 + 𝑘𝑘𝑌𝑌 + 𝑘𝑘𝑋𝑋 (19) 𝑒𝑒𝑡𝑡 + 𝑠𝑠𝑡𝑡 + 𝑔𝑔𝑡𝑡 = (𝑄𝑄𝑡𝑡 + 𝐼𝐼𝑡𝑡 + 𝐺𝐺𝑡𝑡 + 𝑅𝑅𝑡𝑡) (20)
(19)
𝜏𝜏𝑙𝑙 .𝑤𝑤𝑡𝑡 . 𝑙𝑙𝑡𝑡 + 𝜏𝜏𝑘𝑘. 𝑟𝑟𝑡𝑡 .𝑘𝑘𝑡𝑡 + (𝑣𝑣𝑚𝑚 − 𝛿𝛿𝐶𝐶)(𝑚𝑚𝐼𝐼,𝑡𝑡 + 𝑚𝑚𝐺𝐺,𝑡𝑡) + (𝑣𝑣ℎ − 𝑣𝑣𝑒𝑒)ℎ𝑡𝑡𝑃𝑃𝐺𝐺 .𝐺𝐺𝑡𝑡 − 𝑟𝑟𝑡𝑡 .𝑘𝑘𝐺𝐺,𝑡𝑡 − 𝑤𝑤𝑡𝑡 . 𝑙𝑙𝐺𝐺,𝑡𝑡 −𝑣𝑣𝑚𝑚.𝑚𝑚𝐺𝐺,𝑡𝑡 − ъ𝑡𝑡 = 𝑏𝑏𝑡𝑡 (16) 𝑘𝑘𝑡𝑡+1 = 𝑌𝑌𝑡𝑡 − 𝑐𝑐𝑡𝑡 − 𝑣𝑣𝑒𝑒.ℎ𝑡𝑡 + (1 − 𝛿𝛿)𝑘𝑘𝑡𝑡 − 𝛿𝛿𝐶𝐶(𝑚𝑚𝐼𝐼,𝑡𝑡 + 𝑚𝑚𝐺𝐺,𝑡𝑡) (17) 𝑙𝑙 = 𝑙𝑙𝑄𝑄 + 𝑙𝑙𝐼𝐼 + 𝑙𝑙𝐺𝐺 + 𝑙𝑙𝑅𝑅 + 𝑙𝑙𝑌𝑌 + 𝑙𝑙𝑋𝑋 (18) 𝑘𝑘 = 𝑘𝑘𝑄𝑄 + 𝑘𝑘𝐼𝐼 + 𝑘𝑘𝐺𝐺 + 𝑘𝑘𝑅𝑅 + 𝑘𝑘𝑌𝑌 + 𝑘𝑘𝑋𝑋 (19) 𝑒𝑒𝑡𝑡 + 𝑠𝑠𝑡𝑡 + 𝑔𝑔𝑡𝑡 = (𝑄𝑄𝑡𝑡 + 𝐼𝐼𝑡𝑡 + 𝐺𝐺𝑡𝑡 + 𝑅𝑅𝑡𝑡) (20)
(20)
8.4.6 CO2 Emissions
Our model assumes that to generate electricity, the government power producers (G) and the independent power producers (I) use natural gas, the quick rental companies (Q) oil, and the WTE company (R) solid municipal waste (SMW). Using data from the United States Energy Information Administration and calculations from IPCC (2006) for MSW, we model natural gas as releasing 0.41 kilograms of CO2 to generate 1 kilowatt-hour of electricity, oil 0.97 kilograms of CO2, and SMW 0.60 kilograms of CO2 to generate 1 kilowatt-hour of electricity (see section 8.5 for further information on those parameters);20 we therefore specify the CO2 equation as follows:
𝐶𝐶𝐶𝐶2 = 0.41(𝐺𝐺𝑡𝑡+𝐼𝐼𝑡𝑡) + 0.97𝑄𝑄𝑡𝑡 + 0.60 Rt (21)
8.5 Parameter Specification and Electricity Price Schedule For the non-waste sectors, we take the parameter values, calibrated on Bangladesh data, from Amin et al. (2019). All calibrated parameters (annual frequency) used in this chapter are presented below in Table 8.1. As in Amin et al. (2021), we set the capital and labor income tax rates τ k and τ l to 0.15 and 0.10, respectively.
The prices (treated as parameters) are shown in Table 8.2. All prices, apart from those related to waste, are taken from Amin et al. (2021).
20 The IPCC (2006) calculations for MSW include organic and nonorganic waste. We could not source a corresponding parameter for organic waste only. Estimates for biomass are available from IPCC (2012), but those do not include plastic, which is a component of organic waste. The important feature for our analysis is that emissions from combustion of natural gas are lower than from MSW. This is supported by available data and existing literature on WTE incineration studies.

135
THE CASE OF WASTE TO ENERGY IN BANGLADESH
Table 8.1: Parameters
Parameter Description Value
θ Utility: non-electricity consumption share 0.91
γ Utility: service share 0.81
ϕ Utility: consumption versus leisure share 0.60
αYProduction: industry labor share 0.2
αXProduction: service labor share 0.313
αGProduction: government electricity labor share 0.042
αIProduction: IPP electricity labor share 0.036
αHProduction: QR electricity labor share 0.004
αRProduction: WTE electricity labor share 0.15
ΨYProduction: industry electricity share 0.073
ΨXProduction: service electricity share 0.079
ΨGProduction: government electricity gas share 0.302
ΨIProduction: IPP electricity gas share 0.309
ΨHProduction: QR electricity oil share 0.596
ΨRProduction: WTE electricity waste share 0.432
ν g Production: industry EOS between capital and electricity 0.1
ν s Production: service EOS between capital and electricity 0.1
ν m,G Production: govt. electricity EOS between capital and gas 0.1
ν m,I Production: IPP EOS between capital and gas used in IPP 0.1
ν Q Production: QR EOS between capital and oil 0.1
ν m,R Production: WTE EOS between capital and waste 0.197
ύ gg Production: industry degree of homogeneity 0.229
ύ ss Production: service degree of homogeneity 0.234
ν m,GG Production: govt. electricity degree of homogeneity 0.223
ν m,II Production: IPP degree of homogeneity 0.223
ν Q,QQ Production: QR degree of homogeneity 0.222
ν R,RR Production: WTE degree of homogeneity 0.208
AYProduction: industry TFP 0.988
AXProduction: service TFP 1
AGProduction: government electricity TFP 0.870
AIProduction: IPP TFP 0.823
AHProduction: QR TFP 0.817
ARProduction: WTE TFP 0.814
ω Oil price shock persistence 0.95
Ώv Oil price level parameter 0.105
ζ, Standard deviations of oil price shock 0.002
EOS = elasticity of substitution, IPP = independent power producer, QR = quick rental company, TFP = total factor productivity, WTE = waste to energy.
Source: Amin et al. (2019, 2021) and authors.

136
PROSPECTS FOR TRANSITIONING FROM A LINEAR TO CIRCULAR ECONOMY IN DEVELOPING ASIA
We set the price for selling electricity from the incineration plant to Tk18.295/kWh, which is the planned price for selling electricity from WTE at the initial stage of production (Byron and Alam 2020). Reflecting the lower labor intensity of incineration plants, we set αR = 0.15. We set returns to scale in capital and waste to 0.955 (i.e., close to 1, so doubling capital and doubling waste nearly double electricity output). To find ΨR, ν R, and ύRR, we calibrate the model so that when labor and capital are chosen optimally, the electricity-to-waste ratio matches the Baku WTE Project in Azerbaijan (ADB 2020).21 One main reason to calibrate the model to the Baku WTE Project is its association with the Balakhani landfill (where 90% of total waste generated in Baku City is disposed), which exhibits similar features to the Aminbazar landfill in the Dhaka North City Corporation area (where the first Dhaka WTE power plant is planned to be built). The waste z is set so it corresponds to 3,000 metric tons per day on an annual basis as for the Dhaka WTE proposal by CMEC.22 Finally, we calibrate total factor productivity AR to fit with the Baku plant.
For calculating CO2 emissions, we use the conversion 410 g and 970 g CO2 per kWh electricity generated using gas and oil, respectively, per the United States Energy Information Administration (2021). For the carbon emissions from the waste incineration plant, we take the value of 600 g CO2/kWh, which is consistent with the IPCC (2006) calculation method and widely used in the literature on WTE.
21 For more details about the Baku WTE Project, see ADB (2020).22 For more details, see Mamun (2020).
Table 8.2: Electricity and Fuel Prices (Tk/kWh)
Price Description Valueqe Household’s electricity buying price 4.93qg Industry’s electricity buying price 6.95qs Service sector’s electricity buying price 9.00PI IPP’s electricity selling price 3.20PH QR’s electricity selling price 7.79PG Government’s electricity selling price 2.3PR WTE plant’s electricity selling price 18.295ve International oil price (long run value) 8.19vh QR’s oil purchase price 5.72vm Natural gas selling price 0.77
IPP = independent power producer, kWh = kilowatt-hour, QR = quick rental company, WTE = waste to energy.
Source: Amin et al. (2021) and authors.
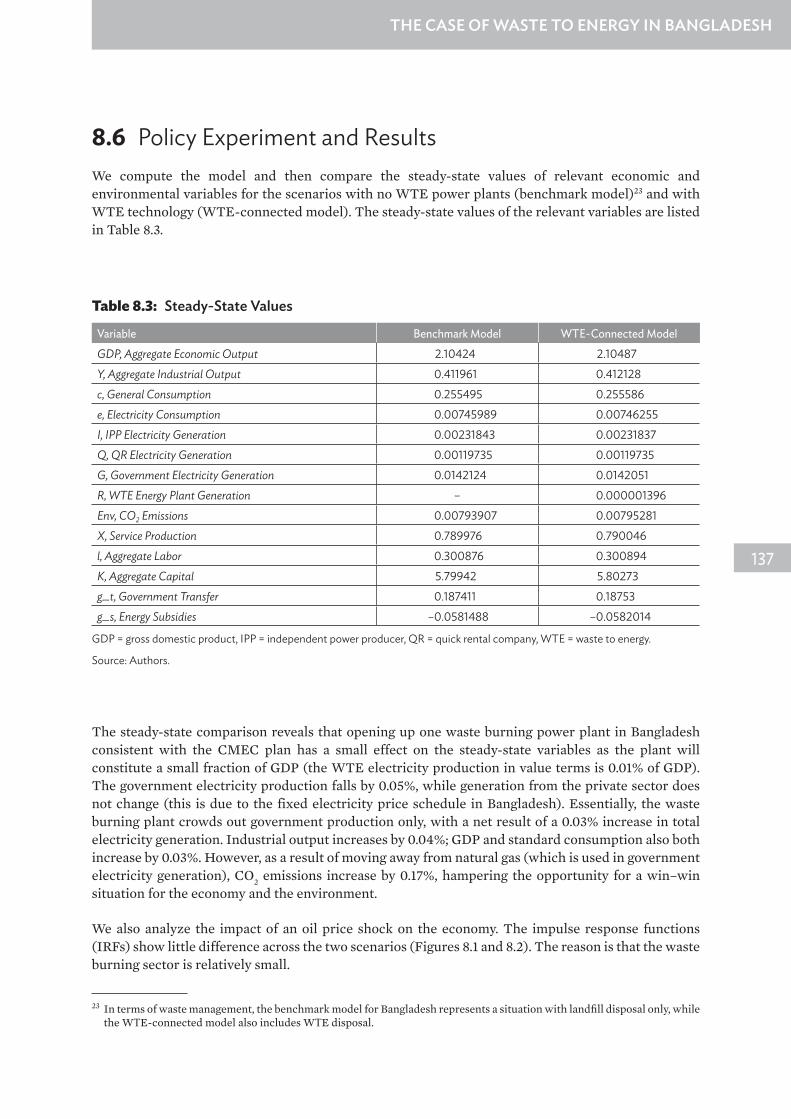
137
THE CASE OF WASTE TO ENERGY IN BANGLADESH
8.6 Policy Experiment and ResultsWe compute the model and then compare the steady-state values of relevant economic and environmental variables for the scenarios with no WTE power plants (benchmark model)23 and with WTE technology (WTE-connected model). The steady-state values of the relevant variables are listed in Table 8.3.
The steady-state comparison reveals that opening up one waste burning power plant in Bangladesh consistent with the CMEC plan has a small effect on the steady-state variables as the plant will constitute a small fraction of GDP (the WTE electricity production in value terms is 0.01% of GDP). The government electricity production falls by 0.05%, while generation from the private sector does not change (this is due to the fixed electricity price schedule in Bangladesh). Essentially, the waste burning plant crowds out government production only, with a net result of a 0.03% increase in total electricity generation. Industrial output increases by 0.04%; GDP and standard consumption also both increase by 0.03%. However, as a result of moving away from natural gas (which is used in government electricity generation), CO2 emissions increase by 0.17%, hampering the opportunity for a win–win situation for the economy and the environment.
We also analyze the impact of an oil price shock on the economy. The impulse response functions (IRFs) show little difference across the two scenarios (Figures 8.1 and 8.2). The reason is that the waste burning sector is relatively small.
23 In terms of waste management, the benchmark model for Bangladesh represents a situation with landfill disposal only, while the WTE-connected model also includes WTE disposal.
Table 8.3: Steady-State Values
Variable Benchmark Model WTE-Connected ModelGDP, Aggregate Economic Output 2.10424 2.10487Y, Aggregate Industrial Output 0.411961 0.412128c, General Consumption 0.255495 0.255586e, Electricity Consumption 0.00745989 0.00746255I, IPP Electricity Generation 0.00231843 0.00231837Q, QR Electricity Generation 0.00119735 0.00119735G, Government Electricity Generation 0.0142124 0.0142051R, WTE Energy Plant Generation – 0.000001396Env, CO2 Emissions 0.00793907 0.00795281X, Service Production 0.789976 0.790046l, Aggregate Labor 0.300876 0.300894K, Aggregate Capital 5.79942 5.80273g_t, Government Transfer 0.187411 0.18753g_s, Energy Subsidies –0.0581488 –0.0582014
GDP = gross domestic product, IPP = independent power producer, QR = quick rental company, WTE = waste to energy.
Source: Authors.

138
PROSPECTS FOR TRANSITIONING FROM A LINEAR TO CIRCULAR ECONOMY IN DEVELOPING ASIA
Figure 8.1: Impulse Responses to an Oil Price Shock in the Benchmark Model
CO2 = carbon dioxide, GDP = gross domestic product.
Source: Authors.
−0.6
−0.8
−0.4
−0.2
0.0GDP
c ex10−3
y
20 40 60 80 100 120 140 20 40 60 80 100 120 140
20 40 60 80 100 120 140 20 40 60 80 100 120 140
0.10
0.08
0.08
0.08
0.08
0.00
−0.02
−0.6
−0.8
−1.0
−0.4
−0.2
0.0
−1.5
−2.0
−2.5
−3.0
−1.0
−0.5
0.0
0
−1
1
2
3
−3
−4
−5
−2
−1
0
0
−4
−2
2
−0.5
−2.0
−1.0
−1.5
0.0
4
6
20 40 60
I Qx10−5x10⁻⁴
G CO2x10−3x10⁻³
80 100 120 140 20 40 60 80 100 120 140
20 40 60 80 100 120 140 20 40 60 80 100 120 140
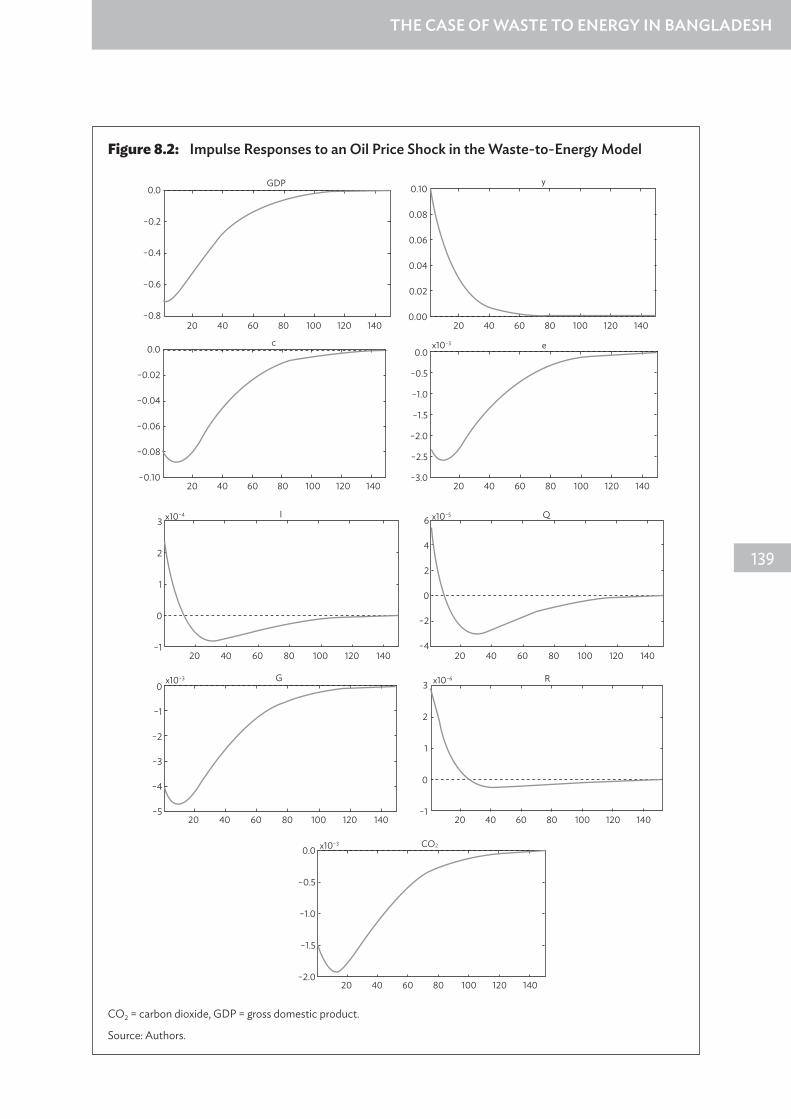
139
THE CASE OF WASTE TO ENERGY IN BANGLADESH
Figure 8.2: Impulse Responses to an Oil Price Shock in the Waste-to-Energy Model
CO2 = carbon dioxide, GDP = gross domestic product.
Source: Authors.
−0.6
−0.8
−0.4
−0.2
0.0GDP
c ex10−3
y
20 40 60 80 100 120 140 20 40 60 80 100 120 140
20 40 60 80 100 120 140 20 40 60 80 100 120 140
0.10
0.08
0.06
0.04
0.02
0.00
−0.06
−0.08
−0.10
−0.04
−0.02
0.0
−1.5
−2.0
−2.5
−3.0
−1.0
−0.5
0.0
0
−1
1
2
3
−3
−4
−5
−2
−1
0
0
−4
−2
2
2
−1
1
0
3
4
6
20 40 60
I Qx10−5x10⁻⁴
G Rx10−6x10⁻³
80 100 120 140 20 40 60 80 100 120 140
20 40 60 80 100 120 140 20 40 60 80 100 120 140
−0.5
−2.0
−1.0
−1.5
0.0CO2x10−3
20 40 60 80 100 120 140

140
PROSPECTS FOR TRANSITIONING FROM A LINEAR TO CIRCULAR ECONOMY IN DEVELOPING ASIA
8.7 Conclusion and Policy RecommendationsBangladesh has made significant progress over the past decade from a socioeconomic standpoint and is now known as the new Asian Tiger for its remarkable development. During this time, the Bangladesh economy has been growing steadily at 7% on average every year, elevating millions of people out of poverty. The energy sector has played a crucial role in achieving this landmark success. However, the sector is characterized by market distortions as the Bangladesh government regulates energy prices and subsidizes energy consumption by keeping prices below costs. Amin (2015) argues that these distortions substantially delay the transition toward a sustainable energy mix.
As a game changer, the government has recently considered opening the first WTE power plant in the country. This chapter has presented a fit-for-purpose DSGE model to assess the implications for the Bangladesh economy of introducing a WTE power plant in the electricity generation sector. We calibrate the Bangladesh economy model and run a policy experiment based on the proposal put forward by CMEC (Byron and Alam 2020). Our results show that transitioning toward an energy sector in which WTE power plants are present increases key macroeconomic variables. For illustration purposes, based on the one plant policy experiment, we find a 0.03% increase in total electricity generation, a 0.04% increase in industrial output, and a 0.04% boost in GDP and standard consumption. However, as a result of moving away from natural gas (which is used predominately in the government electricity generation), CO2 emissions increase by 0.17%. This is due to the WTE plants crowding out government power generation that is fueled by natural gas. Given the Bangladesh electricity price system, gas, oil, and electricity prices are fixed. Thus, the private producers will only change their production if the interest rate and the wage rate change. Consequently, increased supply of electricity when the waste plant is connected to the grid will not crowd out the private electricity generation. The government electricity producer acts to clear the market (swing producer) and therefore cuts its production.
According to our IRF analysis, moving toward a more sustainable energy sector via the introduction of WTE technology does not make the Bangladesh economy less sensitive to oil price shocks; in our policy experiment, the economy is still significantly reliant on oil.
Overall, our study shows that transitioning away from fossil fuel toward WTE has the potential to increase Bangladesh’s overall production, consumption, and GDP. However, we have also found that CO2 emissions will increase due to natural gas in electricity generation being displaced by waste incineration.
One dimension that we have not explored is the pollution impact of the proposed Dhaka incinerator and its effect on human health and ecosystems, with toxic substances and ash releases being of particular concern. A firm regulatory approach from the government would be needed to ensure that up-front recycling and reuse of waste is pursued and clean technology is deployed to process the residual waste. Besides, the increase in Bangladesh’s macroeconomic variables such as production, consumption, and GDP from opening the grid to the Dhaka incinerator can in turn increase GHG emissions, pollution levels, and amount of waste. Therefore, it is even more important that regulatory actions are in place and the polluter pays principle is effectively adopted (e.g., via carbon or energy taxes). In this respect, the need to align policies with Bangladesh’s Paris Agreement pledge to reduce GHG emissions by 15% with respect to business as usual by 2030 can accelerate the transition toward sustainable development in the country.
Based on our results, this study provides the following policy implications. First, it advocates the case for removing energy market distortions as they are the fundamental cause of the increase in CO2 emissions from opening the grid to the WTE power plant. Furthermore, as reliance on imported oil is increasing in

141
THE CASE OF WASTE TO ENERGY IN BANGLADESH
Bangladesh—indeed between 2009 and 2020, the average share of oil in the electricity generation mix increased from 5.92% to 34.05%—there are concerns in policy circles about the country’s vulnerability to oil price shocks and energy security. Given this remarkable increase in oil use, fueled by high GDP growth rates, and the evidence that domestically sourced natural gas reserves are being depleted, this study also argues for a more decisive transition toward renewables including WTE of biomass. As the latter typically generates lower GHG emissions and less pollutants than fossil fuels, it has the potential to foster sustainable development in the country. All of this, however, can only be achieved once price distortions have been removed.
Another promising extension would be modeling WTE technologies other than waste incineration and alternative waste loads (to account for higher reuse and recycling of materials) and exploring their relative performances in terms of macroeconomic variables and CO2 emissions. It is expected that, for the same amount of waste utilized, cleaner WTE technologies such as anaerobic digestion will lower CO2 emissions per kilowatt-hour of electricity generated.24
Finally, it would be important to assess which incentives are needed in Bangladesh to foster the adoption of clean WTE technologies. As Bangladesh develops, more financial resources are expected to be available for environmental protection and for opportunities to implement a circular economy system.
The case of the removal of price distortions, coupled with the introduction of WTE technology in Bangladesh, the impact of emerging WTE technologies, and the assessment of the incentives needed for the transition toward cleaner WTE processes, is left for future work.
24 It is also expected that electricity generation from a given amount of waste decreases, as biomass typically has lower calorific values than undifferentiated waste; in our model, this means that WTE will displace natural gas less than in the study in this chapter, but overall emissions will still decrease. See section 8.1 for further information on GHG emissions from anaerobic digestion recovery process and biomass calorific value.

142
PROSPECTS FOR TRANSITIONING FROM A LINEAR TO CIRCULAR ECONOMY IN DEVELOPING ASIA
ReferencesAhmed, N. 2019. When the Garbage Piles Up. The Daily Star. 7 October. https://www.thedailystar.net
/opinion/environment/news/when-the-garbage-piles-1810375
Alam O., and X. Qiao. 2020. An In-Depth Review on Municipal Solid Waste Management, Treatment and Disposal in Bangladesh. Sustainable Cities and Society. Vol. 52, 101775.
Amin, S.B. 2015. The Macroeconomics of Energy Price Shocks and Electricity Market Reforms: The Case of Bangladesh. PhD thesis, Durham University.
Amin, S.B., T. Jamasb, M. Llorca, L. Marsiliani, and T.I. Renström. 2019. Combining Private and Public Resources: Captive Power Plants and Electricity Sector Development in Bangladesh. Emerging Markets Finance and Trade. Vol. 57(14). pp. 3891–912. https://doi.org/10.1080/1540496X.2019.1703107
Amin, S.B., T. Jamasb, M. Llorca, L. Marsiliani, T.I. Renström, and A. Sarkar. 2021. Captive Power, Market Access and Macroeconomic Performance: Reforming the Bangladesh Electricity Sector. Energy Economics. Vol. 102, 105468.
Amin, S.B., and L. Marsiliani. 2015. Energy Price Shocks in Dynamic Stochastic General Equilibrium: The Case of Bangladesh. Review of Business and Economics Studies. Vol. 3(4). pp. 12–21. https ://rbes.fa.ru/jour/article/view/24/24
Asian Development Bank (ADB). 2020. Waste to Energy in the Age of the Circular Economy Compendium of Case Studies and Emerging Technologies. Manila. https://www.adb.org/publications/waste-to -energy-age-circular-economy-handbook
Bachmaier, J., M. Effenberger, and A. Gronauer. 2010. Greenhouse Gas Balance and Resource Demand of Biogas Plants in Agriculture. Engineering in Life Sciences. Vol. 10(6). pp. 560–9. https://doi .org/10.1002/elsc.201000073.
Bahauddin, K.M., and M.H. Uddin. 2012. Prospect of Solid Waste Situation and an Approach of Environmental Management Measure (EMM) Model for Sustainable Solid Waste Management: Case Study of Dhaka City. Journal of Environmental Science and Natural Resources. Vol. 5(1). pp. 99–111.
Bangladesh Power Development Board (BPDB). 2020. Annual Report. https://www.bpdb.gov.bd /bpdb_new/resourcefile/annualreports/annualreport_1605772936_AnnualReport2019-20.pdf
Byron, R.K., and H. Alam. 2020. Waste to Electricity: China to Build Power Plant for DNCC Area. The Daily Star. 13 November. https://www.thedailystar.net/backpage/news/waste-electricity-china -build-power-plant-dncc-area-1994101
Coady, D., I. Parry, and B. Shang. 2017. Energy Price Reform: A Guide for Policymakers. CESifo Working Paper Series 6342. Munich: CESifo Group.
Dhaka North City Corporation. 2019. Waste Report 2018–2019. https://dncc.portal.gov.bd/sites/default /files/files/dncc.portal.gov.bd/annual_reports/6693c776_0dde_49da_b85b_1928d398a7f4/2020 -07-07-15-04-0388efe51e61d331efb81045a0648dd2.pdf
Dhawan, R., and K. Jeske. 2008. Energy Price Shocks and the Macroeconomy: The Role of Consumer Durables. Journal of Money, Credit and Banking. Vol. 40(7). pp. 1357–77. https://doi.org/10.1111 /j.1538-4616.2008.00163.x
Delpiazzo, E., R. Parrado, and G. Standardi. 2015. Phase-Out of Fossil Fuel Subsidies: Implications for Emissions, GDP and Public Budget. Research Papers Issue RP0275, ECIP-Economic analysis of Climate Impacts and Policy Division, CMCC Research Paper.

143
THE CASE OF WASTE TO ENERGY IN BANGLADESH
Global Subsidies Initiative (GSI). 2019. Raising Ambition through Fossil Fuel Subsidy Reform: Greenhouse Gas Emissions Modelling Results from 26 Countries. Geneva: Global Subsidies Initiative of the International Institute for Sustainable Development.
Government of Bangladesh. 2020. 8th Five-Year Plan (July 2020–June 2025): Promoting Prosperity and Fostering Inclusiveness. Dhaka. https://oldweb.lged.gov.bd/UploadedDocument/UnitPublication /1/1166/8FYP.pdf
Hossain, H.Z., Q.H. Hossain, M.M.U. Monir, and M.T. Ahmed. 2014. Municipal Solid Waste (MSW) as a Source of Renewable Energy in Bangladesh: Revisited. Renewable and Sustainable Energy Reviews. Vol. 39. pp. 35–41.
Intergovernmental Panel on Climate Change (IPCC). 2006. IPCC Guidelines for National Greenhouse Gas Inventories. Volume 5-Waste. Kanagawa, Japan: Institute for Global Environmental Strategies (IGES).
____. 2012. Special Report on Renewable Energy Sources and Climate Change Mitigation (SRREN). Cambridge: Cambridge University Press.
Islam, K.M.N. 2016. Municipal Solid Waste to Energy Generation in Bangladesh: Possible Scenarios to Generate Renewable Electricity in Dhaka and Chittagong City. Journal of Renewable Energy. Article ID 1712370. http://dx.doi.org/10.1155/2016/1712370
Jaaskela, J.P., and K. Nimrak. 2011. A Medium-Scale New Keynesian Open Economy Model of Australia. The Economic Record, Vol. 87(276). pp. 11–36. https://doi.org/10.1111/j.1475-4932.2010.00688.x
Joshi, P., and C. Visvanathan. 2019. Sustainable Management Practices of Food Waste in Asia: Technological and Policy Drivers. Journal of Environmental Management. Vol. 247. pp. 538–50.
Kaur, A., R. Bharti, and R. Sharma. 2021. Municipal Solid Waste as a Source of Energy. Materials Today: Proceedings (forthcoming).
Kim, I.M., and P. Loungani. 1992. The Role of Energy in Real Business Cycles. Journal of Monetary Economics. Vol. 29(2). pp. 173–89. https://doi.org/10.1016/0304-3932(92)90011-P
Kumar, A., and S.R. Samadder. 2017. A Review on Technological Options of Waste to Energy for Effective Management of Municipal Solid Waste. Waste Management. Vol. 69. pp. 407–22. https ://doi.org/10.1016/j.wasman.2017.08.046
Laohalidanond, K., P. Chaiyawong, and S. Kerdsuwan. 2015. Municipal Solid Waste Characteristics and Green and Clean Energy Recovery in Asian Megacities. Energy Procedia. Vol. 79. pp. 391–6.
Lee, S.Y., R. Sankaran, K.W. Chew, C.H. Tan, R. Krishnamoorthy, D-T. Chu, and P-L. Show. 2019. Waste to Bioenergy: A Review on the Recent Conversion Technologies. BMC Energy. Vol. 1, 4. https ://doi.org/10.1186/s42500-019-0004-7
Lehmann, S. 2018. Conceptualizing the Urban Nexus Framework for a Circular Economy: Linking Energy, Water, Food, and Waste (EWFW) in Southeast-Asian Cities, In P. Droege, ed. Urban Energy Transition (Second Edition). Elsevier. pp. 371–98. https://doi.org/10.1016/B978-0-08 -102074-6.00032-2
Li, C., L. Yang, X. Liu, Y. Yang, L. Qin, D. Li, and G. Liu. 2021. Bridging the Energy Benefit and POPs Emission Risk from Waste Incineration. Innovation. Vol. 2(1), 100075.
Malav, L.C., K. Kumar, Y. Neha, G. Sandeep, G.K. Sharma, S. Krishnan, S. Rezania, H. Kamyab, Q.B. Pham, Y. Yadav, S. Bhattacharyya, V.K. Yadav, and Q-V Bach. 2020. A Review on Municipal Solid Waste as a Renewable Source for Waste-to-Energy Project in India: Current Practices, Challenges, and Future Opportunities. Journal of Cleaner Production. Vol. 277, 123227.

144
PROSPECTS FOR TRANSITIONING FROM A LINEAR TO CIRCULAR ECONOMY IN DEVELOPING ASIA
Mamun, S. 2020. 2 Waste-to-Energy Power Plants in Dhaka on the Cards. Dhaka Tribune. 24 September. https://archive.dhakatribune.com/bangladesh/dhaka/2020/09/24/2-waste-to-energy-power -plants-in-dhaka-on-the-cards
Rotemberg, J.J., and M. Woodford. 1996. Imperfect Competition and the Effects of Energy Price Increases on Economic Activity. Journal of Money, Credit and Banking. Vol. 28(4). pp. 549–77. https ://doi.org/10.2307/2078071
Saveyn, H., P. Eder, M. Ramsay, G. Thonier, K. Warren, and M. Hestin. 2016. Towards a Better Exploitation of the Technical Potential of Waste-to-Energy. Luxembourg: Publications Office of the European Union. https://doi.org/10.2791/870953
Siddiqi, A., M. Haraguchi, and V. Narayanamurti. 2020. Urban Waste to Energy Recovery Assessment Simulations for Developing Countries. World Development. Vol. 131, 104040.
Sustainable and Renewable Energy Development Authority. 2020. Waste to Energy. http://www.sreda .gov.bd/site/page/676cb08b-17b7-490c-b94b-d6b71c3ecb19/-
Tun, M.M., P. Palacky, D. Juchelkova, and V. Síťař. 2020. Renewable Waste-to-Energy in Southeast Asia: Status, Challenges, Opportunities, and Selection of Waste-to-Energy Technologies. Applied Sciences. Vol. 10(20), 7312.
United Nations Development Programme (UNDP). 2018. Feasibility Study on Waste to Energy Conversion in Six Municipalities in Bangladesh. Dhaka. https://www.bd.undp.org/content/dam /bangladesh/docs/Projects/srepgen/WASTE%20TO%20ENERGY.pdf
United States Energy Information Administration (EIA). 2021. Frequently Asked Questions: How Much Carbon Dioxide Is Produced per Kilowatthour of U.S. Electricity Generation? https ://www.eia.gov/tools/faqs/faq.php?id=74&t=11
World Bank. 2021. World Development Indicators Database. http://data.worldbank.org/data-catalog /world-development-indicators (accessed 1 July 2021).

145
CONCLUSION
Linda Arthur
At the recently concluded 26th session of the Conference of the Parties (COP26) to the United Nations Framework Convention on Climate Change in Glasgow, Scotland, progress was made on important environmental commitments, though an agreement to phase out coal and fossil fuels was elusive. Switching to renewable energy sources is essential for keeping global warming below 1.5 degrees Celsius, but it is not the full picture. While the consumption of fossil fuels in homes, buildings, and transport accounts for just over half of greenhouse gas (GHG) emissions, the remaining 45% is directly linked to the production of materials, as well as agriculture, forestry, and land use (International Resource Panel 2020). A circular economy addresses the remaining half of GHG emissions by fundamentally reshaping the current linear consumption model.
Recognizing that Asia and the Pacific will be key to averting the worst impacts of global climate change, this report’s authors provide an in-depth look at opportunities and challenges for circular economy principles to take hold. It will require moving away from a “take–make–waste” system to one that acknowledges and respects planetary boundaries. This will not be easy in a region that is already home to the world’s two largest consumer countries, the People’s Republic of China and India, and 55% of the world’s consumer class, with a projected further 1 billion consumers by 2030 (Buchholz 2021).
Successive climate summits have shown that emerging economies are reluctant to drastically reduce their carbon footprint if it means missing or delaying their chance to join the world’s developed economies. Similarly, the new Asian middle class will not give up its place among global consumers. A circular economy, with its emphasis on decoupling human well-being, economic growth, and resource use from environmental impact, provides a viable alternative for emerging Asia, though it will take a concerted global effort. The preceding chapters have highlighted the essential building blocks of a circular economy, as well as their relative strengths and weaknesses in emerging Asia, including regional cooperation, country road maps, regulatory and legal frameworks, private sector participation, and innovation.
Governments will need to lead the transition, providing the right mix of incentives to spur new business models, technology transfer and design innovation, and penalties to curb the worst practices in waste generation and environmental impact. The cases discussed here from East, Southeast, South, and West Asia indicate the wide appeal of circular concepts and practices, though progress is at varied stages across the region. Country road maps can accelerate national transitions toward a circular economy by providing a vision as well as goals. The public sector alone, however, cannot transform current linear economy practices. Hence, it may need to take on early-stage risk in developing circular markets to spur further domestic and foreign investment, as well as other financial incentives to help level the playing field for circular businesses. Regional knowledge and experience-sharing platforms will be crucial, particularly for low-income countries, who are only commencing their circular transitions. Also, where domestic environmental pressures may not be sufficient to change a country’s consumption and waste trajectory, regional alliances may prevail, which is particularly relevant for plastic polluters.
Innovation lies at the center of a circular economy transition, for increasing resource efficiency and designing out waste. Developed economies use about one-fifth of natural resources compared with developing economies to produce the same amount of economic output (United Nations 2021). Thus, as high-income countries shift more of their production to developing economies, there will be a net loss of resource efficiency, which will require more extracted materials and energy while producing more emissions and waste. A rise in extracted materials is already evident from this outsourcing trend, but this

146
will worsen as production shifts from middle- to lower-income economies. Innovation and technology transfer, both regional and international, are therefore critical to avoid further environmental impact and emissions.
Far from being a threat to economic development, a circular economy could generate $4.5 trillion in additional economic output by 2030 (Lacy and Rutqvist 2015), and the potential for job creation, innovation, and prosperity is vast. Policy makers across the region would do well to take advantage of this financial and environmental win–win solution, thereby shifting emerging Asia from its current path of unsustainable consumption to one that leads to a more restorative and regenerative economy.
PROSPECTS FOR TRANSITIONING FROM A LINEAR TO CIRCULAR ECONOMY IN DEVELOPING ASIA

147
CONCLUSION
ReferencesBuchholz, K. 2021. Asia’s Consumer Class Is Growing. This Chart Shows How. 22 October. World
Economic Forum. https://www.weforum.org/agenda/2021/10/growth-consumers-asia -indonesia-bangladesh-pakistan-philippines/ (accessed 2 December 2021).
International Resource Panel. 2020. Resource Efficiency and Climate Change: Material Efficiency Strategies for a Low-Carbon Future. Nairobi: United Nations Environment Programme. https ://www.resourcepanel.org/reports/resource-efficiency-and-climate-change
Lacy, P., and J. Rutqvist. 2015. Waste to Wealth: The Circular Economy Advantage. New York/London: Palgrave Macmillan.
United Nations. 2021. SDG Reports: SDG 12. Department of Economic and Social Affairs, Statistics Division. https://unstats.un.org/sdgs/report/2019/goal-12/ (accessed 2 December 2021).

ASIAN DEVELOPMENT BANK INSTITUTE3-2-5 Kasumigaseki, Chiyoda-kuTokyo, 100-6008 JapanTel +81 3 3593 5500www.adbi.org
Prospects for Transitioning from a Linear to Circular Economy in Developing AsiaUnsustainable consumption, driven by the increasing extraction of raw materials, manufacturing, and production, is contributing to environmental degradation and the acceleration of climate change. In developing Asia, consumption trends will continue to rise as populations and economies grow. Shifting from the current “take–make–dispose” linear consumption pattern to a more circular economy provides an opportunity for governments to rewrite the narrative by decoupling economic output from increased resource use and environmental degradation. A circular economy aims to drive economic growth in a sustainable manner by maximizing resource efficiency while minimizing environmental impacts and greenhouse gas emissions.
Prospects for Transitioning from a Linear to Circular Economy in Developing Asia overviews circular economy principles and provides policy recommendations to promote the transition to circularity. Part I describes the evolution of circular economy in the region and highlights key related initiatives and prospects for future growth. Part II looks at the regulatory and legal frameworks for plastics, such as extended producer responsibility, and assesses their adequacy to stem unsustainable production and minimize the disposal of plastic waste. Part III offers examples of circular economy investment and innovation and calls for effective policies to incentivize and strengthen circular business models.
Linda Arthur is a senior specialist at the Asian Development Bank Institute (ADBI), Tokyo, Japan.
Derek Hondo is a capacity building and training coordinator at ADBI, Tokyo, Japan.
Maria Hughes is a global collaboration specialist at the Finnish Innovation Fund Sitra, Helsinki, Finland.
Reetta Kohonen is a global collaboration project coordinator at the Finnish Innovation Fund Sitra, Helsinki, Finland.
About the Asian Development Bank InstituteADBI is the Tokyo-based think tank of the Asian Development Bank, an international development finance institution. ADBI aims to be an innovative center of excellence for the creation of timely, innovative, evidence-based knowledge to support policy design and implementation by developing and emerging economies that further contributes to achieving a prosperous, inclusive, resilient, and sustainable Asia and the Pacific.
About the Finnish Innovation Fund SitraThe Finnish Innovation Fund Sitra is a future fund that collaborates with partners from different sectors to research, pilot, and implement bold new ideas that shape the future. Based in Helsinki, Sitra is commissioned with the task of probing the future and promoting qualitative and quantitative economic growth. Sitra works on accelerating the transition to a circular economy—a crucial tool in safeguarding biodiversity and solving the climate crisis. Sitra has received recognition for its national and international work on sustainability and the circular economy.