Technical report with basic indicators for rare cancers and health care related macro indicators
51
SURVEILLANCE OF RARE CANCERS IN EUROPE GRANT AGREEMENT NO. 2006113 WORK PACKAGE NO.5 DELIVERABLE NO. 13 TECHNICAL REPORT WITH BASIC INDICATORS FOR RARE CANCERS AND HEALTH CARE RELATED MACRO INDICATORS Prepared by : Gemma Gatta, Jan Maarten van der Zwan, Sabine Siesling, Renée Otter, Andrea Tavilla, Sandra Mallone, Annalisa Trama, Michael Schaapveld, Laura Ciccolallo, Roberta De Angelis, Angelo Paolo Dei Tos, Paolo Casali, Lisa Licitra and Riccardo Capocaccia. Revised version february 2010
-
Upload
independent -
Category
Documents
-
view
0 -
download
0
Transcript of Technical report with basic indicators for rare cancers and health care related macro indicators

SURVEILLANCE OF RARE CANCERS IN EUROPE
GRANT AGREEMENT NO. 2006113
WORK PACKAGE NO.5 DELIVERABLE NO. 13
TECHNICAL REPORT WITH BASIC INDICATORS FOR RARE CANCERS AND HEALTH CARE RELATED MACRO INDICATORS
Prepared by : Gemma Gatta, Jan Maarten van der Zwan, Sabine Siesling, Renée Otter, Andrea Tavilla, Sandra Mallone, Annalisa Trama, Michael Schaapveld, Laura Ciccolallo, Roberta De Angelis, Angelo Paolo Dei Tos, Paolo Casali, Lisa Licitra and Riccardo Capocaccia.
Revised version february 2010
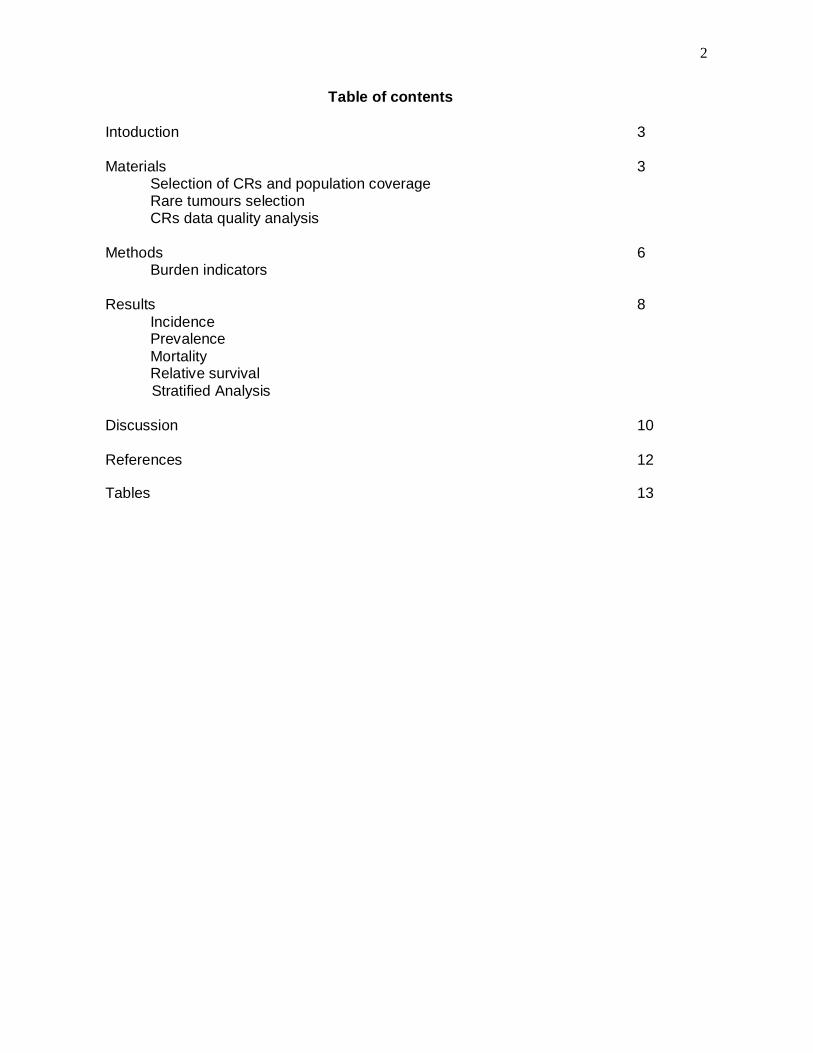
2
Table of contents Intoduction 3 Materials 3 Selection of CRs and population coverage Rare tumours selection CRs data quality analysis Methods 6 Burden indicators Results 8 Incidence Prevalence Mortality Relative survival Stratified Analysis Discussion 10 References 12
Tables 13
3
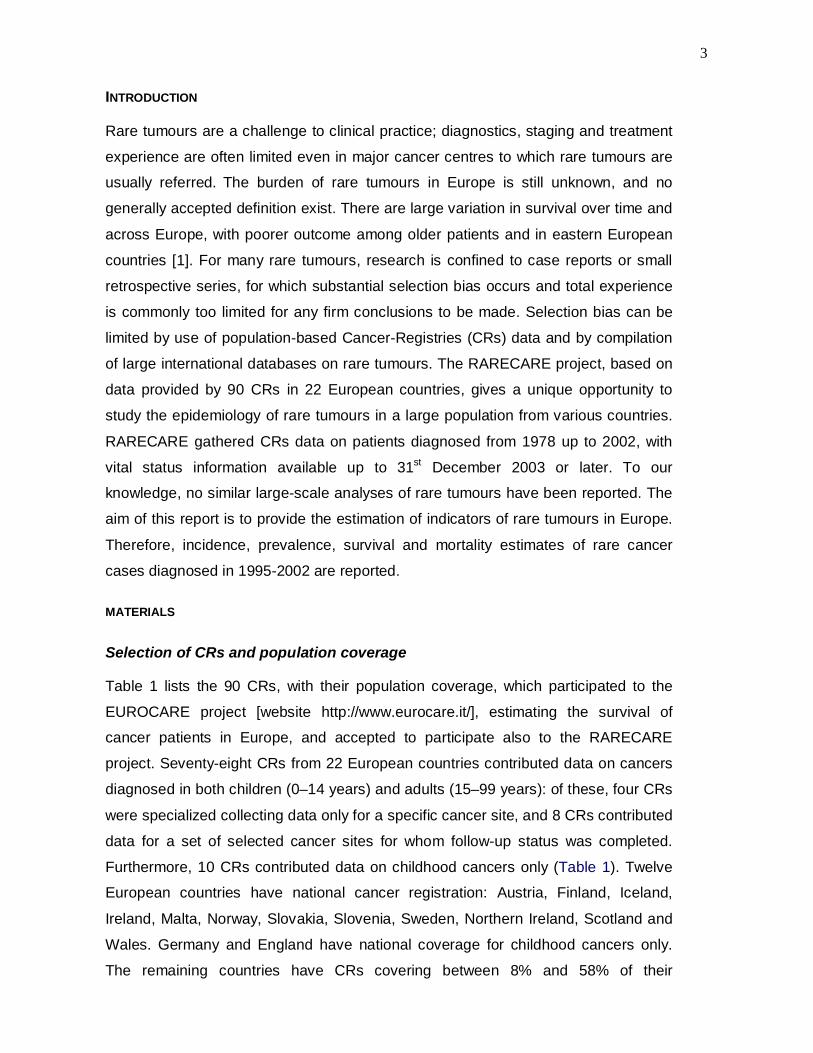
INTRODUCTION
Rare tumours are a challenge to clinical practice; diagnostics, staging and treatment
experience are often limited even in major cancer centres to which rare tumours are
usually referred. The burden of rare tumours in Europe is still unknown, and no
generally accepted definition exist. There are large variation in survival over time and
across Europe, with poorer outcome among older patients and in eastern European
countries [1]. For many rare tumours, research is confined to case reports or small
retrospective series, for which substantial selection bias occurs and total experience
is commonly too limited for any firm conclusions to be made. Selection bias can be
limited by use of population-based Cancer-Registries (CRs) data and by compilation
of large international databases on rare tumours. The RARECARE project, based on
data provided by 90 CRs in 22 European countries, gives a unique opportunity to
study the epidemiology of rare tumours in a large population from various countries.
RARECARE gathered CRs data on patients diagnosed from 1978 up to 2002, with
vital status information available up to 31st December 2003 or later. To our
knowledge, no similar large-scale analyses of rare tumours have been reported. The
aim of this report is to provide the estimation of indicators of rare tumours in Europe.
Therefore, incidence, prevalence, survival and mortality estimates of rare cancer
cases diagnosed in 1995-2002 are reported.
MATERIALS
Selection of CRs and population coverage
Table 1 lists the 90 CRs, with their population coverage, which participated to the
EUROCARE project [website http://www.eurocare.it/], estimating the survival of
cancer patients in Europe, and accepted to participate also to the RARECARE
project. Seventy-eight CRs from 22 European countries contributed data on cancers
diagnosed in both children (0–14 years) and adults (15–99 years): of these, four CRs
were specialized collecting data only for a specific cancer site, and 8 CRs contributed
data for a set of selected cancer sites for whom follow-up status was completed.
Furthermore, 10 CRs contributed data on childhood cancers only (Table 1). Twelve
European countries have national cancer registration: Austria, Finland, Iceland,
Ireland, Malta, Norway, Slovakia, Slovenia, Sweden, Northern Ireland, Scotland and
Wales. Germany and England have national coverage for childhood cancers only.
The remaining countries have CRs covering between 8% and 58% of their

4
populations, with the conspicuous exception of Germany, where only 1.3% of the
adult population is covered. The mean population covered over the period 1995–
1999 was about 162,000,000, corresponding to 39% of the population of the
countries participating in RARECARE and 32% of the population of the European
Union (EU27). Data from the 10 specialized childhood cancer registries were not
analysed because our focus is on the entities that are rare over the entire population.
The 12 CRs providing data only for selected cancer sites were also removed due to
the difficulty to precisely determine which of the entities defined by RARECARE
belongs to the incidence series collected by these CRs. Data from Finland were
excluded from the systematic analyses carried out for the estimation of burden
indicators, because morphology was not coded according to ICD-O classification, so
making it impossible to attribute most diagnoses to a specific cancer entity; Tyrol CRs
was excluded as well to avoid overlaps with the national Austrian registry; UK
England national dataset was also excluded to analyse the longer data series
provided by local England CRs. Finally, 65 out of the above 90 CRs were included in
the present analysis. A total of 4,093,062 of cancer cases were then analyzed (Table
2). The classification of cancer cases used in this project is the International
Classification of Diseases for Oncology 3rd version (ICD-O3) [2]. Table 2 presents
number of cancers cases, together with indicators of data quality by CRs.
Rare tumours selection
A list of tumours (frequent and rare), reporting the number of cases and the crude
incidence rate was built and it is available on the project website:
http://www.rarecare.eu/rarecancers/rarecancers.asp. This list was hierarchically
structured in three Layers based on various combinations of ICD-O morphology and
topography [2]:
Layer 1) families of tumours relevant for the Health Care Organization;
Layer 2) tumours defined in a clinically sound way (perceived by clinicians as single
diseases and relevant for clinical decision making and research);
Layer 3) single WHO tumour entities.

5
Rare tumours were identified as those included within the 1st or the 2nd layer and
having an incidence rate less than 6/100,000/year. This annual threshold resulted in
194 tumour entities, which were then considered rare tumours.
CRs data quality analysis
Automated procedures checked each data field and combinations of fields in each
case record. Topographies and morphologies were checked against ICD-O3 lists,
and records with invalid codes were excluded [3,4]. Other checks were carried out on
combinations of data fields. They concerned:
Consistency between dates of birth, diagnosis and follow-up.
Consistency of site–morphology combinations. Both standard IARC routines [4]
and those additionally defined by the EUROCARE protocol [5, 3] were used.
Consistency of age–site, age–morphology, sex–site and sex–morphology
combinations. Unlikely combinations were checked against IARC criteria [4].
Consistency of morphology–behaviour combinations. Combinations not listed in
ICD-O-3 classification were flagged as unlikely, but the corresponding records were
used in the analysis.
A more detailed description of the procedure of the data quality check is available in
the paper by De Angelis et al [5].
Estimation of incidence rates can be biased by the inclusion of registries with
insufficient quality of topographical and (mainly) morphological information on
diagnoses. In these registries, specific rare tumours may not be precisely recognized
and a certain number of patients may have their cancer classified within a wider, not
clearly specified category (such as carcinoma NOS, Lymphoma NOS, etc). Two
possible criteria were identified for testing the quality of the RARECARE data:
proportion of cases with non specified morphology, and unexpectedly low incidence
of rare tumours, suggesting insufficient specificity of diagnosis. For each CR, the
proportion of cases with non specified morphology was calculated with the following
morphology codes: 8000 (cancer), 8001 (cancer cells) and 9590 (malignant
lymphoma, NOS). These codes are excluded from the definition of any Layer 2 entity
in the rare tumour list. The results are shown in Table 3. None of the registries show
clearly outlier values. Fixing a cut point at 20%, 5 CRs were identified to be
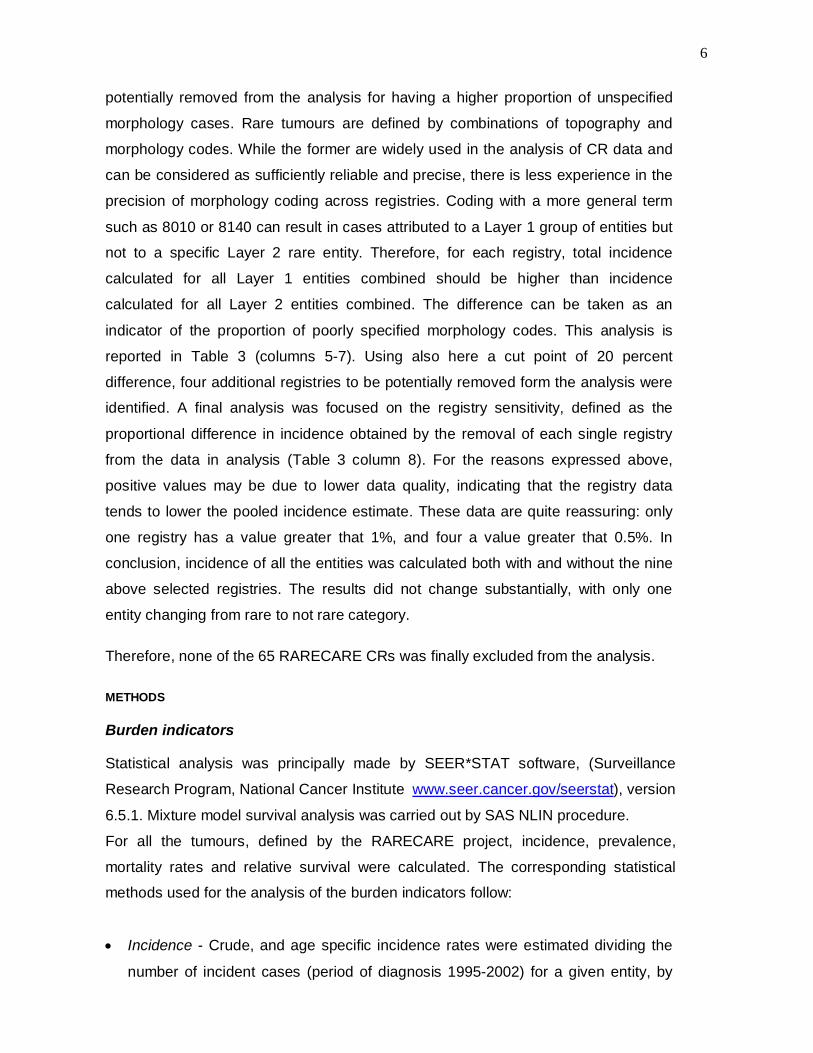
6
potentially removed from the analysis for having a higher proportion of unspecified
morphology cases. Rare tumours are defined by combinations of topography and
morphology codes. While the former are widely used in the analysis of CR data and
can be considered as sufficiently reliable and precise, there is less experience in the
precision of morphology coding across registries. Coding with a more general term
such as 8010 or 8140 can result in cases attributed to a Layer 1 group of entities but
not to a specific Layer 2 rare entity. Therefore, for each registry, total incidence
calculated for all Layer 1 entities combined should be higher than incidence
calculated for all Layer 2 entities combined. The difference can be taken as an
indicator of the proportion of poorly specified morphology codes. This analysis is
reported in Table 3 (columns 5-7). Using also here a cut point of 20 percent
difference, four additional registries to be potentially removed form the analysis were
identified. A final analysis was focused on the registry sensitivity, defined as the
proportional difference in incidence obtained by the removal of each single registry
from the data in analysis (Table 3 column 8). For the reasons expressed above,
positive values may be due to lower data quality, indicating that the registry data
tends to lower the pooled incidence estimate. These data are quite reassuring: only
one registry has a value greater that 1%, and four a value greater that 0.5%. In
conclusion, incidence of all the entities was calculated both with and without the nine
above selected registries. The results did not change substantially, with only one
entity changing from rare to not rare category.
Therefore, none of the 65 RARECARE CRs was finally excluded from the analysis.
METHODS
Burden indicators
Statistical analysis was principally made by SEER*STAT software, (Surveillance
Research Program, National Cancer Institute www.seer.cancer.gov/seerstat), version
6.5.1. Mixture model survival analysis was carried out by SAS NLIN procedure.
For all the tumours, defined by the RARECARE project, incidence, prevalence,
mortality rates and relative survival were calculated. The corresponding statistical
methods used for the analysis of the burden indicators follow:
Incidence - Crude, and age specific incidence rates were estimated dividing the
number of incident cases (period of diagnosis 1995-2002) for a given entity, by

7
the corresponding person-years lived from the general population calculated
during the same period. All newly diagnosed cases were selected, with the
inclusion of second primary and “death certificare only” (DCO) cases, but the
exclusion of cases incidentally discovered at autopsy. For geographical
comparisons, age standardized rates were computed to adjust for different age
distribution of the compared populations, using the conventional European
standard population.
Prevalence - The number of cancer survivors and their proportion per 100,000
population has been estimated at the index date of 1st January 2003. The
counting method [6], based on CRs incidence and follow-up data, has been
applied to CRs data from 1988 to 2002. The method consists in enumerating how
many persons previously diagnosed with a given cancer are alive at the defined
index date. Of course, it is not possible to trace back all the cancers diagnosed
before the start of registration activities. Since most European CRs started
registration activities during the 1980s, a common starting point for the analysis
was than stated at 1st January 1988. Only 22 CRs covered the entire period
providing 15 years prevalence and were therefore included in the analysis (Table
4). Multiple tumours were included in the prevalence estimates of all the
corresponding entities. DCO and autoptic cases were by definition excluded. The
life status of cases lost to follow-up or censored before the index date was
estimated from the survival probability between the censoring and the index
dates, derived from a subset of cancer patients matched by age and cancer
grouping (layer 1). In this way an estimate of 15-year prevalence was obtained,
disentangled by time since diagnosis. In this report, only 15-year prevalence is
provided. The completeness index method [7] will be used to estimate complete
prevalence, adding the number of prevalent cases who were diagnosed before
the start of cancer registration in a given territory.
Mortality - Mortality data do not exist for most of the defined rare entities, because
morphology is not included in information provided by official death records. In
this report, mortality rates were estimated from incidence rates multiplied by the
fatality proportion, under the assumption of constant incidence and survival rates.
Mixture models [8] have been applied to relative survival data of patients
diagnosed during the period 1988-1999. This class of survival models (also
addresses as “cure”) models, assume that a proportion of cases (those cured)

8
has the same mortality rate of the general population, while the complemantary
fraction (the “fatal” cases) have an excess death rate attributed to the diagnosed
cancer. Mixture models allow then to estimate the proportion of patients who die
from their cancer. Mortality figures should be taken as indicative values, mainly for
purposes of comparison with other (non cancer) rare diseases [9], for which
official mortality is the only data source available.
Relative Survival - Relative survival was estimated according to the Hakulinen
method [10]. Standard survival estimates, based on cohort of diagnosis, were
obtained for patients diagnosed during the period 1995-1999 and followed-up
until, at least, the end of 2003. All patients diagnosed during this period were
selected, with the exception of DCO and autoptic cases. Cases lost to follow-up
before the end of the year 2003 were right censored at the time of the last vital
status information. Period survival indicators for the years 2000-2002 were also
estimated using the Brenner algorithm [11]. Both estimates are given by years
since diagnosis.
Stratified Analysis - Incidence, prevalence and mortality rates are estimated also
by sex and four age strata (<15,15-24, 25-64, 65+). To assist in geographical
comparison across Europe, the above indicators, as well as survival, will be
presented by region (Northern Europe, Central Europe, Eastern Europe, Southern
Europe, UK and Northern Ireland, overall EU), and by mean of two macro-
economic indicators: the Gross Domestic Product (GDP) and the Total National
Expenditure on Health (TNEH) in 1994-2002 [12]. Macro economic indicators
were grouped into three categories: Low GDP 0-20000 US$ PPP (Purchasing
Power Parity), Middle GDP >25000 US$ PPP and High GDP >25000 US$ PPP;
low TNEH 0-1500 US$ PPP, middle TNEH >1501-2250 US$ PPP and high TNEH
>2250 US$ PPP. For each burden indicator, 95% confidence intervals are given
as well. A bar graph showing 5-year relative survival (cohort and period) by region
is also given per each tumour entity.
RESULTS
Table 5 shows incidence, prevalence and mortality indicators for all the tumours
defined by the RARECARE project. Table 6 shows the same indicators for the group
of big families of rare tumours which correspond to the Layer 1 of the list. Two

9
hundred and sixty tumour entities are listed in Table 5, of those, 194 are rare (i.e.
have an incidence rate ≤ 6/100,000).
Incidence
For the majority (83.0%) of the rare entities, the annual incidence was lower than 1
per 100,000. The annual incidence of the other rare tumours was between 1 and <2,
between 2 and <3 and between 3 and < 6 for 12, 5 and 10 rare tumours respectively.
Prevalence
Fifteen-year prevalence for all the rare tumours was ≤ 50/100,000, that is the cut off
utilized in Europe for the definition of rare diseases. By contrast, Epithelial Tumours
of Hypopharynx and Larynx, Oesophagus, Stomach, Pancreas, Liver and IBT, and
Ovary have prevalence rates lower than 50 per 100,000 but annual incidence rates
higher than 6 per 100,000. These tumours are then classified as frequent according
to our incidence-based definition, but rare according to the standard EU prevalence-
based criterion. All these tumours have very poor survival and therefore low
prevalence figures, even in presence of a relatively high risk of occurrence, at least
for the European population.
Mortality
Similarly to the incidence, the estimated annual mortality rates were lower than 1 per
100,000 for the majority of the rare tumours (89%). The estimated annual mortality
rates were lower than crude incidence rates and the mortality incidence rates ratio
(M/I) were between 1 and 0.00. The closer a M/I value is to 1.0 the worse is the
expected outcome. In our results, among rare tumours M/I value closer to 1 (≥0.8)
were found for the epithelial tumours of the oropharynx, of the gallbladder, of the
trachea, of the thymus, for the adnexal carcinoma of the skin, malignant
mesothelioma, sarcoma of Kaposi, glial tumours of the CNS, acute myeloyd
leukaemia, myeloproliferative neoplasms and for myelodisplastic myeloproliferative
diseases.

10
Relative survival
Table 7 shows the cohort and period relative survival for all the tumours defined as
rare.
Five-year relative survival of patients diagnosed in 1995-1999 was equal or more
than 50% for the majority of the rare tumours (Table 7). Among rare cancers, survival
was poor (<20%) for the Epithelial Tumours of the Gallbladder, Trachea,
Mesothelioma and Acute Myeloid Leukaemia. Also, it was poor for some rare
tumours of frequent tumour families such as Squamous Cell tumour of the Kidney,
and some rare histotypes of the lung, the oesophagus and the pancreas. The highest
5-year survival figures (>90%) were observed for tumours of the testis (except the
Epithelial Tumours), Pancreatoblastoma, Retinoblastoma, Paget disease of the vulva
and vagina, the Epithelial and Soft tissue tumours of the skin (except adnexal
carcinoma), nodular Hodgkin lymphoma (lymphocyte predominance), special types of
adenocarcinoma of the breast, adenocarcinoma of the middle ear, the ependymal
tumour of the nerves, autonomic nervous system and paraganglia and the squamous
cell carcinoma and variants of the Lip. Up-to-date five-year relative survival, as
estimated from 2000-2002 period survival analysis, was usually higher than 5-year
cohort survival analysis.
Stratified Analysis
The results of the stratified analysis are presented in a dedicated Annex available on
the web-site of the RARECARE project.
DISCUSSION
Bias in our results might arise because of variations in data quality and comparability.
However, our major indicators of the quality of cancer-registry data—ie, proportion of
cases reported as death-certificate only, microscopically verified cases and lost to
follow-up—suggest a high-quality dataset (Table 2). More detailed analysis of the
quality of registry data and comparability of diagnoses necessitates an in-depth
analysis of cancer-registration documents, and possibly pathological review of all
registered selected rare tumours, both of which are beyond the scope of this report.
Inconsistencies in diagnostic and coding criteria can frequently be shown by unlikely
geographical variation in incidence. We analysed the effect of low quality data for
rare tumours CRs and we realised that the effect was very minor. Actually, a

11
dedicated WP is working on data quality revising a sample of selected rare tumours
and the effect of this revision on incidence and survival rates will be calculated. A
report based on these analyses will be prepared by the end of June, 2010
(Deliverable no.15).
The incidence for tumour entities is in general underestimated for Layer 2 entities
because of the relatively high proportion of morphology codes NOS. The extreme
effect is shown by the Layer 1 epithelial tumours of pancreas and oesophagus which
are not rare, but include all Layer 2 entities with very low incidence rates, thus rare.
By contrast, Gastro intestinal stromal tumours (GIST), which is a 1st layer entity is
underestimated owing to the fact that the specific ICD-O code was inexistent but has
now been introduced in the ICD-O3.
With this report we are able to provide 15-year prevalence proportions and not
complete prevalence one. We realized that for many cancers the difference between
these two measures is relevant, separating rare and frequent according to the
European definition of rare diseases. We are presently running all the necessary
procedures that will enable to provide the complete prevalence for the rare entities.
Mortality is an important synthetic indicator, including both the risk to have a cancer
and the risk to die after a cancer diagnosis. However, mortality for such a detailed
entities is not provided by the national official statistics, because of the ICD
classification utilized. Furthermore, for few European countries and several World
wide countries, mortality is the only indicator of frequency available for between
country-comparison. This is why we put a lot of effort for the estimation of rare
tumours mortality.
In conclusion, according to our estimates, 2.5 millions of patients are living today with
a diagnosis of rare cancers in Europe and every year there are 488,000 new
diagnoses of malignant rare cancers which represent in total 19% of all malignant
cancers diagnosed in Europe each year.

12
REFERENCES
1. Gatta G, Ciccolallo L, Kunkler I, et al. Survival from rare cancer in adults: a
population –based study. Lancet Oncology, 2006; 7: 132-40.
2. International Classification of Diseases for the Oncology (ICD-O). Percy C, Fritz
A, Jack A, Shanmugarathan S, Sobin L, Parkin DM, Whelan S. Third Edition, WHO
2000.
3. EUROCARE study web-site: http://www.eurocare.it/ [accessed 03.06.08].
4. Ferlay J, Burkhard C, Whelan S, Parkin DM. Check and conversion programs for
Cancer Registries. International Agency for Research on Cancer, Technical Report
No. 42: Lyon (France); 2005. <http://www.iacr.com.fr/TR42.htm>.
5. De Angelis R, Francisci S, Baili P et al. The EUROCARE-4 database on cancer
survival in Europe: Data standardisation, quality control and methods of statistical
analysis. European Journal Of Cancer 45 (2009) 909 –930
6. Capocaccia R., Colonna M., Corazziari I., et al.. Measuring cancer prevalence in
Europe: the EUROPREVAL Project. Annals of Oncology 2002, 13: 831-839.
7. Capocaccia R., De Angelis R.: Estimating the completeness of prevalence based
on cancer registry data. Stat Med 1997, 16: 425-440.
8. Verdecchia A., De Angelis R., Capocaccia R. et al.: The cure of colon cancer:
results from the Eurocare Study. Int J Cancer 1998, 77: 322-329.
9. European Parliament and Council of the European Communities (1999). Decision
No 1295/1999/EC of the European Parliament and of the Council of 29 April 1999
adopting a programme of Community action on rare diseases within the framework
for action in the field of public health (1999 to 2003).
10. Hakulinen T. Cancer survival corrected for heterogeneity in patient withdrawal.
Biometrics 1982;38:933–42.
11. Brenner H, Söderman B, Hakulinen T. Use of period analysis for providing more
up-to-date estimates of long-term survival rates: empirical evaluation among 370,000
cancer patients in Finland. Int J Epidemiol 2002;31:456–62.
12. Organisation for economic Co-operation and Development (OECD). OECD Health
Data 2004, 1st edn. Paris: OECD, 2004.

13
TABLES

14
Table 1. Countries and cancer registries participating in RARECARE with mean population size covered by registration in 1995-1999 and proportion (%) of national population covered. Countries with nation-wide cancer registration in bold. Country Registry Mean
Population % National
Coverage Country Registry Mean
Population % National
Coverage
Austria Austria (national) 7,963,020 100 Malta Malta 373,866 100 Tyrol 662,087 8.2 The Netherlands Amsterdam 2,771,383 17.6 Belgium Flanders 5,919,586 58.2 Eindhoven 964,196 6.1
North Netherlands 2,101,219 13.5 Finland Finland 5,130,979 100
Twente 1,142,533 7.3 France Bas Rhin 1,009,792 1.7 Dutch Registries 6,971,154 44.5
Calvados (a) 641,148 1.1 Norway Norway 4,394,802 100 Calvados digestive (b) 641,148 1.1 Poland Cracow 738,796 1.9 Côte d'Or digestive (b) 505,083 0.9 Kielce 1,183,001 3.1 Côte d'Or haematol. (c) 505,083 0.9 Warsaw 1,616,103 4.2 Doubs 497,493 0.8 Polish Registries 3,537,900 9.2 Haut Rhin 700,241 1.2 Portugal South Portugal 4,401,902 43.4 Hérault 872,683 1.5 Slovak Republic Slovakia 5,381,037 100
Isère 1,076,495 1.8 Slovenia Slovenia 1,985,998 100 Loire Atlantique (d) 1,114,479 1.9 Spain Albacete (g) 358,533 0.9 Manche 480,850 0.8 Basque Country 2,094,584 5.3 Marne & Ardennes (e) 857,539 1.5 Castellón (f) 460,454 1.2 Somme 553,801 0.9 Girona 523,244 1.3 Tarn 342,400 0.6 Granada (h) 808,926 2 French Registries 8,652,004 10.5 -14.7 Murcia 1,101,177 2.8 Bretagne (k) 535,933 4.9 Navarra 531,028 1.3 Lorraine (k) 455,294 4.1 Tarragona 578,478 1.5
French Registries (k) 991,228 9 Spanish Registries 6,456,423 12.2-16.3
Comunitat Valenciana (k) 405,460 6.5

15 Germany Saarland 1,079,880 1.3 Spain RNTI (k) 774,395 12.4
Germany Berlin (k) 500,505 3.8 Spanish Registries (k) 1,179,855 18.9 Germany East (k) 2,142,038 16.3 Sweden Sweden 8,840,065 100 Germany West (k) 10,473,996 79.7 Switzerland Basel 435,638 6.1
German Registries (k) 13,116,539 100 Geneva 401,080 5.6 Iceland Iceland 270,581 100 Grisons (i) 224,742 3.2 Ireland Ireland 3,659,684 100 St. Gallen 512,538 7.2 Italy Alto Adige 456,085 0.8 Ticino 306,117 4.3
Biella 190,031 0.3 Valais 272,843 3.8 Ferrara 351,964 0.6 Zurich (j) 1,181,050 16.6 Firenze 1,155,529 2.0 Swiss Registries 3,334,008 27.1-46.8 Friuli V.G. 1,185,933 2.1 UK England East Anglia (l) 2,682,456 5.4 Genova 917,278 1.6 North Western 4,142,732 8.4 Macerata 300,354 0.5 Northern & Yorkshire (m) 6,555,870 13.3 Modena 617,191 1.1 Oxford 2,665,408 5.4 Napoli 538,607 0.9 South West 6,574,540 13.3 Palermo (f) 1,241,727 2.2 Trent 4,791,608 9.7 Parma 394,148 0.7 West Midlands
5,265,109 10.7 Ragusa 294,574 0.5 English Registries 32,677,723 66.2 Reggio Emilia 441,490 0.8 UK England and Wales (k) 10,028,100 100 Romagna 970,735 1.7 UK N. Ireland Northern Ireland 1,667,784 100 Salerno 1,090,072 1.9 UK Scotland Scotland 5,085,648 100 Sassari 470,264 0.8 UK Wales Wales 2,900,615 100 Torino 914,194 1.6 Trento 456,629 0.8 Umbria 831,147 1.5 Varese 809,768 1.4 Veneto 1,991,191 3.5 Italian Registries 14,998,047 25.3-27.4 Marche (k) 189,046 2.3 Mean population % Piedmont (k) 511,451 6.2 European Countries in RARECARE 162,319,789 39
Italian Registries (k) 700,497 8.5 EU Members States in RARECARE* 154,320,398 32

16
(a) not include cancers of the digestive organs (b) cancers of the digestive organs only (c) haematological malignancies only (d) colon, rectum, and female breast only (e) thyroid only (f) female breast only (g) female breast and male lung only (h) tongue, oral cavity, oropharynx, head and neck, oesophagus, stomach, colon, rectum, biliary tract, larynx, lung-bronchus-trachea, skin melanoma, breast, cervix, corpus uteri, Hodgkin disease, and non Hodgkin lymphoma only (i) stomach, colon, rectum, lung-bronchus-trachea, skin melanoma, breast, cervix, and prostate only (j) colorectum only (k) specialised childhood (0-14 years) cancer registries (l) mean population 1996-1999 (m) mean population 1998-1999 * 27 EU members

17
Table 2. Data quality indicators of all malignant cancers in European cancer registries included in the analysis, cases diagnosed 1995-2002.
Data quality indicators Country Registry Number of malignant cancers Death
certificate only
Autopsy Microscopic verification
Cases 1995-1998 censored before five
years
Morphology code NOS *
Topography code NOS *
N (%) (%) (%) (%) (%) (%) Austria Austria 304,493 8.9 0.0 85.2 12.1 10.13 0.56 Belgium Flanders 144,715 0.0 0.2 89.8 0.0 7.34 0.54 France Bas Rhin 13,113 0.0 0.0 95.8 0.6 3.91 0.21 Doubs 5,742 0.0 0.0 95.8 0.9 3.24 0.30 Haut Rhin 9,073 0.0 0.0 96.4 0.2 2.94 0.12 Hérault 10,505 0.0 0.0 n.a. 0.1 1.49 0.10 Isère 12,526 0.0 0.0 94.1 0.2 4.14 0.12 Manche 6,267 0.0 0.0 96.5 2.2 3.37 0.34 Somme 6,481 0.0 0.0 94.2 0.9 5.49 0.76 Tarn 4,935 0.0 0.0 93.8 0.0 5.86 1.32 Germany Saarland 54,132 3.9 0.0 91.8 12.1 7.96 0.55 Iceland Iceland 8,854 0.1 1.4 96.6 0.0 3.47 0.01 Ireland Ireland 156,529 2.0 0.3 86.7 0.0 11.02 0.67 Italy Alto Adige 18,676 0.7 0.0 89.5 0.0 9.18 0.50 Biella 11,770 1.3 0.4 87.0 0.0 12.51 0.33 Ferrara 23,740 1.1 0.0 88.1 0.1 9.65 0.59 Firenze 66,097 0.9 0.1 80.4 0.7 17.67 0.80 Friuli V.G. 78,882 0.6 1.9 91.0 0.0 9.79 2.06 Genova 44,207 1.8 0.0 81.4 0.0 16.57 0.92 Macerata 10,396 1.3 0.0 87.4 0.2 13.05 0.61 Modena 34,947 0.5 0.0 88.6 0.0 11.77 0.51 Napoli 8,145 3.9 0.0 73.0 0.1 17.63 1.38 Parma 23,836 1.0 0.0 86.0 0.0 13.10 0.68

18 Ragusa 10,687 1.9 0.8 80.9 0.2 24.60 0.60 Reggio Emilia 22,152 0.2 0.0 88.1 0.0 13.80 0.48 Romagna 60,667 2.4 0.0 87.9 0.0 12.32 0.51 Salerno 26,917 2.5 0.0 77.5 0.7 23.65 1.05 Sassari 18,084 2.9 0.2 84.4 0.0 16.41 0.67 Torino 44,079 1.9 0.1 87.5 0.2 12.66 0.46 Trento 17,788 2.0 0.0 85.0 0.0 27.82 3.83 Umbria 45,221 0.7 0.0 84.0 0.0 12.61 0.56 Varese 24,728 1.1 0.0 89.0 14.1 10.81 0.43 Veneto 84,528 1.5 0.2 87.5 0.0 13.69 1.73 Malta Malta 9,848 1.9 0.1 87.6 0.0 12.89 0.74 Norway Norway 197,240 1.0 0.4 93.1 0.0 6.68 0.58 Poland Cracow 24,545 1.1 0.1 75.2 3.8 27.17 1.20 Kielce 34,123 0.0 0.0 80.2 0.0 21.73 0.96 Warsaw 50,238 3.4 0.0 80.2 0.5 19.06 0.75 Portugal South Portugal 32,917 0.0 0.0 93.9 0.0 7.22 0.39 Slovakia Slovakia 128,686 12.8 1.5 81.8 1.0 17.93 1.65 Slovenia Slovenia 56,632 1.6 1.1 90.8 0.1 9.61 0.67 Spain Basque Country 44,809 4.2 0.0 86.3 0.0 11.43 0.68 Girona 19,936 3.8 0.1 87.7 0.0 12.83 0.65 Murcia 14,068 3.5 0.1 88.0 1.2 11.07 1.04 Navarra 15,381 2.2 0.6 90.9 0.0 7.57 0.40 Tarragona 12,412 4.8 0.0 86.4 0.0 13.33 0.73 Sweden Sweden 347,616 0.0 2.2 98.2 0.0 2.62 1.25 Switzerland Basel 13,654 0.0 4.3 99.0 5.5 0.23 0.01 Geneva 16,775 0.5 1.1 92.6 0.0 6.18 0.74 St. Gallen 16,588 0.7 1.2 92.8 0.3 4.39 0.41 Ticino 10,784 3.0 0.3 91.4 0.0 6.82 1.40 Valais 4,533 1.5 0.4 91.2 0.6 8.23 0.88 Netherlands Amsterdam 95,439 0.0 0.5 95.7 1.2 4.24 0.10 Eindhoven 27,985 0.0 0.0 95.7 0.0 4.14 0.15 North Netherlands 58,508 0.0 1.0 94.7 0.0 5.29 0.22 Twente 41,217 0.0 0.7 95.1 0.0 5.06 0.34

19 UK England East Anglia 131,829 0.5 0.9 86.4 21.4 0.63 0.27 Northern&Yorkshire 265,499 1.1 0.4 86.8 0.0 3.87 0.25 Oxford 85,848 0.8 0.4 88.8 0.0 0.38 0.48 South Western 168,672 7.8 0.1 70.2 0.0 10.58 1.25 Trent 109,768 7.3 0.0 74.0 0.0 2.44 0.76 West Midlands 190,726 5.1 1.1 81.9 0.0 4.19 0.40 UK N. Ireland Northern Ireland 69,558 1.2 0.4 83.4 0.0 16.68 0.60 UK Scotland Scotland 263,710 0.9 0.1 86.4 0.0 5.81 0.55 UK Wales Wales 120,606 12.7 0.0 51.0 0.0 6.27 0.81 RARECARE 4,093,062 3.3 0.6 85.8 1.9 8.43 0.73 § Microscopic verifications only partially available to the Wales CR. Morphology and topography codes are M8000-8001 and C260, C268, C269, C390, C398, C399, C559, C579, C639, C689, C729, C759-C765, C767-C768 respectively. n.a.: not available

20
Table 3. Quality analysis of topographical and morphological information on diagnoses. Country Registry % of unspecified
morphology cases Incidence
Layer 1 Incidence Layer 2
Diff. % Sensitivity
Austria Austria 10.13 463.6 375.0 19.1 0.00 Belgium Flanders 7.34 465.7 389.4 16.4 0.62 France Bas Rhin 3.91 420.3 392.4 6.7 0.49 Doubs 3.24 372.7 348.5 6.5 0.09 Haut Rhin 2.94 422.2 376.8 10.8 0.02 Herault 1.49 395.0 376.6 4.6 0.13 Isère 4.14 377.8 350.4 7.3 0.07 Manche 3.37 416.3 394.5 5.2 0.16 Somme 5.49 368.1 334.1 9.2 -0.02 Tarn 5.86 341.2 317.9 6.8 -0.03 Germany Saarland 7.96 606.4 528.6 12.8 1.05 Iceland Iceland 3.47 391.5 369.1 5.7 -0.03 Ireland Ireland 11.02 499.3 431.7 13.5 -0.92 Italy Alto Adige 9.18 492.6 437.6 11.2 0.03 Biella 12.51 752.6 656.1 12.8 0.08 Ferrara 9.65 819.9 721.6 12.0 0.36 Firenze 17.67 679.2 542.1 20.2 0.27 Friuli V.G. 9.79 795.4 674.6 15.2 0.56 Genova 16.57 773.3 614.0 20.6 0.26 Macerata 13.05 667.8 557.5 16.5 0.03 Modena 11.77 675.7 591.5 12.5 0.42 Napoli 17.63 279.4 212.5 23.9 0.11 Parma 13.10 728.2 608.5 16.4 0.19 Ragusa 24.60 434.9 321.4 26.1 0.04 Reggio Emilia 13.80 680.1 557.8 18.0 -0.01

21 Romagna 12.32 753.2 649.6 13.8 0.15 Salerno 23.65 389.8 285.1 26.9 -0.36 Sassari 16.41 458.2 377.8 17.5 0.00 Torino 12.66 669.3 559.6 16.4 -0.03 Trento 27.82 570.7 435.5 23.7 0.02 Umbria 12.61 662.8 541.9 18.2 -0.03 Varese 10.81 588.6 500.9 14.9 0.00 Veneto 13.69 679.1 568.9 16.2 0.47 Malta Malta 12.89 305.7 255.8 16.3 -0.04 Norway Norway 6.68 534.3 480.3 10.1 0.25 Poland Cracow 27.17 382.8 259.8 32.1 0.13 Kielce 21.73 317.6 231.1 27.2 -0.29 Warsaw 19.06 360.9 269.3 25.4 -0.23 Portugal South Portugal 7.22 361.5 313.0 13.4 -0.09 Slovenia Slovenia 17.93 340.3 288.7 15.2 -0.04 Slovakia Slovakia 9.61 285.4 228.2 20.0 -1.19 Spain Basque Country 11.43 399.5 343.1 14.1 -0.10 Girona 12.83 440.1 381.0 13.4 0.17 Murcia 11.07 306.1 260.8 14.8 -0.12 Navarra 7.57 559.1 511.6 8.5 0.10 Tarragona 13.33 402.1 336.1 16.4 -0.03 Sweden Sweden 2.62 468.2 434.3 7.3 0.24 Switzerland Basel 0.23 439.4 428.5 2.5 0.35 Geneva 6.18 501.3 454.3 9.4 0.00 St. Gallen 4.39 389.4 358.4 8.0 -0.05 Ticino 6.82 480.9 436.0 9.3 0.06 Valais 8.23 400.1 361.5 9.6 -0.03 Netherlands Amsterdam 4.24 406.4 377.2 7.2 1.25 Eindhoven 4.14 393.3 361.1 8.2 -0.23 North Netherlands 5.29 389.4 359.9 7.6 0.09 Twente 5.06 431.4 386.4 10.4 -0.11 UK England East Anglia 0.63 597.1 529.0 11.4 -0.04 Northern&Yorkshire 3.87 575.4 499.4 13.2 -0.63

22 Oxford 0.38 376.4 319.0 15.2 -0.89 South Western 10.58 476.0 353.1 25.8 -0.48 Trent 2.44 426.4 327.6 23.2 -0.55 West Midlands 4.19 424.6 345.6 18.6 -1.26 Northern Ireland 16.68 485.3 391.4 19.3 -0.62 UK Scotland Scotland 5.81 619.3 532.0 14.1 0.16 UK Wales Wales 6.27 497.3 357.7 28.1 -0.13 RARECARE 8.43 481.3 406.7 15.5

23
Table 4. Cancer registries included in the prevalence analysis.
Austria Norway Netherlands Germany Poland Amsterdam Saarland Cracow UK England Iceland Warsaw East Anglia Italy Slovenia Northern and Yorkshire Firenze Slovakia Oxford Modena Sweden West Midlands Parma Switzerland Scotland Ragusa Geneva UK Wales Romagna

24
Table 5. Crude annual incidence and mortality rate and prevalence proportion by tumour entities. Rates and proportions are per 100,000
Incidence
Prevalence
Mortality
N. of cases
Crude rate
Lower Upper N. of cases
Crude rate
Lower Upper N. of cases
Crude rate
Lower Upper
Tumour entities
95% 95% 95%
EPITHELIAL TUMOURS OF THE NASAL CAVITY AND SINUSES
3,594 0.44 0.43 0.46 1,453 2.27 2.15 2.39 2,221 0.27 0.27 0.28
R Squamous cell carcinoma and variants of the Nasal Cavity and Sinuses
2,515 0.31 0.3 0.32 1,049 1.64 1.54 1.74 1,556 0.19 0.19 0.20
R Lymphoepithelial carcinoma of the Nasal Cavity and Sinuses
20 0.00 0.00 0.00 5 0.01 0.00 0.02 11 0.00 0.00 0.00
R Undifferentiated carcinoma of the Nasal Cavity and Sinuses
142 0.02 0.01 0.02 61 0.10 0.07 0.12 117 0.02 0.01 0.02
R Intestinal type adenocarcinoma of the Nasal Cavity and Sinuses
20 0.00 0.00 0.00 9 0.01 0.01 0.03 11 0.00 0.00 0.00
EPITHELIAL TUMOURS OF THE NASOPHARYNX 3,618 0.45 0.43 0.46 1,398 2.18 2.07 2.30 2,385 0.30 0.28 0.30
R Squamous cell carcinoma and variants of the Nasopharynx
2,657 0.33 0.32 0.34 1,098 1.71 1.61 1.82 1,685 0.21 0.20 0.22
R Papillary adenocarcicoma of the Nasopharynx 7 0.00 0.00 0.00 3 0.00 0.00 0.01 3 0.00 0.00 0.00
EPITHELIAL TUMOURS OF THE MAJOR SALIVARY GLANDS AND SALIVARY GLAND TYPE TUMORS
10,633 1.31 1.29 1.34 5,570 8.70 8.48 8.93 4,906 0.60 0.60 0.62
R Epithelial tumours of the major salivary glands 5,919 0.73 0.71 0.75 3,256 5.09 4.91 5.27 2,778 0.34 0.33 0.35 R Salivary gland type tumours of the Head and Neck 3,492 0.43 0.42 0.45 1,984 3.10 2.97 3.24 1,729 0.21 0.21 0.22
EPITHELIAL TUMOURS OF THE HYPOPHARYNX AND LARYNX
51,000 6.29 6.23 6.34 19,578 30.59 30.16 31.02 30,666 3.78 3.75 3.81
R Squamous cell carcinoma and variants of the Hypopharynx
9,633 1.19 1.16 1.21 1,960 3.06 2.93 3.20 8,196 1.01 0.99 1.03
R Squamous cell carcinoma and variants of the Larynx 37,851 4.67 4.62 4.71 16.553 25.86 25.47 26.26 20,746 2.56 2.53 2.58 EPITHELIAL TUMOURS OF THE OROPHARYNX 22,337 2.75 2.72 2.79 7,330 11.45 11.19 11.72 19,412 2.39 2.36 2.42
R Squamous cell carcinoma and variants of the Oropharynx
21,012 2.59 2.56 2.63 7,059 11.03 10.77 11.29 18,313 2.26 2.23 2.29
EPITHELIAL TUMOURS OF THE ORAL CAVITY AND LIP
38,892 4.8 4.75 4.84 16,846 26.32 25.93 26.72 NE NE NE NE

25
R Squamous cell carcinoma and variants of the Oral cavity
26,720 3.3 3.26 3.33 10,166 15.88 15.58 16.20 20,668 2.55 2.52 2.58
R Squamous cell carcinoma and variants of the Lip 9,894 1.22 1.20 1.24 6,092 9.52 9.28 9.76 3,273 0.40 0.40 0.41 EPITHELIAL TUMOURS OF THE OESOPHAGUS 60,723 7.49 7.43 7.55 7,109 11.11 10.85 11.37 57,804 7.13 7.07 7.19
R Squamous cell carcinoma and variants of the Oesophagus
27,525 3.39 3.35 3.43 3,155 4.93 4.76 5.11 26,190 3.23 3.19 3.26
R Adenocarcinoma and variants of the Oesophagus 22,986 2.83 2.8 2.87 3,319 5.19 5.01 5.37 21,987 2.71 2.68 2.75 R Salivary gland type tumours of the Oesophagus 47 0.01 0.00 0.01 4 0.01 0.00 0.02 45 0.01 0.00 0.01 R Undifferentiated carcinoma of the Oesophagus 595 0.07 0.07 0.08 44 0.07 0.05 0.09 575 0.07 0.07 0.08 EPITHELIAL TUMOURS OF THE STOMACH 151,346 18.66 18.57 18.76 26,764 41.82 41.32 42.32 128,769 15.88 15.80 15.96 F Adenocarcinoma and variants of the Stomach 123,800 15.27 15.18 15.35 24,483 38.25 37.78 38.74 102,227 12.61 12.53 12.68 R Squamous cell carcinoma and variants of the Stomach 1,049 0.13 0.12 0.14 144 0.23 0.19 0.27 1,014 0.13 0.12 0.14 R Salivary gland type tumours of the Stomach 41 0.01 0.00 0.01 10 0.02 0.01 0.03 35 0.01 0.00 0.01 R Undifferentiated carcinoma of the Stomach 1,361 0.17 0.16 0.18 176 0.28 0.24 0.32 1,248 0.16 0.15 0.17 EPITHELIAL TUMOURS OF THE SMALL INTESTINE 5,882 0.73 0.71 0.74 1,305 2.04 1.93 2.15 4,691 0.58 0.57 0.59 R Adenocarcinoma and variants of the Small Intestine 4,615 0.57 0.55 0.59 1,100 1.72 1.62 1.82 3,721 0.46 0.44 0.48
R Squamous cell carcinoma and variants of the Small Intestine
51 0.01 0.00 0.01 11 0.02 0.01 0.03 39 0.00 0.00 0.00
EPITHELIAL TUMOURS OF THE COLON 346,910 42.78 42.64 42.92 133,758 208.99 207.88 210.12 214,957 26.51 26.42 26.59 F Adenocarcinoma and variants of the Colon 302,918 37.36 37.22 37.49 127,282 198.88 197.78 199.97 175,124 21.60 21.52 21.67 R Squamous cell carcinoma and variants of the Colon 170 0.02 0.02 0.02 47 0.07 0.05 0.10 143 0.02 0.02 0.02 EPITHELIAL TUMOURS OF THE RECTUM 138,806 17.12 17.03 17.21 60,099 93.90 93.15 94.66 95,392 11.77 11.70 11.83 F Adenocarcinoma and variants of the Rectum 125,890 15.52 15.44 15.61 56,987 89.04 88.31 89.78 84,325 10.40 10.34 10.46 R Squamous cell carcinoma and variants of the Rectum 600 0.07 0.07 0.08 315 0.49 0.44 0.55 364 0.04 0.04 0.05 R Basaloid carcinoma of the Rectum 123 0.02 0.01 0.02 37 0.06 0.04 0.08 114 0.02 0.01 0.02 EPITHELIAL TUMOURS OF THE ANAL CANAL 8,922 1.10 1.08 1.12 4,133 6.46 6.26 6.66 5,653 0.70 0.68 0.71
R Squamous cell carcinoma and variants of the Anal Canal
4,982 0.61 0.60 0.63 2,815 4.40 4.24 4.56 2,742 0.34 0.33 0.35
R Adenocarcinoma and variants of the Anal Canal 2,098 0.26 0.25 0.27 575 0.90 0.83 0.97 1,540 0.19 0.18 0.20 R Basaloid carcinoma of the Anal Canal 993 0.12 0.11 0.13 507 0.79 0.72 0.86 627 0.08 0.07 0.08 R Paget disease of the Anal Canal 32 0.00 0.00 0.01 13 0.02 0.01 0.03 20 0.00 0.00 0.01 EPITHELIAL TUMOURS OF THE PANCREAS 95,836 11.82 11.74 11.89 4,936 7.71 7.50 7.93 93,658 11.55 11.47 11.62 F Adenocarcinoma and variants of the Pancreas 61,459 7.58 7.52 7.64 3,740 5.84 5.66 6.03 60,227 7.43 7.37 7.49 R Squamous cell carcinoma and variants of the Pancreas 211 0.03 0.02 0.03 19 0.03 0.02 0.05 198 0.03 0.02 0.03 R Acinar cell carcinoma of the Pancreas 175 0.02 0.02 0.03 29 0.05 0.03 0.06 145 0.02 0.02 0.02 R Mucinous cystadenocarcinoma of the Pancreas 65 0.01 0.01 0.01 19 0.03 0.02 0.05 39 0.01 0.01 0.01
R Intraductal papillary mucinous carcinoma invasive of the Pancreas
5 0.00 0.00 0.00 3 0.00 0.00 0.01 3 0.00 0.00 0.00
R Solid pseudopapillary carcinoma of the Pancreas 6 0.00 0.00 0.00 2 0.00 0.00 0.01 4 0.00 0.00 0.00
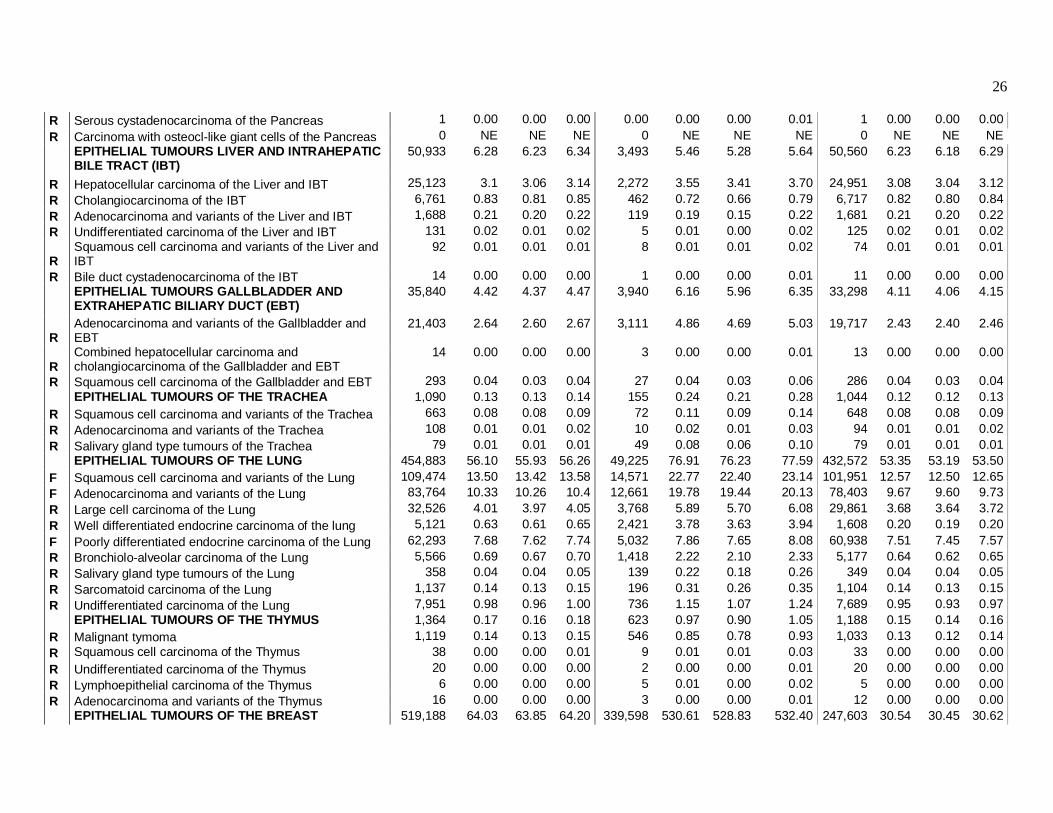
26 R Serous cystadenocarcinoma of the Pancreas 1 0.00 0.00 0.00 0.00 0.00 0.00 0.01 1 0.00 0.00 0.00 R Carcinoma with osteocl-like giant cells of the Pancreas 0 NE NE NE 0 NE NE NE 0 NE NE NE
EPITHELIAL TUMOURS LIVER AND INTRAHEPATIC BILE TRACT (IBT)
50,933 6.28 6.23 6.34 3,493 5.46 5.28 5.64 50,560 6.23 6.18 6.29
R Hepatocellular carcinoma of the Liver and IBT 25,123 3.1 3.06 3.14 2,272 3.55 3.41 3.70 24,951 3.08 3.04 3.12 R Cholangiocarcinoma of the IBT 6,761 0.83 0.81 0.85 462 0.72 0.66 0.79 6,717 0.82 0.80 0.84 R Adenocarcinoma and variants of the Liver and IBT 1,688 0.21 0.20 0.22 119 0.19 0.15 0.22 1,681 0.21 0.20 0.22 R Undifferentiated carcinoma of the Liver and IBT 131 0.02 0.01 0.02 5 0.01 0.00 0.02 125 0.02 0.01 0.02
R Squamous cell carcinoma and variants of the Liver and IBT
92 0.01 0.01 0.01 8 0.01 0.01 0.02 74 0.01 0.01 0.01
R Bile duct cystadenocarcinoma of the IBT 14 0.00 0.00 0.00 1 0.00 0.00 0.01 11 0.00 0.00 0.00
EPITHELIAL TUMOURS GALLBLADDER AND EXTRAHEPATIC BILIARY DUCT (EBT)
35,840 4.42 4.37 4.47 3,940 6.16 5.96 6.35 33,298 4.11 4.06 4.15
R Adenocarcinoma and variants of the Gallbladder and EBT
21,403 2.64 2.60 2.67 3,111 4.86 4.69 5.03 19,717 2.43 2.40 2.46
R Combined hepatocellular carcinoma and cholangiocarcinoma of the Gallbladder and EBT
14 0.00 0.00 0.00 3 0.00 0.00 0.01 13 0.00 0.00 0.00
R Squamous cell carcinoma of the Gallbladder and EBT 293 0.04 0.03 0.04 27 0.04 0.03 0.06 286 0.04 0.03 0.04 EPITHELIAL TUMOURS OF THE TRACHEA 1,090 0.13 0.13 0.14 155 0.24 0.21 0.28 1,044 0.12 0.12 0.13 R Squamous cell carcinoma and variants of the Trachea 663 0.08 0.08 0.09 72 0.11 0.09 0.14 648 0.08 0.08 0.09 R Adenocarcinoma and variants of the Trachea 108 0.01 0.01 0.02 10 0.02 0.01 0.03 94 0.01 0.01 0.02 R Salivary gland type tumours of the Trachea 79 0.01 0.01 0.01 49 0.08 0.06 0.10 79 0.01 0.01 0.01 EPITHELIAL TUMOURS OF THE LUNG 454,883 56.10 55.93 56.26 49,225 76.91 76.23 77.59 432,572 53.35 53.19 53.50 F Squamous cell carcinoma and variants of the Lung 109,474 13.50 13.42 13.58 14,571 22.77 22.40 23.14 101,951 12.57 12.50 12.65 F Adenocarcinoma and variants of the Lung 83,764 10.33 10.26 10.4 12,661 19.78 19.44 20.13 78,403 9.67 9.60 9.73 R Large cell carcinoma of the Lung 32,526 4.01 3.97 4.05 3,768 5.89 5.70 6.08 29,861 3.68 3.64 3.72 R Well differentiated endocrine carcinoma of the lung 5,121 0.63 0.61 0.65 2,421 3.78 3.63 3.94 1,608 0.20 0.19 0.20 F Poorly differentiated endocrine carcinoma of the Lung 62,293 7.68 7.62 7.74 5,032 7.86 7.65 8.08 60,938 7.51 7.45 7.57 R Bronchiolo-alveolar carcinoma of the Lung 5,566 0.69 0.67 0.70 1,418 2.22 2.10 2.33 5,177 0.64 0.62 0.65 R Salivary gland type tumours of the Lung 358 0.04 0.04 0.05 139 0.22 0.18 0.26 349 0.04 0.04 0.05 R Sarcomatoid carcinoma of the Lung 1,137 0.14 0.13 0.15 196 0.31 0.26 0.35 1,104 0.14 0.13 0.15 R Undifferentiated carcinoma of the Lung 7,951 0.98 0.96 1.00 736 1.15 1.07 1.24 7,689 0.95 0.93 0.97 EPITHELIAL TUMOURS OF THE THYMUS 1,364 0.17 0.16 0.18 623 0.97 0.90 1.05 1,188 0.15 0.14 0.16 R Malignant tymoma 1,119 0.14 0.13 0.15 546 0.85 0.78 0.93 1,033 0.13 0.12 0.14 R Squamous cell carcinoma of the Thymus 38 0.00 0.00 0.01 9 0.01 0.01 0.03 33 0.00 0.00 0.00 R Undifferentiated carcinoma of the Thymus 20 0.00 0.00 0.00 2 0.00 0.00 0.01 20 0.00 0.00 0.00 R Lymphoepithelial carcinoma of the Thymus 6 0.00 0.00 0.00 5 0.01 0.00 0.02 5 0.00 0.00 0.00 R Adenocarcinoma and variants of the Thymus 16 0.00 0.00 0.00 3 0.00 0.00 0.01 12 0.00 0.00 0.00 EPITHELIAL TUMOURS OF THE BREAST 519,188 64.03 63.85 64.20 339,598 530.61 528.83 532.40 247,603 30.54 30.45 30.62

27 F Invasive ductal carcinoma of the Breast 327,855 40.43 40.29 40.57 210,567 329.01 327.60 330.41 156,815 19.34 19.27 19.40 F Invasive lobular carcinoma of the Breast 58,726 7.24 7.18 7.30 37,579 58.72 58.12 59.31 32,190 3.97 3.94 4.00 R Mammary Paget’s disease of the Breast 4,135 0.51 0.49 0.53 2,795 4.37 4.21 4.53 1,325 0.16 0.16 0.17 R Special types of adenocarcinoma of the Breast 28,997 3.58 3.53 3.62 22,070 34.48 34.03 34.94 9,042 1.12 1.10 1.13 R Metaplastic carcinoma of the Breast 495 0.06 0.06 0.07 263 0.41 0.36 0.46 339 0.04 0.04 0.05 R Salivary gland type tumours of the Breast 426 0.05 0.05 0.06 252 0.39 0.35 0.45 368 0.04 0.04 0.05 R Epithelial tumours of the Male Breast 3,835 0.97 0.94 1.00 1,896 6.09 5.82 6.37 1,812 0.46 0.44 0.47 EPITHELIAL TUMOURS OF THE CORPUS UTERI 84,500 10.42 10.35 10.49 59,973 93.71 92.96 94.46 28,647 3.53 3.51 3.56 F Adenocarcinoma and variants of the Corpus Uteri 77,394 9.54 9.48 9.61 56,676 88.56 87.83 89.29 24,123 2.97 2.95 3.00
R Squamous cell carcinoma and variants of the Corpus Uteri
945 0.12 0.11 0.12 392 0.61 0.55 0.68 579 0.07 0.07 0.07
R Adenoid cystic carcinoma of the Corpus Uteri 11 0.00 0.00 0.00 81 0.13 0.10 0.16 2 0.00 0.00 0.00 R Transitional cell carcinoma of the Corpus Uteri 1 0.00 0.00 0.00 2 0.00 0.00 0.01 0 NE NE NE EPITHELIALTUMOURS OF THE CERVIX UTERI 49,259 6.07 6.02 6.13 37,713 58.93 58.33 59.52 20,984 2.59 2.56 2.61
R Squamous cell carcinoma and variants of the Cervix Uteri
34,703 4.28 4.23 4.32 26,833 41.93 41.43 42.43 14,367 1.77 1.75 1.79
R Adenocarcinoma and variants of the Cervix Uteri 8,198 1.01 0.99 1.03 5,773 9.02 8.79 9.26 3,711 0.46 0.45 0.47 R Undifferentiated carcinoma of the Cervix Uteri 203 0.03 0.02 0.03 105 0.16 0.13 0.20 168 0.02 0.02 0.02
R MIXED EPITHELIAL AND MESENCHYMAL TUMOURS OF THE UTERUS
3,613 0.45 0.43 0.46 1,304 2.04 1.93 2.15 2,597 0.32 0.31 0.33
EPITHELIAL TUMOURS OF THE OVARY AND FALLOPIAN TUBE
76,284 9.41 9.34 9.47 28,525 44.57 44.05 45.09 61,632 7.60 7.55 7.65
R Adenocarcinoma and variants of the Ovary 48,410 5.97 5.92 6.02 19,297 30.15 29.73 30.58 39,814 4.91 4.87 4.95 R Mucinous adenocarcinoma of the Ovary 6,852 0.84 0.83 0.87 3,608 5.64 5.46 5.83 3,640 0.45 0.44 0.46 R Clear cell adenocarcinoma of the Ovary 2,622 0.32 0.31 0.34 1,266 1.98 1.87 2.09 1,861 0.23 0.22 0.24 R Adenocarcinoma and variants of the Fallopian tube 2,168 0.27 0.26 0.28 989 1.55 1.45 1.64 1,605 0.20 0.19 0.21 NON EPITHELIAL TUMOURS OF THE OVARY 3,513 0.43 0.42 0.45 2,074 3.24 3.10 3.38 NE NE NE NE R Mixed epithelial mesenchymal tumors of the Ovary 1,270 0.16 0.15 0.17 278 0.43 0.38 0.49 1,198 0.15 0.14 0.16 R Sex cord tumours of the Ovary 1,088 0.13 0.13 0.14 824 1.29 1.20 1.38 629 0.08 0.08 0.08 R Malignant Immature Teratomas of the Ovary 548 0.07 0.06 0.07 412 0.64 0.58 0.71 147 0.02 0.02 0.02 R Germ cell tumours of the Ovary 607 0.07 0.07 0.08 560 0.87 0.80 0.95 79 0.01 0.01 0.01 EPITHELIAL TUMOURS OF THE VULVA & VAGINA 15,522 1.91 1.88 1.94 7,374 11.52 11.26 11.79 8,049 0.99 0.97 1.01
R Squamous cell carcinoma and variants of the Vulva and Vagina
12,186 1.5 1.48 1.53 5,884 9.19 8.96 9.43 6,213 0.76 0.75 0.78
R Adenocarcinoma and variants of the Vulva and Vagina 629 0.08 0.07 0.08 251 0.39 0.35 0.44 487 0.06 0.05 0.06 R Paget disease of the Vulva and Vagina 414 0.05 0.05 0.06 248 0.39 0.34 0.44 414 0.05 0.05 0.06 R Undifferentiated carcinoma of the Vulva and Vagina 65 0.01 0.01 0.01 24 0.04 0.02 0.06 50 0.01 0.01 0.01 TROPHOBLASTIC TUMOURS OF THE PLACENTA 192 0.02 0.02 0.03 236 0.37 0.32 0.42 19 0.00 0.00 0.00 R Choriocarcinoma of the Placenta 192 0.02 0.02 0.03 236 0.37 0.32 0.42 19 0.00 0.00 0.00

28 EPITHELIAL TUMOURS OF THE PROSTATE 388,741 47.94 47.79 48.09 185,701 290.15 288.84 291.48 321,397 39.64 39.51 39.76 F Adenocarcinoma and variants of the Prostate 328,962 40.57 40.43 40.71 170,016 265.65 264.38 266.91 271,482 33.48 33.37 33.60 R Squamous cell carcinoma and variants of the Prostate 910 0.11 0.11 0.12 472 0.74 0.67 0.81 863 0.10 0.10 0.11 R Infiltrating duct carcinoma of the Prostate 3,819 0.47 0.46 0.49 2,806 4.38 4.22 4.55 3,533 0.43 0.43 0.45 R Transitional cell carcinoma of the Prostate 518 0.06 0.06 0.07 174 0.27 0.23 0.32 395 0.05 0.05 0.05 R Salivary gland type tumours of the Prostate 13 0.00 0.00 0.00 4 0.01 0.00 0.02 10 0.00 0.00 0.00 TUMOURS OF THE TESTIS AND PARATESTIS 25,510 3.15 3.11 3.18 26,722 41.75 41.25 42.26 3,154 0.39 0.38 0.39 R Adenocarcinoma and variants of the Paratestis 12 0.00 0.00 0.00 6 0.01 0.00 0.02 8 0.00 0.00 0.00 R Malignant Immature Teratomas of the Testis 6,748 0.83 0.81 0.85 7,424 11.60 11.34 11.87 1,128 0.14 0.14 0.14 R Germ cell tumours Seminomatous of the Testis 14,089 1.74 1.71 1.77 14,560 22.75 22.38 23.12 1,014 0.13 0.12 0.13 R Germ cell tumours non Seminomatous of the Testis 2,935 0.36 0.35 0.38 2,539 3.97 3.81 4.13 400 0.05 0.05 0.05 R Trophoblastic tumours of the Testis 140 0.02 0.01 0.02 103 0.16 0.13 0.20 41 0.01 0.00 0.01 R Sex Cord tumours of the Testis 178 0.02 0.02 0.03 144 0.22 0.19 0.26 30 0.00 0.00 0.00 EPITHELIAL TUMOURS OF THE PENIS 5,058 0.62 0.61 0.64 2,635 4.12 3.96 4.28 1,877 0.23 0.23 0.24 R Squamous cell carcinoma and variants of the Penis 4,649 0.57 0.56 0.59 2,423 3.79 3.64 3.94 1,847 0.23 0.22 0.23 R Adenocarcinoma and variants of the Penis 40 0.00 0.00 0.01 16 0.02 0.01 0.04 31 0.00 0.00 0.01 EPITHELIAL TUMOURS OF THE KIDNEY 85,671 10.56 10.49 10.64 37,169 58.08 57.49 58.67 63,861 7.87 7.82 7.93 F Renal cell carcinoma and variants 67,788 8.36 8.3 8.42 34,419 53.78 53.21 54.35 49,198 6.07 6.02 6.11
R Squamous cell carcinoma spindle cell type of the Kidney
56 0.01 0.01 0.01 8 0.01 0.01 0.02 51 0.01 0.01 0.01
R Squamous cell carcinoma and variants of the Kidney 284 0.04 0.03 0.04 33 0.05 0.04 0.07 258 0.04 0.03 0.04
EPITHELIAL TUMOURS OF THE PELVIS, URETHER AND URETHRA
12,888 1.59 1.56 1.62 5,569 8.70 8.47 8.93 7,723 0.95 0.93 0.97
R Transitional cell carcinoma of the Pelvis, Ureter and Urethra
11,139 1.37 1.35 1.4 5,021 7.85 7.63 8.07 6,520 0.80 0.79 0.82
R Squamous cell carcinoma and variants of the Pelvis, Ureter and Urethra
417 0.05 0.05 0.06 114 0.18 0.15 0.21 377 0.05 0.05 0.05
R Adenocarcinoma and variants of the Pelvis, Ureter and Urethra
301 0.04 0.03 0.04 119 0.19 0.15 0.22 258 0.03 0.03 0.03
R Salivary gland type tumours of the Pelvis, Ureter and Urethra
2 0.00 0.00 0.00 1 0.00 0.00 0.01 1 0.00 0.00 0.00
EPITHELIAL TUMOURS OF THE BLADDER 163,624 20.18 20.08 20.28 74,279 116.06 115.23 116.90 77,406 9.55 9.50 9.59 F Transitional cell carcinoma of the Bladder 141,716 17.48 17.39 17.57 67,621 105.66 104.86 106.46 64,753 7.99 7.95 8.03 R Squamous cell carcinoma and variants of the Bladder 3,436 0.42 0.41 0.44 851 1.33 1.24 1.42 2,272 0.28 0.27 0.29 R Adenocarcinoma and variants of the Bladder 2,331 0.29 0.28 0.3 692 1.08 1.00 1.16 1,587 0.20 0.19 0.20 R Salivary gland type tumours of the Bladder 9 0.00 0.00 0.00 2 0.00 0.00 0.01 5 0.00 0.00 0.00 EPITHELIAL TUMOURS OF THE EYE AND ADNEXA 1,286 0.16 0.15 0.17 750 1.17 1.09 1.26 497 0.06 0.06 0.07
R Squamous cell carcinoma and variants of the Eye Adnexa
304 0.04 0.03 0.04 139 0.22 0.18 0.26 118 0.02 0.01 0.02
R Adenocarcinoma and variants of the Eye Adnexa 90 0.01 0.01 0.01 55 0.09 0.06 0.11 90 0.01 0.01 0.01

29 EPITHELIAL TUMOURS OF THE MIDDLE EAR 245 0.03 0.03 0.03 103 0.16 0.13 0.19 161 0.02 0.02 0.02
R Squamous cell carcinoma and variants of the Middle Ear
180 0.02 0.02 0.03 65 0.10 0.08 0.13 126 0.01 0.01 0.02
R Adenocarcinoma and variants of the Middle Ear 29 0.00 0.00 0.01 22 0.03 0.02 0.05 19 0.00 0.00 0.01 MALIGNANT MESOTHELIOMA 15,456 1.91 1.88 1.94 1,427 2.23 2.12 2.35 15,186 1.88 1.85 1.91 R Mesothelioma of the pleura and pericardium 13,056 1.61 1.58 1.64 1,210 1.89 1.79 2.00 12,897 1.59 1.56 1.62 R Mesothelioma of the peritoneum tunica vaginalis 1,014 0.13 0.12 0.13 112 0.17 0.14 0.21 986 0.13 0.12 0.13 F MALIGNANT SKIN MELANOMA 100,883 12.44 12.36 12.52 79,245 123.82 122.96 124.68 31,572 3.89 3.87 3.92 R MALIGNANT MELANOMA OF THE MUCOSA 4,132 0.51 0.49 0.53 1,059 1.66 1.56 1.76 3,250 0.40 0.39 0.42 R MALIGNANT MELANOMA OF THE UVEA 5,301 0.65 0.64 0.67 3,306 5.17 4.99 5.35 2,242 0.27 0.27 0.28 EPITHELIAL TUMOURS OF THE SKIN 397,503 49.02 48.87 49.17 257,623 402.53 400.98 404.09 NE NE NE NE F Basal cell carcinoma of the Skin 263,713 32.52 32.4 32.65 176,685 276.07 274.78 277.36 1,258 0.16 0.15 0.16 F Squamous cell carcinoma and variants of the Skin 132,597 16.35 16.26 16.44 80,506 125.79 124.92 126.66 23,454 2.89 2.88 2.91 R ADNEXAL CARCINOMA OF THE SKIN 2,247 0.28 0.27 0.29 1,312 2.05 1.94 2.16 2,247 0.28 0.27 0.29 EMBRYONAL NEOPLASMS 2,789 0.34 0.33 0.36 2,399 3.75 3.60 3.90 1,073 0.13 0.13 0.14 R Neuroblastoma and ganglioneuroblastoma 982 0.12 0.11 0.13 628 0.98 0.91 1.06 632 0.08 0.07 0.08 R Nephroblastoma 1,149 0.14 0.13 0.15 1,076 1.68 1.58 1.78 312 0.04 0.04 0.04 R Retinoblastoma 437 0.05 0.05 0.06 539 0.84 0.77 0.92 0 NE NE NE R Hepatoblastoma 181 0.02 0.02 0.03 139 0.22 0.18 0.26 40 0.00 0.00 0.01 R Pulmonary blastoma 34 0.00 0.00 0.01 13 0.02 0.01 0.03 7 0.00 0.00 0.00 R Pancreatoblastoma 6 0.00 0.00 0.00 4 0.01 0.00 0.02 0 NE NE NE EXTRAGONADIC GERM CELL TUMOURS 1,028 0.13 0.12 0.13 687 1.07 0.99 1.16 396 0.05 0.05 0.05 R Extragonadic malignant Immature Teratomas 337 0.04 0.04 0.05 202 0.32 0.27 0.36 153 0.02 0.02 0.02 R Extragonadic Germ cell tumours 691 0.09 0.08 0.09 485 0.76 0.69 0.83 189 0.02 0.02 0.02 SOFT TISSUE SARCOMA 38,527 4.75 4.7 4.8 18,335 28.65 28.23 29.07 23,756 2.93 2.90 2.96 R Soft tissue sarcoma of the Head and Neck 2,356 0.29 0.28 0.3 1,183 1.85 1.74 1.96 1,276 0.16 0.15 0.16 R Soft tissue sarcoma of the Limbs 8,376 1.03 1.01 1.06 4,821 7.53 7.32 7.75 4,489 0.55 0.54 0.57 R Soft tissue sarcoma of the Superficial Trunk 3,824 0.47 0.46 0.49 1,503 2.35 2.23 2.47 2,497 0.31 0.30 0.32 R Soft tissue sarcoma of the Mediastinum 218 0.03 0.02 0.03 35 0.06 0.04 0.08 180 0.02 0.02 0.02 R Soft tissue sarcoma of the Heart 121 0.01 0.01 0.02 15 0.02 0.01 0.04 99 0.01 0.01 0.02 R Soft tissue sarcoma of the Breast 1,513 0.19 0.18 0.20 902 1.41 1.32 1.51 648 0.08 0.08 0.09 R Soft tissue sarcoma of the Uterus 4,035 0.5 0.48 0.51 2,005 3.13 3.00 3.27 2,621 0.32 0.31 0.33 R Soft tissue sarcoma of the Genitourinary other 1,939 0.24 0.23 0.25 789 1.23 1.15 1.32 1,298 0.16 0.15 0.17 R Soft tissue sarcoma of the other Viscera 4,129 0.51 0.49 0.52 1,339 2.09 1.98 2.21 3,351 0.41 0.40 0.42 R Soft tissue sarcoma of the Paratesticular region 265 0.03 0.03 0.04 163 0.25 0.22 0.30 265 0.03 0.03 0.04
R Soft tissue sarcoma of the Retroperitoneum and Peritoneum
2,344 0.29 0.28 0.30 674 1.05 0.98 1.14 2,147 0.27 0.26 0.27
R Soft tissue sarcoma of the Pelvis 118 0.01 0.01 0.02 26 0.04 0.03 0.06 90 0.01 0.01 0.02 R Soft tissue sarcoma of the Skin 2,514 0.31 0.3 0.32 1,724 2.69 2.57 2.82 550 0.07 0.07 0.07

30 R Soft tissue sarcoma of the Paraorbital region 56 0.01 0.01 0.01 45 0.07 0.05 0.09 13 0.00 0.00 0.00
R Soft tissue sarcoma of the Brain and other Nervous System
1,621 0.2 0.19 0.21 786 1.23 1.14 1.32 947 0.12 0.11 0.12
R Embryonal rhabdomyosarcoma of the Soft Tissue 495 0.06 0.06 0.07 345 0.54 0.48 0.60 196 0.02 0.02 0.03 R Alveolar rhabdomyosarcoma of the Soft Tissue 263 0.03 0.03 0.04 96 0.15 0.12 0.18 215 0.02 0.02 0.03 R Ewing’s family tumours of the Soft Tissue 193 0.02 0.02 0.03 100 0.16 0.13 0.19 135 0.01 0.01 0.02 BONE SARCOMA 6,523 0.8 0.79 0.82 3,735 5.84 5.65 6.03 4,539 0.56 0.55 0.57 R Osteogenic sarcomas 1,850 0.23 0.22 0.24 1,065 1.66 1.57 1.77 1,187 0.15 0.14 0.15 R Chondrogenic sarcomas 1,982 0.24 0.23 0.26 1,268 1.98 1.87 2.09 962 0.12 0.11 0.13 R Notochordal sarcomas, Chordoma 355 0.04 0.04 0.05 197 0.31 0.27 0.35 355 0.04 0.04 0.05 R Vascular sarcomas, Angiosarcoma 26 0.00 0.00 0.00 7 0.01 0.00 0.02 24 0.00 0.00 0.00 R Ewing’s family of tumours 1,021 0.13 0.12 0.13 544 0.85 0.78 0.92 566 0.07 0.07 0.07 R Epithelial tumours, Adamantinoma 70 0.01 0.01 0.01 39 0.06 0.04 0.08 25 0.00 0.00 0.00
R Other high grade sarcomas (fibrosarcoma, malignant fibrous histyocitoma)
147 0.02 0.02 0.02 60 0.09 0.07 0.12 90 0.01 0.01 0.01
R GASTROINTESTINAL STROMAL SARCOMA 536 0.07 0.06 0.07 224 0.35 0.31 0.40 305 0.04 0.03 0.04 R KAPOSI SARCOMA 2,925 0.36 0.35 0.37 980 1.53 1.44 1.63 2,637 0.32 0.32 0.33 NEURO ENDOCRINE TUMOURS 20,466 2.52 2.49 2.56 8,465 13.23 12.95 13.51 15,390 1.89 1.87 1.93 R Well differentiated endocrine tumours, carcinoid 2,961 0.37 0.35 0.38 799 1.25 1.16 1.34 2,881 0.36 0.34 0.37 R Well differentiated endocrine tumours, atypical carcinoid 6 0.00 0.00 0.00 3 0.00 0.00 0.01 4 0.00 0.00 0.00
R Poorly differentiated endocrine carcinoma (lung microcytoma excluded)
4,225 0.52 0.51 0.54 575 0.90 0.83 0.98 3,528 0.43 0.43 0.45
R Mixed endocrine-exocrine carcinoma 17 0.00 0.00 0.00 7 0.01 0.00 0.02 16 0.00 0.00 0.00 R Endocrine carcinoma of the Thyroid gland 1,772 0.22 0.21 0.23 1,156 1.81 1.70 1.91 871 0.11 0.10 0.11
R Well differentiated endocrine carcinoma not functioning of the Pancreas and of the Digestive tract
10,152 1.25 1.23 1.28 5,351 8.36 8.14 8.59 10,152 1.25 1.23 1.28
R Well differentiated endocrine carcinoma functioning of the Pancreas and of the Digestive tract
200 0.02 0.02 0.03 96 0.15 0.12 0.18 112 0.01 0.01 0.02
R Endocrine carcinoma of the Skin 1,082 0.13 0.13 0.14 449 0.70 0.64 0.77 457 0.05 0.05 0.06 CARCINOMA OF ENDOCRINE ORGANS 33,757 4.16 4.12 4.21 23,316 36.43 35.96 36.90 NE NE NE NE R Carcinomas of the Pituitary gland 333 0.04 0.04 0.05 300 0.47 0.42 0.52 316 0.04 0.04 0.05 R Carcinomas of theThyroid gland 29,803 3.68 3.63 3.72 21,639 33.81 33.36 34.26 16,220 2.00 1.98 2.02 R Carcinomas of the Parathyroid gland 179 0.02 0.02 0.03 113 0.18 0.15 0.21 174 0.02 0.02 0.03 R Carcinoma of the Adrenal gland 1,471 0.18 0.17 0.19 498 0.78 0.71 0.85 1,244 0.15 0.14 0.16
GLIAL TUMOURS OF THE CENTRAL NERVOUS SYSTEM (CNS) AND PINEAL GLAND
43,344 5.35 5.29 5.4 9,286 14.51 14.21 14.81 41,208 5.09 5.03 5.13
R Astrocytic tumours of the CNS 38,864 4.79 4.75 4.84 6,963 10.88 10.63 11.14 37,450 4.62 4.58 4.66 R Oligodendroglial tumours of the CNS 2,863 0.35 0.34 0.37 1,266 1.98 1.87 2.09 2,863 0.35 0.34 0.37 R Ependymal tumours of the CNS
1,617 0.2 0.19 0.21 1,056 1.65 1.55 1.75 988 0.12 0.12 0.13

31
NON GLIAL TUMOURS OF THE CENTRAL NERVOUS SYSTEM (CNS) AND PINEAL GLAND
1,816 0.22 0.21 0.23 1,028 1.61 1.51 1.71 1,077 0.13 0.12 0.14
R Embryonal tumours of the CNS 1,766 0.22 0.21 0.23 988 1.54 1.45 1.64 1,057 0.13 0.13 0.14 R Choroid plexus carcinoma of the CNS 50 0.01 0.00 0.01 40 0.06 0.04 0.09 17 0.00 0.00 0.00 R MALIGNANT MENINGIOMAS 1,225 0.15 0.14 0.16 769 1.20 1.12 1.29 826 0.10 0.09 0.11
GLIAL TUMOURS OF THE OF THE NERVES, AUTONOMIC NERVOUS SYSTEM AND PARAGANGLIA
82 0.01 0.01 0.01 60 0.09 0.07 0.12 18 0.00 0.00 0.00
R Astrocytic tumours of the Nerves, Autonomic Nervous System and Paraganglia
40 0.00 0.00 0.01 30 0.05 0.03 0.07 6 0.00 0.00 0.00
R Ependymal tumours of the Nerves, Autonomic Nervous System and Paraganglia
42 0.01 0.00 0.01 30 0.05 0.03 0.07 0 NE NE NE
NON-GLIAL TUMOURS OF THE OF THE NERVES, AUTONOMIC NERVOUS SYSTEM AND PARAGANGLIA
800 0.10 0.09 0.11 467 0.73 0.66 0.80 521 0.07 0.06 0.07
R Embryonal tumours of the Nerves, Autonomic Nervous System and Paraganglia
599 0.07 0.07 0.08 354 0.55 0.50 0.61 400 0.05 0.05 0.05
R Paraganglioma 201 0.02 0.02 0.03 113 0.18 0.14 0.21 138 0.01 0.01 0.02 LYMPHOID DISEASES 236,546 29.17 29.05 29.29 99,405 155.32 154.35 156.29 226,766 27.96 27.85 28.08 R Classical Hodgkin Lymphoma 19,318 2.38 2.35 2.42 14,652 22.89 22.52 23.27 8,414 1.04 1.02 1.05 R Hodgkin lymphoma nodular lymphocyte predominance 469 0.06 0.05 0.06 305 0.48 0.42 0.53 253 0.03 0.03 0.03 R Composite Hodgkin NHL 42 0.01 0.00 0.01 2 0.00 0.00 0.01 21 0.01 0.00 0.01
R Precursor B/T lymphoblastic leukaemia/lymphoblastic lymphoma
10,384 1.28 1.26 1.31 6,295 9.84 9.59 10.08 6,205 0.76 0.75 0.78
R Non Hodgkin Mature T cell and NK cell neoplasms 7,870 0.97 0.95 0.99 3,230 5.05 4.87 5.22 3,264 0.40 0.39 0.41 F Non Hodgkin Mature B cell lymphoma 141,972 17.51 17.42 17.6 52,491 82.02 81.32 82.72 141,972 17.51 17.42 17.60
ACUTE MYELOYD LEUKAEMIA AND RELATED PRECURSOR NEOPLASMS
29,982 3.70 3.66 3.74 4,953 7.74 7.53 7.96 28,686 3.54 3.50 3.58
R Acute Myeloid Leukamia with recurrent genetic abnormalities
921 0.11 0.11 0.12 376 0.59 0.53 0.65 901 0.11 0.11 0.12
R Acute myeloid leukemia NOS (FAB or WHO type) 23,039 2.84 2.8 2.88 3,631 5.67 5.49 5.86 22,053 2.72 2.68 2.76 R AML with myelodisplasia related and RAEBT-T 399 0.05 0.04 0.05 35 0.05 0.04 0.08 172 0.02 0.02 0.02 R Therapy related myeloid neoplasms 9 0.00 0.00 0.00 2 0.00 0.00 0.01 8 0.00 0.00 0.00 R Acute Myeloid Leukamia NOS and other AML 3,916 0.48 0.47 0.5 693 1.08 1.00 1.17 3,810 0.47 0.46 0.49 R Myeloid sarcoma 124 0.02 0.01 0.02 29 0.05 0.03 0.07 43 0.01 0.00 0.01 R Blastic plasmocytoid dendritic cell neoplasm* MYELOPROLIFERATIVE NEOPLASMS 24,859 3.07 3.03 3.1 11,189 17.48 17.16 17.81 23,771 2.94 2.90 2.96 R Chronic myeloid leukemia 10,185 1.26 1.23 1.28 3,087 4.82 4.65 5.00 10,185 1.26 1.23 1.28 R Myelosclerosis with myeloid metaplasia 1,010 0.12 0.12 0.13 323 0.50 0.45 0.56 669 0.08 0.08 0.09 R Essential thrombocythemia 3,886 0.48 0.46 0.49 2,557 4.00 3.84 4.15 3,886 0.48 0.46 0.49
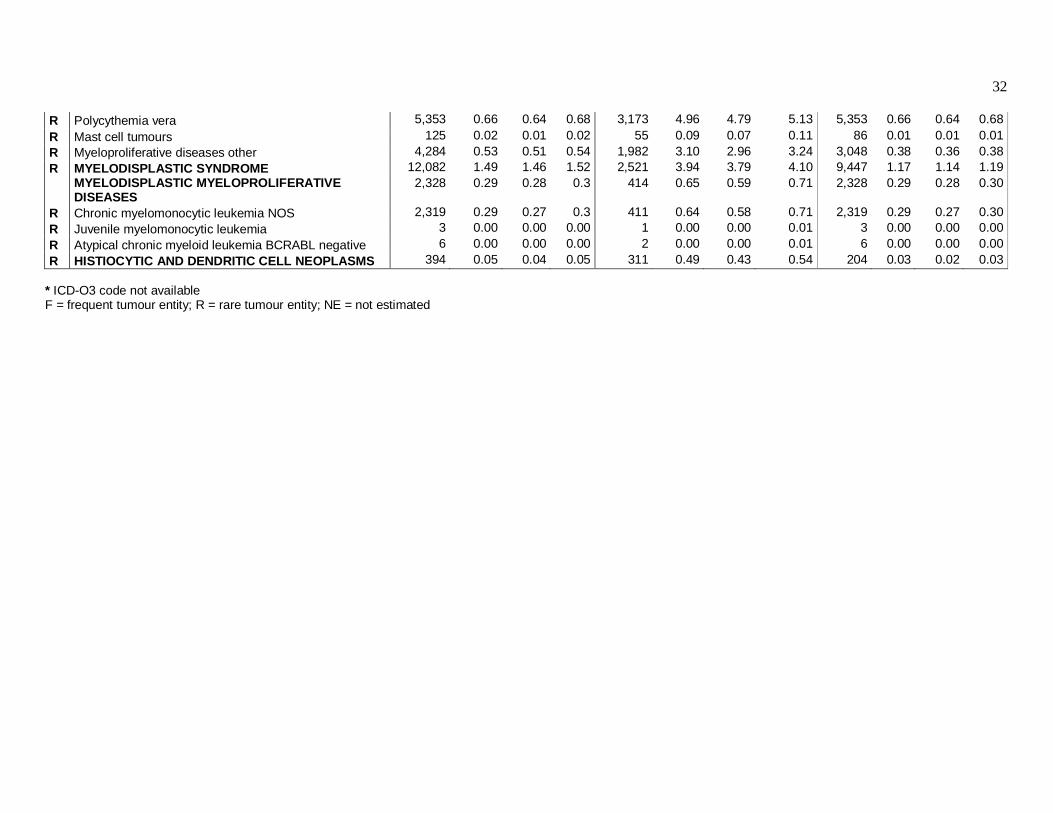
32 R Polycythemia vera 5,353 0.66 0.64 0.68 3,173 4.96 4.79 5.13 5,353 0.66 0.64 0.68 R Mast cell tumours 125 0.02 0.01 0.02 55 0.09 0.07 0.11 86 0.01 0.01 0.01 R Myeloproliferative diseases other 4,284 0.53 0.51 0.54 1,982 3.10 2.96 3.24 3,048 0.38 0.36 0.38 R MYELODISPLASTIC SYNDROME 12,082 1.49 1.46 1.52 2,521 3.94 3.79 4.10 9,447 1.17 1.14 1.19
MYELODISPLASTIC MYELOPROLIFERATIVE DISEASES
2,328 0.29 0.28 0.3 414 0.65 0.59 0.71 2,328 0.29 0.28 0.30
R Chronic myelomonocytic leukemia NOS 2,319 0.29 0.27 0.3 411 0.64 0.58 0.71 2,319 0.29 0.27 0.30 R Juvenile myelomonocytic leukemia 3 0.00 0.00 0.00 1 0.00 0.00 0.01 3 0.00 0.00 0.00 R Atypical chronic myeloid leukemia BCRABL negative 6 0.00 0.00 0.00 2 0.00 0.00 0.01 6 0.00 0.00 0.00 R HISTIOCYTIC AND DENDRITIC CELL NEOPLASMS 394 0.05 0.04 0.05 311 0.49 0.43 0.54 204 0.03 0.02 0.03
* ICD-O3 code not available F = frequent tumour entity; R = rare tumour entity; NE = not estimated

33
Table 6. Crude annual incidence and mortality rate and prevalence proportion by layer 1 tumour entity. Rates and proportions are per 100,000. Tumour entities Incidence Prevalence Mortality RARE N. of
cases Crude rate
Lower Upper N. of cases
Crude rate
Lower Upper N. of cases
Crude rate
Lower Upper
EPITHELIAL TUMOURS OF THE NASAL CAVITY AND SINUSES
3,594 0.44 0.43 0.46 1,453 2.27 2.15 2.39 2,221 0.27 0.27 0.28
EPITHELIAL TUMOURS OF THE NASOPHARYNX
3,618 0.45 0.43 0.46 1,398 2.18 2.07 2.30 2,385 0.30 0.28 0.30
EPITHELIAL TUMOURS OF MAJOR SALIVARY GLANDS AND SALIVARY GLAND TYPE TUMORS
10,633 1.31 1.29 1.34 5,570 8.70 8.48 8.93 4,906 0.60 0.60 0.62
EPITHELIAL TUMOURS OF THE OROPHARYNX
22,337 2.75 2.72 2.79 7,330 11.45 11.19 11.72 19,412 2.39 2.36 2.42
EPITHELIAL TUMOURS OF THE ORAL CAVITY AND LIP
38,892 4.8 4.75 4.84 16,846 26.32 25.93 26.72 NE NE NE NE
EPITHELIAL TUMOURS OF THE SMALL INTESTINE
5,882 0.73 0.71 0.74 1,305 2.04 1.93 2.15 4,691 0.58 0.57 0.59
EPITHELIAL TUMOURS OF THE ANAL CANAL
8,922 1.10 1.08 1.12 4,133 6.46 6.26 6.66 5,653 0.70 0.68 0.71
EPITHELIAL TUMOURS GALLBLADDER AND EXTRAHEPATIC BILIARY DUCT
35,840 4.42 4.37 4.47 3,940 6.16 5.96 6.35 33,298 4.11 4.06 4.15
EPITHELIAL TUMOURS OF THE TRACHEA
1,090 0.13 0.13 0.14 155 0.24 0.21 0.28 1,044 0.12 0.12 0.13
EPITHELIAL TUMOURS OF THE THYMUS
1,364 0.17 0.16 0.18 623 0.97 0.90 1.05 1,188 0.15 0.14 0.16
MIXED EPITHELIAL AND MESENCHYMAL TUMOURS OF THE UTERUS
3,613 0.45 0.43 0.46 1,304 2.04 1.93 2.15 2,597 0.32 0.31 0.33
NON EPITHELIAL TUMOURS OF THE OVARY
3,513 0.43 0.42 0.45 2,074 3.24 3.10 3.38 NE NE NE NE
EPITHELIAL TUMOURS OF THE VULVA & VAGINA
15,522 1.91 1.88 1.94 7,374 11.52 11.26 11.79 8,049 0.99 0.97 1.01
TROPHOBLASTIC TUMOURS OF THE PLACENTA
192 0.02 0.02 0.03 236 0.37 0.32 0.42 19 0.00 0.00 0.00

34 TUMOURS OF THE TESTIS AND PARATESTIS
25,510 3.15 3.11 3.18 26,722 41.75 41.25 42.26 3,154 0.39 0.38 0.39
EPITHELIAL TUMOURS OF THE PENIS 5,058 0.62 0.61 0.64 2,635 4.12 3.96 4.28 1,877 0.23 0.23 0.24
EPITHELIAL TUMOURS OF THE PELVIS URETHER AND URETHRA
12,888 1.59 1.56 1.62 5,569 8.70 8.47 8.93 7,723 0.95 0.93 0.97
EPITHELIAL TUMOURS OF THE EYE AND ADNEXA
1,286 0.16 0.15 0.17 750 1.17 1.09 1.26 497 0.06 0.06 0.07
EPITHELIAL TUMOURS OF THE MIDDLE EAR
245 0.03 0.03 0.03 103 0.16 0.13 0.19 161 0.02 0.02 0.02
MALIGNANT MESOTHELIOMA 15,456 1.91 1.88 1.94 1,427 2.23 2.12 2.35 15,186 1.88 1.85 1.91
MALIGNANT MELANOMA OF THE MUCOSA
4,132 0.51 0.49 0.53 1,059 1.66 1.56 1.76 3,250 0.40 0.39 0.42
MALIGNANT MELANOMA OF THE UVEA
5,301 0.65 0.64 0.67 3,306 5.17 4.99 5.35 2,242 0.27 0.27 0.28
ADNEXAL CARCINOMA OF THE SKIN 2,247 0.28 0.27 0.29 1,312 2.05 1.94 2.16 2,247 0.28 0.27 0.29
EMBRYONAL NEOPLASMS 2,789 0.34 0.33 0.36 2,399 3.75 3.60 3.90 1,073 0.13 0.13 0.14
EXTRAGONADIC GERM CELL TUMOURS
1,028 0.13 0.12 0.13 687 1.07 0.99 1.16 396 0.05 0.05 0.05
SOFT TISSUE SARCOMA 38,527 4.75 4.7 4.8 18,335 28.65 28.23 29.07 23,756 2.93 2.90 2.96
BONE SARCOMA 6,523 0.8 0.79 0.82 3,735 5.84 5.65 6.03 4,539 0.56 0.55 0.57
GASTROINTESTINAL STROMAL SARCOMA
536 0.07 0.06 0.07 224 0.35 0.31 0.40 305 0.04 0.03 0.04
KAPOSI SARCOMA 2,925 0.36 0.35 0.37 980 1.53 1.44 1.63 2,637 0.32 0.32 0.33
NEURO ENDOCRINE TUMOURS 20,466 2.52 2.49 2.56 8,465 13.23 12.95 13.51 15,390 1.89 1.87 1.93
CARCINOMA OF ENDOCRINE ORGANS 33,757 4.16 4.12 4.21 23,316 36.43 35.96 36.90 NE NE NE NE GLIAL TUMOURS OF THE CENTRAL NERVOUS SYSTEM AND PINEAL GLAND
43,344 5.35 5.29 5.4 9,286 14.51 14.21 14.81 41,208 5.09 5.03 5.13
NON GLIAL TUMOURS OF THE CENTRAL NERVOUS SYSTEM AND PINEAL GLAND
1,816 0.22 0.21 0.23 1,028 1.61 1.51 1.71 1,077 0.13 0.12 0.14
MALIGNANT MENINGIOMAS 1,225 0.15 0.14 0.16 769 1.20 1.12 1.29 826 0.10 0.09 0.11

35 GLIAL TUMOURS OF THE OF THE NERVES, AUTONOMIC NERVOUS SYSTEM AND PARAGANGLIA
82 0.01 0.01 0.01 60 0.09 0.07 0.12 18 0.00 0.00 0.00
NON-GLIAL TUMOURS OF THE OF THE NERVES, AUTONOMIC NERVOUS SYSTEM AND PARAGANGLIA
800 0.10 0.09 0.11 467 0.73 0.66 0.80 521 0.07 0.06 0.07
ACUTE MYELOYD LEUKAEMIA AND RELATED PRECURSOR NEOPLASMS
29,982 3.70 3.66 3.74 4,953 7.74 7.53 7.96 28,686 3.54 3.50 3.58
MYELOPROLIFERATIVE NEOPLASMS 24,859 3.07 3.03 3.1 11,189 17.48 17.16 17.81 23,771 2.94 2.90 2.96
MYELODISPLASTIC SYNDROME 12,082 1.49 1.46 1.52 2,521 3.94 3.79 4.10 9,447 1.17 1.14 1.19
MYELODISPLASTIC MYELOPROLIFERATIVE DISEASES
2,328 0.29 0.28 0.3 414 0.65 0.59 0.71 2,328 0.29 0.28 0.30
HISTIOCYTIC AND DENDRITIC CELL NEOPLASMS
394 0.05 0.04 0.05 311 0.49 0.43 0.54 204 0.03 0.02 0.03
FREQUENT EPITHELIAL TUMOURS OF THE HYPOPHARYNX AND LARYNX
51,000 6.29 6.23 6.34 19,578 30.59 30.16 31.02 30,666 3.78 3.75 3.81
EPITHELIAL TUMOURS OF THE OESOPHAGUS
60,723 7.49 7.43 7.55 7,109 11.11 10.85 11.37 57,804 7.13 7.07 7.19
EPITHELIAL TUMOURS OF THE STOMACH
151,346 18.66 18.57 18.76 26,764 41.82 41.32 42.32 128,769 15.88 15.80 15.96
EPITHELIAL TUMOURS OF THE COLON 346,910 42.78 42.64 42.92 133,758 208.99 207.88 210.12 214,957 26.51 26.42 26.59 EPITHELIAL TUMOURS OF THE RECTUM
138,806 17.12 17.03 17.21 60,099 93.90 93.15 94.66 95,392 11.77 11.70 11.83
EPITHELIAL TUMOURS OF THE PANCREAS
95,836 11.82 11.74 11.89 4,936 7.71 7.50 7.93 93,658 11.55 11.47 11.62
EPITHELIAL TUMOURS LIVER AND INTRAHEPATIC BILE TRACT IBT
50,933 6.28 6.23 6.34 3,493 5.46 5.28 5.64 50,560 6.23 6.18 6.29
EPITHELIAL TUMOURS OF THE LUNG 454,883 56.10 55.93 56.26 49,225 76.91 76.23 77.59 432,572 53.35 53.19 53.50 EPITHELIAL TUMOURS OF THE BREAST
519,188 64.03 63.85 64.20 339,598 530.61 528.83 532.40 247,603 30.54 30.45 30.62
EPITHELIAL TUMOURS OF THE CORPUS UTERI
84,500 10.42 10.35 10.49 59,973 93.71 92.96 94.46 28,647 3.53 3.51 3.56
EPITHELIAL TUMOURS OF THE CERVIX UTERI
49,259 6.07 6.02 6.13 37,713 58.93 58.33 59.52 20,984 2.59 2.56 2.61
EPITHELIAL TUMOURS OF THE OVARY AND FALLOPIAN TUBE
76,284 9.41 9.34 9.47 28,525 44.57 44.05 45.09 61,632 7.60 7.55 7.65
EPITHELIAL TUMOURS OF THE 388,741 47.94 47.79 48.09 185,701 290.15 288.84 291.48 321,397 39.64 39.51 39.76

36 PROSTATE EPITHELIAL TUMOURS OF THE KIDNEY
85,671 10.56 10.49 10.64 37,169 58.08 57.49 58.67 63,861 7.87 7.82 7.93
EPITHELIAL TUMOURS OF THE BLADDER
163,624 20.18 20.08 20.28 74,279 116.06 115.23 116.90 77,406 9.55 9.50 9.59
MALIGNANT SKIN MELANOMA 100,883 12.44 12.36 12.52 79,245 123.82 122.96 124.68 31,572 3.89 3.87 3.92 EPITHELIAL TUMOURS OF THE SKIN 397,503 49.02 48.87 49.17 257,623 402.53 400.98 404.09 NE NE NE NE LYMPHOID DISEASES 236,546 29.17 29.05 29.29 99,405 155.32 154.35 156.29 226,766 27.96 27.85 28.08

37
Table 7. One- and 5-year relative survival by tumour entities for the period 1995-99 (cohort survival analysis) and 2000-2002 (period survival analysis) Tumour entities Cohort (1995-99) Period (2000-2002)
years since diagn.
Number of
cases
Survival (%)
Lower 95%CI
Upper 95%CI
Survival (%)
Lower 95%CI
Upper 95%CI
EPITHELIAL TUMOURS OF THE NASAL CAVITY AND SINUSES 1 yr 2,391 74.30 72.36 76.13 74.76 71.76 77.49 EPITHELIAL TUMOURS OF THE NASAL CAVITY AND SINUSES 5 yr 2,391 47.91 45.46 50.32 49.00 45.40 52.50 R Squamous cell carcinoma and variants of the Nasal Cavity and Sinuses 1 yr 1,680 76.68 74.41 78.78 77.50 74.09 80.52 R Squamous cell carcinoma and variants of the Nasal Cavity and Sinuses 5 yr 1,680 48.99 46.06 51.86 50.70 46.44 54.79 R Lymphoepithelial carcinoma of the Nasal Cavity and Sinuses 1 yr 15 81.10 49.61 93.93 25.78 0.87 67.88 R Lymphoepithelial carcinoma of the Nasal Cavity and Sinuses 5 yr 15 28.81 8.69 53.05 4.53 0.06 27.61 R Undifferentiated carcinoma of the Nasal Cavity and Sinuses 1 yr 82 56.59 44.77 66.81 64.91 50.59 76.03 R Undifferentiated carcinoma of the Nasal Cavity and Sinuses 5 yr 82 32.53 21.50 44.03 38.93 23.48 54.11 R Intestinal type adenocarcinoma the Nasal Cavity and Sinuses 1 yr 16 96.42 31.08 99.89 77.34 9.79 97.20 R Intestinal type adenocarcinoma the Nasal Cavity and Sinuses 5 yr 16 50.09 20.63 73.88 23.48 3.43 53.67 EPITHELIAL TUMOURS OF THE NASOPHARYNX 1 yr 2,503 76.04 74.25 77.73 77.97 75.06 80.58 EPITHELIAL TUMOURS OF THE NASOPHARYNX 5 yr 2,503 49.16 46.94 51.33 49.85 46.39 53.21 R Squamous cell carcinoma and variants of the Nasopharynx 1 yr 1,844 77.46 75.40 79.38 79.11 75.89 81.95 R Squamous cell carcinoma and variants of the Nasopharynx 5 yr 1,844 49.14 46.57 51.67 50.21 46.28 54.01 R Papillary adenocarcinoma of the Nasopharynx 1 yr 5 80.43 19.61 97.13 100.55 _ _ R Papillary adenocarcinoma of the Nasopharynx 5 yr 5 58.76 9.36 88.75 NE NE NE
EPITHELIAL TUMOURS OF THE MAJOR SALIVARY GLANDS AND SALIVARY GLAND TYPE TUMORS 1 yr 7,087 83.39 82.41 84.32 84.02 82.54 85.37
EPITHELIAL TUMOURS OF THE MAJOR SALIVARY GLANDS AND SALIVARY GLAND TYPE TUMORS 5 yr 7,087 64.80 63.37 66.18 65.49 63.43 67.47
R Epithelial tumours of the major salivary glands 1 yr 3,934 83.76 82.44 85.00 85.43 83.53 87.13 R Epithelial tumours of the major salivary glands 5 yr 3,934 64.55 62.62 66.42 65.58 62.82 68.18 R Salivary gland type tumours of the Head and Neck 1 yr 2,398 87.22 85.67 88.62 86.92 84.43 89.04 R Salivary gland type tumours of the Head and Neck 5 yr 2,398 69.14 66.80 71.35 70.79 67.29 73.99 EPITHELIAL TUMOURS OF THE HYPOPHARYNX AND LARYNX 1 yr 35,582 80.02 79.57 80.46 79.97 79.25 80.68 EPITHELIAL TUMOURS OF THE HYPOPHARYNX AND LARYNX 5 yr 35,582 54.99 54.37 55.60 55.38 54.44 56.30 R Squamous cell carcinoma and variants of the Hypopharynx 1 yr 6,924 61.94 60.75 63.11 60.31 58.34 62.23 R Squamous cell carcinoma and variants of the Hypopharynx 5 yr 6,924 24.55 23.44 25.68 24.32 22.61 26.07
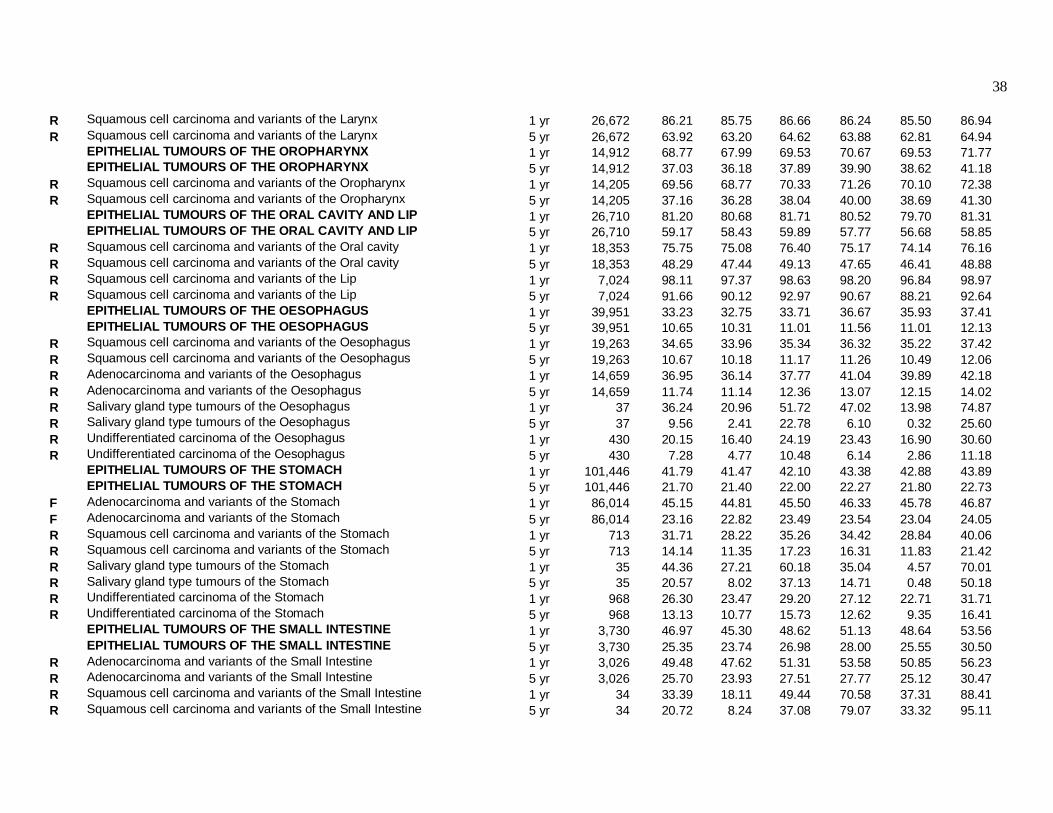
38 R Squamous cell carcinoma and variants of the Larynx 1 yr 26,672 86.21 85.75 86.66 86.24 85.50 86.94 R Squamous cell carcinoma and variants of the Larynx 5 yr 26,672 63.92 63.20 64.62 63.88 62.81 64.94 EPITHELIAL TUMOURS OF THE OROPHARYNX 1 yr 14,912 68.77 67.99 69.53 70.67 69.53 71.77 EPITHELIAL TUMOURS OF THE OROPHARYNX 5 yr 14,912 37.03 36.18 37.89 39.90 38.62 41.18 R Squamous cell carcinoma and variants of the Oropharynx 1 yr 14,205 69.56 68.77 70.33 71.26 70.10 72.38 R Squamous cell carcinoma and variants of the Oropharynx 5 yr 14,205 37.16 36.28 38.04 40.00 38.69 41.30 EPITHELIAL TUMOURS OF THE ORAL CAVITY AND LIP 1 yr 26,710 81.20 80.68 81.71 80.52 79.70 81.31 EPITHELIAL TUMOURS OF THE ORAL CAVITY AND LIP 5 yr 26,710 59.17 58.43 59.89 57.77 56.68 58.85 R Squamous cell carcinoma and variants of the Oral cavity 1 yr 18,353 75.75 75.08 76.40 75.17 74.14 76.16 R Squamous cell carcinoma and variants of the Oral cavity 5 yr 18,353 48.29 47.44 49.13 47.65 46.41 48.88 R Squamous cell carcinoma and variants of the Lip 1 yr 7,024 98.11 97.37 98.63 98.20 96.84 98.97 R Squamous cell carcinoma and variants of the Lip 5 yr 7,024 91.66 90.12 92.97 90.67 88.21 92.64 EPITHELIAL TUMOURS OF THE OESOPHAGUS 1 yr 39,951 33.23 32.75 33.71 36.67 35.93 37.41 EPITHELIAL TUMOURS OF THE OESOPHAGUS 5 yr 39,951 10.65 10.31 11.01 11.56 11.01 12.13 R Squamous cell carcinoma and variants of the Oesophagus 1 yr 19,263 34.65 33.96 35.34 36.32 35.22 37.42 R Squamous cell carcinoma and variants of the Oesophagus 5 yr 19,263 10.67 10.18 11.17 11.26 10.49 12.06 R Adenocarcinoma and variants of the Oesophagus 1 yr 14,659 36.95 36.14 37.77 41.04 39.89 42.18 R Adenocarcinoma and variants of the Oesophagus 5 yr 14,659 11.74 11.14 12.36 13.07 12.15 14.02 R Salivary gland type tumours of the Oesophagus 1 yr 37 36.24 20.96 51.72 47.02 13.98 74.87 R Salivary gland type tumours of the Oesophagus 5 yr 37 9.56 2.41 22.78 6.10 0.32 25.60 R Undifferentiated carcinoma of the Oesophagus 1 yr 430 20.15 16.40 24.19 23.43 16.90 30.60 R Undifferentiated carcinoma of the Oesophagus 5 yr 430 7.28 4.77 10.48 6.14 2.86 11.18 EPITHELIAL TUMOURS OF THE STOMACH 1 yr 101,446 41.79 41.47 42.10 43.38 42.88 43.89 EPITHELIAL TUMOURS OF THE STOMACH 5 yr 101,446 21.70 21.40 22.00 22.27 21.80 22.73 F Adenocarcinoma and variants of the Stomach 1 yr 86,014 45.15 44.81 45.50 46.33 45.78 46.87 F Adenocarcinoma and variants of the Stomach 5 yr 86,014 23.16 22.82 23.49 23.54 23.04 24.05 R Squamous cell carcinoma and variants of the Stomach 1 yr 713 31.71 28.22 35.26 34.42 28.84 40.06 R Squamous cell carcinoma and variants of the Stomach 5 yr 713 14.14 11.35 17.23 16.31 11.83 21.42 R Salivary gland type tumours of the Stomach 1 yr 35 44.36 27.21 60.18 35.04 4.57 70.01 R Salivary gland type tumours of the Stomach 5 yr 35 20.57 8.02 37.13 14.71 0.48 50.18 R Undifferentiated carcinoma of the Stomach 1 yr 968 26.30 23.47 29.20 27.12 22.71 31.71 R Undifferentiated carcinoma of the Stomach 5 yr 968 13.13 10.77 15.73 12.62 9.35 16.41 EPITHELIAL TUMOURS OF THE SMALL INTESTINE 1 yr 3,730 46.97 45.30 48.62 51.13 48.64 53.56 EPITHELIAL TUMOURS OF THE SMALL INTESTINE 5 yr 3,730 25.35 23.74 26.98 28.00 25.55 30.50 R Adenocarcinoma and variants of the Small Intestine 1 yr 3,026 49.48 47.62 51.31 53.58 50.85 56.23 R Adenocarcinoma and variants of the Small Intestine 5 yr 3,026 25.70 23.93 27.51 27.77 25.12 30.47 R Squamous cell carcinoma and variants of the Small Intestine 1 yr 34 33.39 18.11 49.44 70.58 37.31 88.41 R Squamous cell carcinoma and variants of the Small Intestine 5 yr 34 20.72 8.24 37.08 79.07 33.32 95.11

39 EPITHELIAL TUMOURS OF THE COLON 1 yr 228,575 72.77 72.57 72.96 74.62 74.33 74.90 EPITHELIAL TUMOURS OF THE COLON 5 yr 228,575 53.23 52.97 53.49 55.27 54.88 55.66 F Adenocarcinoma and variants of the Colon 1 yr 203,768 77.51 77.31 77.70 78.65 78.36 78.93 F Adenocarcinoma and variants of the Colon 5 yr 203,768 56.38 56.10 56.65 57.96 57.56 58.36 R Squamous cell carcinoma and variants of the Colon 1 yr 119 43.95 34.55 52.94 54.46 37.92 68.33 R Squamous cell carcinoma and variants of the Colon 5 yr 119 31.73 22.03 41.85 41.44 23.50 58.52 EPITHELIAL TUMOURS OF THE RECTUM 1 yr 92,063 77.14 76.84 77.44 79.06 78.63 79.49 EPITHELIAL TUMOURS OF THE RECTUM 5 yr 92,063 52.59 52.18 53.00 54.83 54.23 55.42 F Adenocarcinoma and variants of the Rectum 1 yr 84,604 79.85 79.55 80.15 81.29 80.86 81.72 F Adenocarcinoma and variants of the Rectum 5 yr 84,604 54.37 53.94 54.79 56.36 55.74 56.97 R Squamous cell carcinoma and variants of the Rectum 1 yr 411 71.16 66.21 75.52 77.04 69.83 82.74 R Squamous cell carcinoma and variants of the Rectum 5 yr 411 50.18 44.20 55.87 53.24 44.35 61.34 R Basaloid carcinoma of the Rectum 1 yr 88 74.17 62.87 82.50 64.58 43.25 79.61 R Basaloid carcinoma of the Rectum 5 yr 88 51.08 37.80 62.88 50.73 29.42 68.63 EPITHELIAL TUMOURS OF THE ANAL CANAL 1 yr 5,993 80.53 79.40 81.60 81.61 79.92 83.18 EPITHELIAL TUMOURS OF THE ANAL CANAL 5 yr 5,993 55.53 53.94 57.08 57.99 55.65 60.24 R Squamous cell carcinoma and variants of the Anal Canal 1 yr 3,357 85.16 83.77 86.43 85.38 83.36 87.18 R Squamous cell carcinoma and variants of the Anal Canal 5 yr 3,357 61.45 59.38 63.45 63.54 60.56 66.36 R Adenocarcinoma and variants of the Anal Canal 1 yr 1,425 75.82 73.27 78.17 77.70 73.71 81.16 R Adenocarcinoma and variants of the Anal Canal 5 yr 1,425 42.41 39.18 45.60 46.09 41.12 50.91 R Basaloid carcinoma of the Anal Canal 1 yr 686 86.48 83.32 89.08 85.64 80.32 89.61 R Basaloid carcinoma of the Anal Canal 5 yr 686 61.09 56.35 65.47 59.35 52.40 65.63 R Paget disease of the Anal Canal 1 yr 23 67.91 43.31 83.62 106.04 _ _ R Paget disease of the Anal Canal 5 yr 23 59.88 30.76 80.00 104.37 _ _ EPITHELIAL TUMOURS OF THE PANCREAS 1 yr 57,468 16.45 16.14 16.76 17.64 17.17 18.11 EPITHELIAL TUMOURS OF THE PANCREAS 5 yr 57,468 3.76 3.58 3.94 3.79 3.54 4.05 F Adenocarcinoma and variants of the Pancreas 1 yr 38,658 17.29 16.91 17.68 19.76 19.16 20.36 F Adenocarcinoma and variants of the Pancreas 5 yr 38,658 3.39 3.19 3.60 3.76 3.46 4.08 R Squamous cell carcinoma and variants of the Pancreas 1 yr 130 18.04 11.85 25.27 9.24 3.80 17.65 R Squamous cell carcinoma and variants of the Pancreas 5 yr 130 9.63 4.91 16.26 6.20 1.89 14.25 R Acinar cell carcinoma of the Pancreas 1 yr 112 36.73 27.70 45.77 24.33 13.48 36.89 R Acinar cell carcinoma of the Pancreas 5 yr 112 21.35 13.60 30.27 19.85 9.68 32.63 R Mucinous cystadenocarcinoma of the Pancreas 1 yr 36 68.12 49.63 81.03 56.24 33.76 73.71 R Mucinous cystadenocarcinoma of the Pancreas 5 yr 36 36.53 19.89 53.37 28.84 11.77 48.55 R Intraductal papillary mucinous carcinoma invasive of the Pancreas 1 yr 0 NE NE NE 103.47 _ _ R Intraductal papillary mucinous carcinoma invasive of the Pancreas 5 yr 0 NE NE NE NE NE NE R Solid pseudopapillary carcinoma of the Pancreas 1 yr 3 101.08 _ _ 100.86 _ _ R Solid pseudopapillary carcinoma of the Pancreas 5 yr 3 70.68 3.07 96.60 NE NE NE

40 R Serous cystadenocarcinoma of the Pancreas 1 yr 1 100.42 _ _ NE NE NE R Serous cystadenocarcinoma of the Pancreas 5 yr 1 102.22 _ _ NE NE NE R Carcinoma with osteoclast-like giant cells of the Pancreas 1 yr 0 NE NE NE NE NE NE R Carcinoma with osteoclast-like giant cells of the Pancreas 5 yr 0 NE NE NE NE NE NE EPITHELIAL TUMOURS LIVER AND INTRAHEPATIC BILE TRACT (IBT) 1 yr 31,083 30.30 29.78 30.83 32.34 31.55 33.13 EPITHELIAL TUMOURS LIVER AND INTRAHEPATIC BILE TRACT (IBT) 5 yr 31,083 8.81 8.45 9.18 9.86 9.32 10.42 R Hepatocellular carcinoma of the Liver and IBT 1 yr 16,329 36.99 36.23 37.75 39.30 38.14 40.46 R Hepatocellular carcinoma of the Liver and IBT 5 yr 16,329 11.72 11.16 12.28 13.35 12.50 14.22 R Cholangiocarcinoma of the IBT 1 yr 4,006 22.49 21.18 23.84 22.51 20.69 24.37 R Cholangiocarcinoma of the IBT 5 yr 4,006 5.52 4.74 6.38 5.53 4.46 6.75 R Adenocarcinoma and variants of the Liver and IBT 1 yr 1,039 22.29 19.75 24.92 23.65 20.10 27.38 R Adenocarcinoma and variants of the Liver and IBT 5 yr 1,039 5.37 3.97 7.06 4.59 2.98 6.71 R Undifferentiated carcinoma of the Liver and IBT 1 yr 67 10.81 4.74 19.72 3.06 0.23 13.49 R Undifferentiated carcinoma of the Liver and IBT 5 yr 67 3.62 0.67 11.07 NE NE NE R Squamous cell carcinoma and variants of the Liver and IBT 1 yr 52 24.03 13.27 36.54 27.45 13.62 43.26 R Squamous cell carcinoma and variants of the Liver and IBT 5 yr 52 9.56 3.00 20.77 NE NE NE R Bile duct cystadenocarcinoma of the IBT 1 yr 9 45.05 13.63 72.68 75.83 11.78 96.49 R Bile duct cystadenocarcinoma of the IBT 5 yr 9 12.13 0.63 41.55 NE NE NE
EPITHELIAL TUMOURS GALLBLADDER AND EXTRAHEPATIC BILIARY DUCT (EBT) 1 yr 22,905 31.07 30.45 31.69 32.36 31.39 33.34
EPITHELIAL TUMOURS GALLBLADDER AND EXTRAHEPATIC BILIARY DUCT (EBT) 5 yr 22,905 12.65 12.15 13.16 13.04 12.29 13.81
R Adenocarinoma and variants of the Gallbladder and EBT 1 yr 14,328 37.49 36.68 38.31 39.43 38.17 40.69 R Adenocarcinoma and variants of the Gallbladder and EBT 5 yr 14,328 15.11 14.44 15.79 15.92 14.93 16.95
R Combined hepatocellular carcinoma and cholangiocarcinoma of the Gallbladder and EBT 1 yr 3 34.40 0.84 78.80 0.00 _ _
R Combined hepatocellular carcinoma and cholangiocarcinoma of the Gallbladder and EBT 5 yr 3 39.18 0.57 84.38 NE NE NE
R Squamous cell carcinoma of the Gallbladder and EBT 1 yr 198 17.68 12.62 23.46 15.46 8.40 24.48 R Squamous cell carcinoma of the Gallbladder and EBT 5 yr 198 12.20 7.61 17.93 9.61 4.24 17.63 EPITHELIAL TUMOURS OF THE TRACHEA 1 yr 742 32.25 28.83 35.71 38.10 32.36 43.81 EPITHELIAL TUMOURS OF THE TRACHEA 5 yr 742 12.16 9.68 14.94 14.16 9.98 19.05 R Squamous cell carcinoma and variants of the Trachea 1 yr 473 29.59 25.45 33.84 33.35 26.19 40.66 R Squamous cell carcinoma and variants of the Trachea 5 yr 473 8.49 5.95 11.57 9.47 5.25 15.18 R Adenocarcinoma and variants of the Trachea 1 yr 76 33.74 23.22 44.55 36.29 19.81 53.02 R Adenocarcinoma and variants of the Trachea 5 yr 76 7.56 2.77 15.57 5.89 1.15 16.57 R Salivary gland type tumours of the Trachea 1 yr 53 84.23 70.55 91.90 97.02 66.83 99.77 R Salivary gland type tumours of the Trachea 5 yr 53 56.18 40.21 69.42 57.93 32.16 76.90 EPITHELIAL TUMOURS OF THE LUNG 1 yr 290,236 32.56 32.39 32.74 33.98 33.72 34.25

41 EPITHELIAL TUMOURS OF THE LUNG 5 yr 290,236 10.60 10.47 10.72 10.99 10.80 11.17 F Squamous cell carcinoma and variants of the Lung 1 yr 76,491 40.17 39.81 40.53 41.68 41.10 42.26 F Squamous cell carcinoma and variants of the Lung 5 yr 76,491 13.43 13.16 13.71 13.62 13.21 14.04 F Adenocarcinoma and variants of the Lung 1 yr 53,989 39.44 39.02 39.86 41.71 41.10 42.31 F Adenocarcinoma and variants of the Lung 5 yr 53,989 13.91 13.59 14.24 14.64 14.18 15.10 R Large cell carcinoma of the Lung 1 yr 22,798 35.20 34.56 35.83 36.84 35.82 37.86 R Large cell carcinoma of the Lung 5 yr 22,798 12.35 11.87 12.83 13.24 12.51 13.99 R Well differentiated endocrine carcinoma of the lung 1 yr 3,208 74.10 72.49 75.64 69.64 67.36 71.79 R Well differentiated endocrine carcinoma of the lung 5 yr 3,208 58.86 56.90 60.76 55.30 52.67 57.85 F Poorly differentiated endocrine carcinoma of the Lung 1 yr 41,616 28.13 27.69 28.57 28.86 28.19 29.52 F Poorly differentiated endocrine carcinoma of the Lung 5 yr 41,616 4.56 4.34 4.78 4.87 4.55 5.21 R Bronchiolo-alveolar carcinoma of the Lung 1 yr 3,639 57.84 56.16 59.48 62.97 60.49 65.34 R Bronchiolo-alveolar carcinoma of the Lung 5 yr 3,639 31.31 29.60 33.03 34.38 31.87 36.91 R Salivary gland type tumours of the Lung 1 yr 240 62.20 55.54 68.15 65.56 55.53 73.86 R Salivary gland type tumours of the Lung 5 yr 240 43.17 36.09 50.03 39.80 29.45 49.94 R Sarcomatoid carcinoma of the Lung 1 yr 735 33.81 30.33 37.32 37.17 31.94 42.40 R Sarcomatoid carcinoma of the Lung 5 yr 735 15.90 13.09 18.96 17.96 13.46 23.00 R Undifferentiated carcinoma of the Lung 1 yr 5,388 26.60 25.40 27.81 28.57 26.74 30.43 R Undifferentiated carcinoma of the Lung 5 yr 5,388 6.65 5.94 7.41 7.99 6.85 9.23 EPITHELIAL TUMOURS OF THE THYMUS 1 yr 903 79.47 76.56 82.06 84.36 80.20 87.72 EPITHELIAL TUMOURS OF THE THYMUS 5 yr 903 57.40 53.68 60.94 64.56 59.05 69.53 R Malignant tymoma 1 yr 750 82.34 79.28 84.99 87.23 82.88 90.53 R Malignant tymoma 5 yr 750 60.60 56.53 64.42 68.36 62.40 73.58 R Squamous cell carcinoma of the Thymus 1 yr 25 69.48 46.67 84.03 71.86 32.36 90.77 R Squamous cell carcinoma of the Thymus 5 yr 25 44.63 23.16 64.08 57.78 19.38 83.25 R Undifferentiated carcinoma of the Thymus 1 yr 12 59.27 27.12 81.09 43.79 9.76 74.59 R Undifferentiated carcinoma of the Thymus 5 yr 12 18.21 2.79 44.47 NE NE NE R Lymphoepithelial carcinoma of the Thymus 1 yr 3 100.25 _ _ 67.21 5.09 94.84 R Lymphoepithelial carcinoma of the Thymus 5 yr 3 67.64 4.85 95.07 NE NE NE R Adenocarcinoma and variants of the Thymus 1 yr 11 62.51 27.53 84.27 61.76 11.91 89.66 R Adenocarcinoma and variants of the Thymus 5 yr 11 32.75 7.66 61.56 NE NE NE EPITHELIAL TUMOURS OF THE BREAST 1 yr 343,750 94.41 94.32 94.50 95.67 95.54 95.79 EPITHELIAL TUMOURS OF THE BREAST 5 yr 343,750 80.63 80.46 80.80 82.62 82.38 82.87 F Invasive ductal carcinoma of the Breast 1 yr 216,514 97.48 97.39 97.56 97.60 97.47 97.71 F Invasive ductal carcinoma of the Breast 5 yr 216,514 83.55 83.34 83.75 84.48 84.20 84.76 F Invasive lobular carcinoma of the Breast 1 yr 38,072 97.62 97.41 97.82 97.54 97.23 97.82 F Invasive lobular carcinoma of the Breast 5 yr 38,072 86.01 85.53 86.48 86.19 85.51 86.84 R Mammary Paget’s disease of the Breast 1 yr 2,880 97.64 96.66 98.34 98.03 96.23 98.97

42 R Mammary Paget’s disease of the Breast 5 yr 2,880 83.04 80.98 84.90 83.87 80.65 86.60 R Special types of adenocarcinoma of the Breast 1 yr 19,573 98.86 98.57 99.09 99.28 98.81 99.56 R Special types of adenocarcinoma of the Breast 5 yr 19,573 95.36 94.74 95.91 95.91 95.00 96.66 R Metaplastic carcinoma of the Breast 1 yr 304 86.73 81.89 90.35 88.39 82.34 92.46 R Metaplastic carcinoma of the Breast 5 yr 304 66.15 59.19 72.21 66.53 57.14 74.32 R Salivary gland type tumours of the Breast 1 yr 314 97.28 93.62 98.85 101.35 _ _ R Salivary gland type tumours of the Breast 5 yr 314 85.36 79.24 89.80 89.23 77.86 94.95 R Epithelial tumours of the Male Breast 1 yr 2,537 91.38 89.91 92.65 91.50 89.23 93.31 R Epithelial tumours of the Male Breast 5 yr 2,537 77.45 74.86 79.82 74.29 70.51 77.67 EPITHELIAL TUMOURS OF THE CORPUS UTERI 1 yr 54,701 90.69 90.41 90.96 91.83 91.44 92.20 EPITHELIAL TUMOURS OF THE CORPUS UTERI 5 yr 54,701 79.45 79.00 79.89 80.82 80.18 81.44 F Adenocarcinoma and variants of the Corpus Uteri 1 yr 50,703 92.85 92.58 93.10 93.71 93.35 94.05 F Adenocarcinoma and variants of the Corpus Uteri 5 yr 50,703 81.31 80.86 81.76 82.46 81.82 83.08 R Squamous cell carcinoma and variants of the Corpus Uteri 1 yr 652 67.55 63.65 71.13 71.01 64.68 76.42 R Squamous cell carcinoma and variants of the Corpus Uteri 5 yr 652 53.35 48.79 57.70 54.84 47.75 61.37 R Adenoid cystic carcinoma of the Corpus Uteri 1 yr 10 70.77 32.69 89.86 101.71 _ _ R Adenoid cystic carcinoma of the Corpus Uteri 5 yr 10 74.52 31.08 92.87 NE NE NE R Transitional cell carcinoma of the Corpus Uteri 1 yr 0 NE NE NE 102.63 _ _ R Transitional cell carcinoma of the Corpus Uteri 5 yr 0 NE NE NE NE NE NE EPITHELIALTUMOURS OF THE CERVIX UTERI 1 yr 33,735 85.56 85.16 85.95 86.11 85.49 86.70 EPITHELIAL TUMOURS OF THE CERVIX UTERI 5 yr 33,735 66.62 66.05 67.18 67.83 66.98 68.66 R Squamous cell carcinoma and variants of the Cervix Uteri 1 yr 24,150 87.16 86.71 87.60 87.45 86.74 88.12 R Squamous cell carcinoma and variants of the Cervix Uteri 5 yr 24,150 67.31 66.65 67.97 68.06 67.06 69.04 R Adenocarcinoma and variants of the Cervix Uteri 1 yr 5,638 86.19 85.21 87.10 86.65 85.14 88.01 R Adenocarcinoma and variants of the Cervix Uteri 5 yr 5,638 66.72 65.33 68.07 67.57 65.46 69.58 R Undifferentiated carcinoma of the Cervix Uteri 1 yr 131 58.49 49.28 66.61 55.51 42.55 66.67 R Undifferentiated carcinoma of the Cervix Uteri 5 yr 131 34.14 25.31 43.13 36.92 24.01 49.86 R MIXED EPITHELIAL AND MESENCHYMAL TUMOURS OF THE UTERUS 1 yr 2,272 64.48 62.38 66.49 65.87 63.02 68.55 R MIXED EPITHELIAL AND MESENCHYMAL TUMOURSOF THE UTERUS 5 yr 2,272 37.43 35.14 39.72 38.78 35.56 41.98 EPITHELIAL TUMOURS OF THE OVARY AND FALLOPIAN TUBE 1 yr 49,780 68.14 67.71 68.56 69.26 68.61 69.90 EPITHELIAL TUMOURS OF THE OVARY AND FALLOPIAN TUBE 5 yr 49,780 37.71 37.24 38.19 38.89 38.18 39.60 R Adenocarcinoma and variants of the Ovary 1 yr 32,579 73.43 72.93 73.92 75.14 74.39 75.87 R Adenocarcinoma and variants of the Ovary 5 yr 32,579 36.98 36.40 37.56 38.85 37.99 39.71 R Mucinous adenocarcinoma of the Ovary 1 yr 4,861 75.16 73.87 76.39 75.50 73.35 77.51 R Mucinous adenocarcinoma of the Ovary 5 yr 4,861 57.97 56.38 59.52 57.25 54.75 59.67 R Clear cell adenocarcinoma of the Ovary 1 yr 1,691 79.39 77.31 81.29 81.14 78.23 83.69 R Clear cell adenocarcinoma of the Ovary 5 yr 1,691 53.91 51.27 56.46 55.12 51.41 58.67 R Adenocarcinoma and variants of the Fallopian tube 1 yr 1,424 79.35 77.04 81.45 83.07 79.87 85.80

43 R Adenocarcinoma and variants of the Fallopian tube 5 yr 1,424 47.81 44.85 50.71 48.02 43.90 52.02 NON EPITHELIAL TUMOURS OF THE OVARY 1 yr 2,385 75.83 74.01 77.55 78.17 75.41 80.66 NON EPITHELIAL TUMOURS OF THE OVARY 5 yr 2,385 62.47 60.27 64.59 61.11 57.84 64.20 R Mixed epithelial mesenchymal tumours of the Ovary 1 yr 808 46.23 42.68 49.70 55.81 50.77 60.54 R Mixed epithelial mesenchymal tumours of the Ovary 5 yr 808 18.17 15.35 21.18 18.57 14.65 22.88 R Sex cord tumours of the Ovary 1 yr 759 91.32 88.87 93.25 94.16 90.24 96.54 R Sex cord tumours of the Ovary 5 yr 759 82.66 79.02 85.73 84.18 78.65 88.39 R Malignant Immature Teratomas of the Ovary 1 yr 392 89.04 85.40 91.82 90.52 84.19 94.40 R Malignant Immature Teratomas of the Ovary 5 yr 392 83.21 78.65 86.87 83.41 75.75 88.82 R Germ cell tumours of the Ovary 1 yr 426 91.46 88.34 93.78 94.66 89.90 97.21 R Germ cell tumours of the Ovary 5 yr 426 84.49 80.55 87.70 90.08 84.43 93.76 EPITHELIAL TUMOURS OF THE VULVA & VAGINA 1 yr 10,293 78.89 78.00 79.75 79.71 78.37 80.99 EPITHELIAL TUMOURS OF THE VULVA & VAGINA 5 yr 10,293 60.91 59.63 62.16 61.60 59.72 63.41 R Squamous cell carcinoma and variants of the Vulva and Vagina 1 yr 8,162 79.59 78.60 80.54 80.41 78.94 81.80 R Squamous cell carcinoma and variants of the Vulva and Vagina 5 yr 8,162 59.62 58.19 61.01 60.02 57.95 62.03 R Adenocarcinoma and variants of the Vulva and Vagina 1 yr 431 70.72 65.87 75.00 80.22 73.27 85.54 R Adenocarcinoma and variants of the Vulva and Vagina 5 yr 431 42.91 37.31 48.39 55.59 46.63 63.65 R Paget disease of the Vulva and Vagina 1 yr 282 97.99 91.65 99.53 99.30 12.80 100.00 R Paget disease of the Vulva and Vagina 5 yr 282 98.02 63.10 99.91 93.51 74.55 98.48 R Undifferentiated carcinoma of the Vulva and Vagina 1 yr 45 48.18 32.63 62.13 46.13 22.13 67.25 R Undifferentiated carcinoma of the Vulva and Vagina 5 yr 45 31.49 16.97 47.10 33.48 12.97 55.65 TROPHOBLASTIC TUMOURS OF THE PLACENTA 1 yr 135 94.13 88.50 97.05 91.80 79.47 96.86 TROPHOBLASTIC TUMOURS OF THE PLACENTA 5 yr 135 90.00 83.34 94.09 87.20 74.47 93.84 R Choriocarcinoma of the Placenta 1 yr 135 94.13 88.50 97.05 91.80 79.47 96.86 R Choriocarcinoma of the Placenta 5 yr 135 90.00 83.34 94.09 87.20 74.47 93.84 EPITHELIAL TUMOURS OF THE PROSTATE 1 yr 235,753 91.14 90.99 91.29 94.36 94.19 94.53 EPITHELIAL TUMOURS OF THE PROSTATE 5 yr 235,753 74.44 74.15 74.72 79.70 79.32 80.08 F Adenocarcinoma and variants of the Prostate 1 yr 199,562 95.08 94.94 95.22 96.88 96.72 97.04 F Adenocarcinoma and variants of the Prostate 5 yr 199,562 78.90 78.60 79.19 82.92 82.53 83.31 R Squamous cell carcinoma and variants of the Prostate 1 yr 583 74.68 70.51 78.35 87.29 82.26 90.96 R Squamous cell carcinoma and variants of the Prostate 5 yr 583 45.09 39.77 50.25 56.70 48.40 64.16 R Infiltrating duct carcinoma of the Prostate 1 yr 2,033 95.46 93.94 96.61 98.31 96.71 99.13 R Infiltrating duct carcinoma of the Prostate 5 yr 2,033 77.08 74.00 79.85 85.35 81.57 88.42 R Transitional cell carcinoma of the Prostate 1 yr 369 72.19 66.67 76.97 78.85 69.54 85.61 R Transitional cell carcinoma of the Prostate 5 yr 369 48.47 41.17 55.38 59.46 45.49 70.95 R Salivary gland type tumours of the Prostate 1 yr 11 77.27 35.02 93.86 54.89 0.24 94.22 R Salivary gland type tumours of the Prostate 5 yr 11 49.98 11.75 79.88 49.24 0.11 92.86 TUMOURS OF THE TESTIS AND PARATESTIS 1 yr 16,594 97.35 97.07 97.60 97.92 97.55 98.23

44 TUMOURS OF THE TESTIS AND PARATESTIS 5 yr 16,594 94.87 94.46 95.26 95.98 95.42 96.47 R Adenocarcinoma and variants of the Paratestis 1 yr 6 69.19 18.06 92.38 76.59 10.81 96.85 R Adenocarcinoma and variants of the Paratestis 5 yr 6 81.38 4.03 98.69 88.96 0.00 99.91 R Malignant Immature Teratomas of the Testis 1 yr 4,421 96.94 96.37 97.42 97.72 96.95 98.29 R Malignant Immature Teratomas of the Testis 5 yr 4,421 93.76 92.94 94.49 94.97 93.84 95.91 R Germ cell tumours Seminomatous of the Testis 1 yr 9,090 98.92 98.64 99.14 99.23 98.85 99.48 R Germ cell tumours Seminomatous of the Testis 5 yr 9,090 97.45 96.96 97.86 98.40 97.73 98.87 R Germ cell tumours non Seminomatous of the Testis 1 yr 1,942 96.78 95.87 97.50 96.79 95.37 97.78 R Germ cell tumours non Seminomatous of the Testis 5 yr 1,942 93.57 92.28 94.66 93.22 91.27 94.74 R Trophoblastic tumours of the Testis 1 yr 102 83.46 74.66 89.42 85.67 68.69 93.83 R Trophoblastic tumours of the Testis 5 yr 102 68.20 58.07 76.38 68.15 51.16 80.30 R Sex Cord tumours of the Testis 1 yr 98 95.35 87.14 98.36 95.65 85.95 98.70 R Sex Cord tumours of the Testis 5 yr 98 83.88 71.76 91.11 83.37 66.06 92.33 EPITHELIAL TUMOURS OF THE PENIS 1 yr 3,315 86.27 84.85 87.57 85.55 83.36 87.48 EPITHELIAL TUMOURS OF THE PENIS 5 yr 3,315 71.93 69.71 74.02 68.96 65.67 72.00 R Squamous cell carcinoma and variants of the Penis 1 yr 3,071 87.63 86.19 88.93 86.79 84.57 88.71 R Squamous cell carcinoma and variants of the Penis 5 yr 3,071 73.07 70.78 75.21 70.39 67.00 73.51 R Adenocarcinoma and variants of the Penis 1 yr 27 79.40 54.50 91.60 77.97 37.31 93.92 R Adenocarcinoma and variants of the Penis 5 yr 27 51.86 23.60 74.18 44.26 13.49 71.77 EPITHELIAL TUMOURS OF THE KIDNEY 1 yr 53,678 71.59 71.18 71.99 73.12 72.53 73.69 EPITHELIAL TUMOURS OF THE KIDNEY 5 yr 53,678 56.80 56.28 57.30 58.21 57.48 58.94 F Renal cell carcinoma and variants 1 yr 43,488 79.47 79.06 79.87 80.53 79.95 81.10 F Renal cell carcinoma and variants 5 yr 43,488 63.77 63.22 64.32 64.96 64.18 65.73 R Squamous cell carcinoma spindle cell type of the Kidney 1 yr 31 20.07 8.11 35.82 24.42 8.84 44.07 R Squamous cell carcinoma spindle cell type of the Kidney 5 yr 31 7.88 1.35 22.33 22.45 6.40 44.39 R Squamous cell carcinoma and variants of the Kidney 1 yr 186 26.72 20.44 33.38 34.34 23.98 44.93 R Squamous cell carcinoma and variants of the Kidney 5 yr 186 12.39 7.72 18.21 15.11 7.49 25.21 EPITHELIAL TUMOURS OF THE PELVIS, URETHER AND URETHRA 1 yr 8,308 75.23 74.21 76.21 74.57 73.10 75.97 EPITHELIAL TUMOURS OF THE PELVIS, URETHER AND URETHRA 5 yr 8,308 53.49 52.14 54.83 51.56 49.69 53.40 R Transitional cell carcinoma of the Pelvis, Ureter Urethra 1 yr 7,216 77.79 76.73 78.81 76.68 75.15 78.13 R Transitional cell carcinoma of the Pelvis, Ureter Urethra 5 yr 7,216 55.98 54.52 57.40 53.57 51.57 55.52 R Squamous cell carcinoma and variants of the Pelvis, Ureter Urethra 1 yr 290 54.54 48.36 60.30 57.63 47.32 66.63 R Squamous cell carcinoma and variants of the Pelvis, Ureter Urethra 5 yr 290 32.89 26.59 39.31 38.98 28.29 49.52 R Adenocarcinoma and variants of the Pelvis, Ureter Urethra 1 yr 182 77.28 69.92 83.05 78.93 69.44 85.77 R Adenocarcinoma and variants of the Pelvis, Ureter Urethra 5 yr 182 47.91 38.94 56.33 43.25 31.32 54.60 R Salivary gland type tumours of the Pelvis, Ureter Urethra 1 yr 1 108.81 _ _ 101.84 _ _ R Salivary gland type tumours of the Pelvis, Ureter Urethra 5 yr 1 0.00 _ _ NE NE NE EPITHELIAL TUMOURS OF THE BLADDER 1 yr 112,695 81.26 81.00 81.51 79.48 79.06 79.90

45 EPITHELIAL TUMOURS OF THE BLADDER 5 yr 112,695 65.59 65.20 65.97 62.98 62.40 63.56 F Transitional cell carcinoma of the Bladder 1 yr 98,665 84.72 84.46 84.98 82.88 82.45 83.29 F Transitional cell carcinoma of the Bladder 5 yr 98,665 68.47 68.06 68.88 65.68 65.06 66.28 R Squamous cell carcinoma and variants of the Bladder 1 yr 2,373 48.03 45.90 50.13 42.29 38.97 45.56 R Squamous cell carcinoma and variants of the Bladder 5 yr 2,373 33.50 31.17 35.85 27.01 23.77 30.34 R Adenocarcinoma and variants of the Bladder 1 yr 1,583 67.47 64.94 69.86 67.58 63.65 71.19 R Adenocarcinoma and variants of the Bladder 5 yr 1,583 40.30 37.36 43.22 42.03 37.64 46.35 R Salivary gland type tumours of the Bladder 1 yr 8 79.02 27.59 95.79 106.59 _ _ R Salivary gland type tumours of the Bladder 5 yr 8 66.26 10.90 92.64 NE NE NE EPITHELIAL TUMOURS OF THE EYE AND ADNEXA 1 yr 835 90.37 87.70 92.49 91.09 86.88 94.00 EPITHELIAL TUMOURS OF THE EYE AND ADNEXA 5 yr 835 79.96 75.61 83.62 80.74 74.01 85.89 R Squamous cell carcinoma and variants of the Eye Adnexa 1 yr 217 94.31 87.98 97.35 94.64 79.80 98.67 R Squamous cell carcinoma and variants of the Eye Adnexa 5 yr 217 80.72 70.28 87.80 86.03 64.40 94.98 R Adenocarcinoma and variants of the Eye Adnexa 1 yr 60 87.54 74.40 94.19 95.51 63.80 99.53 R Adenocarcinoma and variants of the Eye Adnexa 5 yr 60 63.60 46.63 76.45 66.74 36.66 84.96 EPITHELIAL TUMOURS OF THE MIDDLE EAR 1 yr 170 60.83 52.69 68.01 71.04 57.27 81.09 EPITHELIAL TUMOURS OF THE MIDDLE EAR 5 yr 170 42.37 33.56 50.90 43.01 29.98 55.37 R Squamous cell carcinoma and variants of the Middle Ear 1 yr 126 55.26 45.75 63.76 69.20 53.31 80.62 R Squamous cell carcinoma and variants of the Middle Ear 5 yr 126 32.22 23.03 41.74 33.53 20.30 47.29 R Adenocarcinoma and variants of the Middle Ear 1 yr 20 97.12 36.85 99.91 90.00 38.91 98.83 R Adenocarcinoma and variants of the Middle Ear 5 yr 20 90.19 38.04 98.90 91.50 9.29 99.67 MALIGNANT MESOTHELIOMA 1 yr 9,707 34.77 33.80 35.75 36.75 35.36 38.14 MALIGNANT MESOTHELIOMA 5 yr 9,707 5.49 5.00 6.02 5.36 4.69 6.09 R Mesothelioma of the pleura and pericardium 1 yr 8,201 36.05 34.98 37.12 37.50 36.00 39.01 R Mesothelioma of the pleura and pericardium 5 yr 8,201 4.89 4.39 5.44 4.64 3.98 5.37 R Mesothelioma of the peritoneum tunica vaginalis 1 yr 634 30.66 27.04 34.35 29.32 24.42 34.39 R Mesothelioma of the peritoneum tunica vaginalis 5 yr 634 11.30 8.76 14.21 10.21 7.15 13.90 F MALIGNANT SKIN MELANOMA 1 yr 64,137 95.45 95.24 95.64 95.97 95.69 96.23 F MALIGNANT SKIN MELANOMA 5 yr 64,137 84.37 83.98 84.76 85.08 84.53 85.61 R MALIGNANT MELANOMA OF THE MUCOSA 1 yr 2,621 59.93 57.94 61.87 59.18 56.39 61.85 R MALIGNANT MELANOMA OF THE MUCOSA 5 yr 2,621 29.52 27.52 31.55 29.40 26.69 32.15 R MALIGNANT MELANOMA OF THE UVEA 1 yr 3,696 95.09 94.13 95.89 94.82 93.14 96.10 R MALIGNANT MELANOMA OF THE UVEA 5 yr 3,696 72.52 70.62 74.31 69.22 66.34 71.91 EPITHELIAL TUMOURS OF THE SKIN 1 yr 235,530 99.82 99.69 99.89 100.05 _ _ EPITHELIAL TUMOURS OF THE SKIN 5 yr 235,530 97.71 97.46 97.94 97.60 97.24 97.91 F Basal cell carcinoma of the Skin 1 yr 154,567 100.72 _ _ 101.00 _ _ F Basal cell carcinoma of the Skin 5 yr 154,567 100.68 _ _ 100.87 _ _ F Squamous cell carcinoma and variants of the Skin 1 yr 80,185 98.13 97.91 98.33 98.38 98.07 98.64

46 F Squamous cell carcinoma and variants of the Skin 5 yr 80,185 91.56 91.06 92.04 91.10 90.40 91.74 R ADNEXAL CARCINOMA OF THE SKIN 1 yr 1,441 95.40 93.43 96.79 95.90 92.73 97.70 R ADNEXAL CARCINOMA OF THE SKIN 5 yr 1,441 86.64 82.80 89.68 87.12 81.59 91.08 EMBRYONAL NEOPLASMS 1 yr 1,925 90.17 88.74 91.44 92.93 90.79 94.58 EMBRYONAL NEOPLASMS 5 yr 1,925 76.76 74.76 78.61 81.69 78.72 84.29 R Neuroblastoma and ganglioneuroblastoma 1 yr 674 85.30 82.37 87.78 87.84 83.14 91.29 R Neuroblastoma and ganglioneuroblastoma 5 yr 674 60.04 56.15 63.70 67.59 61.54 72.90 R Nephroblastoma 1 yr 775 93.77 91.79 95.28 96.40 93.65 97.97 R Nephroblastoma 5 yr 775 85.96 83.25 88.27 89.40 85.47 92.32 R Retinoblastoma 1 yr 316 99.27 96.85 99.83 100.16 _ _ R Retinoblastoma 5 yr 316 97.11 94.36 98.53 99.16 90.10 99.93 R Hepatoblastoma 1 yr 133 74.73 66.36 81.30 83.81 68.61 92.05 R Hepatoblastoma 5 yr 133 62.43 53.42 70.19 70.64 54.98 81.71 R Pulmonary blastoma 1 yr 22 73.17 49.23 87.13 72.69 26.52 92.62 R Pulmonary blastoma 5 yr 22 44.77 22.12 65.17 55.58 19.26 81.10 R Pancreatoblastoma 1 yr 5 100.08 _ _ 100.09 _ _ R Pancreatoblastoma 5 yr 5 100.23 _ _ 100.20 _ _ EXTRAGONADIC GERM CELL TUMOURS 1 yr 672 82.45 79.31 85.15 83.20 78.57 86.91 EXTRAGONADIC GERM CELL TUMOURS 5 yr 672 69.17 65.39 72.63 70.60 65.05 75.44 R Extragonadic malignant Immature Teratomas 1 yr 219 81.22 75.28 85.86 81.94 72.93 88.18 R Extragonadic malignant Immature Teratomas 5 yr 219 65.25 58.27 71.35 62.42 51.87 71.30 R Extragonadic Germ cell tumours 1 yr 453 83.04 79.21 86.23 83.80 78.11 88.12 R Extragonadic Germ cell tumours 5 yr 453 71.05 66.47 75.13 74.25 67.57 79.76 SOFT TISSUE SARCOMA 1 yr 25,691 76.26 75.71 76.80 77.06 76.24 77.86 SOFT TISSUE SARCOMA 5 yr 25,691 55.82 55.11 56.52 57.92 56.88 58.94 R Soft tissue sarcoma of the Head and Neck 1 yr 1,609 82.31 80.11 84.30 81.55 78.06 84.54 R Soft tissue sarcoma of the Head and Neck 5 yr 1,609 64.56 61.37 67.56 64.84 60.11 69.17 R Soft tissue sarcoma of the Limbs 1 yr 5,581 87.00 85.99 87.95 86.40 84.85 87.81 R Soft tissue sarcoma of the Limbs 5 yr 5,581 67.15 65.59 68.65 68.11 65.84 70.27 R Soft tissue sarcoma of the Superficial Trunk 1 yr 2,556 69.25 67.34 71.08 66.37 63.40 69.16 R Soft tissue sarcoma of the Superficial Trunk 5 yr 2,556 47.48 45.22 49.70 44.19 40.99 47.35 R Soft tissue sarcoma of the Mediastinum 1 yr 148 50.93 42.46 58.78 47.08 34.36 58.79 R Soft tissue sarcoma of the Mediastinum 5 yr 148 22.67 15.85 30.24 14.57 7.59 23.72 R Soft tissue sarcoma of the Heart 1 yr 85 40.28 29.80 50.52 43.32 24.79 60.55 R Soft tissue sarcoma of the Heart 5 yr 85 12.96 6.65 21.43 10.00 2.87 22.46 R Soft tissue sarcoma of the Breast 1 yr 1,035 91.80 89.74 93.46 93.94 90.89 95.99 R Soft tissue sarcoma of the Breast 5 yr 1,035 78.40 75.17 81.26 81.34 76.75 85.12 R Soft tissue sarcoma of the Uterus 1 yr 2,660 74.01 72.25 75.67 74.78 72.20 77.16

47 R Soft tissue sarcoma of the Uterus 5 yr 2,660 50.45 48.36 52.49 49.37 46.36 52.30 R Soft tissue sarcoma of the Genitourinary other 1 yr 1,307 67.41 64.68 69.98 72.20 68.07 75.90 R Soft tissue sarcoma of the Genitourinary other 5 yr 1,307 47.43 44.28 50.51 54.11 49.23 58.72 R Soft tissue sarcoma of the other Viscera 1 yr 2,808 65.69 63.82 67.48 65.66 62.76 68.39 R Soft tissue sarcoma of the other Viscera 5 yr 2,808 39.78 37.69 41.86 45.47 42.21 48.67 R Soft tissue sarcoma of the Paratesticular region 1 yr 187 94.89 88.60 97.75 97.25 82.65 99.59 R Soft tissue sarcoma of the Paratesticular region 5 yr 187 87.53 76.89 93.47 90.56 70.90 97.18 R Soft tissue sarcoma of the Retroperitoneum and Peritoneum 1 yr 1,585 64.27 61.77 66.66 67.45 63.72 70.90 R Soft tissue sarcoma of the Retroperitoneum and Peritoneum 5 yr 1,585 37.25 34.57 39.93 42.77 38.67 46.80 R Soft tissue sarcoma of the Pelvis 1 yr 82 62.60 50.77 72.35 65.80 45.34 80.13 R Soft tissue sarcoma of the Pelvis 5 yr 82 34.60 23.38 46.07 42.39 23.39 60.22 R Soft tissue sarcoma of the Skin 1 yr 1,562 97.03 95.64 97.98 97.63 95.51 98.76 R Soft tissue sarcoma of the Skin 5 yr 1,562 92.39 89.89 94.30 94.39 90.67 96.66 R Soft tissue sarcoma of the Paraorbital region 1 yr 35 81.20 63.04 91.03 83.97 54.03 95.16 R Soft tissue sarcoma of the Paraorbital region 5 yr 35 64.77 44.50 79.22 79.40 44.20 93.69 R Soft tissue sarcoma of the Brain and other Nervous System 1 yr 1,055 78.68 75.97 81.12 75.59 71.39 79.27 R Soft tissue sarcoma of the Brain and other Nervous System 5 yr 1,055 55.21 51.80 58.47 52.84 48.05 57.39 R Embryonal rhabdomyosarcoma of the Soft Tissue 1 yr 333 87.91 83.86 91.00 87.15 80.33 91.72 R Embryonal rhabdomyosarcoma of the Soft Tissue 5 yr 333 67.31 61.87 72.15 62.58 53.95 70.05 R Alveolar rhabdomyosarcoma of the Soft Tissue 1 yr 178 77.97 71.04 83.44 72.36 60.73 81.07 R Alveolar rhabdomyosarcoma of the Soft Tissue 5 yr 178 41.25 33.67 48.65 36.72 25.92 47.56 R Ewing’s family tum of the Soft Tissue 1 yr 110 82.87 74.38 88.76 81.26 70.24 88.53 R Ewing’s family tum of the Soft Tissue 5 yr 110 52.14 42.30 61.09 50.99 38.40 62.24 BONE SARCOMA 1 yr 4,443 83.40 82.23 84.51 83.88 82.04 85.55 BONE SARCOMA 5 yr 4,443 60.47 58.87 62.03 61.45 59.04 63.76 R Osteogenic sarcomas 1 yr 1,258 81.94 79.65 84.01 81.77 78.06 84.91 R Osteogenic sarcomas 5 yr 1,258 54.40 51.44 57.26 54.01 49.53 58.27 R Chondrogenic sarcomas 1 yr 1,325 87.84 85.81 89.60 88.32 85.19 90.82 R Chondrogenic sarcomas 5 yr 1,325 73.80 70.85 76.50 76.18 71.80 79.97 R Notochordal sarcoma, Chordoma 1 yr 231 83.95 78.13 88.34 88.15 79.50 93.31 R Notochordal sarcoma, Chordoma 5 yr 231 64.99 57.12 71.79 77.31 65.22 85.65 R Vascular sarcoma, Angiosarcoma 1 yr 20 35.75 15.91 56.24 40.92 5.13 76.43 R Vascular sarcoma, Angiosarcoma 5 yr 20 27.96 9.91 49.54 34.72 4.22 70.22 R Ewing’s family of tum 1 yr 737 82.31 79.35 84.89 84.91 79.66 88.89 R Ewing’s family of tum 5 yr 737 49.72 45.99 53.32 52.22 46.08 58.00 R Epithelial tumours, Adamantinoma 1 yr 48 91.58 76.60 97.14 96.40 64.32 99.70 R Epithelial tumours, Adamantinoma 5 yr 48 83.93 62.72 93.63 83.59 43.54 96.21 R Other high grade sarcoma (fibrosarcoma, malignant fibrous histyocitoma) 1 yr 106 77.27 67.52 84.43 75.89 57.17 87.27

48 R Other high grade sarcoma (fibrosarcoma, malignant fibrous histyocitoma) 5 yr 106 52.46 41.17 62.56 53.91 36.12 68.74 R GASTROINTESTINAL STROMAL SARCOMA 1 yr 181 84.02 77.22 88.93 83.54 78.88 87.26 R GASTROINTESTINAL STROMAL SARCOMA 5 yr 181 70.53 61.18 78.02 67.95 59.41 75.08 R KAPOSI SARCOMA 1 yr 2,122 78.10 76.14 79.91 86.51 83.37 89.09 R KAPOSI SARCOMA 5 yr 2,122 64.03 61.48 66.47 74.99 70.68 78.76 NEURO ENDOCRINE TUMOURS 1 yr 12,636 67.44 66.57 68.28 67.14 65.97 68.28 NEURO ENDOCRINE TUMOURS 5 yr 12,636 50.75 49.72 51.78 49.57 48.18 50.95 R Well differentiated endocrine tumours, carcinoid 1 yr 1,712 61.74 59.30 64.07 56.40 53.31 59.36 R Well differentiated endocrine tumours, carcinoid 5 yr 1,712 32.21 29.71 34.73 29.43 26.43 32.48 R Well differentiated endocrine tumours, atypical carcinoid 1 yr 1 100.32 _ _ 58.47 9.46 88.51 R Well differentiated endocrine tumours, atypical carcinoid 5 yr 1 101.82 _ _ NE NE NE R Poorly differentiated endocrine carcinoma (lung microcytoma excluded) 1 yr 2,680 30.09 28.32 31.89 30.40 27.92 32.90 R Poorly differentiated endocrine carcinoma (lung microcytoma excluded) 5 yr 2,680 12.88 11.47 14.37 11.73 9.94 13.68 R Mixed endocrine-exocrine carcinoma 1 yr 10 30.79 7.20 59.02 84.01 25.70 97.79 R Mixed endocrine-exocrine carcinoma 5 yr 10 34.81 7.52 65.03 62.15 14.32 89.01 R Endocrine carcinoma of the Thyroid gland 1 yr 1,135 90.50 88.50 92.17 92.96 90.30 94.91 R Endocrine carcinoma of the Thyroid gland 5 yr 1,135 80.47 77.53 83.07 82.29 78.00 85.82
R Well differentiated endocrine carcinoma not functioning of the Pancreas and of the Digestive organs 1 yr 6,300 78.99 77.90 80.04 78.70 77.19 80.12
R Well differentiated endocrine carcinoma not functioning of the Pancreas and of the Digestive organs 5 yr 6,300 64.44 62.98 65.85 64.02 62.03 65.94
R Well differentiated endocrine carcinoma functioning of the Pancreas and of the Digest organs 1 yr 143 77.62 69.51 83.82 80.60 65.87 89.46
R Well differentiated endocrine carcinoma functioning of the Pancreas and of the Digestive organs 5 yr 143 51.26 41.68 60.04 53.17 38.05 66.16
R Endocrine carcinoma of the Skin 1 yr 621 80.19 76.16 83.61 85.47 80.50 89.25 R Endocrine carcinoma of the Skin 5 yr 621 57.58 51.56 63.13 57.83 49.81 65.03 CARCINOMA OF ENDOCRINE ORGANS 1 yr 21,082 87.81 87.34 88.27 90.31 89.70 90.88 CARCINOMA OF ENDOCRINE ORGANS 5 yr 21,082 84.52 83.89 85.12 87.14 86.30 87.93 R Carcinomas of the Pituitary gland 1 yr 212 76.54 69.76 82.00 82.23 70.01 89.82 R Carcinomas of the Pituitary gland 5 yr 212 67.86 59.22 75.06 66.72 51.69 78.03 R Carcinomas of the Thyroid gland 1 yr 18,797 90.42 89.96 90.86 92.68 92.11 93.21 R Carcinomas of the Thyroid gland 5 yr 18,797 88.15 87.53 88.73 90.55 89.73 91.31 R Carcinomas of the Parathyroid gland 1 yr 112 87.56 79.08 92.76 90.01 77.71 95.70 R Carcinomas of the Parathyroid gland 5 yr 112 72.75 61.12 81.42 83.37 63.83 92.90 R Carcinoma of the Adrenal gland 1 yr 940 62.53 59.28 65.61 60.14 55.18 64.73 R Carcinoma of the Adrenal gland 5 yr 940 39.45 36.06 42.82 36.47 31.70 41.25
GLIAL TUMOURS OF THE CENTRAL NERVOUS SYSTEM (CNS) AND PINEAL GLAND 1 yr 28,838 42.03 41.46 42.61 43.78 42.90 44.66

49
GLIAL TUMOURS OF THE CENTRAL NERVOUS SYETEM (CNS) AND PINEAL GLAND 5 yr 28,838 20.01 19.52 20.50 19.57 18.86 20.29
R Astrocytic tumours of the CNS 1 yr 25,827 37.23 36.63 37.83 38.95 38.04 39.87 R Astrocytic tumours of the CNS 5 yr 25,827 15.07 14.60 15.54 14.43 13.77 15.11 R Oligodendroglial tumours of the CNS 1 yr 1,941 81.11 79.26 82.81 82.41 79.59 84.87 R Oligodendroglial tumours of the CNS 5 yr 1,941 54.03 51.65 56.35 54.47 50.97 57.84 R Ependymal tumours of the CNS 1 yr 1,070 86.05 83.77 88.03 90.13 86.95 92.58 R Ependymal tumours of the CNS 5 yr 1,070 71.26 68.24 74.06 74.48 70.05 78.36
NON GLIAL TUMOURS OF THE CENTRAL NERVOUS SYSTEM (CNS) AND PINEAL GLAND 1 yr 1,202 78.25 75.80 80.49 81.02 77.46 84.07
NON GLIAL TUMOUR OF THE CENTRAL NERVIOUS SYSTEM (CNS) AND PINEAL GLAND 5 yr 1,202 53.11 50.19 55.94 56.93 52.57 61.05
R Embryonal tumours of the CNS 1 yr 1,178 78.31 75.84 80.57 81.14 77.50 84.24 R Embryonal tumours of the CNS 5 yr 1,178 53.23 50.28 56.09 56.80 52.37 60.99 R Choroid plexus carcinoma of the CNS 1 yr 24 75.42 52.74 88.30 78.39 55.25 90.49 R Choroid plexus carcinoma of the CNS 5 yr 24 46.85 25.78 65.43 64.56 39.09 81.56 R MALIGNANT MENINGIOMAS 1 yr 865 77.05 73.94 79.84 80.09 74.92 84.31 R MALIGNANT MENINGIOMAS 5 yr 865 61.75 57.75 65.50 69.95 63.70 75.33
GLIAL TUMOURS OF THE OF THE NERVES, AUTONOMIC NERVOUS SYSTEM AND PARAGANGLIA 1 yr 55 91.43 79.47 96.57 75.50 52.76 88.37
GLIAL TUMOURS OF THE OF THE NERVES, AUTONOMIC NERVOUS SYSTEM AND PARAGANGLIA 5 yr 55 86.48 71.97 93.78 72.00 48.62 86.10
R Astrocytic tumours of the Nerves, Autonomic Nervous System and Paraganglia 1 yr 27 81.95 61.19 92.25 50.59 20.95 74.31
R Astrocytic tumours of the Nerves, Autonomic Nervous System and Paraganglia 5 yr 27 68.65 46.56 83.10 41.85 16.09 66.01
R Ependymal tumours of the Nerves, Autonomic Nervous System and Paraganglia 1 yr 28 100.76 _ _ 100.14 _ _
R Ependymal tumours of the Nerves, Autonomic Nervous System and Paraganglia 5 yr 28 104.36 _ _ 103.78 _ _
NON-GLIAL TUMOURS OF THE OF THE NERVES, AUTONOMIC NERVOUS SYSTEM AND PARAGANGLIA 1 yr 514 85.60 82.11 88.46 83.74 78.36 87.89
NON-GLIAL TUMOURS OF THE OF THE NERVES, AUTONOMIC NERVOUS SYSTEM AND PARAGANGLIA 5 yr 514 63.50 58.75 67.85 59.63 52.83 65.77
R Embryonal tumours of the Nerves, Autonomic Nervous System and Paraganglia 1 yr 401 87.43 83.60 90.41 85.40 79.03 89.95
R Embryonal tumours of the Nerves, Autonomic Nervous System and Paraganglia 5 yr 401 67.01 61.71 71.74 64.87 56.95 71.69
R Paraganglioma 1 yr 113 79.09 70.00 85.70 79.62 68.01 87.39 R Paraganglioma 5 yr 113 51.00 40.47 60.58 42.84 29.65 55.37 LYMPHOID DISEASES 1 yr 156,200 75.70 75.47 75.92 76.83 76.49 77.17
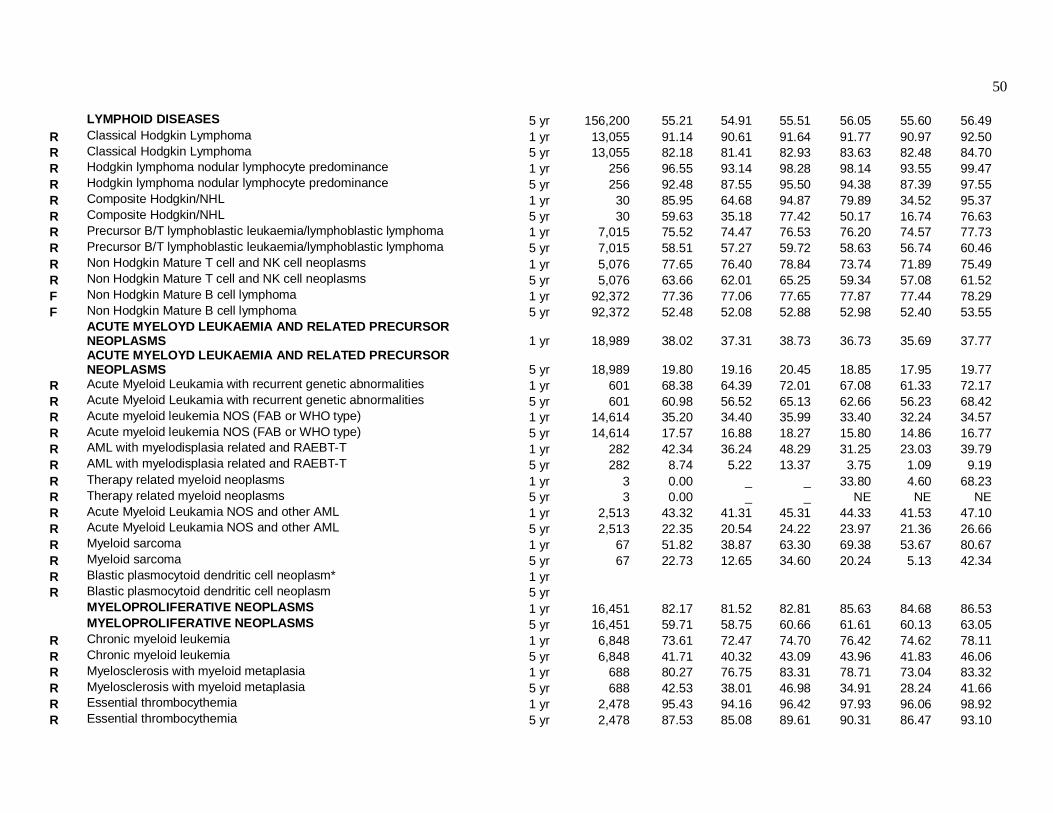
50 LYMPHOID DISEASES 5 yr 156,200 55.21 54.91 55.51 56.05 55.60 56.49 R Classical Hodgkin Lymphoma 1 yr 13,055 91.14 90.61 91.64 91.77 90.97 92.50 R Classical Hodgkin Lymphoma 5 yr 13,055 82.18 81.41 82.93 83.63 82.48 84.70 R Hodgkin lymphoma nodular lymphocyte predominance 1 yr 256 96.55 93.14 98.28 98.14 93.55 99.47 R Hodgkin lymphoma nodular lymphocyte predominance 5 yr 256 92.48 87.55 95.50 94.38 87.39 97.55 R Composite Hodgkin/NHL 1 yr 30 85.95 64.68 94.87 79.89 34.52 95.37 R Composite Hodgkin/NHL 5 yr 30 59.63 35.18 77.42 50.17 16.74 76.63 R Precursor B/T lymphoblastic leukaemia/lymphoblastic lymphoma 1 yr 7,015 75.52 74.47 76.53 76.20 74.57 77.73 R Precursor B/T lymphoblastic leukaemia/lymphoblastic lymphoma 5 yr 7,015 58.51 57.27 59.72 58.63 56.74 60.46 R Non Hodgkin Mature T cell and NK cell neoplasms 1 yr 5,076 77.65 76.40 78.84 73.74 71.89 75.49 R Non Hodgkin Mature T cell and NK cell neoplasms 5 yr 5,076 63.66 62.01 65.25 59.34 57.08 61.52 F Non Hodgkin Mature B cell lymphoma 1 yr 92,372 77.36 77.06 77.65 77.87 77.44 78.29 F Non Hodgkin Mature B cell lymphoma 5 yr 92,372 52.48 52.08 52.88 52.98 52.40 53.55
ACUTE MYELOYD LEUKAEMIA AND RELATED PRECURSOR NEOPLASMS 1 yr 18,989 38.02 37.31 38.73 36.73 35.69 37.77
ACUTE MYELOYD LEUKAEMIA AND RELATED PRECURSOR NEOPLASMS 5 yr 18,989 19.80 19.16 20.45 18.85 17.95 19.77
R Acute Myeloid Leukamia with recurrent genetic abnormalities 1 yr 601 68.38 64.39 72.01 67.08 61.33 72.17 R Acute Myeloid Leukamia with recurrent genetic abnormalities 5 yr 601 60.98 56.52 65.13 62.66 56.23 68.42 R Acute myeloid leukemia NOS (FAB or WHO type) 1 yr 14,614 35.20 34.40 35.99 33.40 32.24 34.57 R Acute myeloid leukemia NOS (FAB or WHO type) 5 yr 14,614 17.57 16.88 18.27 15.80 14.86 16.77 R AML with myelodisplasia related and RAEBT-T 1 yr 282 42.34 36.24 48.29 31.25 23.03 39.79 R AML with myelodisplasia related and RAEBT-T 5 yr 282 8.74 5.22 13.37 3.75 1.09 9.19 R Therapy related myeloid neoplasms 1 yr 3 0.00 _ _ 33.80 4.60 68.23 R Therapy related myeloid neoplasms 5 yr 3 0.00 _ _ NE NE NE R Acute Myeloid Leukamia NOS and other AML 1 yr 2,513 43.32 41.31 45.31 44.33 41.53 47.10 R Acute Myeloid Leukamia NOS and other AML 5 yr 2,513 22.35 20.54 24.22 23.97 21.36 26.66 R Myeloid sarcoma 1 yr 67 51.82 38.87 63.30 69.38 53.67 80.67 R Myeloid sarcoma 5 yr 67 22.73 12.65 34.60 20.24 5.13 42.34 R Blastic plasmocytoid dendritic cell neoplasm* 1 yr R Blastic plasmocytoid dendritic cell neoplasm 5 yr MYELOPROLIFERATIVE NEOPLASMS 1 yr 16,451 82.17 81.52 82.81 85.63 84.68 86.53 MYELOPROLIFERATIVE NEOPLASMS 5 yr 16,451 59.71 58.75 60.66 61.61 60.13 63.05 R Chronic myeloid leukemia 1 yr 6,848 73.61 72.47 74.70 76.42 74.62 78.11 R Chronic myeloid leukemia 5 yr 6,848 41.71 40.32 43.09 43.96 41.83 46.06 R Myelosclerosis with myeloid metaplasia 1 yr 688 80.27 76.75 83.31 78.71 73.04 83.32 R Myelosclerosis with myeloid metaplasia 5 yr 688 42.53 38.01 46.98 34.91 28.24 41.66 R Essential thrombocythemia 1 yr 2,478 95.43 94.16 96.42 97.93 96.06 98.92 R Essential thrombocythemia 5 yr 2,478 87.53 85.08 89.61 90.31 86.47 93.10
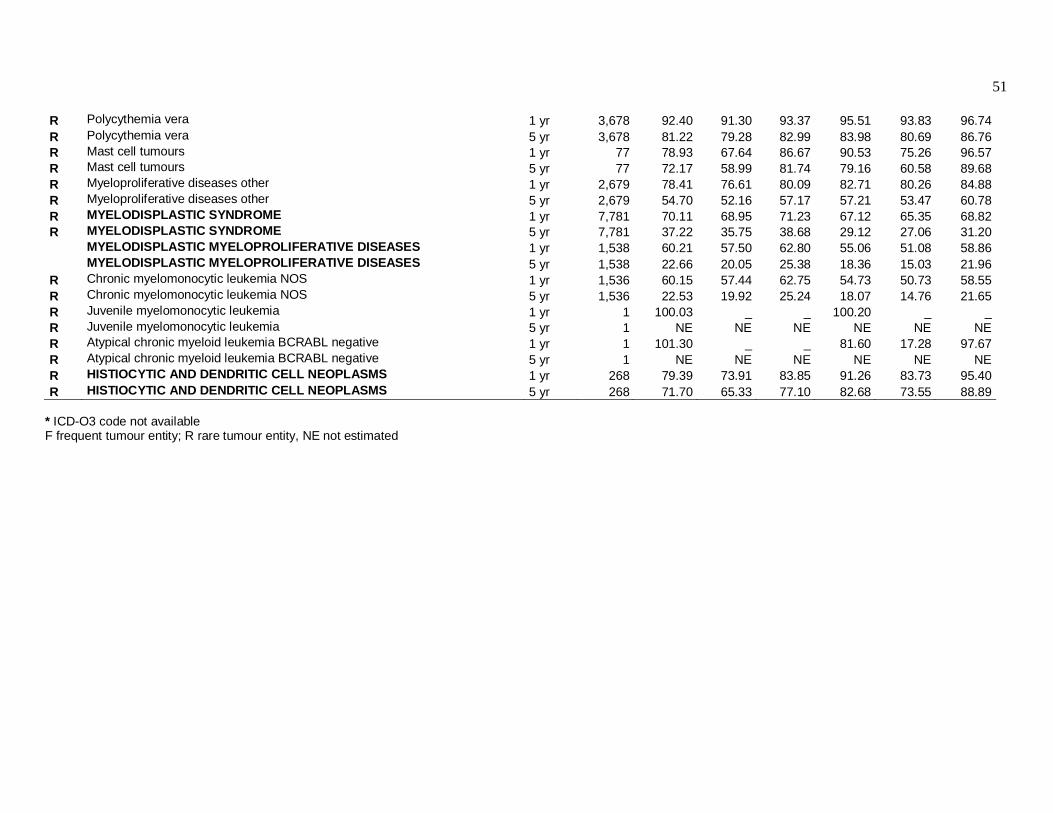
51 R Polycythemia vera 1 yr 3,678 92.40 91.30 93.37 95.51 93.83 96.74 R Polycythemia vera 5 yr 3,678 81.22 79.28 82.99 83.98 80.69 86.76 R Mast cell tumours 1 yr 77 78.93 67.64 86.67 90.53 75.26 96.57 R Mast cell tumours 5 yr 77 72.17 58.99 81.74 79.16 60.58 89.68 R Myeloproliferative diseases other 1 yr 2,679 78.41 76.61 80.09 82.71 80.26 84.88 R Myeloproliferative diseases other 5 yr 2,679 54.70 52.16 57.17 57.21 53.47 60.78 R MYELODISPLASTIC SYNDROME 1 yr 7,781 70.11 68.95 71.23 67.12 65.35 68.82 R MYELODISPLASTIC SYNDROME 5 yr 7,781 37.22 35.75 38.68 29.12 27.06 31.20 MYELODISPLASTIC MYELOPROLIFERATIVE DISEASES 1 yr 1,538 60.21 57.50 62.80 55.06 51.08 58.86 MYELODISPLASTIC MYELOPROLIFERATIVE DISEASES 5 yr 1,538 22.66 20.05 25.38 18.36 15.03 21.96 R Chronic myelomonocytic leukemia NOS 1 yr 1,536 60.15 57.44 62.75 54.73 50.73 58.55 R Chronic myelomonocytic leukemia NOS 5 yr 1,536 22.53 19.92 25.24 18.07 14.76 21.65 R Juvenile myelomonocytic leukemia 1 yr 1 100.03 _ _ 100.20 _ _ R Juvenile myelomonocytic leukemia 5 yr 1 NE NE NE NE NE NE R Atypical chronic myeloid leukemia BCRABL negative 1 yr 1 101.30 _ _ 81.60 17.28 97.67 R Atypical chronic myeloid leukemia BCRABL negative 5 yr 1 NE NE NE NE NE NE R HISTIOCYTIC AND DENDRITIC CELL NEOPLASMS 1 yr 268 79.39 73.91 83.85 91.26 83.73 95.40 R HISTIOCYTIC AND DENDRITIC CELL NEOPLASMS 5 yr 268 71.70 65.33 77.10 82.68 73.55 88.89
* ICD-O3 code not available F frequent tumour entity; R rare tumour entity, NE not estimated