Developing carbon-based ecological indicators to monitor sustainability of Ontario’s forests
12
Ecological Indicators 1 (2002) 235–246 Developing carbon-based ecological indicators to monitor sustainability of Ontario’s forests Changhui Peng a,b,∗ , Jinxun Liu b , Qinglai Dang b , Xiaolu Zhou b , Mike Apps b,1 a Ministry of Natural Resources, Ontario Forest Research Institute, 1235 Queen Street. E., Sault Ste. Marie, ON, Canada P6A 2E5 b Faculty of Forestry and the Forest Environment, Lakehead University, 955 Oliver Road, Thunder Bay, ON, Canada P7B 5E1 Received 16 June 2001; received in revised form 12 March 2002; accepted 18 March 2002 Abstract With 2% of the world’s forests and 17% of Canada’s forested land, Ontario plays a major role in maintaining Canada’s forests and managing them sustainably. Ontario is developing a set of criteria and indicators of sustainable forest management (SFM) to aid in conservation and sustainable management of its temperate and boreal (BO) forests. The criteria and indicators are intended to provide a framework for describing and assessing processes of SFM at a regional scale; and to improve the information available to the public and decision-makers. This paper describes three ecological indicators, evaluated using a carbon (C) budget model, a forest inventory database, and disturbance records to assess long-term sustainability of Ontario’s forest ecosystems based on the environmental conditions of the past 70 years. Results suggest that total net primary productivity (NPP) of Ontario’s forest ecosystems increased from 1925 to 1975 and then decreased between 1975 and 1990; Ontario’s forest ecosystems acted as a C sink between 1920 and 1980, and a C source from 1981 to 1990, mainly due to decreased average forest age and NPP caused by increased ecosystem disturbance (e.g. fire, insect and disease infestations, harvesting) since 1975. Current estimates from this analysis suggest that there is significant potential for Ontario’s forests to function as C sinks by reducing ecosystem disturbances and increasing growth and storage of C in the young forests throughout the province. © 2002 Elsevier Science Ltd. All rights reserved. Keywords: Carbon budget model; Net primary productivity; Net ecosystem production; Net carbon balance; Ecosystem disturbance; Criteria and indicators 1. Introduction Awareness of the need for environmentally sustain- able economic development was raised by the widely cited Brundtland report Our Common Future (WCED, 1987). Published over a decade ago, the issues iden- ∗ Corresponding author. Present address: Institute of Atmo- spheric Sciences, College of Earth Systems, South Dakota School of Mines and Technology, 501 E.St. Joseph, Rapid City, SD 57701-3995, USA. Tel.: +1-605-394-1996; fax: +1-605-394-6061. E-mail address: [email protected] (C. Peng). 1 Present address: Natural Resources Canada, Canadian Forest Service, 506 West Burnside Road, Victoria, BC, Canada V8Z 1M5. tified in the report—in which the concept of “sus- tainable development” was introduced—remain as unmet challenges. The Brundtland report defines sus- tainable development in terms of inter-generation equity as “ensuring that (humanity) meets the need of the present without compromising the ability of future generations to meet their own” (WCED, 1987). Sustainable development has more recently been the major focus of international attention in Agenda 21, set up at the Earth Summit held in Rio De Janeiro in 1992. As a result of the Rio meeting, some national governments have responded to the call to establish sustainable development strategies (CCFM, 1992; 1470-160X/02/$ – see front matter © 2002 Elsevier Science Ltd. All rights reserved. PII:S1470-160X(02)00010-9
-
Upload
independent -
Category
Documents
-
view
2 -
download
0
Transcript of Developing carbon-based ecological indicators to monitor sustainability of Ontario’s forests

Ecological Indicators 1 (2002) 235–246
Developing carbon-based ecological indicators to monitorsustainability of Ontario’s forests
Changhui Penga,b,∗, Jinxun Liub, Qinglai Dangb, Xiaolu Zhoub, Mike Appsb,1
a Ministry of Natural Resources, Ontario Forest Research Institute, 1235 Queen Street. E., Sault Ste. Marie, ON, Canada P6A 2E5b Faculty of Forestry and the Forest Environment, Lakehead University, 955 Oliver Road, Thunder Bay, ON, Canada P7B 5E1
Received 16 June 2001; received in revised form 12 March 2002; accepted 18 March 2002
Abstract
With 2% of the world’s forests and 17% of Canada’s forested land, Ontario plays a major role in maintaining Canada’sforests and managing them sustainably. Ontario is developing a set of criteria and indicators of sustainable forest management(SFM) to aid in conservation and sustainable management of its temperate and boreal (BO) forests. The criteria and indicatorsare intended to provide a framework for describing and assessing processes of SFM at a regional scale; and to improve theinformation available to the public and decision-makers. This paper describes three ecological indicators, evaluated using acarbon (C) budget model, a forest inventory database, and disturbance records to assess long-term sustainability of Ontario’sforest ecosystems based on the environmental conditions of the past 70 years. Results suggest that total net primary productivity(NPP) of Ontario’s forest ecosystems increased from 1925 to 1975 and then decreased between 1975 and 1990; Ontario’sforest ecosystems acted as a C sink between 1920 and 1980, and a C source from 1981 to 1990, mainly due to decreasedaverage forest age and NPP caused by increased ecosystem disturbance (e.g. fire, insect and disease infestations, harvesting)since 1975. Current estimates from this analysis suggest that there is significant potential for Ontario’s forests to function as Csinks by reducing ecosystem disturbances and increasing growth and storage of C in the young forests throughout the province.© 2002 Elsevier Science Ltd. All rights reserved.
Keywords: Carbon budget model; Net primary productivity; Net ecosystem production; Net carbon balance; Ecosystem disturbance; Criteriaand indicators
1. Introduction
Awareness of the need for environmentally sustain-able economic development was raised by the widelycited Brundtland report Our Common Future (WCED,1987). Published over a decade ago, the issues iden-
∗ Corresponding author. Present address: Institute of Atmo-spheric Sciences, College of Earth Systems, South Dakota Schoolof Mines and Technology, 501 E.St. Joseph, Rapid City, SD57701-3995, USA. Tel.:+1-605-394-1996; fax:+1-605-394-6061.E-mail address: [email protected] (C. Peng).
1 Present address: Natural Resources Canada, Canadian ForestService, 506 West Burnside Road, Victoria, BC, Canada V8Z 1M5.
tified in the report—in which the concept of “sus-tainable development” was introduced—remain asunmet challenges. The Brundtland report defines sus-tainable development in terms of inter-generationequity as “ensuring that (humanity) meets the needof the present without compromising the ability offuture generations to meet their own” (WCED, 1987).Sustainable development has more recently been themajor focus of international attention in Agenda 21,set up at the Earth Summit held in Rio De Janeiro in1992. As a result of the Rio meeting, some nationalgovernments have responded to the call to establishsustainable development strategies (CCFM, 1992;
1470-160X/02/$ – see front matter © 2002 Elsevier Science Ltd. All rights reserved.PII: S1470-160X(02)00010-9

236 C. Peng et al. / Ecological Indicators 1 (2002) 235–246
HMSO, 1994). Developing criteria and indicators forsustainable forest management (SFM) is an importantstep toward meeting the forestry commitment made atthe United Nations Conference on Environment andDevelopment (UNCED, 1992). The ongoing debateon sustainable development has moved from definingthis broad concept to examining ways in which it canbe measured (Cocklin, 1989; Bossel, 1996; Wardoyoand Jordan, 1996; CCFM, 1997; Morris et al., 1997).
SFM represents a new paradigm for forestry inCanada (CCFM, 1992). Canada is developing a set ofcriteria and indicators of SFM for domestic purposes(CCFM, 1995, 1997) and has been actively involvedin initiatives to define criteria and indicators forforests in Europe (the Helsinki Process) and fortemperate and BO forests in general (The MontrealProcess, 1997), which will establish internationalcriteria and indicators for the conservation and sus-tainable management of temperate and BO forests.
Ontario holds about 2% of the world’s forests and17% of Canada’s forested land. Maintaining long-termecological sustainability of Ontario’s forests involvesmanaging temporal and spatial patterns of ecosystemconditions at both stand and landscape levels (Pereraet al., 2000). In its broadest sense, SFM embracesboth the concepts of ecosystem management (in whichmultiple resource values are made explicit) and theconcepts of sustainable development (in which theneeds of future generations are explicitly considered)(Kimmins, 1997). Understanding the dynamics of for-est ecosystems, and the factors that influence thesedynamics, provides the basis for the sustainable useof forest resources and the conservation of their envi-ronmental values. Of particular importance is that ata periodic intervals they are subjected to large-scalenatural and anthropogenic disturbances (such as wildfire, insect outbreaks, and harvesting ), whose relation-ship and interaction with environmental variability andchange is imperfectly understood (Candau et al., 1998;Perera et al., 1998; Fleming et al., 2000; Li, 2000).Moreover, forests are under increasing pressure boththrough the direct effects of harvesting and land-usechange, for example, as well as the indirect effects ofanthropogenic changes in the global climate system(Colombo et al., 1998; Parker et al., 2000; Flanninganand Weber, 2000).
In this paper, we (1) provide an overview of thedevelopment of Ontario’s criteria and indicators for
SFM; (2) quantify three specific ecological indica-tors (net primary productivity (NPP), net ecosystemproduction (NEP), net biome production (NBP)) thatrelate global carbon (C) budgets to the long-termsustainability of Ontario’s forest ecosystems undera changing environment; and (3) discuss associatedchallenges and future research needs.
2. Development of criteria andindicators in Ontario
Criteria and indicators are used to condense theworld’s complexity into a manageable amount ofmeaningful information to help us make informeddecisions and direct our actions appropriately. With theincreasing complexity of environment-developmentproblems, the urge of science is to produce ever moredata and indicators. A criterion is a category of con-ditions or processes by which sustainable ecosystemmanagement may be assessed (CCFM, 1995; OMNR,2001). An indicator is a measure of an aspect ofthe criterion. A criterion is characterized by a set ofrelated indicators that are monitored periodically toassess change. An indicator should have four basic at-tributes. It (1) must be easy to understand; (2) must besomething that can be measured; (3) should measuresomething believed to be important or significant in itsown right; and (4) should be comparable among geo-graphical areas, preferably internationally (Anderson,1991; Morris et al., 1997; Peng et al., 1998a).
The seven criteria for Ontario’s forests, which aredefined by 68 related indicators (OMNR, 2001), andare viewed as essential components of the sustainablemanagement of temperate and BO forests are:
1. conserving biological diversity in Ontario’s forest;2. maintaining and enhancing forest ecosystem con-
dition and productivity in Ontario;3. protecting and conserving Ontario’s forest soil and
water resources;4. monitoring Ontario’s forest contributions to global
ecological cycles;5. providing for a continuous and predictable flow of
economic and social benefits;6. accepting Ontario’s social responsibilities for sus-
tainable forest development; and7. maintaining and enhancing Ontario’s framework
for SFM.

C. Peng et al. / Ecological Indicators 1 (2002) 235–246 237
Criteria 1–6 relate specifically to Ontario’s forestconditions, attributes or functions, and to the multiplevalues or benefits associated with the environmentaland socio-economic goods and services that forestsprovide. Criterion 7 relates to how Ontario’s over-all policy framework facilitates SFM and supportsefforts to conserve, maintain or enhance the condi-tion, attributes and benefits captured in criteria 1–6.Taken together, these criteria and indicators providea common understanding and implicit definition ofwhat is meant by SFM. The criteria and indicatorswill help to provide a provincial reference for policymakers and forest managers when formulating pol-icy, improve the quality of information available todecision-makers and the public, and provide betterinformation in support of the forest policy debate atnational and international levels.
Over the next 20 years it is anticipated that demandfor timber production will increase beyond supplyin Ontario. Without the development of appropriatemanagement and decision support indicators, it willbe difficult to manage our forest ecosystem produc-tivity in a sustainable fashion. Of particular interest tous are the indicators associated with forest ecosystemproductivity and net C balance of forest ecosystemsin Ontario. Under the Kyoto Protocol, Canada hasagreed to reduce its greenhouse gases (GHG) emis-sions by 6% from the 1990 level by 2010. With 38%of Canada’s population and 17% of Canada’s forestedland, Ontario plays an important role in Canada’s Cbudgets. Forests could help Ontario achieve a green-house gas emissions reduction target by increasingthe removal of carbon dioxide from the atmosphereand storing it in both vegetation and soil. If forestsare to be used to help meet greenhouse gas emissionreduction targets, it is important to have an accurateestimate of the state of Ontario’s forests. Ontarioneeds to investigate its C budget in detail and reporton its net C balance (e.g. C sinks and sources) to helpmeet the national commitment (OMNR, 2001).
3. Methodology
3.1. Model description
We used the C budget model for the Canadian forestsector (CBM-CFS2,Kurz and Apps, 1999) and forest
inventory database to assess values for these indicatorsfor Ontario’s forests for the last 70 years. The detailson the model are published inKurz et al. (1992), Kurzand Apps (1999), andApps et al. (1999). Therefore,we only provide a short description of the model inthis paper. The CBM-CFS2 is a general framework foraccounting for C stocks and fluxes in forest ecosys-tems. The model considers biomass, soil organicmatter and forest products C pools. It incorporatesdata and simulated processes required to estimate theC budget of the forest, including C storage in above-and belowground biomass and soils, and C exchangeamong these reservoirs and the atmosphere (Fig. 1).It also simulates forest growth, mortality, decompo-sition, and the effects of disturbances on the forestecosystem. The effects of disturbance (principallywildfires, insect outbreaks, and harvesting) on forestage structure and on C releases to the atmosphere andforest floor are calculated on a 5-year cycle.
The inputs of the model include area, forest types,forest age, site condition, harvesting and natural dis-turbance statistics, and management activities such asplanting. The model can be used to generate detailedoutput files and summary information for each spatialunit and ecoclimatic province in Canada. It can alsoprovide estimates of the C stocks in these pools andC fluxes for Ontario’s forested land. During the lastdecade, the CBM-CFS2 has been used at national(Kurz and Apps, 1995, 1999), provincial (Kurz et al.,1996a; Peng et al., 2000; Liu et al., 2002), and forestmanagement unit scales (Price et al., 1996, 1997).For example, it has been used to:
1. demonstrate the importance of natural disturbancesas a major factor governing large-scale temporaldynamics of C in Canadian forests over the lastcentury (Kurz and Apps, 1995, 1996), possibleoutcomes in the future (Kurz and Apps, 1995), andthe role of forest products in this balance (Appset al., 1999);
2. assess the effects of intensive harvesting on Cdynamics (the Foothills Forest in Alberta) andcompare with those likely to have occurred in thesame ecosystem subject only to natural distur-bances (Price et al., 1997);
3. assess the effects of the transition from a natural toa managed disturbance regime in different forestbiomes in Canada (Kurz et al., 1998); and

238 C. Peng et al. / Ecological Indicators 1 (2002) 235–246
Fig. 1. A simple diagram of C stocks and fluxes included in the C budget model of the Canadian forest sector (CBM-CFS2).
4. examine various policy implications, includingthe role of Canada’s forests in meeting the KyotoProtocol, and the sensitivity of national GHGaccounting under Intergovernmental Panel on Cli-mate Change (IPCC) guidelines to different dataand assumptions (Greenough et al., 1997).
3.2. Description of ecological indicators
Of the 68 indicators, three are of particularinterest: (NPP, NEP, and NBP) because of theirrelationship to forest growth, ecosystem productivityand disturbances, and climate change. They are alsoclosely related to ecosystem functions that are oneof core components of sustainability of the ecosys-tem. There are two concepts embedded in the term“sustainability”: sustainability of timber yield andsustainability of the ecosystem. The latter refers tosustaining the integrity of the natural forest in termsof its structure, function and composition (i.e. speciescomposition and biological diversity).
3.2.1. Net primary productivity (indicator 2.2.4)NPP represents the net C input from the atmo-
sphere to terrestrial vegetation (Melillo et al., 1993).
It is a measure, used to describe forest ecosystemcondition and link forest growth with C dynamics(Peng and Apps, 1998, 1999; Peng et al., 1998a,b).For this reason, it is widely used as an indicator forthe sequestration of atmospheric CO2 by plants, aswell as for forest ecosystem production in terms ofbiomass production of all species and types of floraand fauna. It is of fundamental importance to hu-man because we rely on a significant portion of thisbiomass production for fiber, fuel, and food. Nearly40% of the world’s annual NPP is directly managedfor human use (Vitousek et al., 1986).
In theory, NPP is defined as the difference betweengross primary productivity (GPP) and autotrophicrespiration (Ra) (Kimmins, 1997). It is the net amountof canopy C accumulated by a tree over a specifiedtime interval—usually 1 year. In practice, NPP canbe calculated by summing up the growth of all tissueproduced during a year, including that consumed byherbivores or added to the detritus pool (Landsbergand Gower, 1997).
The equation is : NPP= �B + DB + CB
where �B is the change in biomass over a year(annual biomass increment),DB is detritus produced

C. Peng et al. / Ecological Indicators 1 (2002) 235–246 239
during the year, andCB represents biomass consump-tion by herbivores during the year.
3.2.2. Net carbon balance (indicator 4.1.1)The global C cycle is the most important natural
process linking forests with climate change. Forestsplay an important role in the global C cycle becausethey store a large amount of C in vegetation and soil,and exchange C with the atmosphere through photo-synthesis and respiration (Dixon et al., 1994; IPCC,2000). The net C balance represents the net exchangeof C between forests and the atmosphere, and is anindicator of C sinks or sources. It is also an importantfactor in global warming and climate change (IPCC,2000).
NEP and NBP are key indicators used to describethe annual net C balance of forest ecosystems (IGBPWorking Group, 1998; IPCC, 2000). NEP denotesthe net accumulation of C by an ecosystem. It is thedifference between the rate of production of livingorganic matter (NPP) and the decomposition rate ofdead organic matter (heterotropic respiration,RH). RHincludes losses by herbivory and the decompositionof organic debris by soil biota. NBP denotes the netproduction of organic matter in a region containinga range of ecosystem (a biome) includes, in additionto RH, other non-respiratory losses by ecosystem dis-turbances (e.g. fire, insects, harvesting etc.); NBP isa small fraction of initial uptake of CO2 from theatmosphere and can be positive or negative. It is ap-propriate for calculating net C balance of large areas(100–1000 km2) and longer periods of time (severalyears or more).
The relationship between these indices can bedescribed by the following equations:
NEP= NPP− RH
NBP = NEP—non-respiratory C losses throughecosystem disturbances where NPP is the net produc-tion of organic matter by plants in an ecosystem.
For Ontario, NPP was calculated as annual ecosys-tem biomass increment plus annual litterfall (beforedisturbances). NEP was calculated as NPP minus soilC emissions, representing the net C balance of forestecosystems (before disturbance). NBP was calculatedas NEP minus harvest removals and direct C emissionscaused by disturbances.
3.3. Inventory data and spatial units
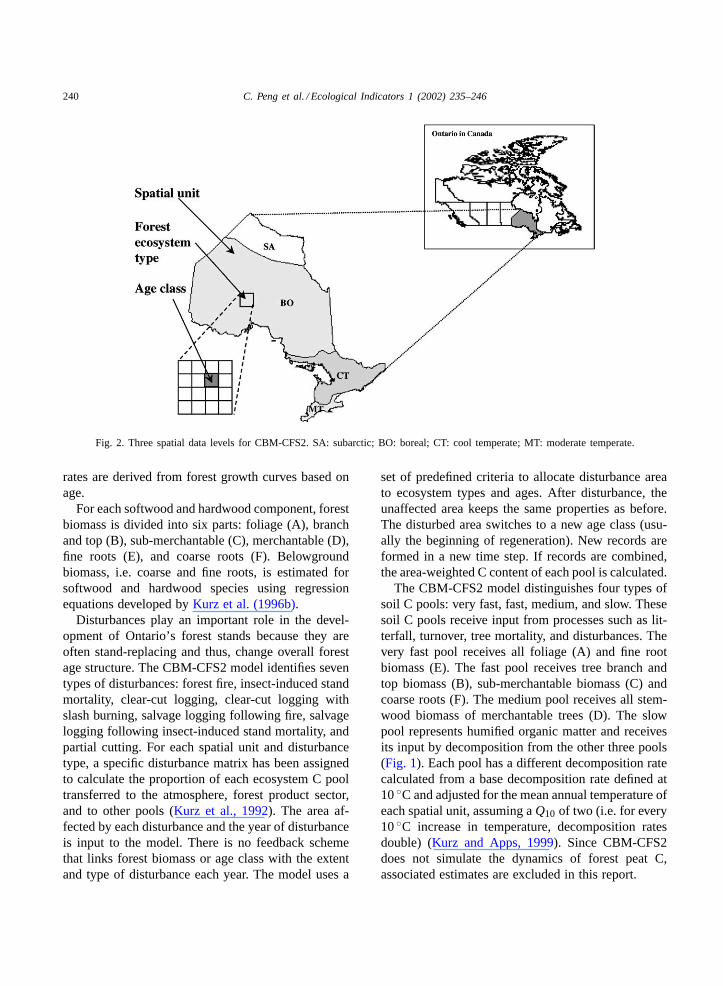
Forest inventory information used in the CBM-CFS2 was derived from the National Forest BiomassInventory (NFBI) (Bonnor, 1985). The NFBI con-tains about 50,000 grid cells (9.5 km× 9.5 km) forall of Canada’s forested land and includes consider-ably more area (440.8 M ha) than the forest inventorysince it estimates biomass in low productivity areasand non-commercial forests. Information in the NFBIwas summarized for 42 spatial units representingthe boundaries of ecoclimatic provinces (EcoregionsWorking Group, 1989). In CBM-CFS2, Ontario’sforested land is divided into four ecoclimatic regions:subarctic (SA); boreal BO; cool temperate (CT); andmoderate temperate (MT) (Fig. 2). The SA region hasno forest cover or biomass. The other three regionscontain 45 forest ecosystem types that have beenclassified using the criteria: land type class, produc-tivity, stocking, forest type, and site quality. Withineach ecoclimatic region, spatial boundaries are notdefined for these forest ecosystem types but their areais known. Forest ecosystem types are further split byage classes for C budget accounting. Each record inthe database represents a specific age class of a spe-cific ecosystem type within an ecoclimatic region, butthe exact location is not known.
3.4. Growth curves, disturbances, andsoil carbon dynamics
In CBM-CFS2, forest growth is described by agrowth curve (i.e. biomass over age) that identifies fourphases of stand development: regeneration, imma-ture, mature, and overmature (Kurz and Apps, 1999).Each phase is represented by a specific growth curvethat indicates the annual net accumulation of above-ground biomass. A pair of tree growth curves (oneeach for hardwoods and softwoods) describes eachecosystem type. Currently, 45 forest types with 90growth curves are used by CBM-CFS2 to presentaboveground biomass dynamics of forest ecosys-tems in Ontario. For each growth curve, the pa-rameters for each growth phase, and the rules fortransitions between growth phases, are derived fromthe NFBI. Growth rate is a dependent variable offorest age. Light, leaf area, tree species, and soilwater content variables are not included. Growth
240 C. Peng et al. / Ecological Indicators 1 (2002) 235–246
Fig. 2. Three spatial data levels for CBM-CFS2. SA: subarctic; BO: boreal; CT: cool temperate; MT: moderate temperate.
rates are derived from forest growth curves based onage.
For each softwood and hardwood component, forestbiomass is divided into six parts: foliage (A), branchand top (B), sub-merchantable (C), merchantable (D),fine roots (E), and coarse roots (F). Belowgroundbiomass, i.e. coarse and fine roots, is estimated forsoftwood and hardwood species using regressionequations developed byKurz et al. (1996b).
Disturbances play an important role in the devel-opment of Ontario’s forest stands because they areoften stand-replacing and thus, change overall forestage structure. The CBM-CFS2 model identifies seventypes of disturbances: forest fire, insect-induced standmortality, clear-cut logging, clear-cut logging withslash burning, salvage logging following fire, salvagelogging following insect-induced stand mortality, andpartial cutting. For each spatial unit and disturbancetype, a specific disturbance matrix has been assignedto calculate the proportion of each ecosystem C pooltransferred to the atmosphere, forest product sector,and to other pools (Kurz et al., 1992). The area af-fected by each disturbance and the year of disturbanceis input to the model. There is no feedback schemethat links forest biomass or age class with the extentand type of disturbance each year. The model uses a
set of predefined criteria to allocate disturbance areato ecosystem types and ages. After disturbance, theunaffected area keeps the same properties as before.The disturbed area switches to a new age class (usu-ally the beginning of regeneration). New records areformed in a new time step. If records are combined,the area-weighted C content of each pool is calculated.
The CBM-CFS2 model distinguishes four types ofsoil C pools: very fast, fast, medium, and slow. Thesesoil C pools receive input from processes such as lit-terfall, turnover, tree mortality, and disturbances. Thevery fast pool receives all foliage (A) and fine rootbiomass (E). The fast pool receives tree branch andtop biomass (B), sub-merchantable biomass (C) andcoarse roots (F). The medium pool receives all stem-wood biomass of merchantable trees (D). The slowpool represents humified organic matter and receivesits input by decomposition from the other three pools(Fig. 1). Each pool has a different decomposition ratecalculated from a base decomposition rate defined at10◦C and adjusted for the mean annual temperature ofeach spatial unit, assuming aQ10 of two (i.e. for every10◦C increase in temperature, decomposition ratesdouble) (Kurz and Apps, 1999). Since CBM-CFS2does not simulate the dynamics of forest peat C,associated estimates are excluded in this report.
C. Peng et al. / Ecological Indicators 1 (2002) 235–246 241
3.5. CBM-CFS2 simulation runs
The CBM-CFS2 simulation was retrospective backto the 1920s, so not only can we evaluate current Ccondition, but we can also get the trends over the past70 years. Input data were mainly based on the forestbiomass inventory database of 1985 (seeKurz et al.,1992; Kurz and Apps, 1995, 1999). For the entireOntario region, there are 45 forest types available.Two growth curves (hardwood and softwood) for eachforest type were parameterized based on inventorydata. Decomposition rates and disturbance matrixeswere derived from various data sources and publishedliterature (Kurz et al., 1992; Kurz and Apps, 1999).In this study, model simulations began in 1989 withsimulated initial ecosystem conditions that are theendpoint of the 70-year retrospective model run forthe period 1920–1989 (Kurz and Apps, 1995, 1999).The modelled distribution of forest age classes andthe biomass C and soil C pools are all affected by theforest dynamics of the 70-year period prior to 1990.Further details on the assumptions underlying theretrospective analysis can be found inKurz and Apps(1995, 1999).
4. Results and discussions
4.1. Quantifying temporal changes in NPP
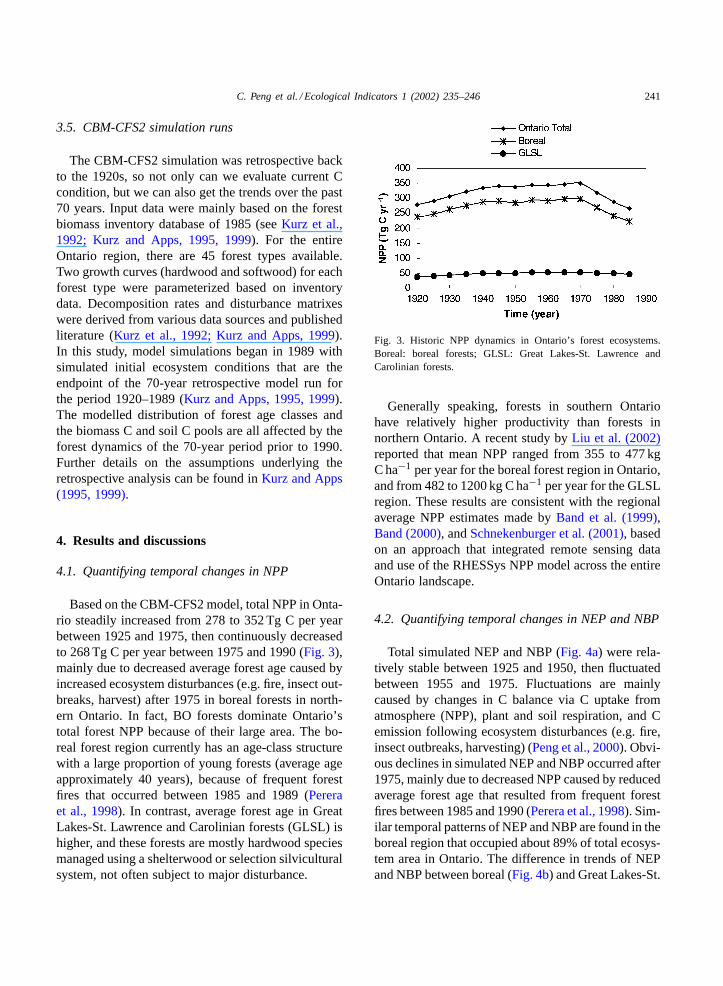
Based on the CBM-CFS2 model, total NPP in Onta-rio steadily increased from 278 to 352 Tg C per yearbetween 1925 and 1975, then continuously decreasedto 268 Tg C per year between 1975 and 1990 (Fig. 3),mainly due to decreased average forest age caused byincreased ecosystem disturbances (e.g. fire, insect out-breaks, harvest) after 1975 in boreal forests in north-ern Ontario. In fact, BO forests dominate Ontario’stotal forest NPP because of their large area. The bo-real forest region currently has an age-class structurewith a large proportion of young forests (average ageapproximately 40 years), because of frequent forestfires that occurred between 1985 and 1989 (Pereraet al., 1998). In contrast, average forest age in GreatLakes-St. Lawrence and Carolinian forests (GLSL) ishigher, and these forests are mostly hardwood speciesmanaged using a shelterwood or selection silviculturalsystem, not often subject to major disturbance.
Fig. 3. Historic NPP dynamics in Ontario’s forest ecosystems.Boreal: boreal forests; GLSL: Great Lakes-St. Lawrence andCarolinian forests.
Generally speaking, forests in southern Ontariohave relatively higher productivity than forests innorthern Ontario. A recent study byLiu et al. (2002)reported that mean NPP ranged from 355 to 477 kgC ha−1 per year for the boreal forest region in Ontario,and from 482 to 1200 kg C ha−1 per year for the GLSLregion. These results are consistent with the regionalaverage NPP estimates made byBand et al. (1999),Band (2000), andSchnekenburger et al. (2001), basedon an approach that integrated remote sensing dataand use of the RHESSys NPP model across the entireOntario landscape.
4.2. Quantifying temporal changes in NEP and NBP
Total simulated NEP and NBP (Fig. 4a) were rela-tively stable between 1925 and 1950, then fluctuatedbetween 1955 and 1975. Fluctuations are mainlycaused by changes in C balance via C uptake fromatmosphere (NPP), plant and soil respiration, and Cemission following ecosystem disturbances (e.g. fire,insect outbreaks, harvesting) (Peng et al., 2000). Obvi-ous declines in simulated NEP and NBP occurred after1975, mainly due to decreased NPP caused by reducedaverage forest age that resulted from frequent forestfires between 1985 and 1990 (Perera et al., 1998). Sim-ilar temporal patterns of NEP and NBP are found in theboreal region that occupied about 89% of total ecosys-tem area in Ontario. The difference in trends of NEPand NBP between boreal (Fig. 4b) and Great Lakes-St.

242 C. Peng et al. / Ecological Indicators 1 (2002) 235–246
Fig. 4. Carbon balances of Ontario’s forest ecosystems between1925 and 1990. (a) Provincial total; (b) boreal forest; (c) GreatLakes-St. Lawrence forest. NEP: net ecosystem forest; NBP: netbiome production.
Lawrence (Fig. 4c) regions are highly related to foresttypes, age class, and frequency of fire disturbances.In latter region, old hardwood forests (over 80 years)and less frequent forest fires, all of which affect Cbalances, account for these regional differences.
In addition, the relative young age (about 36 yearsold) of Ontario’s boreal forests as reported byLiuet al. (2002)indicates a great potential for C sequestra-tion and storage. Because decreases in the frequencyof stand-replacing disturbances and the subsequentincrease in the average age of immature forest standswill increase NEP, NBP, and C sequestration of theforest. The previous results (Liu et al., 2002) indi-cated that 1 Pg (1015 g) more C could be sequesteredwith a 10-year increase in forest age under a reduceddisturbance regime, suggesting that active forest pro-tection and management can enhance C sequestrationand storage in Ontario’s forest ecosystems.
4.3. Future challenges and research needs
4.3.1. ChallengesFuture climate change is likely to have large im-
pacts on Ontario’s forest ecosystem productivity and
net C balance during the 21st century. The Cana-dian general circulation model (GCM) predicts thata doubling of atmospheric CO2 concentration willincrease the mean air temperature of the growingseason in Ontario by 3–5◦C and change regionalprecipitation regimes (Boer et al., 1992). The largesttemperature increases are expected in northwesternOntario. Growing season precipitation is projectedto decrease by about 10–15% over northwestern andsouthern Ontario, but to increase by 10–20% in north-eastern Ontario. Changes in atmospheric CO2 con-centration, temperature and precipitation regimes willlikely affect the structure and function of Ontario’sforests through their influences on forest regeneration,growth, mortality, physiological processes (e.g. pho-tosynthesis, respiration) and ecological processes (e.g.the decomposition of soil organic materials) (Fig. 5).Such changes could result in northward shifts in thenatural range of forest types and species (Colomboet al., 1998; Parker et al., 2000). Furthermore, changesin temperature and precipitation, coupled with ahigher probability of hot, dry periods, are expectedto increase the frequency of natural disturbances (e.g.forest fires). Consequently, climate change would af-fect the dynamics of NPP, NEP, and NBP, changingC sinks–sources dynamics of Ontario’s forests.
Forest management practices affect the storage andcycling of C between forests and the atmosphere. Forexample, harvesting forest stands using practices thatminimize forest floor disturbance keeps soil tempera-tures lower and reduces the respiratory release of soilC. Also, protecting forests from fire, lengthening rota-tions, and using wood in longer-lived forest productsare related actions that increase the amount of storedC. A system of accounting for the amount of C storedin forests and wood products will enable Ontario toreport on and relate forest management and land usepractices to the net C balance of forested land (Penget al., 2000; Parker et al., 2000). Factors, includingclimate change, ecosystem disturbances, and forestmanagement will affect the sustainability of naturalecosystems, leading to an alteration of services thatthese ecosystems provide to humans (Fig. 5).
There are a number of ways to quantify forestecosystem productivity (NPP) and net C balance (NEPand NBP). Generally speaking, field measurement andmodel estimation are two widely used approaches.Field measurements (such as permanent sample plot

C. Peng et al. / Ecological Indicators 1 (2002) 235–246 243
Fig. 5. Potential effects of climate change, ecosystem disturbances, and forest management on forest sustainability in Ontario.
(PSP)) is to measure the net accumulation of standvolume or biomass at intervals of 1–5 years, or overthe total period since stand establishment. However,the information derived from PSP data or stand forestinventory record is typically limited to merchantabletimber and contains only measurements taken forstems larger that a minimum diameter at breast height.To date, no work has been done to synthesize plotsand stand measurements into province-wide spatialpatterns of NPP or NEP or NBP in a comprehensivemanner (Band, 2000). Only few investigations havebeen conducted to measure forest biomass for individ-ual tree species and estimated associated C budgetsfor forest stands (Morrison et al., 1993).
The most common bias of NPP, NEP, and NBP mea-surements and estimates comes from the assumption ofa steady state and the omission of age-related changesin forest NPP and net C balance. Most of the modelscurrently being used to simulate forest NPP and Cbalance represent the forest ecosystem as “stable” and“mature”, and do not account for the effects of distur-bance on species composition, structure and function.Assuming “steady state” may be erroneous, especiallyfor managed and younger forests. There are also afew potential sources of error associated with NPPmeasurements including: (1) the simple estimates offoliage production from leaf litterfall biomass; (2)exclusion of fine root and mycorrhizae productivity;
and (3) quantifying the loss of NPP from herbivoryin forests.
The values of our results are limited by:
• Inadequate validation of model output. SinceCBM-CFS2 is not a stand-level model, it cannotbe tested using site-specific or PSP data. Provincialor national scale data would be ideal for modelvalidation, but the cost of obtaining these data isprohibitive.
• The spatial resolution of CBM-CFS2 was coarse inOntario, that is only three spatial units are broadlyconsidered.
• Although CBM-CFS2 has a general framework anduses averaged parameters, making it suitable forcalculating C balance in Ontario, it includes onlylimited process-level simulation of the response offorest ecosystems to changes in global environment(Kurz and Apps, 1999). The current formulation ofCBM-CFS2 does not explicitly predict the effectsof changes in temperature, precipitation, atmo-spheric CO2 concentration or N deposition, onthe processes of growth and decomposition (Penget al., 2000). One of the challenges for futurework with CBM-CFS2 will be the representationof ecosystem processes by incorporating dynamicforest growth and C dynamic modules in a versionmodified for Ontario.

244 C. Peng et al. / Ecological Indicators 1 (2002) 235–246
4.3.2. Research needs and recommendationsThe NPP and net C balance of Ontario’s forests are
determined by a number of component processes of Cacquisition and C loss, and a small shift in the magni-tude of theses processes would have a large effect on Cbudgets. To increase our understanding of the mecha-nism and processes controlling C fluxes and balancesand improve our ability to predict the potential effectsof future changes in climate, land use (reforestation,afforestation, deforestation), and ecosystem distur-bances (e.g. fire, insect outbreaks, harvesting), somefurther research is required. Priorities include:
• Developing and testing process-based forest growthand C dynamic models to predict the spatial pat-terns and dynamics of NPP and net C balanceacross Ontario’s landscape to track historical andfuture changes in C stocks in relation to climate,reforestation, afforestation, deforestation, forestecosystem disturbances, and forest products.
• Developing new field measurement techniques(such as eddy covariance—Ontario Flux Station)(Margolis, 2001), improving spatial resolution, andincorporating new local and provincial databases.
• Enhancing Ontario’s existing forest growth andyield program by including measurements of NPP,NEP, and NBP for different age classes and foresttypes.
• Assessing the sensitivity of NPP and C balance tochanges in species composition and forest structurefollowing disturbance (e.g. fire, harvesting, insectand disease infestations).
5. Conclusions
Developing criteria and indicators for SFM is animportant step towards meeting the forestry com-mitment made at the United Nations Conference onEnvironment and Development (UNCED, 1992). TheIPCC (IPCC, 2000) and Kyoto Protocol offer a ma-jor boost for developing forest C related indicators.Ontario is developing a set of provincial-level criteriaand indicators of SFM for meeting both domesticand provincial needs (CCFM, 1997; OMNR, 2001).The criteria and indicators are intended to: (1) clarifywhat constitutes SFM and provide a framework fordescribing and assessing process at a provincial level;
(2) provide a reference point for developing policiesfor the conservation, management, and sustainabledevelopment of Ontario forests; and (3) improve theforest related information available to the public anddecision-makers. As an example of a case study inOntario, this paper made estimates of three inter-related ecological indicators using the CBM-CFS2model, forest inventory data, and disturbance records.Results suggest that total NPP of Ontario’s forestecosystems increased from 1925 to 1975 and thendecreased between 1975 and 1990; Ontario’s for-est ecosystems acted as a C sink between 1920 and1980, and a C source from 1981 to 1990, mainly dueto decreased average forest age and NPP caused byincreased ecosystem disturbance (e.g. fire, insect anddisease infestations, harvesting) since 1975. Currentestimates from this analysis suggest that there is sig-nificant potential for Ontario’s forests to function asC sinks by reducing ecosystem disturbances and in-creasing growth and storage of C in the young foreststhroughout the province. This type of critical infor-mation will help forest resource managers to make in-formed decisions about the sustainability of Ontario’sforest ecosystems in an increasingly complex andrapidly changing environment in the 21st century.
Acknowledgements
This paper was presented at the Criteria & Indi-cators Workshop of Ontario’s SFM Program (Nov.2000, Sault Ste. Marie). We thank L. Buse for valu-able comments on the manuscript. This work wassupported by the Network Center of Excellence forSFM (NCE-SFM), University of Alberta, The LakeAbitibi Model Forest (Ontario), and Ontario’s ClimateChange Program through Postdoctoral Fellowshipsfrom Lakehead University to J.X. Liu and X. L. Zhou.Development of CBM-CFS2 was funded by the En-ergy from the Forest (ENFOR) program of the FederalPanel on Energy Research and Development (PERD).
References
Anderson, V., 1991. Alternative Economic Instruments. Routledge& Kegan Paul, London.
Apps, M.J., Kurz, W.A., Beukema, S.J., Bhatti, J.S., 1999. Carbonbudget of the Canadian forest product sector. Environ. Sci. Pol.2, 25–41.

C. Peng et al. / Ecological Indicators 1 (2002) 235–246 245
Band, L.E., 2000. Forest ecosystem productivity in Ontario. In:Perera, A.H., Euler, D.L., Thompson, I.D. (Eds.), Ecologyof Managed Terrestrial Landscape: Patterns and Processes ofForest Landscapes in Ontario. UBC Press, Vancouver, BC,pp. 163–177.
Band, L.E., Perera, A.H., Baker, J.A., 1999. Deriving an eco-regional framework for Ontario through large-scale estimatesof net primary productivity. Ont. Min. Nat. Resour., Ont. For.Res. Inst., Sault Ste Marie, ON. For. Res. Rep. No. 149.
Boer, G.J., McFarlane, N.A., Lazare, M., 1992. Greenhouse gasinduced climate change simulated with the CCC second-generation general circulation model. J. Clim. 5, 1045–1077.
Bonnor, G.M., 1985. Inventory of forest biomass in Canada. Can.For. Serv., Petawawa National For. Inst., Chalk River, ON.
Bossel, H., 1996. Deriving indicators of sustainable development.Environ. Model. Assess. 1, 193–218.
Candau, J.N., Fleming, R.A., Hopkin, A.A., 1998. Spatio-temporalpatterns of large-scale defoliation caused by the sprucebudworm in Ontario since 1941. Can. J. For. Res. 28, 1–9.
CCFM (Canadian Council of Forest Ministers), 1992. Sustainableforests: a Canadian commitment. Ottawa, ON, p. 51.
CCFM (Canadian Council of Forest Ministers), 1995. Definingsustainable forest management: a Canadian approach to criteriaand indicators, Nat. Resour. Can., Can. For. Serv., Ottawa,Canada, p. 22.
CCFM (Canadian Council of Forest Ministers), 1997. Criteria andindicators of sustainable forest management in Canada. Nat.Resour. Can., Can. For. Serv., Ottawa, ON, p. 47.
Cocklin, C.R., 1989. Methodological problems in evaluatingsustainability. Environ. Conserv. 16, 343–351.
Colombo, S.J., Cherry, M.L., Graham, C., Greifenhagen, S.,McAlpine, R.S., Papadopol, C.S., Parker, W.C., Scarr, T.,Ter-Mikaelian, M.T., 1998. The impacts of climate change onOntario’s forests. Ont. Min. Nat. Resour., Ont. For. Res. Instit.,For. Res. Info. Pap. No. 143, p. 50.
Dixon, R.K., Brown, S., Houghton, R.A., Solomon, A.M., Trexler,M.C., Wisniewski, J., 1994. Carbon pool and flux of globalforest ecosystems. Science 263, 185–190.
Ecoregions Working Group, 1989. Ecoclimatic regions of Canada,first approximation. Ecoregions Working Group of CanadaCommittee on Ecological Land Classification, Ecological LandClassification Series, No. 23, Sustainable Development Branch,Can. Wildl. Serv., Conservation and Protection, Environ. Can.Ottawa, ON, 119 pp. and map at 1:7,500,000.
Flanningan, M.D., Weber, M.G., 2000. Influences of climate onOntario forests. In: Perera, A.H., Euler, D.L., Thompson, I.D.(Eds.), Ecology of a Managed Terrestrial Landscope: Patternsand Processes of Forest Landscapes in Ontario. UBC Press,Vancouver, BC, pp. 103–114.
Fleming, R.A., Hopkin, A.A., Candua, J.N., 2000. Insect anddisease disturbance regimes in Ontario’s forests. In: Perera,A,H., Euler, D.L., Thompson, I.D. (Eds.), Ecology of aManaged Terrestrial Landscope: Patterns and Processes ofForest Landscapes in Ontario, UBC Press, Vancouver, BC,pp. 141–162.
Greenough, J.A., Apps, M.J., Kurz, W.A., 1997. Influence ofmethodology and assumptions on reported national carbon flux
inventories: an illustration from the Canadian forest sector.Mitigat. Adapt. Strat. Global Change 2, 267–283.
HMSO, 1994. Sustainable development: The UK Strategy. HMSO,London.
IGBP Working Group, 1998. The terrestrial carbon cycles:implications for the Kyoto protocol. Science 280, 1393–1394.
IPCC (Intergovernmental Panel on Climate Change), 2000. In:Watson, R.T., Nobel, I.R., Bolin, B. (Eds.), Land use, Land-usechange, and Forestry. IPCC Special Report. CambridgeUniversity Press, Cambridge New York.
Kimmins, J.P., 1997. Forest Ecology: A Foundation for SustainableManagement, 2nd Edition. Prentice-Hall, Englewood Cliffs, NJ,p. 44.
Kurz, W.A., Apps, M.J., 1995. An analysis of future carbon budgetsof Canadian boreal forests. Water, Air, Soil Pollut. 82, 321–332.
Kurz, W.A., Apps, M.J., 1996. Retrospective assessment of carbonflows in Canadian boreal forests. In: Apps, M.J., Price, D.T.(Eds.), Forest Ecosystems, Forest Management and the GlobalCarbon Cycle, NATO ASI Ser. Part 1. Global EnvironmentalChange, Vol. 40. Springer-Verlag, Heidelberg, pp. 173–182.
Kurz, W.A., Apps, M.J., 1999. A 70-year retrospective analysisof carbon fluxes in the Canadian forest sector. Ecol. Appl. 9,526–547.
Kurz, W.A., Apps, M.J., Comeau, P.G., Trofymow, J.A., 1996a.The carbon budget of British Columbia’s forests, 1920–1989:Preliminary analysis and recommendations for refinements.Can. For. Serv. Pac., For. Cent. BC Min., For. Res. Branch,Victoria, BC. FRDA Rep. 261, p. 62.
Kurz W.A., Apps, M.J., Webb, T., MacNamee, P., 1992. The carbonbudget of the Canadian forest sector: Phase 1. For. CanadaNorthw. Reg., Edmonton, AB, ENFOR Inf. Rep. NOR-X-326,p. 93.
Kurz, W.A., Beukema, S.J., Apps, M.J., 1996b. Estimation of rootbiomass and dynamics for the carbon budget model of theCanadian forest sector. Can. J. For. Res. 26, 1973–1979.
Kurz, W.A., Beukema, S.J., Apps, M.J., 1998. Carbon budgetimplications of the transition from natural to manageddisturbance regimes in forest landscapes. Mitigat. Adapt. Strat.Global Change 2, 405–421.
Landsberg, J.J., Gower, S.T., 1997. Application of PhysiologicalEcology to Forest Management. Academic Press, New York,p. 354.
Li, C., 2000. Fire regimes and their simulation with referenceto Ontario. In: Perera, A.H., Euler, D.L., Thompson, I.D.(Eds.), Ecology of a Managed Terrestrial Landscape: Patternsand Processes of Forest Landscapes in Ontario, UBC Press,Vancouver, BC, pp. 115–140.
Liu, J.X., Peng, C.H., Apps, M.J., Dang, Q.L., Banfield, E.,Kurz, W.A., 2002. Historic carbon budget of Ontario’s forestecosystems. For. Ecol. Manag., in press.
Margolis, H., 2001. Fluxnet-Canada: understanding the impactsof climate, disturbance and management on carbon cyclingprocesses in forest and peatland ecosystems. Project Proposal(draft).
Melillo, J.M., McGuire, A.D., Kicklighter, D.W., Moore III, B.,Vorosmarty, C.J., Schloss, A.L., 1993. Global climate changeand terrestrial net primary production. Nature 363, 234–240.

246 C. Peng et al. / Ecological Indicators 1 (2002) 235–246
Morris, D.M., Kimmins, J.P., Duckert, D.R., 1997. The use ofsoil organic matter as a criterion of the relative sustainabilityof forest management alternatives: a modelling approach usingFORECAST. For. Ecol. Manage. 94, 61–78.
Morrison, I.K., Foster, N.W., Hazlett, P.W., 1993. Carbon reserves,carbon cycling, and harvesting effects in three mature foreststypes in Canada. NZJ For. Sci. 23, 403–412.
OMNR (Ontario Ministry of Natural Resources), 2001. Criteriaand indicators of sustainable forest management in Ontario(Draft), Ont. Min. Nat. Resour., Sault Ste Marie, ON.
Parker, W.C., Colombo, S.J., Cherry, M.L., Flannigan, M.D.,Greifenhagen, S., McAlpine, R.S., Papadopol, C.S., Scarr, T.,2000. Third millennium forestry: what climate change mightmean to forests and forest management in Ontario. For. Chron.76, 445–463.
Peng, C.H., Apps, M.J., 1998. Simulating carbon dynamicsalong the boreal forest transect case study (BFTCS) in theCentral Canada. Part II. Sensitivity to climate change. GlobalBiogeochem. Cycles 12, 393–402.
Peng, C.H., Apps, M.J., 1999. Modelling response of net primaryproductivity (NPP) of boreal forest ecosystems to changesin climate and fire disturbance regimes. Ecol. Model. 122,175–193.
Peng, C.H., Apps, M.J., Halliwell, D., 1998a. Development ofecologically-based indicators for sustainable forest managementin Canada. In: Qin, D.H. (Ed.), Exploration of SustainableDevelopment Strategy. China Environmental Science Press,Beijing, pp. 149–157.
Peng, C.H., Apps, M.J., Price, D.T., Nalder, I.A., Halliwell, D.,1998b. Simulating carbon dynamics along the boreal foresttransect case study (BFTCS) in the Central Canada: I Modelvalidation. Global Biogeochem. Cycles 12, 381–392.
Peng, C.H., Liu, J.X., Apps, M.J., Dang, Q.L., Kurz, W., 2000.Quantifying Ontario’s forest carbon budget I. Carbon stocksand fluxes of forest ecosystems in 1990. Ont. Min. Nat. Resour.,Ont. For. Res. Instit., Sault Ste Marie, ON, For. Res. Rep. No.158, p. 20.
Perera, A.H., Baldwin, D.J.B., Schnekenburger, F., Osborne, J.E.,Bae, R.E., 1998. Forest fires in Ontario: a spatio-temporalperspective. Ont. Min. Nat. Resour., Ont. For. Res. Inst., For.Res. Rep. No. 147, p. 25.
Perera, A.H., Euler, D.L., Thompson, I.D. (Eds.), 2000. Ecologyof a Managed Terrestrial Landscope: Patterns and Processesof Forest Landscapes in Ontario. UBC Press, Vancouver, BC,p. 336.
Price, D.T., Halliwell, D.H., Apps, M.J., Kurz, W.A., Curry, S.R.,1997. Comprehensive assessment of carbon stocks and fluxesin a boreal forest management unit. Can. J. For. Res. 27,2005–2016.
Price, D.T., Marir, R.M., Kurz, W.A., Apps, M.J., 1996. Effectsof forest management, harvesting and wood processing onecosystem carbon dynamics: a boreal case study. In: Apps,M.J., Price, D.T. (Eds.), Forest Ecosystems, Forest Managementand the Global Carbon Cycle, NATO ASI Ser. 1: GlobalEnvironmental Change, Vol. 40. Springer-Verlag, Heidelberg,pp. 279–292.
Schnekenburger, F., Perera, A.H., Ferko, C., 2001. Estimating netprimary productivity of Ontario at a sub-regional scale. For.Chron. (review).
The Montreal Process, 1997. Progress on implementation of theMontreal process on criteria and indicators for the conservationand sustainable management of temperate and boreal forests.Nat. Resour. Canada, Can. For. Serv., Ottawa, Progr. Rep.,p. 38.
UNCED (United Nations Conference on Environment andDevelopment), 1992. Agenda 21, United Nations, New York.
Vitousek, P.M., Ehrlich, P.R., Ehrlich, A.H., Matson, P.A.,1986. Human appropriation of the products of photosynthesis.BioScience 36, 368–373.
Wardoyo, W., Jordan, G.A., 1996. Measuring and assessingmanagement of forested landscapes. For. Chron. 72, 639–645.
WCED (World Commission on Environment and Development),1987. Our Common Future. Oxford University Press,New York.