Identifying practical indicators of biodiversity for stand-level management of plantation forests
25
ORIGINAL PAPER Identifying practical indicators of biodiversity for stand-level management of plantation forests George F. Smith Tom Gittings Mark Wilson Laura French Anne Oxbrough Saoirse O’Donoghue John O’Halloran Daniel L. Kelly Fraser J. G. Mitchell Tom Kelly Susan Iremonger Anne-Marie McKee Paul Giller Received: 17 October 2006 / Accepted: 23 October 2007 / Published online: 20 November 2007 Ó Springer Science+Business Media B.V. 2007 Abstract Identification of valid indicators of biodiversity is a critical need for sustainable forest management. We developed compositional, structural and functional indicators of biodiversity for five taxonomic groups—bryophytes, vascular plants, spiders, hoverflies and birds—using data from 44 Sitka spruce (Picea sitchensis) and ash (Fraxinus excelsior) plantation forests in Ireland. The best structural biodiversity indicator was stand stage, defined using a multivariate classification of forest structure variables. However, biodi- versity trends over the forest cycle and between tree species differ among the taxonomic groups studied. Canopy cover was the main structural indicator and affected other struc- tural variables such as cover of lower vegetation layers. Other structural indicators included deadwood and distances to forest edge and to broadleaved woodland. Functional indicators included stand age, site environmental characteristics and management prac- tices. Compositional indicators were limited to more easily identifiable plant and bird species. Our results suggest that the biodiversity of any one of the species groups we surveyed cannot act as a surrogate for all of the other species groups. However, certain subgroups, such as forest bryophytes and saproxylic hoverflies, may be able to act as surrogates for each other. The indicators we have identified should be used together to identify stands of potentially high biodiversity or to evaluate the biodiversity effects of silvicultural management practices. They are readily assessed by non-specialists, ecolog- ically meaningful and applicable over a broad area with similar climate conditions and silvicultural systems. The approach we have used to develop biodiversity indicators, G. F. Smith L. French S. O’Donoghue D. L. Kelly F. J. G. Mitchell S. Iremonger A.-M. McKee BIOFOREST Project, Department of Botany, Trinity College Dublin, Dublin, Ireland T. Gittings M. Wilson A. Oxbrough J. O’Halloran T. Kelly P. Giller BIOFOREST Project, Department of Zoology, Ecology and Plant Science, University College Cork, Cork, Ireland Present Address: G. F. Smith (&) Atkins, 150–155 Airside Business Park, Swords, Co. Dublin, Ireland e-mail: [email protected] 123 Biodivers Conserv (2008) 17:991–1015 DOI 10.1007/s10531-007-9274-3
Transcript of Identifying practical indicators of biodiversity for stand-level management of plantation forests
ORI GIN AL PA PER
Identifying practical indicators of biodiversityfor stand-level management of plantation forests
George F. Smith Æ Tom Gittings Æ Mark Wilson Æ Laura French ÆAnne Oxbrough Æ Saoirse O’Donoghue Æ John O’Halloran Æ Daniel L. Kelly ÆFraser J. G. Mitchell Æ Tom Kelly Æ Susan Iremonger Æ Anne-Marie McKee ÆPaul Giller
Received: 17 October 2006 / Accepted: 23 October 2007 / Published online: 20 November 2007� Springer Science+Business Media B.V. 2007
Abstract Identification of valid indicators of biodiversity is a critical need for sustainable
forest management. We developed compositional, structural and functional indicators of
biodiversity for five taxonomic groups—bryophytes, vascular plants, spiders, hoverflies
and birds—using data from 44 Sitka spruce (Picea sitchensis) and ash (Fraxinus excelsior)
plantation forests in Ireland. The best structural biodiversity indicator was stand stage,
defined using a multivariate classification of forest structure variables. However, biodi-
versity trends over the forest cycle and between tree species differ among the taxonomic
groups studied. Canopy cover was the main structural indicator and affected other struc-
tural variables such as cover of lower vegetation layers. Other structural indicators
included deadwood and distances to forest edge and to broadleaved woodland. Functional
indicators included stand age, site environmental characteristics and management prac-
tices. Compositional indicators were limited to more easily identifiable plant and bird
species. Our results suggest that the biodiversity of any one of the species groups we
surveyed cannot act as a surrogate for all of the other species groups. However, certain
subgroups, such as forest bryophytes and saproxylic hoverflies, may be able to act as
surrogates for each other. The indicators we have identified should be used together to
identify stands of potentially high biodiversity or to evaluate the biodiversity effects of
silvicultural management practices. They are readily assessed by non-specialists, ecolog-
ically meaningful and applicable over a broad area with similar climate conditions and
silvicultural systems. The approach we have used to develop biodiversity indicators,
G. F. Smith � L. French � S. O’Donoghue � D. L. Kelly � F. J. G. Mitchell � S. Iremonger �A.-M. McKeeBIOFOREST Project, Department of Botany, Trinity College Dublin, Dublin, Ireland
T. Gittings � M. Wilson � A. Oxbrough � J. O’Halloran � T. Kelly � P. GillerBIOFOREST Project, Department of Zoology, Ecology and Plant Science, University College Cork,Cork, Ireland
Present Address:G. F. Smith (&)Atkins, 150–155 Airside Business Park, Swords, Co. Dublin, Irelande-mail: [email protected]
123
Biodivers Conserv (2008) 17:991–1015DOI 10.1007/s10531-007-9274-3
including stand structural types, is widely relevant and can enhance sustainable forest
management of plantations.
Keywords Biodiversity � Forest management � Indicator � Plantation �Species richness � Stand structure � Sustainable forest management
AbbreviationsCWD Coarse woody debris
Dbh Diameter at breast height (1.3 m)
GPS Geographical positioning system
IndVal Indicator value
NMS Non-metric multidimensional scaling
PCA Principal components analysis
Se Standard error
SR Species richness
Introduction
Comprehensive biodiversity inventories of natural forests are virtually impossible to
undertake because of the time and effort involved (Lawton et al. 1998). Similarly, the
resources necessary to complete biodiversity inventories of plantation forests are not
usually available, despite the often simplified nature of plantation ecosystems. Therefore,
biodiversity assessment and management in plantation forests must rely on the use of
biodiversity indicators (Lindenmayer 1999; Noss 1999; Lindenmayer et al. 2000; Larsson
2001). Despite the clear need, however, most indicators that have been published or exist
in the ‘grey’ literature are the product of conventional wisdom and lack scientific vali-
dation (Noss 1999; Lindenmayer et al. 2006).
In order for indicators to be practical for sustainable forest management, it is important
that they are repeatable, cost-effective, ecologically meaningful and easy to assess, par-
ticularly by forest managers or other non-ecologists (Ferris and Humphrey 1999).
Indicators can be used by forest managers to assess the effect of site management on
biodiversity or to identify sites that potentially are of high biodiversity value, in order to
comply with national forest standards (e.g. Forest Service 2000b, c; Forestry Commission
2004) or the requirements of forestry grant schemes (e.g. Forest Service 2000a, 2006). In
sites where few indicators are present, management can be reviewed and improved. Forest
stands identified as being of potentially high biodiversity can be surveyed and assessed
more thoroughly, and management for biodiversity can be prioritised in forest planning and
operations. Forest biodiversity indicators can be developed at the regional or landscape
scales for use in forest planning, but stand-scale indicators may be the most practical, as
most management operations are carried out at this level (Simila et al. 2006).
At the level of the forest stand, compositional indicators can be particular species or
species groups (Noss 1990). The universality and applicability of surrogacy relationships
among species groups—where the diversity of one group reflects diversity in another,
unrelated group—are the focus of much recent conservation biology research, with mixed
results (e.g. Howard et al. 1998; Vessby et al. 2002; Sætersdal et al. 2003; Anand et al. 2005;
992 Biodivers Conserv (2008) 17:991–1015
123
Oertli et al. 2005; Williams et al. 2006; Simila et al. 2006). Important elements of forest
structure that may serve as structural indicators include tree size, vertical foliage distribution,
horizontal canopy distribution and density and abundance of deadwood (Noss 1990; Spies
1998). Functional indicators can include processes such as productivity, nutrient cycling
rates, disturbance regime and management practices (Noss 1990).
Aspects of stand structure have the potential to be particularly useful biodiversity
indicators, especially as structure is the product of site environment and management and
directly affects biodiversity and ecosystem function (Spies 1998). Comparison of managed
forests and old, natural forests has found that managed forests often lack old-growth
features, such as large trees, vertical heterogeneity, diverse tree species assemblages and
large-diameter dead wood, that may be important for promoting biodiversity (Halpern and
Spies 1995; Hodge and Peterken 1998; Humphrey 2005). Accordingly, many studies of
forest biodiversity have paid special attention to stand structure (e.g. Pitkanen 1997;
Humphrey et al. 1999, 2002; Ferris et al. 2000). However, quantification of stand structure
can be difficult due to its multivariate nature (McElhinny et al. 2005).
In this paper, we develop potential indicators for biodiversity of five groups of plants
and animals in plantation forests. These indicators can be used by non-specialists as tools
to assess the effectiveness of current management practices in maintaining forest biodi-
versity and/or to identify stands or forests of potentially high biodiversity value. We pay
particular attention to stand structure by developing a forest stand structure classification
and assessing how changes in stand structure are reflected by changes in biodiversity.
Methods
Species groups
This study was part of a larger research programme on biodiversity in commercial forestry
plantations in Ireland (O’Halloran et al. 2004; Smith et al. 2005; Iremonger et al. 2007).
We were not able to survey all taxonomic groups present in plantation forests, and thus we
focused our efforts on five groups: bryophytes, vascular plants, spiders, hoverflies (Diptera:
Syrphidae) and birds. These groups vary in mobility and the scales at which forest envi-
ronment and management are likely to affect their diversity. The ecology and taxonomy of
these groups are well-known. Forest understorey vegetation provides food and structural
diversity that can be exploited by dependent fauna. Vascular plants in particular are a well-
known group in Ireland and have been used as surrogates for total biodiversity in other
countries (Ferris and Humphrey 1999; Niemi and McDonald 2004). Bryophytes are an
important component of native forest flora, and in oceanic regions attain levels of diversity
comparable with higher plants (Kelly 1981, 2005). Spiders represent an intermediate
trophic level, and because of their relatively small ranges, they are responsive to changes at
the stand and smaller scales (Niemela et al. 1996). Hoverflies are quite mobile and are
therefore more sensitive to conditions at larger scales than spiders. They are a diverse
group in terms of trophic and habitat requirements and have been used as indicators of
disturbance or habitat quality (Sommagio 1999). Birds range over wider areas than
members of any of the other taxa, and are therefore affected by environmental variation at
the plantation and landscape scales (Pithon et al. 2005). Species assemblages present in the
sites surveyed are analysed in more detail in related work (French et al. in press; Oxbrough
et al. 2005; Smith et al. 2005; Wilson et al. 2006).
Biodivers Conserv (2008) 17:991–1015 993
123
Study design
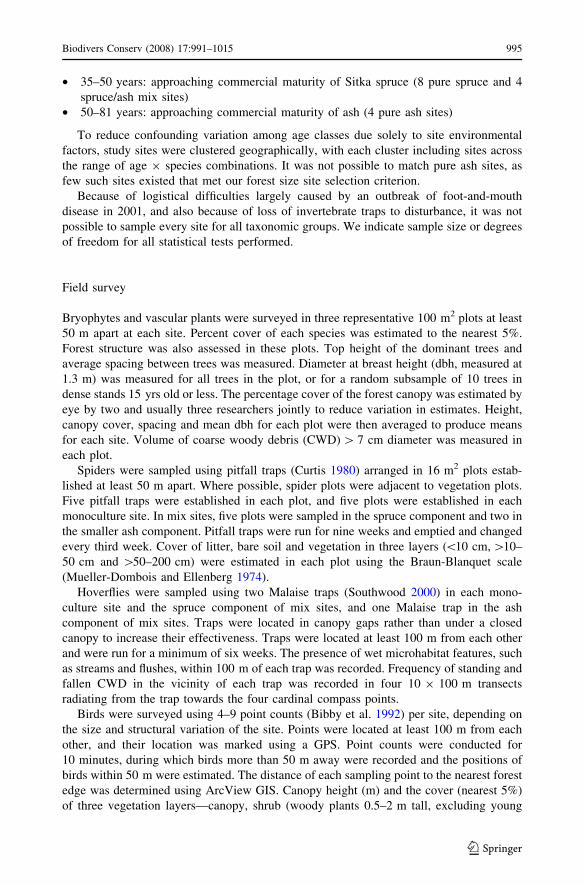
The study sites were in 44 plantation forests distributed across the Republic of Ireland
(Fig. 1). In 12 sites, ash (Fraxinus excelsior) stands were sampled, and in 20 sites, Sitka
spruce (Picea sitchensis) stands were sampled. In the remaining 12 sites, both ash and
Sitka spruce stands were present in a non-intimate mix. These two species were chosen
as the most commonly planted native broadleaf and the most commonly planted exotic
conifer in Ireland. Each forest was in its first rotation and was at least 4 ha in area. The
forests ranged in age from 5 yr to 81 yr at the time of surveying. The majority of the
study sites are owned by Coillte Teoranta, the semi-state forestry company, and only a
few of the youngest forests were privately owned. Sites were surveyed in 2001 and
2002.
We employed a chronosequence approach where we sampled different sites at different
stages of maturity. We selected age classes that would represent the major structural
changes that take place over the course of a commercial rotation:
• 5 years: prior to canopy closure (4 pure spruce, 4 pure ash and 4 spruce/ash mix sites)
• 8–15 years: canopy closure phase (4 pure spruce, 4 pure ash and 4 spruce/ash mix sites)
• 20–30 years: mid-rotation, beginning of thinning operations (4 pure spruce sites)
Fig. 1 Location of the 44 forests surveyed
994 Biodivers Conserv (2008) 17:991–1015
123
• 35–50 years: approaching commercial maturity of Sitka spruce (8 pure spruce and 4
spruce/ash mix sites)
• 50–81 years: approaching commercial maturity of ash (4 pure ash sites)
To reduce confounding variation among age classes due solely to site environmental
factors, study sites were clustered geographically, with each cluster including sites across
the range of age 9 species combinations. It was not possible to match pure ash sites, as
few such sites existed that met our forest size site selection criterion.
Because of logistical difficulties largely caused by an outbreak of foot-and-mouth
disease in 2001, and also because of loss of invertebrate traps to disturbance, it was not
possible to sample every site for all taxonomic groups. We indicate sample size or degrees
of freedom for all statistical tests performed.
Field survey
Bryophytes and vascular plants were surveyed in three representative 100 m2 plots at least
50 m apart at each site. Percent cover of each species was estimated to the nearest 5%.
Forest structure was also assessed in these plots. Top height of the dominant trees and
average spacing between trees was measured. Diameter at breast height (dbh, measured at
1.3 m) was measured for all trees in the plot, or for a random subsample of 10 trees in
dense stands 15 yrs old or less. The percentage cover of the forest canopy was estimated by
eye by two and usually three researchers jointly to reduce variation in estimates. Height,
canopy cover, spacing and mean dbh for each plot were then averaged to produce means
for each site. Volume of coarse woody debris (CWD) [ 7 cm diameter was measured in
each plot.
Spiders were sampled using pitfall traps (Curtis 1980) arranged in 16 m2 plots estab-
lished at least 50 m apart. Where possible, spider plots were adjacent to vegetation plots.
Five pitfall traps were established in each plot, and five plots were established in each
monoculture site. In mix sites, five plots were sampled in the spruce component and two in
the smaller ash component. Pitfall traps were run for nine weeks and emptied and changed
every third week. Cover of litter, bare soil and vegetation in three layers (\10 cm, [10–
50 cm and [50–200 cm) were estimated in each plot using the Braun-Blanquet scale
(Mueller-Dombois and Ellenberg 1974).
Hoverflies were sampled using two Malaise traps (Southwood 2000) in each mono-
culture site and the spruce component of mix sites, and one Malaise trap in the ash
component of mix sites. Traps were located in canopy gaps rather than under a closed
canopy to increase their effectiveness. Traps were located at least 100 m from each other
and were run for a minimum of six weeks. The presence of wet microhabitat features, such
as streams and flushes, within 100 m of each trap was recorded. Frequency of standing and
fallen CWD in the vicinity of each trap was recorded in four 10 9 100 m transects
radiating from the trap towards the four cardinal compass points.
Birds were surveyed using 4–9 point counts (Bibby et al. 1992) per site, depending on
the size and structural variation of the site. Points were located at least 100 m from each
other, and their location was marked using a GPS. Point counts were conducted for
10 minutes, during which birds more than 50 m away were recorded and the positions of
birds within 50 m were estimated. The distance of each sampling point to the nearest forest
edge was determined using ArcView GIS. Canopy height (m) and the cover (nearest 5%)
of three vegetation layers—canopy, shrub (woody plants 0.5–2 m tall, excluding young
Biodivers Conserv (2008) 17:991–1015 995
123
planted trees) and field/ground layer (non-woody vascular plants and bryophytes)—were
recorded within 30 m of each point.
Soil samples were collected in each 100 m2 vegetation plot; subsamples were taken
from the four corners and then bulked. The pH of field-moist soils was measured using a
pH meter with a glass electrode on a soil:distilled water (1:2) suspension. The soils were
then air-dried and sieved prior to further chemical and physical analyses. Available P was
extracted using Morgan’s reagent and quantified by a colorimetric method using a spec-
trophotometer (Allen et al. 1986). Further environmental data, such as elevation, were
collected at the sampling unit or site level, as appropriate. Distance from the site to the
nearest old woodland and the area of old woodland within 1 km were determined using
1:10,560 Ordnance Survey maps published from 1900 to 1915. Management information
was obtained from the Coillte inventory and forest managers.
For further details on survey methodology, see French et al. (in press) for vegetation,
Oxbrough et al. (2005) for spiders, Wilson et al. (2006) for birds and Smith et al. (2005)
for all taxonomic groups, environmental and management data and overall study design.
Nomenclature follows Smith (2004) for mosses, Stace (1997) for vascular plants and
Beaman (1994) for birds.
Data analysis
Stand structural types
Preliminary analyses of stand structural variables, such as canopy cover and tree size,
showed high variability within a given age class. Forest age is only one of many factors
that affect stand structure. Other factors include environmental parameters, such as climate
and soil fertility, and management factors, such as thinning regime. Although stand age per
se can influence biodiversity, particularly through the operation of dispersal and coloni-
sation mechanisms, changes in stand structure in plantation forestry may have a stronger
affect on biodiversity through modification of the below-canopy environment. Accord-
ingly, many studies of forest biodiversity focus on stand structure rather than stand age
(e.g. Pitkanen 1997; Humphrey et al. 1999, 2002; Ferris et al. 2000).
To improve our investigations of biodiversity and structural changes over the forest
cycle, we developed a small number of stand structural types to summarise the structural
characteristics of our study sites. Separate analyses of forest structure were conducted for
each tree species (ash or Sitka spruce) using data from the vegetation plots. PCA ordination
using covariance matrices was conducted on site means of canopy cover, tree height, dbh
and spacing. Percent variation explained by individual axes was calculated by dividing the
eigenvalue of each axis by the sum of all eigenvalues. Sites were assigned to structural
stages using Ward’s hierarchical clustering (Legendre and Legendre 1998). All variables
were transformed to a 0–1 scale by ranging (Sneath and Sokal 1973) prior to analysis to
place them on equivalent scales. Ordinations were performed using PC-Ord (McCune and
Mefford 1997).
Biodiversity measures
Species richness of each of the taxonomic groups was calculated at the sample unit and site
levels. We focus on species richness as our primary measure of biodiversity, as this is the most
996 Biodivers Conserv (2008) 17:991–1015
123

basic and universal method (Gaston 1996; Magurran 2004). However, total species richness
does not indicate whether the species involved are of conservation significance and will also
underestimate the conservation value of important but naturally species-poor habitats. To
address this issue, we have analysed species richness of various subgroups: species charac-
teristic of forest in Ireland (calculated separately for bryophytes, vascular plants, spiders,
hoverflies and birds); hoverflies dependent on deadwood (saproxylic species), wet substrates,
ground debris or semi-natural habitats (anthropophobic species: Speight and Castella 2001);
and ground-nesting and cavity-nesting birds. Species characteristic of native woodland in
Ireland will be referred to as ‘forest species’, although they may not be typical forest species
elsewhere. Plantation forests may have an important role in providing habitat for forest
species in regions where semi-natural forests are rare, as is the case in Ireland where less than
1% of the island is occupied by semi-natural forest (Cross 1998).
Species assemblages were identified using non-metric multidimensional scaling ordina-
tion (NMS) and flexible-beta clustering (Legendre and Legendre 1998). The results of these
analyses will be briefly referred to, but space precludes a complete presentation of the
analysis and results. For further details, see French et al. (in press) for vegetation, Oxbrough
et al. (2005) for spiders, Wilson et al. (2006) for birds and Smith et al. (2005) for all
taxonomic groups. Indicator species of vegetation cluster groups were identified using
indicator species analysis (Dufrene and Legendre 1997). The method assesses the constancy
and fidelity of species to defined assemblages and produces an indicator value score (IndVal)
ranging from 0 to 100 which can be validated using Monte Carlo tests. Ordinations and
indicator species analysis were performed using PC-Ord (McCune and Mefford 1997).
Indicators
Changes in species richness over forest structural stages were compared for the five tax-
onomic groups and the five forest species subgroups. Relationships between potential
indicators and species richness were analysed using ANOVA/t-tests for categorical vari-
ables and correlation (Pearson’s r) for continuous variables. Prior to analysis, variables
were inspected for conformity to assumptions of parametric statistics and transformed
where necessary. In some cases, transformation was inadequate, and Kruskal–Wallis tests
or Spearman’s rank correlation as appropriate were used instead (Sokal and Rohlf 1995).
Correlations among predictive variables were also investigated. As distance to semi-natural
woodland and area of woodland within 1 km were negatively correlated with forest age,
partial correlations between species richness and woodland variables were performed to
control for the effects of forest age. Differences in species richness between ash and spruce
stands were tested using nested ANOVAs, with stand structural stage as the nested factor,
to partition variation due to structural stage and not tree species. These analyses were
performed using SPSS (2001).
Results
Stand structural types
Sitka spruce
The PCA ordination (Fig. 2) shows that the sites form a continuum of changing stand
structure over the plantation cycle. Axis 1 explains 73% of the variance in the structural
Biodivers Conserv (2008) 17:991–1015 997
123
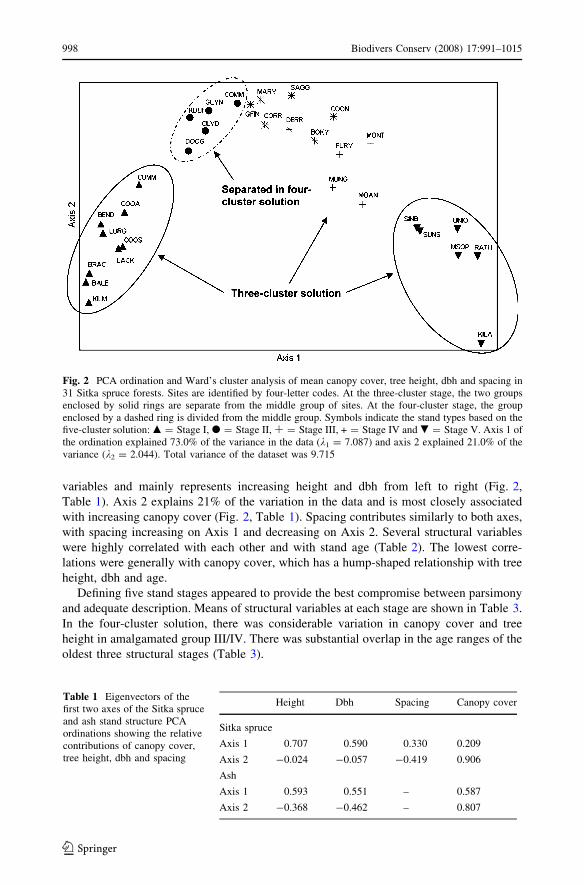
variables and mainly represents increasing height and dbh from left to right (Fig. 2,
Table 1). Axis 2 explains 21% of the variation in the data and is most closely associated
with increasing canopy cover (Fig. 2, Table 1). Spacing contributes similarly to both axes,
with spacing increasing on Axis 1 and decreasing on Axis 2. Several structural variables
were highly correlated with each other and with stand age (Table 2). The lowest corre-
lations were generally with canopy cover, which has a hump-shaped relationship with tree
height, dbh and age.
Defining five stand stages appeared to provide the best compromise between parsimony
and adequate description. Means of structural variables at each stage are shown in Table 3.
In the four-cluster solution, there was considerable variation in canopy cover and tree
height in amalgamated group III/IV. There was substantial overlap in the age ranges of the
oldest three structural stages (Table 3).
Fig. 2 PCA ordination and Ward’s cluster analysis of mean canopy cover, tree height, dbh and spacing in31 Sitka spruce forests. Sites are identified by four-letter codes. At the three-cluster stage, the two groupsenclosed by solid rings are separate from the middle group of sites. At the four-cluster stage, the groupenclosed by a dashed ring is divided from the middle group. Symbols indicate the stand types based on thefive-cluster solution: m = Stage I, d = Stage II, Æ = Stage III, + = Stage IV and . = Stage V. Axis 1 ofthe ordination explained 73.0% of the variance in the data (k1 = 7.087) and axis 2 explained 21.0% of thevariance (k2 = 2.044). Total variance of the dataset was 9.715
Table 1 Eigenvectors of thefirst two axes of the Sitka spruceand ash stand structure PCAordinations showing the relativecontributions of canopy cover,tree height, dbh and spacing
Height Dbh Spacing Canopy cover
Sitka spruce
Axis 1 0.707 0.590 0.330 0.209
Axis 2 -0.024 -0.057 -0.419 0.906
Ash
Axis 1 0.593 0.551 – 0.587
Axis 2 -0.368 -0.462 – 0.807
998 Biodivers Conserv (2008) 17:991–1015
123
Ash
When the four structural variables were analysed for the ash sites, the resulting clusters
joined sites that varied widely in tree size and separated others largely on the basis of
spacing. Analyses were then performed using only canopy cover, tree height and dbh. This
simplified classification was better at forming coherent groupings of larger-tree sites and
also clusters of smaller-tree sites.
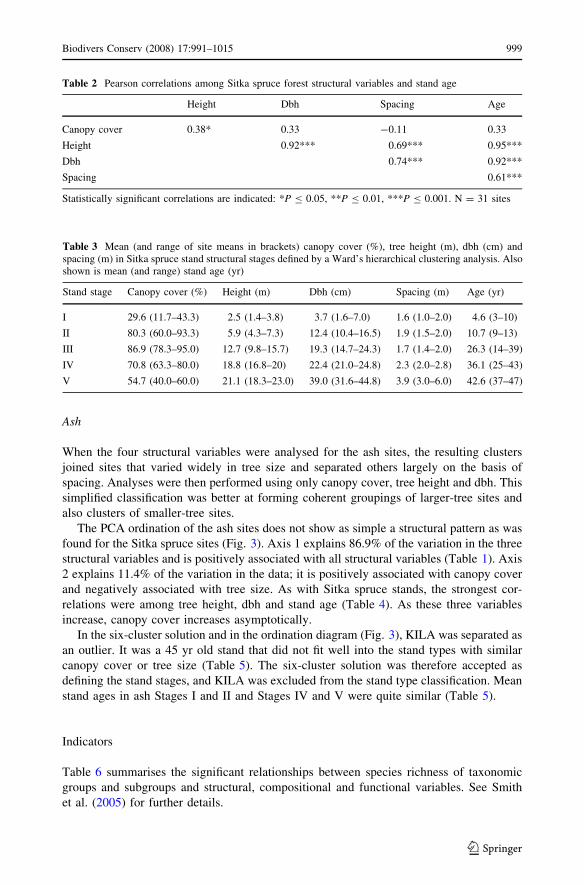
The PCA ordination of the ash sites does not show as simple a structural pattern as was
found for the Sitka spruce sites (Fig. 3). Axis 1 explains 86.9% of the variation in the three
structural variables and is positively associated with all structural variables (Table 1). Axis
2 explains 11.4% of the variation in the data; it is positively associated with canopy cover
and negatively associated with tree size. As with Sitka spruce stands, the strongest cor-
relations were among tree height, dbh and stand age (Table 4). As these three variables
increase, canopy cover increases asymptotically.
In the six-cluster solution and in the ordination diagram (Fig. 3), KILA was separated as
an outlier. It was a 45 yr old stand that did not fit well into the stand types with similar
canopy cover or tree size (Table 5). The six-cluster solution was therefore accepted as
defining the stand stages, and KILA was excluded from the stand type classification. Mean
stand ages in ash Stages I and II and Stages IV and V were quite similar (Table 5).
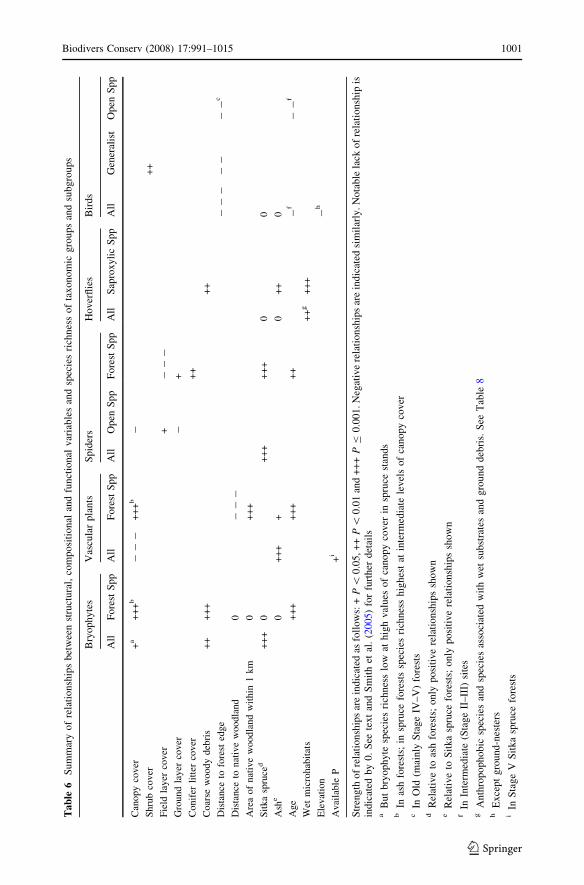
Indicators
Table 6 summarises the significant relationships between species richness of taxonomic
groups and subgroups and structural, compositional and functional variables. See Smith
et al. (2005) for further details.
Table 2 Pearson correlations among Sitka spruce forest structural variables and stand age
Height Dbh Spacing Age
Canopy cover 0.38* 0.33 -0.11 0.33
Height 0.92*** 0.69*** 0.95***
Dbh 0.74*** 0.92***
Spacing 0.61***
Statistically significant correlations are indicated: *P B 0.05, **P B 0.01, ***P B 0.001. N = 31 sites
Table 3 Mean (and range of site means in brackets) canopy cover (%), tree height (m), dbh (cm) andspacing (m) in Sitka spruce stand structural stages defined by a Ward’s hierarchical clustering analysis. Alsoshown is mean (and range) stand age (yr)
Stand stage Canopy cover (%) Height (m) Dbh (cm) Spacing (m) Age (yr)
I 29.6 (11.7–43.3) 2.5 (1.4–3.8) 3.7 (1.6–7.0) 1.6 (1.0–2.0) 4.6 (3–10)
II 80.3 (60.0–93.3) 5.9 (4.3–7.3) 12.4 (10.4–16.5) 1.9 (1.5–2.0) 10.7 (9–13)
III 86.9 (78.3–95.0) 12.7 (9.8–15.7) 19.3 (14.7–24.3) 1.7 (1.4–2.0) 26.3 (14–39)
IV 70.8 (63.3–80.0) 18.8 (16.8–20) 22.4 (21.0–24.8) 2.3 (2.0–2.8) 36.1 (25–43)
V 54.7 (40.0–60.0) 21.1 (18.3–23.0) 39.0 (31.6–44.8) 3.9 (3.0–6.0) 42.6 (37–47)
Biodivers Conserv (2008) 17:991–1015 999
123
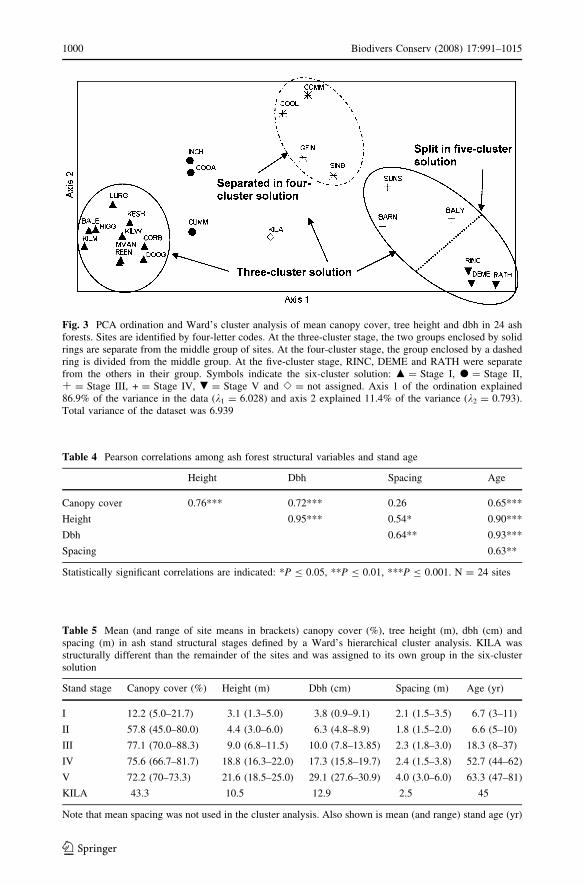
Fig. 3 PCA ordination and Ward’s cluster analysis of mean canopy cover, tree height and dbh in 24 ashforests. Sites are identified by four-letter codes. At the three-cluster stage, the two groups enclosed by solidrings are separate from the middle group of sites. At the four-cluster stage, the group enclosed by a dashedring is divided from the middle group. At the five-cluster stage, RINC, DEME and RATH were separatefrom the others in their group. Symbols indicate the six-cluster solution: m = Stage I, d = Stage II,Æ = Stage III, + = Stage IV, . = Stage V and e = not assigned. Axis 1 of the ordination explained86.9% of the variance in the data (k1 = 6.028) and axis 2 explained 11.4% of the variance (k2 = 0.793).Total variance of the dataset was 6.939
Table 4 Pearson correlations among ash forest structural variables and stand age
Height Dbh Spacing Age
Canopy cover 0.76*** 0.72*** 0.26 0.65***
Height 0.95*** 0.54* 0.90***
Dbh 0.64** 0.93***
Spacing 0.63**
Statistically significant correlations are indicated: *P B 0.05, **P B 0.01, ***P B 0.001. N = 24 sites
Table 5 Mean (and range of site means in brackets) canopy cover (%), tree height (m), dbh (cm) andspacing (m) in ash stand structural stages defined by a Ward’s hierarchical cluster analysis. KILA wasstructurally different than the remainder of the sites and was assigned to its own group in the six-clustersolution
Stand stage Canopy cover (%) Height (m) Dbh (cm) Spacing (m) Age (yr)
I 12.2 (5.0–21.7) 3.1 (1.3–5.0) 3.8 (0.9–9.1) 2.1 (1.5–3.5) 6.7 (3–11)
II 57.8 (45.0–80.0) 4.4 (3.0–6.0) 6.3 (4.8–8.9) 1.8 (1.5–2.0) 6.6 (5–10)
III 77.1 (70.0–88.3) 9.0 (6.8–11.5) 10.0 (7.8–13.85) 2.3 (1.8–3.0) 18.3 (8–37)
IV 75.6 (66.7–81.7) 18.8 (16.3–22.0) 17.3 (15.8–19.7) 2.4 (1.5–3.8) 52.7 (44–62)
V 72.2 (70–73.3) 21.6 (18.5–25.0) 29.1 (27.6–30.9) 4.0 (3.0–6.0) 63.3 (47–81)
KILA 43.3 10.5 12.9 2.5 45
Note that mean spacing was not used in the cluster analysis. Also shown is mean (and range) stand age (yr)
1000 Biodivers Conserv (2008) 17:991–1015
123
Ta
ble
6S
um
mar
yo
fre
lati
on
ship
sb
etw
een
stru
ctu
ral,
com
po
siti
on
alan
dfu
nct
ion
alv
aria
ble
san
dsp
ecie
sri
chn
ess
of
tax
on
om
icg
rou
ps
and
sub
gro
up
s
Bry
op
hy
tes
Vas
cula
rp
lan
tsS
pid
ers
Ho
ver
flie
sB
ird
s
All
Fo
rest
Sp
pA
llF
ore
stS
pp
All
Op
enS
pp
Fo
rest
Sp
pA
llS
apro
xy
lic
Sp
pA
llG
ener
alis
tO
pen
Sp
p
Can
opy
cover
+a
++
+b
--
-+
++
b-
Shru
bco
ver
++
Fie
ldla
yer
cover
+-
--
Gro
und
layer
cover
-+
Conif
erli
tter
cover
++
Coar
sew
oody
deb
ris
++
++
++
+
Dis
tance
tofo
rest
edge
--
--
--
-c
Dis
tance
tonat
ive
woodla
nd
0-
--
Are
aof
nat
ive
woodla
nd
wit
hin
1km
0+
++
Sit
ka
spru
ced
++
+0
++
++
++
00
Ash
e0
++
++
0+
+0
Age
++
++
++
++
-f
--
f
Wet
mic
rohab
itat
s+
+g
++
+
Ele
vat
ion
-h
Avai
lable
P+
i
Str
ength
of
rela
tionsh
ips
are
indic
ated
asfo
llow
s:+
P\
0.0
5,+
+P
\0
.01
and
++
+P
B0.0
01.N
egat
ive
rela
tionsh
ips
are
indic
ated
sim
ilar
ly.
Nota
ble
lack
of
rela
tionsh
ipis
ind
icat
edb
y0
.S
eete
xt
and
Sm
ith
etal
.(2
00
5)
for
furt
her
det
ails
aB
ut
bry
oph
yte
spec
ies
rich
nes
slo
wat
hig
hv
alues
of
cano
py
cov
erin
spru
cest
and
sb
Inas
hfo
rest
s;in
spru
cefo
rest
ssp
ecie
sri
chn
ess
hig
hes
tat
inte
rmed
iate
lev
els
of
can
op
yco
ver
cIn
Old
(mai
nly
Sta
ge
IV–
V)
fore
sts
dR
elat
ive
toas
hfo
rest
s;o
nly
po
siti
ve
rela
tio
nsh
ips
sho
wn
eR
elat
ive
toS
itka
spru
cefo
rest
s;only
posi
tive
rela
tionsh
ips
show
nf
InIn
term
edia
te(S
tag
eII
–II
I)si
tes
gA
nth
rop
oph
ob
icsp
ecie
san
dsp
ecie
sas
soci
ated
wit
hw
etsu
bst
rate
san
dg
rou
nd
deb
ris.
See
Tab
le8
hE
xce
pt
gro
und
-nes
ters
iIn
Sta
ge
VS
itk
asp
ruce
fore
sts
Biodivers Conserv (2008) 17:991–1015 1001
123
Structural
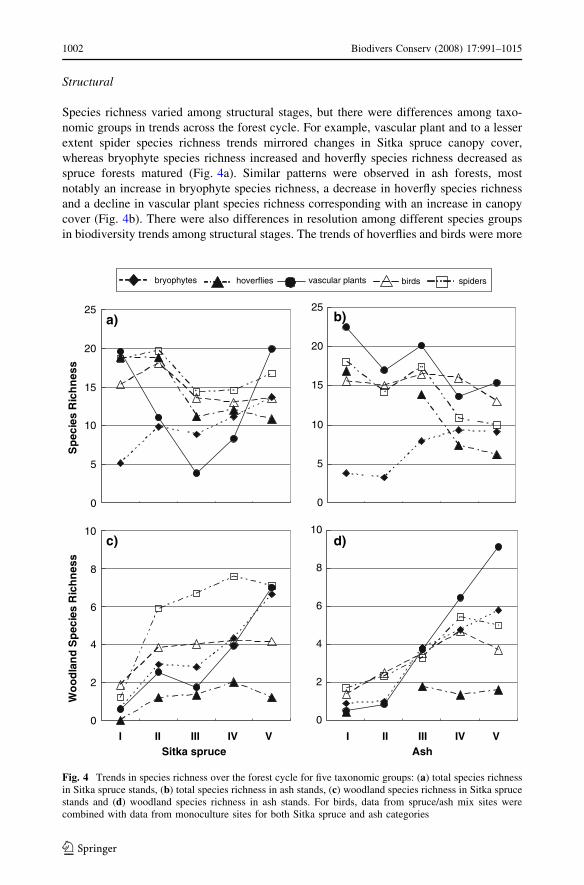
Species richness varied among structural stages, but there were differences among taxo-
nomic groups in trends across the forest cycle. For example, vascular plant and to a lesser
extent spider species richness trends mirrored changes in Sitka spruce canopy cover,
whereas bryophyte species richness increased and hoverfly species richness decreased as
spruce forests matured (Fig. 4a). Similar patterns were observed in ash forests, most
notably an increase in bryophyte species richness, a decrease in hoverfly species richness
and a decline in vascular plant species richness corresponding with an increase in canopy
cover (Fig. 4b). There were also differences in resolution among different species groups
in biodiversity trends among structural stages. The trends of hoverflies and birds were more
ISitka spruce Ash
0
5
10
15
20
25
0
5
10
15
20
25
0
2
4
6
8
10
0
2
4
6
8
10
ssen
hciR
seicep
Ssse
nhci
Rseice
pS
dnal
do
oW
bryophytes spidershoverflies vascular plants birds
a) b)
d)c)
II III IV V I II III IV V
Fig. 4 Trends in species richness over the forest cycle for five taxonomic groups: (a) total species richnessin Sitka spruce stands, (b) total species richness in ash stands, (c) woodland species richness in Sitka sprucestands and (d) woodland species richness in ash stands. For birds, data from spruce/ash mix sites werecombined with data from monoculture sites for both Sitka spruce and ash categories
1002 Biodivers Conserv (2008) 17:991–1015
123
coarse than that of vascular plants (Fig. 4a; Wilson et al. 2006). Richness of forest species
in all taxonomic groups increased with forest maturity in Sitka spruce and ash forests, but
again there were differences in scale of response (Fig. 4c, d).
Although birds are shown in Fig. 4 for comparison with other species groups, pre-
liminary analyses found that birds were not as sensitive to changes in forest structure or
tree species recorded at the stand scale. Therefore, a separate stand type classification was
performed using the structural data from the bird point counts of ash and Sitka spruce
forests combined. This resulted in three bird habitat subgroups, Younger, Intermediate and
Older (Wilson et al. 2006), corresponding to structural Stages I–II, Stages II–III and Stages
III–V, respectively. Indicators for bird diversity were developed in the context of this
simplified structural classification.
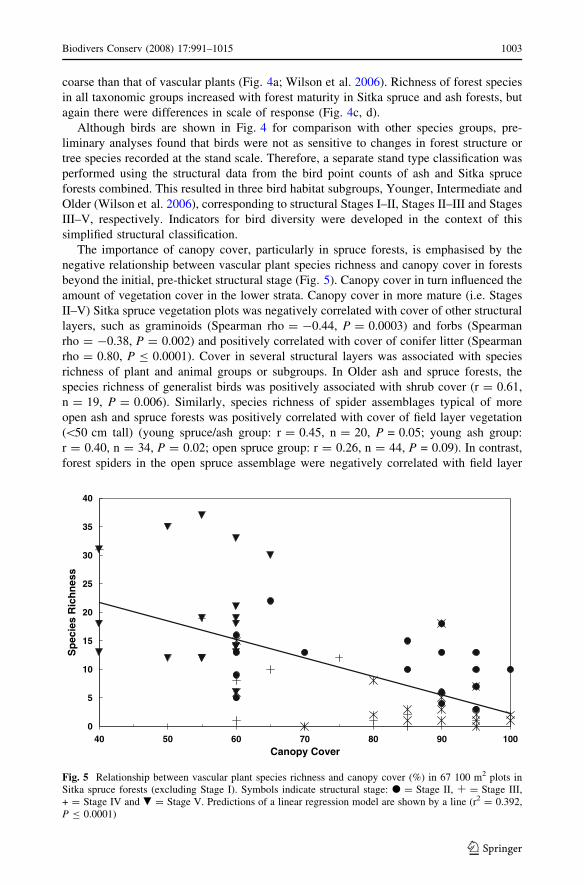
The importance of canopy cover, particularly in spruce forests, is emphasised by the
negative relationship between vascular plant species richness and canopy cover in forests
beyond the initial, pre-thicket structural stage (Fig. 5). Canopy cover in turn influenced the
amount of vegetation cover in the lower strata. Canopy cover in more mature (i.e. Stages
II–V) Sitka spruce vegetation plots was negatively correlated with cover of other structural
layers, such as graminoids (Spearman rho = -0.44, P = 0.0003) and forbs (Spearman
rho = -0.38, P = 0.002) and positively correlated with cover of conifer litter (Spearman
rho = 0.80, P B 0.0001). Cover in several structural layers was associated with species
richness of plant and animal groups or subgroups. In Older ash and spruce forests, the
species richness of generalist birds was positively associated with shrub cover (r = 0.61,
n = 19, P = 0.006). Similarly, species richness of spider assemblages typical of more
open ash and spruce forests was positively correlated with cover of field layer vegetation
(\50 cm tall) (young spruce/ash group: r = 0.45, n = 20, P = 0.05; young ash group:
r = 0.40, n = 34, P = 0.02; open spruce group: r = 0.26, n = 44, P = 0.09). In contrast,
forest spiders in the open spruce assemblage were negatively correlated with field layer
0
5
10
15
20
25
30
35
40
40 50 60 70 80 90 100Canopy Cover
ssen
hciR
seicep
S
Fig. 5 Relationship between vascular plant species richness and canopy cover (%) in 67 100 m2 plots inSitka spruce forests (excluding Stage I). Symbols indicate structural stage: d = Stage II, Æ = Stage III,+ = Stage IV and . = Stage V. Predictions of a linear regression model are shown by a line (r2 = 0.392,P B 0.0001)
Biodivers Conserv (2008) 17:991–1015 1003
123
cover (r = -0.48, n = 44, P B 0.001) and positively correlated with conifer litter cover
(r = 0.46, n = 44, P = 0.002).
Bryophyte species richness was positively associated with volume of CWD in Stage
II–V ash and spruce plots (r = 0.27, n = 105, P = 0.003, 1-tailed). When restricted to
spruce forests only, the relationship was stronger (r = 0.42, n = 68, P = 0.0002, 1-tailed).
Forest bryophytes were also positively associated with CWD volume in Stage II–V ash and
spruce plots (r = 0.35, n = 105, P = 0.0001, 1-tailed). The species richness of saproxylic
hoverflies was positively correlated with frequency of standing CWD (r = 0.62, n = 20,
P = 0.002, 1-tailed) and fallen CWD (r = 0.57, n = 20, P = 0.004, 1-tailed) in spruce
forests older than 20 years.
Structural features at the landscape scale were also associated with species richness of
some taxonomic groups. In Older ash and spruce forests, distance to the forest edge was
negatively correlated with species richness of birds (r = -0.72, n = 19, P = 0.001).
Species richness of forest vascular plants in Stage II–V ash and spruce forests was neg-
atively correlated with distance to native woodland (r = -0.75, n = 30, P B 0.001) and
positively correlated with area of native woodland within 1 km (r = 0.75, n = 30,
P B 0.001) (both are partial correlations controlling for variation due to forest age).
Compositional
Differences in species richness between Sitka spruce and ash stands, when variation due to
structure is removed from the analysis, varied by taxonomic group. Vegetation plots in
Sitka spruce stands supported a significantly higher number of bryophyte species
(9.3 ± 0.6 se) than in ash stands (5.9 ± 0.5 se) (F1,152 = 18.9, P \ 0.001). In contrast,
ash stands supported significantly more vascular plant species (19.0 ± 0.9 se) than Sitka
spruce stands (13.0 ± 1.0 se) (F1,152 = 17.97, P \ 0.001). When both plant groups are
combined, differences in species richness are not significant (F1,152 = 1.95, P = 0.17).
There were also no differences in mean hoverfly species richness between ash (12.5 ± 1.2)
and Sitka spruce (11.5 ± 0.7) (F1,55 = 0.05, P = 0.82). Species richness of saproxylic
hoverflies, however, was significantly higher in ash compared to Sitka spruce: 2.1 ± 0.3 se
in ash and 1.6 ± 0.3 se in Sitka spruce (F1,55 = 11.0, P = 0.002). Spider species richness
was higher in Sitka spruce stands (16.4 ± 0.4 se) than in ash (14.4 ± 0.8 se)
(F1,170 = 13.2, P \ 0.001). There were no significant differences in bird species richness
between tree species in any of the three bird habitat subgroups.
Over the three bird habitat subgroups, the strongest positive correlations between bird
species richness and the abundance of particular bird species were with abundances of
Dunnock (Prunella modularis) (r = 0.55, P \ 0.001), Wren (Troglodytes troglodytes)
(r = 0.49, P \ 0.001) and Blackbird (Turdus merula) (r = 0.47, P = 0.001). Abundances
of Goldcrest (Regulus regulus) were negatively correlated with bird species richness
(r = -0.30, P = 0.048). When considering Older forests only, ten bird species were
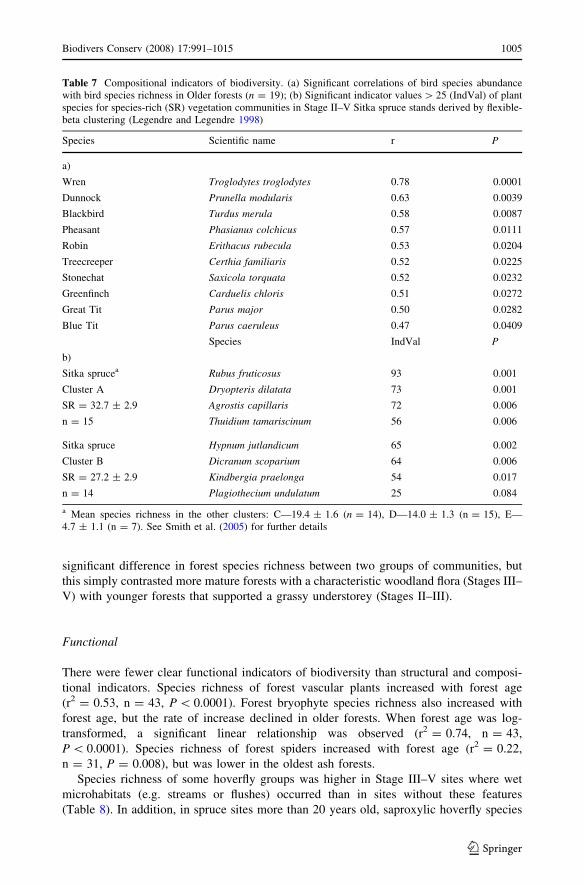
significantly correlated with total bird species richness (Table 7a).
Five plant species assemblages were identified in the more mature Sitka spruce stands
(Smith et al. 2005), two of which supported significantly higher total plant species richness
than the others. Four significant indicator species with indicator values greater than 25
were found for cluster A, representing a more open, vascular-plant rich community, and
four for cluster B, a community type particularly rich in bryophyte species (Table 7b).
Indicator plant species were not identified for ash forests, as there were no significant
differences in total plant species richness among ash plant communities. There was a
1004 Biodivers Conserv (2008) 17:991–1015
123
significant difference in forest species richness between two groups of communities, but
this simply contrasted more mature forests with a characteristic woodland flora (Stages III–
V) with younger forests that supported a grassy understorey (Stages II–III).
Functional
There were fewer clear functional indicators of biodiversity than structural and composi-
tional indicators. Species richness of forest vascular plants increased with forest age
(r2 = 0.53, n = 43, P \ 0.0001). Forest bryophyte species richness also increased with
forest age, but the rate of increase declined in older forests. When forest age was log-
transformed, a significant linear relationship was observed (r2 = 0.74, n = 43,
P \ 0.0001). Species richness of forest spiders increased with forest age (r2 = 0.22,
n = 31, P = 0.008), but was lower in the oldest ash forests.
Species richness of some hoverfly groups was higher in Stage III–V sites where wet
microhabitats (e.g. streams or flushes) occurred than in sites without these features
(Table 8). In addition, in spruce sites more than 20 years old, saproxylic hoverfly species
Table 7 Compositional indicators of biodiversity. (a) Significant correlations of bird species abundancewith bird species richness in Older forests (n = 19); (b) Significant indicator values [ 25 (IndVal) of plantspecies for species-rich (SR) vegetation communities in Stage II–V Sitka spruce stands derived by flexible-beta clustering (Legendre and Legendre 1998)
Species Scientific name r P
a)
Wren Troglodytes troglodytes 0.78 0.0001
Dunnock Prunella modularis 0.63 0.0039
Blackbird Turdus merula 0.58 0.0087
Pheasant Phasianus colchicus 0.57 0.0111
Robin Erithacus rubecula 0.53 0.0204
Treecreeper Certhia familiaris 0.52 0.0225
Stonechat Saxicola torquata 0.52 0.0232
Greenfinch Carduelis chloris 0.51 0.0272
Great Tit Parus major 0.50 0.0282
Blue Tit Parus caeruleus 0.47 0.0409
Species IndVal P
b)
Sitka sprucea Rubus fruticosus 93 0.001
Cluster A Dryopteris dilatata 73 0.001
SR = 32.7 ± 2.9 Agrostis capillaris 72 0.006
n = 15 Thuidium tamariscinum 56 0.006
Sitka spruce Hypnum jutlandicum 65 0.002
Cluster B Dicranum scoparium 64 0.006
SR = 27.2 ± 2.9 Kindbergia praelonga 54 0.017
n = 14 Plagiothecium undulatum 25 0.084
a Mean species richness in the other clusters: C—19.4 ± 1.6 (n = 14), D—14.0 ± 1.3 (n = 15), E—4.7 ± 1.1 (n = 7). See Smith et al. (2005) for further details
Biodivers Conserv (2008) 17:991–1015 1005
123
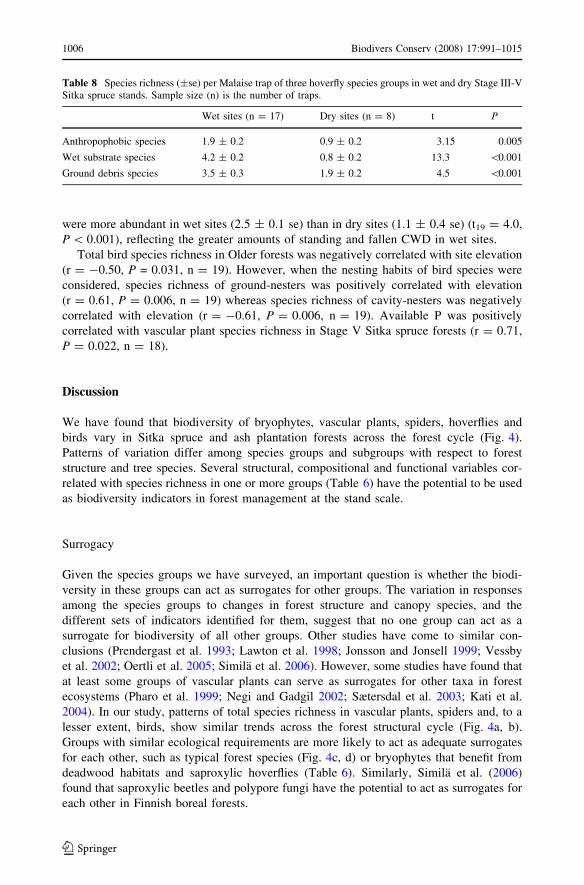
were more abundant in wet sites (2.5 ± 0.1 se) than in dry sites (1.1 ± 0.4 se) (t19 = 4.0,
P \ 0.001), reflecting the greater amounts of standing and fallen CWD in wet sites.
Total bird species richness in Older forests was negatively correlated with site elevation
(r = -0.50, P = 0.031, n = 19). However, when the nesting habits of bird species were
considered, species richness of ground-nesters was positively correlated with elevation
(r = 0.61, P = 0.006, n = 19) whereas species richness of cavity-nesters was negatively
correlated with elevation (r = -0.61, P = 0.006, n = 19). Available P was positively
correlated with vascular plant species richness in Stage V Sitka spruce forests (r = 0.71,
P = 0.022, n = 18).
Discussion
We have found that biodiversity of bryophytes, vascular plants, spiders, hoverflies and
birds vary in Sitka spruce and ash plantation forests across the forest cycle (Fig. 4).
Patterns of variation differ among species groups and subgroups with respect to forest
structure and tree species. Several structural, compositional and functional variables cor-
related with species richness in one or more groups (Table 6) have the potential to be used
as biodiversity indicators in forest management at the stand scale.
Surrogacy
Given the species groups we have surveyed, an important question is whether the biodi-
versity in these groups can act as surrogates for other groups. The variation in responses
among the species groups to changes in forest structure and canopy species, and the
different sets of indicators identified for them, suggest that no one group can act as a
surrogate for biodiversity of all other groups. Other studies have come to similar con-
clusions (Prendergast et al. 1993; Lawton et al. 1998; Jonsson and Jonsell 1999; Vessby
et al. 2002; Oertli et al. 2005; Simila et al. 2006). However, some studies have found that
at least some groups of vascular plants can serve as surrogates for other taxa in forest
ecosystems (Pharo et al. 1999; Negi and Gadgil 2002; Sætersdal et al. 2003; Kati et al.
2004). In our study, patterns of total species richness in vascular plants, spiders and, to a
lesser extent, birds, show similar trends across the forest structural cycle (Fig. 4a, b).
Groups with similar ecological requirements are more likely to act as adequate surrogates
for each other, such as typical forest species (Fig. 4c, d) or bryophytes that benefit from
deadwood habitats and saproxylic hoverflies (Table 6). Similarly, Simila et al. (2006)
found that saproxylic beetles and polypore fungi have the potential to act as surrogates for
each other in Finnish boreal forests.
Table 8 Species richness (±se) per Malaise trap of three hoverfly species groups in wet and dry Stage III-VSitka spruce stands. Sample size (n) is the number of traps.
Wet sites (n = 17) Dry sites (n = 8) t P
Anthropophobic species 1.9 ± 0.2 0.9 ± 0.2 3.15 0.005
Wet substrate species 4.2 ± 0.2 0.8 ± 0.2 13.3 \0.001
Ground debris species 3.5 ± 0.3 1.9 ± 0.2 4.5 \0.001
1006 Biodivers Conserv (2008) 17:991–1015
123
For the above reasons, it is necessary to cover a range of different taxonomic groups to
make an adequate assessment of the biodiversity of a particular site. Although we have
attempted to do this, it is likely that inclusion of additional taxonomic groups in our study
might have revealed additional patterns of variation in biodiversity. For example, forests
are an important habitat for some species of bats, all of which are of conservation value in
Ireland (Hayden and Harrington 2001). As the features that are important for bats, such as
crevices or hollows in trees suitable for roosting, are probably not as important for the taxa
we surveyed, patterns of bat diversity would probably be different than those in this study.
Evaluation of indicators
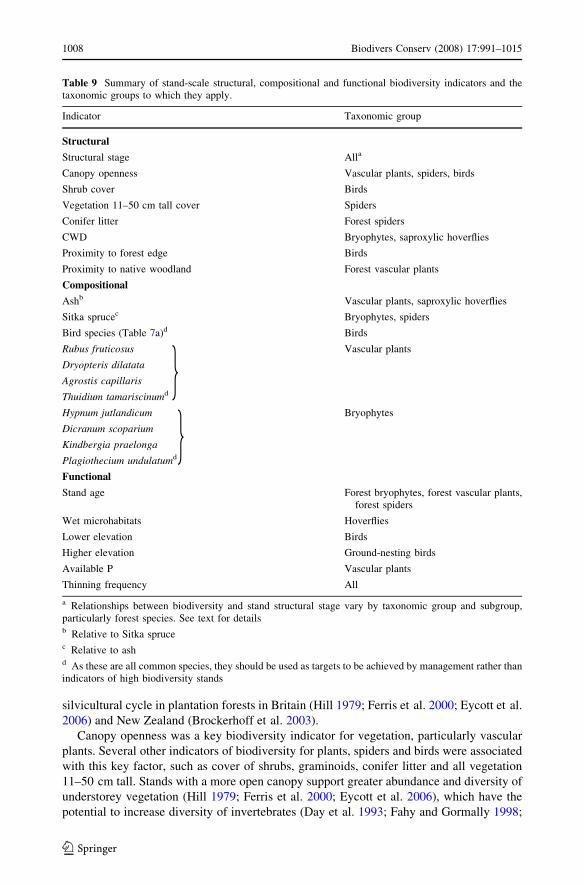
The indicators we have identified are summarised in Table 9. Previous authors have
identified characteristics that indicators should ideally possess if they are to be effective
management tools (Noss 1990; Ferris and Humphrey 1999; Lindenmayer 1999). Prefera-
bly, indicators should: (1) show clear links to particular aspects of biodiversity, (2) be
sensitive to changes in those features, (3) be applicable over a broad geographical area, (4)
be easy and cost-efficient to measure, and (5) be ecologically meaningful. Our study design
and data analysis ensure that the indicators we developed meet the first four criteria. The
last criterion is addressed in the interpretation of our results below.
Structural
The structural indicators we have presented are linked to ecological processes that affect
the biodiversity of our surveyed groups. When considering biodiversity over the forest
cycle, the clearest indicator for the majority of taxonomic groups is stand structural stage,
demonstrating the value of a multivariate structural classification. Other studies have
successfully used similar multivariate classifications (e.g. Pitkanen 1997; Leppaniemi et al.
1998), whereas others have used more subjective classifications (e.g. Humphrey et al.
1999; Ferris et al. 2000) or have used age as a surrogate (e.g. Currie and Balmford 1982;
Brockerhoff et al. 2003; Eycott et al. 2006). In preliminary analyses of biodiversity pat-
terns, we found that our original age categorisation of stand development did not
adequately account for structural variation due to such variables as site fertility and
thinning regime (Smith et al. 2005). Trends in biodiversity were usually better predicted by
structural type rather than age class. The influence of thinning and stand age on structure
and diversity are discussed in more detail below.
There are differences in resolution among different species groups in species richness at
different structural stages. For example, species richness of vascular plants exhibited marked
differences among stages in Sitka spruce and ash, whereas species richness of birds and
hoverflies was less variable (Fig. 4). A fundamental distinction in forest structure to which
virtually all taxonomic groups responded was between the pre-thicket forests of Stage I and
structural stages post-canopy closure (Stages II–V). Some species groups, such as vascular
plants and spiders, showed a unimodal response to stand structural stage, with high species
richness in Stage I, low species richness in intermediate stages and increased richness in later
stages. Other groups, such as typical forest plant, invertebrate and bird species, increased
through the course of the structural cycle. These patterns have also been identified during
succession in natural Douglas-fir (Pseudotsuga menziesii) forests (Spies 1998) and over the
Biodivers Conserv (2008) 17:991–1015 1007
123
silvicultural cycle in plantation forests in Britain (Hill 1979; Ferris et al. 2000; Eycott et al.
2006) and New Zealand (Brockerhoff et al. 2003).
Canopy openness was a key biodiversity indicator for vegetation, particularly vascular
plants. Several other indicators of biodiversity for plants, spiders and birds were associated
with this key factor, such as cover of shrubs, graminoids, conifer litter and all vegetation
11–50 cm tall. Stands with a more open canopy support greater abundance and diversity of
understorey vegetation (Hill 1979; Ferris et al. 2000; Eycott et al. 2006), which have the
potential to increase diversity of invertebrates (Day et al. 1993; Fahy and Gormally 1998;
Table 9 Summary of stand-scale structural, compositional and functional biodiversity indicators and thetaxonomic groups to which they apply.
Indicator Taxonomic group
Structural
Structural stage Alla
Canopy openness Vascular plants, spiders, birds
Shrub cover Birds
Vegetation 11–50 cm tall cover Spiders
Conifer litter Forest spiders
CWD Bryophytes, saproxylic hoverflies
Proximity to forest edge Birds
Proximity to native woodland Forest vascular plants
Compositional
Ashb Vascular plants, saproxylic hoverflies
Sitka sprucec Bryophytes, spiders
Bird species (Table 7a)d Birds
Rubus fruticosus Vascular plants
Dryopteris dilatata
Agrostis capillaris
Thuidium tamariscinumd
Hypnum jutlandicum Bryophytes
Dicranum scoparium
Kindbergia praelonga
Plagiothecium undulatumd
Functional
Stand age Forest bryophytes, forest vascular plants,forest spiders
Wet microhabitats Hoverflies
Lower elevation Birds
Higher elevation Ground-nesting birds
Available P Vascular plants
Thinning frequency All
a Relationships between biodiversity and stand structural stage vary by taxonomic group and subgroup,particularly forest species. See text for detailsb Relative to Sitka sprucec Relative to ashd As these are all common species, they should be used as targets to be achieved by management rather thanindicators of high biodiversity stands
gg
1008 Biodivers Conserv (2008) 17:991–1015
123
Humphrey et al. 1999; Oxbrough et al. 2005) and birds (Currie and Balmford 1982; Bibby
et al. 1989; Duffy et al. 1997; O’Halloran et al. 1999).
Deadwood volumes increased over the forest cycle, as has been noted in previous
studies (Spies et al. 1988; Spies 1998; Humphrey and Peace 2003). Biodiversity of
bryophytes (total and forest) and saproxylic hoverflies were positively associated with
volume of deadwood. Several other studies have found that deadwood is correlated with
diversity of bryophytes and lichens (e.g. Engelmark and Hytteborn 1999; Humphrey et al.
2002), fungi (e.g. Humphrey et al. 2000) and invertebrates (e.g. Berg et al. 1994; Simila
et al. 2006).
The plantation-scale structural indicators—distance to forest edge for birds and distance
to and area of native woodland near plantations for forest plants—reflect the availability of
additional habitats in the immediate landscape to act as supplementary habitat or popu-
lation sources. Forest edges may provide habitat for bird species that prefer open or
shrubby habitats, and the presence of broadleaf scrub at plantation forest edges would
improve the habitat value of the edge for birds (Currie and Balmford 1982; Bibby et al.
1989; Duffy et al. 1997; Iremonger et al. 2006). Native woodlands in close proximity to
plantation forests can act as seed sources for forest plants, which are often dispersal-limited
(Ehrlen and Eriksson 2000; Verheyen et al. 2003; Devlaeminck et al. 2005). The same
relationship was not observed for forest bryophytes, most likely because bryophyte spores
disperse more easily over longer distances.
Compositional
For an indicator to be easy and cost-effective to measure, it must be capable of ready
assessment by non-specialists (Ferris and Humphrey 1999), such as forest inventory staff
or individual landowners. Because of the low species diversity of birds in Ireland and the
lack of forest specialists (Wilson et al. 2006), the number of indicator bird species is low
(Table 7). In fact most of the indicator species are common birds in Ireland and will be
familiar to most non-specialists (Coombes et al. 2002). The vascular plant and bryophyte
species we have listed are readily identifiable with some practice; they are also common
species in Ireland. We have not selected any invertebrate species as compositional bio-
diversity indicators, as they require more time-consuming and expensive sampling
methods and are not easily identifiable by non-specialists.
Tree species, a potential compositional indicator, produced contrasting results among
species groups. Bryophyte and spider species richness were higher in Sitka spruce stands,
vascular plant and saproxylic hoverfly species richness were higher in ash stands and no
differences in total hoverfly or bird species richness were observed between tree species
(Table 6). These results can be explained by the biology of the different taxonomic groups. A
greater diversity of vascular plants is facilitated by the lighter ash canopy and also by the more
fertile conditions in which the ash stands occurred. Bryophyte species richness is encouraged
by the high humidity and lower competition from larger plants in spruce stands. Species
richness in spiders is strongly influenced by vegetation structure (Greenstone 1984; Dennis
et al. 1998; McNett and Rypstra 2000), and it is likely that the reduction in cover of larger
plants in spruce stands facilitated development of ground and lower field layer vegetation that
favours ground-dwelling spiders. Our results, however, cannot be extrapolated to other
broadleaved or coniferous tree species. For example, the number of plant-feeding inverte-
brate species—which form part of the diet of spiders and birds—associated with ash in Britain
is relatively low compared to other native broadleaved trees (Key 1995). Therefore,
Biodivers Conserv (2008) 17:991–1015 1009
123
comparisons between Sitka spruce and plantations of other native broadleaved tree species
might produce greater contrasts in biodiversity than those we found. Oak (Quercus spp.) and
birch (Betula spp.) would be particularly interesting to study in this context as they support
high numbers of plant-feeding invertebrate species (Jones 1959; Atkinson 1992; Key 1995).
While some invertebrate species may specialise on other conifer species, differences in forest
structure may have a more important potential effect on biodiversity. In particular, pines
(Pinus spp.) and larches (Larix spp.) tend to allow greater light penetration through the
canopy and therefore allow greater development of vascular ground flora during the middle
part of the forest cycle (Hill 1979; Ferris et al. 2000; French et al. in press).
Functional
Stand age was an adequate positive biodiversity indicator only for forest plants and forest
spiders and a negative indicator for birds in intermediate-aged stands, especially species
characteristic of open habitats. The increase of forest plant and spider species richness is
the result of dispersal and colonisation of a suitable habitat, successional processes seen in
natural forests and also in plantation forests. Previous research in Britain (Hill and Jones,
1978; Ferris et al. 2000) and New Zealand (Brockerhoff et al. 2003) has also found that
mature plantations of native and exotic species can acquire floras characteristic of native
forests. In our study, the flora of mature spruce plantations somewhat resembles that of
native acid oak woodland and the flora of mature ash plantations is similar to that in semi-
natural ash-hazel woodland (French et al. in press). Dispersal is an important mechanism in
the succession of forest vascular plants, as demonstrated by the relationship with proximity
to old woodland. For spiders, whose young can disperse long distances by ballooning, a
more important factor may be the development of suitable habitat in the form of high cover
of conifer litter or bryophytes (Table 9; Oxbrough et al. 2005). For birds, dispersal is likely
to be much less important than the development of suitable or unsuitable forest structures
with age. Tree size and density were strongly correlated with stand age (Tables 2 and 4),
and it is these factors that are probably responsible for the negative relationship between
open-habitat bird species richness and age. In contrast, canopy cover was less well cor-
related with stand age, and species groups strongly influenced by canopy cover will as a
result have weaker relationships with stand age.
One functional process that is partly responsible for the lower correlation between stand
age and canopy cover is thinning. Thinning operations decrease canopy cover, at least
temporarily, promote larger diameter trees in the longer term and increase deadwood
volume. It was not possible to analyse the relationships between thinning and biodiversity
explicitly because of the difficulty in obtaining stand-specific information on thinning
regime. However, such information as we were able to obtain suggests that Stage II and III
Sitka spruce stands were mainly unthinned and that Stage V spruce stands had been
subjected to at least three thinning operations. Therefore, thinning can be considered an
indicator of biodiversity in Sitka spruce forests (Table 9). In contrast, Brockerhoff et al.
(2003) in New Zealand found that more heavily thinned stands supported a greater pro-
portion of exotic species than more dense stands; however, maximum canopy closure in
their pine stands was 80%, lower than the average in our Stage III stands. As thinning is a
management practice, it is the easiest of our functional indicators to change and may be the
most efficient method of influencing stand biodiversity. We recommend that spruce
plantations be thinned early and at regular intervals so as to prevent complete canopy
closure (Smith et al. 2005).
1010 Biodivers Conserv (2008) 17:991–1015
123
We identified few other functional indicators, possibly in part as a result of our strategy
of clustering sites to reduce environmental variation. The presence of wet microhabitats,
such as flushes and temporary ponds or streams, in plantation forests increased hoverfly
biodiversity by meeting the habitat requirements for the larval stages of a particular set of
species. Wet microhabitats may also increase stand biodiversity of other plant or animal
species groups. Wet spruce sites also supported higher amounts of deadwood, due to
greater frequency of windthrow, and thereby greater diversity of saproxylic hoverflies
(Table 8). Site elevation as an indicator of bird diversity appears to reflect the differences
between upland and lowland plantations and surrounding landscapes. Higher available P in
Stage V Sitka spruce stands indicates greater richness of vascular plants, perhaps because
greater soil fertility permits coexistence of a wider range of species. Eycott et al. (2006)
also found that more fertile sites supported higher vascular plant species richness in pine
plantations in lowland England, and Simila et al. (2006) reached the same conclusion in
managed boreal forests in Finland. Our sites were of low overall fertility, however, and the
true relationship between fertility and vascular plant diversity may be unimodal rather than
linear (Grime 1979; Pausas and Austin 2001).
Using indicators
The biodiversity indicators we identify (Table 9) can be used to assess the effect of site
management practices on biodiversity and to identify sites that are potentially of high
biodiversity value. Used as the former, they are targets to be achieved by management.
Presence of few or no indicators in forest stands suggests that management methods should
be improved; the indicators also provide information on the changes required. Forest stands
identified as being of potentially high biodiversity can be surveyed and assessed more
thoroughly, and management for biodiversity can be prioritised in forest planning and
operations. Indicators cannot substitute for thorough ecological surveys, particularly when
sites of major biodiversity importance may be involved, but they can be employed as a first
step in management assessment or in identifying sites of biodiversity value. These indi-
cators cannot identify sites where rare species are present, a failure general to the indicator
approach (Niemi and McDonald 2004).
Our indicators should be considered preliminary until they are verified using inde-
pendent data (Noss 1990). In addition, the context in which they have been identified, i.e.
first rotation Sitka spruce and ash stands managed under a clearfelling system, must be
taken into consideration. These indicators should generally be employed at the stand level,
rather than at the level of the whole plantation or landscape. They should be used in
conjunction: in general, it is misleading to label a stand as having high biodiversity (or not)
on the basis of just one or two indicators. We recommend the presence of at least four
indicators from two or more groups (compositional, structural and functional) as a general
guideline for designating sites or stands as potentially having high biodiversity. We are not
aware of any similar recommendations regarding the number of indicators required for a
favourable biodiversity assessment.
Conclusions
We have developed a set of provisional, stand-scale indicators of biodiversity for Sitka
spruce and ash plantation forests for use in Ireland; they are likely to be applicable over a
Biodivers Conserv (2008) 17:991–1015 1011
123
wider area with similar climates, such as northern Britain. The approach we have used to
develop indicators has a wider potential for application. The indicators can be employed by
non-specialists as a first step in identifying potentially high biodiversity stands or assessing
the biodiversity implications of management interventions. Structural and functional
indicators are particularly useful, as their assessment is often relatively simple. Functional
indicators can represent management interventions, such as thinning, that can be changed if
required; structural indicators provide targets for management to reach. Stand structure
strongly affects species richness. A multivariate classification of stand structure into a
small number of stages can be used to summarise biodiversity changes over the forest
cycle. As species groups vary in their response to changes in stand structure, caution is
required when using one group as a surrogate for the biodiversity of another.
Acknowledgements We thank Pat Neville and Aileen O’Sullivan for their help in all aspects of our workand Conor Clenaghan, John Cross, Jonathan Humphrey and Tor-Bjorn Larsson for advice on the design ofthis project. We are grateful to Coillte and private landowners for access to their forest plantations andinformation on site management. We thank Jacqueline Bolli, Maire Buckley, Noirın Burke, John Cleary,Sinead Cummins, Gerry Farrell and Richard Jack for assistance in the field and with sample sorting. Twoanonymous reviewers provided helpful comments on an earlier draft. This study is a contribution from theBIOFOREST Project, funded by the National Development Plan through the Council on Forest Researchand Development (COFORD) and the Environmental Protection Agency (EPA).
References
Allen SE, Grimshaw HM, Rowland AP (1986) Chemical analysis. In: Moore PD, Chapman SB (eds)Methods in plant ecology. Blackwell, Oxford, pp 285–344
Anand M, Laurence S, Rayfield B (2005) Diversity relationships among taxonomic groups in recovering andrestored forests. Conserv Biol 19:955–962
Atkinson MD (1992) Biological flora of the British isles: Betula pendula Roth (B. verrucosa ehrh.) andB. pubescens Ehrh. J Ecol 80:837–870
Beaman M (1994) Palearctic birds. Harrier, StonyhurstBerg A, Ehnstrom B, Gustafsson L et al (1994) Threatened plant, animal, and fungus species in swedish
forests: distribution and habitat associations. Conserv Biol 8:718–731Bibby C, Burgess ND, Hill DA (1992) Bird census techniques. Academic Press, LondonBibby CJ, Bain CG, Burges DJ (1989) Bird communities of highland birchwoods. Bird Study 36:123–133Brockerhoff EG, Ecroyd CE, Leckie AC et al (2003) Diversity and succession of adventive and indigenous
vascular understorey plants in Pinus radiata plantation forests in New Zealand. For Ecol Manage185:307–326
Coombes RH, Crowe O, Lysaght L et al (2002) Countryside bird survey report 1998–2000. Bird WatchIreland, Dublin
Cross JR (1998) An outline and map of the potential natural vegetation of Ireland. Appl Veg Sci 1:241–252Currie FA, Balmford R (1982) The value to birdlife of retaining small conifer stands beyond normal felling
age within forests. Q J For 76:153–160Curtis D (1980) Pitfalls in spider community studies. J Arach 8:271–280Day KR, Marshall S, Heaney C (1993) Associations between forest type and invertebrates: ground beetle
community patterns in a natural oakwood and juxtaposed conifer plantations. Forestry 66:37–50Dennis P, Young M, Gordon I (1998) Distribution and abundance of small insects and arachnids in relation
to structural heterogeneity of grazed, indigenous grasslands. Ecol Entomol 23:253–264Devlaeminck R, Bossuyt B, Hermy M (2005) Seed dispersal from a forest into adjacent cropland. Agric
Ecosys Environ 107:57–64Duffy BL, O’Halloran J, Kelly TCK et al (1997) The breeding bird communities of Balrath wood, Co.
Meath, 1996: a preliminary investigation. Ir For 54:2–8Dufrene M, Legendre P (1997) Species assemblages and indicator species: the need for a flexible asym-
metric approach. Ecol Monogr 67:345–366Ehrlen J, Eriksson O (2000) Dispersal limitation and patch occupancy in forest herbs. Ecology 81:1667–
1674
1012 Biodivers Conserv (2008) 17:991–1015
123
Engelmark O, Hytteborn H (1999) Coniferous forests. Acta Phytogeogr Suec 84:55–74Eycott AE, Watkinson AR, Dolman PM (2006) Ecological patterns of plant diversity in a plantation forest
managed by clearfelling. J Appl Ecol 43:1160–1171Fahy O, Gormally M (1998) A comparison of plant and beetle communities in an Irish oak woodland with a
nearby by conifer plantation and clearfelled site. For Ecol Manage 110:263–273Ferris R, Humphrey JW (1999) A review of potential biodiversity indicators for application in British
forests. Forestry 72:313–328Ferris R, Peace AJ, Humphrey JW, et al (2000) Relationships between vegetation, site type and stand
structure in coniferous plantations in Britain. For Ecol Manage 136:35–51Forest Service (2000a) Afforestation grant and premium schemes. Forest Service, Johnstown CastleForest Service (2000b) Code of best forest practice– Ireland. Forest Service, Johnstown CastleForest Service (2000c) Forest biodiversity guidelines. Forest Service, Johnstown CastleForest Service (2006) Forest environment protection (afforestation) scheme. Forest Service, Johnstown
CastleForestry Commission (2004) The UK forestry standard. Forestry Commission, EdinburghFrench LJ, Smith GF, Kelly DL et al (in press) Ground flora communities in temperate oceanic plantation
forests and the influence of silvicultural, geographic and edaphic factors. For Ecol ManageGaston KJ (1996) Species richness: measure and measurement. In: Gaston KJ (ed) Biodiversity: a biology of
numbers and difference. Blackwell Science, Oxford, pp 396Greenstone M (1984) Determinants of web spider species diversity: vegetation structural diversity vs. prey
availability. Oecologia 62:299–304Grime JP (1979) Plant strategies and vegetation processes. Wiley & Sons, ChichesterHalpern CB, Spies TA (1995) Plant species diversity in natural and managed forests of the Pacific northwest.
Ecol Appl 5:913–934Hayden T, Harrington R (2001) Exploring Irish mammals. Town House, DublinHill MO (1979) The development of flora in even-aged plantations. In: Ford ED, Malcolm DC, Atterson J
(eds) The ecology of even aged plantations. Institute for Terrestrial Ecology, Cambridge, pp 175–192Hill MO, Jones EW (1978) Vegetation changes resulting from afforestation of rough grazing in Caeo Forest,
South Wales. J Ecol 66:433–456Hodge SJ, Peterken GF (1998) Deadwood in British forests: Priorities and a strategy. Forestry 71:99–112Howard PC, Viskanic P, Davenport TRB et al (1998) Complementarity and the use of indicator groups for
reserve selection in Uganda. Nature 394:472–475Humphrey JW (2005) Benefits to biodiversity from developing old-growth conditions in British upland
spruce plantations: a review and recommendations. Forestry 78:33–53Humphrey JW, Davey S, Peace AJ et al (2002) Lichens and bryophyte communities of planted and semi-
natural forests in Britain: the influence of site type, stand structure and deadwood. Biol Conserv107:165–180
Humphrey JW, Hawes C, Peace AJ et al (1999) Relationships between insect diversity and habitat char-acteristics in plantation forests. For Ecol Manage 113:11–21
Humphrey JW, Newton AC, Peace AJ et al (2000) The importance of conifer plantations in northern Britainas a habitat for native fungi. Biol Conserv 96:241–252
Humphrey JW, Peace AJ (2003) Deadwood. In: Humphrey J, Ferris R, Quine C (eds) Biodiversity inBritain’s planted forests. Forestry Commission, Edinburgh, pp 41–49
Iremonger S, Gittings T, Smith GF et al (2006) Investigation of experimental methods to enhance biodi-versity in plantation forests. Report for COFORD and EPA, Dublin
Iremonger S, O’Halloran J, Kelly DL et al (2007) Biodiversity in Irish plantation forests. EnvironmentalProtection Agency, Dublin
Jones EW (1959) Biological flora of the British isles: Quercus L. J Ecol 47:169–222Jonsson BG, Jonsell M (1999) Exploring potential biodiversity indicators in boreal forests. Biodivers Cons
8:1417–1433Kati V, Devillers P, Dufrene M, et al (2004) Testing the value of six taxonomic groups as biodiversity
indicators at a local scale. Conserv Biol 18:667–675Kelly DL (1981) The native forest vegetation of Killarney, south-west Ireland: an ecological account. J Ecol
69:437–472Kelly DL (2005) Woodland on the western fringe: Irish oakwood diversity and the challenges of conser-
vation. Bot J Scot 57:21–40Key RS (1995) Invertebrate conservation and new woodland in Britain. In: Ferris-Kaan R (ed) The ecology
of woodland creation. John Wiley & Sons, ChichesterLarsson T-B (2001) Biodiversity evaluation tools for European forests. Ecological bulletins, vol 50.
Blackwell, Oxford
Biodivers Conserv (2008) 17:991–1015 1013
123
Lawton JH, Bignell DE, Bolton B et al (1998) Biodiversity inventories, indicator taxa and effects of habitatmodification in tropical forest. Nature 391:72–76
Legendre P, Legendre L (1998) Numerical ecology. Developments in environmental modelling, vol 20. 2ndEnglish edn. Elsevier, Amsterdam
Leppaniemi P, Hallikainen V, Mikkola K et al (1998) Forest structure classes in central Finnish Lapland.Scand J For Res 13:442–450
Lindenmayer DB (1999) Future directions for biodiversity conservation in managed forests: indicatorspecies, impact studies and monitoring programs. For Ecol Manage 115:277–287
Lindenmayer DB, Franklin JF, Fischer J (2006) General management principles and a checklist of strategiesto guide forest biodiversity conservation. Biol Conserv 131:433–445
Lindenmayer DB, Margules CR, Botkin DB (2000) Indicators of biodiversity for ecologically sustainableforest management. Conserv Biol 14:941–950
Magurran AE (2004) Measuring biological diversity. Blackwell Publishing, OxfordMcCune B, Mefford MJ (1997) PC-ORD for Windows, version 4.25. MjM Software, Glenedon Beach,
OregonMcElhinny C, Gibbons P, Brack C et al (2005) Forest and woodland stand structural complexity: its
definition and measurement. For Ecol Manage 218:1–24McNett B, Rypstra A (2000) Habitat selection in a large orb-weaving spider: vegetational complexity
determines site selection and distribution. Ecol Entomol 25:423–432Mueller-Dombois D, Ellenberg H (1974) Aims and methods of vegetation ecology. Wiley, New YorkNegi HR, Gadgil M (2002) Cross-taxon surrogacy of biodiversity in the Indian Garhwal Himalaya. Biol
Conserv 105:143–155Niemela J, Haila Y, Punttila P (1996) The importance of small-scale heterogeneity in boreal forest-floor
invertebrates across the succession gradient. Ecography 19:352–368Niemi GJ, McDonald ME (2004) Application of ecological indicators. Annu Rev Ecol Evol Syst 35:89–111Noss RF (1990) Indicators for monitoring biodiversity: a hierarchical approach. Conserv Biol 4:355–364Noss RF (1999) Assessing and monitoring forest biodiversity: a suggested framework and indicators. For
Ecol Manage 115:135–146O’Halloran J, Gittings T, Smith GF et al (2004) Biodiversity of plantation forests in Ireland: Bioforest
project. In: MacLennan L (ed) Opportunities for Biodiversity Enhancement in Plantation Forests.COFORD, Dublin, Cork, pp 29–38
O’Halloran J, Walsh PM, Giller PS et al (1999) An assessment of avian biodiversity and opportunities forenhancement in Ireland’s forests: preliminary results. Ir For 55:2–14
Oertli S, Muller A, Steiner D et al (2005) Cross-taxon congruence of species diversity and communitysimilarity among three insect taxa in a mosaic landscape. Biol Conserv 126:195–205
Oxbrough AG, Gittings T, O’Halloran J et al (2005) Structural indicators of spider communities across theforest plantation cycle. For Ecol Manage 212:171–183
Pausas JG, Austin MP (2001) Patterns of plant species richness in relation to different environments: anappraisal. J Vegetat Sci 12:153–166
Pharo EJ, Beattie AJ, Binns D (1999) Vascular plant diversity as a surrogate for bryophyte and lichendiversity. Conserv Biol 13:282–292
Pithon J, O’Halloran J, Moles R (2005) The influence of coniferous afforestation on lowland farmland birdcommunities in Ireland: different seasons and landscape contexts. Landscape Urban Plann 71:91–103
Pitkanen S (1997) Correlation between stand structure and ground vegetation: an analytical approach. PlantEcol 131:109–126
Prendergast JR, Quinn RM, Lawton JH et al (1993) Rare species, the coincidence of diversity hotspots andconservation strategies. Nature 365:335–337
Sætersdal M, Gjerde I, Blom HH et al (2003) Vascular plants as a surrogate species group in complementarysite selection for bryophytes, macrolichens, spiders, carabids, staphylinids, snails, and wood livingpolypore fungi in a northern forest. Biol Conserv 115:21–31
Simila M, Kouki J, Monkkonen M et al (2006) Co-variation and indicators of species diversity: can richnessof forest-dwelling species be predicted in northern boreal forests? Ecol Indicators 6:686–700
Smith AJE (2004) The moss flora of Britain and Ireland. 2nd edn. Cambridge University Press, CambridgeSmith G, Gittings T, Wilson M et al (2005) Assessment of biodiversity at different stages of the forest cycle.
Report for COFORD and EPA, Dublin http://www.coford.ie/iopen24/pub/pub/Project_files/312Report.pdf
Sneath PHA, Sokal RR (1973) Numerical taxonomy. W.H. Freeman, San FranciscoSokal RR, Rohlf FJ (1995) Biometry. 3rd edn. W.H. Freeman and Co., New YorkSommagio D (1999) Syrphidae: can they be used as environmental bioindicators? Agric Ecosys Environ
74:343–356
1014 Biodivers Conserv (2008) 17:991–1015
123

Southwood TRE (2000) Ecological methods with particular reference to the study of insect populations.Blackwell Science, Oxford
Speight MCD, Castella E (2001) An approach to interpretation of lists of insects using digitised biologicalinformation about the species. J Insect Conserv 5:131–139
Spies TA (1998) Forest structure: a key to the ecosystem. Northwest Sci 72:34–39Spies TA, Franklin JF, Thomas TB (1988) Coarse woody debris in Douglas-fir forests of western Oregon
and Washington. Ecology 69:1689–1702SPSS (2001) SPSS for Windows, version 11.0.1. SPSS, ChicagoStace C (1997) New flora of the British Isles. 2nd edn. Cambridge University Press, CambridgeVerheyen K, Guntenspergen GR, Biesbrouck B et al (2003) An integrated analysis of the effects of past land
use on forest herb colonization at the landscape scale. J Ecol 91:731–742Vessby K, Soderstrom B, Glimskar A et al (2002) Species-richness correlations of six different taxa in
Swedish seminatural grasslands. Conserv Biol 16:430–439Williams P, Faith D, Manne L et al (2006) Complementarity analysis: Mapping the performance of
surrogates for biodiversity. Biol Conserv 128:253–264Wilson MW, Pithon J, Gittings T et al (2006) Effects of growth stage and tree species composition on
breeding bird assemblages of plantation forests. Bird Study 53:225–236
Biodivers Conserv (2008) 17:991–1015 1015
123