Industry Monitor - Eurocontrol
10
Industry Monitor. Issue 207. 30/04/2019 Page 1 © EUROCONTROL 2019 Document Confidentiality Classification: White Due to the summer schedule starting a week later in 2019 than in 2018, European flight growth slowed down sharply to 1.4% in March 2019 compared with March 2018. For the first quarter of 2019, the flight growth of 2.4% was in line with the baseline forecast. Preliminary data for April 2019 show an increase of 1.2% in flights on April 2018. Airbus delivered 55 aircraft during the first quarter of 2019 and surpassed Boeing which recorded 24 aircraft deliveries for Europe. Brent crude oil prices surged to €63 per barrel in April, their strongest April in five years. Brent crude prices averaged €56 per barrel for the first quarter of 2019 marginally up from €55 for the same quarter in 2018. EUROCONTROL Statistics and Forecasts 2 Other Statistics and Forecasts 4 Passenger airlines 4 Oil 6 Cargo 7 Airports 7 Fares 9 Environment 9 Economy 10 Aircraft Manufacturing 10 Industry Monitor The EUROCONTROL bulletin on air transport trends Issue N°207. 29/04/2019
-
Upload
khangminh22 -
Category
Documents
-
view
0 -
download
0
Transcript of Industry Monitor - Eurocontrol
Industry Monitor. Issue 207. 30/04/2019 Page 1 © EUROCONTROL 2019 Document Confidentiality Classification: White
Due to the summer schedule starting a week later in 2019 than in 2018, European flight growth slowed down sharply to 1.4% in March 2019 compared with March 2018. For the first quarter of 2019, the flight growth of 2.4% was in line with the baseline forecast. Preliminary data for April 2019 show an increase of 1.2% in flights on April 2018.
Airbus delivered 55 aircraft during the first quarter of 2019 and surpassed Boeing which recorded 24 aircraft deliveries for Europe.
Brent crude oil prices surged to €63 per barrel in April, their strongest April in five years. Brent crude prices averaged €56 per barrel for the first quarter of 2019 marginally up from €55 for the same quarter in 2018.
EUROCONTROL Statistics and Forecasts 2
Other Statistics and Forecasts 4
Passenger airlines 4
Oil 6
Cargo 7
Airports 7
Fares 9
Environment 9
Economy 10
Aircraft Manufacturing 10
Industry Monitor The EUROCONTROL bulletin on air transport trends Issue N°207. 29/04/2019

Industry Monitor. Issue 207. 29/04/2019 Page 2 © EUROCONTROL 2019 Document Confidentiality Classification: White
EUROCONTROL Statistics and Forecasts
European flights in March 2019 Due to the summer schedule starting a week later in 2019 than in 2018, European flight growth (ECAC – European Civil Aviation Conference area) slowed down sharply to 1.4% in March 2019 compared with March 2018 and was at the low end of the forecast published in February 2019. The 1.4% growth for March was the weakest March growth rate since 2015. Preliminary data for April 2019 show an increase of 1.2% in flights on April 2018 (Figure 1). Seven states contributed the most to the growth of local traffic (excluding overflights) in Europe by adding more than 50 flights per day. The top three contributors were Austria (+97 flights/day), Germany (+87 flights/day), Italy (+78 flights/day). On the other hand, Turkey recorded 67 fewer flights per day and Sweden saw 55 fewer daily flights, both states owing to a weak internal flow and Belgium impacted by ATC industrial action recorded 34 fewer daily flights. The traditional scheduled segment remained the main driver of growth with 402 extra daily flights (including overflights) and posted an increase of 2.8%. The low-cost segment decelerated and increased by 1% from 4.9% growth in February and added 74 flights per day compared to 353 extra daily flights in February. Low-cost carriers like Ryanair and easyJet were impacted by the summer schedule with higher traffic levels starting a week later in 2019 compared with 2018. The charter segment declined by 1.8% whereas the all-cargo and business aviation segments were down by 4.4% and 3.8% respectively. The aircraft operators which added the most flights on a daily basis (vs. March 2018) were easyJet UK (+59 flights), Lufthansa (+59 flights), SAS (+57 flights) and Ryanair (+54 flights). The top five external European partners for average daily flights on flows in both directions were the United States (893 flights, up 2.9%), the Russian Federation (726 flights, up 6.6%), Morocco (364 flights, up 8.1%) the United Arab Emirates (350 flights, up 1.5%) and Israel (312 flights/day, down 1.0%) (EUROCONTROL/STATFOR, April).
Figure 1: Monthly European Traffic and Forecast (based on the 7-year forecast Feb 2019).
Industry Monitor. Issue 207. 29/04/2019 Page 3 © EUROCONTROL 2019 Document Confidentiality Classification: White
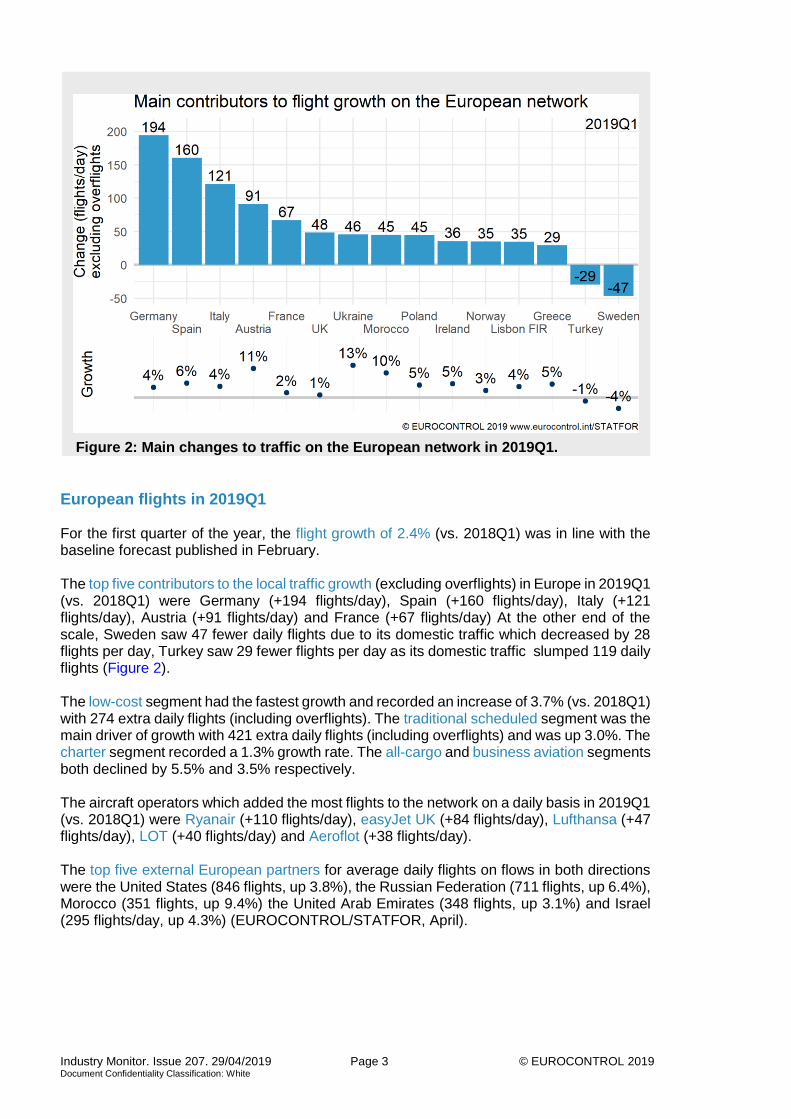
European flights in 2019Q1 For the first quarter of the year, the flight growth of 2.4% (vs. 2018Q1) was in line with the baseline forecast published in February. The top five contributors to the local traffic growth (excluding overflights) in Europe in 2019Q1 (vs. 2018Q1) were Germany (+194 flights/day), Spain (+160 flights/day), Italy (+121 flights/day), Austria (+91 flights/day) and France (+67 flights/day) At the other end of the scale, Sweden saw 47 fewer daily flights due to its domestic traffic which decreased by 28 flights per day, Turkey saw 29 fewer flights per day as its domestic traffic slumped 119 daily flights (Figure 2). The low-cost segment had the fastest growth and recorded an increase of 3.7% (vs. 2018Q1) with 274 extra daily flights (including overflights). The traditional scheduled segment was the main driver of growth with 421 extra daily flights (including overflights) and was up 3.0%. The charter segment recorded a 1.3% growth rate. The all-cargo and business aviation segments both declined by 5.5% and 3.5% respectively. The aircraft operators which added the most flights to the network on a daily basis in 2019Q1 (vs. 2018Q1) were Ryanair (+110 flights/day), easyJet UK (+84 flights/day), Lufthansa (+47 flights/day), LOT (+40 flights/day) and Aeroflot (+38 flights/day). The top five external European partners for average daily flights on flows in both directions were the United States (846 flights, up 3.8%), the Russian Federation (711 flights, up 6.4%), Morocco (351 flights, up 9.4%) the United Arab Emirates (348 flights, up 3.1%) and Israel (295 flights/day, up 4.3%) (EUROCONTROL/STATFOR, April).
Figure 2: Main changes to traffic on the European network in 2019Q1.

Industry Monitor. Issue 207. 29/04/2019 Page 4 © EUROCONTROL 2019 Document Confidentiality Classification: White
All-causes airline delays in March 2019
Based on data from airlines for delays from all causes, the average delay per flight on departure was 11.5 minutes in March 2019, this was a decrease of 2.3 minutes per flight when compared with March 2018 when the average delay per flight was 13.8 minutes. Analysis of the delay causes shows that reactionary delay contributed 5.4 minutes to the average delay per flight in March 2019. In March 2019, 39.6% of the flights departed within the 5 minutes threshold before or after the scheduled departure time (STD); an increase of 1.6 points from 38.0% compared to previous year. Flights delayed >30 minutes from all-causes decreased from 12.7% to 10.8% (EUROCONTROL/CODA, April).
Other Statistics and Forecasts IATA reported that European scheduled passenger traffic increased by 7.3% in February 2019 (vs. February 2018). Capacity was up 7.7% and passenger load factors were 81.5%, a 0.3 percentage point decrease on February 2018 (IATA, 4 April). ACI reported that overall passenger counts at European airports saw an increase of 5% in February 2019 (vs. February 2018) from an increase of 4.2% in January. Total aircraft movements were up 3.5% on February 2018 (ACI, 9 April).
Passenger airlines
Traffic Statistics: First Quarter update
Figure 3 and Figure 4 compare 2019Q1 figures with 2018Q1 figures for most of the main European carriers (with the exception of easyJet which now only reports passenger statistics within its quarterly reports). Pegasus Airlines traffic results were not available at the time of publication. In addition to the number of passengers (PAX), passenger capacity is measured in available seat kilometers (ASK), traffic is measured in revenue passenger kilometers (RPK) and load factor as a percentage (%).
Figure 3: Main carriers’ traffic statistics – 2019Q1 v. 2018Q1.

Industry Monitor. Issue 207. 29/04/2019 Page 5 © EUROCONTROL 2019 Document Confidentiality Classification: White
Norwegian has rescheduled the delivery of part of its Airbus A320neo and A321LR aircraft order with the aim to reduce costs over the next two years and to focus more on profitability than growth. The carrier has also delayed the deliveries of Boeing B737 MAX aircraft it had on order. To date Norwegian operates an all-Boeing fleet of 787 and 737 family aircraft (Norwegian, 10 April). Flybe will end jet operations from four UK airports (Exeter, Norwich, Cardiff and Doncaster Sheffield) with the start of the winter schedule, as part of its strategy to reduce its aircraft fleet and will return its Embraer E195 aircraft to its lessors, starting with six aircraft to be returned this year (Flybe, 3 April).
Air France-KLM and Greek regional Sky Express have signed a partnership agreement to connect Paris CDG and Amsterdam to 24 Greek islands via Athens (Air France-KLM, 5 April). Ukraine Air International will reduce its summer schedule as the delivery of its three Boeing B737 MAX8 aircraft is postponed until the grounding is lifted. UIA will therefore reduce frequencies on its routes to Athens, Istanbul and Erevan (UIA, 4 April). Air Malta is reportedly planning to expand its network and launch new routes to Scandinavia, Eastern Europe and long haul routes to India and sub-Saharan regions after posting its first profit in almost two decades in 2018 (Times of Malta, 23 March). Ryanair has opened a new base at London Southend with three aircraft and 14 new routes to Denmark, Spain, France, Greece, Ireland, Italy, Portugal and Romania (Ryanair, 2 April). Ryanair has launched a connection service on 27 new routes via Brussels Charleroi allowing passengers to arrive at and depart from Brussels Charleroi while remaining in a transit zone and have their checked-in baggage transferred through to their final destination (Ryanair, 11 April). easyJet has set up a new base in Nantes -its seventh base in France- with three Airbus A320 aircraft and has launched 14 new routes to reach 27 destinations operated from the airport (easyJet, 5 April).
Figure 4: Main carriers’ load factors – 2019Q1 v. 2018Q1.

Industry Monitor. Issue 207. 29/04/2019 Page 6 © EUROCONTROL 2019 Document Confidentiality Classification: White
SAS has taken a number of initiatives to reduce its emissions, among which CO2 offsetting of 1.5 million youth tickets that the airline has achieved since April 2018 and the phase out of all its Boeing B737 and Airbus A320 aircraft which will be replaced with a single type fleet of Airbus A320neo aircraft between 2019 and 2023 (SAS, 9 April). US JetBlue will launch transatlantic flights in 2021 operating an Airbus A321LR aircraft to London from New York and Boston (JetBlue, 10 April). UK start-up Faradair plans to launch passenger operations aboard an 18-seat Bio Electric Hybrid Aircraft (BEHA) by 2025. The aircraft will be powered by a combination of bio-diesel and electricity and will be able to fly London to Manchester in circa 42 minutes (vs. currently one-hour flight) (Faradair, 22 March).
Failures
Jet Airways (India) suspended all flights on 17 April after failing to raise funds to continue its operations. The airline had a fleet of over 100 aircraft and flew 55 destinations (36 domestic routes, 19 intercontinental routes with UK, the Netherlands and France as its main European destinations) (Jet Airways, 17 April).
Oil Oil prices surged to €63 per barrel in April 2019, their strongest April in five years. Brent crude prices averaged €56 per barrel for the first quarter of 2019 up from €55 per barrel for the same quarter in 2018. Converted indices for Kerosene and Brent are shown in Figure 5. In its Short-Term Energy Outlook, EIA forecasts Brent crude oil prices will average €58 per barrel in 2019 and €56 per barrel in 2020 (at current exchange rate) compared with an average of €60 per barrel in 2018 (EIA, 9 April).
Figure 5: Brent and kerosene prices.

Industry Monitor. Issue 207. 29/04/2019 Page 7 © EUROCONTROL 2019 Document Confidentiality Classification: White
Cargo The top 5 departure airports for all-cargo flights in 2019Q1 (growth on 2018Q1) were as follows:
Airports Frankfurt was the busiest European airport (based on the number of IFR departures) during 2019Q1 (+3% on 2018Q1) owing mainly to low-cost flights which went up 8.5% and to the detriment of Amsterdam which declined to second place and recorded a 0.2% decrease partly due to the charter and all-cargo segments which went down 38% and 17% respectively. Compared with 2018Q1, Rome Fiumicino (+5.6%), Barcelona (+4.5%) and Madrid (+4.3%) saw the biggest increases whereas Istanbul Atatürk recorded a 1.6% decrease owing to the low-cost and charter segments which declined by 35% and 22% respectively (Figure 6). Note: non-commercial flights (general aviation and military flights) are included.
Figure 6: Main departure airports in Europe in 2019Q1.

Industry Monitor. Issue 207. 29/04/2019 Page 8 © EUROCONTROL 2019 Document Confidentiality Classification: White
Passenger traffic and commercial aircraft movements at the top five European airports (based on the number of flights) in 2019Q1 (growth on 2018Q1) were as follows:
The top 5 departure airports for traditional scheduled flights in 2019Q1 (growth on 2018Q1 were as follows:
The top 5 departure airports for low-cost flights in 2019Q1 (growth on 2018Q1) were as follows:
The ADP group (Aéroports de Paris) published its five-year (2021-2025) investment plan including the construction of a fourth terminal at CDG that will be able to handle up to 40 million passengers a year when completed in 2037. Construction work will start in 2021 with a first section to be operational in 2028 to accommodate up to 10 million passengers per annum. The project is currently subject to a public consultation. In 2018, Paris CDG handled 72.2 million passengers (ADP, 2 April). Turkish Airlines transferred all operations to its new home base, Istanbul Airport on 6 April (IM206). Atatürk is now closed for commercial flights (Turkish Airlines, 6 April).
Rank Airport Passenger traffic Aircraft movements
1 Frankfurt 14.8 million (+2.5%) 117K (+3.0%)
2 Amsterdam 15.5 million (+1.6%) 116K ( -0.1%)
3 London Heathrow 17.9 million (+1.4%) 113K (+0.3%)
4 Paris CDG 16.5 million (+5.7%) 112K (+3.9%)
5 Istanbul Ataturk 15.2 million (- 2.2%) 105K ( -2.0%)
Source: airport reports, April 2019
Rank Departure Airport Average Daily Departures in 2019Q1 Growth on 2018Q1
1 London Heathrow 599 0.6%
2 Frankfurt 559 2.6%
3 Istanbul Ataturk 506 1.2%
4 Paris CDG 492 3.5%
5 Amsterdam 459 0.7%
source: EUROCONTROL/STATFOR
Rank Departure Airport Average Daily Departures in 2019Q1 Growth on 2018Q1
1 Barcelona 266 4.6%
2 London Gatwick 225 -1.0%
3 London Stansted 205 4.4%
4 Istanbul Sabiha Gökcen 186 5.9%
5 Dusseldorf 156 14.3%
source: EUROCONTROL/STATFOR
Industry Monitor. Issue 207. 29/04/2019 Page 9 © EUROCONTROL 2019 Document Confidentiality Classification: White
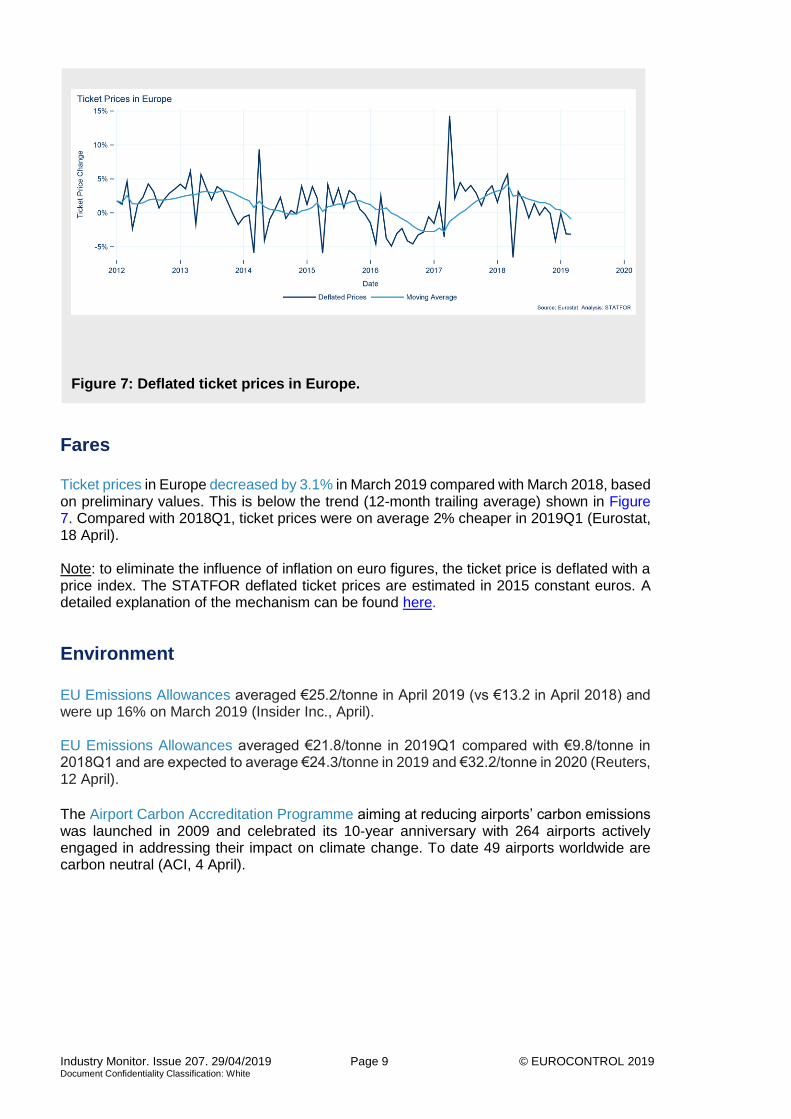
Fares Ticket prices in Europe decreased by 3.1% in March 2019 compared with March 2018, based on preliminary values. This is below the trend (12-month trailing average) shown in Figure 7. Compared with 2018Q1, ticket prices were on average 2% cheaper in 2019Q1 (Eurostat, 18 April). Note: to eliminate the influence of inflation on euro figures, the ticket price is deflated with a price index. The STATFOR deflated ticket prices are estimated in 2015 constant euros. A detailed explanation of the mechanism can be found here.
Environment
EU Emissions Allowances averaged €25.2/tonne in April 2019 (vs €13.2 in April 2018) and were up 16% on March 2019 (Insider Inc., April). EU Emissions Allowances averaged €21.8/tonne in 2019Q1 compared with €9.8/tonne in 2018Q1 and are expected to average €24.3/tonne in 2019 and €32.2/tonne in 2020 (Reuters, 12 April).
The Airport Carbon Accreditation Programme aiming at reducing airports’ carbon emissions was launched in 2009 and celebrated its 10-year anniversary with 264 airports actively engaged in addressing their impact on climate change. To date 49 airports worldwide are carbon neutral (ACI, 4 April).
Figure 7: Deflated ticket prices in Europe.
Industry Monitor. Issue 207. 29/04/2019 Page 10 © EUROCONTROL 2019 Document Confidentiality Classification: White
Economy Euro area economy indicator updates: Annual inflation was 1.4% in March 2019 up from 1.3% in March 2018; Unemployment rate was 7.8% in February 2019 compared with 8.5% in February 2018; GDP rose by 1.8% in 2018 (from a 6.7% growth rate in Ireland to a 0.9% growth rate in Italy) compared with 2.4% in 2017 (EUROSTAT, April).
Aircraft Manufacturing
Boeing recorded 68 net commercial orders during 2019Q1 compared with 209 aircraft during 2018Q1 and delivered 137 aircraft (from 178 aircraft in 2018Q1) of which 24 were destined for the European market (Boeing, April) Airbus posted a negative balance of -58 aircraft orders owing to 120 cancellations (including cancellations of 31 A380, 40 A350-900 and 33 A320neo aircraft cancellations) in 2019Q1 compared with 45 net commercial orders (of which 20 A380 aircraft) in 2018Q1. Airbus delivered 162 aircraft (from 120 aircraft in 2018Q1) of which 55 aircraft (including 25 A320neo, 16 A321neo and 4 A350-900 aircraft) were meant for Europe (Airbus, April). Boeing will temporarily cut production of its B737 Max aircraft by 20% from 52 a month to 42 a month starting mid-April. This slowdown will allow the manufacturer to focus on software certification that will allow the grounded aircraft to fly again (Boeing, 5 April). The Commercial Aircraft Corporation of China (COMAC) presented its first business jet aircraft at the Asian Business Aviation Conference and Exhibition (ABACE 2019). The bizjet is based on the manufacturer’s regional model ARJ21 aircraft. The new jet named COMAC Business Jet (CBJ) will be able to seat 12 to 29 passengers and have a range of 5,500 km (COMAC, 16 April).
Supporting European Aviation
© 2019 EUROCONTROL This document is published by EUROCONTROL for information purposes. It may be copied in whole or in part, provided that EUROCONTROL is mentioned as the source and it is not used for commercial purposes (i.e. for financial gain). The information in this document may not be modified without prior written permission from EUROCONTROL. STATFOR, the EUROCONTROL Statistics and Forecast Service [email protected] www.eurocontrol.int/statfor
The EUROCONTROL Statistics and Forecast Service (STATFOR)
is ISO 9001:2008 certified.
The EUROCONTROL Statistics and Forecast Service (STATFOR)
is ISO 9001:2008 certified.is ISO 9001:2015 certified.