Technical note on En Route Capacity - Eurocontrol
113
TECHNICAL NOTE ON EN ROUTE CAPACITY A PERSPECTIVE ON ALL ASPECTS OF EN ROUTE CAPACITY Technical note prepared by the EUROCONTROL Performance Review Unit (PRU) and commissioned by the Performance Review Commission (PRC) December 2020
-
Upload
khangminh22 -
Category
Documents
-
view
0 -
download
0
Transcript of Technical note on En Route Capacity - Eurocontrol

TECHNICAL NOTE ON EN ROUTE CAPACITY
A PERSPECTIVE ON ALL ASPECTS OF EN ROUTE CAPACITY
Technical note prepared by the EUROCONTROL Performance Review Unit (PRU) and commissioned by the Performance Review Commission (PRC)
December 2020

Technical note on en route capacity – a perspective on all aspects of en route capacity
BACKGROUND
This Technical Note, commissioned by the Performance Review Commission (PRC) has been prepared by the EUROCONTROL Performance Review Unit (PRU). The PRC conducts independent measurement, assessment and review of the performance of the Pan-European Air Navigation Services (ANS) system, including its contribution to the efficiency of Pan-European aviation. The PRC strives to identify future improvements and makes recommendations as appropriate. The PRC maintains open and transparent dialogue with relevant parties, including but not limited to States, Air Navigation Service Providers, Airspace Users, Airports, social dialogue partners, civil-military organisations, international and national organisations, etc. The PRC conducts research into the development of performance measurement. This includes, inter alia, investigating how performance could best be described/measured in the long-term, developing and testing proposals for future indicators and metrics and contributing to future improvements in performance. The PRC disseminates the results of its analysis to relevant parties, provided that no sensitive data are involved, in order to demonstrate the PRC’s commitment to transparency and to promote the application of PRC analysis. The PRC produces independent ad-hoc studies, either on its own initiative and/or at the request of relevant parties. The PRC’s website address is: https://www.eurocontrol.int/air-navigation-services-performance-review
NOTICE The PRU has made every effort to ensure that the information and analysis contained in this document are as accurate and complete as possible. Should you find any errors or inconsistencies we would be grateful if you could please bring them to the PRU’s attention by sending an email to: [email protected].
COPYRIGHT NOTICE AND DISCLAIMER
© EUROCONTROL, 96, rue de la Fusée, B-1130 Brussels, Belgium, www.eurocontrol.int
This document is published in the interest of the exchange of information and may be copied in whole or in part providing that the copyright notice and disclaimer are included. The information contained in this document may not be modified without prior written permission from the Performance Review Unit.
The views expressed herein do not necessarily reflect the official views or policy of EUROCONTROL, which makes no warranty, either implied or express, for the information contained in this document, neither does it assume any legal liability or responsibility for the accuracy, completeness or usefulness of this information.

Technical note on en route capacity – a perspective on all aspects of en route capacity
DOCUMENT IDENTIFICATION SHEET
DOCUMENT DESCRIPTION
Technical note on En Route Capacity
DOCUMENT REFERENCE EDITION: EDITION DATE:
Technical note on en route capacity Final December 2020
Summary This Technical Note focuses on en route capacity in 10 ACCs managed by seven ANSPs. It shows how the various facets of capacity are managed: from planning future capacity, right through to deployment.
Its purpose is to raise awareness of the various aspects of capacity performance and to identify specific examples of how they inter-relate in different ACCs across the network.
The Technical Note also highlights areas where the PRC considers capacity performance could be improved These areas include, but are not limited to, identifying and resolving (or mitigating) capacity bottlenecks; correctly identifying the ANSP-related causes of capacity constraints that aggravate and magnify external constraints (such as ATC staffing); and deploying ATC capacity to meet traffic demand rather than constraining demand until it matches the level of deployed capacity.
Finally, the Technical Note strives to stimulate discussion about the interplay between the operations and the economics of providing air navigation services and in particular about how the economic metric ATCO hour productivity interacts with operational capacity performance.
The Technical Note is based on data up to February 2020. Since then the Covid-19 pandemic has hit the aviation industry particularly hard. The issues explored in this Technical Note may assist ANSPs when the crisis has eased and aviation starts to return to normal.
Keywords EUROCONTROL Performance Review Commission- capacity performance - declared capacity - deployed capacity - planned capacity - collapsed sectors - elementary sectors - capacity constraints - sector hours - ATCO hour productivity - ATFM delays.
CONTACT:
Performance Review Unit, EUROCONTROL, 96 Rue de la Fusée, B-1130 Brussels, Belgium. E-mail: [email protected] https://www.eurocontrol.int/air-navigation-services-performance-review
DOCUMENT INFORMATION
TYPE STATUS DISTRIBUTION Performance Review Report Draft General Public Report commissioned by the PRC Proposed Issue EUROCONTROL Organisation Technical Note Released Issue Restricted

3
T A B L E O F C O N T E N T S
1 INTRODUCTION ....................................................................................................................................... 6
2 BACKGROUND ......................................................................................................................................... 6
3 EXPECTATIONS FOR CAPACITY PERFORMANCE ....................................................................................... 7
4 TYPES OF CAPACITY: DECLARED, DEPLOYED AND PLANNED .................................................................... 7
5 REVIEW OF DECLARED AND PLANNED CAPACITY..................................................................................... 9
6 REVIEW OF ATTRIBUTION OF ATFM DELAY CAUSE ................................................................................ 11
7 REVIEW OF DEPLOYED SECTOR HOURS.................................................................................................. 12
8 REVIEW OF ECONOMIC INDICATOR ATCO- HOUR PRODUCTIVITY ......................................................... 13
9 SCOPE OF THE PRC REVIEW OF EN ROUTE CAPACITY ............................................................................. 14
10 PRC FINDINGS AND LINKS TO EXISTING PC RECOMMENDATIONS ......................................................... 14
10.1 DECLARED CAPACITY ................................................................................................................................. 14 10.2 PLANNED CAPACITY .................................................................................................................................. 15 10.3 DEPLOYED CAPACITY ................................................................................................................................. 16 10.4 REVIEW OF SECTOR HOURS ........................................................................................................................ 18 10.5 ECONOMIC INDICATOR ‘ATCO-HOUR PRODUCTIVITY’ AND OPERATIONS: CAUSATION OR CORRELATION .................... 18
ANNEX 1: ACC ANALYSIS ................................................................................................................................ 20
11 TEN MOST CONSTRAINING ACCS ........................................................................................................... 20
11.1 GERMANY: KARLSRUHE UAC ..................................................................................................................... 21 Review of evolution of declared capacity from 2012 to 2020 .................................................... 21 Review of capacity planning and implementation ..................................................................... 23 Review of attributed causes for ATFM regulations .................................................................... 24 Review of sector hours 2017 - 2019............................................................................................ 26 Review of economic indicator “ATCO- hour productivity” from 2017 – 2018 ............................ 26
11.2 FRANCE: MARSEILLE ACC .......................................................................................................................... 27 Review of evolution of declared capacity from 2012 to 2020 .................................................... 27 Review of capacity planning and implementation ..................................................................... 29 Review of attributed causes for ATFM regulations .................................................................... 30 Review of sector hours 2017 – 2019 ........................................................................................... 32 Review of economic indicator “ATCO- hour productivity” from 2017 – 2018 ............................ 32
11.3 AUSTRIA: WIEN ACC ................................................................................................................................ 33 Review of evolution of declared capacity from 2012 to 2020 .................................................... 33 Review of capacity planning and implementation ..................................................................... 34 Review of attributed causes for ATFM regulations .................................................................... 35 Review of sector hours 2017 – 2019 ........................................................................................... 37 Review of economic indicator “ATCO- hour productivity” from 2017 – 2018 ............................ 37
11.4 HUNGARY: BUDAPEST ACC ........................................................................................................................ 38 Review of evolution of declared capacity from 2012 to 2020 .................................................... 38 Review of capacity planning and implementation ..................................................................... 39 Review of attributed causes for ATFM regulations .................................................................... 40 Review of sector hours 2017 – 2019 ........................................................................................... 42 Review of economic indicator “ATCO- hour productivity” from 2017 – 2018 ............................ 42
11.5 GERMANY: LANGEN ACC .......................................................................................................................... 43 Review of evolution of declared capacity from 2012 to 2020 .................................................... 43 Review of capacity planning and implementation ..................................................................... 44 Review of attributed causes for ATFM regulations. ................................................................... 45 Review of sector hours 2017 - 2019............................................................................................ 47 Review of economic indicator “ATCO- hour productivity” from 2017 – 2018 ............................ 47
11.6 SPAIN: BARCELONA ACC ........................................................................................................................... 48

4
Review of evolution of declared capacity from 2012 to 2020 .................................................... 48 Review of capacity planning and implementation ..................................................................... 49 Review of attributed causes for ATFM regulations .................................................................... 50 Review of sector hours 2017 – 2019 ........................................................................................... 52 Review of economic indicator “ATCO- hour productivity” from 2017 – 2018 ............................ 52
11.7 BELGIUM: BRUSSELS ACC .......................................................................................................................... 53 Review of evolution of declared capacity from 2012 to 2020 .................................................... 53 Review of capacity planning and implementation ..................................................................... 53 Review of attributed causes for ATFM regulations .................................................................... 54 Review of sector hours 2017 - 2019............................................................................................ 56 Review of economic indicator “ATCO- hour productivity” from 2017 – 2018 ............................ 56
11.8 CROATIA: ZAGREB ACC ............................................................................................................................. 57 Review of evolution of declared capacity from 2012 to 2020 .................................................... 57 Review of capacity planning and implementation ..................................................................... 58 Review of attributed causes for ATFM regulations .................................................................... 59 Review of sector hours 2017 - 2019............................................................................................ 61 Review of economic indicator “ATCO- hour productivity” from 2017 – 2018 ............................ 61
11.9 GERMANY: BREMEN ACC .......................................................................................................................... 62 Review of evolution of declared capacity from 2012 to 2020 .................................................... 62 Review of capacity planning and implementation ..................................................................... 62 Review of attributed causes for ATFM regulations .................................................................... 63 Review of sector hours 2017 - 2019............................................................................................ 65 Review of economic indicator “ATCO- hour productivity” from 2017 – 2018 ............................ 65
11.10 FRANCE: REIMS ACC ............................................................................................................................ 66 Review of evolution of declared capacity from 2012 to 2020 .................................................... 66 Review of capacity planning and implementation: .................................................................... 67 Review of attributed causes for ATFM regulations. ................................................................... 68 Review of economic indicator “ATCO- hour productivity” from 2017 – 2018 ............................ 70
ANNEX 2: STAKEHOLDER FEEDBACK .............................................................................................................. 71
12 AUSTRO CONTROL: FEEDBACK .............................................................................................................. 71
13 CROATIA CONTROL: FEEDBACK ............................................................................................................. 82
14 DFS: FEEDBACK ...................................................................................................................................... 84
15 ENAIRE: FEEDBACK ................................................................................................................................ 97
16 HUNGAROCONTROL: FEEDBACK .......................................................................................................... 112
L I S T O F F I G U R E S Figure 1: Liquid in a beaker concept of static capacity and traffic ......................................................................... 8 Figure 2: Difference in deployed capacity .............................................................................................................. 8 Figure 3: Declared capacity and sector occupancy ............................................................................................... 10 Figure 4: Process for reviewing ATC staffing delays ............................................................................................. 12 Figure 5: Definition of ATCO hour productivity .................................................................................................... 14 Figure 6: ANSP accountability for adverse weather delays .................................................................................. 17 Figure 7: Evolution of capacity plans – Karlsruhe UAC ......................................................................................... 23 Figure 8: Alternative ATFM delay attribution – Karlsruhe UAC ............................................................................ 25 Figure 9: Sector hours in Karlsruhe UAC ............................................................................................................... 26 Figure 10: Evolution of capacity plans –Marseille ACC ......................................................................................... 29 Figure 11: Alternative ATFM attribution – Marseille ACC .................................................................................... 31 Figure 12: Sector hours – Marseille ACC............................................................................................................... 32 Figure 13: Evolution of capacity plans – Wien ACC .............................................................................................. 34 Figure 14: Alternative ATFM attributions Wien ACC ............................................................................................ 36 Figure 15: Sector hours in Wien ACC .................................................................................................................... 37 Figure 16: Evolution of capacity plans – Budapest ACC ........................................................................................ 39 Figure 17: Alternative ATFM attribution Budapest ACC ....................................................................................... 41

5
Figure 18: Sector hours Budapest ACC ................................................................................................................. 42 Figure 19: Evolution of capacity plans – Langen ACC ........................................................................................... 44 Figure 20: Alternative ATFM attribution – Langen ACC ........................................................................................ 46 Figure 21: Sector hours – Langen ACC .................................................................................................................. 47 Figure 22: Evolution of capacity plans – Barcelona ACC ....................................................................................... 49 Figure 23: Alternative ATFM attribution - Barcelona ACC .................................................................................... 51 Figure 24: Sector hours – Barcelona ACC ............................................................................................................. 52 Figure 25: Evolution of capacity plans Brussels ACC ............................................................................................ 53 Figure 26: Alternative ATFM attribution – Brussels ACC ...................................................................................... 55 Figure 27: Sector hours – Brussels ACC ................................................................................................................ 56 Figure 28: Evolution of capacity plans Zagreb ACC ............................................................................................... 58 Figure 29: Alternative ATFM attribution – Zagreb ACC ........................................................................................ 60 Figure 30: Sector hours Zagreb ACC ..................................................................................................................... 61 Figure 31: Evolution of declared capacity – Bremen ACC ..................................................................................... 62 Figure 32: Alternative ATFM attribution – Bremen ACC....................................................................................... 64 Figure 33: Sector hours – Bremen ACC ................................................................................................................. 65 Figure 34: Evolution of capacity plans - Reims ACC .............................................................................................. 67 Figure 35: Alternative ATFM attribution – Reims ACC.......................................................................................... 69 Figure 36: Sector hours – Reims ACC .................................................................................................................... 70
L I S T O F T A B L E S Table 1: Comparison of ATCO hour productivity and operational indicators....................................................... 19 Table 2: Scope of Technical Note.......................................................................................................................... 20 Table 3: Evolution of declared capacity from 2012 to 2020 ................................................................................. 22 Table 4: Sectors with Staffing delays - Karlsruhe UAC .......................................................................................... 24 Table 5: ATCO hour productivity - Karlsruhe UAC ................................................................................................ 26 Table 6: Evolution of declared capacity - Marseille ACC ...................................................................................... 28 Table 7: Sectors with Staffing delays - Marseille ACC ........................................................................................... 30 Table 8: ATCO hour productivity - Marseille ACC ................................................................................................. 32 Table 9: Evolution of declared capacity - Wien ACC ............................................................................................. 33 Table 10: Sectors with staffing delays - Wien ACC ............................................................................................... 35 Table 11: ATCO hour productivity - Wien ACC ..................................................................................................... 37 Table 12: Evolution of declared capacity - Budapest ACC .................................................................................... 38 Table 13: Sectors with staffing delays - Budapest ACC ......................................................................................... 40 Table 14: ATCO hour productivity - Budapest ACC ............................................................................................... 42 Table 15: Evolution of declared capacity - Langen ACC ........................................................................................ 43 Table 16: Sectors with Staffing delays - Langen ACC ............................................................................................ 45 Table 17: ATCO hour productivity - Langen ACC .................................................................................................. 47 Table 18: Evolution of declared capacity - Barcelona ACC ................................................................................... 48 Table 19: Sectors with staffing delays - Barcelona ACC ........................................................................................ 50 Table 20: ATCO hour productivity - Barcelona ACC .............................................................................................. 52 Table 21: Evolution of declared capacity - Brussels ACC ...................................................................................... 53 Table 22: Sectors with staffing delays - Brussels ACC ........................................................................................... 54 Table 23: ATCO hour productivity - Brussels ACC ................................................................................................. 56 Table 24: Evolution of declared capacity - Zagreb ACC ........................................................................................ 57 Table 25: Sectors with staffing delays - Zagreb ACC ............................................................................................. 59 Table 26: ATCO hour productivity - Zagreb ACC ................................................................................................... 61 Table 27: Evolution of declared capacity - Bremen ACC ....................................................................................... 62 Table 28: Sectors with staffing delays - Bremen ACC ........................................................................................... 63 Table 29: ATCO hour productivity - Bremen ACC ................................................................................................. 65 Table 30: Evolution of declared capacity - Reims ACC .......................................................................................... 66 Table 31: Sectors with staffing delays - Reims ACC .............................................................................................. 68 Table 32: ATCO hour productivity - Reims ACC .................................................................................................... 70

6
1 INTRODUCTION
This Technical Note focuses on en route capacity in seven ANSPs (10 ACCs). It reviews how ANSPs manage the various facets of capacity: from planning future capacity, right through to deployment.
Its purpose is to raise awareness of the various aspects of capacity performance and to identify specific examples of how they inter-relate in different types of ACCs across the network.
The technical note also highlights areas where the PRC considers capacity performance could be improved. These areas include, but are not limited to, identifying and resolving (or mitigating) capacity bottlenecks; correctly identifying the ANSP-related causes of capacity constraints that aggravate and magnify external constraints (such as ATC staffing); and deploying ATC capacity to meet traffic demand rather than constraining demand until it matches the level of deployed capacity.
The capacity planning process is run by EUROCONTROL NM through the agreed processes and is documented in the Network Operations Plan.
Finally, the Technical Note strives to stimulate discussion about the interplay between the operations and the economics of providing air navigation services and in particular about how the economic metric ATCO hour productivity interacts with operational capacity performance.
The ACC analysis is contained in Annex 1.
The Performance Review Commission (PRC), in accordance with its Terms of Reference, including the requirements to engage with stakeholders and to act in a transparent manner, has provided each of the ANSPs listed with an advance copy of the document requesting comments and feedback. Their responses, where provided, are included in Annex 2.
2 BACKGROUND
The PRC has been reviewing aspects of capacity performance for many years in its annual Performance Review Report (PRR), which it submits to the Provisional Council (PC) together with draft proposals for improving ANS performance. The PC has adopted the following recommendations relating to en route capacity performance:
PC 41 (May 2014)
The Provisional Council urged States to ensure an accurate and consistent classification of ATFM delays to enable constraints on European ATM to be correctly identified and resolved or mitigated.
1.
PC 43 (May 2015)
The Provisional Council: (i) requested Member States to task their ANSPs to develop and implement capacity
plans which are, at a minimum, in line with the Reference Capacity Profile (from the NOP); and to ensure that capacity is made available during peak demand;
(ii) asked the Director General to report on those States that have insufficient capacity plans compared to the Reference Capacity Profile to PC 44 (December 2015).
2.
PC 45 (June 2016)
The Provisional Council requested Member States to task their ANSPs to provide the capacity to meet the demand instead of regulating demand to meet the reduced capacity.
3.
The Provisional Council requested Member States’ ANSPs to accurately identify the specific capacity constraints that adversely impact the service provided to airspace users, enhancing capacity provision through better transparency.
4.
The Provisional Council requested Member States’ ANSPs to review sector capacities, both with and without airspace restrictions to increase network performance. 5.
The Provisional Council requested Member States’ ANSPs to coordinate effectively, with the Network Manager, the planning and implementation of all changes to the ATM system that could adversely affect operations.
6.

7
PC 49 (June 2018)
The Provisional Council recalled that PC/45 (2016) had requested Member States to task their ANSPs to provide sufficient capacity to meet demand and to accurately identify capacity constraints that adversely impact service provision.
7.
The Provisional Council requested the Director General and the Member States to strengthen the ATFCM process by developing and adopting strict procedures for attributing ATFM delay causes, through the NM/NMB, instead of the current guidelines that lead to inconsistencies and opacity in monitoring capacity performance.
8.
PC 51 (June 2019)
The Provisional Council agreed that Member States be requested to task their ANSPs to: a) support the Network Manager in mitigating existing capacity shortfalls by taking a
network centric instead of a local approach; b) work with the Network Manager to ensure that future capacity planning and
deployment show sufficient flexibility to meet forecast traffic demand in a cost efficient manner;
c) work with the Network Manager and airspace users to identify airspace which is likely to have genuine structural issues in the future and which therefore may require more substantial changes in airspace design.
9.
The Provisional Council agreed to take the necessary steps to ensure the implementation of its recommendation at PC/49 (2018) which requested “the Director General and the Member States to strengthen the ATFCM process by developing and adopting strict procedures for attributing ATFM delay causes, through the NM/NMB, instead of the current guidelines that lead to inconsistencies and opacity in monitoring capacity performance.”
10.
3 EXPECTATIONS FOR CAPACITY PERFORMANCE
ICAO1 states the expectations of the ATM community in regards to capacity:
“The global ATM system should exploit the inherent capacity to meet airspace user demands at peak times and locations while minimizing restrictions on traffic flow.
To respond to future growth, capacity must increase, along with corresponding increases in efficiency, flexibility and predictability, while ensuring that there are no adverse impacts on safety and giving due consideration to the environment.
The ATM system must be resilient to service disruption and the resulting temporary loss of capacity.”
Airspace users, including ERA, IATA, A4E, IACA and EBAA, have clarified their expectations in regards to capacity as:
“The airspace user community want to operate their declared gate-to-gate flight schedule in the most cost-efficient and optimized manner, based on their individual trajectory business requirements, enabled by transparency and auditability of imposed constraints, in all phases of flight, in order to facilitate improvements in the ATM system.
Performance improvement in air navigation service provision must therefore be related to the reduction in impact of constraints imposed by service providers.”
4 TYPES OF CAPACITY: DECLARED, DEPLOYED AND PLANNED
Capacity performance: the provision of sufficient capacity to meet traffic demand is determined by the available capacity in specific sectors and by the configuration of sectors.
1 Page D-1 Appendix D of Document 9854: Global Air Traffic Management Operational Concept

8
Due to operational characteristics such as airspace structures, technical equipment and or ATCO staffing and expertise, an ANSP might determine that an elementary sector can normally accommodate a certain number of aircraft per hour: the declared capacity.
There will be times when the number of aircraft per hour permitted in the sector will be less than the declared capacity, possibly due to external factors such as adverse weather, sovereign factors such as military activity, or purely internal – ANSP factors such as ATC equipment serviceability. This is the deployed capacity. (Deploying less than the declared capacity only becomes problematic when the traffic demand is higher than the level of deployed capacity).
ANSPs will also group elementary sectors into larger collapsed sectors for economic reasons. Opening fewer sectors within a given airspace requires fewer ATCOs to be present, potentially enabling the deployment of a higher number of ATCOs during periods of peak traffic demand – more effective use of existing resources. However, collapsed sectors have less declared capacity than their constituent elements opened simultaneously – so it is important to ensure that the reduced capacity deployed is sufficient to accommodate the traffic demand.
Figure 1: Liquid in a beaker concept of static capacity and traffic
Figure 1 shows that a container can hold different amounts of liquid, up to a maximum, and that declared capacity is neither a minimum nor a maximum limit. It further shows that impediments to capacity reduce the amount of liquid (traffic) within the declared capacity.
Figure 2: Difference in deployed capacity
Figure 2 shows the potential difference in deployed capacity for the same volume of airspace. If both sectors are open simultaneously, up to 60 aircraft can be accommodated (48 during military activity).
If the ANSP instead operates one collapsed sector, then a maximum of 45 aircraft can be accommodated (36 during military activity): a reduction of 25% capacity because ATC staff are not deployed to open both sectors.
Finally, in response to the requirements of future growth and, more importantly, to resolve existing capacity deficiencies, ANSPs must ensure that additional capacity is planned and implemented in airspace wherever traffic demand exceeds, or is likely to exceed, available capacity during peak periods.
Increasing capacity could potentially require the following actions:
• splitting of current elementary sectors, into two or more individual sectors, during peak traffic demand;
• adaptation of sector opening schemes to traffic demand patterns;
Maximum safe capacity
Occasional raised capacity ‘D+’
Declared capacity ‘D’
‘Normal’ capacity
buffer
Capacity limits reached with lower level of traffic
Reduced capacity ‘D-’
Capacity impediments(Military activity, adverse weather etc.)
Maximum safe capacity
Traffic can be added until limits are reached
Declared capacity ‘D’

9
• if necessary and if flexible opening schemes are already in place, recruitment of additional controllers;
• eliminating bottlenecks created through the existing areas of responsibility of ACCs through the design of cross-border sectors taking fully into account traffic flows;
• harmonization of operational procedures between ATC units and harmonization of the utilization of the potential of the available infrastructure to enable sector capacity increase;
• increasing the declared capacity of elementary and collapsed sectors through the application of the solutions identified above
The solutions identified above are part of various initiatives that EUROCONTROL/NM has initiated with the ANSPs (Airspace Re-structuring, Operational Excellence, CAPAN studies, the capacity planning process, etc.) and it is strongly recommended that that they are fully implemented to deliver the expected capacity benefits.
A one-time investment (training, equipment, airspace re-design project) to implement planned capacity will result in permanent increases in capacity for airspace users, provided the ANSP deploys it.
5 REVIEW OF DECLARED AND PLANNED CAPACITY
As overall traffic increases, capacity has to increase. Capacity can be increased by improving ATC equipment; improving the skills of the ATCOs (through better training); better civil military cooperation to free up capacity in peak periods; reducing separation requirements within the sector, on entry to the sector or exiting the sector, or by redesigning the airspace – including splitting individual sectors into two or more parts to increase capacity – requiring additional staff for periods of operation.
Declared capacity can be considered as the ability of ATC to safely handle a number of aircraft during normal operations. It is a stable figure reflecting the skills and training of ‘normal ATCOs’ during ‘normal conditions’.
It is not a maximum limit: it could be safely exceeded by ATC staff, operating in fine conditions with a favourable traffic mix.
It is not a minimum limit, as it could be reduced because of adverse weather; military training and operations; ATC equipment limitations; unusual and demanding traffic situation etc. (In each case of reduction, the constraint reducing the capacity should be clearly identified in the ATFM regulation (if required) as weather, airspace management, ATC staffing, ATC equipment, special activity etc.)
Airspace users, paying for infrastructure to increase capacity, should be provided with evidence that capacity has been improved. This can be seen from increases in the overall ACC capacity throughput and the declared capacity, for every sector benefiting from improvements.
The first part of the analysis in this Technical Note involves the review of declared capacity over the period 2012 – 2020 (9 years) for sector configurations (either elementary or collapsed) where ATFM regulations have been applied, and attributed to ‘C’ – ATC capacity. (As a filter, the analysis only considered sectors with aggregated delays over 1000 minutes).
Sector capacities are as recorded in the Network Manager systems – in the Demand Data Repository (DDR) and N.E.S.T. database during AIRAC cycle 02 for each year. Obviously, improvements in capacity (declared) implemented after February will appear only in the following years data.
In exceptional circumstances, the specific sector may not exist as an ATC operational sector, but is used by the Flow Management Position (FMP) to regulate traffic flows into different airspace. This

10
highlights inconsistencies in the ATFCM process where capacity constraints were not linked directly to the ATFM regulations and vice versa.
In the view of the PRC, this makes independent review much more difficult; it makes operations much less transparent to the airspace users and most importantly, it impedes in the mitigation or resolution of the constraint causing the delays.
The PRC is aware that many ANSPs no longer use hourly sector entries to monitor or regulate traffic. Instead, they use the concept of sector occupancy (the number of simultaneous aircraft within the sector) which more accurately considers the workload of the ATC staff. This allows more aircraft to be safely accommodated than relying on the more ‘static’ hourly sector entries. However, when regulations are required, they are implemented and registered, using the hourly sector entries rate.
If ANSPs were to publish the declared sector occupancy figures for individual sectors, this would help users and stakeholders to monitor the improvements in declared capacity, by monitoring the evolution of declared sector occupancy values for the individual sectors.
Figure 3: Declared capacity and sector occupancy
In Figure 3, ATCO workload determines the level of occupancy. If the ATCO can handle the traffic easily, then the occupancy can increase. The entry rate can match the exit rate to keep the sustainable level of ATCO workload. Increasing workload will necessitate reducing the entry rate so that the ATCOs are not overloaded.
The value for sector occupancy is generally considerably lower than the corresponding hourly declared capacity e.g. declared capacity 50/hr.: sector occupancy 10 even though it leads to a greater throughput.
Many ANSPs handle traffic levels well above the declared sector capacities, on a regular basis. The PRC has highlighted this in its annual Performance Review Reports (PRR).
The PRC has also made recommendations to the EUROCONTROL Governing Bodies that ANSPs should review the sector capacities to ensure that any latent capacity in the system can be utilized by airspace users. Updating the declared sector capacities so that capacity is strategically available to the airspace users provides additional capacity at no cost to the ANSP, since they are already providing the capacity, albeit ‘unofficially’ – and without getting the credit for doing so.
Some ANSPs have indicated to the PRC that they did not wish to raise declared capacity values to the level at which they regularly handle traffic within the sectors, because of concerns that they would be obliged to provide that capacity at all times.
The PRC acknowledges these concerns. However the declared capacity of a sector is not a minimum level. The ANSP can always reduce the available deployed capacity in response to adverse weather,

11
ATC equipment failure, military operations and training, etc. The reason for the reduction in available capacity should be identified in any request for ATFM regulations.
6 REVIEW OF ATTRIBUTION OF ATFM DELAY CAUSE
The second part of the analysis deals with the reasons for, or causes of, capacity constraints as identified by the ANSPs requesting ATFM regulations. The clear identification of causes of capacity constraints is vitally important for monitoring and improving capacity performance. Identifying the cause of the problem allows it to be addressed effectively. Misidentification of problems means that the problems are not addressed, or even worse, it means that time, effort, and money can be wasted on trying to address issues that are not causing the capacity constraints.
The PRC is aware of the functionality of the ATFCM system and of the limitation that only one delay cause can be identified for each ATFM regulation. Until this situation is changed, the PRC recommends that any ANSP-internal cause that creates, or significantly contributes to, the capacity constraint should be highlighted. This will enable them to be addressed directly by the ANSP. Highlighting the external causes while overlooking any internal cause gives the impression that nothing can be done to improve capacity, which is clearly not in the interests of improving capacity performance. Furthermore, external capacity constraints are aggravated by co-existing internal constraints leading to a greater overall reduction in deployed capacity than would otherwise have been the case if only the external constraint existed.
In previous PRRs, the PRC recommended that States and ANSPs should review their processes for assigning ATFM delay. The PRC recommends the following principles as a basis for attributing delays:
1. In principle, only ATFM delays resulting from regulations implemented at traffic levels equal to or greater than the declared capacity of the individual sector should be attributed to ‘C’ ATC Capacity.
2. In principle, since the ambition of EUROCONTROL and its Member States is to improve capacity performance by the ANSP, it is better to attribute all delays to ANSP-internal reasons such as staffing or equipment, unless there were no internal constraints applicable at the time.
3. In principle, it is important to identify the capacity constraints due to airspace management – from both large-scale exercises and day-to-day operations.
4. In principle, whenever additional capacity could be provided by de-collapsing a sector, then ATC staffing is a factor in the capacity constraint, and should be identified as such.
The analysis presented in this paper focuses on delays attributed to ATC capacity and adverse weather (46% and 22% of en route AFTM delay in 2019 respectively) which are normally portrayed as delays due to excessive traffic demand and delays outside of the responsibility of the ANSP. The analysis is in three parts.
As a first step, the PRC reviewed the ATFM regulations attributed to ATC staffing, when the ANSP reported that the deployed sector configuration, with its limited capacity, was due to the unavailability of ATC staff. Additional capacity could have been provided if ATC staff were available to operate a different sector configuration. The PRC can then identify specific sector configurations with associated capacity limitations that ANSPs have deployed due to a lack of ATC staff.
The second step was to review the ATFM regulations for sector configurations with delays attributed to ATC capacity or adverse weather and to extract the sector configurations (identified in the first step) caused by a lack of ATC staff. Since the deployment of these non-optimal sector configurations has been attributed by the ANSP to non-availability of ATC staff, the PRC logically groups these delays into ATC staffing, not ATC capacity or adverse weather. The grouping made by the PRC also recognizes the fact that during adverse weather conditions and when the ACC is able to open adapted sector configurations, from a capacity point of view it might be better to collapse some sectors. Using

12
weather as an ATFM delay reason when the ACC is not able to adapt its sector configurations to the traffic demand shall be avoided.
Figure 4: Process for reviewing ATC staffing delays
7 REVIEW OF DEPLOYED SECTOR HOURS
The third part of the operational analysis focuses on the deployment of ATCOs to provide capacity to airspace users. From the data in the NM systems (the DDR and NEST database), the PRC was able to aggregate the sector hours deployed for each ACC over the period 2017 – 2019.
If an ANSP decided to split its airspace into 2 sectors for 12 hours and then further divide it into 6 sectors for the remaining 12 hours, the total number of sector hours was calculated as 2 x 12 (24) + 6 x 12 (72) 96 sector hours for the 24 hour period.
The greater the number of sectors open, the more the capacity made available for airspace users over any given period. Similarly, the fewer the number of sectors open, the less the capacity made available for airspace users over any given period.
Ideally, the ANSP would ensure that more sectors are opened during periods where traffic demand exists, and then the number of sectors could be reduced during periods where traffic demand dissipates.
Increasing sector hours does not necessarily mean increasing the number of ATCOs, nor does reducing sector hours imply that fewer ATCOs are being used. Since ATCOs work according to rostered shift patterns (either individual or as a team) it is possible to manage the availability and non-availability of ATCOs according to known traffic patterns.
In addition, reducing the non-ops related tasks for ATCOs could free up ATC staff to spend more duty-time actually controlling traffic and therefore providing capacity to airspace users.
If an ANSP is unable to accommodate the existing traffic demand then reducing sector hours will only aggravate the capacity deficit.

13
8 REVIEW OF ECONOMIC INDICATOR ATCO- HOUR PRODUCTIVITY
The PRC also noted how an economic indicator interacts with the operational indicators such as ATFM delay, sector hours and evolution of declared capacity.
This paper presents the economic performance indicator ‘ATCO-hour productivity’ for each of the ANSPs annually for the years 2017 – 2018 with the evolution of the indicator over that period. (The 2019 data collection cycle started in July 2020 and has a detailed validation process to ensure a common understanding of how each ANSP is calculating the annual ATCO in OPS hours on duty. For this reason, the present technical note had to limit the review of this indicator to the 2017-2018 period.)
The data underlying this indicator, especially the number of hours worked per ATCOs in OPS during the year is not part of the NM database or the N.E.S.T. tool, which contain operational data recorded on a daily basis. Annual ATCO-hours on operational duties are reported by the ANSPs to the PRU in the context of Specification for Economic Information Disclosure.
The ACE Performance framework (see Figure 5) represents the main conceptual tool used in the ACE analysis to benchmark ANSPs’ economic performance. This framework was developed in agreement with, and following the input of, the PRC and the ACE Working Group, comprising representatives from ANSPs, Airspace Users and other interested stakeholders.
The financial cost-effectiveness indicator, defined as the ratio between the ATM/CNS provision cost borne by the ANSPs and the number of composite flight-hours controlled by each provider (see Annex 2 of the ACE Report for more details on the computation and interpretation of the composite flight-hours output measure), is considered as the key indicator to benchmark ANSPs’ economic performance, both through cross-sectional and time series analyses.
Within the ACE analytical framework, ATCO-hour productivity represents one of the main indicators used to explain differences in cost-effectiveness performance across providers. In fact, all else being equal, higher ATCO-hour productivity contributes to improve an ANSP’s cost-effectiveness performance.
As presented in the framework (Figure 5), the ATCO-hour productivity indicator is computed as the ratio between the composite flight-hours and the number of ATCO-hours on duty for each ANSP. In turn, the number of ATCO hours on duty is the result of two elements: i) the number of ATCOs in OPS, and ii) the average number of hours spent by these ATCO in OPS on operational duties.

14
Figure 5: Definition of ATCO hour productivity
Finally, it is noted that, in line with the scope of the analysis developed in the ACE Report, the ATCO-hour productivity indicator is computed and analysed on the basis of annual values, thus reflecting the average productivity for a certain provider over the year.
9 SCOPE OF THE PRC REVIEW OF EN ROUTE CAPACITY
The intention of this Technical Note is to raise awareness of the various aspects of capacity performance and to identify specific examples of how they inter-relate in different ACCs across the network.
The PRC decided to limit the scope of its analysis to the ten Area Control Centres (ACC) reported in Performance Review Report 2019 as being the most constraining ACCs in the network for 2019 in terms of total ATFM delay. They are listed in this Technical Note in Annex 1.
The PRC takes this opportunity to extend the offer of further analysis on request for any State or ANSP that would like to have a similar review of its en route capacity operations.
10 PRC FINDINGS AND LINKS TO EXISTING PC RECOMMENDATIONS
10.1 Declared capacity
The PRC notes that the vast majority of ATC sectors which caused the greatest amount of delays are collapsed sectors, constructed of two or more elementary sectors. It is recognized that some elementary sectors cannot be operated as elementary sectors but they can be used in flexible sectors configurations and opening schemes.
Employment costs for
ATCOs in OPS
Composite flight-hours
ATCO in OPS hours on duty
ATM/CNS provision costs
Support cost ratio
ATCO-hour Productivity
ATCO employment costs per ATCO-hour
Financialcost-effectiveness
indicator
EUROCONTROL/PRU
Support costsSupport costs per unit of output
ATCOs employment costs per
unit of output

15
Recommendation #4: The Provisional Council requested Member States’ ANSPs to accurately identify the specific capacity constraints that adversely impact the service provided to airspace users, enhancing capacity provision through better transparency. (PC45 – June 2016)
Recommendation #5: The Provisional Council requested Member States’ ANSPs to review sector capacities, both with and without airspace restrictions to increase network performance. (PC 45 – June 2016)
10.2 Planned capacity
Each year, ANSPs provide capacity plans, which the Network Manager publishes in the Network Operations Plan (NOP). These capacity plans might need to include the sectors for which capacity improvements are foreseen to improve transparency to airspace users, or to interested stakeholders. In addition, it is expected that through the Seasonal Rolling NOP details will be available on how and where ANSPs are specifically adding capacity.
Adding capacity to sectors that are not constrained, whilst failing to add the necessary capacity to meet existing airspace user requirements is not an effective use of resources. Furthermore, the added-value of adding capacity to collapsed sectors instead of opening the individual sectors and deploying existing capacity during periods of high demand is questionable. The list of actions identified in the Section 4 shall be fully applied to enhance ACC and sectors throughput and capacity.
Capacity cannot ‘disappear’ within a given airspace from one year to the next. Whilst capacity may not be deployed, it still exists and can be immediately deployed, without additional costs, whenever the constraint preventing deployment is removed - for example adverse weather or military operations and training. There are several examples of ACCs where capacity has been reduced year after year due to the lack of adapted and flexible opening schemes or lack of appropriate actions to address possible additional airspace complexity.
With the exception of reductions in capacity due to specific safety risks (with documented safety cases), an airspace / ATC unit should be able to safely accommodate the same declared capacity as it did previously.
There is also a risk that airspace users might be required to fund the repeated implementation of declared capacity, whilst not being able to benefit from its deployment.The PRC perceives a risk that portraying a reduction in deployed capacity as a reduction in declared capacity implies that an ANSP needs to invest in infrastructural changes or equipment to increase capacity instead of addressing the actual reasons for the reduced capacity - staffing or military operations and training
Recommendation #2: The Provisional Council:
requested Member States to task their ANSPs to develop and implement capacity plans which are, at a minimum, in line with the Reference Capacity Profile (from the NOP); and to ensure that capacity is made available during peak demand;
asked the Director General to report on those States that have insufficient capacity plans compared to the Reference Capacity Profile to PC 44 (December 2015). (PC43 – May 2015)

16
Recommendation #8: The Provisional Council agreed that Member States be requested to task their ANSPs to:
a) support the Network Manager in mitigating existing capacity shortfalls by taking a network centric instead of a local approach;
b) work with the Network Manager to ensure that future capacity planning and deployment show sufficient flexibility to meet forecast traffic demand in a cost efficient manner;
c) work with the Network Manager and airspace users to identify airspace which is likely to have genuine structural issues in the future and which therefore may require more substantial changes in airspace design; (PC 51 – June 2019)
10.3 Deployed capacity
The PRC notes the frequent use of “adverse weather” in the attribution of ATFM delays. In fact, the high proportion of ATFM delays attributed to adverse weather in collapsed sectors suggests that ANSPs may unintentionally be aggravating the adverse impact of weather rather than mitigating it.
By operating collapsed sectors rather than deploying maximum capacity by opening elementary sectors, the ANSPs could unwittingly be adding additional capacity constraints and causing greater delays to airspace users.
The PRC also recognizes the fact that during adverse weather conditions and when the ACC is able to open adapted sector configurations, from a capacity point of view it might be better to collapse some sectors. Using weather as an ATFM delay reason when the ACC is not able to adapt its sector configurations to the traffic demand shall be avoided.
The high proportion of ATFM delays attributed to ATC capacity should provide an impetus for ANSPs to develop plans to increase the capacity of the constrained sectors to accommodate existing traffic.
By attributing delays in collapsed sectors to ATC capacity, ANSPs may unwittingly be overlooking the fact that additional capacity already exists in their airspace and could be deployed to satisfy the existing demand of airspace users.
The PRC’s review of the attribution of ATFM delays suggests that ATC staffing is either the cause, or a significant contributory factor, in the majority of ATFM delays and is therefore a crucial area that needs to be addressed.
Recommendation #1: The Provisional Council urged States to ensure an accurate and consistent classification of ATFM delays to enable constraints on European ATM to be correctly identified and resolved or mitigated. (PC41 – May 2014)
Recommendation #8: The Provisional Council requested the Director General and the Member States to strengthen the ATFCM process by developing and adopting strict procedures for attributing ATFM delay causes, through the NM/NMB, instead of the current guidelines that lead to inconsistencies and opacity in monitoring capacity performance. (PC49 – June 2018)
Recommendation #10: The Provisional Council agreed to take the necessary steps to ensure the implementation of its recommendation at PC/49 (2018) which requested “the Director General and the Member States to strengthen the ATFCM process by developing and adopting strict procedures for attributing ATFM delay causes, through the NM/NMB, instead of the current

17
guidelines that lead to inconsistencies and opacity in monitoring capacity performance.” (PC51 – June 2019)
Figure 6: ANSP accountability for adverse weather delays
The top graph of Figure 6 shows the initial traffic flow through a collapsed sector together with the declared capacity (green line) and reduced capacity (red line). The reduction in capacity over the period ranges from 0% to 25% at various stages of the day, due to adverse weather. Instances of hourly demand exceeding hourly capacity are visible whenever the blue bar goes above the red line. In the above example, 46 aircraft required ATFM regulations to move them into periods when capacity would be available (Not necessarily just the next hour).
The next two graphs show the same initial traffic flow through the constituent sectors of the collapsed sector shown previously. The green lines represent the declared capacities for each sector. When the declared capacities are reduced by the same percentage and at the same time as for the collapsed sector to represent the weather impact in the constituent sectors, the traffic demand does not exceed the available capacity in either sector at any stage of the day.

18
Could the initial traffic have been handled without delays, notwithstanding the presence of adverse weather, except for the capacity constraints originating from the operation of a collapsed sector, instead of opening two separate sectors simultaneously?
10.4 Review of Sector hours
From 2012 until February 2020, traffic levels in the network grew year upon year. Several ANSPs mentioned unexpectedly high growth of traffic when explaining to the European Commission why they had not achieved national targets for ATFM delays and en route capacity performance.
The PRC was surprised to note that many of the constraining ANSPs reviewed had actually reduced the number of sector hours being deployed, year on year. Reducing the number of sector hours means reducing the amount of time where maximum capacity is being deployed – the use of elementary sectors – and a proportional increase in the amount of time where the ANSP is operating with capacity constraints brought about by ATC staffing.
The PRC found it difficult to understand how ANSPs were attempting to improve capacity performance by operating more frequently with self-imposed capacity constraints.
The PRC does not consider that reducing the number of sector hours in any way contributes to the objective of satisfying existing traffic demand in already constrained airspace, never mind accommodating anticipated future traffic growth.
Recommendation #3: The Provisional Council requested Member States to task their ANSPs to provide the capacity to meet the demand instead of regulating demand to meet the reduced capacity. (PC45 – June 2016)
Recommendation #6: The Provisional Council requested Member States’ ANSPs to coordinate effectively, with the Network Manager, the planning and implementation of all changes to the ATM system that could adversely affect operations. (PC45 – June 2016)
Recommendation #7: The Provisional Council recalled that PC/45 (2016) had requested Member States to task their ANSPs to provide sufficient capacity to meet demand and to accurately identify capacity constraints that adversely impact service provision; (PC 49 – June 2018)
10.5 Economic indicator ‘ATCO-hour productivity’ and operations: Causation or correlation
As earlier stated in section 8 above the PRC has based its findings on 2017 and 2018 values for ATCO-hour productivity. To do so, the analysis relied on the data on ATCO-hour productivity gathered, in accordance with the SEID2 template, during the yearly ACE data collection and validation process. The information on “Change in sector hours” and “ATFM delays” comes from the databases of the Network Manager including the DDR and N.E.S.T.
In 2018, ATFM delays increased significantly in all ten ACCs from 2017.
Nine of the ten ACCs increased ATCO-hour productivity. Reims ACC showed a reduction of 2%.
Two of the ACCs increased ATCO-hour productivity whilst reducing sector hours: Karlsruhe UAC & Marseille ACC
2 PRC Specification for Economic Information Disclosure – Version 3.00, December 2012.

19
Two ACCs increased ATCO-hour productivity but kept the same number of sector hours: Barcelona ACC and Brussels ACC.
2017 to 2018 comparison
Change in ATCO- hour productivity
Change in sector hours
Change in ATFM delays
Change in traffic
Karlsruhe UAC +5% -8% +133% +<1% Marseille ACC +10% -6% +137% +2% Wien ACC +4% +4% +229% +7% Budapest ACC +18% +4% +3000% +11% Langen ACC +9% +2% +128% +5% Barcelona ACC +2% - +72% +5% Brussels ACC +4% - +32% +3% Zagreb ACC +6% +5% +397% +10% Bremen ACC +5% +1% +49% +3% Reims ACC -2% - +424% +3%
Table 1: Comparison of ATCO hour productivity and operational indicators
The table highlights that whilst productivity is a useful indicator to understand the different factors influencing cost-effectiveness performance, increasing productivity should not be seen as a stand-alone objective, especially when an ANSP cannot meet demand without generating significant ATFM delays.
Some of the measures implemented by an ANSP to provide extra capacity can have a negative impact on its ATCO-hour productivity performance. This is, for example, the case of a sector split which will allow the ANSP to create additional capacity in its airspace at the expense of more ATCOs or ATCO-hours on duty required to staff the additional sector(s).
And, vice versa, measures to increase ATCO-hour productivity can have a negative impact on capacity performance. For example, collapsing sectors to reduce the number of ATCOs or ATCO-hours on duty required at the expense of creating capacity constraints leading to additional delays for airspace users.
Stakeholder feedback on the PRC analysis is presented in Annex 2:

20
Annex 1: ACC analysis
11 TEN MOST CONSTRAINING ACCS
State ANSP ACC / UAC
Germany DFS Karlsruhe UAC
France DSNA Marseille ACC
Austria Austro Control Wien ACC
Hungary HungaroControl Budapest ACC
Germany DFS Langen ACC
Spain ENAIRE Barcelona ACC
Belgium skeyes Brussels ACC
Croatia Croatia Control Zagreb ACC
Germany DFS Bremen ACC
France DSNA Reims ACC
Table 2: Scope of Technical Note
Important notes:
Evolution of declared sector capacity:
The review only considers sector configurations that had more than 1000 minutes of ATFM delay, attributed to ‘C’ ATC capacity over the period are considered.
Sectors recorded as elementary sectors in the NM system (N.E.S.T.) are in
blue
Increases in declared capacity appear in
green
Reductions in declared appear in
Light red
Major reductions (>10) in declared capacity appear in
red
Review of attributed causes for ATFM delays:
Sectors recorded as elementary sectors in the NM systems are highlighted in blue. Staffing delays in these elementary sectors are possibly for training purposes, for example reducing available capacity (and therefore creating regulations and delays) because the ATCO-in training is not yet able to handle the level of declared capacity.
Delays attributed to ‘C’ ATC capacity and ‘W’ adverse weather in these elementary sectors remain unaffected by the revised attribution process.
The review focuses on sectors where ATFM regulations attributed to ATC Staffing accounted for more than 1000 minutes over the period 2017 – 2019 inclusive.
Due to the methodology chosen, delays attributed to adverse weather or ATC capacity in collapsed sectors will still appear as originally attributed if the ANSP did not attribute any delays to ATC staffing for the same sector. Therefore, even in the revised attribution, delays due to ATC capacity and adverse weather, could potentially be further mitigated or resolved through staffing.

21
11.1 Germany: Karlsruhe UAC
Review of evolution of declared capacity from 2012 to 2020
Total ATFM
delay 13k 284k 345k 309k 632k 1
731k 4
043k 3 068k Sector name 'C' Total 2012 2013 2014 2015 2016 2017 2018 2019 2020
EDUUWUR3C 404137 57 59 59 59 59 59 59 59 59 EDUUFUL1U 342855 54 55 55 56 56 56 56 56 56 EDUUDON1D 304296 45 54 54 54 54 54 54 EDUUHVL1H 301462 49 50 50 51 51 51 51 51 51 EDUUWUR1C 299773 52 53 53 54 54 54 54 54 54 EDUUWUR24 255934 51 51 51 52 52 49 52 52 52 EDUUTGO1T 227614 50 50 50 51 51 51 51 48 48 EDUUSAL1A 202042 46 47 47 48 48 48 48 49 49 EDUUCHI1K 192676 37 48 49 52 53 53 53 53 EDUUFFM1C 167290 51 52 52 53 53 53 53 53 53 EDUUALP1L 164295 42 51 52 54 54 54 55 55 EDUUSPE1P 153527 47 48 48 49 49 49 49 49 49 EDUUERL12 150931 48 48 48 49 49 49 49 50 50 EDUUSLN1S 130433 51 52 52 53 53 53 53 51 51 EDUUSLN13 114128 49 49 49 49 47 EDUUERL1R 98135 50 50 50 51 51 51 51 52 52 EDUUNTM1C 88052 51 52 52 53 53 53 53 53 53 EDUUWUR34 86448 54 54 54 55 55 50 51 51 51 EDUUOH 81929 43 44 44 45 45 45 45 45 45 EDUUFFM3C 74156 54 54 54 55 55 55 55 55 55 EDUUALP13 66624 39 46 46 47 48 48 49 49 EDUUNTM3C 60306 59 59 59 59 EDUUTGO2C 54273 54 54 54 54 54 54 EDUUFFM24 44311 50 50 50 51 51 48 51 51 51 EDUUSAL12 41614 45 46 46 47 47 47 47 48 48 EDUUAP22 34195 45 47 47 47 47 47 47 48 48 EDUUDI 32570 53 53 53 53 53 EDUUALP1C 24157 41 50 51 51 51 51 51 51 EDUULK 21406 54 54 54 54 54 EDUUSLN2C 21332 54 54 54 54 52 52 EDUUWEST 21053 51 52 52 53 53 53 53 53 53 EDUUCHI1C 20855 47 47 47 47 47 EDUUNTM33 20681 59 59 59 59 EDUUFZ44 19692 48 48 48 48 48 48 52 53 53 EDUUEAST 19372 48 49 49 50 50 50 50 50 50 EDUUALP2C 19279 41 47 48 50 51 51 51 51 EDUUFUL2C 16340 51 51 51 53 53 53 54 54 54 EDUUFFM1F 15634 53 55 55 56 56 56 56 56 56 EDUUFFM14 15421 46 47 47 48 48 48 48 50 50 EDUUFFM34 14734 52 52 52 53 53 49 50 50 50

22
Total ATFM delay 13k 284k 345k 309k 632k
1 731k
4 043k 3 068k
Sector name 'C' Total 2012 2013 2014 2015 2016 2017 2018 2019 2020 EDUUNTM1N 13932 54 55 55 56 56 56 56 56 56 EDUUSN 13661 53 53 53 53 EDUUERL22 13380 50 52 52 53 53 53 53 53 53 EDUUDON2C 13004 40 48 52 52 52 52 52 EDUUTS 12924 44 44 44 44 44 44 46 46 46 EDUUCNTR 12052 54 54 56 56 56 56 56 56 EDUUTGO13 11470 45 45 45 45 42 42 EDUUWUR1Z 11170 54 55 55 56 56 56 56 56 56 EDUUTGO22 9948 53 54 54 EDUUOSE1O 8158 44 45 45 46 46 46 46 46 46 EDUUCHI2C 7400 50 51 51 51 51 EDUUAP 7239 43 44 44 45 45 45 45 45 45 EDUUOHAP 6939 45 46 46 47 47 47 47 47 47 EDUUWUR14 6370 48 49 49 50 50 50 50 52 52 EDUUISA1I 6192 44 54 55 55 55 55 55 55 EDUUUF 5065 48 48 48 EDUUALP23 4592 37 46 47 50 50 50 51 51 EDUUHVL12 3759 46 46 46 47 47 47 47 47 47 EDUUDON1C 3080 41 54 49 49 49 49 49 EDUUNTM23 2292 49 50 50 51 51 EDUUFZU44 2042 54 57 57 58 58 48 51 51 51 EDUUDI2C 1937 47 48 48 48 48 48 EDUUSLN12 1237 48 48 48 EDUUNTM14 1193 50 50 50 50 EDUUSLN22 1192 52 54 54 EDUUNTM34 1031 48 48 48 48 EDUUFUL13 1008 47 47 47 48 48 48 48 49 49
Table 3: Evolution of declared capacity from 2012 to 2020
The above table highlights concerted efforts in the years (2012/2013) and (2014/2015) to increase declared capacity, with gains in most sectors. However, it also highlights reductions in declared capacities in the Soellingen (SLN) and Tango (TGO) sector groups in the year (2018/2019), a period in which Karlsruhe UAC was creating very high delays in the Network.
Only four of the twenty sectors with highest delays attributed to ATC capacity are elementary sectors (EDUUWUR24, EDUUERL12, EDUUSLN13 & EDUUWUR34), the rest being collapsed sectors.

23
Review of capacity planning and implementation
Figure 7: Evolution of capacity plans - Karlsruhe UAC
Figure 7 shows the capacity plans, as published in the annual Network Operations Plan (NOP) from 2012 to 2019 for Karlsruhe UAC.
A lowering along the vertical axis indicates a reduction in planned capacity; moving the same vertical value to the right indicates a postponement of capacity planning.
The starting point for each plan is the level of capacity provided during the sampling period for the previous year.
The provided level of capacity increased from 2012 to 2015, which is in line with the increases in declared capacity noted during that period.
In the capacity plan from 2015, for the years 2015-2019, it was reported that Karlsruhe UAC already had a capacity of 368 aircraft per hour and had plans to increase this to 430 aircraft per hour by 2019.
The capacity plans from 2016 to 2019 show an annual decrease in provided capacity from 364 in 2016 to 354 in 2017 to 334 in 2018 and 279 aircraft per hour in 2019.
In the capacity plan from 2019, for the years 2019-2024, Karlsruhe UAC had a capacity of 279 aircraft per hour (-24% from 2015 levels) and planned to achieve a capacity of 380 by 2024.
260
280
300
320
340
360
380
400
420
440
2012
2013
2014
2015
2016
2017
2018
2019
2020
2021
2022
2023
2024
Karlsruhe UAC
Hour
ly c
apac
ity
2012-2016
2013-2017
2014-2019
2015-2019
2016-2020
2017-2021
2018-2022
2019-2024

24
Review of attributed causes for ATFM regulations
(See 6 Review of attribution of ATFM delay cause to understand divergence with ATFCM Operations Manual criteria)
Table 4: Sectors with Staffing delays - Karlsruhe UAC
As discussed earlier in this Technical Note, in attributing ATFM delays to ATC staffing, ANSPs report that the cause of the capacity constraint was a lack of available ATC staff.
Therefore, the sector configurations listed in the table are deployed when the ANSP does not have sufficient qualified staff available to deploy additional capacity by de-collapsing sectors.
Since the same sector configurations provide less capacity than could be available (if staffing levels permitted), it therefore undermines the attribution of delays to ATC capacity for the same sectors. The argument being that the ANSP was operating at reduced capacity because of staffing.
Similarly, attributing delays to adverse weather in sectors that are operating at reduced capacity because of a lack of ATC staff appears problematic.
A reduction in capacity caused by adverse weather will aggravate any existing capacity shortfall, such as the operation of collapsed sectors due to a lack of ATC staffing.
On the basis that these sector configurations already constrain capacity, and are operated as such due to a lack of ATC staff, it can be argued that ATC staffing plays a significant role in ATFM regulations attributed to ATC capacity and weather at these locations.
A comparison between the original attribution of ATFM delays and the revised attribution of ATFM delays for the years 2017 – 2019 is presented in Figure 8 below.
2017 - 2019 Total aggregated delaysSector name ATC Staffing Weather ATC CapacityEDUUFUL1U 243395 103608 342709EDUUWUR1C 189779 50048 299773EDUUWUR3C 175168 91515 401643EDUUFFM1C 158947 26682 167104EDUUSAL1A 152655 44097 202042EDUUTGO1T 124677 84448 227614EDUUDON1D 119966 156763 301026EDUUHVL1H 110766 66612 299948EDUUSPE1P 86369 57299 153509EDUUERL1R 79424 13690 97672EDUUOH 71120 3870 81708EDUUALP1L 58539 116682 163415EDUUCHI1K 56849 83552 189521EDUUFFM3C 38671 27651 73712EDUUFZ44 33104 11113 19692EDUUFFM1F 31475 8342 15634EDUUNTM3C 29667 65307 60306EDUUNTM1C 25038 76589 86522EDUUALP2C 24456 25377 13330EDUUWUR1Z 22028 6089 10941EDUUTGO2C 18636 41982 53814EDUUCHI1C 17405 12308 20722EDUUISA1I 9463 14270 6192EDUUCNTR 7493 5237 12052EDUUNTM1N 6913 5686 13604EDUUCHI2C 6302 11421 7319EDUUTS 5587 10832 12924EDUUDON2C 5517 9044 11572EDUUOSE1O 5341 6109 8158EDUUSLN2C 4792 36139 21332EDUUWEST 3858 20181 21053EDUUAP22 3477 5975 33951EDUUSLN13 3367 81423 101801EDUUTGO1C 2527 720EDUUWUR24 2087 44225 223286EDUUFZU44 2041 2042EDUUOHAP 1773 6051 6939EDUUFUL1C 1154 688EDUUERL12 1140 57318 111715

25
Figure 8: Alternative ATFM delay attribution - Karlsruhe UAC
Figure 8 shows that an inability to deploy qualified ATC staff to meet traffic demand, ATC staffing, is the most significant issue, or contributing factor, influencing capacity in Karlsruhe UAC over the past three years.
ATC Capacity
61%
Weather14%
ATC Staffing
18%
All Other 7%
2019 original attribution
ATC Capacity
50%
Weather21%
ATC Staffing
20%
All Other 9%
2018 original attribution
ATC Capacity
24%
Weather…
ATC Staffing
42%
All Other 7%
2017 original attribution
ATC Capacity
8%
Weather…
ATC Staffing
82%
All Other 7%
2017 revised attribution
ATC Capacity
2%
Weather2%ATC
Staffing87%
All Other 9%
2018 revised attribution
ATC Capacity
2%
Weather1%
ATC Staffing
90%
All Other 7%
2019 revised attribution

26
Review of sector hours 2017 - 2019
Note: the DFS report that the figures in N.E.S.T do not entirely correspond to the actual sector hours.
Figure 9: Sector hours - Karlsruhe UAC
There are five main sector groups in Karlsruhe UAC (West, South, North, East and Central). All sector groups show a year on year decrease in the number of sector hours provided.
The total number of sector hours recorded in the NM systems (N.E.S.T.) for Karlsruhe UAC in 2017 was 171022, for 2018 was 158158 and for 2019 was 144871.
For the whole UAC, 2018 had 8% fewer sector hours than 2017 and 2019 had 8% fewer sector hours than 2018 – overall resulting in 15% fewer hours in 2019 than in 2017.
Karlsruhe UAC created 1.7 million minutes of delay in 2017, 4 million minutes of delay in 2018 and 3 million minutes of delay in 2019.
Furthermore, Karlsruhe UAC implemented a number of traffic re-routing scenarios that forced traffic to avoid flying through the Rhein UIR (airspace controlled by Karlsruhe UAC) – traffic was 1,853k flights in 2017, 1,861k in 2018 (+<1%) and 1,830k in 2019 (-2%).
Review of economic indicator “ATCO- hour productivity” from 2017 – 2018
Karlsruhe UAC 2017 2018 Change
ATCO- hour productivity 1.69 1.77 +5%
Table 5: ATCO hour productivity - Karlsruhe UAC
40480
38440
15339
15614
34997
46788
42775
14899
16831
36867
49389
46064
15982
19422
40164
10000 20000 30000 40000 50000 60000
EDUUUTAC
EDUUUTAE
EDUUUTAN
EDUUUTAS
EDUUUTAW
Sector hours
2017
2018
2019

27
11.2 France: Marseille ACC
Review of evolution of declared capacity from 2012 to 2020
Total ATFM delay 552k 442k 568k 195k 466k 1 198k 2 843k 2 016k Sector name 'C' delays 2012 2013 2014 2015 2016 2017 2018 2019
LFMMB3 148527 37 37 38 38 38 26 26 26 LFMMSBAM 140689 45 45 46 46 46 46 46 46 LFMMAB12 132076 44 44 44 44 44 44 44 44 LFMMGY 108171 50 50 46 46 46 46 46 46 LFMMY3 92038 37 37 37 37 37 26 26 26 LFMMEK12 91916 32 32 32 32 32 32 32 32 LFMME3 67878 35 35 35 35 35 35 35 LFMMYY 60157 46 46 44 44 44 44 44 44 LFMMB2 53574 34 34 35 35 35 35 35 35 LFMMGY12 52975 40 40 37 38 38 38 38 38 LFMME2 46592 32 32 30 28 28 28 28 28 LFMMB12 45768 40 40 40 40 40 40 40 40 LFMMAB34 43488 42 42 42 LFMMM2 42268 32 32 30 30 30 30 30 24 LFMMM3 40472 32 32 32 26 26 26 26 26 LFMMEK 37554 40 40 38 38 38 38 38 38 LFMMAB3 34431 40 40 42 42 LFMMFDZ 32933 36 36 36 LFMMGY34 32415 39 39 39 LFMMRAW 31513 32 32 32 LFMME1 29395 32 32 32 32 32 32 LFMMAJ 29035 27 27 27 27 LFMMGG 25631 48 48 44 44 44 44 44 LFMME12 23355 35 32 32 32 32 32 32 LFMMRAEE 22725 39 39 39 39 39 39 39 LFMMAB 22157 50 50 50 50 50 50 50 LFMMWW 19958 40 41 41 LFMMB34 13198 38 38 38 LFMMEK23 12302 36 36 36 34 34 34 34 LFMMEK1 11594 32 32 32 32 32 32 32 LFMMRAE 11322 32 32 32 32 LFMMGY3 10947 40 40 39 39 LFMMMNST 10842 36 36 36 36 36 36 36 LFMMMFDZ 10739 34 34 36 36 36 LFMMF34 10581 31 31 31 31 LFMMF3 10416 31 31 24 24 24 24 LFMMBTAJ 10379 38 38 38 38 38 38 38 LFMMDZ 10017 34 34 34 34 LFMMEK3 9440 35 35 35 35 35 35 35 35 LFMMY2 9177 34 34 34 34 LFMMGYAB 8983 36 36 36 36

28
Total ATFM delay 552k 442k 568k 195k 466k 1 198k 2 843k 2 016k Sector name 'C' delays 2012 2013 2014 2015 2016 2017 2018 2019
LFMMRAWM 8372 32 32 32 LFMMMALY 8117 36 38 38 38 LFMMM34 7900 32 32 32 LFMMW3 7491 34 34 34 34 34 34 34 34 LFMMG2 7097 32 32 32 32 LFMMFF 7046 40 40 40 40 LFMMDD 7018 34 34 LFMMRAWN 6819 32 32 32 LFMMMM 6569 38 38 38 38 38 38 LFMMMF 6479 40 42 42 42 LFMMF12 6065 34 34 34 34 34 34 34 LFMMB4 5237 26 26 26 LFMMM12 5118 36 36 36 36 36 36 36 36 LFMMW2 5110 30 32 30 30 30 LFMMWM 5024 32 32 32 LFMMEK2 4560 30 30 30 28 28 28 28 LFMMAA 3947 48 46 46 46 46 LFMMKK 3807 39 39 LFMMF2 3731 29 29 29 29 29 LFMMDL 3636 28 28 28 LFMMW1 3480 32 32 32 LFMMLYO 3417 44 28 44 44 LFMMW23 3417 36 36 36 36 LFMMRAEM 3274 36 36 36 36 36 LFMMM1 3165 32 32 34 LFMMEE 2950 37 LFMMK12 2787 32 32 LFMMY12 2429 38 38 38 38 38 LFMMZZ 2408 34 34 34 LFMMGYA 2350 40 40 40 40 LFMMAB2 2199 38 38 38 38 38 LFMMMOML 2090 36 36 36 36 LFMMRAEE1 1985 39 39 39 LFMMDH 1927 28 28 28 28 LFMMG3 1838 37 26 26 LFMMST 1790 31 31 31 31 31 31 LFMMY34 1654 37 37 LFMMBT 1583 28 28 28 LFMMMF3 1487 34 28 28 LFMMG12 1281 38 35 35 35 LFMMF1 1183 32 LFMMW12 1085 34 34
Table 6: Evolution of declared capacity - Marseille ACC

29
Seven sectors (see Table 6) show a net increase in declared capacity over period 2012 – 2019. Twenty sectors currently have a declared capacity lower than what had previously been declared: a net reduction in capacity.
Seven of the twenty sectors with the highest delays attributed to ATC capacity are elementary sectors (two of which have had significant (>10) reductions in declared capacity) according to the NM systems; the remaining thirteen sectors are collapsed sectors.
Review of capacity planning and implementation
Figure 10: Evolution of capacity plans - Marseille ACC
Figure 10 shows the capacity plans, as published in the annual Network Operations Plan (NOP), from 2012 to 2019 for Marseille ACC.
A lowering along the vertical axis indicates a reduction in planned capacity; moving the same vertical value to the right indicates a postponement of planned capacity.
The capacity plan of 2012 started with a capacity base of 244 aircraft per hour and planned to increase to 283 aircraft per hour by 2016.
The capacity plans of 2013, 2014 and 2015 all start from a capacity base around 244, indicating that no capacity was added since 2012.
The 2016 plan started from 247 aircraft per hour and planned to increase to 278 aircraft per hour by 2020.
The 2017 plan started from 278 aircraft per hour showing a significant increase in provided capacity during 2016 and planned further increases to 328 aircraft per hour by 2021.
The 2018 plan started from a reduced capacity level of 268 aircraft per hour and planned to increase to 316 per hour by 2022.
In the capacity plan from 2019, Marseille ACC had existing capacity of 295 and planned to increase to 326 aircraft per hour by 2024.
220
240
260
280
300
320
340
2012
2013
2014
2015
2016
2017
2018
2019
2020
2021
2022
2023
2024
Marseille ACC
Hour
ly c
apac
ity
2012-2016
2013-2017
2014-2019
2015-2019
2016-2020
2017-2021
2018-2022
2019-2024

30
Review of attributed causes for ATFM regulations
(See 6 Review of attribution of ATFM delay cause to understand divergence with ATFCM Operations Manual criteria)
Table 7: Sectors with Staffing delays - Marseille ACC
As discussed earlier in this Technical Note, in attributing ATFM delays to ATC staffing, ANSPs report that the cause of the capacity constraint was a lack of available ATC staff.
Therefore, the sector configurations listed above in Table 7 are deployed when the ANSP does not have sufficient qualified staff available to deploy additional capacity by de-collapsing sectors.
On the basis that these sector configurations already constrain capacity, and are operated as such due to a lack of ATC staff, it can be argued that ATC staffing plays a significant role in ATFM regulations attributed to ATC capacity and weather at these locations.
The graphics below (Figure 11) present a comparison between the original attribution of ATFM delays and the revised attribution of ATFM delays for the years 2017 – 2019.
2017 - 2019 Total aggregated delays 2017 - 2019 Total aggregated delaysSector name ATC Staffing Weather ATC Capacity Sector name ATC Staffing Weather ATC CapacityLFMMRAW 237451 4771 31513 LFMMAB2 11913 61215 195LFMMEK12 134090 38816 43225 LFMMF34 10866 989 7915LFMME12 134055 15610 21194 LFMMRAEM 10657 2626LFMMB12 125477 42873 30828 LFMMW23 8460 7977 3295LFMMGY 111156 51658 35360 LFMMM12 7893 184 2066LFMMFDZ 103628 1845 32933 LFMMRAE 7047 9203LFMMAB12 100659 78547 76177 LFMMGYAB 6231 1650 8273LFMMRAWM 98013 2158 8372 LFMMDD 5852 4333 7018LFMMYY 90559 14139 34974 LFMMY34 5559 1508 806LFMMWW 86624 16605 18407 LFMMF12 5538 3334 3543LFMMDZ 81204 13126 9969 LFMMMF34 4553 5998 558LFMMGG 76751 9036 16148 LFMMLYO 4171 1769 2119LFMMSBAM 75692 42242 59448 LFMMM34 3875 972 3479LFMMGY12 74751 118995 34690 LFMMMF12 3675 19929LFMMFF 67243 2603 6602 LFMMEK2 3433 10858 2657LFMMMFDZ 65619 9728 LFMMWLMO 3269LFMMAB34 64455 105260 35630 LFMMRAEE1 3208 1940LFMMMALY 58720 2692 8117 LFMME3 2954 1476 51085LFMMMF 52536 1216 6479 LFMMB3 2905 816 38808LFMMMNST 52312 88298 8209 LFMMK12 2897 71 2787LFMMGY34 49063 107242 27535 LFMMGYA 2651 1262LFMMRAEE 42134 12620 17274 LFMMEK23 1947 10374LFMMRAWN 36163 2789 6819 LFMME1 1862 1363 25228LFMMMM 35662 2653 5116 LFMMY12 1566 2889 1643LFMMEK 35451 18545 22102 LFMMZZ 1557 1125 2408LFMMEK3 26910 18032 1932 LFMMDZL 1452 1341LFMMB34 25287 12949 8882 LFMMEE 1341 3115 2950LFMMWM 20863 2413 5024 LFMMRAES 1297 0 118LFMMAB 19605 13207 14341 LFMMMF1 1162 26848LFMMKK 19550 4856 2928 LFMMG12 1090 2496 312LFMMBTAJ 16196 11406 7413 LFMMMOML 1067 904LFMMAA 13477 2198 2803 LFMMB2 1017 4398 41874LFMMEK1 12873 22673 5263 LFMMAB1 1006 3737

31
These graphics (Figure 11) show a significant increase in delays for which ATC staffing were, if not the cause, then at least a contributing factor.
As explained previously, the revised attribution for ATC capacity and adverse weather can still contain delays due, entirely or in part, to ATC staffing.
ATC Capacity
39%
Weather12%
ATC Staffing
43%
All Other 6%
2019 original attribution
ATC Capacity
46%
Weather20%
ATC Staffing
22%
All Other 12%
2018 original attribution
ATC Capacity
69%
Weather17%
ATC Staffing
2%All
Other 12%
2017 original attribution
ATC Capacity
28%
Weather3%
ATC Staffing
62%
All Other 7%
2019 revised attribution
ATC Capacity
9%
Weather3%
ATC Staffing
76%
All Other 12%
2018 revised attribution
ATC Capacity
54%
Weather10%
ATC Staffing
24%
All Other 12%
2017 revised attribution
Figure 11: Alternative ATFM attribution - Marseille ACC

32
Review of sector hours 2017 – 2019
Figure 12: Sector hours - Marseille ACC
Figure 12 shows the two main sector groups in Marseille ACC (West and East). Both sector groups show a year on year decrease in the number of sector hours provided.
The total number of sector hours recorded in the NM systems (N.E.S.T.) for Marseille ACC in 2017 was 108596, for 2018 was 102393 and for 2019 was 100685.
For the whole ACC, 2018 had 6% fewer sector hours than 2017 and 2019 had 2% fewer sector hours than 2018 – overall resulting in 7% fewer hours in 2019 than in 2017.
Marseille ACC created 1.2 million minutes of delay in 2017, 2.8 million minutes of delay in 2018 and 2 million minutes of delay in 2019.
Traffic was 1,102k flights in 2017, 1,128k flights in 2018 (+2%) and 1,159k flights in 2019 (+3%).
Review of economic indicator “ATCO- hour productivity” from 2017 – 2018
Marseille ACC 2017 2018 Change
ATCO- hour productivity 0.89 0.98 +10%
Table 8: ATCO hour productivity - Marseille ACC
51672
49013
53029
49364
53991
54606
40000 42000 44000 46000 48000 50000 52000 54000 56000
LFMMCTAE
LFMMCTAW
Sector hours
2017
2018
2019

33
11.3 Austria: Wien ACC
Review of evolution of declared capacity from 2012 to 2020
Total ATFM delay 118k 179k 20k 71k 53k 245k 806k 1 747k
Sector name 'C' total 2012 2013 2014 2015 2016 2017 2018 2019 2020 LOVVSCR 16291 44 44 44 44 LOVVNCR 14063 44 44 44 43 LOVVEAL1 7390 44 44 44 46 LOVVWHT 7119 42 42 42 44 LOVVNLU1 5752 39 39 LOVVSOU 5672 38 38 38 40 LOVVNSL 5214 37 37 37 37 LOVVWLU 4152 36 36 36 37 LOVVSLU 3038 35 35 35 36 LOVVEHT 2937 41 41 41 42 LOVVNOR 2058 41 41 41 44 LOVVSHT 1922 39 39 39 41 LOVVB5A 1212 38 38 38 40 LOVVWSH 1107 34 34 34 39 LOVVW12 157303 36 39 42 42 40 LOVVS15 106128 44 44 49 49 49 LOVVW35 85172 45 45 51 51 51 LOVVE15 81902 50 50 54 54 54 LOVVB15 73110 42 42 46 46 46 LOVVWB12 64779 38 38 41 41 40 LOVVS35 51091 42 42 46 46 46 LOVVN15 39312 46 46 51 51 51 LOVVN35 38263 48 48 50 50 50 LOVVN12 36914 41 41 43 43 42 LOVVWB35 34093 44 44 50 50 50 LOVVS12 15082 37 37 40 40 40 LOVVW3 13151 40 40 43 39 39 LOVVE13 12636 46 46 50 50 50 LOVVSC15 12553 46 46 51 49 49 LOVVSC35 9862 43 43 47 47 47 LOVVNE35 9727 43 43 47 47 47 LOVVNE15 8596 46 46 51 51 51 LOVVW45 8006 44 44 48 48 48 LOVVWB15 6409 44 44 49 49 49 LOVVNE12 3637 39 39 41 41 41 LOVVW13 2475 40 43 43 43 LOVVSC12 1978 39 39 41 41 41 LOVVNE45 1185 44 44 48 48 48 LOVVWB45 1147 44 44 48 48 48 LOVVW2 1010 41 41 43 43 43 LOVVE45 1008 42 42 46 46 46
Table 9: Evolution of declared capacity - Wien ACC
Wien ACC made a considerable reorganization of sectors in 2015/2016, which explains the distinct change in sector names between 2015 and 2016.

34
Table 9 shows that there was an increase in declared capacity in the years (2014/2015) and (2017/2018). In 2020 to date (August), no sectors show an increased declared capacity from what was declared in 2018.
There are 5 sectors with a declared capacity lower than previously declared in the previous 4 years.
Review of capacity planning and implementation
Figure 13: Evolution of capacity plans - Wien ACC
Figure 13 shows the capacity plans, as published in the annual Network Operations Plan (NOP) from 2012 to 2019 for Wien ACC.
A lowering along the vertical axis indicates a reduction in planned capacity; moving the same vertical value to the right indicates a postponement of capacity planning.
The starting point for each series is the level of capacity provided during the sampling period for the previous year.
Capacity was added annually up until 2016 as the bases of the capacity series continued to rise.
However, since 2014 it appears that the full extent of the planned capacity increases have been postponed from year to year, as a similar gradient line moves across the graphic.
The capacity of 229 aircraft per hour for 2020, according to the capacity plan from 2016, is now planned for after 2023.
160
170
180
190
200
210
220
230
240
2012
2013
2014
2015
2016
2017
2018
2019
2020
2021
2022
2023
2024
Vienna ACC
Hour
ly c
apac
ity
Wien ACC
2012-2016
2013-2017
2014-2019
2015-2019
2016-2020
2017-2021
2018-2022
2019-2024

35
Review of attributed causes for ATFM regulations
(See 6 Review of attribution of ATFM delay cause to understand divergence with ATFCM Operations Manual criteria)
As discussed earlier in this Technical Note, in attributing ATFM delays to ATC staffing, ANSPs report that the cause of the capacity constraint was a lack of available ATC staff.
Therefore, the sector configurations listed above are deployed when the ANSP does not have sufficient qualified staff available to deploy additional capacity by de-collapsing sectors.
On the basis that these sector configurations already constrain capacity, and are operated as such due to a lack of ATC staff, it can be argued that ATC staffing plays a significant role in ATFM regulations attributed to ATC capacity and weather at these locations.
Table 10: Sectors with staffing delays - Wien ACC
2017 - 2019
Total aggregated delays
Sector name
ATC Staffing
Weather ATC Capacity
LOVVE15 142519 155925 81190 LOVVW35 101529 101569 83925 LOVVS15 101170 110833 102439 LOVVN15 61832 36877 38930 LOVVWB12 47458 74161 64589 LOVVWB35 40176 48345 33610 LOVVS35 16199 146037 50501 LOVVNE15 9505 12997 8477 LOVVNE12 8556 4999 3637 LOVVWB15 8318 5715 6409 LOVVW12 8158 192667 155799 LOVVW15 7703 133 LOVVNE35 6924 5586 9727 LOVVSC35 4323 10630 9862 LOVVN12 4081 47935 36914 LOVVS13 3995 2317 294 LOVVN35 3857 46709 38263 LOVVW13 3571 4688 2475 LOVVSC12 3491 3221 1978 LOVVB15 2813 123804 73110 LOVVSC15 1131 10042 12553 LOVVS12 1003 74434 15082

36
Figure 14 shows that ATC staffing is either the direct cause of, or at least a significant contributing factor to, almost all ATFM delays in Wien ACC.
Figure 14: Alternative ATFM attributions - Wien ACC

37
Review of sector hours 2017 – 2019
Figure 15: Sector hours - Wien ACC
Wien ACC has increased sector hours year on year. In 2017 there were 53169 hours; in 2018 there were 55255 hours and in 2019 there were 55476 hours. Overall, from 2017 to 2019 there was a 4% increase in sector hours.
In 2017 Wien ACC had 245k minute of delay; in 2018 806k minutes of delay, and in 2019 there were 1.7 million minutes of delay.
Wien ACC controlled 840k flights in 2017, 901k flights in 2018 (+7%) and 932k flights in 2019 (+3%).
Review of economic indicator “ATCO- hour productivity” from 2017 – 2018
Wien ACC 2017 2018 Change
ATCO- hour productivity 1.36 1.42 +4%
Table 11: ATCO hour productivity - Wien ACC
55476
55255
53169
45000 47000 49000 51000 53000 55000 57000
LOVVCTA
Sector hours
2017
2018
2019

38
11.4 Hungary: Budapest ACC
Review of evolution of declared capacity from 2012 to 2020
Total ATFM delay 1k <1k 1k 19k 57k 10k 324k 1 414k Sector name 'C' total 2012 2013 2014 2015 2016 2017 2018 2019 2020
LHCCENLM 220852 44 44 38 LHCCENUHT 197888 53 53 53 LHCCENHT 168626 53 53 50 LHCCENU 112516 51 51 45 LHCCENLMU 57148 44 44 40 LHCCWLM 35873 40 40 40 44 44 44 44 44 38 LHCCENUH 27651 53 53 45 LHCCENH 16228 51 51 51 LHCCEASTH 11414 48 48 48 53 53 51 50 50 50 LHCCWLMU 11295 40 40 40 44 44 44 44 44 LHCCEASTU 5067 48 48 48 53 53 51 50 50 50 LHCCWUHT 3485 48 48 48 53 53 53 53 53 LHCCWENHT 3341 55 55 55 LHCCWESTH 3127 48 48 48 53 53 51 51 51 LHCCWHT 3041 48 48 48 53 53 53 53 53 LHCCWELMU 2877 50 LHCCWENLMU 1746 55 50 LHCCELM 1390 40 40 40 44 44 44 44 44 44 LHCCWESTU 1204 46 46 46 51 51 51 51 51
Table 12: Evolution of declared capacity - Budapest ACC
Table 12 shows that there was a significant increase in declared capacity in the year (2014/2015), with approximately 10% capacity added to each sector.
A re-sectorisation project is observed in (2017/2018) with the introduction of a northern sector group, and the number of elementary sectors increasing from 10 - 15.
There are reductions in declared capacity for sectors in the eastern group (2016/2017) and again in (2017/2018). Similarly, there are reductions in declared capacity for sectors involving the northern sector group in (2019/2020).

39
Review of capacity planning and implementation
Figure 16: Evolution of capacity plans - Budapest ACC
Figure 16 shows the capacity plans, as published in the annual Network Operations Plan (NOP), from 2012 to 2019, for Budapest ACC.
A lowering of the vertical line indicates a reduction in planned capacity; moving the same vertical value to the right indicates a postponement of capacity planning.
The starting point for each series is the level of capacity provided during the sampling period for the previous year.
Capacity was added in 2013, in line with the plans from 2012 – as evidenced by the rise in the starting point of the series 2013-2107.
The gain in capacity from the increased declared sector capacities in 2014/2015 can clearly be seen with the rise in starting points between the 2014-2019 and the 2015-2019 series.
The capacity plan from 2016, for the years 2016-2020, showed an ambitious increase in capacity. Additional capacity was delivered (base capacity of 181 in 2015 rose to 210 in 2016).
The 2017 plan was based on a lower level of delivered capacity, from what had already been provided in 2016.
In 2018, Budapest ACC provided a higher base level of capacity (217 aircraft per hour, up from 200 in 2017 perhaps due to the re-sectorisation project observed in Table 12 and planned a significant increase in capacity to achieve 245 aircraft per hour by 2022.
The capacity plan from 2019 shows a reduction in base capacity (203 down from 217 aircraft per hour) and plans 235 aircraft per hour by 2024.
160
170
180
190
200
210
220
230
240
250
2012
2013
2014
2015
2016
2017
2018
2019
2020
2021
2022
2023
2024
Budapest ACC
Hour
ly c
apac
ity
2012-2016
2013-2017
2014-2019
2015-2019
2016-2020
2017-2021
2018-2022
2019-2024

40
Review of attributed causes for ATFM regulations
(See 6 Review of attribution of ATFM delay cause to understand divergence with ATFCM Operations Manual criteria)
As discussed earlier in this Technical Note, in attributing ATFM delays to ATC staffing, ANSPs report that the cause of the capacity constraint was a lack of available ATC staff.
Therefore, the sector configurations listed below are deployed when the ANSP does not have sufficient qualified staff available to deploy additional capacity by de-collapsing sectors.
On the basis that these sector configurations already constrain capacity, and are operated as such due to a lack of ATC staff, it can be argued that ATC staffing plays a significant role in ATFM regulations attributed to ATC capacity and weather at these locations.
2017 - 2019 Total aggregated delays
Sector name ATC Staffing
Weather ATC Capacity
LHCCENLMU 18214 14661 57148 LHCCENHT 15248 31531 168626 LHCCWSUHT 14422 21917 95492 LHCCWLMU 10960 20873 11295 LHCCENLM 8380 112972 220852 LHCCENUHT 8260 17798 197888 LHCCENUH 2540 13800 27651 LHCCWSLM 2380 61944 177962 LHCCENU 2225 62985 112516 LHCCALL 1889 350 586 LHCCWLM 1792 30711 32135 LHCCWENHT 1679 1808 3341 LHCCWSUH 1093 21344 62273 LHCCWELMU 1043 2877
Table 13: Sectors with staffing delays - Budapest ACC

41
Figure 17: Alternative ATFM attribution - Budapest ACC
Figure 17 shows that ATC staffing became an issue at Budapest ACC, from 2018 onwards.

42
Review of sector hours 2017 – 2019
Figure 18: Sector hours - Budapest ACC
Budapest ACC initially increased the number of sector hours in 2018 but then reduced them in 2019. In 2017 there were 38694 hours; in 2018 there were 40380 hours and in 2019 there were 33896 hours. In 2019, Budapest ACC provided 12% fewer sector hours than in 2017.
In 2017 Budapest ACC had 10k minutes of delay; in 2018 350k minutes of delay, and in 2019 there were 1.4million minutes of delay.
Budapest ACC controlled 779k flights in 2017, 861k flights in 2018 (+11%) and 846k flights in 2019 (-2%).
Traffic in Budapest FIR (including traffic not flying through the airspace controlled by Budapest ACC) also increased over the period: 819k flights in 2017, 901k flights in 2018 reducing again to 888k flights in 2019.
Review of economic indicator “ATCO- hour productivity” from 2017 – 2018
Budapest ACC 2017 2018 Change
ATCO- hour productivity 1.41 1.66 +18%
Table 14: ATCO hour productivity - Budapest ACC
33896
40380
38694
25000 30000 35000 40000 45000
LHCCCTA
Sector hours
2017
2018
2019

43
11.5 Germany: Langen ACC
Review of evolution of declared capacity from 2012 to 2020
Total ATFM
delay 788
k 288
k 295
k 176
k 366
k 284
k 650
k 739
k
Sector name Grand Total
2012
2013
2014
2015
2016
2017
2018
2019
2020
EDGG1 246961 34 34 35 34 32 34 34 34 32 EDGGKNG 134258 35 35 35 35 33 37 37 37 37 EDGG7 125396 30 34 34 36 32 36 36 36 39 EDGGKOD 81059 38 38 38 38 36 40 40 40 40 EDGGDLSN 77355 32 32 32 32 29 32 32 32 32 EDGGRUKIM 72209 39 39 36 36 38 34 38 34 34 EDGGKIHA 62144 34 34 34 34 32 36 36 36 40 EDGGHMM 60526 30 30 30 30 27 30 30 30 EDGGADS 53703 43 43 43 43 41 45 45 45 45 EDGGGIN 52676 36 36 36 36 34 38 38 38 38 EDGGDLA 51015 34 34 34 34 31 34 34 34 34 EDGGSITA 48870 34 34 34 34 32 36 36 36 36 EDGGNOR 39124 36 36 32 36 36 36 36 EDGGDLDN 34161 32 32 32 32 29 32 32 32 32 EDGGGEHE 33464 32 32 32 32 30 34 34 34 34 EDGGPAD 29363 30 30 30 30 27 30 30 30 30 EDGGNLH 27691 40 40 42 42 40 42 40 40 40 EDGGDKB 25321 34 32 36 36 36 36 EDGGBALU 15700 38 38 40 40 36 40 40 40 40 EDGGTAU 15610 32 32 32 32 31 34 34 34 34 EDGGMANK 15050 38 38 32 34 31 34 38 38 38 EDGGKAW 9296 32 32 EDGGPADL 6939 24 24 24 24 23 25 25 25 25 EDGGSIGI 5818 36 36 36 36 34 38 38 38 38 EDGGDKA 5230 34 34 31 34 34 34 36 EDGGKTG 3859 39 39 39 39 37 41 41 41 41 EDGGGHG 3765 32 32 32 32 30 34 34 34 34 EDGG6 2368 34 34 34 34 32 30 30 30 30 EDGGPADH 1806 36 36 36 36 32 36 36 36 36 EDGGGED 1211 34 34 34 34 32 36 36 36 36 EDGGLBU 1121 38 38 40 40 36 40 36 36 36 EDGGBAD 1082 36 36 38 38 34 38 38 38 38
Table 15: Evolution of declared capacity - Langen ACC
The above graphic shows a significant reduction in declared capacity across the board in the year 2015-2016 with a reversion to normal capacity levels the following year (perhaps due to significant system replacement)
Five sectors have less declared capacity in 2020 than had been previously declared since 2016.
Thirteen of the twenty sectors with the highest delays attributed to ATC capacity are collapsed sectors, according to the NM systems.

44
Review of capacity planning and implementation
Figure 19: Evolution of capacity plans - Langen ACC
A lowering along the vertical axis indicates a reduction in planned capacity; moving the same vertical value to the right indicates a postponement of capacity planning.
The starting point for each series is the level of capacity provided during the sampling period for the previous year.
The initial capacity plans from 2012, for the years 2012-2016, promised to deliver capacity of 266 aircraft per hour by 2016.
Significant capacity was added. The base capacity rose from 233 in 2012 to 245 in 2013 and 254 in 2014.
The capacity plan from 2015 reported a drop in base capacity, from 2014. The plan from 2015 also indicated that additional capacity would not be provided for two years, before increasing again at the same rate as planned in from 2012. The level of 266 aircraft per hour was planned to be achieved in 2019.
The capacity plan from 2016 shows a significant increase in base capacity from 251 to 260 aircraft per hour and a plan for 274 aircraft per hour by 2020.
The 2017 plan showed a significant decrease in base capacity – from 260 to 249 aircraft per hour and planned to increase to 261 by 2019. No additional capacity was planned from 2019 to 2021.
The 2018 plan showed an increase in base capacity from 249 to 259 aircraft per hour and planned marginal gains (+2 aircraft per hour) until 2021 when further capacity would be added bringing the total to 264 aircraft per hour by 2022.
The plan from 2019 show a significant reduction in existing capacity (from 259 aircraft per hour in 2018 to 245 aircraft per hour the following year) and plan to deliver 268 aircraft per hour by 2024. This is 2 aircraft per hour higher than originally planned for 2016, in the capacity plans from 2012).
230235240245250255260265270275280
2012
2013
2014
2015
2016
2017
2018
2019
2020
2021
2022
2023
2024
Langen ACC
Hour
ly c
apac
ity2012-2016
2013-2017
2014-2019
2015-2019
2016-2020
2017-2021
2018-2022
2019-2024

45
Review of attributed causes for ATFM regulations.
(See 6 Review of attribution of ATFM delay cause to understand divergence with ATFCM Operations Manual criteria)
2017 - 2019 Total aggregated delays
Sector name ATC Staffing Weather ATC Capacity
EDGG7 167660 48070 82077 EDGGKOD 56773 37093 79944 EDGGDLSN 39801 10042 6841 EDGGSITA 38847 30890 38568 EDGGKIHA 29446 37317 57209 EDGG1 23905 10357 34600 EDGGPAD 19528 6997 11009 EDGGGEHE 19438 28348 21468 EDGGADS 13743 25287 35283 EDGGBALU 9017 11963 15692 EDGGGHG 8933 3478 3684 EDGGMANK 7842 10531 15050 EDGGRUKIM 7017 8214 26990 EDGG4 2422 613 EDGGNOR 2112 25094 34918 EDGGDLDN 2089 5084 23103 EDGG6 1606 0 771 EDGG3 1349 869 828 EDGG2 1174 1632 33
As discussed earlier in this Technical Note, in attributing ATFM delays to ATC staffing, ANSPs report that the cause of the capacity constraint was a lack of available ATC staff.
Therefore, the sector configurations listed below are deployed when the ANSP does not have sufficient qualified staff available to deploy additional capacity by de-collapsing sectors.
On the basis that these sector configurations already constrain capacity, and are operated as such due to a lack of ATC staff, it can be argued that ATC staffing plays a significant role in ATFM regulations attributed to ATC capacity and weather at these locations.
Table 16: Sectors with Staffing delays - Langen ACC

46
Figure 20: Alternative ATFM attribution - Langen ACC
The graphic shows that ATC staffing was the cause of, or at least a contributing factor to, a significant portion of the ATFM delays in Langen ACC.
As explained previously, the revised attribution for ATC capacity and adverse weather can still contain delays due, entirely or in part, to ATC staffing.

47
Review of sector hours 2017 - 2019
Note: the DFS report that the figures in NEST do not entirely correspond to the actual sector hours.
Figure 21: Sector hours - Langen ACC
Figure 21 shows the 7 main sector groups in Langen ACC. According to the information recorded in the NM systems (N.E.S.T.) there was an increase in the number of sector hours deployed at sector groups EDGGCTA1 to EDGGCTA5 from 2017 to 2018. EDGGCTA7 and EDGGCTA6 deployed fewer sector hours in 2018 than in 2017.
From 2018 to 2019, six of the seven sector groups deployed fewer sector hours, with only EDGGCTA1 showing an increase on 2018 numbers.
For the entire ACC the number of sector hours in 2017 was 131701, for 2018 it was 134255 and for 2019, it was 132340.
Langen ACC created 284k minutes of ATFM delay in 2017 with 1,267k flights; 650k minutes of ATFM delay in 2018 with 1,335k flights (+5%), and 739k minutes of delay in 2019 with 1,336k flights (+<1%).
Review of economic indicator “ATCO- hour productivity” from 2017 – 2018
Langen ACC 2017 2018 Change
ATCO- hour productivity 0.97 1.06 +9% Table 17: ATCO hour productivity - Langen ACC
18721
18121
23082
25657
18314
16733
11711
18404
18462
23219
26247
18853
17274
11796
18151
17839
22661
25020
18690
17303
12037
10000 15000 20000 25000 30000
EDGGCTA1
EDGGCTA2
EDGGCTA3
EDGGCTA4
EDGGCTA5
EDGGCTA6
EDGGCTA7
Sector hours
2017
2018
2019

48
11.6 Spain: Barcelona ACC
Review of evolution of declared capacity from 2012 to 2020
Total ATFM delay 284k 224k 158k 289k 315k 226k 390k 635k
S e c t o r n a m e 'C' Delays 2012 2013 2014 2015 2016 2017 2018 2019 2020 LECBBAS 349723 39 39 39 39 39 39 39 39 39 LECBP1U 311019 41 41 41 41 41 41 LECBMNI 201022 42 42 42 42 42 42 42 42 42 LECBCCC 167777 43 43 43 43 43 43 43 43 43 LECBLGU 92267 34 34 34 34 34 34 34 34 34 LECBLVU 82820 37 37 37 37 37 37 37 37 37 LECBLVL 73908 35 35 35 35 35 35 35 35 35 LECBPPI 60064 36 36 36 36 36 36 36 36 36 LECBP1I 52304 36 36 36 36 36 36 LECBBKE 47852 31 31 31 31 31 31 31 31 31 LECBMVS 41314 40 40 40 40 40 40 40 40 40 LECBGO1 40595 41 41 41 LECBVVI 34467 40 40 40 40 40 40 40 40 40 LECBLLI 33715 33 33 33 33 33 33 33 33 33 LECBP1L 33232 38 38 38 38 38 38 LECBGOI 31877 36 36 36 LECBG23 31460 41 41 41 LECBMNL 24129 42 42 42 42 42 42 42 42 42 LECBCVN 23913 39 39 39 39 39 39 39 39 39 LECBBKW 22098 31 31 31 31 31 31 31 31 31 LECBVNI 21497 43 43 43 43 43 43 43 43 43 LECBMMI 21175 43 43 43 43 43 43 43 43 43 LECBGO2 18427 40 40 40 LECBMNU 13545 42 42 42 42 42 42 42 42 42 LECBPP2 12486 42 42 42 42 42 42 LECBPLI 8390 35 35 35 35 35 35 LECBCCL 7806 32 32 32 32 32 LECBPDI 7305 37 LECBVVS 6079 38 38 38 38 38 LECBMVI 5476 38 38 38 38 38 38 38 38 38 LECBLVS 5326 40 40 40 40 40 40 40 40 40 LECBG12 5313 40 40 40 LECBCCU 4231 45 45 45 45 45 LECBGO3 3482 41 41 41 LECBP2R 3089 42 42 42 LECBLGL 1935 34 34 34 34 34 34 34 34 34 LECBXCI 1837 40 LECBVMS 1641 39 39 39 39 39 39 39 39 39 LECBALL 1154 19 19 19 19 19
Table 18: Evolution of declared capacity - Barcelona ACC

49
Although Table 18 Error! Reference source not found.shows that there have been no increases in declared sector capacity for any sector over the period, there have been several airspace restructuring projects:
In 2015 the LECBCCC sector (declared capacity 43) was split into two elementary sectors: LECBCCL (declared capacity 32) and LECBCCU (declared capacity 45).
In 2016, ENAIRE report that sector LECBBP1U increased from declared capacity 41 to 45 (43 on weekends) and sector LECBP1L increased from declared capacity 38 to 41 (40 on weekends). However this is not reflected in the database.
In 2017 sector LECBPP2 became sector LECBP2R [ENAIRE report that capacity rose from 42 to 43 but this is not reflected in the database]; in the same reorganization, sectors LECBP1L FL245-345 (declared capacity 38) and LECBP1U FL345-999 (declared capacity 41) became Sectors LECBGO1 FL245-345 (declared capacity 41), LECBGO2 FL345-365 (declared capacity 40) and sector LECBGO3 FL365-999 (declared capacity 41).
Only four of the 20 most constraining sectors are listed as elementary sectors in the NM database, the remaining 16 being collapsed sectors.
Review of capacity planning and implementation
Figure 22: Evolution of capacity plans - Barcelona ACC
Figure 22 shows the capacity plans, as published in the annual Network Operations Plan (NOP) from 2012 to 2019 for Barcelona ACC.
A lowering along the vertical axis indicates a reduction in planned capacity; moving the same vertical value to the right indicates a postponement of capacity planning.
The starting point for each series is the level of capacity provided during the sampling period for the previous year.
The capacity plan from 2012 started with a baseline capacity of 157 aircraft per hour and planned 184 aircraft per hour by 2016.
Subsequent capacity plans from 2013, 2014 and 2015 started from a lower base of provided capacity (142, 141 and 148 aircraft per hour respectively) which was eventually restored in the capacity plans from 2016 (156 aircraft per hour).
Additional capacity was provided in 2016 and the capacity plan from 2017 started from a base capacity of 172 aircraft per hour planning 206 aircraft per hour by 2021.
130
140
150
160
170
180
190
200
210
2012
2013
2014
2015
2016
2017
2018
2019
2020
2021
2022
2023
2024
Barcelona ACC
Hour
ly c
apac
ity
2012-2016
2013-2017
2014-2019
2015-2019
2016-2020
2017-2021
2018-2022
2019-2024

50
No capacity was added in 2017 so the 2018 plan also started at 172 aircraft per hour and planned an increase to 205 aircraft per hour by 2022.
The latest capacity plans in 2019 showed a decrease in provided capacity from the previous year and although no additional capacity was planned for 2020, plans exist to increase to 186 aircraft per hour by 2024.
Review of attributed causes for ATFM regulations
(See 6 Review of attribution of ATFM delay cause to understand divergence with ATFCM Operations Manual criteria)
2017 - 2019 Total aggregated delays Sector name ATC Staffing Weather ATC Capacity LECBCCC 15071 122444 79839 LECBMNI 10747 8983 69984 LECBG23 5362 11078 31460 LECBGOI 4665 18539 31877 LECBMVS 4592 1673 18981 LECBLGU 3388 8177 27016 LECBBKE 1596 217 13459
Table 19: Sectors with staffing delays - Barcelona ACC As discussed earlier in this Technical Note, in attributing ATFM delays to ATC staffing, ANSPs report that the cause of the capacity constraint was a lack of available ATC staff.
Therefore, the sector configurations listed above are deployed when the ANSP does not have sufficient qualified staff available to deploy additional capacity by de-collapsing sectors.
On the basis that these sector configurations already constrain capacity, and are operated as such due to a lack of ATC staff, it can be argued that ATC staffing plays a significant role in ATFM regulations attributed to ATC capacity and weather at these locations.

51
Figure 23 shows that in 2018 and 2019, ATC staffing caused, or greatly contributed to, a significant proportion of ATFM delays.
As explained previously, the revised attribution for ATC capacity and adverse weather can still contain delays due, entirely or in part, to ATC staffing.
ATC Capacity
72%
Weather21%
ATC Staffing
6%All Other 1%
2019 original attribution
ATC Capacity
55%
Weather35%
ATC Staffing
3% All Other 7%
2018 original attribution
ATC Capacity
72%
Weather23%
ATC Staffing
0% All Other 5%
2017 original attribution
ATC Capacity
69%
Weather20%
ATC Staffing
6% All Other 5%
2017 revised attribution
ATC Capacity
43%
Weather20%
ATC Staffing
30%
All Other 7%
2018 revised attribution
ATC Capacity
36%
Weather6%
ATC Staffing
57%
All Other 1%
2019 revised attribution
Figure 23: Alternative ATFM attribution - Barcelona ACC

52
Review of sector hours 2017 – 2019
Figure 24: Sector hours - Barcelona ACC
Figure 24 shows the two main sector groups in Barcelona ACC: West & East.
According to the information recorded in the NM systems (N.E.S.T.), the West sector group saw a marginal increase in sector hours in 2018, compared to 2017, before decreasing again in 2019. The East sector group reduced slightly in 2018 and then further reduced in 2019.
The total sector hours for Barcelona ACC in 2017 was 62107, in 2018 it was 62303 and in 2019 it was 60421. The sector hours deployed in 2019 were 2.5% less than what was deployed in 2017.
Barcelona ACC created 226k minutes of delay in 2017, 386k minutes of delay in 2018 and 635k minutes of delay in 2019.
Traffic was 873k flights in 2017, 913k flights in 2018 (+5%) and 940k flights in 2019 (+3%).
Review of economic indicator “ATCO- hour productivity” from 2017 – 2018
Barcelona ACC 2017 2018 Change
ATCO- hour productivity 0.97 0.99 +2%
Table 20: ATCO hour productivity - Barcelona ACC
25500
34921
26604
35699
26836
35270
20000 25000 30000 35000 40000
LECBCTAE
LECBCTAW
Sector hours
2017
2018
2019

53
11.7 Belgium: Brussels ACC
Review of evolution of declared capacity from 2012 to 2020
Total ATFM delay 15k 44k 9k 81k 266k 9k 120k 351k Sector name 'C' Total 2012 2013 2014 2015 2016 2017 2018 2019 2020 EBBUEEC 104600 37 37 37 37 37 37 37 37 37 EBBUNWC 93834 38 38 38 38 38 38 38 38 38 EBBUWSC 52508 39 39 39 39 39 39 39 39 39 EBBUESC 18464 40 40 40 40 40 40 40 40 40 EBBUHLC 12930 39 39 39 39 39 39 39 39 39 EBBUEHS 1012 40 40 40 40 40 40 40 40 40
Table 21: Evolution of declared capacity - Brussels ACC Table 21 shows that there has not been any increase in declared capacity for any constraining sector in Brussels ACC since 2012.
Only one of the constraining sectors is an elementary sector, the rest being collapsed sectors.
Review of capacity planning and implementation
Figure 25: Evolution of capacity plans - Brussels ACC
Figure 25 shows the capacity plans, as published in the annual Network Operations Plan (NOP) from 2012 to 2019 for Brussels ACC.
A lowering along the vertical axis indicates a reduction in planned capacity; moving the same vertical value to the right indicates a postponement of capacity planning.
The starting point for each series is the level of capacity provided during the sampling period for the previous year.
The initial capacity plan in 2012 started from a base capacity of 132 aircraft per hour and planned a capacity of 141 aircraft per hour by 2016.
No capacity was added in until 2015 so the capacity plans for 2016 started from a base capacity of 135 aircraft per hour and planned 139 aircraft per hour by 2018.
120
125
130
135
140
145
150
2012
2013
2014
2015
2016
2017
2018
2019
2020
2021
2022
2023
2024
Brussels ACC
Hour
ly c
apac
ity
2012-2016
2013-2017
2014-2019
2015-2019
2016-2020
2017-2021
2018-2022
2019-2024

54
The capacity plan from 2017 reported a drop in existing capacity during 2016 – from 135 to 125 aircraft per hour: a drop of 7.5%.
The year 2017 saw a significant increase in provided capacity, with the base capacity for the 2018 plans up to 138 aircraft per hour. The capacity plan from 2018 planned increases in capacity to 146 aircraft per hour by 2022.
The latest capacity plan from 2019 continues with the plan from the previous year and extrapolates the increase in capacity to 147 aircraft per hour by 2024.
Review of attributed causes for ATFM regulations
(See 6 Review of attribution of ATFM delay cause to understand divergence with ATFCM Operations Manual criteria)
2017 - 2019 Total aggregated delays Sector name ATC Staffing Weather ATC Capacity EBBUWSC 172247 1036 50594 EBBUESC 72827 827 18464 EBBUEEC 67569 57741 99376 EBBUNWC 49633 28575 60456 EBBUHLC 9697 28463 9735 EBBUWLS 2282 1758 825 EBBUALL 1006
Table 22: Sectors with staffing delays - Brussels ACC As discussed earlier in this Technical Note, in attributing ATFM delays to ATC staffing, ANSPs report that the cause of the capacity constraint was a lack of available ATC staff.
Therefore, the sector configurations listed in Table 22 are deployed when the ANSP does not have sufficient qualified staff available to deploy additional capacity by de-collapsing sectors.
On the basis that these sector configurations already constrain capacity, and are operated as such due to a lack of ATC staff, it can be argued that ATC staffing plays a significant role in ATFM regulations attributed to ATC capacity and weather at these locations.

55
Figure 26 shows that ATC staffing was a significant factor in ATFM delays in 2019.
As explained earlier in the Technical Note, the revised attribution for ATC capacity and adverse weather can still contain delays due, entirely or in part, to ATC staffing.
ATC Capacity
72%
Weather21%
ATC Staffing
6% All Other 1%
2019 original attribution
ATC Capacity
55%
Weather35%
ATC Staffing
3% All Other 7%
2018 original attribution
ATC Capacity
72%
Weather23%
ATC Staffing
0% All Other 5%
2017 original attribution
ATC Capacity
71%
Weather23%
ATC Staffing
1% All Other 5%
2017 revised attribution
ATC Capacity
46%
Weather33%
ATC Staffing
14%
All Other 7%
2018 revised attribution
ATC Capacity
46%
Weather16%
ATC Staffing
37%
All Other 1%
2019 revised attribution
Figure 26: Alternative ATFM attribution - Brussels ACC

56
Review of sector hours 2017 - 2019
Figure 27: Sector hours - Brussels ACC
According to the information recorded in the NM systems (N.E.S.T.), Brussels ACC has marginally reduced the number of sector hours between 2017 and 2019.
In 2017, Brussels ACC deployed 29459 sector hours; in 2018 it was 29460 and in 2019 there were 29127 hours, a reduction of approximately 1%.
Brussels ACC created 92k minutes of delay in 2017; 122k minutes of delay in 2018 and 646k minutes of delay in 2019.
Brussels ACC controlled 624k flights in 2017, 644k flights in 2018 (+3%) and 635k flights in 2019 (-2%).
There were 629k flights in the Brussels FIR (Including Luxembourg) in 2017, 650k flights in 2018 and 640k flights in 2019.
Review of economic indicator “ATCO- hour productivity” from 2017 – 2018
Brussels ACC 2017 2018 Change
ATCO- hour productivity 0.73 0.75 +3%
Table 23: ATCO hour productivity - Brussels ACC
29127
29460
29459
25000 26000 27000 28000 29000 30000
EBBUCTA
Sector hours
2017
2018
2019

57
11.8 Croatia: Zagreb ACC
Review of evolution of declared capacity from 2012 to 2020
Total ATFM delay 128k 44k 162k 285k 22k 70k 389k 627k
Sector name 'C' delay 2012 2013 2014 2015 2016 2017 2018 2019 2020 LDZOHW 244921 35 35 35 35 37 37 LDZOULW 178823 35 38 38 38 38 40 40 40 40 LDZON 86813 37 40 40 40 40 42 42 42 42 LDZOULA 65765 34 37 37 37 37 37 37 37 37 LDZOULN 46142 36 36 36 36 36 38 38 38 37 LDZOULN36 44217 38 38 38 38 37 LDZOTHW 41297 38 40 40 40 40 40 40 40 LDZOTHS 40653 36 36 36 36 38 38 38 38 LDZOTHN 38142 40 40 40 40 42 42 40 40 LDZOUW 32313 34 35 35 35 35 37 37 37 37 LDZOHA 30901 30 34 31 31 33 33 35 35 LDZOULS 19611 35 37 37 34 34 37 37 37 37 LDZOHULSX 15056 37 LDZOTHN37 13241 38 38 38 38 38 LDZOS 10744 37 37 37 37 37 37 37 37 37 LDZOHULNX 10460 37 LDZOHN 10270 36 40 37 37 37 37 37 37 LDZOTA 10265 33 33 34 34 34 38 38 38 38 LDZOTHA 6598 34 34 34 34 36 36 36 36 LDZOLW 5447 33 34 37 34 34 34 34 34 34 LDZOT 3691 36 40 40 40 40 40 40 40 40 LDZOTW 2907 36 36 36 36 36 36 36 36 LDZOUL36 2606 35 35 36 36 LDZOLA 1915 35 35 36 36 36 38 38 38 38 LDZOW 1187 37 37 37 37 37 37 37 37 37 LDZOUA 1016 34 35 35 35 35 35 35 35 35
Table 24: Evolution of declared capacity - Zagreb ACC
Following two years (2012/2013 and 2013/2014) of predominantly upward revisions to declared capacity, there were several downward revisions in 2015. The year 2016/2017 saw increases in declared capacity.
Five sectors have declared capacities at a lower level in 2020 than previously declared for the same sector in the previous seven years.
Four of the twenty sectors with highest delays attributed to ATC capacity are elementary sectors according to the NM systems, the rest being collapsed sectors.

58
Review of capacity planning and implementation
Figure 28: Evolution of capacity plans - Zagreb ACC
Figure 28 shows the capacity plans, as published in the annual Network Operations Plan (NOP), from 2012 to 2019 for Zagreb ACC.
A lowering along the vertical axis indicates a reduction in planned capacity; moving the same vertical value to the right indicates a postponement of capacity planning.
The starting point for each series is the level of capacity provided during the sampling period for the previous year.
The capacity plan from 2012 started with a base capacity of 138 aircraft per hour and planned to increase to 180 aircraft per hour by 2016.
The 2013 plan started from a base capacity of 140 and planned to increase to 170 aircraft by 2017.
The 2014 plan started with a base capacity of 143 with planned increases to 167 aircraft per hour by 2019.
The 2015 plan started from a base of 147 with planned increases to 167 aircraft by 2019.
The 2016 capacity plan started from a slightly reduced base capacity of 145 aircraft per hour, aiming to provide 163 aircraft per hour by 2020.
The 2017 plan was exactly in line with the plan from 2016 and extrapolated further to 170 aircraft by 2021.
In 2018, Zagreb ACC added significant capacity (base capacity increase from 149 aircraft per hour in 2017 to 157 aircraft per hour in 2018) and planned 177 per hour by 2022.
The capacity plans from 2019 remain consistent with the previous year’s plan and plans a capacity of 185 aircraft per hour by 2024.
130
140
150
160
170
180
190
2012
2013
2014
2015
2016
2017
2018
2019
2020
2021
2022
2023
2024
Zagreb ACC
Hour
ly c
apac
ity2012-2016
2013-2017
2014-2019
2015-2019
2016-2020
2017-2021
2018-2022
2019-2024

59
Review of attributed causes for ATFM regulations
(See 6 Review of attribution of ATFM delay cause to understand divergence with ATFCM Operations Manual criteria)
Table 25: Sectors with staffing delays - Zagreb ACC
As discussed earlier in this Technical Note, in attributing ATFM delays to ATC staffing, ANSPs report that the cause of the capacity constraint was a lack of available ATC staff.
Therefore, the sector configurations listed above are deployed when the ANSP does not have sufficient qualified staff available to deploy additional capacity by de-collapsing sectors.
On the basis that these sector configurations already constrain capacity, and are operated as such due to a lack of ATC staff, it can be argued that ATC staffing plays a significant role in ATFM regulations attributed to ATC capacity and weather at these locations.
2017 - 2019 Total aggregated delays Sector name ATC Staffing Weather ATC Capacity LDZON 3469 31611 37707 LDZOHULNX 3030 2120 10460 LDZOHA 2404 25553 29085 LDZOT 1777 554 3691 LDZOTHW 1582 8422 5508

60
Figure 29 shows that ATC staffing is the cause of, or a significant contributory factor to, the majority of ATFM delays in Zagreb ACC.
As explained earlier in this Technical Note, the revised attribution for ATC capacity and adverse weather can still contain delays due, entirely or in part, to ATC staffing.
ATC Capacity
59%
Weather36%
ATC Staffing
3% All Other 2%
2019 original attribution
ATC Capacity
54%
Weather43%
ATC Staffing
2%All Other 1%
2018 original attribution
ATC Capacity
35%
Weather52%
ATC Staffing
13%All Other
0%
2017 original attribution
ATC Capacity
25%
Weather11%
ATC Staffing
61%
All Other 3%
2019 revised attribution
ATC Capacity
28%
Weather17%
ATC Staffing
54%
All Other 1%
2018 revised attribution
ATC Capacity
7%
Weather18%
ATC Staffing
75%
All Other
0%
2017 revised attribution
Figure 29: Alternative ATFM attribution - Zagreb ACC

61
Review of sector hours 2017 - 2019
Figure 30: Sector hours - Zagreb ACC
Zagreb ACC has increased the number of sectors hours year-on-year.
In 2017 Zagreb ACC deployed 32486 sector hours, 34257 hours in 2018 and 36576 sector hours in 2019. This represented an overall increase of 13% over the period.
Zagreb ACC created 70k minutes of delay in 2017, 389k minutes of delay in 2018 and 626k minutes of delay in 2019. Traffic was 543k flights in 2017, 600k flights in 2018 (+10%) and 666k flights in 2019 (+10%).
Zagreb FIR traffic ( which includes flights not controlled by Zagreb ACC) over the same period increased from 581k flights in 2017 to 640k flights in 2018 and to 708k flights in 2019.
Review of economic indicator “ATCO- hour productivity” from 2017 – 2018
Zagreb ACC 2017 2018 Change
ATCO- hour productivity 1.55 1.64 +6%
Table 26: ATCO hour productivity - Zagreb ACC
36576
34257
32486
25000 27000 29000 31000 33000 35000 37000 39000
LDZOCTA
Sector hours
2017
2018
2019

62
11.9 Germany: Bremen ACC
Review of evolution of declared capacity from 2012 to 2020
Total ATFM delay 39k 38k 53k 48k 85k 77k 115k 565k Sector name 'C' Total 2012 2013 2014 2015 2016 2017 2018 2019 2020
EDWWSOUTH 230813 32 32 32 32 32 32 32 32 EDWWDBAT 75851 40 40 40 34 34 EDWWDBAS 75667 25 25 25 25 25 25 25 25 25 EDWWEMSC 55224 32 22 22 22 22 22 22 22 22 EDWWFLG 27909 41 39 39 39 39 39 39 39 39 EDWWHAMC 21087 36 36 36 36 36 36 36 36 36 EDWWHRZ 19221 38 38 38 38 38 38 38 38 38 EDWWMARMRZ 13622 24 24 24 24 24 24 18 18 18 EDWWDBANS 11917 29 29 29 29 29 29 29 29 29 EDWWHAN 6771 25 25 25 25 25 25 25 25 25 EDWWHEIC 5916 32 32 32 32 32 32 32 32 32 EDWWMAR 2757 42 42 42 42 42 42 42 42 36 EDWWDSTC 2490 32 32 32 32 32 32 32 32 32 EDWWDBAN 1690 25 25 25 25 25 25 25 25 25 EDWWFRIC 1201 30 30 30 30 30 30 30 30 30
Table 27: Evolution of declared capacity - Bremen ACC
The above table shows that there has not been any increase in declared capacity for any constraining sector in Bremen ACC since 2012. There have been five reductions in declared capacity, since 2012.
Review of capacity planning and implementation
Figure 31: Evolution of declared capacity - Bremen ACC
Figure 31 shows the capacity plans, as published in the annual Network Operations Plan (NOP), from 2012 to 2019 for Bremen ACC.
A lowering along the vertical axis indicates a reduction in planned capacity; moving the same vertical value to the right indicates a postponement of capacity planning.
140
142
144
146
148
150
152
154
156
158
160
2012
2013
2014
2015
2016
2017
2018
2019
2020
2021
2022
2023
2024
Bremen ACC
Hour
ly c
apac
ity
2012-2016
2013-2017
2014-2019
2015-2019
2016-2020
2017-2021
2018-2022
2019-2024

63
The starting point for each series is the level of capacity provided during the sampling period for the previous year.
The capacity plan for Bremen ACC in 2012, for the years 2012-2016, started with a base capacity of 148 aircraft per hour and planned a capacity of 153 aircraft per hour by 2016.
Capacity was added during 2012 since the base for the 2013 plan started at 151 and following a projected decrease in capacity in 2014 and 2015, planned to increase capacity to accommodate 156 aircraft per hour by 2017.
The 2014 plan started at base capacity of 151 and planned to increase capacity to 156 aircraft by 2017 before reducing capacity to 152 by 2019.
The capacity plan from 2015 planned to decrease capacity after 2016.
The capacity plan from 2016 started at 151 and showed no additional capacity until 2019 when capacity would grow again to 154 aircraft per hour.by 2020.
The 2017 capacity plan started at a reduced base capacity of 149 and planned 156 aircraft per hour by 2019.
In 2018, Bremen ACC’s capacity plan started at base capacity 151 and planned no capacity increase for the period 2018-2022.
In 2019, Bremen ACC’s capacity plans started from a reduced base capacity of 148 and planned a decrease in capacity to 143 aircraft per hour in 2020. Capacity is due to increase again in 2021. By 2023 Bremen ACC plan for a capacity of 158 aircraft per hour.
Review of attributed causes for ATFM regulations
(See 6 Review of attribution of ATFM delay cause to understand divergence with ATFCM Operations Manual criteria)
Table 28: Sectors with staffing delays - Bremen ACC
As discussed earlier in this Technical Note, in attributing ATFM delays to ATC staffing, ANSPs report that the cause of the capacity constraint was a lack of available ATC staff.
Therefore, the sector configurations listed above are deployed when the ANSP does not have sufficient qualified staff available to deploy additional capacity by de-collapsing sectors.
On the basis that these sector configurations already constrain capacity, and are operated as such due to a lack of ATC staff, it can be argued that ATC staffing plays a significant role in ATFM regulations attributed to ATC capacity and weather at these locations.
2017 - 2019 Total aggregated delaysSector name ATC Staffing Weather ATC CapacityEDWWSOUTH 20647 36889 229600EDWWDBANS 12700 68092 10880EDWWHAMC 8946 1568 7527EDWWHAN 4019 282 6199EDWWMARMRZ 3251 3790 13398EDWWHEIC 1601 1210 3576EDWWEMSC 1101 13433 54815

64
Figure 32: Alternative ATFM attribution- Bremen ACC
Figure 32 shows that ATC staffing is the cause of, or a contributory factor to, a significant amount of ATFM delays in Bremen ACC.
As explained earlier in this Technical Note, the revised attribution for ATC capacity and adverse weather can still contain delays due, entirely or in part, to ATC staffing.

65
Review of sector hours 2017 - 2019
Note: the DFS report that the figures in NEST do not entirely correspond to the actual sector hours.
Figure 33: Sector hours - Bremen ACC
Figure 33 shows the three main sector groups in Bremen ACC: South, North and East.
According to the information recorded in the NM systems (N.E.S.T.) there was an increase in sector hours from 2017 to 2018 for the East sector group, and a marginal increase or the South sector group. However, from 2018 to 2019, both sector groups reduced the number of sector hours to below what was provided in 2017.
The North sector group deployed fewer sector hours year-on-year.
For the ACC as a whole, there were 106835 sector hours in 2017, 107482 in 2018 and 103885 in 2019. The change between 2017 and 2019 is approximately a 3% reduction in sector hours.
Bremen ACC created 77k minutes of ATFM delay in 2017, 115k minutes of delay in 2018 and 565k minutes of delay in 2019.
Traffic was 649k flights in 2017, 668k flights in 2018 (+3%) and 657k flights in 2019 (-2%).
Review of economic indicator “ATCO- hour productivity” from 2017 – 2018
Bremen ACC 2017 2018 Change
ATCO- hour productivity 0.80 0.84 +5%
Table 29: ATCO hour productivity - Bremen ACC
50002
33233
20650
51932
33828
21722
50901
34453
21481
15000 20000 25000 30000 35000 40000 45000 50000 55000
EDWWCTAE
EDWWCTAN
EDWWCTAS
Sector hours
2017
2018
2019

66
11.10 France: Reims ACC
Review of evolution of declared capacity from 2012 to 2020
Total ATFM delay 186k 259k 385k 512k 263k 254k 1 317k 633k Sector names 'C' Total 2012 2013 2014 2015 2016 2017 2018 2019 LFEEHYR 522446 38 38 38 38 38 38 LFEEKR 195498 30 35 31 30 30 32 30 30 LFEE5R 161525 42 42 42 42 LFEEKHN 132853 38 40 40 40 40 40 40 40 LFEE4E 128353 40 40 40 40 40 40 40 LFEE4N 118586 42 42 44 44 44 44 44 LFEE4H 89795 40 38 38 38 38 38 38 LFEE2F 86660 36 40 40 40 40 40 40 40 LFEEUXR 82826 40 35 35 35 35 35 35 35 LFEEKN 76296 30 33 33 30 30 30 LFEEKD 68293 38 38 34 34 36 36 36 LFEEXR 52830 32 32 30 33 33 33 33 33 LFEEUBN 33373 36 35 35 35 35 LFEEHN 29761 38 33 38 38 38 38 38 38 LFEEKD2F 28928 42 40 40 40 40 40 40 LFEEKHE 25988 35 35 35 35 35 35 LFEEUXE 19563 36 35 35 35 35 35 35 35 LFEEHR 17882 38 33 33 33 LFEEKHR 14787 43 42 42 42 42 42 42 42 LFEESE 14355 26 30 30 30 30 30 30 30 LFEEUF 13584 34 34 34 30 34 34 34 LFEEKHH 13239 33 31 31 31 31 31 31 LFEEESE 12098 30 32 33 33 33 33 33 33 LFEE5E 10179 40 40 40 LFEEUXH 8383 36 34 34 34 34 34 34 34 LFEEUXKE 8017 35 35 35 35 LFEEUXKR 7444 38 38 38 38 38 LFEEHE 7252 33 33 33 33 33 33 LFEEKF 6412 33 29 33 33 33 33 33 LFEE5EH 6238 42 42 38 38 38 38 LFEEUN 6213 35 35 37 36 36 LFEERMS 5391 38 32 LFEEUXKH 4567 35 35 35 35 35 35 LFEEURMN 4443 42 42 42 42 LFEESEUH 4098 35 35 35 LFEEUKBN 2745 40 38 42 42 38
Table 30: Evolution of declared capacity - Reims ACC
As can be seen from Table 30 above, six sectors in Reims ACC show an increased declared capacity currently, than already previously declared in 2012.
Fourteen sectors show less declared capacity than previously declared.

67
Seven of the twenty sectors with the highest delay attributed to ATC capacity are elementary sectors, according to the NM systems; the remaining thirteen are collapsed sectors.
Review of capacity planning and implementation:
Figure 34: Evolution of capacity plans - Reims ACC
Figure 34 shows the capacity plans, as published in the annual Network Operations Plan (NOP) from 2012 to 2019 for Reims ACC.
A lowering along the vertical axis indicates a reduction in planned capacity; moving the same vertical value to the right indicates a postponement of capacity planning.
The starting point for each series is the level of capacity provided during the sampling period for the previous year.
The initial capacity plan in 2012, for the years 2012-2016, started with a base capacity of 183 aircraft per hour and planned 204 aircraft per hour by 2016.
The capacity plan from 2013 had a base capacity of 182 and planned 194 aircraft by 2017.
In 2014, there was a significant rise in capacity (base capacity increased from 182 in 2013 to 198 in 2014) and planned capacity was 235 aircraft per hour by 2019.
The capacity plan from 2015 started at a reduced level of base capacity from the previous year (188) and the future capacity plans showed 202 aircraft per hour planned for 2019.
The capacity plan from 2016 started with 192 base capacity and planned 220 aircraft per hour by 2020.
A significant amount of capacity was added in 2016 and the 2017 capacity plan started from a base of 227 aircraft per hour, rising to 243 by 2021.
The capacity plan for 2018 planned 247 aircraft per hour by 2022.
The 2019 capacity plan shows a decrease in delivered capacity in 2018, with a base of 198 aircraft per hour (down from 224 in 2018), and plan a further drop in capacity for 2020 (down to 192) before adding capacity to achieve 241 aircraft per hour by 2024.
170
180
190
200
210
220
230
240
250
260
2012
2013
2014
2015
2016
2017
2018
2019
2020
2021
2022
2023
2024
Reims ACC
Hour
ly c
apac
ity2012-2016
2013-2017
2014-2019
2015-2019
2016-2020
2017-2021
2018-2022
2019-2024

68
Review of attributed causes for ATFM regulations.
(See 6 Review of attribution of ATFM delay cause to understand divergence with ATFCM Operations Manual criteria)
2017 - 2019 Total aggregated delays Sector name ATC Staffing Weather ATC Capacity LFEE4E 92520 14201 41701 LFEE4H 85926 30407 37456 LFEE5R 84875 32843 160639 LFEE4N 58183 23984 102532 LFEE2F 48837 27732 16652 LFEEKD2F 29030 21355 15403 LFEEKHN 25577 31879 119854 LFEEURMN 17847 15174 3816 LFEEKHE 17270 32182 5405 LFEEUXE 15378 24915 3368 LFEE5E 15336 157 10179 LFEEESE 13965 13885 5967 LFEEKHH 13345 14978 2839 LFEEKHR 10762 5249 9384 LFEE5EH 9437 8084 3727 LFEERFUE 8206 7798 1517 LFEE5H 7212 115 765 LFEEUXR 4610 10120 8733 LFEERMS 3004 2560 4696 LFEEUXKR 2937 354 2023 LFEEUXH 1934 6000 1277 LFEEXKE 1421 LFEEUXKE 1218 1974
Table 31: Sectors with staffing delays - Reims ACC
As discussed earlier in this Technical Note, in attributing ATFM delays to ATC staffing, ANSPs report that the cause of the capacity constraint was a lack of available ATC staff.
Therefore, the sector configurations listed above are deployed when the ANSP does not have sufficient qualified staff available to deploy additional capacity by de-collapsing sectors.
On the basis that these sector configurations already constrain capacity, and are operated as such due to a lack of ATC staff, it can be argued that ATC staffing plays a significant role in ATFM regulations attributed to ATC capacity and weather at these locations.

69
Figure 35 shows that ATC staffing is the cause of, or a contributory factor to, a significant amount of ATFM delays in Reims ACC.
As explained earlier in this Technical Note, the revised attribution for ATC capacity and adverse weather can still contain delays due, entirely or in part, to ATC staffing.
ATC Capacity
39%
Weather12%
ATC Staffing
43%
All Other 6%
2019 original attribution
ATC Capacity
46%
Weather20%
ATC Staffing
22%
All Other 12%
2018 original attribution
ATC Capacity
69%
Weather17%
ATC Staffing
2%All
Other 12%
2017 original attribution
ATC Capacity
28%
Weather3%
ATC Staffing
62%
All Other 7%
2019 revised attribution
ATC Capacity
9%
Weather3%
ATC Staffing
76%
All Other 12%
2018 revised attribution
ATC Capacity
54%
Weather10%
ATC Staffing
24%
All Other 12%
2017 revised attribution
Figure 35: Alternative ATFM attribution - Reims ACC

70
Review of sector hours 2017 - 2019
Figure 36: Sector hours- Reims ACC
There are three main sector groups in Reims ACC, North, East, and Central.
According to the information recorded in the NM systems (N.E.S.T.) the Central sector group increased the number of sector hours deployed between 2017 and 2018, and maintained the number in 2019. The North sector group deployed the same amount of sector hours in 2018 as in 2017 before decreasing in 2019. The East sector group has reduced the number of sector hours deployed year on year.
Reims ACC, as a whole, deployed 70739 sector hours in 2017, reducing slightly to 70457 in 2018 and further reducing to 68892 sector hours in 2019.
Reims ACC created 253k minutes of ATFM delay in 2017, 1.32 million minutes of delay in 2018 and 633k of delays in 2019.
Traffic was 1,005k flights in 2017, 1,038k flights in 2018 (+3%) and 1,022k flights in 2019 (-2%).
Review of economic indicator “ATCO- hour productivity” from 2017 – 2018
Reims ACC 2017 2018 Change
ATCO- hour productivity 0.82 0.80 -2%
Table 32: ATCO hour productivity - Reims ACC
10000 15000 20000 25000 30000 35000
LFEECTAC
LFEECTAE
LFEECTAN
Sector hours
2017
2018
2019

71
Annex 2: Stakeholder feedback
All of the seven ANSPs listed in the document (the ANSPs of Austria, Belgium, Croatia, France, Germany, Hungary and Spain) were provided with a draft copy of this technical note and were invited to provide feedback.
The PRC received feedback from Austro Control, Croatia Control, DFS, ENAIRE and HungaroControl. Their feedback, with PRC comments, are included hereafter.
The ANSP feedback has been formatted as follows:
Referenced text from the draft document is presented offset, italicized, and with a grey background.
Text from the ANSP is presented in plain type.
PRC comments regarding the specific points raised by the ANSP are presented with a blue background.
The PRC did not receive feedback from DSNA or skeyes.
12 AUSTRO CONTROL: FEEDBACK
Austro Control appreciates the PRC initiative of a detailed analysis of the various facets of en route capacity such as declared capacity, deployed capacity and planned capacity.
Especially in the view of the current COVID situation, elaborations on further streamlining the capacity efforts and offers need to be tackled right now, to be prepared for future challenges.
Being exceptionally one of the ten ACCs identified in the Performance Review Report 2019 as the most constraining ACCs in the network for 2019 in terms of total ATFM delay, we are glad to dissect the TECHNICAL NOTE ON EN ROUTE CAPACITY and analyse its impacts as follows on the next pages.
Additional remarks on 2019 season
Heavy CB and TS activity throughout the summer season from April till September
CBs spreading over the whole LOVV FIR, causing difficult and complex situations, especially in cross border areas
CBs & TS in adjacent FIRs forcing aircraft to deviate into ACC Wien AoR and causing overloads and over-deliveries (unanticipated traffic)
Austro Control MET staff was performing their tasks from ACC Wien OPS room to ease coordination with Supervisors and FMP during certain days in June, July and August
Lead Time for application of „Weather Regulations“ has again been increased compared to previous seasons
As pre-cautionary measures, ATFCM regulations due to ATC Capacity and ATC Staffing had to be applied in certain occasions with rates < 100% to absorb unanticipated traffic
Participation in the joint FL adherence days of FABCE / Danube FAB / SMATSA on 2nd and 3rd May

72
ATCOs have been briefed to apply FPL-adherence (RFL, routeing) as much as possible during 2019 to reduce the amount of sector overloads/over-deliveries in own and downstream sectors
PRC comment: The PRC is grateful for the additional information.
General remarks:
The PRC is also aware that many ANSPs handle traffic levels well above the declared sector capacities, on a regular basis. This has been highlighted by the PRC in previous editions of the Performance Review Report. In fact, the PRC has made specific recommendations that ANSPs should review the sector capacities to ensure that any latent capacity in the system can be utilized by airspace users. Updating the declared sector capacities provides additional capacity at no cost to the ANSP, since they were already providing the capacity albeit ‘unofficially’
The pure comparison of declared (average!) sector capacity figures and occasionally handled traffic beyond these values, does not allow a general pre-judgement of ‘unofficial‘ capacity.
PRC comment: The declared capacity figures are not average values, rather they are the sector specific values used in the strategic and pre-tactical phases for capacity planning and for the identification of capacity bottlenecks.
The PRC is not making a general pre-judgement, instead, it is asking ANSPs to review their specific circumstances and to update the declared capacities if it applies to them.
Fact is that, depending on specific traffic patterns and hence less traffic complexity, occasionally more traffic might pass through a specific sector.
Austro Control would be interested in specific ANSPs and sectors, applying these unofficial additional capacities.
PRC comment: The PRC are simply suggesting that ANSPs, in their constant goal to improve capacity, may review the number of occasions that the sector is able to safely accommodate traffic above the level of declared capacity. If the ANSP can increase declared capacity then this would be of benefit to the airspace users.
In principle, since the ambition of EUROCONTROL and its Member States is to improve capacity performance by the ANSP, it is better to attribute all delays to ANSP-internal reasons such as staffing or equipment, unless there were no internal constraints applicable at the time.
Notwithstanding the ambition to improve capacity performance, the sole intention to narrow down delay reasons just to ANSP-internal ones, is not acceptable.
PRC comment: The PRC is not stating that the intention is to narrow down delay reasons just to ANSP-internal ones. The specific point contains the caveat ‘unless there were no internal constraints applicable at the time’. Of course an ANSP should attribute delays to adverse weather, if adverse weather was the sole cause of the capacity constraint.
If lack of ATC staffing lowers available capacity from 50 aircraft per hour to 35 aircraft per hour but then weather further reduces the 35 to 33, then attributing all ATFM delays to adverse

73
weather (and obscuring the fact that staff shortage would have already created delays) could be seen as being misleading.
It goes without saying that specific areas need specific solutions, hence external constraints such as weather, can never be fully compensated by e.g. additional staff. Weather induced mix of traffic flows require short term collapsing & de-collapsing of sectors, based on the available staff.
PRC comment: The PRC agrees with this statement and notes that Austro Control accepts that the level of available staff is a critical factor.
Declared Capacity
The PRC notes that the vast majority of ATC sectors, which cause the greatest amount of delays, are collapsed sectors, constructed of two or more elementary sectors. Fundamentally, this means that additional capacity existed but that the ANSPs, for whatever reason, failed to provide it when needed by the airspace users.
It is a fact that Declared Capacity during the strategic process should also encompass facts like
- Enhanced /reduced /unpredictable … FL / FPL adherence, hence: unpredictable flight trajectories
- eNM Measures (like the 4 ACC initiative, and meanwhile eNM measures which are elaborated each year) influencing heavily traffic flows and traffic patterns, i.e. the complexity of traffic shifts at short notice, affecting new sectors and sector combinations.
- eNM Measures requiring sector adjustments to allow for optimizing climbs and descents to / from major aerodromes (e.g.: LOVV 3-Sector combinations at FL350 and FL360)
PRC comment: The PRC understands that the declared capacities do consider the specific characteristics of the sector, including typical flight trajectories and FL/FPL adherence.
As regards the eNM measures, the PRC understands that although the increase in demand was the greatest change, certain trajectories were also affected as flights were kept below certain sectors.
However, the above arguments underline the importance of providing as much capacity as possible (by opening sectors) rather than reducing available capacity by collapsing sectors.
Planned Capacity:
“… With the exception of reductions in capacity due to specific safety risks (with documented safety cases), it is difficult to envisage how an airspace / ATC unit cannot safely accommodate the same declared capacity as it did previously.”
It goes without saying that each possible reduction in planned capacity is based on clear specific safety cases.
Moreover, Austro Control is fully compliant with the capacity processes as described in the relevant ECTL Guidelines and User Manuals.
Planned capacity: as published in the Network Operations Plan. These values are based on serious calculations

74
Declared capacity: the more detailed capacity available during the strategic and pre-tactical process.
Expected capacity: the capacities (monitoring values and sector configurations) decided and finalised at the end of the pre-tactical process (16:00 UTC D-1).
If a regulation is applied because traffic is expected to be higher than the expected capacity (the capacity plan of at least D-1), then ATC capacity should be the regulation reason.*
If a regulation is applied because the centre is unable to deliver the expected capacity, then ATC staffing should be the regulation reason. It is an ‘on the day shortage of capacity’ and in general is due to controller unavailability.* *see copy of excerpt of Regulation Reasons from NM ATFCM Operations Manual (below).
PRC comment: The PRC acknowledges that the declared capacity of a sector could be reduced if a safety issue became apparent. It follows that the aggregated capacity of an ATC unit could be reduced if one or more sectors had to reduce declared capacity because of safety risks. In such case(s) there would be safety documentation demonstrating the need to reduce declared capacity.
The PRC cannot envisage any other reason to reduce the declared capacity of a sector or of a group of sectors (ATC unit).
Since the declared capacity remains constant, capacity plans in the NOP showing decreased capacity from one year to the next must be driven by the ANSPs intention to deploy less of the existing capacity.
The PRC, as evidenced by previous recommendations, does not consider the guidelines in the ATFCM manual as being sufficiently robust or providing the required transparency to airspace users. Attributing delays to ATC capacity rather than ATC staffing, simply because the lack of staff was known in advance, does not change the fact that it was a lack of available ATC staff that created the capacity constraint, not an excessive demand of air traffic.
Deployed capacity
“… By operating collapsed sectors rather than deploying maximum capacity by opening elementary sectors, the ANSPs are themselves adding additional capacity constraints and causing greater delays to airspace users…”

75
“… Additionally, by attributing delays in collapsed sectors to ATC capacity, the ANSPs are ignoring the fact that additional capacity already exists in their own airspace but it is not being deployed to satisfy the existing demand of airspace users.”
Operating collapsed sectors during bad weather situations such as huge CBs and weather fronts like big squall lines, tends to be more efficient than operating more elementary sectors, provoking additional coordination efforts.
PRC comment: In regards to the operation of collapsed sectors during periods of adverse weather, the PRC notes the difference between having sufficient staff available to provide the required capacity - and then collapsing sectors to reduce excessive workload on ATCOs and the separate situation where staff is not available to open additional sectors and the workload of the ATCOs in the collapsed sector is increased due to the adverse weather.
Analysis of the sector configurations deployed during periods of adverse weather for summer 2019 shows that the sectors were opened and collapsed in line with the sector planning published in NOP 2019-2024 rather than determined by the weather itself.
[Note: the text in the Technical Note was amended to read ‘…the ANSPs are overlooking the fact that additional capacity already exists…’]
Initial traffic
“…It is arguable that the ANSP could have handled the initial traffic without any delays, despite the presence of adverse weather, except for capacity constraints originating from the operation of a collapsed sector, instead of opening two separate sectors simultaneously.”
The term ‚initial traffic‘ needs to be clarified. Actually – considering the opening and merging of sectors in the tactical phase – only ‚last filed FPLs‘ and ‚actual trajectories‘ are considered as criteria for sector management activities.
PRC comment: The PRC has used the initial traffic trajectory from the NEST/DDR (demand data repository), which is defined as the last filed flight plan from the airline (without regulations being applied.)
The PRC notes that the opening and merging of sectors is also constrained by the decisions taken in the strategic and pre-tactical phases. If sufficient capacity is not planned, or if sufficient levels of ATC staff are not deployed to provide capacity, then there will inevitably be ATFM delays. That is why the PRC considers it to be critically important to look at the strategic and pre-tactical planning of capacity, not just the tactical deployment.
“The PRC were surprised to note that many of the constraining ANSPs reviewed have actually reduced the number of sector hours being deployed, year on year.”
It would be of interest to know, which ANSPs used to reduce the number of sector hours
PRC comment: In the Technical Note document, the following ATC units reduced the number of sector hours over the period 2017-2019:

76
Karlsruhe UAC; Marseille ACC, Budapest ACC, Barcelona ACC, Brussels ACC, Bremen ACC and Reims ACC.
“Sectors recorded as elementary sectors in the NM systems are highlighted in blue. Staffing delays in these elementary sectors are possibly for training purposes, for example reducing available capacity (and therefore creating regulations and delays) because the ATCO-in training is not yet able to handle the level of declared capacity.”
Again, it would be of interest to know about this kind of practice and where it might be applied. Austro Control never puts ATFM regulations to comfort training purposes.
PRC comment: The PRC notes that whilst Austro Control has not attributed any ATC staffing delays to elementary sectors, other ANSPs have.
PRC comment: The PRC Technical Note reports the ATCO-hour productivity from Annex 8 Table 0.7 of the ACE report, which was 1,36 and 1,42 for Wien ACC in 2017 and 2018 respectively.
The figures quoted in ACG comments above refer to the composite flight hours for the ANSP (including APP and TWR) rather than the ACC on its own.
The sector hours have been derived from operational data provided to the NM systems NEST/DDR rather than the submission for the ACE report.
The PRC is grateful for highlighting that the change in ATFM delays is incorrect and should only be +229%. The main document has been amended.

77
PRC comment: The PRC is grateful for the correction of the figures and has changed the table in the document.
The PRC acknowledges that the eNM measures could increase demand in several sectors but an increase in demand does not affect the capacity.
In regards to changes in traffic complexity, the PRC notes that ANSPs frequently manage traffic complexity via use of the Route Availability Document (RAD). If an increase in more complex traffic creates excessive workload for the ATCOs then the ANSP has to optimise the provision of flight efficiency with the required level of capacity.
“…Of more concern are the 4 sectors that show a declared capacity less than they were providing in the previous 4 years.”
We cannot find the 4 sectors mentioned in the PRC report (please see the table on p.32)
PRC comment: According to the corrections to the data provided by Austro Control the declared capacity of the following five sectors is lower in 2020 than previously provided in any of the preceding 4 years:
LOVVW12: 40 in 2020 compared with 42 in 2018;
LOVVWB12: 40 in 2020 compared with 41 in 2018 & 2019;
LOVVN12: 42 in 2020 compared with 43 in 2019 & 2018;
LOVVW3: 39 in 2020 compared with 43 in 2018;
LOVVSC15: 49 in 2020 compared with 51 in 2018.

78
PRC comment: The PRC uses the same official database as is used to calculate the ATFM delays for the annual Performance Review Report and for the SES Performance scheme.
The NM dashboard produces slightly different values, which do not affect the findings of the PRC report.
Questionable methodology for the revised attribution. We rather suggest drawing a comparison with the EU average or the Top 10 most constraining ACCs.
PRC comment: The Technical Note takes the top ten most constraining ACCS shown in PRR 2019. The PRC may consider broadening the scope to all ANSPs in future reports.
Discrepancy: weather 4% instead of 2% in 2018 (see Figure below: Replication of the pie charts by Austro Control)

79
PRC comment: Using a different source of data (NM dashboard instead of PRU dashboard) can lead to differing results. If weather goes from 55% to 4% or from 55% to 2% such a change is minimal. Austro Control will certainly agree that it in no way alters the thrust of the PRC findings.
“…In 2017 there were 53.169 hours; in 2018 there were 55.255 hours and in 2019 there were 55.476 hours…“
These values do not correspond to the values referring to ACE 2017 & 2018 Reports. Would you please be kind and provide the source of the data?
PRC comment: As explained in the document (page 11).
“The third part of the operational analysis focuses on the deployment of ATCOs to provide capacity to airspace users. From the data in the NM systems, DDR / N.E.S.T. database, the PRC was able to aggregate the sector hours deployed for each ACC over the period 2017 – 2019.“
A: "...995k flights in 2017, 1.06 million flights in 2018 and 1.11 million flights in 2019. Wien ACC saw an increase in traffic of more than 11% from 2017 to 2019.”
B: “Traffic was 840k flights in 2017, 901k flights in 2018 (+7%) and 932k flights in 2019 (+3%).”

80
(A) Values are based on PRU Portal; however, NM Dashboard reports different values for ACC Wien (B) 2017: 840.062 (=840k), 2018: 900.901 (=901k), and 2019: 931.485 (=931k)
! Only one source of the data should be used !
Rounding error of the increase in traffic (2019 vs. 2017): 12%
PRC comment:The PRC has corrected the text to show only the flights handled in Wien ACC and not handled by the ANSP Austro Control. The numbers of flights for 2017-2019 now read as 840k (839898), 901k and 932k (931501) as produced by the PRU database. The increase between 2017-2019 is 11% (10,9%).
“In 2017 Wien ACC had 245k minute of delay; in 2018 806k minutes of delay, and in 2019 there were 1.7 million minutes of delay.”
The value is inconsistent with the value showed on page 32
PRC comment: The rounding error has been corrected, the figure on page 32 has been corrected.
Change in ATCO hour productivity:
according to ACE 2018 Report:
+5% (YoY)
2018: 1,01
2017: 0,96
PRC comment: Annex 8 – Key data 159
ACE 2017 Benchmarking Report with 2018-2022 outlook
Annex 8 - Table 0.7: Operational data at ACC level, 2017 reports Wien ACC as having ATCO hour productivity of 1,36.
Annex 8 – Key data 173
ACE 2018 Benchmarking Report
Annex 8 - Table 0.7: Operational data at ACC level, 2018 reports Wien ACC as having ATCO-hour productivity of 1,42.
The figures referenced by Austro Control relate to composite flight hours for the entire ANSP and not just the ACC.
Discrepancy in traffic forecast revealed in NOP reports (in comparison with STATFOR)
We assume that the calculation of the % growth is based on the actual data; however, e.g. STATFOR Oct 2011 does not reveal actual data for 2011 (see also NOP 2014-19, NOP 2015-19)
Nevertheless we discover discrepancy in traffic forecast!

81
PRC comment: The PRC notes that STATFOR produce forecasts for large areas e.g. FIRs and at annual level. They do not produce forecasts at sector level or at hourly granularity. The PRC notes that each STATFOR forecast predicted traffic growth for Austria.
The PRC would expect capacity plans to show growth year on year to accommodate the additional traffic. The PRC would expect to see the traffic plans implemented as planned.
The PRC wonders why the capacity plans for Wien ACC appear to be unchanged since 2014, according to what is published in the NOP.

82
13 CROATIA CONTROL: FEEDBACK
Evolution of declared capacity for Zagreb ACC Throughout the observed period 2012-2020, a number of changes affecting Zagreb ACC were implemented, several changes in lateral and vertical sector boundaries, ATM system upgrades, DCT and FRA implementation and a complete redesign of the airspace prepared for 2020.
Zagreb ACC and Sector Capacity Plan - is a yearly rolling document, which identifies elements that influence sectors capacities year on year - such as afore mentioned significant changes in the Airspace, implementation of new ATCO tools and processes, FRA implementation etc.
For summer season 2015, the following changes affecting sector capacities were identified: Changes planned for summer 2015:
• Implementation of new lateral sector CENTRAL • Implementation of dynamic DFL355/365 in sector NORTH • Lateral expansion of TMA Zagreb • Change of lateral boundaries of ACC sectors • Implementation of Night “South-East Axis Free Route Airspace“ (SEAFRA) • Implementation of a set of DCT route options in LOWER Airspace between segments GORPA
– DEVUL & NEMEK – MONID • A set of new cross-border DCT options between ACC Zagreb & ACC Beograd
Due to a significant number of changes affecting ACC Zagreb, a reassessment of sector MV’s was made before the summer. When assessing the quality of the set default MV value of a sector, we use a number of inputs from best judgement to recorded sector over-deliveries and occurrence reports, regular CAPAN Studies as well as records of relation of hourly MV to OTMV, which is one of the tasks of FMP Zagreb during post ops of such changes listed above. The 4 mentioned sectors MV’s were reduced (LDZOHA, ULS, HN, LW) due to all these factors, but it is evident they continued on the upward growth in the latter years.
In 2020, upon final successful implementation of CENTRAL sector in all layers, by implementing a fourth lateral sector we significantly reduced the sector volume for all elementary sectors compared to previous three lateral sector organization. This had most impact on Sector MV in the North sector group which also saw a significant shift of flows and complexity observed in 2019, driven by ATFM Restrictions in the region throughout summer 2019.
Vs. It is correct that only 4 of the listed 20 are elementary sectors and we have no problem to declare any delay on a non-elementary sector as for Reason Staffing, but this implies a change of the definition of this reason in NM systems and Handbook as the staffing reason is described as being applied if the

83
planned number of ATCO’s did not turn up at the day of operations (Unplanned staff shortage reducing expected capacity - ATFCM Ops Manual).
PRC comment: The PRC is grateful for the additional information provided. In regards to attributing ATFM regulations to ATC staffing, the PRC recalls that the ATFCM Ops Manual provides guidelines, not definitions, and that both the PRC and PC have recommended to “strengthen the ATFCM process by developing and adopting strict procedures for attributing ATFM delay causes, through the NM/NMB, instead of the current guidelines that lead to inconsistencies and opacity in monitoring capacity performance.”
If a capacity constraint could be mitigated or resolved by deploying additional ATC staff then it would reasonable to consider the constraint as being due to ATC staffing.
From the picture of Zagreb ACC capacity plan evolution it is evident that there is commitment and adherence to strategic capacity planning which is consistent and escalating in spite of the challenges of significant demand pressure throughout RP2 as well as the recently presented greatest volatility of the traffic picture on the Network. Volatility is defined as lack of predictability and we believe is not given adequate consideration in this document, while it is a major contributor to tactical safety buffers and taking the safe decision, which can later be proven less than optimal in post ops.
PRC comment: The term traffic volatility is an ill-defined term since it could refer to seasonal variability (traffic higher in summer than winter); weekday / weekend variability; or hourly variability (low traffic at night, high demand during specific peak times. It is also a subjective term since it depends on the expectations of the observer. It is appropriate to consider what evidence the observer had when deriving the expectations. Could the observer rely on accurate forecasts? (In which case, how does the ANSP calculate the forecasted demand at sector and or hourly level?)
The PRC would like to work with Croatia Control and other ANSPs to learn how best to plan and deploy capacity whilst taking account of the traffic variations encountered in day to day operations.
We think the document correctly identifies a number of strategic actions and indicators on the 10 ACC’s, but not all are assessed as well as some might not provide a complete picture. We would appreciate if you could kindly expand on the usage of economic metric ATCO hour productivity and its relation to the operational capacity performance, without mentioning, analysing and assessing other influencing factors, such as traffic complexity. The issue is that, as already elaborated in various literature, interpretation of purely economic metric (ATCO hour productivity) and its correlation with operational performance, doesn’t present the operational productivity that we would like to be assessed, but rather provide just one part of the picture – which may lead to wrong conclusions. Thus, we would be grateful if you could provide additional insight on why the economic metric is used for this study, without the presentation of additional elements, which would present real operational environment and the complete picture.
PRC comment: In this technical note, the PRC is not evaluating the ATCO-productivity as a measure to compare ACC's or ANSPs with each other. It is comparing the evolution of ATCO hour productivity for the individual ACC over two years (2017 & 2018) with operational indicators in the same period. Therefore it is not assessing the level to draw conclusions about the productivity per ATCO, but is looking if an ACC is providing additional capacity over the years, related to traffic growth and to avoid delays.

84
14 DFS: FEEDBACK
Some good approaches and analysis in the document are accompanied by some statements showing only one side of the medal.
The document does not take into account fundamental operational factors and procedures, which have an important impact upon capacity planning within ANSPs. These are detailed within the following comments.
In addition to this the document has, in many instances, not been drafted factually and objectively, but the authors have chosen a polemical tone of expression to drive home their points of view. This is clearly in contradiction to the main objective of such a technical analysis. The document further attempts to fully disqualify the ANSPs in their technical and operational competence.
PRC comment: The PRC would very much like to discuss all the operational factors and procedures that have an important impact upon capacity planning within ANSPs. Producing this Technical Note is intended to stimulate the discussion with ANSPs, and all aviation stakeholders that have an interest in ATC capacity.
The PRC endeavours to produce factual and objective reports and analyses and is always open to listen to those with a different perspective. The PRC is mindful of the need to ensure a collaborative working relationship with all stakeholders and has no interest in trying to ‘drive home its point of view’. The PRC appreciates feedback on its draft material so that any potential issues with data or language can be resolved before final publication.
The PRC very much respects and values the technical and operational competence of the ANSPs and offers this analysis so that the wider aviation community can become aware of the problems faced by the ANSPs and their efforts to resolve them.
Several factors have negatively influenced the capacity situation at DFS during RP2:
- Low accuracy of traffic forecast and high traffic volatility
- High pressure on cost reduction coming from airlines at the end RP1
- labour agreements further reducing the amount of available ATCO resources (linked with increased traffic complexity).
PRC comment: Low accuracy of traffic forecasts: The PRC notes that the STATFOR traffic forecasts are based on annual figures and for large areas, rather than hourly / sector level. Capacity performance essentially involves the traffic demand through individual sectors and for specific periods (hourly?).
STATFOR forecasts for FABEC from February 2014 were accurate for every year of RP2: traffic was between baseline and high traffic forecasts each year. Similarly, the forecast for Germany was accurate with actual traffic falling between baseline and high predicted traffic levels for each year in RP2.
If ANSPs are using their own traffic forecasts, the PRC would be very interested in learning about the bandwidth for forecast ranges and the accuracy at sector / hourly level if calculated.
Traffic volatility is an undefined term. If it refers to seasonality - it has always been the case, in the core area, that traffic increases during the summer season. If it refers to hourly fluctuation then the PRC would be grateful to learn how the ANSPs plan for capacity buffers to handle the variation in traffic demand.

85
[…] developing and adopting strict procedures for attributing ATFM delay causes, through the NM/NMB, instead of the current guidelines that lead to inconsistencies and opacity in monitoring capacity performance.
This kind of wording suggests that ANSPs are trying to cheat on the root causes for ATFM delay.
PRC comment: it was not the PRC’s intention to suggest that ANSPs would try to cheat in any way. The highlighted wording is a direct quote from the Provisional Council’s recommendations.
Capacity performance: the provision of sufficient capacity to meet traffic demand is determined by the available capacity in specific sectors and by the configuration of sectors.
The capacity performance is very much depending to stable traffic predictions by adhering to flight plans and sufficient time for ACCs to react in an appropriate manner.
PRC comment: Assuming that traffic prediction here does not refer to STATFOR forecasts (see first PRC comment above). Traffic predictions (tactical) and capacity are linked in that a lack of capacity will result in regulations which impact the way that traffic enters the airspace. If sufficient capacity is available then the traffic will proceed normally. When ANSPs impose regulations due to a lack of capacity the traffic stream becomes more and more impacted. Sufficient time for ACCs to react in an appropriate manner- Reducing deployed capacity is simple and can be done almost instantly (collapsing sectors) however, adding required capacity is more difficult - for an ANSP to deploy staff to open additional sectors there must be staff present who can be utilised. The PRC would be grateful to be informed about steps that the ANSP takes when it observes a regular mismatch between predicted traffic and deployed capacity.
As overall traffic increases, capacity has to increase. Capacity can be increased by improving ATC equipment; improving the skills of the ATCOs (through better training); better civil military cooperation to free up capacity in peak periods; reducing separation requirements within the sector, on entry to the sector or exiting the sector, or by redesigning the airspace – including splitting individual sectors into two or more parts to increase capacity – requiring additional staff for periods of operation.
As the ATCOs are well trained and work safely at their (operational) limits, it is hard to understand how "improving the skills of the ATCOs …" could be a capacity enabler.
PRC comment: developing training programmes specifically identifying any local 'threats' or challenges, reinforced by simulator training, are methods that are used across the industry to increase proficiency. A less-experienced ATCO will likely have a lesser capacity than an experienced ATCO. Additional training (perhaps) during off-peak periods can be used to increase the level of proficiency when workload complexity increases.
It is not a minimum limit, as it could be reduced because of adverse weather; military training and operations; ATC equipment limitations; unusual and demanding traffic situation etc.. (In each case of reduction, the constraint reducing the capacity should be clearly identified in the ATFM

86
regulation (if required) as weather, airspace management, ATC staffing, ATC equipment, special activity etc.)
In the list of reasons, workload/complexity could be stated for declaring a lower capacity.
PRC comment: The PRC understands that typical workload and complexity (for the specific sector) are already factored into the determination of declared capacity. If this were not the case, then the declared capacity could never be a stable figure as it would vary infinitely depending on the workload complexity of every combination of flights and would further depend upon the ability of each individual ATCO.
Airspace users, paying for infrastructure to increase capacity, should be provided with evidence that capacity has been improved.
Airspace users are primarily paying for Air Traffic Services, i.e. the safe and efficient handling of air traffic.
PRC comment: Quote from 2019 European Court Auditors (ECA) Audit, Introduction, section 2, "The safe and efficient flow of such levels of traffic requires a robust Air Traffic Management (ATM) system. ATM involves both ground (air navigation service providers, meteorological information services, airports and the Network Manager) and airborne stakeholders (mostly commercial airlines but also business, general and military aviation). ATM ensures separation between aircraft, aiming at a safe, efficient and expeditious flow of air traffic whilst also providing aeronautical information to airspace users (e.g. navigational aids or weather information)."
In exceptional circumstances, the specific sector may not exist as an ATC operational sector, but is used by the Flow Management Position (FMP) to regulate traffic flows into different airspace. This highlights inconsistencies in the ATFCM process where capacity constraints were not linked directly to the ATFM regulations and vice versa.
DFS is not sure to have understood correctly this paragraph.
If it refers to the fact that ATFM regulations are set on traffic volumes, which might differs from sectors (e.g. by excluding specific traffic flows), then it is important to understand that this is an operational necessity providing clear benefits to network and thereby to the airspace users.
PRC comment: In limited and specific circumstances, the PRC has identified occasions where ANSPs attributed ATFM regulations to an en route geographical airspace that was not an ATC sector. (The PRC has not observed this for the DFS)
The application of the ATFM regulations to specific flights or traffic flows does not prevent the regulation (and associated delays) being attributed to an operational ATC sector. However, attributing regulations (and delays) to airspaces that are not operational ATC sectors prevents transparency and impedes the resolution of the capacity constraint causing the regulation.

87
In the view of the PRC, this makes independent review much more difficult; it makes operations much less transparent to the airspace users and most importantly, it impedes in the mitigation or resolution of the constraint causing the delays.
There are also positive effects of regulation flows instead of sectors, e.g. less regulations per flight, more stability in traffic prediction, resulting in lower delays and more stability for airport operations.
PRC comment: As explained above, the problem is not about regulating flows it is more associated with the delays being attributed to airspaces that are not ATC sectors.
If ANSPs published the declared sector occupancy figures for individual sectors, then this would be a much more efficient way for users and stakeholders to monitor the improvements in declared capacity: by monitoring the evolution of declared sector occupancy values for the individual sectors.
Sector occupancy figures represent only one of several indicators to monitor and assess the traffic load of a sector. Depending on the characteristics of a sector, other indicators (entry counts, complexity) can be more appropriate.
Occupancy counts are well usable for detecting bunching and overload situations. Due to the high volatility in occupancy counts, especially in lower airspaces (a major part of the traffic is departing from aerodromes within the vicinity or even from the sector itself), it is not useful for prediction of the traffic situation more than 60 minutes before entry in a center. The quality of prediction improves between 60 minutes to 1 minute before an A/C is entering the sector.
PRC comment: The PRC is merely reflecting that it is possible to show increases in capacity in a sector, at a strategic level, either through increased declared capacity or by increased sector occupancy figures.
‘The quality of prediction improves between 60 minutes to 1 minute before an A/C is entering the sector’ – the PRC is not convinced that there are any benefits to be gained from improved predictability only a few minutes prior to sector entry, and if there is, would be interested to learn what ATFM measures are effective at such a late stage.
In Figure 3, ATCO workload determines the level of occupancy. If the ATCO can handle the traffic easily, then the occupancy can increase. The entry rate can match the exit rate to keep the sustainable level of ATCO workload.
En-Route: Demand increases or complexity reduces declared or expected ATC capacity.
PRC comment: The level of demand does not affect declared capacity. The declared capacity of a sector is a static value for strategic purposes. Increased demand in a particular sector can certainly inform the ANSPs that additional capacity is required but it does not alter the declared capacity by itself. Similarly, the absence of demand does not reduce the declared capacity of a sector.
Typical traffic complexity is already factored into the determination of declared capacity for a specific sector. This is evidenced through the absence of a generic formula for the calculation of declared capacity - each sector is individual with specific route / volume characteristics and its own associated traffic complexity.

88
Expected capacity: The PRC notes the use of this term, defined in the ATFCM operations manual as " the capacities (monitoring values and sector configurations) decided and finalised at the end of the pre-tactical process (16:00 UTC D-1)."
The PRC notes that this definition does not refer to traffic demand, complexity or declared capacity but simply refers to what the ANSPs has decided to provide the evening before operations.
The PRC is also aware that many ANSPs handle traffic levels well above the declared sector capacities, on a regular basis. This has been highlighted by the PRC in previous editions of the Performance Review Report. In fact, the PRC has made specific recommendations that ANSPs should review the sector capacities to ensure that any latent capacity in the system can be utilized by airspace users. Updating the declared sector capacities provides additional capacity at no cost to the ANSPs, since they were already providing the capacity albeit ‘unofficially’.
No ANSPs holds back an "unofficial" or latent capacity. During certain circumstances it's possible to handle a limited amount of additional traffic safely within a sector or sector group. This depends on the complexity of the actual traffic mix and cannot be planned in advance.
The capacity of a sector is best expressed by a bandwidth and not by a fixed value.
PRC comment: The PRC has been informed by an ANSP that declared capacities have not been updated to reflect the actual capabilities of the sector and ATCOs. The PRC agree that the actual capacity of a sector fluctuates according to real-time weather phenomena; military activity, traffic mix, ATCO skills, equipment serviceability etc. However, the declared capacity of a sector is a fixed value used for strategic purposes.
The PRC would be grateful to learn the benefits of using a bandwidth for declared capacity rather than a discrete value.
In principle, only ATFM delays resulting from regulations implemented at traffic levels equal to or greater than the declared capacity of the individual sector should be attributed to ‘C’ ATC Capacity.
What does this mean? Does it fit to the instructions written in Ops Manual, page 59: En-Route: Demand exceeds or complexity reduces declared or expected ATC capacity.
PRC comment: The PRC and the Provisional Council have made recommendations "to strengthen the ATFCM process by developing and adopting strict procedures for attributing ATFM delay causes, through the NM/NMB, instead of the current guidelines that lead to inconsistencies and opacity in monitoring capacity performance."
The PRC has previously identified that the current guidelines are not suitable for effective performance monitoring and review.
In principle, whenever additional capacity could be provided by de-collapsing a sector, then ATC staffing is a factor in the capacity constraint, and should be identified as such.

89
This seems to be in contradiction with the guidelines stated in the ATFCM Operations Manual, pages 58 and 59, according to which "if a regulation is applied because traffic is expected to be higher than the expected capacity, then ATC capacity should be the regulation reason". "Expected capacity" is defined as "the capacities (monitoring values and sector configurations) decided and finalised at the end of the pre-tactical process (16:00 UTC D-1)".
For this reason, if lack of ATC staff is already known before 16:00 UTC D-1, ATC capacity should be the regulation reason.
PRC comment: The guidelines do not provide airspace users with robust information about the actual cause (and therefore potential solution) of the capacity constraint.
The PRC cannot see the justification for a capacity constraint caused by a lack of ATC staff to be attributed as ATC capacity simply because the ANSPs knew about the lack of staff prior to 16:00 on the day before, or even that the ANSPs has actively planned the lack of ATC staff.
Similarly, the PRC cannot see the justification for all ATFM delay being attributed to 'weather' if, to give a hypothetical situation, a lack of ATC staff had reduced the capacity of the ACC from 100 down to 50, but weather further reduced the capacity to 49.
The third part of the operational analyses focuses on the deployment of ATCOs to provide capacity to airspace users. From the data in the NM systems, N.E.S.T. database, the PRC was able to aggregate the sector hours deployed for each ACC over the period 2017 – 2019.
We know that actual sector opening times are rarely correct in NEST - as there is no automated system for data transfer from ACC to NM, otherwise the ANSPs would not spend several days each year providing (in the case of the DFS PoLo) sector opening times data for determination of the capacity baseline for the NM each year (4 weeks in total).
The PRC analysis on this document should therefore focus only on the 4 weeks of validated data provided by the DFS, and not the data available in NEST on sector opening times.
PRC comment: The PRC recognises that there may always be errors in recorded information. However, the PRC recalls that SES ANSPs have a responsibility to provide the Network Manager with information affecting capacity and the NM records any data received in the N.E.S.T database. The PRC considers basing annual sector hours on less than one month of validated data, would increase the probability and magnitude of errors.
If an ANSP is unable to accommodate the existing traffic demand then it is obvious that reducing sector hours will only aggravate the capacity deficit.
This sentence is superfluous or requires clarification. It suggests that an ANSP would reduce sector hours on purpose.
PRC comment: Our apologies if this statement unintentionally gave that impression. All the PRC sought to do was to clarify that if sector hours are reduced for whatever reason (staff shortage due to resignations for example or reduction in working hours due to labour agreements) this will aggravate the capacity deficit.

90
The PRC notes that ANSPs provide capacity plans each year, which the Network Manager publishes in the Network Operations Plan (NOP). The capacity plans do not provide transparency to airspace users, or to interested stakeholders, on how and where ANSPs are specifically adding capacity. Adding capacity to sectors that are not constrained, whilst failing to add the necessary capacity to meet existing airspace user requirements is not an effective use of resources.
How can the claim "Adding capacity to sectors that are not constrained, whilst failing to add the necessary capacity to meet existing airspace user requirements is not an effective use of resources." be made when apparently the capacity plans do not provide the necessary transparency to deduce that ANSPs are operating in this way?
And why would the ANSPs choose to add more capacity where it is not needed, instead of deploying it where need exists?
If the PRC has an additional requirement for the capacity plans, then they should clearly define their requirement and communicate it with the NM.
PRC comment: The PRC is highlighting that the ANSP capacity plans published in the NOP might need to include the sectors for which capacity improvements are foreseen to improve transparency to airspace users, or to interested stakeholders.
In the example of Karlsruhe UAC from NOP 2019-2024, the only planned capacity projects for the period 2019 -2024 shown are training and transition for implementation Berlin airport (2020) and training for iCAS (2021) - extensive training projects usually involve a short-term reduction in capacity rather than an increase in capacity.
Despite no increase in the number of sectors at maximum configuration, there is a planned capacity increase of 9% from 2019 to 2020 and a further 8.9% from 2020 to 2021 - when there will be less sectors at maximum configuration.
Airspace users will be interested in understanding how the increase in capacity will come about so they can evaluate the likelihood of capacity problems. If ANSPs require 5 years to recruit and train ATCOs (as stated in a later comment) many questions arise about how the capacity improvements will be manifested.
Furthermore, the effectiveness of spending additional resources (time, money) planning and adding capacity to collapsed sectors instead of simply opening the individual sectors, and deploying existing capacity, during periods of high demand is questionable.
The added value of this sentence is also questionable. The best sector configuration is very much dependent on the specific situation. Available staff and labour agreements might be constraining factors. In some cases, running collapsed sectors might be operationally more appropriate to handle the traffic with less coordination, e.g. in bad weather conditions.
PRC comment: The PRC very much agrees that staff availability is very often a constraining factor. Attributing ATFM delays caused by the lack of staff to other causes does not enable the ANSP to address the real capacity constraint.
The PRC would be grateful to learn more about how labour agreements rather than staff availability might be constraining factors. Your earlier comment about “- labour agreements further reducing the amount of available ATCO resources (linked with increased traffic complexity)” also refers.

91
The PRC accepts that adverse weather can occasionally involve additional coordination requirements, with traffic flying non-standard profiles. However, it can be argued that there is a significant difference between having sufficient staff available to provide the required capacity - and then collapsing sectors to reduce ATC workload and not having sufficient available staff to open sectors to provide required capacity and increasing the workload of ATCOs operating collapsed sectors due to the adverse weather.
Additionally, by attributing delays in collapsed sectors to ATC capacity, the ANSPs are ignoring the fact that additional capacity already exists in their own airspace but not being deployed to satisfy the existing demand of airspace users.
According to the guidelines stated in the ATFCM Operations Manual, pages 58 and 59, delays should be attributed to ATC capacity if traffic is expected to exceed the expected capacity, i.e. the capacity "decided and finalised at the end of the pre-tactical process (16:00 UTC D-1)".
PRC comment: The PRC, as explained previously, does not consider the guidelines in the ATFCM manual as being sufficiently robust or providing the required transparency to airspace users. Attributing delays to ATC capacity rather than ATC staffing, simply because the lack of staff was known in advance, does not change the fact that it was a lack of available ATC staff that created the capacity constraint, not an excessive demand of air traffic.
The capacity deficit will not be improved by spending money on increasing capacity in the elementary sectors if they are simply going to be collapsed due to a lack of available staff. The capacity deficit will only be improved by ensuring that there are adequate staff available to satisfy the traffic demand.
[Note: the text in the Technical Note was amended to read ‘…the ANSPs are overlooking the fact that additional capacity already exists…’]
Recommendation #2: The Provisional Council:
(i) requested Member States to task their ANSPs to develop and implement capacity plans which are, at a minimum, in line with the Reference Capacity Profile (from the NOP); and to ensure that capacity is made available during peak demand;
We agree with the first point. Traffic forecasting plays a large part here, which as we know has been difficult during RP1 and RP2 and obviously during RP3 too. Accurate forecasts enable better capacity planning, in particular for meeting unforeseen large demand/peaks during the day, when capacity shortfalls can occur. However, traffic forecasts over a period of 5 years (which is the timeframe required to recruit and train ATCOs) will always have a high level of uncertainty.
PRC comment: As stated previously, the annual traffic for both Germany and FABEC was within the bounds of the high traffic and baseline traffic profiles predicted by STATFOR from February 2014 for each year of RP2. STATFOR profiles and traffic predictions are not made at sector level and are not made at hourly level. Capacity performance is determined by what happens at an individual sector and hourly level.
The capacity plans for Karlsruhe UAC for 2014 - 2019 and 2019 - 2024 are shown below. In 2013 EDUUUAC already had a capacity of 334 aircraft per hour. It also had a growing traffic demand

92
profile since STATFOR predicted growth for Germany over the entire RP2 period. Capacity was planned to increase to 386 by 2018 and 399 by 2019.
By 2018 EDUUUAC had a capacity of 303, predicted a further reduction in capacity to 279 in 2019 and then planned capacity growth to achieve 380 aircraft per hour by 2024.
The PRC does not understand the evolution of capacity plans at Karlsruhe UAC, which had no spare capacity in 2014 and was faced with increasing traffic demand.
The PRC notes the statement that recruiting and training ATCOs takes the DFS 5 years. The PRC notes that some other ANSPs recruit and train ATCOs in shorter timeframes.
By operating collapsed sectors rather than deploying maximum capacity by opening elementary sectors, the ANSPs are themselves adding additional capacity constraints and causing greater delays to airspace users.
This claim stands out particularly for the complete analysis within the document. No operational procedure is mentioned, nor any collective agreement considered, for supporting the recommendation made to the ANSPs.
(Operating with collapsed sector under bad weather conditions reduces the complexity because of fewer communication calls in general ...)
PRC comment: The PRC would be grateful to learn how operational procedures require sectors to be collapsed, thus limiting the available capacity within the airspace. As stated above, the PRC would be very interested to learn how labour agreements, rather than staff availability, are constraining factors for the DFS.
In regards to the operation of collapsed sectors during periods of adverse weather, the PRC notes the difference between having sufficient staff available to provide the required capacity - and then collapsing sectors to reduce excessive workload on ATCOs and the situation where staff is not available to open additional sectors and the workload of the ATCOs in the collapsed sector is increased due to the adverse weather.
Analysis of the sector configurations deployed during periods of adverse weather for summer 2019 shows that the sectors were opened and collapsed in line with the sector planning published in NOP 2019-2024 rather than determined by the weather itself.

93
Additionally, by attributing delays in collapsed sectors to ATC capacity, the ANSPs are ignoring the fact that additional capacity already exists in their own airspace but it is not being deployed to satisfy the existing demand of airspace users.
There might be an inconsistency between PRC view and Ops instructions as published in the handbooks.
PRC comment: The PRC, as stated previously, considers that the guidelines in the ATFCM manual are neither robust enough, nor transparent enough, for effective performance monitoring and reporting.
[Note: the text in the Technical Note was amended to read ‘…the ANSPs are overlooking the fact that additional capacity already exists…’]
Page 18. Table showing productivity, sector changes, traffic etc.
It would be more helpful to focus on the summer, and peak weeks etc. instead of the entire year.
PRC comment: The PRC welcomes this suggestion and may do more specific analyses with shorter timeframes. The 12-month period was chosen so that it relates equally to all ANSPs regardless of when, and for how long, the peak traffic period occurs.
The table highlights that it is important to keep in mind that whilst productivity is a useful indicator to understand the different factors influencing cost-effectiveness performance, increasing productivity should not be seen as a stand-alone objective, especially when an ANSP is not in a situation to satisfy the demand without generating high ATFM delays.
No ANSP would define productivity as its "stand-alone objective". In the last years, when DFS has generated a lot of delays, 100% of the focus was put on reducing delays (obviously maintaining safety as the highest priority). Increasing productivity was not the objective but only the result of the staff shortage.
PRC comment: The PRC is aware that some other ANSPs (not DFS) do give a focus on ATCO hour productivity without explicit reference to their capacity performance.
The total number of sector hours recorded in the NM systems (N.E.S.T.) for Karlsruhe UAC in 2017 was 171,022, for 2018 was 158,158 and for 2019 was 144,871.
For the whole ACC, 2018 had 8% fewer sector hours than 2017 and 2019 had 8% fewer sector hours than 2018 – overall resulting in 15% fewer hours in 2019 than in 2017.
The opening schemes (and therefore the sector hours) data available in NEST do not entirely correspond to the actual opening schemes (and sector hours), since no fully automated data exchange process between ACCs and NM was operational in the entire period 2017-2019.

94
PRC comment: The PRC acknowledges that there may always be errors in recorded information. However, the PRC recalls that SES ANSPs have a responsibility to provide the Network Manager with information affecting capacity and the NM records any data received in the N.E.S.T database.
The PRC would encourage all ANSPs to ensure that the Network Manager is provided with accurate and up to date information, to reduce the likelihood of mismatches between databases.
The latest plans from 2019 show a significant reduction in existing capacity (from 259 aircraft per hour to 245 aircraft per hour the following year.) …
Effects due to network measures (4+11 ACC and eNM/S19 initiatives) are not reflected in this document.
PRC comment: The PRC is presenting the capacity plans provided by the ANSPs to the Network Manager and published in the NOP. The effects of the capacity plans, and capacity shortfalls in the Network, are visible in terms of ATFM delays and reductions in vertical and horizontal flight efficiency.
Page 45: Graphs for 2017 and 2018
If only delays due to "ATC Capacity" and "Weather" are reassigned, why does the percentage of delays due to "all other" causes change?
PRC comment: Thank you for pointing this out, it has been corrected for Langen and Bremen ACCs.
There are 7 main sector groups in Langen ACC (EDGGCTA1-EDGGCTA7). According to the information recorded in the NM systems (N.E.S.T.) there was an increase in the number of sector hours deployed at sector groups EDGGCTA1 to EDGGCTA5 from 2017 to 2018.
EDGGCTA7 and EDGGCTA6 deployed fewer sector hours in 2018 than in 2017. From 2018 to 2019, six of the seven sector groups deployed fewer sector hours, with only EDGGCTA1 showing an increase on 2018 numbers.
For the entire ACC the number of sector hours in 2017 was 131,701, for 2018 it was 134,255 and for 2019, it was 132,340.
There are 9 sector groups in Langen ACC (EDGGCTA1-EDGGCTA8, EDGGCTA10; EDGGCTA8 and EDGGCTA10 appear in NEST as EDGGCTAA).
The opening schemes (and therefore the sector hours) data available in NEST do not entirely correspond to the actual opening schemes (and sector hours), since no fully automated data exchange process between ACCs and NM was operational in the entire period 2017-2019.
PRC comment: As explained previously, the PRC acknowledges that there may be errors in the database. However, if the errors are consistent due to definition of sector groups - then the year on year comparison remains valid.

95
A comment has been inserted reflecting that the DFS report that the figures in NEST do not entirely correspond to the actual sector hours.
Langen ACC created 284k minutes of ATFM delay in 2017, 650k minutes of ATFM delay in 2018 and 739k minutes of delay in 2019. Traffic was 1,267k flights in 2017, 1,335k flights in 2018 (+5%) and 1,336k flights in 2019 (+<1%).
The comparison of ATFM delay annual growth with traffic annual growth implies that there is a direct correlation between both magnitudes. Nevertheless, when analyzing the causes of ATFM delay, the geographical and timely distribution of traffic plays a determining role. In the case of Langen ACC, traffic growth in the Sector Families 3 and 4 achieved 10.2% and 11.8% in May 2019 compared to May 2018, and 3.5% and 4.9% in June 2019 compared to June 2018. Only in these sector families and within this time frame, 30.2% of the total annual ATFM delay of Langen ACC was caused (data source: DFS).
PRC comment: The PRC is grateful for the explanation of delays in the Langen airspace. The PRC agrees completely that delving down into the detail provides much more information and explanations rather than the presentation of high-level indicators that treat entire States / ANSPs / ACCs as single entities. This technical note from the PRC is an attempt to bring the discussion down to an operational level and we fully understand that further progress is required.
Bremen ACC
In principle it is correct that there is a staff shortage at Bremen ACC. However this problem has been significantly increased in the years 2018 and especially 2019 by reasons that cannot be influenced by us – in other words beyond our control.
PRC comment: The PRC would be grateful to receive some detailed information about the reasons that are outside your control. Perhaps the PRC could help to highlight these issues in order to assist all ANSPs?
a. RAD measures caused a downstream from MUAC-sectors into the sector family group South. The impact was already remarkable in 2018 and rather huge in 2019 (May 2019: +35% traffic). This applies to measures taken in the TFV EDWWEMSC and EDWWHAN.
Some of these measures were lifted by the end of June 2019 or even later. But the remarkable increase of traffic remained at a high level. At the same time there was almost no delay in the respective airspace above belonging to MUAC.
As reported several times by NM this was of essential benefit for the entire network.
However the calculation of NM for the traffic expected within Bremen ACC caused by RAD measures especially in 2019 was done at FIR level only. It did not show the impact on the sector family group South that was finally far above average.
Finally Bremen ACC was not aware of the upcoming impact and not able to adjust the planning. In fact an increase of 35% traffic would have been not manageable anyway.
b. Bremen ACC delivered staff within the so called “DFS-Capacity Initiative” to ease the situation in Karlsruhe UAC. This covered necessary ATCO liaison at Air Defense Units and instructors just to name a few.
c. The fact that the deployment of the new airport Berlin / BER has been postponed several times since 2010 caused repeated planning of training and staff availability almost every year. At the same

96
time traffic increased more than predicted. Additionally the ratio of the traffic distribution between the existing airports Tegel and Schönefeld changed and raised up the complexity.
PRC comment: As above for Langen ACC, the PRC is grateful for the additional information. It appears to confirm the main argument of the PRC, that the unavailability of ATCOs (for whatever reason - planned or unplanned) aggravates all other capacity constraints leading to increased delays for airspace users, especially in light of increased traffic demand.
The PRC fully understands how the delays to the operation of the new Berlin airport can have adverse effects on training and staff availability.
There are three main sector groups in Bremen ACC: East, North and South. According to the information recorded in the NM systems (N.E.S.T.) there was an increase in sector hours from 2017 to 2018 for the East sector group, and a marginal increase or the South sector group, however, from 2018 to 2019, both sector groups reduced the number of sector hours to below what was provided in 2017. The North sector group has deployed fewer sector hours year on year.
For the ACC as a whole, there were 106,835 sector hours in 2017, 107,482 in 2018 and 103,885 in 2019. The change between 2017 and 2019 is approximately a 3% reduction in sector hours.
The opening schemes (and therefore the sector hours) data available in NEST do not entirely correspond to the actual opening schemes (and sector hours), since no fully automated data exchange process between ACCs and NM was operational in the entire period 2017-2019.
In NEST, the feeder in Berlin Approach is considered as a sector; this can at least partly explain the difference in sector-hours registered in NEST and by DFS.
PRC comment: The PRC fully acknowledges that there may be errors in the database. However, if the errors are consistent due to definition of sector groups - then the year on year comparison remains valid.
A comment has been inserted reflecting that the DFS report that the figures in NEST do not entirely correspond to the actual sector hours.
Bremen ACC created 77k minutes of ATFM delay in 2017, 115k minutes of delay in 2018 and 565k minutes of delay in 2019.
Traffic was 649k flights in 2017, 668k flights in 2018 (+3%) and 657k flights in 2019 (-2%).
The comparison of ATFM delay annual growth with traffic annual growth implies that there is a direct correlation between both magnitudes. Nevertheless, when analyzing the causes of ATFM delay, the geographical and timely distribution of traffic plays a determining role. In the case of Bremen ACC, traffic growth in the Southern Sector Family achieved 27.0% in May 2019 and 8.0% in June 2019 compared to the respective months in 2018. Only in this sector family and within this time frame, 33.8% of the total annual ATFM delay of Bremen ACC was caused (data source: DFS).
PRC comment: The PRC is grateful for the explanation of delays in the Bremen airspace. The PRC agrees completely that delving down into the detail provides much more information and explanations rather than the presentation of high-level indicators that treat entire States / ANSPs / ACCs as single entities. This technical note from the PRC is an attempt to bring the discussion down to an operational level and we fully understand that further progress is required.

97
15 ENAIRE: FEEDBACK
1. Title, summary, background and Introduction
As stated in the title of the document “A perspective in all aspects of en route capacity” and in the summary, the technical note is supposed to provide “a more in-depth focus on en route capacity than what is normally presented”.
However, the real scope of the document is limited to analyse individual sector or traffic volumes capacity performance in terms of declared, deployed and planned capacity, as reported to the Network Manager, both through the Network Operations Plan, and the monitoring values presented in the CHMI, and to question the use of the regulation reason as provided by ANSPs.
ENAIRE considers that an in-depth focus on en route capacity should be made taking into consideration at least the following factors:
- The network connectivity and delay propagation patterns
- ATM Performances based on agreed indicators KPIs in which the interdependencies among system elements are not adequately represented
- Predictability and volatility of demand
- Reactionary delays and their influence in ATFCM delay
- RAD restrictions along the Network and their influence in sector complexity
- Limitations to the use of new concepts such as occupancy imposed by different NSAs criteria
- Interfaces between different providers and restrictions applied to them
PRC comment: The PRC are not trying to suggest that the analysis in the Technical Note represents the definitive scope for monitoring or reporting on en route capacity performance. We have amended this wording to make this clear.
ENAIRE presents some interesting suggestions for further study.
The PRC considers that there are benefits in reporting on aspects of capacity performance that are already quantifiable rather than overlooking existing problems whilst waiting for the potential completion of studies into the suggested factors.
It is also declared that PRC “conducts independent measurement, assessment and review of the performance” being the intention of the technical note “to inform the reader about how ANSPs manage the various facets of capacity” and “to stimulate discussion about the interplay between the operations and the economics of providing air navigation services”.
ENAIRE understands the need of such an independent assessment, but ENAIRE believes that it should be based on the criteria that the European Commission has endorsed to the NMB, and the latter has approved through the CDM Processes.
PRC comment: The PRC would suggest that limiting assessment criteria to those 'endorsed' or 'approved' by external bodies automatically removes the element of independent assessment.
Further, the PRC’s role is to "propose performance objectives for improvement of ATM system performance" and to "propose performance indicators for monitoring and analysis of ATM system performance" (PRC Terms of Reference as approved by the Permanent Commission on 14 November 2007)

98
The PRC, in reviewing the regulation reasons with a different criterion from the one set in the ATFM Users and Operations Manual, ignoring the Post-operations performance adjustment processes and the delay reattributions introduced by eNM19 measures approved by NMB, includes information and analysis which are not accurate enough and, consequently, many of the conclusions obtained may be incorrect.
PRC comment: The PRC is monitoring the situation as presented to the airspace users on the day of operations. The PRC does not seek to attribute 'blame' for the capacity constraint. The PRC is only concerned with helping the appropriate authorities to ensure that the capacity constraint does not recur.
Extracted literally from the NOP:
Overall, the Network Operations Plan 2019-2024 addresses the operational performance indicators and targets resulting from the application of the EC Regulation (EU) No 390/2013 laying down a performance scheme for air navigation services and network functions. The Plan describes the operational actions to be taken by the Network Manager and other operational stakeholders, needed to respond to the performance targets set for the second Reference Period (RP2) from Regulation (EC) No 390/2013 and the European Commission Implementing Decision of 4 February 2014. For the period of RP3 (01 January 2020 - 31 December 2024) the Plan responds to the EC Implementing Regulation (EU) 2019/317 of 11 February 2019, and is following the performance targets set forth in the Commission Implementing Decision (EU) 2019/903 of 29 May 2019.
PRC comment: The union-wide target was 0.5 minutes delay per flight for each year of RP2.
Each NOP published during RP2 predicted a union-wide delay forecast, based on the capacity plans within, in excess of the union-wide target.
Only the NOP 2016 - 2020 contained a delay forecast that showed South-West FAB achieving their required reference values for any year of RP2 (Actual performance did not achieve the reference value).
The NOP simply presents the actions which the ANSPs have informed the NM that they will take.
The NM makes additional suggestions for capacity improvements, they are reflected in the capacity plans of the ANSPs but not always implemented.
The NOP also provides both a qualitative and quantitative assessment of the impact of these actions on the performance of the network.
PRC comment: The published ANSP capacity plans were insufficient to achieve the union-wide targets every year for RP2. The network delay forecast contained in the NOP was greater than 0.5 minutes delay per flight.
As a requirement of the Network Functions Implementing Regulation (Article 6 and Annex V), the development of the NOP, together with the implementation of cooperative decision making processes and improved information management will ensure better use of the capacity available on the Network and improved management of both planned and unplanned events and constraints.

99
PRC comment: The union-wide performance targets for RP2 were not achieved. The delay forecasts for RP3 performance, and initial performance plans were not consistent with the published targets for RP3.
Moreover, the Technical Note is only focused in solving capacity constraints at sector level without performing the necessary holistic analysis, which should take into consideration the rest of factors contributing to network performance. Solving this capacity constraints at any price would not make the Network more efficient, therefore Safety, Environment (Trajectory Efficiency) and Economic Costs of the service provided must be included if an “independent measurement, assessment and review of the performance” is to be done. We don’t need to reinvent the wheel, as these KPIs are included in the European Regulation and SES objectives.
Finally, national labour laws, Union Agreements, differences in National Legislations, and what is more important, different interpretation of Safety Regulations by NSAs, are not considered, inferring too simplistic conclusions.
PRC comment: The PRC analysis is based on operational characteristics that are applicable in all situations.
The PRC would like to work with ENAIRE in order to learn more about these factors that prevent the planning and deployment of capacity.
Consequently, ENAIRE believes this approach does not help to correctly identify the root causes of delay (not even the ANSP related causes of capacity constraints) neither to improve performance of the network and planning future capacity. Quoting the Technical Note itself “misidentification of problems means that the problems are not addressed”.
PRC comment: The PRC would be grateful to learn ENAIRE’s views of the root causes of delay in Spain and possible remedial actions.
ENAIRE would strongly suggest the PRC to analyse the causes of delay from a network point of view, not only focusing on the En route ATFM individual sector´s delay, but taking into consideration all the contributing factors affecting network performance and considering all the special measures and improvements implemented in the Network.
PRC comment: The PRC notes the prevalence of reports on capacity and delay at network level already: the Network operations report; the PRB Annual Monitoring Report and even the PRC's own Performance Review Report.
Therefore the PRC considers that a different approach is required, hence one of the reasons for producing this technical report.
2. Demand/capacity imbalance
As mentioned earlier, the approach followed regarding planned, declared and deployed capacity seems to be too simplistic exhibiting a lack of the desired holistic view.

100
Page 7: ANSPs must ensure that additional capacity is planned and implemented in airspace wherever traffic demand exceeds, or is likely to exceed, available capacity during peak periods.
Demand is predicted and in response, capacity is planned to cope with it. When the demand forecast is not accurate enough, which is frequent, imbalances between demand and capacity emerge and then, ATFCM measures need to be implemented to guarantee safety. ATFCM measures involving regulations may cause delay. ATFCM measures can be applied both pre-tactically and tactically. Predictability and volatility need to be included in the equation.
PRC comment: STATFOR traffic forecasts are produced for large areas (FIR, FAB, etc.) and at annual level. They are not produced at sector or hourly level, even though that is where the capacity performance derives from.
The PRC would be grateful to learn ENAIREs proposals to mitigate or resolve the problem of frequently inaccurate forecasts at local level.
The PRC notes that the predictability and volatility of traffic is much greater when it is subject to frequent capacity constraints including those imposed by the ANSP, resulting from staff unavailability.
The Technical Note does not focus its analysis in the factors affecting imbalances, therefore ENAIRE believes that the analyses should assess both sides: why planned capacities do not meet the demand with the needed flexibility. Weather, lack of adherence to flight plans, lack of adherence to airport slots and ETA, lack of adherence to ETOTs, reactionary delays, etc., are factors to be included in the analysis to better explain such imbalances.
PRC comment: The Technical Note shows that, for many ANSPs, declared sector capacities in the strategic phase are not increasing despite consistent forecasts of future traffic growth.
If the sector capacities do not increase then there will be more periods where capacity does not equal demand.
When additional capacity constraints occur (weather, military...) the situation will deteriorate further.
ENAIRE are making a strong argument for the need to ensure that there is a surplus of capacity to cope with fluctuations in traffic levels associated with real-time operations.
Demand volatility and lack of predictability causes delay and degrades system performance, whereas an excess in planned capacity causes cost inefficiencies and also reduces performance.
PRC comment: The PRC would suggest that the 10 most constraining ACCs, as listed in the technical document, could not be considered to have an excess in planned capacity during 2019.
It is important to note that 'demand volatility and lack of predictability' are subjective and depend on the expectations of the observer. It is appropriate to consider what evidence the observer had when deriving such expectations. Could the observer previously rely on accurate forecasts? Was there a capacity buffer that allowed variation in the forecast without having a significant detrimental effect on capacity performance?

101
ENAIRE is committed to improve capacity in a collaborative environment, deepen into all reasons producing lack of tuning between demand and capacity.
PRC comment: Since demand is automatically balanced with capacity whenever ANSPs apply ATFM regulations, (creating delays), balancing demand and capacity does not necessarily equate to good capacity performance.
Page 8:
Sector capacities are as recorded in the Network Manager systems – in the N.E.S.T. database during AIRAC cycle 02 for each year. Obviously, improvements in capacity (declared) implemented after February will appear only in the following years data.
…
If ANSPs published the declared sector occupancy figures for individual sectors, then this would be a much more efficient way for users and stakeholders to monitor the improvements in declared capacity: by monitoring the evolution of declared sector occupancy values for the individual sectors.
Applying capacity values of AIRAC cycle 02 for the whole year appears to be unsuitable to perform a consistent analysis.
PRC comment: By using AIRAC cycle 02 year on year, the PRC is able to compare like with like and identify trends in levels of declared capacity.
On the other hand, both environmental data, Occupancy Traffic Monitoring Values (OTMV) and capacity Monitoring Values (MV) are declared to the Network Manager and updated in the ATFCM systems (CHMI) following the ATFCM Operations Manual (5.1. Updating CACD data in predict/ETFMS). However, the implementation of regulations based on occupancy depends on the individual constrains imposed by NSAs based in their specific interpretation of European Regulation.
PRC comment: The PRC would be grateful to learn how ATFM operations are being constrained by NSAs based on specific interpretation of EU Regulations.
3. ATFM delay attribution
Page 10: In previous Performance Review Reports, the PRC recommended that States and ANSPs should review their processes for assigning ATFM delay.
As stated in the ATFCM Operations Manual both the FMP and the NM shall ensure that the cause of the regulation is input correctly in the appropriate field of each regulation. Every regulation reason is defined in the mentioned Manual, as well as its guidelines for application.
PRC comment: The PRC, and ENAIRE, are aware that the manual also states "However, the final decision for the regulation reason remains the responsibility of the relevant FMP.”
The PRC considers that the guidelines contained in the current ATFCM operations manual are not robust and do not provide sufficient transparency to airspace users.

102
If the PRC recommends these processes should be reviewed, being part of Eurocontrol itself, it seems that the more efficient way would be to revisit current regulation reasons and their guidance for application, making them clear enough to avoid different interpretations in their application.
PRC comment: The PRC has made such recommendations to the Provisional Council. Despite adoption by the Provisional Council, the PRC note that no changes have been made to the ATFCM process following from the recommendations.
Producing this Technical Note is one way in which the PRC hopes to encourage stakeholders to change the ATFCM process.
Regarding the revised attribution made for the ten ACCs, ENAIRE, as any ANSP, strictly follows the Post-operations performance adjustment process approved by NMB and strongly believes that the PRC deviating from the existing approved processes to reclassify minutes of delay does not help to give transparency and rigour to the analysis.
PRC comment: The PRC notes that the post-operations process is primarily concerned with allocating delays to third parties / different locations rather than rectifying or improving the actual capacity constraint in the location in which it arose.
Moreover, it is very discouraging that the PRC seems not to be aware of the measures implemented by Eurocontrol to cope with capacity constraints during summer 2019, the so-called eNM19 summer measures. As a result of these measures a delay reattribution between ANSPs has been approved by NMB, resulting in 228.487 minutes of delay to be reassigned from LECB to DSNA.
PRC comment: The PRC is fully aware of the eNM measures. However, it does not alter the fact that airspace users experienced 228k minutes of delay when trying to fly through Spanish airspace because there was insufficient capacity in Barcelona FIR.
The PRC also notes that the planned increase in traffic, due to eNM measures, would further prevent any possibility of excess planned capacity in Barcelona ACC.
Barcelona ACC contributed in a meaningful way to alleviate extreme capacity constraints of the Network during summer 2019 and had accepted to collaborate again in the same manner during 2020. ENAIRE accepted flows of traffic to be deviated into Spanish Airspace even though it implied specific complexity increase and a “bad performance” perception for airspace users.
PRC comment: The PRC is happy to note that Spanish ACCs have been handling traffic levels in excess of what was forecasted (in February 2014) for the entirety of RP2. The PRC is not, in any way, trying to minimise the efforts from ATCOs in Spain.
The PRC is simply trying to assist ANSPs by suggesting solutions on how to improve in the future as and when traffic levels rise once again. If ANSPs are able to identify clearly the constraints that prevented the full amount of capacity from being deployed, then they will be able to address those particular problems.

103
Furthermore, if the airspace is unable to accommodate current traffic levels, without producing significant amounts of delay, then the ANSP must develop plans to increase capacity in individual sectors. Otherwise, the traffic will have nowhere to go.
Table below shows the distribution of the 228.487 minutes of delay made by cause:
AIRACS 1905-1911 (25/04/2019-06/11/2019) 2019 Total general REGULATION REASON C - ATC Capacity W - Weather LECBFMP 179.961 48.526 228.487
As a consequence of this delay reattribution table appeared on page 49 is incorrect and must be modified as follows (weather and ATC capacity delays):
2017 - 2019 Total aggregated delays Sector name
ATC Staffing
Weather ATC Capacity
Weather ATC Capacity
LECBCCC 15.071 122.444 79.839 110.524 69.366 LECBMNI 10.747 8.983 69.984 4.758 49.860 LECBG23 5.362 11.078 31.460 6.070 11.204 LECBGOI 4.665 18.539 31.877 11.019 23.037 LECBMVS 4.592 1.673 18.981 1.673 18.612 LECBLGU 3.388 8.177 27.016 7.946 26.566 LECBBKE 1.596 217 13.459 217 12.470
As for the above included traffic volumes the delay reattributed to LF due to eNM19 was:
TV C - ATC Capacity
W - Weather Total general
LECBG23 20.256 5.008 25.264 LECBMNI 20.124 4.225 24.349 LECBCCC 10.473 11.920 22.393 LECBGOI 8.840 7.520 16.360 LECBBKE 989 989 LECBLGU 450 231 682 LECBMVS 369 0 369
PRC comment: The PRC, as explained in previous comments, is merely trying to improve capacity provision where the actual capacity constraints occurred. Therefore the original figures are appropriate and not the amended figures following agreement between ANSPs about who was responsible.
Page 10: Highlighting the external causes while ignoring the internal causes gives the impression that nothing can be done to improve capacity, which is clearly not in the interests of improving capacity performance.
On this respect, it is necessary to highlight that considering only internal causes would produce a biased analysis as collaborative solutions to a complex issue are always needed.

104
PRC comment: The PRC is not trying to suggest that all delay should be attributed to internal causes only.
The document states 'In principle, since the ambition of EUROCONTROL and its Member States is to improve capacity performance by the ANSP, it is better to attribute all delays to ANSP-internal reasons such as staffing or equipment, unless there were no internal constraints applicable at the time. '
[Note: The text has been amended to read ‘…Highlighting the external causes while overlooking any internal cause…
4. Sector hours, ATCO-hour productivity
Page 11: Since, by the ANSPs own admission, deployment of these non-optimal sector configurations are due to non-availability of ATC staff, the PRC groups these delays into ATC staffing, not ATC capacity or adverse weather.
Page 11: Increasing sector hours does not necessarily mean increasing the number of ATCOs, nor does reducing sector hours imply that fewer ATCOs are being used. Since ATCOs work according to rostered shift patterns (either individual or as a team) it is possible to manage the availability and non-availability of ATCOs according to known traffic patterns.
This paragraph is unclear. Using more ATCOs in a roster means increasing the cost of ATM service.
PRC comment: The original text has been slightly amended to read ‘Since the deployment of these non-optimal sector configurations has been attributed by the ANSP to non-availability of ATC staff, the PRC logically groups these delays into ATC staffing, not ATC capacity or adverse weather.’
The PRC notes that this is not always the case. For example, a team of 10 ATCOs contracted for 35 hours per shift cycle. Each ATCO works on position for 20 hours, 15 hours not on position. Changing the on position / off position ratio can increase the available sector hours, without affecting the contracted hours. Staggering start / end times for individual ATCOs can provide more ATCOs available during peak periods, less ATCOs during off peak periods, with same contracted hours per shift cycle.
Regarding the statement of “Known traffic patterns”, the studies conducted by NM about the already mentioned issues must be referenced: volatility of demand (FPL adherence, intruders/avoiders, interaction between hundreds of regulations implemented in the network at the same time, not adherence to flight plans, delay introduced in airports, reactionary delay, impact of industrial actions in demand, eNM19 measures introducing new flows and increasing capacity in different geographical locations and different hours of day in the Network, etc.) to state that traffic doesn’t normally follow an established pattern.
PRC comment: The PRC notes that the vast majority of traffic adheres to published (daily / weekly) schedules between known airports on a limited number of routes.
The PRC realises that, of course, there is variability in traffic in real time operations due to weather and all the factors listed by ENAIRE.
However, the PRC also notes that the ANSPs continually base their planned provision of capacity upon (internal) traffic forecasts in strategic, pre-tactical and tactical phases. The PRC would be very

105
interested to learn about the various buffers that ANSPs, such as ENAIRE, use to ensure that the 'typical' variation of traffic can be accommodated by the ANSP.
Page 12: In addition, reducing the non-ops related tasks for ATCOs could free up ATC staff to spend more duty-time actually controlling traffic and therefore providing capacity to airspace users.
ENAIRE considers critical counting on the operational knowledge of ATCOs when performing tasks related to the system evolution and it would be a serious mistake not to involve them when developing new procedures, airspace redesign projects, training, new equipment or functionalities.
PRC comment: The PRC agrees: therefore the statement is about reducing such tasks, not eliminating them.
Page 14: the effectiveness of spending additional resources (time, money) planning and adding capacity to collapsed sectors instead of simply opening the individual sectors, and deploying existing capacity, during periods of high demand is questionable.
The analysis made is too simplistic as, in many occasions adding capacity to collapsed sectors, that are usually used at the beginning or the end of the day is translated into less delay and a direct improvement of performance.
It is usual that, in those periods, when these sectors configurations are being used, a peak of unexpected demand appears due to delayed traffic during the day (weather, reactionary delay, etc.).
PRC comment: The PRC acknowledges that ANSPs have to find a balance between the sector configurations deployed and the accuracy of the local traffic demand forecasts – including the likelihood that ‘usual’ unexpected demand occurs.
5. PRC findings
Page14: It is difficult to reconcile the concept that capacity can ‘disappear’ within a given airspace from one year to the next.
…
With the exception of reductions in capacity due to specific safety risks (with documented safety cases), it is difficult to envisage how an airspace / ATC unit cannot safely accommodate the same declared capacity as it did previously.
ENAIRE believes the expression used by PRC is inappropriate. ENAIRE has internal procedures to revise capacity values to ensure efficiency and safety. Although most of the times, capacities are increased, the process must consider a possible reduction of capacity (or conditioning capacity to a certain mix of flows) due to changes in the airway structure of the sector, massive increase of a certain traffic flow, creation of new airports, etc.
PRC comment: The PRC does note that capacity can be reduced for safety reasons. If there are changes in the structures of the sector, new airports etc. then there should be a safety case identifying the increased workload.

106
The PRC notes that many ANSPs address traffic complexity (higher workload) through the Route Availability Document (RAD) to ensure the correct balance of capacity and flight efficiency, whilst ensuring safety.
Page 15: In fact, the high proportion of ATFM delays attributed to adverse weather in collapsed sectors indicate that the ANSPs may actually be aggravating the adverse impact of weather rather than attempting to mitigate it.
By operating collapsed sectors rather than deploying maximum capacity by opening elementary sectors, the ANSPs are themselves adding additional capacity constraints and causing greater delays to airspace users
Being this the criteria used by the PRC to reclassify most of the delay with regulation reason WEATHER, correct conclusions cannot be drawn from the superficial rationale used.
As an example, sectors in Barcelona ACC are structured within different altitude layers or with “balcony” shapes, which need strict procedures to be followed by ATCOs in order to handle complexity. When bad weather conditions affect to these specific sectors, it is necessary to collapse them to manage the traffic safely and efficiently.
PRC comment: The PRC perceives two very different scenarios in regards to collapsed sectors during periods of adverse weather.
One situation is where sectors are open and then collapse to avoid ATCO overload due to excessive internal coordination. Additional staff are available to open sectors when traffic permits.
The other is where the sector was collapsed due to lack of additional staff and is now constrained further due to adverse weather. In this scenario, the workload of ATCO is being increased with no possible option to assist by opening additional sectors.
Furthermore, if significant delays are occurring because there is a requirement to collapse the sector during adverse weather, it is possible to review the organisation of the airspace or the operational procedures to alleviate excessive coordination and workload.
Moreover, ENAIRE has invested in the deployment of new tools to manage bad weather situations:
- integrating meteorological information in radar screens,
- improving the coordination with Spanish Met Provider (Met Forecasters in ACCs)
- taking part in the Cross border WX Procedure lead by Eurocontrol-NM
- developing and improving tools to manage massive deviations of aircraft due to sudden reduction of airport capacity (weather or any other reason).
PRC comment: The PRC is grateful for the additional information.
Hence, splitting sectors is not the only way of managing operations when dealing with bad weather conditions and should not be considered as the key factor of the technical note methodology.
PRC comment: The PRC acknowledges that adverse weather will always reduce available capacity. Once again, this strengthens the argument for ANSPs to develop capacity plans that provide a buffer to ensure safe and efficient operations when external constraints arise.
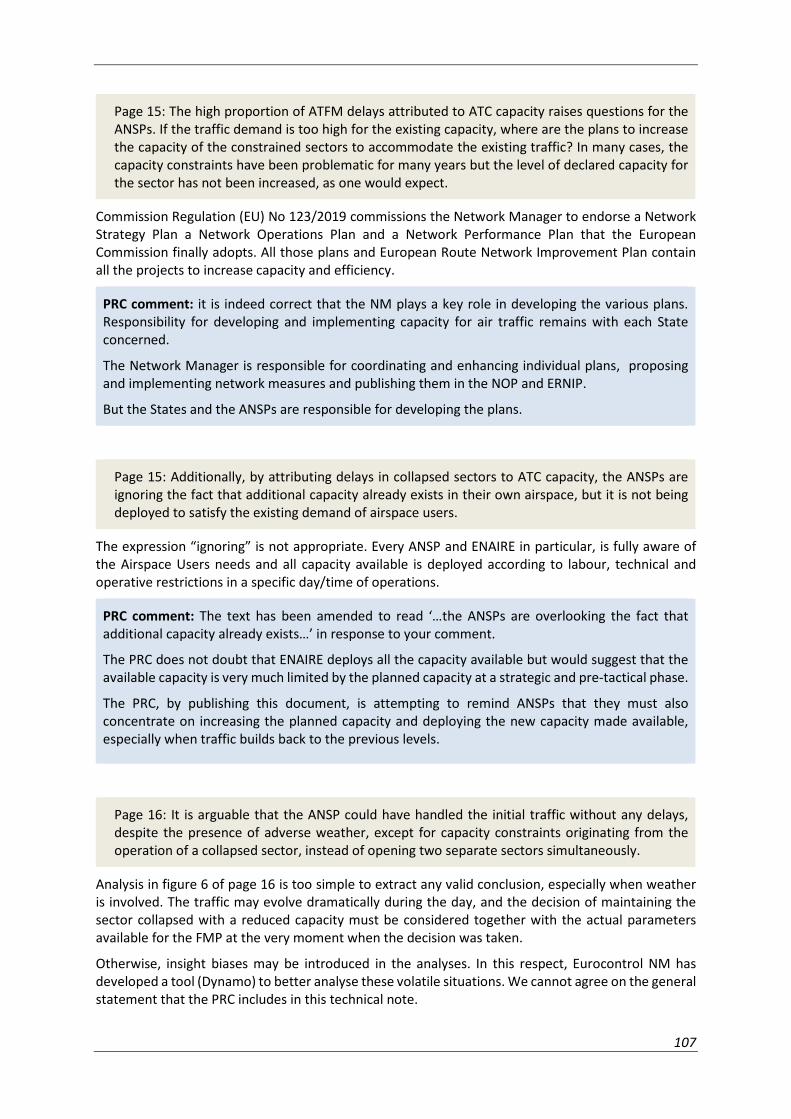
107
Page 15: The high proportion of ATFM delays attributed to ATC capacity raises questions for the ANSPs. If the traffic demand is too high for the existing capacity, where are the plans to increase the capacity of the constrained sectors to accommodate the existing traffic? In many cases, the capacity constraints have been problematic for many years but the level of declared capacity for the sector has not been increased, as one would expect.
Commission Regulation (EU) No 123/2019 commissions the Network Manager to endorse a Network Strategy Plan a Network Operations Plan and a Network Performance Plan that the European Commission finally adopts. All those plans and European Route Network Improvement Plan contain all the projects to increase capacity and efficiency.
PRC comment: it is indeed correct that the NM plays a key role in developing the various plans. Responsibility for developing and implementing capacity for air traffic remains with each State concerned.
The Network Manager is responsible for coordinating and enhancing individual plans, proposing and implementing network measures and publishing them in the NOP and ERNIP.
But the States and the ANSPs are responsible for developing the plans.
Page 15: Additionally, by attributing delays in collapsed sectors to ATC capacity, the ANSPs are ignoring the fact that additional capacity already exists in their own airspace, but it is not being deployed to satisfy the existing demand of airspace users.
The expression “ignoring” is not appropriate. Every ANSP and ENAIRE in particular, is fully aware of the Airspace Users needs and all capacity available is deployed according to labour, technical and operative restrictions in a specific day/time of operations.
PRC comment: The text has been amended to read ‘…the ANSPs are overlooking the fact that additional capacity already exists…’ in response to your comment.
The PRC does not doubt that ENAIRE deploys all the capacity available but would suggest that the available capacity is very much limited by the planned capacity at a strategic and pre-tactical phase.
The PRC, by publishing this document, is attempting to remind ANSPs that they must also concentrate on increasing the planned capacity and deploying the new capacity made available, especially when traffic builds back to the previous levels.
Page 16: It is arguable that the ANSP could have handled the initial traffic without any delays, despite the presence of adverse weather, except for capacity constraints originating from the operation of a collapsed sector, instead of opening two separate sectors simultaneously.
Analysis in figure 6 of page 16 is too simple to extract any valid conclusion, especially when weather is involved. The traffic may evolve dramatically during the day, and the decision of maintaining the sector collapsed with a reduced capacity must be considered together with the actual parameters available for the FMP at the very moment when the decision was taken.
Otherwise, insight biases may be introduced in the analyses. In this respect, Eurocontrol NM has developed a tool (Dynamo) to better analyse these volatile situations. We cannot agree on the general statement that the PRC includes in this technical note.

108
PRC comment: The graphic used in figure 6 is an example only. It is not there to present any conclusion. The PRC avoids stating that this is a conclusion, but indicates that it is arguable.
Page 17: Reducing the number of sector hours means reducing the amount of time where maximum capacity is being deployed.
ENAIRE considers this statement too general and simplistic and does not reflects reality: reducing number of sector hours by itself is not a bad indicator if efficiency is increased by reducing costs and delivering a quality service.
PRC comment: The PRC agrees that sector hours could possibly be reduced, without penalty for airspace users, at ANSPs that do not have a capacity shortfall, but not at the constraining units.
Page 17: It is difficult to understand how ANSPs were attempting to improve capacity performance by operating more frequently with self-imposed capacity constraints.
ANSPs are trying to improve cost-effectiveness in the ATM service and capacity improvement is not the only KPI to be considered within the equation.
PRC comment: The PRC accepts that capacity was not the only KPI under the SES performance scheme but it was a binding target nonetheless. Member States, and their ANSPs, were tasked to meet all key performance indicators.
Page 17: The PRC does not consider that reducing the number of sector hours in any way contributes to the objective of satisfying existing traffic demand in already constrained airspace, never mind accommodating anticipated future traffic growth.
Reducing number of sector hours may contribute to efficiency during low demand periods. The analysis should consider when those sectors hours were used otherwise the analysis lacks of consistency.
PRC comment: The PRC notes ENAIRE’s comment and may consider it for future research.
Page 18: Some of the measures implemented by an ANSP to provide extra capacity can have a negative impact on its ATCO-hour productivity performance. This is, for example, the case of a sector split which will allow the ANSP to create additional capacity in its airspace at the expense of more ATCOs or ATCO-hours on duty required to staff the additional sector(s).
And, vice versa, measures to increase ATCO-hour productivity can have a negative impact on capacity performance. For example, collapsing sectors to reduce the number of ATCOs or ATCO-hours on duty required at the expense of creating capacity constraints leading to additional delays for airspace users.

109
It is obvious that some measures improving capacity involve a decrease in ATCOs productivity, but this doesn’t imply that efforts should not address this factor. If rostering, training or technology improvements are not considered, capacities would remain as they were 50 years ago.
PRC comment: The PRC agrees that improvements are required to increase capacity. This technical paper was produced to encourage ANSPs to focus on improving their capacity plans by addressing individual sector capacities, as well as focusing on the various factors that are preventing the deployment of full capacity during peak periods.
6. Barcelona ACC
Regarding the specific analysis made for Barcelona ACC, ENAIRE wants to make some comments and correct certain data used in the Technical Note.
First, as the Technical Note has not taken into account the eNM19 reattribution of delay, we consider the data provided not correct:
PRC comment: As stated previously, the PRC used the source data from the regulations initiated by Barcelona FMP, without referring to the post-operations process.
Barcelona ACC created 226k minutes of delay in 2017, 386k minutes of delay in 2018 and 635k minutes of delay in 2019.
Considering the delay reattribution due to eNM19 measures (228.487 minutes that should be attributed to LFMM), Barcelona ACC created 407k minutes delay in 2019, so only 5% more delay with an increase of +3% of traffic. And, according to data sent for ACE report, ATCO productivity for LECB ACC (TMA + En route):
Published Preliminary
ATCO Productivity 2014 2015 2016 2017 2018 2019
ACC BARCELONA 0,92 0,90 0,93 0,97 0,99 1,07
Regarding sector capacity evolution, the Technical Note focuses only in the evolution of sectors declared capacity, but misses the improvements achieved by restructuring the airspace.
LECB ACC has already improved the East part of its airspace by splitting the former single sector LECBCCC in two extra elementary sectors: LECBCCL and LECBCCU, and consequently increasing the capacity of that area in more than 80% - June 2015 -.
- LECBCCC capacity 43
- LECBCCU capacity 45 + LECBCCL capacity 32
PRC comment: The PRC welcomes this information and has referenced it in the report as evidence that splitting sectors can provide additional capacity.
Additionally, in June 2016, LECB increased capacity of the following sectors:
- LECBP1L went from capacity 38 to 41 (40 on weekends)

110
- LECBP1U went from capacity 41 to capacity 45 (43 on weekends)
PRC comment: The PRC does not see either LECBP1L, or LECBP1U in AIRAC 1702, 1802 or 1902. (The PRC notes that they have been replaced by GO1 etc.)
The PRC would be grateful to learn why the declared capacity of these sectors is reduced at the weekend when military training and activity is generally reduced.
In June 2017, ENAIRE redesigned the west airspace structure of LECB en-route sectors. PP2, P1L and P1U sectors were redesigned into P2R, GO1, GO2 and GO3 sectors.
Although P2R and old PP2 have the same declared capacity, the airspace restructure implied the flow of traffic proceeding from SE Spain to GIROM was shifted to the GO1, GO2, GO3 sectors (former P1L and P1U). Note that where LECB had 3 sectors with capacities of 42, 38 and 41, now LECB has four sectors with 42, 41, 40 and 41, increasing the global throughput by more than 30% with maximum sector deployment.
- LECBP2R capacity 42
- LECBGO1 capacity 41
- LECBGO2 capacity 40
- LECBGO3 capacity 41
PRC comment: Thank you. The PRC is happy to reference these changes in the report.
The creation of the GO sectors caused a considerable reduction of delays, not only improving LECB performance, but LFBB too, a better vertical trajectory efficiency for traffic departing from Balearic islands and SE of Spain to UK, Benelux and Scandinavian destinations.

111
As for the LECBVVS sector, it has not been an elementary sector until July 2015, therefore not available for its use as a stand-alone sector in any configuration. It was a volume attached to LECBMMS that formed elementary sector LECBBAS.
PRC comment: To reflect your comment, the PRC has deleted the declared capacity values for LECBVVS prior to 2015.
It became an elementary sector in July 2015 to allow a better use of LECB resources, permitting new configurations, and therefore reducing delays. LECBVVS was implemented with a capacity of 38.
It is important to point out that LECBVVS sector has only accounted for a total delay of 500 minutes in the last 3 years.
PRC comment: The LECBVVS sector had 5000 minutes of delay in 2015.
LECBBAS has kept its capacity at 39 all along the analysed period but there is an ongoing project that will yield 2 elementary sectors, completing a major LECB UIR restructuring effort that began in 2015 to tackle all LECB bottlenecks present at 2015.
PRC comment: The PRC welcomes this news.
Unfortunately, this project has suffered some delays due to the efforts ENAIRE has made to train new ATCOs in LECB in the last two years, and now, due to COVID19 outbreak. Nevertheless, simulations on final proposal for the project have been resumed.
Finally, being LECB ACC divided in three clusters, two for en-route and one for TMA, ENAIRE wants to note the improvement of the TMA cluster performance due to training en route ATCOs to become TMA ATCOs, and reducing TMA airspace delays in 42% per traffic in the last 5 years.
2015 2016 2017 2018 2019 Airspace min delay 131.166 111.797 244.036 171.709 65.516 Aerodrome min delay 14.052 656.366 828.083 493.164 231.378 ALL min delay 145.218 768.163 1.072.119 664.873 296.894 Traffic LEBLTMA 362.388 389.666 414.883 435.317 447.660 Min delay/traffic (ALL) 0,40 1,97 2,58 1,53 0,66 Min delay/Traffic (Only AS) 0,36 0,29 0,59 0,39 0,15
PRC comment: As stated previously, the PRC acknowledges the huge efforts from ATC staff in Spain whilst faced with very high increases in traffic over the last few years.
The PRC is not seeking to criticise the performance of ENAIRE, or any ANSP, rather it is trying to assist the ANSPs to improve performance going forward, by looking at planned capacity, declared capacity and deployed capacity.

112
16 HUNGAROCONTROL: FEEDBACK
One very important factor, that quite often gets forgotten, when assessing Budapest ACC performance, is the KFOR sector.
Budapest ACC has been providing ATC service in the airspace over the province of Kosovo since April 2014. This means that with the same ACC staff we serve two airspaces at the same time. We consider Kosovo (KFOR) sector as an additional sector but this fact never appears when Budapest ACC performance is assessed.
We requested several times NM to present in their statistics the traffic evolution in KFOR sector and finally they started to publish it separately, but again it not mentioned anywhere that this airspace is served by Budapest ACC.
Normally, Budapest ACC has around 16-23 ACC licensed ATCOs on a day shift, (depending on a season) and every ATCO can be allocated for duty either in any of the Budapest ACC sectors or in the KFOR sector.
PRC comment: The PRC is grateful for this additional information.