GBUS - Route GeoTracer - Técnico Lisboa
110
GBUS - Route GeoTracer Marta Pereira dos Santos (BSc in Information Systems and Computer Engineering) Dissertation submitted to obtain the Master Degree in Information Systems and Computer Engineering Jury Chairman: Prof. Doutor Alberto Manuel Rodrigues da Silva Supervisor: Prof. Doutor Ricardo Jorge Feliciano Lopes Pereira Co-supervisor: Doutor António Brandão Leal Members: Prof. Doutor Alexandre Paulo Lourenço Francisco November 2012
-
Upload
khangminh22 -
Category
Documents
-
view
0 -
download
0
Transcript of GBUS - Route GeoTracer - Técnico Lisboa

GBUS - Route GeoTracer
Marta Pereira dos Santos(BSc in Information Systems and Computer Engineering)
Dissertation submitted to obtain the Master Degree in
Information Systems and Computer Engineering
Jury
Chairman: Prof. Doutor Alberto Manuel Rodrigues da SilvaSupervisor: Prof. Doutor Ricardo Jorge Feliciano Lopes PereiraCo-supervisor: Doutor António Brandão LealMembers: Prof. Doutor Alexandre Paulo Lourenço Francisco
November 2012


Abstract
Intelligent Transportation Systems are very common nowadays and are adopted by almost ev-
ery public or private transportation company. To adopt an intelligent transportation system, a
company must have a database with all paths travelled by the vehicles and the bus stops’ loca-
tions of each path. Currently, there is not an automatic solution that allows the user to collect the
location of bus stops and its attributes, as well as the bus routes. The system developed, GBUS
- Route GeoTracer, enables a single person, equipped with a tablet (or a smartphone) to gather
bus routes or variations of existing routes, including bus stop locations, photos and attributes.
GBUS consists of a client module and a server side. The client module is a mobile client ap-
plication, GBUS Mobile Application, which allows the user to collect bus stops and routes from
a running vehicle. The server side consists in a server, Route Builder, that receives the infor-
mation collected and applies a map-matching algorithm to map the collected Global Positioning
System (GPS) traces to a digital road map; and a Back-Office Monitoring Application to visualize
and edit the information collected. The collected data can then be used to populate a public
transportation Intelligent Transportation Systems (ITS) system, thus reducing the implementation
time and cost. GBUS was designed taking into consideration the requirements of Tecmic’s XtraN
Passenger ITS.
Keywords: public transportation, bus stops, bus routes, data collection, map-matching,
string matching, ITS, APTS, Tecmic, XtraN Passenger
i

Resumo
Os Sistemas Inteligentes de Transporte ou ITS são bastante comuns nos dias de hoje e
são adoptados pela maioria das empresas de transportes públicos. Para uma empresa
adoptar um ITS, é necessário que sejam conhecidas todas as paragens e as rotas percorridas
pelos veículos. Actualmente, não existe nenhuma solução automatizada que permita que um
utilizador colecione a localização das paragens e seus atributos, assim como as rotas percorridas
pelos autocarros. O sistema desenvolvido, GBUS - Route GeoTracer, permite que um utilizador,
equipado com um tablet (ou smartphone), recolha rotas de autocarros ou variantes de rotas já
existentes, incluindo a localização, fotografia e atributos das paragens de autocarro. O sistema
GBUS é constituído por um módulo cliente e um módulo servidor. O módulo cliente consiste
numa aplicação móvel, GBUS Mobile Application, que permite ao utilizador recolher paragens
e rotas através de um veículo em movimento. O módulo servidor consiste no servidor Route
Builder que recebe a informação recolhida com a aplicação móvel, e aplica um algoritmo de
mapeamento para mapear os percursos recolhidos com GPS no mapa de estradas. Este módulo
é também constituído pela Back-Office Monitoring Application que permite visualizar e editar
a informação recolhida. Esta informação pode posteriormente ser utilizada para popular um
sistema ITS, o que reduz o tempo e custo de implementação. O sistema GBUS foi desenvolvido
tendo em conta as necessidades do sistema XtraN Passenger da Tecmic.
Keywords: transportes públicos, paragens, rotas, recolha de dados, mapeamento, ITS,
APTS, Tecmic, XtraN Passenger
iii


Acknowledgements
This dissertation would have not been possible without the help and support of several indi-
viduals who, in one way or another, contributed to the development of this work.
First of all, I would like to thank my thesis advisor, Professor Ricardo Pereira, for all the support,
dedication and guidance, without which this work would not have been possible.
Tecmic, in particular, António Brandão Leal and Ricardo Ramos, for always being available to
help and for all the support provided.
My parents and grandparents, for providing me with the necessary support, understanding, pa-
tience and guidance.
Diogo Morgado, for all the help, motivation and friendship he gave me throughout this year.
André Levita, for the companionship and support along the way.
Last but not the least, my colleagues at Instituto Superior Técnico, specially at inesc, for all the
guidance and feedback which allowed me to continuously improve my work.
v


Contents
Abstract i
Resumo iii
Acknowledgements v
1 Introduction 1
1.1 Motivation . . . . . . . . . . . . . . . . . . . . . . . . . . . . . . . . . . . . . . . . . 1
1.2 Background . . . . . . . . . . . . . . . . . . . . . . . . . . . . . . . . . . . . . . . . 1
1.3 Proposed Solution . . . . . . . . . . . . . . . . . . . . . . . . . . . . . . . . . . . . 4
1.4 Outline . . . . . . . . . . . . . . . . . . . . . . . . . . . . . . . . . . . . . . . . . . . 5
2 Related Work 7
2.1 Data Collection . . . . . . . . . . . . . . . . . . . . . . . . . . . . . . . . . . . . . . 7
2.2 Map-Matching . . . . . . . . . . . . . . . . . . . . . . . . . . . . . . . . . . . . . . 9
2.2.1 Geometric Map-Matching . . . . . . . . . . . . . . . . . . . . . . . . . . . . 9
2.2.2 Topological Map-Matching . . . . . . . . . . . . . . . . . . . . . . . . . . . . 12
2.2.3 Probabilistic Map-Matching . . . . . . . . . . . . . . . . . . . . . . . . . . . 14
2.2.4 Advanced Map-Matching . . . . . . . . . . . . . . . . . . . . . . . . . . . . 16
2.2.5 Other Map-Matching Algorithms . . . . . . . . . . . . . . . . . . . . . . . . 21
2.3 Discussion . . . . . . . . . . . . . . . . . . . . . . . . . . . . . . . . . . . . . . . . 24
3 System Architecture 25
vii

3.1 System Requirements . . . . . . . . . . . . . . . . . . . . . . . . . . . . . . . . . . 25
3.2 Description . . . . . . . . . . . . . . . . . . . . . . . . . . . . . . . . . . . . . . . . 27
3.2.1 Communication between the Mobile Application and the Route Builder . . . 32
4 Implementation 35
4.1 Client Side - GBus Mobile Application . . . . . . . . . . . . . . . . . . . . . . . . . 35
4.1.1 Data Layer . . . . . . . . . . . . . . . . . . . . . . . . . . . . . . . . . . . . 35
4.1.2 Logic and Presentation Layers . . . . . . . . . . . . . . . . . . . . . . . . . 37
4.2 Client-Server Communication . . . . . . . . . . . . . . . . . . . . . . . . . . . . . . 45
4.2.1 JSON - JavaScript Object Notation . . . . . . . . . . . . . . . . . . . . . . . 46
4.2.2 GPX - GPS eXchange Format . . . . . . . . . . . . . . . . . . . . . . . . . 46
4.3 Server Side . . . . . . . . . . . . . . . . . . . . . . . . . . . . . . . . . . . . . . . . 49
4.3.1 Technologies and Tools . . . . . . . . . . . . . . . . . . . . . . . . . . . . . 49
4.3.2 Server Database - Data Model . . . . . . . . . . . . . . . . . . . . . . . . . 49
4.3.3 Route Builder Server . . . . . . . . . . . . . . . . . . . . . . . . . . . . . . . 50
4.3.4 GBus Monitoring Application . . . . . . . . . . . . . . . . . . . . . . . . . . 55
4.4 Conclusion . . . . . . . . . . . . . . . . . . . . . . . . . . . . . . . . . . . . . . . . 60
5 Evaluation 63
5.1 Map-Matching Algorithm . . . . . . . . . . . . . . . . . . . . . . . . . . . . . . . . . 63
6 Conclusion 65
6.1 Future Work . . . . . . . . . . . . . . . . . . . . . . . . . . . . . . . . . . . . . . . . 66
Bibliography 67
Appendix 70
A Mobile Application Images 71
B Monitoring Application Images 77
C GPX example 93
viii

List of Tables
2.1 Summary of existing transit data collection solutions . . . . . . . . . . . . . . . . . 8
2.2 Summary of geometric map-matching algorithms . . . . . . . . . . . . . . . . . . . 13
2.3 Summary of topological map-matching algorithms . . . . . . . . . . . . . . . . . . 15
2.4 Summary of probabilistic map-matching algorithms . . . . . . . . . . . . . . . . . . 17
2.5 Summary of advanced map-matching algorithms . . . . . . . . . . . . . . . . . . . 22
2.6 Other map-matching algorithms . . . . . . . . . . . . . . . . . . . . . . . . . . . . . 23
5.7 Resulting accuracy of the map-matching algorithm . . . . . . . . . . . . . . . . . . 63
5.8 Resulting precision of the map-matching algorithm . . . . . . . . . . . . . . . . . . 64
ix


List of Figures
2.1 Problem with Point-to-Point matching. . . . . . . . . . . . . . . . . . . . . . . . . . 10
2.2 Problem with Point-to-Arc matching. . . . . . . . . . . . . . . . . . . . . . . . . . . 10
2.3 Problem with Point-to-Arc matching. . . . . . . . . . . . . . . . . . . . . . . . . . . 11
2.4 Problem with Arc-to-Arc matching. . . . . . . . . . . . . . . . . . . . . . . . . . . . 11
2.5 Problem with Arc-to-Arc matching. . . . . . . . . . . . . . . . . . . . . . . . . . . . 11
3.6 Mobile Application use cases . . . . . . . . . . . . . . . . . . . . . . . . . . . . . . 26
3.7 Monitoring Application use cases . . . . . . . . . . . . . . . . . . . . . . . . . . . . 27
3.8 Architectural overview of the GBus system . . . . . . . . . . . . . . . . . . . . . . . 28
3.9 Interaction between the mobile application and the Route Builder when creating a
new route. . . . . . . . . . . . . . . . . . . . . . . . . . . . . . . . . . . . . . . . . . 29
3.10 Interaction between the mobile application and the Route Builder when creating a
new route variation. . . . . . . . . . . . . . . . . . . . . . . . . . . . . . . . . . . . 30
3.11 Interaction between the mobile application and the Route Builder when adding a
bus stop to a route. . . . . . . . . . . . . . . . . . . . . . . . . . . . . . . . . . . . . 31
3.12 Interaction between the mobile application and the Route Builder when sending a
saved route/route variation to the Route Builder. . . . . . . . . . . . . . . . . . . . 31
4.13 Mobile Application database model. . . . . . . . . . . . . . . . . . . . . . . . . . . 36
4.14 General Mobile Application structure. . . . . . . . . . . . . . . . . . . . . . . . . . . 37
4.15 Creation of a new route. . . . . . . . . . . . . . . . . . . . . . . . . . . . . . . . . . 39
4.16 Database after the creation of a new route. . . . . . . . . . . . . . . . . . . . . . . 39
4.17 Database after the insertion of route variation points. . . . . . . . . . . . . . . . . . 39
4.18 Database after the insertion of a new bus stop. . . . . . . . . . . . . . . . . . . . . 40
xi

4.19 Creation of a new route variation. . . . . . . . . . . . . . . . . . . . . . . . . . . . . 42
4.20 Examples of new links. . . . . . . . . . . . . . . . . . . . . . . . . . . . . . . . . . . 43
4.21 Management of saved route variations. . . . . . . . . . . . . . . . . . . . . . . . . 46
4.22 Examples of JSON data sent from the Route Builder to the mobile application. . . 47
4.23 GBus Server Database model. . . . . . . . . . . . . . . . . . . . . . . . . . . . . . 50
4.24 Route Builder architecture. . . . . . . . . . . . . . . . . . . . . . . . . . . . . . . . 51
4.25 Monitoring Application architecture. . . . . . . . . . . . . . . . . . . . . . . . . . . . 56
4.26 Example of stretches for a group of paths. . . . . . . . . . . . . . . . . . . . . . . . 59
A.27 Mobile Application’s home screen. . . . . . . . . . . . . . . . . . . . . . . . . . . . 71
A.28 Examples of the creation of a new route . . . . . . . . . . . . . . . . . . . . . . . . 72
A.29 Examples of the creation of a new bus stop . . . . . . . . . . . . . . . . . . . . . . 73
A.30 Examples of the creation of a new bus route variation. . . . . . . . . . . . . . . . . 74
A.31 Examples of the creation of a new bus route variation . . . . . . . . . . . . . . . . 75
A.32 Examples of the management of stored route variations . . . . . . . . . . . . . . . 76
B.33 Monitoring Application’s home page. . . . . . . . . . . . . . . . . . . . . . . . . . . 78
B.34 Bus stop details. . . . . . . . . . . . . . . . . . . . . . . . . . . . . . . . . . . . . . 79
B.35 Edit route page. . . . . . . . . . . . . . . . . . . . . . . . . . . . . . . . . . . . . . . 80
B.36 Edit route variation page. . . . . . . . . . . . . . . . . . . . . . . . . . . . . . . . . 81
B.37 Edit route variation page: Bus stop options. . . . . . . . . . . . . . . . . . . . . . . 82
B.38 Edit route variation page: Add point to variation. . . . . . . . . . . . . . . . . . . . 83
B.39 Edit route variation page: Point options. . . . . . . . . . . . . . . . . . . . . . . . . 84
B.40 Edit bus stop page. . . . . . . . . . . . . . . . . . . . . . . . . . . . . . . . . . . . . 85
B.41 List bus stops page. . . . . . . . . . . . . . . . . . . . . . . . . . . . . . . . . . . . 86
B.42 Merge bus stops: Selection of bus stops to merge. . . . . . . . . . . . . . . . . . . 87
B.43 Merge bus stops: Selection of attributes. . . . . . . . . . . . . . . . . . . . . . . . . 88
B.44 List of existing stretches. . . . . . . . . . . . . . . . . . . . . . . . . . . . . . . . . . 89
B.45 Selection of route variations to find new stretches. . . . . . . . . . . . . . . . . . . 90
B.46 Details of a path stretch. . . . . . . . . . . . . . . . . . . . . . . . . . . . . . . . . . 91
xii

List of Acronyms
GPS Global Positioning System
DR Dead Reckoning
API Application Programming Interface
JSON JavaScript Object Notation
GPX GPS eXchange Format
ATSIM Automated Transit Stop Inventory Model
ITS Intelligent Transportation Systems
xiii


Chapter 1
Introduction
1.1 Motivation
Intelligent transportation systems (ITS) are very common nowadays and are adopted by almost
every public or private transportation company. Several companies in the market, like Tecmic1,
provide ITS solutions to potential clients. Bus transportation companies are one of these clients
and in order to implement ITS applications, such as transit management and traveller information
systems, it is required that the location of transit stops and the geographic representation of
routes are known. Usually this information is not known by the transportation companies and
there is no geographic database with this data. According to Tecmic, in some bus transportation
companies, only the bus driver and the frequent bus travellers know the usual bus route and
its bus stop locations. In order to adopt an ITS system, the transportation company or the ITS
provider must collect all the information related to bus stops and routes. This task is usually done
manually in the field which can be very expensive, complex and time consuming. There is not a
tool in the market that allows a company to automatically collect the route travelled by each bus
as well as locate bus stops and define its attributes.
1.2 Background
In this section we provide an overview of the technologies of the field where this thesis is included:
Intelligent Transportation Systems. As this thesis was performed in collaboration with Tecmic, we
also present the company and its field of work.
1http://www.tecmic.pt, last accessed on December 20, 2011
1

2 CHAPTER 1. INTRODUCTION
Intelligent Transportation Systems ITS is the application of technology to the transportation
network to improve safety, productivity, accessibility and mobility [2] [3] [4]. There are several
application areas of ITS, including:
• Advanced Traffic Management Systems (ATMS): The purpose of ATMS is to improve the
flow of vehicle traffic and safety. Includes analysis of real-time traffic data, prediction of
traffic congestion, incident detection, and suggestion of alternative routes.
• Advanced Traveller Information Systems (ATIS): ATIS are aimed at providing information
to users about the location of incidents, weather conditions, road problems, optimal routes
and lane restrictions.
• Advanced Vehicle Control Systems (AVCS): AVCS is viewed as an enhancement of the
driver’s control of the vehicle in order to improve safety and efficiency.
• Commercial Vehicle Operations (CVO): CVO is the application of ITS in private trucks, vans
and taxis operators in order to improve management and productivity of their fleets and the
efficiency of operations. CVO systems make it possible for a company to locate its entire
fleet and control its routes in real-time.
• Advanced Public Transportation Systems (APTS): APTS is the application of ITS in public
transit to improve the accessibility to information for its users and the scheduling of routes.
Advanced Public Transportation Systems are very common nowadays and adopted in most pub-
lic and private transportation companies. APTS can be divided in several categories and for
each category several technologies are available [2]. One of these categories corresponds to
Fleet Management Systems which are intended to improve the efficiency and scheduling of tran-
sit systems and to reduce operating costs. These systems do this by using technologies like
Automatic Vehicle Location Systems, to automatically determine and transmit the geographic lo-
cation of the vehicles; Communications Systems, like cellular networks, to communicate with the
vehicles; Geographic Information Systems, which provide a geographical representation of the
vehicles; and Automatic Passenger Counters, to count the number of passenger on board of a
vehicle.
Another category is Traveller Information Systems which are aimed at providing information to
users at home or at stops about vehicles, routes, schedules and prices. These systems allow the
users to choose the most efficient and convenient modes and routes to travel to their destination.
The technologies used are Pre-Trip Transit and Multimodal Traveller Information Systems, which
provide real-time information about the location and schedule of vehicles, and road and traffic
conditions; and In-Terminal and In-Vehicle Transit Information Systems, which provide visual and

1.2. BACKGROUND 3
audio announcements in stops or vehicles about next stops, destination, actual time and date
and transfer points.
Also an APTS category is the one related to Electronic Payment Systems which are installed to
make payment more convenient for travellers and revenue collection less costly for transit compa-
nies. One of the technologies used in this systems are Smart Cards which replace the traditional
magnetic cards or tickets as a payment method.
Finally there is Transportation Demand Management which refers to techniques applied by trans-
portation agencies to manage the capacity of the existing infrastructure more effectively. The pur-
pose of demand management is to maximize the capacity of the current transportation network
in order to meet the increase in the demand for the transportation services. Several technologies
are used to monitor capacity and manage the system in real time. One of these technologies is
Dynamic Ridesharing, which is a service that arranges shared rides in real-time to better utilize
the empty seats in passenger vehicles.
Another technology that is used in most Advanced Public Transportation Systems is the Global
Positioning System (GPS). In the last few years, the GPS has become the major positioning tech-
nology for providing location data for ITS applications. [5] describe the GPS as a tool for intelligent
vehicle-highway systems. Dead Reckoning (DR) sensors, usually consisting of an odometer and
a gyroscope, are also used to assist a GPS sensor in order to fill the gaps of GPS coverage [6].
In some ITS applications it is also necessary to map a vehicle GPS position to a road map and,
since a GPS sensor is not precise, it is necessary to apply a map-matching technique. These
techniques not only match the current position of the vehicle to a known road but also improve
the positioning accuracy. A vast amount of work has been presented in this area and will be
described in section 2.
Tecmic Tecmic is a Portuguese company created in 1988 whose business is to provide Intelli-
gent Transportation Systems for access management, fleet management and remote equipment
management, for several types of companies. XtraN Fleet Management, the family of Tecmic’s
products, offers solutions for several areas, namely, Passenger Fleet Management (XtraN Pas-
senger1), Public Order and Emergency Forces (XtraN Enforcement2 and XtraN 4Forces Emer-
gency Management3), Service Planning and Management (XtraN Dispatch Manager4), Access
Control Management (Siga Access Management5), control and monitoring of remote equipment
1http://www.tecmic.pt/eng/xtran/passenger_intro.html, last accessed on January 7, 20122http://www.tecmic.pt/eng/xtran/enforce_intro.html, last accessed on January 7, 20123http://www.tecmic.pt/eng/4Forces/4Forces_intro.html, last accessed on January 7, 20124http://www.tecmic.pt/eng/xtran/xtran_dispatchmanager.html, last accessed on January 7, 20125http://www.tecmic.pt/eng/siga/siga_intro.html, last accessed on January 7, 2012

4 CHAPTER 1. INTRODUCTION
and systems (Simor Telemetry Monitoring System1) and monitoring of the content level of recy-
cling bins (Ecogest Recycling Points Management2).
XtraN Passenger is a solution for public transportation and enables real-time monitoring of all
fleet activity, voice and data communication with the driver, arrival time prediction and the provi-
sion of information to users in stations, transit stops, and by internet and SMS. XtraN Passenger
has four modules: Informer, a multi-channel platform to provide real-time information to users;
Counter, a system to count on board passengers; Eco-driver, which allows the control of the driv-
ing energy efficiency in order to reduce fuel consumption and improve the comfort and security
of passengers; and Infotainer, an in-board service aimed at providing publicity and entertainment
to transit users.
1.3 Proposed Solution
As mentioned before, most transportation companies do not have a geographical database with
the locations of bus stops and routes, which is required to adopt a system like XtraN Passenger.
We propose to expand the XtraN Passenger system by developing GBus - Route Geotracer, a
system to automatically collect bus routes and also to collect bus stops location and attributes.
GBus consists in a client side and a server side. The client side is a mobile application which
allows the user to collect the data in the field. The server side consists in a server that receives
the information collected with the mobile application. This server analyses the data received and
stores it in a database. The server side is also consisted by a back-office monitoring application
to visualize and edit all the information before it is integrated into XtraN Passenger.
GBUS allows the user to collect bus stops in the field with the mobile application, which auto-
matically collects the travelled bus routes, using the device’s GPS sensor. Then, all the data is
sent to the server which then analyses it and maps the received routes on the digital road map,
using a map-matching algorithm. This mapping process corrects possible errors or imprecisions
of the routes collected with GPS, and each point of the route is mapped onto a road on the map.
Finally, all the information generated is stored in the database and can then be edited with the
monitoring application.
The tests performed revealed great results in terms of precision and accuracy of the routes ob-
tained from the map matching algorithm.
1http://www.tecmic.pt/eng/simor/simor_intro.html, last accessed on January 7, 20122http://www.tecmic.pt/eng/ecogest/ecogest_intro.html, last accessed on January 7, 2012

1.4. OUTLINE 5
1.4 Outline
This document describes the research and work developed and it is organized as follows:
• Chapter 1 presents the motivation, background and proposed solution.
• Chapter 2 describes the previous work in the field.
• Chapter 3 describes the system requirements and the architecture of GBus.
• Chapter 4 describes the implementation of GBus and the technologies chosen.
• Chapter 5 describes the evaluation tests performed and the corresponding results.
• Chapter 6 summarizes the work developed and future work.


Chapter 2
Related Work
The existing Transit Tracking and Transit Information systems assume that the bus stops and
routes are known a priori. Few are the solutions that automate the process of georeferenc-
ing bus stops and collecting and mapping transit routes. The majority of work is divided in two
separate areas: data collection, the collection of the geographical location and attributes of bus
stops; and map-matching, the process of mapping collected GPS traces into a digital road map.
These two areas are described in section 2.1 and section 2.2.
2.1 Data Collection
Bus stop data collection is the process of defining the geographical location of bus stops and its
attributes. An attribute is a feature of a bus stop that can be used to represent and to provide
additional information about the bus stop (for example, its number, name, photograph, accessi-
bility, etc.). Traditional methods of bus stop collection were entirely manual and involved using
clipboard, pencil and paper [7]. With the emergence of GPS receivers the field data collection
became semi-automated: the coordinates of each bus stop are collected with a GPS unit, while
the attributes of each stop are collected in paper. Both kinds of information are then combined in
back-office applications. However, nowadays there are already some automated data collection
solutions. One of them is the Automated Transit Stop Inventory Model (ATSIM)1. ATSIM is divided
into a mobile application and a desktop application. The mobile application is intended to be used
in the field and installed in a PDA with GPS access. This application was especially designed
to be run on the HP iPAQ model hw6925/45 and allows the collection of bus stops coordinates,1http://www.ftis.org/atsim.html, last accessed on December 20, 2011
7

8 CHAPTER 2. RELATED WORK
photographs, as well as the definition of 56 standard attributes and eight user-defined fields. The
Desktop application allows the display, querying and updating of the bus stop inventory collected.
One disadvantage of this solution is the inflexibility of the definition of bus stop attributes. The
application only allows eight custom attributes and it is not possible to change the type of the
standard ones.
Another data collection solution is the ESRI ArcPad1. ArcPad is a software designed for field
mapping and data collection. This software was not designed for any specific type of data which
makes it applicable for collection of almost any kind of information, such as bus stops. While
ATSIM only allows the customization of eight attributes, ArcPad requires the definition of the
name and type of all the attributes. The ArcPad application is integrated with a back-office appli-
cation which allows the customization of the attributes that are going to be collected.
Both ATSIM and ArcPad are intended exclusively for collecting physical locations and attributes,
and do not allow the collection of routes. Table 2.1 summarizes the properties of ATSIM and
ARCPAD: the main purpose of the solution, if it allows taking and linking automatically pictures
to bus stops, the types of attributes supported, and the advantages and disadvantages of each
solution.
Bastos et al. (2008) propose a Transit Information System named Antares [8] [9]. This system
allows the user to introduce an origin and a destination and provides all the possible bus routes
available so he can arrive to the desired destination. Antares consists of a user module and an
administrative module. The user module allows the user to interact with the system whereas the
administrative module is where all the information required is introduced. Although Antares sup-
ports the collection of bus stops and routes, all the information has too be introduced manually:
all the streets that are going to be considered, the attributes of each bus stop and the existing
routes. The coordinates of all bus stops must be collected with a location sensor, such as a GPS
sensor, and each route is defined by an ordered list of bus stops. Introducing all this information,
especially all the street names, can be very time-consuming and may lead to a great amount of
human errors.
1http://www.esri.com/software/arcgis/arcpad/index.html, last accessed on December 20, 2011
Solution Purpose Photographs Attributes CommentsATSIM bus stop inventory Yes 56 standard and
8 user-definedattributes
Does not allow the customization of mostattributes
ArcPad general purpose Yes all attributes areuser-defined
All attributes are fully customizable
Table 2.1: Summary of existing transit data collection solutions

2.2. MAP-MATCHING 9
EasyTracker is a system designed to provide transit tracking, mapping, and arrival time prediction
services with reduced costs and complexity [10]. A smartphone must be installed in all the
vehicles and its main function is to periodically send the GPS coordinates of its actual position.
This information is put through batch and online processing. Online processing matches vehicles
to routes to classify each vehicle as “in-service” or “out-of-service”, and for arrival time prediction
if the vehicle is “in-service”. Batch processing analyses the GPS traces collected in order to
produce route shapes, determine stop locations, and schedules. Single routes are identified
based on repetition since it is assumed that buses travel along the same route several times. To
extract the bus stops the algorithm applies kernel density estimation [11] to produce an estimate
of the proportion of time spent in any location along the route. Intuitively, buses spend more time
in bus stops. However a bus stop may be confused with a traffic signal or a stop sign. In order to
correctly identify the bus stops a minimum density threshold is applied. The authors evaluated the
performance of the stop extraction algorithm and concluded that the algorithm detects between
85% and 100% of the total number of true bus stops, and only 50% of the total stops identified
are true bus stops. According to the authors these results are due to the strong similarity of bus
stopping behaviour at bus stops and certain locations, such as intersections, stop signs, traffic
signals, and traffic congestion. In addition, some bus stops are rarely used by transit riders which
makes them hard to identify. Manual intervention is the solution proposed. Another disadvantage
of EasyTracker is the impossibility of defining attributes to bus stops, since the entire process is
automated. The collection of bus stops attributes could provide additional information to transit
riders.
2.2 Map-Matching
Map-matching is the process of correlating positioning data with spatial road network data in or-
der to identify the correct road on which a vehicle is travelling [1] [12] [13]. Several algorithms
using different techniques have been proposed to solve this problem. Existing map-matching
algorithms have been classified into four categories: geometric, topological, probabilistic, and
advanced [13].
2.2.1 Geometric Map-Matching
Geometric map-matching algorithms only make use of geometric information of the road network.
This method can be applied in three different ways: Point-to-Point, Point-to-Arc and Arc-to-Arc

10 CHAPTER 2. RELATED WORK
matching [1].
In Point-to-Point matching each position is matched to the closest node of a road segment. This
is essentially a search problem. This method as the advantage of being easy to implement and
fast. However, the success of Point-to-Point algorithms depends on the way the road segments
are defined.
Figure 2.1: Problem with Point-to-Point matching [1].
In Figure 2.1 point pt should be matched to arc A but it will be matched to arc B since it is closer
to node B1 than it is to either A0 or A1. Hence, in point-to-point matching arcs with more points
are more likely to be matched to.
Another approach is Point-to-Arc or Point-to-Curve matching in which each point is matched to
the closest arc or road segment in the map. Although this method gives better results than Point-
to-Point matching, it has some problems which make it inappropriate in practice. In Figure 2.2,
p2 is equidistant from arc A and arc B making it impossible to match the point.
Figure 2.2: Problem with Point-to-Arc matching [1].
Another problem is shown in Figure 2.3. Points p0 and p2 are closer to arc A and will be matched
to A whereas point p1 is closer to arc B and will be matched to B. This would mean that the
vehicle was travelling along road segment A and then switched to road segment B and then
switched again to segment A, which is not possible in practice. Hence this matching method
gives very unstable results in urban road networks since the road density is very high [13].
Finally, in Arc-to-Arc or Curve-to-Curve matching a set of m points are simultaneously matched to
the closest arc defined by the points P 0, P 1, ..., Pm. This approach uses Point-to-Point matching

2.2. MAP-MATCHING 11
Figure 2.3: Problem with Point-to-Arc matching [1].
to find a set of candidate nodes and for each candidate node it constructs piecewise linear curves
from the paths that originate from that node. Then it constructs piecewise linear curves using the
vehicle’s trajectory and determines the distances between this curve and each curve built from
the road network. The closest road arc to the curve built from the m points is assumed to be
the one on which the vehicle is travelling. This approach is quite sensitive to outliers, as shown
in Figure 2.4, and can give unexpected results, as shown in Figure 2.5. Besides, this method
depends on Point-to-Point matching which has the disadvantages described above.
Figure 2.4: Problem with Arc-to-Arc matching [1].
Figure 2.5: Problem with Arc-to-Arc matching [1].
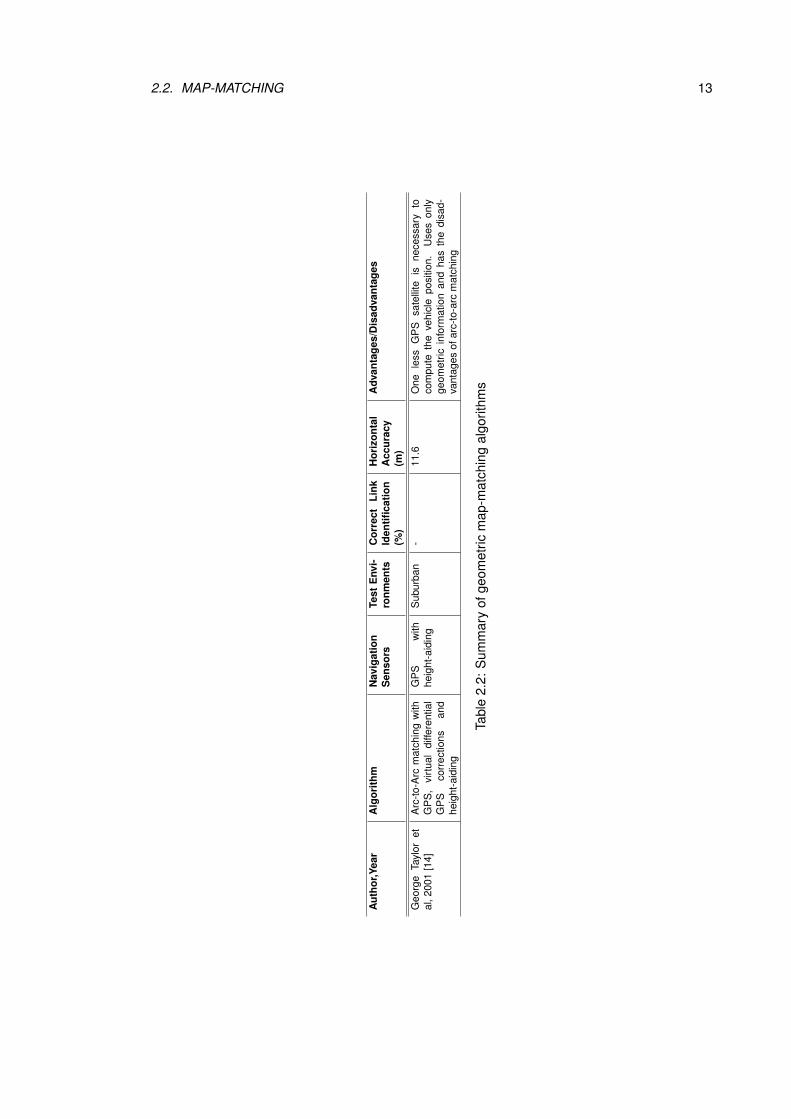
A map-matching algorithm referred to as the road reduction filter algorithm has been proposed
[14]. This method is based on Arc-to-Arc matching and uses GPS, virtual differential GPS cor-
rections and height-aiding. Height data is obtained from a Digital Elevation Model (DEM) and
reduces by one the number of satellites required to the computation os the vehicle position.

12 CHAPTER 2. RELATED WORK
Since this algorithm is based on Arc-to-Arc matching it has the disadvantages described above.
A summary of the geometric map-matching algorithms presented is represented in table 2.2.
2.2.2 Topological Map-Matching
Geometric algorithms can be improved with topological information [1] [13]. Topology refers to
the relationship between entities such as points and lines. A Topological map-matching algorithm
is an algorithm that uses the geometry and topology of the road segments. This approach could
solve for example the problem represented in Figure 2.3. If the relationship between points and
arcs is taken into account, point p1 will be matched to arc A instead of B since p0 was matched
to arc A and arc B is not connected to A.
Greenfeld proposes a weighted topological algorithm [15]. This algorithm uses only geographic
information on the observed positions of the user and is based on topological analysis: uses
the geometry, connectivity and proximity of the arcs. The algorithm is divided in two distinct
algorithms: Initial Mapping algorithm and Map algorithm. The initial mapping algorithm is used
to locate the user somewhere in the road network. Therefore, this algorithm is used for the first
point, when the distance between two points from the GPS trace exceeds a certain distance, or
when the map phase is unable to map a GPS point. In this phase the point P 0 is matched to the
closest node A0 of the road network using geometric point-to-point matching. Then the algorithm
finds all the arcs connected to node A0 and the next GPS point P 1 is matched to one of the arcs
found. The Map algorithm is applied after an initial mapping is found with the Initial Mapping
algorithm and uses topological analysis and a weighting system. For each GPS point P t the
algorithm forms a line segment from P t−1 to P t and evaluates the orientation and proximity to
the currently matched segment Ai using the following formula:
W = WO +WD +WI
Where W is the total score, WO is the weight for similarity in orientation, WD is the weight for
proximity of P t to the line segment, and WI is the weight for intersection. Depending on the value
of W the algorithm decides whether P t maps onto Ai. If P t does not map onto the segment
Ai, the algorithm selects another segment Ai−1 connected to Ai using the formula presented
above. Experiments showed that the algorithm performed a correct match along the entire tested
2.2. MAP-MATCHING 13
Aut
hor,Y
ear
Alg
orith
mN
avig
atio
nS
enso
rsTe
stE
nvi-
ronm
ents
Cor
rect
Link
Iden
tifica
tion
(%)
Hor
izon
tal
Acc
urac
y(m
)
Adv
anta
ges/
Dis
adva
ntag
es
Geo
rge
Tayl
oret
al,2
001
[14]
Arc
-to-A
rcm
atch
ing
with
GP
S,
virt
ual
diffe
rent
ial
GP
Sco
rrec
tions
and
heig
ht-a
idin
g
GP
Sw
ithhe
ight
-aid
ing
Sub
urba
n-
11.6
One
less
GP
Ssa
telli
teis
nece
ssar
yto
com
pute
the
vehi
cle
posi
tion.
Use
son
lyge
omet
ricin
form
atio
nan
dha
sth
edi
sad-
vant
ages
ofar
c-to
-arc
mat
chin
g
Tabl
e2.
2:S
umm
ary
ofge
omet
ricm
ap-m
atch
ing
algo
rithm
s

14 CHAPTER 2. RELATED WORK
route. However further research has to be done in order to verify the accuracy of the algo-
rithm. Quddus et al tested this algorithm for a relatively sparse road network and came to the
conclusion that sometimes the algorithm identifies incorrect road segments [16]. The authors
propose an improvement of the weighted topological algorithm by adding more measured infor-
mation including vehicle speed, the position of the vehicle relative to candidate links, and heading
information. Considering the heading and speed information improves the performance of the al-
gorithm especially at intersections. According to [17] this algorithm does not consider the role of
the time-interval between two consecutive GPS points.
Yin et al. propose a weighted-based map-matching algorithm based on geometric arc-to-arc
matching [17]. The algorithm finds the sequence R of road segments in the map that most re-
semble the route of the trajectory TR collected. The resemblance is measured as the sum of the
distances between TR and every arc of R and the value of each distance is the weight of each
arc. To compute the weight of each arc (road segment) it is considered that the possible route of
TR should be close to the geometry of the arc and each arc of the possible route of TR is in the
same or similar direction to that of the corresponding sub-trajectory. The smallest weight path is
the matched route of TR. According to the authors, experiments show that the algorithm can get
up to 94 % correctness depending on the GPS sampling interval. Furthermore, it is difficult to
match when the GPS sampling intervals are larger than 120 seconds.
The topological map-matching algorithms are summarized in table 2.3.
2.2.3 Probabilistic Map-Matching
In Probabilistic map-matching algorithms an elliptical or rectangular confidence region is defined
around a position obtained from a navigation sensor, such as a GPS receiver. This confidence re-
gion is defined based on the error and error models of the sensor. The confidence region is then
superimposed on the road network in order to identify the segments that are inside the region.
If more than one segment is identified several criteria may be considered in order the choose
the road segment to which the position should be matched to. Honey et al. first introduced this
technique in order to match positions collected from a DR sensor to a road map [18]. The advan-
tage of this technique is that it is not necessary to assume that the vehicle is always on a certain
road [19]. If the vehicle appears to be off the known road network, this method continues to
build the confidence region for each sensor-detected point until one of them is matched to a road
segment. This road segment is the one to which the vehicle has returned. Zhao approaches this

2.2. MAP-MATCHING 15
Aut
hor,Y
ear
Alg
orith
mN
avig
atio
nS
enso
rsTe
stE
nvi-
ronm
ents
Cor
rect
Link
Iden
tifica
tion
(%)
Hor
izon
tal
Acc
urac
y(m
)
Adv
anta
ges/
Dis
adva
ntag
es
Josh
uaS
.Gre
en-
feld
,200
2[1
5]W
eigh
ted
topo
logi
cal
al-
gorit
hm:
poin
t-to-
poin
tm
atch
ing
and
topo
logi
cal
anal
ysis
(geo
met
ry,
con-
nect
ivity
and
prox
imity
ofth
ear
cs)
GP
SU
rban
and
Sub
urba
n10
0-
Use
sto
polo
gica
linf
orm
atio
nin
stea
dof
us-
ing
just
geom
etric
info
rmat
ion.
Doe
sno
tco
nsid
erhe
adin
gor
spee
din
form
atio
n.S
omet
imes
iden
tifies
inco
rrec
tro
adse
g-m
ents
Moh
amm
edA
.Q
uddu
set
al,
2003
[16]
Wei
ghte
dto
polo
gica
lal
-go
rithm
(impr
ovem
ent
ofth
eal
gorit
hmpr
opos
edin
[15]
)
GP
S/D
RU
rban
and
Sub
urba
n88
.618
.1C
onsi
ders
mor
em
easu
rein
form
atio
n;M
ore
perfo
rman
cein
inte
rsec
tions
.It
isdi
fficu
ltto
defin
eth
ere
lativ
esi
gnifi
canc
eof
the
sim
ilarit
ycr
iteria
.D
oes
notc
onsi
der
the
role
ofth
etim
e-in
terv
albe
twee
ntw
oco
nsec
utiv
eG
PS
poin
tsH
uabe
iY
inet
al,
2004
[17]
Wei
ght-b
ased
algo
rithm
base
don
arc-
to-a
rcm
atch
ing
and
topo
logi
cal
info
rmat
ion
(dire
ctio
nof
the
traje
ctor
y)
GP
S-
94-
Con
side
rsto
polo
gica
lin
form
atio
n.U
pto
94%
corr
ectn
ess.
The
corr
ectn
ess
ofth
eal
gorit
hmde
pend
son
the
GP
Ssa
mpl
ing
in-
terv
al.D
ifficu
ltto
mat
chw
ithG
PS
sam
plin
gin
terv
als
larg
erth
an12
0se
cond
s
Tabl
e2.
3:S
umm
ary
ofto
polo
gica
lmap
-mat
chin
gal
gorit
hms

16 CHAPTER 2. RELATED WORK
technique and introduces some of the methods available to calculate the error region[19]. One
of the identified methods is to derive an error ellipse using a stochastic process [20] [21] [22]. To
identify the road segments which are inside the confidence region, the author proposes enlarging
the ellipse using an expansion factor and then turning the ellipse into a rectangle. A rectangle is
more suitable than a ellipse for locating the candidate segments. To find the segments that are
inside the region the Cyrus-Beck clipping algorithm [23] is used. The final segment is chosen
based on heading, closeness and connectivity criteria.
Ochieng et al. propose a similar probabilistic map-matching algorithm [24]. This algorithm is
divided in two phases: the initial mapping process and the subsequent matching process. The
initial mapping process creates a confidence region around the GPS point collected based on
the error of the GPS device used. Then this region is superimposed on the road network and
the road segments that are inside the region are identified. Then if there is more than one seg-
ment inside the confidence region, the segments are filtered based on historical information and
network connectivity to obtain a set of candidate segments. If more than one segment is ob-
tained the final segment is chosen taking into account its orientation and proximity to the GPS
point. After this initial process, the subsequent matching process is responsible for matching the
remaining points. This process assumes that the vehicle continues travelling in the same road
segment for a certain amount of time, therefore the subsequent GPS point are matched to the
same road segment that was identified in the initial mapping process. The subsequent process
stops when a turning maneuver or a junction crossing is detected. In this case, the initial mapping
process is restarted. This algorithm also takes into account the inaccuracy of the vehicle heading
when the speed is low which improves the correctness of the matching process at low speed, in
particular in urban areas where there are frequent stops[13]. This algorithm is faster and more
reliable than the one suggested by [19][13] since the confidence region is only constructed when
the vehicle crosses a junction or performs a turning maneuver. In the algorithm proposed in [19]
the confidence region is constructed for each sensor-collected point.
The probabilistic algorithms referred are summarized in table 2.4.
2.2.4 Advanced Map-Matching
Advanced map-matching algorithms are those that use more refined concepts such as Fuzzy
Logic [19][25][26], a Kalman Filter or an Extended Kalman Filter [27] [28] [29] [30], Dempster-
Shafer’s theory of evidence [29], particle filters [31], Multiple Hypothesis Technique [30] and an

2.2. MAP-MATCHING 17
Aut
hor,Y
ear
Alg
orith
mN
avig
atio
nS
enso
rsTe
stE
nvi-
ronm
ents
Cor
rect
Link
Iden
tifica
tion
(%)
Hor
izon
tal
Acc
urac
y(m
)
Adv
anta
ges/
Dis
adva
ntag
es
S.K
.Hon
eyet
al,
1989
[18]
Pro
babi
listic
map
-m
atch
ing
usin
gD
RD
R-
--
Itis
notn
eces
sary
toas
sum
eth
atth
eve
hi-
cle
isal
way
sin
ace
rtai
nro
adY
ilin
Zhao
,19
97[1
9]P
roba
bilis
ticm
ap-
mat
chin
gal
gorit
hmw
ithhe
adin
g,cl
osen
ess
and
conn
ectiv
ityin
form
atio
n
GP
S-
--
Itis
not
nece
ssar
yto
assu
me
that
the
ve-
hicl
eis
alw
ays
ina
cert
ain
road
.Th
eer
ror
regi
onis
calc
ulat
edfo
reve
ryG
PS
poin
t
W.
Y.O
chie
nget
al,2
004
[24]
Pro
babi
listic
map
-m
atch
ing
algo
rithm
with
hist
oric
al,
conn
ectiv
ity,
orie
ntat
ion
and
prox
imity
info
rmat
ion
GP
S/D
RU
rban
and
Sub
urba
n98
.19.
1Ta
kes
into
acco
untt
hein
accu
racy
ofth
eve
-hi
cle
head
ing
whe
nth
esp
eed
islo
w.F
aste
rsi
nce
the
erro
rre
gion
ison
lyca
lcul
ated
whe
nth
eve
hicl
ecr
osse
sju
nctio
nsor
per-
form
sa
turn
ing
man
euve
r
Tabl
e2.
4:S
umm
ary
ofpr
obab
ilist
icm
ap-m
atch
ing
algo
rithm
s
18 CHAPTER 2. RELATED WORK
Interacting Multiple Model [28].
The difficulty in the map-matching process is mainly due to the error of the positioning sensor.
This makes it difficult, especially in dense urban areas, to determine precisely the particular road
in which the vehicle is travelling. Fuzzy logic can be an effective way to deal with uncertainties
since it has the ability to generate precise output from erroneous input, and because of that it can
be applied to the map matching process. Zhao proposes a simple fuzzy-logic-based algorithm
which uses eight rules and obtains the navigation information from a DR sensor[19]. According to
the author, the rules presented are primitive and additional conditions are required (for example
special rules for GPS if a GPS receiver is used) in order to implement a more robust fuzzy-logic-
based map-matching.
Kim et al. developed a map-matching technique using GPS and DR for ITS applications which
demand very high accuracy (5-10 meters) [27]. The authors attempt to achieve this accuracy by
using digital road maps since some of them can have an accuracy of 3-10 meters. The correct
link where the vehicle is travelling is identified with geometric point-to-curve matching, and the
position of the vehicle in the link is obtained by projecting orthogonally the GPS position onto
the link identified. The GPS bias error is decomposed into a cross-track error and an along-track
error. The cross-track error is significantly reduced with the orthogonal projection. To correct
the GPS position obtained, this technique models the bias error and filters it with an extended
Kalman Filter. The main disadvantage of this technique is the determination of the link where the
vehicle is travelling since this is done with point-to-curve matching. Point-to-curve matching has
several disadvantages as mentioned earlier especially in dense urban areas. If the identification
of the link is not correct this method will return an incorrect final position. [13] suggests taking
into account the heading and speed of the vehicle and topological analysis of the road network
in order to improve the selection of the link.
Pyo et al. propose a map-matching algorithm using the Multiple Hypothesis Technique, MHT,
which is re-formulated as a single target problem (the target being the vehicle) [30]. It is as-
sumed that the true position of the vehicle is on the road except in the off-road case. An elliptical
confidence region is defined using the error of the navigation sensors (GPS/DR), and pseudo-
measurements are defined for all the links within this region. Pseudo-measurements include
position, the projected point of the GPS/DR sensor position on the links, and heading, the link
direction angle at the projection. These pseudo-measurements and the topological analysis of
the road network are used to derive a set of hypotheses and their probabilities. The off-road case

2.2. MAP-MATCHING 19
is always included as an hypotheses. In order to reduce the number of hypotheses, the ones
whose probability is lower than a certain threshold are removed. Finally, a Kalman filter is applied
to estimate the bias and improve the map-matching performance. Field experiments showed
positive results even when the GPS signal is blocked for a certain amount of time. However, this
algorithm does not have a method for initial map-matching which may affect the performance of
subsequent matching.
The authors in [31] describe a framework for positioning, navigation and target tracking problem
areas using particle filters (sequential Monte Carlo method). One of the several applications of
the method described is car positioning by map-matching. In this case, a digital road map is used
to constrain the possible positions of the vehicle and wheel speed is the main external input. The
initial position is either defined by the driver of the vehicle or obtained from a different positioning
system, such as a terrestrial wireless communication system or GPS. This initial position, which
may have errors in the order of Km’s, can be improved to a one meter accuracy using particle
filters. Also, the initial area should cover an area not extending more than a couple of kilometres
to limit the number of particles to a manageable number. This method can be combined with
GPS or used to replace GPS. Test drives were performed in order to evaluate the performance
of the algorithm against the performance of GPS. In rural areas both provide similar results but
in urban areas, especially close to high buildings and tunnels, the algorithm proposed provides
better results.
Yang et al. developed a map-matching algorithm using Kalman Filtering and Dempster-Shafer
(D-S) theory of evidence [29]. Firstly, the coordinates of the vehicle determined by a GPS sen-
sor are processed with Kalman Filtering in order to remove the majority of incorrect points. The
resulting data is the input into the map-matching algorithm proposed, which is based on D-S
theory of evidence. Using a digital map database, the distance between a GPS position and the
surrounding road segments is calculated using point-to-curve matching. Then, based on the cal-
culated distance, the reliability of each road is calculated. Their results show that the algorithm
is able to correctly identify 96% of the road segments, with a sample of 1075 GPS positions.
The main disadvantage of this algorithm is the use of geometric point-to-curve matching without
considering topological information. As mentioned before, point-to-curve matching can produce
incorrect results in dense urban areas.
Cui et al. propose a map-matching algorithm to solve the problem associated with GPS in urban
canyon environments [28]. In these environments the GPS signals are often blocked by high

20 CHAPTER 2. RELATED WORK
buildings, tunnels and trees, and there are not enough satellite signals available to estimate the
vehicle position. The algorithm proposed solves this problem by approximately modelling the
path of the vehicle as pieces of curves, such as straight lines, arcs and polynomials. The road
map is also modelled as junctions connected by piecewise continuous lines. It is assumed that in
an urban area the vehicle is always constrained to a certain road segment and by approximately
modelling the path of the vehicle as a line similar to the road, only two GPS satellites are nec-
essary to derive the position. Since the actual path may deviate from the approximate path, the
state augmentation method and the extended Kalman filtering technique are used to estimate
the parameters of the actual path and the positioning information. Finally, the interactive multiple
model (IMM) algorithm is applied to identify the correct road segment when the vehicle crosses
an intersection. The advantage of this algorithm is that it only requires two satellites to obtain the
vehicle position. However, it may be necessary to change the hardware of the GPS sensor so it
is able to work properly with only two GPS satellites.
The problem associated with urban canyon environments is also addressed in [25]. The authors
propose a map-matching algorithm based on fuzzy logic. Since fuzzy logic is tolerant to imprecise
inputs, it can be applied effectively to map match GPS positions in urban canyons. The algorithm
proposed is divided in two sub-algorithms: first fix algorithm and tracking algorithm. The first fix
sub-algorithm uses a Fuzzy Inference System (FIS) to identify the correct road segment in which
the vehicle is travelling, and its position on this road segment. This sub-algorithm uses a modi-
fied form of Sugeno-type FIS and the inputs to this FIS are the velocity, direction, orientation and
distance between the vehicle and the links, and time, which is obtained from GPS. After the first
fix sub-algorithm identifies the road segment and the position of the vehicle on it, the algorithm
goes into the tracking sub-algorithm. The tracking sub-algorithm also uses a modified version of
Sugeno-type FIS and the inputs are the same. This algorithm checks whether the subsequent
positions can be matched to the road segment identified in the first fix sub-algorithm and then
determines the position of the vehicle on it. If one position can not be matched to the same road
segment, the algorithm goes back into the first fix sub-algorithm, and so on. This algorithm takes
30 time epochs (30 s with 1 Hz data) to complete the first fix sub-algorithm. Although it is ac-
ceptable in offline matching, 30 seconds is too long for online matching (for example for en-route
guidance services) since the vehicle can travel through several intersections or change direction
within this time period. Finally, this algorithm does not take into account the error associated
with the navigation sensors when it determines the location of the vehicle on the identified road
segment

2.2. MAP-MATCHING 21
Fu et al. propose a hybrid map-matching algorithm based on fuzzy comprehensive judgement
[26]. Firstly, a confidence region is built around the vehicle position and the roads that are inside
this area and are connected to the previous matched link are the candidate road segments. If
there is only one candidate the position is matched to that road segment. If there is more than
one candidate, one of them is selected using fuzzy comprehensive judgement. The inputs to
the fuzzy inference system are the perpendicular distance between the vehicle position and the
road segment, and the angle between the vehicle trajectory direction and the road direction. This
system returns a probability for each segment and the road segment with the higher possibility
is chosen. According to the authors, because the algorithm considers the topology of the road
network, the number of candidate road segments is usually low which improves the algorithm
performance. However, this algorithm is sensitive to measurement noise and does not take into
account the inaccuracy of vehicle heading obtained from GPS at low speed.
A summary of the advance methods presented is represented in table 2.5.
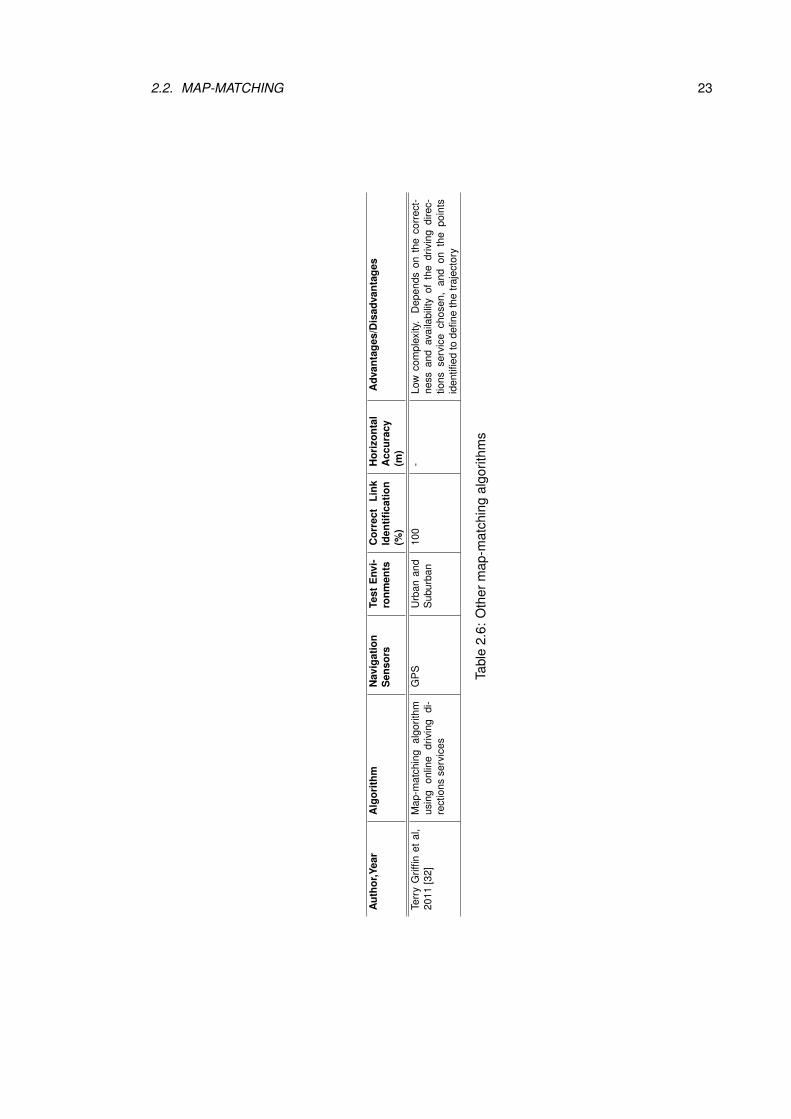
2.2.5 Other Map-Matching Algorithms
Griffin et al. propose a completely different approach to solve the map-matching problem [32].
The input of this algorithm is a GPS data set with stops and routes already identified. For each
route in the data set. the first step of the algorithm is to select a subset of points that represent
that route. Then the points identified are sent to a blackbox algorithm which will provide an initial
matched route. This route is analysed and the points that are considered to be causing errors
are removed from the initial set. This new set of points is then reintroduced in the blackbox which
calculates the final matched route. The blackbox algorithm uses online Driving Directions ser-
vices such as MapQuest® 1, Yahoo® 2, and Google® 3. The selection of points in this algorithm
is crucial to its success. If the number of points supplied to the driving directions service is too
small, the service will quite possibly return a route that does not match the actual travelled path.
On the other hand, if we supply the entire set of points the probability of obtaining an incorrect
match is greater since all the points that may cause errors will be introduced. Finally, the success
of this matching algorithm is dependent on the correctness and availability of the Driving Direc-
tion service selected.
.
1http://www.mapquest.com/directions, last accessed on January 7, 20122http://maps.yahoo.com/, last accessed on January 7, 20123http://maps.google.com/, last accessed on January 7, 2012

22 CHAPTER 2. RELATED WORK
Author,Year
Algorithm
Navigation
Sensors
TestE
nvi-ronm
entsC
orrectLink
Identification(%
)
Horizontal
Accuracy
(m)
Advantages/D
isadvantages
Yilin
Zhao,1997
[19]S
imple
map-m
atchingal-
gorithmusing
fuzzylogic
DR
--
-Fuzzy
Logicis
veryeffective
indealing
with
uncertainties.N
eedsadditionalconditions
toincrease
robustnessand
allowothernav-
igationsensors
Wuk
Kim
etal,
2000[27]
Map-m
atchingtechnique
forITS
applicationsw
hichdem
andvery
highaccuracy
GP
S/D
RS
uburban-
10.6H
orizontalaccuracyof10.6
m.
Uses
point-to-curve
matching
toidentify
thelink
Jong-Sum
Pyo
etal,2001
[30]M
ap-matching
method
usingthe
Multiple
Hypothesis
technique
GP
S/D
RU
rbanand
Suburban
88.8-
Uses
topologicalanalysisof
theroad
net-w
ork.D
oesnot
havea
method
forinitial
map-m
atchingFredrik
Gustafs-
sonet
al,2002
[31]
Map-m
atchingforvehicle
positioningusing
particlefilters
DR
Urban
andS
uburban-
-P
rovidesbetter
resultsthan
GP
Sin
forestsand
closeto
highbuildings
andtunnels.
Dakai
Yanget
al,2003
[29]M
ap-matching
algorithmw
ithK
alman
Filteringand
Dem
pster-Shafer
theoryofevidence
GP
SS
uburban96
-R
esultsshow
thatthe
algorithmcorrectly
identifies96%
oftheroad
segments.
Uses
onlypoint-to-curve
matching
which
canbe
imprecise
inurban
areasYoujing
Cui
etal,
2003[28]
Vehiclepositioning
with
GP
Sin
urbancanyon
en-vironm
ents,using
EK
F,state
augmentation
andIM
M
GP
SU
rban(com
putersim
ula-tions)
-0.436
with
more
thanone
satellite
Them
inimum
number
ofG
PS
satellitesis
reducedto
two.
May
benecessary
tochange
thehardw
areofthe
GP
Ssensor.
S.
Syed
etal,
2004[25]
Map-m
atchingalgorithm
forvehicle
navigationin
urbancanyons
usingfuzzy
logic
GP
S/D
RU
rbanand
Suburban
92.8-
Thealgorithm
dealsw
ithim
preciseinputs
fromthe
GP
Ssensor.
Does
nottake
intoaccountthe
errorassociated
with
thenavi-
gationsensors.The
firstfixalgorithm
istoo
slowforonline
matching
Mengyin
Fuet
al,2004
[26]H
ybridm
ap-matching
al-gorithm
with
fuzzycom
-prehensive
judgement
GP
S-
--
Considers
theroad
topologyw
hichim
-proves
thealgorithm
performance.
Sensi-
tiveto
measurem
entnoise.
Table2.5:
Sum
mary
ofadvancedm
ap-matching
algorithms
2.2. MAP-MATCHING 23
Aut
hor,Y
ear
Alg
orith
mN
avig
atio
nS
enso
rsTe
stE
nvi-
ronm
ents
Cor
rect
Link
Iden
tifica
tion
(%)
Hor
izon
tal
Acc
urac
y(m
)
Adv
anta
ges/
Dis
adva
ntag
es
Terr
yG
riffin
etal
,20
11[3
2]M
ap-m
atch
ing
algo
rithm
usin
gon
line
driv
ing
di-
rect
ions
serv
ices
GP
SU
rban
and
Sub
urba
n10
0-
Low
com
plex
ity.
Dep
ends
onth
eco
rrec
t-ne
ssan
dav
aila
bilit
yof
the
driv
ing
dire
c-tio
nsse
rvic
ech
osen
,an
don
the
poin
tsid
entifi
edto
defin
eth
etra
ject
ory
Tabl
e2.
6:O
ther
map
-mat
chin
gal
gorit
hms
24 CHAPTER 2. RELATED WORK
2.3 Discussion
Two different solutions to collect information on bus stops and routes, Antares[9] and EasyTracker[10],
were presented. EasyTracker is the one that is closer to the solution proposed in this report since
the routes are collected automatically from the GPS traces. However, this system does not allow
the definition of bus stop attributes since the identification of the existing bus stops is also done
automatically, by analysing the collected GPS traces. In the desired system, GBUS, each bus
stop should be collected with the mobile application and the user should be able to define all
the necessary attributes. None of this solutions provide this functionality. In this section, several
solutions were described for data collection and map-matching. The data collection solutions
presented, ATSIM and ArcPad, only allow the collection of bus stop attributes and are not in-
tended to collect bus routes. In addition, the GPS sensors available nowadays provide imprecise
information which makes it difficult to correctly match the vehicle positions collected to a digital
road map. In order to develop a system like GBUS, it is necessary to combine data collection
and map-matching to define the location and attributes of bus stops and also to correctly match
the vehicle positions obtained from GPS to a road map, in order to obtain the travelled routes. Fi-
nally, since the map-matching algorithm implemented in GBUS may sometimes produce incorrect
results, it may be necessary to correct the location of bus stops and routes manually.

Chapter 3
System Architecture
In this chapter we present the system’s requirements and high level architecture.
3.1 System Requirements
Our system, GBus, provides two different applications: a mobile application to collect routes
and bus stops, and a back-office web application to consult and edit the data collected. The
mobile application should run in a tablet in a running vehicle, and must provide the following
functionalities:
• Collect the route travelled by the vehicle
• Create route variations of previously collected routes
• Collect bus stops along the route (define its attributes and correct its position)
• Visualize bus stop locations on a map
• Visualize the current position on a map
• Send the route and bus stops collected to a central server
The functionality provided by the mobile application is represented in the use case diagram in
Figure 3.6. The use cases presented were defined in collaboration with Tecmic. The user can
collect a new route or a variation of an existing route. Each route has one or more variations
and each variation may have from one to three different directions (ascendant, descendant or
25

26 CHAPTER 3. SYSTEM ARCHITECTURE
circular). A route variation is a route that has a similar path to an existing route but with small
differences in some stretches. To collect a new route, the user must start the route in a certain
position and then add bus stops along the travelled path. The user may choose to add an already
defined bus stop or to create a new one. When creating a new bus stop, the user must define
its attributes, take its picture and correct its position on the map if necessary. When the route is
finalized, its information is sent to the server.
On the other hand, if the user intends to create a variation of an existing route, he must start by
defining to which route he wants to add the variation and in which of its variations will the new
variation be based on. Then, the user may collect new paths (or stretches) and bus stops, and
merge them with the original path.
Figure 3.6: Mobile Application use cases
The back-office application must provide an administrator with an interface that allows the vi-
sualization and modification of the data collected. This application should provide the following
functionalities:
• Visualize collected routes and its variations on a map
• Visualize bus stops on a map
• Visualize the attributes of routes, route variations and bus stops
• Edit routes, route variations and bus stops
• Merge duplicate bus stops

3.2. DESCRIPTION 27
• Visualize path stretches of a set of routes, including stretches common to two or more
routes
Figure 3.7: Monitoring Application use cases
The functionality provided by this application is represented in the use case diagram in Figure
3.7. The user is able to correct the position and attributes of a bus stop, delete a bus stop or
merge duplicates. It is also possible to modify the attributes of a certain route or route variation,
as well as its bus stops and its path. Finally, the user may visualize the collected routes and bus
stops on a map and also visualize the stretches (pieces of routes) in a certain collection of routes.
3.2 Description
GBus consists of a client side and a server side. An overview of its architecture is represented in
Figure 3.8. The client side consists in a tablet application, GBUS Mobile Application, which allows
the user to interact with the system and perform the actions described in Section 3.1. This ap-
plication accesses the GPS module and camera of the tablet device in order to obtain the actual
coordinates of the user and to take pictures of bus stops, respectively. Additionally, this applica-
tion also uses an online digital road map to provide a map with the current location of the user
and the information collected, as described in Section 3.1. Apart from the interface, this applica-
tion also provides a service that periodically saves the actual position of the user when a route is
being collected, in order to create a GPS trace. The mobile application communicates with the
28 CHAPTER 3. SYSTEM ARCHITECTURE
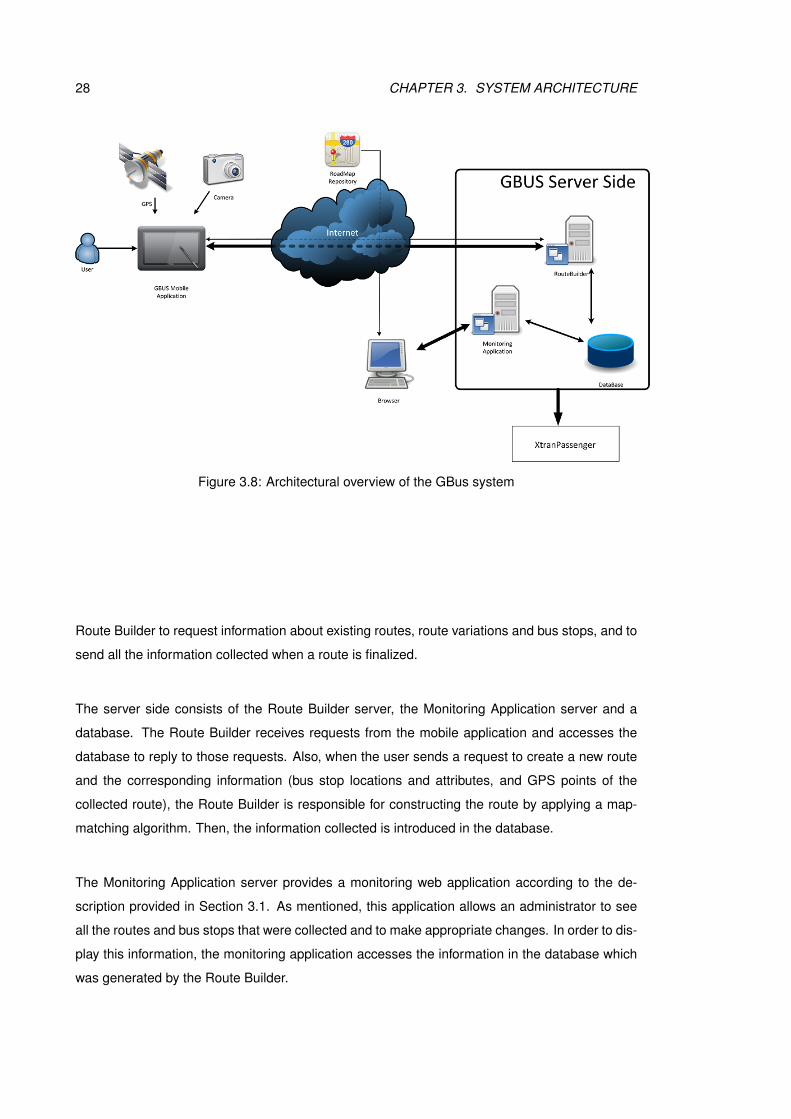
Figure 3.8: Architectural overview of the GBus system
Route Builder to request information about existing routes, route variations and bus stops, and to
send all the information collected when a route is finalized.
The server side consists of the Route Builder server, the Monitoring Application server and a
database. The Route Builder receives requests from the mobile application and accesses the
database to reply to those requests. Also, when the user sends a request to create a new route
and the corresponding information (bus stop locations and attributes, and GPS points of the
collected route), the Route Builder is responsible for constructing the route by applying a map-
matching algorithm. Then, the information collected is introduced in the database.
The Monitoring Application server provides a monitoring web application according to the de-
scription provided in Section 3.1. As mentioned, this application allows an administrator to see
all the routes and bus stops that were collected and to make appropriate changes. In order to dis-
play this information, the monitoring application accesses the information in the database which
was generated by the Route Builder.

3.2. DESCRIPTION 29
Figure 3.9: Interaction between the mobile application and the Route Builder when creating a newroute. The message identified with a letter A represents the new route data(attributes, points andbus stops) that is sent to the server.

30 CHAPTER 3. SYSTEM ARCHITECTURE
Figure 3.10: Interaction between the mobile application and the Route Builder when creating anew route variation. The list of routes and the information about each route that is sent to themobile application is represented with a letter A. The list of route variations and the informationabout each one that is sent to the mobile application is represented with a letter B. The messageswith the letters C and D represent the data (attributes, points and bus stops) corresponding tothe base variation and the new variation, respectively.

3.2. DESCRIPTION 31
Figure 3.11: Interaction between the mobile application and the Route Builder when adding abus stop to a route. The list of existing bus stops and the information about each one that is sentto the mobile application is represented with a letter A.
Figure 3.12: Interaction between the mobile application and the Route Builder when sending asaved route/route variation to the Route Builder. The message identified with a letter A representsthe saved route or route variation data(attributes, points and bus stops) that is sent to the server.

32 CHAPTER 3. SYSTEM ARCHITECTURE
3.2.1 Communication between the Mobile Application and the Route Builder
Certain actions performed by the user in the mobile application require a communication with
the Route Builder server in order to request or send information. When the user creates a new
route with a certain number, it is necessary to check if there is already a route in the server
database with the same number. The mobile application sends a request to the Route Builder
which then accesses the database and verifies if a route with the given number already exists.
If it does the Route Builder replies to the application with an error message. If it does not exist,
the Route Builder creates a new route in the database and replies with its identifier. If the user
cancels or deletes the route, the mobile application sends a request to the Route Builder with
the identifier and the Route Builder deletes the route from the server database. When the user
finalizes the route, the mobile application sends all the points and bus stops collected to the Route
Builder which then performs the map matching algorithm and saves the resulting information in
the database. This interaction is represented in Figure 3.9.
When the user creates a new route variation, the mobile application requests information about
all the existing routes in the server database. The Route Builder serves the request with the
numbers and names of all existing routes. The mobile application then presents the list of routes
sent by the server to the user. When the user chooses a route, the mobile application requests
a list of all available variations of that route. The server serves this request by sending the num-
ber, name and direction of each variation. The mobile application then provides the user with a
list of variations sent by the server and with local variations(in case there are variations of the
chosen route stored only in the device’s database). The variation chosen by the user is the base
variation to create the new one. After the user chooses the base variation, the mobile application
asks the user to introduce the number, name, direction and description of the new variation. The
application then sends a request to the Route Builder in order to verify whether a variation of
the chosen route with the same number and direction already exists. If such variation exists, the
server replies with an error message. Otherwise, it replies with an "ok" message. In this case,
if the base variation chosen by the user was not local (was stored in the server database) the
mobile application requests its complete information. The Route Builder then sends all the points
and bus stops of the variation. If the variation was local, its points and bus stops are stored in the
device’s database. The mobile application then allows the user to manipulate the base variation
in order to create the new one. When the user finalizes the route variation, the mobile application
sends all its information (number, name, description and direction), points and bus stops to the
Route Builder. This interaction is represented in Figure 3.10.

3.2. DESCRIPTION 33
When the user is collecting a new route or route variation and wants to add a bus stop, the mobile
application requests all existing bus stops close to the actual location of the user. This is done
to prevent the user from creating a bus stop that was already defined. The Route Builder replies
with a list of bus stops that satisfy this condition. The mobile application then provides the user
with this list and also with the list of local bus stops (saved only in the device’s database) that are
close to the user. Then the user my choose to add any of the existing bus stops or to create a
new one. This communication is represented in Figure 3.11.
Finally, the user may access the list of routes or route variations that are stored in the device and
not yet sent to the Route Builder. If the user sends a saved route or route variation, the mobile
application sends all its information, points and stops. This is represented in Figure 3.12.

Chapter 4
Implementation
In this chapter we detail the implementation of GBus’ components: the Mobile Application, the
Route Builder, the server database and the Monitoring Application.
4.1 Client Side - GBus Mobile Application
The mobile application was developed on the Google Android platform, version 2.3.3. We chose
Android because it is an open-source platform, supported not only by mobile phones but also
tablet devices. Android is very popular and there is a great variety of Android devices in the
market, from different manufacturers and with different prices and characteristics. Also, Android
allows the applications to take full advantage of the device’s features and provides access to the
tablet’s camera and to location services.
4.1.1 Data Layer
In order to save the Mobile Application data in the device, an SQLite database 1 was used.
Among other features, SQLite databases are fast, easy to use and have a small footprint, which
makes them ideal for mobile devices. Android provides full support to SQLite databases through
the android.database.sqlite package. A database is represented by the class
android.database.sqlite.SQLiteDatabase, and the class android.database.sqlite.SQLiteOpenHelper
was used to manage the database creation, version management and access.
1http://www.sqlite.org/, last accessed on July 28, 2012
35
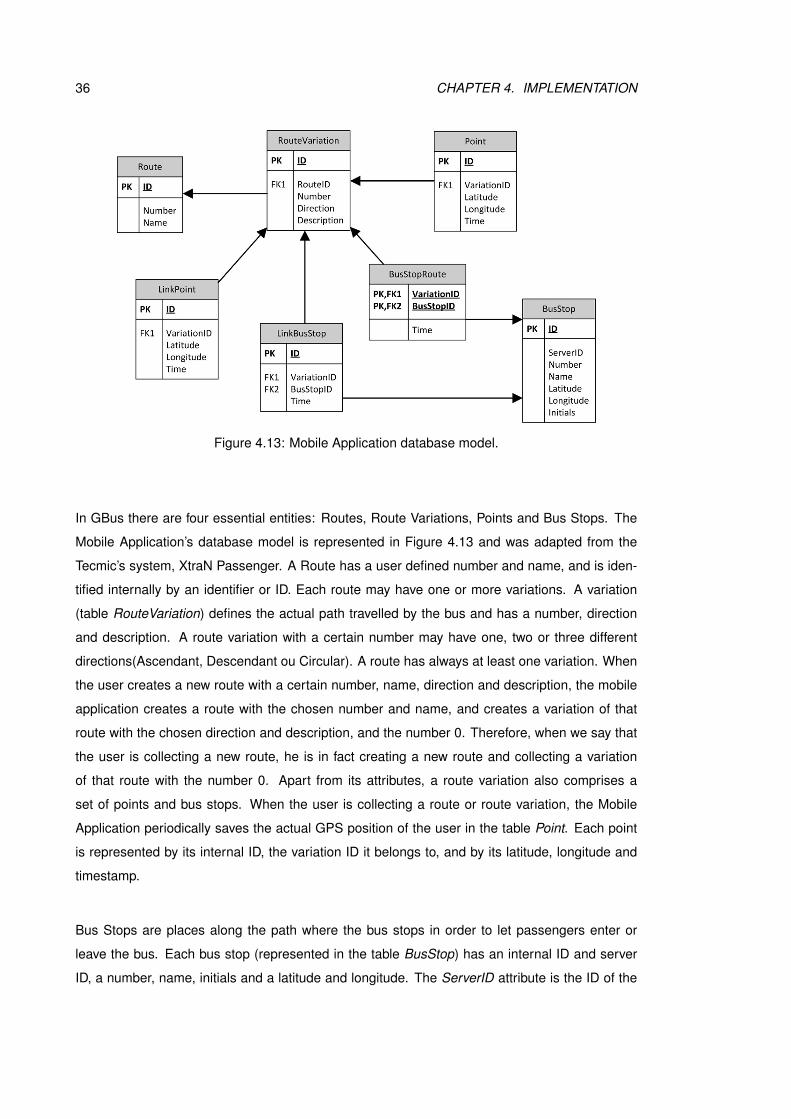
36 CHAPTER 4. IMPLEMENTATION
Figure 4.13: Mobile Application database model.
In GBus there are four essential entities: Routes, Route Variations, Points and Bus Stops. The
Mobile Application’s database model is represented in Figure 4.13 and was adapted from the
Tecmic’s system, XtraN Passenger. A Route has a user defined number and name, and is iden-
tified internally by an identifier or ID. Each route may have one or more variations. A variation
(table RouteVariation) defines the actual path travelled by the bus and has a number, direction
and description. A route variation with a certain number may have one, two or three different
directions(Ascendant, Descendant ou Circular). A route has always at least one variation. When
the user creates a new route with a certain number, name, direction and description, the mobile
application creates a route with the chosen number and name, and creates a variation of that
route with the chosen direction and description, and the number 0. Therefore, when we say that
the user is collecting a new route, he is in fact creating a new route and collecting a variation
of that route with the number 0. Apart from its attributes, a route variation also comprises a
set of points and bus stops. When the user is collecting a route or route variation, the Mobile
Application periodically saves the actual GPS position of the user in the table Point. Each point
is represented by its internal ID, the variation ID it belongs to, and by its latitude, longitude and
timestamp.
Bus Stops are places along the path where the bus stops in order to let passengers enter or
leave the bus. Each bus stop (represented in the table BusStop) has an internal ID and server
ID, a number, name, initials and a latitude and longitude. The ServerID attribute is the ID of the
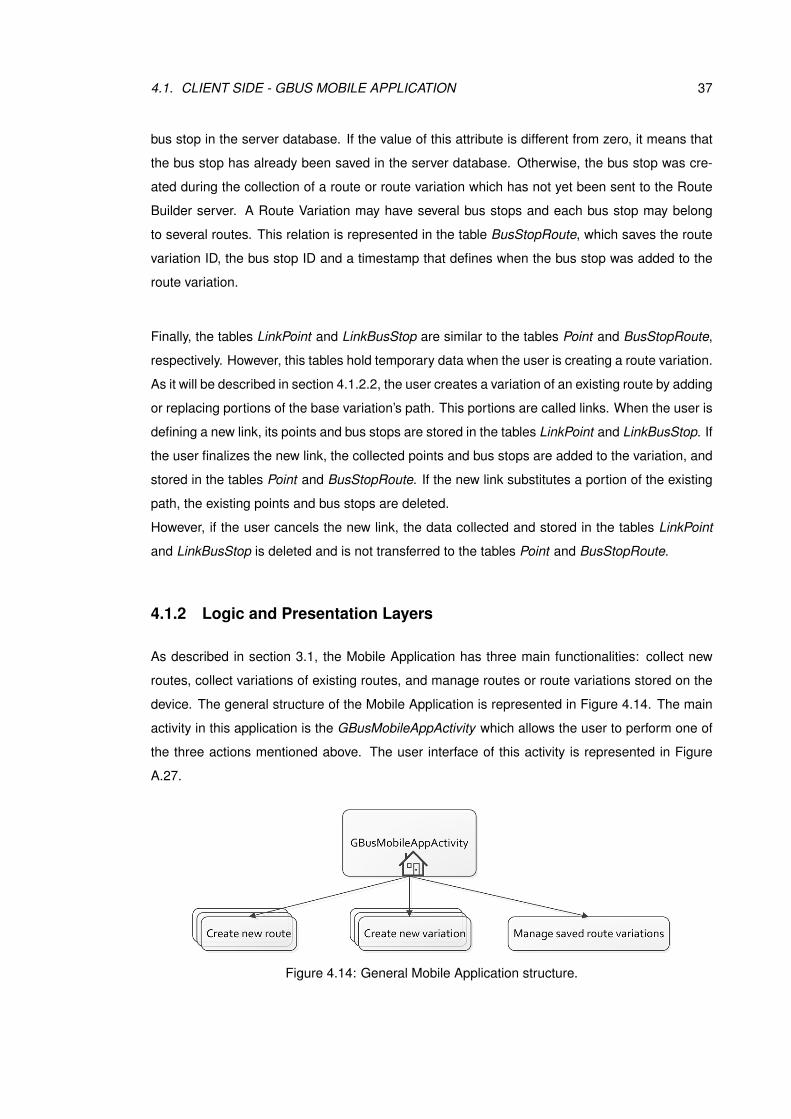
4.1. CLIENT SIDE - GBUS MOBILE APPLICATION 37
bus stop in the server database. If the value of this attribute is different from zero, it means that
the bus stop has already been saved in the server database. Otherwise, the bus stop was cre-
ated during the collection of a route or route variation which has not yet been sent to the Route
Builder server. A Route Variation may have several bus stops and each bus stop may belong
to several routes. This relation is represented in the table BusStopRoute, which saves the route
variation ID, the bus stop ID and a timestamp that defines when the bus stop was added to the
route variation.
Finally, the tables LinkPoint and LinkBusStop are similar to the tables Point and BusStopRoute,
respectively. However, this tables hold temporary data when the user is creating a route variation.
As it will be described in section 4.1.2.2, the user creates a variation of an existing route by adding
or replacing portions of the base variation’s path. This portions are called links. When the user is
defining a new link, its points and bus stops are stored in the tables LinkPoint and LinkBusStop. If
the user finalizes the new link, the collected points and bus stops are added to the variation, and
stored in the tables Point and BusStopRoute. If the new link substitutes a portion of the existing
path, the existing points and bus stops are deleted.
However, if the user cancels the new link, the data collected and stored in the tables LinkPoint
and LinkBusStop is deleted and is not transferred to the tables Point and BusStopRoute.
4.1.2 Logic and Presentation Layers
As described in section 3.1, the Mobile Application has three main functionalities: collect new
routes, collect variations of existing routes, and manage routes or route variations stored on the
device. The general structure of the Mobile Application is represented in Figure 4.14. The main
activity in this application is the GBusMobileAppActivity which allows the user to perform one of
the three actions mentioned above. The user interface of this activity is represented in Figure
A.27.
Figure 4.14: General Mobile Application structure.

38 CHAPTER 4. IMPLEMENTATION
4.1.2.1 Route creation
The application diagram concerning the creation of a new route is represented in Figure 4.15.
When the user chooses to create a new route, the NewRouteActivity is created. This activity’s
user interface is represented in Figure A.28a. The user is asked to introduce the new route’s
number, name, direction and description. Additionally, the user must enter a value in millisec-
onds that defines the desired time interval between GPS samples (points collected along the
new route).
After the information is introduced, the activity runs the asynchronous task (AsyncTask) Check-
RouteNumberTask which connects to the server to verify whether the route number introduced
is available. This interaction was described in section 3.2.1 (Figure 3.9). The task then sends
the result back to the activity. If the server replies with an error, the application asks the user
to introduce a different number. Otherwise, a new route and a new route variation (with number
zero) are created in the database. The Figure 4.16 shows and example of the database after
the creation of a route. The user introduced "23", "23-Rossio/Saldanha", "ASC" and "Rota 23
rossio/Saldanha" as the new route’s number, name, Direction and description, respectively. The
application created a route in the database (table Route) with the number and name introduced
by the user. Additionally, a route variation of the same route was created with the number 0, and
the direction and description introduced. This variation represents the new path that is about to
be collected.
Then, the MapActivity is created, which is represented in Figure A.28b. This activity provides
the user with a map which shows his current position and the route variation’s bus stops. To de-
termine and update the user’s location the android location framework, available in the package
android.location, was used. The main component of this framework is the LocationManager sys-
tem service which provides an Application Programming Interface (API) to determine the tablet’s
location. To update the tablet’s position, and consequently the user’s position, the MapActiv-
ity registers for periodic updates from the GPS provider. In order to displays and manage the
map, Google Maps provides an external library1. This library is available through the package
com.google.android.maps.
The MapActivity also starts the TrackService. This service runs in the background and saves
the GPS positions, corresponding to the actual location of the user, received from the location
service in the table Point. The interval between points is the interval defined by the user in the
NewRouteActivity (see image A.28a). An example of the database after the insertion of several
GPS points by the TrackService is represented in Figure 4.17.
1https://developers.google.com/maps/documentation/android/, last accessed on July 23, 2012

4.1. CLIENT SIDE - GBUS MOBILE APPLICATION 39
Figure 4.15: Creation of a new route.
Figure 4.16: Database after the creation of a new route.
Figure 4.17: Database after the insertion of route variation points.

40 CHAPTER 4. IMPLEMENTATION
The MapActivity provides the user with three different options: pause/resume the route col-
lection, add a bus stop, finalize and cancel the actual route. When the user pauses the route
collection, the activity stops the TrackService and the GPS positions of the user are no longer
stored in the database. To restart the service, the user may resume the route collection.
If the user chooses to cancel the route, the thread CancelRouteThread sends a request to the
server which deletes the route from the server database.
When the user adds a bus stop to the route, the activity AddBusStopActivity is created. This
activity starts by running the asynchronous task GetLocalStopsTask which requests all bus
stops that are close to the actual location of the user, from the server and from the mobile ap-
plication’s database. These bus stops are then presented to the user. An examples of the user
interface is represented in Figure A.29a. The user may choose to add one of the listed bus
stops to the route or to create a new one. If the user chooses to create a new bus stop, the
activity CreateNewBusStopActivity is created and the user is asked to introduce the new bus
stop’s number, name and initials. An example of this activity’s screen is in Figure A.29b. Then,
the activity AdjustBusStopPositionActivity is created which allows the user to adjust the po-
sition of the new bus stop on the map (see Figure A.29c). This activity also uses the package
com.google.android.maps to display and manage the map. This step guarantees that the posi-
tion of the each bus stop is always correct despite the possible imprecision of the user’s location,
obtained from the GPS.
After the user corrects the new bus stop’s position, the user may take a picture of the bus stop
(TakeBusPhotoActivity). The Android framework supports capturing images through the cam-
era Intent. A camera intent makes a request to capture a picture through an existing camera
application. Then the camera application’s user interface appears on the tablet device’s screen
and the user can take a picture. When the user finishes taking the picture or cancels the oper-
ation, the system returns the control back to the mobile application, which receives the picture
Figure 4.18: Database after the insertion of a new bus stop.

4.1. CLIENT SIDE - GBUS MOBILE APPLICATION 41
taken (see Figure A.29d). In image 4.18 is an example of the database after the insertion of a
new bus stop during the collection of a new route.
Finally, when the user finalizes the route, the asynchronous task SendNewRouteTask sends
all the data collected (the route attributes, points and bus stops) to the Route Builder server.
If the data is successfully received at the server, the Mobile Application deletes the data from
its database. Otherwise, it remains stored in the database and can be sent later (described in
section 4.1.2.3). Then, the MapActivity is terminated and the main activity (GBusMobileAp-
pActivity) comes into the foreground.
4.1.2.2 Route variation creation
Instead of creating a new route, the user may choose to create a variation of an existing route.
The corresponding application diagram is represented in Figure 4.19. As described in section
3.2.1, when the user creates a variation of an existing route, he must choose in which existing
variation of the intended route he wants to base the new variation.
The main activity creates the AddVariationActivity, which in turn runs the asynchronous task
GetRoutesTask. This task is responsible for requesting information about all existing routes at
the server. Then, the list of routes is returned to the AddVariationActivity which presents it
to the user (see Figure A.30a). When the user chooses one of the listed routes, the activity
ChooseVariationActivity is created. This activity runs the asynchronous task GetRouteVari-
ationsTask which connects to the Route Builder server in order to collect all the variations of
the chosen route. Additionally, the task accesses the application’s database to collect variations
of the chosen route that may be stored locally. All the collected variations are sent back to the
ChooseVariationActitivity which presents them to the user. An example of this user interface
is in Figure A.30b. The user then chooses one of the variations, which will be the base variation
to create the new one, and the activity NewVariationActivity is created.
This activity asks the user to introduce the new variation’s number, name and direction. The user
may also introduce a description. An example of this activity’s user interface is represented in
Figure A.30c. Each route should not have two variations with the same number and direction.
When the user introduces the requested information, the activity runs the asynchronous task
CheckVariationNumberTask which verifies that there is neither in the server database nor in
the local database, a variation of the same route with the chosen number and direction. If there
is already a variation with the same number and direction, the NewVariationActivity asks the
user to introduce a different combination. When the user introduces an available combination
the new variation is introduced in the application database. Also, the points and bus stops of

42 CHAPTER 4. IMPLEMENTATION
Figure 4.19: Creation of a new route variation.
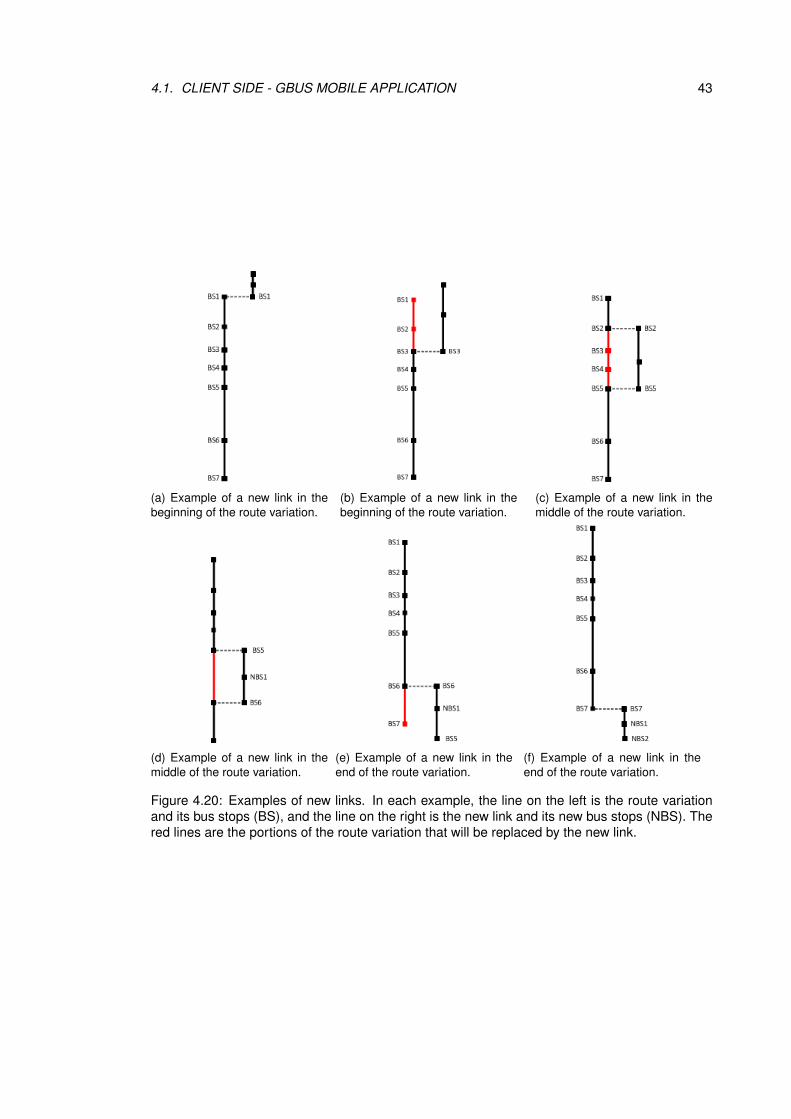
4.1. CLIENT SIDE - GBUS MOBILE APPLICATION 43
(a) Example of a new link in thebeginning of the route variation.
(b) Example of a new link in thebeginning of the route variation.
(c) Example of a new link in themiddle of the route variation.
(d) Example of a new link in themiddle of the route variation.
(e) Example of a new link in theend of the route variation.
(f) Example of a new link in theend of the route variation.
Figure 4.20: Examples of new links. In each example, the line on the left is the route variationand its bus stops (BS), and the line on the right is the new link and its new bus stops (NBS). Thered lines are the portions of the route variation that will be replaced by the new link.
44 CHAPTER 4. IMPLEMENTATION
the base route variation are copied to the new route variation. Then, the activity ListVariation-
BusStopActivity, whose user interface is exemplified in Figure A.30d, is created.
This activity shows the new variation’s bus stops, in the same order in which they appear in the
path(ordered by their timestamps). At this point, the new variation path is equal to the base vari-
ation chosen.
The user is able to reverse the order of bus stops and to add new portions of path or links to
the variation. When the user reverses the order of bus stops (by pressing "Reverse Direction"),
the application reverses the timestamps of bus stops and points, while maintaining the time dif-
ference between consecutive points and bus stops. An example of the list of bus stops after
reversing the direction is represented in Figure A.31a.
When the user wants to create a new link he must define where the link is going to start: at the
current location of the user or a variation bus stop. In image 4.20 are several examples of new
links that may be added to the base variation. The new links represented in the examples 4.20a
and 4.20b start at the current location of the user. The new links in the examples 4.20c, 4.20d,
4.20e and 4.20f start at an existing bus stop of the route variation.
After the beginning of the link is defined, the activity LinkMapActivity is created, which in turn
starts the service TrackService. This service, as described in section 4.1.2.1, runs in the back-
ground and saves the actual location of the user. However, in this case, these locations are stored
in the table LinkPoint instead of the table Point.
The LinkMapActivity is similar to the MapActivity described in section 4.1.2.1 and its user
interface is in Figure A.31b. The activity displays a map on a screen which shows the actual
location of the user and the new link’s bus stops, using the same libraries as the MapActivity.
Additionally, the user is able to pause or resume the collection of the link, add a bus stop and
finalize or cancel the link. As in the MapActivity, when the user pauses the collection of the new
link, the LinkMapActivity stops the TrackService. To restart the service, the user must resume
the collection.
The addition of a bus stop is exactly as described in section 4.1.2.1, the only different being that
the bus stops are stored in the table LinkBusStop.
When the user finalizes the new link he must define in which bus stop the link terminates. The
user is able to choose one of the route variation’s bus stops or the last bus stop of the new link
as the final bus stop of the link (see Figure A.31c). If the user chooses to define one of the route
variation’s bus stops as the final stop, the activity AddFinalBusStopActivity is created. This
activity presents the user with the list of bus stops that come after the link’s first bus stop (see
Figure A.31d). After the user chooses the last bus stop of the link, the application deletes all the
route variation’s points and bus stops between the new link’s first and last bus stops. Then the
new link’s points and bus stops are transferred from the tables LinkPoint and LinkBusStop to the
4.2. CLIENT-SERVER COMMUNICATION 45
tables Point and BusStopRoute, respectively. An example of this interaction is represented in
Figure 4.20. The new link in the example 4.20c started in one of the variation’s bus stops, BS2.
In this example, the user finalizes the link and chooses to define one of the variation’s bus stops
as the link’s final stop. The activity AddFinalBusStopActivity presents the user with the list of
all the variation’s bus stops after BS2, that is, BS3-8. The user then chooses BS5 as the final
bus stop and all points and bus stops between BS2 and BS5 are replaced by the new link. In the
link in the example 4.20e, instead of choosing a variation’s bus stop as the final link’s bus stop,
the user chose to terminate the link in its last bus stop, NBS2. When the link is finalized in this
conditions, all bus stops and points after the first link’s bus stop are deleted from the variation and
replaced by the links points and bus stops. In this example there are no bus stops or points after
BS8 (the first bus stop of the link), so nothing is deleted from the original variation. However, in
the example 4.20f, all bus stops and points after BS7 are deleted from the variation.
Finally, the ListVariationBusStopActivity comes into the foreground with the updated list of the
route variation’s bus stops. In this activity, the user may cancel or finalize the route variation.
If the user cancels the route variation, all its information is deleted from the database. If the
user finalizes the route variation, the activity starts the asynchronous task SendNewRouteTask
which sends the new variation’s attributes, bus stops and points to the Route Builder server. If the
server receives the data successfully, the data is deleted from the mobile application’s database.
Otherwise, it remains stored in the database and can be sent later (described in section 4.1.2.3).
4.1.2.3 Stored data management
As mentioned before, the user may choose to manage route variations stored on the device’s
database. The corresponding diagram is represented in Figure 4.21. The activity ListStore-
dRoutesActivity provides the list of stored route variations to the user. This activity’s user inter-
face is represented in Figure A.32a. The user may choose to delete or send each route variation
to the Route Builder server (see Figure A.32b). If the user chooses to send the route variation to
the server, the activity runs the asynchronous task SendNewRouteTask which sends the route
variation’s attributes, points and stops. If the Route Builder receives the data successfully, the
activity deletes the route variation from the device’s database (see Figure A.32c).
4.2 Client-Server Communication
The Mobile Application communicates with the Route Builder using REST web services, and
the JavaScript Object Notation (JSON) and GPS eXchange Format (GPX) formats to exchange

46 CHAPTER 4. IMPLEMENTATION
Figure 4.21: Management of saved route variations.
data. In section 3.2.1 we described the interaction between the Mobile Application and the Route
Builder. The Route Builder provides several web services that the mobile application invokes
in order to send and to obtain information about routes, route variations and bus stops. The
technologies adopted to transfer data between the two entities, JSON and GPX, are described
below.
4.2.1 JSON - JavaScript Object Notation
As described in the section 3.2.1, when the user creates a new variation of an existing route, the
mobile application requests the Route Builder server the list of existing routes and then the list of
variations of the chosen route. The data sent by the server is represented in Figure 3.10 with the
letters A and B. The technology chosen to exchange this data between the server and the mobile
application was JSON1. JSON is a lightweight data-interchange text format that is language
independent but uses conventions similar to most common languages. Because of this, almost
all modern programming languages support the JSON structure, including Android and ASP.net
MVC, the languages used in the mobile application and the Route Builder, respectively. Examples
of the JSON data exchanged are represented in Figure 4.22.
4.2.2 GPX - GPS eXchange Format
Apart from the information mentioned above, it is also necessary to exchange route variation data
between the mobile application and the Route Builder server. When the user finalizes a route
or a route variation, or sends a stored route variation, the mobile application needs to send the
1http://www.json.org/, last accessed on July 23, 2012

4.2. CLIENT-SERVER COMMUNICATION 47
(a) JSON representation of a listof routes.
(b) JSON representation of a listof route variations.
(c) JSON representation of a listof bus stops.
Figure 4.22: Examples of JSON data sent from the Route Builder to the mobile application.

48 CHAPTER 4. IMPLEMENTATION
route variation attributes, collected points and bus stops (messages A in Figure 3.9, D in Figure
3.10 and A in Figure 3.12)). Additionally, when the user chooses to collect a new route variation,
the mobile application requests all the information (attributes, points and bus stops) about the
base variation, from the Route Builder server (message C in Figure 3.10). In order to tranfer this
type of data between the mobile application and the Route Builder, GPX1 was adopted. GPX
is a lightweight XML data format used to interchange GPS data between applications. Since
GPX is based on XML, it is an open format and can be used without the need to pay license
fees. Additionally, it is easy to understand and to extend, and it can be read by most common
programs. Finally, GPX is a well documented format, which can be transformed into other file
formats, and is recognised by most geographic software. Adopting this format to transfer data in
GBus makes it possible in the future to accept data in the Route Builder from other sources or to
transfer data from the mobile application to others applications or services. Also, besides being
stored in the server database, the data collected is also stored in GPX files at the server, which
makes it possible to open or manipulate the data in other applications that recognise the format.
The GPX format has three main different types of data: waypoints ("wpt"), routes ("rte") and
tracks ("trk"). Waypoints represent points of interest or named features on a map. Tracks and
routes represent and ordered collection of points. Tracks record where a person has been and
each point in a track may have a timestamp. Routes are suggestions of paths that the user may
follow in the future. Routes consist in an ordered list of waypoints representing a series of turn
points leading to a destination and points of a particular interest. Points in a route are unlikely to
have timestamps since they represent paths that are to be travelled in the future.
An example of a GPX file in GBus is represented in Appendix C. Waypoints are used to represent
bus stops and the gpx attributes "lat", "lon", "time" and "name" of each waypoint represent the
latitude, longitude, timestamp and name of each bus stop, respectively. Since the gpx format
allows extensions to the waypoint definition, the tags "id", "number", "initials" and "photodata"
were added to send the bus stop’s identifier (or ID), number, initials and photograph, respectively.
The collected route or route variation is represented as a track, since it describes the path that the
vehicle travelled. The track’s attributes "name" and "desc" are used to send the route’s name and
the variation’s description. The tags "routeid", "routenumber", "variationnumber" and "direction"
were added as extensions to the "trk" definition to send the route’s identifier (or ID) and number,
and the variation’s number and direction, respectively.
1http://www.topografix.com/gpx.asp, last accessed on July 23, 2012

4.3. SERVER SIDE 49
4.3 Server Side
4.3.1 Technologies and Tools
Tecmic’s ITS, XtraN Passenger, is implemented in ASP.NET MVC1. The system’s data is stored
in a Microsoft SQL Server database2. To access and manipulate the data in the database, the
application uses NHibernate3. These technologies were also adopted in the implementation
of the Route Builder, the Monitoring Application and the server database. Adopting the same
technologies facilitates the integration of the new system, Route Builder, with the existing Tecmic’s
systems.
4.3.2 Server Database - Data Model
As mentioned above, the server database is a Microsoft SQL Server database. The data model
of the GBus server database is represented in Figure 4.23 and it is very similar to the mobile ap-
plication’s database. One of the differences between both databases is that the server database
does not have the tables LinkPoint and LinkBusStop, since this database does not hold tempo-
rary data.
Another difference is in the table BusStop. In the server database, the BusStop table does not
have the ServerID attribute. The ServerID attribute in the mobile application database corre-
sponds to the attribute ID in the server database. The table BusStop has two additional at-
tributes: Abbreviation and PhotoData. The Abbreviation consists in the first ten letters of the bus
stop Name attribute, while the PhotoData attribute is the bus stop’s photograph, which is stored
as a string of bytes.
Finally, the server database has three additional tables, PathStretch, PathStretchBusStop and
PathStretchVariation, to save information about stretches. A stretch is a sequence of bus stops
in a route’s or route variation’s path, and therefore, a route or route variation may be defined as a
sequence of stretches. A stretch may be common to several paths or appear in only one path. As
mentioned in section 3.1, the monitoring application calculates the stretches that are common to
several paths and then present them to the user, together with the stretches that appear in only
one path. Each stretch has an internal ID and a name, which are stored in table PathStretch.
Each stretch consists of a set of bus stops in a certain order, which is represented in table Path-
StretchBusStop. Finally, each route variation may have one or more stretches, which is stored in
table PathStretchVariation.1http://www.asp.net/mvc, last accessed on August, 20122http://www.microsoft.com/sqlserver/en/us/default.aspx, last accessed on August, 20123http://nhforge.org/Default.aspx, last accessed on August, 2012

50 CHAPTER 4. IMPLEMENTATION
Figure 4.23: GBus Server Database model.
4.3.3 Route Builder Server
The architecture of the Route Builder server is represented in Figure 4.24. As it was mentioned
before, the Route Builder is implemented in ASP.NET MVC. However, this server only has con-
trollers and models since it does not provide an user interface.
The Route Builder application accesses the database using NHibernate. The main components
in NHibernate are the interfaces ISession, ISessionFactory, ITransaction, IQuery and ICrite-
ria.
The ISession is the primary interface used by the application and consists in a short-lived object
which represents a conversation between the application and the database. It provides methods
for finding, saving, updating and deleting database objects. ISession instances are obtained
from an ISessionFactory.
Persistent objects contain a persistent state and are associated with exactly one ISession.
Transient objects are instances of persistent classes, which were instantiated by the applica-
tion and are not yet associated with an ISession. These instances are not yet persisted in the
database, that is, they do not have a primary key value.
The ITransaction interface abstracts the application code from the underlying transaction imple-
mentation. ITransactions are used by the application to specify atomic units of work and are
created through an ISession.
Finally, the IQuery interface allows the application to perform and control the execution of queries

4.3. SERVER SIDE 51
Figure 4.24: Route Builder architecture.

52 CHAPTER 4. IMPLEMENTATION
against the database. This queries are written in the Microsoft SQL Server 2008 dialect. The ICri-
teria interface is similar to the IQuery, and allows the application to create and execute object-
oriented queries.
The application consists of the models, the HomeController, the Map-Matcher, the GPXLoader
and the GPXWriter.
The BusStopModel , RouteModel and RoutevariationModel, represent the entities Bus Stop,
Route and Route Variation, respectively.
As explained in sections 3.2.1 and 4.1.2, the Mobile Application sends and requests information
from the Route Builder. The methods available are represented in Figure 4.24.
The GPXLoader reads GPX files sent by the mobile application and generates the correspond-
ing model objects, recognised by the application (routes, route variations and bus stops). The
GPXWriter creates GPX files with route variation data, to send to the mobile application.
The last main module in the Route Builder is the Map-Matcher with performs a map-matching
algorithm when the Route Builder receives a new route or route variation from the mobile appli-
cation. This algorithm is detailed in the following section.
4.3.3.1 Map-Matching Algorithm
As mentioned in section 2.2, the GPS sensors may provide imprecise locations in urban areas,
forests and other areas where the GPS signals may be blocked. Because of this, the paths col-
lected with the mobile application may have erroneous points that have to be mapped on the road
network. This process is called map-matching and several different techniques were described
in section 2.2. In GBus, when the Route Builder receives new routes or route variations from
the mobile application, it applies a map-matching algorithm. The algorithms presented were opti-
mized for online map-matching, that is, each GPS point is matched as soon as it is collected. This
algorithms require a great performance and correctness, since they are intended to provide the
user with its location at any time. In GBus, the Route Builder performs an offline map-matching,
that is, the GPS points are matched after the route is terminated and all points collected. There-
fore, in terms of performance and correctness, all the algorithms presented can be used in GBus.
Most algorithms presented required not only GPS locations but also information from DR sensors.
In the GBUS mobile application, the only available information is the user’s location obtained from
the GPS provider. The map matching algorithm chosen was a topological algorithm proposed by
Greenfeld[15] and described in section 2.2. We chose this algorithm because of its simplicity,

4.3. SERVER SIDE 53
correctness, and because it only requires GPS data.
This algorithm consists in two distinct algorithms: Initial Mapping algorithm and Map algorithm.
The input to this algorithm is the list of GPS points and bus stops along the path, in chronological
order. The output is a new set of GPS locations describing the path and without errors. When a
bus stop is collected in the Mobile Application, the user may correct its location on the map. So,
the locations of all bus stops are always correct and don’t need to be changed. The collected bus
stops are introduced in the algorithm to improve its correctness. This particularity is described
below.
Initial Mapping Algorithm This algorithm is used to locate the user somewhere in the road
network and is used in three different situations: for the first GPS point; when the time difference
between two points exceeds a certain value; and when the Map algorithm is unable to match a
certain point. The algorithm proposed uses geometric point-to-point matching to match the first
point, P 0 to the closest node A0 of the road network. Then the algorithm finds all arcs connected
to A0 and the next point P 1 is matched to one of these arcs. To determine to which arc P 1 should
be matched, the algorithm forms a line segment from P 0 to P 1 and evaluates its orientation and
proximity to each arc connected to A0, using the following formula:
W = WO +WD
Where W is the total score, WO is the weight for similarity in orientation, and WD is the weight
for proximity of P 1 to the line segment. The arc with the highest total score is the arc chosen
to match A1. In the algorithm proposed in [15] another parameter was considered to calculate
the total score of each arc. This parameter was the weight for intersection, WI , which was only
considered if the candidate arc intersected the arc between P 0 and P 1. We found that it was
difficult to relate WI with the other weights, since it was not always considered. Because of this,
and since the implemented algorithm produced good results considering only WO and WD, we
decided not to consider WI to calculate the total score.
Another difference between the algorithm proposed and the algorithm implemented has to do
with the fact that the location of bus stops in GBus is always correct. When P 0 is the location
of a bus stop, the Initial Mapping algorithm performs a point-to-arc matching to find the closest
road segment to P 0. Since P 0 is the location of a bus stop, it is correct and the closest road is
definitely the correct match. After the algorithm finds the closest road segment to P 0, the Map
algorithm is started. Since a typical route always begins at a bus stop, the correctness of this
algorithm is highly improved with the inclusion of bus stops, since it guarantees that the first point

54 CHAPTER 4. IMPLEMENTATION
of the route is matched to the correct road segment. If the first point is matched to the wrong road
segment, the map algorithm may continue to match the subsequent points to the same segment
which results in an incorrect path.
Map Algorithm The Map algorithm runs after the Initial Mapping algorithm, and is used to
match the subsequent GPS points. For each GPS point P t, the algorithm forms a line segment
from P t−1 to P t and evaluates its orientation and proximity to the currently matched segment Ai.
This is done by using the same formula as the Initial Mapping Algorithm. Depending on the value
of W, the algorithm decides whether P t maps onto Ai. If P t does not map onto the segment Ai
(the value of W is not high enough), the algorithm selects another segment Ai−1 connected to
Ai, using the same formula. If none of the remaining segments has a total weight high enough,
the Initial Mapping algorithm is run.
As in the Initial Map algorithm, when P t is a bus stop, a point-to-arc matching is performed to find
the closest road segment, Ai+1. P t will then be matched to this segment. This process allows
the algorithm to determine if the last matched segment Ai was correct. This is done by verifying
if Ai is connected to the new road segment Ai+1 (in case the two segments are different from
each other.) If the segments are not connected, it was impossible for the user to have travelled
from Ai to Ai+1, which means that Ai was not the correct match.
In both algorithms, Initial Mapping and Map, when a GPS point is matched to a certain road seg-
ment it is matched to the road’s closest point to the GPS point. When the map-matching algorithm
terminates, the new route or route variation’s attributes, bus stops, and matched points are stored
in the server database. Additionally, a GPX file with the same information is also stored in the
server. The format of this GPX file is the one presented in section 4.2.2.
To implement a map-matching algorithm it is necessary to have access to road shape data. Un-
fortunately, although there are some road data providers on the market, it is very difficult to obtain
free access to this type of information. After a long research we came across OpenStreetMap1.
OpenStreetMap is an editable map of the whole world and is released with an open content li-
cense, which allows free access to map images and all underlying map data. It is possible to
download data from small areas or to download the entire data set (corresponding to the entire
world). The downloaded data comes in the form of XML formatted .osm files, which are easy to
understand and manipulate. These XML files contain information about several types of features
on the map. One of these types of features is the highway feature. Highways represent roads
were vehicles travel. Each highway has several attributes, such as, the name of the road, and is
1http://www.openstreetmap.org/, last accessed on August 5, 2012

4.3. SERVER SIDE 55
represented by a set of ordered nodes (GPS points) defining the road shape. This information is
used in our map-matching algorithm.
The main disadvantage is that the user may require a bigger area than the maximum area the
user is allowed to download. For example, OpenStreetMap does not allow the download of the
entire district of Lisbon. On the other hand, to process the data file corresponding to the whole
world may require a lot of time and computation power, which would be wasted if we only required
a district, region or even a country. To solve this problem it would be necessary to merge several
small areas, which could take some time and effort. To test our map-matching algorithm, we
narrowed our scope to a small area.
Finally, both algorithms, Initial Mapping and Map, required geometrical calculations to determine
the distance between two roads, the distance of a certain point to a road, the angle between
two roads, etc.. These calculations required that the positions received from the GPS sensor
and the locations of the road shape data were converted from the Geographic coordinate system
(latitude and longitude) to the Cartesian coordinate system (X,Y,Z). The geometrical calculations
and translations became the biggest challenge during the implementation of the map matching
algorithm, and required a lot of researching and testing.
4.3.4 GBus Monitoring Application
As mentioned in section 4.3.1, the Monitoring Application is implemented in ASP.NET MVC and
NHibernate, to access the database. This application allows the user to visualize and edit all
collected routes, route variations and bus stops. The architecture of the Monitoring Application is
represented in Figure 4.25.
In order to provide the functionalities described in section 3, this application must be able to dis-
play the collected paths and bus stops on a map. Tecmic developed an API to design paths and
points on a map, which in turn uses the OpenLayers API1.
The main application consists of a set of controllers, models and views. The controllers perform
all the logic of the application. The views are returned by the controllers and provide a user inter-
face. Finally, the models provide dynamic information to the views, about routes, route variations,
and bus stops. Additionally, the application has another class, Geometry, which provides geo-
metric algorithms to support the controllers.
When the user accesses the Monitoring Application, the Home Controller provides the Index
1http://openlayers.org/, last accessed on August, 2012

56 CHAPTER 4. IMPLEMENTATION
Figure 4.25: Monitoring Application architecture.

4.3. SERVER SIDE 57
view which renders the application’s home page (represented in Figure B.33). This page displays
the list of routes and their variations (on the right side of the page) and a map with all variation
paths and all existing bus stops. Bus stops are represented with a green icon, whereas the paths
are represented by a set of linked points (red markers). By clicking on one of the routes, the
Route Controller displays the Edit view, which renders a new page allowing the user to edit
the route. An example is represented in Figure B.35. This page displays the attributes of the
route (number and name) and allows the user to change these attributes or to delete the route.
Additionally, the page lists the route’s variations which may be deleted.
When the user clicks on a bus stop displayed on the map, its number and name are displayed.
The user may also choose to edit the bus stop by clicking "Edit Bus Stop" (see image B.34). If the
user chooses to edit the bus stop, the BusStop Controller provides the Edit view. An example
of this page is represented in Figure B.40. The user is able to change the bus stop’s attributes
(number, name and initials), its photograph or its location. Additionally, the user may delete the
bus stop.
In the home page, the user may click on one of the variations and the RouteVariation Controller
provides the Edit view. This page allows the edition of the route variation attributes, path and bus
stops. An example of this page is represented in Figure B.36. On the left side of the page, the
user is able to change the attributes number, description and direction of the route variation. On
the right side there is a list of existing bus stops that do not belong to the variation. The user is
able to add any of these stops to the route variation. Finally, in the middle of the page there is a
map with the variation’s bus stops and points. The points are represented with a red marker and
connected to display the variation’s path.
By clicking on one of the bus stops, the user may delete it from the current variation, or edit it (see
image B.37). Additionally, the user may add new points to the current path, change the location
of existing points or delete points. To add a new point to the path, the user must press the "Insert
Point" button and then click on the location of the map where the new point should be placed
(see image B.38). To change the location of a path point, the user must activate the drag feature
by clicking on the "Activate Point Drag" button. Then, the user may drag the points to the desired
location. Finally, to delete an existing point, the user must click on the point to be deleted and
select "Delete Point" (see image B.39).
In the upper right corner of every page, the link "bus stops" requests the ListStops page from
the BusStop Controller. This page is represented in Figure B.41. This page displays a list with
all existing bus stops and its locations on a map. By clicking on a bus stop on a map, the user
may edit the bus stop or see its details. Also, by clicking on a bus stop of the list (on the right side
of the page), the user is also redirected to the edit page (see image B.40). Apart from this, this
page allows the user to merge duplicated bus stops or create new stops. To merge duplicated

58 CHAPTER 4. IMPLEMENTATION
bus stops, the user must selected the stops to merge (see image B.42) and then click on the
"Merge selected stops" button. The BusStop Controller provides the Merge view, which is rep-
resented in image B.43. This page allows the user to choose which number, name, initials and
photograph of the selected stops he wants to keep. Also, the user is able to define the location
of the bus stop. When the user saves the changes, application deletes the bus stops selected by
the user to be merged, and creates a new bus stop with the attributes and location chosen.
As described in section 3.1, the monitoring application allows the user to visualize the stretches of
a set of routes’ or route variation’s paths. This functionality is available through the link "stretches"
in the upper right corner of the page and is described in section 4.3.4.1.
4.3.4.1 Common Stretches
In XtraN Passenger, the routes’ or route variations’ paths are usually described as a sequence of
stretches. A stretch is a portion of the path, represented by an ordered sequence of bus stops.
A common stretch between two or more paths is an ordered sequence of bus stops, common
to these paths. Therefore, the stretches that constitute a path may be common to other path
or appear only in this path. Providing information about common stretches between routes or
route variations may be very useful to improve the efficiency and scheduling of transit routes. For
example, it makes it easier to detect whether too many buses travel through the same sequence
of bus stops and whether the routes may be re-scheduled to save fuel or time.
The monitoring application allows the user to visualize all stretches in a set of route variations (we
remind that a route’s path is the path of a route variation with the number zero). This functionally
os available through the link "stretches" in the upper right corner of every page. The PathStretch-
Controller provides the Index View which lists all the existing stretches (see Figure B.44). The
user is then able to click on a stretch to see its details, or to re-calculate the stretches for a new
set of route variations. The details page (Edit View) allows the user to change the stretch name,
and presents the list of bus stops in the stretch and the list of bus stops whose path contains the
stretch (see Figure B.46). If the user chooses to re-calculate the stretches, the existing ones are
deleted and the user is asked to select a new set of route variations. This is shown in Figure
B.45. The application starts by finding all common stretches between the selected route varia-
tions. This is done using string matching. Each bus stop is represented by a character and each
route is represented by a sequence of characters, each character being one of the route’s bus
stops. Each sequence is ordered according to the order in which the bus stops appear in the
route. All the sequences are then concatenated in order to create a new string, and the common
stretches between the set of routes are found by finding the substrings (sequence of characters)
that are repeated in this new string. Since each character represents a bus stop, if the same

4.3. SERVER SIDE 59
(a) Each line represents a path and each piece with a dif-ferent colour represents a stretch. BS1-11 are bus stopsalong each path and each one is represented by a char-acter from A to K.
(b) Sequence of characters for eachpath and string corresponding to allpaths.
Figure 4.26: Example of stretches for a group of paths.
sequence of characters appears more than once in the new string, it means that more than one
route travels through a sequence of bus stops, which is a common stretch between these routes.
To find the common substrings, we used Suffix Trees([33]). A suffix tree for a m-character string
S is a rooted directed tree with exactly m leaves numbered 1 to m. Each internal node of the tree
has at least two children and each edge is labelled with a substring of S. No two edges out of
a node can have labels beginning with the same character. For every leaf i, the concatenation
of the edge’s labels on the path from the root to i is a suffix of S (S[i...m]). This means that the
concatenation of the edge’s labels from the root to an internal node is a substring that appears
more than once in S. By constructing the tree we can extract these substrings which represent
stretches that are common to two or more route variations.
The suffix tree for the string S is built using Ukkonen’s algorithm([34]) which runs in O(m) time,
being m the length of the string. The algorithm is divided into m phases, and each phasei+1 is
divided into i+1 extensions, one for each of the i+1 suffixes of S[1...i+1]. In extension j of phase
i+1, the algorithm finds the end of the path P from the root, labeled with substring S[j...i ]. Then,
the substring is extended by adding character S(i+1). This extensions is done according to one
of the following rules:

60 CHAPTER 4. IMPLEMENTATION
Rule 1 If P ends at a leaf, the character S[i+1] is added to the end of the label on that leaf edge.
Rule 2 P does not end at a leaf and no path from the end of P starts with character S[i+1].
In this case, a new leaf edge starting from the end of P is created and labelled with character
S[i+1]. A new node is also created if P ends inside an edge. The leaf at the end of the new leaf
edge is given the number j.
Rule 3 P does not end at a leaf and there is a path starting from the end of P with character
S[i+1]. In this case the algorithm does nothing since the substring PS[i+1] is already in the tree.
From the suffix tree, we are able to extract the common stretches among the set of variations.
The remaining substrings, that is, the sequence of characters (or bus stops) that only appear in
one route, are also stretches. This algorithm only allows a maximum of 62 bus stops since we
need a character for each bus stop. If the user selects a set of route variations with a total number
of bus stops higher than 62, the user receives an error message.
An example of this process is represented in Figure 4.26. In Figure 4.26a there is a group of paths
and several bus stops distributed along them. Each bus stop from BS1 to BS11 is represented
by a character, from A to K. As shown in Figure 4.26b, each path is represented by a sequence
of characters, each character being a bus stop along that path. Then all the sequences are
concatenated, generating the final string which will be the input to Ukkonen’s algorithm. The
algorithm builds the suffix tree to that string and the stretches are extracted. In this example,
two common stretches were found: stretch BS4-BS5 which is common to paths BS3-BS8, BS1-
BS10 and BS2-BS11; and stretch BS5-BS7 which is common to paths BS3-BS8, BS1-BS10 and
BS6-BS9. The remaining stretches appear only in one path.
4.4 Conclusion
The system developed contemplates all the requirements defined. One of the biggest challenges
during the implementation of GBUS, especially the Route Builder and the Monitoring Applica-
tion, was to become familiar with new technologies and formats, such as ASP.NET MVC, GPX or
OpenStreetMap. This required more time than expected and resulted in a delay of the initially de-
fined schedule. Another challenge was the implementation of the map matching algorithm which
proved to be more difficult than expected, due to the necessary mathematical and geometric cal-
culations.
Because of the extra time needed to implement the system, we did not have enough time to

4.4. CONCLUSION 61
improve the interfaces of the Mobile and the Monitoring Applications. Also, there was not enough
time to test the applications with users since these type of testing required a lot of time, not only
to perform but also to analyse the results.


Chapter 5
Evaluation
During the implementation of the Gbus system, unit tests were executed to guarantee the correct
functionality of each system component. Additionally, integration tests were performed to verify
if the Mobile Application and the RouteBuilder are properly integrated. These tests verified the
correctness of the communication between the two components and the data exchanged.
5.1 Map-Matching Algorithm
Apart from the unit and integration tests, additional tests were performed in order to verify the ac-
curacy and precision of the map-matching algorithm. The accuracy, or correct link identification,
of the algorithm is the percentage of points matched to the correct road segment. The precision
is the degree to which the algorithm provides the same result to repeated collections of the same
path.
To performed this evaluation, several paths had to be collected in the field using the mobile ap-
plication. These paths were collected in the small town of Sintra, in Portugal, since it has both
areas with high buildings and forestation, where the GPS signals may be blocked. Besides, most
paths were collected in residential areas with several roads parallel and close to each other that
could lead the algorithm to match the points to the wrong street.
Collected points Accuracy/Correct Link Identification (%)772 98.4
Table 5.7: Resulting accuracy of the map-matching algorithm
63

64 CHAPTER 5. EVALUATION
To evaluate the accuracy of the algorithm, several different paths were collected. The collected
paths were then sent to the Route Builder which ran the map-matching algorithm for each path.
Finally, for each point it was verified if it was matched to the correct road. The Table 5.7 shows
the resulting accuracy of the map-matching algorithm. From a total of 772 collected GPS points,
98.4% of these points were matched to the correct road segment. This is a very positive result
since the map-matching is done offline, and the user may correct the location of erroneous points
with the monitoring application.
To evaluate the precision of the algorithm, the same path was collected several times. The results
of the map-matching algorithm were then analysed to verify if the points from the several paths
were matched to the same road segments. The results obtained are shown in Table 5.8. The
same path was collected three times and 71.8% of the road segments identified were equal in all
resulting paths.
Collected points Road segments Common segments Precision (%)223 15
11 71.80239 16238 15
Table 5.8: Resulting precision of the map-matching algorithm

Chapter 6
Conclusion
Intelligent Transportation Systems are very common nowadays and are adopted by most trans-
portation companies. Tecmic is a portuguese company that provides Intelligent Transportation
Solutions for several types of clients. One of these solutions is XtraN Passenger, which is aimed
at public transportation companies and enables real-time monitoring of all fleet activity, voice and
data communication with the driver, arrival time prediction and the provision of information to
users. In order to adopt these solutions, a transportation company must have a database with all
the information about bus stops and routes.
Some of the existing data collection solutions were presented in Section 2. However, none of
these solutions allows the collection of bus stops’ location and attributes and, at the same time,
the automatic collection and map-matching of routes. Several map-matching algorithms were
also described in Section 2.
The system developed is GBUS - Route GeoTracer, which extends the XtraN Passenger Sys-
tem. GBUS consists of a Mobile Application to collect the bus stops and routes; a server, Route
Builder, that receives the information collected and applies a map-matching algorithm to map
each route to a road map; a database to save the information collected; and a Monitoring Appli-
cation to visualize and edit all the information. Finally, the information collected is integrated in
XtraN Passenger.
A system like GBUS is very important for the installation of an ITS. To install an ITS, it is nec-
essary to collect essential data, such as the bus routes and bus stops, which is usually done
manually in the field and then manually analysed and correlated. This requires a lot of time
and consequently money which can be problematic in the current days. GBUS automates the
collection and processing of data which reduces the necessary time and cost of the installation.
65

66 CHAPTER 6. CONCLUSION
6.1 Future Work
GBUS does not depend on other systems and can be easily adapted to different contexts. One
can change or add new bus stop or route attributes to be collected with the mobile application.
The monitoring application may also be extended to support other functionalities, for example, to
allow the user to define different zones and tariffs, to define bus schedules, to manage common
stretches, etc.. Also, the user interfaces may be improved to ensure a better user experience.
Finally, future work may be developed to ensure the secure transfer of data between the server
and the mobile application. Security concerns were out of the scope of this work however it may
be crucial in a system like GBUS.

Bibliography
[1] D. Bernstein and A. Kornhauser, “An introduction to map-matching for personal navigation
assistants,” Transportation Research Board, Tech. Rep., 1998.
[2] Research and Special Programs Administration and Volpe National Transportation
Systems Center, Advanced public transportation systems : the state of the
art : update 2000 . Federal Transit Administration, 2000 . [Online]. Available:
http://purl.access.gpo.gov/GPO/LPS15875
[3] Transportation Research Board, “TCRP Synthesis 55 Geographic Information Systems Ap-
plications in Transit: A Synthesis of Transit Practice,” Transportation Research Board, Tech.
Rep., 2004.
[4] Joseph Martin Sussman , Perspectives on intelligent transportation systems . Springer,
2005 .
[5] R. Zito and G. D’Este and M.A.P. Taylor, “Global positioning systems in the time domain:
How useful a tool for intelligent vehicle-highway systems?” Transportation Research Part C:
Emerging Technologies, vol. 3, no. 4, pp. 193 – 209, 1995.
[6] D. Kubrak and C. Macabiau and M. Monnerat and M-L. Boucheret, “Vehicular Navigation
Using a Tight Integration of Aided-GPS and Low-Cost MEMS Sensors,” in Proceedings of
the 2006 National Technical Meeting of The Institute of Navigation, January 2006, pp. 149 –
158.
[7] Albert Gan and Ike Ubaka and Fabian Cevallos, “An Automated Transit Stop Data Collection
System,” in Proceedings of the 2005 Conference on GIS in Transit, National Center for
Transit Research, November 1-3 2005.
[8] Rodrigo Bastos, “Um sistema web de consultas de trajetoria de onibus como servico pub-
lico,” Master’s thesis, Universidade do vale do rio dos sinos, 2008.
67

68 BIBLIOGRAPHY
[9] Rodrigo Bastos and Patricia A. Jaques, “ANTARES: Um sistema Web de consulta de rotas
de onibus como servico publico,” Revista Brasileira de Computacao Aplicada, vol. 2, no. 1,
pp. 41–56, march 2010.
[10] James Biagioni and Tomas Gerlich and Timothy Merrifield and Jakob Eriksson, “Easy-
Tracker: Automatic Transit Tracking, Mapping, and Arrival Time Prediction using Smart-
phones,” in Proceedings of the 9th ACM Conference on Embedded Networked Sensor Sys-
tems, ser. SenSys ’11. ACM, November 1-4 2011, pp. 68–81.
[11] Multivariate Density Estimation. John Wiley & Sons, Inc., 2008, ch. Kernel Density Estima-
tors.
[12] C.E. White and D. Bernstein and A.L. Kornhauser, “Some map-matching algorithms for per-
sonal navigation assistants,” Transportation Research Part C, vol. 8, pp. 91–108, 2000.
[13] M.A. Quddus and W. Y. Ochieng and R. Noland, “Current map-matching algorithms for trans-
port applications: State-of-the art and future research directions,” Transportation Research
Part C: Emerging Technologies, vol. 15, no. 5, pp. 312 – 328, 2007.
[14] George Taylor and Geoffrey Blewitt and Doerte Steup and Simon Corbett and Adrijana Car,
“Road Reduction Filtering for GPS-GIS Navigation.”
[15] J. S. Greenfeld, “Matching GPS observations to locations on a digital map,” in Proceedings
of the 81st Annual Meeting of the Transportation Research Board, January 13-17 2002.
[16] M. A. Quddus and W. Y. Ochieng and L. Zhao and R. B. Noland, “A general map-matching
algorithm for transport telematics applications,” GPS Solutions, vol. 7, no. 3, pp. 157–167,
2003.
[17] H. Yin and O. Wolfson, “A weight-based map-matching method in moving objects
databases,” in Proceedings of the 16th International Conference on Scientific and Statistical
Database Management, vol. 16. IEEE Computer Society, June 21-23 2004, pp. 437–438.
[18] S. K. Honey and W. B. Zavoli and K. A. Milnes and A. C. Phillips and M. S. White and G.
E. Loughmiller, “Vehicle navigational system and method,” 1989, United States Patent No.,
4796191.
[19] Y. Zhao, Vehicle Location and Navigation System. Artech House, Inc., 1997.
[20] A. Papoulis, Probability, Random Variables, and Stochastic Processes, 4rd ed. McGrawHill,
2002.

BIBLIOGRAPHY 69
[21] Boaz Porat, Digital Processing of Random Signals: Theory and Methods. Prentice Hall,
1994.
[22] H. L. Van Trees, Detection, Estimation, and Modulation Theory. Wiley, 1968.
[23] Mike Cyrus and Jay Beck, “Generalized Two- and Three-Dimensional Clipping,” Computers
& Graphics, vol. 3, pp. 23 – 28, 1978.
[24] W.Y. Ochieng and M.A. Quddus and R.B. Noland, “Map-matching in complex urban road
networks,” Brazilian Journal of Cartography, vol. 55, no. 2, pp. 1–18, 2004.
[25] S. Syed and M. E. Cannon, “Fuzzy Logic-Based Map-Matching Algorithms for Vehicle Nav-
igation System in Urban Canyons,” in Proceedings of the Institute of Navigation (ION) na-
tional technical meeting, January 26-28 2004.
[26] Mengyin Fu and Jie Li and Meiling Wang, “A Hybrid Map-Matching Algorithm Based on
Fuzzy Comprehensive Judgment,” in IEEE Proceedings on Intelligent Transportation Sys-
tems, no. 613-617, 2004.
[27] Wuk Kim and Gyu-In Jee and JangGyu Lee, “Efficient Use of Digital Road Map in Various
Positioning for ITS,” in IEEE Symposium on Position Location and Navigation, 2000.
[28] Youjing Cui and Shuzhi Sam Ge, “Autonomous Vehicle Positioning with GPS in Urban
Canyon Environments,” in IEEE Transactions on Robotics and Automation, vol. 19, no. 2.
IEEE, 2003, pp. 15–25.
[29] Dakai Yang and Baigen Cai and Yifang Yuan, “An Improved Map-Matching Algorithm Used
in Vehicle Navigation System,” in IEEE Proceedings on Intelligent Transportation Systems,
2003, pp. 1246–1250.
[30] Jong-Sun Pyo and Dong-Ho Shin and Tae-Kyung Sung, “Development of a map-matching
method using the multiple hypothesis technique,” in IEEE Proceedings on Intelligent Trans-
portation Systems, 2001, pp. 23–27.
[31] Fredrik Gustafsson and Fredrik Gunnarsson and Niclas Bergman and Urban Forssell and
Jonas Jansson and Rickard Karlsson and Per-Johan Nordlund, “Particle Filters for Position-
ing, Navigation and Tracking,” in IEEE Transactions on Signal Processing, vol. 50, no. 2.
IEEE, 2002, pp. 425–435.
[32] T. Griffin and Y. Huang and S. Seals, “Routing-based map matching for extracting routes
from GPS trajectories,” in Proceedings of the 2nd International Conference on Computing
for Geospatial Research & Applications, ser. COM.Geo ’11, no. 24.

70 BIBLIOGRAPHY
[33] D. Gusfield, Algorithms on Strings, Trees and Sequences. Cambridge University Press,
1997.
[34] E. Ukkonen, “On-line construction of suffix-trees,” in Algorithmica, ser. 14, 1995, pp. 249–
260.

Appendix A
Mobile Application Images
Figure A.27: Mobile Application’s home screen.
71

72 APPENDIX A. MOBILE APPLICATION IMAGES
(a)Introductionofthe
newroute’s
attributes.(b)
New
route’sm
ainscreen.
Them
apshow
sthe
currentlocationofthe
userand
thecollected
busstops
(c)New
route’sm
ainscreen
options.
FigureA
.28:E
xamples
ofthecreation
ofanew
route
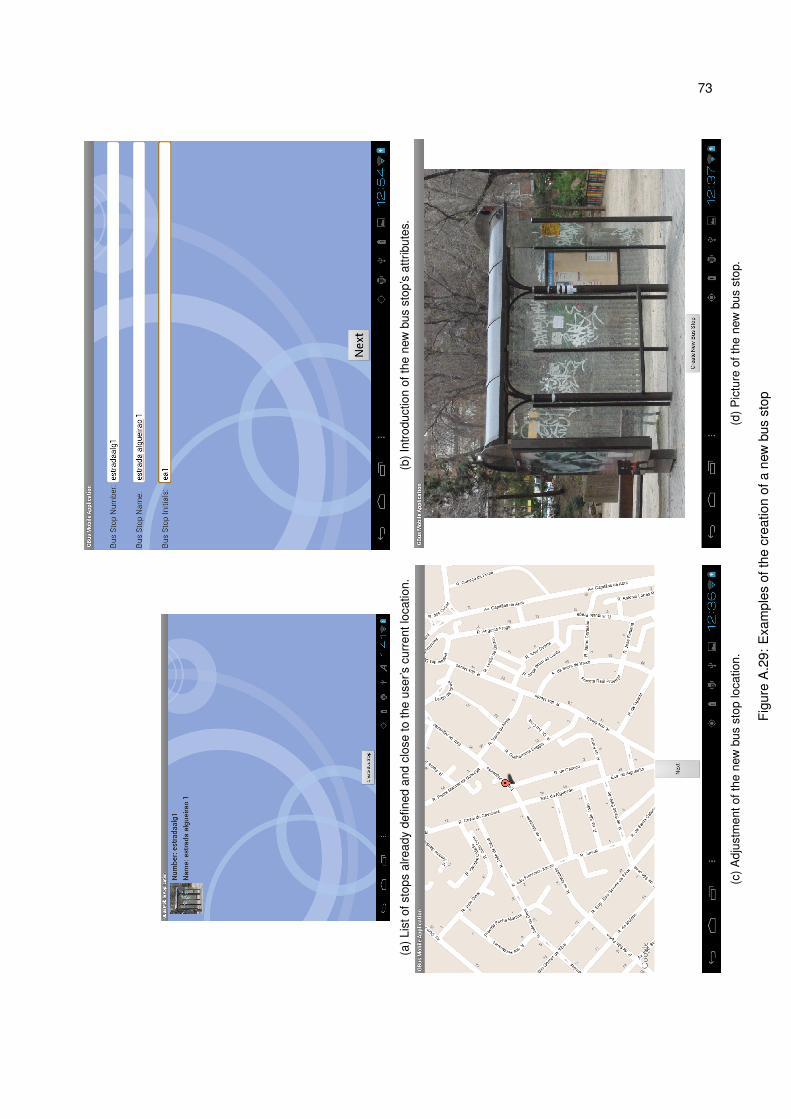
73
(a)L
isto
fsto
psal
read
yde
fined
and
clos
eto
the
user
’scu
rren
tloc
atio
n.(b
)Int
rodu
ctio
nof
the
new
bus
stop
’sat
trib
utes
.
(c)A
djus
tmen
toft
hene
wbu
sst
oplo
catio
n.(d
)Pic
ture
ofth
ene
wbu
sst
op.
Figu
reA
.29:
Exa
mpl
esof
the
crea
tion
ofa
new
bus
stop

74 APPENDIX A. MOBILE APPLICATION IMAGES
(a)Listofexistingroutes.
(b)Listofexistingroute
variations.
(c)Introductionofthe
newroute
variation’sattributes.
(d)List
ofordered
busstops
ofthe
newvariation.
Theuser
may
changethe
orderofthebus
stops,deletebus
stopsorcreate
newlinks.
FigureA
.30:E
xamples
ofthecreation
ofanew
busroute
variation.

75
(a)L
isto
fbus
stop
saf
terr
ever
sing
the
dire
ctio
n.(b
)Cre
atio
nof
ane
wlin
kto
add
toth
ene
wro
ute
varia
tion.
(c)
Whe
nth
eus
erfin
aliz
esa
new
link,
hem
ayte
rmin
ate
the
link
atan
exis
ting
bus
stop
(oft
heva
riatio
n),o
ratt
hela
stbu
sst
opof
the
new
link.
(d)
List
ofbu
sst
ops
ofth
eva
riatio
n.Th
islis
tis
pres
ente
dif
the
user
final
izes
the
new
link
atan
exis
ting
bus
stop
.
Figu
reA
.31:
Exa
mpl
esof
the
crea
tion
ofa
new
bus
rout
eva
riatio
n

76 APPENDIX A. MOBILE APPLICATION IMAGES
(a)Stored
routesorroutes
variationsin
thetabletdevice.
(b)Available
optionsto
eachstored
routeorroute
variation.
(c)Deletion
ofastored
routevariation.
FigureA
.32:E
xamples
ofthem
anagementofstored
routevariations

Appendix B
Monitoring Application Images
77

78 APPENDIX B. MONITORING APPLICATION IMAGES
FigureB
.33:M
onitoringA
pplication’shom
epage.

79
Figu
reB
.34:
Bus
stop
deta
ils.

80 APPENDIX B. MONITORING APPLICATION IMAGES
FigureB
.35:E
ditroutepage.

81
Figu
reB
.36:
Edi
trou
teva
riatio
npa
ge.

82 APPENDIX B. MONITORING APPLICATION IMAGES
FigureB
.37:E
ditroutevariation
page:B
usstop
options.

83
Figu
reB
.38:
Edi
trou
teva
riatio
npa
ge:
Add
poin
tto
varia
tion.

84 APPENDIX B. MONITORING APPLICATION IMAGES
FigureB
.39:E
ditroutevariation
page:Pointoptions.

85
Figu
reB
.40:
Edi
tbus
stop
page
.

86 APPENDIX B. MONITORING APPLICATION IMAGES
FigureB
.41:Listbus
stopspage.

87
Figu
reB
.42:
Mer
gebu
sst
ops:
Sel
ectio
nof
bus
stop
sto
mer
ge.

88 APPENDIX B. MONITORING APPLICATION IMAGES
FigureB
.43:M
ergebus
stops:S
electionofattributes.

89
Figu
reB
.44:
List
ofex
istin
gst
retc
hes.

90 APPENDIX B. MONITORING APPLICATION IMAGES
FigureB
.45:S
electionofroute
variationsto
findnew
stretches.

91
Figu
reB
.46:
Det
ails
ofa
path
stre
tch:
nam
e,bu
sst
ops,
and
varia
tions
who
sepa
thco
ntai
nsth
est
retc
h.


Appendix C
GPX example
<?xml version=" 1.0 " encoding="UTF−8" ?>
<gpx version=" 1.0 " xmlns :xs i= " h t t p : / /www.w3 . org /2001/XMLSchema−i ns tance "
xmlns=" h t t p : / /www. t o p o g r a f i x . com/GPX/ 1 / 0 " xm lns : t opog ra f i x = " h t t p : / /www. t o p o g r a f i x . com/
GPX/ P r i va te / TopoGraf ix / 0 / 1 " xs i :schemaLocat ion=" h t t p : / /www. t o p o g r a f i x . com/GPX/ 1 / 0
h t t p : / /www. t o p o g r a f i x . com/GPX/ 1 / 0 / gpx . xsd h t t p : / /www. t o p o g r a f i x . com/GPX/ P r i va te /
TopoGraf ix / 0 / 1 h t t p : / /www. t o p o g r a f i x . com/GPX/ P r i va te / TopoGraf ix / 0 / 1 / t o p o g r a f i x . xsd ">
< t r k >
<name>23 es t radaa lgue i rao / c a v a l e i r a < / name>
<desc>< / desc>
<extens ions>
< r o u t e i d >60< / r o u t e i d >
<routenumber>23< / routenumber>
<var ia t ionnumber>2< / var ia t ionnumber>
< d i r e c t i o n >ASCE< / d i r e c t i o n >
< / extens ions>
< t rkseg>
< t r k p t l a t = " 38 ,80723 " lon="−9,35006 ">
<t ime>1341273559115,47< / t ime>
< / t r k p t >
< t r k p t l a t = " 38 ,80730 " lon="−9,35079 ">
<t ime>1341273556203,72< / t ime>
< / t r k p t >
< t r k p t l a t = " 38 ,80677 " lon="−9,35166 ">
<t ime>1341273551829,3< / t ime>
< / t r k p t >
< t r k p t l a t = " 38 ,80520 " lon="−9,35344 ">
<t ime>1341273541170,83< / t ime>
< / t r k p t >
93

94 APPENDIX C. GPX EXAMPLE
< t r k p t l a t = " 38 ,80522 " lon="−9,35342 ">
<t ime>1341273541299,8< / t ime>
< / t r k p t >
< t r k p t l a t = " 38 ,80672 " lon="−9,34887 ">
<t ime>1341273564596,35< / t ime>
< / t r k p t >
< / t rkseg>
< / t r k >
<wpt l a t = " 38 ,80522 " lon="−9,35342 ">
<t ime>1341273541299,8< / t ime>
<name>cidadefaro1< / name>
<extens ions>
< i d >57< / i d >
<number> c id fa ro1 < / number>
< i n i t i a l s >cf1< / i n i t i a l s >
< / extens ions>
< / wpt>
<wpt l a t = " 38 ,80672 " lon="−9,34887 ">
<t ime>1341273564596,35< / t ime>
<name>bernardo marques 1< / name>
<extens ions>
< i d >70< / i d >
<number>bernardomarques1< / number>
< i n i t i a l s >bm1< / i n i t i a l s >
< / extens ions>
< / wpt>
< / gpx>
Listing C.1: Example of a GPX file