Repositório da Universidade de Lisboa
175
UNIVERSIDADE DE LISBOA FACULDADE DE CIÊNCIAS DEPARTAMENTO DE BIOLOGIA ANIMAL Marine fish assemblages as indicators of anthropogenic pressures: identifying sensitive metrics Sofia Nunes Henriques Margarido Pires Doutoramento em Biologia Especialidade de Biologia Marinha e Aquacultura 2013
-
Upload
khangminh22 -
Category
Documents
-
view
3 -
download
0
Transcript of Repositório da Universidade de Lisboa

UNIVERSIDADE DE LISBOA
FACULDADE DE CIÊNCIAS
DEPARTAMENTO DE BIOLOGIA ANIMAL
Marine fish assemblages as indicators of
anthropogenic pressures: identifying sensitive
metrics
Sofia Nunes Henriques Margarido Pires
Doutoramento em Biologia
Especialidade de Biologia Marinha e Aquacultura
2013

UNIVERSIDADE DE LISBOA
FACULDADE DE CIÊNCIAS
DEPARTAMENTO DE BIOLOGIA ANIMAL
Marine fish assemblages as indicators of
anthropogenic pressures: identifying sensitive
metrics
Sofia Nunes Henriques Margarido Pires
Tese orientada pelo Professor Doutor Henrique Cabral e pela
Professora Doutora Maria José Costa, especialmente elaborada para a
obtenção do grau de Doutor em Biologia
(especialidade de Biologia Marinha e Aquacultura)
2013


Doctoral dissertation in Biology (scientific area of
Marine Biology and Aquaculture) presented to the
University of Lisboa
Dissertação apresentada à Universidade de Lisboa
para obtenção do grau de Doutor
(especialidade Biologia Marinha e Aquacultura)
Sofia Nunes Henriques Margarido Pires
2013


“It is not the strongest of the species that survives, nor the most intelligent that survives. It is the one that is the most adaptable to change.”
Charles Darwin

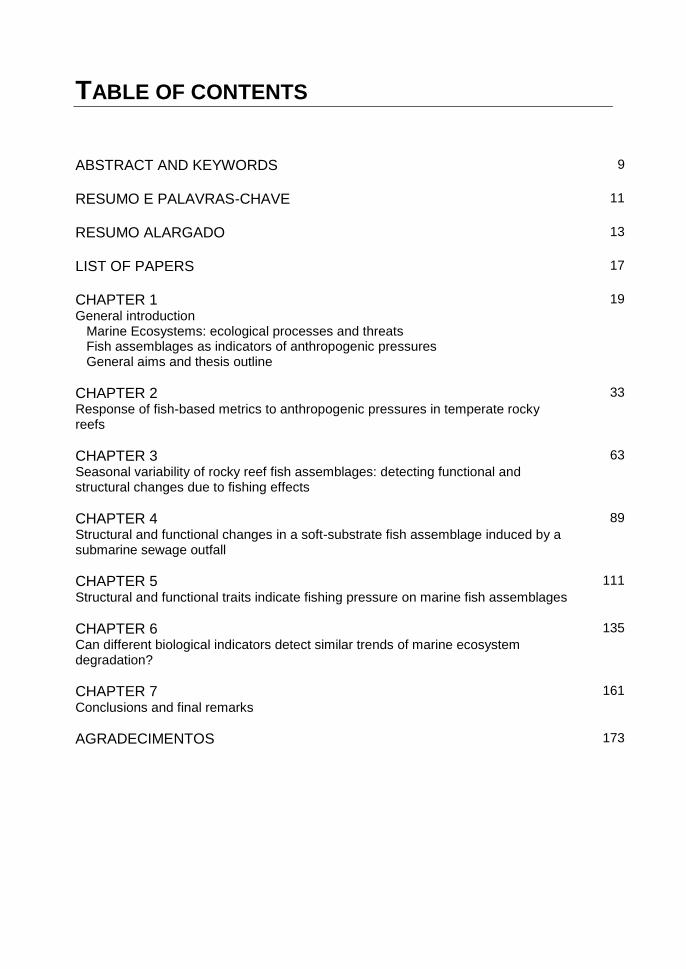
TABLE OF CONTENTS
ABSTRACT AND KEYWORDS
9
RESUMO E PALAVRAS-CHAVE
11
RESUMO ALARGADO
13
LIST OF PAPERS
17
CHAPTER 1 General introduction Marine Ecosystems: ecological processes and threats Fish assemblages as indicators of anthropogenic pressures General aims and thesis outline
19
CHAPTER 2 Response of fish-based metrics to anthropogenic pressures in temperate rocky reefs
33
CHAPTER 3 Seasonal variability of rocky reef fish assemblages: detecting functional and structural changes due to fishing effects
63
CHAPTER 4 Structural and functional changes in a soft-substrate fish assemblage induced by a submarine sewage outfall
89
CHAPTER 5 Structural and functional traits indicate fishing pressure on marine fish assemblages
111
CHAPTER 6 Can different biological indicators detect similar trends of marine ecosystem degradation?
135
CHAPTER 7 Conclusions and final remarks
161
AGRADECIMENTOS 173

Abstract
9
Abstract
Worldwide concern about the environmental threats and need for sustainable development
has led to increased efforts to understand and assess anthropogenic pressure effects.
However, the development of indicators for marine ecosystems is still at an early stage,
due to their high spatial and temporal complexity. Based on several structural and
functional traits (guild approach) and considering the effects of natural variability, the
present study analysed the response of fish assemblages to several anthropogenic
pressures in the Portuguese coast, by selecting fish-based metrics that best distinguish
disturbed from control sites or those sensitive to gradients of pressure. In general, fish
assemblages associated with both rocky reef and soft-substrate habitats were broadly
affected by water pollution (sewage discharges and non-point sources of pollution), which
led to changes in many metrics depending on the balance between the effluent toxicity and
resources availability (e.g. trophic structure, resilience, habitat association and nursery
function attributes). Conversely, fishing affected fish assemblages differentially, since in
addition to the metrics related with commercial value, differences were only observed in
tolerant-opportunistic and large individuals in rocky reefs, and species exhibiting vulnerable
traits and dominance in soft-substrate habitats. Moreover, seasonal variability can
influence the patterns of some fish-based metrics and their ability to detect pressures. The
selection of the warm season after the spawning period (July-October) seems to be the
more adequate to detect changes in rocky reef fish (cost-efficient). Further research is
needed for soft-substrate habitats in order to select the most suitable sampling season.
Finally, due to the difficulty to assess single-pressures on a wide-ranging environment,
often characterized by multiple pressure contexts, an approach based on the previous
selection of the expected pressure sources and applying a directional monitoring plan to
analyze if the biological indicators detect changes, is strongly recommended (more cost-
efficient).
Keywords: Functional and structural traits; marine fish assemblages; rocky reef habitats;
soft-substrate habitats; anthropogenic pressures.

Resumo
11
Resumo
A preocupação global com as ameaças ambientais e a necessidade de um
desenvolvimento sustentável tem levado a um crescente esforço para compreender e
avaliar os efeitos das pressões antropogénicas. No entanto, o desenvolvimento de
indicadores nos ecossistemas marinhos encontra-se ainda numa fase inicial, devido à sua
elevada complexidade espacial e temporal. O presente estudo analisou a resposta dos
peixes a várias pressões antropogénicas na costa portuguesa, através da selecção de
métricas estruturais e funcionais sensíveis a gradientes de pressão, ou que melhor
distinguiram as zonas perturbadas das de controlo. Em geral, as associações de peixes
tanto em recifes rochosos como em substratos móveis foram amplamente afectados por
águas poluídas (descargas de esgoto e poluição difusa), que levaram a alterações em
várias métricas dependendo do balanço entre a toxicidade do efluente e os recursos
disponíveis para os peixes. Em contrapartida, os efeitos da pesca foram mais selectivos
uma vez que, para além das alterações na métricas relacionadas com o elevado interesse
comercial, apenas se observaram diferenças em indivíduos de maiores dimensões e
tolerantes-oportunistas nos recifes rochosos, bem como nas espécies com características
mais vulneráveis e dominância de espécies nos substratos arenosos. A variabilidade
sazonal pode afectar os padrões de algumas métricas e a sua capacidade de detecção de
impactos. Nos recifes rochosos, a selecção da estação quente, depois da época de
reprodução (Julho-Outubro), parece ser mais adequada para a detecção de alterações
nos peixes, enquanto para os substratos móveis são necessários estudos para definir a
melhor época de amostragem. Devido à dificuldade de analisar pressões específicas num
ambiente tão amplo e sujeito a pressões múltiplas, é recomendada a aplicação de uma
abordagem baseada na identificação inicial das potenciais fontes de pressão e na
aplicação de um plano de monitorização direccionado para por fim verificar se os
indicadores biológicos detectam alterações.
Palavras-chave: Características funcionais e estruturais; grupos de peixes marinhos;
recifes rochosos; habitats de substrato móvel; pressões antropogénicas.

Resumo alargado
13
Resumo alargado
Os ecossistemas marinhos contêm uma elevada complexidade de interacções bióticas e
abióticas, responsáveis por uma série de processos ecológicos vitais à manutenção da
própria vida. No entanto, muitos destes ecossistemas encontram-se ameaçados face à
crescente degradação provocada pelas actividades humanas, sendo evidente a
necessidade de recuperar e assegurar a sua utilização sustentável de modo a garantir o
seu bom funcionamento. Neste sentido, é essencial compreender de que forma as
actividades humanas afectam as comunidades biológicas e os limites de pressão que
essas comunidades conseguem suportar sem que haja alterações no seu funcionamento.
Apesar de nas últimas décadas se terem desenvolvido vários indicadores para avaliar o
estado dos ecossistemas aquáticos (e.g. estuários, rios), estes encontram-se ainda numa
fase inicial no que diz respeito ao meio marinho, devido à sua grande complexidade
espacial e temporal. Contudo, tem sido demostrado que a avaliação das alterações nas
comunidades biológicas através de categorias estruturais e funcionais constitui uma
abordagem eficiente, sensível e versátil, tendo levado a uma mudança de paradigma, em
que as abordagens tradicionais (ao nível das espécies) têm sido gradualmente
substituídas por abordagens baseadas em métricas estruturais e funcionais.
O presente estudo teve como principal objectivo avaliar a resposta estrutural e funcional
de grupos de peixes associados a recifes rochosos e a habitats de substrato móvel a
várias pressões antropogénicas, por forma a: identificar métricas sensíveis que possam
ser utilizadas como indicadores; melhorar o conhecimento sobre as consequências
dessas pressões antropogénicas; e contribuir para a correcta detecção das mesmas face
à elevada dinâmica e dimensão dos ambientes marinhos. Esta tese é composta por sete
capítulos, cinco dos quais referem-se a artigos científicos, publicados ou em revisão em
revistas internacionais de arbitragem científica indexadas no Science Citation Index. Estes
capítulos são precedidos por uma introdução geral e sucedidos por um capítulo de
conclusões e comentários finais que incluem sugestões para estudos futuros.
No capítulo 1, introdução geral, é apresentado um enquadramento do tema da presente
tese, onde são abordados os principais factores responsáveis pelos processos ecológicos
e as ameaças provocadas pelas actividades antropogénicas. São também descritas as

Resumo alargado
14
principais dificuldades, a importância e os avanços relativos ao uso de peixes como
indicadores de qualidade ambiental, assim como o seu enquadramento legislativo.
No capítulo 2 foi seleccionado um conjunto alargado de métricas relativas aos atributos de
diversidade, abundância, estrutura trófica, mobilidade, resiliência, associação ao habitat e
função de viveiro, que se pretende serem representativos das principais características
das associações de peixes associados a recifes rochosos e das alterações esperadas
face a pressões antropogénicas. Recorrendo a este conjunto de métricas, a resposta dos
peixes foi analisada na presença de pressões da pesca, actividade portuária, descarga de
esgoto e efluente térmico. Com excepção deste último, foram obtidas diferenças
estruturais e funcionais significativas entre os locais perturbados pelas referidas pressões
e os respectivos locais de controlo (com semelhante complexidade). Estas diferenças
sugeriram a existência de dois padrões de resposta principais, consoante o número de
atributos afectados: pressão selectiva, que afecta diferencialmente os grupos de peixes
(pesca); e pressão abrangente, com métricas dos vários atributos analisados a
responderem à sua presença (descargas de esgoto e actividades portuárias). Por fim, as
métricas relativas a indivíduos generalistas, territoriais, de grandes dimensões com
interesse comercial médio ou elevado, juvenis e ainda as métricas relacionadas com a
estrutura trófica (excepto os zooplanctonívoros), foram seleccionadas como as mais
sensíveis para avaliar alterações nos peixes de recifes rochosos. Estes resultados
constituíram a base de referência para a selecção das métricas utilizadas
subsequentemente no capítulo 3.
O efeito da sazonalidade nas métricas e a sua influência na detecção de um gradiente de
pesca foi averiguado no capítulo 3. Apesar de ser expectável que as métricas sejam mais
resilientes aos efeitos da variabilidade natural, em comparação com as espécies, algumas
apresentaram variações ao longo das estações do ano analisadas, salientando-se as
métricas relativas a juvenis, omnívoros e indivíduos que se alimentam de invertebrados.
Os resultados revelaram diferenças claras entre as estações quentes (Verão e Outono) e
frias (Inverno e Primavera), sugerindo que os padrões de variação encontrados se
deveram aos processos de recrutamento, migrações de reprodução e ainda a movimentos
de alimentação que ocorrem ao longo do ano. Para além disso, ficou demonstrado que
estas variações sazonais podem causar dificuldades na detecção de pressões, uma vez
que apenas foram encontradas diferenças nos indivíduos de elevado interesse comercial
durante o Outono (métrica sensível ao efeito da pesca). Uma conclusão importante deste
trabalho foi a selecção da época depois da reprodução para a maioria das espécies
(Julho-Outubro), como a melhor altura para se avaliar alterações provocadas pelos

Resumo alargado
15
impactos antropogénicos em recifes rochosos. A selecção de uma época específica pode
ter grandes implicações no melhoramento dos planos de gestão e na minimização dos
custos das suas monitorizações.
Os capítulos 4 e 5 focam os efeitos de pressões antropogénicas sobre os grupos de
peixes associados aos substratos móveis, através da análise dos gradientes de descargas
de esgoto e de pesca com arrasto de fundo, respectivamente. Tal como no capítulo 2,
foram utilizados conjuntos alargados de métricas, representativos da estrutura e função
dos grupos de peixes característicos destes substratos e da sua resposta esperada
perante as pressões mencionadas.
Desta forma, no capítulo 4 foi definido um gradiente de influência do efluente de um
emissário submarino, com base na dispersão verificada em estudos anteriores, onde
foram distinguidas três zonas com base na distância à saída do emissário. Da análise das
diferenças encontradas entre essas zonas revelou que este efluente, sobretudo composto
por matéria orgânica, provocou alterações tanto ao nível funcional como estrutural das
associações de peixes, especialmente detectáveis junto à saída do emissário.
Aparentemente, o padrão de resposta resultou não só dos potenciais níveis de toxicidade
do efluente que levou ao decréscimo da abundância e biomassa de grupos de espécies
mais sensíveis (resiliência baixa e muito baixa; Chondrichthyes), mas também do aumento
de complexidade do habitat em consequência da presença das condutas. Essas condutas
possivelmente funcionam como recifes artificiais, atraindo espécies tolerantes aos efeitos
do efluente (residentes de rocha e omnívoros) que beneficiam dos novos recursos
provenientes destes recifes (e.g. alimento, abrigo). Assim, pôde-se concluir que os efeitos
das descargas de esgotos no meio marinho dependem dos aspectos estruturantes
relativos à toxicidade do efluente e à complexidade do habitat, uma vez que estes
condicionam a quantidade de recursos disponíveis para as espécies que tolerem os
efeitos do efluente.
Por sua vez, no capítulo 5 foi utilizada uma abordagem inovadora de selecção de métricas
que demonstrou ser extremamente útil na avaliação de zonas extensas que albergam um
conjunto alargado de factores naturais (e.g. profundidade, latitude, substrato). Esta
abordagem consistiu na modelação da resposta dos grupos de peixes a gradientes de
intensidade de pesca com arrasto, que por sua vez foram definidos recorrendo às
localizações transmitidas pelas embarcações via satélite (Vessel Monitoring System data)
e analisadas com técnicas de Sistemas de Informação Geográfica (SIG). As métricas
foram posteriormente seleccionadas de acordo com a sua consistência ao longo dos
modelos de resposta nas quatro tipologias de habitats definidos a priori, ou seja, níveis de

Resumo alargado
16
intensidade de pesca com arrasto. No geral, as métricas relacionadas com indivíduos de
níveis tróficos mais elevados, de elevado interesse comercial, que exibem características
mais vulneráveis (Chondrichthyes, resiliência muito baixa, sedentários) e ainda a
dominância revelaram-se mais sensíveis ao aumento da intensidade da pesca. Este
padrão foi atribuído ao conjunto de possíveis efeitos directos e indirectos da pesca de
arrasto que actuam sinergicamente sobre características específicas de associações de
peixes associados a substratos móveis, levando à sua homogeneização.
Tendo em conta que os ecossistemas marinhos estão frequentemente sujeitos a impactos
múltiplos provenientes de diferentes fontes de pressão, a detecção dos efeitos singulares
de uma pressão específica é muitas vezes ocultada pelas diferentes pressões que actuam
num mesmo local, constituindo, no entanto, um dos passos fundamentais para o sucesso
dos planos de gestão. Neste contexto, a capacidade de detecção de pressões específicas
foi analisada no capítulo 6, utilizando peixes e macroinvertebrados como indicadores
biológicos e comparando a sua resposta. Para isso, foram definidos quatro tipos de
gradientes de pressão (pesca, poluição orgânica, estruturas físicas e poluição difusa) com
base na localização espacial e grau de impacto esperado das várias pressões existentes
numa extensa área marinha (SIG). Estes gradientes serviram de base para modelar a
resposta dos indicadores referidos não só às pressões específicas mas também ao
padrão cumulativo dessas pressões. Ambos os indicadores foram concordantes na
identificação dos locais sujeitos a maior pressão cumulativa, e a análise da resposta
esperada das métricas sensíveis aos gradientes de pressão específica indicou que a
contaminação difusa foi a pressão que mais contribuiu para os padrões encontrados. Uma
vez que era expectável que outras fontes de pressão tivessem sido detectadas, foi
sugerida uma nova abordagem para melhorar a avaliação de áreas extensas e sujeitas a
pressões múltiplas, que consiste na identificação prévia das fontes de pressão que
actuam numa determinada zona, juntamente com o delineamento de um plano de
monitorização direccionado à origem dessas pressões, para que desta forma seja possível
avaliar correctamente a resposta dos indicadores biológicos.
Finalmente, no capítulo 7 são apresentadas as várias conclusões que integram os
principais resultados obtidos nos capítulos anteriores sendo também exploradas as
implicações das abordagens utilizadas ou sugeridas no contexto da avaliação e detecção
de pressões humanas nos ecossistemas marinhos. Neste capítulo são ainda propostas
algumas linhas de investigação futura, que, de acordo com os resultados obtidos, irão
complementar o conhecimento adquirido com o presente trabalho.

List of papers
17
List of papers
This thesis is comprised by the papers listed below, each corresponding to a chapter, from
2 to 6. The author of this thesis is the first author in all papers and was responsible for
conception and design of the work, field surveys, sample collection and processing,
laboratory analytical procedures, data analysis and manuscript writing of all the papers.
Remaining authors collaborated in some or several of these procedures. All papers
published were included with the publishers’ agreement.
CHAPTER 2: Response of fish-based metrics to anthropogenic pressures in temperate
rocky reefs
Sofia Henriques, Miguel P. Pais, Marisa I. Batista, Maria J. Costa, Henrique N. Cabral
Published in Ecological Indicators (2013) 25: 65-76.
CHAPTER 3: Seasonal variability of rocky reef fish assemblages: detecting functional and
structural changes due to fishing effects
Sofia Henriques, Miguel P. Pais, Maria J. Costa, Henrique N. Cabral
Published in Journal of Sea Research (2013) 79: 50-59.
CHAPTER 4: Structural and functional changes in a soft-substrate fish assemblage
induced by submarine sewage outfall
Sofia Henriques, Miguel P. Pais, Maria J. Costa, Henrique N. Cabral
In review in Environmental Monitoring and Assessment.
CHAPTER 5: Structural and functional traits indicate fishing pressure on marine fish
assemblages
Sofia Henriques, Miguel P. Pais, Rita P. Vasconcelos, Alberto Murta, Manuela Azevedo,
Maria J. Costa, Henrique N. Cabral
In review in Journal of Applied Ecology.
CHAPTER 6: Can different biological indicators detect similar trends of marine ecosystem
degradation?
Sofia Henriques, Miguel P. Pais, Marisa I. Batista, Célia M. Teixeira, Maria J. Costa,
Henrique N. Cabral
Submitted to Ecological Indicators.


19
CHAPTER 1
General introduction
Marine ecosystems: ecological processes and threats
Fish assemblages as indicators of anthropogenic pressures
General aims and thesis outline

General introduction
21
General Introduction
Marine ecosystems: ecological processes and threats
Marine environments comprise complex networks of interactions among the assemblages
of living organisms (biotic component) and between those organisms and the abiotic
environment (physical and chemical components) (Costanza & Mageau 1999; Cury et al.
2003; Mann & Lazier 2006; Costello 2009). Besides providing food and raw material (i.e.
goods), these multiple interactions result in several ecosystem processes that are essential
to the proper functioning of the Earth (i.e. services), such as the regulation of climate, the
bioremediation of pollutants and waste, the prevention of flood and storm, the buffering of
climate change and regulation of nutrient cycling (Costanza & Mageau 1999; Beaumont et
al. 2007; Bremner 2008). However, marine ecosystems are subject to a wide range of
threats that often lead to their degradation with consequent decline or loss of those
functions (Hooper et al. 2005; Bremner 2008; Mouillot et al. 2012). Therefore,
understanding how anthropogenic impacts affect the complexity of the physical, chemical
and biological interactions, as well as the limits of pressure intensity between which
biological assemblages can stand without causing a shift to an alternative state, is
becoming a crucial challenge in order to ensure sustainability of those assemblages
(Costanza & Mageau 1999; Cury et al. 2003; Hughes et al. 2005; Borja et al. 2012).
The concept of sustainable ecosystem, sensu healthy ecosystem, is directly related with
ecosystem’s capacity of maintaining its structure and function (integrity) over time in face of
external stress (resilience), that in turn is supported by synergetic feedbacks between the
biotic and abiotic components (Figure 1.1) (Costanza & Mageau 1999). These biotic (e.g.
tolerance, adaptation, recruitment, competition) and abiotic factors (e.g. habitat complexity,
temperature, wind, currents) determine the spatial and temporal homogeneity of marine
assemblages (Rice 2005; Johnson et al. 2012). The diversity and distribution of marine
assemblages depends on the species life-cycles and their connections with the
surrounding habitat, through the balance among the ecological needs, resources
availability (e.g. food, shelter, conditions that maximize the recruitment), physiological
tolerance and capacity of adaptation (Figure 1.1) (García-Charton & Pérez-Ruzafa 2001;
Pihl & Wennhage 2002; Rice 2005). In addition, it is well known that the patterns of marine

Chapter 1
22
biological assemblages vary at different temporal scales (i.e. seasonal and inter-annual
variability) due to natural environmental oscillations (e.g. sea temperature, currents,
upwelling events) that trigger processes such as species migration, spawning seasons and
recruitment (Holbrook et al. 1994; Harmelin-Vivien et al. 1995; Friedlander & Parrish 1998;
Aburto-Oropeza & Balart 2001; Henriques et al. 2007). For instance, in the Portuguese
coast, the variation in winter sea conditions associated with the North Atlantic Oscillation
(NAO) is possibly the main factor responsible for the inter-annual variation in a marine fish
assemblage by causing shifts in sea surface temperature (SST), currents and wind
direction (see Henriques et al. 2007 for details). These oceanographic conditions can
cause changes in the proportion of some species by affecting the transport of eggs, larvae
and juveniles from other biogeographic regions, as well as affect the local recruitment
patterns due to changes in wind direction (e.g. offshore transport or larval retention)
(Henriques et al. 2007). Seasonality affects the arrangement of fish assemblages as a
consequence of differential patterns in the distribution of some species, for example:
appearance of juveniles and reproductive fish at a particular habitat and/or depth range
and season and occurrence of planktonivore species associated with upwelling events
(Gaertner et al. 1998; Sousa et al. 2005).
Furthermore, the degree to which ecosystems and assemblages are affected by
environmental and anthropogenic disturbances is related with the complexity of trophic
relationships through the dynamic processes of the bottom-up, wasp-waist and top-down
control (Caddy & Garibaldi 2000; Pennigar et al. 2000; Cury et al. 2003). In its simplest
form, top-down control is the process where variations in the upper levels of food web,
usually top-carnivores, drive the abundance of the lower levels, each trophic level
influencing the one below. In bottom-up control the process starts from lower trophic levels
and continues upwards through the food web. Wasp-waist process occurs when an
intermediate level of the food web (e.g. planktonivores), which depends on the environment
(e.g. upwelling), affect the abundances of the upper and lower levels. In this context and
since species and assemblages do not exist in isolation, both environmental and
anthropogenic pressures are likely to affect the overall productivity of the ecosystems
(Figure 1.1) (Cury et al. 2003).
Over-harvesting, pollution and the impacts of climate change as a result of several
anthropogenic activities have been largely recognized as the primary threats on marine
ecosystems (Islam & Tanaka 2004; Hughes et al. 2005; Crain et al. 2009), causing
dramatic shifts in marine assemblages composition and consequently unstable systems
(Graham & Harrod 2009; McKinley & Johnston 2010; Johnson et al. 2012).

General introduction
23
Figure 1.1 Illustration of the complexity of interactions among anthropogenic pressures,
environmental and biotic factors on a simplified food web. Arrows represent the direction of those interactions. Images are from Clipart courtesy FCIT (http://etc.usf.edu/clipart/).
In fact, over-harvesting, mostly associated with fishing activities, can lead to the reduction
of living resources (both target and non-target species) and to the destruction of their
habitats with likely profound effects on food webs that ultimately change the structure and
function of ecosystems (Caddy & Garibaldi 2000; Cury et al. 2003; Crain et al. 2009).
Pollutants derived from a variety of sources, such as domestic and municipal wastes
(organic compounds, pathogens, heavy metals and trace elements), agriculture (fertilizers,
pesticides and agrochemicals), aquaculture (alien species, sediments and organic
compounds), industrial activities (heavy metals and trace elements), shipping (oil spills,
invasive species, noise), among others. These pollutants can cause direct and indirect
effects on marine organisms by affecting their survival, growth, reproductive success, food
availability and interfering on metabolic processes, while increasing their susceptibility to
diseases and deformities, depending on the pollutants toxicity and concentrations (see
Islam & Tanaka 2004; Crain et al. 2009; McKinley & Johnston 2010). Warning
temperatures of ocean and air, increasing rates of sea-level rise, ocean acidification and
UV exposure are some of the major impacts of climate change, which affect the metabolic

Chapter 1
24
processes and the biogeographical distribution of species with consequences in the
diversity, structure and function of marine assemblages, in addition to the deep
implications in the loss of important ecosystems (e.g. polar areas, coral reefs, coastal
habitats) (Crain et al. 2009). Overall, these impacts tend to be intensified due to the
increases in industrialization, population growth and current levels of ecosystems
degradation, which stress the need of ranking the ecosystems vulnerability and key threats
in order to prioritize conservation efforts and direct management measures to reduce those
impacts (Crain et al. 2009; Ban et al. 2010).
It has been estimated that a third of the world´s oceans are under medium to very high
cumulative impact levels, but these levels are unequally distributed, mostly concentrated
in the continental shelf and slope, as a result of both land- and ocean-based anthropogenic
pressures, while the less impacted areas occur in the poles (Halpern et al. 2008).
Moreover, anthropogenic activities with significant impacts (fishing, aquaculture, coastal
engineering and pollution) primarily affect the intertidal and nearshore ecosystems with
coral reefs, rocky reefs and mangroves pointed out as the most threatened marine
ecosystems, as well as hard-bottom shelf areas (30-200m) (Halpern et al. 2007; Halpern et
al. 2008; McKinley & Johnston 2010). Conversely, shallow soft-bottom and pelagic deep-
water ecosystems are the less threatened due to their lower vulnerability (Halpern et al.
2007; Halpern et al. 2008). Despite this worrying global overview, the effects of these
impacts on marine biological assemblages and their consequences for the ecosystem
remain poorly understood.
Until recently, investigations about the anthropogenic impacts on biological organisms
focused on taxonomic-based approaches, by employing species richness, diversity
indices, evenness or population abundance as descriptors (Niemi & McDonald 2004;
Mouillot et al. 2012). Theoretical ecological foundations suggest that, under stable
conditions, marine assemblages are characterized by a strong interspecific competition
resulting in a balance between large-body size, slow growth, long life span species
(supposedly more sensitive) and opportunistic species (short life span, fast growth), with
those sensitive dominating the assemblages in terms of biomass. Conversely, under
increases of stress, those assemblages become gradually shifted to opportunistic species
which, at highest levels of disturbance intensity, dominate the assemblages in both
abundance and biomass (Warwick 1993; Yemane et al. 2005; Cheung et al. 2008).
However, since not all species are ecologically identical and in view of the above-
mentioned biotic and abiotic interactions, the complexity of human-induced changes
cannot be solely viewed as species differences in terms of tolerance to disturbance as the

General introduction
25
stress-response relationships are far from be unimodal (Hughes et al. 2005; Mouillot et al.
2012). Consequently, the approaches are gradually becoming more ecological, moving
from the assessment of individual species at a single broad scale, to multiple-species
analyses, and finally to ecosystem-based assessments at multiple spatial and temporal
scales (Levin & Lubchenco 2008).
In the last decades the ecosystem-based approach (EBA) has become a new and central
paradigm underlying international policies, such as the Water Framework Directive (WFD)
and the Marine Strategy Framework Directive (MSFD), which consider the entire
ecosystem components (including humans), their interactions and the impacts of multiple
activities, as integral parts of the marine management in order to ensure sustainable
ecosystems. For instance, the MSFD aims to achieve good environmental status of all EU
marine waters by 2020 and to implement programmes of measures in order to recover
impacted systems and prevent future degradation (Directive 2008/56/CE). The
implementation of the MSFD should include an integrated approach to assess the
environmental status, comprising several biological elements such as plankton, algae,
macroinvertebrates, fish, marine mammals, reptiles and seabirds, together with physical
and chemical features (see annex III in Directive 2008/56/CE). Since the previous
assessment tools focused on physicochemical targets, these legislative requirements bring
new challenges and urgent demand of the: development of biological tools and
methodologies to accurately assess to the environmental status of marine waters and
establish the ecological quality objectives; as well as the application of an approach based
on an adaptive management to deal with political and environmental changes.
Fish assemblages as indicators of anthropogenic pressures
The extreme difficulty of measuring anthropogenic impacts in such complex, spatially and
temporally diverse ecosystems led to the development of several indicators in order to
isolate key aspects that provide insight into changing conditions (Heink & Kowarik 2010).
In the ecological and environmental planning contexts the meaning of the term indicators is
still ambiguous as it varies widely in usage, often with different terms used as synonyms
(see Heink & Kowarik 2010 for further details). Since indicators are relevant to link science
and policy, presenting a definition in the context in which they are applied becomes
important to avoid misinterpretations (Heink & Kowarik 2010). Here, the meaning inherent
to environmental indicators implies that measures of biological, physical or chemical
components reflect changes in the environment state (evaluative indicators), while
ecological indicators are measurable characteristics of biological organisms (from cell to

Chapter 1
26
community level) used to assess the condition of the ecosystem (state of ecological
processes) and to detect change related to anthropogenic disturbances (descriptive
indicators). These concepts were defined based on the revisions of Niemi et al. (2004),
Niemi and McDonald (2004) and Heink and Kowarik (2010).
Independently of the definition used, all indicators must detect and quantitatively assess
anthropogenic impacts against a background of natural variability in a predictable manner,
be early-warning signals of disturbance, be cost effective as well as have a broad
applicability (different geographical areas and habitat types) (Dale & Beyeler 2001;
Greenstreet & Rogers 2006). In this context, the assessment of changes through functional
and structural guilds (i.e. metrics based on biological traits), has proven to be a versatile,
powerful and sensitive approach, since species within guilds tend to be similarly affected
by impacts and, along spatial and temporal gradients, they are replaced by others sharing
the same guild (Micheli & Halpern 2005; Elliott et al. 2007; Noble et al. 2007; Bremner
2008; Mouillot et al. 2012; Pais et al. 2012).
In the present study, fish assemblages will be the ecological indicator analysed. Although
some limitations have been identified in their use as indicators, such as the selectivity and
seasonal nature of samples, the large sampling effort that may be required to be
representative, their mobility and relative tolerance to chemical pollution, these limitations
are largely offset by the advantages: trophic position (high variety of trophic levels,
including those near the top of food webs), easiness in identification when compared with
other biological groups, extensive life-history information available, high variety of
functional guilds that reflect several components of the ecosystem; In addition, fishes are
both sedentary and mobile (given us information about the local and “border” of the
effects), can show external anatomical pathologies, are relatively long-lived species
providing temporal integration in the assessments and have high economic value making
simpler to communicate with the general public (Harris 1995; Whitfield & Elliott 2002;
Harrison & Whitfield 2006). In fact, previous studies showed that fish assemblages provide
powerful tools for assessing streams and estuaries, i.e. multimetric indices – tools used to
classify the condition of an environment according to the anthropogenic-induced changes
in features of biological assemblages (e.g. Karr 1981; Deegan et al. 1997; Breine et al.
2006; Harrison & Whitfield 2006; Hering et al. 2006; Coates et al. 2007; Roset et al. 2007;
Marzin et al. 2012). However, to our knowledge, the Marine Fish Community Index (MFCI)
was the only tool specifically developed to assess marine fish assemblages (Henriques et
al. 2008). Yet, the dataset used to perform the MFCI tests resulted from scientific reports
and papers collection, and lacked information about the anthropogenic impacts affecting

General introduction
27
the areas (Henriques et al. 2008). Therefore, the use of fish-based indicators in marine
waters is still in an early stage, an there is an urgent need for scientific knowledge about
the sensitivity and consistency of metrics (i.e. measures that describe features of the
structure and function of marine biological assemblages) in the assessment of
anthropogenic pressures.
General aims and thesis outline
In view of the growing awareness of assessing human-induced changes at ecosystem
level, including the legislative requirements, as well as the lack of information available for
the use of fish assemblages as indicators in marine waters, the general aims of this thesis
were: (1) to identify sensitive metrics, based on marine fish assemblages associated to
different habitats and their responses to the main anthropogenic pressures (2) to improve
the current understanding about the consequences of anthropogenic pressures in fish
assemblages, (3) to critically address the precautions needed to properly detect disturbed
areas on wide-ranging and dynamic environment. The thesis includes five scientific papers
published, in review or submitted in peer reviewed international journals, each
corresponding to a chapter.
In all chapters, the approaches applied were designed to focus on changes caused by
anthropogenic pressures while considering the effects of natural variability. Therefore,
disturbed areas were compared with control areas or along pressure gradients whilst
accounting for season and the similarity of environmental features (e.g. rocky reef
complexity, depth, sediment type). Given that habitat complexity plays an important role in
the spatial and temporal composition of fish assemblages, due to the above-explained
biotic and abiotic interactions, fish assemblages associated with soft-substrates and rocky
reefs were analysed separately.
Chapter 2 relies on both structural and functional responses of rocky fish assemblages to
the pressures of fishing, sewage discharges, port activities and thermal effluents in order to
select trait-based metrics that best distinguishes disturbed from control areas. One of the
novel aspects is the integrated assessment achieved through the analysis of several
metrics representing numerous attributes of fish assemblages (namely diversity,
abundance, trophic structure, mobility, resilience, habitat association, nursery function).
The results are discussed in the light of studies focusing on anthropogenic impacts in order
to identify the possible mechanisms driving the observed patterns. This chapter identifies a
set of sensitive metrics with biological meaning that will be the basis of the next chapter.

Chapter 1
28
Seasonal variability is one of the main drivers of fish distribution and abundance variations
in rocky reefs. However, only a few studies analyzed the effects of seasonal variability on
marine rocky fish assemblages and none focused on fish metrics, which is key to improve
the understanding of anthropogenic impacts. Chapter 3 addresses the effects of seasonal
variation on the stability of several trait-based metrics (guild approach) as well as their
capability to detect the effects of fishing pressure. The results are discussed regarding the
choice of the best season to assess anthropogenic pressures.
Chapters 4 and 5 address the use of soft-substrate fish assemblages in the assessment of
human-induced changes. Chapter 4 constitutes the first guild approach to the effects of
sewage on both structural and functional fish-based metrics. Chapter 5 examines changes
in fish assemblages structure and functioning concurrent with changings levels of trawling
effort, one of the most destructive fishing methods. Moreover, in chapter 5 a novel
approach is applied by comparing the response models of several trait-based metrics and
the consistency of metric response among different soft-substrate habitat typologies.
Results of both chapters are discussed in relation to the possible factors responsible for
the observed changes and indicate a set of sensitive metrics that will be used in chapter 6.
Since marine ecosystems are usually under the influence of multiple-pressure sources,
that can mask the response of indicators, chapter 6 tests if known sensitive trait-based
metrics of both fish and macroinvertebrate indicators are capable of detecting ecosystem
degradation problems, and distinguishing pressure types (i.e. fishing, organic, physical and
non-point source). The results are discussed regarding the design of more cost-efficient
field surveys.
Finally, chapter 7 outlines the main conclusions gathered from the several chapters, their
contribution and implications within the context of anthropogenic impact assessment. This
chapter also point out some recommendations on how adequately assess disturbed areas
on wide-ranging and dynamic ecosystem and presents suggestions for further research.
Literature cited
Aburto-Oropeza O. & Balart E.F. (2001). Community structure of reef fish in several habitats of a rocky reef in the Gulf of California. Marine Ecology-Pubblicazioni Della Stazione Zoologica Di Napoli I, 22, 283-305.
Ban N.C., Alidina H.M. & Ardron J.A. (2010). Cumulative impact mapping: Advances, relevance and limitations to marine management and conservation, using Canada's Pacific waters as a case study. Marine Policy, 34, 876-886.
Beaumont N.J., Austen M.C., Atkins J.P., Burdon D., Degraer S., Dentinho T.P., Derous S., Holm P., Horton T., van Ierland E., Marboe A.H., Starkey D.J., Townsend M. & Zarzycki T. (2007).
General introduction
29
Identification, definition and quantification of goods and services provided by marine biodiversity: implications for the ecosystem approach. Marine Pollution Bulletin, 54, 253-265.
Borja A., Dauer D.M. & Gremare A. (2012). The importance of setting targets and reference conditions in assessing marine ecosystem quality. Ecological Indicators, 12, 1-7.
Breine J.J., Maes J., Quataert P., Bergh E., Simoens I., Thuyne G. & Belpaire C. (2006). A fish-based assessment tool for the ecological quality of the brackish Schelde estuary in Flanders (Belgium). Hydrobiologia, 575, 141-159.
Bremner J. (2008). Species' traits and ecological functioning in marine conservation and management. Journal of Experimental Marine Biology and Ecology, 366, 37-47.
Caddy J.F. & Garibaldi L. (2000). Apparent changes in the trophic composition of world marine harverests: the perspective from FAO capture database. Ocean & Coastal Management, 43, 615-655.
Cheung S.G., Lam N.W., Wu R.S. & Shin P.K. (2008). Spatio-temporal changes of marine macrobenthic community in sub-tropical waters upon recovery from eutrophication. II. Life-history traits and feeding guilds of polychaete community. Marine Pollution Bulletin, 56, 297-307.
Coates S., Waugh A., Anwar A. & Robson M. (2007). Efficacy of a multi-metric fish index as an analysis tool for the transitional fish component of the Water Framework Directive. Marine Pollution Bulletin, 55, 225-240.
Costanza R. & Mageau M. (1999). What is a healthy ecosystem? Aquatic Ecology, 33, 105-115.
Costello M.J. (2009). Distinguishing marine habitat classification concepts for ecological data management. Marine Ecology Progress Series, 397, 253-268.
Crain C.M., Halpern B.S., Beck M.W. & Kappel C.V. (2009). Understanding and managing human threats to the coastal marine environment. Annals of the New York Academy of Sciences, 1162, 39-62.
Cury P., Shannon L. & Shin Y.J. (2003). The functioning of marine ecosystems: a fisheries perspective. In: Responsible Fisheries in the Marine Ecosystem (ed. M. Sinclair aGV). FAO/CAB International Rome, Italy/Wallingford, UK, pp. 103-123.
Dale V.H. & Beyeler S.C. (2001). Challenges in the development and use of ecological indicators. Ecological Indicators, 1, 3-10.
Deegan L.A., Finn J.T. & Buonaccorsi J. (1997). Development and validation of an estuarine biotic integrity index. Estuaries, 20, 601-617.
Directive 2008/56/CE. Directive of the European Parliment and the Council of 17 June 2008, establishing a framework for community action in the field of marine environmental policy (Marine Strategy Framework Directive). In: Official Journal of the European Union L 164, 19-40.
Elliott M., Whitfield A.K., Potter I.C., Blaber S.J.M., Cyrus D.P., Nordlie F.G. & Harrison T.D. (2007). The guild approach to categorizing estuarine fish assemblages: a global review. Fish and Fisheries, 8, 241-268.
Friedlander A.M. & Parrish J.D. (1998). Temporal dynamics of fish communities on an exposed shoreline in Hawaii. Environmental Biology of Fishes, 53, 1-18.
Gaertner J.C., Chessel D. & Bertrand J. (1998). Stability of spatial structures of demersal assemblages: a multitable approach. Aquatic Living Resources, 11, 75-85.
García-Charton J.A. & Pérez-Ruzafa A. (2001). Spatial pattern and the habitat structure of a Mediterranean rocky reef fish local assemblage. Marine Biology, 138, 917-934.
Graham C.T. & Harrod C. (2009). Implications of climate change for the fishes of the British Isles. Journal of Fish Biology, 74, 1143-1205.
Greenstreet S.P.R. & Rogers S.I. (2006). Indicators of the health of the North Sea fish community: identifying reference levels for an ecosystem approach to management. ICES Journal of Marine Science, 63, 573-593.

Chapter 1
30
Halpern B.S., Selkoe K.A., Micheli F. & Kappel C.V. (2007). Evaluating and ranking the vulnerability of global marine ecosystems to anthropogenic threats. Conservation Biology, 21, 1301-15.
Halpern B.S., Walbridge S., Selkoe K.A., Kappel C.V., Micheli F., D'Agrosa C., Bruno J.F., Casey K.S., Ebert C., Fox H.E., Fujita R., Heinemann D., Lenihan H.S., Madin E.M.P., Perry M.T., Selig E.R., Spalding M., Steneck R. & Watson R. (2008). A Global Map of Human Impact on Marine Ecosystems. Science, 319, 948-952.
Harmelin-Vivien M.L., Harmelin J.-G. & Leboulleux V. (1995). Microhabitat requirements for settlement of juvenile sparid fishes on Mediterranean rocky shores. Hydrobiologia, 300/301, 309-320.
Harris J.H. (1995). The use of fish in ecological assessments. Australian Journal of Ecology, 20, 65-80.
Harrison T.D. & Whitfield A.K. (2006). Application of a multimetric fish index to assess the environmental condition of south African estuaries. Estuaries and Coasts, 29, 1108-1120.
Heink U. & Kowarik I. (2010). What are indicators? On the definition of indicators in ecology and environmental planning. Ecological Indicators, 10, 584-593.
Henriques M., Gonçalves E.J. & Almada V.C. (2007). Rapid shifts in a marine fish assemblage follow fluctuations in winter sea conditions. Marine Ecology Progress Series, 340, 259-270.
Henriques S., Pais M.P., Costa M.J. & Cabral H. (2008). Development of a fish-based multimetric index to assess the ecological quality of marine habitats: the Marine Fish Community Index. Marine Pollution Bulletin, 56, 1913-1934.
Hering D., Johnson R.K., Kramm S., Schmutz S., Szoszkiewicz K. & Verdonschot P.F.M. (2006). Assessment of European streams with diatoms, macrophytes, macroinvertebrates and fish: a comparative metric-based analysis of organism response to stress. Freshwater Biology, 51, 1757-1785.
Holbrook S.J., Kingsford M.J., Schmitt R.J. & Stephens J.S. (1994). Spatial and Temporal Patterns in Assemblages of Temperate Reef Fish. American Zoologist, 34, 463-475.
Hooper D.U., Chapin F.S., Ewel J.J., Hector A., Inchausti P., Lavorel S., Lawton J.H., Lodge D.M., Loreau M., Naeem S., Schmid B., Setala H., Symstad A.J., Vandermeer J. & Wardle D.A. (2005). Effects of biodiversity on ecosystem functioning: A consensus of current knowledge. Ecological Monographs, 75, 3-35.
Hughes T.P., Bellwood D.R., Folke C., Steneck R.S. & Wilson J. (2005). New paradigms for supporting the resilience of marine ecosystems. Trends in Ecology and Evolution, 20, 380-386.
Islam S.M. & Tanaka M. (2004). Impacts of pollution on coastal and marine ecosystems including coastal and marine fisheries and approach for management: a review and synthesis. Marine Pollution Bulletin, 48, 624-649.
Johnson A.F., Jenkins S.R., Hiddink J.G. & Hinz H. (2012). Linking temperate demersal fish species to habitat: scales, patterns and future directions. Fish and Fisheries, doi.org/10.1111/j.1467-2979.2012.00466.x.
Karr J.R. (1981). Assessment of Biotic Integrity Using Fish Communities. Fisheries, 6, 21-27.
Levin S.A. & Lubchenco J. (2008). Resilience, robustness, and marine ecosystem-based management. Bioscience, 58, 27-32.
Mann K.H. & Lazier J.R.N. (2006). Dinamics of Marine Ecosystems: Biological-physical interactions in the oceans. Third edition. Blackwell, USA.
Marzin A., Archaimbault V., Belliard J., Chauvin C., Delmas F. & Pont D. (2012). Ecological assessment of running waters: Do macrophytes, macroinvertebrates, diatoms and fish show similar responses to human pressures? Ecological Indicators, 23, 56-65.
McKinley A. & Johnston E.L. (2010). Impacts of contaminant sources on marine fish abundance and species richness: a review and meta-analysis of evidence from the field. Marine Ecology Progress Series, 420, 175-191.

General introduction
31
Micheli F. & Halpern B.S. (2005). Low functional redundancy in coastal marine assemblages. Ecology Letters, 8, 391-400.
Mouillot D., Graham N.A., Villeger S., Mason N.W. & Bellwood D.R. (2012). A functional approach reveals community responses to disturbances. Trends in Ecology and Evolution, 28, 167-177.
Niemi G., Wardrop D., Brooks R., Anderson S., Brady V., Paerl H., Rakocinski C., Brouwer M., Levinson B. & McDonald M. (2004). Rationale for a new generation of indicators for coastal waters. Environmental health perspectives, 112, 979-86.
Niemi G.J. & McDonald M.E. (2004). Application of ecological indicators. Annual Review of Ecology Evolution and Systematics, 35, 89-111.
Noble R.A.A., Cowx I.G., Goffaux D. & Kestemont P. (2007). Assessing the health of European rivers using functional ecological guilds of fish communities: standardising species classification and approaches to metric selection. Fisheries Management and Ecology, 14, 381-392.
Pais M.P., Henriques S., Costa M.J. & Cabral H.N. (2012). A critical approach to the use of published data for baseline characterisation of marine fish assemblages: An exercise on Portuguese coastal waters. Ocean & Coastal Management, 69, 173-184.
Pennigar J.K., Polunin N.V.C., Francour P., Badalamenti F., Chemello R., Harmelin-Vivien M.L., Hereu B., Milazzo M., Zabala M., D'Anna G. & Pipitone C. (2000). Trophic cascates in benthic marine ecosystems: lessons for fisheries and protected-area management. Environmental Conservation, 27, 179-200.
Pihl L. & Wennhage H. (2002). Structure and diversity of fish assemblages on rocky and soft bottom shores on the Swedish west coast. Journal of Fish Biology, 61, 148-166.
Rice J.C. (2005). Understanding fish habitat ecology to achieve conservation. Journal of Fish Biology, 67, 1-22.
Roset N., Grenouillet G., Goffaux D., Pont D. & Kestemont P. (2007). A review of existing fish assemblage indicators and methodologies. Fisheries Management and Ecology, 14, 393-405.
Sousa P., Azevedo M. & Gomes M.C. (2005). Demersal assemblages off Portugal: Mapping, seasonal, and temporal patterns. Fisheries Research, 75, 120-137.
Warwick R.M. (1993). Environmental-Impact Studies on Marine Communities - Pragmatical Considerations. Australian Journal of Ecology, 18, 63-80.
Whitfield A.K. & Elliott M. (2002). Fishes as indicators of environmental and ecological changes within estuaries: a review of progress and some suggestions for the future. Journal of Fish Biology, 61, 229-250.
Yemane D., Field J.G. & Leslie R.W. (2005). Exploring the effects of fishing on fish assemblages using abundance biomass comparison (ABC) curves. ICES Journal of Marine Science, 62, 374-379.


33
CHAPTER 2
Henriques S., Pais M.P., Batista M.I., Costa M.J. & Cabral H.N. (2013). Response
of fish-based metrics to anthropogenic pressures in temperate rocky reefs.
Ecological Indicators 25, 65-76.

Response of rocky reef fish to anthropogenic pressures
35
Response of fish-based metrics to anthropogenic pressures
in temperate rocky reefs
Abstract: The increasing degradation of marine ecosystems as a result of increasing impact caused by anthropogenic pressures, urges for well-founded knowledge to develop efficient tools to appraise the quality status of fish assemblages, as required by the Marine Strategy Framework Directive. This study analyzed the structural and functional response of rocky fish assemblages to several pressures on the Portuguese coast, i.e. fishing, sewage discharges, port activities and thermal effluent, by selecting fish-based metrics that best distinguished disturbed from control areas. One of the novel aspects of this research is the integrated assessment made through the analysis of several metrics representing numerous attributes of fish assemblages (namely diversity, abundance, trophic structure, mobility, resilience, habitat association, nursery function), which contrasts with the most commonly used approaches that in general focus on fish species/families. PERMANOVA results showed significant differences on metrics composition for all pressures with the exception of the thermal effluent. Moreover, two major patterns of stress were identified: (1) selective pressure, which affects differentially the fish assemblages (fishing); and (2) broad-range pressure, which affects the entire fish assemblage with metrics of several attributes (e.g. structure, resilience, trophic guilds, nursery function) responding to its presence (sewage discharges, port activities). Taking into account the sensitivity results (discriminant analysis and Mann-Whitney test), biological meaning and redundancy with other metrics (Spearman correlations), the following metrics were selected as the most suitable to detect changes on temperate reef fish assemblages: density of generalist individuals, density of territorial individuals, density of large individuals with medium to high commercial value (> 20 cm), density of juveniles and metrics relative to trophic guild (except zooplanktivores). Since metrics grouped species that have some degree of functional overlap, the present approach was useful to understand human-induced changes at the assemblage level, contributing for the future use of marine fishes as biological indicators.
Keywords: Fish-based metrics; multi-stressor approach; temperate rocky reefs; environmental quality assessment, Portugal, Marine Strategy Framework Directive (MSFD).
Introduction
Marine ecosystems are influenced by several land- and ocean-based human activities that
are responsible for their degradation, which is being intensified with human population
growth, especially on coastlines (Halpern et al. 2008; Crain et al. 2009). Consequently,
quality assessment and monitoring of marine ecosystems has become increasingly
important to ensure their sustainability (e.g. Directive 2008/56/CE ; Spatharis & Tsirtsis
2010; Borja et al. 2012). There is widespread agreement that water pollution provided from
variable sources (e.g. agriculture, aquaculture, industrial and urban wastes), fishing,
dredging, port activities, coastal engineering and biological pollution are amongst the major

Chapter 2
36
threats of the marine ecosystems health (Halpern et al. 2008; Crain et al. 2009; Ban et al.
2010). In this context, knowing the location and effects of anthropogenic activities on
marine communities is critical to successful management and conservation (Ban et al.
2010; Korpinen et al. 2012).
Several studies have shown that marine fish assemblages associated with hard substrates
respond to human-induced changes (e.g. Khalaf & Kochzius 2002; Guidetti et al. 2003;
Claudet et al. 2006; García-Charton et al. 2008; Azzurro et al. 2010; McKinley & Johnston
2010). However, the differences found between disturbed and control areas focused on
fish species/genus/families with few metrics related to functional guild composition
employed, and even when used, they tend to represent only one feature (e.g. trophic
structure). Since anthropogenic activities can have a direct influence on food resources,
distribution, diversity, breeding, abundance, growth and survival of fish assemblages
(Henriques et al. 2008 and references therein), the usual approach is insufficient to
characterize both functional and structural changes of the whole assemblage. Therefore,
an integrative analysis of pressure-response relationship of several fish-based metrics by
comparing different pressures is required (multistressor approach), towards the
development of efficient tools to assess the quality state of marine fish assemblages (e.g.
multimetric indices).
The complexity of rocky reefs plays a key role in determining the diversity and spatial
distribution patterns of fish assemblages depending on species life-cycles, by limiting the
quantity of food and shelter available, density of predators and quality of nursery habitats
(Rice 2005). Therefore, the study of the potential fish assemblages a given habitat can
support is extremely important in order to successfully understand the effects of
anthropogenic impacts (García-Charton & Pérez-Ruzafa 2001).
Based on habitat characteristics, disturbed and their respective control sites were selected
on the Portuguese coast in order to represent the impacts of fishing, sewage discharges,
port activities and thermal effluents. By using underwater visual census (UVC) along strip
transects, fish assemblages associated with each site were characterized through several
fish-based metrics, representing both functional and structural features of the
assemblages. Finally, the effects of the presence of the above-mentioned pressures on
fish assemblages were tested through: (1) the selection of the fish-based metrics that best
distinguish disturbed from control sites and (2) the characterization of the stressor-
response patterns of fish-based metrics.

Response of rocky reef fish to anthropogenic pressures
37
Material and Methods
Study areas
A total of eight sites on the Portuguese west coast were selected, based on the presence
of fishing activity, sewage discharges, port activities and thermal effluents. For each type of
pressure a disturbed and a control site were sampled (henceforward designated as D and
C, respectively) (Figure 2.1).
In the case of fishing, the disturbed site was located on the complementary protection zone
in the Marine Protected Area of Arrábida (MPA), where local fishing activities with traps,
nets, angling, longlines and handlines are allowed for licensed boats (< 7 m stern to bow),
while its no-take zone (without any activity) was selected as control site (Figure 2.1a). The
site disturbed by sewage discharges was located in Cape of Sines (Figure 2.1b), between
a sewer and a runoff effluent of a stream that crosses the industrial zone of Sines, both
discharging untreated waters directly to the sea close to the shoreline. The control site was
located to the north, due to prevailing winds and oceanic swell from the northwest (Fiúza et
al. 1982).
Concerning the pressure of port activities and accounting that the structure of their
waterbreaks works as an artificial substrate (not comparable with natural rocky reefs), two
sites inside the Sines harbour were selected. The disturbed site was placed inside the
marina in the innermost area of Sines harbour, with the influence of several human
activities including a large fishing harbour. The control site was located near a small yacht
club with few small boats and human presence (Figure 2.1c). Regarding the thermal
effluent, the disturbed site was located near the hot water output of the thermal power
station of Sines and the control site located to the south, far from the influence of the hot
water discharge, according to temperatures measured with a multiparameter probe YSI
Professional Plus (Figure 2.1d). It is important to highlight that control sites do not
represent “pristine” conditions, but since each analysed pressure prevails in the
correspondent disturbed site, one can infer to a certain degree that differences among fish
assemblages are probably due to the presence of the analysed pressure.
In order to ensure that each pair of sites (D vs. C) had comparable habitat complexity, they
were characterized by the following measures: a 25 m chain positioned to follow the
contours and crevices as closely as possible and the linear distance from the beginning to
the end of the chain was used to estimate the rugosity ratio (Ferreira et al. 2001);
Proportion of rock and sand cover (in meters) estimated along each deployment of the
chain; algal cover, characterized by the mean percentage of cover (50 x 50 cm quadrat)

Chapter 2
38
Figure 2.1 Location of the sampled sites that represent the pressures of: a - fishing; b - sewage
discharge; c - port activities; and d - thermal effluent. Circles indicate the control sites (C) and triangles the disturbed sites (D).
Response of rocky reef fish to anthropogenic pressures
39
by structural groups: encrusting, creeping (< 5 cm), tufts, filamentous and sheet (≥ 5 cm);
invertebrates, the presence of sponges, anemones, hydrozoans, gorgonians, polychaetes,
gastropods, crustaceans, sea urchins, starfish, sea cucumbers and ascidians was
recorded in each quadrat (1 m2). Habitat sampling was performed by depth strata (similar
to the sampling of fishes, see below). Two chain deployments and six quadrats were
performed in each stratum.
Fish sampling method
Fish were sampled using underwater visual census (UVC) through 50 m long strip
transects placed parallel to the coastline. In order to direct the diver´s attention to both
holes and crevices and water column, maximizing their representativeness, each transect
was travelled twice for each replicate, first pass for non-cryptobenthic species (50 m x 2 m)
and the second for cryptobenthic species (50 m x 1 m). These transects were performed
with a minimum visibility of 5 m. In all transects the abundance and total length of observed
species were recorded by the same divers (S. Henriques & M.P. Pais) in order to minimize
observer effects.
A preliminary study using a total of 26 fish transects was performed, 13 allocated randomly
in each depth strata (shallow 0-5 m; deep 5-10 m), sampled during the summer in
consecutive days, at an independent site with high habitat complexity, to explore the
number of replicates and divide the species between both transect passes, according to
their behaviour. Length estimates were tested and calibrated between both observers until
no significant differences were found. A total of 6 replicates per depth strata were assumed
as representative of the fish assemblages. The species belonging to the families
Blenniidae, Bothidae, Batrachoididae, Callionymidae, Congridae, Gadidae (subfamilies
Phycinae and Lotinae), Gobiesocidae, Gobiidae, Muraenidae, Scorpaenidae,
Scophthalmidae, Soleidae, Syngnathidae, Tripterygiidae, the species Ctenolabrus
rupestris and Labrus mixtus as well as Symphodus spp. (with less than 5 cm total length)
were counted on cryptobenthic transects.
A total of 60 transects were performed between spring 2010 and summer 2011
corresponding to 9000 m2 of sampled area. Sites representing the fishing pressure
included both depth strata, for port activities only the shallow stratum was present, while
the remaining sites only have the deep stratum. Since season, sampling method, habitat
and depth strata were similar between each D vs. C pair, fish assemblages were
comparable per type of pressure.

Chapter 2
40
Fish-based metrics
A list of candidate metrics was compiled from an extensive review of existing studies about
fish response to anthropogenic pressures and description of rocky fish assemblages
(Table 2.1) (Fasola et al. 1997; Mosqueira et al. 2000; García-Charton & Pérez-Ruzafa
2001; Guidetti et al. 2002; Khalaf & Kochzius 2002; Pelletier et al. 2005; Rice 2005;
Claudet et al. 2006; Clynick 2006; Henriques et al. 2007; García-Charton et al. 2008;
Harmelin-Vivien et al. 2008; Henriques et al. 2008; Pizzolon et al. 2008; Johnston &
Roberts 2009; Azzurro et al. 2010; Claudet et al. 2010; McKinley & Johnston 2010; Wen et
al. 2010). These metrics represent a range of structural and functional fish assemblage
characteristics including diversity, composition, abundance, trophic structure, habitat
association, nursery function, mobility and resilience. To test the thermal effluent pressure,
metrics related with biogeographic affinities were added to the analysis (Table 2.1).
Density/abundance data are more sensitive to subtle changes in assemblages than
relative frequencies or number of species (Hewitt et al. 2005; McKinley & Johnston 2010)
and functional guilds tend to suffer smaller natural variations and respond more predictably
to stress (Elliott et al. 2007). Thus, a guild approach was adopted and fish-based metrics
were measured in density (ind. m-2
) (Table 2.1). Finally, all fish species were allocated to
their ecological and functional guilds based on the previous classification of Henriques et
al. (2008) updated with available literature and FishBase online database information
(Froese & Pauly 2012) (Supplementary data I).
Metrics selection
Differences among the fish metrics of each pair of sites (D vs. C) were examined through
one-way multivariate analysis of variance using permutations (PERMANOVA; Anderson
2001). This method does not assume normality since the p-values are obtained by
permutations, but it is sensitive to differences in dispersion among groups, so homogeneity
of multivariate dispersions was tested using the PERMDISP routine (Anderson et al. 2008).
In order to understand the response patterns in multivariate space, unconstrained Principal
Coordinates Analysis was used (PCO; Anderson et al. 2008). Moreover, to minimize the
potential influence of microhabitat, PERMANOVA analyses were repeated excluding the
cryptobenthic species belonging to the families Gobiidae, Bleniidae, Gobiesocidade and
Tripterygiidae, since they depend directly on substratum type (Fasola et al. 1997). Despite
this, a careful analysis was made considering the expected response of fish species and
habitat features, to avoid misinterpretations (see discussion).

Response of rocky reef fish to anthropogenic pressures
41
Table 2.1 List of candidate metrics to characterize the fish assemblage response to anthropogenic
pressures. Metrics are divided by the following attributes: diversity/structure, trophic structure, mobility, resilience, habitat association, nursery function and biogeographic affinity.

Chapter 2
42
Different methods can be employed to select the subset of suitable metrics for
incorporation in multimetric indices (see Roset et al. 2007 for a review) that should include
only those that are: (1) biologically meaningful, (2) able to be reliably and easily quantified
using field sampling, (3) sensitive to human disturbance and (4) not redundant with other
metrics (Noble et al. 2007; Roset et al. 2007). In order to do so, a Canonical Analysis of
Principal Coordinates (CAP, Anderson & Willis 2003) was used to identify the metrics that
best discriminate between groups (D vs. C) (Spearman r > |0.5|). The non-parametric
Mann-Whitney U test was used to assess whether the metrics of one of the sites (control
or disturbed) tend to have larger values than the other (Roset et al. 2007). Finally,
Spearman correlations among metrics were used to ascertain the degree to which each
pair of metrics was correlated and thus redundant (r > |0.85|). In this way, if a metric was
not redundant with others, if it had high correlation with the axes of the discriminant
analysis and if their values were consistently higher/lower among replicates of each site,
then it was selected.
All the above mentioned analyses, except the Mann-Whitney test and Spearman
correlations, were performed per type of pressure in PRIMER 6 with PERMANOVA+
software package. These analyses were based on a Euclidean distance matrix constructed
after normalizing each metric by subtracting the mean and dividing by the standard
deviation, in order to place all metrics on a comparable measurement scale. P-Values
were calculated using 9999 permutations. Mann-Whitney tests and Spearman correlations
were carried out using Statistica 10 software. For all analyses the level of statistical
significance adopted was 0.05.
In order to improve the interpretation of metric differences, a SIMPER routine was
performed to identify the species that contributed most to dissimilarities between each pair
of sites (PRIMER 6 software).
Results
Habitat description
The habitats of both sites representing the fishing pressure are characterized by an
extensive rocky area (91%) composed by calcareous boulders with different sizes,
including some small areas of cobbles (7%) (Mean rugosity ratio: disturbed - 0.2 and
control - 0.3). These rocky areas are full of holes, vertical walls and small caves with
sponges, polychaetes, hydrozoans, anemones and gastropods recorded in almost all
quadrats. The control site was covered by creeping (40%), encrusting algae (15%) and
Response of rocky reef fish to anthropogenic pressures
43
12% of Asparagopsis armata (invasive algae), while the disturbed site was covered
predominantly by A. armata (66%).
Both habitats associated with sewage pressure are composed by extensive areas of big
rocky blocks (88.5%) with vertical walls and some holes surrounded by sand patches (5%)
and small areas of cobbles (5%) (Mean rugosity ratio: 0.3). These rocky strata are mainly
covered by creeping and encrusting algae (93%). Sponges and polychaetes occur in both
sites and gastropods at the control site (recorded in almost all quadrats).
Regarding the pressure of port activities, the habitats consist of natural stone riprap that
generates a large number of deep holes (mean rugosity ratio: 0.5). The coverage of these
sites was very poor when compared with natural rocky reefs, being characterized by the
dominance of creeping and encrusting algae (70%) and a residual presence of
invertebrates.
Finally, the site near the thermal effluent comprises extensions of rocky substrate with
ridges (83%) and some blocks surrounded by sand (16%) (Mean rugosity ratio: 0.2). The
control site had higher algal coverage (92%) characterized by the dominance of creeping
and encrusting algae (60%), which contrasted with the 60% of creeping algae in a total of
67% of cover in the disturbed site. Sponges, polychaetes, hydrozoans and gastropods
were the dominant invertebrates at both sites.
Fish assemblages
A total of 51 species were identified in a total count of 8983 individuals (Table 2.2). Fish
assemblages were characterized by the dominance of species belonging to the families
Labridae, Sparidae, Gobiidae and Blenniidae. In general, the species belonging to the
Labridae family (except Coris julis), and the species Diplodus sargus, D. vulgaris, Sarpa
salpa, Parablennius pilicornis and Tripterygion delaisi, had higher densities at control sites,
excluding the family Labridae from the sites inside Sines harbor (Table 2.2). Furthermore,
a remarkable difference between fished and protected sites (average dissimilarity: 40.29%)
was found for C. julis, with 3-fold higher density at the disturbed site and the species S.
salpa with 2-fold higher density at the control site, each one contributing more than 15% for
the dissimilarity (SIMPER results). The remaining species D. vulgaris, D. sargus, T. delaisi
and Gobius xanthocephalus had higher density at the control site (> 5% contribution for
sites dissimilarity).

Chapter 2
44
Table 2.2 Mean density (ind. m
-2) and standard deviation (in parenthesis) of fish species recorded at control (C) and disturbed (D) sites of the pressures of
fishing, port activities, sewage discharges and thermal effluent. * Species with frequency of occurrence lower than 50%.

Response of rocky reef fish to anthropogenic pressures
45
Table 2.2 (continued)

Chapter 2
46
When compared with the control site, all species exhibited lower densities at the sewage-
disturbed site (Table 2.2), with D. vulgaris, P. pillicornis, C. julis, Ctenolabrus rupestris, T.
delaisi and Gobiusculus flavescens being the highest contributing species for the
dissimilarities found (> 5% contribution) (average dissimilarity: 59.48%). Among these
species, C. julis was the only species that stood out in the sewage-disturbed site, but a
great difference in size class distribution was observed: small individuals (< 8 cm) were
only recorded at the control site, while adults (> 15 cm) had higher density at the disturbed
site.
The main species contributing to the dissimilarities between sites in the case of port activity
(average dissimilarity: 43.79%) were P. pillicornis, S. salpa, Dicentrarchus labrax and D.
sargus in the control site and G. xanthocephalus in the disturbed site. Finally, for the
impact of the thermal effluent (average dissimilarity: 57.04%), only P. pilicornis and C.
rupestris characterized the disturbed site and G. flavescens, Symphodus melops and D.
vulgaris the control (> 5% contribution).
Fish-based metrics
PERMANOVA results showed significant differences among the fish metrics for each pair
of sites (D vs. C), with the exception of the thermal effluent pressure: fishing (pseudo-F =
3.162, p-value < 0.05), sewage discharges (pseudo-F = 6.594, p-value < 0.05), port
activities (pseudo-F = 3.544, p-value < 0.05), thermal effluent (pseudo-F = 1.403, p-value >
0.05). These results were in agreement with the PCO analysis, where the first axis
separates disturbed from control sites for all stressors with the exception of the thermal
effluent (Figure 2.2). No significant differences in multivariate dispersions were found by
the PERMDISP routine within each group (control and disturbed) for all pressures (p-
values > 0.05), with the exception of sewage discharges, which differed in their relative
dispersion. This is however unlikely to affect the performance of PERMANOVA given the
distance between groups (Figure 2.2B).
The results of the discriminant CAP analysis of the fish metrics dataset also showed
significant differences between C and D sites (fishing, sewage discharges and port
activities with p-values < 0.05). The correlation of individual metrics with the first canonical
axis corresponding to pressure effects and the Mann-Whitney test results are shown in
Table 2.3 and Table 2.4.

Response of rocky reef fish to anthropogenic pressures
47
Figure 2.2 Principal Coordinates Analysis (PCO) comparing fish-based metrics at control (gray circles)
and disturbed (black triangles) sites for the pressures of fishing (A), sewage discharges (B), port activities (C) and thermal effluent (D).
The highest contributing metrics for the discrimination between the fishing pressure sites
were related with the dependence on a specific substrate (density of territorial species,
density of rock specialists and density of sand specialists) with r > 0.75 (Table 2.3). These
results suggest that habitat features are having a strong influence on species distribution.
In fact, if we remove the most habitat-dependent species (Blenniidae, Gobiidae,
Gobiesocidae and Tripterygiidae) the effect of fishing pressure is no longer significant
(PERMANOVA: Pseudo-F = 1.889 p-value > 0.05). However, the Mann-Whitney test
shows that metrics related with medium commercial value and density of herbivores have
consistently greater values at the control site, as well as the density of generalist
individuals at disturbed site (see Table 2.4). This means that some differences between
zones were found but they were not enough to be detected in PERMANOVA. Facing these
results and accounting that the metric density of individuals with medium commercial value
is highly correlated with several metrics, especially with the density of herbivores (r = 0.90),
the metrics density of herbivores and density of generalist individuals were selected.

Chapter 2
48
Table 2.3 Results of the Canonical Analysis of Principal Coordinates (CAP) showing fish-based
metrics contributing most to distinguish control from disturbed sites by type of pressure (correlation coefficients r > 0.5). Metrics were calculated using all species. The metrics that showed consistent responses to pressure are indicated (•) (Mann-Whitney test results). Metrics associated with disturbed sites are marked with an asterisk (*).

Response of rocky reef fish to anthropogenic pressures
49
Table 2.4 Results of the Canonical Analysis of Principal Coordinates (CAP) showing fish-based
metrics contributing most to distinguish fished from control sites, estimated without cryptobenthic species (correlation coefficients |r| > 0.5). Metrics that showed consistent responses to pressure are marked (•) (Mann-Whitney test results). Metrics associated with disturbed sites are marked with an asterist (*).
On the other hand, despite not being consistently higher at the control site, the metric
density of large individuals with medium to high commercial value (> 20 cm) was selected,
since it had lower correlation with other metrics and has a greater potential as indicator of
fishing pressure.
For the remaining pressures, the PERMANOVA results without cryptobenthic species were
consistent with the ones previously obtained, maintaining the differences between sites (C
vs. D) for the sewage and port activities and showing non-significant results for the thermal
effluent. There was a greater number of metrics responding to sewage discharges and port
activities and the majority of them tend to have higher values at the control site. The
density of juveniles and total density were the highest contributing metrics for the
discrimination between the sewage and the control with r > 0.85. While the density of
individuals over maturity size, density of macrocarnivores, density of territorial individuals
and density of generalist individuals were associated with the control site of port activities
(see Table 2.3 for details of remaining metrics). Through the analysis of the Spearman
rank correlations, the above mentioned metrics related with trophic guilds and the metrics
density of juveniles, density of territorial individuals and density of generalist individuals
were selected due to their lower redundancy and higher discriminating response between
control and disturbed sites. In this context, two major patterns of response were identified:
(1) selective pressure, which affects differentially the fish assemblages, with specific
metrics responding to pressure (fishing); and (2) broad-range pressure, which affects the
entire fish assemblage with fish metrics representing several attributes (trophic, structure,
resilience, habitat, nursery function) responding to its presence, independently of the
assemblage type (sewage discharges, port activities).

Chapter 2
50
Summarizing, in a multi-stressor approach perspective and accounting for sensitivity,
biological meaning and redundancy results, the following metrics were selected as the
most suitable to predict and understand fish assemblage changes: density of invertebrate
feeders, density of omnivores, density of macrocarnivores, density of herbivores, density of
generalists, density of territorial individuals, density of large individuals with medium to high
commercial value (> 20 cm) and density of juveniles.
Discussion
Since ecological guilds group species with some degree of functional overlap, the metric
approach provides an operational unit linking individual species characteristics with
community level responses (Noble et al. 2007) and, as showed in this study, is extremely
useful to understand changes due to human-induced pressure.
Effects of fishing
Although the choice of a control site to represent the fishing pressure attempted to
maximize de structural similarity among sites, the diversity of boulder sizes was greater at
the control site than at the fished site (Gonçalves et al. 2002). Random-sized boulders
constitute a complex habitat (Gonçalves et al. 2002) and consequently tend to support
higher density and diversity of cryptobenthic species (Macpherson 1994; Fasola et al.
1997; La Mesa et al. 2006). Additionally, canopy formed by A. armata (dominant at fished
site) creates refuge that may reduce predation by fishes on small epifauna (Sala 1997).
Although these algae present clear seasonal variability (Sala 1997), the observed fish
assemblage does not change with the reduction of its cover (Henriques et al. unpublished
data). Therefore, considering the low mobility of territorial cryptobenthic species, their diet
of small invertebrates and habitat complexity could explain their preference for the control
site. These facts clarify the results of discriminant analysis, where the metrics that best
explained the differences between sites were associated to cryptobenthic species.
Increases in total abundance, biomass and size of fish within the boundaries of MPA of
Arrábida, particularly for target species, are some of the reported differences as a result of
protection (see García-Charton et al. 2008 for a review). Besides, changes in abundance
of predatory fish can cause ecosystem wide effects such as trophic cascades (Pennigar et
al. 2000; Guidetti & Sala 2007) and decreases in small cryptic fishes (Willis & Anderson
2003), which make the effects stemming from fishing very complex. Furthermore, these
differences increase with time of protection and are dependent of other factors such as
Response of rocky reef fish to anthropogenic pressures
51
recruitment patterns, exportation of biomass, connectivity, fishing effort outside the
reserve, law enforcement and reserve size (Claudet et al. 2006; García-Charton et al.
2008; Guidetti et al. 2008). This MPA was established in 2005 but a phased process to
implement the regulatory measures of the no-take area was adopted. Although the control
site was located in an area that is fully protected since 2008, the 2 years of protection were
not enough to detect strong differences between sites (C vs. D) regarding the fish-based
metrics estimated with the non-cryptobenthic species, suggesting that this reserve is still
on a trajectory of recovery.
In general, Sparidae, Serranidae and large Labridae individuals appear to benefit from
protection, however, the response patterns of fishes remains heterogeneous (García-
Charton et al. 2008). The results of some meta-analyses are in agreement with the
observed pattern, suggesting that the species S. salpa responds positively to medium to
high levels of protection (Guidetti et al. 2008), while C. julis has a negative response
(Ojeda-Martinez et al. 2007). Such results were associated to different factors like density
of predators, local fishing traditions and inter-specific relationships (Ojeda-Martinez et al.
2007; Guidetti et al. 2008). C. julis is a generalist species (wide home ranges and flexibility
of diets) without commercial value in this zone, so the high density observed at the fished
site is probably a consequence of competition with other species that take advantage of
protection. On the other hand, the highest densities of the herbivore S. salpa are probably
directly related with fishing impacts, considering that it is frequently caught by fishing gears
used in this area and that the same density pattern was observed in other seasons when
A. armata, that is not in the diet of this species, was much less abundant at the fished zone
(Henriques et al. unpublished data). These facts explain the CAP analysis and Mann-
Whitney results, where the density of herbivores, density of individuals with medium
commercial value and density of juveniles characterized the control site, while, the density
of generalist individuals was consistently associated to fished sites.
Slightly higher densities of the target species Diplodus spp. were found at control site but
their late maturity, slow growth rate and low rates of recruitment makes their recovery
longer (Ojeda-Martinez et al. 2007). Although not always consistently higher at the control
site, the metric density of large individuals with medium to high commercial value (> 20
cm), composed mainly by Sparidae and some large Labridae individuals (Labrus spp.),
helps in the discrimination between sites (C vs. D). These results are in accordance with
previous work by Claudet et al. (2006), that only found significant differences in medium-
sized species (20-30 cm) and in medium to high-value commercial species after 3 years of
protection, as well as for the large species (> 30 cm) after 6 years. Regarding the

Chapter 2
52
remaining metrics, it was expected that the number of species, the total density and the
density of macrocarnivores would have higher values at the control site (Claudet et al.
2006; Guidetti & Sala 2007; Guidetti et al. 2008). However, the number of species metric
loss significance when the most habitat-dependent species were removed from the
analyses and the total density metric was not significant probably due to the replacement
of species (e.g. C. julis). Finally, as the density of macrocarnivores is composed by
relatively uncommon and usually solitary species with slow growth rates (e.g. Conger
conger, Muraena helena, Serranus cabrilla) their response to fishing protection is delayed.
This means that with larger protection periods these metrics could become good
indicators, nonetheless, the metric density of large individuals with medium to high
commercial value (> 20 cm) seems more sensitive, since it takes into account both density
and size of species directly impacted by fishing.
Effects of sewage discharges
Urban and industrial untreated discharges led to broad range changes on fish
assemblages, with significant differences observed between control and disturbed sites
using fish-based metrics with and without cryptobenthic species. These results suggest
that the whole fish assemblage was affected by the sewage discharges pressure. Changes
on diversity, abundance and trophic structure of fish assemblages are some of the main
responses reported due to sewage impacts (McKinley & Johnston 2010 and references
therein). However, the direction of changes is often unclear. For instance, the effect on
species richness is controversial, with reports of increase, decrease or even no differences
found between control and disturbed sites (e.g. Guidetti et al. 2002; Khalaf & Kochzius
2002; Guidetti et al. 2003; Johnston & Roberts 2009; Azzurro et al. 2010; McKinley &
Johnston 2010). In fact, the metric total number of species had slightly higher values at the
control site and low correlation with canonical axes (r = 0.44). Consequently, it was
considered a weak indicator of sewage effects.
The main differences between C and D sites were in the density of juveniles, total density,
density of individuals that use water column and cavities, density of omnivorous, density of
species with medium resilience and density of invertebrate feeders. These results are
explained by strong differences in density of Sparidae (omnivorous), Labridae (invertebrate
feeders, medium resilience) and some cryptobenthic species (omnivorous and invertebrate
feeders) which were higher at the control site. A decrease in abundance of Sparidae and
Labridae due to sewage was previously demonstrated (Guidetti et al. 2002; Guidetti et al.
2003; Azzurro et al. 2010). In the present study, 3-fold higher density was observed for the

Response of rocky reef fish to anthropogenic pressures
53
cryptobenthic species P. pilicornis and T. delaisi at the control site, which contrasts with
results from Azzurro et al. (2010), who found higher abundances of opportunistic-tolerant
cryptobenthic species (Gobius buchicchi and Parablennius rouxi) at sewage impacted
locations. Due to their lower mobility and high dependence on the substratum, benthic
fishes are probably more affected by contaminants, unless they profit from opportunistic
life-history strategies or high tolerance to stressful conditions (Azzurro et al. 2010). Despite
the organic enrichment expected from the sewage discharge, the disturbed site is also
possibly influenced by industrial wastewaters coming from a nearby stream (personal
observations), which could explain not only the low density of the above-mentioned
species and juveniles but also the low total density at the disturbed site, except for adults
of C. julis. In fact, a general decrease in fish abundance (~50%), invertebrate and fish
feeders and young life stages (larvae, settlers and juveniles) were observed as a response
to industrial disturbance (Khalaf & Kochzius 2002; McKinley & Johnston 2010). Moreover,
generalist species like C. julis that have physiological mechanisms and develop
cytoprotective proteins that increase their tolerance to pollutants, could profit from these
impacted areas (Fasulo et al. 2010), explaining the fact that it was the only species
abundant at the disturbed site.
While it has been demonstrated that some trophic guilds benefit from sewage plumes
(detritivores and planktivores) (Guidetti et al. 2002; Guidetti et al. 2003; Azzurro et al.
2010), even in association with industrial pollution (Khalaf & Kochzius 2002), none of them
stood out at the disturbed site. This contradictory result is probably due to weak detection
of pelagic species (e.g. Mugilidae) with the sampling method used that is necessarily
directed at demersal fish assemblages at depths close to 10m (deep stratum).
Unfortunately, the poor visibility of mainland Portuguese waters reduces the effectiveness
of sampling methods for pelagic species (such as stationary points). These facts also
explain the differences obtained for the total density metric in relation to other studies,
since the higher total abundance observed at sewage-impacted sites in those studies are
related to high abundances of detritivores and planktivores (Guidetti et al. 2002; Guidetti et
al. 2003; Azzurro et al. 2010).
Effects of port activities
Little is known about the impacts of port activities on fish assemblages because research
carried out has focused on the effects of artificial substratum (e.g. Clynick, 2006, 2008;
Pizzolon et al., 2008; Wen et al., 2010). Furthermore, two studies performed in zones
influenced by several anthropogenic pressures, including port activities, reported a general
Chapter 2
54
decrease in fish abundance despite not finding significant differences in the number of
species (Khalaf & Kochzius 2002; Järvik et al. 2005).
Like with sewage discharges, the whole fish assemblage was affected by this pressure,
which led to broad range changes on several metrics. In fact, the metric differences found
between these pressures are only related to the assemblage type that is affected. In
general, fish assemblages associated with artificial substrates are characterized by
species with large mobility and few sedentary/territorial species as well as low abundance
or absence of common reef-associated species (e.g. Clynick 2006, 2008; Pizzolon et al.
2008; Wen et al. 2010). This explains why metrics related to size, generalist species, top
predators (macrocarnivores) and some territorial/sedentary low mobile species were the
most sensitive (see table 2.3 for details). Moreover, similarly to what happened with
sewage effluent, total density and density of juveniles were higher at the control site,
probably due to higher levels of pollution at the disturbed site. Indeed, activities associated
with marinas, including boat cleaning, leakage of fuel and organic waste disposal cause
pollution (Clynick 2006 and references therein), which in this case is intensified by the
presence of the neighbouring fishing port highly contaminated by chemical, microbiological
and organic compounds. Furthermore, it has been reported that marinas have an important
nursery function for many commercial species (e.g. Sparidae) (Clynick 2006), so in this
case the sensitivity of juveniles to pollution makes the metric density of juveniles extremely
important to assess this type of pressure.
Effects of thermal effluent
Since the sampled sites of the thermal effluent pressure are located in temperate waters, it
is expected that the majority of species can tolerate a broad range of temperatures, with
few species living near their tolerance limits. With exception of the metric density of cold-
temperate individuals (due to the gregarious species G. flavescens), no other fish-based
metrics were specifically linked with the thermal effluent. Thus, the increase of 1ºC
(observed difference between C and D sites at the bottom) was not enough to produce
significant changes on fish assemblages, showing that the functional approach is strategic
to detect assemblage changes at both structural and functional levels, despite the small
differences found for a few species. This result is in accordance with observations by
Teixeira et al. (2012) for fish and other biological groups, where no differences were found
with an increase of 2ºC in tropical waters (supposedly more sensitive to thermal stress).

Response of rocky reef fish to anthropogenic pressures
55
Metrics selection
Fish-based metrics were selected according to their sensitivity and biological meaning, as
well as their redundancy with other metrics. This way, all the metrics of trophic structure
(except for zooplanktivores) and the metrics density of territorial individuals, density of
generalist individuals, density of large individuals with medium to high commercial value
(> 20 cm) and density of juveniles, were chosen as the most suitable to assess changes
on temperate reef fish assemblages. Conversely, although broadly used in estuarine and
freshwater fish-based indices, the metrics number of species and dominance were not
selected as they showed weak responses to the studied pressure sources. In general,
attributes with few functional guilds (composed by 2-3 metrics) have higher redundancy
than other metrics (e.g. attribute of resilience). Moreover, the response patterns of metrics
measured in ratio are difficult to predict since they are dependent of the observed total
density (e.g. commercial/non commercial ratio).
There is some disagreement about the extent to which redundancy among metrics is
problematic for developing multimetric indices. Despite not having been included in the
final selection due to some degree of redundancy with other metrics, the total density
metric provides sensitive information to detect pollution problems. Thus, future research
regarding the implications of selecting redundant metrics that are highly sensitive to
pressures and the test of methods to prevent metric overfitting (e.g. down weighting
redundant metrics so that they count as a single metric in the final index value) are
required in order to conclude if the use of these metrics is suitable.
Some of the existing multimetric indices employ metrics related with opportunistic species
(Noble et al. 2007). From our results, the possible use of adults of C. julis as indicator
species for degraded sites (tolerant to pollution and generalist) seems promising but care
is needed since this species prefers deeper habitats (García-Charton & Pérez-Ruzafa
2001). Furthermore, no assessment of quality status of fish communities should be made
without looking for species information to check if some tolerant-opportunistic species are
affecting the results and consequently leading the metric values in unexpected directions
(e.g. increase of opportunistic-tolerant cryptobenthic individuals at sewage impacted
locations).
The results obtained in this study highlight the importance of having species-habitat
relationships into consideration when interpreting metric values, in order to ensure that
differences found are due to the presence of a human-induced pressure. This is especially
important in control-impact sampling designs which are the most commonly used, as many

Chapter 2
56
times before-impact data is not accessible or the sampling methods are not comparable
(Osenberg et al. 2006). Finally, the use of replicate variability to test metrics strengthened
the sensitivity and consistency of the selection, considering that the application of
multimetric indices often uses the sum of replicates to calculate final metric values.
Although it was possible to select a group of sensitive metrics, further research is needed
to address spatial (including across biogeographic regions) and temporal (seasonal and
inter-annual) variability in the response of those metrics. Moreover, this research should
include not only the assessed pressures but also other drivers of pressure (e.g. dredging
activities, aquaculture), in order to test the applicability of the selected metrics and
strengthen their sensitivity. Overall, the results obtained were supported by other studies
that analyzed the effects of similar pressures at the species level, thus the use of the
selected metrics seems promising. However, it would be premature to reach a final
conclusion regarding their use in multimetric indices without further testing, and this study
is but a starting point for the successful use of reef fish assemblages as indicators.
Acknowledgements
The authors would like to thank all the volunteers for the invaluable aid during field surveys
and the Instituto da Conservação da Natureza e Biodiversidade (ICNB) for issuing diving
permissions at the Arrábida Marine Protected Area. Host institution was funded with
project PEst-OE/MAR/UI0199/2011 and PhD grants attributed to Sofia Henriques
(SFRH/BD/47034/2008), Miguel Pais (SFRH/BD/46639/2008) and Marisa Isabel Batista
(SFRH/BD/64395/2009), all from Fundação para a Ciência e Tecnologia (FCT). The
authors wish to thank the anonymous reviewers for providing useful comments on the
paper.
Literature cited
Anderson M.J. (2001). A new method for non-parametric multivariate analysis of variance. Austral Ecology, 26, 32-46.
Anderson M.J. & Willis T.J. (2003). Canonical analysis of principal coordinates: A useful method of constrained ordination for ecology. Ecology, 84, 511-525.
Anderson M.J., Gorley R.N. & Clarke K.R. (2008). PERMANOVA + for PRIMER Guide to software and statistical methods. PRIMER-E: Plymounth, UK.
Azzurro E., Matiddi M., Fanelli E., Guidetti P., La Mesa G., Scarpato A. & Axiak V. (2010). Sewage pollution impact on Mediterranean rocky-reef fish assemblages. Marine Environmental Research, 69, 390-7.
Ban N.C., Alidina H.M. & Ardron J.A. (2010). Cumulative impact mapping: Advances, relevance and limitations to marine management and conservation, using Canada's Pacific waters as a case study. Marine Policy, 34, 876-886.

Response of rocky reef fish to anthropogenic pressures
57
Borja A., Dauer D.M. & Gremare A. (2012). The importance of setting targets and reference conditions in assessing marine ecosystem quality. Ecological Indicators, 12, 1-7.
Claudet J., Pelletier D., Jouvenel J.Y., Bachet F. & Galzin R. (2006). Assessing the effects of marine protected area (MPA) on a reef fish assemblage in a northwestern Mediterranean marine reserve: Identifying community-based indicators. Biological Conservation, 130, 349-369.
Claudet J., Osenberg C.W., Domenici P., Badalamenti F., Milazzo M., Falcon J.M., Bertocci I., Benedetti-Cecchi L., Garcia-Charton J.A., Goni R., Borg J.A., Forcada A., De Lucia G.A., Perez-Ruzafa A., Afonso P., Brito A., Guala I., Le Direach L., Sanchez-Jerez P., Somerfield P.J. & Planes S. (2010). Marine reserves: fish life history and ecological traits matter. Ecological Applications 20, 830-839.
Clynick B.G. (2006). Assemblages of fish associated with coastal marinas in north-western Italy. Journal of the Marine Biological Association of the United Kingdom, 86, 847-852.
Clynick B.G. (2008). Characteristics of an urban fish assemblage: distribution of fish associated with coastal marinas. Marine Environmental Research, 65, 18-33.
Crain C.M., Halpern B.S., Beck M.W. & Kappel C.V. (2009). Understanding and managing human threats to the coastal marine environment. Annals of the New York Academy of Sciences, 1162, 39-62.
Directive 2008/56/CE. Directive of the European Parliment and the Council of 17 June 2008, establishing a framework for community action in the field of marine environmental policy (Marine Strategy Framework Directive). In: Official Journal of the European Union L 164, 19-40.
Elliott M., Whitfield A.K., Potter I.C., Blaber S.J.M., Cyrus D.P., Nordlie F.G. & Harrison T.D. (2007). The guild approach to categorizing estuarine fish assemblages: a global review. Fish and Fisheries, 8, 241-268.
Fasola M., Canova L., Foschi F., Novelli O. & Bressan M. (1997). Resource use by a Mediterranean rocky slope fish assemblage. Marine Ecology-Pubblicazioni Della Stazione Zoologica Di Napoli I, 18, 51-66.
Fasulo S., Mauceri A., Maisano M., Giannetto A., Parrino V., Gennuso F. & D'Agata A. (2010). Immunohistochemical and molecular biomarkers in Coris julis exposed to environmental contaminants. Ecotoxicology and Environmental Safety, 73, 873-82.
Ferreira C.E.L., Goncalves J.E.A. & Coutinho R. (2001). Community structure of fishes and habitat complexity on a tropical rocky shore. Environmental Biology of Fishes, 61, 353-369.
Fiúza A.F.G., Macedo M.E. & Guerreiro M.R. (1982). Climatological space and time variation of the Portuguese coastal upwelling. Oceanologica Acta, 5, 31-40.
Froese F. & Pauly D. (2012). FishBase. Available at: http://www.fishbase.org. Accessed 2012.
García-Charton J.A. & Pérez-Ruzafa A. (2001). Spatial pattern and the habitat structure of a Mediterranean rocky reef fish local assemblage. Marine Biology, 138, 917-934.
García-Charton J.A., Pérez-Ruzafa A., Marcos C., Claudet J., Badalamenti F., Benedetti-Cecchi L., Falcón J.M., Milazzo M., Schembri P.J., Stobart B., Vandeperre F., Brito A., Chemello R., Dimech M., Domenici P., Guala I., Le Diréach L., Maggi E. & Planes S. (2008). Effectiveness of European Atlanto-Mediterranean MPAs: Do they accomplish the expected effects on populations, communities and ecosystems? Journal for Nature Conservation, 16, 193-221.
Gonçalves E.J., Henriques M. & Almada V. (2002). Use of a temperate reef-fish community to identify priorities in the establishment of a marine protected area. In: In: Beumer, J. P., Grant, A. & Smith, D. C. (Eds). Aquatic Protected Areas: what works best and how do we know? Proceedings of the World Congress on Aquatic Protected Areas (pp. 261-272), Cairns, Australia – August 2002.
Guidetti P., Fanelli G., Fraschetti S., Terlizzi A. & Boero F. (2002). Coastal fish indicate human-induced changes in the Mediterranean littoral. Marine Environmental Research, 53, 77-94.
Guidetti P., Terlizzi A., Fraschetti S. & Boero F. (2003). Changes in Mediterranean rocky-reef fish assemblages exposed to sewage pollution. Marine Ecology Progress Series, 253, 269-278.

Chapter 2
58
Guidetti P. & Sala E. (2007). Community-wide effects of marine reserves in the Mediterranean Sea. Marine Ecology Progress Series, 335, 43-56.
Guidetti P., Milazzo M., Bussotti S., Molinari A., Murenu M., Pais A., Spanò N., Balzano R., Agardy T., Boero F., Carrada G.C., Cattaneo-Vietti R., Cau A., Chemello R., Greco S., Manganaro A., Notarbartolo di Sciara G., Russo G.F. & Tunesi L. (2008). Italian marine reserve effectiveness: Does enforcement matter? Biological Conservation, 141, 699-709.
Halpern B.S., Walbridge S., Selkoe K.A., Kappel C.V., Micheli F., D'Agrosa C., Bruno J.F., Casey K.S., Ebert C., Fox H.E., Fujita R., Heinemann D., Lenihan H.S., Madin E.M.P., Perry M.T., Selig E.R., Spalding M., Steneck R. & Watson R. (2008). A Global Map of Human Impact on Marine Ecosystems. Science, 319, 948-952.
Harmelin-Vivien M., Ledireach L., Sempere B.J., Charbonnel E., Garcia-Charton J., Ody D., Perez-Ruzafa A., Renones O., Sanchez P.J. & Valle C. (2008). Gradients of abundance and biomass across reserve boundaries in six Mediterranean marine protected areas: Evidence of fish spillover? Biological Conservation, 141, 1829-1839.
Henriques M., Gonçalves E.J. & Almada V.C. (2007). Rapid shifts in a marine fish assemblage follow fluctuations in winter sea conditions. Marine Ecology Progress Series, 340, 259-270.
Henriques S., Pais M.P., Costa M.J. & Cabral H. (2008). Development of a fish-based multimetric index to assess the ecological quality of marine habitats: the Marine Fish Community Index. Marine Pollution Bulletin, 56, 1913-1934.
Hewitt J.E., Anderson M.J. & Thrush S.F. (2005). Assessing and monitoring ecological community health in marine systems. Ecological Applications, 15, 942-953.
Järvik A., Drevs T., Järv L., Raid T. & Jaanus A. (2005). Monitoring of the impact of Muuga Port activities on fish communities and fishery in Muuga Bay in 1994-2004 as: difficulties in results definition and needs for method improvement. ICES Journal of Marine Science, 12.
Johnston E.L. & Roberts D.A. (2009). Contaminants reduce the richness and evenness of marine communities: a review and meta-analysis. Environmental Pollution, 157, 1745-52.
Khalaf M.A. & Kochzius M. (2002). Changes in trophic community structure of shore fishes at an industrial site in the Gulf of Aqaba, Red Sea. Marine Ecology Progress Series, 239, 287-299.
Korpinen S., Meski L., Andersen J.H. & Laamanen M. (2012). Human pressures and their potential impact on the Baltic Sea ecosystem. Ecological Indicators, 15, 105-114.
La Mesa G., Di Muccio S. & Vacchi M. (2006). Structure of a Mediterranean cryptobenthic fish community and its relationships with habitat characteristics. Marine Biology, 149, 149-167.
Macpherson E. (1994). Substrate Utilization in a Mediterranean Littoral Fish Community. Marine Ecology-Progress Series, 114, 211-218.
McKinley A. & Johnston E.L. (2010). Impacts of contaminant sources on marine fish abundance and species richness: a review and meta-analysis of evidence from the field. Marine Ecology Progress Series, 420, 175-191.
Mosqueira I., Cote I.M., Jennings S. & Reynolds J.D. (2000). Conservation benefits of marine reserves for fish populations. Animal Conservation, 3, 321-332.
Noble R.A.A., Cowx I.G., Goffaux D. & Kestemont P. (2007). Assessing the health of European rivers using functional ecological guilds of fish communities: standardising species classification and approaches to metric selection. Fisheries Management and Ecology, 14, 381-392.
Ojeda-Martinez C., Bayle-Sempere J.T., Sanchez-Jerez P., Forcada A. & Valle C. (2007). Detecting conservation benefits in spatially protected fish populations with meta-analysis of long-term monitoring data. Marine Biology, 151, 1153-1161.
Osenberg C.W., Bolker B.M., White J.-S., St. Mary C.M. & Shima J.S. (2006). Statistical issues and design in ecological restorations: lessons learned from marine reserves. In: Fundations of restoration ecology (eds. Falk D, Palmer N & Zedler J). Island Press Washington, USA.

Response of rocky reef fish to anthropogenic pressures
59
Pelletier D., Garcia-Charton J.A., Ferraris J., David G., Thebaud O., Letourneur Y., Claudet J., Amand M., Kulbicki M. & Galzin R. (2005). Designing indicators for assessing the effects of marine protected areas on coral reef ecosystems: A multidisciplinary standpoint. Aquatic Living Resources, 18, 15-33.
Pennigar J.K., Polunin N.V.C., Francour P., Badalamenti F., Chemello R., Harmelin-Vivien M.L., Hereu B., Milazzo M., Zabala M., D'Anna G. & Pipitone C. (2000). Trophic cascates in benthic marine ecosystems: lessons for fisheries and protected-area management. Environmental Conservation, 27, 179-200.
Pizzolon M., Cenci E. & Mazzoldi C. (2008). The onset of fish colonization in a coastal defence structure (Chioggia, Northern Adriatic Sea). Estuarine Coastal and Shelf Science, 78, 166-178.
Rice J.C. (2005). Understanding fish habitat ecology to achieve conservation. Journal of Fish Biology, 67, 1-22.
Roset N., Grenouillet G., Goffaux D., Pont D. & Kestemont P. (2007). A review of existing fish assemblage indicators and methodologies. Fisheries Management and Ecology, 14, 393-405.
Sala E. (1997). The rule of fishes organization of a Mediterranean sublittoral community II: Epifaunal communities. Journal of Experimental Marine Biology and Ecology, 212, 45-60.
Spatharis S. & Tsirtsis G. (2010). Ecological quality scales based on phytoplankton for the implementation of Water Framework Directive in the Eastern Mediterranean. Ecological Indicators, 10, 840-847.
Teixeira T.P., Neves L.M. & Araujo F.G. (2012). Thermal impact of a nuclear power plant in a coastal area in Southeastern Brazil: effects of heating and physical structure on benthic cover and fish communities. Hydrobiologia, 684, 161-175.
Wen C.K., Pratchett M.S., Shao K.T., Kan K.P. & Chan B.K. (2010). Effects of habitat modification on coastal fish assemblages. Journal of Fish Biology, 77, 1674-87.
Willis T.J. & Anderson M.J. (2003). Structure of cryptic reef fish assemblages: relationships with habitat characteristics and predator density. Marine Ecology Progress Series, 257, 209-221.

Chapter 2
60
Supplementary data I. Database used to calculate the several fish-based metrics. The exhibit list present the ecological parameters characterized for
each species: trophic level, maturity length, mobility (hm - high, mm - medium, te - territorial, se - sedentary), feeding guilds (inv - invertebrate feeders, ma - macrocarnivores, pi - piscivores, om - omnivores, zoo-zooplanktonivores, he-herbivores), qualitative abundance ( VC - very common, C - common, LC - less common, R - rare), commercial value (€ - nor or low, €€ - medium, €€€ - high), resilience (VL - very low, L - low, M - medium, H - high), habitat association ( rockcave - use mainly substrate covered by algae and water column, watcave - use water column and cavities, gen - generalists individuals, rockspe and sandspe - rock or sand specialists, respectively, watalgae - use mainly substrate covered by algae and water column, wat - water column), biogeographic group (Temp- temperate, Eury- eurythermic, Warm - warm-temperate, Cold- cold-temperate, Trop- tropical).
Response of rocky reef fish to anthropogenic pressures
61

63
CHAPTER 3
Henriques S., Pais M.P., Costa M.J. & Cabral H.N. (2013). Seasonal variability of
rocky reef fish assemblages: detecting functional and structural changes due to
fishing effects. Journal of Sea Research 79, 50-59.


Influence of seasonal variability in fish-based metrics and their performance
65
Seasonal variability of rocky reef fish assemblages:
Detecting functional and structural changes due to fishing
effects
Abstract: The present study analysed the effects of seasonal variation on the stability of fish-based metrics and their capability to detect changes in fish assemblages, which is yet poorly understood despite the general idea that guilds are more resilient to natural variability than species abundances. Three zones subject to different levels of fishing pressure inside the Arrábida Marine Protected Area (MPA) were sampled seasonally. The results showed differences between warm (summer and autumn) and cold (winter and spring) seasons, with the autumn clearly standing out. In general, the values of the metrics density of juveniles, density of invertebrate feeders and density of omnivores increased in warm seasons, which can be attributed to differences in recruitment patterns, spawning migrations and feeding activity among seasons. The density of generalist/opportunistic individuals was sensitive to the effect of fishing, with higher values at zones with the lowest level of protection, while the density of individuals with high commercial value only responded to fishing in the autumn, due to a cumulative result of both juveniles and adults abundances during this season. Overall, this study showed that seasonal variability affects structural and functional features of the fish assemblage and that might influence the detection of changes as a result of anthropogenic pressures. The choice of a specific season, during warm sea conditions after the spawning period (July-October), seems to be more adequate to assess changes on rocky-reef fish assemblages.
Keywords: Seasonal variability, fish-based metrics, fishing pressure, temperate rocky
reefs, Portugal.
Introduction
Temperate rocky reefs are characterized by a large biological diversity which depends on
the interaction of physical and biological factors that can cause strong fluctuations in the
distribution and abundance patterns of marine assemblages (Holbrook et al. 1994; Rubal
et al. 2011). Habitat complexity and exposure (e.g. Friedlander & Parrish 1998; Lara &
Gonzalez 1998; García-Charton & Pérez-Ruzafa 2001; Friedlander et al. 2003; La Mesa et
al. 2011a), seasonal variability (e.g. Holbrook et al. 1994; Friedlander & Parrish 1998;
Magill & Sayer 2002; Beldade et al. 2006) and inter-annual climatic shifts (e.g. Holbrook et
al. 1994; Henriques et al. 2007), are some of the main factors affecting the persistence of
species in reefs depending on their ecological requirements, interspecific relationships, life-
cycle and mobility patterns. Consequently, they can buffer the effects of anthropogenic
pressures or lead to misinterpretation of changes in marine communities (Holbrook et al.
1994).
In recent years, short-term indicators of anthropogenic effects on marine assemblages
have become an important issue in applied ecology and implementation of international
policies, such as the Marine Strategy Framework Directive (Directive 2008/56/CE). The

Chapter 3
66
usefulness of any state indicator will depend on how well it is able to distinguish
anthropogenic from natural variability (Niemi & McDonald 2004). Thus, the analysis of any
indicator should take into consideration the above-mentioned factors in order to not only
understand stress-response relationships, but also to select the most suitable indicators.
Marine Protected Areas (MPA) are broadly used in marine conservation, aiming to restore
and protect the structure and function of marine ecosystems (Micheli et al. 2004). By
limiting or forbidding fishing activities in some areas (e.g. no-take zones), MPAs are the
best case studies to analyse the effects of fishing on multispecies assemblages as well as
their recovery trajectories (Micheli et al. 2004). Although the differences between protected
and fished areas depend upon the age of reserves, several other factors could contribute
to reserve effectiveness, namely law enforcement, species home-range, fishing effort
outside the reserve, reserve size, species recruitment patterns and connectivity between
habitats (Claudet et al. 2006; García-Charton et al. 2008; Guidetti et al. 2008). Moreover,
these factors could lead to differences between geographical areas in what regards the
effects of fishing, making them less predictable.
In general, MPAs are expected to increase the density and biomass of fish assemblages,
especially of target and large-bodied species, nevertheless, several studies report complex
top-down and bottom-up changes due to habitat quality improvement, competition and
predator-prey interactions, which can lead to changes on non-target species depending
upon their role in the ecosystem (e.g. Pennigar et al. 2000; Ruitton et al. 2000; Willis &
Anderson 2003; Micheli et al. 2004; Guidetti & Sala 2007). In Europe, MPA effects are well
known for some geographical areas like the Mediterranean Sea (see García-Charton et al.
2008 for a brief review; Fenberg et al. 2012), but are poorly studied in the north-eastern
Atlantic. Although several fish-based metrics related with the abundance/biomass of
trophic groups (e.g. piscivores and macrocarnivores), fish size, high commercial value and
indicator species have been successfully used as indicators of fishing pressure within
MPAs (e.g. Claudet et al. 2006; Guidetti & Sala 2007), there is a considerable lack of
knowledge about the consequences of seasonal variability on those metrics, since in this
case the studies have been focused on seasonal fluctuations of species (e.g. Holbrook et
al. 1994; Friedlander & Parrish 1998; Magill & Sayer 2002; Beldade et al. 2006).
It is recognized that the use of functional guilds to assess anthropogenic impacts has
several advantages as they tend to be more resilient to natural variation and respond more
predictably to stress (Elliott et al. 2007; Henriques et al. 2008; Pais et al. 2012).
Furthermore, since guilds group species with some degree of functional overlap in the

Influence of seasonal variability in fish-based metrics and their performance
67
ecosystem they could be easily applicable to other regions (Elliott et al. 2007; Noble et al.
2007). In this context, based on several fish-based metrics (guild approach), the present
study aimed to assess structural and functional changes in fish assemblages due to fishing
pressure and to understand the influence of seasonal variability on those metrics as well
as their ability to detect changes.
Material and Methods
Study area
The Arrábida MPA (mainland Portugal; NE Atlantic) was formally established in 2005 but
the regulatory measures were gradually implemented over the following four years (see
Sousa 2011 for details of implementation process). The before MPA covers about 53 km2
which includes a total protection zone (TPZ) of 4 km2, four partial protection zones (PPZ)
and three complementary protection zones (CPZ) covering 21 km2 and 28 km
2,
respectively (Figure 3.1). Regarding the commercial fishing inside this MPA, only licensed
vessels under 7 m length are allowed to fish, but with several restrictions: in the CPZ,
fishing activities with traps, jigging, longline and handline are allowed in all areas, whereas
nets are permitted only farther than 1/4 nm from shore line; in the PPZ, only traps, jigging
and handline are allowed farther than 200 m from shore line; the TPZ is a “no-take-no-
entry” area; in the whole MPA, trawling, dredges and handcathing commercial fishing are
forbidden. Finally, recreational angling is only permitted in the CPZ while spearfishing is
forbidden in all zones.
At the time of this study, about 73 vessels operated inside the MPA, but the number of
angling fishermen is unknown since anyone with a recreational fishing license can fish in
the CPZ. Fishing effort is high in all fished zones, being concentrated in the CPZ near the
Sesimbra village and in the PPZ surrounding the TPZ (Cabral et al. 2008). According to
Cabral et al. (2008), traps are one of the most commonly used gears within the MPA, while
gill and trammel nets concentrated in the CPZ near the exit of the Sesimbra port (> 1/4 nm)
as well as vessels fishing with jigs, longlines and handlines that normally operate less than
200 m from shoreline (see Figure 3.1 for fishing pressure details). It is important to note
that the values of fishing pressure in figure 3.1 correspond to a normal fishing day and
were estimated between September 2007 and February 2008, just before the end of
fishing allowance in the TPZ. This data represents the best available information to date
about the fishing effort within the MPA.

Chapter 3
68
Figure 3.1 Location of the Arrábida MPA showing the different levels of protection: CPZ -
complementary protection zones, PPZ - partial protection zones, TPZ - total protection zone. Triangles indicate sampled sites. Information about habitat complexity of the sampled sites is shown in the graphs. Fishing pressure values were based on the previous study of Cabral et al. (2008).
This MPA faces south and is therefore protected from the prevailing north and northwest
winds and waves (Gonçalves et al. 2002; Henriques et al. 2007). Subtidal rocky habitats
are highly heterogeneous, resulting from the disintegration of calcareous cliffs that border
the coastline and extend to tens of meters (Gonçalves et al. 2002; Henriques et al. 2007).
These rocky areas are composed of mixed patches of sand, gravel, cobble, random-sized
blocks and bedrock. Due to their heterogeneity and topographic complexity, they support a
large number of fish species (Gonçalves et al. 2002; Beldade et al. 2006).
To analyse the effects of fishing on rocky reef fish assemblages, three zones were
selected inside the MPA, one at each protection level (TPZ, PPZ, CPZ) (Figure 3.1). These
zones were selected based on their habitat characteristics which are of similar complexity.
The Combined Topography Index (CTI), the percent cover of rock, cobble and sand, the
cover of algae by structural groups (i.e. creeping, encrusting, tufts, sheet and filamentous)
and the presence/absence of invertebrate groups (i.e. sponges, anemones, hydrozoans,
gorgonians, polychaetes, gastropods, crustaceans, sea urchins, star-fish, sea cucumbers

Influence of seasonal variability in fish-based metrics and their performance
69
and ascidians) were used to characterize habitat complexity. Habitat sampling was
performed by depth strata, by deploying 12 quadrats (50x50 cm) to estimate algal cover
and the presence of invertebrates, and 8 replicates of the chain-and-tape method for the
remaining measures, by using a 25 m leaded rope as a chain and a 25 m measuring tape
to calculate the linear distance travelled by contouring the chain over the substrate and to
estimate the percent cover of different substrates (see Pais et al. 2013 for details). Since
topography remains similar year round, only quadrat sampling was repeated seasonally.
CTI was estimated for each chain-and-tape replicate through the formula CTI = (1-SR) +
NC/25 + MVR/25, where SR is the substrate rugosity index, NC the number of
corrugations and MVR the maximum vertical relief in meters (see Pais et al. 2013). The
average value of the CTI among replicates of both depth strata was used to characterize
each sampled zone.
Fish assemblages
Fishes were seasonally sampled at each site from May 2010 to February 2011 using
underwater visual census methods. Based on a pilot study (see Henriques et al. 2013),
50 m long strip-transects were randomly placed parallel to the coastline at two depth strata
(0−5 m and 5−10 m). Each transect was inspected twice, first pass for demersal species
(50x2 m) and the second for cryptobenthic species (50x1 m). On the cryptobenthic pass
only the families Blenniidae, Bothidae, Batrachoididae, Callionymidae, Congridae, Gadidae
(subfamilies Phycinae and Lotinae), Gobiesocidae, Gobiidae, Muraenidae, Scorpaenidae,
Scophthalmidae, Soleidae, Syngnathidae, Tripterygiidae and the species Ctenolabrus
rupestris and Labrus mixtus, as well as Symphodus spp. with less than 5 cm total length,
were counted (Henriques et al. 2013). A total of 144 transects were performed,
corresponding to six replicates per zone and per season. Each replicate included
observations for both depth strata pooled together, i.e. one transect at a 0-5 m depth range
and another at a 5-10m range, performed in the same dive (~80 min). A total of two
replicates were done per day. Transects were performed with a minimum visibility of 5 m.
In all transects, the abundance and total length of fish were recorded by the same divers
(S. Henriques or M.P. Pais) in order to minimize observer effects.
All fish species were allocated to their ecological and functional guilds based on the
previous classification by Henriques et al. (2008) and updated with available literature and
FishBase online database (Froese & Pauly 2012) (Supplementary data II). Species were
considered invertebrate feeders when they feed mostly on non-planktonic invertebrates,
otherwise being considered zooplanktivore. Macrocarnivores feed both on

Chapter 3
70
macroinvertebrates and vertebrates (mostly fish). Herbivores feed predominantly on
macroalgae, macrophytes, phytoplankton and microphytobenthos and omnivores feed on
detritus, filamentous algae, macrophytes, epifauna and infauna. The concepts of habitat
association were adapted from Fasola et al. (1997) and the species that use all, or most,
habitat categories, especially rocky habitats and less water column and sand, were
considered generalists. Finally, the commercial value of each species was attributed based
on Cabral et al. (2008).
With the purpose of characterizing structural and functional changes due to fishing, the
following metrics were calculated: density of invertebrate feeders, density of omnivores,
density of macrocarnivores, density of herbivores, density of generalist individuals, density
of juveniles, density of individuals with high commercial value, density of large individuals
with medium to high commercial value ( > 20 cm) and density of adults with high
commercial value (see Henriques et al. 2013 for metrics description). These metrics were
selected based on the results of a previous study that analysed the response of several
fish-based metrics to different types of human pressure, including fishing (Henriques et al.
2013), and complemented with other metrics that comprise the density and size of target
species, as these species are likely to respond quickly to fishing closure (Halpern &
Warner 2002). Moreover, the cryptobenthic species belonging to the families Gobiidae,
Bleniidae, Gobiesocidade and Tripterygiidae were excluded from the analysis in order to
minimize the potential influence of microhabitat, since they depend directly on substratum
type (Fasola et al. 1997) and it would not be expected that they benefit strongly from
reserve protection (Mosqueira et al. 2000).
Data analysis
Multivariate analysis of variance using permutations (PERMANOVA) tests the effect of one
or more factors on one or more variables on the basis of any distance or dissimilarity
measure of choice and does not assume normality of errors since the p-values are
obtained by permutations (Anderson et al. 2008). Nevertheless, PERMANOVA is sensitive
to differences in dispersion among groups, and therefore homogeneity of multivariate
dispersions was tested using a PERMDISP routine before running the PERMANOVA tests
(Anderson et al. 2008).
The similarity of habitat complexity among zones was tested using two-way PERMANOVA
analyses for biotic cover (functional groups of algae and presence/absence of invertebrate
groups) and one-way PERMANOVA analysis for habitat structure (CTI and the percent

Influence of seasonal variability in fish-based metrics and their performance
71
cover of rock, cobble and sand). When significant values of biotic cover were found for
factor zone, univariate PERMANOVA analyses were performed on each variable
individually, in order to find those responsible for the differences. The effects of different
protection levels and seasonality on fish-based metrics were analysed both through a
multivariate (all metrics) and a univariate (each metric individually) perspective using 2-way
PERMANOVA analyses (Anderson et al. 2008). With the exception of habitat structure, all
analyses were performed with both factors zone (3 levels) and season (4 levels) treated as
fixed. Only the factor zone was tested for habitat structure since it is not expected to
change seasonally. When significant differences were detected, factors were investigated
through post-hoc pair-wise comparisons.
In order to visualize multivariate patterns of fish-based metrics without constraints,
Principal Coordinates Analysis was used (PCO; Anderson et al. 2008). In addition,
Canonical Analysis of Principal Coordinates (CAP; Anderson & Willis 2003) was also
performed with the purpose of uncovering patterns that could be masked by unconstrained
analysis, by finding axes through the multivariate cloud that best discriminate between
different zones and seasons. Furthermore, Spearman correlation coefficients of metric
values with PCO and CAP axes were calculated and the most correlated metrics (r > |0.5|)
supported the discussion of the observed patterns.
All the analyses performed with fish-based metrics and habitat structure variables were
based on Euclidean distance matrices, constructed after normalizing each variable by
subtracting the mean and dividing by the standard deviation, in order to place all variables
on a comparable scale. For algae functional groups, the percentage of cover was fourth-
root transformed and the Bray-Curtis similarity index used to construct the resemblance
matrix, while for the presence/absence of invertebrate groups the resemblance matrix was
calculated using the Jaccard index. All the above-mentioned analyses were performed
using PRIMER 6 with PERMANOVA+ software package. P-values were calculated using
9999 permutations and the level of statistical significance adopted was 0.05. After running
the analyses, redundancy between metrics was checked and all of them were preserved
since no pair was found with a Spearman correlation coefficient higher than |0.85|.
Finally, the size structure of the most abundant species with high commercial value
(Diplodus vulgaris and Diplodus sargus) was plotted per zone and season in order to better
understand the effects of fishing and seasonal variability. Size structure was plotted
according to the following size classes: early juveniles (below 10 cm), juveniles (between
10 cm and the size at first maturity) and adults (above the size at first maturity).

Chapter 3
72
Results
The analysis of habitat variables showed no significant differences for habitat structure
among zones (Pseudo-F = 1.96 p > 0.05), as well as for both the factor zone and the
interaction between factors zone x season in the case of algae cover (Pseudo-F = 2.02 p >
0.05 and Pseudo-F = 1.60 p > 0.05, respectively). Regarding the presence of invertebrate
groups, the overall multivariate PERMANOVA results revealed significant differences for
the factors zone and season (Pseudo-F = 5.17 p < 0.05 and Pseudo-F = 1.60 p < 0.05,
respectively) but, more importantly, no significant differences for the interaction of both
factors (Pseudo-F = 1.02 p > 0.05).
Pair-wise comparisons for the factor zone in the PERMANOVA analyses performed on
each invertebrate group individually showed that only the hydrozoans, anemones,
gorgonians and ascidians were significantly different among zones (Pseudo-F = 5.94 p <
0.05, Pseudo-F = 11.04 p < 0.05, Pseudo-F = 10.76 p < 0.05 and Pseudo-F = 4.50 p <
0.05, respectively). With the exception of gorgonians, which differ in the TPZ when
compared to the remaining zones, hydrozoans and anemones differ in the CPZ when
compared to the PPZ and the TPZ, while ascidians only differ between the CPZ and the
TPZ. Habitat structure (substrate and topography) features are shown in Figure 3.1, while
the algae cover and the frequency of occurrence of invertebrates are presented in Table
3.1.
In the present study, a total of 47 fish species belonging to 20 families were counted in the
Arrábida MPA. Sparidae and Labridae were the most represented families in terms of
number of species (12 and 9 species, respectively) and abundance (95% of the total
abundance, on average). PERMANOVA for the fish-based metrics showed a significant
overall multivariate effect of both season and zone (Pseudo-F = 7.47 p < 0.05 and Pseudo-
F = 5.68 p < 0.05, respectively) as well a significant interaction effect (Pseudo-F = 1.51 p <
0.05). Additionally, no significant differences in multivariate dispersions was found by the
PERMDISP routine (F = 0.23 p > 0.05). Pair-wise comparisons showed significant
differences among all zones and seasons (p < 0.05), except between winter and spring
(p > 0.05), while no consistent patterns were found for the interaction between both
factors. Actually, significant differences between all zones were obtained in spring and an
opposite effect in winter, no differences were detected between the TPZ and the CPZ in
summer and between TPZ and the PPZ in autumn (see pair-wise comparisons in Table
3.2).
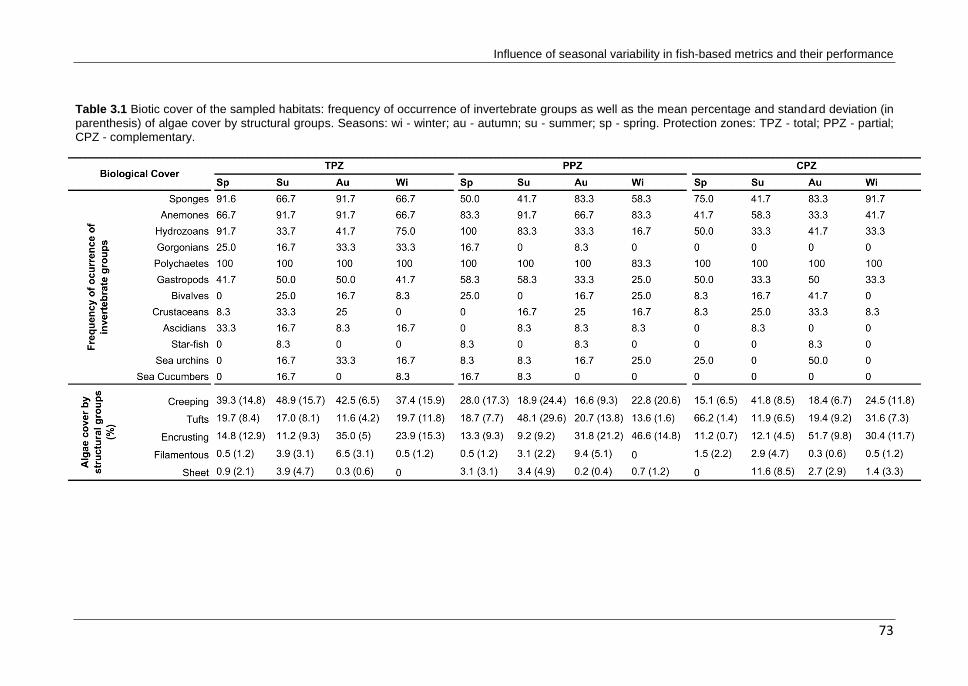
Influence of seasonal variability in fish-based metrics and their performance
73
Table 3.1 Biotic cover of the sampled habitats: frequency of occurrence of invertebrate groups as well as the mean percentage and standard deviation (in
parenthesis) of algae cover by structural groups. Seasons: wi - winter; au - autumn; su - summer; sp - spring. Protection zones: TPZ - total; PPZ - partial; CPZ - complementary.

Chapter 3
74
Table 3.2 P-values of pair-wise comparisons using permutations of the t-statistic for the interaction
between factor zone and season. TPZ - total protection zone, PPZ - partial protection zone and CPZ - complementary protection zone.
Spring Summer Autumn Winter
TPZ vs. PPZ 0.005*
0.009*
0.278
0.292
TPZ vs. CPZ 0.013*
0.700
0.003*
0.482
PPZ vs. CPZ 0.031* 0.008* 0.003* 0.552
* p-value < 0.05.
The PCO plots show a strong effect of season when compared to the effect of zone, since
all seasons, particularly autumn, are clearly separated in the multivariate data cloud. No
patterns of zones were globally detected if seasons were not taken into account (Figures
3.2A and 3.2B). The discriminant CAP analysis, however, was able to find axes to
separate zones (Figure 3.2C), with a squared canonical correlation of δ2 = 0.523 (p < 0.05).
Figure 3.2 Ordination plots of Principal Coordinates Analysis (PCO) and Canonical Analysis of
Principal Coordinates (CAP) comparing fish-based metrics among levels of protection (A and C) and seasons (B and D). Correlations with canonical axes are only shown when Spearman’s r > |0.5| (circles represent vector correlations of 1). Metric codes: Dinv - density of invertebrate feeders; Dom - density of omnivores; Dgen - density of generalist individuals; Djuv - density of juveniles; D€€€ -density of individuals with high commercial value; Dlarge - density of large individuals with medium to high commercial value (>20cm).
-0,3 -0,2 -0,1 0 0,1 0,2CAP1
-0,3
-0,2
-0,1
0
0,1
0,2
CA
P2
WinterAutumnSpringSummerDinv
Dom
Djuv
-0,3 -0,2 -0,1 0 0,1 0,2CAP1
-0,2
-0,1
0
0,1
0,2
0,3
CA
P2
TPZPPZCPZ
Dlarge
Dgen D€€€
-4 -2 0 2 4 6PCO1 (29% of total variation)
-4
-2
0
2
4
PC
O2
(22%
ofto
talva
riation)
Dinv
Dom
Dhe
Djuv
Dlarge
Dgen
D€€€
-4 -2 0 2 4 6PCO1 (29% of total variation)
-4
-2
0
2
4
PC
O2
( 22%
ofto
talva
r iation)
Dinv
Dom
Dhe
Djuv
Dlarge
Dgen
D€€€
A C
DB
CA
P2
CA
P2
PC
O2
(2
2%
of
tota
l va
ria
tio
n)
PC
O2
(2
2%
of
tota
l va
ria
tio
n)

Influence of seasonal variability in fish-based metrics and their performance
75
The first canonical axis clearly separated the fish-based metrics in the CPZ from the TPZ
and PPZ, and the second canonical axis separated the TPZ from the PPZ (Figure 2C).
Vectors representing Spearman correlations with CAP axes (r > |0.5|) showed that some
metrics are apparently associated with the different levels of protection. The density of
generalist individuals is higher in zones where fishing is permitted (CPZ), the individuals
with high commercial value tends to have higher values in protected zones (TPZ and PPZ)
and the large individuals with medium to high commercial value is associated with the TPZ.
The CAP analysis performed to discriminate seasons, as expected, was able to find axes
that maximize seasonal variation with a square canonical correlation of δ2
= 0.743 (p<0.05)
(Figure 3.2D).The first canonical axis clearly separated the fish-based metrics in autumn
and summer from spring and winter, with winter and spring seeming to cluster. In this case,
the density of invertebrate feeders was associated with summer and autumn, while the
juveniles and omnivores seems to be more related with autumn (r > |0.5|) (Figure 3.2D).
Permutational univariate ANOVA on fish-based metrics revealed a significant effect of
season in the density of omnivores and juveniles, while significant differences were found
among zones for herbivores and the individuals with high commercial value (Table 3.3).
Both factors had significant effects on the density of generalist individuals, invertebrate
feeders and adults with high commercial value, while no effects were obtained for the
macrocarnivores and the large individuals with medium to high commercial value (Table
3.3). Additionally, the interaction between factors zone and season showed a significant
effect in the density of invertebrate feeders, density of generalist individuals and density of
individuals with high commercial value (Table 3.3). Pair-wise comparisons of metrics with
significant results for factor season showed that, in general, the majority of them were
significantly different between autumn and other seasons (Table 3.3). Furthermore, some
metrics were not significantly different between successive seasons as well as between
summer and winter (Table 3.3). Regarding the effects of zone, only the density of
generalists showed significant differences among all zones, while the density of
invertebrate feeders and the density of individuals with high commercial value differed
significantly between the CPZ and the zones with higher protection status (TPZ and PPZ)
(Table 3.3). However, this effect of zone was not consistent among all seasons (see pair-
wise comparisons for the interaction of both factors in Table 3.3). The density of generalist
individuals was consistently different among all zones in all seasons with exception of
summer. For the remaining fish-based metrics, no differences between protection zones
was detected in winter. In spring, the density of generalists was significantly different
between the TPZ and the CPZ.
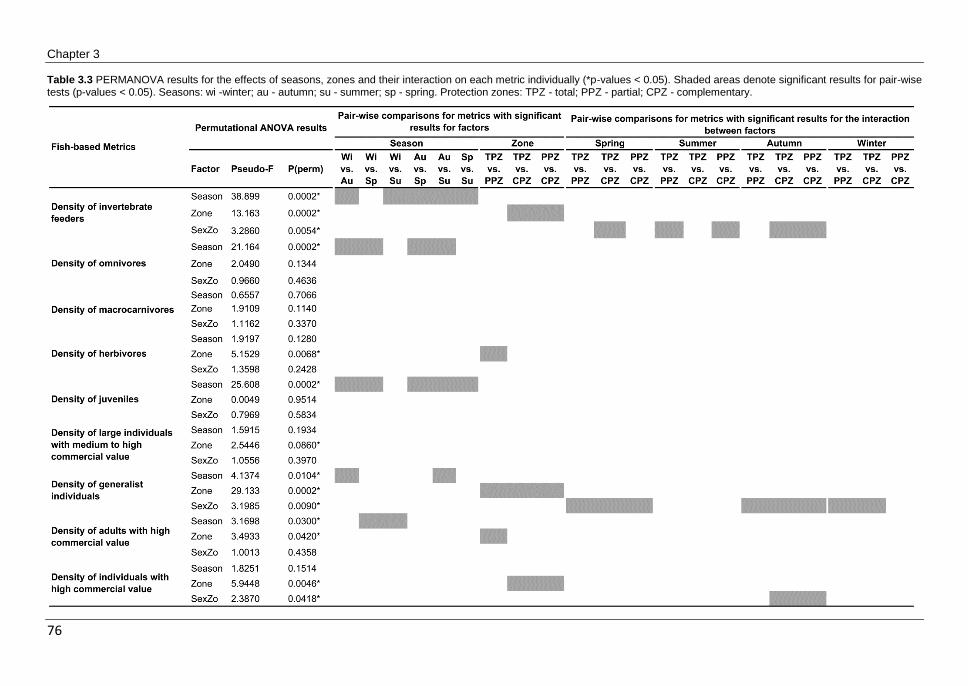
Chapter 3
76
Table 3.3 PERMANOVA results for the effects of seasons, zones and their interaction on each metric individually (*p-values < 0.05). Shaded areas denote significant results for pair-wise tests (p-values < 0.05). Seasons: wi -winter; au - autumn; su - summer; sp - spring. Protection zones: TPZ - total; PPZ - partial; CPZ - complementary.

Influence of seasonal variability in fish-based metrics and their performance
77
On the other hand, in autumn, all metrics were different between the CPZ and the
remaining zones and no differences in the density of individuals with high commercial
value and invertebrate feeders were detected between the TPZ and the PPZ. Finally, plots
with size distribution of the most representative species with high commercial value (D.
vulgaris and D. sargus) showed differences among seasons (Figure 3.3). Abundance of
juveniles of D. vulgaris peaked in summer and no strong peak was identified for early
juveniles of D. sargus. In general, mean number of adults of D. vulgaris was higher in
autumn and when higher differences between protection zones were observed, especially
between the TPZ and the PPZ in comparison with the CPZ. In the case of D. sargus, the
mean number of juveniles and adults was higher in winter and spring and the juveniles
class was the most represented in all seasons.
Figure 3.3 Size structure of the most abundant species with high commercial value (Diplodus vulgaris and D. sargus) per season. Vertical axes correspond to the mean number of individuals per transect in each level of protection: black - total, dark grey - partial and light grey - complementary. Vertical error bars represent standard errors. Size classes: early juveniles (below 10cm), juveniles (between 10 cm and the size at first maturity) and adults (above the size at first maturity).
0
20
40
60
80
100
120
<10cm 10-20cm 21-40cm
0
20
40
60
80
100
120
<10cm 10-16cm 17-40cmSummer
Spring
Diplodus vulgaris Diplodus sargus
0
20
40
60
80
100
120
<10cm 10-16cm 17-40cm
0
20
40
60
80
100
120
<10cm 10-16cm 17-40cm
0
20
40
60
80
100
120
<10cm 10-16cm 17-40cm
0
20
40
60
80
100
120
<10cm 10-20cm 21-40cm
0
20
40
60
80
100
120
<10cm 10-20cm 21-40cm
0
20
40
60
80
100
120
<10cm 10-20cm 21-40cm
Autumn
Winter
Mean
nu
mb
er
of
ind
ivid
ua
lsp
er
tran
sect

Chapter 3
78
Discussion
The present study highlights the influence of seasonal variability in fish assemblage
patterns and stresses the importance of taking seasonality into account when assessing
changes due to anthropogenic disturbance. A marked degree of seasonal variability of the
fish-based metrics was evident in both PCO and CAP analyses, which was less
pronounced between winter and spring and more in the autumn. These trends were
consistent with PERMANOVA results, where significant differences were obtained among
all seasons except between winter and spring, matching the results from previous studies
that analysed seasonal patterns of rocky fish species (e.g. Holbrook et al. 1994;
Friedlander & Parrish 1998; Magill & Sayer 2002; Beldade et al. 2006). Seasonal changes
in fish assemblage composition and abundance have been broadly attributed to the input
of recruits and to spawning and feeding migrations (Holbrook et al. 1994; Friedlander &
Parrish 1998; Aburto-Oropeza & Balart 2001). Indeed, a general increasing trend in the
density of juveniles, the omnivores and the invertebrate feeders was associated with
summer and autumn samples.
In a study about the very-near-shore fish larvae distribution at Arrábida MPA, Borges et al.
(2007) obtained higher diversity and abundance of larvae from May to July followed by a
strong decrease in August. This period corresponds to the spawning season of most of the
rock-associated species in this area (Almada et al. 1999; Gonçalves et al. 2002; Borges et
al. 2007). These results suggest that in this area recruitment processes can occur in late
summer. This pattern is also confirmed by Garcia-Rubies and Macpherson (1995) which
observed an increase of recruits (smaller than 1.5 cm length) from July to September with
a very similar fish assemblage in the NW Mediterranean, although some variances in the
starting and range of recruitment pattern of certain species could occur due to temperature
differences between Atlantic and Mediterranean waters. It is important to note that the
metric density of juveniles includes all individuals bellow the size at first maturity and not
merely early juveniles. Consequently, despite the density of juveniles increasing in summer
(July), the highest densities were found in autumn (October) as a cumulative result of
recruitment processes of various species.
Although the increase in juveniles could partly explain the increased values for the trophic
structure metrics that they represent (e.g. omnivores and invertebrate feeders), other
factors like spawning migrations or feeding activity might be important (e.g. Harmelin et al.
1995; Friedlander & Parrish 1998).

Influence of seasonal variability in fish-based metrics and their performance
79
In temperate rocky reefs, two main spawning strategies occur: (1) demersal spawners,
species producing eggs that become attached to the substrate or in nests, normally with
males or females displaying parental care, for example the genus Symphodus; and (2)
pelagic spawners, species producing planktonic eggs with high dispersive capabilities, for
example the families Sparidae, Serranidae and Mugilidae (Almada et al. 1999; Borges et
al. 2007). In both cases, females and/or males must travel long distances in search for
nests/partners (demersal spawners) or migrate to spawning sites like bays, deep or
shallow waters (pelagic spawners) (Almada et al. 1999). These migrations could lead to
changes on adult’s abundance in the assemblages, either by their departure from reefs or
by their aggregation, which is expected to happen at higher intensity in the spawning
season from mid-spring to early summer (May-July). In agreement, despite not being
initially included in the metrics list, since it had previously shown weak response to
anthropogenic pressures (Henriques et al. 2013), the density of individuals over the size at
first maturity showed strong seasonal variation (PERMANOVA, Pseudo-F = 4.307 p < 0.05
for factor season, Pseudo-F = 1.43 p>0.05 for factor zone and Pseudo-F = 1.28 p > 0.05
for the interaction of both factors), with significant differences found between summer
(July) and spring and autumn (April and October, respectively). Notwithstanding the above-
mentioned results, some species exhibited an extended spawning strategy with several
peaks year-long, in order to reduce inter-specific competition as they share similar habitat
requirements with other species (Garcia-Rubies & Macpherson 1995). Thus, other
seasonal differences in spawning and recruitment patterns could be observed for some
species as they have several recruitment and adult migration peaks year-long (e.g.
Diplodus spp.).
Finally, seasonal changes on feeding activity could also contribute for the observed
patterns during summer and autumn, specially the density of invertebrate feeders and
density of omnivores. Benthic invertebrates, which are known to increase with proliferation
of macroalgae canopy (e.g. fleshy erect algae) during spring and summer (Sala 1997),
constitute the prevailing preys of most of the observed fish species (Almada et al. 1999). In
accordance, the frequent occurrence of several invertebrate groups (e.g. gastropods,
crustaceans and bivalves) started in spring and persisted through autumn, which could be
related with seasonal fluctuations of macroalgae cover that showed an increase in algae
tufts during spring and summer, as observed by Rubal et al. (2011) in tidepool macroalgal
assemblages (north of Portugal). An increment of prey availability during summer and
autumn might attract invertebrate feeders and omnivores that forage on rocky substrates,
being easier to observe them. However, because these results were based on
presence/absence data of major invertebrate groups (frequencies of occurrence), further

Chapter 3
80
research about invertebrate’s abundance at lower taxonomic levels is desirable to fully
understand seasonal changes in fish assemblages. This could prove to be particularly
important in the assessment of anthropogenic pressures that also affect invertebrate
assemblages.
Despite the fact that some year-to-year variation on the global values of species
abundance is expected due to inter-annual biological and environmental conditions (e.g.
oceanographic features, recruitment patterns, larval mortality), coastal fish assemblages
display a relatively stable and predictable response to seasonality for both juveniles and
adults, with higher abundance in summer and autumn (Holbrook et al. 1994; Harmelin et
al. 1995; Magill & Sayer 2002; Beldade et al. 2006) and peak larval density in spring and
early summer (Borges 2006).
It is expected that environmental conditions on each season affect all zones in a similar
manner. Therefore, and taking into account the similarity between habitats, if differences in
fish-based metrics were detected among zones within seasons they are likely to be due to
the effects of protection. In fact, non-significant differences were found among zones for
the habitat structure and algae cover as well as in the interaction zone x season of biotic
cover (algae and invertebrates). Only the sessile ascidians and gorgonians (higher in TPZ)
and the hydrozoans and anemones (lower in CPZ) showed significant differences among
zones. However, it is unlikely that these differences are responsible for the differences
found for fish-based metrics, considering that most of the observed fish species that feed
on invertebrates exhibit some flexibility in their diets, with a preference for molluscs
(gastropods and bivalves), crustaceans (isopods, amphipods and decapods) and
polychaetes, which did not differ among zones (see Stergiou & Karpouzi 2002 for feeding
habits details). Moreover, there are two additional facts that also suggest the lack of
response of fish assemblages to these particular invertebrate groups: (1) the metric density
of invertebrate feeders had higher values outside the reserve (CPZ), where a lower
frequency of occurrence of those sessile invertebrates was observed; (2) the interaction of
both factors (season and zone) was non-significant for these sessile invertebrates due to
large differences between samples, while for the fish-based metrics that responded to
protection, significant differences were found.
Several differences among zones were found in spring, summer and autumn and no
differences were found in winter, suggesting that seasonal variability of fish assemblages
affects the detection of their response to anthropogenic pressures. Many of the fish
species undergo regular migrations during the winter to find shelter or to spawn (e.g.
deeper water), probably as a response to unfavourable conditions (e.g. thermoregulation,

Influence of seasonal variability in fish-based metrics and their performance
81
food availability) which create a general pattern of low abundance in this season
(Friedlander & Parrish 1998; Magill & Sayer 2002). These regular movements might clarify
why no differences were detected among zones during winter in the multivariate approach
as well as for the fish-based metrics individually, with the exception of the density of
generalists.
The density of generalists was always higher at the zones with the lowest level of
protection in all seasons except in summer, where no effects were found. The most
abundant generalist Coris julis has a wide habitat range and depth distribution, flexibility of
diet and has no commercial value in this area (Harmelin et al. 1995; Henriques et al.
2013). Such flexibility is an advantage in a context of inter-specific competition that is
expected to be higher inside protected zones (Mosqueira et al. 2000; Ojeda-Martinez et al.
2007). Coris julis may migrate to shelf waters to spawn during the spring and summer (see
results of Borges et al. 2007). Although the density of generalists was varied with fishing
pressure, some care is needed in their widespread use because in some geographical
areas C. julis has commercial interest (e.g. Mediterranean Sea), prefers deeper habitats
(García-Charton & Pérez-Ruzafa 2001) and there may be other generalist species with
higher commercial interest (e.g. Dicentrarchus labrax, Sparus aurata). Furthermore, C. julis
is also tolerant to contamination (Fasulo et al. 2010). In this context, the concept of
opportunistic species seems to be more adequate and the metric should therefore be
changed to density of opportunistic individuals in order to avoid misinterpretations.
Regarding the trophic structure metrics, no pattern of response to the interaction between
the level of protection and season was found for the density of invertebrate feeders even
though some significant differences were obtained in pair-wise comparisons. In this case,
the most probable explanation is related to the functional overlap between species that
responded positively or negatively to protection (Coris julis vs. other invertebrate feeders).
As for the density of herbivores (only with differences between TPZ and PPZ but with no
significant results for the interaction between factors), the most probable explanation is
related to the migration of schools between feeding grounds as it only comprises the
species Sarpa salpa, which has a broad home range (Jadot et al. 2006; Abecasis et al.
2012). These results suggest that these trophic levels were not good indicators of fishing
pressure as opposed to macrocarnivores and piscivores (top predators) as the most
sensitive groups (e.g. Micheli et al. 2004; Guidetti & Sala 2007; Villamor & Becerro 2012).
The low density values observed for top predators could be related not only to the early
age of the reserve and their high mobility but also to their preference by other types of
habitats (e.g. Pagrus pagrus; García-Charton & Pérez-Ruzafa 2001).

Chapter 3
82
Concerning the distribution of fishing activities along the MPA (see material and methods),
greater differences would be expected between the CPZ and the remaining zones, since
no fishing activity is allowed in the TPZ while in the PPZ only traps, jigs and handlines are
allowed farther than 200 m from shore line. This pattern was only observed in the autumn
and for the metrics density of generalists and density of invertebrate feeders (as explained
before), as well as for the density of individuals with high commercial value. In accordance
with the expected pattern, results of CAP showed that the density of large individuals with
medium to high commercial value ( > 20 cm) was also associated with the TPZ and the
PPZ, however, no significant differences were found, meaning that it was not consistently
different. On the other hand, the density of individuals with high commercial value was only
significantly different between zones in autumn, following the expected pattern due to
fishing effort distribution, which is probably due to a cumulative result of the abundance of
juveniles and adults during this season, in accordance with the general seasonal pattern
observed. These results suggest that this reserve is still in a trajectory of recovery.
An increase of large-bodied species, especially those targeted by fishing, has been pointed
out as one of the main changes in fish assemblages due to protection (e.g. Halpern &
Warner 2002; Micheli et al. 2004; Claudet et al. 2006; Guidetti & Sala 2007; Claudet et al.
2010). Because large-bodied species are many times slow-growing and late-maturing, they
will respond slower to protection measures than short-lived and fast-growing species
(Mosqueira et al. 2000; Halpern & Warner 2002). Moreover, the increase in species
abundance is extremely dependent on recruitment processes, fishing effort outside and
between the different levels of protection, as well as their catchability and migration
patterns (Côté et al. 2001; Micheli et al. 2004; Guidetti & Sala 2007). This means that
recovery of fish size and species density depends on the age and size of the reserve
(Claudet et al. 2008). For instance, some studies suggest that 1−3 yr appears to be
enough to detect significant changes in total density and biomass (see meta-analysis of
Halpern & Warner 2002), while this time period seems to be insufficient to detect
differences in fish size or trophic structure (e.g. the abundance of top predators) (e.g.
Micheli et al. 2004; Russ & Alcala 2004; Claudet et al. 2006). In this context, despite the
sampled site being under full protection measures for 2 years, there was probably not
enough time to detect clear changes on fish size, explaining why no consistent effects of
zone were observed for the density of adults with high commercial value and the large
individuals with medium to high commercial value ( > 20 cm).
A previous study by Harmelin et al. (1995) showed higher abundances of Diplodus spp.
(especially large individuals) within protected zones in all seasons and successive years,

Influence of seasonal variability in fish-based metrics and their performance
83
though these abundances peaked in late summer (Mediterranean Sea). Therefore, the fact
that the density of individuals with high commercial value only responded to the effect of
zone in autumn and the lack of response of the density of adults with high commercial
value, stress the idea that the MPA is at an early stage. In fact, seasonal variations on size
structure of the most abundant species with high commercial value, D. sargus and D.
vulgaris were observed. These variations followed the life-cycle features of each species
and resulted in clear differences between zones in autumn, probably due to cumulative
abundances of both juveniles and adults. Both species have a large spawning period that
peaks in winter and results in an extended recruitment (Garcia-Rubies & Macpherson
1995), but while D. vulgaris travels to shelf waters (Correia et al. 2011), D. sargus
congregates in sheltered bays and nearshore waters to spawn (Almada et al. 1999; Veiga
et al. 2010). These results are also supported by the research of Horta e Costa et al. (in
press) performed in the same study area, during the spring and autumn (pooled together)
in two consecutive years (2009-2010), where eight zones were sampled inside TPZ and
PPZ (four in each one) and four zones in CPZ (spatial variability). The authors found
significant differences in the density of both D. vulgaris (below the legal size of 15 cm) and
D. sargus (all sizes) between protected (TPZ and PPZ) and unprotected zones (CPZ)
(Horta e Costa et al. in press).
It is important to note that this study was not based on before-after MPA establishment
data, so other factors beyond the ones discussed could hinder the detection of significant
differences among the different levels of protection: (1) size of the no-take and partially
protected areas relative to the target species’ home-range; (2) the ban of spearfishing in
the whole MPA area which has been reported to heavily impact target species (e.g.
Diplodus spp.) (Coll et al. 2004; Lloret et al. 2008; La Mesa et al. 2011b); (3) the increased
surveillance of illegal fishing activity. In this way, further research is need to follow the
reserve effects over time, like changes on size-structure of large-bodied fish (e.g. target
species) and increase in the abundance of top predators (macrocarnivores and piscivores).
This should also be complemented with the study of complex successional trajectories of
inter-species relationships (e.g. decreases in the abundance of preys due to the increase
in top predators) in order to test new metrics. Further studies should include other habitats
and depth strata in order to accomplish higher spatial variability.
In conclusion, this study showed that (1) seasonal variability affects the structural and
functional features of fish assemblages that can influence the detection of changes as a
result of anthropogenic pressures; (2) comparisons between control and impacted sites
should only be made using data from similar seasons; (3) it is important to take the species
Chapter 3
84
life history and their ecological traits into account to analyze fish-based metrics, especially
those represented by one or few species; (4) the metrics density of generalists (i.e. density
of opportunistic individuals) and density of individuals with high commercial value seem to
be adequate to assess fish assemblages’ response to fishing pressure. Overall, the choice
of a particular season to assess impacts on fish assemblages, during warm sea conditions
after the spawning period (July-November), can probably give better results while
minimizing monitoring costs. This is particularly important in wide-ranging environmental
assessments, those required to implement the Marine Strategy Framework Directive.
Acknowledgements
The authors would like to thank all the volunteers for the invaluable aid during field surveys
and to Instituto da Conservação da Natureza e Biodiversidade (ICNB) for issuing diving
permissions at the Arrábida Marine Protected Area. Host institution was funded with
project PEst-OE/MAR/UI0199/2011 and PhD grants attributed to S. Henriques
(SFRH/BD/47034/2008) and M.P. Pais (SFRH/BD/46639/2008), both from Fundação para
a Ciência e Tecnologia (FCT). The authors wish to thank the anonymous reviewers for
providing useful comments on the paper.
Literature cited
Abecasis D., Bentes L. & Erzini K. (2012). Movements of Sarpa salpa (Linnaeus, 1758) (Sparidae) in a coastal lagoon (Ria Formosa, Portugal). Journal of Applied Ichthyology, 28, 126-129.
Aburto-Oropeza O. & Balart E.F. (2001). Community structure of reef fish in several habitats of a rocky reef in the Gulf of California. Marine Ecology-Pubblicazioni Della Stazione Zoologica Di Napoli I, 22, 283-305.
Almada V., Henriques M. & Gonçalves E.J. (1999). Ecology and behaviour of reef fishes in the temperate north-eastern Atlantic and adjacent waters. In: Behaviour and Conservation of Litoral Fishes (ed. Almada V.C. ORFaGEJe) ISPA, Lisboa, pp. 33-69.
Anderson M.J. & Willis T.J. (2003). Canonical analysis of principal coordinates: A useful method of constrained ordination for ecology. Ecology, 84, 511-525.
Anderson M.J., Gorley R.N. & Clarke K.R. (2008). PERMANOVA + for PRIMER Guide to software and statistical methods. PRIMER-E: Plymounth, UK.
Beldade R., Erzini K. & Gonçalves E.J. (2006). Composition and temporal dynamics of a temperate rocky cryptobenthic fish assemblage. Journal of the Marine Biological Association of the United Kingdom, 86, 1221-1228.
Borges R. (2006). Composition, temporal and spatial patterns of very-nearshore larval fish assemblages at Arrábida Marine Park. In. Universidade do Algarve, Faculdade de Ciências do Mar e Ambiente, p. 341.
Borges R., Ben-Hamadou R., Chicharo M.A., Re P. & Goncalves E.J. (2007). Horizontal spatial and temporal distribution patterns of nearshore larval fish assemblages at a temperate rocky shore. Estuarine Coastal and Shelf Science, 71, 412-428.

Influence of seasonal variability in fish-based metrics and their performance
85
Cabral H., Batista M., Baeta F., Alves A. & Costa M.J. (2008). Avaliação do impacto das condicionantes na Área Marinha do Parque Natural da Arrábida à actividade da pesca comercial e lúdica, à náutica de recreio e ao mergulho. (Evaluation of the impacts of the Arrábida Marine Reserve management plan in local fisheries and other human activities). In. Centro de Oceanografia, FCUL, p. 241.
Claudet J., Pelletier D., Jouvenel J.Y., Bachet F. & Galzin R. (2006). Assessing the effects of marine protected area (MPA) on a reef fish assemblage in a northwestern Mediterranean marine reserve: Identifying community-based indicators. Biological Conservation, 130, 349-369.
Claudet J., Osenberg C.W., Benedetti-Cecchi L., Domenici P., Garcia-Charton J.A., Perez-Ruzafa A., Badalamenti F., Bayle-Sempere J., Brito A., Bulleri F., Culioli J.M., Dimech M., Falcon J.M., Guala I., Milazzo M., Sanchez-Meca J., Somerfield P.J., Stobart B., Vandeperre F., Valle C. & Planes S. (2008). Marine reserves: size and age do matter. Ecology Letters, 11, 481-489.
Claudet J., Osenberg C.W., Domenici P., Badalamenti F., Milazzo M., Falcon J.M., Bertocci I., Benedetti-Cecchi L., Garcia-Charton J.A., Goni R., Borg J.A., Forcada A., De Lucia G.A., Perez-Ruzafa A., Afonso P., Brito A., Guala I., Le Direach L., Sanchez-Jerez P., Somerfield P.J. & Planes S. (2010). Marine reserves: fish life history and ecological traits matter. Ecological Applications 20, 830-839.
Coll J., Linde M., García-Rubies A., Riera F. & Grau A.M. (2004). Spear fishing in the Balearic Islands (west central Mediterranean): species affected and catch evolution during the period 1975–2001. Fisheries Research, 70, 97-111.
Correia A.T., Pipa T., Goncalves J.M.S., Erzini K. & Hamer P.A. (2011). Insights into population structure of Diplodus vulgaris along the SW Portuguese coast from otolith elemental signatures. Fisheries Research, 111, 82-91.
Côté I.M., Mosqueira I. & Reynolds J.D. (2001). Effects of marine reserve characteristics on the protection of fish populations: a meta-analysis. Journal of Fish Biology, 59, 178-189.
Directive 2008/56/CE. Directive of the European Parliment and the Council of 17 June 2008, establishing a framework for community action in the field of marine environmental policy (Marine Strategy Framework Directive). In: Official Journal of the European Union L 164, 19-40.
Elliott M., Whitfield A.K., Potter I.C., Blaber S.J.M., Cyrus D.P., Nordlie F.G. & Harrison T.D. (2007). The guild approach to categorizing estuarine fish assemblages: a global review. Fish and Fisheries, 8, 241-268.
Fasola M., Canova L., Foschi F., Novelli O. & Bressan M. (1997). Resource use by a Mediterranean rocky slope fish assemblage. Marine Ecology-Pubblicazioni Della Stazione Zoologica Di Napoli I, 18, 51-66.
Fasulo S., Mauceri A., Maisano M., Giannetto A., Parrino V., Gennuso F. & D'Agata A. (2010). Immunohistochemical and molecular biomarkers in Coris julis exposed to environmental contaminants. Ecotoxicology and Environmental Safety, 73, 873-82.
Fenberg P.B., Caselle J.E., Claudet J., Clemence M., Gaines S.D., Garcia-Charton J.A., Goncalves E.J., Grorud-Colvert K., Guidetti P., Jenkins S.R., Jones P.J.S., Lester S.E., McAllen R., Moland E., Planes S. & Sorensen T.K. (2012). The science of European marine reserves: Status, efficacy, and future needs. Marine Policy, 36, 1012-1021.
Friedlander A.M. & Parrish J.D. (1998). Temporal dynamics of fish communities on an exposed shoreline in Hawaii. Environmental Biology of Fishes, 53, 1-18.
Friedlander A.M., Brown E.K., Jokiel P.L., Smith W.R. & Rodgers K.S. (2003). Effects of habitat, wave exposure, and marine protected area status on coral reef fish assemblages in the Hawaiian archipelago. Coral Reefs, 22, 291-305.
Froese F. & Pauly D. (2012). FishBase. Available at: http://www.fishbase.org. Last accessed 20 November 2012.
García-Charton J.A. & Pérez-Ruzafa A. (2001). Spatial pattern and the habitat structure of a Mediterranean rocky reef fish local assemblage. Marine Biology, 138, 917-934.

Chapter 3
86
García-Charton J.A., Pérez-Ruzafa A., Marcos C., Claudet J., Badalamenti F., Benedetti-Cecchi L., Falcón J.M., Milazzo M., Schembri P.J., Stobart B., Vandeperre F., Brito A., Chemello R., Dimech M., Domenici P., Guala I., Le Diréach L., Maggi E. & Planes S. (2008). Effectiveness of European Atlanto-Mediterranean MPAs: Do they accomplish the expected effects on populations, communities and ecosystems? Journal for Nature Conservation, 16, 193-221.
Garcia-Rubies A. & Macpherson E. (1995). Substrate use and temporal pattern of recruitment in juvenile fishes of the Mediterranean littoral. Marine Biology, 124, 35-42.
Gonçalves E.J., Henriques M. & Almada V. (2002). Use of a temperate reef-fish community to identify priorities in the establishment of a marine protected area. In: In: Beumer, J. P., Grant, A. & Smith, D. C. (Eds). Aquatic Protected Areas: What Works Best And How Do We Know? Proceedings of the World Congress on Aquatic Protected Areas (pp. 261-272), Cairns, Australia – August 2002.
Guidetti P. & Sala E. (2007). Community-wide effects of marine reserves in the Mediterranean Sea. Mar Ecol-Prog Ser, 335, 43-56.
Guidetti P., Milazzo M., Bussotti S., Molinari A., Murenu M., Pais A., Spanò N., Balzano R., Agardy T., Boero F., Carrada G.C., Cattaneo-Vietti R., Cau A., Chemello R., Greco S., Manganaro A., Notarbartolo di Sciara G., Russo G.F. & Tunesi L. (2008). Italian marine reserve effectiveness: Does enforcement matter? Biological Conservation, 141, 699-709.
Halpern B.S. & Warner R.R. (2002). Marine reverves have rapid and lasting effects. Ecology Letters, 5, 361-366.
Harmelin J.G., Bachet F. & Garcia F. (1995). Mediterranean Marine Reserved: Fish indices as tests of protection efficiency. Marine Ecology, 13, 233-250.
Henriques M., Goncalves E.J. & Almada V.C. (2007). Rapid shifts in a marine fish assemblage follow fluctuations in winter sea conditions. Mar Ecol-Prog Ser, 340, 259-270.
Henriques S., Pais M.P., Costa M.J. & Cabral H. (2008). Development of a fish-based multimetric index to assess the ecological quality of marine habitats: the Marine Fish Community Index. Mar Pollut Bull, 56, 1913-1934.
Henriques S., Pais M.P., Batista M.I., Costa M.J. & Cabral H.N. (2013). Response of fish-based metrics to anthropogenic pressures in temperate rocky reefs. Ecological Indicators, 25, 65-76.
Holbrook S.J., Kingsford M.J., Schmitt R.J. & Stephens J.S. (1994). Spatial and Temporal Patterns in Assemblages of Temperate Reef Fish. American Zoologist, 34, 463-475.
Horta e Costa B., Erzini K., Caselle J.E., Folhas H. & Gonçalves E.J. (in press). The reserve effect within a temperate marine protected area in the north-eastern Atlantic (the Arrábida Marine Park, Portugal). Mar Ecol-Prog Ser, doi: 10.3354/meps10204.
Jadot C., Donnay A., Acolas M.L., Cornet Y. & Anras M.L.B. (2006). Activity patterns, home-range size, and habitat utilization of Sarpa salpa (Teleostei : Sparidae) in the Mediterranean Sea. ICES
Journal of Marine Science, 63, 128-139.
La Mesa G., Molinari A., Gambaccini S. & Tunesi L. (2011a). Spatial pattern of coastal fish assemblages in different habitats in North-western Mediterranean. Marine Ecology, 32, 104-114.
La Mesa G., Molinari A., Bava S., Finoia M.G., Cattaneo-Vietti R. & Tunesi L. (2011b). Gradients of abundance of sea breams across the boundaries of a Mediterranean marine protected area. Fisheries Research, 111, 24-30.
Lara E.N. & Gonzalez E.A. (1998). The relationship between reef fish community structure and environmental variables in the southern Mexican Caribbean. Journal of Fish Biology, 53, 209-221.
Lloret J., Zaragoza N., Caballero D., Font T., Casadevall M. & Riera V. (2008). Spearfishing pressure on fish communities in rocky coastal habitats in a Mediterranean marine protected area. Fisheries Research, 94, 84-91.
Magill S.H. & Sayer M.D.J. (2002). Seasonal and interannual variation in fish assemblages of northern temperate rocky subtidal habitats. Journal of Fish Biology, 61, 1198-1216.

Influence of seasonal variability in fish-based metrics and their performance
87
Micheli F., Halpern B.S., Botsford L.W. & Warner R.R. (2004). Trajectories and correlates of community change in no-take marine reserves. Ecological Applications, 14, 1709-1723.
Mosqueira I., Cote I.M., Jennings S. & Reynolds J.D. (2000). Conservation benefits of marine reserves for fish populations. Animal Conservation, 3, 321-332.
Niemi G.J. & McDonald M.E. (2004). Application of ecological indicators. Annual Review of Ecology Evolution and Systematics, 35, 89-111.
Noble R.A.A., Cowx I.G., Goffaux D. & Kestemont P. (2007). Assessing the health of European rivers using functional ecological guilds of fish communities: standardising species classification and approaches to metric selection. Fisheries Management and Ecology, 14, 381-392.
Ojeda-Martinez C., Bayle-Sempere J.T., Sanchez-Jerez P., Forcada A. & Valle C. (2007). Detecting conservation benefits in spatially protected fish populations with meta-analysis of long-term monitoring data. Marine Biology, 151, 1153-1161.
Pais M.P., Henriques S., Costa M.J. & Cabral H.N. (2012). A critical approach to the use of published data for baseline characterisation of marine fish assemblages: An exercise on Portuguese coastal waters. Ocean & Coastal Management, 69, 173-184.
Pais M.P., Henriques S., Costa M.J. & Cabral H. (2013). Improving the “chain and tape” method: a combined topography index for marine fish ecology studies. Ecological Indicators, 25, 250-255.
Pennigar J.K., Polunin N.V.C., Francour P., Badalamenti F., Chemello R., Harmelin-Vivien M.-L., Hereu B., Milazzo M., Zabala M., D'Anna G. & Pipitone C. (2000). Trophic cascates in benthic marine ecosystems: lessons for fisheries and protected-area management. Environmental Conservation, 27, 179-200.
Rubal M., Veiga P., Vieira R. & Sousa-Pinto I. (2011). Seasonal patterns of tidepool macroalgal assemblages in the North of Portugal. Consistence between species and functional group approaches. Journal of Sea Research, 66, 187-194.
Ruitton S., Francour P. & Boudouresque C.F. (2000). Relationships between algae, benthic herbivorous invertebrates and fishes in rocky sublittoral communities of a temperate sea (Mediterranean). Estuarine Coastal and Shelf Science, 50, 217-230.
Russ G.R. & Alcala A.C. (2004). Marine reserves: long-term protection is required for full recovery of predatory fish populations. Oecologia, 138, 622-627.
Sala E. (1997). The rule of fishes organization of a Mediterranean sublittoral community II: Epifaunal communities. Journal of Experimental Marine Biology and Ecology, 212, 45-60.
Sousa I.G.C. (2011). Assessment of reserve effect in marine Protected Area: the case study of Professor Luiz Saldanha Marine Park (Portugal). In. Universidade do Algarve, Faculdade de Ciências e Tecnologia, p. 114.
Stergiou K.I. & Karpouzi V. (2002). Feeding habits and trophic levels of Mediterranean Fish. Reviews in Fish Biology and Fisheries, 11, 217-254.
Veiga P., Ribeiro J., Goncalves J.M. & Erzini K. (2010). Quantifying recreational shore angling catch and harvest in southern Portugal (north-east Atlantic Ocean): implications for conservation and integrated fisheries management. Journal of Fish Biology, 76, 2216-37.
Villamor A. & Becerro M.A. (2012). Species, trophic, and functional diversity in marine protected and non-protected areas. Journal of Sea Research, 73, 109-116.
Willis T.J. & Anderson M.J. (2003). Structure of cryptic reef fish assemblages: relationships with habitat characteristics and predator density. Mar Ecol-Prog Ser, 257, 209-221.
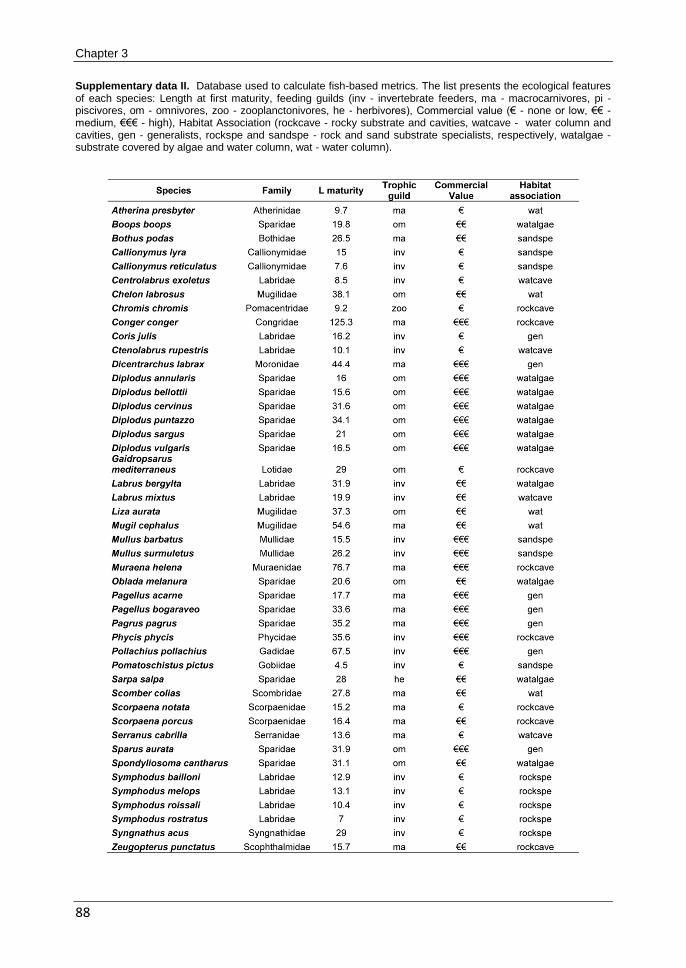
Chapter 3
88
Supplementary data II. Database used to calculate fish-based metrics. The list presents the ecological features of each species: Length at first maturity, feeding guilds (inv - invertebrate feeders, ma - macrocarnivores, pi - piscivores, om - omnivores, zoo - zooplanctonivores, he - herbivores), Commercial value (€ - none or low, €€ - medium, €€€ - high), Habitat Association (rockcave - rocky substrate and cavities, watcave - water column and cavities, gen - generalists, rockspe and sandspe - rock and sand substrate specialists, respectively, watalgae -substrate covered by algae and water column, wat - water column).

89
CHAPTER 4
Henriques S., Pais M.P., Costa M.J. & Cabral, H.N. Structural and functional
changes in a soft-substrate fish assemblage induced by a sewage outfall. In
review in Environmental Monitoring and Assessment.


Response of soft-substrate fish to a sewage effluent
91
Structural and functional changes in a soft-substrate fish
assemblage induced by a submarine sewage outfall
Abstract: Understanding how sewage affects fish assemblages at structural and functional levels is key to predict its effects on ecosystem functioning. This study constitutes the first guild approach regarding the effects of sewage on soft-substrate fish assemblages, by analysing the response of several fish-based metrics to a sewage gradient. The combined results of PERMANOVA and discriminant analyses showed that the metrics related with individuals with low and very low resilience, rock residents and omnivores, had greater sensitivity to sewage pollution, which was attributed to the balance between habitat complexity and effluent effects (toxicity vs. available resources). Moreover, density-based metrics may be better indicators of sewage pollution than biomass-based metrics, since they better reflect changes in the relative abundance of common small-bodied species. Although further research is needed to strengthen the sensitivity and to assess the applicability of the selected metrics, this study improves the understanding of coastal fish assemblage’s response to sewage pollution, contributing for their use as biological indicators of human pressures and to the future development of environmental assessment tools, such as multimetric indices.
Keywords: Sewage outfall, demersal fish assemblages, fish-based metrics, soft-substrate
habitats, Marine Strategy Framework Directive.
Introduction
Industrial and urban growth and their establishment on the coastlines increased the
impacts on surrounding marine communities (Halpern et al. 2008; Crain et al. 2009).
Sewage outfalls are one of the main pollution sources in nearshore coastal waters,
increasing the levels of pathogenic organisms, organic substances, heavy metals, trace
elements, among others (Jordão et al. 2002; Islam & Tanaka 2004; de-la-Ossa-Carretero
et al. 2012). The impact caused by a sewage effluent will depend in part on flow rate,
depth and hydrodynamic conditions of release and type of wastewater discharged (i.e.
domestic or industrial) (Azzurro et al. 2010 and references therein). In recent years, the
use of fish assemblages as indicators of anthropogenic disturbance has received an
increasing attention due to their relative easiness of identification, representation of several
functional guilds that reflect all components of the ecosystem and trophic levels, their rapid
response to pulse impacts and a high economic value that facilitates the understanding of
environmental degradation by the general public (Whitfield & Elliott 2002; Guidetti et al.
2003).
Although sewage effects on fish assemblages have been studied in rocky and coral reefs
(e.g. Pastorok & Bilyard 1985; Grigg 1994; Smith et al. 1999; Guidetti et al. 2002; Guidetti
et al. 2003; Fabricius et al. 2005; Reopanichkul et al. 2009; Azzurro et al. 2010;
Chapter 4
92
Reopanichkul et al. 2010), estuaries and bays (e.g. Hall et al. 1997; Araujo et al. 2002) and
streams (e.g. Porter & Janz 2003), fewer studies have investigated their effects in marine
soft-substrate habitats. Despite that, there are some suggestions that sewage induces
changes in abundance of some soft-substrate fish species (Russo 1982; Otway 1995;
Scanes & Philip 1995; Otway et al. 1996a; Otway et al. 1996b) with consequences in their
trophic interactions (Russo 1982; Otway et al. 1996b). However, none of these studies
focused on a complete structural and functional guild approach to fish assemblages, i.e.
diversity, abundance, trophic structure, mobility, resilience habitat association, nursery
function. Understanding how sewage affects fish assemblages at these levels is key to
predict its effects on ecosystem functioning as well as to assess the environmental status
of marine waters in the scope of European Directives (e.g. Marine Strategy Framework
Directive).
Structurally and functionally, marine fish assemblages are strongly related to their
surrounding habitat, being more diverse and abundant as habitat complexity increases, as
a result of the food regime accessible (balance between prey and competitors), quantity of
shelter (degree of exposure to predators) and conditions that maximize their reproductive
potential (García-Charton & Pérez-Ruzafa 2001; Pihl & Wennhage 2002; Rice 2005). In
the case of soft-substrate habitats, many studies identify depth as the main structural
factor of fish assemblages (e.g. Demestre et al. 2000; Sousa et al. 2005; Catalan et al.
2006), being more homogeneous on deeper zones due to changes in water temperature,
pressure, light intensity and salinity, which affect species distribution according to
ecological needs and physiological tolerances (Rice 2005). Nevertheless, other factors like
latitude and sediment type can have an important effect on species distribution (Gaertner
et al. 1998; Demestre et al. 2000; Pihl & Wennhage 2002; Prista et al. 2003; Labropoulou
& Papaconstantinou 2004). For instance, Prista et al. (2003) suggest that the proximity of
rocky shores increases the heterogeneity of the soft-substrate habitats by creating a wider
diversity of available niches, supporting higher fish diversity and abundance. In this
context, the assessment of changes on fish assemblages should have well-based
information about natural variability, as it is the only way to properly predict consequences
of anthropogenic activities (Holbrook et al. 1994).
The purpose of this study was to evaluate the effects of sewage on function and structure
of soft-substrate fish assemblages, by comparing and selecting the fish-based metrics that
best distinguish among assemblages displaced along a gradient of exposure to a sewage
discharge. All fish-based metrics were analysed with both density and biomass data in
order to identify the type of data that is most suitable to detect sewage-induced changes.

Response of soft-substrate fish to a sewage effluent
93
Material and Methods
Study Area
The case-study is the largest submarine sewage outfall in Portugal, located off Cascais
(Guia). It receives wastewaters from four municipalities on western Lisbon (Figure 4.1) and
operates since 1994, supplying 753 thousand inhabitants (population equivalent) and
discharging 150 thousand m3 per day of urban effluent (Santos et al., 2011) subject to
primary treatment with screening and removal of grit and solids, degreasing and primary
decantation without addition of reagents. The submarine outfall is 2.75 km long, including
two 1.8 km long diffusers, and lies at a depth of 45 m. The last 400 m of the diffusers have
80 holes (every 5 m) to promote the dilution process during the discharge (Neves et al.
2002; Santos et al. 2002; Santos et al. 2011).
The impact caused by the sewage effluent on the physicochemical parameters of water
column and sediments was previously detected in a restricted area close to the diffuser, as
a consequence of the depth of the discharge zone, strong tidal currents, wind and wave
action that promotes the initial dilution and sediment ressuspension (Neves et al. 2002).
The results of the monitoring program implemented on this outfall showed that the plume
extends most in mid and bottom waters (Santos et al. 2002; Santos et al. 2011). Moreover,
in typical conditions the plume disperses northward (see Neves et al. 2002 for details). The
plume is only identifiable by faecal bacteria which are present in higher concentrations
close to the diffusers (< 2 km), still measureable at ~ 4 km distance (with less intensity),
but at ~ 8 km from diffuser they are hardly detectable (Santos et al. 2002).
Accounting for the above-mentioned characteristics of the plume, three zones were
selected in order to represent a gradient of sewage influence. Site A was located near the
mouth of the outfall while sites B and C were placed 4 and 8 km away from the outfall,
respectively (Figure 4.1). These sites were sampled at the end of summer 2010
(September) to avoid the effect of seasonality on fish assemblages and prevent the strong
influence of the Tagus estuary plume that has higher flow during wet months (Valente & da
Silva 2009).
Fish-based metrics
On board of a fishing vessel, nine 30-minute trawls were performed using an otter-trawl (12
m headline; 20 m footrope; 80 mm cod-end mesh), three replicates randomly allocated
within each zone, covering a total area of 147.000 m2. Trawls were carried out in daylight
at a constant speed (2.1-2.3 knots) and all fish were identified, measured (total length; 1
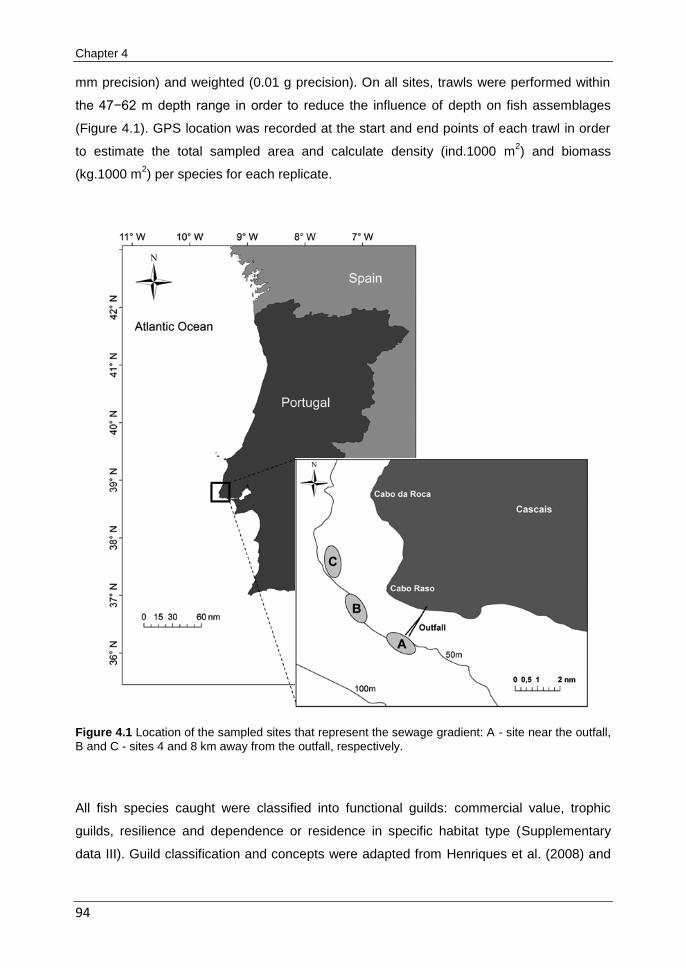
Chapter 4
94
mm precision) and weighted (0.01 g precision). On all sites, trawls were performed within
the 47−62 m depth range in order to reduce the influence of depth on fish assemblages
(Figure 4.1). GPS location was recorded at the start and end points of each trawl in order
to estimate the total sampled area and calculate density (ind.1000 m2) and biomass
(kg.1000 m2) per species for each replicate.
Figure 4.1 Location of the sampled sites that represent the sewage gradient: A - site near the outfall,
B and C - sites 4 and 8 km away from the outfall, respectively.
All fish species caught were classified into functional guilds: commercial value, trophic
guilds, resilience and dependence or residence in specific habitat type (Supplementary
data III). Guild classification and concepts were adapted from Henriques et al. (2008) and

Response of soft-substrate fish to a sewage effluent
95
FishBase online database (Froese & Pauly 2012). Trophic guilds were adapted from Elliott
et al. (2007).
A total of 28 fish-based metrics were calculated in order to analyse both structural and
functional changes due to sewage discharges (Table 4.1). These metrics represent a
broad range of fish assemblage attributes such as diversity, abundance, trophic structure,
resilience, habitat association, mobility and nursery function, and were selected based on
ecological features of soft-substrate fish assemblages and their response to anthropogenic
pressures (Russo 1982; Otway 1995; Otway et al. 1996b; Porter & Janz 2003; Rochet &
Trenkel 2003; Labropoulou & Papaconstantinou 2004; Henriques et al. 2008; Johnston &
Roberts 2009; McKinley & Johnston 2010).
Metrics sensitivity
The identification of the most sensitive metrics was performed by examining general
patterns of fish-based metrics on each site along the exposure gradient, through one-way
permutational multivariate (all metrics) and univariate (each metric individually) analyses of
variance with site treated as fixed factor (PERMANOVA; Anderson et al. 2008) and
discriminant analysis through a Canonical Analysis of Principal Coordinates (CAP; Willis &
Anderson 2003). Post-hoc pair-wise comparisons followed whenever significant
differences among sites were found. Spearman correlation coefficients of the fish-based
metrics with CAP axes were calculated and the highest values (r > |0.5|) were added to the
plots in order to support the discussion of the observed patterns.
After running the analyses, all metrics were normalized by subtracting the mean and
dividing by the standard deviation to place all metrics on a comparable measurement
scale. Analyses were performed based on Euclidean distance matrices using PRIMER 6
with PERMANOVA+ software package. Results were considered significant at p < 0.05
and p-values were calculated through 9999 permutations. In PERMANOVA analyses,
whenever the number of unique permutations available did not reach 100 due to lack of
replicates, p-values were based on a Monte Carlo method (Anderson et al. 2008).
Additionally, Spearman correlations among metrics were calculated to detect redundancies
(r > |0.85|) in order to proceed to the final choice of the most sensitive metrics. After the
exclusion of redundant metrics, a metric was selected as sensitive if it was significantly
different among sites and if it had high correlation with CAP axes. This analytical approach
provides detailed information about fish assemblage-level indicators to assess functional

Chapter 4
96
impacts of sewage discharges. Spearman correlations were performed in Statistica 10
software.
Finally, the SIMPER routine was used to identify the percent contribution of each species
for the average Bray-Curtis dissimilarity among sites (Clarke & Gorley 2006), in order to
improve the interpretation of differences in metric values. This analysis was performed
using PRIMER 6 software.
All analyses were run with fish-based metrics estimated in density and in biomass with the
purpose of identifying which type of data is most sensitive to sewage induced changes.
Results
The sewage outfall studied led to several changes on fish assemblages, with metrics
belonging to different attributes responding to sewage pressure. Overall, significant
differences were found among sites with both density (PERMANOVA; Pseudo-F = 4.814,
p < 0.05) and biomass (PERMANOVA; Pseudo-F = 10.502, p < 0.05) data. Moreover, pair-
wise comparisons showed that when metrics were measured in biomass all sites differed
significantly (p < 0.05), while with density data the sites B and C were significantly different
from the site near the sewage outfall (A) (p < 0.05).
In accordance, results of PERMANOVA on each metric individually showed increased
differences among sites when biomass data was used, accounting for the larger number of
metrics responding significantly to the factor site (22 metrics), which contrasted with the 15
sensitive metrics obtained with density data (Table 4.2). These differences were due to the
metrics total density/biomass, density/biomass of flatfish, density/biomass of invertebrate
feeders, density/biomass of macrocarnivores, density/biomass of individuals with medium
mobility, density/biomass of individuals with high resilience and density/biomass of soft-
substrate dependents which only differed between sites when measured in biomass.
Moreover, metrics related with juveniles, sedentary, and medium commercial value
individuals were not significantly different among sites with none of the data types (p >
0.05) (Table 4.2).
In general, the metrics that characterized the replicates nearest the outfall were the
density/biomass of omnivores, density/biomass of rock residents and density/biomass of
individuals with medium resilience (Table 4.2), always showing higher values on site A.

Response of soft-substrate fish to a sewage effluent
97
Table 4.1 List of candidate metrics to assess the response of soft-substrate fish assemblages to sewage discharges. Metrics are divided by the
following attributes: Diversity/composition, trophic structure, mobility, resilience, habitat association and nursery function.

Chapter 4
98
On the other hand, the mean trophic level metric had lower values on this site,
Chondrichthyes and individuals with very-low and low resilience were absent from this
location and were always present in the replicates from sites B and C. Furthermore, only
the metrics mean trophic level and density/biomass of omnivores responded clearly to the
expected gradient effect, with values increasing and decreasing, respectively, with the
distance from the outfall.
Table 4.2 PERMANOVA results for the effects of sewage (sites) on each metric individually, using
both density and biomass data. Shaded areas denote significant results for pair-wise permutational t-tests (p-values < 0.05). Sites: A - near outfall, B - 4 km away from outfall and C - 8km away from outfall.
These results were also supported by the discriminant analysis performed by CAP, where
the first canonical axis clearly separated the fish-based metric values of site A from those
of the sites B and C, when measured with both density (δ2
= 0.975; p < 0.05) and biomass
(δ2
= 0.973; p < 0.05) data (Figure 4.2). Moreover, the second CAP axis distinguished site
B from remaining sites. Vectors representing the Spearman correlations with the CAP axes
showed that several metrics were related with this pattern (r > |0.5|) (Figure 4.2). Despite

Response of soft-substrate fish to a sewage effluent
99
that, the metrics density/biomass of rock residents, density/biomass of sedentary
individuals, density/biomass of omnivores, dominance when measured in biomass,
density/biomass of rock dependents and density/biomass of individuals with medium
resilience seem to be associated with site A, while the metrics mean trophic level,
density/biomass of flatfish, density/biomass of Chondrichthyes, density/biomass of
individuals with low and very low resilience were linked with sites B and C (Figure 4.2). It is
also important to note that site B (4 km away from the outfall) was characterized by higher
values of total biomass, thus many of the metrics measured in biomass were associated
with the second axis of the CAP plot (Figure 4.2).
Figure 4.2 Ordination plots of the Canonical Analysis of Principal Coordinates (CAP) comparing fish-
based metrics among sites along the gradient of exposure to sewage with both density (A) and biomass (B) data. Triangles represent site A (outfall), while circles and squares represent sites B (4 km away) and C (8 km away), respectively. Correlations with canonical axes are only shown when Spearman’s r > |0.5|. For metric abbreviations see Table 4.1.
Overall, none of the metrics belonging to the mobility and nursery function attributes,
relative to the length of individuals and commercial value, as well as the metrics total
number of species and total density, were useful in distinguishing among sites.
Regarding the metrics with higher sensitivity to the impact of sewage (PERMANOVA and
CAP results), Spearman correlations among each pair of metrics showed that the metric
density/biomass of Chondrichthyes was redundant with the density/biomass of individuals

Chapter 4
100
with low and very low resilience, as well as the density/biomass of rock dependents,
density/biomass of omnivores, density/biomass of individuals with medium resilience
among them (r > |0.85|).
Table 4.3 Summary of SIMPER results showing the average density (ind.1000 m2) and biomass (Kg.
1000 m2) values among sites (A - near outfall, B - 4 km away from outfall and C - 8 km away from
outfall). A cut-off appoint of 90% cumulative dissimilarity was applied.

Response of soft-substrate fish to a sewage effluent
101
Moreover, the metric density/biomass of omnivores was negatively correlated with the
metric mean trophic level (r < -0.85), while the metric density/biomass of rock residents
was not redundant with any other metric. Taking these results into account, the metrics
density/biomass of individuals with low and very low resilience, density/biomass of rock
residents and density/biomass of omnivores were selected as the most suitable to detect
changes on soft-substrate fish assemblages due to sewage discharge. The metric
density/biomass of omnivores was selected rather than mean trophic level since it was
correlated with a higher number of metrics that were not selected.
Finally, the results of the SIMPER analysis indicate that the species Diplodus bellottii,
Serranus hepatus and Trisopterus luscus were captured exclusively or with higher mean
density and biomass on site A, corresponding to resident species that are dependent from
rocky habitats (Table 4.3). On the other hand, the cartilaginous fish Raja clavata was only
associated with sites located away from the outfall (B and C) having higher contribution for
dissimilarities when measured in biomass (Table 4.3). Furthermore, the density and
biomass of Trisopteurs luscus, Diplodus bellotti and Callionymus lyra increased with
proximity to the outfall, while the species Arnoglossus imperialis and Buglossidium luteum
showed the opposite pattern. Comparing the results between density and biomass data in
SIMPER analyses, it is evident that large-bodied species had greater importance when the
metrics are measured in biomass, which masks the influence of small-bodied species that
also contribute for dissimilarities among sites (Table 4.3).
Discussion
The obtained results provided suggestive evidence that sewage discharges caused
changes in both structural and functional features of fish assemblages, especially notable
near the outfall. In general, the site nearest the outfall was characterized by several fish-
based metrics related with species that are resident or dependent on rocky habitats. These
species appear to benefit from the increased habitat complexity brought by the
construction of the pipelines, which is in accordance with other studies that also detected
an increase of fish abundance when the outfalls are constructed over soft-substrates
(Russo 1982; Otway 1995). Actually, the pipeline constitutes a reef-like structure that
provides a higher number of available resources (e.g. food and shelter) which can be
exploited by species other than those characteristic of soft-substrates, providing that they
are tolerant to sewage pollution (e.g. Family Serranidae). This fact explains why the metric
density/biomass of rock residents was found exclusively on the outfall site.

Chapter 4
102
Furthermore, some fish species may also be attracted to the plume as a possible direct or
indirect source of food supply due to the increased levels of organic particulate matter or in
response to increases in the abundance of their benthic prey (Russo 1982; Grigg 1994;
Otway 1995; Otway et al. 1996b). Indeed, the metric density/biomass of omnivores had
higher values in the site near the outfall (A), followed by site B (intermediate), and
ultimately presenting the lowest values at the farthest site (C). These values are mainly
due to the higher abundances of the benthopelagic species Diplodus bellottii, which occurs
on various types of substrates. Since omnivores consist of non-specialized feeders, they
are probably more able to handle changes in benthic prey availability than other trophic
groups (e.g. fish or invertebrate feeders), as verified by Porter and Janz (2003) and Khalaf
and Kochzius (2002). The majority of the observed fish species are macrocarnivores and
invertebrate feeders. Apparently the abundances of sensitive species were balanced by
some species that are more tolerant to sewage (functional redundancy), as these trophic
guilds did not respond significantly to the presence of the sewage outfall despite the
obtained abundance differences at the species level. In fact, besides the density/biomass
of omnivores only the metric mean trophic level responded to the sewage gradient, but
they were redundant.
Additionally, previous studies on sewage outfalls also have documented increases in the
abundance of planktivores and detritivores (e.g. Russo 1982; Grigg 1994; Guidetti et al.
2002; Khalaf & Kochzius 2002; Guidetti et al. 2003). As the majority of the planktivores and
detritivores that occur frequently in this zone are pelagic (e.g., Mugilidae, Sardina
pilchardus, Engraulis encrasicolus) (Prista et al. 2003), it is probable that they were not
caught because of the selective properties of the fishing gear. Given this, the sampling
method should be complemented with other types of gears (e.g. gill nets) in order to
assess the effects of sewage discharges on these trophic guilds. Despite that, the aim of
this study was to characterize changes on fish assemblages associated with soft-
substrates (demersal and benthopelagic species).
The direction of the response of fish assemblages to the sewage discharge (i.e. increase
or decrease in abundance) is not always linear, as it depends on the rates of discharge,
effluent toxicity, as well as on the characteristics of fish assemblages and heterogeneity of
the environment (Russo 1982; Otway 1995; McKinley & Johnston 2010; de-la-Ossa-
Carretero et al. 2012). For instance, Otway (1995) observed a general decrease in fish
abundance when submarine outfalls were built over soft substrates near rocky substrates,
since these already contributed greatly to habitat heterogeneity. In fact, on rocky reefs
there are several examples of decreased abundance of intolerant fish species and/or

Response of soft-substrate fish to a sewage effluent
103
increased abundance of tolerant/opportunistic fish species (e.g. planktivores, detritivores)
(Smith et al. 1999; Guidetti et al. 2002; Khalaf & Kochzius 2002; Guidetti et al. 2003;
Johnston & Roberts 2009; Azzurro et al. 2010; Henriques et al. 2013). Moreover, when the
effluent contains industrial wastewaters it has higher levels of contaminants, such as
metals, polycyclic aromatic hydrocarbons, persistent organic pollutants and pesticides
(McKinley & Johnston 2010). These contaminants are potentially toxic for fishes at certain
concentrations and could affect fish assemblages by reducing fish survivorship, growth,
reproductive success and prey availability, while increasing their susceptibility to diseases
and deformities (see McKinley & Johnston 2010 and references therein). According to the
meta-analysis of McKinley and Johnston (2010), industrial effluent reduces fish abundance
(~ 50%), which contrasts with the obtained results, where total density was not significantly
different among zones, probably due to the differences in the type of effluent discharged
(urban wastewaters). On the other hand, the metric total biomass didn´t contribute to the
discrimination among zones, being significantly different among the three zones as it is
extremely dependent on fish length. In this way, none of these metrics seems to be
promising to assess the effects on soft-substrate fish assemblages induced by urban
wastewater discharges.
In the studied outfall, the effluent is mainly constituted by urban waste submitted to primary
treatment. Therefore, an increase in organic compounds and fecal bacteria is expected
(O´Sullivan 1971; Snieszko 1974). Depending not only on their concentration but also on
water circulation and the initial dilution of effluent, their effects on fish assemblages could
be more or less pronounced. Exophthalmus, open external sores, epitheliomas,
papillomas, fin rot (necrosis), opaqueness of eyes and blindness are some of the diseases
and deformities of fishes pointed out as a consequence of sewage pollution (see
O´Sullivan 1971 and references therein). Previous studies performed at this outfall show
that some fishes (~ 2% of total catch), especially benthic species, exhibited external
deformities on the head (dorsal profile, mouth and missing one of the eyes), vertebral
region and fins (absence or deformities on pectoral or caudal fins) (Santos et al. 2008).
Although external deformities were not specifically addressed as an aim of this study, since
it is focused on assemblage-level differences, most fishes caught near the outfall
presented a generalized paleness and a characteristic odor (personal observation).
As contaminants tend to accumulate on sediments (Santos et al. 2008), it could be
possible that the slightly lower densities of benthic species are related to pollution effects,
explaining why the metric density/biomass of flatfishes was associated with the sites
farther from the outfall, despite the fact that the same species were found in all sites
Chapter 4
104
(metric with high Spearman correlation with CAP axes but without significant results in
PERMANOVA). Such contaminants could also be related with the obtained results for sites
placed 4 and 8 km away from the outfall, where metrics related with species that have very
low or low resilience and Chondrichthyes had higher values at those sites. In general,
Chondrichthyes are characterized by K-selected life histories, meaning that they have low
fecundity, slow growth and late maturity (Stevens et al. 2000). These characteristics have
serious implications for Chondrichthyan populations, as they limit their capacity of recovery
from negative impacts. In this way, the lower densities and biomasses observed for
Chondrichthyans and other species, which also have low or very low resilience (e.g.
Merluccius merluccius, Solea senegalensis), at the outfall site may be linked to their weak
recovery capacity. Furthermore, it is also possible that these species are avoiding the
plumes due to a decrease in food availability or a reduction of their capacities to find prey
(lower visibility and intense odor), as they are macrocarnivores that feed mostly on fish and
crustaceans (Stergiou & Karpouzi 2002; Farias et al. 2006; Martinho et al. 2012). However,
there are insufficient data to assess the extent to which these possible explanations
contribute to the observed pattern and so further research will be needed to identify the
impacts of plumes on benthic fish species (flatfish and species with low and very low
resilience) and their preys.
Additionally, it is expected that young life stages (i.e. larvae, settlers and juveniles) are
more sensitive to sewage than adults, as reported by Henriques et al. (2013) in rocky-
reefs, unless they profit directly or indirectly from the increase in organic matter (Azzurro et
al. 2010), depending on their tolerance to pollution (e.g. McKinley et al. 2011). In this way,
two main hypotheses might explain the lack of response of the metric density/biomass of
juveniles. Firstly, the effluent could not affect significantly the juveniles (lower toxicity
and/or food improvement) or, secondly, these sites are not naturally important nursery
areas.
Regarding the gradient effects of sewage, the results showed that the site positioned at an
intermediate distance from the outfall (site B) showed similarities with the other two sites,
being characterized by metrics that were also associated to the outfall site
(density/biomass of omnivores, density/biomass of rock dependents, density/biomass of
individuals with medium resilience) and with the site farthest from the outfall
(density/biomass of individuals with low and very low resilience, mean trophic level and
density/biomass of Chondrichthyes). In this case, species appear to benefit from some
increase in resources provided by the plume, with possibly lower levels of pollution due to
dilution (as explained above), which could lead to the higher values of biomass/density
Response of soft-substrate fish to a sewage effluent
105
observed at this site. In fact, the differences among sites were much clearer between site
A (outfall) and C (8 km away), with site B (4 km away) being closer to site C.
Accounting for the fact that a higher number of metrics responded to the effect of sewage
when measured with biomass data as they have into account weight differences between
individuals (higher noise), that the metrics most sensitive to the gradient responded with
both types of data and that the biomass data underestimated the influence of small-bodied
species, it is reasonable to conclude that metrics measured in density may be better
indicators of fish assemblage changes due to sewage pollution. Despite that, it is
premature to conclude that density data gives always better results than biomass data, as
it will be dependent on the type of pressure to be analysed and the scale needed to detect
changes.
It is likely that all the above-mentioned hypotheses act synergistically and none of them
alone could explain the observed patterns. In fact, the fish assemblages response to
sewage results from a balance between their tolerance to pollution (toxicity), available
resources, ecological characteristics and intra and inter-specific competition, sometimes
without changes at the functional levels. In summary, the results showed that the metric
approach provides more useful information for interpreting the consequences of human-
induced changes than species individually, and reinforced the importance of using fish
assemblages as biological indicators. In this context, the metrics density/biomass of
individuals with low and very low resilience, density/biomass of rock residents and
density/biomass of omnivores seem to be promising to detect changes on soft-substrate
fish assemblages due to sewage discharge. However, it is important to note that the
present study was performed in a single season/year and focusing on a single outfall
discharging urban wastewaters. Consequently, despite the large size of the sampled area
and the agreement with results from other studies, further effort is needed to assess the
sensitivity and applicability of the selected metrics by testing the effect of variability among
different seasons and years and including other types of sewage effluents (i.e. industrial).
Nevertheless, the present study constituted the first functional guild approach to the effects
of sewage on soft-substrate fish assemblages, contributing not only to the understanding
of sewage-related impacts, but also to the future use of marine fishes as biological
indicators, as required by the Marine Strategy Framework Directive.

Chapter 4
106
Acknowledgements
The authors would like to thank all the volunteers for the invaluable aid during field
surveys. Host institution was funded with project PEst-OE/MAR/UI0199/2011 and PhD
grants attributed to S. Henriques (SFRH/BD/47034/2008) and M.P. Pais
(SFRH/BD/46639/2008), both from Fundação para a Ciência e Tecnologia (FCT).
Literature cited
Anderson M.J., Gorley R.N. & Clarke K.R. (2008). PERMANOVA + for PRIMER Guide to software and statistical methods. PRIMER-E: Plymounth, UK.
Araujo F.G., de Azevedo M.C.C., Silva M.D., Pessanha A.L.M., Gomes I.D. & da Cruz A.G. (2002). Environmental influences on the demersal fish assemblages in the Sepetiba Bay, Brazil. Estuaries, 25, 441-450.
Azzurro E., Matiddi M., Fanelli E., Guidetti P., La Mesa G., Scarpato A. & Axiak V. (2010). Sewage pollution impact on Mediterranean rocky-reef fish assemblages. Marine Environmental Research, 69, 390-7.
Catalan I.A., Jimenez M.T., Alconchel J.I., Prieto L. & Munoz J.L. (2006). Spatial and temporal changes of coastal demersal assemblages in the Gulf of Cadiz (SW Spain) in relation to environmental conditions. Deep-Sea Research Part II-Topical Studies in Oceanography, 53, 1402-1419.
Clarke K.R. & Gorley R.N. (2006). PRIMER v6: User manual/tutorial. PRIMER-E, Plymouth UK.
Crain C.M., Halpern B.S., Beck M.W. & Kappel C.V. (2009). Understanding and managing human threats to the coastal marine environment. Annals of the New York Academy of Sciences, 1162, 39-62.
de-la-Ossa-Carretero J.A., Del-Pilar-Ruso Y., Gimenez-Casalduero F. & Sanchez-Lizaso J.L. (2012). Assessing reliable indicators to sewage pollution in coastal soft-bottom communities. Environmental Monitoring and Assessment, 184, 2133-49.
Demestre M., Sanchez P. & Abello P. (2000). Demersal fish assemblages and habitat characteristics on the continental shelf and upper slope of the north-western Mediterranean. Journal of the Marine Biological Association of the United Kingdom, 80, 981-988.
Elliott M., Whitfield A.K., Potter I.C., Blaber S.J.M., Cyrus D.P., Nordlie F.G. & Harrison T.D. (2007). The guild approach to categorizing estuarine fish assemblages: a global review. Fish and Fisheries, 8, 241-268.
Fabricius K., De'ath G., McCook L., Turak E. & Williams D.M. (2005). Changes in algal, coral and fish assemblages along water quality gradients on the inshore Great Barrier Reef. Marine Pollution Bulletin, 51, 384-98.
Farias I., Figueiredo I., Moura T., Serrano Gordo L., Neves A. & Serra-Pereira B. (2006). Diet comparison of four ray species (Raja clavata, Raja brachyura, Raja montagui and Leucoraja naevus) caught along the Portuguese continental shelf. Aquatic Living Resources, 19, 105-114.
Froese F. & Pauly D. (2012). FishBase. Available at: http://www.fishbase.org. Accessed 2012.
Gaertner J.C., Chessel D. & Bertrand J. (1998). Stability of spatial structures of demersal assemblages: a multitable approach. Aquatic Living Resources, 11, 75-85.
García-Charton J.A. & Pérez-Ruzafa A. (2001). Spatial pattern and the habitat structure of a Mediterranean rocky reef fish local assemblage. Marine Biology, 138, 917-934.
Grigg R.W. (1994). Effects of Sewage Discharge, Fishing Pressure and Habitat Complexity on Coral Ecosystems and Reef Fishes in Hawaii. Marine Ecology Progress Series, 103, 25-34.
Response of soft-substrate fish to a sewage effluent
107
Guidetti P., Fanelli G., Fraschetti S., Terlizzi A. & Boero F. (2002). Coastal fish indicate human-induced changes in the Mediterranean littoral. Marine Environmental Research, 53, 77-94.
Guidetti P., Terlizzi A., Fraschetti S. & Boero F. (2003). Changes in Mediterranean rocky-reef fish assemblages exposed to sewage pollution. Marine Ecology Progress Series, 253, 269-278.
Hall J.A., Frid C.L.J. & Gill M.E. (1997). The response of estuarine fish and benthos to an increasing discharge of sewage effluent. Marine Pollution Bulletin, 34, 527-535.
Halpern B.S., Walbridge S., Selkoe K.A., Kappel C.V., Micheli F., D'Agrosa C., Bruno J.F., Casey K.S., Ebert C., Fox H.E., Fujita R., Heinemann D., Lenihan H.S., Madin E.M.P., Perry M.T., Selig E.R., Spalding M., Steneck R. & Watson R. (2008). A Global Map of Human Impact on Marine Ecosystems. Science, 319, 948-952.
Henriques S., Pais M.P., Costa M.J. & Cabral H. (2008). Development of a fish-based multimetric index to assess the ecological quality of marine habitats: the Marine Fish Community Index. Marine Pollution Bulletin, 56, 1913-1934.
Henriques S., Pais M.P., Batista M.I., Costa M.J. & Cabral H.N. (2013). Response of fish-based metrics to anthropogenic pressures in temperate rocky reefs. Ecological Indicators, 25, 65-76.
Holbrook S.J., Kingsford M.J., Schmitt R.J. & Stephens J.S. (1994). Spatial and Temporal Patterns in Assemblages of Temperate Reef Fish. American Zoologist, 34, 463-475.
Islam S.M. & Tanaka M. (2004). Impacts of pollution on coastal and marine ecosystems including coastal and marine fisheries and approach for management: a review and synthesis. Marine Pollution Bulletin, 48, 624-649.
Johnston E.L. & Roberts D.A. (2009). Contaminants reduce the richness and evenness of marine communities: a review and meta-analysis. Environmental Pollution, 157, 1745-52.
Jordão C.P., Pereira M.G., Bellato C.R., Pereira J.L. & Matos A.T. (2002). Assessment of water systems for contaminants from domestic abd industrial sewages. Environmental Monitoring and Assessment, 79, 75-100.
Khalaf M.A. & Kochzius M. (2002). Changes in trophic community structure of shore fishes at an industrial site in the Gulf of Aqaba, Red Sea. Marine Ecology Progress Series, 239, 287-299.
Labropoulou M. & Papaconstantinou C. (2004). Community structure and diversity of demersal fish assemblages: the role of fishery. Scientia Marina, 68, 215-226.
Martinho F., Sa C., Falcao J., Cabral H.N. & Pardal M.A. (2012). Comparative feeding ecology of two elasmobranch species, Squalus blainville and Scyliorhinus canicula, off the coast of Portugal. Fishery Bulletin, 110, 71-84.
McKinley A. & Johnston E.L. (2010). Impacts of contaminant sources on marine fish abundance and species richness: a review and meta-analysis of evidence from the field. Marine Ecology Progress Series, 420, 175-191.
McKinley A.C., Miskiewicz A., Taylor M.D. & Johnston E.L. (2011). Strong links between metal contamination, habitat modification and estuarine larval fish distributions. Environmental Pollution, 159, 1499-509.
Neves R., Monte H.M.d., C.Santos, Quintino V., Matos J. & Zenha H. (2002). Integrated Wastewater Management in Coastal Areas: Wastewater Treatment, Environmental Monitoring and Performance Optimisation of Costa do Estoril System. In: International conference on marine waste water discharges Istanbul, pp. 1-15.
O´Sullivan A.J. (1971). Effects of sewage discharge in the marine environment. Proceedings of the Royal Society of London, 177, 331-351.
Otway N.M. (1995). Assessing impacts of deepwater sewage disposal: A case study from New South Wales, Australia. Marine Pollution Bulletin, 31, 347-354.
Otway N.M., Gray C.A., Craig J.R., McVea T.A. & Ling J.E. (1996a). Assessing the impacts of deepwater sewage outfalls on spatially- and temporally-variable marine communities. Marine Environmental Research, 41, 45-71.

Chapter 4
108
Otway N.M., Sullings D.J. & Lenehan N.W. (1996b). Trophically-based assessment of the impacts of deepwater sewage disposal on a demersal fish community. Environmental Biology of Fishes, 46, 167-183.
Pastorok R.A. & Bilyard G.R. (1985). Effects of Sewage Pollution on Coral-Reef Communities. Marine Ecology Progress Series, 21, 175-189.
Pihl L. & Wennhage H. (2002). Structure and diversity of fish assemblages on rocky and soft bottom shores on the Swedish west coast. Journal of Fish Biology, 61, 148-166.
Porter C.M. & Janz D.M. (2003). Treated municipal sewage discharge affects multiple levels of biological organization in fish. Ecotoxicology and Environmental Safety, 54, 199-206.
Prista N., Vasconcelos R.P., Costa M.J. & Cabral H. (2003). The demersal fish assemblage of the coastal area adjacent to the Tagus estuary (Portugal): relationships with environmental conditions. Oceanologica Acta, 26, 525-536.
Reopanichkul P., Schlacher T.A., Carter R.W. & Worachananant S. (2009). Sewage impacts coral reefs at multiple levels of ecological organization. Marine Pollution Bulletin, 58, 1356-62.
Reopanichkul P., Carter R.W., Worachananant S. & Crossland C.J. (2010). Wastewater discharge degrades coastal waters and reef communities in southern Thailand. Marine Environmental Research, 69, 287-96.
Rice J.C. (2005). Understanding fish habitat ecology to achieve conservation. Journal of Fish Biology, 67, 1-22.
Rochet M.-J. & Trenkel V.M. (2003). Which community indicators can measure the impact of fishing? A review and proposals. Canadian Journal of Fisheries and Aquatic Sciences, 60, 86-99.
Russo A.R. (1982). Temporal changes in fish community structure near a sewage ocean outfall, Mokapu, Oahu, Hawaii. Marine Environmental Research, 6, 83-98.
Santos C., Catarino J., Marques E., Figueiredo I., Trancoso A., Marecos H. & Neves R. (2002). Monitoring sea water around the disposal area of Guia submarine outfall. In: International conferenre on marine waste water discharges and coastal environment Istanbul, pp. 1-12.
Santos C., Catarino J., Figueiredo Z., Calisto S., Marques E., Cunha P. & Antunes M. (2008). Water and Wastewater Monitoring of Guia Submarine Outfall – an 11 year survey. In: International conference on marine waste water discharges and coastal environment Dubrovink, Croatia.
Santos C., Barreiros A., Pestana P., Cardoso A. & Freire A. (2011). Environmental status of water and sediment around submarine outfalls- west coast of Portugal. Journal of Integrated Coastal Zone Management 11, 207-217.
Scanes P.R. & Philip N. (1995). Environmental impact of deepwater discharge of sewage off Sydney, NSW, Australia. Marine Pollution Bulletin, 31, 343-346.
Smith A.K., Ajani P.A. & Roberts D.E. (1999). Spatial and temporal variation in fish assemblages exposed to sewage and implications for management. Marine Environmental Research, 47, 241-260.
Snieszko S.F. (1974). The effects of environmental stress on outbreaks of infectious diseases of fishes. Journal of Fish Biology, 6, 197-208.
Sousa P., Azevedo M. & Gomes M.C. (2005). Demersal assemblages off Portugal: Mapping, seasonal, and temporal patterns. Fisheries Research, 75, 120-137.
Stergiou K.I. & Karpouzi V.S. (2002). Feeding habits and trophic levels of mediterranean fish. Reviews in Fish Biology and Fisheries, 11, 217-254.
Stevens J.D., Bonfil R., Dulvy N.K. & Walker P.A. (2000). The effects of fishing on sharks, rays, and chimaeras (chondrichthyans), and the implications for marine ecosystems. ICES Journal of Marine Science, 57, 476-494.
Valente A.S. & da Silva J.C.B. (2009). On the observability of the fortnightly cycle of the Tagus estuary turbid plume using MODIS ocean colour images. Journal of Marine Systems, 75, 131-137.

Response of soft-substrate fish to a sewage effluent
109
Whitfield A.K. & Elliott M. (2002). Fishes as indicators of environmental and ecological changes within estuaries: a review of progress and some suggestions for the future. Journal of Fish Biology, 61, 229-250.
Willis T.J. & Anderson M.J. (2003). Structure of cryptic reef fish assemblages: relationships with habitat characteristics and predator density. Marine Ecology Progress Series, 257, 209-221.

Chapter 4
110
Supplementary data III. Database used to calculate fish-based metrics. The list presents the
ecological features of each species: trophic level, length at first maturity, mobility (hm - high, mm -
medium, te - territorial, se - sedentary) habitat association ( R- soft-b – resident of soft-bottoms; R-
rock – resident of rocky reefs; D-soft-b – dependent of soft-bottoms; D- rock – dependent of rocky
reefs), trophic guilds (inv - invertebrate feeders, ma - macrocarnivores, pi - piscivores, om -
omnivores, zoo - zooplanctonivores), commercial value (€ - none or low, €€ - medium, €€€ - high)
and resilience ( VL - very low, L - low, M - medium, H - high).

111
CHAPTER 5
Henriques S., Pais M.P., Vasconcelos R.P., Murta A., Azevedo M., Costa M.J. &
Cabral, H.N. Structural and functional traits indicate fishing pressure on marine
fish assemblages. In review in Journal of Applied Ecology.


Trait-based metrics response to fishing
113
Structural and functional traits indicate fishing pressure on
marine fish assemblages
Abstract: 1. Conservation science increasingly focuses on how ecosystem functioning is affected by anthropogenic pressures, which implies an understanding about the structural and functional changes in biological assemblages and requires indicators to timely detect such changes.
2. In this sense, a novel approach was used to model the response of several trait-based metrics of fish assemblages to gradients of trawling intensity, within four distinct habitat typologies. The fishing gradient was defined based on vessel monitoring system records.
3. Overall, individuals of higher trophic levels, high commercial value, those exhibiting vulnerable traits like chondrichthyes, species with very low resilience and sedentary individuals and dominance, were the most sensitive metrics to increased level of fishing.
4. These patterns were attributed to direct and indirect fishing effects acting synergistically over specific features of fish assemblages leading to its homogenization, with likely impacts on ecosystems resilience. Since the selected metrics responded to a gradient of anthropogenic pressure, independently of the intensity levels concerned, this approach can be particular advantageous in cases where pristine conditions are absent.
5. Synthesis and Applications. A key goal in the proposed approach was to provide indicators that are sensitive to gradients of trawling intensity and can be extrapolated to a broader geographic region. Moreover, the identification of threshold levels of fishing pressure that fish assemblages can withstand before ecosystem functioning is altered can have deep implications on the success of management plans. In this context, a similar approach should be applied to assess other types of pressure sources and biological indicators.
Keywords: Ecosystem function, fishing gradients, fish assemblages, guild approach, marine habitats, response models, trait-based metrics.
Introduction
In recent years, structural and functional indicators of anthropogenic disturbances on
marine assemblages have become an important issue in applied ecology (Bremner 2008;
Auster & Link 2009; Mouillot et al. 2012). It is widely recognized that structural and
functional approaches, through the analysis of trait-based metrics, have several
advantages in the detection of changes in assemblage functioning, compared with strictly
taxonomic-based methods, as they represent the species adaptations to the environment
and their response to stress (Elliott et al. 2007; Juan et al. 2007; Noble et al. 2007;
Bremner 2008; Rochet et al. 2010; Mouillot et al. 2012).
Since species have distinct sensitivities, different abundance distributions are expected
under stress with some species that share traits decreasing in abundance while others
remain stable or even increase (Bremner 2008; Mouillot et al. 2012). On the other hand,

Chapter 5
114
some disturbances can lead to changes in species abundances without shifts within
functional traits (i.e. functional redundancy), thus not affecting the assemblage’s function
(see Bremner 2008; and Rochet et al. 2010 for details about compensation mechanisms).
Biogeographic dissimilarities in species distributions lead to regional variation in
assemblages which provides little opportunity for generalization and comparison of
anthropogenic effects, a problem that may be overcome by using trait-based metrics as
indicators (Micheli & Halpern 2005; Elliott et al. 2007; Noble et al. 2007; Bremner 2008).
Together these facts suggest that trait-based metrics can be powerful as early warning
indicators of assemblage changes in addition to making such changes easier to interpret,
compare and predict in a functional perspective (Rochet & Trenkel 2003; Fulton et al.
2005; Bremner 2008; Mouillot et al. 2012), as demonstrated for benthic invertebrate
assemblages (e.g. Tillin et al. 2006; Juan et al. 2007). However, while fish population-
based metrics are well developed to detect fishing disturbance, considerable less attention
has been given to assemblage-based metrics and, in the latter case, the use of trait-based
indicators is still in its infancy (see Rochet & Trenkel 2003 for a critical review). Despite the
suggestions that some structural and trophic-related metrics are good indicators of
exploitation (e.g. Rochet & Trenkel 2003; Gristina et al. 2006; Methratta & Link 2006;
Auster & Link 2009; Rochet et al. 2010; Dimech et al. 2012), information concerning a wide
range of structural and functional traits (i.e. diversity, abundance, trophic structure,
mobility, resilience) is still lacking or dispersed, which implies a poor understanding about
fishing effects on assemblage functioning. Additionally, the majority of previous
assessments have focused on distinct sites with different levels of fishing disturbance.
Consequently, it is urgent to find indicators that are sensitive to gradients of fishing
pressure in order to better understand the patterns of change and follow environmental
impact gradients, which constitutes an essential property of a good indicator (Greenstreet
& Rogers 2006).
By modifying seabed habitats, disrupting food web processes and removing species (e.g.
target, large-bodied, vulnerable, by-catch), bottom trawling activities can have dramatic
consequences on marine ecosystems (Gristina et al. 2006; Tillin et al. 2006; Juan et al.
2007; Dimech et al. 2012). This study relies on both structural and functional traits of soft-
substrate fish assemblages to assess patterns of change under gradients of trawling
intensity. The applied approach compared the response models of several trait-based
metrics estimated from five years of scientific surveys along the Portuguese coast. The
consistency of metric response among four habitat typologies allowed the selection of a set
of metrics sensitive to increasing levels of fishing intensity, supporting discussion about
Trait-based metrics response to fishing
115
their usefulness as indicators of changes in assemblage function, with likely effects on
marine ecosystems functioning.
Material and Methods
Study area and habitat typologies
The study area extends from 36ºN to 42ºN, covering all the Portuguese continental coast
with a depth range between 20 m and 460 m (Figure 5.1). Since the distribution of marine
fish species is affected by habitat features, depending on their ecological needs and
physiological tolerances (Rice 2005), the study area was divided in four habitat typologies
based on previous studies about the distribution patterns of fish assemblages, topographic
features, oceanographic conditions (Fiúza et al. 1982; Gomes et al. 2001; Sousa et al.
2005; Figueiredo et al. 2007) and sediment charts from Hydrographic Institute of Portugal
(Charts 1: 150 000): (1) North typology, continental shelf (< 200 m deep) located from
Minho river to Cape Raso (38º42’0’’N), which is relatively wide and flat with predominance
of coarse sands and gravel substrates as well as several rocky areas; (2) Centre typology,
located between Cape Raso and Cape São Vicente (37º1’30’’N), also corresponds to a
continental shelf section (< 200 m deep) but straighter and steeper with predominance of
coarse sandy substrates and some rocky patches; (3) South typology, steeper section of
the continental shelf (< 200 m deep) from Cape São Vicente to Vila Real de Santo António,
characterized by fine and medium sandy sediments poorly calibrated; (4) Deep typology,
continental slope throughout the coast (> 200 m deep) mainly composed of fine sands and
muddy sediments.
In general, the west coast is under the influence of prevailing north and northwest winds
and waves, which promote important upwelling events mainly during the summer months,
while the south coast is more sheltered but highly influenced by the Mediterranean outflow
(Fiúza et al. 1982; Sousa et al. 2005; Figueiredo et al. 2007). All statistical analyses were
performed per habitat typology in order to minimize the confounding effects of habitat.
Trait-based metrics of fish assemblages
The fish assemblage database was compiled from a 5-year time series (2006-2010) of
scientific surveys carried out by the Portuguese Institute of Sea and Atmosphere (IPMA),
with the RV “Noruega”, during September-October, in order to avoid the effects of
seasonality. Each survey followed a mixed sampling scheme composed by 96 sampling
stations (66 stations distributed over a fixed grid with 5’ per 5’ miles and 30 random

Chapter 5
116
stations) spread throughout the study area, where 30-minute trawls were performed at a
constant speed (3.5 knots) during the daylight using a bottom trawl (14 m headline; ground
rope with rollers; 20 mm cod-end mesh size).
Figure 5.1 Map of the study area showing the spatial distribution of the five trawling intensity classes
derived from VMS records of fishing vessels. The latitudinal borders that divide shallow habitat typologies (< 200 m deep) are marked.

Trait-based metrics response to fishing
117
In order to analyse structural and functional changes on soft-substrate fish assemblages
due to trawling impacts, a set of functional traits was assigned to every species, according
to the previous classification of Henriques et al. (2008) updated with available literature
and FishBase online database (Froese & Pauly 2012) (Supplementary data IV), namely:
trophic level, length at first maturity, mobility, trophic guild, abundance, commercial value,
resilience. Afterwards, 23 trait-based metrics representing a range of fish assemblage
attributes, including measures of species composition and diversity, abundance, trophic
structure, resilience and mobility, were estimated per sample (haul) after standardization
per unit of effort (Table 5.1). Individuals were quantified in biomass (kg.hour-1
), as it is
expected to be most sensitive measure to fishing-induced changes (Harmelin-Vivien et al.
2008). Metrics were selected based on the ecological features of marine soft-substrate fish
assemblages, as well as their response to anthropogenic pressures, including fishing
(Rochet & Trenkel 2003; Fulton et al. 2005; Labropoulou & Papaconstantinou 2005;
Greenstreet & Rogers 2006; Henriques et al. 2008; Rochet et al. 2010; Dimech et al.
2012). As pelagic species are strongly affected by climatic and environmental factors (Coll
et al. 2008), are not entirely dependent from the substrate and their abundance is
underestimated in bottom trawl samples (Labropoulou & Papaconstantinou 2005), they
were excluded from the analyses (namely Alosa falax, Auxis rochei, Atherina presbyter,
Belone belone, Engraulis encrasicolus, Gadiculus argenteus, Liza spp., Macroramphosus
spp., Mola mola, Micromesistius poutassou, Sardina pilchardus, Scomber spp., Spicara
maena, Trachurus spp., Vinciguerria poweriae and Xiphias gladius).
Mapping trawling intensity
Trawling intensity was analysed using Vessel Monitoring System (VMS) data, obtained
from an automated satellite-based onboard system that records time, speed and position
of vessels at sea (Witt & Godley 2007; Fock 2008). Since 2005, this system is mandatory
in Europe for fishing vessels larger than 15m (Witt & Godley 2007; Fock 2008), providing a
robust way to spatially measure fishing intensity (e.g. Mills et al. 2007; Witt & Godley 2007;
Fock 2008; Lambert et al. 2012). Using VMS data from 2006 to 2007 with records at every
two hours, fishing intensity of trawlers operating in the Portuguese continental coast was
estimated applying GIS techniques in ArcGIS 10.1 software. As VMS is unable to
discriminate between different types of activity (e.g. steaming, fishing, in port, navigation),
data were filtered by typical trawling speed (2-5 knots) in order to keep only points that
likely correspond to fishing operations (Fock 2008; Alemany et al. 2012). Route lines per
day and vessel were then created by joining successive position points and a

Chapter 5
118
Table 5.1 List of candidate metrics to model the response of soft-substrate fish assemblages to trawling intensity and their corresponding abbreviations
used in the analyses. Metrics are divided by the following attributes: diversity/composition, trophic structure, mobility, resilience.

Trait-based metrics response to fishing
119
mask of 6 nautical miles from the coast was applied to eliminate the positions where
vessels were leaving or nearing ports (Witt & Godley 2007), since trawling activity is
forbidden within this area according to Portuguese legislation (Portaria nº 1102-E/2000). In
addition, a fishing intensity raster was created per year based on the density of route lines
per grid-cell (pixel width of 1 nm2), and the two annual rasters were then combined, cell by
cell, by assigning their mean value into a final raster output (ArcGIS multiple raster
operation tools). Finally, 5 classes of fishing intensity were defined (i.e. 1 - none or very
low, 2 - low, 3 - moderate, 4 - high and 5 - very high) using Jenks natural break
classification. This classification method outlines the best arrangement among classes by
seeking to reduce the variance within classes while maximizing the variance between
classes (Alemany et al. 2012). Each sample was then classified according to this scale.
Statistical analyses
Mapping of VMS data highlighted considerable heterogeneity in the fishing intensity among
the different typologies, with the south coast being the most intensively trawled (Figure
5.1). Therefore, the data were analysed according to a gradient of fishing pressure and not
according to the categorical division of the different fishing classes.
Before identifying sensitive metrics, several preliminary analyses were done in order to
accomplish the assumptions of the linear modelling analyses (Anderson et al. 2008). For
each habitat typology, Draftsman plots were drawn to visually assess when the metric
distribution was notably skewed and to detect cases of multi-collinearity (Clarke & Gorley
2006; Anderson et al. 2008). Right-skewed metrics were square-root transformed and only
one of the metrics from redundant pairs (|r| ≥ 0.95) was retained as a proxy for the other
(Clarke & Gorley 2006; Anderson et al. 2008). Moreover, two metrics (biomass of
piscivores and biomass of territorial individuals) were excluded from the analyses as they
were only present in very few samples and are not characteristic of these assemblages.
Extreme multivariate outliers were also identified and removed through the observation of
Principal Coordinates Analysis (PCO) plots based on Euclidean distances among all pairs
of samples with all metrics previously normalized to place them on a comparable
measurement scale (Anderson et al. 2008). The resultant datasets for the groups of
replicate samples (North, Centre, South and Deep habitat typologies) comprised non-
redundant and non-skewed metrics, samples without extreme outliers and representative
metrics.

Chapter 5
120
For each habitat typology, non-parametric distance-based linear models (DISTLM;
Anderson et al. 2008) were used to identify the relationship between trait-based metrics
(used as predictor variables) and the gradients of trawling intensity (coded as model
matrices). A metric-selection approach inspired by the method proposed by Hallett et al.
(2012) was applied: (1) Model matrices were built, so that the distances among pairs of
samples reflected the order of intensity of the defined classes (e.g. same-class samples
with distance 0, category 5 samples with distance 3 from category 2 samples) (Clarke &
Gorley 2006); (2) Distance-based linear models were then run to select the best subset of
trait-based metrics by testing all possible combinations and computing the corrected
Akaike Information Criterion (AICc), developed for cases where the number of samples (n)
relative to predictor variables (q) is small (Anderson et al. 2008 and references therein); (3)
The selection of the best model for each typology was done by seeking the compromise
between the lowest AICc value, higher proportion of the explained variation (R2) and lower
number of metrics. The final set of metrics that best responded to changes in trawling
intensity categories were selected if they were part of the best model in at least half of the
typologies and if they had a predictable steering response (i.e. increase or decrease).
In order to complement the information provided by the models and given that the model
approach is not suitable to apply with species data, due to high number of species
compared with samples, a SIMPER routine using Bray-Curtis dissimilarities was used to
identify species that contributed most for the biomass dissimilarities between trawling
intensity classes within each typology (North, Centre, South and Deep). Bray-Curtis
dissimilarities were computed after square root transformation of biomass data to reduce
the influence of dominant species.
All statistical analyses were performed using PRIMER 6 package with PERMANOVA+
(Clarke & Gorley 2006; Anderson et al. 2008).
Results
The DISTLM results showed that several trait-based metrics responded to increasing
levels of fishing intensity (Table 5.2). The goodness of fit of the models was generally high,
with the highest percentages of explained variation corresponding to the Centre and South
typologies (66.1% and 67.4%, respectively) followed by the Deep typology (40.7%) and
with the lowest value in the North typology (27.4%). Although the number of metrics
selected in each model varied among typologies, some metrics were consistently selected
(i.e. at least by half of the models) (Table 5.2). These include dominance, mean trophic

Trait-based metrics response to fishing
121
level, chondrichthyes, invertebrate feeders, macrocarnivores and individuals with very low,
low and medium resilience. However among these, only those that showed a predictable
trend (i.e. increase or decrease) were selected as suitable to detect differences between
categorical levels of trawling intensity (Table 5.2). Therefore, the metrics low and medium
resilience and the metric mean trophic level were excluded. The majority of metric values
decreased with an increase in trawling intensity, which in the case of the dominance
means that the assemblage is progressively dominated by few species with the increasing
fishing intensity.
Table 5.2 Results of the DISTLM models for each habitat typology (North, Centre, South and Deep).
Shown is the response trend of the trait-based metrics ("+" increase; "-" decrease) along the gradient of trawling intensity (1 - none or very low; 2 - low; 3 - medium; 4 - high; 5 - very high) in the best model. Metric trends per typology were based on mean values observed in each trawling intensity class. Redundant metrics in bold were the ones used as proxies in the analyses. Goodness of fit of models is also shown: percentage of explained variation and AICc. Only the metrics selected by the models are shown. See Table 5.1 for metric abbreviations.
Besides these metrics, it is also important to analyse redundant metrics that were excluded
from the model analyses in order to verify if their response is comparable to their proxies
(Table 5.2). The metric biomass of individuals with high commercial value was frequently
redundant with biomass of macrocarnivores and the biomass of sedentary individuals with
the biomass of individuals with very low resilience. Moreover, the metric total biomass was
always redundant with one of the metrics chosen by the models.

Chapter 5
122
Some metrics were only chosen by one of the models and were not selected for the final
set, as they probably represent specific features of a particular typology (total number of
species, rare and uncommon individuals, omnivores and zooplanktivores), whereas other
metrics (medium commercial value, flatfish, average fish weight, high mobility and high
resilience) were never included in the best models and were rarely selected when
correlated to other metrics (e.g. medium mobility) (Table 5.2).
In summary, out of 21 trait-based metrics tested, only 8 showed consistent responses to
differences in trawling intensity. These include the dominance, biomass of chondrichthyes,
biomass of invertebrate feeders, biomass of macrocarnivores, biomass of sedentary
individuals, biomass of individuals with very low resilience, biomass of individuals with high
commercial value and total biomass, all of which decreased as fishing intensity increased
(Table 5.2; Figure 5.2).
Figure 5.2 Diagram illustrating the response trend of the selected trait-based metrics and fish
species according to increasing levels of fishing intensity. Biomass of species from group A generally decreased with increasing intensity, the response of species from group B was not consistent and the biomass of species from group C increased. For species names see Table 5.3.

Trait-based metrics response to fishing
123
Table 5.3 Results of the SIMPER analysis for each habitat typology (North, Centre, South and
Deep). Shown is the response trend of the species that most contributed (90%) for the differences between trawling intensity classes (1 - none or very low; 2 - low; 3 - medium; 4 - high; 5 - very high). Group A - species which decreased in biomass (-) with increasing levels of trawling intensity; Group B - species that did not show a consistent trend (±); Group C - species which increased in biomass with increasing levels of trawling intensity.
SIMPER evidenced the general response trends of fish species biomass per habitat
typology (Table 5.3), i.e. the species that most contributed to differences between trawling
intensity classes were identified. Three main groups of species are observed according to
their response to different categories of fishing intensity. Group A comprised species
whose biomass generally decreases with increasing fishing intensity, group B included
species that not always have a predictable response and group C included two species
that respond positively to increasing pressure in the North typology. Most of these species
have high commercial value and the majority belongs to group A, including all the
chondrichthyes. Group A also comprises many of the sedentary species, invertebrate
feeders and a wide range of species with different classes of resilience, while species from
group B have higher mobility and most have medium resilience. Besides, all species from
group B have gregarious behaviour, with exception of Conger conger, which depends on
Chapter 5
124
the proximity of rocky patches. Regardless of these results, it is important to highlight that
the metrics were estimated based on the total 119 fish species included in this study, and
although these species were those that most contributed for differences between trawling
intensity classes, they are not fully representative of the fishing-induced changes as
measured with trait-based metrics.
Discussion
Several trait-based metrics were identified as sensitive to differences in trawling intensity,
indicating that trawling caused changes on both structural and functional aspects of soft-
substrate fish assemblages. The consistent changes on some of the trait-based metrics
and fish species in most of the habitat typologies analysed suggests that trawling pressure
was the main factor responsible for these changes, rather than other environmental
constraints, such as habitat and inter-annual variability (along the 5 years studied). These
results are in accordance with models of Coll et al. (2008), which identified fishing as the
main impact driving the dynamics of demersal species, while environmental driving forces
were predominant in the pelagic system.
A general response trend to fishing gradients was found for all typologies, even if only
small differences exist between adjacent fishing classes. Nevertheless, it should be noted
that not all trawling intensity classes were present in every typology, which could in part
explain metrics showing an inconsistent response or selected in just one model, as well as
species with variable trends in biomass. Additionally, in the North typology, the best model
only explained 27% of total variation, which could be associated with heterogeneity due to
the environmental particularities of this typology, as it is more exposed to severe
oceanographic conditions and has a wider and flatter shelf (Fiúza et al. 1982; Gomes et al.
2001; Figueiredo et al. 2007). Still, several trait-based metrics followed the same trend of
the remaining typologies.
Trawling fisheries are characterized by their low selectivity with low by-catch survival and a
great physical damage to habitat, which often results in heavily exploited areas being
dominated by few opportunistic/tolerant species (Tillin et al. 2006; Juan et al. 2007; Kaiser
& Hiddink 2007; Dimech et al. 2012). Such fishing method can have both direct and
indirect effects that ultimately change the ecosystem structure and function through
dynamic processes of bottom-up, wasp-waist and top-down control (Caddy & Garibaldi
2000; Cury et al. 2001). Present results support these predictions as they indicate trawling-
driven declines in total biomass, with particular incidence in the biomass of

Trait-based metrics response to fishing
125
macrocarnivores, invertebrate feeders, chondrichthyes, sedentary species, species with
high commercial value and individuals with very low resilience, along with an increase in
dominance.
Changes in total biomass can be difficult to predict because of the indirect effects along
food webs (e.g. depletion of top-predators and eutrophication) and environmental
variability (e.g. in upwelling systems), leading to fluctuations in the abundance of small-
sized pelagic and demersal fish species with gregarious behaviour (e.g. Farina et al. 1997;
Rogers & Ellis 2000; Coll et al. 2008; Barausse et al. 2011). Therefore, here the
predictable trend in total biomass was probably detectable due to the exclusion of pelagic
species. Moreover, total biomass was redundant with many other metrics and the meaning
of their increase or decrease is difficult to understand when used alone. These facts
suggest that the metric total biomass should be used with caution and the analysis of
assemblage components may lead to clearer information (see Caddy & Garibaldi 2000;
and Rochet & Trenkel 2003).
The majority of analysed species were macrocarnivores (including most species with high
commercial value) or invertebrate feeders. Their decrease is directly related with depletion
from commercial fishing and probably indirectly related to physical disturbance on the
benthic ecosystem. Indeed, increased proportions of burrowers and opportunistic
invertebrate scavengers have been pointed out as functional changes following trawling
disturbance, with consequent loss of functional diversity and dominance by smaller and
short-lived species in benthic invertebrate assemblages (e.g. Tillin et al. 2006; Juan et al.
2007; Kaiser & Hiddink 2007; Dimech et al. 2012). However, while some sensitive
invertebrate species are simply removed, in other cases no changes in the abundance of
opportunistic species were reported (Kaiser & Hiddink 2007) despite changes in their
proportion, and therefore, although the dominance of a particular benthic prey could be
beneficial to its predators, an increase in abundance of great magnitude is not expected.
Moreover, the higher diversity of benthic invertebrates in less disturbed areas may better
fulfil the resource requirements of a broader range of fish species (Juan et al. 2007),
explaining, together with fishing mortality, the decreasing trend in biomass of
macrocarnivores and invertebrate feeders resulting from trawling-induced habitat
homogeneity. Such high vulnerability to direct and indirect impacts suggests that these
trophic groups may lose some species in chronically trawled areas, with consequent loss
of functional diversity and ultimately leading to degradation of ecosystem functions (Micheli
& Halpern 2005; Juan et al. 2007). There is, however, a considerable lack of information
about the role of macrocarnivores and invertebrate feeders in maintaining ecosystem

Chapter 5
126
functions on soft-substrate habitats, but it is likely that their effects are centred on the
abundance and composition of invertebrate assemblages, which in turn are crucial
elements of key biochemical processes such as nutrient cycling (Allen & Clarke 2007).
Conversely, omnivores are probably more able to handle changes in benthic prey
availability than other trophic groups, as they are non-specialized feeders by definition
(Khalaf & Kochzius 2002). In this case, the direct effect of fishing mortality on some
omnivore species is balanced by other species with high resilience to fishing (functional
redundancy), therefore no consistent response was found for this trophic guild. In fact, only
three species of omnivores contributed most for the differences between trawling intensity
classes and the response of the gregarious species Boops boops and Spondyliosoma
cantharus (with medium commercial value) was inconsistent.
Although the mean trophic level has been pointed out as a promising indicator of fishing
impacts (Rochet & Trenkel 2003), it showed an inconsistent trend, which could be
attributed to the characteristics of the analysed fish assemblages. Actually, the south coast
is characterized by high densities of omnivore species (i.e. from the Sparidae family)
(Gomes et al. 2001; Sousa et al. 2005), and some of them constitute important target
species for fish trawlers (Costa et al. 2008). This justifies why only in this typology the
biomass of omnivores was selected in the model and why the mean trophic level increased
with increasing trawling intensity, as omnivores have lower trophic levels than
macrocarnivores. Consequently, it is possible that long-term changes (over decades) in
fish assemblages lead to a general decrease in mean trophic level (e.g. Jennings et al.
2002; Coll et al. 2008), but this was not detected at the temporal and spatial scale
addressed in the present study.
As broadly demonstrated worldwide, chondrichthyes showed a very consistent decreasing
trend with increasing trawling intensity. Due to their specific life-history strategy,
characterized by slow growth, late maturity, long life spans and low fecundity (K-strategy),
chondrichthyes are particularly vulnerable to fishing (Stevens et al. 2000; Gristina et al.
2006). In the studied area, cartilaginous fishes are captured by both crustacean and fish
trawlers, representing an important proportion of commercial by-catch (Costa et al. 2008),
thus decreases in mean weight and distribution patterns of most commercially important
rays have been already reported (Figueiredo et al. 2007). Furthermore, the effects of
fishing are dependent on the balance between fishing intensity and species vulnerability to
disturbance (e.g. Gristina et al. 2006). Hence, the decreasing trend observed in the
biomass of species with very low resilience and of sedentary individuals (metrics that were

Trait-based metrics response to fishing
127
redundant in one typology) can be linked to their weak capacity to recover, associated to
their limited movement beyond home ranges, as in Helicolenus dactylopterus (e.g. Dimech
et al. 2012). In addition, changes in some species with low resilience, such as the majority
of chondrichthyes, were balanced by other species that, despite their low resilience,
probably have other features that make them less sensitive to fishing (e.g. high and
medium mobility) resulting in an inconsistent trend response of the metric. These results
highlight the advantages of using trait-based indicators in the assessment of anthropogenic
disturbances (Bremner 2008), as they permit the identification of assemblage features that
are more sensitive to changes.
Results from trait-based metrics were also supported by underlying species responses, as
species which decreased in biomass with increasing levels of trawling intensity (group A
response type), showed an identical trend when subject to similar pressure in other areas
(e.g. Gristina et al. 2006; Dimech et al. 2012). In this context, the biomass of
macrocarnivores (or individuals with high commercial value), invertebrate feeders,
chondrichthyes, individuals with very low resilience (or sedentary) and dominance seem to
be useful metrics to follow changes in soft-substrate fish assemblages. In summary, both
trait-based metrics and species biomass data pointed to a pattern of ecosystem
degradation due to trawling activities, with synergistic processes acting over structural and
functional features of soft-substrate fish assemblages, leading to their homogenization and
consequent dominance by fewer species. As the stability of structural and functional
groups depends on the diversity of life history strategies, through density-dependent
compensation by resilient members (functional redundancy) (Tillin et al. 2006; Bremner
2008; Rochet et al. 2010), the homogeneity of fish assemblages can have a profound
impact on the ecosystem resilience, making it more vulnerable (Elmqvist et al. 2003).
Although the approach presented does not directly measure ecosystem functioning, which
is determined by a complex interaction of physical, chemical and biological components
(Bremner 2008), it offers clearer insights into how ecosystems are changing, since it
focuses on the structural and functional trends of assemblages instead of species alone
(Mouillot et al. 2012).
A key goal in the proposed approach was to provide indicators that are sensitive to
gradients of trawling intensity and can be extrapolated to a broader geographic region. As
long-term changes over decades appear to be strongly influenced by fluctuations on
oceanographic conditions, such as climatic oscillations and changes (Farina et al. 1997),
these type of indicators (sensitive to gradients) can also be useful to improve our
knowledge about fishing-induced changes, constituting a useful complement to traditional

Chapter 5
128
stock assessments and long-term studies. Since the selected metrics responded to a
gradient of anthropogenic pressure, independently of the intensity levels concerned, this
approach can be particular advantageous in cases where pristine conditions are absent.
Finally, the identification of threshold levels of fishing pressure that fish assemblages can
withstand before ecosystem functioning is altered can have deep implications on the
success of management plans. In this context, a similar approach should be applied to
assess other types of pressure sources.
Acknowledgements
The authors would like to thank to the Portuguese General-Directorate for Natural
Resources, Safety and Maritime Services for providing VMS data. The survey data was
collected under the Portuguese Biological Sampling Programme (PNAB- EC Data
Collection Framework). Research was founded with project PTDC/MAR/117084/2010 from
Fundação para a Ciência e Tecnologia (FCT). Host institution was funded with project
PEst-OE/MAR/UI0199/2011 and PhD grants attributed to S. Henriques
(SFRH/BD/47034/2008) and M.P. Pais (SFRH/BD/46639/2008) as well as Post-Doc grant
of R.P. Vasconcelos (SFRH/BPD/65473/2009), all from FCT.
Literature Cited
Alemany D., Iribarne O.O. & Acha E.M. (2012). Effects of a large-scale and offshore marine protected area on the demersal fish assemblage in the Southwest Atlantic. ICES Journal of Marine Science, 70, 123-134.
Allen J.I. & Clarke K.R. (2007). Effects of demersal trawling on ecosystem functioning in the North Sea: a modelling study. Marine Ecology Progress Series, 336, 63-75.
Anderson M.J., Gorley R.N. & Clarke K.R. (2008). PERMANOVA + for PRIMER Guide to software and statistical methods. PRIMER-E: Plymounth, UK.
Auster P.J. & Link J.S. (2009). Compensation and recovery of feeding guilds in a northwest Atlantic shelf fish community. Marine Ecology Progress Series, 382, 163-172.
Barausse A., Michieli A., Riginella E., Palmeri L. & Mazzoldi C. (2011). Long-term changes in community composition and life-history traits in a highly exploited basin (northern Adriatic Sea): the role of environment and anthropogenic pressures. Journal of Fish Biology, 79, 1453-86.
Bremner J. (2008). Species' traits and ecological functioning in marine conservation and management. Journal of Experimental Marine Biology and Ecology, 366, 37-47.
Caddy J.F. & Garibaldi L. (2000). Apparent changes in the trophic composition of world marine harverests: the perspective from FAO capture database. Ocean & Coastal Management, 43, 615-655.
Clarke K.R. & Gorley R.N. (2006). PRIMER v6: User manual/tutorial. PRIMER-E, Plymouth UK.
Coll M., Palomera I., Tudela S. & Dowd M. (2008). Food-web dynamics in the South Catalan Sea ecosystem (NW Mediterranean) for 1978–2003. Ecological Modelling, 217, 95-116.
Costa M.E., Erzini K. & Borges T.C. (2008). Bycatch of crustacean and fish bottom trawl fisheries from southern Portugal (Algarve). Scientia Marina, 72, 801-814.

Trait-based metrics response to fishing
129
Cury P., Shannon L. & Shin Y. (2001). The functioning of marine ecosystems. In: Reykjavik Conference on Responsible Fisheries in the Marine Ecosystem.
Dimech M., Kaiser M.J., Ragonese S. & Schembri P.J. (2012). Ecosystem effects of fishing on the continental slope in the Central Mediterranean Sea. Marine Ecology Progress Series, 449, 41-54.
Elliott M., Whitfield A.K., Potter I.C., Blaber S.J.M., Cyrus D.P., Nordlie F.G. & Harrison T.D. (2007). The guild approach to categorizing estuarine fish assemblages: a global review. Fish and Fisheries, 8, 241-268.
Elmqvist T., Folke C., Nystrom M., Peterson G., Bengtsson J., Walker B. & Norberg J. (2003). Response diversity, ecosystem change, and resilience. Frontiers in Ecology and the Environment, 1, 488-494.
Farina A.C., Freire J. & Gonzalez-Gurriaran E. (1997). Demersal fish assemblages in the Galician continental shelf and upper slope (NW Spain): Spatial structure and long-term changes. Estuarine Coastal and Shelf Science, 44, 435-454.
Figueiredo I., Moura T., Bordalo-Machado P., Neves A., Rosa C. & Gordo L.S. (2007). Evidence for temporal changes in ray and skate populations in the Portuguese coast (1998–2003) – its implications in the ecosystem. Aquatic Living Resources, 20, 85-93.
Fiúza A.F.G., Macedo M.E. & Guerreiro M.R. (1982). Climatological space and time variation of the Portuguese coastal upwelling. Acta Oceanologica 5, 31-40.
Fock H.O. (2008). Fisheries in the context of marine spatial planning: Defining principal areas for fisheries in the German EEZ. Marine Policy, 32, 728-739.
Froese F. & Pauly D. (2012). FishBase. Available at: http://www.fishbase.org. Accessed 2012.
Fulton E., Smith A. & Punt A. (2005). Which ecological indicators can robustly detect effects of fishing? ICES Journal of Marine Science, 62, 540-551.
Gomes M.C., Serrao E. & Borges M.D. (2001). Spatial patterns of groundfish assemblages on the continental shelf of Portugal. ICES Journal of Marine Science, 58, 633-647.
Greenstreet S.P.R. & Rogers S.I. (2006). Indicators of the health of the North Sea fish community: identifying reference levels for an ecosystem approach to management. ICES Journal of Marine Science, 63, 573-593.
Gristina M., Bahri T., Fiorentino F. & Garofalo G. (2006). Comparison of demersal fish assemblages in three areas of the Strait of Sicily under different trawling pressure. Fisheries Research, 81, 60-71.
Hallett C.S., Valesini F.J. & Clarke K.R. (2012). A method for selecting health index metrics in the absence of independent measures of ecological condition. Ecological Indicators, 19, 240-252.
Harmelin-Vivien M., Ledireach L., Sempere B.J., Charbonnel E., Garcia-Charton J., Ody D., Perez-Ruzafa A., Renones O., Sanchez P.J. & Valle C. (2008). Gradients of abundance and biomass across reserve boundaries in six Mediterranean marine protected areas: Evidence of fish spillover? Biological Conservation, 141, 1829-1839.
Henriques S., Pais M.P., Costa M.J. & Cabral H. (2008). Development of a fish-based multimetric index to assess the ecological quality of marine habitats: the Marine Fish Community Index. Marine Pollution Bulletin, 56, 1913-1934.
Jennings S., Greenstreet S.P.R., Hill L., Piet G.J., Pinnegar J.K. & Warr K.J. (2002). Long-term trends in the trophic structure of the North Sea fish community: evidence from stable-isotope analysis, size-spectra and community metrics. Marine Biology, 141, 1085-1097.
Juan S., Thrush S.F. & Demestre M. (2007). Functional changes as indicators of trawling disturbance on a benthic community located in a fishing ground (NW Mediterranean Sea). Marine Ecology Progress Series, 334, 117-129.
Kaiser M.J. & Hiddink J.G. (2007). Food subsidies from fisheries to continental shelf benthic scavengers. Marine Ecology Progress Series, 350, 267-276.

Chapter 5
130
Khalaf M.A. & Kochzius M. (2002). Changes in trophic community structure of shore fishes at an industrial site in the Gulf of Aqaba, Red Sea. Marine Ecology Progress Series, 239, 287-299.
Labropoulou M. & Papaconstantinou C. (2005). Effects of fishing on community structure of demersal fish assemblages. Belgian Journal of Zoology, 135, 191-197.
Lambert G.I., Jennings S., Hiddink J.G., Hintzen N.T., Hinz H., Kaiser M.J. & Murray L.G. (2012). Implications of using alternative methods of vessel monitoring system (VMS) data analysis to describe fishing activities and impacts. ICES Journal of Marine Science, 69, 682-693.
Methratta E.T. & Link J.S. (2006). Evaluation of quantitative indicators for marine fish communities. Ecological Indicators, 6, 575-588.
Micheli F. & Halpern B.S. (2005). Low functional redundancy in coastal marine assemblages. Ecology Letters, 8, 391-400.
Mills C.M., Townsend S.E., Jennings S., Eastwood P.D. & Houghton C.A. (2007). Estimating high resolution trawl fishing effort from satellite-based vessel monitoring system data. ICES Journal of Marine Science, 64, 248-255.
Mouillot D., Graham N.A., Villeger S., Mason N.W. & Bellwood D.R. (2012). A functional approach reveals community responses to disturbances. Trends in Ecology and Evolution, 28, 167-177.
Noble R.A.A., Cowx I.G., Goffaux D. & Kestemont P. (2007). Assessing the health of European rivers using functional ecological guilds of fish communities: standardising species classification and approaches to metric selection. Fisheries Management and Ecology, 14, 381-392.
Rice J.C. (2005). Understanding fish habitat ecology to achieve conservation. Journal of Fish Biology, 67, 1-22.
Rochet M.-J. & Trenkel V.M. (2003). Which community indicators can measure the impact of fishing? A review and proposals. Canadian Journal of Fisheries and Aquatic Sciences, 60, 86-99.
Rochet M.-J., Trenkel V.M., Carpentier A., Coppin F., De Sola L.G., Léauté J.-P., Mahé J.-C., Maiorano P., Mannini A., Murenu M., Piet G., Politou C.-Y., Reale B., Spedicato M.-T., Tserpes G. & Bertrand J.A. (2010). Do changes in environmental and fishing pressures impact marine communities? An empirical assessment. Journal of Applied Ecology, 47, 741-750.
Rogers S.I. & Ellis J.R. (2000). Changes in the demersal fish assemblages of British coastal waters during the 20th century. ICES Journal of Marine Science, 57, 866-881.
Sousa P., Azevedo M. & Gomes M.C. (2005). Demersal assemblages off Portugal: Mapping, seasonal, and temporal patterns. Fisheries Research, 75, 120-137.
Stevens J.D., Bonfil R., Dulvy N.K. & Walker P.A. (2000). The effects of fishing on sharks, rays, and chimaeras (chondrichthyans), and the implications for marine ecosystems. ICES Journal of Marine Science, 57, 476-494.
Tillin H.M., Hiddink J.G., Jennings S. & Kaiser M.J. (2006). Chronic bottom trawling alters the functional composition of benthic invertebrate communities on a sea-basin scale. Marine Ecology Progress Series, 318, 31-45.
Witt M.J. & Godley B.J. (2007). A Step Towards Seascape Scale Conservation: Using Vessel Monitoring Systems (VMS) to Map Fishing Activity. PLos ONE, 2, e1111.

Trait-based metrics response to fishing
131
Supplementary data IV. Database used to calculate fish-based metrics. The list presents the
ecological features of each species: trophic level, mobility (hm- high, mm- medium, te- territorial, se-sedentary), trophic guilds (inv- invertebrate feeders, ma- macrocarnivores, pi- piscivores, om- omnivores, zoo- zooplanktivores), commercial value ( €- none or low, L-low, M- medium, H- high) and resilience (H - high, M - medium, L - low, VL – very low).

Chapter 5
132
Supplementary data IV. (continued)

Trait-based metrics response to fishing
133
Supplementary data IV. (continued)


135
CHAPTER 6
Henriques S., Pais M.P., Batista M.I., Teixeira C.M., Costa M.J. & Cabral H.N. Can
different biological indicators detect similar trends of marine ecosystem
degradation? Submitted to Ecological Indicators.

Detecting the effects of multiple pressure sources
137
Can different biological indicators detect similar trends of
marine ecosystem degradation?
Abstract: Marine ecosystems are typically under the influence of multiple human pressure sources, which hinders the assessment of pressure-specific effects upon their biological assemblages. In this context, distance-based linear models were used to analyse the relationships of several trait-based metrics of macroinvertebrates and fish with the pressure-specific types (i.e. fishing, organic, physical and non-point-source) and global pattern of cumulative pressures. Both indicators detected similarly the effects of the global degradation and the analyses of the metrics’ sensitivity (given the expected response trends) suggested that the non-point-source had the strongest contribution to this pattern, followed by organic pollution. The difficulties of assessing single pressure effects in a multiple pressure context are discussed. An approach based on the previous identification of pressure sources, a sampling strategy directed to those sources, together with indicator response is highly recommended, as it could be the only way to accurately predict human-induced changes on broad range ecosystems, with likely implications in the success of marine management plans.
Keywords: Benthic macroinvertebrate assemblages, fish assemblages, marine soft-substrates, trait-based metrics, structural and functional approach, Human Pressure Index, anthropogenic pressures.
Introduction
Awareness of the harmful effects of human pressures on the marine environment has
resulted in an increasing attention to monitoring using biological indicators, in order to
identify which human pressures are driving changes on the ecosystem structure and
function, as well as design management plans to minimize impacts (Niemi et al. 2004;
Rogers & Greenaway 2005; Smale et al. 2010). In this context, recent politics have been
developed with the purpose of promoting sustainable use of marine resources and protect
marine ecosystems (e.g. Marine Strategy Framework Directive, MSFD; Directive
2008/56/CE). To implement the MSFD, an integrated ecosystem-based approach should
be applied, giving priority to the attainment of a “good environmental status” through the
assessment of physical and chemical elements, together with several biological indicators,
among which are fish and macroinvertebrates (see annex III in Directive 2008/56/CE).
Due to the difficulty of analysing patterns of change in complex, spatially and temporally
diverse multi-species assemblages, the need to assess environmental status comes with
new challenges concerning the use of biological indicators in marine waters (Niemi et al.
2004; Niemi & McDonald 2004; Mee et al. 2008). Additionally, stress in marine ecosystems
is usually characterized by the effects of multiple human pressure sources, and as physical
boundaries between marine habitats are difficult to define, thus the identification of
Chapter 6
138
pressures that are affecting an area constitutes a complex task (Niemi et al. 2004; Ban et
al. 2010). This way, coupling human pressure and biological response analyses is
essential to link the causes of stress to the response of indicators. Otherwise, it would be
extremely difficult to identify sources of disturbance, unless pressure-specific metrics exist
and detect such changes (Niemi et al. 2004; Niemi & McDonald 2004).
Earlier attempts at comparing the response of fish-based and macroinvertebrate-based
metrics have been focused on freshwater ecosystems (e.g. Hering et al. 2006; Johnson et
al. 2006; Marzin et al. 2012). In general, these studies showed that macroinvertebrates
and fish have different sensitivities depending on the human pressure analysed, with fish
responding more to hydrological changes, while macroinvertebrates show a higher
sensitivity to water quality and/or geomorphological changes (Hering et al. 2006; Marzin et
al. 2012). However, these assemblages differ deeply from those of marine waters. For
example, fish assemblages are known to be species-poor in streams (Hering et al. 2006).
To our knowledge, only few studies have compared the response of multiple indicators in
coastal waters (marine and estuarine ecosystems), but through multimetric indices (e.g.
Borja et al. 2009; Azevedo et al. 2011). Therefore, a complete approach based on
structural and functional metrics is still lacking. Despite that, these studies showed that
both fish and macroinvertebrates indices had a consistent response to water quality
improvement (Borja et al. 2009) and in the detection of degraded sites (Azevedo et al.
2011).
Although it seems that both biological indicators (i.e. fish and macroinvertebrates) are
capable of detecting ecosystem degradation, they have completely different biological
traits. Fish have longer life cycles, occupy a variety of trophic levels (reflecting effects at all
levels within food webs) and higher mobility (although some species have limited ranges),
which probably makes them more sensitive to large-scale changes (Whitfield & Elliott
2002; Elliott et al. 2007). Compared with fish, benthic macroinvertebrates have short life
cycles and are relatively sedentary, which makes them more vulnerable to small variations
in the ecosystem (Aarnio et al. 2011; Marzin et al. 2012). Based on these assumptions, it
would be expected that these biological assemblages have different sensitivities to
disturbance.
By analysing the response models of several macroinvertebrates and fish trait-based
metrics in a multiple-pressure context, the present study aimed at addressing several key
questions: (1) Can fish and macroinvertebrates trait-based metrics detect the global
pattern of marine ecosystem degradation? (2) Is it possible to distinguish single effects of

Detecting the effects of multiple pressure sources
139
specific pressures in a multiple-pressure context? (3) Do both indicators detect specific
pressures similarly (organic, fishing, physical, non-point-source)?
Material and Methods
Study area and human pressure gradients
The study area is located on the coastal shelf off Cascais and extends between
Carcavelos (38º40’36’’N 9º19’32’’W) and Cabo da Roca (38º46’51’’N 9º30’2’’W), covering
a depth range between 20 and 50 m and a marine area of 109 km2 (Figure 6.1). The
adjacent terrestrial area is highly populated (approximately 200.000 inhabitants) and
consequently the study area is under the influence of multiple human pressures. These
include a submarine sewage outfall (see Sampaio et al. 2010a for details), the influence of
the Tejo estuary (see Vasconcelos et al. 2007 for details), bathing waters and polluted
streams (see Viegas et al. 2009 for details), shellfish aquacultures in extensive regime,
recreational (e.g. angling and spearfishing) and commercial (e.g. nets, pots, longlines)
fishing activities, marina and anchoring areas, intensive recreational sport activities
(sailing, windsurf, canoeing, surf, kitesurf, diving) and physical structures mainly related to
urban and port development (Hidroprojecto 2008).
In order to understand how human-driven changes are distributed across pressure types,
pressure sources were grouped into the following categories: organic pollution, fishing,
physical and non-point-source (see Table 6.1 for details). In the present study, organic
pollution only included the sewage outfall, since pressures that can result in several types
of contamination were considered in the non-point-source category (high variety of
pollutants).
Using a Geographical Information System (GIS) approach, “environmental risk surface”
analysis was performed for each pressure type, with the purpose of classifying samples
according to the level of influence of human pressures. This analysis consists of a
modelled composite raster surface that combines information about the extent and relative
intensities of perceived environmental risks in the studied area (Schill & Raber 2009). To
do so, spatial information about each stressor was mapped into a layer, and a relative
scale was used to rank each layer according to intensity (measure of the degree of risk),
expected range of influence and weight (expected level of impact) (see Table 6.1 for
details). Intensity varied between 1 and 5 and was obtained by ranking the classification
data chosen for each pressure among locations (see Table 6.1 for details about data and
metrics used for intensity classification). Mean values of classification data from the last 5

Chapter 6
140
years were used whenever possible. Range of influence values were adapted from Ban
and Alder (2008) and Ban et al. (2010) and complemented with inquiries to several local
stakeholders and available legislation. A linear decay function was used to simulate
decrease in pressure intensity with increasing distance to the pressure source. The weight
values used resulted from the mean value of frequency of occurrence (1 - rare to 4 -
persistent) and the expected degree of impact on the marine environment (1 - low to 4 -
high). Weight values obtained were then normalized into a 1 to 3 scale (1 - low, 2 - medium
and 3 - high) (see Table 6.1 for details). The assignment of frequency and expected impact
values was performed according to the authors’ judgement, based on the values indicated
in Halpern et al. (2007).
Figure 6.1 Map of the study area showing the spatial distribution of the four specific pressure types
analysed, as well as the combined effect of those pressures in a Human Pressure Index (HPI).

Detecting the effects of multiple pressure sources
141
Table 6.1 Relative scale used to estimate the four types of human pressure gradients (organic, fishing, physical, non-point-source), showing the ranks of
each activity/pressure source according to their intensity (rank order from 1 - low to 5 - high), expected range of influence and weight according to the degree of expected impact (1 - low; 2 - medium; 3 - high).

Chapter 6
142
For each type of pressure (organic, fishing, physical and non-point-source), a raster (100
m cell width) with the cumulative impact score (CIS) was created based on previous work
by Halpern et al. (2008):
where Ai is the intensity of each activity or human pressure source A in the location i, while
wi represents the weight given to each source for that location. Analyses were performed
using the extension “Environmental Risk Assessment” of the package “Protected Area
Tools v4” (Schill & Raber 2009) in ArcGIS 10 software. Ultimately, a Human Pressure
Index (HPI) was created by combining (summing cell values) raster layers representing
individual pressures, hence reflecting the cumulative impacts for each location.
Sampling strategy
During 2009, both fish and macroinvertebrates assemblages were surveyed in four
sampling campaigns (March, June, September and November). In order to ensure that all
the study area was equally covered in each sampling campaign, three sectors were
delimited, where samples were randomly collected.
A total of 120 macroinvertebrate samples were collected using a 0.1 m2 “Day” grab. These
samples were then transported to the laboratory and washed over a 0.5 mm-mesh sieve.
The material removed was conserved in ethanol (70%) and stained with Rose Bengal.
Macroinvertebrates were sorted, counted and identified to the lowest taxonomic level
possible (usually to genus/species level). The total density (ind.m-2
) per taxa was
estimated for each replicate. Additionally, 100 g size of substrate were taken from each
site in order to characterize the composition of bottom sediments (gravel - Ø > 2000 µm ,
sand - 2000 < Ø < 63 µm and mud- Ø < 63 µm) in percentage. All sample locations were
recorded using a GPS (Global Positioning System) device.
Fish assemblages were sampled on board of a fishing vessel using an otter-trawl (12 m
headline; 20 m footrope; 80 mm cod-end mesh), covering a total area of 280.452 m2. A
total of 24 hauls were performed, with a duration of 20 minutes each (6 in each sampling
campaign). Hauls were carried out in daylight at a constant speed (2.1 - 2.3 knots) and all
fish species were identified, measured (total length; 1 mm precision) and weighted (1 g
precision). Geographic coordinates were recorded both at the start and end points of each
n
i
ii wACIS1
*
Detecting the effects of multiple pressure sources
143
haul in order to estimate the total sampled area and calculate biomass (kg.1000m-2
) per
species for each replicate.
Finally, values for organic, fishing, physical and non-point source pressure were attributed
to each sample, by overlapping sample locations with the raster images containing the
human pressure gradients.
Biological trait-based metrics
Based on an extensive revision of published literature on the expected response of trait-
based metrics to human-induced pressures (Table 6.2), a total of 9 fish-based and 21
macroinvertebrate-based metrics were selected (Table 6.3). This was followed by the
classification of all taxa of both indicators (fish and macroinvertebrates) according to their
functional traits. Trophic levels, length at first maturity, mobility, trophic guild, commercial
value and resilience traits of every fish species were assigned based on previous
classifications by Henriques et al. (2008), updated with available literature and FishBase
online database (Froese & Pauly 2012). As for macroinvertebrates, functional traits related
with living habit, body size, environmental position and feeding habits were adapted from
the classification by Bremner et al. (2003) and Aarnio et al. (2011) and classified according
to information provided by the European Register of Marine Species (MarBEF 2013) and
Biological Traits Information Catalogue (MarLIN 2006) online databases. The classification
of ecological groups was done recurring to AMBI index software v.5 (AZTI´s Marine Biotic
Index; Borja et al. 2000).
Data analysis
The response patterns of fish-based and macroinvertebrate-based metrics were analysed
through distance-based linear models (DISTLM; Anderson et al. 2008). In order to assess
if some of the metrics or a set of metrics were associated with specific pressure types
and/or to a global pattern of cumulative pressures, a model was run for the following
gradients: (1) univariate gradients (linear) - organic, fishing, physical and non-point-source
pressures; (2) multivariate pattern - including all pressure types.
In order to identify the subset of trait-based metrics that best predicts the displacement of
samples along each pressure gradient (coded into model matrices), metrics were
subjected to a forward selection procedure and selected based on the corrected Akaike
Information Criterion (AICc). AICc was used because it was developed to handle with

Chapter 6
144
Table 6.2 Predicted changes in marine assemblages induced by anthropogenic pressures, as reported in several studies. Response trend: (+) increase (-)
decrease (~) no change, with increasing levels of anthropogenic pressure.
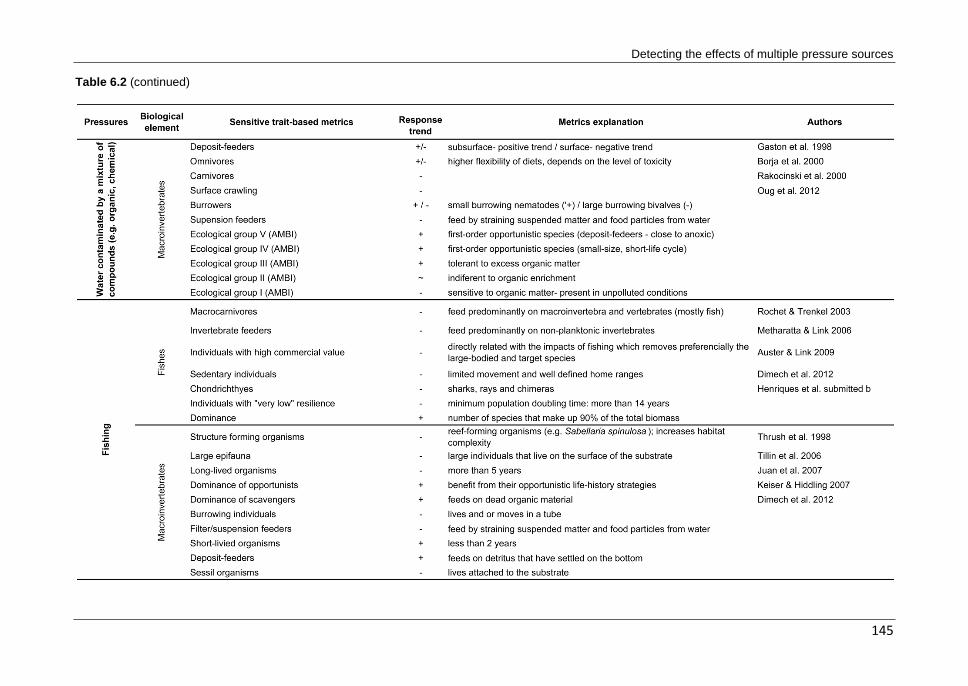
Detecting the effects of multiple pressure sources
145
Table 6.2 (continued)
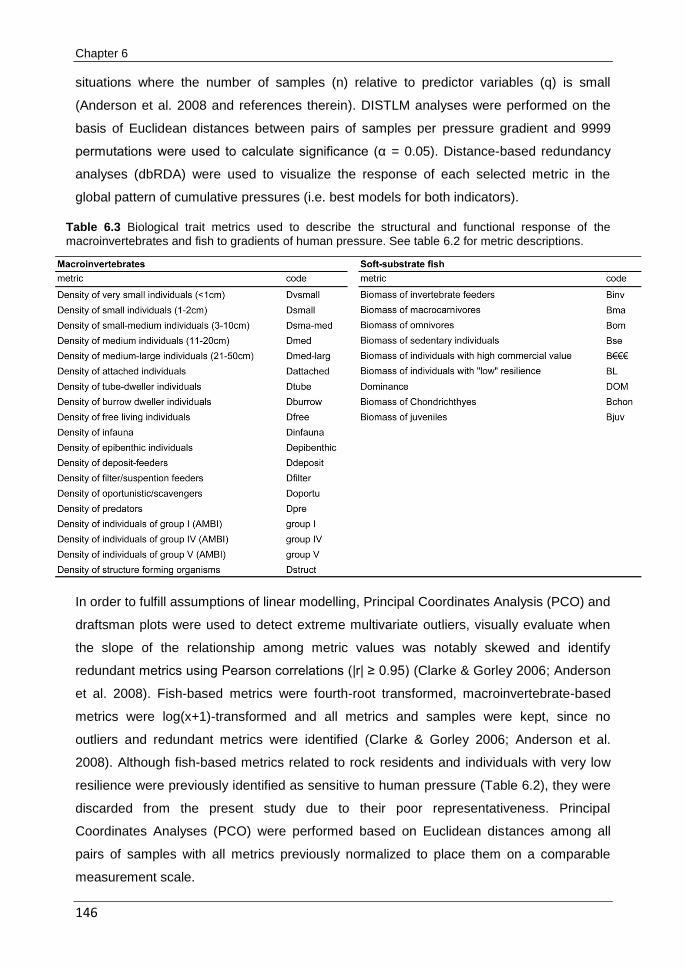
Chapter 6
146
situations where the number of samples (n) relative to predictor variables (q) is small
(Anderson et al. 2008 and references therein). DISTLM analyses were performed on the
basis of Euclidean distances between pairs of samples per pressure gradient and 9999
permutations were used to calculate significance (α = 0.05). Distance-based redundancy
analyses (dbRDA) were used to visualize the response of each selected metric in the
global pattern of cumulative pressures (i.e. best models for both indicators).
Table 6.3 Biological trait metrics used to describe the structural and functional response of the
macroinvertebrates and fish to gradients of human pressure. See table 6.2 for metric descriptions.
In order to fulfill assumptions of linear modelling, Principal Coordinates Analysis (PCO) and
draftsman plots were used to detect extreme multivariate outliers, visually evaluate when
the slope of the relationship among metric values was notably skewed and identify
redundant metrics using Pearson correlations (|r| ≥ 0.95) (Clarke & Gorley 2006; Anderson
et al. 2008). Fish-based metrics were fourth-root transformed, macroinvertebrate-based
metrics were log(x+1)-transformed and all metrics and samples were kept, since no
outliers and redundant metrics were identified (Clarke & Gorley 2006; Anderson et al.
2008). Although fish-based metrics related to rock residents and individuals with very low
resilience were previously identified as sensitive to human pressure (Table 6.2), they were
discarded from the present study due to their poor representativeness. Principal
Coordinates Analyses (PCO) were performed based on Euclidean distances among all
pairs of samples with all metrics previously normalized to place them on a comparable
measurement scale.

Detecting the effects of multiple pressure sources
147
All analyses were performed for fish and macroinvertebrates separately, but with all
correspondent samples pooled together, using PRIMER 6 package with PERMANOVA+
(Clarke & Gorley 2006; Anderson et al. 2008). As macroinvertebrates assemblages are
known to be strongly linked to sediment type (Thrush et al. 1998), the relationship between
the log(x+1)-transformed macroinvertebrate-based metrics and sediment granulometry
(gravel - Ø > 2000 µm, sand - 2000 < Ø < 63 µm and mud - Ø < 63 µm) was also tested
through DISTLM analysis on the basis of Euclidean distances and 9999 permutations (α =
0.05).
Results
Although the study area is subject to multiple pressures acting on the same site, several
differences were found in the expected spatial distribution of specific pressure types
(Figure 6.1 and Table 6.1). In general, higher values of fishing and non-point-source
intensities are expected near the shoreline. Despite that, the Tejo estuary seems to
contribute greatly to non-point-source intensity values in areas closer to the river mouth
(Figure 6.1). Physical pressure has a lower importance in most of the study area, with the
exception of the small band around the submarine outfall structure. The sewage outfall is
expected to affect much of the study area, with greater intensity near the mouth, located at
a depth of 45 m (Figure 6.1).
None of the sediment type variables showed significant relationships with the
macroinvertebrate-based metrics (DISTLM marginal tests: gravel Pseudo-F= 1.941
p>0.05, mud Pseudo-F= 2.098 p>0.05, sand Pseudo-F= 1.162 p>0.05), with the three
sediment types together explaining only 3.3% of the total variation. This has led to the
decision of discarding these variables from further analyses.
The best model results for macroinvertebrate and fish indicators suggest that they were
both sensitive to the global pattern of cumulative pressures, as well as to some of the
specific pressure types (Tables 6.4 and 6.5). The percentage of variation explained by the
models of macroinvertebrate-based metrics ranged between 29.6% and 54.2%, with the
exception of the physical pressure, where only 0.078% of variation was explained by the
best model (AICc= 314.25) and thus it was excluded from results. In contrast, fish-based
metrics explained higher percentages of variation (32.8%-73.4%). In both cases, a
significantly higher number of metrics were selected for the non-point-source pressure
models, which also explains the higher values of variation obtained for each biological
indicator, whereas opposite patterns were observed for organic pollution.

Chapter 6
148
Table 6.4 Distance-based Linear Model (DISTLM) analyses for macroinvertebrate-based metrics,
showing both marginal and sequential tests performed with a forward selection procedure and AICc selection criteria. Marginal tests show how much variation is explained by each metric alone. Sequential tests explain the cumulative variation attributed to each metric, fitted in the model in the order presented. See table 6.3 for metric codes. Significant p-values in bold.

Detecting the effects of multiple pressure sources
149
Table 6.4 (continued)

Chapter 6
150
Table 6.5 Distance-based Linear Model (DISTLM) analyses for fish-based metrics, showing both
marginal and sequential tests performed with a forward selection procedure and AICc selection criteria. Marginal tests show how much variation is explained by each metric alone. Sequential tests explain the cumulative variation attributed to each metric, fitted in the model, in the order presented. See table 6.3 for metric codes. Significant p-values in bold.

Detecting the effects of multiple pressure sources
151
The dbRDA plots in figures 6.2 and 6.3 represent the best combination of metrics that
responded to the global pattern of cumulative pressures for macroinvertebrates and fish
indicators, respectively.
Regarding macroinvertebrates assemblages (Table 6.4; Figure 6.2), the analyses of metric
response trends along pressure gradients indicate that the organic and non-point-source
impacts were probably the most responsible for the global cumulative pattern. In this case,
the first two metrics selected in best model for the global pattern (ecological group I and
medium-sized individuals) varied in the same direction of organic pollution, while the
response of the remaining metrics was consistent with the non-point-source models
(predators, ecological groups III and IV, small and structure forming individuals).
Figure 6.2 Distance-based Redundancy Analysis (dbRDA) showing best model results for
macroinvertebrate-based metrics and their correlations with the axes (circles represent vector correlations of 1). Ordination plot with position of pressure gradients is shown on the top. See table 6.3 for metric codes. Some macroinvertebrate taxa are also illustrated and images are from Clipart courtesy FCIT (http://etc.usf.edu/clipart/).

Chapter 6
152
Moreover, filter/suspension feeders and ecological group I were selected for the best
models of these specific pressures, but showed opposite trends (i.e. increased values in
response to organic pollution and decreased values with the increased intensity of the non-
point-source pressure). Metrics related to epibenthic and attached individuals were only
selected in the best model for fishing impacts. However, contrary to the expected,
epibenthic and structure forming individuals were positively associated with this pressure.
Ecological group IV and I, filter/suspension feeders and structure forming individuals were
the most selected metrics overall.
When compared to macroinvertebrates, fish-based metrics reflected that not only organic
and non-point-source pressures contribute greatly to the global pressure pattern, but also
that fishing and physical pressures could influence the global pressure patterns (Table 6.5;
Figure 6.3).
Figure 6.3 Distance-based Redundancy Analysis (dbRDA) showing best model results for fish-based
metrics and their correlations with dbRDA axes (circles represent vector correlations of 1). Ordination plot with position of pressure gradients is shown on the top. See table 6.3 for metric codes. Some representative fish species are also illustrated. Fish images were adapted from Food and Agriculture Organization of the United Nations (FAO).

Detecting the effects of multiple pressure sources
153
However, only metrics related with trophic structure responded significantly to the global
pattern of cumulative pressures. Invertebrate feeders explained 17% of variation in the
global pressures model, changing in the same direction of organic and fishing pressures,
whilst macrocarnivores decreased with the increased values of non-point-source intensity
and explained 15% of variation in the global pattern of cumulative pressures (Table 6.5).
Omnivores only explained 9% of variation in the global model and their trend seems to be
linked to physical changes (significant results and higher proportion of explained variation),
despite that, this metric had individual significant differences in marginal tests within non-
point-source pressures. Besides macrocarnivores, sedentary and high commercial value
individuals have shown a significant positive trend in the face of non-point-source
pressure. Although not significant, juveniles showed a consistently negative trend in
response to non-point-source pressure and individuals with low resilience decreased
significantly with the increase of fishing pressure.
Discussion
This study highlighted the usefulness of trait-based metrics in the assessment of human-
induced changes in coastal areas, since both biological indicators detected the global
pattern of cumulative pressures. However, given the expected response of the tested
metrics (see Table 6.2) and the results obtained in the models, it seems that the effects of
the global pattern of cumulative pressures were mainly due to non-point-source pressures
and not to a combined effect of all pressures, even though some variability was explained
by organic pollution. This possibly means that the detection of pressure-specific effects will
depend in part on the magnitude, persistency and spatial scale of disturbances,
emphasizing the difficulties of assessing single pressure effects in a multiple pressures
context on a broad range ecosystem.
In many cases, trait-based metrics of both indicators responded predominantly to specific
pressures, although this specificity was obscured by different pressures acting on the
same area. As evidenced in freshwater ecosystems (e.g. Hering et al. 2006; Johnson et al.
2006; Marzin et al. 2012), it is possible that losses caused by a specific pressure could be
compensated by some benefits provided by other pressure (e.g. toxicity vs. food supply),
which makes the biological assessment in a multiple pressures context much more
complex, with likely confounding effects. These facts might explain why some metrics were
unexpectedly selected for pressure-specific models in both macroinvertebrates and fish
indicators, suggesting that, in a multiple pressure approach, the analysis of indicator

Chapter 6
154
response should focus on known sensitive metrics, giving attention to the remaining
metrics only if they put forward contradictory results.
Non-point-source pollution can result in a mixture of contaminants with different degrees of
toxicity (Islam & Tanaka 2004; McKinley & Johnston 2010), thus, it was somewhat
expected that a higher number of metrics from both indicators were sensitive to this source
of pollution. In fact, several studies have highlighted strong relationships between pollution
(e.g. run-off and/or industrial wastewaters) and decreases in diversity, abundance (e.g.
Giangrande et al. 2005; Johnston & Roberts 2009; McKinley & Johnston 2010), as well as
with changes in some biological traits and ecological groups (Gaston et al. 1998; Borja et
al. 2000; Khalaf & Kochzius 2002; Oug et al. 2012; Henriques et al. 2013). Besides several
small polluted streams (Viegas et al. 2009), marina wastewaters and other non-point
sources of pollution, the studied area is affected by the Tejo estuary, which is not only a
source of domestic and industrial wastewaters, but also an important cause of physical
disturbance, as the movement of sediments can create unstable conditions on the bottom
(see Silva et al. 2004).
In macroinvertebrate assemblages, the response of ecological groups (AMBI), small-sized
and filter/suspension feeders to pollution is supported by a well-established and accepted
scientific knowledge (e.g. Gaston et al. 1998; Borja et al. 2000; Borja et al. 2009; Azevedo
et al. 2011). In this context, the results obtained for ecological groups I (decreasing trend of
species sensitive to organic matter) and IV (increasing trend of opportunistic species),
small individuals (increasing trend) and filter/suspension feeders (decreasing trend),
suggests the presence of some degree of pollution stress in the areas most influenced by
non-point-source pressures. In accordance, there were some evidences that
macrocarnivores and juveniles of fish assemblages responded accurately to this source of
pollution (negative trends) (Khalaf & Kochzius 2002; Henriques et al. 2013). The higher
densities of predators, infauna (macroinvertebrates) and omnivores (fish) could be
associated with the unstable conditions of the bottom, as they profit from higher mobility
and/or flexibility of diets (Khalaf & Kochzius 2002; Oug et al. 2012).
Taking into account the results previously obtained at this sewage outfall, which showed
changes in both macroinvertebrates and fish assemblages (Silva et al. 2004; Santos et al.
2008; Sampaio et al. 2010b; Sampaio et al. 2011; Henriques et al. submitted-a), a weak
response of metrics to organic pollution was found in the models of both indicators.
Although one might think at first that estuarine outflow dominated the study area, masking
the effects of sewage discharges, the most probable explanation is the lack of samples in
the area nearest the sewer mouth. In fact, those studies only found significantly higher

Detecting the effects of multiple pressure sources
155
values in opportunistic and scavenger macroinvertebrates (e.g. Capitella spp. Nassarius
reticulatus), as well as in fish guilds (invertebrate feeders and rocky resident fish) at the
area closest to diffusers (~4 km), which was attributed to the hydrodynamic stress that
promotes the early dilution of wastewaters (Santos et al. 2002). Moreover, Sampaio et al.
(2010b) noticed higher influence of sewage dispersion up to 500 m from the outfall through
the use of carbon and nitrogen isotopes to trace sewage-derived organic matter in
macroinvertebrates and sediments, whereas Santos et al. (2008) detected high
concentrations of fecal coliforms up to 2 km. Despite that, invertebrate feeders (fish)
showed a significant response to the organic gradient, and the macroinvertebrates
ecological group III (tolerant to organic matter) and small-sized individuals seem to be
associated with organic pressure within the global pattern of cumulative pressures,
according to the expected trends (see Table 6.2).
All these facts indicate that probably more accurate results are obtained when the
sampling design is directed to pressure sources (e.g. sampling along a pre-defined
pressure gradient instead of randomly). If sampling is performed on randomly placed
locations (like the present study), it is possible that indicators fail to detect pressures or
show weaker responses, responding preferentially to pressures with higher spatial
extension (e.g. non-point-source). This directed sampling approach could have strong
implications in the success of local management plans.
In contrast with the two mentioned pressure types, where some predictable metrics
responded to increases in intensity, fishing and physical pressure gradients revealed
unexpected responses (e.g. macroinvertebrates - epibenthic and structure forming
individuals; fish - sedentary individuals and invertebrate feeders). Moreover, many of the
most sensitive metrics to fishing pressure were not selected (e.g. high commercial fish and
chondrichthyes) (see Table 6.2 for details). While no strong impact was expected from
physical structures, fishing was expected to have some detectable impacts. These results
may suggest that fishing impact is not high enough in the study area to be detected or, at
least, the fishing gears used may not be destructive enough to cause strong changes in
both fish and macroinvertebrate assemblages. Actually, to our knowledge, the majority of
the studies that analysed functional and structural changes on soft-substrate marine
assemblages focus on trawling pressure (Thrush et al. 1998; Tillin et al. 2006; Kaiser &
Hiddink 2007; Auster & Link 2009; Dimech et al. 2012; Henriques et al. submitted-b). Since
most of the local fishermen use pots and nets, the lack of detection could be attributed to
weak sensitivity of the metrics tested, maladjustment of the spatial area defined as
impacted by fishing, or to actual low impact of fishing activities when compared with other

Chapter 6
156
pressures. Nonetheless, further research should be conducted to relate local fishing effort
(e.g. traps, pots, nets, longlines) with changes in the structure and function of invertebrates
and fish assemblages.
Overall, the present study clearly supports the use of structural and functional trait-based
metrics in the design of monitoring plans, as both indicators similarly detected the most
impacted sampled areas and mutually support evidence of weak responses to some other
pressure types (organic matter loads and fishing), independently of the causes of those
responses. Although different sensitivities to perturbation would be expected between the
tested indicators, none seemed to perform clearly better in the assessment of any of the
specific pressures. Previous studies provided some proof that macroinvertebrates react to
lower levels of perturbation due to their limited mobility and high dependence on the
substrate, being apparently more affected by contaminants (Hering et al. 2006; Marzin et
al. 2012). On the other hand, fish respond more dramatically to strong perturbations
(including at large scales) from the moment when habitat conditions are no longer
favourable, being probable early-warning indicators of recovery (Marzin et al. 2012). In this
way, information provided by the use of multiple indicators might be complementary and
give a more complete picture when assessing global degradation patterns. However,
further research about indicator sensitivity to different types and intensities of pressure is
urgent, in order to select potentially robust early-warning indicators/metrics to assess the
quality of marine ecosystems.
In a broad range ecosystem, without defined boundaries between habitats, an approach
similar to the one applied, i.e. previously identifying the expected pressure sources and
then analysing if the biological indicators detect changes, together with directional
monitoring plans (pressure-sources vs. controls) could be the only way to accurately
assess human impacts on marine ecosystems, while making the local/national
management plans more cost effective. Additionally, as structural and functional metrics
simplify taxonomic data into information that is more understandable for the general public
(Azevedo et al. 2011; Henriques et al. 2013) and as they are well-adapted for broad-range
geographical scales (Henriques et al. 2013), their use could also have significant
implications, not only in the success of local management plans, but also to fulfil the
requirements of international policies, such as the Marine Strategy Framework Directive.

Detecting the effects of multiple pressure sources
157
Acknowledgements
The authors would like to thank all the volunteers for the invaluable aid during field
surveys. Field work in Cascais was co-funded by Programa Operacional Regional - Lisboa
and Quadro de Referência Estratégico Nacional, through the AQUASIG project. Host
institution was funded with project PEst-OE/MAR/UI0199/2011 and PhD grants attributed
to S. Henriques (SFRH/BD/47034/2008), M.P. Pais (SFRH/BD/46639/2008) and M.I.
Batista (SFRH/BD/64395/2009), as well as Post-Doc grant of C. M. Teixeira
(SFRH/BPD/62986/2009), all from Fundação para a Ciência e Tecnologia (FCT).
Literature cited
Aarnio K., Mattila J., Törnroos A. & Bonsdorff E. (2011). Zoobenthos as an environmental quality element: the ecological significance of sampling design and functional traits. Marine Ecology, 32, 58-71.
Anderson M.J., Gorley R.N. & Clarke K.R. (2008). PERMANOVA + for PRIMER Guide to software and statistical methods. PRIMER-E: Plymounth, UK.
Auster P.J. & Link J.S. (2009). Compensation and recovery of feeding guilds in a northwest Atlantic shelf fish community. Marine Ecology Progress Series, 382, 163-172.
Azevedo I., Ramos S., Mucha A.P. & Bordalo A.A. (2011). Applicability of ecological assessment tools for management decision-making: A case study from the Lima estuary (NW Portugal). Ocean & Coastal Management, 72, 54-63.
Ban N. & Alder J. (2008). How wild is the ocean? Assessing the intensity of anthropogenic marine activities in British Columbia, Canada. Aquatic Conservation: Marine and Freshwater Ecosystems, 18, 55-85.
Ban N.C., Alidina H.M. & Ardron J.A. (2010). Cumulative impact mapping: Advances, relevance and limitations to marine management and conservation, using Canada's Pacific waters as a case study. Marine Policy, 34, 876-886.
Borja A., Franco J. & Pérez V. (2000). A marine biotic index to establish the ecological quality of soft-bottom benthos within european estarine and coastal environments. Marine Pollution Bulletin, 40, 1100-1114.
Borja A., Bald J., Franco J., Larreta J., Muxika I., Revilla M., Rodriguez J.G., Solaun O., Uriarte A. & Valencia V. (2009). Using multiple ecosystem components, in assessing ecological status in Spanish (Basque Country) Atlantic marine waters. Marine Pollution Bulletin, 59, 54-64.
Bremner J., Rogers S.I. & Frid C.L.J. (2003). Assessing functional diversity in marine benthic ecosystems: a comparison of approaches. Marine Ecology Progress Series, 254, 11-25.
Cheung S.G., Lam N.W., Wu R.S. & Shin P.K. (2008). Spatio-temporal changes of marine macrobenthic community in sub-tropical waters upon recovery from eutrophication. II. Life-history traits and feeding guilds of polychaete community. Marine Pollution Bulletin, 56, 297-307.
Clarke K.R. & Gorley R.N. (2006). PRIMER v6: User manual/tutorial. PRIMER-E, Plymouth UK.
Dimech M., Kaiser M.J., Ragonese S. & Schembri P.J. (2012). Ecosystem effects of fishing on the continental slope in the Central Mediterranean Sea. Marine Ecology Progress Series, 449, 41-54.
Directive 2008/56/CE. Directive of the European Parliment and the Council of 17 June 2008, establishing a framework for community action in the field of marine environmental policy (Marine Strategy Framework Directive). In: Official Journal of the European Union L 164, 19-40.

Chapter 6
158
Elliott M., Whitfield A.K., Potter I.C., Blaber S.J.M., Cyrus D.P., Nordlie F.G. & Harrison T.D. (2007). The guild approach to categorizing estuarine fish assemblages: a global review. Fish and Fisheries, 8, 241-268.
Froese F. & Pauly D. (2012). FishBase. Available at: http://www.fishbase.org. Accessed 2012.
Gaston G.R., Rakocinski C.F., Brown S.S. & Cleveland C.M. (1998). Trophic function in estuaries: response of macrobenthos to natural and contaminant gradients. Marine and Freshwater Research, 49, 833-846.
Giangrande A., Licciano M. & Musco L. (2005). Polychaetes as environmental indicators revisited. Marine Pollution Bulletin, 50, 1153-62.
Grigg R.W. (1994). Effects of Sewage Discharge, Fishing Pressure and Habitat Complexity on Coral Ecosystems and Reef Fishes in Hawaii. Marine Ecology Progress Series, 103, 25-34.
Halpern B.S., Selkoe K.A., Micheli F. & Kappel C.V. (2007). Evaluating and ranking the vulnerability of global marine ecosystems to anthropogenic threats. Conservation Biology, 21, 1301-15.
Halpern B.S., Walbridge S., Selkoe K.A., Kappel C.V., Micheli F., D'Agrosa C., Bruno J.F., Casey K.S., Ebert C., Fox H.E., Fujita R., Heinemann D., Lenihan H.S., Madin E.M.P., Perry M.T., Selig E.R., Spalding M., Steneck R. & Watson R. (2008). A Global Map of Human Impact on Marine Ecosystems. Science, 319, 948-952.
Henriques S., Pais M.P., Costa M.J. & Cabral H. (2008). Development of a fish-based multimetric index to assess the ecological quality of marine habitats: the Marine Fish Community Index. Marine Pollution Bulletin, 56, 1913-1934.
Henriques S., Pais M.P., Batista M.I., Costa M.J. & Cabral H.N. (2013). Response of fish-based metrics to anthropogenic pressures in temperate rocky reefs. Ecological Indicators, 25, 65-76.
Henriques S., Pais M.P., Costa M.J. & Cabral H.N. (submitted-a). Structural and functional changes in a soft-substrate fish assemblage indicated by a submarine sewage outfall. submitted to Environmental Monitoring and Assessment.
Henriques S., Pais M.P., Vasconcelos R.P., Murta A., Azevedo M., Costa M.J. & Cabral H. (submitted-b). Structural and functional traits indicate fishing pressure on marine fish assemblages. submitted to Journal of Applied Ecology.
Hering D., Johnson R.K., Kramm S., Schmutz S., Szoszkiewicz K. & Verdonschot P.F.M. (2006). Assessment of European streams with diatoms, macrophytes, macroinvertebrates and fish: a comparative metric-based analysis of organism response to stress. Freshwater Biology, 51, 1757-1785.
Hidroprojecto (2008). Carta de Sensibilidades e Potencialidades da Zona Costeira do Concelho de Cascais. Relatório Temático de Caracterização do Litoral. Volume 3 - Qualidade do Ambiente. In, p. 55.
Islam S.M. & Tanaka M. (2004). Impacts of pollution on coastal and marine ecosystems including coastal and marine fisheries and approach for management: a review and synthesis. Marine Pollution Bulletin, 48, 624-649.
Johnson R.K., Hering D., Furse M.T. & Verdonschot P.F.M. (2006). Indicators of ecological change: comparison of the early response of four organism groups to stress gradients. Hydrobiologia, 566, 139-152.
Johnston E.L. & Roberts D.A. (2009). Contaminants reduce the richness and evenness of marine communities: a review and meta-analysis. Environmental Pollution, 157, 1745-52.
Juan S., Thrush S.F. & Demestre M. (2007). Functional changes as indicators of trawling disturbance on a benthic community located in a fishing ground (NW Mediterranean Sea). Marine Ecology Progress Series, 334, 117-129.
Kaiser M.J. & Hiddink J.G. (2007). Food subsidies from fisheries to continental shelf benthic scavengers. Marine Ecology Progress Series, 350, 267-276.

Detecting the effects of multiple pressure sources
159
Khalaf M.A. & Kochzius M. (2002). Changes in trophic community structure of shore fishes at an industrial site in the Gulf of Aqaba, Red Sea. Marine Ecology Progress Series, 239, 287-299.
Machias A., Karakassis I., Giannoulaki M., Papadopoulou K.N., Smith C.J. & Somarakis S. (2005). Response of demersal fish communities to the presence of fish farms. Marine Ecology Progress Series, 288, 241-250.
MarBEF (2013). European Register of Marine Species. Available at: http://www.marbef.org. Last accessed Feb. 2013
MarLIN (2006). BIOTIC - Biological Traits Information Catalogue. Marine Life Information Network. Plymouth: Marine Biological Association of the United Kingdom. Available at: http://www.marlin.ac.uk/biotic. Last accessed Feb. 2013
Marzin A., Archaimbault V., Belliard J., Chauvin C., Delmas F. & Pont D. (2012). Ecological assessment of running waters: Do macrophytes, macroinvertebrates, diatoms and fish show similar responses to human pressures? Ecological Indicators, 23, 56-65.
McKinley A. & Johnston E.L. (2010). Impacts of contaminant sources on marine fish abundance and species richness: a review and meta-analysis of evidence from the field. Marine Ecology Progress Series, 420, 175-191.
Mee L.D., Jefferson R.L., Laffoley D. & Elliott M. (2008). How good is good? Human values and Europe's proposed Marine Strategy Directive. Marine Pollution Bulletin, 56, 187-204.
Methratta E.T. & Link J.S. (2006). Evaluation of quantitative indicators for marine fish communities. Ecological Indicators, 6, 575-588.
Niemi G., Wardrop D., Brooks R., Anderson S., Brady V., Paerl H., Rakocinski C., Brouwer M., Levinson B. & McDonald M. (2004). Rationale for a new generation of indicators for coastal waters. Environmental health perspectives, 112, 979-86.
Niemi G.J. & McDonald M.E. (2004). Application of ecological indicators. Annual Review of Ecology Evolution and Systematics, 35, 89-111.
Otway N.M. (1995). Assessing impacts of deepwater sewage disposal: A case study from New South Wales, Australia. Marine Pollution Bulletin, 31, 347-354.
Oug E., Fleddum A., Rygg B. & Olsgard F. (2012). Biological traits analyses in the study of pollution gradients and ecological functioning of marine soft bottom species assemblages in a fjord ecosystem. Journal of Experimental Marine Biology and Ecology, 432-433, 94-105.
Rochet M.-J. & Trenkel V.M. (2003). Which community indicators can measure the impact of fishing? A review and proposals. Canadian Journal of Fisheries and Aquatic Sciences, 60, 86-99.
Rogers S.I. & Greenaway B. (2005). A UK perspective on the development of marine ecosystem indicators. Marine Pollution Bulletin, 50, 9-19.
Russo A.R. (1982). Temporal changes in fish community structure near a sewage ocean outfall, Mokapu, Oahu, Hawaii. Marine Environmental Research, 6, 83-98.
Sampaio L., Freitas R., Maguas C., Rodrigues A. & Quintino V. (2010a). Coastal sediments under the influence of multiple organic enrichment sources: An evaluation using carbon and nitrogen stable isotopes. Marine Pollution Bulletin, 60, 272-82.
Sampaio L., Rodrigues A.M. & Quintino V. (2010b). Carbon and nitrogen stable isotopes in coastal benthic populations under multiple organic enrichment sources. Marine Pollution Bulletin, 60, 1790-802.
Sampaio L., Rodrigues A.M. & Quintino V. (2011). Can biotic indices detect mild organic enrichment of the seafloor? Ecological Indicators, 11, 1235-1244.
Santos C., Catarino J., Marques E., Figueiredo I., Trancoso A., Marecos H. & Neves R. (2002). Monitoring sea water around the disposal area of Guia submarine outfall. In: International conferenre on marine waste water discharges and coastal environment Istanbul, pp. 1-12.
Chapter 6
160
Santos C., Catarino J., Figueiredo Z., Calisto S., Marques E., Cunha P. & Antunes M. (2008). Water and Wastewater Monitoring of Guia Submarine Outfall – an 11 year survey. In: International conference on marine waste water discharges and coastal environment Dubrovink, Croatia.
Schill S. & Raber G. (2009). Protected Area Tools (PAT) for ArcGIS 9.3 - User Manual and Tutorial In: (ed. Conservancy TN), p. 75.
Silva S., Re A., Pestana P., Rodrigues A. & Quintino V. (2004). Sediment disturbance off the Tagus Estuary, Western Portugal: chronic contamination, sewage outfall operation and runoff events. Marine Pollution Bulletin, 49, 154-62.
Smale D.A., Langlois T.J., Kendrick G.A., Meeuwig J.J. & Harvey E.S. (2010). From fronds to fish: the use of indicators for ecological monitoring in marine benthic ecosystems, with case studies from temperate Western Australia. Reviews in Fish Biology and Fisheries, 21, 311-337.
Thrush S.F., Hewitt J.E., Cummings V.J., Dayton P.K., Cryer M., Turner S.J., Funnell G.A., Budd R.G., Milburn C.J. & Wilkinson M.R. (1998). Disturbance of the marine benthic habitat by commercial fishing: Impacts at the scale of the fishery. Ecological Applications, 8, 866-879.
Tillin H.M., Hiddink J.G., Jennings S. & Kaiser M.J. (2006). Chronic bottom trawling alters the functional composition of benthic invertebrate communities on a sea-basin scale. Marine Ecology Progress Series, 318, 31-45.
Tuya F., Sanchez-Jerez P., Dempster T., Boyra A. & Haroun R.J. (2006). Changes in demersal wild fish aggregations beneath a sea-cage fish farm after the cessation of farming. Journal of Fish Biology, 69, 682-697.
Vasconcelos R.P., Reis-Santos P., Fonseca V., Maia A., Ruano M., Franca S., Vinagre C., Costa M.J. & Cabral H. (2007). Assessing anthropogenic pressures on estuarine fish nurseries along the Portuguese coast: a multi-metric index and conceptual approach. The Science of the Total Environment, 374, 199-215.
Viegas C.N., Nunes S., Fernandes R. & Neves R. (2009). Streams contribution on bathing water quality after rainfall events in Costa do Estoril - a tool to implement an alert system for bathing water quality. Journal of Coastal Research, 56, 1691-1695.
Villnäs A., Perus J. & Bonsdorff E. (2011). Structural and functional shifts in zoobenthos induced by organic enrichment - Implications for community recovery potential. Journal of Sea Research, 65, 8-18.
Warwick R.M., Pearson T.H. & Ruswahyuni (1987). Detection of Pollution Effects on Marine Macrobenthos - Further Evaluation of the Species Abundance-Biomass Method. Marine Biology, 95, 193-200.
Whitfield A.K. & Elliott M. (2002). Fishes as indicators of environmental and ecological changes within estuaries: a review of progress and some suggestions for the future. Journal of Fish Biology, 61, 229-250.

161
CHAPTER 7
Conclusions and final remarks


Conclusions and final remarks
163
Conclusions and final remarks
Overall, this thesis has clearly demonstrated the usefulness of metric-based approach for
characterizing changes in fish assemblages due to anthropogenic pressures and
represents an important contribution towards a deeper understanding of the consequences
of those pressures. Moreover, to our knowledge, this thesis comprises the first integrative
metric-based approach to assess changes in marine fish assemblages and identifies some
sets of metrics sensitive to the main anthropogenic pressures acting on marine
ecosystems, such as fishing and different water contamination sources.
The assessments of fish assemblages associated with both rocky (Chapter 2) and soft-
substrate habitats (Chapter 4 and 5) showed that the metric-based approach provides
stronger evidence of anthropogenic-induced changes than species individually. Besides
providing more understandable information (Elliott et al. 2007; Mouillot et al. 2012), in
some cases the observed changes in the abundance or biomass of particular species were
balanced by changes in other species that shared the same biological trait, hence not
altering some features of the assessed assemblages (compensation mechanisms)
(Chapter 2, 3, 4 and 5). For instance, no structural and functional shifts were found in the
response of rocky fish assemblages to a thermal effluent, despite the observed differences
in species composition between disturbed and control sites (Chapter 2). This mechanism
of compensation, due to functional redundancy, has been largely recognized as one of the
most important factors responsible for the resilience and stability of ecosystems, making
the use of a metric-based approach more powerful in the assessment of ecological
condition of ecosystems (Hughes et al. 2005; Bremner 2008; Mouillot et al. 2012). On the
other hand, when pressure is severe enough to affect almost all the species representing a
given structural or functional trait, this compensation mechanism becomes less efficient,
with consequent loss of that stability (Hughes et al. 2005; Bremner 2008; Mouillot et al.
2012). Therefore, it is not surprising that different patterns of response may be observed
depending not only on the intensity and degree of destructiveness of pressure, but also on
the complexity of habitat and biotic interactions affected.
Considering the assumption of limited resources, ranking the vulnerability of marine
ecosystems and the impacts of anthropogenic pressures becomes an important task in

Chapter 7
164
order to prioritize conservation efforts (Halpern et al. 2007; Crain et al. 2009; Ban et al.
2010). Since the analysed pressures had different potential degrees of destructiveness, i.e.
trawling (soft-substrate) versus artisanal fishing activities (rocky reefs) and organic effluent
(soft-substrate) versus mixture of compounds from sewage discharges and run-off sources
(rocky reefs), it is not possible here to directly compare the susceptibility of fish
assemblages of different habitat typologies. Rocky reefs, hard-bottom shelf areas, coral
reefs and mangroves have been pointed out by experts as the most threatened marine
ecosystems (Halpern et al. 2007). However, the selection of protected/recovery areas is
ultimately associated with the local conservation targets and human uses.
Fish assemblages of rocky reef habitats were broadly affected by water pollution resultant
from the mixture of potentially toxic components (sewage discharges and non-point
sources of pollution) which led to changes of many metrics representing several attributes
(trophic, mobility, structure, resilience, habitat, nursery function) (broad-range pressure),
whereas fishing affected fish assemblages differentially, with specific metrics responding to
its presence (selective pressure) (Chapter 2 and 3). In agreement, sewage discharges led
to broad range effects on several attributes of fish assemblages while trawling led to more
selective effects in the associated fish assemblages (Chapter 4 and 5). Although at first the
number of sensitive metrics could be seen as a reflection of the degree of destructiveness
caused by pressure, this is not necessary true since only one biological indicator and one
specific pressure were evaluated. Thus, it is possible that broad-range pressures may
affect more attributes of a given assemblage but cause less impact than a more selective
pressure. For instance, demersal destructive fishing (e.g. trawling) has been widely
recognized as one of the worse threats of marine ecosystems (Halpern et al. 2007; Crain
et al. 2009; Dimech et al. 2012).
Present results, stress the urgent need for the development of integrative strategies to
assess biologically and ecologically sensitive areas, rank human activities and their
impacts, as well as analyse the spatial scale in which a given pressure disturbs, in order to
design appropriate monitoring and management plans to achieving the sustainable use of
the seas, e.g. Ecosystem-based management and Marine Spatial Planning (MSP)
(Crowder & Norse 2008; Douvere 2008; Levin et al. 2009; Foley et al. 2010). Yet, these
approaches raise a question: how to assess anthropogenic pressure effects in changing
ecosystems? Although marine ecosystems are subject to multiple pressures and are
spatially and temporally dynamic (Costanza & Mageau 1999; Cury et al. 2003; Rice 2005;
Johnson et al. 2012), which makes their assessment difficult, several aspects of the
applied sampling method may contribute greatly for the success of monitoring plans, while
Conclusions and final remarks
165
making them more cost-effective, as evidenced by several of the present findings, as
follows:
(1) Given the influence of the environmental features in the composition of fish
assemblages, such as habitat complexity, depth, biotic cover, sediment type, seasonal and
inter-annual variability, among others (e.g. Holbrook et al. 1994; García-Charton & Pérez-
Ruzafa 2001; Magill & Sayer 2002; Friedlander et al. 2003; Labropoulou &
Papaconstantinou 2004; Henriques et al. 2007; La Mesa et al. 2011a), and the agreement
between the observed response with the results previously obtained by other authors that
analysed similar pressures at the species level (see chapters 2, 3, 4 and 5 and references
therein), the general applied approach in this thesis seems to be adequate to detect
anthropogenic impacts. Accordingly, future studies aimed at assessing changes in fish
assemblages should follow the same commencement, i.e. minimize the effects of natural
variability by comparing habitats of similar complexity and accounting for season and/or
inter-annual shifts. In this way, the use of measures of habitat complexity (Pais et al.
2013), substrate cover, biotic cover, exposure and depth, is advisable in order to
characterize rocky reef habitats (Chapter 2 and 3). Soft-substrate habitats should be
characterized at least using measures related with depth, sediment type, exposure and
latitude (Chapter 4 and 5);
(2) Despite the general idea that structural and functional guilds are more resilient to
natural variations than species abundances (Elliott et al. 2007; Henriques et al. 2008),
results of chapter 3 showed that seasonal variations can influence the patterns of some
fish-based metrics and in turn potentially affect the detection of changes in rocky reefs
depending on the intensity and degree of damage caused by pressure. In this case, the
choice of a specific season to survey rocky reefs, during the warm season after the
spawning period (July-October), seems to be more adequate to detect changes in fish
assemblages, while minimizing monitoring costs (Chapter 3). In this context, further
research is needed to suitably assess the effects of seasonal variations in soft-substrate
fish-based metrics and uncover the best season to detect anthropogenic impacts;
(3) A novel approach to select sensitive metrics was tested in chapter 5, by modelling the
response of several fish-based metrics to a gradient of trawling intensity and comparing
the consistency of those metrics among four different habitat typologies. This approach
proved to be efficient in the assessment of extensive marine areas as it allowed the
detection of sensitive metrics against a background of natural variability. Consequently, it

Chapter 7
166
can have deep implications in the assessment of anthropogenic pressures that embrace
broad areas, and therefore, it should be tested for other types of pressure sources;
(4) Chapter 6 highlighted some findings that are of extreme importance to deal with
multiple pressures contexts and broad scales, since they show the weaknesses of
common monitoring plans, which are designed to characterize marine assemblages and
may not be able to detect specific anthropogenic pressure effects. Overall, the results
reinforce the difficulties of detecting single pressure effects, which is of paramount
importance for increase management options, due to the lack of pressure-specific metrics
and the influence of multiple pressures that act synergistically upon the assemblages (both
fish and macroinvertebrates indicators). In this way, an alternative approach is
recommended to improve pressure specific analysis, which consist firstly of identifying the
expected pressure sources and applying a directional monitoring plan (pressure vs.
controls), to analyse if the biological indicators detect changes (chapter 6). On the other
hand, this directed monitoring plan probably makes the local/national management plans
more cost-effective.
The advantages of using metric-based approach are evident, given the diversity of natural
factors that can influence the detection of anthropogenic pressures. Although the selected
fish-based metrics seem promising in the assessment of anthropogenic pressures, the
present study is but a starting point for the successful use of marine fish assemblages as
indicators. The development of this approach would highly benefit from further research
including spatial (higher number of rocky reefs and soft-substrate habitats and other
biogeographic regions) and temporal (seasonal and inter-annual) variability in the
response of fish-based metrics. Moreover, these investigations should also address not
only the assessed pressures, but also other drivers of pressure such as dredging activities,
aquacultures, other fishing activities, other types of water pollution. Such studies should
allow to increase base-knowledge about fish assemblages changes, find potential new
sensitive metrics, test the broad applicability of fish-based metrics and reinforce metrics
sensitiveness.
Most assessment tools (multimetric indices) developed for fish assemblages in several
aquatic ecosystems compare the observed metric values with a reference scale, based on
the values that the metrics would have in the absence of anthropogenic pressure, to
classify the final ecological condition (e.g. Karr 1981; Deegan et al. 1997; Harrison &
Whitfield 2006; Hering et al. 2006; Roset et al. 2007). Even though some compensatory
mechanisms reduce the influence of natural variability and given the amount of factors that

Conclusions and final remarks
167
determine the homogeneity of marine assemblages spatially and temporally, here the
application of a common reference method would probably lead to inadequate
classifications. Therefore, an alternative classification method on a case-by-case basis
based on the percentage of deviance between control and disturbed sites, by pressure,
would probably assess more accurately the ecological conditions with higher degree of
confidence. To test this hypothesis, a strong background of the results of above-mentioned
studies is needed to define those percentages of deviance. Until then, another option may
be the simple assessment of has/has no impact or analysing gradients of pressure as in
the present study.
Finally, to achieve an efficient sustainable use of marine resources, the pressure sources
must be identified to assure the establishment of efficient management plans. However, it
is difficult to find in practice metrics sensitive to single pressure (pressure-specific) due to
its scattering power over the complex networks of biotic/abiotic interactions (Niemi et al.
2004). In this way, the proposed directed monitoring approach (chapter 6), which follow the
principles of the ecosystem-based Marine Spatial Planning (MSP) (Crowder & Norse 2008;
Douvere 2008; Levin et al. 2009; Foley et al. 2010), should be tested and include other
biological indicators (e.g. algae, invertebrates, phytoplankton), in order to increase the
knowledge about the effects of anthropogenic pressures on marine assemblages and
properly assess the ecological condition of marine ecosystems.
Literature cited
Ban N.C., Alidina H.M. & Ardron J.A. (2010). Cumulative impact mapping: Advances, relevance and limitations to marine management and conservation, using Canada's Pacific waters as a case study. Marine Policy, 34, 876-886.
Bremner J. (2008). Species' traits and ecological functioning in marine conservation and management. Journal of Experimental Marine Biology and Ecology, 366, 37-47.
Costanza R. & Mageau M. (1999). What is a healthy ecosystem? Aquatic Ecology, 33, 105-115.
Crain C.M., Halpern B.S., Beck M.W. & Kappel C.V. (2009). Understanding and managing human threats to the coastal marine environment. Annals of the New York Academy of Sciences, 1162, 39-62.
Crowder L. & Norse E. (2008). Essential ecological insights for marine ecosystem-based management and marine spatial planning. Marine Policy, 32, 772-778.
Cury P., Shannon L. & Shin Y.J. (2003). The functioning of marine ecosystems: a fisheries perspective. In: Responsible Fisheries in the Marine Ecosystem (ed. M. Sinclair aGV). FAO/CAB International Rome, Italy/Wallingford, UK, pp. 103-123.
Deegan L.A., Finn J.T. & Buonaccorsi J. (1997). Development and validation of an estuarine biotic integrity index. Estuaries, 20, 601-617.
Dimech M., Kaiser M.J., Ragonese S. & Schembri P.J. (2012). Ecosystem effects of fishing on the continental slope in the Central Mediterranean Sea. Marine Ecology Progress Series, 449, 41-54.
Chapter 7
168
Douvere F. (2008). The importance of marine spatial planning in advancing ecosystem-based sea use management. Marine Policy, 32, 762-771.
Elliott M., Whitfield A.K., Potter I.C., Blaber S.J.M., Cyrus D.P., Nordlie F.G. & Harrison T.D. (2007). The guild approach to categorizing estuarine fish assemblages: a global review. Fish and Fisheries, 8, 241-268.
Foley M.M., Halpern B.S., Micheli F., Armsby M.H., Caldwell M.R., Crain C.M., Prahler E., Rohr N., Sivas D., Beck M.W., Carr M.H., Crowder L.B., Emmett Duffy J., Hacker S.D., McLeod K.L., Palumbi S.R., Peterson C.H., Regan H.M., Ruckelshaus M.H., Sandifer P.A. & Steneck R.S. (2010). Guiding ecological principles for marine spatial planning. Marine Policy, 34, 955-966.
Friedlander A.M., Brown E.K., Jokiel P.L., Smith W.R. & Rodgers K.S. (2003). Effects of habitat, wave exposure, and marine protected area status on coral reef fish assemblages in the Hawaiian archipelago. Coral Reefs, 22, 291-305.
García-Charton J.A. & Pérez-Ruzafa A. (2001). Spatial pattern and the habitat structure of a Mediterranean rocky reef fish local assemblage. Marine Biology, 138, 917-934.
Halpern B.S., Selkoe K.A., Micheli F. & Kappel C.V. (2007). Evaluating and ranking the vulnerability of global marine ecosystems to anthropogenic threats. Conservation Biology, 21, 1301-15.
Harrison T.D. & Whitfield A.K. (2006). Application of a multimetric fish index to assess the environmental condition of south African estuaries. Estuaries and Coasts, 29, 1108-1120.
Henriques M., Gonçalves E.J. & Almada V.C. (2007). Rapid shifts in a marine fish assemblage follow fluctuations in winter sea conditions. Marine Ecology Progress Series, 340, 259-270.
Henriques S., Pais M.P., Costa M.J. & Cabral H. (2008). Development of a fish-based multimetric index to assess the ecological quality of marine habitats: the Marine Fish Community Index. Marine Pollution Bulletin, 56, 1913-1934.
Hering D., Johnson R.K., Kramm S., Schmutz S., Szoszkiewicz K. & Verdonschot P.F.M. (2006). Assessment of European streams with diatoms, macrophytes, macroinvertebrates and fish: a comparative metric-based analysis of organism response to stress. Freshwater Biology, 51, 1757-1785.
Holbrook S.J., Kingsford M.J., Schmitt R.J. & Stephens J.S. (1994). Spatial and Temporal Patterns in Assemblages of Temperate Reef Fish. American Zoologist, 34, 463-475.
Hughes T.P., Bellwood D.R., Folke C., Steneck R.S. & Wilson J. (2005). New paradigms for supporting the resilience of marine ecosystems. Trends in Ecology and Evolution, 20, 380-386.
Johnson A.F., Jenkins S.R., Hiddink J.G. & Hinz H. (2012). Linking temperate demersal fish species to habitat: scales, patterns and future directions. Fish and Fisheries, doi.org/10.1111/j.1467-2979.2012.00466.x.
Karr J.R. (1981). Assessment of Biotic Integrity Using Fish Communities. Fisheries, 6, 21-27.
La Mesa G., Molinari A., Gambaccini S. & Tunesi L. (2011a). Spatial pattern of coastal fish assemblages in different habitats in North-western Mediterranean. Marine Ecology, 32, 104-114.
Labropoulou M. & Papaconstantinou C. (2004). Community structure and diversity of demersal fish assemblages: the role of fishery. Scientia Marina, 68, 215-226.
Levin P.S., Fogarty M.J., Murawski S.A. & Fluharty D. (2009). Integrated ecosystem assessments: developing the scientific basis for ecosystem-based management of the ocean. PLoS Biology, 7, e14.
Magill S.H. & Sayer M.D.J. (2002). Seasonal and interannual variation in fish assemblages of northern temperate rocky subtidal habitats. Journal of Fish Biology, 61, 1198-1216.
Mouillot D., Graham N.A., Villeger S., Mason N.W. & Bellwood D.R. (2012). A functional approach reveals community responses to disturbances. Trends in Ecology and Evolution, 28, 167-177.

Conclusions and final remarks
169
Niemi G., Wardrop D., Brooks R., Anderson S., Brady V., Paerl H., Rakocinski C., Brouwer M., Levinson B. & McDonald M. (2004). Rationale for a new generation of indicators for coastal waters. Environmental Health Perspectives, 112, 979-86.
Pais M.P., Henriques S., Costa M.J. & Cabral H. (2013). Improving the “chain and tape” method: a combined topography index for marine fish ecology studies. Ecological Indicators, 25, 250-255.
Rice J.C. (2005). Understanding fish habitat ecology to achieve conservation. Journal of Fish Biology, 67, 1-22.
Roset N., Grenouillet G., Goffaux D., Pont D. & Kestemont P. (2007). A review of existing fish assemblage indicators and methodologies. Fisheries Management and Ecology, 14, 393-405.


Agradecimentos
173
Agradecimentos (PT)
Depois de concluído mais este desafio, não poderia deixar de expressar o meu profundo e
sincero agradecimento a todas as pessoas que de alguma forma contribuíram para esta
tese, em especial:
Ao Professor Henrique Cabral por todo o apoio e amizade ao longo destes últimos anos,
pela supervisão desta tese e por ter proporcionado todas as condições que permitiram o
seu desenvolvimento; por todos conselhos e orientação da minha carreira científica.
Á Professora Maria José Costa, por ter aceite orientar esta tese e pela oportunidade de
fazer parte da equipa do Centro de Oceanografia, FCUL.
Ao Centro de Oceanografia (CO), Faculdade de Ciências da Universidade de Lisboa
(FCUL) e Fundação para a Ciência e Tecnologia (FCT) por terem apoiado e
proporcionado as condições necessárias ao desenvolvimento desta tese.
Ao Bernardo e à Tânia, pelo tempo interminável que perderam a ensinar-me a trabalhar
no FIA (Flow Injection Analysis), aquela máquina especial com vontade própria.
A todos os que participaram nas campanhas de amostragem, desde os dias de pesca (um
pouco enjoativos) aos mergulhos, pois sem a vossa ajuda o trabalho teria sido certamente
bem mais difícil.
A todas pessoas do laboratório pelo apoio fundamental dos últimos anos, em especial ao
Miguel, Marisa, Rita, Inês, Joana, Susana, Vanessa, Susanne e Patrick pelos momentos
maravilhosos de trabalho de campo, “peixeiradas”, por todos os conselhos e discussões
científicas, enfim... pela vossa amizade e por tornarem os momentos de trabalho e lazer
muito mais agradáveis.
Ao Miguel pela amizade e apoio em todas as fases desta tese, pelo companheirismo e
inúmeras horas de trabalho de campo, discussão de ideias e leitura dos artigos. Pelo seu
entusiasmo e humor que tanto ajudaram nos momentos mais difíceis, principalmente no
de campo.

Agradecimentos
174
Á Marisita pela sua fantástica amizade ao longo destes anos, por toda a ajuda e
motivação e pelas longas horas a navegar por esses mares fora. E agora, que esta já está
terminada, ofereço-me para tomar conta do meu “sobrinho”, ainda sem nome, para
acabares a tua tese.
À Rita por toda a força, motivação e exemplo que tanto me ajudaram a ultrapassar todos
os momentos difíceis destes anos. Pela sua amizade e apoio incondicionais e por ser a
nossa “melhor” skipper, a única que bate palmas quando chegamos à superfície.
A todos os meus amigos que enriquecem a minha vida, tornando os bons momentos
únicos e os maus momentos mais fáceis de ultrapassar.
A toda a minha família, pelo amor, amizade e apoio incondicionais, uma vez que cada um,
desde o mais pequenino ao mais velho, é um pouco responsável pelo que sou hoje. Em
especial aos meus pais, por acreditarem em mim todos os dias e por me terem sempre
apoiado no meu sonho de “estudar os bichos”.
Ao Diogo, provavelmente a pessoa mais difícil de demostrar a minha gratidão pois não
existem palavras que cheguem para expressar aquilo que sinto. Pela paciência e
motivação que tanto me ajudaram a ultrapassar esta árdua tarefa de fazer um
doutoramento. Por todo o amor e amizade incondicionais que fazem de mim uma pessoa
melhor e FELIZ todos os dias.
A autora desta tese foi financiada com uma bolsa de doutoramento da Fundação para a
Ciência e a Tecnologia (Referência SFRH/BD/47034/2008).
The author of this thesis was funded by Fundação para a Ciência e a Tecnologia with a
PhD grant (Reference SFRH/BD/47034/2008).