Establishing Key Performance Indicators for Measuring ...
11
Establishing Key Performance Indicators for Measuring Soſtware-Development Processes at a Large Organization Cem Sürücü Volkswagen Financial Services AG Braunschweig, Germany Otto-von-Guericke University Magdeburg, Germany [email protected] Bianying Song Volkswagen Financial Services AG Braunschweig, Germany [email protected] Jacob Krüger University of Toronto Toronto, Canada Otto-von-Guericke University Magdeburg, Germany [email protected] Gunter Saake Otto-von-Guericke University Magdeburg, Germany [email protected] Thomas Leich Harz Unviersity of Applied Sciences Wernigerode, Germany [email protected] ABSTRACT Developing software systems in large organizations requires the cooperation of various organizational units and stakeholders. As software-development processes are distributed among such organi- zational units; and are constantly transformed to fulfill new domain regulations, address changing customer requirements, or adopt new software-engineering methods; it is challenging to ensure, measure, and steer—essentially monitor—the quality of the resulting sys- tems. One means to facilitate such monitoring throughout whole software-development processes are key performance indicators, which provide a consolidated analysis of an organizations’ perfor- mance. However, it is also challenging to introduce key performance indicators for the software development of a large organization, as they must be implemented at and accepted by all relevant organiza- tional units. In this paper, we report our experiences of introducing new key performance indicators for software-development pro- cesses at Volkswagen Financial Services AG, a large organization in the financial sector. We describe i) our methodology; ii) how we cus- tomized and use key performance indicators; iii) benefits achieved, namely improved monitoring and comparability, which help to define quality-improving actions; iv) and six lessons learned. These insights are helpful for other practitioners, providing an overview of a methodology they can adopt to assess the feasibility of key performance indicators as well as their benefits. Moreover, we hope to motivate research to investigate methods for introducing and monitoring key performance indicators to facilitate their adoption. CCS CONCEPTS • Social and professional topics → Quality assurance; • Soft- ware and its engineering → Risk management. Permission to make digital or hard copies of all or part of this work for personal or classroom use is granted without fee provided that copies are not made or distributed for profit or commercial advantage and that copies bear this notice and the full citation on the first page. Copyrights for components of this work owned by others than the author(s) must be honored. Abstracting with credit is permitted. To copy otherwise, or republish, to post on servers or to redistribute to lists, requires prior specific permission and/or a fee. Request permissions from [email protected]. ESEC/FSE ’20, November 8–13, 2020, Virtual Event, USA © 2020 Copyright held by the owner/author(s). Publication rights licensed to ACM. ACM ISBN 978-1-4503-7043-1/20/11. . . $15.00 https://doi.org/10.1145/3368089.3417057 KEYWORDS Key performance indicators, quality assurance, monitoring ACM Reference Format: Cem Sürücü, Bianying Song, Jacob Krüger, Gunter Saake, and Thomas Leich. 2020. Establishing Key Performance Indicators for Measuring Software- Development Processes at a Large Organization. In Proceedings of the 28th ACM Joint European Software Engineering Conference and Symposium on the Foundations of Software Engineering (ESEC/FSE ’20), November 8–13, 2020, Virtual Event, USA. ACM, New York, NY, USA, 11 pages. https://doi.org/10. 1145/3368089.3417057 1 INTRODUCTION Most larger organizations deliver software systems as a part of their products, or these systems are the products themselves. So, these organizations have defined software-development processes, which usually span various organizational units (e.g., departments, sub- organizations) that collaborate while developing a system. While such an organizational structure can facilitate certain activities, for example, eliciting customer requirements is done by specialists in one department, it can also pose challenges, for instance, to coor- dinate development activities, share knowledge, or steer business decisions [13, 17, 18, 21, 23]. In particular, each organizational unit may use own means to monitor their part of the process, hampering comparability and traceability of system and process properties throughout the whole software-development process. A helpful means to monitor and steer software-development processes are key performance indicators, a set of values allowing to analyze and compare an organization’s performance regard- ing specified objectives [1, 4, 15, 19]. However, introducing key performance indicators in a large organization with distributed development activities and a constantly evolving infrastructure is far from trivial. We are aware of existing guidelines, tools, and experience reports [1, 3, 4, 6, 13, 15, 20, 21], but we do not know of a light-weight, well-defined, and practically evaluated methodol- ogy that provides fast feedback on the impact of introducing key performance indicators in large, distributed organizations. In this paper, we report our experiences of introducing key per- formance indicators at Volkswagen Financial Services AG (VWFS), a large German organization in the finance sector. By sharing our 1331
-
Upload
khangminh22 -
Category
Documents
-
view
0 -
download
0
Transcript of Establishing Key Performance Indicators for Measuring ...
Establishing Key Performance Indicators for MeasuringSoftware-Development Processes at a Large Organization
Cem SürücüVolkswagen Financial Services AG
Braunschweig, GermanyOtto-von-Guericke University
Magdeburg, [email protected]
Bianying SongVolkswagen Financial Services AG
Braunschweig, [email protected]
Jacob KrügerUniversity of Toronto
Toronto, CanadaOtto-von-Guericke University
Magdeburg, [email protected]
Gunter SaakeOtto-von-Guericke University
Magdeburg, [email protected]
Thomas LeichHarz Unviersity of Applied Sciences
Wernigerode, [email protected]
ABSTRACTDeveloping software systems in large organizations requires thecooperation of various organizational units and stakeholders. Assoftware-development processes are distributed among such organi-zational units; and are constantly transformed to fulfill new domainregulations, address changing customer requirements, or adopt newsoftware-engineering methods; it is challenging to ensure, measure,and steer—essentially monitor—the quality of the resulting sys-tems. One means to facilitate such monitoring throughout wholesoftware-development processes are key performance indicators,which provide a consolidated analysis of an organizations’ perfor-mance. However, it is also challenging to introduce key performanceindicators for the software development of a large organization, asthey must be implemented at and accepted by all relevant organiza-tional units. In this paper, we report our experiences of introducingnew key performance indicators for software-development pro-cesses at Volkswagen Financial Services AG, a large organization inthe financial sector. We describe i) our methodology; ii) how we cus-tomized and use key performance indicators; iii) benefits achieved,namely improved monitoring and comparability, which help todefine quality-improving actions; iv) and six lessons learned. Theseinsights are helpful for other practitioners, providing an overviewof a methodology they can adopt to assess the feasibility of keyperformance indicators as well as their benefits. Moreover, we hopeto motivate research to investigate methods for introducing andmonitoring key performance indicators to facilitate their adoption.
CCS CONCEPTS• Social and professional topics → Quality assurance; • Soft-ware and its engineering→ Risk management.
Permission to make digital or hard copies of all or part of this work for personal orclassroom use is granted without fee provided that copies are not made or distributedfor profit or commercial advantage and that copies bear this notice and the full citationon the first page. Copyrights for components of this work owned by others than theauthor(s) must be honored. Abstracting with credit is permitted. To copy otherwise, orrepublish, to post on servers or to redistribute to lists, requires prior specific permissionand/or a fee. Request permissions from [email protected]/FSE ’20, November 8–13, 2020, Virtual Event, USA© 2020 Copyright held by the owner/author(s). Publication rights licensed to ACM.ACM ISBN 978-1-4503-7043-1/20/11. . . $15.00https://doi.org/10.1145/3368089.3417057
KEYWORDSKey performance indicators, quality assurance, monitoring
ACM Reference Format:Cem Sürücü, Bianying Song, Jacob Krüger, Gunter Saake, and Thomas Leich.2020. Establishing Key Performance Indicators for Measuring Software-Development Processes at a Large Organization. In Proceedings of the 28thACM Joint European Software Engineering Conference and Symposium on theFoundations of Software Engineering (ESEC/FSE ’20), November 8–13, 2020,Virtual Event, USA. ACM, New York, NY, USA, 11 pages. https://doi.org/10.1145/3368089.3417057
1 INTRODUCTIONMost larger organizations deliver software systems as a part of theirproducts, or these systems are the products themselves. So, theseorganizations have defined software-development processes, whichusually span various organizational units (e.g., departments, sub-organizations) that collaborate while developing a system. Whilesuch an organizational structure can facilitate certain activities, forexample, eliciting customer requirements is done by specialists inone department, it can also pose challenges, for instance, to coor-dinate development activities, share knowledge, or steer businessdecisions [13, 17, 18, 21, 23]. In particular, each organizational unitmay use ownmeans to monitor their part of the process, hamperingcomparability and traceability of system and process propertiesthroughout the whole software-development process.
A helpful means to monitor and steer software-developmentprocesses are key performance indicators, a set of values allowingto analyze and compare an organization’s performance regard-ing specified objectives [1, 4, 15, 19]. However, introducing keyperformance indicators in a large organization with distributeddevelopment activities and a constantly evolving infrastructureis far from trivial. We are aware of existing guidelines, tools, andexperience reports [1, 3, 4, 6, 13, 15, 20, 21], but we do not know ofa light-weight, well-defined, and practically evaluated methodol-ogy that provides fast feedback on the impact of introducing keyperformance indicators in large, distributed organizations.
In this paper, we report our experiences of introducing key per-formance indicators at Volkswagen Financial Services AG (VWFS),a large German organization in the finance sector. By sharing our
1331

ESEC/FSE ’20, November 8–13, 2020, Virtual Event, USA Cem Sürücü, Bianying Song, Jacob Krüger, Gunter Saake, and Thomas Leich
method and lessons learned, we hope to provide helpful insights forpractitioners who plan to adopt key performance indicators them-selves. During such an adoption, it is important to consider theorganization’s domain, relevant regulations, business needs (Sec-tion 2), and goals for monitoring (Section 3). To provide insightsinto such considerations, we discuss how we established tools, cus-tomized key performance indicators to our organization’s needs,convinced managers and developers to use these, balanced trade-offs (Section 4), and report our results as well as lessons learned (Sec-tion 5). Our insights also indicate future directions for researchersto explore, particularly on designing guidelines and techniques tofacilitate the introduction and use of key performance indicators.
2 THE ORGANIZATIONVWFS is a large, international organization in the financial sectorwith over 16 000 employees. Within VWFS, several sub-organiza-tions exist tomanage its different business areas, including a large ITorganization—VWFS Digital Solutions GmbH (DS)—to develop andmaintain software systems. This IT organization is further dividedinto functional departments, such as process coordination, testing,software development, IT operations, or application management;while departments, such as product management and marketing,are part of other sub-organizations. Due to this structure, differentdepartments and internal as well as external organizations con-tribute to the existing software-development processes, which arecoordinated by DS. So, to develop a software system at VWFS, vari-ous specialists from such units cooperate in agile [14, 22], waterfall,or mixed-method software-development processes.
As any organization, VWFS and DS constantly face fundamentalorganizational and process transformations to cope with changingregulations in the financial and software domain, to modernizetheir systems, and to incorporate new software technologies. Forinstance, DS estimates that approximately 80 % of its system land-scape will be changed accordingly in the next years. Currently,DS intensifies an agile transformation to change the predominantconventional co-working departments via cross-functional, multi-disciplinary teams into a new business cluster focusing on customer-oriented business processes. To create this business cluster, severaldepartments cooperate to analyze and transform the strategicallymost important and most appropriate software systems togetherwith their development processes. In parallel, DS uses this trans-formation to increase the quality of its systems and improve itsprocesses, introducing new organizational structures, technologies,and software-engineering methods.
3 MOTIVATIONDuring the current agile transformation, and while planning futuresteps, it became apparent that VWFS could heavily benefit fromimproving the tracing of quality in its software-development pro-cesses; in particular to measure (software) quality throughout allorganizational units. Such an extended end-to-end traceability andmeasurement of all processes in a system’s life-cycle could facilitatecommunication and coordination among all units. For this reason,we decided to investigate and introduce additional key performanceindicators to measure existing processes in terms of software qual-ity, efficiency, and stability. The constant need to transform our
processes and especially the most recent changes further motivatedthis idea, as key performance indicators can help to assess the im-provements specific technologies and methods yield. So, we saw awin-win situation for VWFS and aimed to establish methods andkey performance indicators as basis for a data-driven steering oforganizational transformations and daily business operations.
There have been historically grown means to measure software-development processes at VWFS, for instance, stability reports ofthe IT department, testing reports of the testing department, ormanagement reports comprising strategic key performance indi-cators. We found that these means are helpful and provide a goodintuition about the business trends of each department, defininga reliable basis for managers and specialists of the departments toderive their decisions. However, the existing means and key perfor-mance indicators are too department-specific and do not providean end-to-end overview of the development processes of interest.So, we saw potential for improvement concerning six criteria:
C1 Transparency. Key performance indicators can help to as-sess, report on, and depict an organization’s overarchingbusiness needs and their complex relations (e.g., to regula-tions and customer requirements). The existing means atVWFS were helpful in this regard, but each organizationalunit derived own measurements according to its needs. So,the existing measurements were sometimes too coarse- ortoo fine-grained for an overarching business perspective,which did limit their usability for making business needstransparent. We aimed to improve this situation by intro-ducing a set of new, unified key performance indicators thatfocus on describing the organizations’ business needs.
C2 Intelligibility. As the key performance indicators shouldsupport data-driven steering, they must be understood by allstakeholders involved in steering activities, such as team ordepartment leads. In particular, all stakeholders must under-stand what a key performance indicator measures, what itspurpose is, how to interpret it, and how to use it during steer-ing. This way, they can derive concrete actions to steer dailybusiness operations and transformations, allowing them toreason on their decisions based on reliable data.
C3 Coverage. To measure quality, it is necessary to cover eachsoftware-development process as a whole. The historicallygrown means of each organizational unit with separatelycollected measurements were not ideal, since their activi-ties are connected and influence each other, independentof organizational structures and boundaries. For instance,insufficient or delayed requirements specifications can influ-ence the development time, the number of defects identifiedduring testing, the time-to-market, and thus the resultingquality. By implementing the same key performance indica-tors among all organizational units, we aimed to cover eachsoftware-development process in its entirety.
C4 Quantification. In order to steer, monitor, and assess theimpact of actions we define, it is essential to select suitablekey performance indicators and to be able to quantify them.A quantification allows to use concrete numbers to evalu-ate an implemented decision, and thus reason whether tokeep or discard it. Quantified numbers are easier to com-pare against each other and support decision making, for
1332
Establishing Key Performance Indicators for Measuring Software-Development ... ESEC/FSE ’20, November 8–13, 2020, Virtual Event, USA
instance, providing empirical data to empower cost estima-tions beyond educated guesses—a regular use case in thesoftware-engineering domain [2, 5, 8, 9].
C5 Comparability. A particular criterion we aimed to improvewas the comparability between releases of our software sys-tems. We found that this is a fundamental requirement atVWFS, as many existing measurements (e.g., the numberof defects or effort spent) were absolute numbers that ham-pered the reasoning about improvements. So, we aimed tointroduce comparable key performance indicators by relat-ing different values to each other, providing a better intuitionabout improvements (e.g., PDpPD relates defects and effort).
C6 Communication. Introducing new key performance indi-cators and fulfilling the previous criteria was intended tofacilitate communication among organizational units. In con-trast to the existing means, a unified set of key performanceindicators that is agreed upon does require less translationand interpretation of reported data. So, improving on thiscriterion helps to reduce the time and effort needed to coor-dinate between organizational units, avoids confusion thatmay occur due to synonymous terms, and establishes a com-mon ground regarding measured data and its interpretation.
These criteria are heavily related, building on each other and thesame key performance indicators to measure them. For instance,improving transparency and intelligibility immediately facilitatescommunication. So, these criteria should not be considered in iso-lation, but tackled together. To this end, we performed an analysisprocess during which we introduced new key performance indica-tors and assessed them with all relevant organizational units.
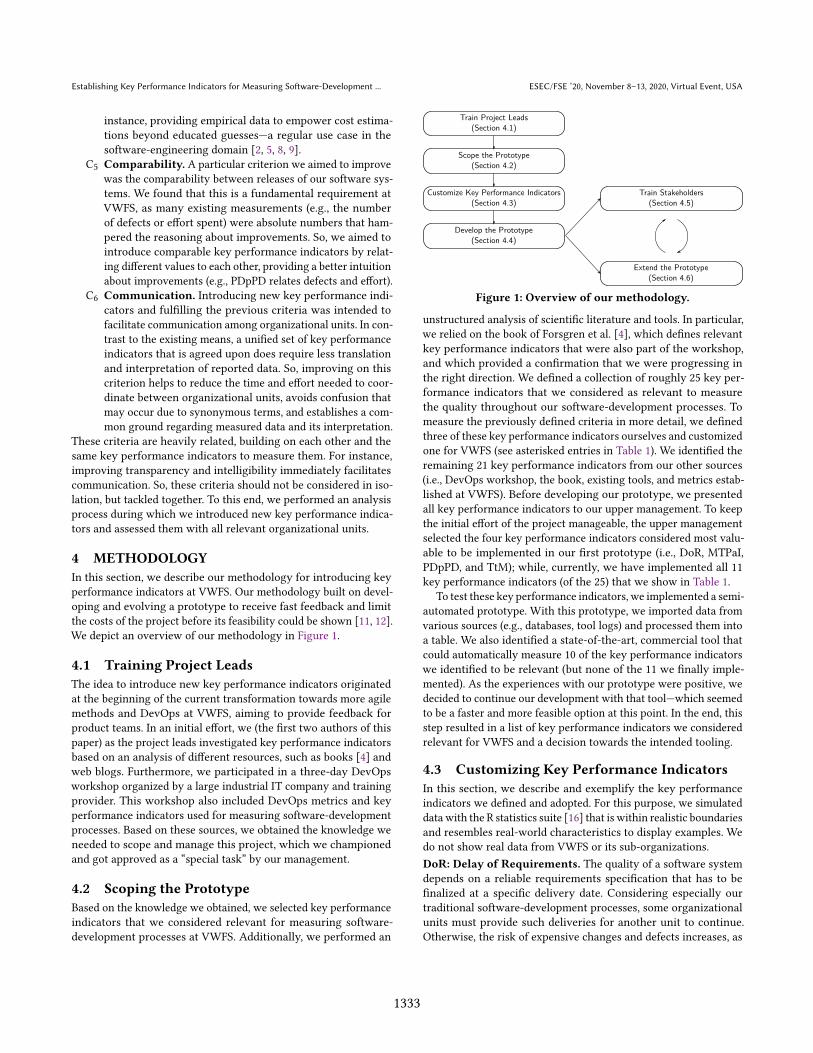
4 METHODOLOGYIn this section, we describe our methodology for introducing keyperformance indicators at VWFS. Our methodology built on devel-oping and evolving a prototype to receive fast feedback and limitthe costs of the project before its feasibility could be shown [11, 12].We depict an overview of our methodology in Figure 1.
4.1 Training Project LeadsThe idea to introduce new key performance indicators originatedat the beginning of the current transformation towards more agilemethods and DevOps at VWFS, aiming to provide feedback forproduct teams. In an initial effort, we (the first two authors of thispaper) as the project leads investigated key performance indicatorsbased on an analysis of different resources, such as books [4] andweb blogs. Furthermore, we participated in a three-day DevOpsworkshop organized by a large industrial IT company and trainingprovider. This workshop also included DevOps metrics and keyperformance indicators used for measuring software-developmentprocesses. Based on these sources, we obtained the knowledge weneeded to scope and manage this project, which we championedand got approved as a “special task” by our management.
4.2 Scoping the PrototypeBased on the knowledge we obtained, we selected key performanceindicators that we considered relevant for measuring software-development processes at VWFS. Additionally, we performed an
Customize Key Performance Indicators(Section 4.3)
Scope the Prototype(Section 4.2)
Train Project Leads(Section 4.1)
Develop the Prototype(Section 4.4)
Train Stakeholders(Section 4.5)
Extend the Prototype(Section 4.6)
Figure 1: Overview of our methodology.
unstructured analysis of scientific literature and tools. In particular,we relied on the book of Forsgren et al. [4], which defines relevantkey performance indicators that were also part of the workshop,and which provided a confirmation that we were progressing inthe right direction. We defined a collection of roughly 25 key per-formance indicators that we considered as relevant to measurethe quality throughout our software-development processes. Tomeasure the previously defined criteria in more detail, we definedthree of these key performance indicators ourselves and customizedone for VWFS (see asterisked entries in Table 1). We identified theremaining 21 key performance indicators from our other sources(i.e., DevOps workshop, the book, existing tools, and metrics estab-lished at VWFS). Before developing our prototype, we presentedall key performance indicators to our upper management. To keepthe initial effort of the project manageable, the upper managementselected the four key performance indicators considered most valu-able to be implemented in our first prototype (i.e., DoR, MTPaI,PDpPD, and TtM); while, currently, we have implemented all 11key performance indicators (of the 25) that we show in Table 1.
To test these key performance indicators, we implemented a semi-automated prototype. With this prototype, we imported data fromvarious sources (e.g., databases, tool logs) and processed them intoa table. We also identified a state-of-the-art, commercial tool thatcould automatically measure 10 of the key performance indicatorswe identified to be relevant (but none of the 11 we finally imple-mented). As the experiences with our prototype were positive, wedecided to continue our development with that tool—which seemedto be a faster and more feasible option at this point. In the end, thisstep resulted in a list of key performance indicators we consideredrelevant for VWFS and a decision towards the intended tooling.
4.3 Customizing Key Performance IndicatorsIn this section, we describe and exemplify the key performanceindicators we defined and adopted. For this purpose, we simulateddata with the R statistics suite [16] that is within realistic boundariesand resembles real-world characteristics to display examples. Wedo not show real data from VWFS or its sub-organizations.DoR: Delay of Requirements. The quality of a software systemdepends on a reliable requirements specification that has to befinalized at a specific delivery date. Considering especially ourtraditional software-development processes, some organizationalunits must provide such deliveries for another unit to continue.Otherwise, the risk of expensive changes and defects increases, as
1333
ESEC/FSE ’20, November 8–13, 2020, Virtual Event, USA Cem Sürücü, Bianying Song, Jacob Krüger, Gunter Saake, and Thomas Leich
Table 1: Overview of implemented key performance indicators (KPIs). Higher priority refers to (very) high severity incidents.
KPI Name Definition (unit in bold) Goal Criteria
K ATP Automated Test Progress Ratio of passed and failed automatedtest cases.
Examine correct functional behavior ofa system.
C1
K CoD Classification of Defects Number of defects classified accord-ing to their root cause, for instance, in-frastructure, application, requirements,or testing.
Increase the transparency of what de-fects still exist in the system and assignthem to the relevant departments.
C1
K CoRRHPI Classification of Release-Related High-Priority Inci-dents
Percentages of classified and release-related higher priority incidents accord-ing to their root causes.
Increase the transparency of what in-cidents have been reported and assignthem to the relevant departments.
C1, C5
* DoR Delay of Requirements Number of days a requirement is be-hind its deadline.
Identify requirement delays to asses therisk of reduced software quality.
C3, C5
(*) MTPaI Manual Test Progress andInterruptions
Ratio of test cases that have beenpassed, out of the number of targettest cases (i.e., excluding not applicableones), displayable as a progress graphwith disruptions and incidents.
Provide an overview of testing progressfor a new system release that allows todepict disruptions.
C1, C2
* NoCRaD Number of Change Re-quests after Deadline
Number of change requests for eachrequirement after the supposed final de-livery of that requirement.
Detect modifications after the intendedfinalization date to identify potentialrisks due to overdue changes.
C1, C3
K NoRRHPI Number of Release-RelatedHigh-Priority Incidents
Number of higher priority inci-dents within the first six weeks afterrelease.
Measure the quality of the delivered sys-tem in terms of user feedback regardinghigher priority incidents.
C3, C5
K NoRRHPAI Number of Release-RelatedHigh-Priority ApplicationIncidents
NoRRHPI caused by the code of a sys-tem.
Track incidents caused by the code of arelease and their solutions.
C1, C5
* PDpPD Priority Defects per PersonDay
Ratio of higher priority defects to thedevelopment effort of a system release.
Compare the quality and costs of dif-ferent releases of a system with eachother.
C2, C5
K TtM Time to Market Time in days from creating user sto-ries to delivering a system.
Identify differences in delivery speed. C3
K VoLD Volume of Living Defects Number of all open defects in a sys-tem distinguished by their priority.
Measure the quality of a system releasein terms of known defects, with higherpriority defects preventing a release.
C1, C5
* designed and (*) customized for VWFS — K: Common key performance indicators
delays or later changes can propagate through the whole software-development process, impacting the quality negatively.
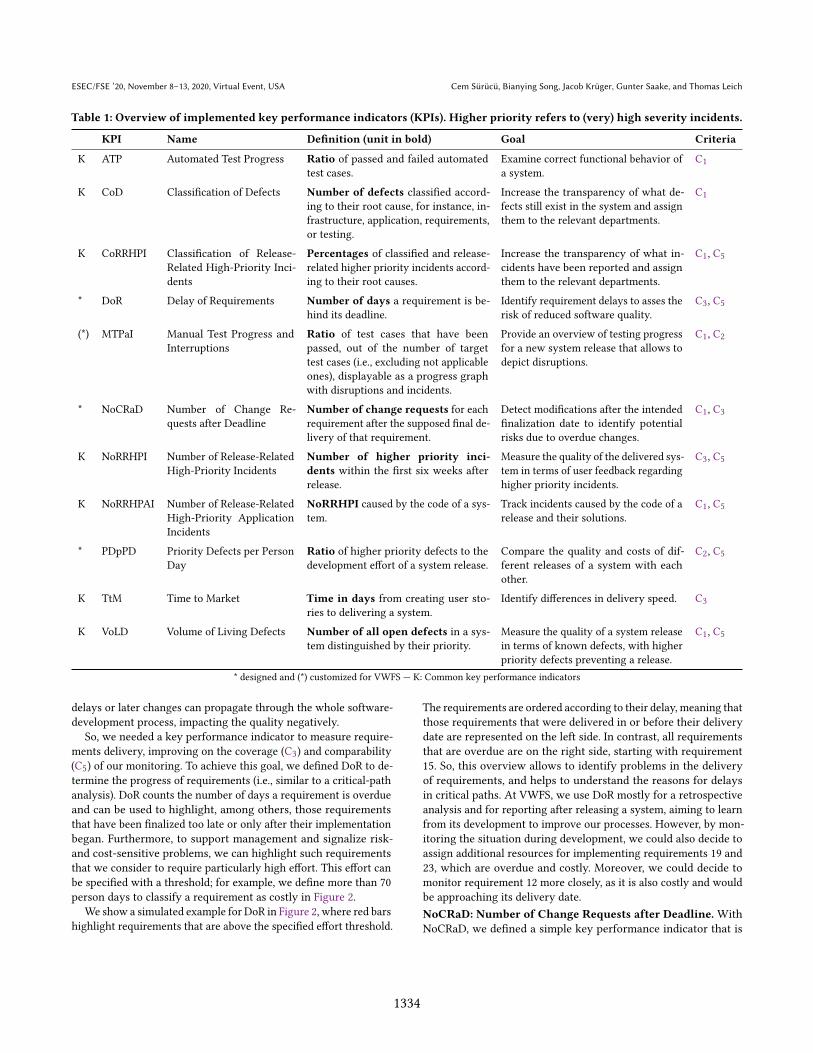
So, we needed a key performance indicator to measure require-ments delivery, improving on the coverage (C3) and comparability(C5) of our monitoring. To achieve this goal, we defined DoR to de-termine the progress of requirements (i.e., similar to a critical-pathanalysis). DoR counts the number of days a requirement is overdueand can be used to highlight, among others, those requirementsthat have been finalized too late or only after their implementationbegan. Furthermore, to support management and signalize risk-and cost-sensitive problems, we can highlight such requirementsthat we consider to require particularly high effort. This effort canbe specified with a threshold; for example, we define more than 70person days to classify a requirement as costly in Figure 2.
We show a simulated example for DoR in Figure 2, where red barshighlight requirements that are above the specified effort threshold.
The requirements are ordered according to their delay, meaning thatthose requirements that were delivered in or before their deliverydate are represented on the left side. In contrast, all requirementsthat are overdue are on the right side, starting with requirement15. So, this overview allows to identify problems in the deliveryof requirements, and helps to understand the reasons for delaysin critical paths. At VWFS, we use DoR mostly for a retrospectiveanalysis and for reporting after releasing a system, aiming to learnfrom its development to improve our processes. However, by mon-itoring the situation during development, we could also decide toassign additional resources for implementing requirements 19 and23, which are overdue and costly. Moreover, we could decide tomonitor requirement 12 more closely, as it is also costly and wouldbe approaching its delivery date.NoCRaD: Number of Change Requests after Deadline. WithNoCRaD, we defined a simple key performance indicator that is
1334
Establishing Key Performance Indicators for Measuring Software-Development ... ESEC/FSE ’20, November 8–13, 2020, Virtual Event, USA
Figure 2: Simplified representation of DoR with simulateddata. Red (darker) bars highlight requirements that are con-sidered particularly costly.
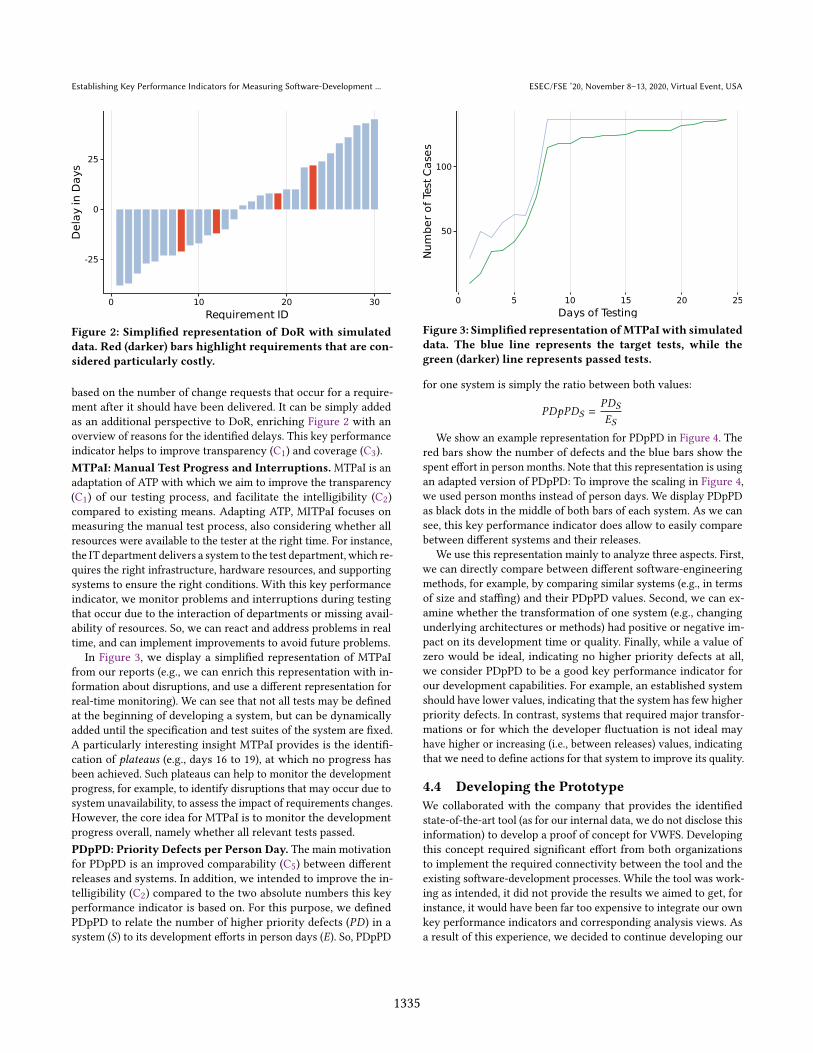
based on the number of change requests that occur for a require-ment after it should have been delivered. It can be simply addedas an additional perspective to DoR, enriching Figure 2 with anoverview of reasons for the identified delays. This key performanceindicator helps to improve transparency (C1) and coverage (C3).MTPaI: Manual Test Progress and Interruptions.MTPaI is anadaptation of ATP with which we aim to improve the transparency(C1) of our testing process, and facilitate the intelligibility (C2)compared to existing means. Adapting ATP, MITPaI focuses onmeasuring the manual test process, also considering whether allresources were available to the tester at the right time. For instance,the IT department delivers a system to the test department, which re-quires the right infrastructure, hardware resources, and supportingsystems to ensure the right conditions. With this key performanceindicator, we monitor problems and interruptions during testingthat occur due to the interaction of departments or missing avail-ability of resources. So, we can react and address problems in realtime, and can implement improvements to avoid future problems.
In Figure 3, we display a simplified representation of MTPaIfrom our reports (e.g., we can enrich this representation with in-formation about disruptions, and use a different representation forreal-time monitoring). We can see that not all tests may be definedat the beginning of developing a system, but can be dynamicallyadded until the specification and test suites of the system are fixed.A particularly interesting insight MTPaI provides is the identifi-cation of plateaus (e.g., days 16 to 19), at which no progress hasbeen achieved. Such plateaus can help to monitor the developmentprogress, for example, to identify disruptions that may occur due tosystem unavailability, to assess the impact of requirements changes.However, the core idea for MTPaI is to monitor the developmentprogress overall, namely whether all relevant tests passed.PDpPD: Priority Defects per Person Day. The main motivationfor PDpPD is an improved comparability (C5) between differentreleases and systems. In addition, we intended to improve the in-telligibility (C2) compared to the two absolute numbers this keyperformance indicator is based on. For this purpose, we definedPDpPD to relate the number of higher priority defects (𝑃𝐷) in asystem (𝑆) to its development efforts in person days (𝐸). So, PDpPD
Figure 3: Simplified representation ofMTPaIwith simulateddata. The blue line represents the target tests, while thegreen (darker) line represents passed tests.
for one system is simply the ratio between both values:
𝑃𝐷𝑝𝑃𝐷𝑆 =𝑃𝐷𝑆
𝐸𝑆
We show an example representation for PDpPD in Figure 4. Thered bars show the number of defects and the blue bars show thespent effort in person months. Note that this representation is usingan adapted version of PDpPD: To improve the scaling in Figure 4,we used person months instead of person days. We display PDpPDas black dots in the middle of both bars of each system. As we cansee, this key performance indicator does allow to easily comparebetween different systems and their releases.
We use this representation mainly to analyze three aspects. First,we can directly compare between different software-engineeringmethods, for example, by comparing similar systems (e.g., in termsof size and staffing) and their PDpPD values. Second, we can ex-amine whether the transformation of one system (e.g., changingunderlying architectures or methods) had positive or negative im-pact on its development time or quality. Finally, while a value ofzero would be ideal, indicating no higher priority defects at all,we consider PDpPD to be a good key performance indicator forour development capabilities. For example, an established systemshould have lower values, indicating that the system has few higherpriority defects. In contrast, systems that required major transfor-mations or for which the developer fluctuation is not ideal mayhave higher or increasing (i.e., between releases) values, indicatingthat we need to define actions for that system to improve its quality.
4.4 Developing the PrototypeWe collaborated with the company that provides the identifiedstate-of-the-art tool (as for our internal data, we do not disclose thisinformation) to develop a proof of concept for VWFS. Developingthis concept required significant effort from both organizationsto implement the required connectivity between the tool and theexisting software-development processes. While the tool was work-ing as intended, it did not provide the results we aimed to get, forinstance, it would have been far too expensive to integrate our ownkey performance indicators and corresponding analysis views. Asa result of this experience, we decided to continue developing our
1335

ESEC/FSE ’20, November 8–13, 2020, Virtual Event, USA Cem Sürücü, Bianying Song, Jacob Krüger, Gunter Saake, and Thomas Leich
Figure 4: Simplified representation of PDpPD with simu-lated data, adopted to person-months for improved scaling.Blue bars represent the effort in personmonths for a system,while the red (darker) bars represent the number of reporteddefects. The PDpPD values are the black dots, representingthe ratio between both values.
own prototype. For this purpose, we implemented a feature thatallowed us to semi-automatically derive quarterly reports that wereshared among relevant organizational units. Initially, we reportedthe four key performance indicators we defined during scopingonly for our department, while PDpPD was the only mandatorypart of reports for other organizational units.
4.5 Training StakeholdersIn parallel to extending our prototype, we intensified the trainingof relevant stakeholders. For this purpose, we performed roughlythree workshops with specialists (e.g., those reporting to the man-agement) and the management of the relevant organizational units.During these workshops, all participants used the key performanceindicators measured by the most recent prototype to identify ac-tions for improving the quality of existing software-developmentprocesses. Later, we conducted weekly meetings in workshop-likesettings, during which all participants derived actions from our re-ports. So, all relevant stakeholders were introduced to the existingprototype, trained on using the defined key performance indicators,and could provide feedback. By now, we use the quarterly reportsto discuss the key performance indicators and receive feedback.
4.6 Extending the PrototypeWe received positive feedback on our initial prototype, but all or-ganizational units agreed that it required extensions. To this end,we coordinated with our management and specialists form suchunits to select additional key performance indicators form our ini-tial ones. In Table 1, we provide a complete overview of all 11 keyperformance indicators we introduced, and the most importantcriteria they shall fulfill (cf. Section 3). However, we remark thatall key performance indicators contribute to each criterion we de-fined, and particular quantification (C4) and communication (C6)are improved by all of them, based in their agreed upon definitionsand acceptance by all organizational units. For over six months, we
are reporting this list of key performance indicators in our quar-terly reports and extending our prototype based on user feedback.So, we continuously extend the prototype based on the needs ofspecialists at VWFS. This resulted in several changes and additionsnot only to the prototype, but also to our software-developmentprocesses. For instance, our management derived a new checklistwith specific thresholds for each key performance indicator thatnew development projects have to fulfill.
5 RESULTSIn this section, we reflect on the results of introducing key per-formance indicators at VWFS. To this end, we first discuss ourachievements with particular focus on the criteria we defined inSection 3 to show the value of key performance indicators. Then,we exemplify five use cases and outcomes that are based on the keyperformance indicators. Finally, we describe the lessons we learned,aiming to provide guidance for other organizations.
5.1 AchievementsBy now, we have elicited our key performance indicators for overtwo years, and for six months we collect all of these we show in Ta-ble 1. As more and more organizational units saw the benefits of ourquarterly reports and the comprised key performance indicators,their acceptance increased—particularly because we used feedbackof specialists to further improve our reporting. Now, measuring keyperformance indicators is implemented, understood, and acceptedacross all relevant organizational units. The management uses thekey performance indicators to measure releases and systems, to an-alyze business operations, and to steer transformations of processes,technologies, as well as methods.
We received positive feedback from our management and special-ists of involved organizational units (e.g., through workshops, per-sonal discussions), allowing us to continue the project and achievenoticeable benefits for VWFS—consideirng the feedback and mea-sured key performance indicators. For the initially stated criteria,we can summarize the following achievements, building on ourown experiences, responses from specialists and management, aswell as constant re-evaluations during the quarterly reports:
C1 Transparency. We limited the complexity and number ofkey performance indicators we report to organizational unitsand to the management (due to their valuable insights for dif-ferent stakeholders, the historically grown means are still inplace). Based on this, our quarterly reports focus on summa-rizing the complexity of release occurrences as clear depic-tions of the development progress of a system, and other in-formation that the relevant stakeholders consider importantfor steering. For instance, DoR and NoCRaD show whetherrequirements are delivered in time or are delayed, and whichchanges cause these delays.
C2 Intelligibility. We achieved a common understanding ofour key performance indicators and how to derive actionableitems from them, at least for specialists of the relevant orga-nizational units and the management. So, we have improvedour ability to monitor and steer our software-developmentprocesses together with all relevant stakeholders. Nonethe-less, interpreting what actions are needed, or providing a
1336
Establishing Key Performance Indicators for Measuring Software-Development ... ESEC/FSE ’20, November 8–13, 2020, Virtual Event, USA
standardized guide, is far from trivial, if possible at all. Cur-rently, we only provide a means to guide a data-driven moni-toring and support the decision making of the relevant stake-holders and organizational units.
C3 Coverage. Combining DoR, NoCRaD, TtM, PDpPD, andNoRRHPI allows for a coherent analysis across all organiza-tional boundaries to achieve an end-to-end monitoring ofsoftware-development processes in their entirety. This im-proved our capabilities to identify potentials for improvingour process and system quality. In particular, we can under-stand in which phases we face bottlenecks and obstacles thatdecrease the quality, guiding us in defining concrete actionsfor improvements and transformations.
C4 Quantification. Each of the key performance indicators weintroduced is quantified, providing concrete numbers to spec-ify a system’s quality throughout our software-developmentprocesses. Moreover, we measure process as well as systemproperties. So, we extended our reporting capabilities andthe understandably of values as well as actions across allrelevant specialists and the management.
C5 Comparability. Regularly measuring our software-devel-opment processes with the same key performance indicatorsallows us to compare systems, releases, as well as differentsoftware-engineering methods and techniques. We see thisas a major benefit, helping us to assess the impact of trans-formations, and thus steer the organization based on reliabledata. For instance, by considering PDpPD, we can comparereleases and systems even though they have different sizesand can derive insights on their quality.
C6 Communication. As stated in Section 3, we hoped thatintroducing unified and agreed-upon key performance indi-cators would establish a basis for, and thus facilitate, internalcommunication. Considering the regular feedback and dis-cussions, we see that this is clearly the case. We found thatthe unified communication is a major achievement, avoidingconfusions and providing a terminology that is accepted,used, and considered valuable throughout all relevant orga-nizational units.
Overall, we see major achievements regarding each of our definedcriteria, which were only possible due to the support and involve-ment of all relevant organizational units and our management. Weremark that we experienced no major disruptions due to introduc-ing the new key performance indicators, as a separate team collectsand reports these based on independent data analyses.
5.2 Example Use Cases and OutcomesIn the following, we describe five concrete examples of how we useour key performance indicators to define actionable items at VWFS.We can see that these examples are strongly connected, so itemstackling one obstacle also tackle other obstacles. This highlightsthe importance of considering key performance indicators not inisolation, but together to achieve a better overview understandingof software-development processes.Example 1: Improved Release Quality.We established multiplework groups based on analyzing key performance indicators. Asa concrete example, we introduced a work group involving the
first author of this paper as well as specialists and managers ofthe testing, development, and business-related departments withthe goal of increasing the quality of our system releases. In thiswork group, we defined several actionable items and used the keyperformance indicators in a retrospective analysis to monitor theseitems and evaluate their impact. We experienced, and could actuallymeasure, a consistent improvement in the release quality during thelast year. A particular reason for this experience is the facilitatedcommunication between departments that is regularly mentionedas a positive aspect by the involved stakeholders.Example 2: Defined andQuantifiableChecklists.As aforemen-tioned, our management introduced a checklist with requirementsnew development projects within our business area shall fulfill.These requirements are based on our key performance indicators,most of which are listed with a certain threshold that has to befulfilled. Our management derived these thresholds for each keyperformance indicator by considering historical data and measure-ments of systems over multiple releases. So, we can define require-ments for a system and measure them in more detail comparedto before. As we experienced this as a major benefit to ensureand improve system quality, this checklist was further extendedinto a guideline for software-development projects in our businessarea—with increasing interest from other organizational units.Example 3: Reduced Delay of Requirements. We experiencedthat particularly delays in delivering requirements specificationscould increase costs, wherefore we introduced DoR and NoCRaD.This helped us to define two actionable items for reducing delays,as we could now easier convince relevant stakeholder of the ob-stacles and could reason how these items would help. First, it isnow easier to identify and quantify delays as well as their impacton our software-development processes. To improve, we raised allrelevant stakeholders’ awareness of delays and their causes, andintroduced new methods to facilitate the planning and steering ofreleases. For instance, our quarterly reports and the correspondingmeetings served both purposes, allowing us to talk to the relevantstakeholders and come to mutual agreements on how to improve.
Second, we intend to analyze the key performance indicators (e.g.,Figure 2) to evaluate the impact of transformations we employed.As a particular example, specialists in relevant organizational unitssuggest that the newly introduced cross-functional teams com-posed of experts of the business, IT, and testing departments hadless delays during requirements specification. It seems that suchteams collaborate more closely, earlier, and with less coordinationdelays than was the case in our traditional software-developmentprocesses (i.e., the ideas of introducing agile methods in our case).Moreover, they seem to change requirements less often after thedelivery, to provide complete specifications earlier, and to designsystems as well as test cases that are better aligned with the require-ments from the start. For future releases, we aim to analyze whetheradditional key performance indicators reflect these assumptions.Still, while such quantifiable measurements would be even moreconvincing, the general impression of our specialists increases ourconfidence that our agile transformation is beneficial for VWFS.Example 4: Improved Testing Process. By using ATP, CoD, andMTPaI, we increased our understanding and the transparency ofdefect causes. Based on the results, we implemented an additional
1337
ESEC/FSE ’20, November 8–13, 2020, Virtual Event, USA Cem Sürücü, Bianying Song, Jacob Krüger, Gunter Saake, and Thomas Leich
monitoring view for our testing processes. So, all relevant stake-holders can now immediately recognize delays in the daily testingroutines (e.g., obstacles in the infrastructure during testing), whichresulted in the following improvements:
• We found that some tests were not ready when testing of-ficially began. Usually, this problem was caused by eitherdelayed technological deliveries (e.g., software or systemavailability), which we resolved by defining a buffer that trig-gers the delivery at an earlier point in time than before; orbecause some test cases were not finalized. We hypothesizedthat this was caused by late changes or late submissionsof important requirements that were important to imple-ment. By analyzing DoR, we could confirm this hypothesiswith reliable data, monitoring not a single requirement, butproviding a holistic overview of delayed and punctual re-quirements (we used the actions in Example 3 to tackle thisissue, too). As this example shows, combining different keyperformance indicators is highly valuable.
• We identified that some tests could not be finished in thedefined period, which we solved by planning our testing pro-cesses differently. Now, we have regular (daily or multipletimes a week) agreements between development, incidentmanagement, testing, and business-related departments re-garding the reasons for interruptions and sustainable solu-tions to address these. The agreements are helpful, as, forexample, it is a huge difference in terms of a solution whethertesting was actually in time, but an incident in the infrastruc-ture disrupted the processes, or avoidable testing plateausoccurred (cf. Section 4.3). While we could also identify andsolve this obstacle without our key performance indicators,they made the reasons for delays more transparent.
• Finally, we decided to invest more into automated regressiontesting for systems for which we expected (and historicallymeasured) many changes. This allowed us to accelerate ourquality assurance, freeing resources for other activities inour software-development processes.
Our positive experiences regarding these actions strengthened ouropinion that agile teams, DevOps, and further automation are highlyvaluable to facilitate our testing. Moreover, these experiences andmeasurements support the reasoning for our current agile transfor-mation towards these practices.Example 5: Facilitated Comparison of Releases. IntroducingPDpPD was highly beneficial in our experience, allowing us tocompare and monitor system releases more systematically. Forexample, we investigated what factors impact this key performanceindicator at VWFS, which are, among others:
• New, innovative systems, which are not established yet, usu-ally comprise more defects than those systems that havebeen evolved, maintained, and tested for a long time.
• Large changes of established systems, of components thatare integrated into systems, or of our platforms can causeshort-term increases in PDpPD.
• Similarly, large-scale development projects and transforma-tions can affect the PDpPD of the involved systems, whichour specialists attributed particularly to delays in the require-ments specification (cf.Example 3).
All of these factors can be expected to result in more defects in newreleases. However, being able to quantify these factors and relatethem to other properties (e.g., effort) facilitated this analysis andallowed us to derive solutions more easily and convincingly.
If we find that one of our systems comprises more defects thanour defined threshold allows (cf. Example 2), the management andspecialists of the relevant organizational units initiate actions toagain fulfill the threshold. These actions include allocating addi-tional resources to a system, increasing test automation (e.g., Unittests), using more integration tests, and adjusting our software-development processes. For instance, we extended our defect man-agement to improve its efficiency by integrating the defect managerinto the development team—again employing agile ideas, and thusreducing idle times. Afterwards, we measure PDpPD for new re-leases and compare the new measurements against the previousonce to evaluate the effectiveness of such means.
One interesting insight we gained is that some reported defectswere in fact not defects of our systems. The problem was that thedata quality was not optimal at the beginning of this project. Weconducted data cleansing and reviews with specialists, establish-ing the actionable item to continuously monitor and improve dataquality. Similar to the general system requirements (cf. Example2), we derived a checklist for our defect management and its co-ordination between development and testing departments. Thischecklist was distributed among, evaluated with, and accepted byall relevant organizational units, describing the important activitiesto improve the identification of defects, their documentation, andthe maintenance of the corresponding data.
5.3 Lessons LearnedWhile introducing the key performance indicators, we found thatsome steps worked well, while others did not yield the expected re-sults. In the following, we share our experiences, aiming to supportother organizations and indicate opportunities for future research.Using an off-the-shelf solution has limitations. As we men-tioned, we initially opted to use a fully automated, state-of-the-arttool to measure key performance indicators. While this toolingallowed us to easily collect numerous DevOps key performance in-dicators, we experienced some limitations regarding our situation:
• The predefined “standard” DevOps key performance indica-tors gave a good impression and vague tendencies of whatwas happening in our business, but they were not preciseenough to detect concrete obstacles and to derive actions forimproving the situation. To increase the value of introducingkey performance indicators, we developed some ourselves.So, we could align the key performance indicators to ourneeds and measure what was most interesting to us.
• The effort required to customize and implement key perfor-mance indicators in a large organization that uses varioustools and software-development processes is very costly.Obviously, these costs are higher in a large organizationcompared to start-ups, where many established key perfor-mance indicators originated from. As a result, off-the-shelfsolutions may currently not be ideal for large organizations.
• The data quality at VWFS was not ideal at the beginning ofthis project, limiting the usability of automated, real-time
1338
Establishing Key Performance Indicators for Measuring Software-Development ... ESEC/FSE ’20, November 8–13, 2020, Virtual Event, USA
measuring and reporting, which is also the reason our proto-type is not fully automated. We cleansed our data and con-ducted expert reviews to improve this situation. However,using an off-the-shelf solution means that we could not getimmediate feedback or use the measured key performanceindicators reliably, we first would have needed to optimize allof our data. So, developing our own prototype provided thebenefits that we focused on the most important key perfor-mance indicators and could see improvements immediately,which enabled a faster introduction in our opinion.
For these reasons, we decided to continue developing our own,semi-automated prototype. Considering our current experiences,we argue that this was the right decision.
Large organizations must carefully evaluate to what extent off-the-shelf solutions for key-performance indicators suit their demandsand can be integrated into their existing infrastructure.
Lesson 1
Customizing key performance indicators. In retrospective, theroughly 25 key performance indicators we identified and specifiedin the beginning of this project were too many. We experiencedthat it is neither productive nor efficient to measure many keyperformance indicators simply because they are recommendedor readily available. Instead, we highly recommend to perform adetailed domain analysis, discuss with relevant stakeholders, anddefine precise goals in order to select the key performance indicatorsthat are actually relevant for an organization. This is a major issue,as too many irrelevant key performance indicators can bias notonly the results, but may also decrease their overall acceptance.So, we cannot stress enough the importance of regularly involvingmanagement and specialists to scope key performance indicatorsand tooling to their needs.
Focus on a small, domain-dependent set of important and agreed-upon key performance indicators to establish and evaluate theirusage in an organization.
Lesson 2
Achieving acceptance. Simply introducing key performance in-dicators is not useful, they must also be accepted, measured, andunderstood by all relevant stakeholders. For this purpose, we expe-rienced that the following means were important:
• To develop and introduce key performance indicators withina new project requires the commitment, support, and involve-ment of the organization’s management. This commitmentis essential to motivate other stakeholders in the beginningand to scope the whole project.
• It is necessary to repeatedly communicate key performanceindicators, their meanings, and their interpretations. By con-stantly talking to relevant organizational units and our man-agement, we improved their acceptance significantly, butthis still required time.
• We recommend to constantly ask for feedback of the manage-ment and specialists, and incorporate it into the tooling. First,feedback helps to customize and improve key performanceindicators and the tooling towards the organization’s busi-ness needs and domain. Second, seeing that their feedback istaken seriously, improves the acceptance of the stakeholders.
• In our case, workshops were particularly helpful to com-municate key performance indicators and improve the com-prehension of relevant stakeholders. Especially, involvingskeptical stakeholders is important to receive their feedback.These workshops greatly helped us to introduce and improveour prototype, and steadily increased the acceptance amongall stakeholders.
• Regular reports that provide an overview of all key perfor-mance indicators were helpful to increase acceptance. Thesereports served as foundation for discussions and documentedour progress and improvements, which we experienced tobe highly valuable for acceptance.
• We found that it is important to establish key performance in-dicators early on as an additional means to monitor and steersoftware-development processes. For this purpose, we usedour quarterly reports and the corresponding meetings todefine new actionable items and evaluate how these workedout. This greatly contributed to the acceptance of the keyperformance indicators.
Overall, the relevant organizational units and our management atVWFS agreed that key performance indicators are a helpful meansand greatly support the monitoring of software-development pro-cesses.We account this success especially to our close collaborationswith these stakeholders, which resulted in a fast acceptance.
Constantly involve relevant stakeholders in the design and use ofkey performance indicators, ideally during interactive sessions tocommunicate benefits, increase acceptance, and improve tooling.
Lesson 3
Considering different target groups for reporting. A particu-lar challenge while defining and reporting key performance indica-tors was that we had to address various target groups. For example,in the software-development processes at VWFS, specialists withsoftware development but also non software-development back-ground are involved. Moreover, the organizational structure withvarious units and hierarchies means that we prepare reports fordevelopers and managers alike. To address these different scopesof expertise and working areas, we selected management-oriented,but also typical development key performance indicators. In partic-ular, we considered the previously existing means for measuringin the organizational units to support their information needs. Wefound that it is important, but also essential, to report the keyperformance indicators and their meaning in an appropriate levelof detail, depending on the relevant stakeholders and their needs.For this reason, we selected key performance indicators based ontheir usability for steering software-development processes and forexplaining the corresponding decisions to other stakeholders.
Consider key performance indicators that are important to thedifferent stakeholders involved to achieve benefits for all organi-zational units that have to measure and use them.
Lesson 4
Managing the project. This project was not performed as a VWFSdevelopment project, but as a “special task” that we initiated bychampioning key performance indicators and convincing our uppermanagement to approve the project. As a consequence, we had tocarefully manage and limit the costs of the project, as success was
1339

ESEC/FSE ’20, November 8–13, 2020, Virtual Event, USA Cem Sürücü, Bianying Song, Jacob Krüger, Gunter Saake, and Thomas Leich
uncertain. So, we performed the light-weight, iterative methodol-ogy based on prototyping to receive fast feedback and evaluateintermediate outcomes. In particular, we started with the four mostpromising key performance indicators before extending our toolto involve additional ones. We heavily involved and coordinatedwith specialists and our management to optimize and adjust theprototype to their needs. In our experience, this iterative, step-wiseevolution of our prototype was efficient, constructive, and limitedthe costs as well as risks of our project.
Create light-weight prototypes to gain fast feedback on the usabil-ity of key performance indicators and to evaluate their value forthe organization’s businesses.
Lesson 5
Assessing the trade-off between costs and benefits. A generaldiscussion we faced during this project is the trade-off betweencosts and benefits of using key performance indicators in a largeorganization. We relied on a semi-automated prototype that re-quires considerable manual efforts for each report. In particular,we have to derive the required data, review the data with special-ists, cleanse the data, and prepare its depiction. Ideally, we couldhave a fully automated tool that delivers the right key performanceindicators on dashboards without delay (i.e., achieving completereal-time monitoring). However, for this purpose, we need to haveexcellent data quality and availability for an automated selectionand analysis. Most expensive would be to achieve the required dataquality, which requires process adjustments, quality gates across allrelevant organizational units, additional personal, and cooperatingexternal organizations to contribute to our internal analysis. In or-der to balance costs and benefits, we decided to tackle these issueson a long-term basis. Currently, they are not a viable option, butwe aim to constantly introduce corresponding changes to automateour prototype further during future transformations.
Define and maintain a business case comparing the costs andbenefits of the established key performance indicators to providereliable evaluations and not only educated guesses on their value.
Lesson 6
6 RELATEDWORKIn this section, we exemplify related studies of using key perfor-mance indicators to measure and steer software-development pro-cesses. For instance, Kilpi [7] describes how Nokia established ametrics-based monitoring program. To this end, Nokia introducedan own method called Nokiaway, which is explained in this paper.We report a similar, yet different methodology in more detail andprovide concrete experiences as well as lessons learned.
Cheng et al. [3] report a case study with three smaller Dutchorganizations who used key performance indicators in the contextof agile software engineering. The authors report the key perfor-mance indicators used and what actions were derived to improvesoftware-development processes. In contrast to this work, we re-port a methodology for introducing key performance indicatorsand experiences from a large organization.
Lawler and Kitchenham [10] describe the measurement model-ing technology, implemented in a tool to automatically measuresoftware-development processes. Also, they report experiences of
introducing and using this technology in a Fortune 500 company.Still, these insights are rather coarse and we report more detailedexperiences, and used a technology-independent methodology.
Staron et al. [20] introduced and evaluated a quality model tospecify “good” key performance indicators. So, this work is relatedto our customization phase, but it does not report how to introducekey performance indicators in an organization. Further, Staron et al.[21] report a framework for introducing key performance indica-tors at another large organization, namely Ericsson. As the authorsreport a framework, its usage, and experiences, this work is closelyrelated to ours. We complement this study with new insights andexperiences, obtained at another organization in a different domain.Moreover, we again used another methodology that is helpful to as-sess the usability of key performance indicators before introducinga full-fledged framework.
7 CONCLUSIONIn this paper, we described how we introduced and use key perfor-mance indicators at a large organization in the financial sector. Ourexperiences show the value of key performance indicators, but wealso highlight potential problems and report recommendations forother organizations. More precisely, we described:
• A light-weight methodology to introduce key performanceindicators, allowing for fast feedback.
• A set of four key performance indicators customized to ourneeds that may be relevant for other organizations, too.
• An overview of the criteria we aimed to improve and theimpact our key performance indicators have had on these,as well as five concrete examples.
• A set of six lessons learned, which can help other organiza-tions to introduce key performance indicators, related to (1)selecting the required tooling, (2) customizing key perfor-mance indicators, (3) increasing acceptance and usability, (4)involving different stakeholders, (5) evaluating constantly,and (6) providing a business case.
We hope that these contributions help practitioners in their endeav-ors and guide researchers to investigate new research directions. AtVWFS, the project is considered a success: We enhanced the compa-rability of releases and processes as well as the comprehensibilityand acceptance of our monitoring, which facilitated the steeringof actions for improving software quality—which is visible in theimproved user feedback.
In future work, we plan to automate and extend our prototype, aswell as to conduct an empirical evaluation. Moreover, we plan to addnew and refine the existing key performance indicators. For exam-ple, we can enrich DoR with the costs of requirements, but not theirvalue for a system—which is an equally important information. Todecide on such changes, we intend to understand the costs and sav-ings of key performance indicators in more detail. Finally, we aimto define recommendations on actionable items and their impact.
ACKNOWLEDGMENTSSupported by the German Research Foundation (LE 3382/2-3, SA465/49-3) and VWFS. We would like to thank all our colleagues atVWFS who supported the development and introduction of our keyperformance indicators and prototype by providing highly valuablefeedback and suggestions for improvement.
1340

Establishing Key Performance Indicators for Measuring Software-Development ... ESEC/FSE ’20, November 8–13, 2020, Virtual Event, USA
REFERENCES[1] Daniele Barone, Lei Jiang, Daniel Amyot, and John Mylopoulos. 2011. Reasoning
with Key Performance Indicators. InWorking Conference on The Practice of Enter-prise Modeling (PoEM). Springer. https://doi.org/10.1007/978-3-642-24849-8_7
[2] BarryW. Boehm. 1984. Software Engineering Economics. Transactions on SoftwareEngineering SE-10, 1 (1984). https://doi.org/10.1109/TSE.1984.5010193
[3] Tjan-Hien Cheng, Slinger Jansen, and Marc Remmers. 2009. Controlling andMonitoring Agile Software Development in Three Dutch Product SoftwareCompanies. In Workshop on Software Development Governance (SDG). IEEE.https://doi.org/10.1109/SDG.2009.5071334
[4] Nicole Forsgren, Jez Humble, and Gene Kim. 2018. Accelerate: The Science ofLean Software and DevOps Building and Scaling High Performing TechnologyOrganizations. IT Revolution.
[5] Magne Jørgensen and Barry W. Boehm. 2009. Software Development EffortEstimation: Formal Models or Expert Judgment? IEEE Software 26, 2 (2009).https://doi.org/10.1109/MS.2009.47
[6] Lj Kazi, Biljana Radulovic, and Zoltan Kazi. 2012. Performance Indicators inSoftware Project Monitoring: Balanced Scorecard Approach. In InternationalSymposium on Intelligent Systems and Informatics (SISY). IEEE. https://doi.org/10.1109/SISY.2012.6339539
[7] Tapani Kilpi. 2001. Implementing a Software Metrics Program at Nokia. IEEESoftware 18, 6 (2001). https://doi.org/10.1109/52.965808
[8] Jacob Krüger and Thorsten Berger. 2020. Activities and Costs of Re-EngineeringCloned Variants into an Integrated Platform. In International Working Conferenceon Variability Modelling of Software-Intensive Systems (VaMoS). ACM. https://doi.org/10.1145/3377024.3377044
[9] Jacob Krüger and Thorsten Berger. 2020. An Empirical Analysis of the Costsof Clone- and Platform-Oriented Software Reuse. In Joint Meeting of the Euro-pean Software Engineering Conference and the ACM SIGSOFT Symposium on theFoundations of Software Engineering (ESEC/FSE). ACM. https://doi.org/10.1145/3368089.3409684
[10] Jim Lawler and Barbara A. Kitchenham. 2003. MeasurementModeling Technology.IEEE Software 20, 3 (2003). https://doi.org/10.1109/MS.2003.1196324
[11] Horst Lichter, Matthias Schneider-Hufschmidt, and Heinz Zullighoven. 1994.Prototyping in Industrial Software Projects - Bridging the Gap Between Theory
and Pactice. IEEE Transactions on Software Engineering 20, 11 (1994). https://doi.org/10.1109/32.368126
[12] Pam Mayhew and P. Dearnley. 1987. An Alternative Prototyping Classification.The Computer Journal 30, 6 (1987). https://doi.org/10.1093/comjnl/30.6.481
[13] Wilhelm Meding. 2017. Sustainable Measurement Programs for Software De-velopment Companies: What to Measure. In International Workshop on SoftwareMeasurement and International Conference on Software Process and Product Mea-surement (IWSM/Mensura). ACM. https://doi.org/10.1145/3143434.3143438
[14] Alan Moran. 2015. Managing Agile. Springer. https://doi.org/10.1007/978-3-319-16262-1
[15] David Parmenter. 2015. Key Performance Indicators: Developing, Implementing,and Using Winning KPIs. Wiley.
[16] R Core Team. 2020. R: A Language and Environment for Statistical Computing. RFoundation for Statistical Computing. https://www.R-project.org
[17] Ita Richardson and Christiane G. vonWangenheim. 2007. Why are Small SoftwareOrganizations Different? IEEE Software 24, 1 (2007). https://doi.org/10.1109/MS.2007.12
[18] Andreas Riege. 2005. Three-Dozen Knowledge-Sharing Barriers Managers MustConsider. Journal of Knowledge Management 9, 3 (2005). https://doi.org/10.1108/13673270510602746
[19] Miroslaw Staron and Wilhelm Meding. 2018. Software Development MeasurementPrograms. Springer. https://doi.org/10.1007/978-3-319-91836-5
[20] Miroslaw Staron, Wilhelm Meding, Kent Niesel, and Alain Abran. 2016. AKey Performance Indicator Quality Model and its Industrial Evaluation. In In-ternational Workshop on Software Measurement and International Conferenceon Software Process and Product Measurement (IWSM/Mensura). IEEE. https://doi.org/10.1109/IWSM-Mensura.2016.033
[21] Miroslaw Staron, Wilhelm Meding, and Christer Nilsson. 2009. A Framework forDeveloping Measurement Systems and its Industrial Evaluation. Information andSoftware Technology 51, 4 (2009). https://doi.org/10.1016/j.infsof.2008.10.001
[22] Thomas Stober and Uwe Hansmann. 2010. Agile Software Development. Springer.https://doi.org/10.1007/978-3-540-70832-2
[23] Frank van der Linden, Klaus Schmid, and Eelco Rommes. 2007. Software ProductLines in Action. Springer.
1341