
Measuring pregnancy planning
44
Demographic Research a free, expedited, online journal of peer-reviewed research and commentary in the population sciences published by the Max Planck Institute for Demographic Research Konrad-Zuse Str. 1, D-18057 Rostock · GERMANY www.demographic-research.org DEMOGRAPHIC RESEARCH VOLUME 23, ARTICLE 11, PAGES 293-334 PUBLISHED 06 AUGUST 2010 http://www.demographic-research.org/Volumes/Vol23/11/ DOI: 10.4054/DemRes.2010.23.11 Research Article Measuring pregnancy planning: An assessment of the London Measure of Unplanned Pregnancy among urban, south Indian women Corinne H. Rocca Suneeta Krishnan Geraldine Barrett Mark Wilson © 2010 Corinne H. Rocca et al. This open-access work is published under the terms of the Creative Commons Attribution NonCommercial License 2.0 Germany, which permits use, reproduction & distribution in any medium for non-commercial purposes, provided the original author(s) and source are given credit. See http:// creativecommons.org/licenses/by-nc/2.0/de/
Transcript of Measuring pregnancy planning

Demographic Research a free, expedited, online journal
of peer-reviewed research and commentary in the population sciences published by the Max Planck Institute for Demographic Research Konrad-Zuse Str. 1, D-18057 Rostock · GERMANY www.demographic-research.orgDEMOGRAPHIC RESEARCH VOLUME 23, ARTICLE 11, PAGES 293-334 PUBLISHED 06 AUGUST 2010 http://www.demographic-research.org/Volumes/Vol23/11/ DOI: 10.4054/DemRes.2010.23.11 Research Article
Measuring pregnancy planning: An assessment of the London Measure of Unplanned Pregnancy among urban, south Indian women
Corinne H. Rocca
Suneeta Krishnan
Geraldine Barrett
Mark Wilson © 2010 Corinne H. Rocca et al. This open-access work is published under the terms of the Creative Commons Attribution NonCommercial License 2.0 Germany, which permits use, reproduction & distribution in any medium for non-commercial purposes, provided the original author(s) and source are given credit. See http:// creativecommons.org/licenses/by-nc/2.0/de/

Table of Contents
1 Introduction 294 2 Methods 298 2.1 Study setting 298 2.2 The Samata Health Study 298 2.3 Pilot and instrument modification 299 2.4 Analyses 300 2.4.1 Item analysis and missingness 300 2.4.2 Classical Test Theory analyses 301 2.4.3 Item Response Modeling analyses 302 3 Results 304 3.1 Item analysis and missingness (see 2.4.1) 306 3.2 Classical Test Theory results (see 2.4.2) 309 3.2.1 Reliability (see 2.4.2.1) 309 3.2.2 Validity (see 2.4.2.2) 312 3.3 Item response modeling results (see 2.4.3) 312 3.3.1 Item fit (see 2.4.3.2) 312 3.3.2 Reliability (see 2.4.3.3) 315 3.3.3 Validity (see 2.4.3.4) 315 4 Discussion 317 4.1 Conclusion and future directions 320 5 Acknowledgements 321 References 322 Appendix 1 329 Appendix 2 331 Appendix 3 333
Demographic Research: Volume 23, Article 11 Research Article
http://www.demographic-research.org 293
Measuring pregnancy planning: An assessment of the London Measure of Unplanned Pregnancy
among urban, south Indian women
Corinne H. Rocca1
Suneeta Krishnan2
Geraldine Barrett3
Mark Wilson4
Abstract
We evaluated the psychometric properties of the London Measure of Unplanned Pregnancy among Indian women using classical methods and Item Response Modeling. The scale exhibited good internal consistency and internal structure, with overall scores correlating well with each item’s response categories. Items performed similarly for pregnant and non-pregnant women, and scores decreased with increasing parity, providing evidence for validity. Analyses also detected limitations, including infrequent selection of middle response categories and some evidence of differential item functioning by parity. We conclude that the LMUP represents an improvement over existing measures but recommend steps for enhancing scale performance for this cultural context.
1 Corresponding author: University of California, San Francisco, School of Medicine, Bixby Center for Global Reproductive Health, Department of Obstetrics, Gynecology and Reproductive Sciences, 3333 California Street, Suite 335, UCSF Box 0744, San Francisco, CA 94143-0744 (for courier services use 94118). Tel: 1-415-476-6973. Fax: 1-415-502-8479. E-mail: [email protected]. Department of Epidemiology, University of California, Berkeley, School of Public Health, 101 Haviland Hall, Berkeley, CA 94720-7358, USA. Women’s Global Health Imperative (WGHI), RTI International, 114 Sansome Street, Suite 500, San Francisco, CA 94104, USA. 2 Department of Epidemiology, University of California, Berkeley, School of Public Health, 101 Haviland Hall, Berkeley, CA 94720-7358, USA. Women’s Global Health Imperative (WGHI), RTI International, 114 Sansome Street, Suite 500, San Francisco, CA 94104, USA. Epidemiology and Statistics Unit, St. John’s Research Institute, Koramangala, Bangalore 560034, India. 3 School of Health Sciences and Social Care, Brunel University, Uxbridge, Middlesex UB8 3PH, UK. 4 Graduate School of Education, University of California, Berkeley, 4415 Tolman Hall, Berkeley, CA 94720, USA.

Rocca et al.: Measuring pregnancy planning
294 http://www.demographic-research.org
1. Introduction
Although essential to demographic research, accurate measurement of latent variables, including individual characteristics such as acculturation or relationship power, or attitudes such as those towards partnerships and childbearing, receives relatively little attention in the demographic literature (Cleland, Johnson-Acsadi, and Marckwardt 1987). In other fields, such as psychology, quality of life research, and education, the use of valid and reliable instruments is the norm, and methods for conducting psychometric analyses are long-established (Aaronson et al. 2002; American Educational Research Association et al. 1999; Food and Drug Administration 2009). The consequences of poor measurement and misclassification include erroneous findings and conclusions from studies and potentially misguided resultant policies.
A particularly notable and oft-cited example of the absence of attention to accurate and precise measurement in demography is the assessment of pregnancy intentions (Casterline and El-Zeini 2007; Santelli et al. 2003). The measurement of unintended or unplanned pregnancy is essential to understanding fertility patterns, including why fertility differs between populations and how women decide when to have children, and to preventing unwanted childbearing. Proper measurement of pregnancy intentions is also necessary in investigating the possible influences of pregnancy intendedness on health outcomes of a mother and her baby (Gipson, Koenig, and Hindin 2008). Quantifying levels of unintended pregnancy is of particular importance in less developed regions where levels of contraceptive access and use are low and unintended pregnancy rates may be considerable (Casterline and El-Zeini 2007; Koenig et al. 2006).
Although the measurement of pregnancy intentions is critical, approaches have varied widely between studies and surveys, and most have received criticism, with their merits and utility debated and discussed (Bachrach and Newcomer 1999; Bongaarts 1990; Casterline and El-Zeini 2007; Santelli et al. 2003). With several notable exceptions (Koenig et al. 2006; Casterline and El-Zeini 2007; Bongaarts 1990), the majority of the work on improving measurement techniques has focused on the United States; significantly less attention has been devoted to debating conceptual and measurement approaches in low resource settings such as India, which is the focus of this analysis.
Approaches to measurement of pregnancy intentions have been criticized on several fronts. First, many surveys and studies utilize individual questions and/or place individuals into distinct categories of intentions. The largest source of health and pregnancy intentions data internationally, the Demographic and Health Surveys (DHS), categorizes pregnancies as intended, mistimed, or unintended based on the question: At the time you became pregnant, did you want to become pregnant then, did you want to wait until later, or did you not want to have any (more) children at all? (Casterline and El-Zeini 2007; ICF Macro 2008). The DHS also asks women “if you could go back to the

Demographic Research: Volume 23, Article 11
http://www.demographic-research.org 295
time you did not have any children and could choose exactly the number of children to have in your whole life, how many would that be?” This number is compared to the number of living children at the time of conception. A third approach is to ask women prospectively whether they would like to have another child or prefer not to. A large majority of studies in the developing world have utilized DHS data or similar questions.
The categorization of women into a small number of intention groups is now viewed as simplistic. Qualitative research has shown that some women have attitudes and intentions that are ambivalent, contradictory or poorly specified, and that women feel varying degrees of conviction about either trying to become pregnant or avoiding pregnancy (Barrett and Wellings 2002; Kendall et al. 2005; Moos et al. 1997; Gribaldo, Judd, and Kertzer 2009; Fisher 2000). Continuous or multidimensional measures of intentions have been advanced to better capture the range of intentions individuals hold (Bachrach and Newcomer 1999).
Another concern involves the retrospective assessment of intentions, or asking women to recall their intentions after their pregnancy has occurred. This approach has been criticized because a woman’s recollection and perception of a conception may change over the course of a pregnancy and after childbirth (Joyce, Kaestner, and Korenman 2002; Poole et al. 2000; Bankole and Westoff 1998; Koenig et al. 2006). Although prospective measures, which assess intentions prior to pregnancy, are a more valid approach to capturing individual-level intentions, they are not always available, particularly in large-scale surveys that do not follow individual women over time. As such, retrospective measures remain important for establishing population prevalence estimates of unintended pregnancy (Santelli et al. 2009; Casterline and El-Zeini 2007).
A third issue, which receives less attention, regards the approach to conceptualizing intentionality. Ever since Coale proposed that fertility levels would decrease when reproduction entered into “the calculus of conscious choice,” (Coale 1973) the dominant approach to understanding women’s reproductive patterns and measuring pregnancy intentions has been intentionality-based behavioral models, such as the Theory of Reasoned Action (TRA) (Fishbein and Ajzen 1975) and the Theory of Planned Behavior (TPB) (Ajzen 1985). These theories postulate that behaviors are primarily driven by behavioral intentions. Motivations and beliefs, desires, and intentions are each treated as psychologically distinguishable steps along the pathway to behavior (Miller, Severy, and Pasta 2004). Most measures of pregnancy intention, including the widely-used DHS questions, are consistent with such theories and thus focus on assessing pregnancy and fertility wantedness, planning, or intention. These measures assume that women hold desires, intention, or plans regarding fertility and pregnancy that can be articulated and that women act according to those beliefs.
Although the TRA/TPB conceptualizations have contributed greatly to our understanding of human behavior, the social psychology and anthropology literatures

Rocca et al.: Measuring pregnancy planning
296 http://www.demographic-research.org
(Schwarz 2000; Johnson-Hanks 2005; Johnson and Boynton 2009) and published work on fertility behaviors and intentions (Zabin 1999; Luker 1975; Esacove 2008) have called into question the appropriateness of such models, offering alternative theoretical perspectives. Some have argued that the predominant focus on intentional action ignores the fact that much of human action, including reproductive behavior, is determined by culturally-informed habits, customs, or systems of meaning of which individuals may not be explicitly aware (Esacove 2008; Johnson-Hanks 2008; Gribaldo, Judd, and Kertzer 2009; Bledsoe, Banja, and Hill 1998; Fisher 2000). Whether a pregnancy is characterized as intended is deeply embedded in social and cultural characteristics, such as family and gender norms, the degree to which pregnancy is viewed as being within a woman’s conscious control, and the level of economic development of a society (Moos et al. 1997; Johnson-Hanks 2005; Kendall et al. 2005). Studies have now found that couples do not necessarily have explicit plans of action in reference to reproduction; plans may be vague, underspecified, and subconscious (Kendall et al. 2005; Johnson-Hanks 2008; Gribaldo, Judd, and Kertzer 2009; Fisher 2000; Barrett and Wellings 2002; Moos et al. 1997). For instance, contraceptive behavior frequently does not correspond to stated intentions (Trussell, Vaughan, and Stanford 1999; Rocca et al. 2010; Crissey 2005). While this could be attributed to barriers women face in carrying out their reproductive intentions, such as lack of perceived behavioral control (Ajzen 1985), research suggests that behaviors themselves may be habitual or reflections of underlying intentions (Luker 1975; Sable 1999; Schwarz 2000; Johnson and Boynton 2009; Ouellette and Wood 1998).
Finally, many measures are utilized without rigorous psychometric evaluation. For data to be optimally meaningful, evidence that an instrument is effectively measuring the construct of interest -- the reliability and validity -- should be garnered (Aaronson et al. 2002; Food and Drug Administration 2009). In light of evidence that women across and within populations have been shown to understand and use the terms “want,” “intend” and “try” in different ways (Barrett and Wellings 2002; Kendall et al. 2005) and that pregnancy intentions encompass complex affective, cultural and contextual factors, pregnancy intention measures must also be psychometrically tested for use across settings (Aaronson et al. 2002; Food and Drug Administration 2009).
A few researchers have developed more sophisticated, multi-item measurement tools that capture a range of behaviors and emotions, placing women on a continuum of intention or planning, and/or establishing psychometric properties (Miller 1995; Morin et al. 2003; Barrett, Smith, and Wellings 2004; Speizer et al. 2004; Santelli et al. 2009). All are focused on developed world populations. One of these scales, the London Measure of Unplanned Pregnancy (LMUP), is a six-question, self-administered measure that retrospectively evaluates the extent to which a woman’s most recent pregnancy was planned or intended (Barrett, Smith, and Wellings 2004). (Because qualitative data

Demographic Research: Volume 23, Article 11
http://www.demographic-research.org 297
suggest that women do not reliably differentiate between the terms “intended” and “planned” when referring to pregnancies, we use the terms interchangeably (Barrett and Wellings 2002; Fischer et al. 1999).) Developed in the United Kingdom (UK), the LMUP uses responses to questions regarding behaviors (contraceptive use, discussion with partner and pre-pregnancy preparatory behavior) and attitudes (timing, intent and wantedness) to place women on a continuous pregnancy planning scale (Barrett 2010). Each item has three response categories (0, 1 and 2) and responses are summed into an intentions score ranging from zero to twelve. Scores can be treated as continuous or divided into a minimum of three categories: 10-12 (planned); 4-9 (ambivalent); and 0-3 (unplanned). The measure was found to be understood by participants, to have excellent reliability (Cronbach’s α=0.92, two-week test-retest reliability of 0.97) and good internal structure according to principal components analysis (Barrett, Smith, and Wellings 2004).
The LMUP has numerous strengths and advantages over other measures. The instrument was designed after extensive qualitative research; was refined in an initial field test; and was re-administered and psychometrically evaluated in its final version using a new study population (Barrett and Wellings 2002; Barrett, Smith, and Wellings 2004). The LMUP does not assume that women have fully formed childbearing plans or clearly defined intentions and allows women to fall along a range of intentions. Moreover, by including both attitudinal and behavioral items and allowing respondents to give conflicting responses to items, the LMUP does not assume that behaviors are consistent with intentions; it acknowledges that behaviors may themselves be indicative of less conscious intentions. The inclusion of behavioral items, including an item regarding contraceptive use, may be particularly helpful for a retrospective measure, to help avoid recall and response biases (Crissey 2005).
Considering the importance of pregnancy intentions in understanding demographic patterns, it is surprising how few studies have assessed the reliability and validity of multi-item, continuous pregnancy intention measures, particularly for use in the developing world. In India, the principal source of pregnancy intention data is the National Family Health Survey (NFHS) (International Institute for Population Sciences and Macro International 2008), which utilizes the DHS measures. Experts on pregnancy intentions in India have noted the inadequacies of the current NFHS measures and have called for the development of better measurement tools for this context (Koenig et al. 2006). A comprehensive measure that could be used in India, which is projected to be the most populous country in the world by 2050 (United Nations Population Fund (UNFPA) 2008), would represent an improvement over the NFHS and could contribute substantially to demographic research in the region. Furthermore, a measure that could be used internationally would yield insights into cultural differences in the conceptualization of intentions.

Rocca et al.: Measuring pregnancy planning
298 http://www.demographic-research.org
The LMUP has been used in several studies in the UK (Lakha and Glasier 2006; Schunmann and Glasier 2006; Cater and Coleman 2006), and studies assessing the measure in other populations are underway (Barrett 2010). Before the LMUP can be used across populations of women, its psychometric properties must be assessed. The primary objective of this analysis was to evaluate the performance and psychometric properties of the LMUP among young married women in urban south India and to assess its suitability for use in an Indian context. Specifically, we aimed to assess the reliability and validity of the LMUP among married Indian women.
2. Methods
2.1 Study setting
This assessment was conducted in Bangalore, the capital of the Karnataka state in south India. As in all of India, motherhood and childbearing play a significant role in shaping women’s self-worth and social identity in south India. The median age of marriage in Karnataka is 18 years (International Institute for Population Sciences and Macro International 2008); many marriages are arranged, and the dowry system prevails (Srinivasan 2005). According to the most recent NFHS (2005-6), the mean ideal number of children among women in urban Karnataka is 2.1, and 89% of women with two children reported wanting no additional children (International Institute for Population Sciences and Macro International 2008), reflecting a strong two-child norm. Although the total fertility rate (TFR) of urban women in Karnataka is below replacement level (TFR=1.9) (International Institute for Population Sciences and Macro International 2008), married women are under strong societal and familial pressure to begin childbearing and prove their fertility early in marriage (Bott et al. 2003; Jejeebhoy 1998). Strong gender-based power differentials are normative, limiting women’s decision-making role in both reproductive and non-reproductive spheres (Buckshee 1997; Bott et al. 2003).
2.2 The Samata Health Study
Data for this psychometric assessment come from the Samata Health Study, a longitudinal study of young married women in Bangalore, India. The overall aims of Samata were to evaluate the relationships between numerous aspects of gender-based power, such as women’s employment and decision-making ability, and reproductive health outcomes, including domestic violence, sexually transmitted infections (STI), and unintended pregnancy.

Demographic Research: Volume 23, Article 11
http://www.demographic-research.org 299
The methods of Samata are detailed elsewhere (Krishnan et al. 2010; Rocca et al. 2009). Briefly, female field staff recruited and enrolled 744 women via community outreach and through government primary health centers in two low-income communities. Women had to be married, between 16 and 25 years old, and fluent in Tamil or Kannada, the local languages, to participate. Interested women completed informed consent processes and participated in face-to-face baseline interviews, conducted in one of two study clinics. In the interviews, women were asked about sociodemographic characteristics; household and relationship characteristics; and health and sexual behaviors. Participants returned for two follow-up interviews, 12 months and 24 months after baseline. Testing for STIs and pregnancy was offered at all visits, and reproductive health care was available to participants throughout the study period. We administered the LMUP to ever-pregnant and currently pregnant women at the 12-month and 24-month visits. The study protocol was approved by the human subjects protection programs at the University of California, San Francisco; the Centre for Public Policy at the Indian Institute of Management, Bangalore; and RTI International.
2.3 Pilot and instrument modification
Prior to administering the LMUP, trained research staff who were fluent in English and the local languages translated the LMUP into Tamil and Kannada. Questions were back-translated to English to ensure proper translation. Six members of the study field team, who had similar socio-demographic characteristics as study participants, completed the LMUP and provided feedback about potential misunderstandings in the questions. After modifications were made, the instrument was administered to 23 pilot study participants to ensure that women understood items and that transitions between items were clear. All potential changes to the LMUP were discussed with the LMUP originator (GB) to ensure that the conceptual function of the items remained the same.
Minor modifications from the original LMUP were necessary to accommodate the population and context (Appendix 1 and (Barrett 2010)). Item two, which asked whether a woman felt that her last pregnancy came at the right time, not quite the right time, or the wrong time, was interpreted by some participants in terms of certain times of the week or month that were considered to be “inauspicious.” We thus changed the question to ask if the woman wanted the pregnancy then, sooner, later, or not at all, in order to maintain the focus of the question on the timing of the pregnancy. Secondly, we modified the pre-pregnancy health behaviors listed in item six to include actions that are more commonly taken by local women in preparation for pregnancy, such as cutting down on chewing paan leaves and avoiding “hot” foods. Because education levels were low in the study population, the questions were administered by an interviewer rather than self-

Rocca et al.: Measuring pregnancy planning
300 http://www.demographic-research.org
administered. Finally, items were reworded to refer specifically to a husband, rather than to any partner.
2.4 Analyses
Analyses for this study were based on two methodological approaches. We used a Classical Test Theory-based (CTT) approach because the methods are familiar to most audiences and to facilitate the comparison of our results with the original UK study (Barrett et al. 2004). We also implemented Item Response Modeling (IRM) because of the advantages of this approach over true score theory-based methods, including the ability to allow the “distance” between response categories to vary within and across items; the availability of a broader set of tools with which to examine individual item performance; and the capability of incorporating external variables directly into models to assess whether items perform differentially between groups of individuals (see Appendices 2 and 3). It is beyond the scope of this paper to provide a comprehensive review of IRM; readers are referred to other sources for introductions to IRM (De Boeck and Wilson 2004; Embretson and Reise 2000; Wilson 2006) and for discussion of its application to health research (Wilson et al. 2006a, 2006b). While the use of advanced psychometric methods such as IRM is fairly widespread in psychological and educational research, this is the first analysis to our knowledge to apply IRM within the field of demography.
Analyses are consistent with established guidelines for psychometric testing of an existing instrument in a new population (Aaronson et al. 2002; American Educational Research Association et al. 1999; Food and Drug Administration 2009). LMUP items are presented in Appendix 1.
2.4.1 Item analysis and missingness
We assessed the acceptability of the measure by examining missing item responses. For participants missing one of the six item responses, the average score on completed items was used to impute a response. We also examined the frequency with which each item's response categories were selected to gain insight into the discrimination abilities of the categories, using 80% and 10% as general guidelines for high and low selection. Data were cleaned, coded, and managed in Stata version 10 (College Station, TX).
Demographic Research: Volume 23, Article 11
http://www.demographic-research.org 301
2.4.2 Classical Test Theory analyses
We conducted CTT analysis analyses using similar procedures as were followed in the original evaluation in the UK (Barrett, Smith, and Wellings 2004) using Stata version 10.
2.4.2.1 Reliability
We computed Cronbach’s α to assess internal consistency, using 0.7 as the cut-off point for acceptable reliability (Aaronson et al. 2002; Cronbach 1990). We assessed item-total correlations, with scores greater than 0.2 indicating that the item contributed to the homogeneity of the scale (Kline 1986; Streiner and Norman 1995). Internal consistency was initially assessed separately by language; because results were very similar, we combined results across languages for remaining tests.
Because the LMUP was administered within an ongoing cohort study, we were unable to evaluate test-retest reliability over two weeks, as is customary (Streiner and Norman 1995). However, we did examine the long-term stability of the measure over a year. The motivation for this test was that some previous research has shown that women’s retrospective perceptions of the intendedness of a pregnancy may change over the course of a pregnancy, after the birth of a child, and over time (Joyce, Kaestner, and Korenman 2002; Poole et al. 2000; Bankole and Westoff 1998; Koenig et al. 2006), though others have found reporting before and after birth to be consistent (Barrett, Smith, and Wellings 2004). We conducted the stability test using two subsets of women: (1) women who were pregnant at the first administration of the LMUP and had given birth by the second administration and (2) those who had no new pregnancies between administrations. Stability was assessed using the weighted κ, the non-parametric version of the intra-class correlation coefficient. A score above 0.60 was considered to be substantial (Landis and Koch 1977). We also assessed the simple Pearson’s correlation between scores at the two administrations. Because the interpretation of a correlation coefficient depends strongly on context and purposes of the test, and because no precedent exists in this field, we used 0.60 as the cut-point for acceptable correlation.
2.4.2.2 Validity
To evaluate the internal structure of the LMUP, we used principal component analysis, using oblique rotation. The scale was considered valid if all items loaded onto one component with an eigenvalue larger than one (Kline 1998).

Rocca et al.: Measuring pregnancy planning
302 http://www.demographic-research.org
Although evidence for external validity is frequently garnered by comparing the performance of a new instrument to an existing measure or “gold standard,” no such pregnancy planning measure exists. As such, we examined external validity by comparing median responses between women by their parity at last conception (nulliparous, primaparous and multiparous) using the non-parametric Wilcoxon Rank-Sum test. We hypothesized that LMUP scores would decrease with increasing parity.
2.4.3 Item Response Modeling analyses
IRM analyses were conducted using ACER ConQuest version 2.0 (Wu et al. 2007).
2.4.3.1 Model and distribution
We fit the data to a unidimensional Partial Credit Model (PCM) (Masters 1982) because it allowed the relative distances between ordinal response categories to differ for each item, unlike the less flexible Rating Scale Model (Andrich 1978). Because person locations calibrated assuming normal versus discrete item distributions during the initial structural estimation step were very similar, we assumed a normal distribution for the initial estimation step. We then used maximum likelihood estimation (MLE) to calculate person parameters.
To determine whether we could examine Kannada and Tamil measures together, we ran an item-by-language differential item functioning (DIF) model. A DIF model examines whether items function differentially by an external variable, controlling for overall performance differences by that variable. We compared a model with item-by-language interaction terms to a simpler model without these terms using the log-likelihood ratio (LLR) test. In addition, we examined whether interaction terms represented substantively meaningful differences in item performance.
One assumption we made in this analysis was that there were no consistent changes in individual item functioning over the two administrations of the LMUP. A challenge of evaluating this assumption was that characteristics we hypothesize could lead to DIF, such as pregnancy status and parity, change over time. Thus, at the outset, we simply assumed we could combine data from the two visits. Then, after assessing DIF by parity and pregnancy status at the end of analyses, we introduced an additional item-by-visit term to the IRM to determine if visit affected item performance after accounting for these external person variables.

Demographic Research: Volume 23, Article 11
http://www.demographic-research.org 303
2.4.3.2 Item fit
We assessed item fit to the IRM by examining the deviation of item responses from the model. A ratio of 1.33 or greater between the observed item-score variance and the variance expected by the model, using the weighted mean square statistic, was considered unacceptable fit (Adams and Khoo 1996). A weighted mean square statistic of less than 0.75 was considered better than expected fit. We confirmed our assessments by ensuring that the weighted t statistic was between -2 and 2 (Wright and Masters 1981). However, given that large sample sizes can yield significant t statistics for many items, we relied primarily on the effect size statistics (Wilson 2006).
To determine if each response category was the most commonly selected among participants at some range of the LMUP scale, we graphed item characteristic curves (ICCs) for each item. ICCs plot the frequency of selection of each ordinal response category onto the overall scale performance. We also plotted item category thresholds and respondent locations on a logit scale metric (Wright Map) and examined each item's response category thresholds to subjectively assess whether the item served to separate or distinguish respondents by their levels of pregnancy planning.
2.4.3.3 Reliability
We assessed internal consistency reliability using the separation reliability coefficient. This coefficient is similar to the Cronbach’s α except that it uses the metric of person intention scores from the IRM rather than summed scores across items. We calculated the separation reliability using an expected a posteriori estimation based on plausible values (EAP/PV) scores rather than the MLE score because a substantial portion of respondents had perfect scores on the LMUP. The MLE would exclude perfect scores and would thus underestimate the true reliability of the scale. Again, we used the 0.70 cut-off point for acceptable reliability.
We also examined the Wright Map to determine if the level of intentions measured by the LMUP items covered the full range of person intention levels. We graphed scale Information (inverse of the square of the standard error of measurement) to assess the level of precision at each level of the LMUP, again, to determine whether information was highest at levels where most participants fell.

Rocca et al.: Measuring pregnancy planning
304 http://www.demographic-research.org
2.4.3.4 Validity
Evidence for internal structure validity was gathered by determining, for each item, whether women selecting each increasing ordinal response option also had increasing mean scores on the LMUP scale. We also examined the point biserial correlation, which assesses correlation between response category and overall raw score on the instrument, for the same purpose.
Evidence for external structure validity was garnered by assessing the relationship between LMUP score and parity at last conception. We used Explanatory Item Response Modeling (EIRM), fitting a PCM including random intercepts for parity (De Boeck and Wilson 2004). Parity was treated using dummy variables for primaparous and multiparous, with nulliparous serving as the reference. As in CTT analyses, we hypothesized that intentions would decrease as parity increased.
As a final test of validity, we examined whether the LMUP items functioned differentially based on current pregnancy status and parity. We first confirmed that the full range of LMUP scores was represented within each pregnancy and parity group so as to be sure that neither variable too closely captured the construct of pregnancy planning. We then fit models with random intercepts for pregnancy and parity. We next introduced interaction terms between items and each external variable (pregnancy status and parity) and compared the fit of each DIF model to the nested non-DIF model. For instance, the current pregnancy DIF model was compared to a simpler model with only a random intercept for current pregnancy. The relative improvement in fit of each model was assessed using the LLR test and comparing each model's Akaike Information Criterion (AIC) and Bayesian Information Criterion (BIC). We also assessed item-by-trait coefficients to determine if the level of DIF was subjectively meaningful, using a cut-point of a half logit difference in item location by person-trait as a guideline for evidence of DIF (De Boeck and Wilson 2004).
As a final step, we included DIF terms for visit into the best-fitting EIRM model to confirm that items did not perform differentially over time.
3. Results
Characteristics of the participants completing the LMUP are described in Table 1. The LMUP was completed a total of 971 times: 443 times at the 12 month visit and 528 times at 24 months. Due to a skip pattern error in the survey, 183 ever-pregnant women did not complete the LMUP at 12 months. Although this error would bring into doubt normative interpretations of the measurement results, the data are still useful as the basis of an investigation of properties of the instrument. That is, because this study is a psychometric

Demographic Research: Volume 23, Article 11
http://www.demographic-research.org 305
analysis of a measure, the sample must contain individuals along the range of the construct (Kline 1986), but it does not need to be strictly representative of the study population to provide valid data.
Table 1: Characteristics of Samata Health Study participants completing the
London Measure of Unplanned Pregnancy (LMUP) on two occasions (n=971)
12-monthsa,
n=443 (67% of sample) 24-months,
n=528 (97% of sample) Mean SD Mean SD
Age (n=971) 23.4 2.3 24.5 2.7
n % n %Language (n=971) Tamil 354 79.9 416 78.8 Kannada 89 20.1 112 21.2
Religion (n=970) Hindu 220 49.7 289 54.8 Christian 161 36.3 184 34.9 Muslim 62 14.0 54 10.3
Education (n=969) none 84 19.0 95 18.1 Primary (1-5 years) 106 23.9 122 23.2 Middle (6-8 years) 147 33.2 176 33.5 High or more (9+ years) 106 23.9 133 25.3
Pregnancy Status (n=960) Not currently but previously 345 78.8 451 86.4 Currently and previously 84 19.2 69 13.2 Currently but not previously 9 2.1 2 0.4
Parity at last pregnancy (n=808b) 0 87 23.8 73 16.5 1 152 41.5 193 44.3 2 97 26.5 130 29.4 3 26 7.1 36 8.1 4+ 4 1.1 7 1.6 Notes: a Due to an error in the questionnaire at 12 months, 183 women who were not currently pregnant but had previously been
pregnant did not complete the LMUP. b 163 observations are missing for parity at last pregnancy. For some previously but not currently pregnant women, we were
unable to quantify parity at last pregnancy because the participant reported more than one pregnancy between visits, often due to spontaneous abortion or for other reasons.

Rocca et al.: Measuring pregnancy planning
306 http://www.demographic-research.org
3.1 Item analysis and missingness (see 2.4.1)
Missing response rates were very low. Twenty-nine participants had missing or "don't know" responses on a single item (3.0%), and seven participants failed to answer two items (0.7%). Items with the most missing or “don’t know” responses were items 2 (timing) and 3 (intention) (Table 2). The raw total scores of the LMUP fell into a left-skewed distribution (Figure 1), with 46.5% of participants scoring 10-12 (planned); 44.4% scoring 4-9 (ambivalent); and only 9.1% scoring 0-3 (unplanned).
Table 2: Missing Responses and Classical Test Theory results: Cronbach’s
alpha and item-total correlations, Samata Health Study participants Item Missing responses a Item-Total Correlations b
Total (n=971)
Kannada (n=201)
Tamil (n=770)
Total Kannada Tamil
1. contraception 2 2 0 0.09 0.15 0.07 2. timing 14 0 14 0.56 0.56 0.56 3. intention 20 1 19 0.68 0.71 0.67 4. want 3 0 3 0.67 0.73 0.67 5. discuss 2 1 1 0.48 0.58 0.46 6. prepare c 2 0 2 0.25 0.28 0.23 Cronbach’s α 0.72 0.76 0.71
Notes: a Only 1 item (Tamil, item 5) was missing a response; all others were marked “don’t know.”
b Item-total correlation is the correlation of the individual item with the remaining items in the scale. c Item 6 (prepare) has mark-all-that-apply response categories. Thus, numbers reflect “don’t know” for any of the response options.

Demographic Research: Volume 23, Article 11
Figure 1: Histogram of LMUP raw scores. Samata Health Study, Bangalore, India (n=971)
Table 3 illustrates participants' responses to individual items. On item one
(contraception), over 80% of respondents were not using contraception when they last became pregnant, and fewer than 10% selected the other categories. Few participants selected the middle of the three response options on items three (intention) and four (want).
http://www.demographic-research.org 307

Rocca et al.: Measuring pregnancy planning
308 http://www.demographic-research.org
Table 3: Participant responses, item and step fit, and Item Characteristic Curve (ICC) interpretations. Samata Health Study participants (n=971)
Item and Step Fit Items and Response Categories Responses (%) Weighted mean
squarea Tb
ICC Rangec
1. contraception 1.2 2.0 2: not using contraception 90.5 1.2 1.8 1: using sometimes or failed at least once 7.0 1.0 0.3 √ 0: always using contraception 2.5 1.2 1.0 √ 2. timing 0.9 -2.5 2: wanted pregnancy then or sooner 42.8 1.0 -1.5 1: wanted pregnancy later 41.8 1.0 -0.5 0: did not want pregnancy at all 15.4 0.9 -1.7 √ 3. intention 0.8 -4.3 2: intended pregnancy 61.4 0.8 -4.6 1: intentions kept changing 9.0 1.0 0 √ 0: did not intend pregnancy 29.6 0.9 -3.0 4. want 0.8 -4.3 2: wanted baby 69.5 0.8 -4.2 1: mixed feelings about having baby 6.4 1.0 0 √ 0: did not want baby 24.1 0.8 -3.6 5. discuss 1.0 0.7 2: agreed to get pregnant 65.9 0.9 -2.1 1: discussed but not agreed to get pregnant 11.0 1.0 -0.3 √ 0: never discussed getting pregnant 23.1 1.2 3.2 b 6. prepare 1.3 7.8 b 2: did 2 or more preparatory behaviors 40.7 1.2 5.6 b √ 1: did 1 preparatory behavior 21.3 1.0 0 b 0: did no preparatory behaviors 37.9 1.3 7.6 b
Notes: a All items and step fits were within the acceptable weighted mean square statistic range: 0.75-1.33.
b Lower than expected item or step fit (t>2.0) based on the t-test for the infit statistic c √ indicates that the response category is not the most common selection at any range of the LMUP scale.

Demographic Research: Volume 23, Article 11
http://www.demographic-research.org 309
3.2 Classical Test Theory results (see 2.4.2)
3.2.1 Reliability (see 2.4.2.1)
Internal consistency was acceptable (Cronbach’s α: Kannada=0.76, Tamil=0.71, overall=0.72) (Table 2). Item one (contraception) had low variation and an item-total correlation of <0.2 in both language versions; the other items had item-total correlations of 0.25-0.68. Cronbach’s α increased to 0.75 when removing item one.
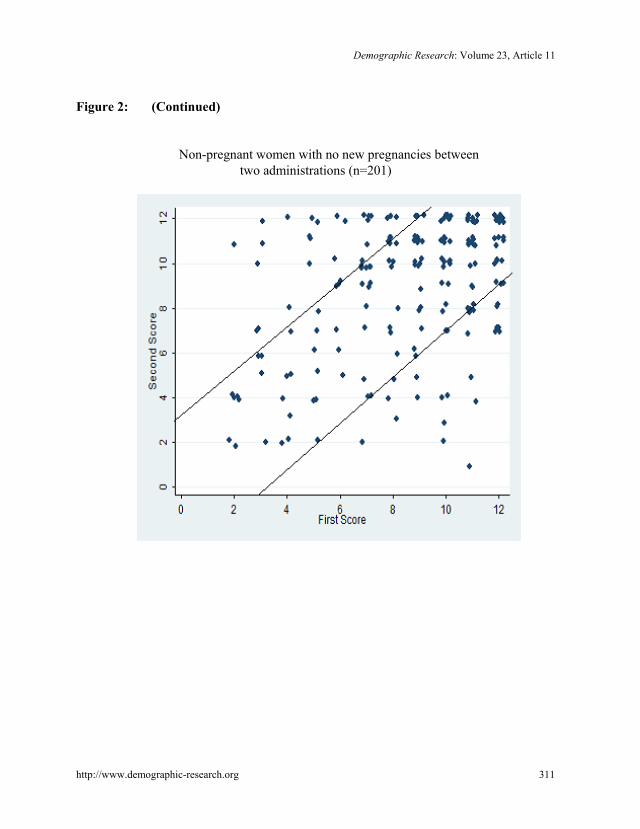
The long-term stability test indicated that responses to the LMUP changed substantially over one year (Figure 2). Of the 65 women who were pregnant at the first LMUP administration and gave birth before the second administration, the κ statistic was 0.43, reflecting moderate stability over one year. Only 3% of the 65 women had scores that decreased more than three points over time, while 22% had scores that increased more than three points, supporting the notion that women view pregnancies as more planned over time. The κ statistic was 0.27 among the 201 women who did not get pregnant between the two administrations and completed the LMUP twice. Among these women, 17% and 22% had scores that decreased and increased, respectively, more than three points over time. A full 44% of these 201 women were sterilized at the time of the baseline interview, indicating that the previous pregnancy occurred over a year earlier for a substantial portion of these participants. The correlation of scores was 0.59 among women who were pregnant at the first visit and 0.43 among those not pregnant at either.

Rocca et al.: Measuring pregnancy planning
Figure 2: Differences in LMUP scores between first and second administrations, one year apart
Pregnant women giving birth between two administrations (n=65)
310 http://www.demographic-research.org
Demographic Research: Volume 23, Article 11
Figure 2: (Continued)
Non-pregnant women with no new pregnancies between two administrations (n=201)
http://www.demographic-research.org 311

Rocca et al.: Measuring pregnancy planning
312 http://www.demographic-research.org
3.2.2 Validity (see 2.4.2.2)
Principal component analysis indicated that the six items loaded onto two components with eigenvalues greater than one. Because rotation did not improve results, we present unrotated findings. The first component had an eigenvalue of 2.66, with factor loadings as follows: item one (0.15); two (0.76); three (0.86); four (0.85); five (0.66); and item six (0.38). The second component, with an eigenvalue of 1.05, mainly represented item one (loading of 0.78).
Our hypothesis regarding the relationship between parity and LMUP score was confirmed. Nulliparous women had the highest scores (median=11, interquartile range (IQR): 10-12), followed by primaparous women (median=9, IQR: 6-11) and multiparous women (median=7, IQR: 4-10) (p<0.001).
3.3 Item Response Modeling results (see 2.4.3)
3.3.1 Item fit (see 2.4.3.2)
Weighted mean square statistics for each LMUP item and category all fell within the acceptable range (Table 3). However, several of the t-tests indicated larger than expected deviance, particularly for item six (prepare). Item Characteristic Curves (ICCs) reflect the patterns found in fit statistics and in participants' responses to items (Figure 3). The ICC for item one (contraception) showed that the highest category (not using contraception) was the most commonly selected response among participants at all LMUP levels. For item two (timing), the lowest category of not wanting to be pregnant at all was at no point along the LMUP scale the most common response. The ICCs for items three, four, five and six indicated that the middle of the three response categories was never the most common selection.
The Wright Map (Figure 4) indicated that only two of the items, item two (timing) and item six (prepare), had pairs of successive thresholds that were at substantively different scale locations. The two thresholds for items one, three, four, and five fell close together on the map. This is reflective of the infrequent selection of the middle of the three response categories on these items.

Demographic Research: Volume 23, Article 11
Figure 3: Item Characteristic Curvesa for LMUP items
Item 1 (contraception) Item 2 (timing)
Pro
babi
lity
1
.8
.6
.4
.2
0
-1 0 1 2 3 Latent Trait (logits)
Pro
babi
lity
1
.8
.6
.4
.2
0
-1 0 1 2 3
Latent Trait (logits)
Item 3 (intention) Item 4 (want)
Pro
babi
lity
1
.8
.6
.4
.2
0
-1 0 1 2 3
Latent Trait (logits)
Pro
babi
lity
1
.8
.6
.4
.2
0
-1 0 1 2 3
Latent Trait (logits)
Item 5 (discuss) Item 6 (prepare)
Pro
babi
lity
1
.8
.6
.4
.2
0 -1 0 1 2 3
Latent Trait (logits)
Pro
babi
lity
1
.8
.6
.4
.2
0 -1 0 1 2 3
Latent Trait (logits)
Notes: a The x-axes represent total LMUP score. The y-axes represent probability of selecting a given response. Each of the three
smoothed lines represents the probability that respondents with a given LMUP score selected each of three available responses. For instance, on item 5 (discuss), the lowest response category (never discussed having children) was the most common response among participants with the lowest LMUP scores. The highest response category (agreed to become pregnant) was the most common among participants at all LMUP levels above 0 logits.
http://www.demographic-research.org 313

Rocca et al.: Measuring pregnancy planning
Figure 4: Wright Map: LMUP logit scores, raw scores, respondent locations, item category threshold locations, item locations, and test information
========================================================================= Logit Raw Respondents* Item Category Item Test Score Score Thresholds† Locations Information‡ -------------------------------------------------------------------------
| |
12 XXXXXXXXXX| 3 |
| |
| | | | 2 11 XXXXXXXXX| | | | | 10 XXXXXXXXX| 2.2 6.2 | 1 | 9 XXXXXX| | 8 XXXXX| | 3.2 6.1 7 XXXXX| 5.2 | 3.1 4.2 0 6 XXX| | 4.1 5.1 5 XXXX| | 4 XXX| | | 2.1 3 XXX| -1 | | | 1.2 2 XX| | | | -2 | 1.1 | =========================================================================
1 (contraception): -1.63
2 (timing): 0.22 3 (intend): 0.35
4 (want): 0.08 5 (discuss): 0.10
6 (prepare): 0.89
0 1 2 3 4
Notes: a Each 'X' represents 15.9 respondents. b Item category thresholds are labeled with the item level, and step threshold, respectively. An item-step threshold location
represents the amount of “pregnancy planning” a respondent would need to have in order to have a 50% chance of selecting a response category on either side of the threshold. For instance, 4.1 represents the amount of "pregnancy planning" a respondent would need to have to have an equal (50%) chance of selecting the lowest category (did not want to have a baby) or selecting one of the two higher response categories on item 4.
c Test Information is the inverse square of the standard error of measurement at each level of the scale. LMUP items measure pregnancy planning with the most precision for participants falling just above 0 logits.
314 http://www.demographic-research.org

Demographic Research: Volume 23, Article 11
http://www.demographic-research.org 315
3.3.2 Reliability (see 2.4.3.3)
Internal consistency was modest, just below the cut-off point for acceptability (EAP/PV reliability: Kannada=0.70, Tamil=0.69, overall=0.69). The Information curve (Figure 4) indicated that the LMUP scale level with the lowest error (highest information) fell lower than did most participants. Error increased between one and three logits, where the bulk of participants in this sample fell, indicating that the LMUP estimated intention levels with lower precision at the highest levels.
3.3.3 Validity (see 2.4.3.4)
The LMUP showed excellent internal structure validity, with the average overall LMUP score among participants selecting each category increasing as expected across response categories (data not shown). The explanatory (EIRM) model with parity supported our hypothesis that average scores decreased as parity increased: as compared to nulliparous women, primaparous and multiparous women scored on average 0.85 and 1.32 logits lower, respectively.
Participants within each of the pregnancy status and parity groups covered the range of LMUP scores, signifying that these traits did not capture pregnancy planning too closely to assess DIF.
Although women who were currently pregnant scored, on average, 0.58 logits lower on the LMUP than non-pregnant women, the DIF model with pregnancy status showed no evidence of DIF: interaction terms between pregnancy status and items were not significant, and the fit of the item-by-pregnancy DIF model showed no improvement over the nested model with only a random intercept for current pregnancy. The DIF model with parity, on the other hand, showed improved fit over the simpler model with intercepts for parity. The best fitting model overall was the all item-by-parity DIF model, including a random intercept for current pregnancy. Regression coefficients and parameters from this model are presented in Table 4. Compared to multiparous women, primaparous women scored 0.4 logits higher and nulliparous women scored 1.4 logits higher.

Rocca et al.: Measuring pregnancy planning
Table 4: Parameter estimates: Partial Credit Model with random effects for parity and pregnancy status and all item Differential Item Functioning (DIF) by paritya
Parity Estimate Error Regression Coefficients
Constant 2.05 0.08
Parity 0 (reference) 1 -0.99 0.10 2+ -1.41 0.10 Currently pregnant No (reference) Yes -0.57 0.09 Item x Parity DIF Terms
1. contraception 0 -0.03 0.06 1 0.38 0.05 2+ -0.32 0.08 2. timing 0 -0.40 0.05 1 0.13 0.04 2+ 0.27 0.07 3. intention 0 -0.29 0.05 1 0.40 0.04 2+ 0.26 0.06 4. want 0 -0.14 0.05 1 -0.03 0.04 2+ 0.16 0.06 5. discuss 0 0.29 0.05 1 -0.21 0.04 2+ -0.08 0.06 6. prepare 0 0.58 0.12 1 -0.28 0.09 2+ -0.29 0.15
Notes: a Parameters for items and item-by-step terms are omitted.
316 http://www.demographic-research.org

Demographic Research: Volume 23, Article 11
http://www.demographic-research.org 317
Item-by-parity parameter estimates revealed how items behaved differentially by parity, accounting for overall difference in performance by parity and pregnancy status. Differences were largely between nulliparous women and women with any children. Items performed similarly for primaparous and multiparous women. On item two (timing), prima and multiparous women were less likely than nulliparous women to express that the last pregnancy happened sooner than planned or at the right time, controlling for overall intentions. Similarly, nulliparous women were also more likely to have intended their most recent pregnancy (item three). Nulliparous women scored lower on items five (discuss) and six (prepare), than parous women, indicating that nulliparous women were less likely to have discussed having a child with their husbands or to have engaged in preparatory behaviors prior to pregnancy than were parous women.
Accounting for overall score differences on the LMUP by parity, primaparous women were least likely to have used contraception at last pregnancy (item one), particularly compared to multiparous women. Evidence of DIF for item one may not be particularly meaningful because the item fell so far below participant intention levels and showed so little variation in this population.
The model with DIF terms for language showed no significant evidence of DIF by language. There was no evidence of DIF by visit, after incorporating differences between women’s pregnancy status and parity over time. This confirms the legitimacy of calibrating the two time points together, keeping in mind that standard errors may be slightly lower given that the 971 observations were not truly independent.
4. Discussion
This paper examined the psychometric properties of the London Measure of Unplanned Pregnancy among married women in south India using two approaches: Classical Test Theory and Item Response Modeling. Because no overall test of fit to an IRM is available, model fit was assessed by examining item and category threshold deviance statistics. With the exception of item six (prepare), all items fell within the acceptable fit range. As a result, we considered the LMUP a reasonable fit to the IRM and recommend further investigation of item six (prepare) to see if the observed lack of fit is replicated. If so, then deletion or modification of the item would be required.
In many respects, the LMUP functioned very well in this urban Indian context. Scale clarity was high, with very low missing and “don’t know” responses. Considering that the scale was developed in a completely different cultural context from urban India, Cronbach’s αs of > 0.70 are good, and EAP/PV reliability coefficients of 0.69-0.70 are modest, bordering on acceptable. Furthermore, the IRM analysis revealed strong internal structure validity, with mean person scores increasing consistently over increasing item

Rocca et al.: Measuring pregnancy planning
318 http://www.demographic-research.org
category responses. (Interestingly, the pattern and ordering of factor loadings and item-totals found in this study in India were similar, though generally lower, than those found in the UK study (Barrett, Smith, and Wellings 2004).) Both CTT and IRM analyses provided strong evidence of external structure validity, and our hypothesis that average scores would decrease at increased parities was confirmed. That DIF analyses indicated no DIF by current pregnancy status suggests that the LMUP can be used validly with both pregnant and non-pregnant women.
In other respects, the LMUP did not function ideally. For instance, item one (contraception) showed very little variability in this study. In principal component analysis, item one contributed little to the internal consistency of the scale (very low item-total correlation) falling beneath the 0.2 threshold for loading on to the main factor. In IRM analyses, item one did little to contribute to the measurement of intentions. Furthermore, DIF analyses revealed that, comparing women at the same overall LMUP score, primaparous women were slightly less likely to use contraception, and multiparous women were more likely to do so. On the other hand, item one fit the PCM; therefore including the item does little harm and keeps the LMUP closer to its original version, which may serve as an advantage for cross-cultural comparisons. We do, however, recommend exploring possible new response categories to achieve a greater distribution of responses. For instance, the proportion of women who became pregnant while using non-modern contraceptive methods, including withdrawal, rhythm, or breast-feeding, could be examined as potential response categories.
The contraceptive use findings are consistent with other research on fertility and contraceptive use patterns in India. In general, young women in India become pregnant soon after marriage, and 64% of married teenagers in Karnataka are pregnant or have at least one child (International Institute for Population Sciences and Macro International 2008). Use of birth spacing contraceptive methods is low, with only 4% of urban women of reproductive age using an intrauterine device, 4% using condoms, and 1% using birth control pills. Once women achieve their desired family size, most undergo sterilization. A full 70% of women with two children are sterilized (International Institute for Population Sciences and Macro International 2008). Given these patterns, it is not surprising that few women reported using contraception at their last pregnancy, even women who otherwise indicated lower pregnancy planning. The item-by-parity DIF we detected is likely a function of these patterns, as well. Primaparous women may be less likely to use contraception (than nulliparous and multiparous women with the same overall LMUP scores) because non-permanent birth spacing methods are not commonly used.
The middle of the three response categories to four items received low response rates. While this response pattern is not optimal, it may simply indicate that women in this study tended to hold more polar viewpoints on pregnancy planning. Similarly, participants scored higher on the LMUP than the scale’s items are designed to ideally
Demographic Research: Volume 23, Article 11
http://www.demographic-research.org 319
capture. Most likely, this is not a problem with the scale per se, but rather a function of the cultural context.
DIF analyses suggest that four items may have functioned differentially for women of different parities, also along the lines of attitudinal and behavioral questions. Compared to nulliparous women at the same overall pregnancy planning level, parous women were less likely to indicate that they had favorable attitudes towards pregnancy, including timing of the pregnancy and the overall intention of the pregnancy. Nulliparous women were less likely than women with children to select behavioral indications of pregnancy intentions, namely speaking to and agreeing with one’s husband to get pregnant and engaging in preparatory health behaviors. This pattern could be due to the normative pressure on young married Indian women to bear children and prove their fertility early on in marriage (Bott et al. 2003; Jejeebhoy 1998). The strong expectation that young nulliparous women become pregnant may negate their need to engage in purposive behavior to get pregnant. Additional research is needed to confirm whether, how and why LMUP items function differentially by parity and whether or not this represents a meaningful underlying difference in conceptualization of pregnancy planning between parous and nulliparous women or the different circumstances under which they experience pregnancy. Interestingly, another CTT analysis of a different intention scale among African-Americans in the United States found that factor loadings differed by the birth order of the pregnancy (Speizer et al. 2004).
The long-term assessment of the stability of the LMUP strikes a cautionary note about retrospective measurement of intentions. Women who were pregnant at the first LMUP administration indicated lower levels of planning than when they were no longer pregnant. This finding is in contrast to findings in the UK (Barrett, Smith, and Wellings 2004) but is consistent with other studies indicating that, at the group level, women’s reported intentions increased after the birth of a child (Koenig et al. 2006; Bankole and Westoff 1998; Joyce, Kaestner, and Korenman 2000). Our data suggest that post-pregnancy estimates of pregnancy intentions using retrospective measures in an Indian population may underestimate the true incidence of unintended pregnancy. Although the reliability of two intention assessments (one year interval) provided after the birth of a child was low, we found no clear evidence of a net increase in reported intention levels. This finding is in contrast to other studies that have suggested that intention levels increase over time during pregnancy (Poole et al. 2000) and after birth (Bankole and Westoff 1998; Koenig et al. 2006). It is possible that there is a gradual increase in intention estimates over the years post-delivery that we were unable to detect in only a one-year comparison.

Rocca et al.: Measuring pregnancy planning
320 http://www.demographic-research.org
4.1 Conclusion and future directions
As this analysis has highlighted, the translation of the LMUP into the Indian context was successful on multiple fronts, despite the emergence of some weaknesses. There exists no clear hierarchy for evaluating the relative importance of psychometric problems, and there are inherent tensions and trade-offs to modifying an existing measure. For instance, while using the same version of an instrument facilitates cross-cultural comparisons and the examination of DIF, items developed in one context may not validly capture the construct of pregnancy intentions in a different environment, threatening instrument content validity. In addition, altering items in an instrument to increase reliability may result in decreased external validity.
With these trade-offs in mind, we assess that the use of the LMUP as a retrospective measure of pregnancy intentions in urban India is, at the least, more robust than existing, non-psychometrically validated questions such as those from the DHS. By avoiding the assumptions that decisions about pregnancy are completely rational, that actions and attitudes should be congruent, and that women fall into clear categories of intentions, the LMUP represents an improvement over existing retrospective measures.
At the same time, we recommend several steps for improving the performance of the LMUP for use in India. First and foremost, study findings should be corroborated by testing the LMUP on other populations of Indian women. The young, married women in this study had low levels of education and lived in a poor urban environment. At the same time as opportunities for employment are burgeoning in the study communities, underlying gender norms and expectations, particularly around fertility, continue to exert a strong influence in women’s lives (Krishnan et al. 2010; Rocca et al. 2009). Such an environment may generate unique perspectives on pregnancy intentions. Testing the LMUP among women who are older, unmarried and living in rural areas would help to determine whether the issues identified in this analysis are study population-dependent.
We also suggest returning to qualitative research to explore potential modifications of the other LMUP items that were problematic in this analysis. For instance, it would also be useful to explore why selection of the middle response option on items one, three, four and five was low; modified categories for these items might achieve a better spread of participants. We recommend particularly exploring the gender-based power dimensions of pregnancy planning; the degree to which women view their fertility as being within their control; and the extent to which a woman’s husband or societal norms influence her intentions and her behaviors. It is possible that these power dynamics influence reported intentions and mask the underlying ambivalence some women feel about pregnancy. It is also possible that, in contexts in which women have little control over fertility behaviors, examination of certain behaviors as reflections of a woman’s intentions could be misleading. Learning more about how women internalize or act in

Demographic Research: Volume 23, Article 11
http://www.demographic-research.org 321
response to pressures to become pregnant may provide useful insights into rephrasing response categories to more validly capture women’s actual intentions.
More generally, future psychometric analyses of the LMUP in other populations, including the original UK population, should examine the potential for and meaning of DIF by women’s characteristics, such as education, socio-economic status, and parity. Particular attention should be paid to understanding the cultural or contextual meaning of an individual’s attitudes towards pregnancy and pregnancy-related behavior. Further inquiry into the significance of DIF by parity would help determine if women of different parities conceptualize pregnancy intentions differently and whether such differences actually compromise the validity of intention measurement. Such research would inform modifications to enhance the validity of the LMUP in India and elsewhere.
5. Acknowledgements
This research was supported by a grant from the National Institute of Child Health and Human Development (R01-HD041731) and a gift from the Levis Strauss Foundation, USA. The views and conclusions presented herein are solely the responsibility of the authors and do not necessarily represent the official position of these supporters.
We are extremely grateful to the Samata Health Project research team for their dedication and effort. We extend a special thanks to Kalyani Subbiah, Mridula Shankar, Sajida Khanum and Anu Sreevathsa for their diligence in coordinating the project. We also appreciate Nancy Padian and Art Reingold for their reviews and Ira Tager for his encouragement to pursue an untraditional analysis.
Rocca et al.: Measuring pregnancy planning
322 http://www.demographic-research.org
References
Aaronson, N., Alonso, J., Burnam, A., Lohr, K.N., Patrick, D.L., Perrin, E., and Stein, R.E.K. (2002). Assessing health status and quality-of-life instruments: attributes and review criteria. Quality of Life Research 11(3): 193-205. doi:10.1023/A:1015291021312.
Adams, R.J. and Khoo, S.T. (1996). Quest. Melbourne, Australia: Australian Council for Educational Research.
Ajzen, I. (1985). From intentions to actions: a theory of planned behavior. In: Kuhl, J. and Beckmann, J. (eds.). Action control: from cognition to behavior. New York, NY: Springer-Verlag: 11-39.
American Educational Research Association, American Psychological Association, and National Council for Measurement in Psychology (1999). Standards for educational and psychological testing. Washington, DC: American Psychological Association.
Andrich, D. (1978). Rating formulation for ordered response categories. Psychometrika 43(4): 561-573. doi:10.1007/BF02293814.
Bachrach, C.A. and Newcomer, S. (1999). Intended pregnancies and unintended pregnancies: distinct categories or opposite ends of a continuum? Family Planning Perspectives 31(5): 251-252. doi:10.2307/2991577.
Bankole, A. and Westoff, C.F. (1998). The consistency and validity of reproductive attitudes: evidence from Morocco. Journal of Biosocial Science 30(4): 439-455. doi:10.1017/S0021932098004398.
Barrett, G. (2010). The London Measure of Unplanned Pregnancy [electronic resource]. Middlesex, UK. http://www.lmup.org.uk/download.htm.
Barrett, G., Smith, S.C., and Wellings, K. (2004). Conceptualisation, development, and evaluation of a measure of unplanned pregnancy. Journal of Epidemiology and Community Health 58(5): 426-433. doi:10.1136/jech.2003.014787.
Barrett, G. and Wellings, K. (2002). What is a 'planned' pregnancy? Empirical data from a British study. Social Science & Medicine 55(4): 545-557. doi:10.1016/S0277-9536(01)00187-3.
Bledsoe, C., Banja, F., and Hill, A.G. (1998). Reproductive mishaps and western contraception: An African challenge to fertility theory. Population and Development Review 24(1): 15- 57. doi:10.2307/2808121.

Demographic Research: Volume 23, Article 11
http://www.demographic-research.org 323
Bongaarts, J. (1990). The measurement of wanted fertility. Population and Development Review 16(3): 487-506. doi:10.2307/1972833.
Bott, S., Jejeebhoy, S., Shah, I., and Puri, C. (2003). Towards adulthood: exploring the sexual and reproductive health of adolescents in South Asia [electronic resource]. Geneva, Switzerland: World Health Organization, Department of Reproductive Health and Research. http://whqlibdoc.who.int/publications/2003/9241562501.pdf
Buckshee, K. (1997). Impact of roles of women on health in India. International Journal of Gynaecology and Obstetrics 58: 35-42. doi:10.1016/S0020-7292(97)02887-7.
Casterline, J.B. and El-Zeini, L.O. (2007). The estimation of unwanted fertility. Demography 44(4): 729-745. doi:10.1353/dem.2007.0043.
Cater, S. and Coleman, L. (2006). Planned teenage pregnancy: Views and experiences of young people from poor and disadvantaged backgrounds [electronic resource]. York, UK: Joseph Rowntree Foundation. http://www.jrf.org.uk/publications/
Cleland, J., Johnson-Acsadi, G., and Marckwardt, A. (1987). The Core Questions. In: Cleland, J. and Scott, C. (eds.). The World Fertility Surveys: an assessment. Oxford: Oxford University Press.
Coale, A.J. (1973). The demographic transition reconsidered. Paper presented at the International Union for the Scientific Study of Population, Liege, Belgium, 1973.
Crissey, S.R. (2005). Effect of pregnancy intention on child well-being and development: Combining retrospective reports of attitude and contraceptive use. Population Research and Policy Review 24(6): 593-615. doi:10.1007/s11113-005-5734-1.
Cronbach, L.J. (1990). Essentials of psychologic testing (5th edition). New York, NY: Harper & Row.
De Boeck, P. and Wilson, M. (2004). Explanatory Item Response Models: a Generalized Linear and Nonlinear Approach. New York, NY: Springer-Verlag.
Embretson, S.E. and Reise, S.P. (2000). Item response theory for psychologists. Mahwah, NJ: MEA.
Esacove, A. (2008). Making sense of sex: rethinking intentionality. Culture Health & Sexuality 10(4): 377-390. doi:10.1080/13691050801898869.
Fischer, R.C., Stanford, J.B., Jameson, P., and DeWitt, M.J. (1999). Exploring the concepts of intended, planned, and wanted pregnancy. Journal of Family Practice 48(2): 117-122. doi:10.1111/j.1728-4457.2000.00295.x.

Rocca et al.: Measuring pregnancy planning
324 http://www.demographic-research.org
Fishbein, M., and Ajzen, I. (1975). Belief, attitude, intention and behavior: an introduction to theory and research. Reading, MA: Addison-Wesley.
Fisher, K. (2000). Uncertain aims and tacit negotiation: Birth control practices in Britain, 1925-50. Population and Development Review 26(2): 295-317. doi:10.1111/j.1728-4457.2000.00295.x.
Food and Drug Administration (2009). Guidance for industry on patient-reported outcome measures: use in medicinal product development to support labeling claims [electronic resource]. Rockville, MD. http://www.fda.gov/ downloads/Drugs/GuidanceComplianceRegulatoryInformation/Guidances/ucm071975.pdf
Gipson, J.D., Koenig, M.A., and Hindin, M.J. (2008). The effects of unintended pregnancy on infant, child, and parental health: A review of the literature. Studies in Family Planning 39(1): 18-38. doi:10.1111/j.1728-4465.2008.00148.x.
Gribaldo, A., Judd, M.D., and Kertzer, D.I. (2009). An Imperfect Contraceptive Society: Fertility and Contraception in Italy. Population and Development Review 35(3): 551-584. doi:10.1111/j.1728-4457.2009.00296.x.
ICF Macro (2008). Demographic and Health Surveys, Women's Questionnaire [electronic resource]. Calverton, MD. http://www.measuredhs.com/pubs/pdf/DHSQ5/DHS5-Woman%27s-QRE-22-Aug-2008.pdf
International Institute for Population Sciences and Macro International (2008). National Family Health Survey (NFHS-3), India, 2005-6: Karnataka [electronic resource]. Mumbai, India: IIPS. http://www.nfhsindia.org/NFHS-3%20Data/ Karnataka_report.pdf
Jejeebhoy, S.J. (1998). Adolescent sexual and reproductive behavior: a review of the evidence from India. Social Science & Medicine 46(10): 1275-1290. doi:10.1016/S0277-9536(97)10056-9.
Johnson-Hanks, J. (2005). When the future decides: uncertainty and intentional action in contemporary Cameroon. Current Anthropology 46(3): 363-385. doi:10.1086/428799.
Johnson-Hanks, J. (2008). Demographic transitions and modernity. Annual Review of Anthropology 37: 301-315. doi:10.1146/annurev.anthro.37.081407.085138.
Johnson, B.T. and Boynton, M.H. (2009). Putting attitudes in their place: behavioural prediction in the face of competing variables. Paper presented at the 12th

Demographic Research: Volume 23, Article 11
http://www.demographic-research.org 325
Symposium of Social Psychology, Sydney, Australia, 2009. http://www.sydneysymposium.unsw.edu.au/2009/chapters/JohnsonSSSP09.pdf
Joyce, T., Kaestner, R., and Korenman, S. (2000). The stability of pregnancy intentions and pregnancy-related maternal behaviors. Maternal and Child Health Journal 4(3): 171-178. doi:10.1023/A:1009571313297.
Joyce, T., Kaestner, R., and Korenman, S. (2002). On the validity of retrospective assessments of pregnancy intention. Demography 39(1): 199-213. doi:10.1353/dem.2002.0006.
Kendall, C., Afable-Munsuz, A., Speizer, I., Avery, A., Schmidt, N., and Santelli, J. (2005). Understanding pregnancy in a population of inner-city women in New Orleans: results of qualitative research. Social Science & Medicine 60(2): 297-311. doi:10.1016/j.socscimed.2004.05.007.
Kline, P. (1986). A handbook of test construction: introduction to psychometric design. London, UK: Methuen.
Kline, P. (1998). The new psychometrics: science, psychology and measurement. London, UK: Routledge.
Koenig, M.A., Acharya, R., Singh, S., and Roy, T.K. (2006). Do current measurement approaches underestimate levels of unwanted childbearing? Evidence from rural India. Population Studies: a Journal of Demography 60(3): 243-256. doi: 10.1080/00324720600895819.
Krishnan, S., Rocca, C.H., Hubbard, A.E., Subbiah, K., Edmeades, J., and Padian, N.S. (2010). Do changes in spousal employment status lead to domestic violence? Insights from a prospective study in Bangalore, India. Social Science & Medicine 70(1): 136-143. doi:10.1016/j.socscimed.2009.09.026.
Lakha, F. and Glasier, A. (2006). Unintended pregnancy and use of emergency contraception among a large cohort of women attending for antenatal care or abortion in Scotland. Lancet 368(9549): 1782-1787. doi:10.1016/S0140-6736(06)69737-7.
Landis, J.R. and Koch, G.G. (1977). Measurement of observer agreement for categorical data. Biometrics 33(1): 159-174. doi:10.2307/2529310.
Luker, K.C. (1975). Taking chances: abortion and the decision not to contracept. Berkeley, CA: University of California Press.
Masters, G. (1982). Rasch model for partial credit scoring. Psychometrika 49: 359-381.

Rocca et al.: Measuring pregnancy planning
326 http://www.demographic-research.org
Miller, W.B. (1995). Childbearing motivation and its measurement. Journal of Biosocial Science 27(4): 473-487. doi:10.1017/S0021932000023087.
Miller, W.B., Severy, L.J., and Pasta, D.J. (2004). A framework for modelling fertility motivation in couples. Population Studies-a Journal of Demography 58(2): 193-205. doi:10.1080/0032472042000213712.
Moos, M.K., Petersen, R., Meadows, K., Melvin, C.L., and Spitz, A.M. (1997). Pregnant women's perspectives on intendedness of pregnancy. Womens Health Issues 7(6): 385-392. doi:10.1016/S1049-3867(97)00081-9.
Morin, P., Payette, H., Moos, M.-K., St-Cyr-Tribble, D., Niyonsenga, T., and De Wals, P. (2003). Measuring the intensity of pregnancy planning effort. Paediatric and Perinatal Epidemiology 17(1): 97-105. doi:10.1046/j.1365-3016.2003.00461.x.
Ouellette, J.A. and Wood, W. (1998). Habit and intention in everyday life: the multiple processes by which past behavior predicts future behavior. Psychological Bulletin 124(1): 54-74. doi:10.1037/0033-2909.124.1.54.
Poole, V.L., Flowers, J.S., Goldenberg, R.L., Cliver, S.P., and McNeil, S. (2000). Changes in intendedness during pregnancy in a high-risk multiparous population. Maternal and Child Health Journal 4(3): 179-182. doi:10.1023/A:1009 523430135.
Rocca, C.H., Hubbard, A.E., Johnson-Hanks, J., Padian, N.S., and Minnis, A.M. (2010). Predictive ability and stability of pregnancy intentions measures: a longitudinal analysis of adolescent boys and girls. Studies in Family Planning 41(3): in press.
Rocca, C.H., Rathod, S., Falle, T., Pande, R.R., and Krishnan, S. (2009). Challenging assumptions about women’s empowerment: social and economic resources and domestic violence among young women in urban South India. International Journal of Epidemiology 38(2): 577-585. doi:10.1093/ije/dyn226.
Sable, M.R. (1999). Pregnancy intentions may not be a useful measure for research on maternal and child health outcomes. Family Planning Perspectives 31(5): 249-250. doi:10.2307/2991575.
Santelli, J., Rochat, R., Hatfield-Timajchy, K., Colley Gilbert, B., Curtis, K., Cabral, R., Hirsch, J.S., Schieve, L, and Unintended Pregnancy Working Group (2003). The measurement and meaning of unintended pregnancy. Perspectives on Sexual and Reproductive Health 35(2): 94-101. doi:10.1363/3509403.
Santelli, J.S., Lindberg, L.D., Orr, M.G., Finer, L.B., and Speizer, I. (2009). Toward a multidimensional measure of pregnancy intentions: evidence from the United
Demographic Research: Volume 23, Article 11
http://www.demographic-research.org 327
States. Studies in Family Planning 40(2): 87-100. doi:10.1111/j.1728-4465.2009.00192.x.
Schunmann, C. and Glasier, A. (2006). Measuring pregnancy intention and its relationship with contraceptive use among women undergoing therapeutic abortion. Contraception 73(5): 520-524. doi:10.1016/j.contraception.2005.12.009.
Schwarz, N. (2000). Agenda 2000: Social judgement and attitudes: warmer, more social and less conscious. European Journal of Social Psychology 30 (2): 149-176. doi:10.1002/(SICI)1099-0992(200003/04)30:2<149::AID-EJSP998>3.0.CO;2-N.
Speizer, I.S., Santelli, J.S., Afable-Munsuz, A., and Kendall, C. (2004). Measuring factors underlying intendedness of women's first and later pregnancies. Perspectives on Sexual and Reproductive Health 36(5): 198-205. doi:10.1363/3619804.
Srinivasan, S. (2005). Daughters or dowries? The changing nature of dowry practices in South India. World Development 33(4): 593-615. doi:10.1016/j.worlddev.2004. 12.003.
Streiner, DL. and Norman, G. R. (1995). Health measurement scales: a practical guide to their development and use (2nd edition). Oxford, UK: Oxford University Press.
Trussell, J., Vaughan, B., and Stanford, J. (1999). Are all contraceptive failures unintended pregnancies? Evidence from the 1995 National Survey of Family Growth. Family Planning Perspectives 31(5): 246-247: 260. doi:10.2307/2991573.
United Nations Population Fund (UNFPA) (2008). The State of World Population 2008 [electronic resource]. New York, NY: UNFPA. http://www.unfpa.org/swp/2008/presskit/docs/en-swop08-report.pdf
Wilson, M. (2006). Constructing Measures: An Item Response Modeling approach. Mahwah, New Jersey: Lawrence Erlbaum Associates.
Wilson, M., Allen, D.D., and Li, J.C. (2006a). Improving measurement in health education and health behavior research using item response modeling: comparison with the classical test theory approach. Health Education Research 21(Supplement 1): 19-32. doi:10.1093/her/cyl053.
Wilson, M., Allen, D.D., and Li, J.C. (2006b). Improving measurement in health education and health behavior research using item response modeling: introducing item response modeling. Health Education Research 21(Supplement 1): 4-18. doi:10.1093/her/cyl108.
Rocca et al.: Measuring pregnancy planning
328 http://www.demographic-research.org
Wright, B.D. and Masters, G.N. (1981). Best test design. Chicago, IL: MESA Press.
Wu, M.L., Adams, R.J., Wilson, M.R., and Haldane, S.A. (2007). ACER ConQuest version 2.0: Generalized Item Response Modeling Software. Camberwell, Victoria, Australia: ACER Press.
Zabin, L.S. (1999). Ambivalent feelings about parenthood may lead to inconsistent contraceptive use - and pregnancy. Family Planning Perspectives 31(5): 250-251. doi:10.2307/2991576.
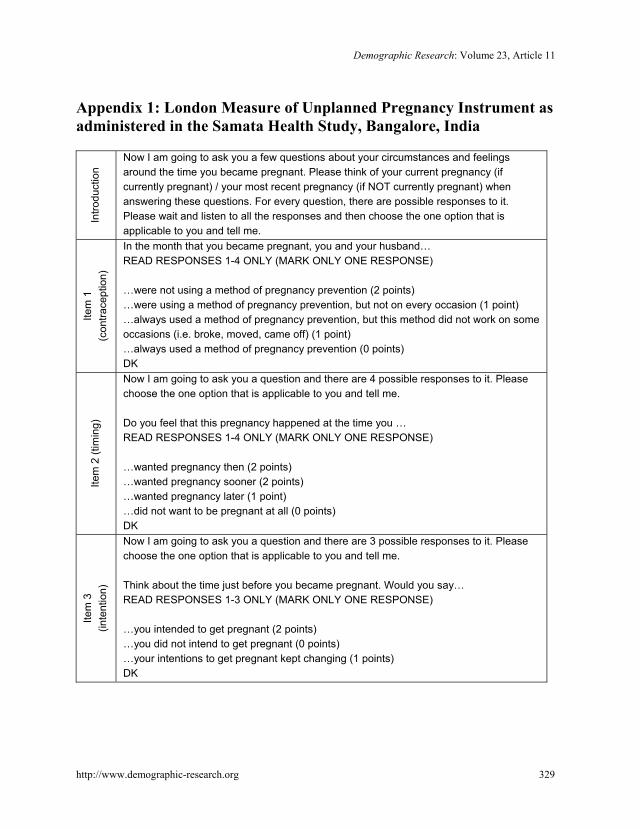
Demographic Research: Volume 23, Article 11
http://www.demographic-research.org 329
Appendix 1: London Measure of Unplanned Pregnancy Instrument as administered in the Samata Health Study, Bangalore, India
Intro
duct
ion
Now I am going to ask you a few questions about your circumstances and feelings around the time you became pregnant. Please think of your current pregnancy (if currently pregnant) / your most recent pregnancy (if NOT currently pregnant) when answering these questions. For every question, there are possible responses to it. Please wait and listen to all the responses and then choose the one option that is applicable to you and tell me.
Item
1
(con
trace
ptio
n)
In the month that you became pregnant, you and your husband… READ RESPONSES 1-4 ONLY (MARK ONLY ONE RESPONSE) …were not using a method of pregnancy prevention (2 points) …were using a method of pregnancy prevention, but not on every occasion (1 point) …always used a method of pregnancy prevention, but this method did not work on some occasions (i.e. broke, moved, came off) (1 point) …always used a method of pregnancy prevention (0 points) DK
Item
2 (t
imin
g)
Now I am going to ask you a question and there are 4 possible responses to it. Please choose the one option that is applicable to you and tell me. Do you feel that this pregnancy happened at the time you … READ RESPONSES 1-4 ONLY (MARK ONLY ONE RESPONSE) …wanted pregnancy then (2 points) …wanted pregnancy sooner (2 points) …wanted pregnancy later (1 point) …did not want to be pregnant at all (0 points) DK
Item
3
(inte
ntio
n)
Now I am going to ask you a question and there are 3 possible responses to it. Please choose the one option that is applicable to you and tell me. Think about the time just before you became pregnant. Would you say… READ RESPONSES 1-3 ONLY (MARK ONLY ONE RESPONSE) …you intended to get pregnant (2 points) …you did not intend to get pregnant (0 points) …your intentions to get pregnant kept changing (1 points) DK

Rocca et al.: Measuring pregnancy planning
330 http://www.demographic-research.org
Item
4
(wan
t) Now I am going to ask you a question and there are 3 possible responses to it. Please choose the one option that is applicable to you and tell me. Again think about the time just before you became pregnant and say… READ RESPONSES 1-3 ONLY (MARK ONLY ONE RESPONSE) …you wanted to have a baby (2 points) …you had mixed feelings about having a baby (1 points) …you did not want to have a baby (0 points) DK
Item
5
(dis
cuss
)
Now I am going to ask you a question and there are 3 possible responses to it. Please choose the one option that is applicable to you and tell me. Now think about you and your husband before you became pregnant. Would you say… READ RESPONSES 1-3 ONLY (MARK ONLY ONE RESPONSE) …you and your husband had agreed that you would like for you to be pregnant (2 points) …you and your husband had discussed having children together, but hadn’t agreed for you to get pregnant (1 points) …you and your husband had never discussed having children together (0 points) DK
Item
6
(pre
pare
)
Before you became pregnant, you did the following things in preparation for pregnancy: READ ALL RESPONSES AND CHECK ALL THAT APPLY …took vitamins …stopped or cut down on smoking, drinking, or eating paan leaves …changed your diet, such as ate more healthfully or avoided hot foods …sought medical or health advice or information about pregnancy …saved money for medical expenses …took some other action: ______________ (Add checked responses. Score is 0 checks=0 points, 1 check=1 point, ≥2 checks=2 points.)

Demographic Research: Volume 23, Article 11
http://www.demographic-research.org 331
Appendix 2: Comparison of Classical Test Theory (CTT) and Item Response Modeling approaches (IRM)
CTT IRM Purpose To develop measures of latent constructs (abilities or attitudes) and test their
reliability and validity Theoretic Foundation
Respondents are given a level or amount of a characteristic based on their raw score across all items. Assumed that each person has a “true score” or true value on a latent construct; we try to measure that true score by eliminating as many of the sources of error as possible (Xobs = T + E).
Uses item responses to create a linear (logit) scale of less to more of the latent ability or attitude. Item locations are modeled to be independent of respondent locations; any respondent at any location has an estimated probability of endorsing that item. Resulting scale interpreted as indicating the probability that a respondent with a particular estimated location will endorse a given item. Can compare relationship between person location and item location on the scale.
Focus “Score” focused approach. Scores based on adding up responses. All results are at the instrument level.
“Item” focused approach. Probability of a response to item I is modeled as a function of θ; (respondent level) and δ (item level). Results are at the item and instrument levels.
Model Choice No model choice. Always Xobs = T + E. See Appendix 3.
Many models available. Common Models: Basic Rasch Model, Rating Scale, Partial Credit, 2PL. Can compare models of increasing complexity using deviance-based tests. See Appendix 3.
Outcome Space / Response Categories
Generally requires response categories to be the same between items and assumes meaning of difference between two adjacent response categories is the same within and across items.
Allows items to have different numbers and types of response categories. Does not assume meaning of difference between two adjacent response categories is the same within or across items.

Rocca et al.: Measuring pregnancy planning
332 http://www.demographic-research.org
Errors Aggregated error available for entire test or survey. Often treats the raw scores linearly and assumes same error throughout range, which can bias statistical methods based on that assumption.
Errors for each item, response category threshold, and person location are available. Error varies over range of scale, with lower error in areas with greater item coverage.
Use of Raw scores
Raw scores are used to compute statistics (means, variances, reliability coefficients, item discrimination measures, total scores, errors for overall score).
Raw scores are used to estimate item and respondent parameters and all standard errors. (SE). These parameters are used to calculate the equivalent statistics from CTT, in addition to others such as the SE at different locations across range. The focus on items in IRM allows for more extensive assessment of: the coverage of content of the instrument and the functioning of response categories.
Evaluation of Item Fit
Cannot evaluate fit of items. (“Item Analysis” is more model fit).
Can assess fit statistics for individual items (weighted mean square values by item; t statistics) and response categories (item curves). Helps designer identify problems (i.e. multidimensionality).
Item “order” Rank of “difficulty” of item based only on frequency of endorsement. Total score on scale has no interpretable meaning.
Item “difficulty” explicitly ranked, allowing one to assess the validity of the scale in a new way. Ordered item and respondent location allows researcher to interpret meaning of individual scores.
Evaluation of Person Fit
Difficult to identify individuals who provide unusual response patterns because one is limited to a person’s final score.
Can identify individuals for whom the estimated location was not sufficient to convey an adequate summary of their set of responses (i.e. unusual response patterns). Helps alert designer to alternative points of view.
Meaning of a person score
Final person score meaningful only relative to other respondents (ie percentile).
Final person score meaningful across populations of respondents. That is, item parameters are not biased by the population distribution.
Visual Assessment
Not available. Respondent, item and threshold locations can be assessed visually (Wright Map). This allows researcher to see if thresholds cover respondent locations.
Source: Based upon and adapted from Wilson et al, 2006.
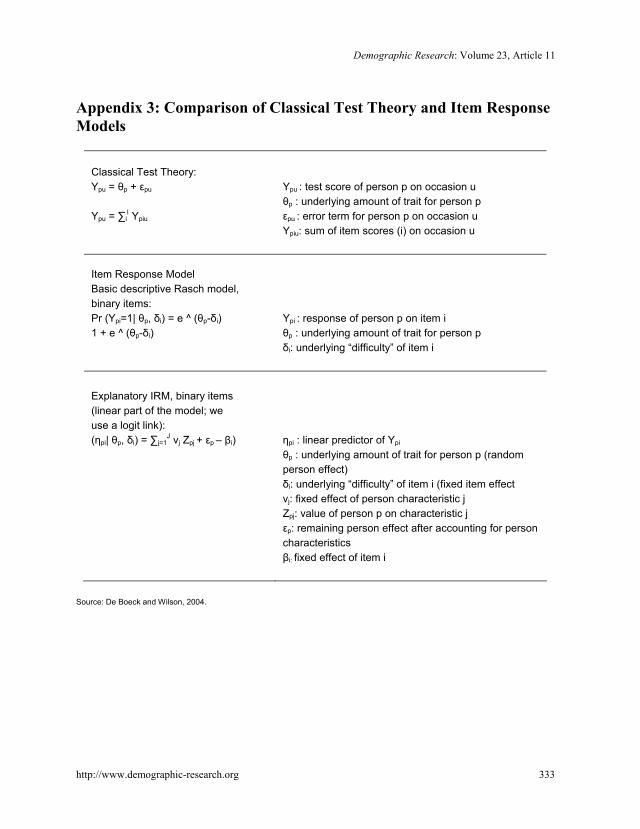
Demographic Research: Volume 23, Article 11
http://www.demographic-research.org 333
Appendix 3: Comparison of Classical Test Theory and Item Response Models
Classical Test Theory:
Ypu = θp + εpu
Ypu = ∑i
I Ypiu
Ypu : test score of person p on occasion u θp : underlying amount of trait for person p εpu : error term for person p on occasion u Ypiu: sum of item scores (i) on occasion u
Item Response Model
Basic descriptive Rasch model, binary items:
Pr (Ypi=1| θp, δi) = e ^ (θp-δi) 1 + e ^ (θp-δi)
Ypi : response of person p on item i θp : underlying amount of trait for person p δi: underlying “difficulty” of item i
Explanatory IRM, binary items (linear part of the model; we use a logit link):
(ηpi| θp, δi) = ∑j=1J νj Zpj + εp – βi)
ηpi : linear predictor of Ypi
θp : underlying amount of trait for person p (random person effect) δi: underlying “difficulty” of item i (fixed item effect νj: fixed effect of person characteristic j Zpj: value of person p on characteristic j εp: remaining person effect after accounting for person characteristics βi: fixed effect of item i
Source: De Boeck and Wilson, 2004.

Rocca et al.: Measuring pregnancy planning
334 http://www.demographic-research.org