Malito, D. V. (2014) Measuring sustainability: benefits and pitfalls of fiscal sustainability...
34
RSCAS 2014/77 Robert Schuman Centre for Advanced Studies Global Governance Programme-120 Measuring Sustainability: Benefits and pitfalls of fiscal sustainability indicators Debora Valentina Malito
Transcript of Malito, D. V. (2014) Measuring sustainability: benefits and pitfalls of fiscal sustainability...

RSCAS 2014/77 Robert Schuman Centre for Advanced Studies Global Governance Programme-120
Measuring Sustainability: Benefits and pitfalls of fiscal
sustainability indicators
Debora Valentina Malito


European University Institute
Robert Schuman Centre for Advanced Studies
Global Governance Programme
Measuring Sustainability: Benefits and pitfalls of fiscal
sustainability indicators
Debora Valentina Malito
EUI Working Paper RSCAS 2014/77

This text may be downloaded only for personal research purposes. Additional reproduction for other
purposes, whether in hard copies or electronically, requires the consent of the author(s), editor(s).
If cited or quoted, reference should be made to the full name of the author(s), editor(s), the title, the
working paper, or other series, the year and the publisher.
ISSN 1028-3625
© Debora Valentina Malito, 2014
Printed in Italy, July 2014
European University Institute
Badia Fiesolana
I – 50014 San Domenico di Fiesole (FI) Italy
www.eui.eu/RSCAS/Publications/
www.eui.eu
cadmus.eui.eu

Robert Schuman Centre for Advanced Studies
The Robert Schuman Centre for Advanced Studies (RSCAS), created in 1992 and directed by Brigid
Laffan since September 2013, aims to develop inter-disciplinary and comparative research and to
promote work on the major issues facing the process of integration and European society.
The Centre is home to a large post-doctoral programme and hosts major research programmes and
projects, and a range of working groups and ad hoc initiatives. The research agenda is organised
around a set of core themes and is continuously evolving, reflecting the changing agenda of European
integration and the expanding membership of the European Union.
Details of the research of the Centre can be found on:
http://www.eui.eu/RSCAS/Research/
Research publications take the form of Working Papers, Policy Papers, Distinguished Lectures and
books. Most of these are also available on the RSCAS website:
http://www.eui.eu/RSCAS/Publications/
The EUI and the RSCAS are not responsible for the opinion expressed by the author(s).
The Global Governance Programme at the EUI
The Global Governance Programme (GGP) is research turned into action. It provides a European
setting to conduct research at the highest level and promote synergies between the worlds of research
and policy-making, to generate ideas and identify creative and innovative solutions to global
challenges.
The GGP comprises three core dimensions: research, policy and training. Diverse global governance
issues are investigated in research strands and projects coordinated by senior scholars, both from the
EUI and from other internationally recognized top institutions. The policy dimension is developed
throughout the programme, but is highlighted in the GGP High-Level Policy Seminars, which bring
together policy-makers and academics at the highest level to discuss issues of current global
importance.The Academy of Global Governance (AGG) is a unique executive training programme
where theory and “real world” experience meet. Young executives, policy makers, diplomats,
officials, private sector professionals and junior academics, have the opportunity to meet, share views
and debate with leading academics, top-level officials, heads of international organisations and senior
executives, on topical issues relating to governance.
For more information: http://globalgovernanceprogramme.eui.eu


Abstract
The concept of sustainability emerged on the global governance agenda during the 1970s, when, the
economic crisis put the spotlight on environmental and social risks associated with economic growth.
Although much has been written about it, the literature on pillars, dimensions and measures of
sustainability has developed quite independently from the discussions on the idea of sustainability as a
set of interlinked and interdependent concentric thematic circles (that is its environmental, social,
economic and institutional dimensions). Beginning with this conceptual debate, the present paper
argues that indicators of fiscal sustainability are caught between demands of a solvency criterion and
the principles of inter- and intra-generational equity. Bypassing their function as a mere representation
of reality, these indicators have played a key role in de facto regulating the current fiscal crisis and in
eclipsing the other dimensions of sustainability. To discuss this argument, the paper’s first section
explores the literature on sustainability indicators and composite indices of sustainable development.
Its second part focuses on indicators of fiscal sustainability evaluating concepts, measures and
demands. The third part gives insight into two measures, the United Nations’ (UN) Debt to GNI ratio
and the European Union’s (EU) fiscal sustainability gap indicators. The fourth part concludes by
summarising conceptual, normative and ontological questions.
Keywords
Economic and Financial Crisis , Sustainable Public Finances, Sustainable Development, GDP, Debt.


1
Introduction
The concept of sustainability emerged on the global governance agenda during the 1970s when the
downturns in the global economy put the spotlight on environmental and social risks associated with
economic growth (Meadows, Meadows, Randers, & Behrens, 1972). In the mid-70s an inflationary
crisis gripped advanced economies, while the oil crisis and sovereign debt defaults loomed
respectively in emerging and developing countries. The empirical reality of the crisis gave rise to new
ideological and policy debates that all centred on the idea of promoting a responsible market economy,
aware of the social and environmental trade-offs accompanying economic growth. A special emphasis
of the debate back then was laid on the long-term consequences of the depletion of natural resources.
The hour of birth of the conceptual debate on sustainable development was its definition by the
United Nations (UN) through the World Commission on Environment and Development’s crucial
1987 Brundtland report. With this report, the concept entered into the global governance debate,
acquiring international recognition and relevance for the first time. The report defined development as
sustainable when it satisfied the requirements of inter-generation equity and availability1.
Since the Brundtland report, a plethora of definitions, conceptualisations and operationalisations
broadened the debate. In 1992, the UN Conference on Environment and Development in Rio de
Janeiro concretised the concept by formulating a related political action plan known as the Agenda 21
(United Nations, 1992). ‘Rio 1992’ was followed by several global conferences on the topic leading to
the UN Millennium Summit in 2000 that launched and established eight development goals, the 7th of
which comprised the need to integrate ‘the principles of sustainable development into country policies
and programs’ (ibidem). Between 2001 and 2002, the World Bank, the UN Environment Programme
(UNEP) and the International Monetary Fund (IMF) initiated cooperating on the report ‘Financing for
Sustainable Development’ that served as an input to the 2002 World Summit on Sustainable
Development.
Notwithstanding the growing public and academic interest, sustainability remained a blurry,
contested and inconsistent concept ever since. The expanding body of literature and metrics of
sustainability made it increasingly open to a wide range of interpretations, which were essential to
produce new policy interventions allowing for a certain degree of discretion in the decision-making
process. While multidimensional perspectives led to a broad conceptual debate, the production of
metrics of sustainability developed rather independently from the conceptual framing. Within the
production of sustainability measures, the concept of sustainability clashed with established measures
of economic growth (Meadows et al., 1972) in so far as it appeared evident that classical indicators,
like GDP, would not provide an ‘adequate indication of sustainability’ (United Nations, 1992), nor of
well-being. Further developing the principle of inter-generational equity addressed by the Brundtland
report, scholars hence introduced an intra-generational element, based on the assumption that
sustainability is a multidimensional and long-term process in which the economic, political, social and
the temporal components were interdependent and mutually influential.
Still today, more than 25 years after its baptism, sustainability is an ubiquitous concept (Castro,
2004). On the one hand, the conceptual separation between ‘sustainability’ and the normative
definition of a ‘sustainable development’ has stimulated a fragmentation into separate ‘pillars of
sustainability’ (the environmental, social, economic and institutional dimensions). On the other hand,
the definitional ambiguity has even been complicated by normative and policy implications when it
comes to the construction of indicators. So, while there is a lack of agreement about the definition of
1 ‘Sustainable development is a Development that meets the needs of the present without compromising the ability of
future generations to meet their own needs’ (United Nations, 1987).

Debora Valentina Malito
2
sustainability and sustainable development, there is larger consensus about the type of policies
required to promote sustainable patterns of development, based on the neo-liberal economic policy
paradigm. In contrast to the generally multidimensional definition of sustainability, metrics of
sustainability are strongly rooted in the logics of the neoclassical economic growth theory (Solow,
1956, 1974). In the same vein, policy demands deriving from the sustainability discourse embrace the
priorities of the neo-liberal agenda: from deregulation and liberalisation of markets (International
Monetary Fund, 2002) to the privatisation of formerly public organisations or services (Huffschmid,
2005, 2008).
On the background of these considerations, the present paper analyses the production of
sustainability measures, particularly focusing on measures of fiscal sustainability. It aims to
contextualise the discourse about sustainability, especially in view of normative demands and
implications related to its prescriptive character. The remainder of this paper is organised as follows:
section 1 explores the literature on sustainability indicators and composite indices of sustainable
development by focusing on different pillars of sustainability (1.1); concepts of development and well-
being (1.2); the approaches of weak or strong sustainability (1.3); and on connections with neoclassic
growth theories (1.4). Section 2 discusses measures of fiscal sustainability evaluating concepts (2.1);
metrics (2.2.); and demands (2.3) for such indicators. Section 3 presents an in-depth analysis of two
measures, the UN’s Debt to GNI ratio and the EU’s fiscal sustainability gap indicators. Section 4
concludes by summarising conceptual, normative and ontological questions.
1. Measuring sustainability and sustainable development
Between 1990 and 2000, a growing demand for sustainability indicators could be witnessed at both
national and global level. The first important initiative to measure sustainable development was
undertaken in 1992 by the UN’s Commission on Sustainable Development (UNCSD). After the 1992
Rio conference and the subsequent call for sustainable development indicators within Agenda 21, the
UNCSD published a list of 140 indicators, grouped into four thematic frameworks: the social, the
economic, institutional and environmental components (United Nations, 2001). The third edition of
the dataset presents 96 indicators, no longer grouped into four pillars, but into 14 themes2. After this
first initiative, a galaxy of sustainability indicators emerged and many international organisations
engaged in the development of their own sustainability indicators: in 1997, for instance, the OECD
launched a sustainable development initiative that culminated in a set of indicators used within the
OECD economic surveys and the Environmental Performance Reviews to monitor member countries’
environmental performance. While the first OECD initiative was characterised by a strong
environmental focus3, in 2004 the organisation announced the need to create indicators based on a
‘Capital Approach’ able ‘to reserve or conserve wealth in its different components’ (Strange &
Bayley, 2008) by maximising different types of capital.
In the late 1990s, also many national governmental and non-governmental actors produced their
own sustainability indicators. Among them the ‘Barometer of Sustainability’ developed by the World
Conservation Union (IUCN) and the International Development Research Centre (IDRC) in Canada,
the ‘Canadian Index of Wellbeing’, the British ‘Measuring National Well-Being’, the ‘Gross National
Happiness Index’ of Bhutan, the Thai ‘Sustainable Development Index’, the Korean ‘Sustainable
Development Index Resource’, the ‘Environmental Performance Index’ for China, and the Malaysian
‘Quality of Life Index’. Moreover, the UN Environmental Programme’s ‘Mediterranean Action Plan’
2 Poverty; Governance; Health; Education; Demographics; Natural hazards; Atmosphere; Land; Oceans, seas and coasts;
Freshwater; Biodiversity; Economic development; Global economic partnership; Consumption and production patterns. 3 These indicators included: reducing emissions of greenhouse gas; reducing air pollution; water pollution; improving
natural resources management; reducing and improving the management of municipal waste; improving living conditions
in developing countries; and ensuring sustainable retirement income.

Measuring Sustainability: Benefits and pitfalls of fiscal sustainability indicators
3
(MAP) launched a regional project to construct metrics of sustainable development in the
Mediterranean area.
In 2000, the UN launched the ‘Millennium Development Goals’ (MDGs), an ambitious initiative to
stimulate the achievement of 15 global development aims. Many institutional interests and efforts in
the field of sustainability were bundled and integrated into the so-called ‘Millennium Project’, aimed
at formulating a set of strategies to meet the 15 targets (United Nations, 1990). The Inter-Agency and
Expert Group on the MDG Indicators, led by the Department of Economic and Social Affairs of the
UN’s Secretariat, united experts from the most important international organisations (UN, IMF, WB,
WTO and OECD) to formulate indicators for monitoring progress towards the MDGs.
In 2001, also the EU established a sustainable development strategy in which the construction of
sustainability indicators was considered pivotal to implement member states’ related strategies. This
initiative resulted in 2005 in the formulation of 140 indicators grouped in eleven themes. These
indicators are used to monitor EU member states’ compliance with the EU ‘Strategy for Sustainable
Development’.
The growing demand for ‘measures of the immeasurable’ (Bell & Morse, 2008) were accompanied
by a conceptual transformation (Warhurst, 2002) of sustainability. On the one hand, indicators of
sustainability were integrated in a broad variety of measures ranging from development indices, over
market and economy-based indices to ecosystem and welfare-focused measures (Singh, Murty, Gupta,
& Dikshit, 2009). On the other hand, different institutions and stakeholders produced mono-
dimensional metrics of sustainability, disaggregating the original idea of an integrated model of
sustainable development. Both trends underline the need for an encompassing perspective on
sustainability to balance the dynamics of the capitalist system in view of the depletion of natural and
human resources with concerns of managing and safeguarding the latter for future generations. First,
the division of the sustainability discourse into ‘pillars of sustainability’ has yet also diminished the
idea of sustainability as a set of interlinked and interdependent concentric circles. Following this trend
towards isolating priorities, social scientists define social sustainability as the ability to maintain
human capital. Economists define an economy as sustainable if the system affords the monetary
resources necessary to provide services, to satisfy community needs and to generate economic growth.
Ecologists focus on environmental sustainability that implies maintaining natural capital. As result,
sectorial indicators of social sustainability do not necessarily take into account the trade-offs between
natural and social needs; and indicators of economic sustainability often erode the margins claimed by
ecologists to safeguard the environmental equilibrium. Passing from conceptual interdependence
towards independence, this trend has gradually promoted the formation of separate ‘markets of
sustainability’ (Heal, 1999) in which the economic, social and environmental dimensions became
independent assets of the survival of the contemporary neo-liberal mode of production4.
Second, taking up the logics of these separate markets, institutions and stakeholders have
incorporated sustainability concerns into the production of their goods and the delivery of their
services, by creating new ‘market opportunities’ (Heal, 1999) to reduce the negative externalities of
the economic market production5. In this context, sustainable development is seen as ‘central to
strategic positioning and competitive advantage, a key component in future economic success and
market value’ (Rowledge, James, Barton, & Brady, 1999). For many stakeholders and institutions, the
4 According to Heal, the market plays a complex role: ‘it determines which resources are converted by technologies to
goods and services that satisfy peoples preferences: It also manages the resource base, in the sense that if a resource is
scarce its price rises, reducing use and providing incentives to search for more’ (Heal, 1999:83). 5 According to Sutton (1997) this sort of incorporation is facilitated given that ‘there is something about the basic structure
of the market which, until it is changed, makes it hard to have an environmentally sustainable economy. If firms want to
help bring about ecological sustainability they need to not only produce the greenest products that are possible at any
particular point in time, but they need to contribute to the restructuring of the market itself to favour sustainability eg.
through ecotax and eco-investment strategies.’

Debora Valentina Malito
4
commitment to sustainability has been justified by the need of creating ‘more efficient and liquid
markets for environmental products and services’(“Environmental markets,” 2014). While
sustainability concerns created new demands6 (Heal, 1999) the formation of such markets of
sustainability is yet also part of the neo-liberal mode of production (Castro, 2004; Krever, 2013; Kumi,
Arhin, & Yeboah, 2013) that gives special emphasis on the liberalisation of the economy. According
to the UN, ‘free market mechanisms’ on the one hand make a positive contribution to sustainable
development, on the other they stimulate the formulation of a compensative mechanism, ‘in which the
prices of goods and services should increasingly reflect the environmental costs of their input,
production, use, recycling, and disposal subject to country-specific conditions’ (United Nations, 1992).
Following this argument, sustainability has been conceptualised as a way to compensate the
deterioration of non-renewable resources by introducing technological inputs or by improving capital
productivity. This approach, however, does not aim to redeem unsustainable patterns of consumption
and production. Quite the contrary, it tends to mitigate and regulate the externalities of the existing
economy through the imposition of regulatory pressures (Rowledge et al., 1999).
1.1 Pillars of sustainability
Indicators to measure sustainability can be analysed on the basis of their structure, content,
methodological choices and theoretical foundations. As illustrated in Table 1, several sustainability
indicators have been formulated to refer to the social, economic, and environmental dimensions of
sustainability. Some integrate all of these dimensions. While others have used the concept of
sustainability to measure the quality or improvement of data related to human capital, well-being or
development. The ‘Human Development Index’ for instance, measures human development as an
aggregate of social and economic elements, such as life expectancy and income, while the Human
Development Report takes into account also environmental factors including carbon dioxide emissions
per capita or change in forest area. The ‘Barometer of Sustainability’7, for instance uses the concept of
sustainability to measure well-being and comprises data for both socio-economic well-being and
ecosystem preservation. Following the same approach, the Joint UNECE/OECD/EUROSTAT
Working Group on Statistics for Sustainable Development (WGSSD) also elaborated a composite
measure of sustainability.
Among the most prominent environmental sustainability indices are the ‘Ecological Footprint’
calculated by the Global Footprint Network, the ‘Environmental Sustainability Index’ (ESI) launched
by the World Economic Forum (WEF) and the ‘Living Planet Index’, developed by WWF in 1998.
Metrics of sustainability focusing on the social dimension of SD include the ‘Human Development
Index’ (HDI), launched in 1997 by the UN Development Programme (UNDP). Metrics of economic
sustainability include inter alia the ‘Genuine Savings’ and the ‘Index for Sustainable Economic
Welfare’ (ISEW) (the current ‘Genuine Progress Indicator’ (GPI)). ISEW and GPI are generally
considered hybrid metrics of sustainability including data such as income inequality and costs of
crime, hence focusing on both the social and economic dimension of sustainability.
6 ‘Water is a good for which individuals or municipalities are willing to pay. They are willing to pay for quality as well as
quantity, and this in effect puts a price on the water management and purification services provided by a watershed. It
generates an indirect demand, what economists call a derived demand, for watersheds’ (Heal, 1999: 59). 7 The ‘Barometer of Sustainability’ is part of the ‘Resource Kit for Sustainability Assessment’ developed by the
International Union for the Conservation of Nature (IUCN) M&E Initiative with support from the International
Development Research Centre (IDRC).

Measuring Sustainability: Benefits and pitfalls of fiscal sustainability indicators
5
Table 1. Metrics of Sustainable Development
Pillar Provider Measure
Indices of sustainable
development
United Nations UNDP
UN Sustainable Development Indicators Human Development Index (HDI)
Centre for Environmental Strategy (CES) and the New Economics Foundation (NEF)
Index of sustainable and economic welfare (ISEW)
European Commission EU Sustainable Development Indicators
Indicators of sustainability
Environment-based
Yale University's Center for Environmental Law and Policy Columbia University's Center for International Earth Science Information Network (CIESIN), World Economic Forum
Environment Sustainability Index
RobecoSAM Sustainability Performance Index
WWF Living Planet Index
Global Footprint Network Ecological Footprint (EF)
ITT Flygt Sustainability Index
Environmental RiskRating ECCO-CHECK Index
US environmental Protection Agency Environment Quality Index
United Nations Environmental Program Environmental Vulnerability Index
Social-based UNDP Gender Empowerment Measure
Overseas Development Council Physical Quality of Life Index
Gallup-Healthways Well-Being Index
Sustainable Society Foundation Index for sustainable society
Economic-based
European Commission Internal Market Index
IFO Institute for Economic Research Business Climate Indicator
European Central Bank European Labour Market Indicators
OECD Composite Leading Indicators
World Bank Genuine Savings (GSs)
UNEP Composite sustainable development index
Debora Valentina Malito
6
Among the measures that integrate different pillars of sustainability, the ‘Genuine Progress Index’
(GPI), for instance, has been developed as a metric for well-being going beyond the constraints of the
narrow GDP approach as it incorporates environmental and social factors not captured by the original
GDP indicator. Also the ‘Sustainable Society Index’ (SSI) and the ‘Legatum Prosperity Index’
constitute such hybrid indices of sustainability: while the first includes both indicators of
environmental and social sustainability, the second incorporates a wide array of factors in terms of
wealth, economic growth and quality of life.
Yet, although there are such initiatives creating or refining measures of sustainability in a
polycentric perspective, several scholars have concluded that only a few of them privilege a fully
integrated approach (Bossel & Balaton Group, 1999) that takes into account features and thresholds
deriving from all dimensions of sustainability. Following such a more integrated, yet not fully
comprehensive approach, the ‘Sustainable Progress Index’, for instance, is designed as a metric for
biodiverse sustainability measuring the total land area required to maintain the natural capital stock
(food, water, energy and waste-disposal demands) per person, per product or per city. As such, it is a
more comprehensive indicator that, however, does not capture the social dimension of sustainability.
The ‘Index of Sustainable Economic Welfare’ indeed takes into account social and environmental
components, but not economic indicators. While the UN Development Programme’s ‘Human
Development Indicator’ (HDI) includes the three welfare components health, education and income, it
does not intensively take into account environmental factors. For this reason, in 2010, UNEP
introduced also a series of environmental indicators, like the Carbon dioxide emission per capita and
change in forest area into the Human Development Report, that were not included previously.
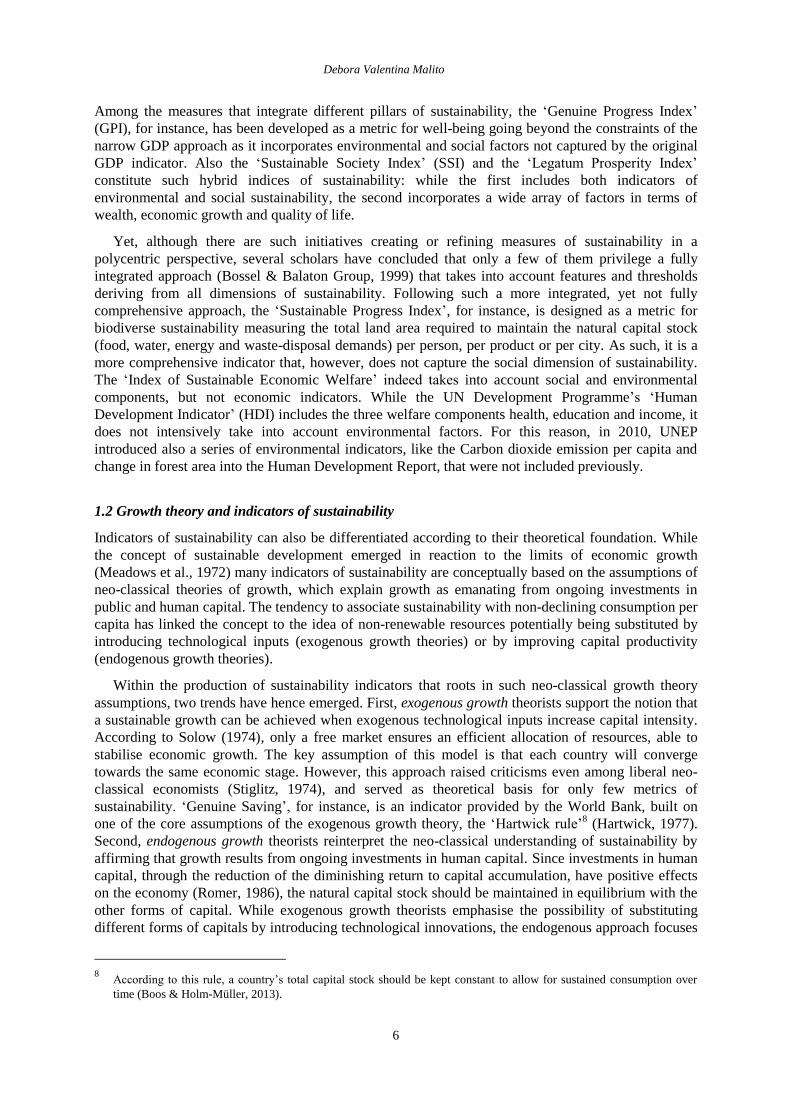
1.2 Growth theory and indicators of sustainability
Indicators of sustainability can also be differentiated according to their theoretical foundation. While
the concept of sustainable development emerged in reaction to the limits of economic growth
(Meadows et al., 1972) many indicators of sustainability are conceptually based on the assumptions of
neo-classical theories of growth, which explain growth as emanating from ongoing investments in
public and human capital. The tendency to associate sustainability with non-declining consumption per
capita has linked the concept to the idea of non-renewable resources potentially being substituted by
introducing technological inputs (exogenous growth theories) or by improving capital productivity
(endogenous growth theories).
Within the production of sustainability indicators that roots in such neo-classical growth theory
assumptions, two trends have hence emerged. First, exogenous growth theorists support the notion that
a sustainable growth can be achieved when exogenous technological inputs increase capital intensity.
According to Solow (1974), only a free market ensures an efficient allocation of resources, able to
stabilise economic growth. The key assumption of this model is that each country will converge
towards the same economic stage. However, this approach raised criticisms even among liberal neo-
classical economists (Stiglitz, 1974), and served as theoretical basis for only few metrics of
sustainability. ‘Genuine Saving’, for instance, is an indicator provided by the World Bank, built on
one of the core assumptions of the exogenous growth theory, the ‘Hartwick rule’8 (Hartwick, 1977).
Second, endogenous growth theorists reinterpret the neo-classical understanding of sustainability by
affirming that growth results from ongoing investments in human capital. Since investments in human
capital, through the reduction of the diminishing return to capital accumulation, have positive effects
on the economy (Romer, 1986), the natural capital stock should be maintained in equilibrium with the
other forms of capital. While exogenous growth theorists emphasise the possibility of substituting
different forms of capitals by introducing technological innovations, the endogenous approach focuses
8 According to this rule, a country’s total capital stock should be kept constant to allow for sustained consumption over
time (Boos & Holm-Müller, 2013).

Measuring Sustainability: Benefits and pitfalls of fiscal sustainability indicators
7
on the idea of compensating environmental or social dysfunctions by providing investments in human
capital. Here, contrary to the exogenous approach, technology is no longer an exogenous variable, but
an endogenous component stemming from increased investments in formation and education. This
endogenous model of growth establishes a threshold under which natural capital cannot be exploited.
It is however still possible to maintain, or even raise, the economic value of the stocks by enforcing a
positive exploitation, that is to provide a monetary compensation for the erosion of essential natural
resources.
The endogenous model of growth builds the foundation of many contemporary metrics of
sustainability: the ISEW or the ‘Genuine Progress Index’ include inter-generational equity
considerations based on the idea of balancing the deterioration of physical capitals by increasing
investments in human capital (like education or health spending). Also the ‘Human Development
Index’ is based on the extension of Lucas’ model of endogenous growth theory that, including the
standard of living, education and health in its utility function, postulates that human capital raises the
productivity of both physical and human capital.
1.3 Strong versus weak sustainability, monetary and physical indicators
In terms of further categorising we can explore the debate between strong and weak approaches to
sustainability. The approach of strong sustainability assumes that natural resources are limited and not
entirely substitutable with other forms of capital (Neumayer, 2004). In line with the idea of non-
decreasing natural capital, a minimum level below which capital stocks should not be allowed to fall
exists, and it is critical to define the amount of natural capital that cannot be substituted by capital
productivity.
Contrary to this, the approach of weak sustainability (Pearce & Atkinson, 1993) assumes that it is
possible to substitute natural capital by other forms of capital. Pearce and Atkinson (ibidem: 105) have
introduced the idea that ‘an economy is sustainable if its savings rate is greater than the combined
depreciation rate on natural and man-made capital’. Here, the erosion of natural capital does not
receive particular attention. Sustainability is expressed as a constant portion of consumption per capita
for an infinite amount of time, where the non-declining total capital stock is a result of maintaining the
country’s savings higher (or equal) than the total depreciation of all the forms of capital.
While the strong sustainability approach has usually been associated to ecological theories, the
concept of weak sustainability defines the environment as a renewable natural resource and resembles
‘a by-product of growth theory with exhaustible resources’ (Cabeza Gutés, 1996). The theoretical
difference between weak and strong sustainability indicators is supported by different methodological
choices in view of the adoption of either physical or monetary aggregation. The monetary aggregation
method supports the notion that the measurement of all capital stocks may be realised by using a
common unit, a monetary one. On the other side, the supporters of the strong approach to
sustainability have privileged the formulation of physical measures.
In view of this divide, monetary-focused indicators and indices measuring sustainability include:
‘Genuine Savings’ or total national wealth, the ‘Measure of Economic Welfare’ (MEW), the ‘Index of
Social Progress’ (ISP), the ‘Physical Quality of Life Index’ (PQLI), the ‘Economic Aspects of
Welfare’ (EAW), GDP and ‘Index for Sustainable Economic Welfare’ (ISEW). Physical indicators are
included in measures like the ‘Ecological Footprint’, the ‘Sustainability Performance Index’, and the
‘Living Planet Index’.
Beyond this preference for physical or monetary indicators, a second methodological distinction
concerns the use of single data sources versus the aggregation of types of capital under a composite
indicator. Among the aggregate indicators of sustainability are the ‘Ecological Footprint’, ‘Human
Development Index’ (HDI), ‘Sustainable Progress Index’ (SPI), ‘Index for Sustainable Economic
Welfare’ (ISEW), ‘Genuine Progress Indicator’ (GPI), ‘Genuine Savings Indicator’ (GSI), ‘Barometer
Debora Valentina Malito
8
of Sustainability’, and the ‘Environmental Pressure Indicators’ (EPI). Among single data sources are
the ‘Sustainable Development Indicators’ developed and computed both by the UN and the European
Commission (EUROSTAT).
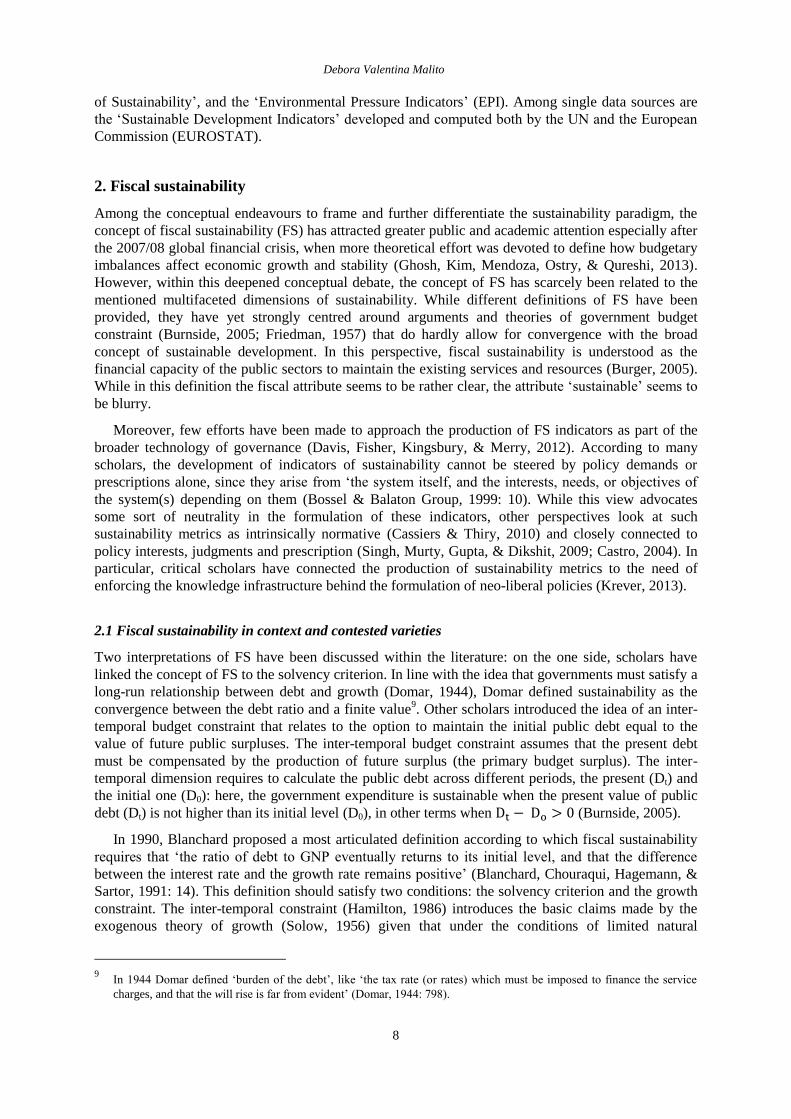
2. Fiscal sustainability
Among the conceptual endeavours to frame and further differentiate the sustainability paradigm, the
concept of fiscal sustainability (FS) has attracted greater public and academic attention especially after
the 2007/08 global financial crisis, when more theoretical effort was devoted to define how budgetary
imbalances affect economic growth and stability (Ghosh, Kim, Mendoza, Ostry, & Qureshi, 2013).
However, within this deepened conceptual debate, the concept of FS has scarcely been related to the
mentioned multifaceted dimensions of sustainability. While different definitions of FS have been
provided, they have yet strongly centred around arguments and theories of government budget
constraint (Burnside, 2005; Friedman, 1957) that do hardly allow for convergence with the broad
concept of sustainable development. In this perspective, fiscal sustainability is understood as the
financial capacity of the public sectors to maintain the existing services and resources (Burger, 2005).
While in this definition the fiscal attribute seems to be rather clear, the attribute ‘sustainable’ seems to
be blurry.
Moreover, few efforts have been made to approach the production of FS indicators as part of the
broader technology of governance (Davis, Fisher, Kingsbury, & Merry, 2012). According to many
scholars, the development of indicators of sustainability cannot be steered by policy demands or
prescriptions alone, since they arise from ‘the system itself, and the interests, needs, or objectives of
the system(s) depending on them (Bossel & Balaton Group, 1999: 10). While this view advocates
some sort of neutrality in the formulation of these indicators, other perspectives look at such
sustainability metrics as intrinsically normative (Cassiers & Thiry, 2010) and closely connected to
policy interests, judgments and prescription (Singh, Murty, Gupta, & Dikshit, 2009; Castro, 2004). In
particular, critical scholars have connected the production of sustainability metrics to the need of
enforcing the knowledge infrastructure behind the formulation of neo-liberal policies (Krever, 2013).
2.1 Fiscal sustainability in context and contested varieties
Two interpretations of FS have been discussed within the literature: on the one side, scholars have
linked the concept of FS to the solvency criterion. In line with the idea that governments must satisfy a
long-run relationship between debt and growth (Domar, 1944), Domar defined sustainability as the
convergence between the debt ratio and a finite value9. Other scholars introduced the idea of an inter-
temporal budget constraint that relates to the option to maintain the initial public debt equal to the
value of future public surpluses. The inter-temporal budget constraint assumes that the present debt
must be compensated by the production of future surplus (the primary budget surplus). The inter-
temporal dimension requires to calculate the public debt across different periods, the present (Dt) and
the initial one (D0): here, the government expenditure is sustainable when the present value of public
debt (Dt) is not higher than its initial level (D0), in other terms when (Burnside, 2005).
In 1990, Blanchard proposed a most articulated definition according to which fiscal sustainability
requires that ‘the ratio of debt to GNP eventually returns to its initial level, and that the difference
between the interest rate and the growth rate remains positive’ (Blanchard, Chouraqui, Hagemann, &
Sartor, 1991: 14). This definition should satisfy two conditions: the solvency criterion and the growth
constraint. The inter-temporal constraint (Hamilton, 1986) introduces the basic claims made by the
exogenous theory of growth (Solow, 1956) given that under the conditions of limited natural
9 In 1944 Domar defined ‘burden of the debt’, like ‘the tax rate (or rates) which must be imposed to finance the service
charges, and that the will rise is far from evident’ (Domar, 1944: 798).

Measuring Sustainability: Benefits and pitfalls of fiscal sustainability indicators
9
resources, capital accumulation cannot lead to persistent growth. Therefore, a technological factor
should be introduced to stimulate a sustainable growth.
As a second interpretation, already at the end of 1980s neo-classical economists began to
emphasise the need to keep the natural capital stock in equilibrium with other capital stocks (social
and economic). Barro and Romer elaborated a theory of endogenous growth in which technological
changes are no longer external to the production function, but determinant of growth since investments
in human capital increase capital productivity (Barro, 1991; Romer, 1986). According to this model,
public services serve ‘as input to private production’ (Barro, 1991:7). So, production can show
decreasing capital returns if the government inputs do not expand. Applying this model to the concept
of fiscal sustainability, the government is allowed to run budgetary imbalances leading to the emission
of public debt. The key implication of this approach is that sustainable growth is achieved not only by
the accumulation of physical capital, but by the formation of human capital, resulting from educational
spending.
This conceptualisation of FS derives from the ‘Capital Approach’ according to which fiscal
imbalances should be compensated by investments in human capital, increasing labour productivity
(Greenwood, 2001). The approach does hence not aim to reduce either the total fiscal imbalance, or
the causes leading states to be caught in fiscal imbalances. On the contrary, scholars and institutional
providers aim to establish thresholds against which legal and regulatory regimes can be monitored and
evaluated, in order to assess performances and define new prescriptions. Indicators, here, are pivotal to
define the threshold under which consumption should not be allowed to fall. Therefore, indicators are
‘valuable in designing policies to avoid consuming capital to support current consumption’ (ibidem),
but even in establishing the remuneration essential to balance the unsustainable behaviour.
Some scholars doubted the utility to equate solvency and sustainability, arguing that the concept of
sustainability should be extended beyond the limits of the solvency criterion (Artis & Marcellino,
2000). However, many institutions that prioritise addressing sovereign debt continue to equate FS with
solvency or debt sustainability. For the EU, fiscal sustainability relates to the ‘ability of a government
to assume the financial burden of its debt in the future. Fiscal policy is not sustainable if it implies an
excessive accumulation of government debt over time and ever increasing debt service’ (European
Union, 2012). In a similar vein, for the IMF10
, an ‘entity’s liability position is sustainable if it satisfies
the present value budget constraint without a major correction in the balance of income and
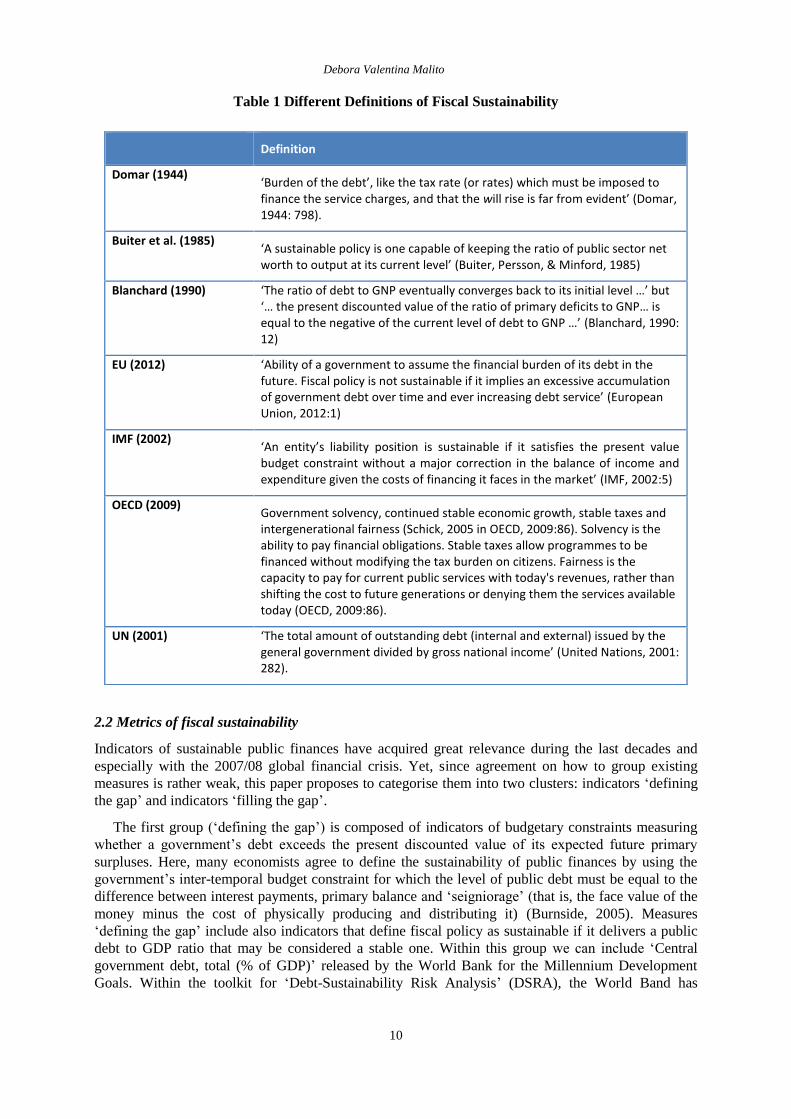
expenditure given the costs of financing it faces in the market’ (IMF, 2002). Table 1 summarises
different definitions of fiscal sustainability.
10
Tanner pointed out: ‘What is a sustainable fiscal policy? What is a sustainable trajectory for public debt? As a
prerequisite, a government must satisfy intertemporal solvency: it must raise enough resources (in present value terms) to
service its obligations so as to preclude either default or restructuring. In this vein, a “sustainable policy” may be one that,
if continued indefinitely and without modification, would keep the government solvent. A policy may be defined either as
some chosen primary surplus or some rule or reaction function, explicit or implicit. Alternatively, in cases of severe fiscal
stress, an ‘unsustainable’ situation may be one where the primary adjustment required to avoid a debt restructuring or
outright default is not feasible; conversely ‘sustainability’ would imply that the necessary adjustment is feasible’(Heal,
1999).
Debora Valentina Malito
10
Table 1 Different Definitions of Fiscal Sustainability
2.2 Metrics of fiscal sustainability
Indicators of sustainable public finances have acquired great relevance during the last decades and
especially with the 2007/08 global financial crisis. Yet, since agreement on how to group existing
measures is rather weak, this paper proposes to categorise them into two clusters: indicators ‘defining
the gap’ and indicators ‘filling the gap’.
The first group (‘defining the gap’) is composed of indicators of budgetary constraints measuring
whether a government’s debt exceeds the present discounted value of its expected future primary
surpluses. Here, many economists agree to define the sustainability of public finances by using the
government’s inter-temporal budget constraint for which the level of public debt must be equal to the
difference between interest payments, primary balance and ‘seigniorage’ (that is, the face value of the
money minus the cost of physically producing and distributing it) (Burnside, 2005). Measures
‘defining the gap’ include also indicators that define fiscal policy as sustainable if it delivers a public
debt to GDP ratio that may be considered a stable one. Within this group we can include ‘Central
government debt, total (% of GDP)’ released by the World Bank for the Millennium Development
Goals. Within the toolkit for ‘Debt-Sustainability Risk Analysis’ (DSRA), the World Band has
Definition
Domar (1944) ‘Burden of the debt’, like the tax rate (or rates) which must be imposed to finance the service charges, and that the will rise is far from evident’ (Domar, 1944: 798).
Buiter et al. (1985) ‘A sustainable policy is one capable of keeping the ratio of public sector net worth to output at its current level’ (Buiter, Persson, & Minford, 1985)
Blanchard (1990) ‘The ratio of debt to GNP eventually converges back to its initial level …’ but ‘… the present discounted value of the ratio of primary deficits to GNP… is equal to the negative of the current level of debt to GNP …’ (Blanchard, 1990: 12)
EU (2012) ‘Ability of a government to assume the financial burden of its debt in the future. Fiscal policy is not sustainable if it implies an excessive accumulation of government debt over time and ever increasing debt service’ (European Union, 2012:1)
IMF (2002) ‘An entity’s liability position is sustainable if it satisfies the present value budget constraint without a major correction in the balance of income and expenditure given the costs of financing it faces in the market’ (IMF, 2002:5)
OECD (2009) Government solvency, continued stable economic growth, stable taxes and intergenerational fairness (Schick, 2005 in OECD, 2009:86). Solvency is the ability to pay financial obligations. Stable taxes allow programmes to be financed without modifying the tax burden on citizens. Fairness is the capacity to pay for current public services with today's revenues, rather than shifting the cost to future generations or denying them the services available today (OECD, 2009:86).
UN (2001) ‘The total amount of outstanding debt (internal and external) issued by the general government divided by gross national income’ (United Nations, 2001: 282).

Measuring Sustainability: Benefits and pitfalls of fiscal sustainability indicators
11
developed both debt- and budget-related indicators providing for metrics to identify public-debt
vulnerabilities and risks. Under the same conceptual umbrella, the IMF has formulated the ‘Financial
Soundness Indicators’ comprising data on 12 core dimensions of fiscal vulnerability.
The second group (‘filling the gap’) defines fiscal sustainability by establishing ‘sustainable
thresholds’ and by measuring the gap that needs to be filled to reach a sustainable debt ratio. This
approach focuses on the relation between different variables, such as government revenue and
expenditure (Afonso, 2005), primary surplus and the initial public debt ratio (Bohn, 1995), the
evolution between present and future spending (the primary gap and the tax gap), or the target value of
debt established at the end of precise horizon to fill the original gap.
This second group of indicators includes, for instance, the ‘tax gap’ indicator computed by the
OECD and formulated by Blanchard (1990), the ‘Debt to GNI ratio’ computed by the UNCSD, the
‘Fiscal Sustainability’ gap indicators (S1 and S2 ‘Gap to the debt-stabilizing primary balance’)
provided by the European Commission within the EU’s Fiscal Sustainability Report, and the ‘Growth
rate of real GDP per capita’ provided by EUROSTAT as a metric for sustainable socio-economic
development within the Sustainable Development Indicators. Table 3 summarises these two typologies
of measures.

Debora Valentina Malito
12
Table 3 Indicators of Fiscal Sustainability
Type of indicator Provider Indices/Report Indicator
Indicators of budgetary constraints ‘Defining the gap’
-United Nations Commission on Sustainable Development -United Nations
-Indicators of Sustainable Development -Millennium Development Indicators
-Debt to GNI ratio -Central government debt, total (% of GDP)
EUROSTAT Sustainable Development Indicators
Growth rate of real GDP per capita
International Monetary Fund
Financial Soundness Indicators
World Bank -WBI -Debt-Sustainability Risk Analysis (DSRA)
-Central government debt, total (% of GDP); debt-to GDP ratio -Macroeconomic, budget, debt, variables
Indicators of sustainable thresholds ‘Filling the gap’
OECD OECD Method Sustainable gap quota (Blanchard, 1990)
European Commission
Fiscal Sustainability Report
S0 indicator, early detection of fiscal stress; S1 indicator, debt compliance risk; S2 indicator, ageing-induced fiscal risks
2.3 Criticisms
Most of the criticism related to measuring sustainability and fiscal sustainability concerns the
definitional incongruences; the selection of data; the construction of monetary, material or aggregate
measures (like normalisation and aggregation); and the comparability of different indices and
typologies of indicators. The following section addresses some of the conceptual, methodological and
ontological concerns raised in the literature.
2.3.1 Conceptual shortcomings
The present analysis follows the assumption that ‘disagreements on quantification choices are far more
than a methodological question’ (Thiry, 2011: 2). Following from this, one of the most important
criticisms related to FS indicators concerns their underdeveloped capacity to account for the
complexity of the sustainability discourse (Jollands, 2004), turning a blind eye to the concentric
relationship between the different dimensions of sustainability (Gustafsson, 1998).
For the further illustration of this criticism, two of the most applied approaches of indicators of FS
shall be analysed more in-depth: the ‘Generational Accounting’ and the ‘OECD method’.
‘Generational Accounting’ computes the fiscal adjustment required to satisfy the government’s inter-
temporal budget constraint. This method calculates the generational balance of public finance by
evaluating the difference between the present burden and that of a youngest generation (Langenus,
2006). In contrast to this understanding, Blanchard, as mentioned above, brought forward the idea of

Measuring Sustainability: Benefits and pitfalls of fiscal sustainability indicators
13
formulating new indicators11
of FS (Blanchard, 1990) that have been subsequently adopted by the
OECD; among them, Blanchard calculated the sustainable tax quota, a finite metric of FS, defined as a
the constant quota of taxes for all years considered in the time horizon.
The most important difference between the two approaches concerns the time horizon adopted: the
‘Generational Account’ adopts an infinite time horizon. Public finances are sustainable if, over an
infinite time horizon, the present value of the primary deficits
equals the initial Debt :
∑
Especially by adopting an infinite time horizon, this method does not violate the principle of inter-
generational constraint.
The tax gap indicator calculated by Blanchard and used by the OECD assumes that fiscal
sustainability is satisfied when the difference between the sum of the primary deficit ∑
and
the public debt
is equal to the initial Debt :
∑
Indicators of FS based on a finite time horizon, however, ‘violate’ (Benz & Fetzer, 2006) one of the
basic assumptions of the concept of sustainability. As observed by Balassone and Franco (2000), the
tax-gap ratio proposed by Blanchard faces two important shortcomings: ‘the arbitrary nature of the
choices required about the time horizon (n) and the target debt to GDP ratio at the end of the period
(d0)’.
2.3.2 Methodological shortcomings
The lack of a common (theoretical) understanding of sustainability contributed to the proliferation of a
broad variety of indicators and methodologies. In view of this range of differentiation, a first
methodological problem relates the selection of data and variables. Given the difficulty to collect data
on government assets, especially in developing countries, indicator providers often rely on a gross
measure of debt. Further difficulties emerge with regard to defining variables such as the gross or net
debt12
.
Moreover, the debt to GDP ratio does not seem to be a very reliable predictor of which country will
default or not. Balassone and Franco (2000) have addressed a problem of co-variation here. Also
according to Benz and Fetzer (2006) the evolution of the debt quota increases with the growth/interest
difference. According to Huang and Xie, indicators of debt-to GDP ratio are extremely sensitive to the
expenditure GDP ratio. This criticism holds an important policy implication, since several scholars
have criticised the meaningless (Huang & Xie, 2008) and the arbitrariness (Balassone & Franco, 2000)
11
Blanchard in 1990 brought forward the idea that no single indicator can answer the different questions raised by the
concept of fiscal sustainability. Hence, he proposed to construct four types of metrics: indicators of discretionary fiscal
policy, of sustainability, of fiscal impact and fiscal distortions (Blanchard, 1990). 12
As observed by Bassalone and Franco (2000:31): ‘As the assets owned by government can be sold to repay the debt, a net
debt measure may perhaps constitute a clearer benchmark (although the issue of the degree of liquidity of government
assets should also be taken into account). However, data on assets are often regarded as unreliable, especially those on
non-interest bearing assets, so that on practical grounds one may opt for a gross measure of debt.’

Debora Valentina Malito
14
of having a single criterion in Debt-to GDP ratio, as the one employed in the European Stability and
Growth Pact. This criticism is supported by a twofold empirical evidence. First, many countries
maintained a high public debt without falling into a financial crisis. And second, as noted by Huang
and Xie (Huang & Xie, 2008) ‘55 percent of the defaults in emerging markets occurred when the
public debt was below 60 percent of GDP, and 35 percent of the defaults occurred when the debt ratio
was less than 40 percent of GDP’
Furthermore, additional concerns have been raised about the reliance on a single or aggregate
methodology (Jollands, 2004). Different indices of sustainable development are based on an aggregate
methodology like the ‘Index of Sustainable Economic Welfare’ (ISEW), the ‘Genuine Progress
Indicator’, the ‘Ecological Footprint’ and the ‘Human Development Index’ (Neumayer, 2001). Among
the indicators of fiscal sustainability, one of the FS indicators computed by the EU (the S0) results
from an aggregation methodology, based on the ‘signal’ approach13
: the S0 is composed by 28 fiscal
and macro-financial variables collected by different surveys (AMECO, EUROSTAT, WEO and BIS).
The construction of composite indicators of FS has both strengths and weaknesses. On the one side,
the aggregate methodology is a simple approach, capable of incorporating and summarising many
variables and information, but also able to accommodate differences in data. By summarising
information, aggregate indicators are better suited to assist policy-makers in formulating their agenda.
On the other side, one can also argue that a large amount of information is lost (Meadows, 1998) or
distorted (Lindsey, Wittman, & Rummel, 1997) in the process of simplifying or aggregating different
components. Aggregation of data presents in fact the risk of creating space for discretion in policy-
making processes. Especially when institutions and practitioners use the indicators in a way that,
intentionally or not, ignores some methodological aspects that are indeed crucial to better understand
and contextualise the meaning of the numbers (Jollands, 2004).
Further criticism concerns the validity and robustness of the method employed to evaluate the
impact of demographic changes on public expenditure. During the last decades, many contributions
have carried out long-term analysis. However, a selection bias affects these long-term projections on
the future deterioration of fiscal balance. Simplistic or policy-oriented models often orient these
projections to demonstrate the impact of ageing on public expenses, but without taking into
consideration the impact of other relevant variables. Moreover, many of these analyses presuppose an
‘implausible’ absence of economies of scale (Balassone & Franco, 2000:40), assuming that the ‘age-
related per capita expenditure levels remains constant in real terms or in per capita GDP terms at the
initial level over the projection period’ (ibidem: 39).
2.3.3 Ontological criticisms
After the economic crisis of the 1970s, cutting existing welfare programmes has become a policy
imperative to deal with both the sustainability of growth and public finances. The formulation of FS
indicators has been sensitive to such neo-liberal policy prescriptions (Arza & Kohli, 2007) managing
the fiscal crisis in a way that reduces state responsibilities14
and establishes a new role for the market
in the provision of welfare.
The construction of FS indicators has been influenced by this potential policy prescription in a way
that compromises their function as simple instrument of social representation. FS indicators are based
13
‘The approach is designed to determine the optimal threshold as the one that maximizes the ability to predict fiscal stress
episodes based on the value taken by the variable in question’ (Berti, Lequien, & Salto, 2012) 14
As affirmed by Arza and Kohli (2007:4) ‘Pension schemes face increasingly stringent financial challenges, partly through
the combined demography of low fertility and increasing life expectancy, and partly through the stronger exposure of
national economies to global competition. But the translation of fiscal pressures into specific institutional changes owes
much to the new mainstream of economic thinking and lobbying about the need for welfare state retrenchment and the
merits of privatisation.’

Measuring Sustainability: Benefits and pitfalls of fiscal sustainability indicators
15
on long-term projections focusing on the impact of changes introduced by welfare reforms, even if
‘reforms curtailing pension benefits are implemented gradually and only display their full effects a
long time later’ (Holzmann, 1988) Long-term projections are justified by the assumption that
demographic changes are the only factors compromising public expenditures. This policy-oriented aim
has yet been criticised as empirically inconsistent. Indicators of FS are, for instance, pivotal to the
formulation of pension reforms through the introduction of capital funded pension systems and the
partial privatisation of public pay-as-you-go (PAYG) systems. International institutions like the OECD
and the World Bank, and most recently the EU have promoted such ‘reforms’15
as crucial for the
sustainability of public finance. However, recent studies (Zandberg & Spierdijk, 2010) did not find
any significant correlation between growth and a changed funding mechanism to pay pensions.
According to Zandberg and Spierdijk (considering 54 countries and including both OECD and non-
OECD member states), in the short-run there is no effect of changed pension funding on growth, while
in the long-run, there might only be a modest effect. Other scholars have pointed out that funded
pension systems have no positive effects on macro-economic variables in both emerging and
consolidated countries (Bosworth & Burtless, 2004). Additionally, Huffschmid pointed out that the
shift from public to private funding system are part of those financial innovation that are contributing
to destabilise the current economic and financial system, by expanding privatisations and undermining
the provision of public services (Huffschmid, 2005, 2008).
2.4 Demands for FS indicators
Even considering the absence of a homogeneous normative prescription to inform the demand for
metrics of sustainability, indicators of FS are increasingly open to policy demands arising from the
need to improve market regulation and reduce state intervention. Since market distortions create
vulnerabilities and discontinuities, the only valuable solution to fiscal vulnerabilities are viewed to be
the creation, or restoration, of conditions of perfect competition, resources rationalisation and
efficiency. This political use (Hezri, 2004) of the indicators holds a series of important implications.
First, the fiscal sustainability narrative has tried to mitigate its strong unpopularity by employing
the rhetoric of inter-generational responsibility, although it still misbalances inter-generational and
intra-generational constraints essential to qualify policies as sustainable. Hence, there has been a
growing use and abuse of the term sustainability. While there is little doubt that sustainability
increases profitability and productivity, many doubts are raised about whether productivity, market-
regulation and efficiency really increase sustainability (Bosworth & Burtless, 2004; Castro, 2004;
Huffschmid, 2005, 2008; Zandberg & Spierdijk, 2010).
Second, even if many international institutions justify their interest in indicators of FS by referring
to the international ‘fight against poverty’ agenda, many of them use indicators of FS to address
specific interests that actually seem to contradict the principle of intra-generational equity, the anti-
poverty commitment, and the basic rules of sustainability. The World Bank, for instance, uses
indicators of fiscal sustainability to manage investment risks, given the necessity to control and
examine debt-stabilising policies. However, there is growing empirical evidence that macro-economic
policies and structural adjustments to restructure public debt addressed by the World Bank run counter
to poverty reduction in many developing countries (Caufield, 1996; Chossudovsky, 2003; Krever,
2013).
Third, criticism has been articulated about fiscal austerity measures having positive or expansionist
effects on economic growth (Erixon, 2013) or having played any positive role in past financial crises.
15
‘We speak of ‘reform’ here because it has become the general terminological currency (…) But the translation of fiscal
pressures into specific institutional changes owes much to the new mainstream of economic thinking and lobbying about
the need for welfare state retrenchment and the merits of privatisation (Arza & Kohli, 2007). This should be kept in mind
when speaking of ‘reform’. On this criticisms see also Scharpf and Schmidt (2000).

Debora Valentina Malito
16
In this context, the European Commission pointed out that the sustainability of government
expenditure is undermined by limitations to access the free market. This argument yet produces a
tautological reasoning: if the debt crisis limited the market access, and not vice versa, why should
market deregulation or privatisation interventions be able to prevent the fiscal crisis?
3. Comparing metrics: Debt to GNI ratio (UN) and FS gap indicators (EU)
The present chapter presents a comparison of two metrics of fiscal sustainability: the UN’s ‘Debt to
GNI ratio’ and the European Commission’s ‘fiscal sustainability gap’ indicators.
One of the first indicators of fiscal sustainability has been developed by the UN Commission for
Sustainable Development within the ‘Indicators of Sustainable Development’. In 1995, the UNCSD
decided to formulate a list of development indicators. A first version including 136 indicators was
published in 1996. In 2007, the updated third edition was launched. Among the indicators of economic
development, the ‘Debt to GNI ratio’ represents an indicator useful to assess the level of sustainability
of public finances.
One of the most recent initiatives to construct FS indicators has been launched by the EU, after the
European Council underlined the need to prepare a Sustainability Report based on the EU Member
States’ budgetary situations and projections. In 2005 the European Commission presented the first
indicators of FS for the then 25 EU member states. The production of these indicators was meant to
support the Ageing Working Group of the EU Economic Policy Committee in evaluating the
economic impact of ageing populations on the Member States.
3.1 Concepts, Data and Strategies
The two above metrics use different definitions of fiscal sustainability. The UN defines the
sustainability of public finance as equivalent to a low degree of government indebtedness. So, the
Debt to GNI ratio has been defined as the ‘total amount of outstanding debt (internal and external)
issued by the general government divided by gross national income’ (World Bank, 2005: 282).
‘Debt’ comprises the total amount of internal and external debt issued by the government, while
‘Gross National Income’ corresponds to ‘the sum of value added by all resident producers plus any
taxes (less subsidies) not included in the valuation of output, plus net receipts of primary income
(compensation of employees and property income) from abroad’ (ibidem).
The European Commission has provided a broader definition that describes fiscal sustainability as
‘the ability to continue now and in the future, current policies without changes regarding public
services and taxation, without causing the debt to rise continuously as a share to GDP’ (European
Union, 2012).
From these definitions, two different operationalisations of fiscal sustainability derive. While the
UN definition provides a parsimonious metric, obtained by dividing total public debt by total GNI, the
EU Fiscal Sustainability Report takes into consideration three types of indicators: the S0 indicator
(‘early detection of fiscal stress’) to detect short short-term challenges, the S1 indicator (‘debt
compliance risk’) focused in the definition of medium-term challenges, and the S2 indicator (‘ageing-
induced fiscal risks’) that touches upon long-term challenges.
So, the EU’s approach towards indicators of sustainable finance is more variegated, since it has
evolved from an exclusive focus on the long-term dynamics (S1 and S2 indicators) towards an
integration of short-term risks and challenges (S0 indicator). The S1 indicator (medium-term) is a type
of tax-gap metric that assesses the value of the average tax ratio required to produce a debt ratio equal
to the 60% of GDP. This is the ‘sustainability benchmark’ established in the Maastricht Treaty.
Following this definition the indicators applied allow to assess EU member states’ performance

Measuring Sustainability: Benefits and pitfalls of fiscal sustainability indicators
17
according to three levels of fiscal sustainability: low (when the S1 value is lower than zero, S1 <0),
medium (0<S1<3) and high risk (when S1>3).
In 2009, the European Commission also established the S2 indicator measuring the correction to
the structural primary balance required to fulfil the inter-temporal budget constraint at the infinite
horizon16
. This metric computes the difference between the present and future primary balances, the
gap between the current (or initial) structural primary balance and the debt-stabilising primary surplus
to ensure sustainability. The higher the values of S2, the greater the sustainability gap and hence the
required fiscal correction. Also this measure has allowed the assessment of the evaluated states: low
(when S2 is less than 2), medium (when 2<S2<6) and high risk (when S2>6).
The third indicator used by the European Commission is the S0 indicator, a new metric launched in
2011, which illustrates the level of fiscal stress in the shorter term. The European Commission defined
the S0 indicator as an ‘early-detection indicator’, because it shows the fiscal risks in a short horizon (1
year). S0 is a composite indicator that includes both fiscal and financial-competitiveness variables.
In view of the two institutional practices, also the data gathering focus and the methodology
employed to create indicators differ. Data used by the UN to construct the indicators are collected
from a variety of institutions. Data on the external and internal debt come from the Global
Development Finance (GDF) database run by the World Bank, which brings together reports collected
by national central banks or finance ministries to the World Bank Debt Reporting System. Data used
in the EU to compute the S1 and S2 indicator are based on EUROSTAT on general government debt.
Data used to compute the sustainability of the S0 indicator derive indeed from aggregating 28 fiscal
and macro-financial variables collected by EUROSTAT, AMECO, WEO and BIS.
3.2 Policy demands and implications
The Debt to GNI ratio can be considered a policy-oriented indicator because of its strict connection to
the Millennium Development Goal (target 15, goal 8), which aims to ensure the sustainability of
external debt for poor countries. This indicator lays particular emphasis on the idea of preserving the
health of public finance, specifically addressing objectives described in Agenda 2117
.
The evolution of the EU’s strategy towards indicators of short-term financial sustainability seems
to stem from the difficulty of linking the indicators of long-term fiscal risk with comprehensible policy
prescriptions18
. The S0 indicators expresses the need of creating an instrument able to detect short-
term risks and to address also short-term adjustments, to reduce ‘fiscal stress’, by establishing a target
time horizon and a target debt level. The EU hence pursues a multi-dimensional strategy, integrating
medium- and long-term prescriptions with more immediate challenges and risks. The three dimensions
of fiscal sustainability in fact hold different policy implications. While the S0 indicator has policy
implications related to creating flexible measures of fiscal containment, S1 and S2 serve to generate
medium- and long-term projections on the sustainability of the Euro-zone.
General policy implications related to the use of these indicators concern the need to preserve the
sustainability of public finances in EU member states, considering the impact of the financial crisis
16
That is the difference between the present and future primary balances, also called the Required Primary Balance. 17
‘Using the CSD indicators as basis for national indicators of sustainable development can assist countries in monitoring
national implementation of their international commitments too. In this regard, the CSD indicators are useful for
measuring the outcome of policies towards achieving sustainable development goals’ (United Nations, 2007). 18
While the infinite horizon gives a comprehensive picture of the sustainability of public finances, it can prove weak from a
policy point of view due to its lack of immediacy and it can raise issues of time consistency.

Debora Valentina Malito
18
and the demographic factor, which is the ageing of societies19
. So, on the one hand, the demand for
fiscal sustainability indicators has impacted on the development of benchmarks to measure the
compliance with norms or to construct and regulate specific policies. Within the Maastricht Treaty for
example, fiscal sustainability forms a central pillar of the European Economic and Monetary Union.
The Treaty requires EU member states to maintain budget positions with deficits below 3 per cent of
GDP and the reduction of debt to GDP ratios to 60 per cent or lower. However problematic the
implementation of this instrument currently may be in reality, this benchmark has acquired relevance
as a metric of the EU member states’ compliance with a European norm and as an explicit benchmark
for a country’s eligibility to the European Monetary Union.
On the other hand, the EU needs to develop and implement pensions and health care reforms
capable of maintaining sustainable public finances in the medium- and long-term (European Union,
2012, 2014). However, the processes of budget cuts, privatisation and rationalisation of basic services
raise major doubts about the sustainable impact of these reforms on the universal access to basic
services. Here, the definition of fiscal sustainability provided by the Fiscal Sustainability Report
(European Union, 2012) offers an interesting point to evaluate this threshold:
‘Fiscal sustainability relates to the ability of a government to assume the financial burden of its
debt in the future. Fiscal policy is not sustainable if it implies an excessive accumulation of
government debt over time and ever increasing debt service. Sustainability means avoiding an
excessive increase in government liabilities – a burden on future generations – while ensuring that
the government is able to deliver the necessary public services, including the necessary safety net
in times of hardship, and to adjust policy in response to new challenges.’
The main question yet remains how this idea is put into sustainable fiscal practice.
3.3 Criticisms
Both the UN and EU FS indicators have policy implications that raise important questions about the
consistence between the original meaning of sustainability and the exclusive nature of the solvency
criterion associated with the operationalisation of fiscal sustainability.
The main criticism in view of the UN Debt to GNI ratio relates to the lack of considerations about
different macro-economic variables. Whereas increasing value of debt ratios are perceived as an
indication of unsustainable public finances, this metric is not able to measure the implementation of
specific actions as it does not take into consideration under which conditions the real economy enters
into a critical stage. Most importantly, it is not suited to express whether the increased value of public
debt is necessary to sustain general well-being. This constraint has been openly recognised by the
same UN Commission on Sustainable Development: ‘a high ratio by itself is not a definite sign of
trouble’, especially because ‘there are no absolute rules to determine when the ratio of debt to GNI is
too high’ (World Bank, 2005). In particular, other signs of stability of the economy must be taken into
consideration.
The key criticism concerning the EU’s fiscal sustainability gap indicators relates to the lack of
consideration of social indicators of sustainability. If indicators of public health provided by
EUROSTAT (2014) are taken into consideration, in Greece, for instance, the ‘Healthy life years and
life expectancy at birth’, for women has decreased from 67.7 in 2010 to 64.9 in 2012. If we consider
data about health equality and in particular the ‘Self-reported unmet need for medical examination or
treatment, by income quintile’, the percentage of people belonging to lower income groups that have
felt unable to afford medical expenses have passed from 7.8 in 2010 to 11 in 2012. Also data for the
EU as a whole show that the degree of inequalities in access to health care between socioeconomic
19
According to the Ageing Working Group established by the EC in the coming decades, Europe’s population ageing is
expected to increase and have a significant impact on growth and to lead to significant pressures to increase public
spending.

Measuring Sustainability: Benefits and pitfalls of fiscal sustainability indicators
19
groups has increased between 2005 and 200920
. Thus, a key danger is that data on the sustainability of
the fiscal system might not be closely related to data on social sustainability and its potential erosion,
contradicting the intra-generational principle indispensable to define a development strategy as
sustainable.
4. Conclusions
The deterioration of fiscal positions and increases in government debt since 2007, together with the
budgetary pressures posed by population ageing, are mutually enhancing and make fiscal
sustainability an acute policy challenge across the globe. Indicators of fiscal sustainability, bypassing
their function as mere representation of the reality, have played a key role in de facto
governmentalising fiscal sustainability. As we saw throughout the analysis, a series of conceptual and
methodological problems arise from this trend.
From a conceptual point of view, many definitions of the premises of fiscal sustainability merged
with its realities within the related policy and reform discourse (Cassiers & Thiry, 2010). In the Euro
area, for instance, many indicators quantify the budgetary impact of ageing in order to deal with
population ageing by privileging efforts to reduce pension and health care spending. Moreover, many
institutions tend to incorporate policy prescription within their definition of fiscal sustainability,
rendering the latter construction of the term rather biased.
In many respects, the long-term perspective of sustainability is hence contradicted by the concept
of fiscal sustainability that brings short-term risks into play that requires direct interventions. As
pointed out by Schick, ‘Fiscal sustainability is more than projecting the future; it is about the urgency
of policy change’ (Schick, 2005). From the conceptual debate on both sustainability and fiscal
sustainability, important questions remain to be answered: Why should fiscal austerity rules be
conceptualised as sustainable? How does the debt to GDP or GNI ratio relate to other macro-economic
variables, such as unemployment or the access to basic welfare? How does the short-time horizon of
many fiscal indicators relate to intergenerational justice? How do policy-makers using FS indicators
incorporate intra- and intergenerational constraints?
From a theoretical perspective, the production of FS indicators bypasses important aspects of the
discourse about sustainability (Ortega-Cerdà, 2005) and poses important questions as well: Is a
sustainable development compatible with an exponential growth under the conditions of finite
resources? How do fiscal policies support growth if most governments in times of crisis consolidate
public finances? To what extent does the notion of government budget constraint impose financial
limitations on the government’s ability to fulfil its socio-economic policy ambitions? Do indicators of
sustainability establish sectorial thresholds that hamper the achievement of a discrete equilibrium
between the dimensions of sustainability? How does the solvency criterion relate to the intra-
generational element of sustainable development?
The theoretical components of endogenous growth within indicators of FS pose another constraint
related to the validity of the growth assumptions beyond industrialised countries. Most developing
countries, especially in Africa have low rates of capital accumulation and low technological
capabilities (Wiebe, 2012). Measuring the net debt in these countries raises difficult issues due to
differences in the definition of government assets (Baldacci, McHugh, & Petrova, 2011). How do the
indicators of FS hence account for their translation from the global to regional, national or local
levels? How does the ageing criterion informing FS indicators fit to countries in which other factors,
20
‘Between 2005 and 2009 the proportion of people reporting unmet needs for healthcare fell for all income groups. In
addition, over the same period the gap between the lowest and the highest income group decreased. At the same time
there has been an increasing trend of cost sharing by patients, in particular out-of-pocket payments which would be
expected to put an increasing pressure on accessibility to health care, especially for low-income groups’ (Eurostat, 2014).
Debora Valentina Malito
20
and opposite demographic trends, affect the sustainability of public finance? This paper may rather
have raised additional questions, than provided answer for those brought forward. By doing so, it yet
seeks to stimulate the discussion on additional empirical and theoretical issues framing the normative
origin and the policy implications of indicators.

Measuring Sustainability: Benefits and pitfalls of fiscal sustainability indicators
21
References
Afonso, A. (2005). Fiscal sustainability: The unpleasant European case. FinanzArchiv/Public Finance
Analysis, 19–44.
Artis, M., & Marcellino, M. (2000). The solvency of government finances in Europe. In Fiscal
Sustainability Conference (p. 210). Retrieved from
http://papers.ssrn.com/sol3/papers.cfm?abstract_id=2109371
Arza, C., & Kohli, M. (2007). Pension reform in Europe: politics, policies and outcomes. Routledge.
Balassone, F., & Franco, D. (2000). Assessing fiscal sustainability: a review of methods with a view to
EMU. Retrieved from http://papers.ssrn.com/sol3/papers.cfm?abstract_id=2109377
Baldacci, E., McHugh, J., & Petrova, I. (2011). Measuring fiscal vulnerability and fiscal stress: A
proposed set of indicators. International Monetary Fund. Retrieved from
http://books.google.it/books?hl=en&lr=&id=_GzrPz_YFw0C&oi=fnd&pg=PA3&dq=Baunsgaard+
and+Shin,+2011&ots=RhqtEtWuZF&sig=ZPSTkM0C1jk6DGIO3X6Rd3WVrP0
Barro, R. J. (1991). Economic growth in a cross section of countries. The Quarterly Journal of
Economics, 106(2), 407–443.
Bell, S., & Morse, S. (2008). Sustainability indicators: measuring the immeasurable? London:
Earthscan. Retrieved from
http://books.google.it/books?hl=en&lr=&id=6DOC13cd9c0C&oi=fnd&pg=PR5&dq=An+analysis
+of+factors+influencing+use+of+indicators+in+the+European+Union+Morse+Bell&ots=IpHUBP
SGjs&sig=qa5zR5q0U_OgNbXoCUNvrc8EjDI
Benz, U., & Fetzer, S. (2006). Indicators for measuring fiscal sustainability: a comparison of the
OECD method and generational accounting. FinanzArchiv: Public Finance Analysis, 62(3), 367–
391.
Berti, K., Lequien, M., & Salto, M. (2012). An early-detection index of fiscal stress for EU countries.
Blanchard. (1990). Suggestions for a new set of fiscal indicators. OECD Publishing. Retrieved from
http://ideas.repec.org/p/oec/ecoaaa/79-en.html
Blanchard, O., Chouraqui, J.-C., Hagemann, R., & Sartor, N. (1991). The sustainability of fiscal
policy: New answers to an old question. NBER Working Paper, (R1547). Retrieved from
http://papers.ssrn.com/sol3/papers.cfm?abstract_id=227461
Bohn, H. (1995). The sustainability of budget deficits in a stochastic economy. Journal of Money,
Credit and Banking, 27(1), 257–271.
Boos, A., & Holm-Müller, K. (2013). The relationship between the resource curse and genuine
savings: Empirical evidence. Journal of Sustainable Development, 6(6), p59.
Bossel, H., & Balaton Group. (1999). Indicators for sustainable development: theory, method,
applications. Winnipeg, Man.: International Institute for Sustainable Development.
Bosworth, B., & Burtless, G. (2004). Pension reform and saving. National Tax Journal, 57, 703–728.
Buiter, W. H., Persson, T., & Minford, P. (1985). A guide to public sector debt and deficits. Economic
Policy, 14–79.
Burger, P. (2005). Fiscal sustainability: the origin, development and nature of an ongoing 200-year
old debate. Bremen: Inst. für Weltwirtschaft und Internat. Management, Univ. Bremen.
Burnside, C. (2005). Fiscal sustainability in theory and practice: a handbook. Washington, D.C:
World Bank.
Cabeza Gutés, M. (1996). The concept of weak sustainability. Ecological Economics, 17(3), 147–156.

Debora Valentina Malito
22
Cassiers, I., & Thiry, G. (2010). Alternative Indicators to GDP: Values behind Numbers. Adjusted Net
Savings in Question. Applied Research in Quality of Life. Retrieved from
http://www.ie.ufrj.br/images/pesquisa/pesquisa/textos_sem_peq/texto2606.pdf
Castro, C. J. (2004). Sustainable Development: Mainstream and Critical Perspectives. Organization &
Environment, 17(2), 195–225. doi:10.1177/1086026604264910
Caufield, C. (1996). Masters of illusion: the World Bank and the poverty of nations. Macmillan
London. Retrieved from http://www.getcited.org/pub/100119141
Chossudovsky, M. (2003). The globalization of poverty and the new world order. Global Outlook
Shanty Bay, Ontario.
Davis, K., Fisher, A., Kingsbury, B., & Merry, S. E. (2012). Governance by indicators: Global power
through classification and rankings. Oxford University Press. Retrieved from
http://books.google.it/books?hl=en&lr=&id=oEN8jOw1v9oC&oi=fnd&pg=PP2&dq=kevin+davis
+indicators&ots=qagM_tyEgE&sig=Q0r_oGtpbbi0oJoRCE_CtJrJSfs
Domar, E. D. (1944). The“ burden of the debt” and the national income. The American Economic
Review, 34(4), 798–827.
Environmental markets. (2014). Goldman Sachs. Retrieved June 26, 2014, from
http://www.goldmansachs.com/citizenship/environmental-stewardship-and-
sustainability/environmental-markets/environmental-markets-main-page.html
Erixon, L. (2013). Can fiscal austerity be expansionary in present Europe? The lessons from
Sweden♣. Stockholm University, Department of Economics. Retrieved from
http://www2.euromemorandum.eu/uploads/erixon_can_fiscal_austerity_be_expansionary_in_prese
nt_europe.pdf
European Union. (2012). Fiscal Sustainability Report. Retrieved from
http://ec.europa.eu/economy_finance/publications/european_economy/2012/pdf/ee-2012-8_en.pdf
European Union. (2014). Public Finance Sustainability. Retrieved from
http://ec.europa.eu/europe2020/pdf/themes/03_public_finance_sustainability.pdf
Eurostat. (2014, February). “Sustainable development - public health” - Statistics Explained.
Retrieved September 2, 2014, from
<http://epp.eurostat.ec.europa.eu/statistics_explained/index.php/Sustainable_development_-
_public_health#>
Friedman, M. (1957). A Theory of the Consumption. princeton university press Princeton. Retrieved
from http://people.su.se/~calmf/Ekonomisk%20politik/IntermacroEc_ht08/Forelasning9_ht08.pdf
Ghosh, A. R., Kim, J. I., Mendoza, E. G., Ostry, J. D., & Qureshi, M. S. (2013). Fiscal fatigue, fiscal
space and debt sustainability in advanced economies. The Economic Journal, 123(566), F4–F30.
Greenwood, D. (2001). Natural capitalism, growth theory and the sustainability debate. Presented at
the Southwest Economic association meetings,. Retrieved from
http://www.uccs.edu/Documents/ccps/SWEA.2001v2..NATL%20CAP.pdf
Gustafsson, B. (1998). Scope and limits of the market mechanism in environmental management.
Ecological Economics, 24(2), 259–274.
Hamilton, J. D. (1986). On testing for self-fulfilling speculative price bubbles. International Economic
Review, 27(3), 545–552.
Hartwick, J. M. (1977). Intergenerational equity and the investing of rents from exhaustible resources.
The American Economic Review, 67(5), 972–974.
Heal, G. (1999). Markets and sustainability. Science of the Total Environment, 240(1), 75–89.
Measuring Sustainability: Benefits and pitfalls of fiscal sustainability indicators
23
Hezri, A. A. (2004). Sustainability indicator system and policy processes in Malaysia: a framework for
utilisation and learning. Journal of Environmental Management, 73(4), 357–371.
Holzmann, R. (1988). Reforming public pensions. Organisation for Economic Co-operation and
Development. Retrieved from http://www.getcited.org/pub/102821564
Huang, H., & Xie, D. (2008). Fiscal sustainability and fiscal soundness. Annals of Economics and
Finance, 9(2), 239–51.
Huffschmid, J. (2005). Economic policy for a social Europe. Palgrave Macmillan London. Retrieved
from
http://www.dandelon.com/servlet/download/attachments/dandelon/ids/DE002BCDF11B2CBEA12
A8C12571B10024F5FB.pdf
Huffschmid, J. (2008). Finance as a driver of privatisation. Transfer: European Review of Labour and
Research, 14(2), 209–236.
IMF. (2002). Assessing Sustainability. Presented at the Prepared by the Policy Development and
Review Department In consultation with the Fiscal Affairs, International Capital Markets,
Monetary and Exchange Affairs, and Research Departments Approved by Timothy Geithner.
International Monetary Fund. (2002, May 28). Assessing Sustainability, Prepared by the Policy
Development and Review Department In consultationwith the Fiscal Affairs, International Capital
Markets, Monetary and Exchange Affairs, and Research Departments Approved by Timothy
Geithner ,.
Jollands, N. (2004). The usefulness of aggregate indicators in policy making and evaluation: a
discussion with application to eco-efficiency indicators in New Zealand. Retrieved from
https://digitalcollections.anu.edu.au/handle/1885/41033
Krever, T. (2013). Quantifying Law: legal indicator projects and the reproduction of neoliberal
common sense. Third World Quarterly, 34(1), 131–150.
Kumi, E., Arhin, A. A., & Yeboah, T. (2013). Can post-2015 sustainable development goals survive
neoliberalism? A critical examination of the sustainable development–neoliberalism nexus in
developing countries. Environment, Development and Sustainability, 1–16. doi:10.1007/s10668-
013-9492-7
Langenus, G. (2006). Fiscal sustainability indicators and policy design in the face of ageing. Available
at SSRN 2005169. Retrieved from http://papers.ssrn.com/sol3/papers.cfm?abstract_id=2005169
Lindsey, G., Wittman, J., & Rummel, M. (1997). Using indices in environmental planning: evaluating
policies for wellfield protection. Journal of Environmental Planning and Management, 40(6), 685–
704.
Meadows, D. H. (1998). Indicators and information systems for sustainable development.
Sustainability Institute Hartland. Retrieved from
http://www.comitatoscientifico.org/temi%20SD/documents/@@Meadows%20SD%20indicators.p
df
Meadows, D. H., Meadows, D., Randers, J., & Behrens, W. (1972). The Limits to Growth: A Report to
The Club of Rome (1972). Universe Books, New York. Retrieved from http://www.ask-
force.org/web/Global-Warming/Meadows-Limits-to-Growth-Short-1972.pdf
Neumayer, E. (2001). The human development index and sustainability—a constructive proposal.
Ecological Economics, 39(1), 101–114.
Neumayer, E. (2004). Sustainability and well-being indicators. UNU-WIDER. Retrieved from
http://eprints.lse.ac.uk/30851/
OECD. (2009). Government at a Glance 2009. OECD Publishing.

Debora Valentina Malito
24
Ortega-Cerdà, M. (2005). Sustainability indicators as discursive elements. In Paper submitted at the
6th International Conference of the European Society for Ecological Economics in Lisbon,
available at http://ecoman. dcea. fct. unl. pt/projects/esee2005. Retrieved from http://ent-
consulting.com/images/stories/ENT/pdf/articles/indicators.pdf
Pearce, D. W., & Atkinson, G. D. (1993). Capital theory and the measurement of sustainable
development: an indicator of “weak” sustainability. Ecological Economics, 8(2), 103–108.
Romer, P. M. (1986). Increasing returns and long-run growth. The Journal of Political Economy,
1002–1037.
Rowledge, L. R., James, A., Barton, R. S., & Brady, K. S. (1999). Mapping the Journey: case studies
in strategy and action toward sustainable development. Greenleaf Publishing. Retrieved from
http://books.google.it/books?hl=en&lr=&id=gMk00Dq0Z7kC&oi=fnd&pg=PA9&dq=Rowledge+
1999&ots=urzxSYKyfF&sig=zS5ISR8gS-zweaKGkTjbXOoCK98
Scharpf, F. W., & Schmidt, V. A. (2000). Welfare and Work in the Open Economy: From
Vulnerability to Competitiveness, Vol. I+ II. Oxford/New York.
Schick, A. (2005). Sustainable budget policy: concepts and approaches. OECD Journal on Budgeting,
5(1), 107.
Singh, R. K., Murty, H. R., Gupta, S. K., & Dikshit, A. K. (2009). An overview of sustainability
assessment methodologies. Ecological Indicators, 9(2), 189–212.
doi:10.1016/j.ecolind.2008.05.011
Solow, R. M. (1956). A contribution to the theory of economic growth. The Quarterly Journal of
Economics, 70(1), 65–94.
Solow, R. M. (1974). The economics of resources or the resources of economics. The American
Economic Review, 64(2), 1–14.
Stiglitz, J. E. (1974). Growth with Exhaustible Natural Resources: Efficient and Optimal Growth
Paths. Review of Economic Studies, 41(128), 123–137.
Strange, T., & Bayley, A. (2008). Sustainable Development: Linking Economy, Society. OECD.
Sutton, P. (1997). THE SUSTAINABILITY-PROMOTING FIRM an essential player in the politics of
sustainability. Presented at the Ecopolitics Conference XI (University of Melbourne). Retrieved
from http://www.green-innovations.asn.au/spf.htm
Thiry, G. (2011). Beyond GDP: Conceptual Grounds of Quantification. The Case of the Index of
Economic Well-Being (IEWB). Université catholique de Louvain, Institut de Recherches
Economiques et Sociales (IRES). Retrieved from http://sites-
final.uclouvain.be/econ/DP/IRES/2011048.pdf
United Nations. (1987). Report of the World Commission on environment and development: “Our
common future.” United Nations.
United Nations. (1992, June 3). United Nations Conference on Environment & Development Rio de
Janerio, Brazil, AGENDA 21.
United Nations. (2001). Indicators of sustainable development: Guidelines and methodologies. United
Nations, Economic & Social Affairs. Retrieved from
http://books.google.it/books?hl=en&lr=&id=FmZq4WecK3MC&oi=fnd&pg=PA3&dq=indicators
+of+Sustainable+Development:+Guidelines+and+Methodologies&ots=hZtKkqiomt&sig=bF7tyST
G5CdIVMcTy3KEVn9oYEg
United Nations. (2007). Indicators of Sustainable Development: Guidelines and Methodologies.
United Nations Publications.

Measuring Sustainability: Benefits and pitfalls of fiscal sustainability indicators
25
United Nations, S. S. (1990). The Millennium Development Goals Report. Change, 1999, 1999–2005.
Warhurst, A. (2002). Sustainability indicators and sustainability performance management. Warnick:
University of Warwick. Retrieved from
http://www.commdev.org/userfiles/files/681_file_sustainability_indicators.pdf
Wiebe, K. S. (2012). The Human Development Index in an endogenous growth model. Retrieved from
http://ecomod.net/system/files/Paper_Wiebe_HDI.pdf
World Bank. (2005). World Development Indicators 2005. World Bank Publications.
Zandberg, E., & Spierdijk, L. (2010). Funding of pensions and economic growth: are they really
related? Journal of Pension Economics and Finance, 1(1), 1–17.

Debora Valentina Malito
26
Author contacts:
Debora Valentina Malito
Villa La Fonte
Via delle Fontanelle 18
50014 San Domenico di Fiesole (FI)
ITALY
Email: [email protected]