
Improving fiscal policy in the EU: the case for independent forecasts
Upload
independentCategory
view
2download
0
IFiscal Sustainability and Policy Rules under Changing Demographic Forecasts
KeskusteluaiheitaDiscussion Papers21 December 2011
No 1265
* ETLA – The Research Institute of the Finnish Economy, [email protected]** ETLA – The Research Institute of the Finnish Economy, [email protected]*** University of Eastern Finland, School of Computing, Statistics, [email protected]
Jukka Lassila* – Tarmo Valkonen** – Juha M. Alho***
under Changing Demographic Forecasts
Fiscal Sustainability and Policy Rules

ETLA Keskusteluaiheita – Discussion Papers No 1265II
We thank Sixten Korkman and Niku Määttänen for comments and Eija Kauppi for efficient model programming.We are grateful for the National Audit Office of Finland for financial support and their staff for stimulating discussions.
ISSN 0781–6847

1Fiscal Sustainability and Policy Rules under Changing Demographic Forecasts
Contents
Abstract 2
1 Introduction 3
2 Fiscalsustainabilityanduncertaindemographics 6 2.1 Economicmodels 6 2.2 Risksandstochasticprojections 7
3 Forecastingdemographicforecasts 8
4 Theeconomicmodelandbasepolicyoutcomes 11 4.1 Themodel 11 4.2 Basepolicyoutcomes 12
5 Expectedsustainabilityandpolicyrules 14 5.1 EnhancingsustainabilitywithVATincreases 14 5.2 Onthelengthoftheforecasthorizoninforecast-basedpolicyrules 18
6 Taxpolicyeffectsonfuturesustainabilityoutlook 20
7 Conclusions 23 7.1 Generalassessmentofsustainability 23 7.2 Policylessons 24 7.3 Methodologicallessons 25
AppendixPolicyruleeffectswithaonepercentVATincrease 27 References 30

ETLA Keskusteluaiheita – Discussion Papers No 12652
Abstract
All practical evaluations of fiscal sustainability that include the effects of population ageing must utilize demographic forecasts. It is well known that such forecasts are uncertain, and that has been taken into ac-count in some studies by using stochastic population projections jointly with economic models. We de-velop this approach further by introducing regular demographic forecast revisions that are embedded in stochastic population projections. This allows us to separate systematically, in each demographic out-come and under different policy rules, the expected and the actualized effects of population ageing on public finances. We show that the likelihood of sustainability risks is significant, and that it would be wise to consider policies that reduce the likelihood of getting highly indebted. Furthermore, although demo-graphic forecasts are uncertain, they seem to contain enough information to be useful in forward-look-ing policy rules.
Key words: Public finance, fiscal sustainability, stochastic population simulations, changing demographic forecasts
JEL: H30, H62, H63, J11
Tiivistelmä
Julkisen talouden kestävyysarvioissa tarvitaan ennusteita tulevasta väestökehityksestä, jos väestön ikään-tymisen seuraukset halutaan ottaa mukaan. Väestöennusteiden epävarmuus on suurta, ja tämä on eräissä aiemmissa tutkimuksissa huomioitu tekemällä kestävyyslaskelmia stokastisten väestösimulaatioiden avul-la. Tässä tutkimuksessa näihin simulointeihin on lisätty periodeittain päivittyvät väestöennusteet. Tämän uuden tekniikan avulla tutkimme sekä odotettuja väestön ikääntymisen vaikutuksia julkiseen talouteen että odotuksista poikkeavien toteutumien vaikutuksia erilaisten politiikkavalintojen oloissa.
Julkisen talouden nykylinjaa kuvaamme politiikkana, jossa työeläkemaksuja nostetaan eläkemenojen ra-hoittamiseksi, ja terveys- ja hoivamenot rahoitetaan kunnallisveroilla ja valtionavuilla. Valtion veroasteet pidetään nykyisillä tasoillaan. Osoitamme, että riski valtion velan kasvusta kestämättömäksi on merkittä-vä, ja ylivelkaantumisen estämiseksi olisi syytä miettiä vaihtoehtoisia tai täydentäviä politiikkavalintoja. Osoitamme myös, että vaikka väestöennusteet ovat hyvin epävarmoja, niiden varaan voidaan rakentaa hyödyllisiä politiikkasääntöjä velkaantumisen rajoittamiseksi.
Asiasanat: Julkisen talouden kestävyys, muuttuvat väestöennusteet, stokastiset väestösimulaatiot

3Fiscal Sustainability and Policy Rules under Changing Demographic Forecasts
1 IntroductionPopulationageingwillinthecomingdecadesresultinagestructuresvastlydifferentfroman-ythingpreviouslyexperienced.Itwillputpressureonpublicfinances,sincetheelderly,whosepopulationsharesareincreasing,arenetrecipientsofpublicoutlaysandthoseinworkingag-es,adeclininggroupatleastrelativelyandinmanycountriesabsolutely,arethenetpayers.
Analysisof sustainability is thusneededtomakearealistic foresightonwhether thepublicsectorcaninthefuturefinancetheservicesandtransfersithasexplicitlyorimplicitlyprom-isedtocitizens.ThisisespeciallyimportantinNordiccountrieswherepublicwelfaretrans-fersandservicesareextensiveandpeopleonthewholeseemtocountonthemwhenponder-ingonhowtheoldagewillturnouteconomically.
ThisstudyconcernsthesustainabilityofpublicfinancesinFinland.Itconsidersthelargepub-licsectorwhichconsistsofthestate,themunicipalitiesandthesocialsecurityinstitutionsin-cludingthestatutoryearnings-relatedpensionsystem.
Wewishtoutilizetheempiricalresearchconcerningtheuncertaintyindemographicprojec-tions.Studiesshowthatofficiallong-termdemographicprojections,bothnationalandinter-national,have in thepastbeenhighlyuncertainand in somerespects systematicallybiased(seeKeilman,2008).Althoughbetteruseofstatisticalmethodsmightreducethebiases,theuncertaintyremains.Otherstudieshaveevaluatedtheeffectsofdemographicuncertaintiesontheeconomicconsequencesofpopulationageing,andshown,notsurprisingly,thateconom-icestimatesalsobecomeveryuncertain(seeAlho,LassilaandValkonen,2005).Theresultsofthisstudysupportthesefindings.
Thekeynoveltyhereisthat,inasetupofstochasticpopulationprojections,wealsoincludechangingdemographicforecasts.Thisallowsustoseparateexpectedandactualoutcomesinfairlyrealisticsituationsandanalyzetheconsequencesofsomepolicyrules,especiallyfromtheirtimingpointofview.
Recently,Leeper(2010)criticizedfiscalpolicyanalysisingeneralandsustainabilityanalysisasaspecificpartofitforapoorstateofmodelling.Helongedforasituationwhere‘detailedanalysesof“unsustainablefiscalpolicies”arenolongerconductedwithoutexplicitanalysisofexpectationsanddynamicadjustments” (Leeper,2010,p.2).Ourapproach fullyagreeswithLeeper’ssuggestions.
ThisstudyismadefortheNationalAuditOfficeofFinland.ItisFinland’sSupremeAuditIn-stitution and reports directly to Parliament. It audits the state’s finances and asset manage-mentinordertoensurethatpublicfundsarespentwiselyandincompliancewithlegislation.Thustheresultsandmessagesofthissustainabilityanalysisarebeingdisseminatedtoavastgroupofpoliticaldecision-makers.Disseminatingtheuncertaintiesinvolvedisdifficult.Itis,however,anintegralpartofthisproject.Weaimtodevelopgraphicalrepresentations,exam-plesofwhichareincludedhere,thathopefullyclarifytheissueswithoutsimplifyinganyes-sentialfeaturesaway.
InSection2ofthisstudy,wefirstdiscussgeneralissuesofsustainabilityandtheroleofuncer-taintyintheanalysis,basedonpreviousresearch.WethendiscussinSection3thekeymeth-

ETLA Keskusteluaiheita – Discussion Papers No 12654
odologicalimprovementinstochasticpopulationprojections,namelyembeddingperiodical-lyupdateddemographicforecaststoeachtime-pointineachsimulatedpopulationpath.Sec-tion4describestheeconomicmodelandthelong-termprojectionoutcomesfortheFinnishpublicsectorfinancesunderourbasepolicyassumptions.TheroleofadditionalpolicyrulesandtheirimplicationsforsustainabilityofFinnishpublicfinancesisanalyzedanddiscussedinSection5,usingVAT-rulesthatarebasedontheexpectedsizeofthesustainabilitygaporexpectedindebtedness.Section6containssomeobservationsconcerningtheeffectsoftaxin-creasesonthesustainabilitygapsthatwillbecalculatedinthefuture.Section7concludes.
Fiscal crisis and sustainability analysisThe European fiscal debt crisis changes the way how fiscal sustainability will be assessed in future in the EMU. The previous practice of publishing target-orientated non-binding Stability and Conver-gence Programmes for the medium term and numerical illustrations of the way how government debts explode in the long term has turned out to be useless and even misleading in the case of the strongly indebted Member States. Markets do not any more trust promises or lax agreements prone to political discretion and wait for the accumulation of debt, but raise the interest rate. Also the EU has been compelled to react to the crisis by reforming its surveillance, guidance and sanction mechanisms.
From the point of view of sustainability evaluations, this development raises three issues. The first is the credibility of the new EU rules. If they are effective, the existing structural deficits will be corrected in the medium term, public debts will be lower in the long term and the main focus of sustainability analysis returns to long-term ageing expenditure. The second issue is the increased sensitivity of the interested rates on government bonds on the deficits and debts in the euro area. This will be the more important the less credible and efficient the new EU rules are. The third issue is the political capacity of the governments to follow strict fiscal policy and implement large enough austerity measures, if necessary.
The challenge is aggravated by the need to simultaneously improve competitiveness in the crisis countries. This reminds of the situations in which many developing countries have struggled for a long time, with one important exception: devaluation is not allowed for single Member States. Improvement in competitiveness requires structural reforms, lower wages, fiscal devaluations and weaker euro.
European Commission aims to learn from recent experiences, when it reforms its sustainability analysis. It suggests introducing several new methodologies (European Commission, 2011). The first is to measure the fiscal risk linked to the banking sector in order to estimate the possible impact that a banking crisis could have on the public finances. Second methodology uses fiscal and macroeco-nomic variables to identify thresholds which have in the past been linked to the onset of crises. Third one estimates country-level fiscal reaction functions and combines them with the intertemporal budget constraint to calculate sustainable debt levels under different assumptions for the interest rate-growth rate differential. Finally, since the required fiscal measures are large leading to substan-tial changes in behavior and market prices, numerical general equilibrium models are suggested to be used to simulate the outcomes of the reforms.
The main new pillar in the economic governance system of EU is legislative package called ‘six pack’. It entered in force December 13, 2011, allowing it to be applied in time for the next European Semester*. Six pack aims to stronger preventive and corrective action to ensure fiscal sustainability
* European semester is a governance architecture, aimed to improve ex ante coordination of budgetary and economic policies.

5Fiscal Sustainability and Policy Rules under Changing Demographic Forecasts
and to identify and correct competitive gaps and macroeconomic imbalances. The elements of the six pack are the following.
– A concept of prudent fiscal policy-making (PFPM) will be adopted as the basis of preventive sur-veillance. It implies that the growth rate of government expenditure does normally not exceed growth rate of GDP in the medium term.
– It will be possible to open an Excessive Deficit Procedure (EDP) also on the basis of the debt cri-terion. Member States with government debt ratios in excess of 60% of GDP should reduce this ratio in line with a numerical benchmark, which implies a decline of the amount by which their debt exceeds the threshold at a rate in the order of 1/20th per year over three years. If they do not, they could be placed in EDP.
– The threat of progressive sanctions will be strengthened: – Large deviations from prudent fiscal policy-making may lead to interest-bearing deposit of
0.2% of GDP. – A non-interest-bearing deposit of 0.2% of GDP may be requested from a euro area country
that is placed in EDP. – In case of non-compliance with the initial recommendation for corrective action, this non-
interest-bearing deposit will be converted into a fine. The fine will be increased in case of repeated non-respect of the recommendations.
– On a recommendation by the Commission, sanctions will be imposed by the Council unless a qualified majority of Member States vote against it.
– A new directive on national budgetary frameworks will be adopted. Fiscal frameworks should be reliable, multi-annual and transparent and include numerical fiscal rules.
– A new surveillance and enforcement mechanism will be set up to identify and correct competi-tiveness gaps and major macroeconomic imbalances within the EU. It is called the Excessive Imbalance Procedure (EIP). An early warning mechanism is adopted that may trigger in-depth studies. The Commission and the Council may adopt preventive recommendations to correct the imbalances. If these recommendations are not followed, EIP may be opened.
– For euro area countries an interest-bearing deposit can be imposed after one failure to comply with the EIP’s recommended corrective action. After a second compliance failure, this interest-bearing deposit can be converted into a fine (up to 0.1% of GDP). Sanctions can also be imposed for failing twice to submit a sufficient corrective action plan. The fine can only be stopped by a qualified majority vote.
Another agreement, called ‘fiscal compact’ was preliminarily approved in the beginning of Decem-ber 2011. This agreement includes e.g. the following elements.– It obliges eurozone countries to incorporate a balanced general government budget provision
into their national constitutions, committing them to keeping annual structural deficits at or below 0.5 per cent of nominal GDP. The provision must also include an automatic correction mechanism that kicks in if the deficits exceed the ceiling.
– The EDP will be reinforced by automatic consequences as soon as the euro area Member State is in breach of the 3 % deficit ceiling. Again, a qualified majority of these countries is needed to avoid the steps and sanctions proposed by the Commission.
The stricter and the more automatic the new rules are the more fiscal policy autonomy is lost, which may be difficult to accept in some countries. Another point is that since there are so many countries in EU that does not currently comply with the criteria, the requirement of qualified majority may not be as binding as desired. Possible weak point may also be the difficult measurement of structural deficits.

ETLA Keskusteluaiheita – Discussion Papers No 12656
2 Fiscal sustainability and uncertain demographics Awell-knowndefinitionofthesustainabilityoffiscalpoliciesistheOECDview:“Sustainabil-ityisbasicallyaboutgoodhousekeeping.Itisessentiallyaboutwhether,basedonthepolicycurrentlyonbooks,agovernmentisheadedtowardsexcessivedebtaccumulation.”(Blanchardetal.1990,p.8).Moreprecisely:“Fiscalpolicycanbethoughtofasasetofrules,aswellasaninheritedlevelofdebt.Andasustainable fiscal policycanbedefinedasapolicysuchthattheratioofdebttoGNPeventuallyconvergesbacktoitsinitiallevel”(p.11).
Forward-lookingapproachestosustainability,liketheoneweapplyhere,projectsfutureval-uesforthedeterminantsofthedebtdynamicsanddevelopsmeasuresthatquantifytheneed-edadjustmentifunsustainabledynamicsisdetected.Thequalityofdataandtheelaboratenessandsophisticationlevelofthemodelsusedhavedevelopedalotinpastfewyears,butthereisstillmuchroomforimprovement1.
Blanchard(1985)definesa‘taxgap’asanimmediateadjustmentinthetotaltaxratethatal-lowsthedebt/GDPratiotoconvergetothecurrentlevelatagiveterminaldate.Acorrespond-ingflowindicator,developedbyBuiter(1985)isa‘primarygap’definedasanimmediatead-justmentintheprimarybalancethatwouldfulfillthesameterminaldebtcondition.
Itwaslaternoted,however,thattherequiredfiscaladjustmentdependsheavilyonthechosenterminaldate.Therefore,alternativespecifications,whichestimatetheseindicatorsassuminginfinitehorizon,havebeendeveloped.Anotherlaterrefinementconsiderstheamountofter-minaldebt.Amorestringentconditionassumesthatthepresentvalueofallfuturesurplus-esanddeficitsequalscurrentdebt,implyingthatthedebtwillfinallybefullyrepaid(Heller,2003).Thisconditionisknownasthepresentvaluebudgetconstraint.
Inpractice,thechoiceoftheinitialvaluesisalsoimportant.Businesscyclesmaycausetempo-raryvariationintaxreceipts,expenditure,interestratesandinthevalueofthegovernment’sassets.Themagnitudeofthenecessarydiscretionarymeasuresdepends,however,onthecy-clicallyadjustedinitialtotaltaxrateorprimarybalance.
European Commission uses two sustainability measures that are directly elaborated fromthese indicators.The firstonemeasures thedifferencebetweencurrent total tax rateandataxratethatisrequiredtogeneratepublicdebt/GDPratioof60percentin2050.Thesecondmeasuresthetaxgapthatwouldequalizethecurrentpublicdebtandthepresentvalueofallfuturesurplusesanddeficits(EPC,2006).Weusethelattermeasurehere.
2.1 Economic modelsRecentsustainabilityassessmentshaveutilizedthreetypesofeconomicmodels.Majorityofthecalculationshasbeenmadewithaccountingmodels.Aspecialexampleofthesemodelsisgenerationalaccounts.Alessfrequentlyusedframeworkismacroeconometricmodels.Thirdchoiceisnumericaldynamicgeneralequilibriummodels,oftenwithoverlapping-generationshouseholdstructure.
1 “The process of developing long-term budgets is in its infancy, and there is neither a single analytical approach nor a fiscal rule for sustainable development that has achieved agreement as best practice.” Ulla (2006).

7Fiscal Sustainability and Policy Rules under Changing Demographic Forecasts
Generationalaccountsincludedetaileddescriptionofthecurrentlinksbetweenagestructureofpopulationandthepublicsectorfinances.Theotherdataneededconsistsofapopulationprojectionandassumptionsaboutfutureemploymentrates,productivitygrowthrateandin-terestrate(seee.g.AlhoandVanne,2006).Asimilarsimplemacroeconomicsettingisinusealsoinotheraccountingmodels(seee.g.,Duycketal.,2005).Accountingmodelsthusoftenprovideelaborateddescriptionof financial flowsbetween individualsandpublicsector,buthaveminimummacroeconomiccontentsandnobehavioraleffects.
SustainabilityanalysisperformedbytheEuropeanCommissiontakestheresultsofthenation-alpensionprojectionsasgiven,butprojectstheotherage-dependentexpendituresusingsim-ilarmethodologyasingenerationalaccounts.Theyconsideralsotheinfluenceofthesizeoftheworking-agepopulationonthegrowthrateoftheGDP.Thelackofanybehavioralreac-tionsweakenstherelevanceoftheperformedsensitivityandpolicyanalysis.
Dynamicgeneralequilibriummodels,withoverlappinggenerationsofhousehold, take intoaccounttheinteractionbetweendemographicstructureandthefactormarketsoftheecon-omy,encompassing thereby implicationsofgrowthmodels.Theycanalsoproduce theout-comesofactuarialpensionmodelsandgenerationalaccounts,sinceitispossibletomodelthepensionsystemrulesanddetailedlinksbetweenageofthehouseholdgenerationsandpublicexpendituresandrevenues.Theysuitwelltopolicyanalysis,sincehouseholdsandfirmsreacttopolicy.Forthesamereason,theyareabletotrackthesensitivityofthepublicsectorfinanc-estovariationinfactorsthatareoutofreachofdomesticpolicy.
2.2 Risks and stochastic projectionsTheforward-lookingapproachissensitivetotheaccuracyoftheprojections.Uncertaintyinnumerical analysisofpublic finances is typicallyassessedbygeneratingabaseline scenarioandsomealternativesinordertorevealthesensitivityofthebaselinetosomesalientvaria-bles.Forexample,EuropeanCommission(EPC,2009)usesalargeamountofdifferentscenar-iosforthemostimportantvariablestodescribealternativefutures.
Ithaslongbeenknownthatthisscenarioapproachsuffersfrommanyproblems(see,Törn-qvist,1949).Ageneralfindinginnewdemographicstudiesisthatuncertaintyistypicallyun-derestimatedinofficialnationaldemographicforecasts(Andersonetal.2001)andtherebye.g.inpensionexpenditureprojections(LassilaandValkonen,2008a).Asaconsequence,toonar-rowrangeofpolicyalternativesisoftenentertained.Onewaytoavoidthisistousestochas-ticmodels.
Stochasticsustainabilityanalysiscanbedescribedbyfoursteps2.First,alargeamountofsam-plepathsofthekeyvariablesisproducedusingstochasticmodels.Second,futurepublicex-penditure and taxes associated with each of these paths are simulated using an economicmodel.Thirdly,thesimulationresultsaretransformedtosustainabilitygapsorprimarygaps.Fourthly,thepredictivedistributionsofthegapsarepresentedandtheprobabilitiesofunsus-tainablepathsareevaluated.
2 There is also another branch of numerical stochastic sustainability analysis, performed mainly by IMF. It analyses the vulnerability of debt to adverse shocks. Sustainability simulations are performed typically for the short or medium term using highly aggregated econometric models (see e.g. Mendoza and Oviedo, 2004).

ETLA Keskusteluaiheita – Discussion Papers No 12658
Studiesthatutilizestochasticpopulationprojectionsmainlyuseaccountingmodelstoanalyzethesustainabilityofpensionsystems(e.g.,BurdickandManchester2003,Holmer2003,Con-gressionalBudgetOffice(CBO)2001,AuerbachandLee,2006,Keilman,2005).Theexcep-tionsinthislineofresearchareLeeandMiller(2001)andLassilaandValkonen(2004),whostudyhealthcareandCreedyandScopie(2002),whoforecastalsosocialexpenditureswithanaccountingmodel.Themethodofstochasticforecastinghasbeenappliedalsototheunitcostsofhealthcare,seeBoardsofTrustees(2003).TheeffectsofbotheconomicanddemographicuncertaintyonaggregatepublicfinancesarestudiedinasimilaraccountingframeworkbyLeeandTuljapurkar(1998,2001).AlhoandVanne(2006)andSeftonandWeale(2005)usedgen-erationalaccountingtoperformacorrespondingriskanalysis.
Alho et al. (2002) and Alho, Jensen, Lassila and Valkonen (2005) were the first to analyzeageing using a large set of OLG model simulations; the application concerned the Lithua-nianeconomy.Alhoetal.(2008)presentsimilarresultsforsomeothercountries.LassilaandValkonen(2008b)analyzefinancialsustainabilityoftheFinnishpublicsectorusingstochas-ticprojectionstodescribetheuncertainfuturedemographictrendsandassetyields.Theyalsoanalyzethreepolicyoptionsaimedatimprovingsustainability.Longevityadjustmentofpen-sionbenefitsandintroductionofaNDCpensionsystembothreducetheexpectedproblemandnarrowthesustainabilitygapdistribution.Ifpensionfunds investmore inequitiesandexpecttogethigherreturns,thatwouldalsolimitthesustainabilityproblem,butonlywithapreconditionthatpolicymakersinthefuturecanlivewithsubstantiallylargervariationinthevalueofthefundswithoutadjustingtaxrulesorbenefits.
3 Forecasting demographic forecastsTo illustrate how long-term demographic forecasts can change substantially in a relativelyshorttime,Figure1showsfourforecasts,madebetween2002and2009,forthefuturepopula-tioninFinland.Thetotalpopulationwasforecastedin2002tobeabout5millionin2050.Theviewhaschangedgradually,andthelatestforecastisabout6.1millionin2050.Thatmeansa22percentdifferencebetweenforecastsmadeduringsevenyears.
Therewerelargeandsystematicchangesalsointhenumberofworking-agepopulationandthenumberofelderly.Thesechangescanbetracedbacktochangingviewsonfertility,mi-grationandlongevity.Theyhaveaffectedempiricalsustainabilityevaluationsinvariousways.Therearemorepeopleworking (good for tax revenues),more retirees (costly forpublic fi-nances)andpeoplelivelonger(goodforindividualwelfarebutcostlyforpublicfinances).
Figure2showstheforecastsforthenumberofpeopleaged65andover.Althoughthechangeshavebeensignificant,theyallshowthebasicfeatureofanageingsociety:thenumberisgrow-ing.Theissueisquantitative–populationisageingbutwedon’tknowhowmuch.
Statisticalmethodsofexpressingdemographicuncertaintyhavebeendevelopedbymanyre-searchers(seee.g.AlhoandSpencer,2005).Thesemethodsquantifyuncertaintyprobabilis-tically,basedonanalysesofpastdemographicdataandtheviewsofexperts.Fertility,mor-talityandmigrationareconsideredasstochasticprocesses.Theparametersoftheseprocess-esarefittedtomatchtheerrorsofpastforecasts(seeAlhoetal.,2008).Again,judgmentmay

9Fiscal Sustainability and Policy Rules under Changing Demographic Forecasts
1970 1980 1990 2000 2010 2020 2030 2040 2050 20604
4.5
5
5.5
6
4
4.5
5
5.5
6
Mill.Mill.
2002 2004 2007 2009
ETLA
beused.Thereafter,samplepathsforfuturepopulationbyage-groupsaresimulated.Wedealwithdemographicuncertaintybyusingsuchstochasticpopulationprojections.
Wealsoprymore informationoutof stochasticpopulationprojections thanhasbeendonepreviously. In essence, we add demographic forecasts for the future that start in differenttimepoints insimulatedpopulationpaths.Giventheuncertaintyofpopulationforecasting,itmightseemthattryingtoforecastwhatfuturepopulationforecastsarelike,wouldbenear-lyhopeless.Weargue,however,thatforecastsare,forboththeoreticalandpracticalreasons,moreregularthanactualdevelopments.Asapracticalreason,itshouldbementionedthatthedevelopmentoftherecentpastoftenhasaheavyinfluenceonprojectionsoftheremotefuture.
Figure 1 Population in Finland, as forecasted by Statistics Finland
1970 1980 1990 2000 2010 2020 2030 2040 2050 20600.4
0.6
0.8
1
1.2
1.4
1.6
1.8
0.4
0.6
0.8
1
1.2
1.4
1.6
1.8
Mill.Mill.
2002 2004 2007 2009
ETLA
Figure 2 Population in ages 65+ in Finland, as forecasted by Statistics Finland

ETLA Keskusteluaiheita – Discussion Papers No 126510
StochasticpopulationprojectionsareproducedbyacomputerprogramPEP (foradescrip-tion,visithttp://www.joensuu.fi/statistics/juha.html).AnothercomputerprogramFPATH ex-tendstheapplicationofresultsfromPEPtoforward-lookingOLGmodels,whereagentsareallowedtorevisetheirlifetimeeconomicplansastheyrealizethatpopulationhasnotevolvedaccordingtotheexpectedpath.ForthispurposeFPATH calculatesanumericalapproxima-tion to theconditionalexpectationof futurepopulationat futureyears fora (typically ran-dom)subset of pathsWecanthinkoftheconditionalexpectationasbeinga forecast of what would be a forecast inafutureyear.Thismethodologyisnew,andisdescribedinmoredetailinAlho(2011).
Thestochasticprojectionforpopulationinages65+inFinlandispresentedinFigure3.Halfofthesimulationoutcomesareintheshadedareaaroundthemedian.10%oftheoutcomesareabovethe90%lineand10%arebelowthe10%line.
1970 1980 1990 2000 2010 2020 2030 2040 2050 20600.2
0.6
1
1.4
1.8
0.2
0.6
1
1.4
1.8
Mill.Mill.
50 % predictive interval10 % 90 %Median
ETLA
Figure 3 Predictive distribution of population in ages 65+ in Finland
2010 2020 2030 2040 2050 20601
1.2
1.4
1.6
1.8
2
1
1.2
1.4
1.6
1.8
2
Mill.Mill.
ETLA
Figure 4 Population in ages 65+ in Finland in one simulated path
11Fiscal Sustainability and Policy Rules under Changing Demographic Forecasts
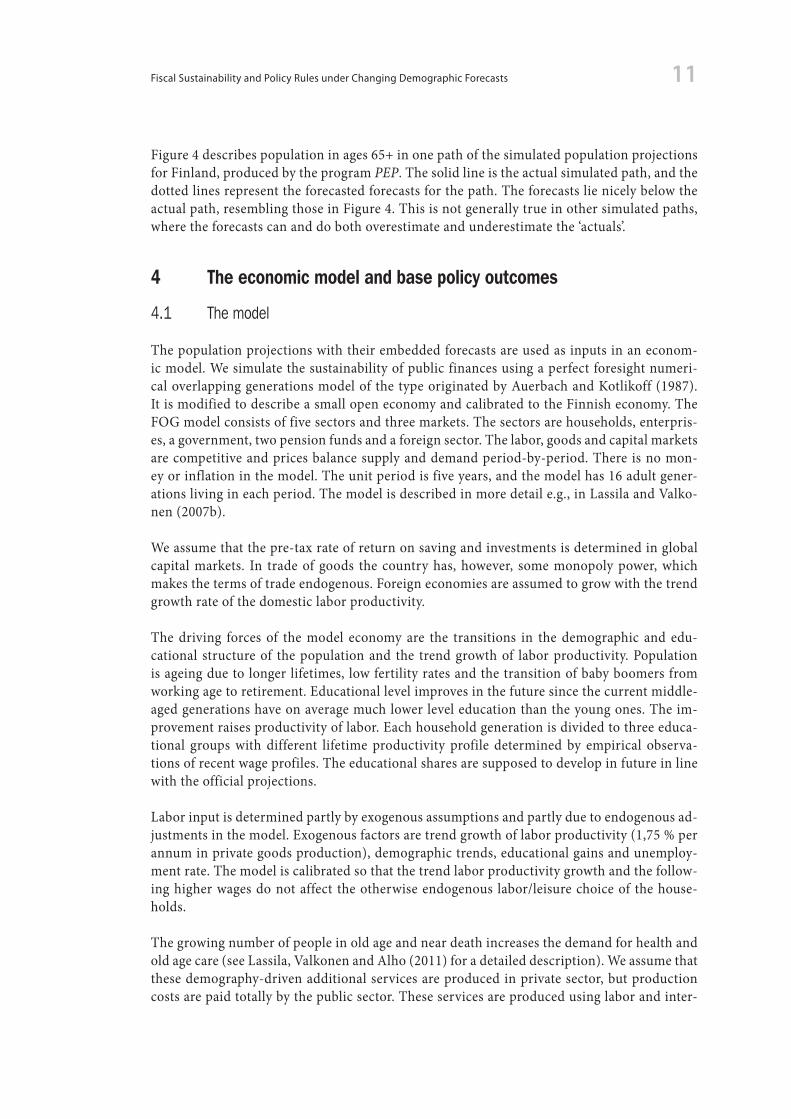
Figure4describespopulationinages65+inonepathofthesimulatedpopulationprojectionsforFinland,producedbytheprogramPEP.Thesolidlineistheactualsimulatedpath,andthedottedlinesrepresenttheforecastedforecastsforthepath.Theforecastslienicelybelowtheactualpath,resemblingthoseinFigure4.Thisisnotgenerallytrueinothersimulatedpaths,wheretheforecastscananddobothoverestimateandunderestimatethe‘actuals’.
4 The economic model and base policy outcomes
4.1 The modelThepopulationprojectionswiththeirembeddedforecastsareusedasinputsinaneconom-icmodel.Wesimulatethesustainabilityofpublicfinancesusingaperfectforesightnumeri-caloverlappinggenerationsmodelofthetypeoriginatedbyAuerbachandKotlikoff(1987).ItismodifiedtodescribeasmallopeneconomyandcalibratedtotheFinnisheconomy.TheFOGmodelconsistsoffivesectorsandthreemarkets.Thesectorsarehouseholds,enterpris-es,agovernment,twopensionfundsandaforeignsector.Thelabor,goodsandcapitalmarketsarecompetitiveandpricesbalancesupplyanddemandperiod-by-period.There isnomon-eyorinflationinthemodel.Theunitperiodisfiveyears,andthemodelhas16adultgener-ationslivingineachperiod.Themodelisdescribedinmoredetaile.g.,inLassilaandValko-nen(2007b).
Weassumethatthepre-taxrateofreturnonsavingandinvestmentsisdeterminedinglobalcapital markets. In trade of goods the country has, however, some monopoly power, whichmakesthetermsoftradeendogenous.Foreigneconomiesareassumedtogrowwiththetrendgrowthrateofthedomesticlaborproductivity.
The driving forces of the model economy are the transitions in the demographic and edu-cational structureof thepopulationand the trendgrowthof laborproductivity.Populationisageingduetolongerlifetimes,lowfertilityratesandthetransitionofbabyboomersfromworkingagetoretirement.Educationallevelimprovesinthefuturesincethecurrentmiddle-agedgenerationshaveonaveragemuchlowerleveleducationthantheyoungones.Theim-provementraisesproductivityoflabor.Eachhouseholdgenerationisdividedtothreeeduca-tional groups with different lifetime productivity profile determined by empirical observa-tionsofrecentwageprofiles.Theeducationalsharesaresupposedtodevelopinfutureinlinewiththeofficialprojections.
Laborinputisdeterminedpartlybyexogenousassumptionsandpartlyduetoendogenousad-justmentsinthemodel.Exogenousfactorsaretrendgrowthoflaborproductivity(1,75%perannuminprivategoodsproduction),demographictrends,educationalgainsandunemploy-mentrate.Themodeliscalibratedsothatthetrendlaborproductivitygrowthandthefollow-inghigherwagesdonotaffect theotherwiseendogenous labor/leisurechoiceof thehouse-holds.
Thegrowingnumberofpeopleinoldageandneardeathincreasesthedemandforhealthandoldagecare(seeLassila,ValkonenandAlho(2011)foradetaileddescription).Weassumethatthesedemography-drivenadditionalservicesareproducedinprivatesector,butproductioncostsarepaidtotallybythepublicsector.Theseservicesareproducedusinglaborandinter-

ETLA Keskusteluaiheita – Discussion Papers No 126512
mediategoodsasinputs.Thereisnoproductivitygrowthintheproduction.Thesharesofem-ployeesinprivateandpublicsectorarekeptconstant.
Realwageadjuststoequalizethevalueofmarginalproductoflaborandlaborcostsinthepro-ductionofprivategoodsandservices.Therestoftheworkers,whoprovidetax-fundedserv-icesproducedinprivateandpublicsector,earnthesamewage.
Publicexpenditureshavestrongconnectiontotheageofindividuals.Provisionofpublicserv-ices isallocatedmainlyeither to theearlypartof the lifecycle (daycareandeducation)ortothelasttenyears(healthcareandoldagecare).Similarly,incometransfersaredistributedmainlyeithertoyoungfamiliesortoretiredindividuals.Thisiswhythechangesinthede-mographicstructurearesoimportantforthepublicexpenditures.Weassumethatallincometransfers(excepttheearning-relatedpensions)arefullyindexedtowagesbecauseanyotherassumptionwouldhavedramaticconsequencestoincomedistributionintheverylongtermanalysis.Otherthanage-relatedexpenditureisassumedtogrowatthesamerateastheGDP.
Revenuesofthepublicsectororiginatefromtwotypesofsourcesinthemodel.Themajorityofthereceiptsareaccumulatedbyincometaxes,consumptiontaxesandsocialsecuritycontri-butions.Anothernoteworthyrevenuesourceistheyieldofthepublicsectorwealth.Theyieldofthewealthisimportantespeciallyforthepensionfunds,butalsothecentralgovernmenthassubstantialamountoffinancialassets.
Weassumethatthemodeledmainsubsectorsofthegeneralgovernment,suchasthemunici-palsector,thepublicandtheprivatesectorpensionfundandthenationalsocialsecurityin-stitute,havetheirownbudgets,whicharebalancedeitherbysocialsecuritycontributionsorearnedincometaxes.Theonlyexceptionisthestatebudget,whichisbalancedbyborrowinguntil2145,andafterthatbyusingalumpsumtransfer.Earnedincometaxbracketsareadjust-edwiththegrowthoftheeconomy.Thepensionfundsfollowtheircurrentprefundingplans,andpensioncontributionsareendogenous.Householdsreacttotheincomeandsubstitutioneffectsoftaxationandsocialsecuritycontributions.
Inouranalysiswesubstitutetheperfectforesightassumptionwithamorerealisticapproachwheredecisionmakerssequentiallyoptimizetheirbehaviouraccordingtoreviseddemograph-icforecasts.Wejustifytheuseofarevisedforecastsmethodologybytwopoints:First,itseemsclear that households do not take uncertainties related to their future contribution rates orbenefitsfullyintoaccountwhenmakingtheirsavingsandlaboursupplydecisions.Theseun-certaintiesareveryseldomdiscussed,letalonequantified,inpopularpress.Second,bymak-ing the extreme assumption that households ignore these uncertainties altogether and basetheirdecisionsondeterministicforecasts,isawayofavoidingthedifficultiesrelatedtogener-alequilibriumheterogeneousagentmodelswithaggregateuncertainty.Thisallowsustouseamodelthatincludesdetaileddescriptionsofrathercomplexpensionandotherwelfaresystems.
4.2 Base policy outcomesThereisabasepolicyplanthatisthesameineachofthe200modelruns.Inthisplan,welfaretransfersandservicesareprovidedaccordingtocurrentrulesandpractices.Mandatorypen-sioncontributionsadapttopensionexpenditure,whichvaryfromonedemographicpathto

13Fiscal Sustainability and Policy Rules under Changing Demographic Forecasts
another.Aggregatehealthandlong-termcarecostsdependonpopulationagestructureandproximitytodeath.Theyarefinancedbymunicipaltaxes,whichthusalsodependondemo-graphicvariables.PartofhealthandLTCis,however,financedbystateaidtomunicipalities.Statetaxratesareheldconstant,sovariationinexpenditureandtaxbasescausesvariationinpublicdebt.Wedescribetheoutcomesofthisbasepolicyongrosspublicdebtandonatotaltaxmeasure,whichincludesthepensioncontributionrate,municipaltaxesandallstatetaxes.BothdebtandtaxesarerelatedtoGDP.
Figure 5 Public debt and taxes in Finland in the non-stochastic scenario
40 45 50 Total taxes / GDP, %0
20
40
60
80
100
120
140
0
20
40
60
80
100
120
140Public debt, % GDP
Reinhart-Rogoff
Maastricht
Finland2000
Sweden2000
2010 2060
ETLA 20.12.2011
IfdemographicsevolveaccordingtoStatisticsFinland’sprojection,thebasepolicyleadstoin-creasingtaxesinrelationtoGDP,andkeepspublicindebtednessroughlyatthecurrentlevelduringthecomingdecades.Sincetotaltaxes/GDPstayswellbelowtheleveltheywerein2000–ahistoricalrecord–thebasepolicycouldbedescribedassustainable.Butthatiscondition-alonthedemographics.
Figure6describeswhatkindofoutcomesin2060s3wecanexpectthebasepolicytoproduceunderdemographicuncertainty.Eachdotrepresentsthesituationinonepopulationpath.Theoutcomesare separatedonlybydemographicdevelopments, and theeconomic reactions tobothexpectedandactualizeddemographicsthatourmodelgives.
Inanageingsociety, it is thenatureof thisbasepolicy that taxeswill increase.Butbyhowmuch, that we don’t know but can make probabilistic statements about. As each stochasticpopulationpathisequallylikely,andthusalsothedotsinFigure4areequallylikely,count-ingthedotsindifferentpartsyieldscorrespondingprobabilities.Thetaxratiohasaboutone-thirdchanceofexceedingthehighestvaluethusfarinFinland,47,2%in2000.Inallsimula-tionsthetaxratestaysbelowthatinSwedenin2000,50,8%ofGDP,whichisthehighestraterecordedinEU’staxstatistics.
Despitegrowingtaxrates,indebtednessisalsolikelytoincrease.ThedebtratioislikelytoriseovertheMaastrichtlimit,andwitha10%probabilityoverthe90%levelthatReinhartandRogoff(2010)considerharmfulforeconomicgrowth.
3 The model’s unit period is 5 years. Thus ‘2060s’ refers to years 2060–64 for flow variables such as GDP, and to end of 2064 situation for stock variables such as debt.

ETLA Keskusteluaiheita – Discussion Papers No 126514
Whetherthispolicylinewouldbesustainableornot,isamatterofopinion.Somemayfindmostoftheoutcomesgenerallyplausible,othersperhapsnot.Butcertainlythepossibilityofproblemscannotberuledout.Thereisabout30%chanceoftaxesbecominghigherthaneverbeforeinFinlandandatthesametimedebtexceedingtheMaastrichtcriterion.Furthermore,thereisan8,5%chancefortheverydifficultoutcomethattaxratesarehigherthanin2000andindebtednessexceeds90%(seeTable1inthefollowingsection).
5 Expected sustainability and policy rules
5.1 Enhancing sustainability with VAT increasesThe base policy contains many rules. Besides those concerning pension contributions andmunicipaltaxes,thereislongevityadjustmentofpensionbenefits,andseveralindexingrules.Stillitseemsfromthe2060outcomesthatfiscalpolicydoesnotreacttoexpecteddifficultiesinpublicfinancesinasufficientmanner.Inmanyempiricalsustainabilityanalysesthisisthecasethroughout,asLeeper(2010)criticizes.Inmodel-basedanalysis,suchasours,wecangofurtherandstudytheeffectsofspecificadditionalpolicyrules.
Thefirstpolicyrulewestudyrelatestaxationtotheviewaboutfiscalsustainabilitythatpre-vailsatdifferenttimepoints.Heuristically,weassumethateachtimethedemographicfore-castisrevised,theministryoffinanceorsomeotherfiscalauthoritypublishesitsassessmentonthesustainabilityofpublicfinances,intheformofsustainabilitygap.InthepolicyrulewethentieincreasesintheVATratetothesustainabilitygap.
Thesecondpolicyruleslooksatforecastsofpublicdebtthatareupdatedeachtimeanewpop-ulationforecastismade.AnincreaseintheVATrateistriggeredbyahighforecastedlevelofthedebt/GDPratio.Thethirdpolicyruleisacombinationofthefirsttworules.
Thesustainabilitygapisthedifferencebetweenahypotheticalconstanttaxrateandtheinitialtaxrate.Theconstanttaxrateshouldbesuchthat,ifimplementedimmediately,itwouldex-
Figure 6 Public debt and taxes in Finland in 2060s
40 45 50 Total taxes / GDP, %0
20
40
60
80
100
120
140
0
20
40
60
80
100
120
140Public debt, % GDP
Reinhart-Rogoff
Maastricht
Finland2000
Sweden2000
2010
ETLA 26.8.2011

15Fiscal Sustainability and Policy Rules under Changing Demographic Forecasts
actlysufficetopaytheprojectedpublicexpenditureandkeepnetpublicwealthontheinitiallevel.Wearethususingthes2definitionofthegap.
LetY(i,t)andp(i,t) denoteGDPandthetotaltaxrateinsimulation i inperiodt,V(i,t)thepublicdebtattheendofperiodt,andp(t(0)) theinitialtaxlevel.Thebondyieldr isassumedtobeconstant.TheT-period-aheadsustainabilitygaps2,calculatedinperiodt(0)isthen
[1]
whereD(i,t)isthediscountfactor
[2]
The first part in the numerator shows how much future changes in pension contributionsandmunicipaltaxescontributetothegap.Thesecondpartisthecontributionofthechangeinpublicdebt.Thedesiredlevelofthedebthereissuchthatthedebt/GDPratioremainsthesame.
Policyrule1:iftheexpectedsustainabilitygaps2,overa50-yearhorizon,exceedsthreeper-centagepoints,thentheVATrateisincreasedpermanentlybytwopercentagepoints.
Policyrule2:ifpublicdebt/GDPisforecastedtoexceed90%within50years,thentheVATrateisincreasedpermanentlybytwopercentagepoints.
Policyrule3:iftheexpectedsustainabilitygap,overa50-yearhorizon,exceedsthreepercent-agepoints,orpublicdebt/GDPisforecastedtoexceed90%within50years,thentheVATrateisincreasedpermanentlybytwopercentagepoints.
The2060outcomesofthesepolicyrulesareinFigure7below.Thebasepolicyoutcomesaredenotedbysmalldots,andotherpolicyoutcomesbycircles.Thebiggerdarkdotsarecom-binationsofsmalldotsandcircles,andoccurwhentheeconomicdevelopmentonthedemo-graphicpathinquestiondoesnotwarrantanypolicychangesduetothecriteriaofpolicyrules1,2or3.
Forcomparison,thetop-leftcorner(Fig.7a)presentstheoutcomeswithasimplerpolicy:theVATrateisincreasedby2%-pointsinallpathsin2015.ThisunconditionalVATriseseemslikeagoodpolicywithrespecttoexpectedindebtedness,comparedtothebasepolicyplan.Thedebt ratio ismuch less likely to riseover theMaastricht limitand theReinhart-Rogofflimit.Thereisonlyabout10%chanceofbothtaxesanddebttoendoutsidethenormalarea.Furthermore,thechanceoftheverydifficultoutcomethatindebtednessexceeds90%andatthesametimetaxesexceedthecurrentrecordlevelof2000hasdeclinedfrom8,5%to1%.
ThedownsideoftheunconditionalVATriseisthattaxratiosarehigherinallpaths.TheVATincreasecouldbeconsideredunnecessaryforthosepopulationpathswherethebaseoutcomestayedinthenormaltax-debtregion,andthatgroupconsistsofoverathirdofallpaths.
[ ](0)
(0)(0)
(0)
( , (0) )( , ) ( (0)) ( , ) ( , ) ( , (0) ) ( , (0) 1) ( , (0) )( , (0))
2( , (0), )( , ) ( , )
t T
t tt T
t t
Y i t Ti t t Y i t D i t V i t T V i t D i t TY i t
s i t TY i t D i t
τ τ+
=+
=
+− + + − − +
=∑
∑
( (0))( , ) (1 ) t tD i t r − −= +

ETLA Keskusteluaiheita – Discussion Papers No 126516
Thethreeconditionalpolicyrulesavoidincreasingtaxes inmanycaseswheretheincreaseswouldlaterbedeemedunnecessary.Theyalsofailtoincreasetaxesinsomecaseswherein-creaseswouldbeneededtoavoidgrowingindebtedness.Policyrule2,basedonforecastedin-debtednessinthebasepolicy,seemstoproduceareasonablebalancebetweenthetwopitfalls.
InTable1the200simulationoutcomesin2060aredividedintoseveralcategories.NormaltaxratesarethosebelowtheFinnish2000totaltaxrate,47,2%ofGDP.Highisanytaxrateabovethenormal,andveryhightaxratesarethoseabovetheSwedishrecord,50,8%ofGDP,andthusareunprecedented.Publicgrossdebt,aspercentofGDP,isconsiderednormalifitisbe-lowtheMaastrichttreatylevelof60%.Abovethattheyarehigh,andiftheyexceedthe90%leveltheyareclassifiedasveryhigh.Theselimitsareofcoursearbitrarybutserveapurpose.Thedebtlimitsareself-evident;60%isbasedonEUpoliciesand90%isbasedonanexten-sivestudybyReinhartandRogoff.Taxratelimitsaremorecountry-specific.ThechosentaxlimitsarefamiliartoNordicaudiences,butanalysesofsustainabilityine.g.theMediterraneancountriesshouldprobablyusemuchlowerlimits.
Sustainabilitygapdoesnotseemtoperformwellasavariableonwhichtoconditionthepol-icy.Thereasonisthatthebasepolicyleadstograduallyincreasingtaxesinmostsimulations,
Figure 7 Public debt and taxes in 2060s under different policy rules
7a Unconditional VAT increase
43 45 47 49Gross tax rate-200
20
40
60
80
100
120
140
-200
20
40
60
80
100
120
140Public debt, % GDP
43 45 47 49Gross tax rate-20
0
20
40
60
80
100
120
140
-200
20
40
60
80
100
120
140Public debt, % GDP
7b Policy rule 1
7c Policy rule 2
43 45 47 49Gross tax rate-200
20
40
60
80
100
120
140
-200
20
40
60
80
100
120
140Public debt, % GDP
43 45 47 49Gross tax rate-20
0
20
40
60
80
100
120
140
-200
20
40
60
80
100
120
140Public debt, % GDP
ETLA 1.8.2011
7d Policy rule 3

17Fiscal Sustainability and Policy Rules under Changing Demographic Forecasts
andthegapdiminishes intime,because it isalwayscalculatedonthetaxratethat isactualatthetime.ThusafixedthresholdvalueasinPolicyrule1mayleadtoaVATincreaseinthefirstperiod,butifitdoesnot,itwilldosoonlyseveraldecadesinthefuture(seeFigure2AintheAppendix).
ThesizeofthetriggeredVATincreaseisofcourseimportantfortheresults.Appendixcon-tainssomeresultsforsmallerincreases.Italsocontainsfiguresshowingthedistributionsofthresholdvariablesthatareusedinthepolicyrules.
Table 1 Base policy and policy rule outcomes in 2060s (share of cases in different debt-tax categories, %)
16
normal, and very high tax rates are those above the Swedish record, 50.8 % of GDP, and thus are unprecedented. Public gross debt, as per cent of GDP, is considered normal if it is below the Maastricht treaty level of 60%. Above that they are high, and if they exceed the 90 % level they are classified as very high. These limits are of course arbitrary but serve a purpose. The debt limits are self-evident; 60 % is based on EU policies and 90 % is based on an extensive study by Reinhart and Rogoff. Tax rate limits are more country-specific. The chosen tax limits are familiar to Nordic audiences, but analyses of sustainability in e.g. the Mediterranean countries should probably use much lower limits. Table 1: Base policy and policy rule outcomes in 2060s
(share of cases in different debt-tax categories, %) Base
policy VAT
increasedin all
cases in 2015
VAT increased when gap
> 3 %
VAT increased
when debt/GDP forecast to
exceed 90 % within 50
years
VAT increased when either gap
> 3 % and/or debt/GDP forecast to
exceed 90 % within 50 years
Normal debt and normal taxes Normal debt and high taxes Normal debt, total
37,5
5, 0
42,5
52,0
36,0
88,0
39.0
12,0
51,0
50,5
11,5
62,0
49,5
17,0
66,5
High debt and normal taxes High debt and high taxes High debt, total
26,0
21,0
47,0
1,0
10,0
11,0
22,5
21,5
44,0
8,0
27,5
35,5
8,0
24,0
32,0
Very high debt and normal taxes Very high debt and high taxes Very high debt, total
2,0
8,5
10,5
0,0
1,0
1,0
1,5
3,5
5,0
0,0
2,5
2,5
0,0
1,5
1,5
Normal taxes, total
High taxes, total
65,5
34,5
53,0
47,0
63,0
37,0
58,5
41,5
57,5
42,5 Sustainability gap does not seem to perform well as a variable on which to condition the policy. The reason is that the base policy leads to gradually increasing taxes in most simulations, and the gap diminishes in time, because it is always calculated on the tax rate that is actual at the time. Thus a

ETLA Keskusteluaiheita – Discussion Papers No 126518
17
fixed threshold value as in Policy rule 1 may lead to a VAT increase in the first period, but if it does not, it will do so only several decades in the future (see Figure 2A in the Appendix). The size of the triggered VAT increase is of course important for the results. Appendix contains some results for smaller increases. It also contains figures showing the distributions of threshold variables that are used in the policy rules.
On the length of the forecast horizon in forecast-based policy rules Table 2: Forecast-based policy rule outcomes in 2060s with different forecast horizons
(share of cases in different debt-tax categories, %) Base
policy VAT
increased when
debt/GDP observed to exceed
60 %
VAT increased
when debt/GDP forecast to exceed 60 % within 5 years
VAT increased
when debt/GDP forecast to
exceed 60 % within 10
years
VAT increased
when debt/GDP forecast to
exceed 60 % within 20
years
VAT increased
when debt/GDP forecast to
exceed 60 % within 50
years Normal debt and normal taxes Normal debt and high taxes Normal debt, total
37,5
5, 0
42,5
48,0
18,0
66,0
51,5
22,5
74,0
54,0
25,0
79,0
54,5
31,0
85,5
53,0
34,0
87,0
High debt and normal taxes High debt and high taxes High debt, total
26,0
21,0
47,0
9,0
22,5
31,5
5,0
19,5
24,5
2,0
17,5
19,5
1,5
11,5
13,0
1,0
11,0
12,0
Very high debt and normal taxes Very high debt and high taxes Very high debt, total
2,0
8,5
10,5
0,0
2,5
2,5
0,0
1,5
1,5
0,0
1,5
1,5
0,0
1,5
1,5
0,0
1,0
1,0
Normal taxes, total
High taxes, total
65,5
34,5
57,0
43,0
56,5
43,5
56,0
44,0
56,0
44,0
54,0
46,0
5.2 On the length of the forecast horizon in forecast-based policy rules
Weshouldnotethatreactingtodebtdevelopmentcertainlyimprovesthesituation,nomatterwhatthehorizonis.Butjustlookingatforecasts5yearsahead,comparedtoreactingtoob-serveddebt,markedlyimprovesthechancestostaybelowtheMaastrichtlimit.Roughly,thechancesimprovefromtwothirdstothreequarters.Relyingonevenlongerforecastsimprovesthechances,butafter20yearstheimprovementslowsdown.
Sincethedebtandtaxlimitsinthetablesabovearesomewhatarbitrary,wealsolookattheen-tiredistributionsofoutcomesin2060sunderdifferentforecasthorizons,inFigure8.
Table 2 Forecast-based policy rule outcomes in 2060s with different forecast horizons (share of cases in different debt-tax categories, %)

19Fiscal Sustainability and Policy Rules under Changing Demographic Forecasts
Figure 8 Predictive distribution of public debt/GDP ratio in 2060s when VAT increases are conditioned on forecasted debt/GDP ratios with forecast horizons from 0 to 50 years
0 5 10 15 20 25 30 35 40 45 500
20
40
60
0
20
40
60
%%
10 %25 %Median75 %90 %
Wenoticethattheupmostdecile limitdeclinesuptoforecasthorizonof20yearsandstaysroughlyconstantthereafter.Theupperquartileandthemediandeclinelonger,buttherateofdeclineslowsdownafterthe35yearhorizon.Thelowerquartileandthelowestdecilelimitsdeclineuptoforecasthorizonof30years.
Althoughtheeffectoftheforecasthorizoninthepolicyrulevarieswiththeexactstatisticonelooksat,inallcasesimprovementoccursuptill20years.Usingthe20-yearhorizon,theim-provementinthedebtoutlookin2060sishuge,asFigure9shows.Theexpecteddebt/GDP
Figure 9 Frequency distribution of public debt, as % of GDP, in the 2060s
0 10 20 30 40 50 60 70 80 90 Public debt, % GDP0
5
10
15
20
25
0
5
10
15
20
25
Freq. %Freq. %
Policy rule: VAT conditional on 20 year forecast of public debt /GDP ratio
BaselinePolicy rule

ETLA Keskusteluaiheita – Discussion Papers No 126520
ratio,markedwithacircle,fallsfromthebaseline’s65%toabout45%iftheVATincreaseisconditionedonforecastswith20-yearhorizon.Thelikelihoodofdebtratiosover60%hasre-duceddramatically.
Atthesametime,thelikelihoodofhightaxrateshasnotrisenverymuch.Theexpectedtaxratioin2060shasrisenfrom46,9%to47,2%.Thecrucialthingisthetimingofthetaxin-crease:ifdemographicsturnouttorequirehighertaxes,topreventexcessindebtedness,itisbesttomakethetaxincreaseasearlyaspossible.
6 Tax policy effects on future sustainability outlookWemayalso lookat tax levels thatarepredicted tobesustainableatdifferent times.Theseconsistoftwoparts,theactualtaxlevelandthesustainabilitygap.Wethinkitisimportanttolookatthesesustainabletaxlevelsespeciallyattheendofthe50-yearperiodthatwehaveusedinouranalysisthusfar.Itremindsusthatthefarfutureshouldnotgounnoticedinsustaina-bilityanalysis,eventhoughitisdifficulttoattachnumberstoit.50yearsistooshortaperiodtogetawidergenerationalviewofthesustainabilityissuesinanageingsociety.
Sustainabletaxlevelsthatarepredictedin2060alsoreflectandsummarizethepoliciesthathavebeencarriedoutbefore2060.Intuitively it isclear thatabetterstartingpoint in2060,suchasonewithalowerdebt,yieldsalowersustainabletaxlevel,iftheexpectedfutureises-sentially thesame. If the lowerdebt is theresultofanearlier tax increase, then the issue iswhethertheeconomicdevelopmentisaffectedbythistaxincreasesomuchthatitisnotthesameorevencloseintheforecasts,althoughthedemographicforecastisthesame.ThisistheLafferissue,andourmodelseemstooperateontherisingpartoftheLaffercurve.
Thusthesimulatedoutcomesfor2060inthedebt-taxspacehavethestructureofFigure11:Thebaseoutcome(1)hasahigherdebtandlowertaxratethantheoutcomewithahigherVAT
Figure 10 Frequency distribution of total taxes, as % of GDP, in the 2060s
45 46 47 48 49 50 Total taxes / GDP, %02
4
6
8
10
12
14
16
18
20
02
4
6
8
10
12
14
16
18
20Freq. %Freq. %
Policy rule: VAT conditional on 20 year forecast of public debt /GDP ratio
BaselinePolicy rule

21Fiscal Sustainability and Policy Rules under Changing Demographic Forecasts
Figure 11 Schematic structure of tax rates, sustainable tax rates and public debt
Gross tax rate
Public debt, % GDP
1
2
3
4
Figure 12 Sustainability outlook in 2060
12a. Effects of unconditional VAT increase
43 46 49 52 Sustainablegross tax rate
-200
20
40
60
80
100
120
140
-200
20
40
60
80
100
120
140Public debt, % GDP
43 46 49 52 Sustainablegross tax rate
-200
20
40
60
80
100
120
140
-200
20
40
60
80
100
120
140Public debt, % GDP
12b. Effects of policy rule 1
12c. Effects of policy rule 2
43 46 49 52 Sustainablegross tax rate
-200
20
40
60
80
100
120
140
-200
20
40
60
80
100
120
140Public debt, % GDP
43 46 49 52 Sustainablegross tax rate
-200
20
40
60
80
100
120
140
-200
20
40
60
80
100
120
140Public debt, % GDP
12d. Effects of policy rule 3

ETLA Keskusteluaiheita – Discussion Papers No 126522
Table 3 Sustainability outlook in 2060 with different policies (share of cases, %)
22
Table 3: Sustainability outlook in 2060 with different policies (share of cases, %) Base
policy VAT
increased in all
cases in 2015
VAT increased when gap
> 3 %
VAT increased
when debt/GDP forecast to
exceed 90 % within 50 years
VAT increased when either gap >
3 % and/or debt/GDP
forecast to exceed 90 % within 50
years Normal debt and normal sustainable taxes Normal debt and high sustainable taxes Normal debt and very high sustainable taxes Normal debt, total
3,5
36,0
3,0
42,5
20,5
62,5
5,0
88,0
4,5
43,5
3,0
51,0
12,0
45,5
4,5
62,0
12,0
50,5
4,0
66,5
High debt and normal sustainable taxes High debt and high sustainable taxes High debt and very high sustainable taxes High debt, total
9,5
35,0
2,5
47,0
2,0
7,0
2,0
11,0
9,5
31,0
3,5
44,0
5,5
28,0
2,0
35,5
5,5
24,0
2,5
32,0
Very high debt and normal sustainable taxes Very high debt and high sustainable taxes Very high debt and very high taxes Very high debt, total
1,0
7,5
2,0
10,5
0,0
1,0
0,0
1,0
0,5
4,0
0,5
5,0
0,0
1,5
1,0
2,5
0,0
1,0
0,5
1,5
Normal sustainable taxes, total
High sustainable taxes, total Very high sustainable taxes, total
14,0
78,5
7,5
22,5
70,5
7,0
14,5
78,5
7,0
17,5
75,0
7,5
17,5
75,5
7,0

23Fiscal Sustainability and Policy Rules under Changing Demographic Forecasts
rate(2).Thesustainabletaxinthebasecase(3)istypicallyhigherthantheactualtaxrate(butnotalways),reflectingthe fact thatpopulationageingwillcontinueafter2060 inmostpro-jections.ThesustainabletaxrateoftheincreasedVATcase(4)isinouranalysisalwayslowerthanthatinthebasecase,becauseincreasedtaxrevenueshavealreadycumulatedintoalow-erpublicdebt4.
Thesustainabilityoutlookin2060isusuallyworsethantheprojected ‘actual’debt-taxsitu-ationin2060.Eventhoughthereisoveraone-thirdchanceinstayinginthenormalareainactualoutcomesofthebasepolicy,thesustainabilityoutlookwillstaythereonlywithaverysmallprobability(Table3).Ontheotherend,sustainabletaxratesexceedtheSwedishrecordlevelin7,5%ofthecases.
Thepolicyruleshaveallimprovedthesustainabilityoutlook.Mostofthisimprovementisvis-ibleindebtratios,butduetothefeaturedescribedinFigure5,sustainabletaxratesarealwayslowerifthethresholdofthepolicyrulehasbeenmetandanincreaseinVATtriggered.
7 ConclusionsAnalysingfiscalsustainabilityandcalculatingsustainabilitygapsreliesheavilyondemograph-icprojections.Theseprojectionsarechangedatregularorirregularintervals.Thesechangesarenotalwaysminor–infacttheyareoftenlarge.Inthispaperwehaveanalysedwhatim-plicationstheseinevitablechangeshaveforsustainabilityanalysisandforpolicyconclusions.
Wehave focusedon the fiscalpressures that financingpensions,healthand long-termcare(LTC)expenditurewillbringaboutinageingFinland.Weaskwhetherthesystemwherepen-sionsarefinancedbycontributionsandhealthandLTCbymunicipaltaxesandstateaidissus-tainableinthespecificsensethatcitizenscanrelyonreceivingtheservicesinthefuture.Asthefutureisinevitablyuncertain,nodefiniteanswercanbegiven.Wecan,however,quantifysomeuncertaintiesandillustrateandevaluatetheireffects.Wecanformaprobabilisticviewof the public debt and taxation developments that financing pensions, health and LTC willcause.Thisviewthenservesasabasisforourevaluationofthesustainabilityofthesystem,or,phraseddifferently,ofthecredibilityofthepromiseconcerningpubliclyfinancedpensionandhealthandLTCservicesinthefuture.
Wechosethetimespansothatitshouldsufficeforthosewhoareabouttoleavethelabormar-ket.Ifoneis50,thenthehorizonshouldbeatleast50years,forlivingupto100yearswillnotberare.Ifa50-yearolddoesnotthinkthatpromisesconcerningfuturewelfareservicesarefullycredible,sheorhestillhas10–20yearstotakeindividualprecautionarymeasureswhilebeingpartofthelaborforce.
7.1 General assessment of sustainabilityEvenwithourassumptionsoffuturehealthandLTCdemand,whicharelowcomparedtothoseusedinotherfiscalprojectionsmadeforFinland,difficultiesinsustainabilityloomlarge.
4 In fact, assuming that the GDP path is not affected at all by the tax increase, the decline in the sustainable tax level could be derived from equation (1).

ETLA Keskusteluaiheita – Discussion Papers No 126524
Inourbaselinepolicy,municipaltaxesadjusttohealthandLTCexpendituresandchangesinthetaxbase,andpensioncontributionsadjusttopensionoutlays.Inanageingsociety,itisthenatureofthisbaselinepolicythattaxeswillincrease.Thetotaltax/GDPratiohasaboutone-thirdchanceofexceedingthehighestvaluethusfarinFinland,47,2%in2000.Inallsimula-tionsthetaxratestaysbelowthatinSwedenin2000,51,8%ofGDP,whichisthehighestraterecordedinEU’staxstatistics.
Despitegrowingtaxrates,indebtednessisalsolikelytoincrease.ThedebtratioislikelytoriseovertheMaastrichtlimit,andwitha10%probabilityoverthe90%levelthatReinhartandRogoff(2010)considerharmfulforeconomicgrowth.
Whether thispolicy linewouldbesustainableornot, isamatterofopinion.Somemayfindmostoftheoutcomesgenerallyplausible,othersnot.Butasfuturepensionersandusersofthesewelfareserviceswearenotsatisfiedwiththeoutlook.Thepossibilityofproblemsistoohigh.There isabout30%chanceof taxesbecominghigherthaneverbefore inFinlandandat thesametimedebtexceedingtheMaastrichtcriterion.Furthermore,thereisan8,5%chancefortheverydifficultoutcomethattaxratesarehigherthanin2000andindebtednessexceeds90%.Wethinkthat,withthebaselinepolicy,thelikelihoodofcutsinwelfaretransfersandservicesinthefutureistoohigh,ifthesecutswillcomeassurprisesandleavecitizenslittletimetopre-parefortheminadvance.Thussomepolicyamendmentsoralternativesshouldbeconsidered.
7.2 Policy lessonsCan thewelfare statedobetter?Yes.Although themagnitudesofageingareuncertain,andforecasterrorsprobablylarge,ageingpoliciescanandmustrespondinadvance.Uncertaintyshouldnotimplyinaction.Inactionisapolicychoice,andherearatherpoorone.Oursimu-lationsshowthatforecastscontaininformationandcanbeusedinpolicydesign.
Wefirststudyalternativeswherethestatereactstothesustainabilitygap.Theactionisaper-manent increase in the VAT rate. Secondly, we study policies where the VAT rise is condi-tionedontheactualorforecastedpublicdebtdevelopmentinsteadofthesustainabilitygap.Theselatterpoliciesturnouttobemoreeffectiveinpreventingexcessindebtedness.Sustain-abilitygapdoesnotseemtoperformwellasavariableonwhichtoconditionthepolicy.Thereasonisthatthebasepolicyinourstudyleadstograduallyincreasingtaxesinmostsimula-tions,andthesustainabilitygapdiminishesintime,becauseitisalwayscalculatedonthetaxratethatisactualatthetime.Thusapolicybasedonafixedthresholdvalueofthesustaina-bilitygapmayleadtoaVATincreaseinthefirstperiod,butifitdoesn’t,itwilldosoonlyaf-tersomedecades.
Our simulations indicated that high indebtedness became less likely if the VAT policy wasconditionedonforecasteddebtdevelopmentinsteadofobserved.Althoughtheeffectoftheforecasthorizoninthepolicyrulevarieswiththeexactstatisticonelooksat,inallcasesim-provementoccursup till 20years.Using the20-yearhorizon, the improvementof thedebtoutlookin2060sishuge.Theexpecteddebt/GDPratiofallstoabout45%fromthebaselinevalueof65%.Atthesametime,thelikelihoodofhightaxratesdoesnotriseverymuch.Theexpectedtaxratioin2060shasrisenfrom46,9%to47,2%.Thecrucialthingisthetimingofthetaxincrease:ifdemographicsturnouttorequirehighertaxes,topreventexcessindebted-

25Fiscal Sustainability and Policy Rules under Changing Demographic Forecasts
ness,itisbesttomakethetaxincreaseasearlyaspossible.Ontheotherhand,demographicsmayalsoturnouttobemorepositivethanexpected,whichweakensthecaseofanyuncondi-tionalinitialtaxincrease.
Amoregeneralpolicylessonisthatthereshouldbeaplanforworsethanexpectedfuturede-velopments.Actionscanincludepostponedconditionalmeasures.Theyshouldformacoher-entprogram,withwell-definedthresholds.Theyshouldalsobecredible;arequirementthatmaybedifficulttooperationalize,butaslongasthesituationisgoodorlooksgood,relyingonfutureactionsmaybeaviableoption.
Thereisnotmuchpointinarguingabouttheexactsizeofthesustainabilitygap.Thequestioniswhetherthepolicycurrentlyonbooksissustainableintheforeseeablefuturewithareason-ableprobability.Relyingonexpecteddevelopments,witha50%probability,isnotreasonable.Certaintyisnotachievable,buttheriskcanbereduced.
Thepolicyruleanalysiscouldhavebeenusedtoderivealsothewelfareeffectsofdifferentpol-icychoicesinaddressingsustainabilityproblems.Thiscouldbeespeciallyusefulwhencon-sideringpostponingdecisions.Theircosts,andwhomtheyoccurto,canbeillustrated,thusavoidingoneofthecriticalfaultsinusingunsustainablepathsdescribedinLeeper(2010).Weconsidersuchworkanecessaryingredientinfutureanalysis.
7.3 Methodological lessonsWehaveamended stochasticpopulationprojectionswithembeddedandgraduallyupdateddemographicforecasts.Ateachtime-pointoneachpopulationpathconsideredthereisalsoasimulateddemographicforecastforthefuture.Theagentsintheeconomicmodelmaketheirfutureplansbasedonthisdemographic forecast thatprevails thereandthen.Anewdemo-graphicforecastismadewhentheeconomymovestothenextperiod,andagentsupdatetheirplans.Technicallythetree-likecombinationofstochasticpopulationprojectionswithembed-deddemographic forecasts isobtainedby jointuseofcomputerprogramsFPATHandPEP.Therangesofforecastrevisionsseemquiterelevant,whencomparedtotheadjustmentsinde-mographicforecastsbyStatisticsFinlandbetween2002and2009.
Usingperiodicallyupdatedpopulationprojectionsasaninputinaforward-lookingeconomicmodelproducesresultsthat,wethink,havestronglinkstodecisionsthatareconsideredorac-tuallymadeintherealworld.Eachupdateintheofficialpopulationprojectionschangesourconceptionofthefuture.Allpublicpoliciesandprivatebehaviourcontingenttotheconcep-tionofthefuturearesubjecttochange.
Introducingforecastsembeddedinstochasticpopulationprojectionsallowsustoanalyzepol-iciesthatarebasedonforecasts.Thereisanobviouswayforwardhere.Analyzeallrelevantpolicyrules,andcompareresults.Thisisverytedious,anddifficult.Therearemanyparame-tersthatcouldbechangedandshouldbeanalyzed.Inourrathersimplepolicyrulessuchpa-rametersarethethresholdvaluesandlengthoftheperiodtheyarecalculatedfrom,andotherspecificationsrelatedtothem.Thesizeofthetriggeredpolicymeasuresshouldalsobestud-ied.Forpedagogicalpurposes,roughexamplesmaysuffice.Forquantitativepolicyguidelines,muchmoreworkisneeded.

ETLA Keskusteluaiheita – Discussion Papers No 126526
Thistypeofanalysisproducesavastamountofsimulationresults–sovastthatchoosingwhattopresentisanessentialpartofanystudy.Theeconomicmodeloutputconsistsofstylizedna-tionalaccountsforeachperiod,addedbyhouseholdbehaviorby5-yearbirthcohorts,threeeducationalgroupsandamaximumageof100years.50yearswitha5-yearunitperiodanda50-yearhorizonofforecastsmeansthatthebaselineconsistsof100nationalaccountsforeachofthe200populationpathsused,intotal20 000nationalaccounts.
27Fiscal Sustainability and Policy Rules under Changing Demographic Forecasts
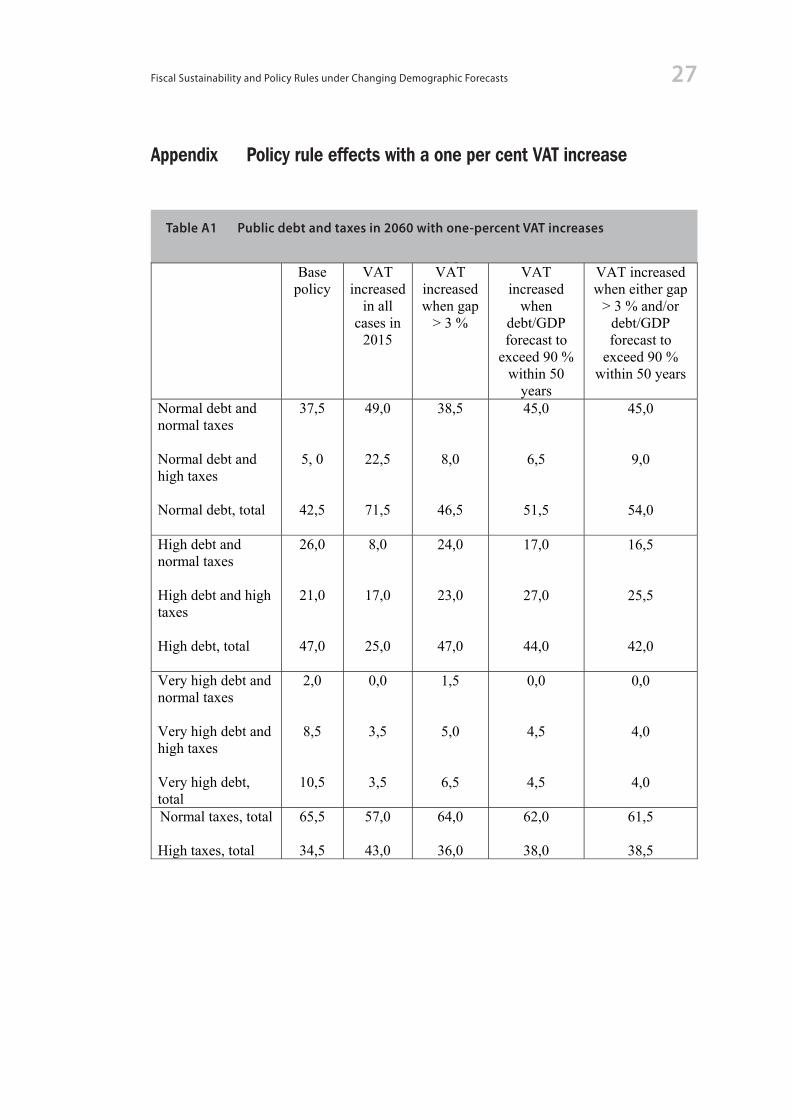
Appendix Policy rule effects with a one per cent VAT increase
Table A1 Public debt and taxes in 2060 with one-percent VAT increases
27
Appendix: Policy rule effects with a one per cent VAT increase Table A1: Public debt and taxes in 2060 with one-percent VAT increases
Base policy
VAT increased
in all cases in
2015
VAT increased when gap
> 3 %
VAT increased
when debt/GDP forecast to
exceed 90 % within 50
years
VAT increased when either gap
> 3 % and/or debt/GDP forecast to
exceed 90 % within 50 years
Normal debt and normal taxes Normal debt and high taxes Normal debt, total
37,5
5, 0
42,5
49,0
22,5
71,5
38,5
8,0
46,5
45,0
6,5
51,5
45,0
9,0
54,0
High debt and normal taxes High debt and high taxes High debt, total
26,0
21,0
47,0
8,0
17,0
25,0
24,0
23,0
47,0
17,0
27,0
44,0
16,5
25,5
42,0
Very high debt and normal taxes Very high debt and high taxes Very high debt, total
2,0
8,5
10,5
0,0
3,5
3,5
1,5
5,0
6,5
0,0
4,5
4,5
0,0
4,0
4,0
Normal taxes, total
High taxes, total
65,5
34,5
57,0
43,0
64,0
36,0
62,0
38,0
61,5
38,5

ETLA Keskusteluaiheita – Discussion Papers No 126528
28
Table A2: Sustainability outlook in 2060 (1 %-point VAT increases) Base
policy VAT
increased in all
cases in 2015
VAT increased when gap
> 3 %
VAT increased
when debt/GDP forecast to
exceed 90 % within 50
years
VAT increased when either gap
> 3 % and/or debt/GDP forecast to
exceed 90 % within 50 years
Normal debt and normal sustainable taxes Normal debt and high sustainable taxes Normal debt and very high sustainable taxes Normal debt, total
3,5
36,0
3,0
42,5
13,0
54,5
4,0
71,5
3,5
39,5
3,5
46,5
7,5
41,0
3,0
51,5
7,5
43,0
3,5
54,0
High debt and normal sustainable taxes High debt and high sustainable taxes High debt and very high sustainable taxes High debt, total
9,5
35,0
2,5
47,0
5,0
18,0
2,0
25,0
10,5
33,5
3,0
47,0
8,5
32,0
3,5
44,0
8,5
30,5
3,0
42,0
Very high debt and normal sustainable taxes Very high debt and high sustainable taxes Very high debt and very high taxes Very high debt, total
1,0
7,5
2,0
10,5
0,0
2,5
1,0
3,5
0,5
5,0
1,0
6,5
0,0
3,5
1,0
4,5
0,0
3,0
1,0
4,0
Normal sustainable taxes, total
High sustainable taxes, total Very high sustainable taxes, total
14,0
78,5
7,5
18,0
75,0
7,0
14,5
78,0
7,5
16,0
76,5
7,5
16,0
76,5
7,5
Table A2 Sustainability outlook in 2060 (1 %-point VAT increases)

29Fiscal Sustainability and Policy Rules under Changing Demographic Forecasts
Figure A1 Predictive distribution of sustainability gaps (Horizontal axis shows the year the gap is evaluated)
Figure A2 Predictive distribution of highest forecasted debt/GDP-ratio within 50 years (Horizontal axis shows the year the forecast is made)
2010 2020 2030 2040 2050 2060-1
0
1
2
3
-1
0
1
2
3
%%
50 % predictive interval Median10 % 90 %
ETLA 3.8.2011
2010 2020 2030 2040 2050 20600
50
100
150
0
50
100
150
%%
50 % predictive intervalMedian10 %90 %
ETLA 3.8.2011

ETLA Keskusteluaiheita – Discussion Papers No 126530
References Anderson, M – Tuljapurkar, S – Li, N (2001) How Accurate Are Demographic Projections Used in Fore-casting Pension Expenditure? Pensions: More Information, Less Ideology, Assessing the Long-Term Sus-tainability of European Pension Systems: Data Requirements, Analysis and Evaluations. Springer.
Alho, J M (2011) Forecasting demographic forecasts. ETLA, manuscript.
Alho, J M – Cruijsen H – Keilman, N (2008) Empirically-based specification of forecast uncertainty. In Uncertain Demographics and Fiscal Sustainability. Ed. by Alho, J M et al. Cambridge University Press.
Alho, J M – Jensen, S E H – Lassila, J (eds.) (2008) Uncertain Demographics and Fiscal Sustainability. Cambridge University Press.
Alho, J M – Jensen, S E H – Lassila, J – Lazutka, R – Morkūnienė, A – Valkonen, T (2002) The Economic Ef-fects of Population Ageing and Demographic Uncertainty in Lithuania. Research Report P98-1023-R of the European Union’s Phare ACE Program.
Alho, J M – Jensen, S E H – Lassila, J – Valkonen, T (2005) Controlling the Effects of Demographic Risks: The Role of Pension Indexation Schemes. The Journal of Pension Economics and Finance, 4(2), 139–153.
Alho, J M – Lassila, J – Valkonen, T (2005) Demographic Uncertainty and the Evaluation of Sustaina-bility of Pension Systems. Pension Reform: Issues and Prospects for Non-Financial Defined Contribution (NDC) Schemes. Ed. by Holzmann, R and Palmer, E. The World Bank, 2005
Alho, J M – Spencer, B D (2005) Statistical Demography and Forecasting. New York: Springer.
Alho, J M – Vanne, R (2006) On Predictive Distributions of Public Net Liabilities. International Journal of Forecasting, 22(4), 725–733.
Auerbach, A J – Kotlikoff, L J (1987) Dynamic Fiscal Policy. Cambridge: Cambridge University Press.
Auerbach, A J – Lee, R D (2006) Notional Defined Contribution Pension Systems in a Stochastic Con-text: Design and Stability. NBER Working Papers No. 12805.
Blanchard, O J (1985) Debt, Deficits, and Finite Horizons. The Journal of Political Economy, 93(2), 223–247.
Boards of Trustees (2003) Annual Report of the Boards of Trustees of the Federal Hospital Insurance Trust and Federal Supplementary Medical Insurance Trust Funds. Available at http://cms.hhs.gov/publications/trusteesreport/2003/tr.pdf
Buiter, W H (1985) A Guide to Public Sector Debt and Deficits. Economic Policy, 1, 13–79.
Burdick, C – Manchester, J (2003) Stochastic Models of the Social Security Trust Funds. Office of Policy, Office of Research, Evaluation, and Statistics Research and Statistics Note No. 2003–01, March 2003.
Creedy, J – Scopie, G M (2002) Population Ageing and Social Expenditure in New Zealand: Stochastic Projections. New Zealand Treasury Working Paper 02/28. Wellington.
CBO (2001) Uncertainty in Social Security’s Long-Term Finances: A Stochastic Analysis. Congression-al Budget Office, Technical Report, December 2001. Available at www.cbo.gov.

31Fiscal Sustainability and Policy Rules under Changing Demographic Forecasts
Duyck, J – Lambrecht, M – Paul, J-M (2005) The budgetary cost of ageing in a stochastic demographic framework”. Mimeo, Federal Planning Bureau.
EPC (2006) The Long-term Sustainability of Public Finance in the European Union. European Econo-my, No. 4/2006.
EPC (2009) Sustainability Report 2009, EUROPEAN ECONOMY 9/2009.
European Commission (2011) Public finances in EMU – 2011, European Economy 3/2011.
Heller, P S (2003) Who Will Pay? Coping with Aging Societies, Climate Change, and Other Long-Term Fiscal Challenges. International Monetary Fund.
Holmer, M R (2003) Methods for Stochastic Trust Fund Projection. Report prepared for the Social Secu-rity Administration. Available at www.polsim.com/stochsim.pdf.
Keilman, N (2005) The Impact of Demographic Uncertainty on Liabilities for Public Old Age Pensions in Norway. Special Issue, New Zealand Population Review, 31(1), 35–50.
Keilman, N (2008) European demographic forecasts have not become more accurate during the past 25 years. Population and Development Review 34(1)2008, 137–153.
Lassila, J – Valkonen, T (2004) Pre-funding Expenditure on Health and Long-term Care under Demo-graphic Uncertainty Geneva Papers on Risk and Insurance, 29(4), 620–639.
Lassila, J – Valkonen, T (2005) Demographic Uncertainty and Fiscal Sustainability in Finland. Mimeo, ETLA.
Lassila, J – Valkonen, T (2007b) The Finnish Pension Reform of 2005. Geneva Papers on Risk and Insur-ance – Issues and Practice, 32, 75–94.
Lassila, J – Valkonen, T (2008a) Demographic uncertainty and pension projections. Uncertain Demo-graphics and Fiscal Sustainability. Ed. by Alho, J M et al. Cambridge University Press.
Lassila, J – Valkonen, T (2008b) Fiscal sustainability in Finland: a stochastic analysis. Bank of Finland Research Discussion papers 28/2008.
Lassila, J, – Valkonen, T – Alho, J M (2011) Assessing the sustainability of health and long-term care fi-nancing and the usefulness of policy guidelines based on demographic forecasts. In Honkatukia, J. (ed.): Three takes on sustainability. Government Institute for Economic Research, Helsinki 2011.
Lee, R D – Tuljapurkar, S (1998) Uncertain Demographic Futures and Social Security Finances. Ameri-can Economic Review, 88, 237–41.
Lee, R D – Tuljapurkar, S (2001) Population Forecasting for Fiscal Planning: Issues and Innovations. Demographic Change and Fiscal Policy. Ed. by Auerbach, A J and Lee, R D. Cambridge University Press.
Lee, R D – Miller, T (2001) An approach to forecasting health expenditures, with application to the U.S. Medicare system, Health Services Research 37(5), 1365–1386.
Lee, R D – Anderson, M W – Tuljapurkar, S (2003) Stochastic Forecasts of the Social Security Trust Fund. Report prepared for the Social Security Administration. January. Available at http://simsoc.demog.berkeley.edu/Reports/LAT_SSA_Mar2003.pdf.
ETLA Keskusteluaiheita – Discussion Papers No 126532
Leeper, Eric M. (2010): Monetary Science, Fiscal Alchemy. Paper prepared for the Federal Reserve Bank of Kansas City’s Jackson Hole Symposium, “Macroeconomic Policy: Post-Crisis and Risks Ahead,” August 26–28, 2010.
Mendoza, E – Oviedo, P M (2004) Public Debt, Fiscal Solvency and Macroeconomic Uncertainty in Lat-in America: The Cases of Brazil, Colombia, Costa Rica, and Mexico. NBER Working Paper No. 10637.
Reinhart, C – Rogoff, K (2010) Growth in a Time of Debt. CEPR Discussion Paper, 7661.
Sefton, J – Weale, M (2005) Fiscal Implications of Demographic Uncertainty for the United Kingdom. NIESR Discussion Paper No. 250.
Törnqvist, L (1949) Näkökohdat, jotka ovat määränneet primääristen prognoosiolettamusten valin-nan (in Finnish). Suomen väestöä, sen uusiutumista ja tulevaa kehitystä koskevia laskelmia. Ed. by Hyp-pölä, J A et al. Statistics Finland, Helsinki.
Ulla, P (2006) Assessing Fiscal Risks through Long-term Budget Projections. OECD Journal on Budget-ing, 6(1), 130–191.

33Fiscal Sustainability and Policy Rules under Changing Demographic Forecasts
ETLA Keskusteluaiheita – Discussion Papers No 126534
ETLAElinkeinoelämän TutkimuslaitosThe Research Institute of the Finnish EconomyLönnrotinkatu 4 B00120 Helsinki
ISSN 0781–6847
Puh. 09-609 900Fax 09-601 753
Aikaisemmin ilmestynyt ETLAn Keskusteluaiheita-sarjassa Previously published in the ETLA Discussion Papers Series
No 1248 Rita Asplund – Sami Napari, Intangible Capital and Wages. An Analysis of Wage Gaps Across Occupations and Genders in Czech Republic, Finland and Norway. 11.04.2011. 18 p.
No 1249 Mari Kangasniemi – Antti Kauhanen, Performance-related Pay and Gender Wage Differences. 21.04.2011. 19 p.
No 1250 Ye Zhang, Wireless Acquisition of Process Data. 24.05.2011. 52 p.
No 1251 Rita Asplund – Erling Barth – Per Lundborg – Kjersti Misje Nilsen, Challenges of Nordic Labour Markets: A Polarization of Working Life? 08.06.2011. 21 p.
No 1252 Jari Hyvärinen, Innovaatiotoiminta: Näkemyksiä ympäristö- ja energia-alaan. 1.6.2011. 39 s.
No 1253 Ari Hyytinen – Mika Maliranta, Firm Lifecycles and External Restructuring. 17.06.2011. 34 p.
No 1254 Timo Seppälä – Olli Martikainen, Europe Lagging Behind in ICT Evolution: Patenting Trends of Leading ICT Companies. 22.06.2011. 18 p.
No 1255 Paavo Suni – Pekka Ylä-Anttila, Kilpailukyky ja globaalin toimintaympäristön muutos. Suomen koneteollisuus maailmantaloudessa. 19.08.2011. 39 s.
No 1256 Jari Hyvärinen, Innovaatiotoiminta: Näkemyksiä hyvinvointialaan ja työelämän kehittämiseen. 31.8.2011. 28 s.
No 1257 Terttu Luukkonen – Matthias Deschryvere – Fabio Bertoni – Tuomo Nikulainen, Importance of the Non-financial Value Added of Government and Independent Venture Capitalists. 2.9.2011. 28 p.
No 1258 Ari Hyytinen – Mika Pajarinen – Pekka Ylä-Anttila, Finpron vaikuttavuus – Finpron palveluiden käytön vaikutukset yritysten kansainvälistymiseen ja menestymiseen. 15.9.2011. 32 p.
No 1259 Kari E.O. Alho, How to Restore Sustainability of the Euro? 19.9.2011. 27 p.
No 1260 Heli Koski, Does Marginal Cost Pricing of Public Sector Information Spur Firm Growth? 28.9.2011. 15 p.
No 1261 Valeriy Naumov – Olli Martikainen, Method for Throughput Maximization of Multiclass Networks with Flexible Servers. 13.12.2011. 19 p.
No 1262 Valeriy Naumov – Olli Martikainen, Optimal Resource Allocation in Multiclass Networks. 14.12.2011. 17 p.
Elinkeinoelämän Tutkimuslaitoksen julkaisemat ”Keskusteluaiheita” ovat raportteja alustavista tutkimustuloksista ja väliraportteja tekeillä olevista tutkimuksista. Tässä sarjassa julkaistuja monisteita on mahdollista ostaa Talous-tieto Oy:stä kopiointi- ja toimituskuluja vastaavaan hintaan.
Papers in this series are reports on preliminary research results and on studies in progress. They are sold by Taloustieto Oy for a nominal fee covering copying and postage costs.
Julkaisut ovat ladattavissa pdf-muodossa osoitteessa: www.etla.fi/julkaisuhaku.php Publications in pdf can be downloaded at www.etla.fi/eng/julkaisuhaku.php
Copyright © 2022 FDOKUMEN


