
Journal of Population Research Spatial Weighting Improves the Accuracy of Small-Area Demographic...
28
Journal of Population Research Spatial Weighting Improves the Accuracy of Small-Area Demographic Forecasts of Urban Populations --Manuscript Draft-- Manuscript Number: JPOR-D-13-00051R2 Full Title: Spatial Weighting Improves the Accuracy of Small-Area Demographic Forecasts of Urban Populations Article Type: Original Research Keywords: small-area estimation, demography, forecasts, urban, census tract Corresponding Author: Jack Baker, Ph.D. University of New Mexico Albuquerque, NM UNITED STATES Corresponding Author Secondary Information: Corresponding Author's Institution: University of New Mexico Corresponding Author's Secondary Institution: First Author: Jack Baker, Ph.D. First Author Secondary Information: Order of Authors: Jack Baker, Ph.D. Adelamar Alcantara, PhD Xiaomin Ruan, MA, MS Kendra Watkins, MACRP Order of Authors Secondary Information: Abstract: Existing research in small-area demographic forecasting suffers from two important limitations: (1) a paucity of studies that quantify patterns of error in either total or age/sex-specific estimates and (2) limited methodological innovation aimed specifically at improving the accuracy of such forecasts. This paper attempts to fill, in part, these gaps in existing research by presenting a comparative evaluation of the accuracy of standard and spatially-weighted Hamilton-Perry forecasts for urbanized census tracts within incorporated New Mexico municipalities. These comparative forecasts are constructed for a ten-year horizon (base = April 1, 2000 and target = April 1, 2010), then compared to the results of the 2010 Census in an ex post facto evaluation. Results are presented for the standard Hamilton-Perry forecasts as well as two sets that incorporate two common variants of spatial weights to improve forecast accuracy. Findings are discussed in the context of what is currently known about error in small- area demographic forecasts and with an eye toward continued innovations. Powered by Editorial Manager® and ProduXion Manager® from Aries Systems Corporation
-
Upload
independent -
Category
Documents
-
view
4 -
download
0
Transcript of Journal of Population Research Spatial Weighting Improves the Accuracy of Small-Area Demographic...

Journal of Population Research
Spatial Weighting Improves the Accuracy of Small-Area Demographic Forecasts ofUrban Populations--Manuscript Draft--
Manuscript Number: JPOR-D-13-00051R2
Full Title: Spatial Weighting Improves the Accuracy of Small-Area Demographic Forecasts ofUrban Populations
Article Type: Original Research
Keywords: small-area estimation, demography, forecasts, urban, census tract
Corresponding Author: Jack Baker, Ph.D.University of New MexicoAlbuquerque, NM UNITED STATES
Corresponding Author SecondaryInformation:
Corresponding Author's Institution: University of New Mexico
Corresponding Author's SecondaryInstitution:
First Author: Jack Baker, Ph.D.
First Author Secondary Information:
Order of Authors: Jack Baker, Ph.D.
Adelamar Alcantara, PhD
Xiaomin Ruan, MA, MS
Kendra Watkins, MACRP
Order of Authors Secondary Information:
Abstract: Existing research in small-area demographic forecasting suffers from two importantlimitations: (1) a paucity of studies that quantify patterns of error in either total orage/sex-specific estimates and (2) limited methodological innovation aimed specificallyat improving the accuracy of such forecasts. This paper attempts to fill, in part, thesegaps in existing research by presenting a comparative evaluation of the accuracy ofstandard and spatially-weighted Hamilton-Perry forecasts for urbanized census tractswithin incorporated New Mexico municipalities. These comparative forecasts areconstructed for a ten-year horizon (base = April 1, 2000 and target = April 1, 2010),then compared to the results of the 2010 Census in an ex post facto evaluation.Results are presented for the standard Hamilton-Perry forecasts as well as two setsthat incorporate two common variants of spatial weights to improve forecast accuracy.Findings are discussed in the context of what is currently known about error in small-area demographic forecasts and with an eye toward continued innovations.
Powered by Editorial Manager® and ProduXion Manager® from Aries Systems Corporation

Dear Dr. Charles-Edwards,
We appreciate the editorial comments you made and have incorporated them as is in this revision.
The issue of Queen vs Rook contiguity is corrected—essentially a textual mix-up. There is no
significance that we infer from the modest differences between the two models of spatial dependency
so we have simply switched the text to conform to the accurate description. We have made no changes
in the remainder of the text in presenting or discussing results.
Thanks for your hard work on our manuscript. The only other change is an acknowledgement of our
reviewers and of your inputs.
Response to reviewer's comments

Spatial Weighting Improves Accuracy in Small-Area Demographic Forecasts of
Urban Census Tract Populations
Jack Baker, PhD Senior Research Scientist Geospatial and Population Studies, 1 University of New Mexico MSC 063510 Albuquerque, NM, 87131 USA [email protected] (505) 504-1020 Adélamar Alcántara, PhD Director Geospatial and Population Studies, 1 University of New Mexico MSC 063510 Albuquerque, NM, 87131 USA Xiaomin Ruan Research Scientist Geospatial and Population Studies, 1 University of New Mexico MSC 063510 Albuquerque, NM, 87131 USA Kendra Watkins Socio-economic Program Manager Mid-Region Council of Governments 809 Copper NW Albuquerque, NM 87102
Acknowledgements: This manuscript has been greatly improved by the suggestions made by
two anonymous referees as well as Dr. Elin Charles-Edwards, editor for the Journal of
Population Research. This research was supported by an annual appropriation to Geospatial
and Population Studies by the Legislature of the State of New Mexico to support the Census
Data Dissemination and Demographic Analysis project. While we wish to acknowledge these
contributions, any errors or omissions in either logic or content remain the responsibility of the
authors.
Page Contaning Author's Details

Introduction
Small-area demographic estimation has a long history. Within the United States, the
need for small-area forecasts of population appears to have grown out of a need to plan for
public education demand in the post World War II era (Armstrong and Harris, 1949; Zitter,
1954; Schmid and Shanley, 1952). While this interest has continued (Fabricant and Weinman,
1972; Legare, 1972; Mckibben, 2006), the utility of generating small-area demographic data in
between censuses—and beyond them—has reached the fields of public planning (Cavanaugh,
1981; Smith et. al., 2001; Landis and Zhang, 1998; George, 2004), market analysis (Le Sage and
Pace, 2004; Pace and O-Gilley, 1997; Harris et. al., 2005; Swanson et. al., 2010), public health
surveillance (CDC, 1999; Kuldorff, 1997, 1999), biostatistics (Hund et. al., 2012; Best and
Wakefield, 1999), and GIScience/Geography (Herold et. al., 2003; Ward et. al., 2000; Dietzel
and Clarke, 2007). With such an expanded audience in recent years, it is surprising that so few
studies have attempted to quantify the magnitude and direction of errors associated with
small-area demographic models or to introduce new methodological innovations aimed at
enhancing their accuracy. In this paper, we attempt to fill gaps both in existing knowledge of
the structure of errors for small-area demographic models and in innovations to improve their
accuracy. While we focus on the problem of forecasting: predicting future values of total
population and population within five-year age/sex-specific intervals, it should be noted that
methodological and mathematical equivalency exists with studies focused on the task of
“estimation” (modeling past population values—see Swanson and Tayman, 2012; Smith et. al.,
2001; Baker et. al., 2013). Thus, although we focus on forecasts in the current paper—the
results are relevant to demographers making demographic estimates using equivalent
methods.
Forecast accuracy is typically measured using ex post facto evaluations that compare
forecasts against decennial census counts and compute distributions of “error”—or
discrepancies with the two sets with the census considered as a gold-standard (Tayman, 1999;
Tayman et. al., 1998; Smith, 1987). While it is clear that the census itself is not a gold-standard
(Hogan, 1992, 1993; Fellegi, 1968; Cavanaugh, 1981), it is likely true that a census is always
more accurate than a demographic forecast and it is largely agreed upon that such evaluations
Manuscript (Please exclude authors names from the file)

provide useful information on forecast accuracy. In such evaluation studies, it is a general
finding that existing methods tend to be less accurate in modeling rapidly-changing areas or
those with smaller populations or population groupings (Smith et. al., 2001; Swanson and
Tayman, 2012; Keyfitz, 1981; Isserman, 1977; Smith, 1987; Hoque, 2010), only a handful of
studies have specifically attempted to quantify forecast errors for small-areas. These studies
(Smith and Shahidullah, 1995; Baker et. al., 2012, 2013; Voss and Kale, 1985; Hoque, 2010) have
suggested that errors in total population forecasts over a ten-year forecast horizons should
reach between 15.00 and 25.00 percent. When estimates are made for specific population
age/sex categories, these studies suggest that errors may climb significantly—sometimes as
high as 100.00 percent or greater within a given age/sex interval—though they typically fall in
the range of 20.00 to 40.00 percent. Clearly, demographers should use caution when making
small-area population forecasts—large amounts of error may be present and both Hoque
(2010) and Baker et. al. (2013) report the existence of large-scale outliers that are clearly not
reliable enough for release in a demographic dataset.
With so few studies to validate existing methods for small-area population forecasting,
demographers would benefit from more evaluative studies across a greater range of study
areas. They would also benefit from the introduction of innovative extensions of existing
methods—or entirely new ones—to enhance the accuracy of small-area demographic forecasts.
Perhaps one obstacle to the development of innovations in demography has been a lack of
input data on demographic components of change (births, deaths, migration, residential
construction, etc.) at appropriately small levels to permit implementation of more traditional
methods (Voss and Kale, 1985; Smith et. al., 2001; Cai, 2007; Baker et. al., 2008; Swanson et.
al., 2010). While geocoding (mapping to specific street segments—see Drummond, 1995;
Karimi and Durcik, 2004 for general explanations and Baker et. al., 2012 for demographic
examples) has opened the possibility of such straightforward implementation of demographic
methods at small geographic levels, the known incompleteness of geocoding has been
observed to significantly down-bias demographic models even after significant efforts at data
quality control and remediation and spatial imputation methods have been employed (Baker
et. al., 2012, 2013). Since geocoded data are also known to be biased with respect to important

population characteristics such as race and ethnicity (Gilboa et. al., 2005; Oliver et. al., 2005;
Goldberg et. al., 2007; Zandbergen, 2009), demographers wishing to implement such
procedures also have run the risk of differentially impacting forecast accuracy for specific
population groupings. The findings of Baker et. al. (2013) suggest that methods of trend
extrapolation might perform similarly to the best-performing estimates made using geocoded
data, even within specific age-sex categories. This raises the question of whether such
intensive remediation is worth the effort involved. A conclusion offered by Baker et. al. (2014)
is that in cases where information on population dynamics is necessary—such efforts have a
benefit in estimating components of change; however, existing evidence suggests that
additional complexity in small-area demographic models is not the magic-bullet that
demographers seek to improve forecast accuracy (see also Kale et. al., 1981; Long, 1995; Smith
and Sincich, 1992; Stoto, 1983; White, 1954; Leach, 1981; Pflaumer, 1992).
Chi and Zhu (2008) and Chi and Voss (2011) have suggested an alternative: that the
incorporation of spatial dependency into small-area demographic forecasting may provide
improvements in accuracy that applied demographers have sought. Spatial dependency refers
to the tendency of data physically closer in space to be more similar—this is Tobler’s first law of
geography (Tobler, 1979; Voss, 2004; Haining, 2003). This suggestion is compelling for a
number of reasons. First, it has long been established that the grouping of small-area data into
larger areal units distorts important locally-specific effects and spatial statisticians and
GIScientists make use of spatial autocorrelation models in order to capture such small-area
heterogeneity (Getis and Ord, 2004; Getis, 2009; Getis and Alstadt, 2004; Frotheringham et.
al., 2002). Chi and Zhu (2008) , Chi and Voss (2011), and Baker et. al. (2012) have presented
analyses suggesting that demographic dynamics may be similarly spatially-autocorrelated.
Census data—which form the basis of demographic forecasts—are known to be spatially
autocorrelated (Hogan and Tchernis, 2004; Pace and O’Gilley, 1997; Pattachini and Zenou,
2007) and significant spatial dependency has been observed in socioeconomic status (Duncan
and Duncan, 1955), ethnicity and education (Duncan and Duncan, 1955; Legare, 1972; Alba et.
al., 2000; Vasan et. al., 2014), housing prices (Pace and O’Gilley, 1997; se Can and Meglolugbe,
1997) and other important variables that might also impact models of small-area population
dynamics (Myer, 1954; Massey and Denton, 1985; Legare, 1972). The potential for leveraging
such patterns of spatial-dependency for improving estimation is well-known in other fields
(Pace and O’Gilley, 1997; Le Sage and Pace, 2004; Frotheringham et. al., 2002)—its full
potential in small-area demographic forecasts remains largely untapped (Chi and Zhu, 2008;
Chi and Voss, 2011).
This paper attempts to leverage spatial-dependency within the framework of a well-
known existing component method of demographic forecasting: the Hamilton-Perry or
Component III method (Hamilton-Perry, 1962; Smith and Shahidullah, 1995; Smith et. al.,
2001; George, 2004; Romaniuk, 2009; Swanson et. al., 2010; Baker et. al., 2013). This method
utilizes historical intercensal shifts in population as an extrapolative basis for forecasting
population—and it does so by modeling change for each specific geography to which the model
will be applied (in the current study: US census tracts—polygons containing 1,500 to 8,000
persons, but targeted to 4,000). In this sense, the model is inherently local to the extreme and
one might be tempted to view this model as an extreme example of leveraging spatial
dependency; however, upon careful consideration it is clear why this is not so from a
conceptual basis. In related fields interested in small-area analysis (such as geography or real
estate economics), it has been observed that what is happening within a single neighborhood is
not usually happening in isolation. In fact, it may impact and interact with surrounding
neighborhoods in shaping future growth or decline (Le Sage and Pace, 2004; Dietzel and Clarke,
2007; Landis and Zhang, 1998). Cellular automata models attempting to model urban
expansion have utilized the fact that limits to growth in one neighborhood (build-out given
suitable terrain for example) will shift growth to surrounding, appropriate areas (Herold et. al.,
2003; Ward et. al., 2000). Likewise, Baker et. al. (2008) have found that incorporating carrying
capacity into models of housing unit growth in urban census tracts may provide more accurate
forecasts for similar reasons. Overly-local application of the Hamilton-Perry method might tend
to obscure such dynamics while incorporating them may provide a “smoothing” effect that
allows both a better reflection of the real patterns of demographic change that population
forecasts seek to capture while also leveraging existing patterns of spatial dependency to
improve their accuracy (Chi and Voss, 2011; Chi and Zhu, 2008). Incorporating spatial

dependency may provide an important innovation in small-area demographic forecasting that
when combined with a method such as the Hamilton-Perry procedure—which is capable of
forecasting both total population and age/sex composition—comprises a more adequate
solution to many of the issues associated with small-area demographic forecasting as well as
the needs of data users in disparate fields of study.
From this contextual perspective, this paper attempts to achieve two goals. First it
seeks to add to a growing body of literature that reports the ex post facto errors associated
with demographic forecasts. It accomplishes this goal by reporting the results of an April 1,
2010-based evaluation of errors associated with 1990-2000 based Hamilton-Perry forecasts
when compared against the 2010 census counts (n = 221). Next, it compares these results to
identical evaluations of error for two sets of spatially-weighted Hamilton-Perry forecasts. The
results of the sets are compared in terms of percentage-point improvement in accuracy for
both total population forecasts as well as those made for population within five-year age/sex-
specific intervals. Comparisons are made only for urban census tracts—those within the
municipal boundaries of New Mexico’s fastest-growing and most urbanized cities:
Albuquerque, Las Cruces, Rio Rancho, and Santa Fe. The average size of these census tracts is
approximately 4,000 persons and their standard deviation is approximately 1,250 persons. To
avoid biases associated with size-differences between census tracts (Cavanaugh, 1981; Tayman
et. al., 1999), all comparisons are made using percentage errors. To avoid biases in
comparisons of central tendencies given the well-known non-normality of such error
distributions (Smith and Sincich, 1992; Tayman et. al., 1999), we utilize the median as a
comparison measure as suggested by Baker and coworkers (2013, 2014). The results of are
compared not only across methods, but also by method across strata of the percentage
population change observed in each census tract between 2000 and 2010. These results are
discussed in light of the existing literature on small-area demographic forecasts and further
potential refinements of the method are reviewed.
Materials and Methods
Study Area and Database Formulation
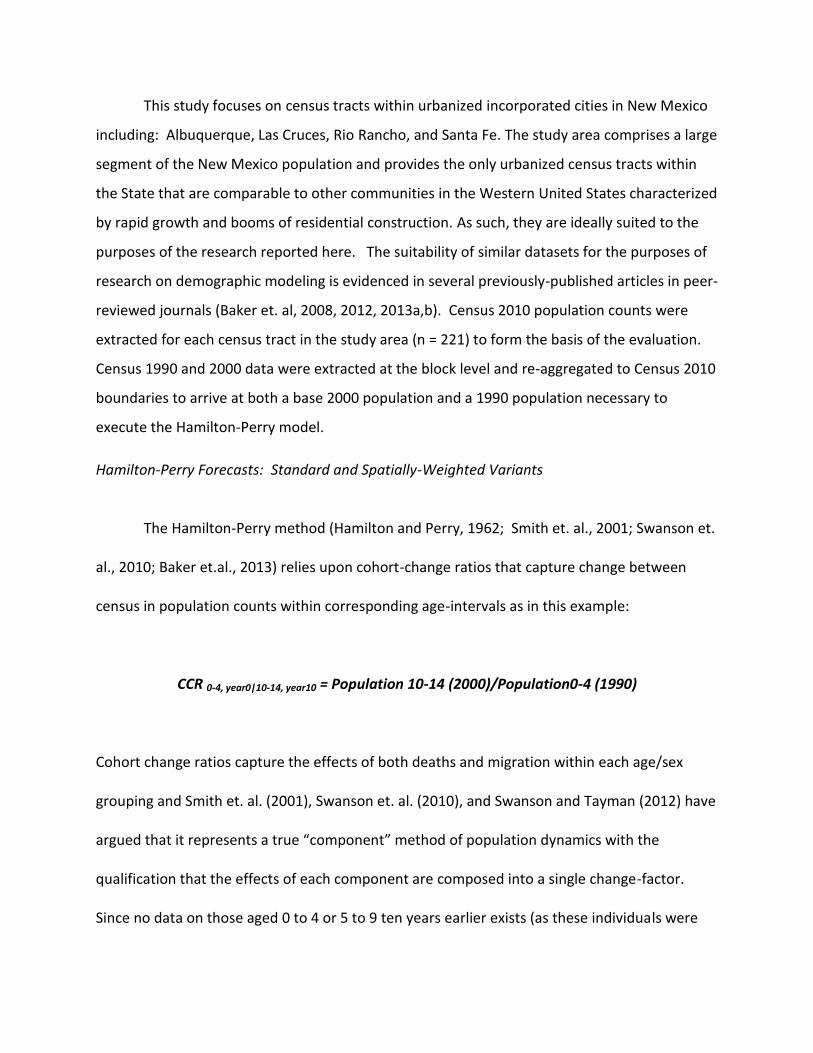
This study focuses on census tracts within urbanized incorporated cities in New Mexico
including: Albuquerque, Las Cruces, Rio Rancho, and Santa Fe. The study area comprises a large
segment of the New Mexico population and provides the only urbanized census tracts within
the State that are comparable to other communities in the Western United States characterized
by rapid growth and booms of residential construction. As such, they are ideally suited to the
purposes of the research reported here. The suitability of similar datasets for the purposes of
research on demographic modeling is evidenced in several previously-published articles in peer-
reviewed journals (Baker et. al, 2008, 2012, 2013a,b). Census 2010 population counts were
extracted for each census tract in the study area (n = 221) to form the basis of the evaluation.
Census 1990 and 2000 data were extracted at the block level and re-aggregated to Census 2010
boundaries to arrive at both a base 2000 population and a 1990 population necessary to
execute the Hamilton-Perry model.
Hamilton-Perry Forecasts: Standard and Spatially-Weighted Variants The Hamilton-Perry method (Hamilton and Perry, 1962; Smith et. al., 2001; Swanson et.
al., 2010; Baker et.al., 2013) relies upon cohort-change ratios that capture change between
census in population counts within corresponding age-intervals as in this example:
CCR 0-4, year0|10-14, year10 = Population 10-14 (2000)/Population0-4 (1990)
Cohort change ratios capture the effects of both deaths and migration within each age/sex
grouping and Smith et. al. (2001), Swanson et. al. (2010), and Swanson and Tayman (2012) have
argued that it represents a true “component” method of population dynamics with the
qualification that the effects of each component are composed into a single change-factor.
Since no data on those aged 0 to 4 or 5 to 9 ten years earlier exists (as these individuals were

not born prior to the previous decennial census), these populations are modeled using
dependency ratios (Hamilton and Perry, 1962; Smith et. al., 2001; Swanson and Tayman, 2012)
that proportionally relate the number of individuals within each age/sex group to the number
of reproductive-aged women (typically between ages 15 and 49), as in this example:
DR males 0 to 4 = Population of males 0 to 4 (2000)/Population of Women 15 to 49 (2000)
The Hamilton-Perry forecast is accomplished by multiplying the previous census population
against the appropriate cohort change ratio to arrive at an estimate of the target population
then multiplying the forecasted population of reproductive-aged women against the
appropriate dependency ratio.
The Hamilton-Perry forecasts were implemented by computing cohort change ratios
based on observed 1990 to 2000 intercensal population change, then multiplication of the
Census 2000 population counts by age/sex in five-year groupings against these ratios to arrive
at estimates of population in each age/sex grouping for the years 10-14 through 80 plus. Both
the cohort-change ratios and the resulting ten-year forecasts were computed for each census
tract individually (the standard Hamilton-Perry). Forecasts were made in the standard method
without spatial weighting, then subjected to spatial-weighting algorithms that average the
values of groups of census tracts depending on specific geographic relationships. These
relationships are captured in spatial weights matrices (Getis and Aldstadt, 2004; Getis, 2009; )
that represent weighted sum of spatially-proximate census tracts based on an apriori
conceptualization of spatial relationships based on contiguity or proximity. In this study, two

commonly-used spatial weight matrices were utilized including those based on rook contiguity
(shared sides) and queen contiguity (shared sides and/or corners). Arithmetically, if a given
census tract had two neighbors j and k (as defined by the contiguity models rook or queen),
then its spatially-weighted forecast would be determined as:
Pop Census Tract i = (Pop tract h*.333) (Pop tract i original*.333) + (Pop tract j *.333)
Rook and Queen contiguity matrices were constructed using ESRI’s Arc-GIS software
package (version 10.1).
Populations aged 0 to 4 and 5 to 9 for each sex were forecasted by computing Census
2000 dependency ratios and holding them constant throughout the forecast horizon. Different
formulations of dependency ratios such as those associated children ages 0 to 4 divided by
women 15 to 44 or children ages 5 to 9 by women aged 20 to 49 were implemented, but made
little difference in the results (less than a percent in any specific instance) and are not reported
or discussed in this paper.
Statistical Characterization of Accuracy
Typically, applied demographers use average errors to capture information on model
accuracy. Mean absolute percentage errors are typically utilized to measure “accuracy” while
mean algebraic percentage errors provide information on “bias”—the tendency of a set of
estimates to be higher or lower than the census count (Tayman et. al., 1998; Smith et. al., 2001;
Smith and Sincich, 1992). Here, we use percentage errors to account for the large variation
observed in population size across the census tracts included in this study since it is well-known
that using simple numeric differences can tend to exaggerate the contribution of tracts with
larger populations to summary measures of error (Tayman, 1999; Tayman et. al., 1998; Smith
et. al., 2001; Swanson and Tayman, 2012; Cavanaugh, 1981). In the current study, nearly all of
the average errors reported were negative, indicating an overall negative bias in both weighted
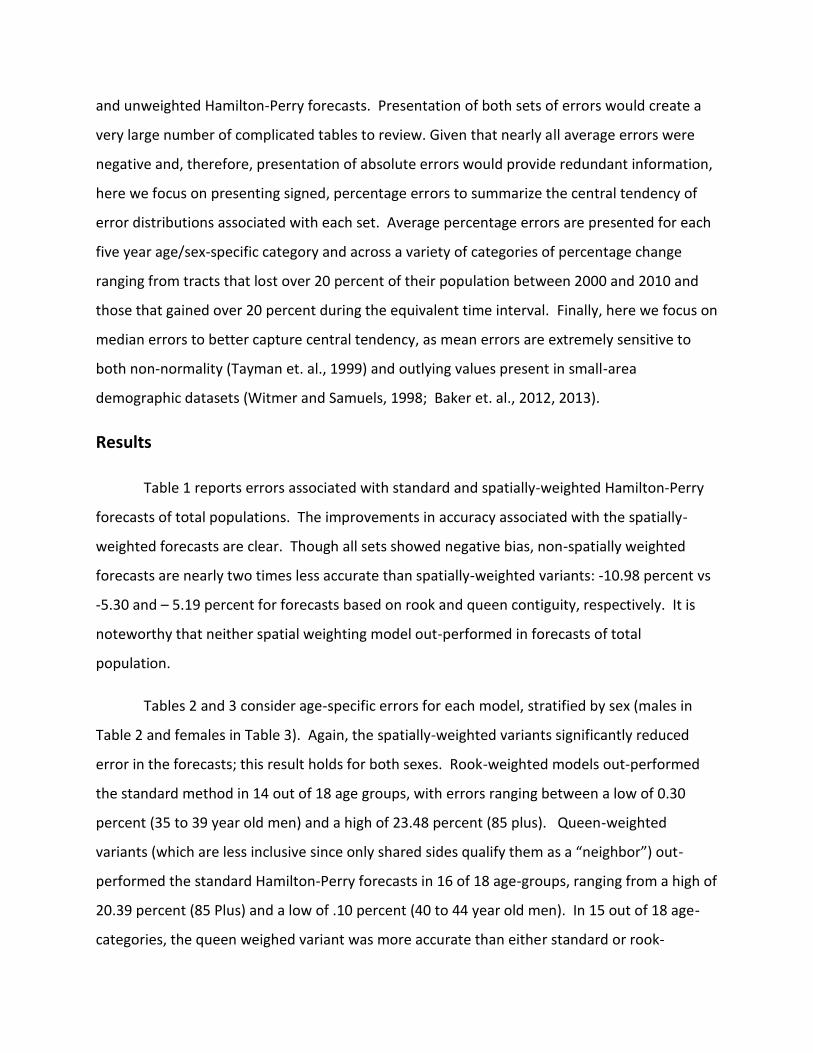
and unweighted Hamilton-Perry forecasts. Presentation of both sets of errors would create a
very large number of complicated tables to review. Given that nearly all average errors were
negative and, therefore, presentation of absolute errors would provide redundant information,
here we focus on presenting signed, percentage errors to summarize the central tendency of
error distributions associated with each set. Average percentage errors are presented for each
five year age/sex-specific category and across a variety of categories of percentage change
ranging from tracts that lost over 20 percent of their population between 2000 and 2010 and
those that gained over 20 percent during the equivalent time interval. Finally, here we focus on
median errors to better capture central tendency, as mean errors are extremely sensitive to
both non-normality (Tayman et. al., 1999) and outlying values present in small-area
demographic datasets (Witmer and Samuels, 1998; Baker et. al., 2012, 2013).
Results
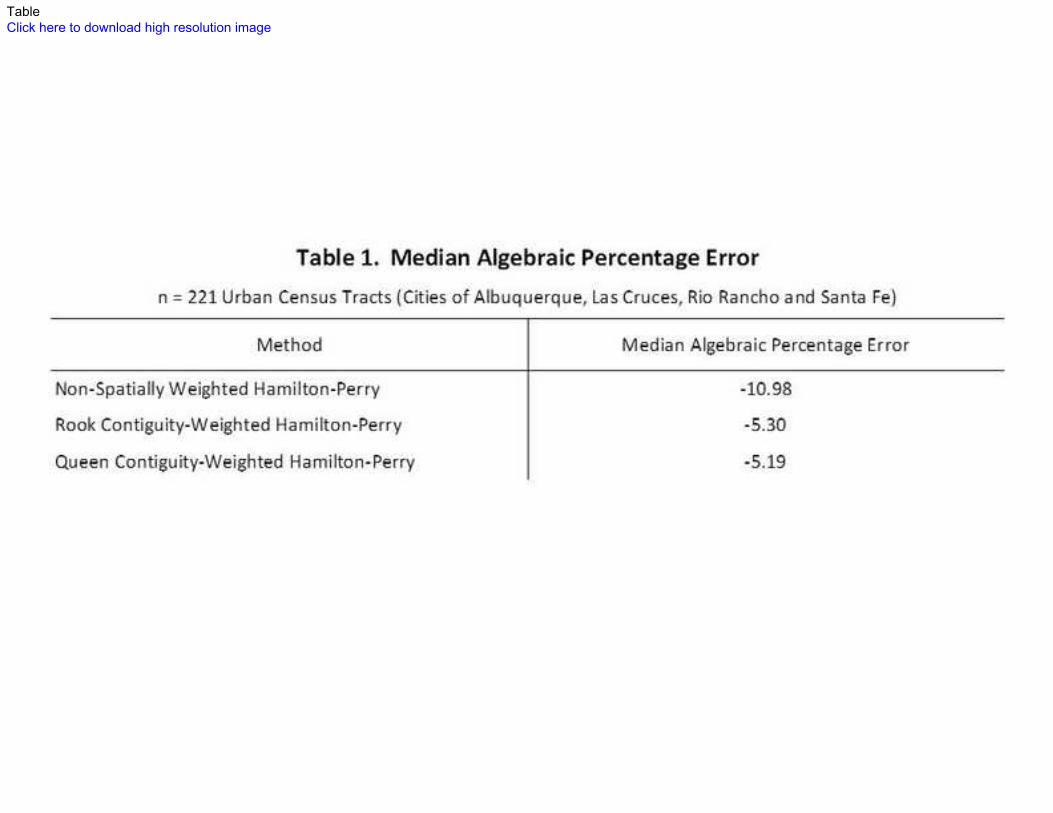
Table 1 reports errors associated with standard and spatially-weighted Hamilton-Perry
forecasts of total populations. The improvements in accuracy associated with the spatially-
weighted forecasts are clear. Though all sets showed negative bias, non-spatially weighted
forecasts are nearly two times less accurate than spatially-weighted variants: -10.98 percent vs
-5.30 and – 5.19 percent for forecasts based on rook and queen contiguity, respectively. It is
noteworthy that neither spatial weighting model out-performed in forecasts of total
population.
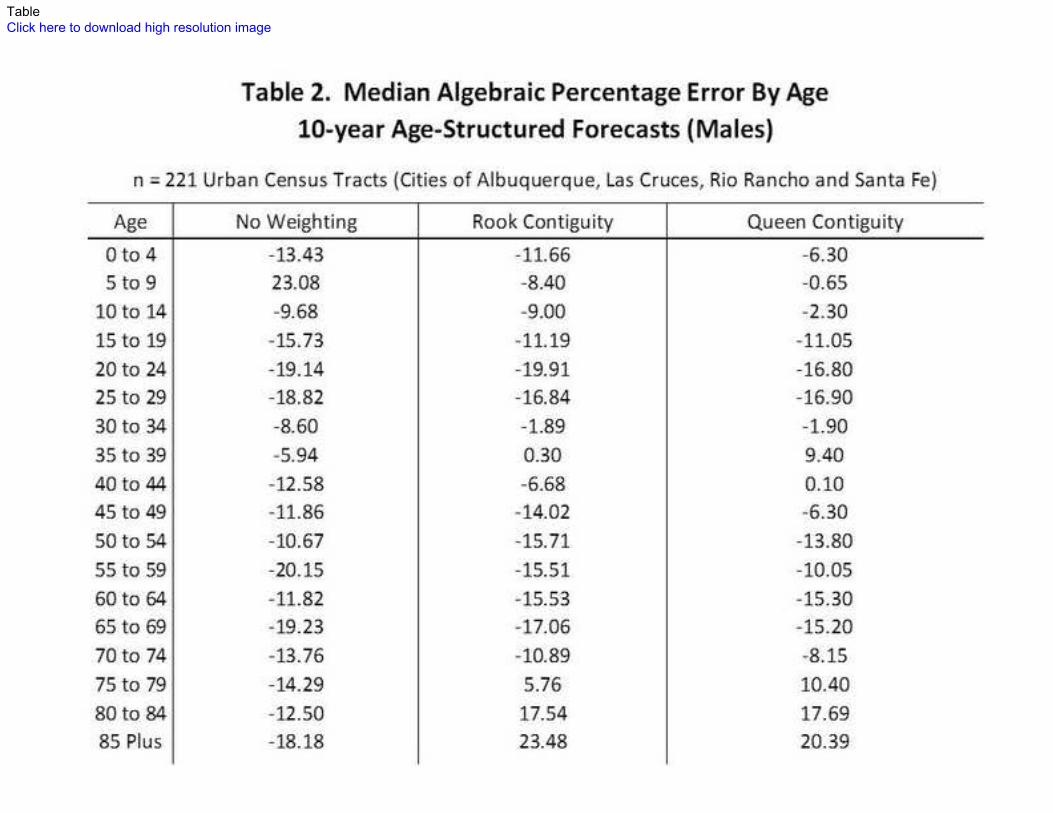
Tables 2 and 3 consider age-specific errors for each model, stratified by sex (males in
Table 2 and females in Table 3). Again, the spatially-weighted variants significantly reduced
error in the forecasts; this result holds for both sexes. Rook-weighted models out-performed
the standard method in 14 out of 18 age groups, with errors ranging between a low of 0.30
percent (35 to 39 year old men) and a high of 23.48 percent (85 plus). Queen-weighted
variants (which are less inclusive since only shared sides qualify them as a “neighbor”) out-
performed the standard Hamilton-Perry forecasts in 16 of 18 age-groups, ranging from a high of
20.39 percent (85 Plus) and a low of .10 percent (40 to 44 year old men). In 15 out of 18 age-
categories, the queen weighed variant was more accurate than either standard or rook-
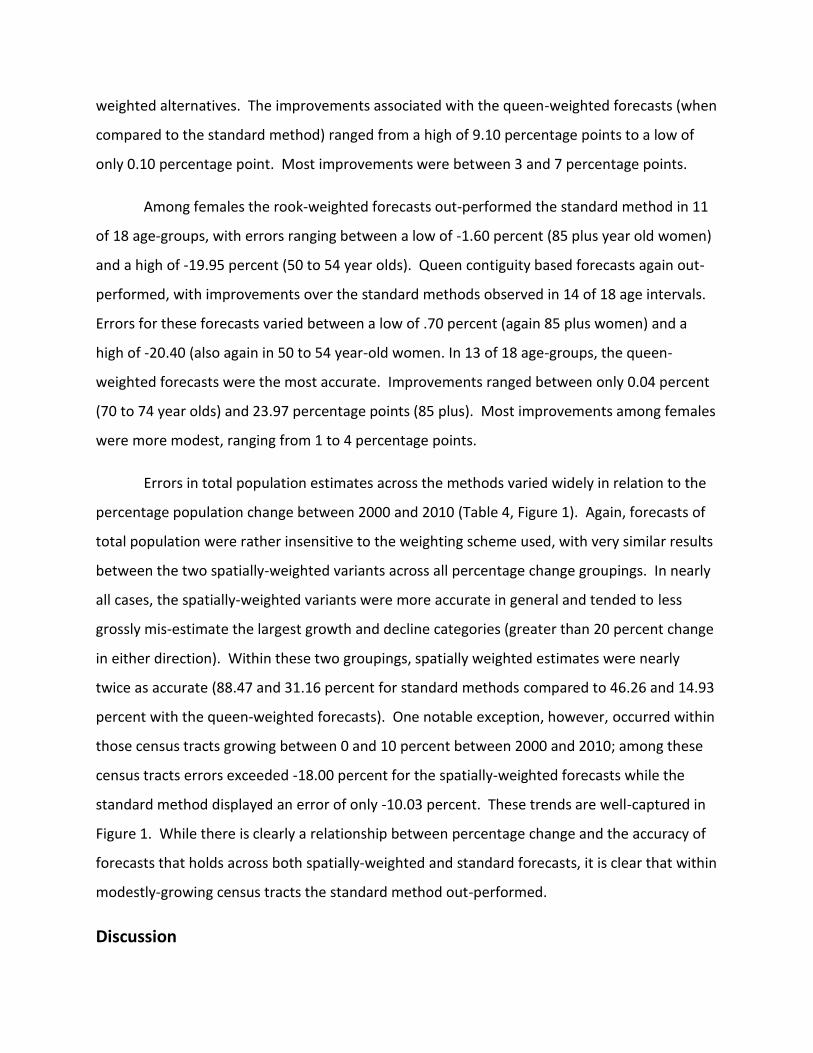
weighted alternatives. The improvements associated with the queen-weighted forecasts (when
compared to the standard method) ranged from a high of 9.10 percentage points to a low of
only 0.10 percentage point. Most improvements were between 3 and 7 percentage points.
Among females the rook-weighted forecasts out-performed the standard method in 11
of 18 age-groups, with errors ranging between a low of -1.60 percent (85 plus year old women)
and a high of -19.95 percent (50 to 54 year olds). Queen contiguity based forecasts again out-
performed, with improvements over the standard methods observed in 14 of 18 age intervals.
Errors for these forecasts varied between a low of .70 percent (again 85 plus women) and a
high of -20.40 (also again in 50 to 54 year-old women. In 13 of 18 age-groups, the queen-
weighted forecasts were the most accurate. Improvements ranged between only 0.04 percent
(70 to 74 year olds) and 23.97 percentage points (85 plus). Most improvements among females
were more modest, ranging from 1 to 4 percentage points.
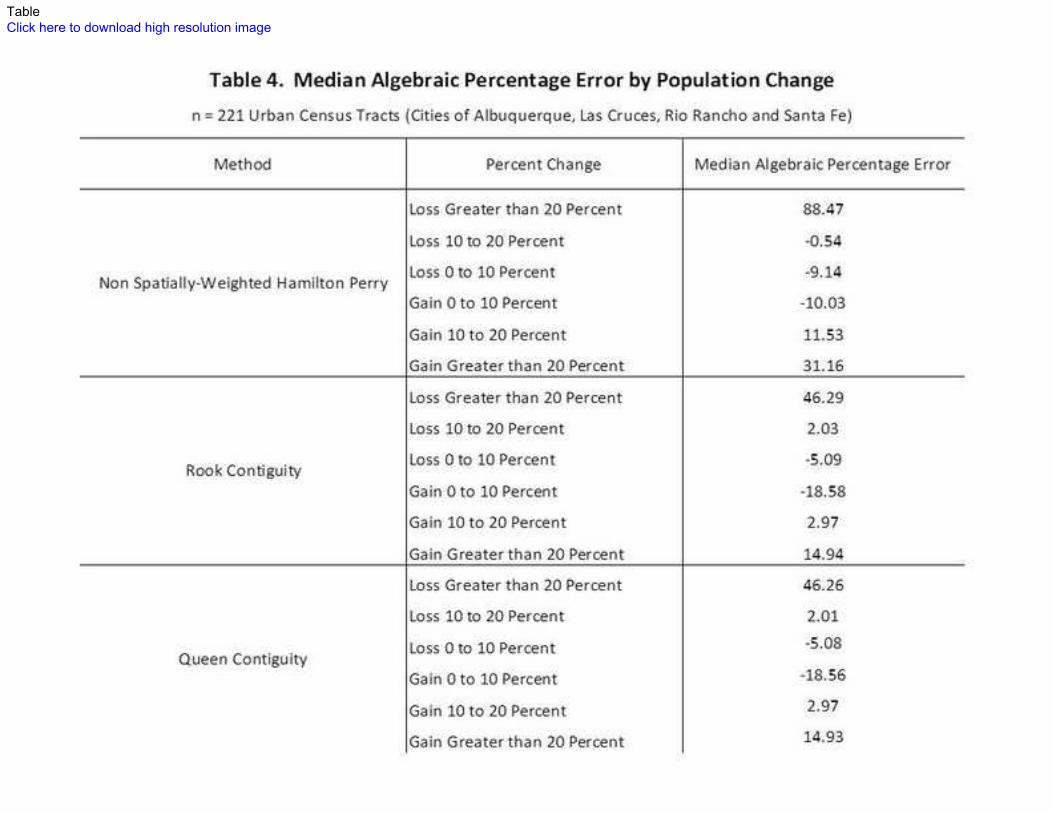
Errors in total population estimates across the methods varied widely in relation to the
percentage population change between 2000 and 2010 (Table 4, Figure 1). Again, forecasts of
total population were rather insensitive to the weighting scheme used, with very similar results
between the two spatially-weighted variants across all percentage change groupings. In nearly
all cases, the spatially-weighted variants were more accurate in general and tended to less
grossly mis-estimate the largest growth and decline categories (greater than 20 percent change
in either direction). Within these two groupings, spatially weighted estimates were nearly
twice as accurate (88.47 and 31.16 percent for standard methods compared to 46.26 and 14.93
percent with the queen-weighted forecasts). One notable exception, however, occurred within
those census tracts growing between 0 and 10 percent between 2000 and 2010; among these
census tracts errors exceeded -18.00 percent for the spatially-weighted forecasts while the
standard method displayed an error of only -10.03 percent. These trends are well-captured in
Figure 1. While there is clearly a relationship between percentage change and the accuracy of
forecasts that holds across both spatially-weighted and standard forecasts, it is clear that within
modestly-growing census tracts the standard method out-performed.
Discussion
As with other extrapolation-based methods, the performance of Hamilton-Perry
forecasts depends upon the correspondence between historical and future trends: the
method will perform best when rates and direction of change within any age-cohort are similar
between the two periods and fertility is constant or growing at a constant rate (Smith et. al.,
2001; Swanson and Tayman, 2012). In cases where either of these trends are incongruent
(change in direction) between the historical and horizon-specific periods one should anticipate
relatively poorer performance. Previous studies have uniformly suggested that demographic
forecasts will perform most poorly in areas where rapid change has occurred in either direction
(Smith and Shahidullah, 1995; Isserman, 1977; Keyfitz, 1981; Smith, 1987; White, 1954; Smith
et. al., 2001). In this study, visual inspection of errors revealed that the largest errors observed
were in those census tracts where such incongruent trends have occurred. While there is not a
simple solution to this issue in the context of the Hamilton-Perry method, the results of the
current study are encouraging for its utility and, especially, for the utility of spatially-weighted
versions of it.
Since the Hamilton-Perry method (or any component method) is mathematically
equivalent whether it is applied for making estimates or forecasts (Swanson and Tayman, 2012;
Baker et. al., 2013), the relevance of these results are reviewed in the context of both sets of
studies. From this perspective, the average errors for forecasts of total population using
spatially-weighted variants is at the low end of those reported in previous research, while the
non-weighted standard variant falls well within the range of errors reported in these efforts.
Hoque (2010) presents size-stratified results in his study of vintage 2000 estimates for Texas
counties made using two variants of the Component method, one of which was the Hamilton-
Perry (he refers to it as the Component III method in the sense of Smith et. al., 2001 and
Swanson and Tayman, 2012). He also presents results for a well-known alternative method
based on regression—the ratio-correlation technique (Schmitt and Crossetti, 1954; Swanson
and Tayman, 2012). Hoque reports an average error or -18.93% for a component-based
estimate based on births, deaths, and school-enrollment and an average error or only 10.98%
when using the Hamilton-Perry approach. These results are comparable those obtained using
the standard Hamilton-Perry method in the current study (-10.98 percent), and clearly larger

than the spatially-weighted total population forecasts presented here (-5.30 for Rook-weighted
and – 5.19 for Queen-weighted forecasts). Hoque reports average errors ranging between 4.70
percent and 17.74 percent over similar size categories using the ratio-correlation method.
Smith (1987) reported errors between 18.00 and 25.00 percent using a variety of trend-
extrapolation procedures for Florida census tracts and Voss and Kale (1985) report errors of a
similar magnitude (15.00 to 25.00 percent) in their study of census tract extrapolation-based
forecasts. Smith and Shahidullah (1995) report errors between 17.30 and 27.61 percent for a
variety of methods. Cai (2007) reports a very small average error (0.5 percent) in her study of a
select group of Oregon census tracts (n=147) for which building permit data were available to
track net-migration through housing within a component-based framework that might be
utilized for either estimation or projection.
To our knowledge, only two studies have attempted to address errors in forecasts of
age/sex composition for census tracts or equivalently-small populations: Smith and Shahidullah
(1995), Baker et. al. (2013a) and Baker et. al. (2013b). Smith and Shahidullah (1995) report
their results in ten year age intervals. Errors in that study ranged between -7.3 percent and
11.4 % (0 to 9 year olds and 65 plus with no sex-specific analysis reported). We would expect
that errors would have been somewhat larger in that study if they had been grouped in five-
year age/sex intervals—perhaps similar to the magnitude of errors reported here. However,
perhaps the most important study to compare to the current one is Baker et. al. (2013a). In
that study, census tract level estimates were compared to the 2010 census results for all census
tracts in four representative counties that broadly reflect the statewide characteristics of the
New Mexico population (Bernalillo, Dona Ana, San Juan, and Curry). Errors in this study were
also consistently negative. Among males, these errors ranged between a high of -33.42 percent
(40 to 44 year olds) and a low of only 4.28 percent (0 to 4 year olds). Among females,
magnitudes of error were similar, ranging between a low of 3.68 percent (0 to 4 year olds) and
a high of 24.02 percent (30 to 34 year olds). It is noteworthy that the lowest errors were
observed in intervals where child/woman dependency ratios were utilized to make forecasts,
rather than cohort change ratios. Unlike in the current study—no clear relationship between
percentage change and accuracy of estimates was observed in that research. While the study

area in that research overlapped with the current one, it is important to note that some
important differences exist between the two studies. First, and perhaps foremost, in the
current study only urban census tracts situated within city boundaries were included, while
census tracts within two largely rural counties (Curry and San Juan) were included in the Baker
et. al. (2013) study. This should tend to enhance accuracy even in the absence of spatial
weighting. This limits the comparability of the two studies in spite of some overlap in study
population (Bernalillo and Dona Ana counties)—and it makes the greater accuracy observed in
this study much more comprehensible. The results of this study apply only to urbanized
population dynamics—they are likely generalizable to other urbanized settings of the American
West, but only additional studies in a variety of settings will confirm the conclusions reached
here.
The significantly lower error patterns observed here suggest that the spatial weighting
of demographic forecasts may be a promising avenue for future research within applied
demography. While limitations associated with generalizability are apparent, the results
suggest that further research on the utility of spatial weighting of demographic forecasts is
merited. A variety of spatial-weighting algorithms exist—some base the definition of a
“neighborhood” on a specific number of k closest neighbors while others (such as Delaunay
triangulation) conceptualize proximity in terms of centroids (Getis, 2009; Ord and Getis, 2009;
Getis and Aldstadt, 2004). Statistical methods such as “spatial-scanning” (Kuldorff, 1997, 1999;
Kuldorff and Nagarwala,1995; Kuldorff et. al., 2005) apply a rough equivalent to a
neighborhood matrix in applying a variably-sized circle-based scanning window to define
groupings of census tract population data. Such a flexible scanning window based on a
stochastic neighborhood matrix might provide an avenue for extending the concept of
“neighborhood” to provide refinements to the simple method presented here. Likewise,
though it would be computationally more intensive, it is also possible that spatial weightings
could be adjusted to optimize fit between forecasts and census data at one point in time, then
carried forward within forecasts. This would be analogous to the optimization of portfolio
weightings within an investment model except that the objective function here would be
minimization of error rather than an maximization of return on investment given a specific risk
appetite (Markowitz, 1952; De Miguel et. al., 2009).
The most significant challenge to successful implementation of the Hamilton-Perry
method for demographic forecasts observed in this study, was in zones where there was an
incongruency of trends between the previous intercensal period and the forecast period.
Further research that sought to bring togther ancillary data that signaled such shifts would
improve the procedure implemented here. Examples might include data on shifts in housing
stock or analyses focused on areas where previous forecasts displayed significant inaccuracy in
conjunction with a directional switch in trends. These analyses could be performed in
conjunction with shift-share models of housing unit stock relying on census data (Smith et. al.,
2001), data from the American Community Survey, examination of geocoded building permits
(if imperfect), or parcel or E911 records. In urbanized settings, each of these pathways might
bear fruit. When combined with improvements in considerations of spatial-weighting
algorithms, a unified and innovative approach might provide some of the significant innovations
and improvements that demographers must generate moving forward.

Alba R, Logan J, Stults B (2000) How Segregated are Middle-Class African-Americans. Social Problems.
47(4):543-558.
Armstrong CM, Harris M (1949) A Method of Predicting School-Age Population. Albany: State University
of New York, State Education Department.
Baker J, Ruan XM, Alcantara A, Jones T, Watkins K, and additional authors (2008) Density-dependence in
Urban Housing Unit Growth: An Evaluation of the Pearl-Reed Model for Predicting Housing Unit Stock at
the Census Tract Level. Journal of Economic and Social Measurement, 33,155-163.
Baker J, Alcantara A, Ruan XM (2011) A Stochastic Version of the Brass PF Ratio Adjustment of Age-
Specific Fertility Schedules. PLoS One. 6(8):e23222. doi:10.1371/journal pone0023222
Baker J, Alcantara A, Ruan XM, Watkins K (2012) The Impact of Incomplete Geocoding on Small Area
Population Estimates. Journal of Population Research, 29, 91-112.
Baker J, Alcantara A, Ruan XM, Watkins K, Vasan S (2013) A Comparative Evaluation of Error and Bias in
Census Tract-Level Age/Sex-Specific Population Estimates: Component I (Net-migration) vs Component
III (Hamilton-Perry). Population Research and Policy Review. 32:919-942.
Best N and Wakefield J (1999) Accounting for Inaccuracies in Population Counts and Case Registration in
Cancer Mapping Studies. Journal of the Royal Statistical Society: Series A (Statistics in Society).
162(3):363-382.
Cai Q (2007) New Techniques in Small Area Population Estimates by Demographic Characteristics.
Population Research and Policy Review. 26:203-218.
Cavanaugh F (1981) The Census Bureau's 1980 Census Test of Population Estimates. In: Small-Area
Population Estimates--Methods and Their Accuracy and New Metropolitan Area Definitions and Their
Impact on the Private and Public Sector, Series GE-41, No. 7. Washington, DC: Government Planning
Office.
Centers for Disease Control (1999) National Program of Cancer Registries Cancer Surveillance System
Rationale and Approach. Atlanta: CDC.
Chi G and Voss P (2011) Small-Area Population Forecasting: Borrowing Strength Across Space and Time.
Population, Space, and Place. 17:505-520.
Chi G and Zhu J (2008) Spatial Regression Models for Demoraphic Analysis. Population Research and
Policy Review. 27:17-42.
de Miguel V, Garlappi L, Uppal R (2007) Optimal Versus Naieve Diversification: How Inefficient is the
1/N Portfolio Strategy. Journal of Finance. 22(5): 1915-1953.
Dietzel C and Clarke K (2007) Research Article. Toward Optimal Calibration of the SLEUTH Land Use
Change Model. Transactions in GIS. 11(1):29-45.
Drummond WJ (1995). Address Matching: GIS Technology for Mapping Human Activity Patterns. Journal
of the American Planning Association, 61(2), 240-251.
Duncan O and Duncan B (1955) A Methodological Analysis of Segregation Indexes. American
Sociological Review. 20(2):210-217.
Fabricant R, Weinman J (1972) Forecasting First Grade Public School Enrollment by Neighborhood.
Demography. 9(4):625-634.
Fellegi IP (1968) Coverage Check of the 1961 Census of Population. Technical Memorandum (Census
Evaluation Series). No. 2, Dominion Bureau of Statistics.
Frotheringham A, Brundson C, Charlton M (2002) Geographically Weighted Regression: The Analysis of
Spatially-Varyiugn Relationships. West Sussex: Wiley.
Getis A and Aldstadt J (2004) Constructing the Spatial Weights Matrix Using a Local Statistic.
Geographical Analysis. 36(2):90-104.
George MV (2004) Population Projections. In: J. Siegel and D. Swanson, editors, The Methods and
Materials of Demography. New York: Springer.
Getis A (2009) Spatial Weight Matrices. Geographical Analysis. 41(4):404-410.
Gilboa SM (2006). Comparison of Residential Geocoding Methods in a Population-Based Study of Air
Quality and Birth Defects. Environmental Research, 101, 256-262.
Goldberg DW, Wilson JP, Knoblock CA (2007). From Text to Geographic Coordinates: the Current State
of Geocoding. URISA Journal, 19(1), 33-46.
Hamilton C and Perry J (1962) A Short Method for Projecting Population by Age from One Decennial
Census to Another. Social Forces, 41(2), 163-170.
Haining R (2003). Spatial Data Analysis: Theory and Practice. New York: Cambridge.
Harris R, Sleight P, Webber R (2005) Geodemographics, GIS, and Neighborhood Targeting. New York:
Wiley.
Herold M, Goldstein N, Clark KC (2003) The Spatiotemporal Form of Urban Growth: Measurement,
Analysis, and Modeling. Remote Sensing of Environment. 86:286-302.
Hogan J and Tchernis R (2004) Bayesian Factor Analysis for Spatially-Correlated Data, With Application to
Summarizing Area-Level Material Deprivation from Census Data. 99(466):314-324.
Hogan H (1992) The 1990 Post-Enumeration Survey: An Overview. The American Statistician, 261-269.

Hogan H (1993) The 1990 Post-Enumeration Survey: Operations and Results. Journal of the American
Statistical Association, 88,1047-1060.
Hogan H (2003) The Accuracy and Coverage Evaluation: Theory and Design. Survey Methodology,
29(2), 129-138.
Hoque N (2010) An Evaluation of Small Area Population Estimates Produced by Component Method II,
Ratio Correlation, and Housing Unit Methods for 1990. The Open Demography Journal, 3:18-30.
Hund L, Chen J, Krieger N, Coull B (2012) A Geostatistical Approach to Large-Scale Disease Mapping with
Temporal Misalignment. Biometrics. 68(3):849-858.
Karimi HA and Durcik M (2004) Evaluation of Uncertainties Associated with Geocoding Techniques.
Computer-aided Civil and Infrastructural Engineering, 19, 170-185.
Keyfitz N (1981) The Limits of Population Forecasting. Population and Development Review. 7(4):579-
593.
Kuldorff, M. (1997). A spatial scan statistic. Communication in Statistics: Theory and Methods. 26:
1481–1496.
Kuldorff, M. (1999). An isotonic spatial scan statistic for Geographical Disease Surveillance. Journal of
the National Institute of Public Health. 48:94-101.
Landis J and Zhang M (1998) The Second Generation of the California Urban Futures Model: Part 2,
Specification and Calibration Results of the Land Use Change Submodel. Environment and Planning B.
25:795-842.
Leach D (1981) Re-evaluation of the Logistic Curve for Human Populations. Journal of the Royal
Statistical Society. 144:94-103.
Legare J (1972) Methods for Measuring School Performance Through Cohort Analysis. Demography.
9(4):617-624.
Le Sage, J., & Pace, K. R. (2004). Models for spatially-dependent missing data. Journal of Real Estate
Finance and Economics. 29(2):233–254.
Long J (1995) Complexity, Accuracy, and the Utility of Official Population Projections. Mathematical
Population Studies. 5(3):203-216.
Markowitz HM (1952) Portfolio Selection. Journal of Finance. 7:77-91.
Massey D and Denton N (1985) Spatial Assimilation as a Socioeconomic Outcome. American Sociological
Review. 50(1):94-106.

McKibben J (1996) The Impact of Policy Changes on Forecasting for School Districts. Population Research
and Policy Review. 15(5-6):527-536.
Myers JK (1954) Note on the Homogeneity of Census Tracts: A Methodological Problem in Urban
Ecological Research. Social Forces.
Oliver MN (2005) Geographic Bias Related to Geocoding in Epidemiologic Studies. International Journal
of Health Geographics. 4(29): Online.
Ord J and Getis A (2004) Local Spatial Autocorrelation Statistics: Distributional Issues and an
Application. Geographical Analysis.
Pace K, Gilly O R (1997) Using the Spatial Configuration of Data to Improve Estimation. The Journal of
Real Estate Finance and Economics. 14(3):330-340.
Patacchini E, Zenou Y (2007) Spatial Dependence in Local Unemployment Rates. Journal of Economic
Geography. 7(2):169-191.
Pflaummer P (1992) Forecasting US Population Totals with the Box-Jenkins Approach. International
Journal of Forecasting. 8:329-338.
Ratcliffe JH (2001) On the Accuracy of Tiger-Type Geocoded Address Data in Relation to Cadastral and
Census Area Units. International Journal of Geographical Information Science. 15(5):473-485.
Schmid C and Shanley F (1952) Techniques of Forecasting University Enrollment. Tested Empirically
by Deriving Forecasts of Enrollment for the University Of Washington. The Journal of Higher Education.
23(9):483-488, 502-503.
Schmitt A and Crosetti A (1954) Accuracy of the Ratio-Correlation Method for Estimating Postcensal
Population. Land Economics. 30:279-281.
se Can A and Megbolugbe I (1997) Spatial Dependence in House Price Index Construction. Journal of
Real Estate Finance and Economics. 14(1-2):203-222.
Shahidullah M and Flotow M (2005) Criteria for Selecting a Suitable Method for Producing post-2000
County Population Estimates: A case study of population estimates in Illinois. Population Research and
Policy Review, 24, 215-229.
Shyrock H and Siegel J (1980) The Methods and Materials of Demography. Vol II. Washington DC: US
Department of Commerce.
Smith S (1987) Tests of Forecast Accuracy and Bias for County Population Projections. Journal of the
American Statistical Association, 82(400), 991-1003.
Smith S and Sincich T (1992) The Relationship Between length of the Base Period and Population
Forecast Errors. Journal of the American Statistical Association. 85(410):367-375.
Smith S, Tayman J, Swanson D (2001) State and Local Population Projections: Methodology and Analysis.
New York: Plenum.
Smith S and Shahidullah M (1995) An Evaluation of Projection Errors for Census Tracts. Journal of the
American Statistical Association, 90(429), 64-71.
Swanson D and Tayman J (2012) Subnational Population Estimates. New York: Springer.
Swanson D, Schlottman A, Schmidt B (2010) Forecasting the Population of Census Tracts by Age and
Sex: An Example of the Hamilton-Perry Method in Action. Population Research and Policy Review,
29(1), 47-63.
Swanson D and McKibben J (2010) New Directions in the Development of Population Estimates in the
United States. Population Research and Policy Review, 29(6), 797-818.
Tayman J, Schafer E, and Carter L (1998) The Role of Population Size in the Determination and
Prediction of Population Forecast Errors: An Evaluation Using Confidence Intervals for Subcounty Areas.
Population Research and Policy Review, 17(1), 1-20.
Tayman J (1999) On the Validity of MAPE as a Measure of Forecast Accuracy. Population Research and
Policy Review. 18(4):299-322.
Tobler WR (1979) Smooth Pycnophylactic Interpolation for Geographical Regions. Journal of the
American Statistical Association, 74, 519-530.
Voss PR, Long DD, Hammer RB (1999) When Census Geography Doesn't Work: Using Ancillary
Information to Improve the Spatial Interpolation of Demographic Data. Center for Demography and
Ecology, University of Wisconsin, Madison. Working Paper No. 99-26.
Voss P and Kale B (1985) Refinements to Small-Area Population Projection Models: Results of a Test
Based on 128 Wisconsin Communities. Presented at the Annual Meeting of the Population Association
of America’s Annual Meeting. March 28-30, 1985.
Ward D, Murray A, Phinn S (2000) A Stochastically Constrained Cellular Model of Urban Growth.
Computers, Environment, and Urban Systems. 24(6):539-558.
White HR (1954) Empirical Study of Selected Methods of Projecting State Population. Journal of the
American Statistical Association. 49:480-498.
Witmer JA, Samuels ML. (1998) Statistics for the life sciences. New York: Sinauer.
Zandbergen P (2009) Geocoding Quality and Implications for Spatial Analysis. The Geography Compass
3.
Zandbergen P and Ignizio D (2010) Comparison of Dyasymetric Mapping Techniques for Small Area
Population Estimates. Cartography and Geographic Information Science, 37(3), 199-214.

Zitter M (1954) Forecasting School Enrollment for the United States and Local Areas. Journal of Teacher
Education. 5(1):53-63.

FigureClick here to download high resolution image
TableClick here to download high resolution image
TableClick here to download high resolution image

TableClick here to download high resolution image
TableClick here to download high resolution image