SUSTAINABILITY REPORT 2017 Sustainability Approach
153
-
Upload
khangminh22 -
Category
Documents
-
view
3 -
download
0
Transcript of SUSTAINABILITY REPORT 2017 Sustainability Approach


SUSTAINABILITY REPORT 2017
Sustainability Approach
SUST
AIN
ABI
LITY
APP
ROAC
H

CONTENTS
ABOUTTHE REPORT
01 02MESSAGEFROM THE CEO
04CCI AT AGLANCE
08PERFORMANCE HIGHLIGHTS
14INTEGRATING SUSTAINABILITY
10AWARDS RECEIVED
12SUSTAINABILITY JOURNEY
25
CORPORATE GOVERNANCEAND ETHICS13
EXTERNAL RECOGNITION

CONTENTS
ABOUTTHE REPORT
01 02MESSAGEFROM THE CEO
04CCI AT AGLANCE
08PERFORMANCE HIGHLIGHTS
14INTEGRATING SUSTAINABILITY
10AWARDS RECEIVED
12SUSTAINABILITY JOURNEY
25
CORPORATE GOVERNANCEAND ETHICS13
EXTERNAL RECOGNITION
SUSTAINABILITY APPROACH 1
CCI’s 10th sustainability report shares our practices and performance results obtained during the period between January 1 and December 31, 2017 for six of the 10 operating countries: Turkey, Jordan, Azerbaijan, Kazakhstan, Pakistan and Kyrgyzstan. Please note that ‘CCI Operating Geography’, ‘Summary of Financials’ and ‘Key Financial and Operating Indicators’ include all operating countries.
The coverage of the report reached 87% of CCI’s total production volume and 85% of CCI’s employees as of December 31, 2017. In order to meet the information disclosure requirements of various sustainability indices, we added new content to our report as we did in the previous year’s report. We also included results and related information of projects initiated at the reporting period but that will continue in 2018.
Standards Used
The three principles of the AA1000 Assurance Standard, namely materiality, inclusiveness and responsiveness, guide the content development process of this report. In addition, we measure and report our social, environmental and ethical performance using leading principles, standards and methodologies such as those adopted by the Global Reporting Initiative (GRI) Standards, CDP Programs, the International Labor Organization (ILO), the United Nations Convention Against Corruption (UNCAC) and the Greenhouse Gas (GHG) Protocol developed by the World Resources Institute (WRI).
The content of this report has been prepared in accordance with the “core” option of the GRI Standards Sustainability Reporting Guidelines. The report also serves as our Communication on Progress (COP) to the United Nations Global Compact (UNGC) as well as our progress
report on how we incorporate the United Nations Women Empowerment Principles (WEPs).
Verification
For the seventh consecutive year, certain data in this report were independently audited. The GHG emissions of CCI Turkey Operations’ manufacturing, sales and distribution operations for 2017 were audited, as in the last five years, by a third-party auditing organization, and verified in accordance with the International Organization for Standardization’s ISO 14064-3 2006 Standard as meeting the requirements of ISO 14064-1. CCI Turkey Operations successfully passed the audits. Both GHG Protocol’s Scope 1 and Scope 2 emissions were verified as a result of this process. The level of assurance was deemed “reasonable” and the uncertainty was considered to be below 5% by the verifier. The assurance statement of Bureau Veritas is included in Performance Indicators section of this report.
Selected information, as defined in the Independent Limited Assurance Report in Performance Indicators section of this report, received limited assurance from the independent audit company EY. In 2017, we obtained, for the 7th
time, limited assurance on Selected Information for our operations in Turkey. The Selected Information covered total energy data, per-product energy use, total water withdrawal and consumption data and per-product water use, as described in the CCI Reporting Guidance included in the Performance Indicators section of this report. Within the context of this audit, 2017 data from CCI’s Turkey plants were assessed to reach a conclusion of Limited Assurance in accordance with the International Standard Assurance Engagements Other Than Audits or Reviews of Historical Financial Information (ISAE 3000 (Revised)).
Structure
The year 2017 was a transition period for sustainability practices at CCI. In our efforts to update our 2025 Road map and our reporting approach, we changed the report structure to reflect the value we create for our stakeholders. To further enhance the reporting practice, we developed our reporting approach that illustrates “our pledge to create value” through CCI operations in line with our 2025 sustainability vision and strategies.
This year, we prepared three full sections that represent our different stakeholders’ interests. The first section, Sustainability Approach, includes general information about CCI and sustainability governance. In the second section, Sustainability in Review, we summarize our programs and efforts to create value for our stakeholders. Finally, the third section, Performance Indicators, provides supplementary technical and numerical information about our operations for relevant stakeholders.
Feedback
Receiving feedback from our stakeholders is vital to help us improve both our practices and our reporting processes. We evaluate every issue that comes to our attention and use any feedback from our stakeholders to continuously improve our practices.
We invite our stakeholders to share their opinions, suggestions or complaints by sending an e-mail [email protected]
or by calling the Corporate Affairs Department at+90 216 528 40 00
or through the Contact Us tab on our website cci.com.tr
ABOUT THE REPORT
102-45; 102-46; 102-48; 102-50; 102-53; 102-56

2 CCI SUSTAINABILITY REPORT 2017
MESSAGE FROM THE CEO
We are delighted to present our 10th Sustainability Report covering our 2017 performance. Around the globe, we experienced a significant rebound in global trade with a 3.8 percent increase in world growth. CCI; operating in Turkey, the Middle East, Central Asia and Pakistan with 26 plants and close to 9,000 employees performed even better. Our sales volume was up by 4%, reaching 1.24 billion unit cases, while our net sales revenue increased by 21% to ₺8.5 billion and our EBITDA by 26% to ₺1.4 billion. We are also distributing ₺200 million dividends to our shareholders for 2017. We are satisfied with the growth momentum we achieved in 2017 with all regions
contributing to the growth and have registered the highest net revenue, EBIT and EBITDA growth of the last five years while delivering 2017 guidance.
We are focused on reaching our goal to become the best FMCG company across our markets. However, while we work feverishly to accomplish this, we never compromise on being a responsible corporate citizen. We are committed to delivering sustainable growth, and we strive to create sustainable value for our stakeholders along our value chain. We commit to transfer this value to the community through corporate citizenship; by being a great place to work; by being our customers’ preferred partner and
being the trusted brand for our consumers.
We are embedding sustainability principles in all our processes. This year, we developed our 2025 sustainability vision & framework as we advance towards our growth targets set by our 2025 vision. Through our effective water management practices, we saved about 200,000 m³ of water in our six reporting countries. We also increased waste recycling rates in our production and reduced the materials used and GHG emissions generated from packaging operations in the value chain through sustainable packaging projects designed to make our bottles lighter.
Dear stakeholders,
102-14

SUSTAINABILITY APPROACH 3
In 2017, we saved almost 31 million MJ of energy and reduced our CO2 emissions by 3,305 tons through efficiency projects at our plants. Our cooling equipment accounts for around 43.5% of our GHG emissions. Our cooler EMD program solely made it possible to save about 468 million kWh of electricity in our six reporting countries, thus reducing CO2 emissions by 78,711 tons. That equals to an amount that would require 6.6 million trees to extract from the atmosphere.
Based on our previous learnings, we focused heavily on our route to market safety in 2017, and with the safety campaigns, we had no employee or contractor fatalities occurring. Our dedication will continue in 2018, with best-in-class practices like Road Safety Collaboration Pakistan project where we are pioneering other multi-national organizations in Pakistan to create a collaborative impact on the traffic safety
awareness of Pakistan.
While we outperformed most of our sustainability goals in 2017, we did not keep up to our expectations on empowerment of women leaders within CCI. We reviewed the reasons for our shortcoming, and we will be taking the necessary actions.
We believe that inspiring our value chain and disseminating our sustainability vision are our essential missions. Therefore, we focus on our suppliers to spread our positive impact and raise the bar in society. To this end; we had developed Supplier Guiding Principles (SGP) to strengthen the sustainability pillars and to comply with CCI. Also, we conduct Workplace Rights Policy (WRP) audits. To achieve full compliance at all 17 WRP and SGP Audits, performed by the independent auditing companies authorized by TCCC, in 2017 was an important success in that term.
I am delighted and proud to announce that our commitment to reaching perfection bore its fruits in 2017. Our excellent work was recognized and awarded by many governmental organizations and NGOs.
Our commitment to UN Global Compact and contribution to Sustainable Development Goals will be ongoing.
On behalf of all the CCI organization, I sincerely thank you for your positive response, input and support in making our journey towards sustainability successful.
Burak Başarır
Coca-Cola İçecek, CEO
102-14

Total beverage mindsetCommercial excellence
Corporate governanceEnvironmental footprintWorkplace rightsSocial license to operate
Capability and leadershipEngaged, diverse and inclusive
High performing One Team culture
Customer centric organizationValue-added customer solutionsCompetitive cost to serve
CREATEVALUE
Customer & Consumer
Community People
INN O V A T IO N
TEC
HN
OLO
GY
BUSIN
E SSPR
OC
ESSE
S
Being a goodcorporate citizen
Great place towork
Being the preferred partner of our customers, offering our consumers a wide choice of products fit for every
lifestyle and occasion
4 CCI SUSTAINABILITY REPORT 2017
CCI is the sixth-largest bottler in the Coca-Cola system in terms of sales volume. CCI produces, distributes and sells sparkling and still beverages of The Coca-Cola Company (TCCC) throughout Turkey, Pakistan, Kazakhstan, Azerbaijan, Kyrgyzstan, Turkmenistan, Jordan, Iraq, Syria and Tajikistan.
CCI employs close to 9,000 people and has a total of 26 plants, offering a wide range of beverages to a consumer base of 400 million people. In addition to sparkling beverages, the product portfolio includes juices, waters, sports and energy drinks, teas, coffees and iced teas.
CCI’s shares are traded on the Borsa Istanbul (BIST) under “CCOLA.IS”, American depositary receipts (ADR) are traded over the counter in the United States under “COLAY”, and Eurobond is traded on the Irish Stock Exchange under “CCOLAT” tickers.
CCI AT A GLANCE
Our Vision
“Be the best FMCG company across our markets.”
102-1; 102-2; 102-4; 102-6

SUSTAINABILITY APPROACH 5

We put our hearts and mind into what we do.
We collaborate for our collective
success.
We are open, honest, ethical and we trust and
respect each other.
We act with high sense of responsibility
and hold ourselves accountable.
Passi
on
Acco
untability
Team
work
Inte
grity
Turk
ey
Inte
rnat
iona
l
Cons
olid
ated
37.3% 31.4% 26.2%
million TL1,379 Increase
26.2%
EBITDA
Turk
ey
Inte
rnat
iona
l
Cons
olid
ated
49.6% 48.5% 36.4%
million TL874 Increase
36.4%
EBIT
Turk
ey
Inte
rnat
iona
l
Cons
olid
ated
11.7% 30.4% 20.9%
million TL8,521 Increase
20.9%
Net Sales Revenue
Turk
ey
Inte
rnat
iona
l
Cons
olid
ated
3.3% 4.9% 4.1%
million unit cases1,237 Increase
4.1%
Sales Volume
2016 2017
6 CCI SUSTAINABILITY REPORT 2017
Our Values
Key Financial and Operational Indicators
CCI Operating Geography
Population (2017)(millions)(1)
Percentage of population
under 30 (2015)(1)
GDP per capita (thousands $)
(2017)(3)
Per-capita consumption of
NARTD (L)(4)
CCI’s market share in sparkling
beverages(5)
CCI’s ranking in sparkling beverages
Turkey 80.8 50% 26.5 57 63% 1
Pakistan 207.7(2) 64% 5.4 26 37% 2
Iraq 38.3 68% 17.0 47 - 2
Jordan 9.7 64% 12.5 49 - 2
Syria 18.3 65% - - - -
Kazakhstan 18.2 51% 26.1 71 49% 1
Azerbaijan 9.8 49% 17.4 26 75% 1
Turkmenistan 5.8 58% 18.7 51 61% 1
Kyrgyzstan 6.0 59% 3.7 35 68% 1
Tajikistan 8.9 65% 3.1 16 - -Source: (1) UN, (2) Pakistan Bureau of Statistics, (3) IMF, (4) CCI and TCCC estimations, (5) Nielsen & Ipsos as of December 2017 (for Turkmenistan as of October 2017)GDP per capita based on purchasing power parity (PPP).
(1 January - 31 December 2017)
102-7; 102-45

KAZAKHSTAN
TURKEY
SYRIA
JORDAN
IRAQ
TURKMENISTAN
PAKISTAN
TAJIKISTAN
KYRGYZSTANAZERBAIJAN
Operating in 10 Countries with 26 plants,
8,097 employees and 780,000
sales points to 400 million consumers with more than 25 brands.
SUSTAINABILITY APPROACH 7
Financial Highlights BrandsConsolidated (million TL) 2016 2017
Sales Volume (million UC) 1,189 1,237
Net Sales Revenue 7,050 8,521
EBIT 641 874
EBIT Margin 9.1% 10.3%
EBITDA 1,093 1,379
EBITDA Margin 15.5% 16.2%
Net Income -28 238
Net Income Margin (0.4)% 2.8%
Total Equity 4,997 5,440
Total Assets 10,456 13,394
Net Debt 2,293 2,093
102-2; 102-4; 102-6; 102-7; 102-45

8 CCI SUSTAINABILITY REPORT 2017
We succeeded in identifying and implementing improvements that resulted in an annual saving of approximately
$5.74 million with 217Operational Excellence projects.
Women
Our woman employee rat io is
16.3%_ for Turkey,
5.8%_ for Jordan,
17.7%_ for Kazakhstan,
14.2%_ for Azerbaijan,
6.2%__ for Pakistan,
19.5%_ for Kyrgyzstan.
Community Programs
• 12 volunteer activities have been realized in 17 different cities under the program targeting disadvantaged women, children and families, people with disabilities, refugee children and the elderly, with the participation of more than 1.000 CCI volunteers in Turkey.
• My Sister Project is a part of the 5By20 initiative launched by The Coca-Cola Company with the goal to economically empower 5 million women entrepreneurs around the world by 2020. As of end of 2017, the project has reached over 2,000 women, including ladies from a variety of backgrounds, including housewives, engineers, entrepreneurs and university students.
• The 3.2.1 Move! Program supported approximately 152 Physical Education teachers from 131 public schools and engaged more than 125,000 young people in sports and group activities in 15 cities of Turkey.
• We reached 700,000 young people with our projects.
• Within the scope of the Paani Project, 24 filtration plants have generated more than 15 Million liters of safe drinking water and enabled water access for 850,000+ individuals.
2017 PERFORMANCE HIGHLIGHTS
Training
We provided
436 training sessions with
4,716 participants to our distributors in Turkey. We provided
45,392 person-hours of OHS training to our employees in the operations.
We provided
8,574 hours of environmental training to our employees.

SUSTAINABILITY APPROACH 9
GHG
• With our EMD program we saved approximately 468 million kWh electricity in six countries of operation. We achieved 78,711 tons of CO2 reduction which is equal to the amount of CO2 that 6.6 million trees annually extract from the atmosphere.
Water
• We saved about 199,862 m3 of water in the six countries of operation.
• The water replenishment rate for Turkey has reached 150%, equal to about 4,271 million liters of water.
Sustainable Packaging
• We saved a total of 2,732.5 tons of resin in six countries of operation with our sustainable packaging program.
• PlantBottle resin was used in all Damla 330 ml and 1 lt bottles produced in Turkey.
• The total waste recycling throughout all our plants was 96.0% in Turkey, 91.90% in Jordan, 90.0% in Kazakhstan, 97.8% in Azerbaijan, 94.44% in Pakistan and 97.7% in Kyrgyzstan.
• We reached a 54% post-consumer recycling rate for plastics, glass, metal and aluminum-packaging waste in Turkey.
• 91,900 tons of glass is saved by returnable bottle practices.
• Our efficiency projects and the OE Program conducted throughout our CCI plants led to a savings of 26,9 Million MJ energy and reduced 2,806 tons of CO2.

10 CCI SUSTAINABILITY REPORT 2017
2003
• CCI Ankara plant wins the “TCCC Eurasia Africa Group Presidency Quality Award”.
2010
• CCI İzmir plant wins the “Best Performing Plant for the Environment Award” by the TCCC EAG President’s Environment Awards.
• CCI Turkey Operations wins the “Best Country Bottling Operation Grand Prize” by the TCCC EAG President’s Environment Awards.
2011
• CCI Jordan wins an “Occupational Health and Safety Management Award”.
2012
• CCI Ankara plant is awarded the EFQM’s (European Foundation for Quality Management) “Taking Responsibility for a Sustainable Future Prize”.
• Turkey, Azerbaijan and Jordan operations are among the finalists in TCCC EAG President’s Sustainability Awards. CCI Turkey Operations wins the “Best Country Bottling Operation Grand Prize”. CCI Ankara plant is recognized as the “Best Performing Plant for Quality” and CCI İzmir plant as the “Best Performing Plant for the Environment”.
2013
• CCI receives an “Ethics Award” from the Ethical Values Center Association.
• CCI wins three prizes in the 2013 TCCC EAG President’s Sustainability Awards: The Grand Prize for “Best Country Bottling Operation”, “Best Performing Plant for Quality”, and the “Best Performing Plant for the Environment”.
2014
• CCI is the first and only company from Turkey and the Coca-Cola system to be included in the UNGC 100 Index.
• CCI İzmir plant receives an award in the “Water Management” category from the Green Business Platform.
• CCI receives the second-highest score and wins second place in the transparency category in the “CDP Turkey Climate Leadership Awards”.
• CCI is awarded the Grand Prize in the “ÇEVKO Green Dot Industry Awards”, which recognizes companies with environmentally sustainable practices.
• CCI Ankara plant is awarded as the “Best Performing Plant for Quality” and CCI İzmir plant as the “Best Performing Plant for the Environment” in the 2014 TCCC Eurasia & Africa Group (EAG) President’s Sustainability Awards.
• CCI Bursa and Mahmudiye plants receive “National Quality Excellence Awards”.
2015
• The 3.2.1. Move! Program is awarded a “Bronze Stevie Award” in the 12th Annual International Business Awards.
• CCI Turkey Operations receives three awards, including the Grand Prize of “Best Country Bottling Operation” of Coca-Cola Eurasia and Africa Sustainability Awards. In addition, CCI Azerbaijan and CCI Kazakhstan are voted among the 10 finalists nominated for this prize. CCI Turkey Operations also receives the “Excellence Award” in the individual Well-being category and İzmir plant receives the “Best Performing Plant for the Environment” award.
• CCI Bursa plant receives the “EFQM Excellence Award in the Developing Organizational Capability” category.
• CCI Mahmudiye plant is given the “National Quality Excellence Grand Prize”.
2016
• CCI is ranked among CDP Turkey’s climate change leaders and once again received the “2016 Climate Leadership Award”.
• CCI was awarded by Pakistan Red Crescent on the occasion of Presidental visit with a plaque of appreciation for its cooperative approach during the times of crisis and natural disasters.
• CCI Turkey Operations receives the “Waste Management Award” due to its recycling performance of packaging waste and waste management achievements in FMCG sector. As a member of ÇEVKO, CCI became the 2nd Company in waste collection, recycling and recovery, achieving 48% packaging waste recovery.
AWARDS RECEIVED

SUSTAINABILITY APPROACH 11
2017
CCI Turkey Operations Receives Recycling Award from the Turkish Ministry of Environment
CCI receives a recycling award from the Turkish Ministry of Environment and Urbanization in appreciation of its efforts to recycle product packages. The award came as a recognition of CCI’s successful practices to reach waste management targets for the FMCG sector in Turkey.
CCI Mersin Plant Receives Efficiency Award
In May, CCI Mersin plant receives the second prize in the Midsize Enterprises category with its Tetra Lines Automatic Pallet Truck System project at the 2017 Efficiency Projects Competition organized by the Turkish Ministry of Science, Industry and Technology.
CCI Turkey Operations Receives International Safety Award
CCI Turkey Operations receives an International Safety Award from British Safety Council. This award is issued for 2017 performance, improvements and good practices implemented.
CCI Receives Water Efficiency Award from the Sustainability Academy in Turkey
CCI receives the grand prize in Water Efficiency category at the 4th
Sustainable Business Awards in Turkey. The awards are organized every year by the Sustainability Academy to award Turkish companies that apply the most sustainable business models in various fields of activity.
CCI Kyrgyzstan Receives Best Tax Payer Award
CCI Kyrgyzstan receives “Kyrgyzstan’s Best Tax Payer Award” as a result of significant contribution to the economic growth of the Kyrgyz Republic and conscientious execution of tax legislation following the result of 2016 and 5 months in 2017. The certificate was presented by the Deputy Prime Minister.

2014
2013 2015
20162017
2018
2011
2012 2002
2007
2009
2010
CCI’s 1st environment policy
CCI ranks 5th in Turkey’s Accountability Rating.
• CCI ranks 1 st in Turkey’s Accountability Rating.
• CCI becomes a signatory to the United Nations Global Compact.
CCI’s 2020 Vision and Strategic Framework is announced.
• CCI becomes a charter member of the Climate Change Leaders Group.
• CCI becomes Turkey’s first food and beverage company to participate in disclosure leaders.
• CCI signs the 20 C Communiqué regarding climate protection.
• CDP recognizes CCI as one of Turkey’s top two carbon performance leaders.
• CCI İzmir and Mersin plants complete the Top 10 Energy-Saving Challange of TCCC and the WWF (World Wildlife Fund).
• CCI is named among the companies with the best sustainable development practices in Turkey, and represents Turkey in the Rio+20 innovation competition.
• All plants in all operating countries complete the Top 10 Energy-Saving Challenge Program and CCI Turkey Operations becomes the first multi-plant country operation in the Coca-Cola system to complete the program.
• CCI announces its new Code of Ethics, Workplace Rights Policy and Ethics Service.
• CCI Turkey Operations receives the first ISO 14064-1 certificate for its greenhouse gas emissions.
• CCI becomes the first and only company in Turkey and within the Coca-Cola system to be included in the UN Global Compact 100 Index.
• CCI is named one of Turkey’s carbon disclosure and performance leaders by CDP in its Turkey 100 Climate Change Report 2013.
• CCI Turkey Operations receives a Gender Equality Certification from KAGIDER.
•
CCI is the first and only companyfrom Turkey -and within Turkey the Coca-Cola system- to be included in the UNGC 100 Index.
• CCI receives the second-highest score and wins second place in the Transparency category in the CDP Turkey Climate Leadership Awards.
•
CCI becomes the first and only company in Turkey to participate in the CDP Water Program.
•
CCI’s Corporate Governance Rating score as measured by SAHA increases from 8.8 to 9.25.
•
CCI is the only company from Turkey that is included in the UNGC 100 Index (as of May 2016).
•
CCI’s 2025 Vision and Strategic Framework is announced.
• CCI is quoted in the BIST 50• Sustainability Index.• CCI is quoted in the
Euronext Vigeo Emerging 70 Index.
•
CCI becomes a signatory to the UN Women’s Empowerment Principles.
•
CCI’s Corporate Governance Rating score as measured by SAHA increases from 9.25 to 9.40.
• CCI continues to be listed in the BIST Sustainability Index.
• CCI joins the MSCI Global Sustainability Index.
• CCI joins the FTSE4Good Emerging Index.
• CCI is ranked among Turkey’s climate change leaders by CDP’s “Climate Change Report 2016”.
• CCI continues to be listed in the BIST Sustainability Index.
• CCI continues to be listed in the FTSE4Good Emerging Index.
• CCI continues to be listed in the MSCI Global Sustainability Index.
• CCI joins ECPI Emerging Markets ESG Equity index.
• CCI joins Vigeo Eiris Best Emerging Markets Performers Ranking.
• CCI joins 30% Club Turkey.
• CCI will announce its 2025 Sustainability Commitments.
12 CCI SUSTAINABILITY REPORT 2017
CCI’s SUSTAINABILITY JOURNEY

SUSTAINABILITY APPROACH 13
CCI is the First and Only Turkish Company in the UNGC 100 Index• Since its launch by the United
Nations Global Compact (UNGC) in 2013, CCI continues to be the first and the only company in Turkey to be included in the UNGC 100 Index. The 100 companies listed in the index are selected from the eligible UNGC members around the world.
• These members have implemented and demonstrated an executive commitment to the 10 principles of the UNGC, for which companies that continuously improve and disclose their sustainability performance and maintain baseline profitability are selected.
CCI Listed in the BIST Sustainability Index• Based on the evaluation of its
sustainability practices and performance in 2016-2017, CCI was selected among the Borsa Istanbul (BIST) companies to be included in the BIST Sustainability Index for the period between November 2017 and October 2018. CCI had become one of the first 29 companies to be included in the BIST Sustainability Index in 2015.
CCI Listed in the MSCI ESG Leaders Index• Following the evaluation of
our environment, society and corporate governance performance for 2016-2017, CCI was selected by Morgan Stanley Capital International to be included in the 2017 MSCI ESG Leaders Index, receiving an AA score in our evaluation. CCI first joined in the MSCI Global Sustainability Index in 2016.
CCI Listed in the FTSE4Good Emerging Index• CCI joined in 2016 and continued
to be listed in 2017 in the FTSE4Good Emerging Index due to its high performance in the fields of environment, society and corporate governance in 2016. The FTSE4Good Emerging Index was launched in 2016 by FTSE Russell, a global leader in indexes and data that are used by investors globally.
• It is an extension of the FTSE4Good Index Series, which is designed to measure the performance of companies demonstrating strong environment, society and corporate governance practices.
CCI Participated in CDP Turkey Climate Change and Water Programmes• CCI participates in CDP Climate
Change and Water Programmes every year. CCI was honored with the Climate Leadership Award by CDP Turkey in performance and transparency categories three times, in 2012, 2014 and 2016.
CCI Joined the ECPI Emerging Markets ESG Equity Index• As of December 2017, CCI became
a constituent of ECPI Emerging Markets ESG Equity index. ECPI is a leading rating and index company dedicated to environmental, social and governance performance research. ECPI Indices are used for benchmarking, thematic investment, risk management purposes and to create index-tracking investment strategies or exchange-traded funds.
CCI Included in Vigeo Eiris Best Emerging Markets Performers Ranking• In December, CCI was included in
Vigeo Eiris Best Emerging Markets Performers Ranking, chosen as one of the 100 most advanced companies within the Equitics Emerging Markets Universe that consists of 850 companies from 37 sectors and 31 countries. Companies included in this index achieve the highest scores, as determined by a review based on 38 criteria, divided into six key areas of corporate environmental, social and governance matters, assessed by Vigeo Eiris.
EXTERNAL RECOGNITIONOur efforts and successes in the field of sustainability are acknowledged and awarded by various Turkish and international institutions. In 2017, we marked many important successes in sustainability both on a national and an international scale.
102-12

14 CCI SUSTAINABILITY REPORT 2017
Our 2025 vision is to be the best FMCG company across our markets. While we grow our business in line with this vision, we want to ensure being a responsible corporate citizen. Therefore; we are committed to sustainable growth. Consequently; we strive to create sustainable value for our diverse group of stakeholders along the value chain. To materialize this commitment, we developed our 2025 sustainability vision and framework. As we advance towards our growth targets set by our 2025 vision, we are embedding
sustainability principles into all our processes.
Value creation is at the heart of our 2025 Vision, which is built on; ‘Customers & Consumers’, ‘People’ and ‘Community’. Our sustainability strategy focuses on the issues that are material for our stakeholders. We closely evaluate and manage these issues under six major areas: Consumer Well-Being, Customer Value, Human Rights, Human Capital, Environmental Footprint and Community Development.
Within each of these areas, during the course of our various operations, we work hard towards creating value for our stakeholders. Offering a wide beverage portfolio in high product safety and quality standards to our consumers has a crucial importance in our business model. In addition to that; we are determined to go for high customer satisfaction through our customer-centric approach. Therefore, we remain limitless in our sustainability practices with regards to our own operations and implement them within all phases
INTEGRATING SUSTAINABILITY
102-9; 102-49; 103-1; 103-2; 103-3
SUSTAINABILITY APPROACH 15
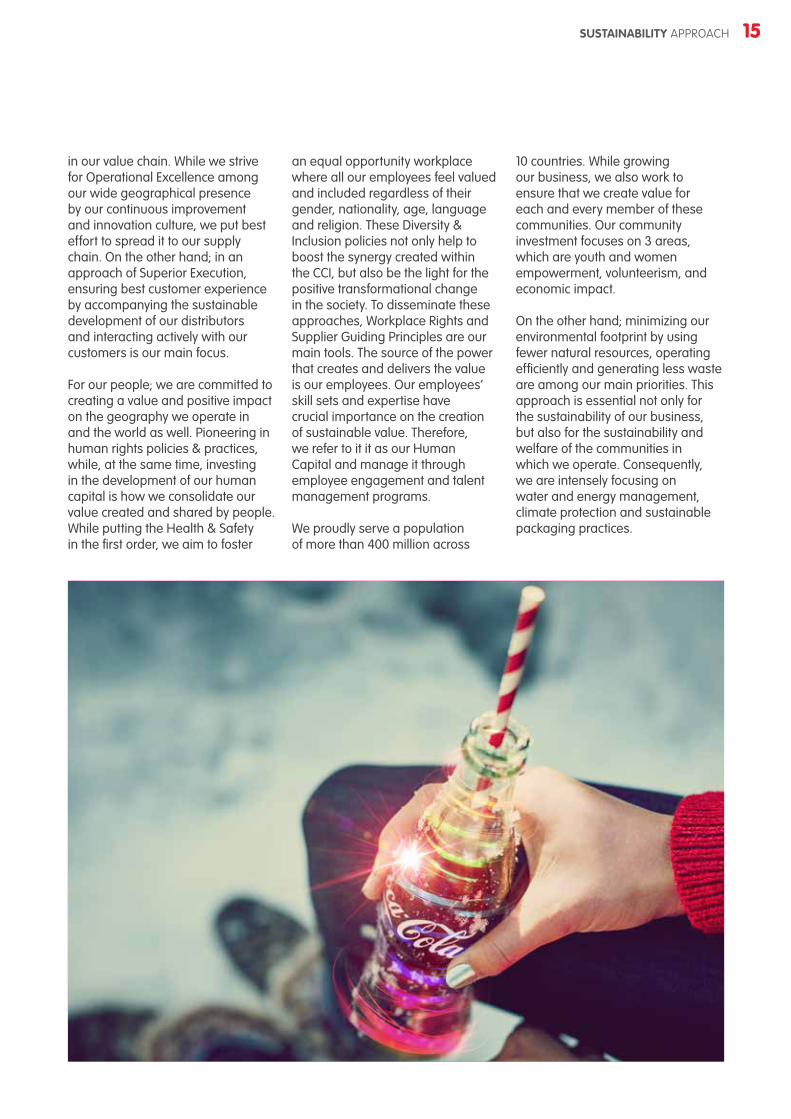
in our value chain. While we strive for Operational Excellence among our wide geographical presence by our continuous improvement and innovation culture, we put best effort to spread it to our supply chain. On the other hand; in an approach of Superior Execution, ensuring best customer experience by accompanying the sustainable development of our distributors and interacting actively with our customers is our main focus.
For our people; we are committed to creating a value and positive impact on the geography we operate in and the world as well. Pioneering in human rights policies & practices, while, at the same time, investing in the development of our human capital is how we consolidate our value created and shared by people. While putting the Health & Safety in the first order, we aim to foster
an equal opportunity workplace where all our employees feel valued and included regardless of their gender, nationality, age, language and religion. These Diversity & Inclusion policies not only help to boost the synergy created within the CCI, but also be the light for the positive transformational change in the society. To disseminate these approaches, Workplace Rights and Supplier Guiding Principles are our main tools. The source of the power that creates and delivers the value is our employees. Our employees’ skill sets and expertise have crucial importance on the creation of sustainable value. Therefore, we refer to it it as our Human Capital and manage it through employee engagement and talent management programs.
We proudly serve a population of more than 400 million across
10 countries. While growing our business, we also work to ensure that we create value for each and every member of these communities. Our community investment focuses on 3 areas, which are youth and women empowerment, volunteerism, and economic impact.
On the other hand; minimizing our environmental footprint by using fewer natural resources, operating efficiently and generating less waste are among our main priorities. This approach is essential not only for the sustainability of our business, but also for the sustainability and welfare of the communities in which we operate. Consequently, we are intensely focusing on water and energy management, climate protection and sustainable packaging practices.

Ingredients
TCCC focused on sustainably sourcing
key agricultural ingredients by 2020
and developed Sustainable
Agriculture Guiding Principles. As CCI, we initiated a sustainable sourcing program for
sugar and sweeteners.
Ingredients
Manufacturing
We saved: approximately 200,000 m3 of water,
31 million MJ of energy and 3,305 tons of CO2
emissions through efficiency projects in six countries of operation.
Manufacturing
Customers&Consumers
As a means of communication with our consumers; CCI Turkey Operations
continued its Open to Curiosity platform in 2017 and this year
604.868 users made 717.793 visits and
873.360 pages were viewed in total during
the visit sessions.
Customers&Consumers
Packaging
We used 23,060 tons of PlantBottle
packaging, which is which is 30% plant based. Additionally, 2,732.5 tons of resin
and 1,286 tons of glass savings were
achieved in six countries of operation.
Packaging
Logistics
We reduced 3,500 tons of CO2
emissions as a result of route optimization, product distribution
and fleet improvement
practices in last three years.
Logistics
Refrigeration
We achieved 78,711 tons of CO2 reduction
in 6 countries of operation through our EMD Program, which is
equal to the annual extraction of
6.6 million trees.
Refrigeration
16 CCI SUSTAINABILITY REPORT 2017
What We Achieved For Our Value Chain During 2017

SUSTAINABILITY APPROACH 17
Value We Create For Our Commitment Areas Relevant SDG’s
Customers& Consumers
Customer Value
Consumer Well-Being
People
Human Rights
Human Capital
Community
Environmental Footprint
Community Development
CCI’s Next Generation Sustainability Commitment Areas

18 CCI SUSTAINABILITY REPORT 2017
The year 2017 assumes critical importance in the process of setting next generation targets. Aligned with the TCCC, we identified our top performance areas. We linked our company goals with the UN Sustainable Development Goals in order to broaden the scope of the value we create for our stakeholders.
2018 will be the year that we communicate intensely on our 2025
sustainability commitments and their contribution to SDGs.
The next steps in our sustainability agenda will focus on topics such as life cycle evaluation of our environmental impacts, human rights and circular economy. By 2019, we plan to become a signatory to the Science Based Target Initiative, a collaboration between CDP, World Resources Institute (WRI), the World
Wide Fund for Nature (WWF), and the United Nations Global Compact (UNGC) and is one of the We Mean Business Coalition commitments.
With an integrated thinking approach, we plan to share our 2020 sustainability performance in an Integrated Report that will link together our strategic focus, financial and non-financial goals.
The Way Forward
2018 2019 2020Setting goals for 2025 Focusing on life cycle of our
environmental footprint (Carbon footprint and sustainable agriculture)
Issuing integrated report
Identifying top performance areas aligning with SDGs
Become a member of Science Based Targets Initiative
Broadening geographic scope of reporting to all CCI countries
Communicating 2025 goals Extending assurance scope to other CCI operations and human rights indicators
*Science Based Targets Initiative is a partnership between CDP, UN Global Compact, WRI and WWF, which helps companies determine how much they must cut emissions to prevent the worst impacts of climate change.

CCI EXECUTIVE COMMITTEE
CCI Sustainabil i ty Steering Commit tee
Operational Sustainabil i ty Group
Environment & Water Management Working
Group (TR)
Cl imate Protection & Energy
Management Working Group (TR)
CORPORATE GOVERNANCE
COMMITTEE
SUSTAINABILITY APPROACH 19
The CCI Board of Directors is actively engaged with the Company’s sustainability issues and its commitment to integrate sustainability into our business strategy. The CCI Board of Directors’ Corporate Governance Committee has the ultimate responsibility in determining and implementing the sustainability strategy. This responsibility is undertaken by the CCI Executive Committee, which is steered by the CEO, and by the CCI Sustainability Steering Committee (SSC) that became functional in 2015. The CCI Executive Committee is comprised of senior management, and the SSC is composed of CCI’s Finance, Corporate Affairs, Legal, Human Resources and Supply Chain Directors. Since 2015, CCI Corporate Affairs Director Atilla D. Yerlikaya has also been serving as the Deputy Chairman of UNGC Turkey Network.
Until May 2017, İzzet Karaca chaired the Corporate Governance Committee as an independent, non-executive Board Member. The Sustainability Organization described above is as of December 31, 2017 and the members of Board of Directors will change in 2018.
The main responsibilities of the SSC are:• To set the long-term sustainability
vision, strategy, plan and goals, and submit these for CEO approval;
• To make decisions on capital expenditures regarding sustainability;
• To review performance and quarterly progress on key performance indicators (KPIs); and
• To give final approval for sustainability disclosures.
CCI function heads both at the group and country levels integrate the sustainability targets set by the SSC into their respective functional objectives. All CCI function heads play a critical role in making sure that sustainability priorities and targets are embedded in the field operations. The strategic orientation and objectives that are determined by upper-level management are then transformed and integrated by them into the field practices.
The Climate Protection & Energy Management and the Environment & Water Management working groups support the SSC. The Corporate Affairs function is responsible for the disclosure, reporting and communication of sustainability targets and performance results. Finally, our employees are key to the integration of sustainability into our overall business.
Sustainability Organization
2007-2008• 1st GRI Checked Report in Turkey• Scope: Turkey• Accountability
rating 2008 - 1. Ranking
2011• 2nd A+ GRI Level Report• Scope: Turkey, Kazakhstan, Jordan, Azerbaijan + Best Practices of Pakistan• CCI 2011 CSR Report finalist in two categories at the “2013 CRA”• Independent Assurance on
Water & Energy TR
2014• GRI G4
Guidelines• Scope: Turkey,
Kazakhstan,
Jordan, Azerbaijan and Pakistan
• External Review• Independent
assurance on Water,
Energy of Turkey & Pakistan
• Readlines Audit for Park
2013• GRI G4 Guidelines• Scope:
Turkey, Kazakhstan, Jordan and Azerbaijan• GC COP• Independent Assurance on Water, Energy and Waste
(Azerbaijan, Kazakhstan, Jordan and
Turkey) and GHG
in Turkey
2009 - 2010• 1st GRI B Level Report• Scope: Turkey, Kazakhstan, Jordan and Azerbaijan• GC COP
2008 - 2009• 1st GRI B Level Report• Scope: Turkey,
Kazakhstan and Jordan• GC COP
2012• G3.1 Guidelines
GRI A+ Level Report• Scope: Turkey,
Kazakhstan, Jordan, Azerbaijan + Best Practices of Pakistan• GC COP• Independent
Assurance on Water, Energy and Waste (Azerbaijan, Kazakhstan, Jordan and
Turkey) and GHG in Turkey
2015• GRI G4 Guidelines• Scope: Turkey,
Kazakhstan, Jordan,
Azerbaijan and Pakistan• Independent
assurance on Water, Energy of Turkey & Pakistan
• Verification on GHG of Turkey
• GC COP & WEP• Sustainability
Index requirements
2016 2017• New GRI • New GRI Standards
• 6 countries of scope: Turkey, Jordan, Kazakhstan, Azerbaijan, Pakistan and Kyrgyzstan
• Independent assurance on Water & Energy data of Turkey
• Verification on GHG emissions of Turkey for Scope 1 & 2
• GC COP & WEP• Sustainability Index
requirements
Standards• Extension in
reporting scope
and boundary by including full data from our Kyrgyzstanoperations
• Independent assurance on Water & Energy data of Turkey
• Verification on GHG emissions of Turkey • GC COP & WEP• Sustainability Index requirements
Coca-Cola İçecek Corporate Social Responsibility Report(Turkey) January 2007-March 2008
March 2008 - March 2009Corporate Social Responsibility Report
Corporate Social Responsibility Report1 January 2011 - 31 December 2011
SUSTAINABILITY
REPORT
2012
SUSTAINABILITY REPORT 2013
Sust
aina
bilit
y Re
port
201
4
SUSTAINABILITY REPORT2014
Esenkent Mahallesi Deniz Feneri Sokak No.4 / 34776 Dudullu - Istanbul, TurkeyTel: +90 216 528 40 00 Fax: +90 216 365 84 67-68
www.cci.com.tr
Sust
aina
bilit
y Re
port
201
5
SUSTAINABILITY REPORT2015
OSB Mah. Deniz Feneri Sokak No: 4 34776 Dudullu Ümraniye İstanbul
Tel: +90 216 528 40 00 Fax: +90 216 510 70 12 www.cci.com.tr
SUSTAINABILITY REPORT2016
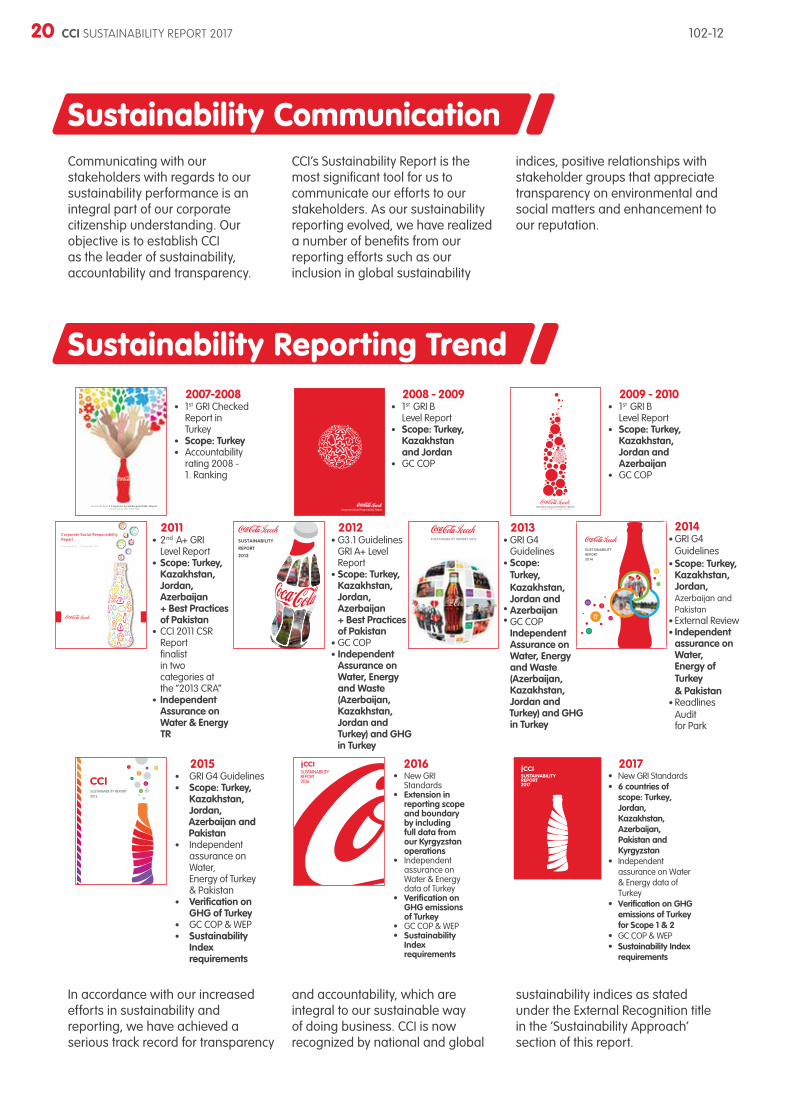
Communicating with our stakeholders with regards to our sustainability performance is an integral part of our corporate citizenship understanding. Our objective is to establish CCI as the leader of sustainability, accountability and transparency.
CCI’s Sustainability Report is the most significant tool for us to communicate our efforts to our stakeholders. As our sustainability reporting evolved, we have realized a number of benefits from our reporting efforts such as our inclusion in global sustainability
indices, positive relationships with stakeholder groups that appreciate transparency on environmental and social matters and enhancement to our reputation.
Sustainability Communication
Sustainability Reporting Trend
In accordance with our increased efforts in sustainability and reporting, we have achieved a serious track record for transparency
and accountability, which are integral to our sustainable way of doing business. CCI is now recognized by national and global
sustainability indices as stated under the External Recognition title in the ‘Sustainability Approach’ section of this report.
102-1220 CCI SUSTAINABILITY REPORT 2017

SUSTAINABILITY APPROACH 21
We place strong emphasis on our material sustainability concerns, because they have significant impact on the value we create for our stakeholders. While we determine material issues, we consider the broader social, economic and environmental impacts they create both for our business and value chain. We also consider relevant risks and opportunities and stakeholder expectations with regards to specific issues. This evaluation process is a continuous and consistent process for us during which we review our progress and assessment results every year.
In 2017, the Sustainability Work Group reviewed our issue universe in light of our risk management practices, the data and information requested by our stakeholders, as well as CCI’s and TCCC’s priorities. The graph below illustrates the results of the material assessment conducted in 2017. While conducting this assessment, we took into account our direct and indirect level of influence on the issue. Issues on the top right are the focus of this report since they have relatively significant impact on the value we create.
While we determine material issues, we consider the broader social, economic and environmental impacts they create both for our business and value chain.
Our Memberships
Materiality Analysis
Initiatives to which we are Signatories
• ÇEVKO (Environmental Protection and Packaging Waste Recovery and Recycling Trust)
• TÜSİAD (Turkish Industry and Business Association)
• YASED (International Investors Association)
• MEDER (Beverage Industry Association)
• KALDER (Turkish Quality Association)
• DEİK (Foreign Economic Relations Board)
• SUDER (Packed Water Manufacturers Association)
• MEYED (Fruit Juice Industry Association)
• TEİD (Turkish Ethics and Reputation Society)
• TÜYİD (Investor Relations Association)
• TOBB (Union of Chambers and Commodity Exchanges of Turkey)
• TGDF (Federation of Food and Drink Industry Associations of Turkey)
• UNGC Network Turkey (United Nations Global Compact Network Turkey)
• Brand Protection Group
• 30% Club Turkey
• CDP Climate Change Program
• CDP Water Program• Equality at Work Platform• United Nations Global
Compact (UNGC)
• Turkish Climate Platform of the Turkish Climate Change Leaders Group
• United Nations Women’s Empowerment Principles
102-12; 102-13; 102-46; 102-49

22 CCI SUSTAINABILITY REPORT 2017
Materiality Analysis Chart
Stakeholder engagement is the cornerstone of our corporate responsibility. Building an effective and strong stakeholder dialogue is at the foundation of our business, sustainability reporting initiatives and our sustainability performance.
In 2013, we prioritized our stakeholders and our communication methods by means of a comprehensive stakeholder mapping study pursuant to AccountAbility’s AA1000 SES Standard and the EFQM Business Excellence Model. We identified our key stakeholders as:
• Investors and financial institutions, non-governmental organizations, opinion leaders, shareholders, employees, and the Coca-Cola system.
• For business continuity, we also engage regularly and intensively with other stakeholders, including distributors, customers, customers, and suppliers.
To evaluate both our material issues and sustainability performance, we seek alternative ways to collect our stakeholders’ opinions and feedbacks. We engage with each stakeholder group on a regular
basis and share our sustainability efforts through various methods.Besides corporate publications such as the annual report or sustainability report, we communicate with our stakeholders through various platforms such as Stakeholder Days, Stakeholder Days, the external report review committees, factory visits, investor calls and questionnaires, distributor meetings, supplier days and audits, and stakeholder reputation surveys. Further information on how we respond to stakeholders’ questions and concerns is provided on the following table.
Stakeholder Engagement
• Product Quality• Consumer Health and Safety and
Well-being• Occupational Health and Safety• Energy Efficiency and GHG Emissions• Packaging and Waste• Water Use & Wastewater• Compliance• Business Ethics• Supplier and Distributor Assessment• Indirect Economic Impact• Diversity and Equal Opportunity• Community Engagement
• Lobbying• Biodiversity• Customer Privacy• Indigenous Rights• Security Practies• (Human Rights) Assessment• Investment and Procurement Practices• Equal Renumeration for women and men• Supplier Assessment for Impacts on Society• Financial Assistance Received from Governments
• Corporate Governance• Anti-competitive Behavior• Economic Performance• (Raw) Materials Sourcing• Transport• Labor Conditions• Child Labor and Forced Labor• Training and Education• Freedom of Association and Collective Bargaining• Enviromental, Human Rights and Labor Practices Grievance Mechanisms
Influ
ence
on
Stak
ehol
der A
sses
smen
t and
Dec
isio
nH
igh
Low
Low
At the beginning of 2017, we conducted a materiality analysis as shown below.
Significance of Environmental, Social and Economic Impact
*The issues that are written in blue are also material for our supply chain (e.g. our suppliers, distributors, customers, consumers and TCCC).
102-40; 102-42; 102-43; 102-46; 102-47; 102-49; 103-1

SUSTAINABILITY APPROACH 23
Engagement with Stakeholders
Stakeholders Engagement PlatformsFrequency of engagement Issues that were brought up by stakeholders
Investors and financial institutions
Annual report, investor conferences, analyst meetings, investor presentation, webcast, e-mail distributions, special caseannouncements, Public Disclosure Platform, direct feedback forms through the corporate website, sustainability report, CDP Climate Change Report, CDP Water Report, Sustainability Index Assessment.
Every year CCI’s financial, operational and sustainability performance; future investment plans.
NGOs Project partnerships, corporate and individual employee memberships, participation in conferences and presentations, reputation survey, Stakeholder Day.
Regular CCI’s operational, environmental, quality and community-related performance; transparency and reporting.
Opinion leaders Reputation Survey, sustainability report, External Stakeholder Review Committee, stakeholder engagement panel.
Regular CCI’s operational, environmental, quality and community-related performance, environmental impacts in the value chain.
Shareholders General Assemblies, corporate website, Public Disclosure Platform. Regular Financial and operational performance and reporting.
Employees Employee engagement and satisfaction survey, Newsline, Newsletter, CokePort, press releases, CCI training programs, leadership development trainings, reputation surveys, CCIdea, Volunteer Programs, CEO Meetings.
Regular Business results, environmental performance, community projects, awards and recognitions, compensation and benefits topics.
The Coca-Cola System
Regular meetings, TCCC’s Sustainability, Public Affairs and Communication Summits.
Regular, very often
CCI’s and its suppliers’ sustainability performance.
Distributors/Sellers Customer Interaction Center, Distributor Satisfaction Survey, distributor meetings and trainings, regular visits, plant visits, distributor portal.
Periodic Business performance, commercial plans, satisfaction scores.
Customers Trainings, support programs, regular visits, plant visits, Coca-Cola Customer Road Show, Customer Satisfaction Survey, CCI Interaction Center, focus group studies, business development meetings.
Periodic Business performance, commercial plans, products, marketing plans.
Suppliers Training programs, improvement audits, plant visits, supplier days, supplier performance scores, supplier satisfaction surveys, cooperation portal, industrial development and pilot activities.
Regular Quality of materials and services, future plans, strategic initiatives, business performance, sustainability, workplace rights, innovation in cooling equipment.
Public Institutions and Organizations
Information for contribution to sector development, compliance with laws and regulations, support for infrastructure investments, Reputation Survey, Environment Days, Presentations, expertise sharing in public conferences, plant visits.
Annual reputation survey, regular meetings
CCI’s operational, environmental, quality and community-related performance; compliance with regulations.
Consumers Coca-Cola Open to Curiosity Platform, Coca-Cola Social Interaction Center, informative publications, plant visits, product labels.
Regular Product quality, consumer satisfaction, low- and no-calorie product alternatives, nutritional labeling, product ingredients.
Union Union representation, collective labor agreements, representative meetings, plant visits.
Regular Human and workplace rights.
Sector Groups Corporate memberships, joint projects, meetings, conferences. Regular Industry-wide issues, regulations, legal compliance, speaking engagements at conferences, benchmark visits to plants.
Local community Stakeholder Survey, voluntary practices, donations, plant visits, field studies, needs analyses for community investment projects, economic impact assessments.
Annual CCI’s operational, environmental, quality and community-related performance; sponsorship and donation requests.
Society Coca-Cola Open to Curiosity Platform, donations, plant visits, voluntary practices, product labels, advertisement and marketing activities, social engagement projects, field studies, meetings, surveys and eliciting opinions, sustainability report.
Regular Product quality, product ingredients, marketing and promotion campaigns, sports tournaments.
Media Regular updated, statements, support programs, regular visits, plant visits, reputation survey.
Regular Products, marketing and promotion campaigns, product ingredients, sustainability performance, community development projects.
Universities Conferences, career days, plant visits, sponsorships, volunteering for community development projects.
Regular Sustainability performance, career development opportunities.
At an international level, we are signatory to and member of multi-stakeholder initiatives such as UNGC and GRI. We are proactively working together with our external partners in order to bring together the expertise of many organizations and
individuals. Our Corporate Affairs Director A.D. Yerlikaya who is on the board of UNGC Turkey Network since 2012, has been selected to GRI’s Global Sustainability Standard Board(GSSB) for a term of 3 years until 2019.
Additionally, we are a member of TUSIAD Environment and Climate Change Working Group. We participate in regular meetings of this Working Group. We are taking part in TUSIAD Environment and Climate Change working group to engage with public authorities on climate change issues including the Paris Agreement, national policies and positions.
102-40; 102-42; 102-43; 102-44

24 CCI SUSTAINABILITY REPORT 2017
CCI and TCCC developed the Stakeholder Day series as a new local engagement platform to further improve relations with key local stakeholders and to raise awareness of TCCC’s economic and social impacts, sustainability efforts, and manufacturing capabilities in CCI’s operating regions. The first Stakeholder Day event was held at the Mersin Plant
in April 2017, where CCI and TCCC representatives had the opportunity to come together with the local stakeholders and share information on the operations in the region, CSR efforts, and the sustainability vision. 39 representatives from public institutions, academia, NGOs, business and educational institutions and local suppliers attended the event. Stakeholders
provided very useful feedback related to our performance on sustainability, social investments, governance practices and communication platforms, which can provide improvement opportunities across CCI’s sustainability efforts.
We will be organizing 4 additional Stakeholder Days in 2018, the first of which will be held in Elazığ.
Stakeholder Day Series
CCI Reputation Research At CCI, we periodically measure our reputation among our managers and employees, local communities and opinion leaders. This way, we form action plans with regards to the expectations of our stakeholders and create a roadmap for our corporate reputation strategy. Through the research conducted between December 2015 and February 2016 via a third party in accordance with EFQM and AA1000 standards, we questioned our product and service quality, brand, working environment, financial durability, management quality, environmental impacts, corporate social responsibility and transparency performance. More details on the 2015-2016 reputation research results can be found in our 2016 Sustainability Report. We decided to conduct the next reputation research in 2018.
102-40; 102-42; 102-43

SUSTAINABILITY APPROACH 25
CORPORATE GOVERNANCE
CCI’s strong corporate governance structure plays a vital role in achieving our strategic goals. CCI conducts all its operations within the framework of established regulations in operating countries and the Corporate Governance Principles as outlined by Turkey’s Capital Markets Board. To transparently inform stakeholders,
we publish an annual Corporate Governance Principles Compliance Report that includes information corresponding to Corporate Governance Principles.
Corporate governance is managed and represented by the Board of Directors, under which Audit, Corporate Governance and Risk
Detection Committees operate. Determination and implementation of our sustainability strategy is managed by the Corporate Governance Committee. For further information on Corporate Governance, see CCI 2017 Annual Report and our investor relations website on cci.com.tr.
CORPORATE GOVERNANCE AND ETHICS
Priority Areas 2017 Goals Performance in 2017 Status 2018 Goals
Risk Management
To continue to update and further develop the ERM website.
ERM website has been updated. Transfer of ERM website to new portal is ongoing.
Ongoing
To continue to update and further develop the ERM website.
To integrate the ERM process into strategic planning.
ERM Process became a part of the Strategic Planning. Achieved
Information Security
To further implement Information Security Standards in our other country of operations.
Information Security Standards have been implemented in all CCI countries.
Achieved
• To increase production plants’ industrial control systems security.
• To increase security monitoring capabilities. • To add more topics to the awareness program. • To implement additional processes, technology
solutions for compliance with the laws & regulations.
Business Ethics
To continue to give our training on Code of Ethics and anti-bribery policy to all management teams in all CCI countries.
Training has been given to all newcomers as part of the orientation program.
AchievedTo continue to give our training on Code of Ethics and anti-bribery policy to all management teams and all newcomers in all CCI countries.
To continue to review and update Code of Ethics and anti-bribery policy in line with TCCC practices.
We started, but it will continue in 2018. Ongoing To continue to review and update Code of Ethics and
anti-bribery policy in line with TCCC practices.
Goals and Commitments
RISK MANAGEMENT
CCI’s management has the primary ownership of the Risk Management and Internal Control System. Enterprise Risk Management (ERM), which directly reports to the CEO and the Risk Committee, act as the facilitator and provide assurance and consultancy services in the risk management area.
Under the ERM framework, CCI’s management identifies critical threats and opportunities and
manages these according to the Company’s risk appetite using a systematic and disciplined approach that is integrated into the Strategic Business Planning process.
The ERM investigates risks on country and group levels and shares opinion with the management on identified risks. Risks that are assessed as high-priority are reported to the Risk Committee along with mitigation action plans, to be reported to the
Board of Directors. CCI employees are regularly trained on risk management.
CCI management uses the pillars explained in the company’s strategic business plan to evaluate business risks. Each country’s management periodically assesses these risks and prepares mitigation plans, which are monitored by the top management and the Risk Committee. CCI’s principal risks and key mitigations are given below:
102-11; 102-18; 103-1; 205-2

26 CCI SUSTAINABILITY REPORT 2017
Besides financial risks, rated as CCI’s top three risks for 2017 are slowdown in economic activity, law & order, and corporate reputation & public sentiment. These are followed by category health perception, exchange rate uncertainty, sustainable talent capability, volatile tax & regulatory environment and cyber security. CCI’s principal environmental risks are assessed as water scarcity, climate change and post-consumer packaging.
Throughout 2017, we participated in the Coca-Cola system ERM Exchange virtual and face-to-face meetings with TCCC and other bottlers. This enabled us to observe and track the collective ERM program progress across the Coca-Cola system. The annual ERM Exchange also helped us advance an enterprise-wide culture of risk management that enables and equips us to proactively address risks, seize opportunities and deliver business objectives.
In addition to operational activities performed, we informed all our employees of these activities via the ERM website, which is accessible through the internal CCI Portal. The website provides an ERM tool along with guidelines, leading articles, useful links and an ERM awareness training presentation.
Risk Pillar Principal Risk Key Mitigations
Sustainability
Community & Stakeholder Relations
• Implement locally relevant projects with local and international project partners.• Drive stakeholder perception through transparency and reporting practices.
Water Scarcity• Water reduction activities at plants.• Continue local replenishment and access to water program.• Sustainable sourcing.
Wastewater• Waste water treatment systems.• Periodic analysis.• ISO 14001 EMS and KORE Audits.
Energy • OE Projects, Behavioral Energy Program.• Improve energy efficiency (achieve energy use ratio targets)
Climate Change
• Energy efficiency and GHG emission reduction programs at plants, logistics and cooling operations.
• Post-consumer packaging programs to reduce packaging materials and GHG emissions.
• Policy making and engagement with NGOs and legal authorities. • Investigate alternative clean energy sources.
Water
• Conduct SVA studies. • Follow-up of Source Water Protection Plan. • Implementation of water efficiency projects. • Improvement of WUR (water use ratio).
Supply Chain
Food Safety • Implementation KORE audits and International Standards.
Packaging• Implementation of sustainable packaging and waste solutions. Maintaining
packaging innovation, Lightweight, PlantPet, recycling activities. Coordination with local authorities for waste collection and recycling.
Supplier Management • Follow-up of SGP audit findings.
Quality • KORE audits and International Standards.
Legal & Compliance
Compliance Risks• Establish an early warning mechanism for critical draft and recent regulations. • Lobby as an industry against unfavorable regulatory and tax initiatives of the
government.
Ethics-Bribery & Corruption
• Train employees on the Code of Ethics. • Encourage effective use of Ethic HotLine. • Implement ethics program.
Work Life
Human & Workplace Rights
• SGP Audits. • Follow-up SGP audit results. • Ethics Hotline.
Health & Safety
• Hand in Hand Safety Program. • KORE Compliance Implementations. • Distributor safety process implementations. • Contractor safety process implementations. • Driving Safety Program.
Sustainable Talent Capability
• Continue with talent development forum.• Effective cooperation with respected universities to build employer branding.
CORPORATE GOVERNANCE AND ETHICS / RISK MANAGEMENT
102-11; 102-16; 102-18; 103-1; 205-2
SUSTAINABILITY APPROACH 27
INFORMATION SECURITY & PRIVACY According to the Global Risk Report by World Economic Forum; cyber risk is one of the leading and rising risks in the world. Therefore, in today’s digital world of information every corporate business is struggling to mitigate information & privacy risks. To address this challenge and mitigate risks, CCI has a durable focus in securing its information assets.
CCI is maintaining robust information security and privacy program with the following key elements.
Information Security Governance: CCI is running company-wide information security governance structure that enables the effective management of potential risks and incorporates security and privacy controls into our information systems and services. Information Security Steering Committee, which is composed of top executives and security management team, acts as a governing body since 2009. CCI has implemented a comprehensive Information Security Management System (ISMS) based on the ISO 27001 ISMS standard to achieve security objectives. CCI complied to and was certified with ISO 27001 certification in 2016 and completed the surveillance audit in 2017.
Security Awareness: Every CCI employee has a critical role to play in protecting CCI’s sensitive information because Information Security is everyone’s business. CCI has been continuously running a mandatory cybersecurity awareness program for all employees since 2014, thereby promoting cybersecurity awareness across the company. Awareness program reports are also submitted to top management to make them aware of any risk.
Awareness program includes, but is not limited to the following activities:• Online training on different
subjects, i.e., phishing, travel security, URL security, e-mail security, physical security
• Awareness posters on different topics, i.e. paswword security, phishing, mobile security, clean desk & screen, are displayed in working areas of CCI and our distributors. i.e., password security, phishing, mobile security, clean desk & screen
• E-Mail notification on different topics
Regulatory Compliance: CCI has designed and implemented many initiatives aimed at ensuring compliance with the requirements of:• Turkish Personal Data Protection
Law no. 6698 (KVKK) • Communiques published by
Capital Markets Board of Turkey • Authorized Economic Operator
program of Turkish Ministry of Customs and Trade
• The Law of the Republic of Kazakhstan on Personal Data and Their Protection
Privacy and Data Protection: CCI takes preventive measures to secure the personal information of its employees and customers. Our IT environment, security measures, policies and cyber security awareness program contribute to complying with privacy and data protection requirements.
Cyber Risk Insurance: CCI has cyber risk insurance to mitigate cyber-related security breach or events. Cyber risk insurance covers the cost of restoring loss to business income or reputation caused by damage to computers and computer networks.
BUSINESS CONTINUITY
CCI implements the TCCC’s Incident Management and Crisis Resolution (IMCR) program, which is designed to create and maintain an efficient and integrated structure for preventing and managing incidents. Implementing the IMCR program is a key management activity, and it is everyone’s responsibility at CCI.
To ensure that we prevent or reduce the impact of incidents on our business, we have incident management teams in each country of operation. Each team joins our annual training sessions, and collectively they work on simulations of complex incidents. We will provide further training in Turkmenistan, and Kyrgyzstan in second phase of 2018.
As part of the IMCR program, each country conducts the IMCR Validation program, which aims to create readiness for crisis situations, build awareness, identify gaps and develop action plans to make improvements.
CORPORATE GOVERNANCE AND ETHICS / RISK MANAGEMENT
102-16; 103-1

28 CCI SUSTAINABILITY REPORT 2017
The Corporate Governance Committee has also developed necessary mechanisms for stakeholders to report any illegal or unethical practices in the company to the Corporate Governance Committee or the Audit Committee. CCI Internal Audit Department handles investigations concerning Code of Ethics violations and the CCI Ethics and Compliance Committee makes decisions based on the findings of the investigations. Certain categories of decision-making authority may be delegated to Local Ethics and Compliance Committees in accordance with the Guidelines for Handling Code of Ethics Matters.
We impose disciplinary measures that fit the nature and circumstances
of each Code violation. Letters of reprimand are issued for less significant, first-time offenses. Violations of a more serious nature may result in suspension without pay, loss of progress payments and bonuses or termination of employment.
All newly recruited employees must sign an acknowledgement form confirming that they haveread the Code of Ethics and agree to abide by its provisions. All employees are required to periodically make this acknowledgement. The Code of Ethics Handbook and Guidelines for Handling Code of Ethics Matters are shared with our employees in electronic format. Moreover, representatives and consultants
assigned by CCI and third parties doing work on behalf of CCI may also obtain a copy of the Code and learn therein about their obligations.
In 2013, our employees began receiving trainings on the revised Code of Ethics, the Code of Ethics Handbook and procedural provisions. In 2017, to ensure that the Code of Ethics was rolled-out effectively in all CCI countries, Code of Ethics trainers were trained in each country to introduce local training sessions.
In this scope, 1,197 person-hours training was provided to trainers in six country operations in the reporting scope.
ETHICS
Integrity and honesty are fundamental to our business. Since our reputation is a reflection of our integrity and honesty, it is our duty to protect our most valuable asset: the Coca-Cola brand.
The CCI Code of Ethics guides our employees to live our values and “do the right thing.” It outlines the behavior expected from every employee and its scope applies to all CCI countries of operation. Our CCI Code of Ethics and Code of Ethics Handbook are available for everyone to further review and understand, and can be reached on
CCI’s corporate website:www.cci.com.tr/en/investor-relations/corporategovernance/code-of-ethics.
CCI’s Corporate Governance Committee ensures full implementation and enforcement of the Code of Ethics. Implementation of the Code is under the responsibility of the CCI Ethics and Compliance Officer and the Local Ethics and Compliance Officers. CCI Ethics and Compliance Committee, is composed of CCI’s CFO, Human Resources Director, General Counsel, Corporate Affairs Director and Chief
CCI Ethics Service communication channels are:1. E-mail: employee’s name and e-mail address are kept confidential.2. CCI Ethics and Compliance websites www.ccietikhat.com (in Turkish) and www.cciethicsline.com (in English,
Russian and Arabic): employees can login to the page anonymously and enter their message.3. Dedicated phone number.
CORPORATE GOVERNANCE AND ETHICS / RISK MANAGEMENT
Audit Executive.
There are several channels available for our employees to express their concerns on ethical issues. They can direct their concerns to their managers or Local Ethics and Compliance Officers, or can use the CCI Ethics Service, which is run by a completely independent third party and is available 24/7 to all employees. There are translators providing translation services online in Arabic, English, Georgian, Russian and Turkish.
205-2; 103-1

SUSTAINABILITY APPROACH 29

30 CCI SUSTAINABILITY REPORT 2017

SUSTAINABILITY APPROACH 31

REPORTING CONSULTANT & DESIGN
www.esgturkey.com
CCI
Burcu CoşkunGroup Corporate Affairs [email protected]
OSB Mah. Deniz Feneri Sokak No: 434776 Dudullu Ümraniye İstanbulTel: +90 216 528 40 00 Fax: +90 216 510 70 12www.cci.com.tr
LEGAL DISCLAIMER
This sustainability report (the Report) was prepared by CCI within the principles of GRI (Global Reporting Initiative) and the United Nations Global Compact. This report has been prepared solely for informative purposes and does not aim to form the basis for any investment decision. No information in this report constitutes a proposal or part of a propos-al relating to the sale of CCI shares, or an invitation to this kind of sales process, and the publishing of this report does not mean that a legal relationship of this kind has been established. All featured information and related documents are believed to be accurate at the time of this report’s preparation, and all information has been provided in good faith and relies on trustworthy sources. However, CCI does not make any kind of declaration, guarantee or promise in relation to this information.
This report is printed on recycled paper.
CONTACT
32 CCI SUSTAINABILITY REPORT 2017 102-3

REPORTING CONSULTANT & DESIGN
www.esgturkey.com
CCI
Burcu CoşkunGroup Corporate Affairs [email protected]
OSB Mah. Deniz Feneri Sokak No: 434776 Dudullu Ümraniye İstanbulTel: +90 216 528 40 00 Fax: +90 216 510 70 12www.cci.com.tr
LEGAL DISCLAIMER
This sustainability report (the Report) was prepared by CCI within the principles of GRI (Global Reporting Initiative) and the United Nations Global Compact. This report has been prepared solely for informative purposes and does not aim to form the basis for any investment decision. No information in this report constitutes a proposal or part of a propos-al relating to the sale of CCI shares, or an invitation to this kind of sales process, and the publishing of this report does not mean that a legal relationship of this kind has been established. All featured information and related documents are believed to be accurate at the time of this report’s preparation, and all information has been provided in good faith and relies on trustworthy sources. However, CCI does not make any kind of declaration, guarantee or promise in relation to this information.
This report is printed on recycled paper.


SUSTAINABILITY REPORT 2017
Sustainability in Review
SUST
AIN
ABI
LITY
IN R
EVIE
W
CONTENTS
CONSUMER WELL-BEING
01 04CUSTOMER VALUE
08HUMANRIGHTS
17HUMAN CAPITAL
22COMMUNITYDEVELOPMENT
40ENVIRONMENTALFOOTPRINT

CONTENTS
CONSUMER WELL-BEING
01 04CUSTOMER VALUE
08HUMANRIGHTS
17HUMAN CAPITAL
22COMMUNITYDEVELOPMENT
40ENVIRONMENTALFOOTPRINT
SUSTAINABILITY IN REVIEW 1
While we offer our consumers a wide range of products fit for every lifestyle and occasion, product safety and quality remain the priority of
our commitment to well-being. We aim to meet the ever-evolving preferences of our consumers and provide more choice in our beverage
portfolio with a “total beverage” mindset. We provide affordable, ready, innovative products for all occasions.
CONSUMER WELL-BEING
Priority Areas 2017 Goals Performance in 2017 Status 2018 Goals
Product safety and quality
To continue to have zero major findings in food safety and quality audits.
Only one unconformity is reported in a plant. Partial To continue to have zero major findings in food safety
and quality audits.
Consumer Well-being
To continue with the Open to Curiosity platform as a means of communicating with our consumers.
In 2017, 604.868 users made 717.793 visits and 873.360 pages were viewed in total during the visit sessions.
Achieved To continue with the Open to Curiosity platform as a means of communicating with our consumers.
Goals and Commitments
Total Beverages Portfolio
At CCI, we offer beverages to a consumer base of 400 million people. We aim to meet the ever-evolving preferences of our consumers, provide more choice in our beverage portfolio with a total beverage mindset. We provide affordable, available, admirable, innovative products by leveraging all occasions.
As part of our efforts for a more transparent relationship with our consumers, we launched the online Open to Curiosity platform in Turkey, which provides a direct forum for our consumers to address their concerns regarding our products. Furthermore, stakeholders who are interested in seeing our production processes can easily attend our plant tours – in person or virtually – to learn about the production phases of Coca-Cola products. Our stakeholders can visit merakettim.coca-colaturkiye.com and coca-colafabrikasi.com for further information.
We provide our consumers with clear, understandable and scientific information regarding our products.
At the core of our efforts for transparent consumer engagement lies comprehensive and clear nutritional information. We comply
with labeling regulations of the countries where our products are sold and provide our consumers with nutritional information about all our products, allowing them to make choices that fit best to their lifestyles. At a minimum, our labels provide basic nutritional information about the beverage, such as the amount of energy (kilocalories, calories, kilojoules), protein, carbohydrates, fats, total sugars and sodium.
We offer more than 25 brands to our consumers. We are ensuring our growth by building and bringing to market “consumer-centric” brands. In order to meet the ever-changing preferences of our consumers and to build a stronger business, we offer a wide choice across our beverage portfolio that includes low or no-calorie beverage options.
Our strategy is powered by a leaner operating model and a digitized business enterprise. Key to driving this new strategy forward will be a more agile operating structure that drives quick action in the marketplace. We will adopt more of a tech company modus operandi rather than inventing the perfect thing.
Responsible advertising and marketing form another important
component of our engagement with consumers. In addition to adherence with the legal requirements of our countries of operation and the expectations of our stakeholders, TCCC’s standards and policies serve as an integral roadmap to advertising and marketing practices. In line with TCCC’s Global School Beverage Guidelines, we do not sell our sparkling beverages in elementary schools. Specifically, to honor the rights of parents and caregivers to make the appropriate choices for their children, we do not engage in advertising or marketing activities targeting children under the age of 12. Our stakeholders can reach further information regarding our responsible marketing policy at
https://www.coca-colacompany.com/content/dam/journey/us/en/private/fileassets/pdf/our-company/responsible-marketing-policy.pdf .
103-1; 416-1; 417-1

2 CCI SUSTAINABILITY REPORT 2017
Product Safety and Quality
At CCI, we conduct bottling operations in 26 plants throughout 10 countries. The sustainability of our business lies first and foremost in the excellence of these operations.
KORE (The Coca-Cola Operating Requirements), the set of operating requirements in the Coca-Cola
system, forms our main reference point in managing food safety and quality, environment, and health and safety performances in our plants. Annual KORE audits and assessments are carried out in each plant by TCCC’s internal auditors to ensure our compliance with the requirements as well as possession
of relevant and applicable certifications and engagement with approved excellence programs. Please refer to “Management Systems Standards and Principles” in Performance Indicators section of the report for an explanation of compliance with regards to internal policies, external standards and principles.
CONSUMER WELL-BEING
103-1; 416-1

SUSTAINABILITY IN REVIEW 3
CONSUMER WELL-BEING
The sustainability
of our business
lies first and foremost
in the excellence
of these operations.
KORE Audits
Compliance with product safety and quality requirements both by our suppliers and our own plants is regularly monitored through unannounced audits by TCCC.
During the reporting period, 6 CCI plants were audited in this regard and only one unconformity is reported in a plant. All other plants passed the audit without any unconformity. In addition, third-party external audits on compliance with the FSSC 22000 standard were carried out, resulting in either re-certification or follow-up. As of the end of the reporting period, all plants hold FSSC 22000 certificates.
External audits conducted at our plants verify our compliance with relevant standards. As of the end of reporting period;
Quality, Environment, Health, Safety & Food Quality
All our plants in 10 countries of operation hold ISO 9001, ISO 14001, OHSAS 18001 and FSSC 22000 certificates.
Energy & GHG
All our plants, sales operations and offices in Turkey are certified with ISO 50001 Energy Management and ISO 14064-1 Green House Gases Standards. Our Burundai plant in Kazakhstan also holds the ISO 50001 certificate.
Food Packaging
All our plants that produce preforms hold PAS 223 Packaging certificates.
103-1; 416-1

4 CCI SUSTAINABILITY REPORT 2017
In line with our 2025 Vision, we aim to build a company that creates value and delivers sustainable long-term growth as the preferred partner of our customers. To create this value for them, we are delivering best-in-class commercial strategies and solutions to create the perfect shopper experience every time they visit the outlets. Our key motivation
is “winning with the customer” via delivering joint initiatives and superior execution.
Across our operating geography, we have almost 400 million consumers and we work with approximately 780,000 sales points, including supermarkets, restaurants, convenience stores,
hotels and other retail outlets. We deliver products from 26 plants while ensuring that we offer the highest quality products to our customers. We keep on investing in coolers to ensure our consumers access cold products. We have more than 1 million coolers across our geography and we work to upgrade to more innovative and energy efficient coolers with less carbon footprint.
CUSTOMER VALUE
Priority Areas 2017 Goals Performance in 2017 Status 2018 Goals
Customer Satisfaction
To repeat satisfaction studies.
We conducted customer satisfaction studies in Turkey, Iraq and Azerbaijan with more than 3,500 customers.
Achieved We aim to conduct the study for Kyrgyzstan, Pakistan, Kazakhstan, Turkey and Jordan.
Distributor Trainings
To continue providing occupational health and safety training to our distributors.
We provided 436 training sessions with 4,716 participants to our distributors in Turkey.
Achieved To continue providing trainings to our distributors.
Goals and Commitments
Joint Business Plan Meetings
In Turkey, to increase customer collaboration; Modern Channel Joint Business Plan (JBP) meetings are held every year by creating a joint agenda which is constituted with top local & national account customers’ priorities & annual marketing plans. Every year, an engaging &
entertaining concept (aligned with the marketing plans, e.g. football concept in the stadium) is created and cross functional teams from both customer & CCI sides get together to ensure co-marketing & operational plans are aligned from both parties.
Customer Trainings
21 customer development training sessions for
214 participants were organized in Turkey.
Superior Execution
We aim to offer a sustainable Route to Market (RTM) model for delivering superior customer service through perfect commercial execution. Turkey’s indirect RTM model serves the “Best in Class Customer Service” based on the market dynamics. We listen to both customers and
distributors. While managing distributors we involve them and contribute to their operations, investing in their operational capabilities. We constantly check and improve customer satisfaction levels by supervising each distributor’s results. All these
provide an effective, efficient and sustainable RTM model. One of our RTM sustainability strategies is optimizing the daily number of vehicle movements and the kilometers driven daily and the time in field.
RED Practices
The Right Execution Daily (RED) system helps us offer products to our customers and consumers in the optimal way. In 2017, we successfully continued our RED project with increasing performance. RED project enables us to monitor
and follow merchandising standards and practices at our sales points. In the traditional channel, we further succeeded with the aid of the image recognition technology implemented in 2016. This technology allows us to cover all our traditional sales
points. In 2017; following Turkey, we carried this technology to our other operations; Iraq, Kazakhstan and Azerbaijan. In 2018, we aim to complete this transition in all CCI countries.
103-1; 416-1

SUSTAINABILITY IN REVIEW 5
The CCI Customer Interaction Center
CCI Customer Interaction Center’s mission is to understand and satisfy customers’ and distributors’ expectations and exceed them with best service approach.
• We make our potential customers, existing customers and distributors satisfied with many different and flexible work flows created.
• We conduct issue-based customer satisfactions surveys and take proactive actions.
• We call back most of our incoming callers about their service requests to ensure they are satisfied with our solution. In 2017, we realized 80.000 outbound calls.
• We analyse all our calls instantly and do issue based reportings.
• We follow up our service level and quality level day by day and take actions if needed.
In 2017, we welcomed 275.000 service requests, 42% increase from last year on different issues regarding customers (both existing and new), distributors, fleet and finance. In addition, our Customer Interaction Center performed 80.000 outbound calls to check the satisfaction levels of service requesters.
We welcomed
275,000 service requests
Customer Satisfaction Surveys
To “win with the customer”, it is crucial to understand the key drivers of satisfaction and dissatisfaction of our customers. To understand the dynamics and take necessary steps for stronger and sustainable relationships, we conduct Customer Satisfaction Studies in all of our countries of operation. These studies not only allow us to judge our own performance relative to that of other players’, but also enable us to focus on the gaps between our customers’ expectations and our current service performance. We have been conducting customer satisfaction
surveys in Turkey since 2005 and at other operation countries (except Syria, South Iraq and Tajikistan) since 2012. By conducting this study at least once every two years, we are following closely our ability to meet and exceed our customers’ needs and prepare action plans for areas of improvement. During 2017, more than 3,500 customers responded to our customer satisfaction studies in Turkey, Iraq and Azerbaijan. For 2018, the study will be conducted for Turkey, Jordan, Kazakhstan, Pakistan, and Kyrgyzstan.
Integrating with Distributor Network
Every year, we conduct Distributor Satisfaction Surveys via a third-party service provider to evaluate the satisfaction level of our distributors. As an evaluation of our company reputation, surveys help us become aware of our strengths and weaknesses about our partnership with our distributors and ability to manage our distributor network. In 2017, we conducted distributor surveys with a total of 209 distributors in Turkey and the results of the Distributor Satisfaction Surveys illustrate a clear increase in satisfaction score according to last year.
Distributor Satisfaction Survey (Turkey) 2013 2014 2015 2016 2017
Distributor Satisfaction Score 84.0 84.9 84.5 84.3 86.0
Customer Satisfaction Survey (Turkey) 2013 2014 2015 2016 2017
Customer Satisfaction Score 61 68 64 60 54
In order to accompany the sustainable development of our Turkey distributors, we support their sales capability developments. Therefore, we have provided the supervisors and presellers of our Turkey distributors with 436 training sessions on various sales and professional development topics with 4,716 participants.
CUSTOMER VALUE
103-1

6 CCI SUSTAINABILITY REPORT 2017
A Case of Success In Turkey In OE Projects
Throughout our organization, we strive to incorporate a culture of Operational Excellence (OE) with the long-term intention of diligently improving our business processes and systems. The OE Model is based on Lean Six Sigma methodologies and applied to all company functions. While the model focuses on maximizing quality and efficiency and minimizing failure, it also aims to decrease the environmental impacts that arise from our bottling operations.
* CCI countries excluding Turkey in the reporting scope are: Jordan, Kazakhstan, Azerbaijan, Pakistan, Kyrgyzstan.
** CCI countries in the reporting scope are: Turkey, Jordan, Kazakhstan, Azerbaijan, Pakistan, Kyrgyzstan
TURKEY
Since ImplementationIn 2017
(2008 to 2017 Cumulative)
758 610 $ 61 80 40 $ 1.5 0 25
OE projects certifications million savings OE projects certifications million saving blackbelts greenbelts
ALL CCI COUNTRIES (Including Turkey)**
Since ImplementationIn 2017
(2008 to 2017 Cumulative)
1,366 767 $ 67.24 217 40 $ 5.74 0 82
OE projects certifications million savings OE projects certifications million saving blackbelts greenbelts
CCI COUNTRIES (Excluding Turkey)*
Since ImplementationIn 2017
(2008 to 2017 Cumulative)
608 157 $ 6.24 137 0 $ 4.24 0 57
OE projects certifications million savings OE projects certifications million saving blackbelts greenbelts
CUSTOMER VALUE
Excellence in Supply Chain
Due to our broad regional presence, we manage a large value chain with significant social, environmental and economic impacts. Thus, we see
it as our responsibility to diligently follow our sustainability approach, remain limitless in our sustainability policies and practices with regards
to our own operations, and to implement them within all phases in our value chain.
103-1; 308-1; 414-1

SUSTAINABILITY IN REVIEW 7
CCI Turkey Operations Innovation Day
EFQM Model’s fundamental goal, “harnessing creativity and innovation,” was the inspiration for the establishment of CCI Turkey Operations Innovation Day. It
provides an opportunity to all employees for sharing their ideas and fostering the innovation culture among CCI. This dynamic event offers us an opportunity to recognize and reward innovation and activate new ideas that can lead to a positive
Received 2,422 ideas from our employees within
the scope of
CCIdea
Out of 3 proposals, 1 was
presented as finalist, and 2 were presented as semi-finalists at
Bi’ Fikir Festivali
25 employees were nominated for green-belt
certificates.
impact on our communities and business operations. The Innovation Day brings together CCIdea, OE projects and the Innovation Competition within a single framework.
CUSTOMER VALUE
Anadolu Group’s Bi’ Fikir Festivali (An Idea Festival) is attended by Group companies and the festival rewards companies that are successful in the area of innovation. Among our 2017 innovation projects;
2 were selected as semi-finalists and 1 was as finalist in ‘Explorer’ and ‘Inventor’ categories.
In 2018, we aim to integrate the CCIdea to Anadolu Group’s Bi’ Fikir Platform, so as to gather more ideas from all Anadolu Group employees for CCI and create a synergy.

Prohibitionof Forced Labor
A Safe HealthyWorkplace
Prevention of ArbitraryDiscrimination
Community andStakeholderEngagement
Commitmentto not Employ Child Labor
Freedom of Association andCollective Bargaining
Working Hoursand Wages
WorkplaceSecurity
8 CCI SUSTAINABILITY REPORT 2017
HUMAN RIGHTS
Workplace Rights
Our employees are vital for our success. It is our main responsibility to create a workplace environment in which they feel valued, encouraged, and where their workplace and human rights are recognized and respected. As one of our priorities, the CCI Workplace Rights Policy (WRP) is our guide to sustain these values within all our operations for our collective success.
As a part of our commitment to protect our employees and safeguard our value chain, we hold our suppliers to the same standards and require that they comply with the Supplier Guiding Principles (SGP), which provides the same coverage as WRP.
The CCI Workplace Rights Policy is based on international standards of human rights according to the
United Nations Universal Declaration of Human Rights, International Labor Organization Declaration of Basic Work Principles and Rights, and United Nations Global Compact.
We have updated our WRP as in following topics and will be re-launching in 2018.
CREATING VALUE FOR PEOPLE
Topics covered in The CCI Workplace Rights Policy
CCI’s Workplace Rights Policy is available online at http://www.cci.com.tr/Portals/3/Documents/PDF/CCI_WPR_2017.pdf
103-1

SUSTAINABILITY IN REVIEW 9
In addition to practices we conduct in-house at CCI, independent auditing companies authorized by TCCC routinely audits CCI plants. We
have set a clear target of achieving “green code” status; in other words, 100% compliance for all WRP and SGP audits with zero findings. The
table below shows the WRP and SGP audit performance results for all CCI operations for the year 2017:
HUMAN RIGHTS
The CCI WRP is available in English as well as in all local languages throughout all our operations and
our trainings are available as a part of the online onboarding and orientation program. Throughout
2017; 1,473 hours of training dedicated to Workplace Rights.
17 Plants in All CCI Countries
Collective Bargaining Agreements
We respect our employees’ right to exercise freedom of association and collective bargaining and commit to constructive dialogue with employees who are members of legally recognized trade unions. We consider Collective Bargaining Agreements (CBA) and our relationship with unions in general as important employee engagement mechanisms. As of 2017-year end, 91.14 % of our blue-collar employees in Turkey operations and 100% of our blue-color employees in Pakistan operations are covered by CBA.
Priority Areas 2017 Goals Performance in 2017 Status 2018 Goals
Workplace Rights
To maintain “green scores” on WRP audits for all CCI operations in 10 countries.
We obtained "Green Scores" at all audits performed in all CCI countries.
Achieved To maintain “green scores” on WRP audits for all CCI operations in 10 countries.
Work-life balance
To encourage all employees to use their 2017 annual leave as well as 20% of prior years’ accumulated annual leave.
We managed to achieve a serious decline in unused accumulated leaves in CCI operations in 2017. Accordingly, the number of unused leave days dropped from 107,000 to 73,600.
AchievedTo keep encouraging all employees to use their 2018 annual leave as well as 20% of prior years’ accumulated annual leave.
Goals and Commitments
CCI Turkey Operations
CCI Turkmenistan CCI Azerbaijan CCI Tajikistan CCI Kazakhstan CCI Pakistan
GREEN GREEN GREENGREEN GREEN GREEN
Parental Leave
Our women employees take paid maternity leave per laws and regulations set within their respective countries of operation.
103-1; 407-1; 412-1; 102-41

Laws andRegulations
Health andSafety
Freedom of Association andCollective Bargaining
Wages andBenefits
Work Hoursand Overtime
Non-discriminationEnvironment
Demonstrationof Compliance
Child Labor Forced Labor Abuse of Labor
Compliance with
ZERO TOLERANCE ON
Priority Areas 2017 Goals Performance in 2017 Status 2018 Goals
Sustainability of our Suppliers
To conduct a Supplier Satisfaction Survey in
2017.
Supplier Satisfaction Survey is performed.
Achieved
To conduct a Supplier Satisfaction Survey every two years and increase our supplier satisfaction
scores.To attain a success
rate of 93% for the SGP audits in all countries of
operation.
The realized success rate was 68%.
Underachieved
To attain a success rate of 85% for the SGP audits in all countries of
operation.
Goals and Commitments
10 CCI SUSTAINABILITY REPORT 2017
Supplier Guiding Principles
We create economic impact both upstream and downstream. Our suppliers play an important role in creating this impact. Our local procurement policy supports the sustainable development of local economies and we support our suppliers to improve their sustainability performance with
effective supplier development practices.
As part of our supplier agreements since 2002, the Supplier Guiding Principles (SGP) determine the social, environmental, ethical and economic minimums, which TCCC and its bottlers expect from their suppliers. The latest human rights
advancements from Ruggie, OECD and UNGC standards, as well as guidance provided by the Danish Institute for Human Rights study of TCCC policies and practices have been reflected to SGP standards. At a minimum, our suppliers are required to meet these standards with respect to their operations.
HUMAN RIGHTS
You can access the SGP from the TCCC corporate website: http://www.coca-colacompany.com/content/dam/journey/us/en/private/fileassets/pdf/unknown/unknown/SGP_Brochure_ENG.pdf
We consistently cultivate effective communication, and conduct audit and development practices in order to ensure that our suppliers adhere to our principles. Our suppliers receive a copy of our SGP at the beginning of the business relationship and are expected to transfer these principles to their stakeholders, in particular, to their
workforce. We attach the SGP Policy to our supplier contracts when applicable with the expectation that they will develop and implement appropriate internal business processes to safeguard compliance with the SGP requirements. Supplier audits are conducted by TCCC’s and CCI’s own trained personnel as well as by third parties. For our direct
material and cooler suppliers, it is obligatory to undergo SGP audit and comply with SGP standards before making contracts.
Third-party audits include confidential interviews with employees and on-site contract workers. A supplier who fails to meet any aspect of the SGP requirements is expected to implement corrective
412-1

SUSTAINABILITY IN REVIEW 11
actions. If a supplier fails to adhere to our principles, sanctions that include termination of the contract are applicable.
During the reporting period, with enlarged scope of SGP by trademarked Tertiary Packaging suppliers like crates, pallets, printed shrink, etc. 68% of our suppliers passed the audits for compliance
with SGP without any major issues. While this was below our goal set for 93%, we have made an effort to work closely with these suppliers so that we can resolve their issues and bring them back to SGP compliance. We have revised our target for 2018 as 85%, however we keep the ambitious target for 2020 as 95%. As a result of the SGP
audit, a remediation action plan that covers specific matters such as working hours (especially night shifts), rest day violation, overtime and health and safety, were sent to the relevant suppliers and follow-up audits were organized. In the last three years, TCCC has audited all of CCI’s ingredients and packaging suppliers.
HUMAN RIGHTS
Turkey Jordan Kazakhstan Azerbaijan Pakistan Kyrgyzstan Turkmenistan North Iraq Iraq
Green Green Green Green Green Green Green Green N/A
201488% 93%92% 90% 95%91% 85%
2015 2016 2017 2018 2019 2020Target Target Target
11.6%Women
Employees
33.4%Gen Y in
Management Roles
23.4%Women Senior
Managers
51.8%Gen Y
Employees
30.0%Women First
Level Managers
15.3%Women New
Employes Hires
Average Age 35 – Seniority 8 years
SGP Audit Targets for Years
Local Procurement
Local procurement is a significant practice that enables us to contribute to local economies. The proportion of spending on raw materials from local suppliers (within the same country) is provided in the table below.
Local Procurement (%) 2013 2014 2015 2016 2017
Turkey* 96 98 95 95 99
Jordan 68 65 55 95 95
Azerbaijan** 48 54 47 47 49
Pakistan 97 98 95 97 97
* Concentrate is not included.
** There are no approved suppliers in these local markets for some product and service categories. (There are no local suppliers available for some of the product categories with high spend. Selection and approval of the suppliers are done by TCCC.)
412-1

Turkey Jordan Kazakhstan Azerbaijan Pakistan Kyrgyzstan Turkmenistan North Iraq Iraq
Green Green Green Green Green Green Green Green N/A
201488% 93%92% 90% 95%91% 85%
2015 2016 2017 2018 2019 2020Target Target Target
11.6%Women
Employees
33.4%Gen Y in
Management Roles
23.4%Women Senior
Managers
51.8%Gen Y
Employees
30.0%Women First
Level Managers
15.3%Women New
Employes Hires
Average Age 35 – Seniority 8 years
12 CCI SUSTAINABILITY REPORT 2017
At CCI, from recruitment to compensation and promotion, our equal opportunity approach applies to all human resources processes. We aim to foster a workplace where all our employees
feel valued as respected members of CCI, regardless of their gender, nationality, age, language or religion. We embrace differences and consider them significant for the synergy created in our workplace
and our sustainable growth. As a result, we aim for an inclusive culture where all employees feel confident in speaking their mind, sharing their ideas and opinions.
Priority Areas 2017 Goals Performance in 2017 Status 2018 Goals
Diversity and Inclusion (D&I)
• To increase women in the workplace by 1%.
• To sustain 32% women in managerial positions.
• To maintain 62% Generation Y & Millenials in the total workforce.
• Women in workplace was increased by 1%.
• Women representation in managerial positions and in the Executive Committee (Excom) across CCI was sustained and increased.
• Percentage of the Generation Y & Millenials in the workforce is maintained.
Achieved
• To define our D&I constitution.
• Launch Women in Leadership Program for CCI.
• Design pilot project to build external talent pipeline to increase women hiring in Supply Chain (plant) & Commercial side (field).
• To review diversity friendly policies and implement in selected countries as a pilot.
• To start cultural D&I programs.
• To establish Women Clubs in CCI Pakistan, Kazakhstan, Kyrgyzstan and Turkey.
• To create Women Leadership Development, Mentoring & Gender Sensitization Programs.
• Women Clubs in CCI Pakistan, Kazakhstan, Kyrgyzstan and Turkey were established.
• The work group has been established for Women Empowerment as part of D&I strategy. It led the industry benchmark, internal surveys and senior stakeholder interviews. CCI Pakistan, Kazakhstan, Kyrgyzstan and Turkey were established.
Achieved
Diversity and Inclusion
HUMAN RIGHTS
103-1; 405-1

Boomers
ages 52-71
2.9%
Generation X
ages 36-51
36.5%
60.6%
Millenials
ages 20-35
SUSTAINABILITY IN REVIEW 13
Diversity & Inclusion for us at CCI:
• Gender and generational diversity whereby more women and Gen Y/Millennials are part of our workforce.
• All employees feel confident to openly share their thoughts, ideas and opinions, and act with respect and cooperation in their efforts to meet business needs.
• CCI values all employees for their contribution to sustainable growth regardless of their gender, nationality, language and role.
While we aim to recruit and retain a competent and dynamic workforce, we foster gender, generational and cultural diversity in our workplace, as expressed by our signature support of the UN’s
Women Empowerment Principles (WEPs) and multi-generational hiring efforts. We believe that forming a talent pool that is reflective of the diverse marketplace we serve is crucial to the success we achieve. As a company that faces major challenges with regards to women employment due to its operational geography, we unequivocally invest the energy to overcome these barriers with concrete, mid and long-term objectives. Women Employee Ratio By
Countries of Operation (%)
Since 2015, Diversity and Inclusion Steering Committee is led by our Human Resources Department and is comprised of representatives from various branches of our organization. Meeting every six months, the Committee’s main objective is to advise senior leaders
on how they can achieve the gender goals and to pioneer in creating an inclusive culture throughout our organization.
Women representation in leadership positions is another challenge we face as we work towards gender
diversity in our workforce. Women members of senior management make up 40% in Azerbaijan and Jordan, operations, 33.3% in Kazakhstan, 20% in Kyrgyzstan and 28.6% in Turkey operations of the total senior management.
HUMAN RIGHTS
103-1; 405-1
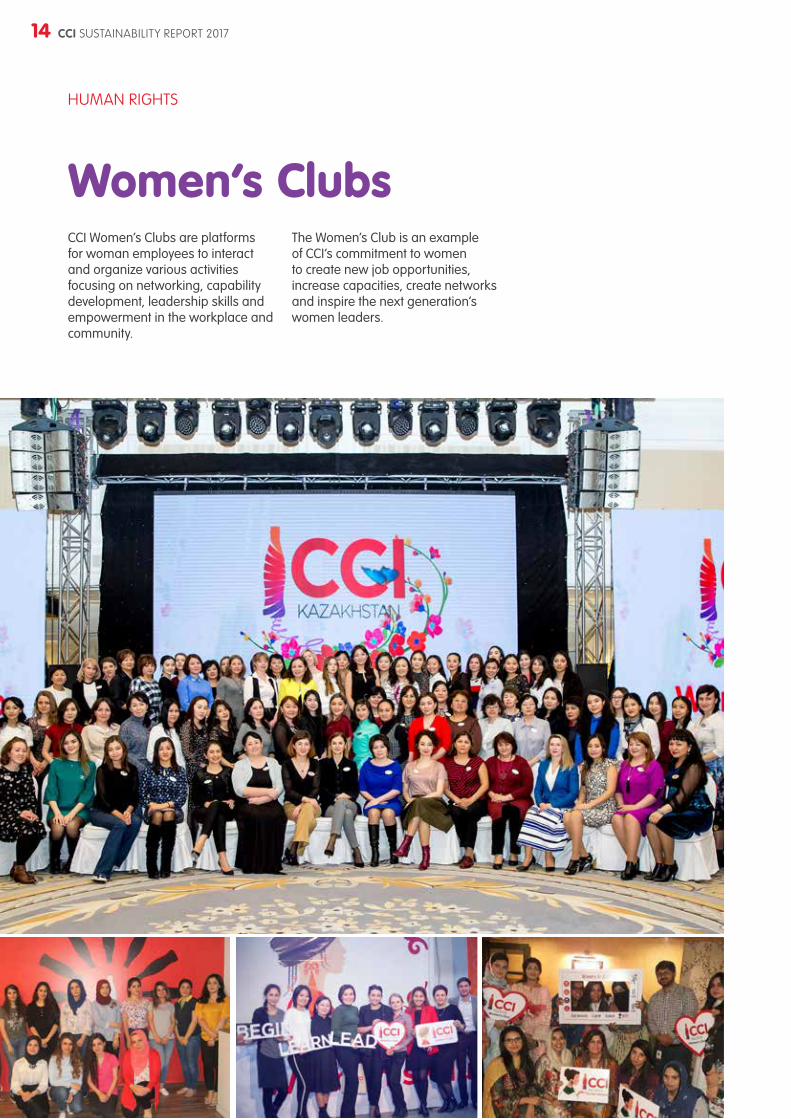
14 CCI SUSTAINABILITY REPORT 2017
CCI Women’s Clubs are platforms for woman employees to interact and organize various activities focusing on networking, capability development, leadership skills and empowerment in the workplace and community.
Women’s Clubs
HUMAN RIGHTS
The Women’s Club is an example of CCI’s commitment to women to create new job opportunities, increase capacities, create networks and inspire the next generation’s women leaders.

SUSTAINABILITY IN REVIEW 15
Health and Safety
It is our primary responsibility to provide our employees a safe and healthy working environment. By doing so, we can improve our employees’ work-life balance, and positively impact their motivation and our productivity and business performance.
• Protect the most valuable and important resource of our company – our human capital – from any occupational health and safety risks or hazards.
• Ensure that OHS is an integral part of our business and is actively supported through management leadership and commitment.
• Protect the Company from any legal challenges by complying with (at a minimum) local legal requirements and applying industry best practices to set higher standards than such legal requirements.
• Protect all other resources and assets from any losses that may be caused by work-related risks and hazards.
Health and safety issues are managed through the Coca-Cola Operating Requirements (KORE). All our operating plants are certified with OHSAS 18001 Management System certification by 2017. Furthermore, OHS issues are handled within the context of
collective bargaining agreements signed with labor unions.
Country Health and Safety (H&S) committees and the Group H&S Manager coordinate H&S matters throughout all CCI countries. H&S managers and/or specialists are
assigned to all CCI plants where we operate. The CEO is the top-ranking executive who has ultimate responsibility and the HR Director is at the top in the chain of command for H&S management.
Priority Areas 2017 Goals Performance in 2017 Status 2018 Goals
OHS policy, procedures and systems
To have no major findings from KORE and local legal audits.
We had one major finding across CCI
PartialTo have no major findings from KORE and local legal audits.
Safe Driving
To have the online system tested in Turkey, Jordan and Pakistan.
The online system tested in Turkey.
Partial To apply the online system in Jordan.
To have the system running in CCI Turkey Operations.
It is decided to postpone running of the system in CCI Turkey Operations due to budget replaning.
Delayed
To apply the telematics system for the countries with high Vehicle Crash Rates.
OHS performanceThe overall LTIR score to be reduced to 0.5.
The overall LTIR score was reduced to 0.28.
AchievedReduce the last year’s overall LTIR score by 20%.
OHS Along the Supply Chain
To control the maturity of the system periodically.
The maturity of the system is controlled periodically.
AchievedTo improve supervision system for contractors.
To spread reporting to all countries.
No country is added to the reporting.
Underachieved
To spread reporting to all remaining countries in the scope, which are Jordan, Kazakhstan, Azerbaijan, Kyrgyzstan.
HUMAN RIGHTS
103-1; 403-1

0.28Lost Time Injury Rate
45,392Person-hours OHS Training Provided
to Employees
12,06216,159
21,284
679 992 1,0962,235
4,525 2,9963,1984,392 2,902
22,72618,557
10,2714,581 6,603
6,843
45,481
51,228
45,392
0
10,000
20,000
30,000
40,000
50,000
60,000
2015 2016 2017
Turkey Jordan Kazakhstan Azerbaijan Pakistan Kyrgyzstan OVERALL
16 CCI SUSTAINABILITY REPORT 2017
Hand in Hand Safety Program Progress
In 2016, we established the Hand in Hand Occupational Safety System in order to standardize occupational health and safety practices at CCI. Below are some examples of progress that were made in 2017 to support our targets:
• Hand in Hand Safety maturity has been improved and total number of lost time accidents halved.
• The H&S performance reporting system has been changed and the performance improved +20%.
• We adapted a more proactive and accurate approach to risk analysis.
• Number of major accidents and incidents decreased, the number of near misses increased.
A significant improvement is expected in the 2018 performance trends with the improved maturity of Hand in Hand Safety Management, the Safety Maturity Index (SMI) culture-focused and proactive reporting methodology and focused H&S leadership along with a focus on unsafe behaviors.
Based on previous learnings, CCI had focused heavily on the RTM safety and with the safety campaigns, we had no employee or contractor fatalities occurring in 2017. Our dedication will continue in 2018, with best-in-class practices like Road Safety Collaboration Pakistan project where CCI is pioneering other multi-national organisations in Pakistan to create a collaborative impact on the traffic safety awareness of the Pakistan.
To expand and strengthen our occupational health and safety culture, we provide targeted and periodic OHS trainings to our employees and contractors conducting work on behalf of CCI.
In 2017, we provided 45,392 person-hours of OHS training to our employees throughout our operations. The main topics of the training sessions included first aid, confined space, working at height, emergency response, CCI’s Golden Rules, defensive driving and forklift safety.
HUMAN RIGHTS
401-1; 103-1; 403-1

SUSTAINABILITY IN REVIEW 17
We are committed to creating value and the main source of this value created is our employees. We see ourselves as one, diverse, engaged and inclusive team and consider it as our Human Capital. Our employees’ diversified skills and expertise are critical to our creation of sustainable value. We seek ways to provide different opportunities
for our employees to develop themselves. In fact, our employees’ development is fundamental to our success. With this in mind, we believe it is our responsibility to provide our employees with a workplace that is productive, happy and safe.
We have established systems and programs that offer support to our
employees so that they are able to improve their skills, knowledge, competency, and raise their living & working standards.
Detailed data on our employee demographics is provided in the Performance Indicators section of the report.
Priority Areas 2017 Goals Performance in 2017 Status 2018 Goals
Talent Management
New• To raise the Talent Readiness Index (TRI) from
41% to 55%.
Leadership Development
To implement targeted leadership development programs for top executives, senior leaders and mid-level managers.
CCI leadership development programs were designed targeting top executives, senior leaders.
Ongoing
• To implement leadership development programs for Excom, general manager, country leadership teams and extended leadership teams.
• To design programs for GM pipeline and future leader development.
• To design CCI coaching program.
• To design leadership development program for mid-level manager and create CCI internal trainers pool.
Employee Engagement
To define the engagement action plans in detail function by function, based on the Survey conducted in 2016.
Employee engagement dipstick survey has been carried out in Pakistan and results show a tremendous increase in the engagement score. It jumped to 83% from 47%.
Achieved• To execute the Pakistan Dipstick Survey.
• To pulse check survey for other countries.
HUMAN CAPITAL

18 CCI SUSTAINABILITY REPORT 2017
Talent Development
CCI Talent management strategy ensures that it has “objectively identified and diversified talents” to contribute whilst achieving business results. We strongly believe that the talents of our employees and hence their individual expertise are paramount to our success. We provide opportunities to our employees so that they harness their potential. Our ability to identify and develop talent is one of our Strategic Priorities. CCI Leaders have a duty and responsibility to help all employees foster their strengths and empower them to meet their career aspirations.
In 2017, we continued to conduct and review our Talent Development Forum to identify our talent pools, create bench strength and fill positions with the right people accordingly. We facilitated transfer of crucial knowledge, experience and talent by offering opportunities through international and local career moves. Talent Readiness Index (TRI) is an index that shows the usage of internal talent pool ratio. It is a recently introduced and customized index to trace and track the overall succession readiness (indexing bench strength) across CCI. In 2017, we achieved 41% at TRI for the critical positions and for the next year; we target 55%.
In 2017, through our E-Talent Management Platform, we have introduced “Talent and Development Profile” and “Individual Development Plan” (IDP) within our ‘Talent Management Process’. With Talent Profiles, our employees will create their own personal career pages including their career aspirations and international mobility preferences. IDPs are their individual development plans to help them reach their career aspirations and guide their preparation of future career paths. Both tools contribute as great Talent Data sources for prudent talent decisions.
In order to support and be more effective in the career planning process, we also continue to use the platform “My Career Talk”. This platform helps CCI employees identify their career goals, establish a plan for pursuing them and take personal responsibility for achieving those goals.
“My Career Platform” provides end-to-end information and is a one-stop solution to a career at CCI. We encourage all our employees to take charge of their career and get the support available to them from internal tools and resources.
“CCI Career Navigation Framework”, a structured tool created to support employees and managers in career planning and development, is a resource for thinking through “Critical Experiences” and “Opportunities” that an employee should pursue in lieu of their career aspirations.
Our talent management approach, accompanied by our Performance Management System, ensures that we remain equipped and maintain fairness and transparency. We aim to deliver successful results by improving performance whilst developing capabilities of both teams and individuals. The CCI Performance Management Process facilitates smart goals and secures that our organization delivers successful results by improving the skills and performance of teams and individuals. At CCI, performance assessment processes are implemented for all employees regardless of position or seniority.
Action @ field
In 2017, we organized the second Action @ Field project for university students in Turkey. With this project, we created a candidate pool of new college graduates and further strengthen our employer brand. The project participants, consisting of senior students, went through a special selection process, followed
by a 3-day company orientation program. They then developed team projects and presented them to our Senior Management competing for awards. At end of the project, 9 participants joined the CCI family as trainees, 4 as Sales Representatives, 2 as Assistant Product Manager and 1 as HR Specialist.
HUMAN CAPITAL

SUSTAINABILITY IN REVIEW 19
HUMAN CAPITAL
CCI Talent management strategy ensures that it has “objectively identified and diversified talents” to contribute whilst achieving business results.

20 CCI SUSTAINABILITY REPORT 2017
Learning and Development
At CCI, we promote a work environment where continuous learning is achieved. We carry out our learning and development activities under the main headings of Commercial Development, Leadership Development and Functional Development.
Collaborating for Value Program helps increase our employees’ commercial capability across our geography. We conduct standardized and country-specific customized training sessions in the classroom, the field and on the job throughout all our country operations. In 2017, 462 sales colleagues completed our basic sales training “Collaborating for Value” succesfully.
Manager on Board (MOB) Program is a program for new managers with the goal of supporting participants to become more effective managers by focusing on the balance between business and people management. It was initially launched in 2015 in Pakistan, Azerbaijan, Kazakhstan, Turkmenistan and Jordan, and was spread to all CCI countries in 2016. As of February 2017, the program reached its target of 467 people.
Supervisor on Board (SOB) Program is a program prepared for employees who are already managing a team with less than a year of experience. The program aims to improve the participants’ basic team management skills and also informs them about the necessary HR procedures for managing people. With a target audience of about 905 people, the
program was launched in Pakistan, Azerbaijan, Turkmenistan and Kazakhstan in 2015 and continued in all CCI countries in 2016; reaching its entire target audience as of February 2017.
Finance Leader Certification Program was designed for finance employees up to the managerial level. The program, accredited by Boğaziçi University, is continued in 2017 and reached 125 employees.
In addition to these programs, a variety of learning solutions are also offered to employees, including but not limited to, coaching and mentoring, research articles, books, conferences, seminars, and business English language development. All of these resources are structured under CCI UNI, which is supported through Learning Management System software.
HUMAN CAPITAL
403-2
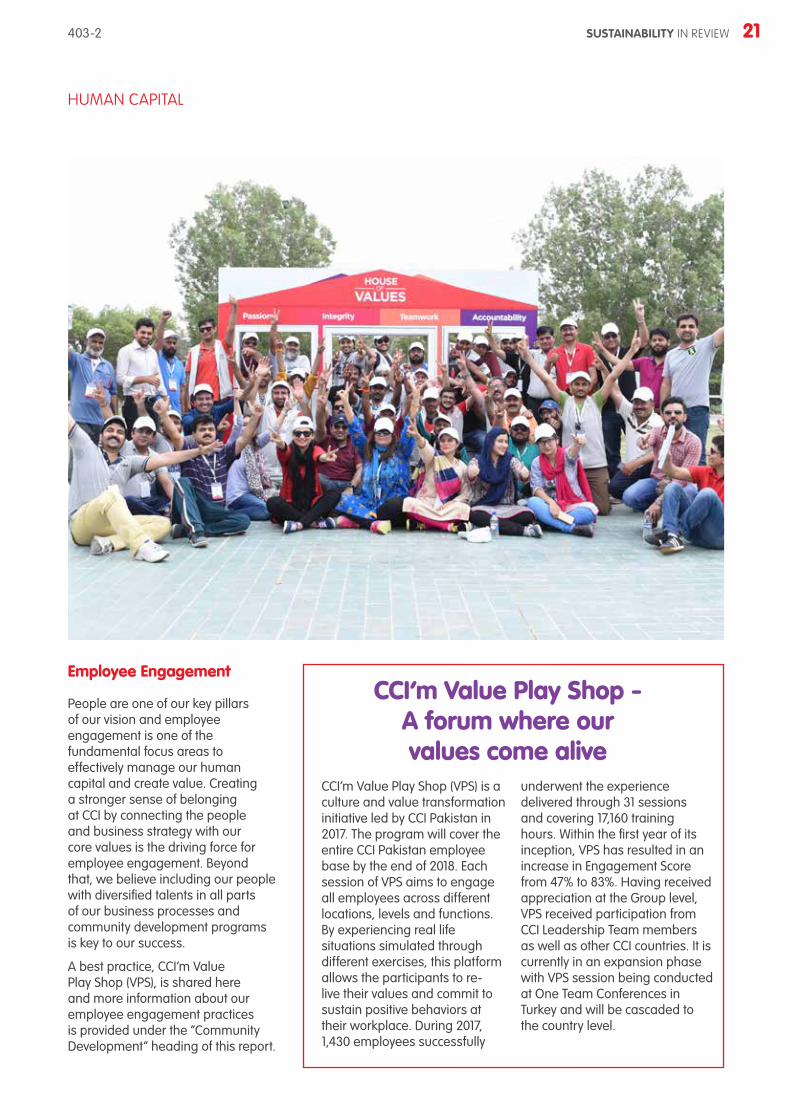
SUSTAINABILITY IN REVIEW 21
Employee Engagement
People are one of our key pillars of our vision and employee engagement is one of the fundamental focus areas to effectively manage our human capital and create value. Creating a stronger sense of belonging at CCI by connecting the people and business strategy with our core values is the driving force for employee engagement. Beyond that, we believe including our people with diversified talents in all parts of our business processes and community development programs is key to our success.
A best practice, CCI’m Value Play Shop (VPS), is shared here and more information about our employee engagement practices is provided under the “Community Development” heading of this report.
CCI’m Value Play Shop (VPS) is a culture and value transformation initiative led by CCI Pakistan in 2017. The program will cover the entire CCI Pakistan employee base by the end of 2018. Each session of VPS aims to engage all employees across different locations, levels and functions. By experiencing real life situations simulated through different exercises, this platform allows the participants to re-live their values and commit to sustain positive behaviors at their workplace. During 2017, 1,430 employees successfully
underwent the experience delivered through 31 sessions and covering 17,160 training hours. Within the first year of its inception, VPS has resulted in an increase in Engagement Score from 47% to 83%. Having received appreciation at the Group level, VPS received participation from CCI Leadership Team members as well as other CCI countries. It is currently in an expansion phase with VPS session being conducted at One Team Conferences in Turkey and will be cascaded to the country level.
CCI’m Value Play Shop - A forum where our values come alive
HUMAN CAPITAL
403-2

22 CCI SUSTAINABILITY REPORT 2017
COMMUNITY DEVELOPMENT
CCI conducts bottling and distribution operations and creates a positive impact both directly & indirectly. Additionally, CCI invests in community in various ways.
As a company operating in 10 countries with 780,000 sales points and serving to 400,000 million consumers, CCI creates an economic ecosystem along its value chain.
CREATING VALUE FOR COMMUNITY
Priority Areas 2017 Goals Performance in 2017 Status 2018 Goals
Women Empowerment
To train at least 2,000 women and provide 10 applicants with grants while expanding the geography of the project beyond the 3 regions established in Kazakhstan in 2016.
We trained 2,050 women and allocated 10 grants.
Achieved
To train at least 2,000 women and provide 10 applicants with grants in Belestery Program will cover 3 regions in Kazakhstan.
We aim to help set up a total of 15 Tabeer stores by the end of 2017.
We helped to set up 13 Tabeer stores within the scope of The Project Zarya.
Partial
The project is completed; therefore, we will not set goals for 2018. We will be supporting a new women empowerment project.
Youth Empowerment
To reach 120,000 students in 18 cities in 150 schools.
We reached more than 125,000 students in 17 cities in 131 schools.
AchievedTo reach 140,000 students in 18 cities in 150 schools.
Include 50 youth aged 17 to 22 from all over Kazakhstan in the project aimed at the development of social entrepreneurship and conduct training for the 10 best participants.
We received 80 applications from all over Kazakhstan and the 10 best participants are deemed worthy to participate trainings.
Achieved
To include 60 youngsters, aged between 18 and 29, in the social entrepreneurship program and train the best 10.
Community Development
To plant 15,000 more trees in Baku.
15,000 more trees were planted in Baku and by this 46,000 trees were planted in total.
AchievedTo plant 4,000 more trees in Baku and reach 50,000 in total.
Water
To provide clean drinking water to additional 100,000 people and bring the total number of people reached to 850,000.
We set up 4 additional plants and provided clean drinking water to additional 100,000 people. The total number of people reached to 850,000.
Achieved
To provide clean drinking water to additional 50,000 people and bring the total number of people reached to 900,000.
Goals and Commitments
Furthermore, CCI invests a certain ratio of its annual pre-tax profit in local economies.
103-1; 413-1

Rs. 5
The Economic Impact of Coca-Cola In Pakistan
The Economic Impact of Coca-Cola In Turkey
An injection of Rs. 1 by CCI Pakistan yields almost Rs. 5
in the economy.
Every 1 TL generated by the Coca-Cola system in
Turkey yields 9.7 TL in the economy.
The Coca-Cola system enables a direct and indirect employment impact of
30,000people.
For every Rs. 1 tax paid by CCI Pakistan, almost
Rs. 2 are Generated for the government.
Ouremployment rate is
13.6%
Enables
4.1 billion TLvalue added in the retail
business, supporting the industry. Generated income for
160,000 farmers
Rs. 1
Rs. 5
1 TL
9.7 TL
Rs. 1 Rs. 2
SUSTAINABILITY IN REVIEW 23
Economic ImpactOur products are produced, sourced (where possible), distributed and sold locally. A bottle of Coca-Cola creates added value for multiple sectors during its journey from the production line to the consumer. Many sectors, including agriculture, energy, production, transportation, distribution, retail, cooling, advertising, media and packaging play a role in the production of a single bottle of Coke. Our business stimulates job creation throughout our value cycle. We contribute to the economic success of each community by employing local people; paying
taxes to governments; paying suppliers for goods, services and capital equipment; and supporting community investment programs.
We reach close to 780,000 sales points with our extensive sales and distribution network. We support local retailers to build their businesses through providing assets and trainings. Finally, through strong supplier contributions, we also support our suppliers to increase their international competitiveness. An independent economic impact study conducted for CCI Pakistan showed that the CCI Pakistan has
an output multiplier of 5, which means that an injection of Rs 1 by CCI Pakistan generates Rs 5 in the Pakistan economy. Additionally, CCI’s tax multiplier in Pakistan is 2, which means for every Rs 1 tax paid by CCI Pakistan, almost Rs 2 are generated in the taxation for government. For our Turkey operations, according to the recent economic assessment, every 1 TL generated by the Coca-Cola system in Turkey yields 9.7 TL in the economy. Additionally, our operations enable 4.1 billion TL value added in retail business and also generate income for 160,000 farmers.
COMMUNITY DEVELOPMENT
103-1; 203-2

24 CCI SUSTAINABILITY REPORT 2017
While growing our business, we also work to ensure that we create value for each and every member of these communities. Our goal is to be recognized as a good corporate citizen by all our stakeholders. Our community investment focuses on 3
areas: volunteerism, youth & women empowerment and water.
We care about the needs of the local communities where we operate. Through partnerships and collaboration with both local and international partners, we identify
community challenges and needs, and develop and implement projects to address them. We work closely with the Anadolu Foundation on projects addressing the different needs of our stakeholders.
The Anadolu Foundation
In 1979, the founders of the Anadolu Group established the Anadolu Foundation with the aim of creating lasting solutions for social needs. The foundation’s mission is to make a difference by improving people’s quality of life through supporting development in education, health and social issues.
Through the Foundation’s Young Social Entrepreneurs project, which received funding from the Istanbul
Development Agency’s Financial Support for Children and Youth program, young entrepreneurs have the possibility to develop their capacities and develop joint projects with universities, local governments and NGOs. The My Dear Teacher project, conducted by the Foundation on a national scale, offers opportunities for youth and teachers to develop sustainable solutions for their communities.
For more information and to see the Annual Report of the Anadolu Foundation www.anadoluvakfi.org.tr/en.
COMMUNITY DEVELOPMENT
203-1

17Cities
12Projects
54StrategicPartnerships
32Calls inPortal
+3,033Voluntary Hours
12Activities
83,680 TLDonation
+1,000Volunteers
+95,091Beneficiaries
PET and GlassLightweight
Returnable Glass Bottles
PlantBottle
REDUCE REUSE
RENEW Post-ConsumerMaterial Collection
RECYCLE
Our Sustainable Packaging Strategy
2017 Volunteerism by numbers in CCI Turkey Operations
SUSTAINABILITY IN REVIEW 25
Volunteerism
Encouraging and supporting employee volunteerism is one of the building blocks of CCI’s organizational culture. CCI’s main goal is to be recognized as one of the most responsible corporate citizens by all stakeholders. To reach this objective, CCI supports civic initiatives that help build stronger communities, focusing primarily
on women’s empowerment, youth development and environmental protection. In doing this, CCI collaborates with local and international NGOs and encourages its employees to take an active role through volunteering.
In 2013, we launched the CCI Volunteers initiative to integrate
social responsibility into our company culture and encourage employee volunteerism in support of community development programs. We also began the establishment of Employee and Family Volunteering Clubs in our countries of operation, which in turn has created yet another platform for our employees to improve internal communication.
COMMUNITY DEVELOPMENT
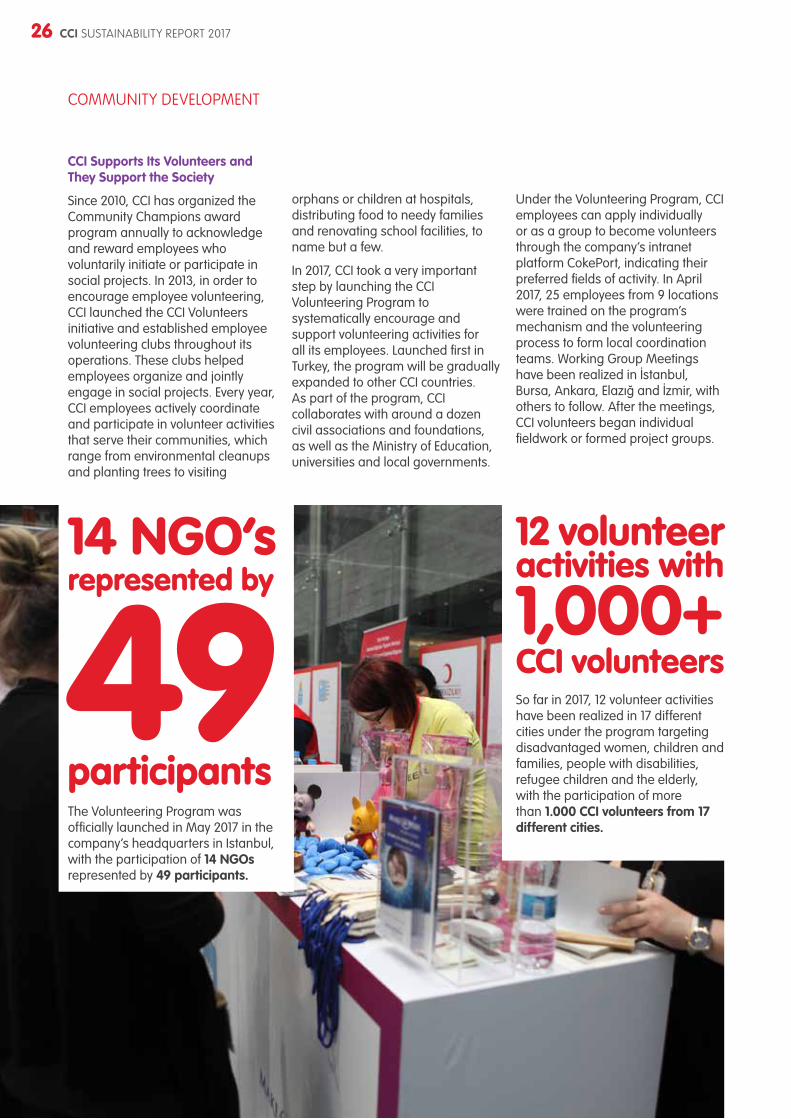
26 CCI SUSTAINABILITY REPORT 2017
orphans or children at hospitals, distributing food to needy families and renovating school facilities, to name but a few.
In 2017, CCI took a very important step by launching the CCI Volunteering Program to systematically encourage and support volunteering activities for all its employees. Launched first in Turkey, the program will be gradually expanded to other CCI countries. As part of the program, CCI collaborates with around a dozen civil associations and foundations, as well as the Ministry of Education, universities and local governments.
Under the Volunteering Program, CCI employees can apply individually or as a group to become volunteers through the company’s intranet platform CokePort, indicating their preferred fields of activity. In April 2017, 25 employees from 9 locations were trained on the program’s mechanism and the volunteering process to form local coordination teams. Working Group Meetings have been realized in İstanbul, Bursa, Ankara, Elazığ and İzmir, with others to follow. After the meetings, CCI volunteers began individual fieldwork or formed project groups.
CCI Supports Its Volunteers and They Support the Society
Since 2010, CCI has organized the Community Champions award program annually to acknowledge and reward employees who voluntarily initiate or participate in social projects. In 2013, in order to encourage employee volunteering, CCI launched the CCI Volunteers initiative and established employee volunteering clubs throughout its operations. These clubs helped employees organize and jointly engage in social projects. Every year, CCI employees actively coordinate and participate in volunteer activities that serve their communities, which range from environmental cleanups and planting trees to visiting
COMMUNITY DEVELOPMENT
14 NGO’s represented by
49
participants The Volunteering Program was officially launched in May 2017 in the company’s headquarters in Istanbul, with the participation of 14 NGOs represented by 49 participants.
12 volunteer
activities with
1,000+ CCI volunteers So far in 2017, 12 volunteer activities have been realized in 17 different cities under the program targeting disadvantaged women, children and families, people with disabilities, refugee children and the elderly, with the participation of more than 1.000 CCI volunteers from 17 different cities.

SUSTAINABILITY IN REVIEW 27
Youth Empowerment
CCI serves a predominantly young population of more than 400 million and almost 60% of population is below 29 years of age. Investing in our geographical regions’ young and growing population is critical to the sustainable development of our communities. We consolidate our efforts for youth development into two key areas: youth entrepreneurship and sports.
COMMUNITY DEVELOPMENT
We reached 700,000 young people with our projects
in 2017

28 CCI SUSTAINABILITY REPORT 2017
3.2.1. Move! In Kazakhstan
Coca-Cola İçecek’s award-winning legacy program 3.2.1 Move! has reawakened enthusiasm in the development of thousands of youth since its inception in 2013. The program continues to grow as newly formed youth leaders spread it throughout the community and creates impact in their local communities.
The program was expanded to Kazakhstan in 2014, as experts visited Almaty and Akmola regions to conduct a large-scale study regarding the conditions of schools and children. Holding meetings with teachers and discussing with students, the experts concluded that the materials and technical equipment of the schools were insufficient, hence demotivating
students from an active and healthy lifestyle. Evaluating the results of the research, we conducted a competition, the Best School Sports Project, which covered 19 schools from low-income rural areas. We delivered sports equipment, board games and gymnastic exercises to these schools and repaired 3 gymnasiums, allowing 3,000 students to benefit from the renovation of sports facilities and donation of sports equipment. In addition, we focused on helping PE teachers develop their professional capacities, meanwhile introducing creative and innovative learning methods. So far, more than 40 physical education teachers have been trained within the scope of the project.
In 2017, within the framework of the 3.2.1 – Move! project, young people aged 17 to 22 received substantial help in implementing socially meaningful projects through entrepreneurial activities. With this project, identification and support of youth initiatives aimed at solving specific social and environmental problems in various regions of the country have been supported.
In 2017, 80 applications were received from all over Kazakhstan, and the best 10 applications were selected for participation in the semifinal. All the finalists were trained in business planning, online sales, marketing and PR strategies, financial literacy and presentation skills. The authors of the 3 best projects received financing in amount of 1 million tenge.
COMMUNITY DEVELOPMENT

SUSTAINABILITY IN REVIEW 29
Physical Education Teachers Take the Lead in Turkey
3.2.1 Move! set out to transform public schools into habitats that effectively foster students’ physical and personal development through local projects developed and executed by Physical Education (PE) teachers. Between 2013 and 2017, 3.2.1 Move! supported 152 PE
teachers from 131 public schools in 15 provinces in Turkey, mainly by creating and renovating sports facilities and providing sports equipment for students. The projects reached more than 125,000 young people through sports and group activities. 3.2.1 Move! participants
actively practice 30 different kinds of sports at school and have so far formed 538 new school teams. 82% of the participants express that they felt more fit, self-confident and happier.
COMMUNITY DEVELOPMENT

30 CCI SUSTAINABILITY REPORT 2017
Coca-Cola Turkmenistan Grassroots Football TournamentJointly organized every year by Coca-Cola, the Football Federation of Turkmenistan, Turkmenistan Sports Committee and the Ministry of Education, the Coca-Cola Turkmenistan Grassroots Football Tournament took place between April and June. Around 110,000 children from 1,874 schools from across the country participated in the tournament.
COMMUNITY DEVELOPMENT

SUSTAINABILITY IN REVIEW 31
The Olympic Moves ProgramThe Program was launched in December 2015 in Azerbaijan with the collaboration of Coca-Cola, the National Olympic Committee of Azerbaijan, the Ministry of Education and the Ministry of Youth and Sport, with the mission to increase sports participation in youth and foster healthier, happier and more active communities. Until the end of 2017; 100,000 youngsters participated in the program in 4 cities and in 4 sports, which are athletics, biking, swimming and basketball.
COMMUNITY DEVELOPMENT

32 CCI SUSTAINABILITY REPORT 2017
Copa Coca-Cola Football TournamentThe 5th season of Copa Coca-Cola grassroots football tournament took place in Iraq. The tournament brought together more than 300 schools from seven provinces and more than 2,400 students.
COMMUNITY DEVELOPMENT

SUSTAINABILITY IN REVIEW 33
3.2.1 Move!Projects reached more than 125,000 young people through sports and group activities.
COMMUNITY DEVELOPMENT

34 CCI SUSTAINABILITY REPORT 2017
Women EmpowermentTo foster women’s entrepreneurial potential is an excellent way for communities to prosper. Yet, women still constitute a fraction of the global labor force. Our efforts focus on offering women access to business skills training courses, financial services and connections with peers and mentors. As a sign of our commitment to this cause, we have been a signatory to the Women’s Empowerment Principles (WEP) since March 2015.
COMMUNITY DEVELOPMENT
103-1

SUSTAINABILITY IN REVIEW 35
My Sister Program
COMMUNITY DEVELOPMENT
My Sister Project, which has made a considerable difference in the lives of participants, is a part of the 5By20 initiative launched by The Coca-Cola Company with the goal to economically empower 5 million women entrepreneurs by 2020.
This project, in Turkey, where woman labor force participation is in decline,
offers women platforms where they can improve their business skills and gain competence via training and consultancy programs. TCCC partners up with Boğaziçi University, with the support of the Union of Chambers and Commodity Exchanges of Turkey, governorships, and municipalities in the project cities.
As of end of 2017, My Sister Project has reached over 2,000 women, including ladies from a variety of backgrounds, including housewives, engineers, entrepreneurs and university students.

36 CCI SUSTAINABILITY REPORT 2017
The Coca-Cola Belestery ProgramLaunched in 2013, The Coca-Cola Belestery Program in Kazakhstan partners with the Coalition for Green Economy and Development of G-global, and the Social Dynamics Public Fund and aims to develop entrepreneurship among women in Kazakhstan. The program provides business skills training and technical support to women in Almaty and Astana on how to start and effectively run a business specifically using green technologies.
In 2017; 2,050 women from the regions of Akmola, Almaty and Karaganda were provided with business training and presented their business ideas on issues such as cultivation of agricultural and bakery products and furniture manufacturing. The program also provided grants to 10 women to be used in realizing their business concept.
COMMUNITY DEVELOPMENT

SUSTAINABILITY IN REVIEW 37
UNDP Women’s Empowerment ProgramCCI Azerbaijan has partnered with the United Nations Development Program (UNDP) Azerbaijan since 2014 to sponsor the Economic and Social Empowerment of Young Women. The project aims to create opportunities for women and youth to participate in economic and social life.
The program offers trainings such as business development and effective communication and presentation skills as well as awareness raising activities to help reduce gender stereotyping. The program also provides in-kind contribution to disabled women eager to start their own businesses. As part of the program, Women’s Resource Centers have been established in Neftchala and Salyan. 700 women were trained at these centers.
COMMUNITY DEVELOPMENT

38 CCI SUSTAINABILITY REPORT 2017
The Zarya ProjectCCI Pakistan initiated the project Zarya with the objective of empowering women in the workplace and society. As the first phase of Zarya, the Zeenat Gari project was launched to provide microfinance opportunities to disadvantaged women in Pakistan.
CCI Pakistan initiated the second phase of the project in 2016, which is called Tabeer Stores. Tabeer Stores provide microfinance to disadvantaged women to set up and run small grocery stores. 3 more Tabeer stores have been added to the stores in 2017 and those bring the total number to 13.
COMMUNITY DEVELOPMENT

Water access for 850,000+
individuals
10-15% decrease in the outbreak of
diseases
25 filtration plants 15 million liters of safe drinking water
PAANI PROJECT
SUSTAINABILITY IN REVIEW 39
Water Stewardship
Access to clean drinking water is a major problem in today’s world. We attach particular importance to water related issues, since water problems directly affect the welfare of the communities where we operate and the sustainability of our business.
Access to clean drinking water is a significant health concern in our geography. In Pakistan, we have been running our Paani Clean Water project in collaboration with the World Wildlife Fund (WWF).
Paani – Safe Water Initiative
Access to safe drinking water in Pakistan is a critical issue. A report by Pakistan Council of Research in Water Resources (PCRWR) reveals that 44% of the total population in Pakistan is without access to safe drinking water. Furthermore, UNICEF reports that patients with water-related diseases occupy 20-40% of hospital beds in Pakistan. Another publication by Pakistan’s Waters at Risk states that 33% of deaths in Pakistan are due to water borne diseases - typhoid, cholera, dysentery and hepatitis.
Addressing the safe drinking water needs of our communities, CCI Pakistan set up its first filtration plant in Malir, Karachi in collaboration with Rotary International Pakistan. The second plant was installed at Lari Adda, Lahore in collaboration with the Clean Water Trust.
In addition, two plants in Rahimyar Khan were installed under the banner of the Clean Water Trust. Each plant has the capacity to produce over 2,000 liters per hour and serve a community of over 20,000 people every day.
In keeping with our objective to provide safe drinking water, CCI Pakistan launched the Paani – Safe Water Initiative in 2015 with the aim of providing clean water to more than 850,000 people across Pakistan by the end of 2017. The project was launched and implemented in collaboration with WWF Pakistan. A total of 25 plants have been set up over the course of three years. Extensive community outreach and mobilization activities have also been conducted in the targeted areas informing people about the importance of safe drinking water and its appropriate usage.
COMMUNITY DEVELOPMENT
203-1
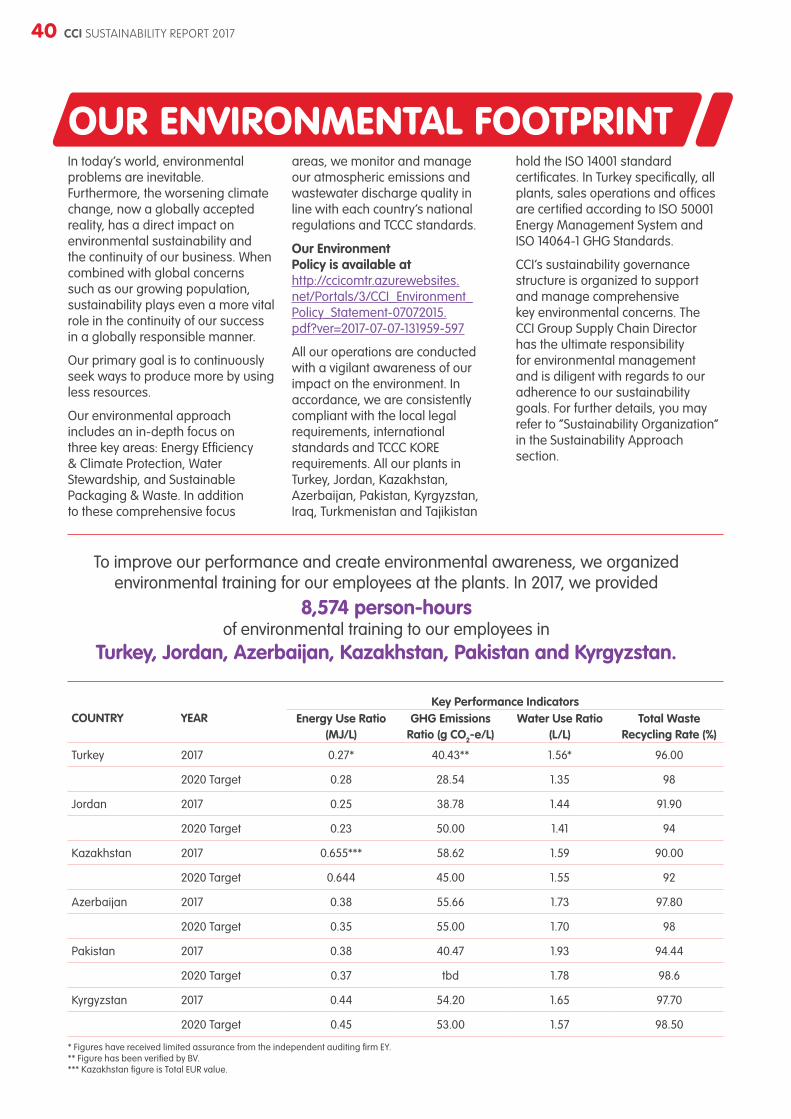
40 CCI SUSTAINABILITY REPORT 2017
In today’s world, environmental problems are inevitable. Furthermore, the worsening climate change, now a globally accepted reality, has a direct impact on environmental sustainability and the continuity of our business. When combined with global concerns such as our growing population, sustainability plays even a more vital role in the continuity of our success in a globally responsible manner.
Our primary goal is to continuously seek ways to produce more by using less resources.
Our environmental approach includes an in-depth focus on three key areas: Energy Efficiency & Climate Protection, Water Stewardship, and Sustainable Packaging & Waste. In addition to these comprehensive focus
areas, we monitor and manage our atmospheric emissions and wastewater discharge quality in line with each country’s national regulations and TCCC standards.
Our Environment Policy is available at http://ccicomtr.azurewebsites.net/Portals/3/CCI_Environment_Policy_Statement-07072015.pdf?ver=2017-07-07-131959-597
All our operations are conducted with a vigilant awareness of our impact on the environment. In accordance, we are consistently compliant with the local legal requirements, international standards and TCCC KORE requirements. All our plants in Turkey, Jordan, Kazakhstan, Azerbaijan, Pakistan, Kyrgyzstan, Iraq, Turkmenistan and Tajikistan
hold the ISO 14001 standard certificates. In Turkey specifically, all plants, sales operations and offices are certified according to ISO 50001 Energy Management System and ISO 14064-1 GHG Standards.
CCI’s sustainability governance structure is organized to support and manage comprehensive key environmental concerns. The CCI Group Supply Chain Director has the ultimate responsibility for environmental management and is diligent with regards to our adherence to our sustainability goals. For further details, you may refer to “Sustainability Organization” in the Sustainability Approach section.
OUR ENVIRONMENTAL FOOTPRINT
To improve our performance and create environmental awareness, we organized environmental training for our employees at the plants. In 2017, we provided
8,574 person-hours of environmental training to our employees in
Turkey, Jordan, Azerbaijan, Kazakhstan, Pakistan and Kyrgyzstan.
* Figures have received limited assurance from the independent auditing firm EY.** Figure has been verified by BV.*** Kazakhstan figure is Total EUR value.
COUNTRY YEARKey Performance Indicators
Energy Use Ratio (MJ/L)
GHG Emissions Ratio (g CO2-e/L)
Water Use Ratio (L/L)
Total Waste Recycling Rate (%)
Turkey 2017 0.27* 40.43** 1.56* 96.00
2020 Target 0.28 28.54 1.35 98
Jordan 2017 0.25 38.78 1.44 91.90
2020 Target 0.23 50.00 1.41 94
Kazakhstan 2017 0.655*** 58.62 1.59 90.00
2020 Target 0.644 45.00 1.55 92
Azerbaijan 2017 0.38 55.66 1.73 97.80
2020 Target 0.35 55.00 1.70 98
Pakistan 2017 0.38 40.47 1.93 94.44
2020 Target 0.37 tbd 1.78 98.6
Kyrgyzstan 2017 0.44 54.20 1.65 97.70
2020 Target 0.45 53.00 1.57 98.50

SUSTAINABILITY IN REVIEW 41
Priority Areas 2017 Goals Performance in 2017 Status 2018 Goals
Energy Efficiency
To achieve the following energy use ratios:Our EUR performances are as follows:
To achieve the following energy use ratios:
Turkey : 0.27 MJ/L 0.27 MJ/L Achieved0.299 MJ/L – total energy 0.262 MJ/L – core operations
Jordan : 0.28 MJ/L 0.25 MJ/L Achieved 0.24 MJ/L – total energy
Kazakhstan : 0.44 MJ/L 0.44 MJ/L Achieved0.58 MJ/L – total energy 0.36 MJ/L – core operations
Azerbaijan : 0.37 MJ/L 0.38 MJ/L Underachieved0.67 MJ/L – total energy 0.37 MJ/L – core operations
Pakistan : 0.41 MJ/L 0.38 MJ/L Achieved0.39 MJ/L – total energy 0.38 MJ/L – core operations
Kyrgyzstan : 0.46 MJ/L 0.44 MJ/L Achieved0.66 MJ/L – total energy 0.47 MJ/L – core operations
To expand the Behavioral Energy Efficiency program in Turkey and other countries of operation.
The program expanded in Turkey and other countries of operation.
Achieved
Climate Protection
For CCI plants to achieve a carbon emissions ratio of:Our carbon emissions ratio performances are as follows:
Our target is to achieve a carbon emissions ratio
Turkey : 26.60 CO2 g/L In parallel with EUR
Jordan : 44.80 CO2 g/L In parallel with EUR
Kazakhstan : 52.00 CO2 g/L Achieved In parallel with EUR
Azerbaijan : 60.24 CO2 g/L In parallel with EUR
Pakistan : 37.28 CO2 g/L In parallel with EUR
Kyrgyzstan : 34.92 CO2 g/L Achieved 28.00 CO2 g/L
To ensure that 100% of all newly purchased cooler equipment is HFC-free by the end of 2017.
96.84% of newly purchased cooler equipment is HFC-free.
UnderachievedTo ensure that 95% of newly purchased cooler equipment is HFC-free by the end of 2018.
To increase EMD-equipped coolers to 89%.We increased our EMD-equipped coolers to 90% of the total in Turkey.
AchievedTo increase our EMD-equipped coolers to 90.5 % of the total in Turkey.
Water Management and Stewardship
To achieve a water use ratio of: Turkey : 1.44 L/L Jordan : 1.67 L/L Kazakhstan : 1.63 L/L Azerbaijan : 1.80 L/L Pakistan : 1.83 L/L Kyrgyzstan : 1.80 L/L
We achieved: 1.56 L/L 1.44 L/L 1.59 L/L 1.73 L/L 1.93 L/L 1.65 L/L
Underachieved Achieved Achieved Achieved
Underachieved Achieved
To achieve a water use ratio of: 1.48 L/L 1.43 L/L 1.57 L/L 1.72 L/L 1.86 L/L 1.64 L/L
To conduct SVA study in our Karachi, Faisalabad, Gujranwala, Bishkek and Erbil plants.
We conducted SVA study in our Karachi, Faisalabad, Gujranwala, Bishkek and Erbil plants.
AchievedTo conduct SVA study in our Hazar, Ashgabat plants.
Packaging and Waste
To achieve a total waste ratio of: Turkey : 4.97 g/L Jordan : 2.27 g/L Kazakhstan : 1.91 g/L Azerbaijan : 0.96 g/L Pakistan : 9.93 g/L Kyrgyzstan : 3.65 g/L
We achieved: 4.77 g/ 1.35 g/L 1.60 g/L 1.17 g/L 10.77 g/L 2.93 g/L
Achieved Achieved Achieved
Underachieved Underachieved
Achieved
To achieve a total waste ratio of: 4.31 g/L 1.35 g/L 1.56 g/L 1.00 g/L 11.48 g/L 2.90 g/L
To continue assessing opportunities to reduce resin and glass used in the packaging we use.
We saved 1,740 tons of resin and 1,267 tons of glass in Turkey.
Achieved
To continue assessing opportunities to reduce resin and glass used in the packaging we use.
To continue conducting feasibility studies for implementing Lightweight projects in Pakistan.
We conducted feasibility studies for implementing Lightweight projects in Pakistan.
AchievedTo implement Lightweight projects at 1 L and 1,5 L Fanta, 750ml full set resin and 250 ml glass bottle.
To continue to produce all 1 L Damla water bottles in Turkey using PlantBottle resin.
We produced all 1 L Damla water bottles in Turkey using PlantBottle resin.
AchievedTo continue to produce all 1 L Damla water bottles in Turkey using PlantBottle resin.
Environmental Compliance
100% compliance with legal environmental limits and TCCC’s standards.
No fine is received. Achieved100% compliance with legal environmental limits and TCCC’s standards.
Sustainable Sourcing
In 2017, we will organize a workshop with TCCC regarding sustainable agriculture project and conduct feasibility study for this project.
The project did not start with TCCC.
Underachieved
Goals and Commitments
Note: Fines of USD 200,000 are deemed significant by CCI.
OUR ENVIRONMENTAL FOOTPRINT

Reducing energy use and GHG emissions in our manufacturing operations, manufacturing and sales offices by implementing energy efficiency programs;
1Reducing logistics-based direct emissions with effective fleet and fuel management and optimization practices;
2 3
Promoting climate protection awareness by engaging with our stakeholders in climate change platforms;
6Calculating, verifying and reporting accurate carbon footprint of our operations;
5Increasing awareness on climate protection by collaborating with our distributors, dealers, suppliers and other stakeholders;
4
Calculating the carbon footprint of our products in line with a life-cycle approach;
7Researching and investing in clean and renewable energy where possible;
8Investigating opportunities and conducting a feasibility study to supply sustainable sources.
9
Reducing indirect emissions by focusing on our climate friendly refrigeration programs;
We supply energy needs of lighting and our post mix
line in our İzmir Plant from 100% clean energy
resources.
We increased our EMD-equipped coolers to
90% of the total in Turkey.
We saved approximately 31 Million MJ energy
and reduced 3,305 tons of CO2 with efficiency
projects in our plants in six countries of operation.
With our EMD program, we saved approximately 468
million kWh electricity in six countries of operation. We achieved 78,711 tons of
CO2 that 6.6 million trees annually extract from
the atmosphere.
42 CCI SUSTAINABILITY REPORT 2017
Energy Management and Climate Protection
Attention to climate change and its effects on the world’s ecosystems continue being at the forefront of responsible business practices. As one of the most critical global problems, climate change creates significant risks for all of us. CCI joins the global business community
in implementing the necessary changes to combat these risks.
Energy efficiency and climate protection is one of our three priorities in our sustainability strategy. We recognize that climate change may have medium term
direct and indirect implications for our business, supply chain and communities. These potential effects raise the need for immediate action. Burning fossil fuels for energy (electricity, heat and logistics) is one of the largest sources of human-caused GHG emissions.
OUR ENVIRONMENTAL FOOTPRINT
The focus areas of our energy efficiency and climate protection strategy are:
Throughout the CCI operations, we calibrate reduction targets that directly and indirectly impact energy use and GHG emissions and track our performance. We also systematically seek measures to reduce our energy consumption
and related GHG emissions in our value chain (packaging, manufacturing, transportation and cooling processes) and implement GHG reduction programs, while improving operational efficiency and quality to achieve our goals.
These efforts require both national and international coordination as we aim to work in collaboration with adherence to the global efforts for climate protection.
201-2; 103-1; 302-5

We supply energy needs of lighting and our post mix
line in our İzmir Plant from 100% clean energy
resources.
We increased our EMD-equipped coolers to
90% of the total in Turkey.
We saved approximately 31 Million MJ energy
and reduced 3,305 tons of CO2 with efficiency
projects in our plants in six countries of operation.
With our EMD program, we saved approximately 468
million kWh electricity in six countries of operation. We achieved 78,711 tons of
CO2 that 6.6 million trees annually extract from
the atmosphere.
SUSTAINABILITY IN REVIEW 43
OUR ENVIRONMENTAL FOOTPRINT
CCI Mersin Plant Receives Efficiency AwardCCI Mersin plant receives the second prize in the Midsize Enterprises category with its Tetra Lines Automatic Pallet Truck System project at the 2017 Efficiency Projects Competition organized by the Turkish Ministry of Science, Industry and Technology.
In 2017, we saved 4.57 Million MJ energy and reduced 661 tons of CO2 throughout our efficiency projects and the OE Program conducted in CCI Turkey Operations.
The Behavioral Energy Efficiency Program
Investigating, creating new approaches and promoting effective change are all foundational to TCCC’s Behavioral Energy Efficiency Program (Energy Excellence). This program is designed with staff awareness and culture at its core, and aims to reveal the ways in which the CCI system affects personal interactions and behaviors related to work and the workplace. Indeed, our individual relationship to systems, technology, procedures, and our perceptions of that relationship
have a direct impact on productivity, collaborative efforts and success. Our goal is to extend beyond the Energy Efficiency Top 10 by promoting a company roadmap that is holistic in its approach to “Energy Excellence” and helps spread a sense of ownership and accountability of this central issue. In 2017, the program has been replicated in all 21 CCI plants in 10 countries. The effects and savings of the program will be calculated during 2018.
302-5

0.260.27 0.25
0.27
1.12
0.33 0.30.25
0.72
0.41
0.55
0.44
0.67
0.37 0.37 0.38
0.480.4
0.38
0.480.44
2006 2015 2016 2017
Turkey Jordan Kazakhstan Azerbaijan Pakistan Kyrgzystan
Energy Management FiguresEnergy Use Ratio (MJ/L)
Improvements in Core EURs between 2006 and 2017 (MJ/L)
2006 2015 2016 2017
TCCC*
0.49
Kyrgyzstan***
0.48
0.44
Pakistan***
0.48
0.38
Azerbaijan
0.38
0.67
Jordan
0.25
1.12
Kazakhstan
0.440.
72
Turkey**
0.27
0.26
*2017 value for TCCC has not yet been disclosed at the time of publishing this report.**The Isparta plant in Turkey is put into service in 2017, which cause a rise in EUR.*** Pakistan and Kyrgyzstan data were included in the sustainability report in 2015 and 2016 respectively.
44 CCI SUSTAINABILITY REPORT 2017
OUR ENVIRONMENTAL FOOTPRINT
302-5

SUSTAINABILITY IN REVIEW 45
OUR ENVIRONMENTAL FOOTPRINT
Our Carbon FootprintSustainability performance of our business is closely related to our sourcing, packaging, manufacturing, distribution and refrigeration processes. To decrease the carbon emissions created during these processes, we employ several practices.
Transport and Distribution
We transport millions of goods and products from our suppliers to our plants, and from our plants to our customers and distributors.
Our business success is dependent on a broad and thorough logistics network that balances efficiency and energy reduction. As such, optimization of distribution is crucial to our business performance. Transportation accounts for about 16.5% of the total direct GHG
emissions of our value chain.
Addressing the issue twofold, we aim to reduce the number of vehicles in transit and the kilometers travelled. For this purpose, we choose vehicles that consume less fuel and emit less carbon. Our Route Optimization Project” is in line with this specific objective. Via the platform “Road Net,” developed for our Turkey operations in 2013, 65 distributors and 5 direct distribution
points in Turkey have used this platform to date. We continued our Road Net program in 2016, which reduces driving by 1.35 million kilometers, meaning approximately 1,050 tons less GHG emissions and a fuel savings of $650,000 every year. Combined with the “Reduce the Carbon Footprint in The Drink in Your Hand by 25%” program, we have furthered our intention to decrease fleet emission.
Cooling Practices
It goes without saying that refrigeration greatly improves our consumers’ enjoyment of our products. Again, with regards to protecting the environment, we need to create a balance between our efforts to please our customers and our responsibility to decrease our environmental footprint. As of 2017 year-end, we have approximately 333.000 cooling devices in Turkey. As we invest in technologically developed cooling devices, we also reduce our climate change impact.
Cooling equipment accounts for approximately 43.5% for our total operations. For new cooling equipment purchases, we switched to HFC-free equipment that contains refrigerant gases with low global warming potential, we upgrade existing equipment to the energy efficient technology, and we continue to work with suppliers to innovate and develop climate-friendly cooling technologies. We continue to reach beyond our current efforts as we collaborate with suppliers to develop
new technologies to be used in cooling operations. Within this reporting period alone, we collected and disposed of 38,542 old cooling equipment.
Effective since 2009, our Energy Management Device (EMD) Program is another feature from which we are able to address our cooling equipment’s environmental footprint. By using EMD equipped coolers, we were able to reduce energy consumption by 42%. Also, new coolers (larger than 250-liter capacity) with EMD capacities were purchased as part of the program. By 2017 year-end we have 90% EMD ratio in our Turkey operations (Please see the Performance Indicators section of the report for detailed data on EMD ratios for six countries of the reporting scope). In 2017, this program allowed us to save approximately 459 million kWh electricity in Turkey. EMD ratio increased to 90%, which resulted in 77,156 tons of CO2 reduction for CCI Turkey operation.
Between 2009 and 2017 our EMD program in Turkey resulted in a total energy savings of about 2.440 Million kWh (equal to the annual energy consumption of 420,011 Turkish households) and a total reduction of approximately 991,056 tons of CO2 emissions (equal to the amount of CO2 extracted from the atmosphere annually by 82.6 million trees).
With EMD Program, we aim to prevent the emissions of 1.75 million tons CO2 gas between 2010-2020.
At CCI Turkey operations, we have been purchasing coolers with LED lights since 2012. By the end of 2012,11% of our coolers were equipped with LED lights. In 2017, 100% of our newly purchased coolers are equipped with LED lights, bringing our overall ratio to 40%. Today, every eight out of 20 coolers have LED lighting. With this strategy, we will keep increasing our ratio and minimizing our energy consumption.
With EMD program across CCI, we achieved 79,000 tons of CO2 reduction, which equals the amount of CO2 extracted f rom the atmosphere annual ly by 6,6 mi l l ion trees.
302-5; 305-1; 103-1

51,602 63,346 176,386 291,334
2183,738
17,943
21,898
14,05322,717
43,800
80,570
3,0386,694
12,068
21,800
22,682
48,562
284,649
355,893
2,0242,024
2,8662,866
2,6432,643
7,5337,533
Scope 1 Scope 2 Scope 3* TOTAL
Turkey Jordan Kazakhstan Azerbaijan Pakistan KyrgzystanKyrgzystan
2017 Emissions by Scope and Region
46 CCI SUSTAINABILITY REPORT 2017
OUR ENVIRONMENTAL FOOTPRINT
Global climate change is directly impacted by HFCs used as refrigerants in coolers. Together with its bottling partners, TCCC has established the goal that 100% of new cold-drink equipment will be HFC-free. Where a commercial HFC-free solution is not currently available, we collaborate with our suppliers to develop alternative HFC-free solutions. This effort is vital: HFC-free coolers when compared to their HFC counterparts have at least 1,000 times less effect on global warming.
Refrigerants in cooling equipment may slowly leak into the atmosphere during use or may leak completely if the equipment is not properly disposed of at the end of its life cycle. CCI always ensures that coolers are properly emptied of any gases. By the end of 2017, 63% of the coolers we use in Turkey were HFC-free. Due to our use of HFC-free cooling equipment, we managed to reduce our total fugitive CO2 emissions by 11,637 tons between 2009 and 2017.
With our climate-friendly studies in six countries of operations, we achieved 1,078,711 tons of CO2 emissions reductions equivalent to approximately 89 million trees extracted from atmosphere since 2009.
Emissions by Regions
Our absolute emissions in six countries of operation decreased from 973,954 tons to 779,028 tons of CO2 in 2017. In addition to monitoring total emissions for each country of operation, we also monitor our GHG emissions ratio, which represents grams of CO2-e per liter of product produced. A table providing a detailed overview of our GHG emissions for the six countries of operation is provided in the “Performance Indicators” section.
Reduce the CO2 Emissions Embedded in the Drink in Your Hand by 25% by 2020
The Coca-Cola system launched a global initiative in 2013 called “Reduce the CO2 emissions embedded in the drink in your hand by 25% by 2020 aimed at reducing GHG emissions across its entire value chain. In CCI, we are aligning our climate protection target with this overall target in order to achieve comprehensive carbon footprint reductions across our manufacturing processes, packaging formats, delivery fleet, refrigeration equipment and ingredient sourcing. This is a comprehensive approach, since the goal covers Scope 1, 2 and 3 emissions. Our goal for Turkey operations is to reduce our GHG emissions by 2020 covering manufacturing, fleet and cooler functions. In 2017, we decreased this amount by 7.7 % with respect to last year, without considering the decrease in emission factors change in coolers.
302-5; 305-1

51,602 63,346 176,386 291,334
2183,738
17,943
21,898
14,05322,717
43,800
80,570
3,0386,694
12,068
21,800
22,682
48,562
284,649
355,893
2,0242,024
2,8662,866
2,6432,643
7,5337,533
Scope 1 Scope 2 Scope 3* TOTAL
Turkey Jordan Kazakhstan Azerbaijan Pakistan KyrgzystanKyrgzystan
2017 Emissions by Scope and Region
SUSTAINABILITY IN REVIEW 47
OUR ENVIRONMENTAL FOOTPRINT
This year in CCI Turkey Operations; our total Scope 1 emissions increased from 43,777 tons of CO2 to 51,602 tons compared to 2016. Eventhough the fleet emissions decreased, the rise in the emissions due to fugitive gases causes an increase in Scope 1 emissions. We managed to reduce Scope 2 emissions due to electricity use. A remarkable decrease is observed in our Scope 3 emissions owning to our climate change mitigation, emission reduction activities and change in methodology. Emissions from coolers at our distributors and customers are the main cause for the decline.
For more accuracy in GHG Inventory calculations, change in methodology in Scope 3 is as follows:
• Emissions from coolers; Scope 2 emission factor, which is 0.441 kg CO2e / kWh, was being used for the calculation of the emissions resulting from electricity use until 2017. In 2017, Scope 3 emission factor for electricity consumption, which is 0.168 kg CO2e / kWh, is started to be used in relevant calculations.
• Employee commuting; employee commuting is provided by minibuses. Therefore, emission factor for minivans (DEFRA) is started to be used, which is more appropriate.
• Business travel; CCI put great effort to minimize the emissions caused by business air travel. There is no change in methodology, the reduction is
directly connected to the decrease in miles traveled.
• Downstream transportation; GHG emissions sourced from leased trucks used in distribution is added to downstream transportation in 2017.
Consequently, our absolute emissions in Turkey decreased from 522,431 tons to 291,334 tons in 2017.
Our absolute emissions in six countries of operation decreased from 973,954 tons to 779,028 tons of CO2 in 2017.
A table providing a detailed overview of our GHG emissions for the six countries of operation is provided in the “Performance Indicators” section.
GHG Emissions in Turkey (tons CO2-e) 2013 2014 2015 2016 2017
Scope 1
Stationary combustion emissions 14,517 14,283 16,218 14,896 17,045
Fleet emissions 15,145 16,012 9,378 8,241 7,687
Fugitive emissions 19,555 17,123 26,566 20,634 26,869
TOTAL 49,217 47,418 52,162 43,770 51,602
Scope 2
Emissions (electricity) 62,877 61,359 60,370 64,291 63,346
TOTAL 62,877 61,359 60,370 64,291 63,346
Scope 3
Cooler Emissions 328,628 321,162 299,264 369,679 126,734
Employee commuting 1,314 1,157 1,621 1,130 177
Business travel 9,668 4,733 5,241 4,321 1,347
Downstream transportation 37,415 33,385 38,533 39,240 48,128
TOTAL 377,025 360,437 344,659 414,37 176,386
OVERALL TOTAL 489,119 469,214 457,191 522,431 291,334
Our GHG Emissions in Turkey operations for the last 5 years are as follows:
302-5; 305-1

48 CCI SUSTAINABILITY REPORT 2017
OUR ENVIRONMENTAL FOOTPRINT
Emission savings in Turkey (t CO2-e) Scope 2014 2015 2016 2017Product distribution fleet improvement Scope 1 366 2,075 0 0
Fugitive emission reductions of coolers Scope 1 299 145 2,651 7,782
Energy efficiency and low-carbon projects in plants
Scope 1+2 2,030 1,402 80,289 661
Route optimization Scope 3 1,050 1,050 1,050 1,400
Cooler EMD improvement Scope 3 175,000 172,315 217,915 77,156
IT Improvement Scope 3 840
TOTAL Scope 1+2+3 178,745 176,987 301,905 87,839
In addition to reducing the absolute emissions, we performed optimization to increase savings. As a result of efforts put into practice, in 2017, we achieved a GHG reduction of 87,839 tons of CO2 in Turkey resulting from emission reduction activities in cooling and manufacturing operations.
302-5; 305-1; 305-5

Above figures are 2017 figures of 6 countries of operation.
We recycle and reuse the water in our production
processes.
Volume of Water Recycled and Reused (m3)
537,481 m3
We strive to reduce our overall water withdrawal.
Our TotalWater Withdrawal
9,321,826 m3of water
We consistently decrease the amount of water used for producing one liter of
product.
Our Water Use Ratio
1.71L/L
We replenish the amount of water equivalent to our product volume.
Water Replenishment
Rate (%)Turkey
150%TCCS 2020 Objective
100%Eurasia
69%
SUSTAINABILITY IN REVIEW 49
Water ManagementWater is one of the most critical natural resources. It is also the main ingredient of our products and a vital element of our production processes. Since water resources have been affected by overuse, increasing demand and climate change, it has become a global issue that needs to be managed consciously. Otherwise, the effects of mismanagement will harm societies, businesses and life for all.
There is a direct link between sustainable use of water and the sustainability of our business. Therefore, minimizing our impacts on water and sustaining water efficient operations is of the highest priority and we fully support
TCCC’s ultimate goal of “replenish every drop of water we use.” Our strategies in water management are summarized below:
• Improving the overall water-use efficiency in our plants;
• Implementing Source Vulnerability Assessment and Source Water Protection studies to protect water catchment basins in the regions where our plants are located;
• Managing wastewater and stormwater discharge in our plants (achieving 100% compliance in wastewater treatment);
• Mitigating risk for communities and for our business by
partnering with governments, NGOs and communities to assess, understand and generate effective, long-term water stress solutions, and implement source water protection plans;
• Replenishing the water we use back to the nature by implementing locally relevant programs;
• Researching and investing in new technologies to reduce water consumption;
• Investigating opportunities and conducting feasibility study to supply sustainable sources.
OUR ENVIRONMENTAL FOOTPRINT
103-2

50 CCI SUSTAINABILITY REPORT 2017
According to a study conducted by Turkey’s State Hydraulic Works, the amount of annual total usable water in Turkey is 112 billion m³, of which five billion m³ is used in industry.
CCI Turkey Operations accounts for 0.0044 billion m³, or only 0.089% of Turkey’s industrial water usage. (Source: www.dsi.gov.tr/toprak-ve-su-kaynaklari ).
CCI’s water resources are wells, spring water and municipal water systems. Spring water is only used in Turkey.
We submitted our fourth annual report to the 2017 CDP Turkey Water Program describing our water strategy, disclosing our SVA study summary update, the results of water risk assessments, and the data on our water withdrawal, discharge and consumption. We received a “B” assessment score by CDP with our fourth report. We will be submitting our fifth report to the CDP Water Program in 2018.
Plant Water Use & Minimization
Our total water withdrawal amounted to 9,321,826 m³ in six countries of operation included in the reporting scope, which was 8,792,859 m³ in the previous year. Detailed data on the total water withdrawal for the last five years is provided in a table in the Environmental Performance Indicators section of the report.
Another important indicator we monitor is the amount of water used for producing one liter of
product. Accordingly, we set water use reduction targets based on this KPI and closely monitor our performance.
Our 2020 goal for CCI Turkey Operations is to achieve 1.35 liter use per liter product in our Turkey operations. In 2017, our water usage ratio is realized as 1.56 L/L.
Since 2006, there has been a 22.7% improvement in Coca-Cola’s water efficiency on a global basis until
2016. At CCI operations, we started water reduction activities in 2006.
We have improved our water efficiency by 10.3% in CCI Turkey Operations, 58.1% in Jordan, 24.3 % in Kazakhstan and 17.6 % in Azerbaijan during 2006-2017, thanks to the efficiency projects put in practice in our plants.
Improvements between 2006-2017 for operations within the reporting scope are presented below.
In all CCI plants, we develop, invest and implement water saving programs every year in line with OE Culture. Some of the top water saving programs in 2017 include yield increase in boilers and production lines in Kazakhstan; reject water re-uses, treated water
flushing for temperature control, automatic valve installation in washers, reduce water waste in conveyor lubricant system in Pakistan; elimination of leakages in the plants in Kyrgyzstan and Turkey; optimization of water consumption during CIP in Azerbaijan.
In support of our commitment to water sustainability, the “Top 10 Water Saving Program” is designed to reduce water usage in our production facilities and aims to support the continuous improvement in manufacturing plants regarding water use ratio. All CCI plants completed the program.
Improvements in WURs Between 2006 and 2017 (L/L) **
Kyrgyzstan***
1.651.8
8
Pakistan***
1.93
2.03
*2017 value for TCCC has not yet been disclosed at the time of publishing this report.**The Isparta plant in Turkey is put into service in 2017, which causes an increase in WUR.*** Pakistan data is from 2015 and Kyrgyzstan data is from 2016.
Azerbaijan
2.1
1.73
Kazakhstan
2.1
1.59
Jordan
3.44
1.44
Turkey**
1.74
1.56
TCCC*
1.962.
56
2006 2015 2016 2017
Post-consumer packaging recycling rate by years in Turkey
37% 42% 54%40% 48% 52%38% 44% 60%
2010 2011 2012 2013 2017 2020Target2014 2015 2016
CCI Turkey Operations received the “Waste Management Award”in 2017 for its 2016 recycling performance of packag-ing waste and waste management achievements in the FMCG sector. As a member of ÇEVKO, CCI became the 2nd Company in Turkey in waste collection, recycling and recovery, achieving 52% packaging waste recovery in 2016.
Waste Management Award for CCI:
Improvements in Total Waste Recycling Rate Between 2006 and 2016
Kyrgyzstan**
97.7
0
98.10
Pakistan**
94.4
4
70.5
4
Kazakhstan
90.0
0
94.6
7
Azerbaijan
97.8
0
75.5
5
Turkey*
90.9
9
96.0
0
Jordan81
.60
91.9
0
*Pakistan data was included in the sustainability report in 2015 and Kyrgzystan data was included in 2016 report.**Pakistan data is from 2015 and Kyrgyzstan data is from 2016.
2006 2015 2016 2017
OUR ENVIRONMENTAL FOOTPRINT
SUSTAINABILITY IN REVIEW 51
Source Water Vulnerability Assessment
The water we use in our products and our production processes is drawn from local water sources. As part of our water stewardship program, we conduct a local source vulnerability assessment (SVA) and develop Source Water Protection Plan (SWPP) to source water responsibly, mitigate water-related risks to our System and to the communities we serve.
SVAs allow us to assess vulnerabilities to community sources of water and help us to determine potential impacts of our water usage and wastewater discharge.
This assessment is conducted every five years in all CCI plants. As of December 31, 2016, all CCI plants had completed their SVA studies in all countries of operation. The second cycle of SVA study began in 2016 and continued in 2017. The cycle will be completed in all CCI operations by 2020.
During any SVA study, an analysis of water basins and sub-basins around our plants is conducted, and it includes the topographical, geological, hydro-geological and hydrological assessment of the study areas as well as identification
of any risks to the sustainability of water resources within these areas. SVA studies include processes such as field surveys, interviews with plant authorities or site representatives, interviews with local and national authorities as well as desktop studies. These assessments inventory the social, environmental and political risks to the water sources supplying our facilities and surrounding communities. We evaluate the results of these studies with a SWPP and take action on a plant-by-plant basis.
CCI Receives Water Efficiency Award from the Sustainability Academy in Turkey
CCI receives the grand prize in Water Efficiency category at the 4th Sustainable Business Awards in Turkey. The awards are organized every year by the Sustainability Academy to award Turkish companies that apply the most sustainable business models in various fields of activity.
OUR ENVIRONMENTAL FOOTPRINT
303-2; 306-5

CCI Turkey Operations plants minimizes their water consumption by projects inOperational Excellence Culture.
Water Saving ProjectsOur plants have created water map in order to follow water consumption on a daily basis.
Water Map
Replenish Every Dropof WaterWe Used
In 2017, we saved approximately 331,785 m3 of water in the six countries of
total water efficiency operation, where the
investments amounted to approximately $46,087.
331,785 m3
of saving
In 2017, we achieved 11,504 m3
reduction by implementing water saving projects at CCI Turkey Operations plants.
11,504 m3
of savingin Turkey
WaterEfficiencySurvey
2020GOAL
As the water committee set a goal for year 2017. A waterefficiency checklist and a survey conducted in all CCI Turkey Operations plants in order to determine minimization and recovery opportunities.
Investment$46,087
water saving240,000 m3
52 CCI SUSTAINABILITY REPORT 2017
OUR ENVIRONMENTAL FOOTPRINT
306-5

SUSTAINABILITY IN REVIEW 53
OUR ENVIRONMENTAL FOOTPRINT
306-5

TCCC’s Replenishment Goal
The Coca-Cola system aimed for “water neutrality” is defined as:
1. Returning the water we use back to the communities we serve by treating all wastewater and returning it to the environment at a level of purity that supports aquatic life.
2. Replenishing the amount of water equivalent to our product volume through locally-relevant water and sanitation projects.
The Coca-Cola System (TCCS) globally balanced an estimated 100% of the equivalent amount of water used in their finished beverages in 2015. The water replenishment rate for Turkey has reached 150%, equal to about 4,271 million liters of water in the same year. In TCCC’s Eurasia region (which includes CCI’s Turkey, Azerbaijan, Kazakhstan, and Turkmenistan operations but excludes Jordan), the replenishment rate increased to 69%. We will continue replenishment programs in 2017 in local regions (e.g. Sapanca region) through community water projects in line with the results of source water vulnerability assessments (SVA) conducted for each of plants.
Turkey is considered a “nearly waterscarce” country, with an average allowance of only 1,520 m³ of water per person, and more than 70% of the country’s fresh water is being used in agriculture. In this
sense, The Life Plus Environment Program was initiated with the aim to foster a new approach to land and water management in line with adaptation to climate change and decreasing water resources.
Two projects have been conducted under the Life Plus Environment Program: Agriculture of the Future and Harran Night Irrigation. The Program has so far saved 6.7 billion liters of water on 50 million m2 of agricultural land. Some 200,000 saplings were also planted as windbreakers in the Konya basin, and the program has reached 2,500 people, including farmers, NGO representatives, academicians and the local community.
The water replenishment project in Konya initiated by Coca-Cola has a budget of $1.99 million distributed over three years, from 2014 to 2017.
Agriculture of the Future Project
Agriculture of the Future Project has two objectives. The first is to improve the water-holding capacity of soil, ensuring efficient use of land and water. The second is to increase the capacity to use “ecosystem services” in agriculture through direct seeding and windbreaks. The Project was realized in partnership with The Coca-Cola Life Plus Foundation, the Ministry of Food, Agriculture and Livestock, and the Nature Conservation Centre.
Biodiversity Conservation Aspect
The Agriculture of the Future Project aims to promote the “ecosystem services” approach in agricultural practices in order to conserve agricultural ecosystems and biodiversity without reducing the prosperity of the communities. The project’s ecosystem services and biodiversity monitoring activities are summarized below.
Ecosystem Services Approach
Natural ecosystems that directly or indirectly provide various benefits for human welfare are called ecosystem services. Agriculture is a dominant human activity, and agricultural land covers nearly 40% of the world’s total land area. The ecosystem services used by agricultural production can be provisioning (freshwater, genetic biodiversity etc.), supporting (soil structure and fertility) or regulating services (climate regulation, pollination, biological control etc.). In the Agriculture of the Future Project, the aim is to integrate the Ecosystem Approach – a strategy for sustainable management of land, water and living resources – into agricultural activities. The Ecosystem Approach provides tools to minimize the conflicts between nature conservation and economic activities, thus enhancing the sustainability of socio-ecological systems.
Replenish Programs
TCCC began water replenishment programs in 2005, and since then have been working with communities, governments and respected third-parties to commission and support projects that address local water needs from safe water access to watershed protection and water for productive use. These programs have been developed with consideration of the following objectives:
• to improve safe access to water and sanitation;
• to protect watersheds;
• to provide water for productive use;
• to educate and raise awareness about water issues, including engagement on water policy.
OUR ENVIRONMENTAL FOOTPRINT
54 CCI SUSTAINABILITY REPORT 2017 203-1; 306-5
The project is the first of its kind to use such a comprehensive approach in handling socio-economic activities and environmental values together.
As a part of the biodiversity monitoring activities in the project, 43 bird species, 18 plant species, 15 butterfly species, and 10 small mammal species have been observed in the direct seeding areas, wind break zones and control areas. The project also develops environment-friendly solutions to the problems of agricultural production, such as rodent management. As a part of biological pest control scheme, owl and kestrel boxes are placed in farming areas as an
alternative to chemical pesticides used to exterminate the rodents in the fields.
Harran Night Irrigation Project
Harran Plain is one of the agricultural production centers in Turkey. During summer months, irrigation is done at high temperatures, which increases evaporation. In order to reduce the amount of water lost by evaporation, it is important to do irrigation in the early hours of the day, in the evening or at night, rather than during the daytime. Reducing water loss will also minimize environmental problems caused by
over-irrigation, such as salination, fungal diseases and pollution. With the implementation of this project, 4.5 billion liters of water were saved in Harran. In addition, farmers achieved a 15% yield increase. Furthermore, an irrigation management scheme is developed in Geographical Information Systems (GIS) environment for an irrigation union, which is first of its kind. GIS-based water management and night irrigation is now promoted by the Regulation on Water Usage Control in Irrigation Systems and Reduction of Water Losses.
OUR ENVIRONMENTAL FOOTPRINT
SUSTAINABILITY IN REVIEW 55203-1; 306-5

56 CCI SUSTAINABILITY REPORT 2017
Waste Water Management
At CCI we have high standards for the wastewater we discharge in the environment. “Zero wastewater generation and reclamation” defines our wastewater management approach. Not only do we comply with local laws regulating wastewater treatment and discharge in all the countries in which we operate, but we also act in accordance with TCCC’s standards that determine the wastewater pollutant limits for our operations. In many cases the allowed discharge limits set by TCCC are much lower than the limits established by the
local authorities. TCCC requirements for Treated Wastewater Quality are given in the Performance Indicators section. All CCI operations are regularly audited in detail in this scope, in addition to ISO 14001 Environment Management System Audits by third parties. We monitor our wastewater parameters with periodic analyses and reduce our environmental impact by treating wastewater prior to discharge and we develop projects to reduce wastewater generated as a result of our activities.
In 2017, we discharged a total of about 3.1 million m³ of wastewater in six countries of operation. Of this amount, we discharged 1,448,430 m³ to municipal sewage system, 826,205 m³ in organized industrial zone treatment facilities, and 834,315 m³ was discharged to surface water after treatment.
To monitor and manage the quality of the wastewater we discharge, we also measure the amount of wastewater discharged per liter of product for their compliance with the program.
OUR ENVIRONMENTAL FOOTPRINT
103-1; 306-5

SUSTAINABILITY IN REVIEW 57
Sustainable Sourcing
Sustainable agriculture is critical for us to meet the expectations of our consumers, customers and other stakeholders and to enable the continued growth of our business. Sourcing of CCI’s raw materials accounts for a large portion of our economic, social and environmental footprint.
Sustainable sourcing is purchasing ingredients from farm locations and suppliers that meet TCCC-approved standards, most preferably adhering to the TCCC’s Sustainable Agriculture Guiding Principles (SAGP), which, among other things, set standards to be met by farm suppliers for human and workplace rights, environmental protection and responsible farming management.
TCCC’s approach to sustainable agriculture is founded on principles that protect the environment, uphold workplace rights and help build more sustainable communities. Coca-Cola is addressing the challenges of agriculture availability, quality and safety while also helping to improve livelihoods and the well-being of farming communities. TCCC has focused on sustainably sourcing key agricultural ingredients by 2020 and developed Sustainable Agriculture Guiding Principles.
Compliance with SAGP will be verified according to international third-party standards such as Bonsucro, Rainforest Alliance, Sustainable Agriculture Initiative Platform (SAI) and Fairtrade International or equivalent.
In line with TCCC’s strategy, CCI set a goal to investigate sustainable sourcing opportunities for sugar and sweeteners, engage with stakeholders and conduct a feasibility study for sustainable sugar sourcing in Turkey in 2016. We established a study group formed by TCCC and CCI PAC, Technical and Procurement responsible for understanding how to comply with SAGP. Related information regarding the validation process, compliance standards and expectations were discussed. In May 2017, a workshop was organized on the SAGP compliance program for suppliers. CCI’s sweetener suppliers were invited to the meeting. As a next step, suppliers will work on SAGP and share their project calendar for their compliance with the program.
OUR ENVIRONMENTAL FOOTPRINT
Sustainable Agriculture Guiding Principles
Workplace and Human Rights
• Freedom of association and collective bargaining
• Prohibit child labor
• Eliminate discrimination
• Work hours and wages
• Safe and healthy workplaces
• Community and traditional rights
Environment
• Water management
• Energy management and climate protection
• Conservation of natural habitats and ecosystems
• Soil management
• Crop protection
Farm Management Systems
• Harvest and postharvest handling
• Reproductive material identity, selection and handling
• Management systems, record keeping and transparency
• Business integrity
103-1

58 CCI SUSTAINABILITY REPORT 2017
Our Sustainable Packaging Strategy
Using less resource for packaging is one of the key elements of our strategy and design lies beneath that goal. We continuously work to develop lighter packaging by using less material and conduct lightweight projects on both glass and resin side. Additionally, we develop and use new materials that mitigate our environmental footprint, such as PlantBottle.
PlantBottle
Considering that about 60% of TCCC’s beverage volume today is delivered in PET plastic packaging and that in some countries we are not legally allowed to use recycled plastic, TCCC invests in alternative technologies to reduce its plastic footprint due to PET.
Developed by TCCC, PlantBottle packaging replaces the traditional fossil-based ingredients used to make PET plastic with renewable substitutes made from plants. The key difference between PlantBottle packaging and traditional PET plastic bottles is that instead of using
petroleum and other fossil fuels to produce a key ingredient in the plastic, PlantBottle packaging uses materials that are up to 30% plant-based. Essentially, we are trading fossil fuels for plant-based materials without sacrificing performance or recyclability.
In 2013, we conducted several trials at our plants using PlantBottle. After obtaining legal permits in 2014, we started to produce 330-ml Damla water bottles and in 2017 1 L Damla water bottles in Turkey using PlantBottle resin. In 2017, we used about 23,060 tons of PlantBottle resin in six countries of operation. Detailed information about PlantBottle can be found at: https://www.coca-colacompany.com/stories/great-things-come-in-innovative-packaging-an-introduction-to-plantbottle-packaging
TCCC will continue to focus on developing 100-percent recyclable packaging and reducing the amount of plastic in its bottles.
Lightweight
As defined in our strategy, we
put several practices into action to reduce the amount of natural resources used in packaging while paying close attention to not compromising the safety of our products. Our efforts began in 2008 when we reduced the length of the bottleneck for the lightweight PET bottle. A standard amount of resin is used in PET bottles through Lightweight and Short Neck projects. In 2015, we conducted a benchmark study covering all CCI countries of operation to map the amount of resin used for all sizes of bottles and to share among the plants best practices of lightweight applications.
With our lightweight practices; we not only save materials, but also reduce GHG emissions generated during the production process. We are reducing our GHG emissions by implementing lightweight programs since 2010 in CCI Turkey Operations, Kazakhstan, Azerbaijan and Kyrgyzstan operations.
Recycling
Recycling is the process of collecting materials that would otherwise be thrown away and converting them into new products.
Sustainable PackagingPackaging is an essential aspect of the quality of our products and ensures safe delivery of our products to our customers and consumers. We are dedicated to packaging our products in the most sustainable way possible. With our sustainable packaging efforts to conserve resources and use less energy,
we not only contribute to circular economy, but we also reduce our environmental impact since packaging is one of the biggest sources of carbon footprint.
To mitigate our environmental footprint via sustainable packaging, we focus on the entire packaging
lifecycle through a renewed perspective. CCI determines its sustainable packaging goals taking into account the packaging materials and the recycling related regulations in the six countries of operation.
17Cities
12Projects
54StrategicPartnerships
32Calls inPortal
+3,033Voluntary Hours
12Activities
83,680 TLDonation
+1,000Volunteers
+95,091Beneficiaries
PET and GlassLightweight
Returnable Glass Bottles
PlantBottle
REDUCE REUSE
RENEW Post-ConsumerMaterial Collection
RECYCLE
Our Sustainable Packaging Strategy
2017 Volunteerism by numbers in CCI Turkey Operations
103-1; 301-2
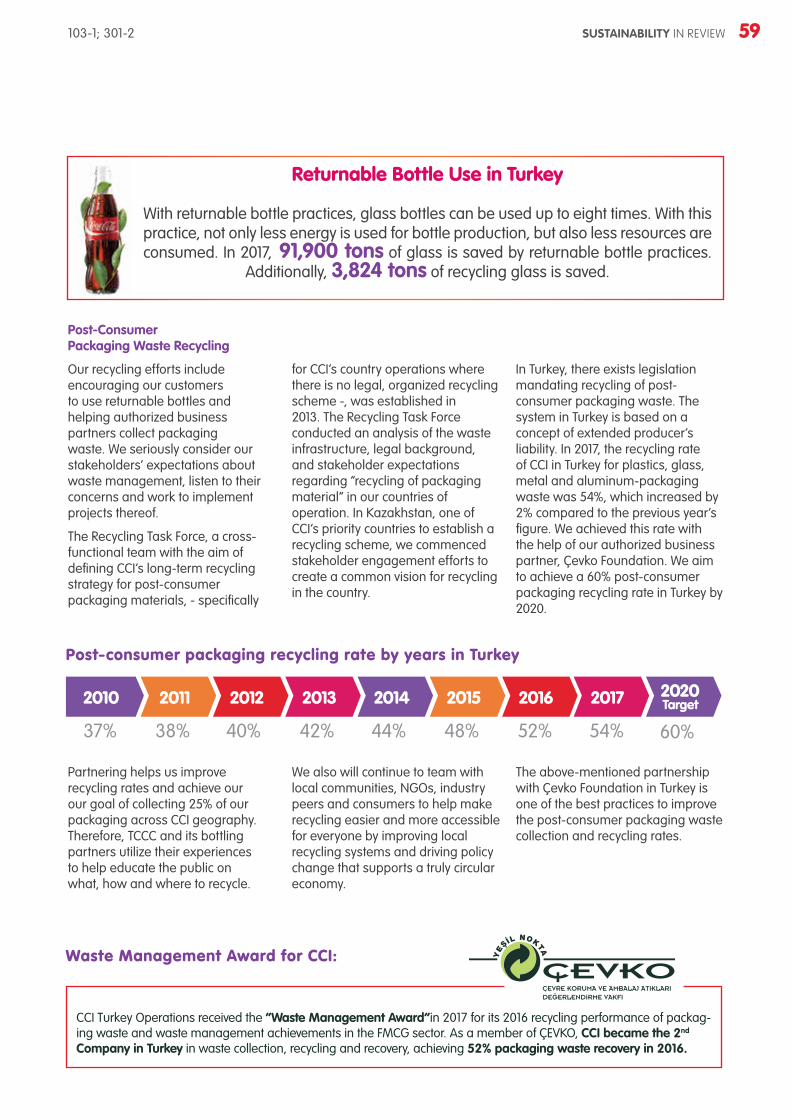
SUSTAINABILITY IN REVIEW 59
Post-Consumer Packaging Waste Recycling
Our recycling efforts include encouraging our customers to use returnable bottles and helping authorized business partners collect packaging waste. We seriously consider our stakeholders’ expectations about waste management, listen to their concerns and work to implement projects thereof.
The Recycling Task Force, a cross-functional team with the aim of defining CCI’s long-term recycling strategy for post-consumer packaging materials, - specifically
for CCI’s country operations where there is no legal, organized recycling scheme -, was established in 2013. The Recycling Task Force conducted an analysis of the waste infrastructure, legal background, and stakeholder expectations regarding “recycling of packaging material” in our countries of operation. In Kazakhstan, one of CCI’s priority countries to establish a recycling scheme, we commenced stakeholder engagement efforts to create a common vision for recycling in the country.
In Turkey, there exists legislation mandating recycling of post-consumer packaging waste. The system in Turkey is based on a concept of extended producer’s liability. In 2017, the recycling rate of CCI in Turkey for plastics, glass, metal and aluminum-packaging waste was 54%, which increased by 2% compared to the previous year’s figure. We achieved this rate with the help of our authorized business partner, Çevko Foundation. We aim to achieve a 60% post-consumer packaging recycling rate in Turkey by 2020.
Returnable Bottle Use in Turkey
With returnable bottle practices, glass bottles can be used up to eight times. With this practice, not only less energy is used for bottle production, but also less resources are consumed. In 2017, 91,900 tons of glass is saved by returnable bottle practices.
Additionally, 3,824 tons of recycling glass is saved.
Improvements in WURs Between 2006 and 2017 (L/L) **
Kyrgyzstan***
1.651.8
8
Pakistan***
1.93
2.03
*2017 value for TCCC has not yet been disclosed at the time of publishing this report.**The Isparta plant in Turkey is put into service in 2017, which causes an increase in WUR.*** Pakistan data is from 2015 and Kyrgyzstan data is from 2016.
Azerbaijan
2.1
1.73
Kazakhstan
2.1
1.59
Jordan
3.44
1.44
Turkey**
1.74
1.56
TCCC*
1.962.
56
2006 2015 2016 2017
Post-consumer packaging recycling rate by years in Turkey
37% 42% 54%40% 48% 52%38% 44% 60%
2010 2011 2012 2013 2017 2020Target2014 2015 2016
CCI Turkey Operations received the “Waste Management Award”in 2017 for its 2016 recycling performance of packag-ing waste and waste management achievements in the FMCG sector. As a member of ÇEVKO, CCI became the 2nd Company in Turkey in waste collection, recycling and recovery, achieving 52% packaging waste recovery in 2016.
Waste Management Award for CCI:
Improvements in Total Waste Recycling Rate Between 2006 and 2016
Kyrgyzstan**
97.7
0
98.10
Pakistan**
94.4
4
70.5
4
Kazakhstan90
.00
94.6
7
Azerbaijan
97.8
0
75.5
5
Turkey*
90.9
9
96.0
0
Jordan
81.6
0
91.9
0
*Pakistan data was included in the sustainability report in 2015 and Kyrgzystan data was included in 2016 report.**Pakistan data is from 2015 and Kyrgyzstan data is from 2016.
2006 2015 2016 2017
Improvements in WURs Between 2006 and 2017 (L/L) **
Kyrgyzstan***
1.651.8
8
Pakistan***
1.93
2.03
*2017 value for TCCC has not yet been disclosed at the time of publishing this report.**The Isparta plant in Turkey is put into service in 2017, which causes an increase in WUR.*** Pakistan data is from 2015 and Kyrgyzstan data is from 2016.
Azerbaijan
2.1
1.73
Kazakhstan
2.1
1.59
Jordan
3.44
1.44
Turkey**
1.74
1.56
TCCC*
1.962.
56
2006 2015 2016 2017
Post-consumer packaging recycling rate by years in Turkey
37% 42% 54%40% 48% 52%38% 44% 60%
2010 2011 2012 2013 2017 2020Target2014 2015 2016
CCI Turkey Operations received the “Waste Management Award”in 2017 for its 2016 recycling performance of packag-ing waste and waste management achievements in the FMCG sector. As a member of ÇEVKO, CCI became the 2nd Company in Turkey in waste collection, recycling and recovery, achieving 52% packaging waste recovery in 2016.
Waste Management Award for CCI:
Improvements in Total Waste Recycling Rate Between 2006 and 2016
Kyrgyzstan**
97.7
0
98.10
Pakistan**
94.4
4
70.5
4
Kazakhstan
90.0
0
94.6
7
Azerbaijan
97.8
0
75.5
5
Turkey*
90.9
9
96.0
0
Jordan
81.6
0
91.9
0
*Pakistan data was included in the sustainability report in 2015 and Kyrgzystan data was included in 2016 report.**Pakistan data is from 2015 and Kyrgyzstan data is from 2016.
2006 2015 2016 2017
Partnering helps us improve recycling rates and achieve our our goal of collecting 25% of our packaging across CCI geography. Therefore, TCCC and its bottling partners utilize their experiences to help educate the public on what, how and where to recycle.
We also will continue to team with local communities, NGOs, industry peers and consumers to help make recycling easier and more accessible for everyone by improving local recycling systems and driving policy change that supports a truly circular economy.
The above-mentioned partnership with Çevko Foundation in Turkey is one of the best practices to improve the post-consumer packaging waste collection and recycling rates.
103-1; 301-2

60 CCI SUSTAINABILITY REPORT 2017
Zero Waste To Landfill
Waste generated by our processes is an essential part of our environmental management system. We work to minimize our environmental footprint by minimizing the amount of waste that is disposed of safely and in compliance with legislation. Our main strategy is based on preventing, reducing, reusing, recycling and recovering the waste. To do so, we employ the ISO 14001 environmental management system and carry out related operations in accordance with CCI’s environmental policy, legislations and TCCC’s KORE-EOSH requirements.
At our manufacturing sites, we segregate our waste as reusable, recyclable, hazardous, landfill and
non-recyclable wastes. All waste that can be reused is reused, and that which can be recycled and recovered is delivered to licensed companies in all CCI operations. Waste that cannot be recycled or recovered is sorted according to specific, legally defined categories and delivered to licensed disposal facilities or municipalities to be used as landfill or to be incinerated. According to our waste management standards, all waste disposal sites are evaluated before use, and periodically thereafter, to verify and document site acceptability.
“Achieving zero waste production” is our ultimate goal and we do our best to accomplish this by reusing
and recycling all the waste produced from our sites. Accordingly, one of the key performance indicators we track is Total Waste Recycling%. Another is our total waste ratio, which is an indicator that shows the amount of waste generated per liter of product produced (g/l). We investigate alternative methods and strive to recycle 100% total waste generated from our operations. Results are carefully observed, monitored and evaluated to achieve better performance. Since 2006, we have managed to improve our performance in all countries of operation. Detailed information can be found in the Performance Indicators section.
Improvements in WURs Between 2006 and 2017 (L/L) **
Kyrgyzstan***
1.651.8
8
Pakistan***
1.93
2.03
*2017 value for TCCC has not yet been disclosed at the time of publishing this report.**The Isparta plant in Turkey is put into service in 2017, which causes an increase in WUR.*** Pakistan data is from 2015 and Kyrgyzstan data is from 2016.
Azerbaijan
2.1
1.73
Kazakhstan
2.1
1.59
Jordan
3.44
1.44
Turkey**
1.74
1.56
TCCC*
1.962.
56
2006 2015 2016 2017
Post-consumer packaging recycling rate by years in Turkey
37% 42% 54%40% 48% 52%38% 44% 60%
2010 2011 2012 2013 2017 2020Target2014 2015 2016
CCI Turkey Operations received the “Waste Management Award”in 2017 for its 2016 recycling performance of packag-ing waste and waste management achievements in the FMCG sector. As a member of ÇEVKO, CCI became the 2nd Company in Turkey in waste collection, recycling and recovery, achieving 52% packaging waste recovery in 2016.
Waste Management Award for CCI:
Improvements in Total Waste Recycling Rate Between 2006 and 2016
Kyrgyzstan**
97.7
0
98.10
Pakistan**
94.4
4
70.5
4
Kazakhstan
90.0
0
94.6
7
Azerbaijan
97.8
0
75.5
5
Turkey*
90.9
9
96.0
0
Jordan
81.6
0
91.9
0
*Pakistan data was included in the sustainability report in 2015 and Kyrgzystan data was included in 2016 report.**Pakistan data is from 2015 and Kyrgyzstan data is from 2016.
2006 2015 2016 2017
103-1; 301-2

2017 Sustainable Packaging Performance of CCI
of glass and
glass is savedof recycling
91,900 tons3,824 tons
of 30% plant based material in
23,060 tons
Damla 330 ml & 1 l
Bottle
saving in 6 countries due to
2,732 tons of resin
1,286 tons of glass projects
LightweightShort Neck
CCI TurkeyOperationsachieved
54% post-consumer
packaging wastes recovery rateplasticglassmetal
aluminium
Turkey96.0%
Jordan91.9%Pakistan94.4%
Kazakhstan90.0%
Kyrgyzstan97.7%
Total waste recycling rateat plants
Azerbaijan97.8%
2020 PLAN60% post-consumer
packaging waste recycling rate in Turkey
SUSTAINABILITY IN REVIEW 61
Improvements in WURs Between 2006 and 2017 (L/L) **
Kyrgyzstan***
1.651.8
8
Pakistan***
1.93
2.03
*2017 value for TCCC has not yet been disclosed at the time of publishing this report.**The Isparta plant in Turkey is put into service in 2017, which causes an increase in WUR.*** Pakistan data is from 2015 and Kyrgyzstan data is from 2016.
Azerbaijan
2.1
1.73
Kazakhstan
2.1
1.59
Jordan
3.44
1.44
Turkey**
1.74
1.56
TCCC*
1.962.
56
2006 2015 2016 2017
Post-consumer packaging recycling rate by years in Turkey
37% 42% 54%40% 48% 52%38% 44% 60%
2010 2011 2012 2013 2017 2020Target2014 2015 2016
CCI Turkey Operations received the “Waste Management Award”in 2017 for its 2016 recycling performance of packag-ing waste and waste management achievements in the FMCG sector. As a member of ÇEVKO, CCI became the 2nd Company in Turkey in waste collection, recycling and recovery, achieving 52% packaging waste recovery in 2016.
Waste Management Award for CCI:
Improvements in Total Waste Recycling Rate Between 2006 and 2016
Kyrgyzstan**
97.7
0
98.10
Pakistan**
94.4
4
70.5
4
Kazakhstan
90.0
0
94.6
7
Azerbaijan
97.8
0
75.5
5
Turkey*
90.9
9
96.0
0
Jordan
81.6
0
91.9
0
*Pakistan data was included in the sustainability report in 2015 and Kyrgzystan data was included in 2016 report.**Pakistan data is from 2015 and Kyrgyzstan data is from 2016.
2006 2015 2016 2017
103-1; 301-2

62 CCI SUSTAINABILITY REPORT 2017

SUSTAINABILITY IN REVIEW 63

64 CCI SUSTAINABILITY REPORT 2017
REPORTING CONSULTANT & DESIGN
www.esgturkey.com
CCI
Burcu CoşkunGroup Corporate Affairs [email protected]
OSB Mah. Deniz Feneri Sokak No: 434776 Dudullu Ümraniye İstanbulTel: +90 216 528 40 00 Fax: +90 216 510 70 12www.cci.com.tr
LEGAL DISCLAIMER
This sustainability report (the Report) was prepared by CCI within the principles of GRI (Global Reporting Initiative) and the United Nations Global Compact. This report has been prepared solely for informative purposes and does not aim to form the basis for any investment decision. No information in this report constitutes a proposal or part of a propos-al relating to the sale of CCI shares, or an invitation to this kind of sales process, and the publishing of this report does not mean that a legal relationship of this kind has been established. All featured information and related documents are believed to be accurate at the time of this report’s preparation, and all information has been provided in good faith and relies on trustworthy sources. However, CCI does not make any kind of declaration, guarantee or promise in relation to this information.
This report is printed on recycled paper.
CONTACT
102-3

REPORTING CONSULTANT & DESIGN
www.esgturkey.com
CCI
Burcu CoşkunGroup Corporate Affairs [email protected]
OSB Mah. Deniz Feneri Sokak No: 434776 Dudullu Ümraniye İstanbulTel: +90 216 528 40 00 Fax: +90 216 510 70 12www.cci.com.tr
LEGAL DISCLAIMER
This sustainability report (the Report) was prepared by CCI within the principles of GRI (Global Reporting Initiative) and the United Nations Global Compact. This report has been prepared solely for informative purposes and does not aim to form the basis for any investment decision. No information in this report constitutes a proposal or part of a propos-al relating to the sale of CCI shares, or an invitation to this kind of sales process, and the publishing of this report does not mean that a legal relationship of this kind has been established. All featured information and related documents are believed to be accurate at the time of this report’s preparation, and all information has been provided in good faith and relies on trustworthy sources. However, CCI does not make any kind of declaration, guarantee or promise in relation to this information.
This report is printed on recycled paper.


SUSTAINABILITY REPORT 2017
Performance Indicators
PERF
ORM
AN
CE IN
DIC
ATO
RS

CONTENTS
CCI REPORTING GUIDANCE
01 07
MANAGEMENT SYSTEMS STANDARDS AND PRINCIPLES
08PERFORMANCE INDICATORS
41INDEPENDENT ASSURANCE LETTER
42GREENHOUSE GAS VERIFICATION STATEMENT
34GRI STANDARDS CONTENT INDEX
40UNGC CONTENT INDEX

PERFORMANCE INDICATORS 1
This document provides guidance on the indicators included in the 2017 CCI sustainability report, some of which have been externally assured for the current or a prior period.
Indicators that have been externally assured for this year’s report are marked with an asterisk in the report. Other indicators covered in this sustainability report are reported in line with the GRI Standards of the Global Reporting Initiative (GRI) and are listed on pages 34-39.
The data within the scope of this guidance document is for the financial year ending on December 31, 2017 and concerns the relevant operations in Turkey, Jordan, Azerbaijan, Kazakhstan, Pakistan and Kyrgyzstan. Referral to “The Company” covers these six countries, unless otherwise stated.
2017 Assurance Scope
The Reporting Guidance (RG) document covers The Company’s data-gathering and reporting obligations for the indicators listed below. It is the responsibility of The Company management to ensure that appropriate procedures are in place to prepare data related to these indicators in line with the RG in all material respects.
• The total energy consumption, energy usage ratio (EUR), total water withdrawal and water usage ratio (WUR) of The Company’s Turkey operations, in year 2017, were audited according to the ISAE 3000 Standard (Revised).1
• GHG emissions of Turkey operations were verified in line with the ISO 14064-3 Standard.
Legal entities covered fully by this report include:
• Coca-Cola İçecek AŞ, Turkey• Coca-Cola Satış ve Dağıtım AŞ,
Turkey• Mahmudiye Kaynak Suyu Ltd. Şti.,
Turkey• J.V. Coca-Cola Almaty Bottlers LLP,
Kazakhstan• Azerbaijan Coca-Cola Bottlers
Limited LLC., Azerbaijan• The Coca-Cola Bottling Company
of Jordan Ltd., Jordan• Coca-Cola Beverages Pakistan
Ltd., Pakistan• Coca-Cola Bishkek Bottlers CJSC
Kyrgyzstan
For a full list of entities included in CCI’s financial statements, please see page 98 of the CCI 2017 Annual Report, available on: http://www.cci.com.tr/Portals/3/Documents/PDF/Annual_Report/2017/CCI-2017-AR.pdf
General Reporting Principles
In preparing this guidance document, consideration has been given to the following principles:
• Information Preparation – to highlight the primary principles of relevance and reliability of information; and
• Information Reporting – to highlight the primary principles of comparability, consistency (especially with regards to other data, including that of previous years), understandability and transparency in order to provide clarity to users.
Key Definitions
For the purpose of this report, the following definitions apply:
PLANT: All on-site facilities, including production buildings, water treatment units, wastewater treatment units, warehouses, laboratories, administration buildings and technical service operations.
ENERGY:Electricity, natural gas, diesel, gasoline, fuel oil, liquefied petroleum gas (LPG) and steam. For the purpose of this report, energy does not include alternative forms of fuel, such as bio-waste, biomass, bio-diesel, or renewable sources of energy such as wind or solar energy, which collectively represent an insignificant share of total energy consumption and carbon emissions.
ENERGY CONSUMPTION: The energy consumed during the reporting year (January 1 to December 31). Energy consumption data covers energy used in the operation of on-site industrial facilities and manufacturing processes, including electrical systems, heating, lighting, on-site transportation, air circulation and air conditioning (HVAC system). Manufacturing processes refer to the energy consumed in the core bottling (filling) operation. Total energy consumption also includes preform injection for those plants that use this energy-intensive process as well as energy used for CO2 production processes in our plants in Kazakhstan and Azerbaijan.
CCI REPORTING GUIDANCE (RG)
302-2; 305-1; 305-2; 305-3

2 CCI SUSTAINABILITY REPORT 2017
ENERGY USE RATIO (EUR, MJ): MJ of energy consumed per liter of product produced, calculated as the sum of all individual energy sources from the filling (core) production processes (in MJ) divided by production volume (in liters). To allow comparability between different CCI plants:• Energy consumption during
preform injection, an energy-intensive process, is excluded from the EUR since only a few sites employ this process. Of those CCI operations that fall within the scope of this RG, only the Turkish bottling facilities in Ankara and Çorlu, the international operations in Kazakhstan and Azerbaijan, and the bottling facility in Lahore, Pakistan employed an operational preform injection process during the reporting period.
• Energy consumption for CO2 production processes in our plants in Kazakhstan and Azerbaijan is also excluded from the EUR calculation.
• Beginning in 2013, the electricity producing process, which is present only in Kazakhstan, is included in EUR calculations.
GHG EMISSIONS (TON): Emissions during the reporting year (January 1 to December 31). The GHGs reported are those currently required by the United Nations Framework Convention on Climate Change and the Kyoto Protocol. These GHGs are currently: carbon dioxide (CO2), methane (CH4), nitrous oxide (N2O), hydrofluorocarbons (HFCs), perfluorocarbons (PFCs), Sulphur hexafluoride (SF6) and nitrogen trifluoride (NF3). Other GHGs, including those regulated by the Montreal Protocol, are excluded from GHG emissions and analyzed separately. “GHG emissions” refers to emissions from all production processes, such as bottling and preform injection, arising from The Company’s plants in Jordan,
Azerbaijan, Kazakhstan and Pakistan. In Turkey, CCI has been reporting its GHG emissions more extensively since 2012 in accordance with the ISO 14064-1 Standard for quantifying and reporting GHG emissions at the organization level. Consequently, GHG emissions reported for Turkey also include CCI’s GHG emissions from its non-plant buildings, e.g. offices, fleet transport and fugitive emissions. Where a plant generates energy on-site, the related energy consumption is defined as the energy of the fuel used for generation (e.g. for on-site, diesel-fired electricity generators, the energy consumption would be the diesel used rather than the electricity output of the generator).
WASTE (TON): Waste generated at a given site includes waste due to production, construction, food services or any other activity. Examples of the types of solid waste generated by The Company include paper, plastic, corrugated cardboard, metal, glass, sludge from water, waste oils, fleet waste (tires, batteries, coolants, oils, etc.) and damaged ingredients or products, plus all hazardous waste such as solvents, inks and lab waste. Liquid waste disposed of through the wastewater system is not included in the calculations as such waste is accounted for in wastewater discharge volume and wastewater sludge.
TOTAL WASTE RATIO (g/L): Grams of total waste generated per liter of product produced.
WASTE RECYCLING RATE (%): Tons of waste recovered, re-used or recycled divided by total waste generated (in tons), i.e. the Waste Recycling Rate represents the portion of waste that is not disposed to a landfill or incinerated. In the six countries covered by the 2017 CCI sustainability report, accredited waste contractors collected tons of waste for recycling and re-use.
WASTE DISPOSAL (TON): Waste disposal has followed the GRI G4 EN23 classification. To determine the method of disposal, CCI has used the legal categories laid out in the disposal documentation provided by its accredited waste contractors. Based on the disposal documentation, the categories of waste generated by CCI during the reporting period were recycling, re-use, recovery, incineration and landfill. Some hazardous waste is sold for use as fuel in processes such as cement manufacturing. In accordance with the legal categories of accredited waste documentation, this waste is classified as recovery rather than incineration.
REUSED WASTE (TON): Waste used again for the same or different purposes without re-processing, e.g., wood.
RECYCLED WASTE (TON): Waste that is broken down into raw materials, changed and reprocessed for use and used for new products. Recyclable materials include many kinds of glass, paper, metal, plastic, textiles, and electronics. The composting or other reuse of biodegradable waste – such as food or garden waste – is also considered recycling. Materials to be recycled are brought to a collection center, or picked up from the curbside, then sorted, cleaned and reprocessed into new materials bound for manufacturing.
RECOVERED WASTE (TON): Non-recyclable waste materials and the extraction therefrom of heat, electricity or energy through a variety of processes, including combustion, gasification, pyrolyzation and anaerobic digestion. For example, if waste is incinerated in an incineration plant to generate energy, then the waste is “recovered.” If there is no use of energy during the process, then the waste is incinerated. There are several ways to recover energy
CCI REPORTING GUIDANCE
302-2; 305-1; 305-2; 305-3

PERFORMANCE INDICATORS 3
from waste. Anaerobic digestion is a process of decomposition that occurs naturally whereby organic matter is reduced to a simpler chemical component in the absence of oxygen. “Recovery” also refers to incineration or directly controlled burning of municipal solid waste in order to reduce waste and create energy. Secondary recovered fuel is energy recovered from waste that cannot be reused or recycled through mechanical and biological treatment activities. Since most of the waste is recovered for energy in licensed facilities before storage, hazardous waste in Turkey is categorized as “recovery.”
WASTE STORED ON SITE (TON): Waste stored initially before the final treatment. Wood waste is treated in different ways, and the final treatment method is confirmed with suppliers and categorized by operations. Methods for reuse, recycle and recovery of hazardous waste are confirmed with CCI’s service providers for waste management. For our Turkey operations, disposal and treatment methods are decided according to the waste disposal codes defined in the Turkish Hazardous Waste Control Regulation. The amount of waste from coolers and two-way bottles generated by the market is measured either by weighing it directly or by calculations using waste factors recorded after measuring the exact weight of each part of the equipment.
LANDFILLED WASTE (TON): Waste sent to landfills (of either a municipality or an accredited company) and disposed of by burial.
WATER: Includes water from all sources, including wells, spring water, municipality and collected rainwater.
WATER CONSUMPTION (LITER): All water used during the reporting year (January 1 to December 31). Water consumption data includes water used for production, water treatment, boiler makeup, cooling (contact and non-contact), cleaning and sanitation, backwashing filters, irrigation, washing trucks and other vehicles, kitchen or canteen, toilets and sinks, and fire control.
WATER USE RATIO (L/L): Liters of water used per liter of product produced, calculated as total water use (in liters) divided by production volume (in liters).
WATER WITHDRAWAL (L): Total volume of water withdrawn from any source during the reporting year (January 1 to December 31), including ground water, municipality water and collected rainwater.
WASTE EFFLUENT (L): The total volume of water discharges during the reporting period by discharge and quality, including treatment method. This indicator is aligned with GRI’s Standards 306-1 indicator.
ENVIRONMENTAL COMPLIANCE:The monetary value of significant fines (over $200,000) and the total number of non-monetary sanctions for non-compliance with national Environmental Laws and Regulations. This indicator is aligned with GRI’s Standards 307-1 indicator.
EMPLOYEE NUMBERS: CCI employees working in The Company’s headquarters, plants and sales offices. Employee figures are categorized as permanent, temporary and contractor workers, and these data are recorded as year-end figures. This indicator is aligned with GRI’s Standards 108-2 indicator.
INJURIES AND LOST DAYS: Type of injury, rates of injury, lost days and total number of work-related fatalities, by region. This indicator is aligned with GRI’s Standards 403-2 indicator. CCI’s main injury metric is the Lost Time Incident Rate (LTIR), which is number of lost time incidents/occupational illnesses multiplied by 200,000 and then divided by the total number of hours worked during the reporting period.
TRAINING (Hr): Average hours of training carried out during the reporting period per employee, categorized in terms of OHS training, environmental training and total training. This indicator is aligned with GRI’s Standards 404-1 indicator.
Scope of Reporting
The following tables summarize the activities that are currently reported within the scope of this sustainability report for energy consumption, GHG emissions, water consumption and solid waste.
CCI REPORTING GUIDANCE
302-2; 305-1; 305-2; 305-3

Total Energy Consumption Turkey Jordan Azerbaijan Kazakhstan Pakistan Kyrgyzstan
Industrial sites where bottling processes are conducted, together with secondary operations such as preform injection*, bottle blowing and lift truck operations
x Except preform production x x x Except preform
production
Technical service operations (e.g. repairing of coolers, etc.) x x x x x x
Administrative buildings located at industrial sites x x x x x x
Own transportation of materials and products within industrial plant sites (e.g., forklift operations)
x x x x x x
Data adjustment for preform injection, CO2 production and electricity generation processes for energy consumption figures*
Only preform process None
CO2 production and preform
processesx Only preform
processOnly CO2 process
*Adjustment is made to the EUR (core) to allow comparability between plants by removing certain energy-intensive processes from the EUR, but not from total energy consumption. As explained in the RG, an adjustment is made to the EUR for energy consumption for preform injection processes, electricity generation processes (present only in our Kazakhstan plant) and CO2 production processes (present only in our plants in Kazakhstan and Azerbaijan). From 2013 onwards, energy use for electricity generation is included in the EUR data.
Industrial sites comprising bottling facilities together with secondary operations such as lift truck operations x
Technical service operations x
Preform manufacturing, bottle blowing processes x
Administrative buildings located at industrial sites x
Administrative buildings located away from industrial sites and headquarters x
Own transportation of materials and products within industrial plant sites (e.g. forklift operations) x
Own transportation of materials and products out of industrial plant sites x
Employees commuting with CCI-owned vehicles and sales fleet operations x
Energy used in the cooling of products (off site) x
Fugitive emissions from the cooling of products (off site) x
Fugitive emissions from the cooling system (on site) x
Fugitive emissions from fire extinguishers x
Fugitive emissions of CO2 filling process x
Fugitive emissions from off-site coolers x
Fugitive emissions from on-site coolers x
4 CCI SUSTAINABILITY REPORT 2017
GHG Emissions as CO2-e Verification Scope for Turkey
CCI REPORTING GUIDANCE
302-2; 305-1; 305-2; 305-3
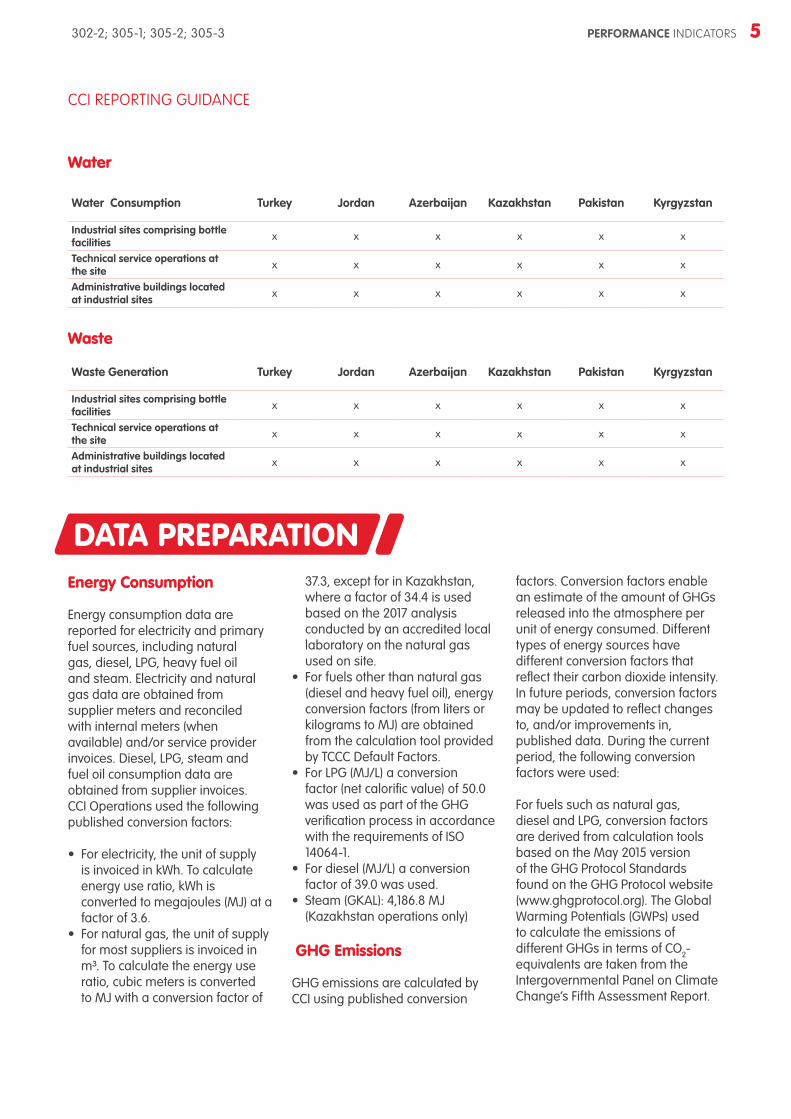
PERFORMANCE INDICATORS 5
Energy Consumption
Energy consumption data are reported for electricity and primary fuel sources, including natural gas, diesel, LPG, heavy fuel oil and steam. Electricity and natural gas data are obtained from supplier meters and reconciled with internal meters (when available) and/or service provider invoices. Diesel, LPG, steam and fuel oil consumption data are obtained from supplier invoices. CCI Operations used the following published conversion factors:
• For electricity, the unit of supply is invoiced in kWh. To calculate energy use ratio, kWh is converted to megajoules (MJ) at a factor of 3.6.
• For natural gas, the unit of supply for most suppliers is invoiced in m³. To calculate the energy use ratio, cubic meters is converted to MJ with a conversion factor of
37.3, except for in Kazakhstan, where a factor of 34.4 is used based on the 2017 analysis conducted by an accredited local laboratory on the natural gas used on site.
• For fuels other than natural gas (diesel and heavy fuel oil), energy conversion factors (from liters or kilograms to MJ) are obtained from the calculation tool provided by TCCC Default Factors.
• For LPG (MJ/L) a conversion factor (net calorific value) of 50.0 was used as part of the GHG verification process in accordance with the requirements of ISO 14064-1.
• For diesel (MJ/L) a conversion factor of 39.0 was used.
• Steam (GKAL): 4,186.8 MJ (Kazakhstan operations only)
GHG Emissions
GHG emissions are calculated by CCI using published conversion
factors. Conversion factors enable an estimate of the amount of GHGs released into the atmosphere per unit of energy consumed. Different types of energy sources have different conversion factors that reflect their carbon dioxide intensity. In future periods, conversion factors may be updated to reflect changes to, and/or improvements in, published data. During the current period, the following conversion factors were used:
For fuels such as natural gas, diesel and LPG, conversion factors are derived from calculation tools based on the May 2015 version of the GHG Protocol Standards found on the GHG Protocol website (www.ghgprotocol.org). The Global Warming Potentials (GWPs) used to calculate the emissions of different GHGs in terms of CO2-equivalents are taken from the Intergovernmental Panel on Climate Change’s Fifth Assessment Report.
DATA PREPARATION
CCI REPORTING GUIDANCE
Water Consumption Turkey Jordan Azerbaijan Kazakhstan Pakistan Kyrgyzstan
Industrial sites comprising bottle facilities x x x x x x
Technical service operations at the site x x x x x x
Administrative buildings located at industrial sites x x x x x x
Waste Generation Turkey Jordan Azerbaijan Kazakhstan Pakistan Kyrgyzstan
Industrial sites comprising bottle facilities x x x x x x
Technical service operations at the site x x x x x x
Administrative buildings located at industrial sites x x x x x x
Water
Waste
302-2; 305-1; 305-2; 305-3

kg CO2 /kWh electricity
2011 IEA Factors (Used for the 2013
Report)
2012 IEA Factors (Used for the 2014
Report)
2013 IEA Factors (Used for the 2015
Report)
2014 IEA Factors (Used for the 2016
Report)
2015 IEA Factors (Used for the 2017
Report)Turkey 0.457314 0.4591454 0.42868 0.497 0.441
Jordan 0.637428 0.6356158 0.6393961 0.656 0.588
Kazakhstan 0.395557 0.4608749 0.4324272 0.515 0.416
Azerbaijan 0.444116 0.4936623 0.4687942 0.477 0.487
Pakistan Not used 0.417622 0.4161746 0.425 0.410
Kyrgyzstan N/A N/A N/A 0.050 0.092
6 CCI SUSTAINABILITY REPORT 2017
In 2014, we began using the “GHG emissions from transport or mobile sources” tool, version 2.6 of May 2015, from the GHG Protocol of the World Resources Institute and World Business Council for Sustainable Development to calculate the emission values for employee commuting and business categories. GHG emissions of Turkey are taken from the report verified by the auditing firm Bureau Veritas in line with the ISO 14064-1 Standard.
Extrapolation Method Used for Energy Use Calculation and Total Energy Consumption
Since the period covered by invoices may not always fully align with The Company’s reporting period, adjustments are made where necessary in order to align the consumption data from the invoices with the reporting period as agreed with The Company’s verifiers.
TCCC Default Factors for CO2 Emissions
• Natural gas (MJ): 0.05039 kg CO2• LPG (MJ): 0.0594 kg CO2• Diesel (light fuel oil) (MJ):
0.07040 kg CO2• Heavy Fuel Oil (MJ): 0.073771 kg
CO2 (Azerbaijan operations only)• Electricity (kWh): For electricity,
conversion factors for GHG emissions are obtained from the International Energy Agency (IEA) and shared by TCCC with the entire Coca- Cola system.
In this year’s report, we used IEA factors of the year 2015 (as there is a two-year time gap for IEA publish the factors for a certain year). Combined factors are used for all operations in the sustainability report. This information is available in the internal document entitled
“SDW Fuel Conversion Factors”, which is updated every year by TCCC.
For our Kazakhstan operations, since electricity is generated by a co-generation plant at the site, local laboratory analysis results are used for the calculation of GHG emissions in these operations. The average value of external laboratory analysis results is used to determine the chemical composition of samples of the natural gas used in the plant.
CCI REPORTING GUIDANCE
Water Consumption
Water consumption data is obtained from internal meters where ground water is utilized. Moreover, separate data on water consumption is obtained from supplier meters and then reconciled with internal meters (when available) and/or service provider invoices where the water is supplied by the network.
Restatements
The measuring and reporting of assured environmental data inevitably involves a degree of estimation. In exceptional circumstances, restatements of data reported in a prior year may be required. Restatements are considered where the data differs by more than 5% at The Company level.
302-2; 305-1; 305-2; 305-3

PERFORMANCE INDICATORS 7
MANAGEMENT SYSTEMS STANDARDS AND PRINCIPLES
Issue Internal Policies Related External Standards and Principles
Production
Environmental management
CCI Health, Safety & Environment (HSE) Policy
ISO 14001TCCC HSE Policy
KORE - EOSH* Requirements
Water management KORE – EOSH Requirements ISO 14001
Energy management & carbon emissions KORE - EOSH Requirements ISO 14001, ISO 50001, ISO 14064-1,
GHG ProtocolSustainable packaging & waste management KORE - EOSH Requirements ISO 14001, PAS223
Quality management (Production process) KORE - OE ISO 9001, EFQM Business Excellence
Model, Lean Six Sigma
Product quality & safety KORE ISO 9001, ISO 22000, FSSC 22000, GFSI**
Occupational health & safety KORE - EOSH Requirements OHSAS 18001
Other
Sustainable supply chain Supplier Guiding Principles UNGC, GRI
Marketing responsiblyTCCC Responsible Marketing Policy,
TCCC Global School Beverage Guideline
Human and workplace rights Workplace Rights Policy UN Guiding Principles on Business and Human Rights
Anti-corruption CCI Ethics Code, Workplace Rights Policy UNGC
Community involvement TCCC’s Policy UNGC
Overall Code of Business Conduct, KORE UNGC, GRI
* EOSH: Environmental and Occupational Safety and Health
** GFSI: Global Food Safety Initiative
302-2

8 CCI SUSTAINABILITY REPORT 2017
PERFORMANCE INDICATORSThis section contains additional data on CCI’s sustainability performance.
Sustainability Across Value Chain
Materials Used in Products (tons) Concentrate & beverage base Sugar CO2
Turkey
2013 40,951 230,222 24,255
2014 42,169 217,892 23,508
2015 44,095 227,812 27,072
2016 37,613 255,703 24,727
2017 32,308 220,520 26,399
Jordan
2013 190 7,293 997
2014 213 8,032 1,151
2015 229 8,744 1,094
2016 215 9,463 987
2017 257 8,999 905
Kazakhstan
2013 5,115 4,889 4,588
2014 4,672 66,914 4,815
2015 4,580 49,885 5,518
2016 2,481 42,739 4,268
2017 3,845 46,920 5,390
Azerbaijan
2013 1,809 17,555 2,706
2014 1,878 18,954 2,954
2015 1,520 17,085 2,565
2016 636 11,054 1,312
2017 832 14,149 1,633
Pakistan
2015 635 158,838 16,069
2016 5,413 180,611 19,934
2017 5,489 187,339 21,925
Kyrgyzstan2016 274 8,641 941
2017 294 8,960 890

PERFORMANCE INDICATORS 9
Employee Profile
PERFORMANCE INDICATORS / HUMAN RESOURCES
Employees by Gender, Employment Type (%)
Country
Male Female
2013 2014 2015 2016 2017 2013 2014 2015 2016 2017
Blue Collar
Turkey – Group Office98.8
0.0 0.0 0.0 0.01.2
0.0 0.0 0.0 0.0
Turkey – Operations* 98.5 98.5 98.5 98.0 1.5 1.5 1.5 2.0
Jordan 100.0 99.5 100.0 100.0 100.0 0.0 0.5 0.0 0.0 0.0
Kazakhstan 99.3 98.8 99.2 99.1 99.0 0.7 1.2 0.8 0.9 1.0
Azerbaijan 97.5 97.4 97.1 97.0 97.0 2.5 2.6 2.9 3.0 3.0
Pakistan** N/A 99.2 99.1 98.3 98.0 N/A 0.8 0.1 1.7 2.0
Kyrgyzstan N/A N/A N/A 94.7 93.0 N/A N/A N/A 5.3 7.0
White Collar
Turkey – Group Office76.6
58.4 55.9 52.3 52.823.4
41.6 44.1 47.7 47.2
Turkey – Operations* 77.1 78.3 78.2 77.5 22.9 21.7 21.8 22.5
Jordan 91.8 90.4 89.4 89.3 89.2 8.2 9.6 10.6 10.7 10.8
Kazakhstan 75.2 77.7 76.7 70.7 67.6 24.8 22.3 23.3 29.3 32.4
Azerbaijan 77.7 78.2 81.1 80.2 79.9 22.3 21.8 18.9 19.8 20.1
Pakistan** N/A 93.2 90.8 90.4 90.8 N/A 6.8 9.2 9.6 9.2
Kyrgyzstan N/A N/A N/A 64.2 64.7 N/A N/A N/A 35.8 35.3
* The Blue-collar/white-collar distinction is based on permanent employees, since Pakistan does not have this information for its temporary workers.
Number of Outsourced Employees
Outsource-White Collar Jobs (*) Outsource-Auxiliary jobs (**)
2013 2014 2015 2016 2017 2013 2014 2015 2016 2017
Turkey – Group Office902
0 0 0 0673
0 0 0 0
Turkey – Operations 896 857 929 890 0 227 261 350
Jordan 7 0 0 0 0 53 55 48 50 50
Kazakhstan 0 0 0 0 0 86 106 108 122 122
Azerbaijan 164 153 0 0 0 33 42 44 37 38
Pakistan N/A 806 409 271 294 N/A 865 885 579 528
Kyrgyzstan N/A N/A N/A 0 0 N/A N/A N/A 49 64
* Outsource-White Collar Jobs: Employees who are on the payroll of a third-party company and whose jobs are directly related to our own business (e.g., jobs in merchandising, sales, warehouse operations, production etc.)
** Outsource-Auxiliary Jobs: Employees who are on the payroll of a third-party company and whose jobs are not directly related to our own business (e.g., jobs in security, gardening, health services etc.)
Number of Employees 2013 2014 2015 2016 2017
Turkey - Group Office2.773
166 143 132 125
Turkey - Operations* 2.342 2.219 2.241 2.200
Jordan 409 397 404 398 377
Kazakhstan 749 845 950 717 651
Azerbaijan 373 390 352 296 295
Pakistan 4.491 4.175 3.564 3356 2.955
Kyrgyzstan 366 384 355 307 308
* Turkey operations include Turkey factories and Turkey sales offices.
102-8; 405-1

10 CCI SUSTAINABILITY REPORT 2017
Employees by Gender, Employment Type and Contract (Number)
Country
Male Female Total
2013 2014 2015 2016 2017 2013 2014 2015 2016 2017 2013 2014 2015 2016 2017
Blue Collar
Turkey – Group Office
8730 0 0 0
110 0 0 0
8840 0 0 0
Turkey – Operations* 851 830 829 829 13 13 13 17 864 843 842 846
Jordan 190 199 197 192 173 0 1 0 0 0 190 200 197 192 173
Kazakhstan 299 335 376 325 302 2 4 3 3 3 301 339 379 328 305
Azerbaijan 193 188 136 97 98 5 5 4 3 3 198 193 140 100 101
Pakistan** N/A 2,002 1,535 1,289 1,219 N/A 18 14 22 25 N/A 2,020 1,549 1,311 1,244
Kyrgyzstan N/A N/A N/A 161 160 N/A N/A N/A 9 12 N/A N/A N/A 170 172
White Collar
Turkey – Group Office
1,44797 80 69 66
44269 63 63 59
1,889166 143 132 125
Turkey – Operations* 1,140 1,078 1,094 1,050 338 298 305 304 1,478 1,376 1,399 1,354
Jordan 201 178 185 184 182 18 19 22 22 22 219 197 207 206 204
Kazakhstan 337 393 438 275 234 111 113 133 114 112 448 506 571 389 346
Azerbaijan 136 154 172 157 155 39 43 40 39 39 175 197 212 196 194
Pakistan N/A 2,008 1,830 1,848 1,553 N/A 147 185 197 158 N/A 2,155 2,015 2,045 1,711
Kyrgyzstan N/A N/A N/A 88 88 N/A N/A N/A 49 48 N/A N/A N/A 137 136
Permanent
Turkey – Group Office
2,31997 80 69 66
45169 63 63 59
2,770166 143 132 125
Turkey – Operations* 1,990 1,908 1,921 1,879 347 309 316 314 2,337 2,217 2,237 2,193
Jordan 389 349 377 376 355 18 19 22 22 22 407 368 399 398 377
Kazakhstan 636 726 814 600 536 113 117 136 117 115 749 843 950 717 651
Azerbaijan 329 342 307 253 253 44 48 44 42 42 373 390 351 295 295
Pakistan N/A 3,874 3,287 3,015 2,686 N/A 162 198 206 174 N/A 4,036 3,485 3,221 2,860
Kyrgyzstan N/A N/A N/A 249 248 N/A N/A N/A 58 60 N/A N/A N/A 307 308
Temporary
Turkey – Group Office
10 0 0 0
20 0 0 0
30 0 0 0
Turkey – Operations* 1 0 2 0 4 2 2 7 5 2 4 7
Jordan 2 28 5 0 0 0 1 0 0 0 2 29 5 0 0
Kazakhstan 0 2 0 0 0 0 0 0 0 0 0 2 0 0 0
Azerbaijan 0 0 1 1 0 0 0 0 0 0 0 0 1 1 0
Pakistan** N/A 136 78 122 86 N/A 3 1 13 9 N/A 139 79 135 95
Kyrgyzstan N/A N/A N/A 0 0 N/A N/A N/A 0 0 N/A N/A N/A 0 0
* Turkey operations include Turkey factories and Turkey sales offices. Since 2014, employee profile for Turkey is reported in two seperate categories; Group Office and Operations.
** Blue collar employee data in Pakistan have been updated with temporary employees.
*** The Blue-collar/white-collar distinction is based on permanent employees, since Pakistan does not have this information for its temporary workers.
PERFORMANCE INDICATORS / HUMAN RESOURCES
102-8; 405-1

PERFORMANCE INDICATORS 11
Percentage of Employees by Age (%)
Under 30 Between 30-50 Above 50
2013 2014 2015 2016 2017 2013 2014 2015 2016 2017 2013 2014 2015 2016 2017
Senior Management
Turkey – Group Office 0.0
0.0 0.0 0.0 0.080.0
77.8 60.0 54.5 60.020.0
22.2 40 45.5 40.0
Turkey – Operations* 0.0 0.0 0.0 0.0 100.0 100.0 100.0 100.0 0.0 0.0 0.0 0.0
Jordan 0.0 0.0 0.0 0.0 0.0 100.0 100.0 100.0 100.0 100.0 0.0 0.0 0.0 0.0 0.0
Kazakhstan 4.0 0.0 0.0 0.0 0.0 76.0 76 75.0 87.5 83.3 20.0 24.0 25 12.5 16.7
Azerbaijan 0,0 0.0 0.0 0.0 0.0 100.0 100 100 100.0 80.0 0.0 0.0 0.0 0.0 20.0
Pakistan N/A N/A 0.0 0.0 0.0 N/A N/A 90.0 90.0 100.0 N/A N/A 10 10 0.0
Kyrgyzstan N/A N/A N/A 16.7 20 N/A N/A 83.3 80.0 N/A N/A N/A 0.0 0.0
Other Employees
Turkey – Group Office 27.1
9.6 11.9 13.2 16.571.4
87.3 81.8 80.2 74.81.5
3.2 6.3 6.6 8.7
Turkey – Operations* 23.5 23.3 23.9 25.9 74.6 75.1 75.0 72.5 1.8 1.6 1.1 1.6
Jordan 35.3 30.9 38.2 42.5 41.1 60.0 62.4 56.0 53.2 54.6 4.7 6.7 5.8 4.3 4.3
Kazakhstan 49.9 40.4 36.3 30.3 29.5 43.1 52.1 56.5 61.5 60.6 7.0 7.5 7.2 8.2 9.9
Azerbaijan 42.5 40.3 36.1 34.8 32.1 46.0 48.7 53.2 55.6 57.2 11.4 11 10.7 9.6 10.7
Pakistan N/A N/A 33.3 27.0 31.3 N/A N/A 62.7 69.3 65.7 N/A N/A 4 3.7 3.0
Kyrgyzstan N/A N/A N/A 62.1 59.7 N/A N/A N/A 30.2 33.3 N/A N/A N/A 7.6 6.9
* Turkey operations include Turkey factories and Turkey sales offices.
Number and Percentage (%) of Employees by Gender
CountriesMale Female
2013* 2014 2015 2016 2017 2017 (%) 2013* 2014 2015 2016 2017 2017 (%)
Senior Management
Turkey – Group Office10
7 8 9 8 80.04
2 2 2 2 20.0
Turkey – Operations 5 7 7 5 71.4 2 1 1 2 28.6
Jordan 4 5 6 3 3 60.0 0 1 0 2 2 40.0
Kazakhstan 18 18 4 4 4 66.7 7 7 4 4 2 33.3
Azerbaijan 3 3 3 1 3 60.0 3 3 3 2 2 40.0
Pakistan N/A N/A 7 10 9 100.0 N/A N/A 3 0 0 0.0
Kyrgyzstan N/A N/A N/A 5 4 80.0 N/A N/A N/A 1 1 20.0
Other Employees
Turkey – Group Office2,310
91 72 60 58 50.4449
66 61 61 57 49.6
Turkey – Operations 1,986 1,901 1,916 1,874 85.5 349 310 317 319 14.5
Jordan 387 372 376 373 352 94.6 18 19 22 20 20 5.4
Kazakhstan 618 710 810 596 532 82.5 106 110 132 113 113 17.5
Azerbaijan 326 339 305 253 250 86.2 41 45 41 40 40 13.8
Pakistan N/A N/A 3,358 3,127 2,763 93.8 N/A N/A 196 219 183 6.2
Kyrgyzstan N/A N/A N/A 244 244 80.5 N/A N/A N/A 57 59 19.5
PERFORMANCE INDICATORS / HUMAN RESOURCES
102-8; 405-1

12 CCI SUSTAINABILITY REPORT 2017
Percentage of employees by gender (%)
2013 2014 2015 2016 2017
Male Female Male Female Male Female Male Female Male Female
Turkey – Group Office83.7 16.3
59.0 41.0 55.9 44.1 52.3 47.7 52.8 47.2
Turkey – Operations* 85.0 15.0 85.9 14.1 85.8 14.2 85.4 14.6
Jordan 95.6 4.4 95 5.0 94.6 5.4 94.5 5.5 94.2 5.8
Kazakhstan 84.9 15.1 86.2 13.8 85.7 14.3 83.7 16.3 82.3 17.7
Azerbaijan 88.2 11.8 87.7 12.3 87.5 12.5 85.8 14.2 85.8 14.2
Pakistan N/A N/A 96.0 4.0 94.4 5.6 93.5 6.5 93.8 6.2
Kyrgzystan N/A N/A N/A N/A N/A N/A 81.1 18.9 80.5 19.5
TOTAL 85.4 14.6 90.6 9.4 89.8 10.2 88.7 11.3 88.4 11.6
* Turkey operations include Turkey factories and Turkey sales offices.
Number of employees by gender 2013 2014 2015 2016 2017
Male Female Male Female Male Female Male Female Male Female
Turkey – Group Office2,320 453
98 68 80 63 69 63 66 59
Turkey – Operations* 1,993 351 1,908 311 1,923 318 1,879 321
Jordan 391 18 377 20 382 22 376 22 355 22
Kazakhstan 636 113 728 117 814 136 600 117 536 115
Azerbaijan 329 44 342 48 308 44 254 42 253 42
Pakistan N/A N/A 3,874 162 3,365 199 3,137 219 2,772 183
Kyrgzystan N/A N/A N/A N/A N/A N/A 249 58 248 60
TOTAL 3,676 628 7,412 766 6,857 775 6,608 839 6,109 802
PERFORMANCE INDICATORS / HUMAN RESOURCES
102-8; 405-1

PERFORMANCE INDICATORS 13
Number of employees per employee category 2013 2014 2015 2016 2017
Senior Management
Turkey - Group Office
149 10 11 10
Turkey Operations *
7 8 8 7
Jordan 4 6 6 5 5
Kazakhstan 25 25 8 8 6
Azerbaijan 6 6 6 3 5
Pakistan N/A N/A 10 10 9
Kygrzystan N/A N/A N/A 6 5
Other Employees
Turkey - Group Office
2,759157 133 121 115
Turkey Operations *
2,335 2,211 2,233 2,193
Jordan 405 391 398 393 372
Kazakhstan 724 820 942 709 645
Azerbaijan 367 384 346 293 290
Pakistan N/A N/A 3,554 3,346 2,946
Kyrgzystan N/A N/A N/A 301 303
* Turkey operations include Turkey factories and Turkey sales offices.
Average Hours of Training Per Employee (Hour)
2013 2014 2015 2016 2017
Turkey – Group Office 20.3
37.7 9.7 12.4 2.4
Turkey – Operations* 8.3 4.3 4.0 5.4
Jordan 26.4 35.1 64.8 13.3 1.4
Kazakhstan 13.5 29.3 27.0 23.2 29.7
Azerbaijan 11.1 14.1 37.5 30.6 35.9
Pakistan N/A N/A 65.6 27.8 7.7
Kyrgyzstan N/A N/A N/A 27.8 23.4
Training
PERFORMANCE INDICATORS / HUMAN RESOURCES
102-8; 404-1

14 CCI SUSTAINABILITY REPORT 2017
Countries YearsTotal number of hours of training (Employee*Hour)
Average hours of training per year per
employee (Hour)
Total Number of Employee
Turkey 2013 56,429 20.3 2,773
Turkey Operations*
2014 19,540 8.3 2,342
2015 9,596 4.3 2,219
2016 8,976 4.0 2,241
2017 11,960 5.4 2,200
Corporate/Group Office
2014 6,255 37.7 166
2015 1,384 9.7 143
2016 1,633 12.4 132
2017 306 2.4 125
Jordan
2013 10,788 26.4 409
2014 13,916 35.1 397
2015 26,160 64.8 404
2016 5,297 13.3 398
2017 544 1.4 377
Kazakhstan
2013 10,091 13.5 749
2014 24,757 29.3 845
2015 25,642 27.0 950
2016 16,606 23.2 717
2017 19,306 29.7 651
Azerbaijan
2013 4,145 11.1 373
2014 5,481 14.1 390
2015 13,198 37.5 352
2016 9,051 30.6 296
2017 10,592 35.9 295
Pakistan
2015 233,862 65.6 3,564
2016 93,256 27.8 3,356
2017 22,750 7.7 2,955
Kyrgzystan2016 8,546 27.8 307
2017 7,222 23.4 308
TOTAL
2013 81,453 18.9 4,304
2014 69,949 16.9 4,140
2015 309,842 40.6 7,632
2016 143,365 19.3 7,447
2017 72,680 10.5 6,911
* Turkey operations include Turkey factories and Turkey sales offices,
PERFORMANCE INDICATORS / HUMAN RESOURCES

PERFORMANCE INDICATORS 15
Total Number and Rate of New Employee Hires
Male Female
Number Rate (%) Number Rate (%)
2013
Turkey – Group Office179 7.7 95 21.0
Turkey – Operations*
Jordan 136 34.8 5 27.8
Kazakhstan 188 29.6 28 24.8
Azerbaijan 82 24.9 1 2.3
Kyrgyzstan N/A N/A N/A N/A
2014
Turkey – Group Office 1 1.0 1 1.4
Turkey – Operations* 135 6.8 44 12.5
Jordan 49 13.0 6 30.0
Kazakhstan 206 28.3 29 24.8
Azerbaijan 43 12.6 8 16.7
Kyrgyzstan N/A N/A N/A N/A
2015
Turkey – Group Office 4 5.0 3 4.8
Turkey – Operations* 172 9.0 32 10.3
Jordan 156 40.8 6 27.3
Kazakhstan 241 29.6 41 30.1
Azerbaijan 41 13.3 6 13.6
Pakistan 79 2.3 49 24.6
Kyrgyzstan N/A N/A N/A N/A
2016
Turkey – Group Office 3 4.3 5 7.9
Turkey – Operations* 144 7.5 38 12.0
Jordan 148 39.4 6 27.3
Kazakhstan 120 20.0 15 12.8
Azerbaijan 15 5.9 3 7.1
Pakistan 137 4.5 37 18.0
Kyrgyzstan 30 12.0 4 6.9
2017
Turkey – Group Office 6 9.1 5 8.5
Turkey – Operations* 96 5.1 36 11.5
Jordan 82 23.1 2 9.1
Kazakhstan 74 13.8 13 11.3
Azerbaijan 26 10.3 5 11.9
Pakistan 80 3.0 16 9.2
Kyrgyzstan 38 15.3 10 16.7
* Turkey operations include Turkey factories and Turkey sales offices.
New Employee Hires
PERFORMANCE INDICATORS / HUMAN RESOURCES

16 CCI SUSTAINABILITY REPORT 2017
Total Number and Rates of Employee Turnover
Male Female Total Turnover (%)Number Rate (%) Number Rate (%)
2013
Turkey – Group Office205 8.8 41 9.1 8.9
Turkey – Operations*
Jordan 40 10.2 3 16.7 10.5
Kazakhstan 109 17.1 19 16.8 17.1
Azerbaijan 25 7.6 5 11.4 8.0
Kyrgyzstan
2014
Turkey – Group Office 11 11.3 10 14.5 12.7
Turkey – Operations* 342 17.2 64 18.2 17.3
Jordan 49 13.0 6 30.0 13.9
Kazakhstan 109 15.0 18 15.4 15.0
Azerbaijan 30 8.8 4 8.3 8.7
Kyrgyzstan
2015
Turkey – Group Office 13 16.3 4 6.3 11.9
Turkey – Operations* 270 14.2 73 23.5 15.5
Jordan 53 13.9 3 13.6 13.9
Kazakhstan 145 17.8 24 17.6 17.8
Azerbaijan 26 8.4 6 13.6 9.1
Pakistan 163 4.8 42 21.1 5.8
Kyrgyzstan
2016
Turkey – Group Office 15 21.6 5 7.9 15.2
Turkey – Operations* 157 8.2 45 14.2 9.0
Jordan 66 17.5 4 18.2 17.6
Kazakhstan 334 55.6 34 29.1 51.3
Azerbaijan 59 23.3 4 9.5 21.4
Pakistan 417 13.8 37 18.0 14.1
Kyrgyzstan 68 27.3 11 19.0 25.7
2017
Turkey – Group Office 16 24.2 7 11.9 18.4
Turkey – Operations* 133 7.1 36 11.5 7.7
Jordan 48 13.5 3 13.6 13.5
Kazakhstan 147 27.4 16 13.9 25.0
Azerbaijan 26 10.3 5 11.9 10.5
Pakistan 438 16.3 52 29.9 17.1
Kyrgyzstan 41 16.5 8 13.3 15.9
* Turkey operations include Turkey factories and Turkey sales offices.
Employee Turnover
PERFORMANCE INDICATORS / HUMAN RESOURCES

PERFORMANCE INDICATORS 17
Local Employment in International Operations
Local Senior Management
Employment Rate (%)
Local White Collar Employment Rate (%)
Local Blue Collar Employment Rate (%)
2013
Turkey 90.0 99.6 100.0
Jordan 60.0 97.0 99.0
Azerbaijan 16.7 96.0 100.0
Kazakhstan 50.0 98.9 100.0
Kyrgyzstan N/A N/A N/A
2014
Turkey – Group Office 100.0 97.0 0.0
Turkey – Operations* 90.0 99.8 100.0
Jordan 67.0 100.0 100.0
Azerbaijan 16.7 96.0 100.0
Kazakhstan 50.0 99.2 100.0
Kyrgyzstan N/A N/A N/A
2015
Turkey – Group Office 100.0 89.5 0.0
Turkey – Operations* 87.5 99.9 100.0
Jordan 33.3 100.0 100.0
Azerbaijan 16.7 97.2 100.0
Kazakhstan 62.5 99.5 100.0
Pakistan 90.0 99.95 100.0
Kyrgyzstan N/A N/A N/A
2016
Turkey – Group Office 100.0 89.4 0.0
Turkey – Operations* 100.0 99.9 100.0
Jordan 80.0 99.5 100.0
Azerbaijan 50.0 99.0 100.0
Kazakhstan 50.0 98.5 100.0
Pakistan 70.0 99.8 100.0
Kyrgyzstan 50.0 97.1 100.0
2017
Turkey – Group Office 100.0 100.0 0.0
Turkey – Operations* 100.0 99.3 100.0
Jordan 80.0 97.5 100.0
Azerbaijan 40.0 98.5 100.0
Kazakhstan 33.3 96.8 100.0
Pakistan 66.7 99.7 100.0
Kyrgyzstan 60.0 97.8 100.0
* Turkey operations include Turkey factories and Turkey sales offices.
Local Employment
PERFORMANCE INDICATORS / HUMAN RESOURCES

18 CCI SUSTAINABILITY REPORT 2017
Employee Breakdown by Seniority (%) 2013 2014 2015 2016 2017
0 – 5 Years
Turkey – Group Office53.8
53.0 54.0 47.0 36.0
Turkey – Operations* 43.3 40.0 42.6 37.2
Jordan 55.0 53.2 55.0 57.0 56.2
Kazakhstan 61.3 60.0 63.0 56.0 50.8
Azerbaijan 58.5 55.1 56.0 47.0 47.5
Pakistan N/A N/A 54.0 42.0 40.6
Kyrgyzstan N/A N/A N/A 67.0 60.4
6 – 10 Years
Turkey – Group Office24.5
32.0 31.0 25.0 25.6
Turkey – Operations* 32.4 31.0 29.1 29.7
Jordan 14.9 15.9 16.0 15.0 13.3
Kazakhstan 27.8 26.6 23.0 25.0 22.4
Azerbaijan 27.9 32.3 28.0 35.0 23.1
Pakistan N/A N/A 33.0 40.0 40.1
Kyrgyzstan N/A N/A N/A 21.0 25.0
11 – 15 Years
Turkey – Group Office10.0
4.0 3.0 8.0 15.2
Turkey – Operations* 6.9 11.0 11.3 16.0
Jordan 18.3 14.6 11.0 9.0 9.8
Kazakhstan 5.3 7.9 8.0 12.0 18.9
Azerbaijan 4.6 3.3 5.0 7.0 19.3
Pakistan N/A N/A 5.0 8.0 11.6
Kyrgyzstan N/A N/A N/A 5.0 7.1
16 – 20 Years
Turkey – Group Office9.4
5.0 6.0 7.0 8.8
Turkey – Operations* 13.9 13.0 11.8 10.2
Jordan 11.7 10.6 12.0 14.0 13.3
Kazakhstan 5.7 4.7 5.0 5.0 3.5
Azerbaijan 9.1 10.5 10.0 10.0 4.1
Pakistan N/A N/A 5.0 8.0 6.8
Kyrgyzstan N/A N/A N/A 7.0 4.2
20+ Years
Turkey – Group Office2.3
6.0 6.0 14.0 14.4
Turkey – Operations* 3.5 5.0 5.2 6.8
Jordan 0.0 5.8 5.0 5.0 7.4
Kazakhstan 0.0 0.7 1.0 2.0 4.3
Azerbaijan 0.0 0.0 1.0 1.0 6.1
Pakistan N/A N/A 0.0 2.0 1.9
Kyrgyzstan N/A N/A N/A 1.0 3.2
* Turkey operations include Turkey factories and Turkey sales offices.
Employee Breakdown by Seniority (Years of Service)
PERFORMANCE INDICATORS / HUMAN RESOURCES

PERFORMANCE INDICATORS 19
Employees covered by collective bargaining agreements
2013 2014 2015 2016 2017
# % # % # % # % # %
Turkey - Group Office38 4.10
0 0 0 0 0 0 0 0
Turkey Operations * 41 4.30 52 6.20 761 90.38 770 91,02
Jordan 0 0 0 0 0 0 0 0 0 0
Kazakhstan 0 0 0 0 0 0 0 0 0 0
Azerbaijan 0 0 0 0 0 0 0 0 0 0
Pakistan 2,156 100 1,881 100 1,470 100 1,229 100 1,182 100
Kyrgyzstan N/A N/A N/A N/A N/A N/A 0 0 0 0
* Turkey operations include Turkey factories and Turkey sales offices.
Benefits Provided to Full-time Employees in 2017 Turkey Jordan Kazakhstan Azerbaijan Pakistan Kyrgzystan
Private health insurance yes yes yes yes yes yes
Private life insurance yes yes no no yes no
Individual pension funds yes no no no no no
Company products yes yes yes yes yes yes
Seniority service awards yes yes yes yes yes yes
Employees Covered by Collective Bargaining
PERFORMANCE INDICATORS / HUMAN RESOURCES
401-2

20 CCI SUSTAINABILITY REPORT 2017
OHS Performance Indicators
Lost Time Incidents (workdays lost) Lost Time Incidents (Number) Number of Fatalities
Employee Contractor Total Employee Contractor Total Employee Contractor Total
2013
Turkey 208 79 287 21 12 33 0 0 0
Jordan 140 20 160 10 0 10 0 0 0
Kazakhstan 0 0 0 0 0 0 0 0 0
Azerbaijan 0 21 21 0 1 1 0 0 0
OVERALL 348 120 468 31 13 44 0 0 0
2014
Turkey 648 94 742 30 7 37 0 0 0
Jordan 146 0 146 9 0 9 0 0 0
Kazakhstan 0 0 0 0 0 0 0 0 0
Azerbaijan 0 0 0 0 0 0 0 0 0
OVERALL 794 94 888 39 7 46 0 0 0
2015
Turkey 146 292 438 15 15 30 0 0 0
Jordan 118 0 118 8 0 8 0 0 0
Kazakhstan 0 0 0 0 0 0 0 0 0
Azerbaijan 0 0 0 0 0 0 0 0 0
Pakistan* 174 0 174 7 10 17 0 0 0
OVERALL 438 292 730 30 25 55 0 0 0
2016
Turkey 141 109 250 19 11 30 0 0 0
Jordan 296 0 296 18 0 18 0 0 0
Kazakhstan 32 16 48 2 1 3 0 0 0
Azerbaijan 0 0 0 0 0 0 0 0 0
Pakistan 220 4 224 4 1 5 1 0 1
Kyrgyzstan 0 0 0 0 0 0 0 0 0
OVERALL 689 129 818 43 13 56 1 0 1
2017
Turkey 217 6 223 15 3 18 0 0 0
Jordan 47 0 47 4 0 4 0 0 0
Kazakhstan 10 0 10 1 0 1 0 0 0
Azerbaijan 180 0 180 1 0 1 0 0 0
Pakistan 8 33 41 1 3 4 0 0 0
Kyrgyzstan 0 0 0 0 0 0 0 0 0
OVERALL 462 39 501 22 6 28 0 0 0
* 2015 vehicle accident data for Pakistan was not prepared on a consistent basis between plants.
OHS Performance Indicators
PERFORMANCE INDICATORS / HUMAN RESOURCES

PERFORMANCE INDICATORS 21
OHS Performance Indicators
LTIR LTISR Total Vehicle Accident Vehicle Accident Rate
2013
Turkey 0.55 4.75 241.00 13.87
Jordan 1.56 27.67 54.00 23.80
Kazakhstan 0.00 0.00 8.00 2.93
Azerbaijan 0.17 3.58 6.00 3.40
OVERALL 0.55 5.90 309.00 12.97
2014
Turkey 0.67 8.83 164.00 14.22
Jordan 1.54 24.91 50.00 22.02
Kazakhstan 0.00 0.00 27.00 9.89
Azerbaijan 0.00 0.00 8.00 4.28
OVERALL 0.62 3.15 249.00 13.68
2015
Turkey 0.68 9.50 101.00 10.44
Jordan 1.42 20.93 74.00 32.60
Kazakhstan 0.00 0.00 2.00 0.73
Azerbaijan 0.00 0.00 3.00 1.74
Pakistan 0.37 3.77 13.00 2.51
OVERALL 0.49 6.63 193.00 8.97
2016
Turkey 0.68 5.69 100.00 10.88
Jordan 3.42 56.28 65.00 28.63
Kazakhstan 0.43 6.91 0.00 0.00
Azerbaijan 0.00 0.00 0.00 0.00
Pakistan 0.13 5.98 13.00 2.16
Kyrgyzstan 0.00 0.00 0.00 0.00
OVERALL 0.57 8.35 178.00 8.59
2017
Turkey 0.38 4.70 95 10.70
Jordan 0.73 8.63 39 17.18
Kazakhstan 0.16 1.55 5 3.31
Azerbaijan 0.34 60.96 0 0
Pakistan 0.11 1.15 5 0.83
Kyrgyzstan 0 0 8 9.20
OVERALL 0.28 5.17 152 7.22
PERFORMANCE INDICATORS / HUMAN RESOURCES

22 CCI SUSTAINABILITY REPORT 2017
Energy Use in Core Operations (Million MJ) *
Fuel - Plant Purchased EnergyTOTAL
Heavy fuel oil Diesel LPG Natural gas Electricity Steam
Turkey
2013 0 3.23 59.62 255.56 391.25 0 709.66
2014 0 1.75 55.69 269.10 385.69 0 712.23
2015 0 4.07 51.95 281.96 404.47 0 742.45
2016 0 2.88 35.63 263.24 400.74 0 702.49
2017 0 3.91 25.69 306.77 422.59 0 758.96
Jordan
2013 0 7.45 4.66 0 19.27 0 31.38
2014 5.28 3.41 4.00 0 22.60 0 35.29
2015 4.22 1.01 2.81 0 23.41 0 31.45
2016 3.97 0.61 3.00 0 23.93 0 31.51
2017 2.47 0.39 2.35 0 21.06 0 26.26
Kazakhstan
2013 0 0.54 13.90 106.65 50.20 54.63 225.92
2014 0 0.41 16.49 93.06 61.08 63.59 230.63
2015 0 0.38 14.15 82.36 71.62 60.74 229.25
2016 0 82.30 13.39 60.69 92.38 49.97 298.74
2017 0 55.21 13.37 57.13 101.15 53.65 280.51
Azerbaijan
2013 1.07 0.96 5.87 29.70 55.87 0 93.47
2014 0 0.71 7.34 29.30 60.49 0 97.84
2015 0 0.39 7.25 21.70 48.27 0 77.61
2016 0 0.00 8.75 15.70 30.52 0 54.97
2017 0 0 5.69 24.19 37.27 0 67.15
Pakistan
2014 0 180.20 21.50 11.00 85.50 0 298.20
2015 0 345.83 50.08 46.39 229.22 0 671.53
2016 0 188.70 26.80 132.60 296.30 0 644.40
2017 0 192.13 44.63 125.93 313.57 0 676.26
Kyrgyzstan2016 0 0.93 0.92 16.12 22.75 0 40.72
2017 0 0.40 1.39 16.70 21.20 0 39.69
TOTAL
2013 1.07 12.18 84.05 391.91 516.59 54.63 1,060.43
2014 5.28 186.48 105.03 402.46 615.36 63.59 1,374.20
2015 4.22 351.68 126.24 432.41 776.99 60.74 1,752.28
2016 3.97 275.42 88.49 488.35 866.62 49.97 1,772.82
2017 2.47 252.04 93.12 530.72 916.84 53.65 1,848.83
Note: These figures exclude energy use for preform injection and CO2 production processes at plants in Turkey, Kazakhstan and Azerbaijan. Energy use for the electricity generation process, which is present only at our Kazakhstan plant, is included. The energy metric used in Pakistan is the Total EUR and not the Core EUR. However, for benchmarking purposes against other international plants it is included in the table above. * The figures for 2013 in Turkey, Jordan, Kazakhstan and Azerbaijan operations and the figures for 2014-2017 in Turkey and Pakistan have received limited assurance from the independent auditing firm EY.
ENVIRONMENTEnergy Management and Climate Protection
302-1

PERFORMANCE INDICATORS 23
Total Energy Use (Million MJ) *
Fuel - Plant Purchased EnergyTOTALHeavy fuel
oil Diesel LPG Natural gas Electricity Steam
Turkey
2013 0 3.23 59.64 273.13 482.22 0 818.22
2014 0 2.01 55.69 284.11 466.83 0 808.64
2015 0 4.16 51.95 297.53 492.90 0 846.54
2016 0 3.12 35.63 277.17 492.32 0 808.24
2017 0 3.91 25.69 321.21 504.74 0 855.55
Jordan
2013 0 7.45 4.66 0 19.27 0 31.38
2014 5.28 3.41 4.00 0 22.60 0 35.29
2015 4.22 1.01 2.81 0 23.41 0 31.45
2016 3.97 0.61 3.00 0 23.93 0 31.51
2017 2.47 0.39 2.35 0 21.06 0 26.26
Kazakhstan
2013 0 0.54 13.90 184.19 96.04 54.63 349.30
2014 0 0.41 16.49 188.45 110.62 63.59 379.56
2015 0 0.38 14.15 172.11 111.72 60.74 359.10
2016 0 96.83 13.39 134.45 119.23 49.97 413.88
2017 0 75.60 13.37 129.37 142.94 53.65 414.93
Azerbaijan
2013 1.07 49.52 5.87 29.70 84.30 0 170.46
2014 0 54.70 7.34 29.30 88.90 0 180.24
2015 0 0.39 7.25 75.58 71.61 0 154.83
2016 0 0 8.75 32.65 82.74 0 124.14
2017 0 0 5.69 60.19 54.27 0 120.15
Pakistan
2014 0 434.85 45.81 57.81 233.57 0 772.04
2015 0 366.47 50.08 46.39 268.41 0 731.35
2016 0 195.60 46.49 132.59 338.56 0 713.24
2017 0 198.88 44.63 125.93 354.13 0 723.58
Kyrgyzstan2016 0 1.15 1.01 38.60 23.80 0 64.56
2017 0 0.40 1.39 17.94 21.28 0 41.01
TOTAL
2013 1.07 60.74 84.07 487.02 681.83 54.63 1,369.36
2014 5.28 495.38 129.33 559.67 922.52 63.59 2,175.77
2015 4.22 372.41 126.24 591.61 968.05 60.74 2,123.27
2016 3.97 297.31 108.27 615.46 1,080.58 49.97 2,155.56
2017 2.47 279.18 93.12 654.64 1,098.42 53.65 2,181.48
Note: This table includes data on energy use for all processes in the plants. * The figures for 2013 in Turkey, Jordan, Kazakhstan and Azerbaijan operations and the figures of 2014 - 2017 in Turkey have received limited assurance from the independent auditing firm EY.
PERFORMANCE INDICATORS / ENVIRONMENT
302-1; 302-2

24 CCI SUSTAINABILITY REPORT 2017
CCI uses two main KPIs to measure energy intensity:
1. Energy Use Ratio (MJ/L), which relate only to the core process (filling), so that the energy efficiency of the core process can be compared between plants. (For more information please see the Reporting Guidance section of the report.)2. Total Energy Use Ratio (MJ/L), which is the total absolute energy consumption (in MJ) from the plant divided by total production (in liters).
Total Energy Use Ratio (MJ/L) 2012* 2013* 2014 2015 2016 2017
Turkey 0.30 0.30 0.30* 0.30* 0.29* 0.30*
Jordan 0.47 0.41 0.41 0.33 0.30 0.25
Kazakhstan 0.69 0.68 0.64 0.65 0.76 0.65
Azerbaijan 0.74 0.75 0.72 0.74 0.70 0.68
Pakistan N/A N/A 0.59* 0.52* 0.43 0.41
Kyrgyzstan N/A N/A N/A N/A 0.76 0.69
* These figures have received limited assurance from the independent auditing firm EY.
Core Energy Use Ratio (MJ/L) 2012* 2013* 2014 2015 2016 2017
Turkey 0.26 0.26 0.26 0.27* 0.25* 0.27*
Jordan 0.47 0.41 0.41 0.33 0.30 0.25
Kazakhstan 0.28 0.44 0.40 0.41 0.55 0.44
Azerbaijan 0.39 0.41 0.39 0.37 0.37 0.38
Pakistan N/A N/A 0.52 0.48* 0.40 0.38
Kyrgyzstan N/A N/A N/A N/A 0.48 0.44
* These figures have received limited assurance from the independent auditing firm EY.
PERFORMANCE INDICATORS / ENVIRONMENT
302-3
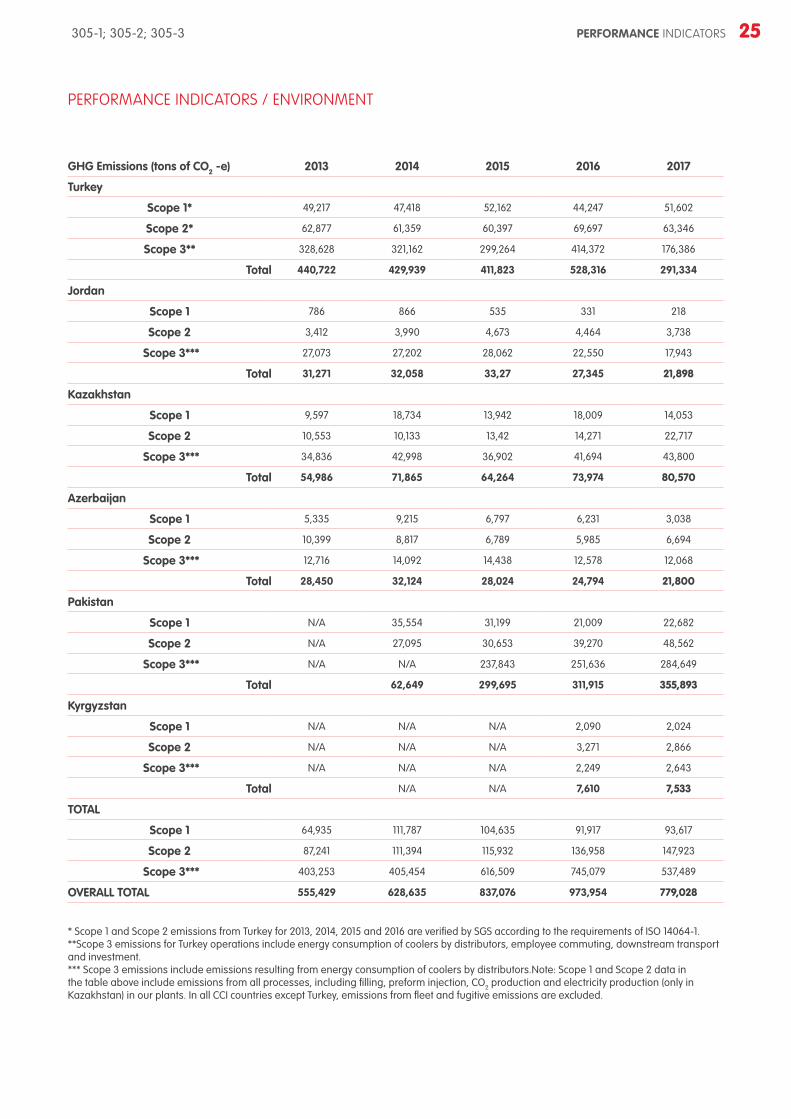
PERFORMANCE INDICATORS 25
GHG Emissions (tons of CO2 -e) 2013 2014 2015 2016 2017
Turkey
Scope 1* 49,217 47,418 52,162 44,247 51,602
Scope 2* 62,877 61,359 60,397 69,697 63,346
Scope 3** 328,628 321,162 299,264 414,372 176,386
Total 440,722 429,939 411,823 528,316 291,334
Jordan
Scope 1 786 866 535 331 218
Scope 2 3,412 3,990 4,673 4,464 3,738
Scope 3*** 27,073 27,202 28,062 22,550 17,943
Total 31,271 32,058 33,27 27,345 21,898
Kazakhstan
Scope 1 9,597 18,734 13,942 18,009 14,053
Scope 2 10,553 10,133 13,42 14,271 22,717
Scope 3*** 34,836 42,998 36,902 41,694 43,800
Total 54,986 71,865 64,264 73,974 80,570
Azerbaijan
Scope 1 5,335 9,215 6,797 6,231 3,038
Scope 2 10,399 8,817 6,789 5,985 6,694
Scope 3*** 12,716 14,092 14,438 12,578 12,068
Total 28,450 32,124 28,024 24,794 21,800
Pakistan
Scope 1 N/A 35,554 31,199 21,009 22,682
Scope 2 N/A 27,095 30,653 39,270 48,562
Scope 3*** N/A N/A 237,843 251,636 284,649
Total 62,649 299,695 311,915 355,893
Kyrgyzstan
Scope 1 N/A N/A N/A 2,090 2,024
Scope 2 N/A N/A N/A 3,271 2,866
Scope 3*** N/A N/A N/A 2,249 2,643
Total N/A N/A 7,610 7,533
TOTAL
Scope 1 64,935 111,787 104,635 91,917 93,617
Scope 2 87,241 111,394 115,932 136,958 147,923
Scope 3*** 403,253 405,454 616,509 745,079 537,489
OVERALL TOTAL 555,429 628,635 837,076 973,954 779,028
* Scope 1 and Scope 2 emissions from Turkey for 2013, 2014, 2015 and 2016 are verified by SGS according to the requirements of ISO 14064-1. **Scope 3 emissions for Turkey operations include energy consumption of coolers by distributors, employee commuting, downstream transport and investment.*** Scope 3 emissions include emissions resulting from energy consumption of coolers by distributors.Note: Scope 1 and Scope 2 data in the table above include emissions from all processes, including filling, preform injection, CO2 production and electricity production (only in Kazakhstan) in our plants. In all CCI countries except Turkey, emissions from fleet and fugitive emissions are excluded.
PERFORMANCE INDICATORS / ENVIRONMENT
305-1; 305-2; 305-3
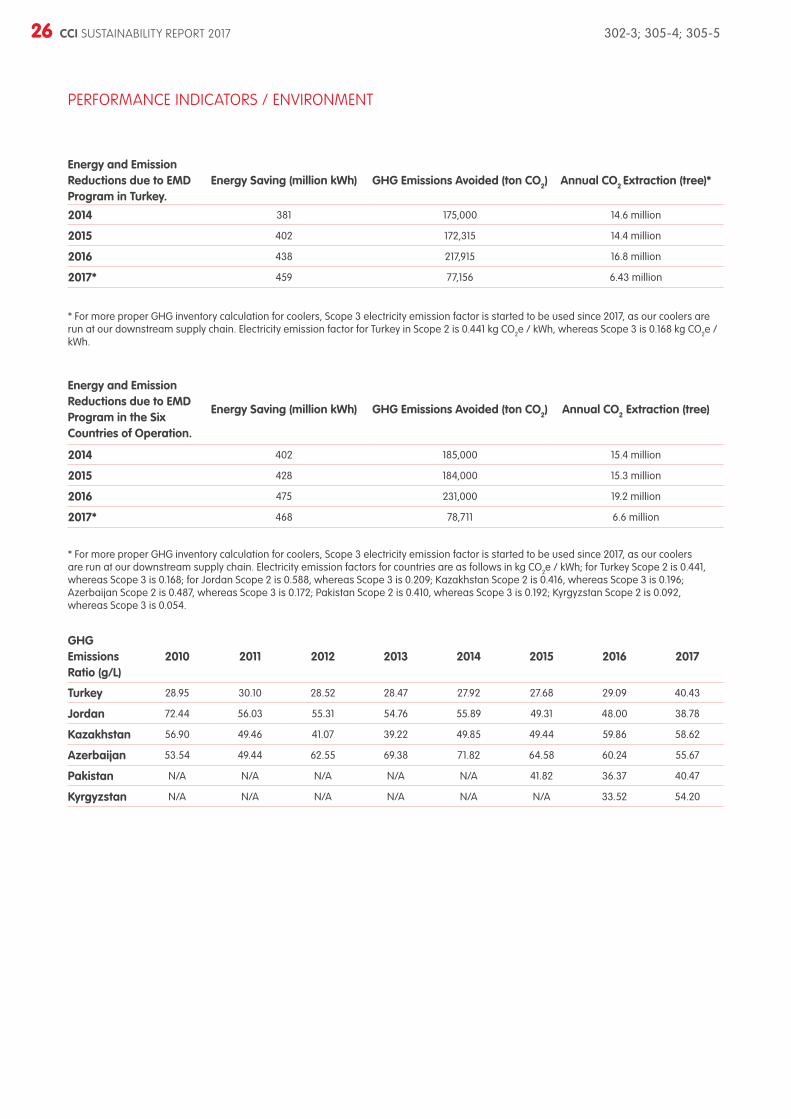
26 CCI SUSTAINABILITY REPORT 2017
Energy and Emission Reductions due to EMD Program in Turkey.
Energy Saving (million kWh) GHG Emissions Avoided (ton CO2) Annual CO2 Extraction (tree)*
2014 381 175,000 14.6 million
2015 402 172,315 14.4 million
2016 438 217,915 16.8 million
2017* 459 77,156 6.43 million
* For more proper GHG inventory calculation for coolers, Scope 3 electricity emission factor is started to be used since 2017, as our coolers are run at our downstream supply chain. Electricity emission factor for Turkey in Scope 2 is 0.441 kg CO2e / kWh, whereas Scope 3 is 0.168 kg CO2e / kWh.
Energy and Emission Reductions due to EMD Program in the Six Countries of Operation.
Energy Saving (million kWh) GHG Emissions Avoided (ton CO2) Annual CO2 Extraction (tree)
2014 402 185,000 15.4 million
2015 428 184,000 15.3 million
2016 475 231,000 19.2 million
2017* 468 78,711 6.6 million
* For more proper GHG inventory calculation for coolers, Scope 3 electricity emission factor is started to be used since 2017, as our coolers are run at our downstream supply chain. Electricity emission factors for countries are as follows in kg CO2e / kWh; for Turkey Scope 2 is 0.441, whereas Scope 3 is 0.168; for Jordan Scope 2 is 0.588, whereas Scope 3 is 0.209; Kazakhstan Scope 2 is 0.416, whereas Scope 3 is 0.196; Azerbaijan Scope 2 is 0.487, whereas Scope 3 is 0.172; Pakistan Scope 2 is 0.410, whereas Scope 3 is 0.192; Kyrgyzstan Scope 2 is 0.092, whereas Scope 3 is 0.054.
GHG Emissions Ratio (g/L)
2010 2011 2012 2013 2014 2015 2016 2017
Turkey 28.95 30.10 28.52 28.47 27.92 27.68 29.09 40.43
Jordan 72.44 56.03 55.31 54.76 55.89 49.31 48.00 38.78
Kazakhstan 56.90 49.46 41.07 39.22 49.85 49.44 59.86 58.62
Azerbaijan 53.54 49.44 62.55 69.38 71.82 64.58 60.24 55.67
Pakistan N/A N/A N/A N/A N/A 41.82 36.37 40.47
Kyrgyzstan N/A N/A N/A N/A N/A N/A 33.52 54.20
PERFORMANCE INDICATORS / ENVIRONMENT
302-3; 305-4; 305-5

PERFORMANCE INDICATORS 27
Emissions Savings in Turkey (tons of CO2-e) ScopeAMOUNT
2015 2016 2017
Product distribution fleet improvement Scope 1 2,075 0 0
Fugitive emissions reductions in coolers Scope 1 145 2,651 7,782
Energy efficiency and low carbon projects in plants Scope 1+2 1,402 80,289 661
IT Improvements Scope 3 0 0 840
Route optimization Scope 3 1,050 1,050 1,400
Cooler EMD Improvement Scope3 172,315 201,317 77,156*
TOTAL 176,987 285,307 87,839
* Since 2017, ‘Cooler EMD Improvement’ saving is started to be calculated by Scope 3 Electricity Emission Factor, which is 0.168 kg CO2e/kWh; instead of Scope 2 Electricity Emission factor, which is 0.441 kg CO2e/kWh.
Energy Saved and GHG Emissions Reduced due to Efficiency Projects in Plants
2015 2016 2017
Energy (Million MJ)
GHG Emissions
(tons of CO2)
Monetary Saving (USD)
Energy (Million MJ)
GHG Emissions
(tons of CO2)
Monetary Saving (USD)
Energy (Million MJ)
GHG Emissions
(tons of CO2)
Monetary Saving (USD)
Turkey 11.7 1,402 247,886 1,591.89 4,417.11 269,938 4.57 660.94 196,168
Jordan 2.5 200 40,869 2.87 372.85 95,100 1.04 169.72 71,499
Kazakhstan 0 0 0 0 0 0 19.60 2,265.30 199,514
Azerbaijan 0.2 28 2,655 0.39 53.82 4,403 0.18 23.70 2,576
Pakistan 12.8 1,168 387,455 16.34 1,699 19,163 1.41 99.14 85,459
Kyrgyzstan N/A N/A N/A 9.09 431.07 83,831.06 3.38 86.47 30,586
TOTAL 27.2 2,798 678,865 1,620.58 6,973.85 472,435.06 30.18 3,305.27 585,802
EMD Ratio (%) 2011 2012 2013 2014 2015 2016 2017
Turkey 35 59 77 84 87 88 90
Jordan 5 5 5 5 5 5 60
Kazakhstan 12 19 29 29 39 41 70
Azerbaijan 50 50 50 50 50 50 87
Pakistan N/A N/A N/A N/A N/A N/A 0.15
Kyrgyzstan N/A N/A N/A N/A N/A 72.5 76
PERFORMANCE INDICATORS / ENVIRONMENT
302-3; 305-5

28 CCI SUSTAINABILITY REPORT 2017
Water Management
Water Use Ratio (L/L)
2013 2014 2015 2016 2017
Turkey 1.41 1.41* 1.44* 1.47* 1.56*
Jordan 2.00 2.04 1.89 1.71 1.44
Kazakhstan 1.65 1.55 1.47 1.67 1.59
Azerbaijan 1.92 1.82 1.85 1.82 1.73
Pakistan N/A 2.40* 2.03* 2.00 1.93
Kyrgyzstan N/A N/A N/A 1.88 1.65
* WUR figures for Turkey are assured by an independent third party.
Total Water Withdrawal by Region (m3)
2013 2014 2015 2016 2017
Turkey 3,912,240* 3,832,252* 4,000,719* 4,130,826* 4,439,083*
Jordan 153,656* 177,081 180,232 177,137 153,807
Kazakhstan 849,980* 896,218 816,221 911,071 1,005,964
Azerbaijan 436,075* 457,873 388,103 251,715 304,544
Pakistan N/A 3,138,972* 2,829,952* 3,161,737 3,418,428
Kyrgyzstan N/A N/A N/A 160,373 148,610
TOTAL 5,351,951 8,502,396 8,215,227 8,792,859 9,321,826
* Total water withdrawal figures for Turkey are assured by an independent third party.
Volume of Water Recycled and Reused (m3)
2013 2014 2015 2016 2017
Turkey 284,782 40,337 80,000 341,973 345,551
Jordan 0 0 0 0 0
Kazakhstan 0 0 0 0 0
Azerbaijan 5,580 5,942 5,191 5,236 5,771
Pakistan N/A N/A 68,216 129,005 183,499
Kyrgyzstan N/A N/A 720 2,660
TOTAL 290,362 46,279 153,407 476,934 537,481
PERFORMANCE INDICATORS / ENVIRONMENT
301-2; 303-1; 303-3

PERFORMANCE INDICATORS 29
Percentage of Water Recycled and Reused (%)
2013 2014 2015 2016 2017
Turkey 7.3 1.1 2.0 7.4 7.8
Jordan 0 0 0 0 0
Kazakhstan 0 0 0 0 0
Azerbaijan 1.3 1.3 1.3 2.08 1.9
Pakistan N/A N/A 2.4 4 5.4
Kyrgyzstan N/A N/A N/A 0.5 1.8
TOTAL 5.4 0.5 1.9 5.4 5.8
Water Discharge by Destination (m3)
Destination 2015 2016 2017
Turkey
Surface water 421,941 530,676 677,174
Organized Industrial Zone 181,205 505,514 656,115
Municipal sewage system 489,190 191,590 121,795
JordanSurface water 0 0 0
Municipal sewage system 84,771 73,125 46,685
KazakhstanSurface water 0 0 0
Municipal sewage system 198,552 303,110 348,530
AzerbaijanSurface water 0 0 0
Municipal sewage system 204,397 132,284 118,654
Pakistan
Surface water 156,553 147,484 157,141
Organized Industrial Zone 519,763 168,036 629,581
Municipal sewage system 735,906 1,066,204 748,482
Kyrgyzstan
Surface water N/A 0 0
Organized Industrial Zone N/A 0 0
Municipal sewage system N/A 80,893 64,284
TOTAL
Surface water 578,494 678,160 834,315
Organized Industrial Zone 700,968 673,550 1,285,696
Municipal sewage system 1,712,816 1,847,206 1,448,430
PERFORMANCE INDICATORS / ENVIRONMENT
Water Discharge (L/L) 2006 2013 2014 2015 2016 2017
Turkey 0.39 0.35 0.41 0.39 0.47 0.51
Jordan 2.43 1.00 1.04 0.89 0.71 0.44
Kazakhstan 0.87 0.50 0.42 0.36 0.56 0.55
Azerbaijan 1.16 1.05 0.94 0.97 0.96 0.84
Pakistan N/A N/A 1.35 1.01 0.82 0.87
Kyrgyzstan N/A N/A N/A N/A 0.95 0.71
303-3; 306-1

30 CCI SUSTAINABILITY REPORT 2017
The Coca-Cola Company Requirements for Treated Wastewater Quality*
Water Quality Parameters Maximum Allowable Limit Values5-Day Biological Oxygen Demand < 50 mg/l
pH Level 6.5-8**
Total Suspended Solids < 50 mg/l
Total Dissolved Solids < 2,000 mg/l
Total Nitrogen < 5 mg/l
Total Phosphorus < 2 mg/l
PERFORMANCE INDICATORS / ENVIRONMENT
306-1

PERFORMANCE INDICATORS 31
PERFORMANCE INDICATORS / ENVIRONMENT
Packaging Materials Used (tons) Steel Crown PE Closure PET preform
and resin GlassAseptic Carton
PackagingCarton
Aluminum Cans &
Cans end
Plastic Shrink & Stretch
Turkey
2013 945 4,112 55,369 25,664 458 8,481 10,866 6,667
2014 987 3,419 43,168 27,941 4,958 7,692 11,304 5,853
2015 1,259 3,986 46,274 39,414 5,131 9,742 12,533 6,689
2016 1,385 3,966 4,758 45,844 4,825 8,924 12,008 7,082
2017 1,552 3,970 44,585 54,433 4,668 19,276 13,926 6,976
Jordan
2013 62 105 1,056 7,005 0 262 1,076 237
2014 49 121 1,247 4,942 0 317 1,293 274
2015 45 129 1,234 1,272 0 220 1,719 289
2016 28 151 1,362 200 0 417 1,874 379
2017 29 126 1,984 242 0 309 1,733 370
Kazakhstan
2013 69 1,263 16,305 6,124 694 1,329 339 1,878
2014 32 1,411 17,418 3,974 663 1,685 361 1,889
2015 44 1,367 17,464 3,674 581 1,696 325 205
2016 49 1,175 14,098 4,537 650 1,245 194 1,536
2017 50 1,475 18,234 4,638 571 1,518 160 2,169
Azerbaijan
2013 0 817 9,939 0 0 786 0 850
2014 0 896 7,171 0 0 570 0 855
2015 0 528 6,776 0 0 384 0 737
2016 0 375 4,276 0 0 275 0 465
2017 0 474 5,518 0 0 295 0 577
Pakistan
2015 21 237 43,783 21,762 n/a 4,263 571 4,161
2016 2,182 2,951 56,817 3,304 n/a 6,042 907 5,178
2017 2,066 2,525 59,082 10,431 n/a 446 1,052 5,473
Kyrgyzstan2016 0 250 2,932 0 0 192 0 266
2017 0 254 3,068 0 0 244 0 269
Sustainable Packaging and Waste
301-3

32 CCI SUSTAINABILITY REPORT 2017
Total Weight of Waste by Type and Disposal Method (Tons) Turkey* Jordan Kazakhstan* Azerbaijan Pakistan Kyrgyzstan
2013
Hazardous
Reuse 0.0 0.0 0.8 0.0 N/A N/A
Recycle 15.4 0.0 0.0 0.0 N/A N/A
Landfill 7.6 0.0 0.0 0.0 N/A N/A
Incineration 8.0 0.0 0.0 0.0 N/A N/A
Recovery 609.8 0.0 0.0 0.0 N/A N/A
TOTAL 640.8 0.0 1.0 0.0 N/A N/A
Non-Hazardous
Reuse 6.3 0.0 650.6 77.0 N/A N/A
Recycle 12,510 467.5 85.9 212.6 N/A N/A
Landfill 520.7 26.2 79.1 1.2 N/A N/A
Recovery 132.6 0.0 0.0 0.0 N/A N/A
TOTAL 13,169.6 493.7 815.6 290.8 N/A N/A
OVERALL TOTAL 13,810.4 493.7 816.6 290.8 N/A N/A
2014
Hazardous
Reuse 2.4 0.0 0.0 0.0 4.0 N/A
Recycle 69.4 0.0 1.5 0.0 2.6 N/A
Landfill 5.9 0.0 0.0 0.0 28.0 N/A
Incineration 8.2 0.0 0.4 0.0 122.8 N/A
Recovery 415.8 0.0 0.0 0.0 0.0 N/A
TOTAL 501.7 0.0 1.9 0.0 157.4 N/A
Non-Hazardous
Reuse 0.0 0.0 204.9 0.0 6,221 N/A
Recycle 12,032.5 260.3 757.8 486.0 10,630 N/A
Landfill 407.6 0.0 89.2 31.0 422.0 N/A
Recovery 0.0 0.0 0.0 0.0 0.0 N/A
TOTAL 12,440.1 260.3 1,051.9 517.0 17,273.0 N/A
OVERALL TOTAL 12,941.8 260.3 1,053.8 517.0 17,430.4 N/A
2015
Hazardous
Reuse 0.0 0.0 0.0 0.0 0.0 N/A
Recycle 18.7 0.0 17.1 0.0 0.0 N/A
Landfill 4.3 0.0 0.0 13.5 24.1 N/A
Incineration 18.6 0.0 0.4 0.0 324.0 N/A
Recovery 2.0 0.0 0.0 0.0 0.0 N/A
TOTAL 43.6 0.0 17.5 13.5 348.1 N/A
Non-Hazardous
Reuse 0.0 0.0 173.5 0.0 3,303.7 N/A
Recycle 7,661.7 225.3 823.6 241.1 9,511.9 N/A
Landfill 283.0 0.0 71.6 17.4 320.7 N/A
Recovery 144.8 0.0 0.0 0.0 0.0 N/A
TOTAL 8,089.5 225.3 1,068.7 258.5 13,136.3 N/A
OVERALL TOTAL 8,133.1 225.3 1,086.2 272.0 13,484.4 N/A
2016
Hazardous
Reuse 78.3 0.0 0.0 0.0 0.0 N/A
Recycle 243.7 0.0 9.4 19.6 0.0 N/A
Landfill 7.6 0.0 0.0 0.0 0.345 N/A
Incineration 33.5 0.0 0.52 0.0 148,523 N/A
Recovery 0.4 0.0 0.0 0.0 0.0 2.8
TOTAL 363.6 0.0 9.9 19.6 148,523.3 2.8
Non-Hazardous
Reuse 2,025.2 0.0 123.1 0.0 1,945 317.6
Recycle 10,722.1 289.0 903.2 129.5 13,343 0.0
Landfill 696.8 0.0 100.5 4.6 326.2 3.5
Recovery 115.0 0.0 0.0 0.0 0.0 0.0
TOTAL 13,559.1 289.0 1,126.8 134.1 15,614.2 321.1
OVERALL TOTAL 13,922.7 289.0 1,136.7 153.7 164,137.5 323.9
2017
Hazardous
Reuse 0.8 0.0 0.0 0.0 0.0 0.0
Recycle 28.1 0.0 6.9 0.0 0.0 0.0
Landfill 13.7 1.9 0.0 18.0 0.0 0.0
Incineration 273.3 0.0 0.45 0.0 280.4 0.0
Recovery 116.8 0.0 0.0 0.0 0.0 2.3
TOTAL 432.7 1.9 7.3 18.0 280.4 2.3
Non-Hazardous
Reuse 1,361.8 0.0 160.5 7.0 668.6 258.78
Recycle 10,859.6 157.7 742.4 166.8 17,327.2 0.0
Landfill 677.7 12.0 105.5 0.0 779.2 3.76
Recovery 107.0 0.0 0.0 10.0 0.0 0.0
TOTAL 13,006.2 169.7 1,008.4 183.8 18,775 262.54
OVERALL TOTAL 13,438.9 171.6 1,015.7 201.8 19,055.4 264.8
PERFORMANCE INDICATORS / ENVIRONMENT
301-2; 306-2

PERFORMANCE INDICATORS 33
Total Waste Recycling Rate (%) 2006 2013 2014 2015 2016 2017
Turkey 90.99 96.12 96.66 95.57 94.79 96.00
Jordan 81.60 94.70 90.45 94.10 90.30 91.90
Kazakhstan 94.67 90.30 91.70 93.00 91.20 90.00
Azerbaijan 75.55 99.60 94.00 95.60 96.30 97.80
Pakistan N/A N/A N/A 70.54 93.00 94.44
Kyrgyzstan N/A N/A N/A N/A 98.10 97.70
2017 Resin Saving (tons)
Turkey 1,740
Jordan 1.26
Kazakhstan 0
Azerbaijan 360
Pakistan 623.43
Kyrgyzstan 7.8
TOTAL 2,732.49
2017 Glass Saving (tons)
Turkey 1,267
Jordan 19
Kazakhstan 0
Azerbaijan 0
Pakistan 0
Kyrgyzstan 0
TOTAL 1,286
Total Hours of Environment Training (man-hours)
2013 2014 2015 2016 2017
Turkey 2,490 3,342 2,590 2,818 5,043
Jordan 80 34 56 95 66
Kazakhstan 63 98 344 295 446
Azerbaijan 79 224 224 188 834
Pakistan N/A N/A 1,971 1,072 1,901
Kyrgyzstan N/A N/A N/A 434 284
TOTAL 2,712 3,698 5,185 4,902 8,574
PERFORMANCE INDICATORS / ENVIRONMENT
Total Waste Ratio (g/L) 2006 2013 2014 2015 2016 2017
Turkey 3.74 4.99* 4.77* 5.09 4.99 4.77
Jordan 15.72 6.44* 3.29 2.46 3.07 1.35
Kazakhstan 4.14 1.59* 1.82* 1.96 2.08 1.60
Azerbaijan 0.65 1.28* 2.06 1.23 0.96 1.17
Pakistan N/A N/A N/A 9.66 8.90 10.77
Kyrgyzstan N/A N/A N/A N/A 3.81 2.93
301-2; 306-2

34 CCI SUSTAINABILITY REPORT 2017
GRI STANDARDS CONTENT INDEX
Our report is composed of three full sections. On GRI Table; page numbers in RED indicate that referenced page is on “Sustainability Approach”, numbers in PURPLE indicate that referenced page is on “Sustainability in Review”, numbers in ORANGE indicate that referenced page is on “Performance Indicators” sections. Numbers in BLACK indicate that referenced source is CCI Annual Report 2017.
GRI Standard Disclosure Page
GRI 101: Foundation 2016
GRI 102: General Disclosures 2016
Organizational Profile
102-1 Name of the organization CCI at a Glance 4
102-2 Activities, brands, products, and services CCI at a Glance 4,7
102-3 Location of headquarters Contact 32, 64, 44
102-4 Location of operations CCI at a Glance 4,7
102-5 Ownership and legal formCorporate Website, http://cci.com.tr/Portals/3/Documents/PDF/CCI_Shareholder_Structure.pdf?ver=2017-06-05-133510-227
102-6 Markets served CCI at a Glance 4,7
102-7 Scale of the organization CCI at a Glance 6,7
102-8 Information on employees and other workers Performance Indicators 9-13
102-9 Supply chain Integrating Sustainability 14
102-10 Significant changes to the organization and its supply chain Corporate Website, http://cci.com.tr/en/investor-relations
102-11 Precautionary Principle or approach Corporate Governance and Ethics 25, 26
102-12 External initiatives External Recognition, Integrating Sustainability 13, 20, 21
102-13 Membership of associations Integrating Sustainability 21
Strategy 102-14 Statement from senior decision-maker Message from the CEO 2-3
Ethics and integrity 102-16 Values, principles, standards, and norms of behavior Corporate Governance and Ethics 26, 28
Governance 102-18 Mechanisms for advice and concerns about ethics Corporate Governance and Ethics 25, 26
Stakeholder Engagement
102-40 List of stakeholder groupsStakeholder Engagement; 22-24
How We Respond to Stakeholders’ Questions and Concerns? 23
102-41 Collective bargaining agreements Human Rights 9
102-42 Identifying and selecting stakeholdersStakeholder Engagement; 22-24
GRI Content Index: CCI defines all individuals and institutions that are influenced by or have an influence on Company’s operations as its stakeholders. 34
102-43 Approach to stakeholder engagementStakeholder Engagement; 22-24
How We Respond to Stakeholders’ Questions and Concerns? 23
102-44 Key topics and concerns raised How We Respond to Stakeholders’ Concerns 23
Reporting Practice
102-45 Entities included in the consolidated financial statements About the Report; CCI at a Glance 1; 6-7
102-46 Defining report content and topic Boundaries About the Report; Materiality Analysis 1; 21; 22
102-47 List of material topics Materiality Analysis 22
102-48 Restatements of information About the Report 1
102-49 Changes in reporting Integrating Sustainability, Materiality Analysis 14; 21; 22
102-50 Reporting period About the Report 1
102-51 Date of most recent report GRI Content Index: 2017 34
102-52 Reporting cycle GRI Content Index: Annual 34
102-53 Contact point for questions regarding the report About the Report 1
102-54 Claims of reporting in accordance with the GRI Standards GRI Content Index: This report has been prepared in accordance with the GRI Standards: Core option. 34
102-55 GRI content index GRI Content Index 34-39
102-56 External assurance About the Report; Independent Assurance Letter 1; 40
102-42; 102-51; 102-52; 102-54; 102-55

PERFORMANCE INDICATORS 35
GRI STANDARDS CONTENT INDEX
GRI 200: Economic Standard Series
Material Topics Disclosure Page
Corporate Governance
GRI 103: Management Approach 2016
103-1 Explanation of the Material Topic and its BoundariesIntegrating Sustainability, Materiality Analysis 14; 22
Corporate Governance and Ethics 25-27
103-2 The Management Approach and its Components Integrating Sustainability 14
103-3 Evaluation of th Management Approach Integrating Sustainability 14
Economic
GRI 103: Management Approach 2016
103-1 Explanation of the Material Topic and its Boundaries Materiality Analysis: Integrating Sustainability 22; 14
Performance
GRI 103: Management Approach 2016
103-2 The Management Approach and its Components Integrating Sustainability 14
103-3 Evaluation of th Management Approach Integrating Sustainability 14
GRI 201: Economic Performance 2016
201-1 Direct economic value generated and distributed CCI Annual Report 2017 5
201-2 Financial implications and other risks and opportunities due to climate change Energy Efficiency and Climate Protection 42
201-4 Financial assistance received from government CCI Annual Report 2017 92-97
Indirect Economic Impact
GRI 103: Management Approach 2016
103-1 Explanation of the Material Topic and its BoundariesMateriality Analysis: Integrating Sustainability 22; 14
Economic Impact 23
103-2 The Management Approach and its Components Integrating Sustainability 14
103-3 Evaluation of th Management Approach Integrating Sustainability 14
GRI 203: Indirect Economic Impacts 2016
203-1 Infrastructure investments and services supported
Water Stewardship 39
The Coca-Cola Life Plus Foundation 39, 54-55
The Anadolu Foundation 24
203-2 Significant indirect economic impacts Economic Impact 23
GRI 204: Procurement Practices 2016
204-1 Proportion of spending on local suppliers Excellence in Supply Chain, Local Procurement 6; 10,11
Business Ethics
GRI 103: Management Approach 2016
103-1 Explanation of the Material Topic and its BoundariesMateriality Analysis: Integrating Sustainability 22; 14
Corporate Governance and Ethics 25, 27
103-2 The Management Approach and its Components Integrating Sustainability 14
103-3 Evaluation of th Management Approach Integrating Sustainability 14
GRI 205: Anti-corruption 2016
205-1 Operations assessed for risks related to corruption “GRI Content Index: All CCI operations are assessed for risks related to corruption.” 35
205-2 Communication and training about anti-corruption policies and procedures Ethics 25, 26; 28
GRI 206: Anti-competitive Behavior 2016
206-1 Legal actions for anti-competitive behavior, anti-trust, and monopoly practices
GRI Content Index: During the reporting period, there were no legal actions against us for anti-competitive behavior, anti-trust or monopoly practices. 35
102-55; 205-1; 206-1

36 CCI SUSTAINABILITY REPORT 2017
GRI STANDARDS CONTENT INDEX
GRI 300: Environmental Standards Series
Material Topics Disclosure Page
Packaging and Waste
GRI 103: Management Approach 2016
103-1 Explanation of the Material Topic and its Boundaries
Materiality Analysis 22
Integrating Sustainability 14
Sustainable Packaging 58-61
Sustainable Sourcing 57
103-2 The Management Approach and its Components Integrating Sustainability 14
103-3 Evaluation of th Management Approach Integrating Sustainability 14
GRI 301: Materials 2016
301-2 Materials used by weight or volume Sustainable Packaging, Performance Indicators 58-61; 28, 32,33
301-3 Reclaimed products and their packaging materials Performance Indicators 31
GRI 306: Effluents and Waste 2016
306-2 Waste by type and disposal method Performance Indicators 32,33
Energy Efficiency and Carbon Reduction
GRI 103: Management Approach 2016
103-1 Explanation of the Material Topic and its Boundaries
Materiality Analysis 22
Integrating Sustainability 14
Energy Management and Climate Protection 42
103-2 The Management Approach and its Components Integrating Sustainability 14
103-3 Evaluation of th Management Approach Integrating Sustainability 14
GRI 302: Energy 2016
302-1 Energy consumption within the organization Performance Indicators 22, 23
302-2 Energy consumption outside of the organization Performance Indicators 1-7; 23
302-3 Energy intensity Performance Indicators 24
302-4 Reduction of energy consumption Performance Indicators 26-27
302-5 Reductions in energy requirements of products and services Energy Management and Climate Protection 42-48
GRI 305: Emissions 2016
305-1 Direct (Scope 1) GHG emissionsPerformance Indicators, 25, 1-6;
Energy Management and Climate Protection 45-48
305-2 Energy indirect (Scope 2) GHG emissions Performance Indicators 25, 1-6;
305-3 Other indirect (Scope 3) GHG emissions Performance Indicators 25, 1-6;
305-4 GHG emissions intensity Performance Indicators 26
305-5 Reduction of GHG emissionsPerformance Indicators 26, 27
Energy Efficiency and Climate Protection 48
Water Use
GRI 103: Management Approach 2016
103-1 Explanation of the Material Topic and its Boundaries
Materiality Analysis 22
Integrating Sustainability 14
Water Management 49
103-2 The Management Approach and its Components Integrating Sustainability 14
103-3 Evaluation of th Management Approach Integrating Sustainability 14
GRI 303: Water and Effluents 2018
303-1 Interactions with water as a shared resource Performance Indicators 28
303-2 Management of water discharge related impacts Water Management 51
303-3 Water withdrawal Performance Indicators 28, 29
102-55

PERFORMANCE INDICATORS 37
GRI STANDARDS CONTENT INDEX
Wastewater
GRI 103: Management Approach 2016
103-1 Explanation of the Material Topic and its Boundaries
Materiality Analysis 22
Integrating Sustainability 14
Waste Water Management 56
Sustainable Sourcing 57
103-2 103-2 The Management Approach and its Components Integrating Sustainability 14
103-3 Evaluation of th Management Approach Integrating Sustainability 14
GRI 306: Effluents and Waste 2016
306-1 Water discharge by quality and destination Performance Indicators 29, 30
306-5 Water bodies affected by water discharges and/or runoff Water Management 51-56
Transport
GRI 103: Management Approach 2016
103-1 Explanation of the Material Topic and its Boundaries
Materiality Analysis 22
Integrating Sustainability 14
Transport and Distribution 45
103-2 The Management Approach and its Components Integrating Sustainability 14
103-3 Evaluation of th Management Approach Integrating Sustainability 14
Compliance
GRI 103: Management Approach 2016
103-1 Explanation of the Material Topic and its Boundaries
Materiality Analysis 22
Integrating Sustainability 14
Corporate Governance and Ethics 26, 28
103-2 The Management Approach and its Components Integrating Sustainability 14
103-3 Evaluation of th Management Approach Integrating Sustainability 14
GRI 307: Environmental Compliance 2016
307-1 Non-compliance with environmental laws and regulations GRI Content Index: During the reporting period, no significant fines* were paid for non-compliance with environmental laws and regulations. 37
GRI 419: Socioeconomic Compliance 2016
419-1 Non-compliance with laws and regulations in the social and economic area
GRI Content Index: During the reporting period, no significant fines were paid for non-compliance with laws and regulations in the social and economic area. 37
Supplier and Distributor Assessment
GRI 103: Management Approach 2016
103-1 Explanation of the Material Topic and its Boundaries
Materiality Analysis 22
Integrating Sustainability 14
Excellence in Supply Chain 6
Superior Execution 4-5
103-2 The Management Approach and its Components Integrating Sustainability 14
103-3 Evaluation of th Management Approach Integrating Sustainability 14
GRI 308: Supplier Environmental Assessment 2016
308-1 New suppliers that were screened using environmental criteria Excellence in Supply Chain 6
GRI 414: Supplier Social Assessment 2016
414-1 New suppliers that were screened using social criteria Excellence in Supply Chain 6
102-55; 307-1; 419-1; 405-2; 406-1

38 CCI SUSTAINABILITY REPORT 2017
GRI STANDARDS CONTENT INDEX
GRI 400: Social Standards Series
Material Topics Disclosure Page
Diversity and Inclusion (incl. women empowerment)
GRI 103: Management Approach 2016
103-1 Explanation of the Material Topic and its Boundaries
Materiality Analysis 22
Integrating Sustainability 14
Diversity and Inclusion 12-13
Women’s Empowerment 34
103-2 The Management Approach and its Components Integrating Sustainability 14
103-3 Evaluation of the Management Approach Integrating Sustainability 14
GRI 401: Employment 2016
401-1 New employee hires and employee turnover Performance Indicators 15, 16
401-2 Benefits provided to full-time employees that are not provided to temporary or part-time employees Performance Indicators 19
401-3 Parental leave Diversity and Inclusion 12
GRI 404: Training and Education 2016
404-1 Average hours of training per year per employee Learning and Development 13
GRI 404: Training and Education 2016
405-1 Diversity of governance bodies and employeesPerformance Indicators 9-13
Diversity and Inclusion 12-13
405-2 Ratio of basic salary and remuneration of women to menGRI Content Index: As CCI “equal pay for equal work” is adopted as per Pay Policy principles in order to reward our employees in accordance with their valuable contributions to our company regardless of gender bias.
38
GRI 406: Non-discrimination 2016
406-1 Incidents of discrimination and corrective actions taken GRI Content Index: During the reporting period, there have been no incidents of discrimination at CCI operations. 38
Labour / Management Relations
GRI 103: Management Approach 2016
103-1 Explanation of the Material Topic and its Boundaries
Materiality Analysis 22
Integrating Sustainability 14
Workplace Rights 8-9
103-2 The Management Approach and its Components Integrating Sustainability 14
103-3 Evaluation of th Management Approach Integrating Sustainability 14
GRI 402: Labor/Management Relations 2016
402-1 Minimum notice periods regarding operational changes CCI Annual Report 2017 63
GRI 407: Freedom of Association and Collective Bargaining 2016
407-1 Operations and suppliers in which the right to freedom of association and collective bargaining may be at risk Workplace Rights 9
GRI 408: Child Labor 2016
408-1 Operations and suppliers at significant risk for incidents of child labor CCI Annual Report 2017 29
GRI 409: Forced or Compulsory Labor 2016
409-1 Operations and suppliers at significant risk for incidents of forced or compulsory labor CCI Annual Report 2017 29
GRI 412: Human Rights Assessment 2016
412-1 Operations that have been subject to human rights reviews or impact assessments Workplace Rights 9-10
Occupational Health and Safety
GRI 103: Management Approach 2016
103-1 Explanation of the Material Topic and its Boundaries
Materiality Analysis 22
Integrating Sustainability 14
Occupational Health and Safety 15, 16
103-2 The Management Approach and its Components Integrating Sustainability 14
103-3 Evaluation of th Management Approach Integrating Sustainability 14
GRI 403: Occupational Health and Safety 2018
403-1 Occupational health and safety management system Occupational Health and Safety 15, 16
403-2 Hazard identification, risk assessment, and incident investigation Performance Indicators 20-21
102-55; 410-1; 416-2; 417-3

PERFORMANCE INDICATORS 39
GRI STANDARDS CONTENT INDEX
Security Practices
GRI 103: Management Approach 2016
103-1 Explanation of the Material Topic and its Boundaries
Materiality Analysis 23
Integrating Sustainability 14
Health and Safety 15, 16
103-2 The Management Approach and its Components Integrating Sustainability 14
103-3 Evaluation of th Management Approach Integrating Sustainability 14
GRI 410: Security Practices 2016
410-1 Security personnel trained in human rights policies or procedures
GRI Content Index: All security personnel working in CCI operations are trained in human rights policies and procedures. 39
Community Engagement
GRI 103: Management Approach 2016
103-1 Explanation of the Material Topic and its Boundaries
Materiality Analysis 22
Integrating Sustainability 14
Community Development 22
103-2 The Management Approach and its Components Integrating Sustainability 14
103-3 Evaluation of th Management Approach Integrating Sustainability 14
GRI 413: Local Communities 2016
413-1 Operations with local community engagement, impact assessments, and development programs Community Development 22
Consumer Health Well-Being
GRI 103: Management Approach 2016
103-1 Explanation of the Material Topic and its Boundaries
Materiality Analysis 22
Integrating Sustainability 14
Product Safety and Quality 1-4
Consumer Well-Being 1
103-2 The Management Approach and its Components Integrating Sustainability 14
103-3 Evaluation of th Management Approach Integrating Sustainability 14
GRI 416: Customer Health and Safety 2016
416-1 Assessment of the health and safety impacts of product and service categories Product Safety and Quality 1-4
416-2 Incidents of non-compliance concerning the health and safety impacts of products and services
GRI Content Index: During the reporting period, there have been no incidents of non-compliance concerning the health and safety impacts of products and services.
39
GRI 417: Marketing and Labeling 2016
417-3 Incidents of non-compliance concerning marketing communications
GRI Content Index: During the reporting period, there have been no incidents of non-compliance concerning marketing communications. 39
Product Quality and Labeling
GRI 103: Management Approach 2016
103-1 Explanation of the Material Topic and its Boundaries
Materiality Analysis 22
Integrating Sustainability 14
Product Safety and Quality 2-4
Consumer Well-Being 1
103-2 The Management Approach and its Components Integrating Sustainability 14
103-3 Evaluation of th Management Approach Integrating Sustainability 14
GRI 417: Marketing and Labeling 2016
417-1 Requirements for product and service information and labeling Consumer Well-Being 1
417-2 Incidents of non-compliance concerning product and service information and labeling
GRI Content Index: During the reporting period, there have been no incidents of non-compliance concerning product and service information and labeling 39
Sustainable Agriculture (sugar)
GRI 103: Management Approach 2016
103-1 Explanation of the Material Topic and its Boundaries
Materiality Analysis 22
Integrating Sustainability 14
Sustainable Sourcing 57
103-2 The Management Approach and its Components Integrating Sustainability 14
103-3 Evaluation of th Management Approach Integrating Sustainability 14
102-55; 417-2

40 CCI SUSTAINABILITY REPORT 2017
UN Global Compact Communication on Progress
Human Rights
Principle 1: Businesses should support and respect the protection of internationally proclaimed human rights; and
Workplace Rights 8-13
Community Development 22-39
Principle 2: make sure that they are not complicit in human rights abuses. Workplace Rights 8-13
Community Development 22-39
Labour
Principle 3: Businesses should uphold the freedom of association and the effective recognition of the right to collective bargaining; Workplace Rights 9
Principle 4: the elimination of all forms of forced and compulsory labour; Workplace Rights 8-11
Principle 5: the effective abolition of child labour; and Workplace Rights 8-11
Principle 6: the elimination of discrimination in respect of employment and occupation.
Workplace Rights 8-13
Diversity and Inclusion 12-13
Environment
Principle 7: Businesses should support a precautionary approach and environmental challenges;
Energy Efficiency and Climate Protection 42-60
Principle 8: undertake initiatives to promote greater environmental responsibility; and Our Environmental Footprint 42-60
Principle 9: encourage the development and diffusion of environmentally friendly technologies. Our Environmental Footprint 42-60
Anti-Corruption Principle 10: Businesses should work against corruption in all its forms, including extortion and bribery. Corporate Governance and Ethics 25, 28
GRI STANDARDS CONTENT INDEX

PERFORMANCE INDICATORS 41
INDEPENDENT ASSURANCE STATEMENT
102-56

42 CCI SUSTAINABILITY REPORT 2017
GREENHOUSE GAS VERIFICATION STATEMENT

PERFORMANCE INDICATORS 43PERFORMANCE INDICATORS 43
44 CCI SUSTAINABILITY REPORT 2017
REPORTING CONSULTANT & DESIGN
www.esgturkey.com
CCI
Burcu CoşkunGroup Corporate Affairs [email protected]
OSB Mah. Deniz Feneri Sokak No: 434776 Dudullu Ümraniye İstanbulTel: +90 216 528 40 00 Fax: +90 216 510 70 12www.cci.com.tr
LEGAL DISCLAIMER
This sustainability report (the Report) was prepared by CCI within the principles of GRI (Global Reporting Initiative) and the United Nations Global Compact. This report has been prepared solely for informative purposes and does not aim to form the basis for any investment decision. No information in this report constitutes a proposal or part of a propos-al relating to the sale of CCI shares, or an invitation to this kind of sales process, and the publishing of this report does not mean that a legal relationship of this kind has been established. All featured information and related documents are believed to be accurate at the time of this report’s preparation, and all information has been provided in good faith and relies on trustworthy sources. However, CCI does not make any kind of declaration, guarantee or promise in relation to this information.
This report is printed on recycled paper.
CONTACT
102-3

REPORTING CONSULTANT & DESIGN
www.esgturkey.com
CCI
Burcu CoşkunGroup Corporate Affairs [email protected]
OSB Mah. Deniz Feneri Sokak No: 434776 Dudullu Ümraniye İstanbulTel: +90 216 528 40 00 Fax: +90 216 510 70 12www.cci.com.tr
LEGAL DISCLAIMER
This sustainability report (the Report) was prepared by CCI within the principles of GRI (Global Reporting Initiative) and the United Nations Global Compact. This report has been prepared solely for informative purposes and does not aim to form the basis for any investment decision. No information in this report constitutes a proposal or part of a propos-al relating to the sale of CCI shares, or an invitation to this kind of sales process, and the publishing of this report does not mean that a legal relationship of this kind has been established. All featured information and related documents are believed to be accurate at the time of this report’s preparation, and all information has been provided in good faith and relies on trustworthy sources. However, CCI does not make any kind of declaration, guarantee or promise in relation to this information.
This report is printed on recycled paper.