2017 Annual Financial and Sustainability Report - China Bank
244
2017 Annual Financial and Sustainability Report
-
Upload
khangminh22 -
Category
Documents
-
view
1 -
download
0
Transcript of 2017 Annual Financial and Sustainability Report - China Bank

2017 Annual Financial and Sustainability Report

ABOUT THE REPORT 102-50, 102-51 102-52, 102-54, 102-55
China Bank embarks on another milestone as we produce our first Annual Financial and Sustainability Report. Our goal is to provide a holistic understanding of how we embed sustainability into our operations to deliver strong results while creating value for society.
This report covers our financial and non-financial performance from January 1, 2017 to December 31, 2017. We aligned the narrative to our contributions to the 17 Sustainable Development Goals (SDGs) of the United Nations through the products and services we provide. We took a systematic reporting approach in embedding sustainability into our operations, including developing a sustainability strategy that reflects our commitment to contribute more to the achievement of the SDGs.
This report has been prepared in accordance with the Global Reporting Initiatives (GRI) Standards: Core option. In the process, we have successfully completed the GRI Materiality Disclosures services, which verifies that the General Standard Disclosures 102-40 to 102-49 were correctly located in both the GRI Content Index (pages 237-240) and in the text of this report.
CONTENTSAbout this Report IFC About China Bank , Vision, Mission, and Core Values 1 Journey to 100 Years 2 Financial Highlights 4 Non-Financial Highlights 6 Foundations for Sustainable Growth 8 Message to Our Stakeholders 10 Business Review 18 Driving Sustainable Economic Progress 18 Growing and Preserving Assets 28 Fostering Financial Inclusion 34Environmental, Social, and Governance 44 Board of Directors 82Management Committee 86Senior Officers 88Management Directory 90Awards and Distinctions 91Financial Statements 92China Bank Branches 212China Bank Savings Branches 221China Bank Off-Branch ATMs 226Business Offices 231Subsidiaries and Affiliate 232Product and Services 235Investor Information 236GRI Index 237
ABOUT THE COVER For nearly a century, China Bank’s unique place in Philippine economic history and the banking industry has been characterized by its rich heritage, timeless values, enduring partnerships, principled banking, service excellence, and value creation. The solid foundation underlies the story of continued growth, network expansion, technology and innovation, and business diversification as we pursue our goal of becoming a more effective enabler of our customers’ success, and continue to be the best bank for them. The year 2017, with its record of performance, transition and preparation for future growth, marks another milestone in that continuing story—quietly symbolized by a simple scroll sealed with the auspicious symbol of the Lu, denoting prosperity and good fortune.
i

ABOUT CHINA BANK 102-1, 102-2, 102-3, 102-4, 102-6
China Banking Corporation (China Bank) is one of the leading private universal banks in the Philippines. We offer a full range of banking products and services to institutional (corporate, middle market/commercial, SMEs) and individual (retail, mass affluent, high net worth) customers, as well as thrift banking, investment banking, insurance brokerage, and bancassurance through our subsidiaries China Bank Savings, China Bank Capital, China Bank Securities, China Bank Insurance Brokerage, and affiliate Manulife China Bank Life Assurance. Established in 1920 as the first privately-owned local commercial bank, China Bank has an in-depth understanding of the way entrepreneurs and businessmen do business. While maintaining very close multi-generational relationships with the Chinese-Filipino community, we have since expanded the scope of our products and services to cover all market segments as we pursue ways to create greater value for the future.
The China Bank stock (PSE: CHIB) is listed on the Philippine Stock Exchange (PSE). We are a member of the SM Group, one of the largest conglomerates in the Philippines.
Headquarters: China Bank Building, 8745 Paseo de Roxas corner Villar St.,Makati City 1226 Philippines
VISION 102-16
Drawing strength from our rich history, we will be the best, most admired, and innovative financial services institution, partnering with our customers, employees, and shareholders in wealth and value creation.
MISSIONWe will be a leading provider of quality services consistently delivered to institutions, entrepreneurs, and individuals here and abroad, to meet their financial needs and exceed their rising expectations. We will be a primary catalyst in the creation of wealth for our customers, driven by a desire to help them succeed, through a highly engaged team of competent and empowered professionals, guided by in-depth knowledge of their needs and supported by leading-edge technology. We will maintain the highest ethical standards, sense of responsibility, and fairness with respect to our customers, employees, shareholders, and the communities we serve.
CORE VALUES• Integrity• High Performance Standards• Commitment to Quality• Customer Service Focus• Concern for People• Efficiency• Resourcefulness / Initiative
888 ATMs
China Bank Online, China Bank Mobile App, China Bank TellerPhone
596 branches
9,124 employees
1.3 million customers
P84B Capital+32%
P751B Assets +19%
P635B Deposits
+17%
P454B Gross Loans+17%
“Baa2”Investment grade
credit ratingfrom Moody’s
Among the top 5 publicly-listed companies in the Philippines for 6 straight years
Best in corporate governance
P7.5B Net income
+16%
1China Bank at a Glance

1968Becomes the first bank in Southeast Asia to process accounts online
1990Head office officially transfers to Makati
1942The Japanese military shuts down China Bank in April, liquidates its assets, andarrests Don Albino and George Dee Se Kiat
1931The Great Depression hits the Philippine banking sector; hit by runs, a rival bank goes under, but China Bank weathers the crisis unshaken
1988 Introduces TellerPhone, the first phone banking service in the country
1935P21.5M in resources and one of the country’s biggest banks
1948Opens first branch in Cebu
1927Is listed on the Manila Stock Exchange
1920Opens for business on August 16, 1920Founders: Dee C. Chuan, Don Albino Sycip, and a group of top Chinesebusinessmen
JOURNEY TO 100 YEARS
1945Reopens in July; lends to key industries for post-war reconstruction
China Bank Annual Financial and Sustainability Report 20172

2014• Acquires Planters Development Bank• Raises P8B from stock rights offer
2017 • Celebrates 90th listing anniversary• Gets investment grade credit rating from Moody’s• Raises P15B from stock rights offer
2015 • Launches investment house subsidiary, China Bank Capital• Launches credit card business2012
Acquires Pampanga-based Unity Bank
1997Best capitalized bank during the Asian Financial Crisis, after a 2 for every 3 shares stock rights offering
1996Accesses the offshore capital markets with US$50M floating rate certificates of deposit (and US$75M in 1997)
2006Completes first international US$53M secondary share offering
2016China Bank Capital acquires stock brokerage house ATC Securities, renamed China Bank Securities
2007 • Acquires Manila Banking Corp. and operates it as a savings bank arm, China Bank Savings (CBS)• Signs bancassurance joint venture with Manulife
3China Bank at a Glance

2015 2016 2017
FOR THE YEAR (IN THOUSAND PESOS)Net Interest Income 15,085,184 16,694,195 19,626,403 Non-Interest Income 4,487,142 5,094,746 6,101,694 Operating Income 19,572,326 21,788,941 25,728,097 Provision for Impairment & Credit Losses 966,574 850,546 754,171 Operating Expenses 12,193,207 13,350,873 15,961,818 Net Income Attributable to Equity Holders of the Parent Bank 5,606,666 6,458,296 7,513,972
AT YEAR END (IN THOUSAND PESOS)Total Resources 526,826,963 633,198,011 751,447,510 Loan Portfolio (Net) 309,761,777 386,827,300 448,970,942 Investment Securities 71,209,973 98,982,422 127,970,546 Total Deposits 439,265,686 541,583,018 635,093,393 Stockholders’ Equity 59,170,904 63,386,204 83,655,497 Number of Branches 517 541 596 Number of ATMs 740 805 888 Number of Employees 7,540 8,124 9,124
KEY PERFORMANCE INDICATORS (IN %)
ProfitabilityReturn on Average Equity 9.62 10.42 10.01 Return on Average Assets 1.17 1.16 1.12 Net Interest Margin 3.37 3.20 3.11 Cost to Income Ratio 62.30 61.27 62.04 LiquidityLiquid Assets to Total Assets 36.09 34.39 36.40 Loans (net) to Deposit Ratio 70.52 71.43 70.69 Asset QualityGross Non-Performing Loans Ratio 2.53 1.86 1.41 NPL Cover 87.33 91.00 99.02 CapitalizationCapital Adequacy Ratio (CET 1/Tier 1) 12.58 11.30 13.47 Capital Adequacy Ratio (Total CAR) 13.50 12.21 14.22
SHAREHOLDER INFORMATION
Market Value Market Price Per Share (In Pesos) 30.38 1/ 33.51 1/ 33.30 Market Capitalization (In Thousand Pesos) 68,958,700 76,077,058 89,402,898 ValuationEarnings Per Share (In Pesos) 2.50 1/ 2.88 1/ 2.91 Book Value Per Share (In Pesos) 26.07 1/ 27.92 1/ 31.16 Price to Book Ratio (x) 1.17 1.20 1.07 Price to Earnings Ratio 12.15 11.64 11.44 DividendsCash Dividends Paid (In Thousand Pesos) 1,716,414 1,853,728 1,988,719 Cash Dividends Per Share (In Pesos) 1.00 1.00 0.80Cash Payout Ratio (In %) 33.54 33.06 30.79 Cash Dividend Yield (In %) 2.91% 3.09% 2.36%Stock Dividends Paid (In Pesos) 1,373,142 1,482,993 1,988,729 Stock Dividends Per Share (in %) 8.00 8.00 8.00
1/ Restated to show the cumulative effects of stock dividends & stock rights
FINANCIAL HIGHLIGHTS102-7
4 China Bank Annual Financial and Sustainability Report 2017

In Billion PesosNET INCOME
8.0
7.0
6.0
3.0
5.0
1.0
2.0
4.0
0
7.5
6.5
5.6
5.1
5.1
2013 2014 2015 2016 2017
In Billion PesosMARKET CAPITALIZATION
100
90
80
70
60
30
50
10
20
40
0
89.4
76.1
69.0
80.7
84.2
2013 2014 2015 2016 2017
STOCKHOLDERS’ EQUITYIn Billion Pesos
83.7
90.0
70.0
50.0
30.0
80.0
60.0
40.0
20.0
10.0
0
63.4
59.2
56.6
45.4
2013 2014 2015 2016 2017
TOTAL CAR
14.2
2
18.0
14.0
10.0
6.0
16.0
12.0
8.0
4.0
2.0
0
12.2
1
13.5
0
14.8
8
15.3
9
2013 2014 2015 2016 2017
DIVIDENDS PAID In Billion Pesos
STOCK
2.0
2.0
2.52.5
2.02.0
1.5
1.5
0.5
1.0
0.5
00
1.5
1.4
1.3
1.3
1.9
1.7
1.6
1.6
2013 2014 2015 2016 2017
BRANCHES ATM
88
85
96
900
700
400
600
300
800
500
200
100
0
900
700
400
600
300
800
500
200
100
0
80
55
41
740
517
66
14
705
61
36
7
2013 2014 2015 2016 2017
In Billion PesosDEPOSITS
700.0
600.0
500.0
200.0
400.0
100.0
300.0
0
635.
1
541.
6
439.
3
399.
3
354.
3
2013 2014 2015 2016 2017
In Billion PesosTOTAL RESOURCES
800.0
700.0
600.0
500.0
200.0
400.0
100.0
300.0
075
1.4
633.
2
526.
8
471.
2
413.
7
2013 2014 2015 2016 2017
RETURN ON EQUITY
10
4
8
2
6
0
10.0
1
10.4
2
9.629.
91
11.3
1
12
2013 2014 2015 2016 2017
CASHIn Percent
In Percent
5Performance Highlights

NON-FINANCIAL HIGHLIGHTS102-7
DrivingEconomic Progress
Growing and
Preserving Assets
Fostering Financial Inclusion
14%
UITFs
Increase in number of UITF Accounts
13%
Pension Fund
Increase in number ofRetirement Accounts
23% Increase in
volume
Real Estate Loans
31% Increase in
volume
Vehicle Loans
P1.4 Billion
Civil Servants Loans
Loans released to DepEd
employees
China Bank Annual Financial and Sustainability Report 20176
6% P805 Billion
Life & Non-life
insurance
Syndicated &Securitized Loans
Term Loans &Project Finance
Equity Raising/IPOBond IssuancesSME Loans
11%
Deposit Accounts
Increase incustomers
Worth of Total Issuances
P258 Billion Loan Portfolio
Total Fund Mobilized for SDGs
Note: DepEd and Real Estate not included in the total disbursed amount
*Water and Sanitations Systems, Education, Sustainable Mobility, Nutrition, Health and Wellness, Micro & Small Business Loan, Climate and Disaster Resilience
141%
Cash Management Transactions
Increase in volume Increase in volume
Increasein credit card gross billings
Cards & Payments
14%
28% 24%
9%
20% 78%
12%
Total Disbursed through Direct Loans
Power Generation
Sustainable Communities
Food and Agriculture
16%
53%
Infrastructure Development
Infrastructure 22% Power Generation
7% Sustainable Energy
Others*
Total Funds and Capital Raised for Clients
Increase in
number of lives
covered
Increase in
total claims
113% Increase in
remittance volume
Remittance Services
P655 Billion P141 Billion
P796 Billion

Revised ESG Scorecard:
ASPECT 2017 PERFORMANCE
Economic
Value Generated (in billion pesos) 32.64
Value Distributed (in billion pesos) 29.09
Value Retained (in billion pesos) 3.55
Environment
GHG Emissions (Tonnes CO2e)
Scope 2 3,425
Scope 3 645
GHG Intensity (Tonnes CO2e/in billion pesos revenue) 124.68
Average Electricity Consumption/Branch3.42%
reduction
Savings/Branch (in pesos/branch) 1,000
Total Water Consumption (m3)*Main facilities 66,089
Total Water Intensity (m3/in billion pesos revenue) 18,643
Social
Total Employees 9,124
By Gender
Male 2,917
Female 6,207
By Rank
Rank and File 5,982
Junior Officers 2,835
Senior Officers 307
Attrition Rate
Officer (%) 10.42
Rank and File (%) 14.57
Overall (%) 13.15
Employee Covered by CBA (%)* 61
Total No. of employees covered by CBA* 3,993
*Parent bank only
Total No. of Rank and File (V to VII) promoted 1,074
Average Training Hours per Employee 11.14
No. of Internal Engagement Programs 4
Total No. of Participants 2,127
Third Month Questionnaire
Officer - Satisfaction Rating (out of 10) 8.05
Rank and File - Satisfaction Rating (out of 10) 8.68
% of employees who said they will recommend China Bank as a workplace (based on 2017 exit interview) 97%
GovernanceNo. of Employees Trained in Anti-corruption 5,209Among the top 5 publicly-listed companies in corporate governance for 6 straight years Appointed Roberto F. Kuan as the lead independent director and Margarita L. San Juan as an independent director (only female member of the Board)All material topics are adequately disclosed in accordance to SEC and PSE policies
ASPECT 2017 PERFORMANCE
7Performance Highlights

FOUNDATIONS FOR SUSTAINABLE GROWTH
Proven Reliability and Stability
Committed to the highest standards of corporate
governance, business integrity, and professionalism, China
Bank continues to be a reliable and stable institution. We
are constantly improving our performance, products, and processes in step with the
changing times, rising customer expectations, and international
best practices to fulfill our fiduciary duties and deliver on our commitments to our stakeholders.
Enduring Client Relationships
As a leading universal bank operating for 97 years, China Bank is a trusted partner of generations of clients. We build and nurture strong customer relationships, guided by our mission to be a
primary catalyst in wealth creation. With a customer-centric approach
of always considering what’s best for our clients, we develop relevant products and services, roll out various improvements
and innovations, and simplify our processes to enhance customer experience across all our touch
points.
Quality Talent Capital
Our workforce drives China Bank’s relentless move forward. A key strategy to our success all these
years is attracting, developing, and retaining high caliber employees to effectively support our expanding operations. We are adopting the
best practices in human resources management to create a positive
working environment where people are motivated and energized to
do their best work and to provide excellent customer service all
the time.
“Baa2” INVESTMENT
GRADE CREDIT RATINGFrom Moody’s
1.3 millionCLIENTS
16% have been banking with China Bank for more
than 10 years
9,124 EMPLOYEES
102-7
P84 billionCAPITAL
CET 1/Tier 1 CAR: 13.5%; Total CAR: 14.2%
China Bank Annual Financial and Sustainability Report 20178

Wide Reach
We put a lot of infrastructure and technology to provide the
best combination of value, accessibility, and convenience for
our customers. Driven to be within easy reach anywhere and anytime,
we continue to expand our nationwide footprint and enhance our electronic banking channels.
Our wide physical and digital distribution network makes our
products and services accessible to more customers and enables them to choose how, when, and
where they want to bank with us.
Efficient Operations
With a balanced approach to operational efficiency, we ensure
that China Bank’s revenue streams are growing faster than overhead
costs. Focused on increasing productivity and achieving long-term efficiency, we continue to
make the necessary investments to enhance our market coverage, improve competitiveness, provide
better and more responsive service, and generate long-term
value for all stakeholders.
Robust IT Infrastructure
China Bank’s business activities are ably supported by robust IT
infrastructure that can scale with demand. With our up-to-date
technology—from our core banking system to our various front-to-
end operations systems— well-thought out business processes,
and comprehensive policy frameworks, we are organized to provide excellent service to our internal and external customers,
manage our risks, and achieve our organizational goals.
2.31%
COST-TO-AVERAGE ASSETS RATIO
NEW CORE BANKING SYSTEM
Rolled out in 2015
596 BRANCHES
Complemented by 888 ATMs, China Bank Online,
China Bank Mobile Banking App, China Bank TellerPhone
9Foundations for Sustainable Growth

MESSAGE TO OUR STAKEHOLDERS102-14, 102-15
10 China Bank Annual Financial and Sustainability Report 2017
We overcame challenges and took full advantage of opportunities, using our capabilities, footprint, and scale to meet our customers’ financial needs and create sustained value for all our stakeholders. We are continuing to invest in the future while delivering results for today.

To Our Fellow Stakeholders,
The year 2017 was a significant period of change and progress for China Bank, marking a new chapter in our storied history. We achieved good business and financial results as we sustained our growth momentum, successfully completed a stock rights offer to bolster our capacity to pursue further business growth, highlighted by an investment grade credit rating. We overcame challenges and took full advantage of opportunities, using our capabilities, footprint, and scale to meet our customers’ financial needs and create sustained value for all our stakeholders. We are continuing to invest in the future while delivering results for today. And as we prepare with anticipation for our 100th anniversary in 2020, a new leadership in the management team has been entrusted with carrying the Bank forward and upward. The new senior leadership is tasked to our vision of becoming the best, most admired, and innovative financial services institution.
What Happened in 2017
The Philippines remained one of the fastest growing among emerging economies in the region. Gross Domestic Product (GDP) grew 6.7% in 2017, still a healthy growth record compared to the 6.9% in 2016, as expansion in infrastructure-related and investment-related spending offset the expected slack from the previous year’s election-related spending. The strong economic expansion extended the economy’s run of 76 quarters of uninterrupted growth, as the initial phases of the government’s “Build, Build, Build” program start to gain traction. The solid economic fundamentals provided the monetary authorities ample space to support the country’s growth trajectory, and continue the program for broader market reforms under the new BSP Governor Nestor Espenilla Jr.
The government’s long-term development plan of accelerating economic development through 2040 was jump started with a critical piece, as Congress enacted the first phase of tax reforms popularly known as TRAIN 1 ( RA 10963 or Tax Reform Acceleration & Inclusion Act), which would partly fund the government‘s ambitious “Build, Build, Build“program. Phase 2 of the tax reforms program is expected to be revenue neutral, but the reduction of the Corporate Income Tax to align with our ASEAN peers and modernize the fiscal incentives system are among the significant initiatives expected to broaden the tax base, improve tax efficiency while continuing to encourage foreign investments and exports and improve labor productivity.
The acceleration in the government’s infrastructure spending was reflected in the slight increase in the country‘s fiscal deficit to P350.6 billion, still below the government‘s target of P482.1 billion or about 3% of GDP. The government’s plan to usher in a golden era of infrastructure spending is considered sustainable, as the country’s debt to GDP ratio of less than 35% can very well accommodate additional spending, complemented by funding from ODA and PPP. Similarly, the acceleration in infrastructure-related imports coupled with higher costs of fuel brought the current account deficit up to US$100 million in 2017. As a result, the peso shed 5.8% of its value against the dollar, averaging P50.40: US$1 in 2017 from P47.49: US$1 in 2016. Due to the positive investor sentiment, the PSEi closed 25% higher at 8,558 from 6,841 in 2016.
The Philippine banking industry was both a beneficiary and a crucial catalyst in helping sustain this sustainable pace of growth of our economy. Industry assets expanded by 12% or P1.5 trillion to P14.8 trillion, 81% of which came from loans growth. Bank lending continued to expand by 19% and went mostly to productive sectors.
11Message to Our Stakeholders

How We Performed
In 2017, our Bank generated a record net income of P7.5 billion, up 16% on the back of sustained growth in core and fee-based businesses. This translates to a return on equity (ROE) of 10.01% and return on assets (ROA) of 1.12%.
Our net interest income rose 18% year-on-year to P19.6 billion, driven by the 17% growth in loan portfolio and stable net interest margin of 3.11%.
Total assets expanded 19% to P751.4 billion. Gross loans grew 16% by P65 billion to P454 billion due to strong demand across all segments, particularly consumer loans, which jumped 25%, and corporate loans, which rose 19%.
Even as the expansion in our loan portfolio continued apace, stronger focus on credit underwriting standards and disciplined collection efforts led to a milestone reduction
New BSP Governor
Our thrift banking arm China Bank Savings tripled its net income, sustaining the momentum of its turnaround to full profitability in 2016.
HENRY SY, SR.Honorary Chairmanand Advisor to the Boardd
12 China Bank Annual Financial and Sustainability Report 2017

in our NPL ratio to 1.4% -- lower than industry levels – as non-performing loans (NPL) dropped P900 million or 12.3%. Continued provisioning improved the loan loss coverage ratio (LLR) to 99% from 91% (consolidated level) and to 175% from 153% (parent bank).
The growth in loans and asset base exceeded P100 billion in the last two years, supported by the growth in funding base. Total deposits rose 17% to P635.1 billion, boosted by 24% growth in low-cost funds, resulting to healthy CASA (checking & savings accounts) ratio of 54%, while the loans-to-deposit ratio was steady at 71%.
We generated this growth by focusing on our customers’ need and making China Bank more accessible. We sustained our network expansion efforts, opening 55 new branches to grow our nationwide footprint to 596 branches, complemented by 888 ATMs and our secure and convenient electronic banking channels. With a wider reach and more ways to reach us, we are able to serve more customers anytime and virtually anywhere.
Our thrift banking arm China Bank Savings tripled its net income, sustaining the momentum of its turnaround to full profitability in 2016. At 160 branches as of year-end 2017, CBS has more branches than China Bank in 2006 before the start of our expansion phase triggered by the acquisition of Manila Bank.
In the capital markets, the China Bank Group continued to make its presence felt as a major player. Our investment house subsidiary China Bank Capital sustained its market leadership in the local bond market, and with a very active participation in major underwriting deals. It reported a 25% earnings growth, even as it completed its capital markets capability with the launching of China Bank Securities (from the acquisition of ATC Securities).
Major Developments
The year marked a significant change at the management leadership level, with William C. Whang becoming President effective November 1, 2017. William joined the Bank in 2011 as head of our Institutional Banking Group, and was Chief Operating Officer before his designation as President.
Taking over as Chief Operating Officer is Executive Vice President Romeo “Romy” D. Uyan, Jr. who previously oversaw the Financial Markets segment while serving as Treasurer and Head of Treasury Group, while also serving as President of China Bank Capital.
Patrick D. Cheng was designated Chief Finance Officer. Patrick joined the bank in 2013 as Trust Officer and Head of Trust and Asset Management Group.
The senior management team is further bolstered by Rosemarie C. Gan as Head of Retail Banking, and Alberto Emilio V. Ramos as President of China Bank Savings -- both key units engaging the retail, SME, and commercial segments.
Meanwhile, capable successors were designated for key functions -- Benedict L. Chan succeeded Romy as Treasurer and Head of Treasury Group, while Lilian Yu replaced William as Head of Institutional Banking Group. Ryan Martin L. Tapia was designated President of China Bank Capital, with Marisol M. Teodoro appointed as President of China Bank Securities.
We take this opportunity to express our sincere thanks and deep appreciation to Ricardo “Ric” R. Chua, who stepped down as President and CEO on October 31, 2017. We are truly grateful to Ric for his dedicated service of 42 years— President and CEO from September 2014 to October 31, 2017 and previously as EVP and COO from 1995 to 2014. Ric had been instrumental to China Bank’s success, and we are happy to note that we continue to benefit from his wise counsel as an advisor to the Board.
13Message to Our Stakeholders

At the last stockholders’ meeting, we welcomed Ms. Margarita L. San Juan to our Board as Independent Director, succeeding the late Dy Tiong. Margie also serves as an Independent Director of our subsidiaries China Bank Savings and China Bank Capital. We hope to secure shareholder and regulatory approval to increase the number of board directors to twelve, to accommodate the addition of a fourth independent director, as we continue our efforts to be aligned with best practice in corporate governance.
While our 2014 P8 billion stock rights offering provided the resources to pursue our growth and diversification strategies post-Plantersbank acquisition, we returned to the capital markets in May 2017 with another oversubscribed P15-billion stock rights offering. This SRO bolstered our capital strength to sustain our growth momentum across all segments, while we prepare for greater competition and a more complex regulatory scenario Basel 3 and related rules taking effect. Our common equity tier 1 (CET 1) and total capital adequacy ratios as of end-December 2017 stood at 13.47% and 14.22%, respectively.
The capital raising was complemented by a rationalization of the liability funding mix with the issuance of LTNCDs amounting to P15.9 billion -- P9.6 billion in November 2016 and P6.3 billion in June 2017. Apart from leveraging the stronger capital base with longer-term funding to match our long term asset deployment, the proceeds were used to support our strategic initiatives and business expansion.
In a development reflective of our balance sheet strength and our ample liquidity situation, we paid off -- one year ahead of schedule -- the 3-year US$158 million Syndicated Loan due in June 2018. Robust growth of our foreign currency deposits at favorable rates enabled us to repay the loan sooner.
A significant highlight of the year was the INVESTMENT GRADE credit rating of Baa2 given by Moody’s Investors Service in its very first credit rating report issued for China
Bank, citing the Bank’s strong capital base and stable asset quality. This investment grade credit rating is at par with the Philippine sovereign rating and the best rated banks in the country. This investment grade rating followed a rating upgrade from Capital Intelligence to “BBB” from “BBB-“, and a similar affirmation by Fitch Ratings of China Bank’s “BB+” Long Term Issuer Default Ratings.
Good corporate governance is the cornerstone of our business. It has been crucial in our success in the last 97 years. We are pleased to note that our commitment and efforts in this field was recognized both here and abroad.
At the annual Philippine Stock Exchange (PSE) Bell Awards for excellence in corporate governance, China Bank was given a special citation as the only publicly listed company to have won the Bell Award for 5 consecutive years from 2012 to 2016, and continued to be among the top five in corporate governance in 2017 – and the only bank to be so recognized in each of those 6 years. We were recognized hailed by the Global Banking & Finance Review as the Best Bank for Corporate Governance Philippines 2017 and Best Investor Relations Bank Philippines 2017.
We marked another milestone as we celebrated the 90th anniversary of the listing of our shares in 1927 at the Manila Stock Exchange (a forerunner of the Philippine Stock Exchange).
How We Create Shared Value
For 97 years, we have been combining financial success with ethical practice and socially responsible action. We are driven to create sustainable value for our stakeholders while being mindful of our broader impact on society and the environment. We take seriously our responsibility for making a positive difference in our stakeholders’ lives, for protecting the environment, and for enabling societal and
China Bank Annual Financial and Sustainability Report 201714

economic progress. And while we are proud of the strides we have made in sustainability, we know there is more work to be done.
This year, for the first time, references can be found in various sections of this report to the United Nations Sustainable Development Goals (SDGs) which are most significant to our business.
Our Plans
With another great year 2017 to build on, and with a new management team at the helm, we are prepared to face the challenges presented by an environment characterized by globalization, fragmentation, and disruption. As we look forward to celebrating our 100th anniversary in 2020, our objective is to sharpen our focus on four wildly important goals —business growth, operational excellence, customer centricity, and employee engagement.
As our journey continues, we are even more excited for what the future holds. We are preparing to embrace the myriad opportunities of the next century by staying relevant to our customers in an increasingly digital world, where the rules of competition and business models are being redefined and even disrupted across many industries. We will pursue our digital banking transformation, with our innovations in platforms, products, and services aimed at creating and enhancing value for our customers and partners -- our road map to becoming the best Bank for our customers and stakeholders.
On behalf of the board of directors, management, and staff of China Bank, we thank our customers for your continued support and partnership. We especially thank our stockholders for your continued trust in your Board and Management to continue our journey of strength, growth, and shareholder value.
HANS T. SYChairman of the Board &the Executive Committee
GILBERT U. DEEVice Chairman
WILLIAM C. WHANGPresident
As we look forward to celebrating our 100th anniversary in 2020, our objective is to sharpen our focus on four wildly important goals—business growth, operational excellence, customer centricity, and employee engagement.
15Message to Our Stakeholders

Using our resources and expertise, we help our business
and individual customers achieve their financial objectives
and prosper, which redounds to more jobs, better quality of
life, and vibrant communities.
Through our core products and services, we create value in
three key ways: driving economic progress, growing and
preserving assets, and fostering financial inclusion.
We drive economic progress by supporting businesses
wherever they are in their growth journey. We provide
a complete range of credit facilities, financial solutions,
and advisory services to businesses of all sizes. We
proactively finance businesses and projects that directly
deliver on the sustainable development goals, including
education, infrastructure, energy, and sustainable
communities.
We help grow and preserve our customers’ assets with an
array of deposit and investment products and services. No
matter what stage in life they are in, we have the solutions
best suited to their lifestyle, ambitions, and preferences,
and offer sound financial advice to help them make the
right choices.
SUSTAINABLE VALUE FOR ALL
We foster financial inclusion by offering accessible banking
products and services, making China Bank accessible to
more people, and developing programs that encourage the
un-banked and underserved segments to save and access
banking products and services.
For all our customer segments, we have life and non-life
products and services to enable them to manage risks,
bounce back from losses, and enjoy peace of mind and
financial security.
Our value creation through our core products and services
is underpinned by our robust Environmental, Social, and
Governance (ESG) framework that drives us to conduct
our business in an ethical and responsible manner. We
have a full complement of highly qualified employees and
comprehensive employee development programs. We have
policies in place to keep our environmental impact managed
and ensure meaningful support for various advocacies.
We have a consumer protection framework and efficient
mechanisms for handling customer concerns. And we have
a strong risk management, governance, and compliance
culture—a hallmark of our success all these years.
102-9
As a leading universal bank operating for almost a century, China Bank believes in creating value for stakeholders. We are a trustworthy and responsive bank to our customers and shareholders, a fair and caring employer to our employees, and a responsible and proactive ally to society.
China Bank Annual Financial and Sustainability Report 201716

Human ResourcesEnvironmental
ProtectionSocial
ResponsibilityCustomer Protection
Corporate Governance
Working Capital
SME Loans
Supply Chain Financing
Term Loans and Project Finance
Bond Issuances
Advisory Services,Mergers and Acquisitions
Long-term CDCommercial Paper
Retail Bonds
Trust Fund
Pension Funds
Estate Planning
Escrow
Basic Deposit Account
Kiddie Savings
OFW Savings Account
Consumer Loans
Real Estate
Vehicle Loans
Personal / Salary Loans
Civil Servants Loan
Cards and Payments
Remittance Services
Life and Non-life Insurance
Trade Financing
Mutual Funds/UITFs
Growing andPreserving Assets
Fostering FinancialInclusion
Driving EconomicProgress
Value Creation
Products and Services
SustainableBanking
(ESG Framework)
Syndicated LoansSecuritized Loans
Equity Raising / IPO
Time Deposits
Money Market Placements
Government Securities(Peso and ROPs)
Fixed-Income Bonds
17Sustainability at China Bank

Driving Sustainable Economic Progress
18 China Bank Annual Financial and Sustainability Report 2017

19Business Review
As one of the biggest universal banks in the Philippines, China Bank is intrinsically an enabler of economic progress. We embrace this role and go to great lengths to be the best bank for our business customers and facilitate business growth and economic development in a way that is sustainable and likewise beneficial to society and the environment.

FINANCING SUSTAINABLE DEVELOPMENT
China Bank, built by entrepreneurs, is the local businessmen’s bank. We provide a wide range of loan and credit facilities and trading and advisory services to our corporate and commercial customers through our Institutional Banking Group (IBG). In 2017, IBG focused not just on helping our customers scale up their businesses but also on scaling up our financing for businesses and projects that contribute to the Sustainable Development Goals (SDGs).
48% of the portfolio is aligned
with the SDGs
DISBURSED LOANS CONTRIBUTING TO SUSTAINABLE DEVELOPMENT GOALS
1.16
2.16
2.88
4.79
8.76
10.28
18.26
33.87
40.62
0 5 10 15 20 25 30 35 40 45
In Billion Pesos
203-2
Nutrition, Health and Wellness
Sustainable Mobility
Education
Water and Sanitation Systems
Sustainable Energy
Food and Agriculture
Infrastructure Development
Sustainable Communities
Electrification
P258 billion IBG’s loan portfolio
Up 17%
Close to P100 billion in loans for electrification, building
sustainable communities, and infrastructure development
China Bank Annual Financial and Sustainability Report 201720

In 2017, we extended to SMC Consolidated Power Corporation a P6.68 billion peso loan-part of a 12-year loan facility that partially financed the construction of the 4 x
Great places to live, work, and play We helped enable the establishment of sustainable communities through a P3 billion loan to Sta. Lucia Land Inc. (SLI). One of the country’s prime real estate developers, SLI develops properties that spur progress and add value to the communities in which they are located. These include a network of thriving residential communities and retail, tourism, and leisure developments nationwide.
Wireless connections, digital innovationsWe helped fund Smart Communications’ network improvements to bring faster and more responsive telecommunications services across the country with a P9.9 billion loan. Smart is the country’s leading mobile network. Its LTE and 3G expansion program which initially covered Boracay, Metro Davao, Metro Cebu, Rizal, and Metro Manila last year, has been brought to other parts of the country to boost network speed, coverage, and capacity to make the best digital experience more accessible to more customers.
DISBURSED LOANS CONTRIBUTING TO SUSTAINABLE DEVELOPMENT GOALS
Photo from www.smcglobalpower.com.ph
More power to the nation 150 MW greenfield coal-fired thermal power plant located in Limay, Bataan. This plant utilizes the circulating fluidized bed (CFB) technology which transforms coal into a fuel source that is relatively low in pollutant emissions.
33.08%
27.59%
14.87%
8.37%
7.14%
3.90%2.34%
1.76%0.95%
Electrification
Sustainable Communities
Infrastructure Development
Food and Agriculture
Sustainable Energy
Water and Sanitation Systems
Education
Sustainable Mobility
Nutrition, Health and Wellness
21Business Review

We provide businesses access to a range of financing options to improve their funding structure and capacity to grow and expand. Aside from traditional bank lending, we offer debt or equity financing arrangements through China Bank Capital, our investment house subsidiary, and its stock brokerage arm, China Bank Securities. We help both the private and government sectors raise funds through the capital markets to finance expansion projects and infrastructure developments that enhance the production capacity of the nation.
BROADENING ACCESS TO FINANCING VIA THE CAPITAL MARKETS
China Bank Securities (formerly ATC Securities)
Acquired in 2017
No. 3 in IPO volume
Investment Banking Division Started in 2011
China Bank Capital Established in 2015
No. 1 in peso retail bond issues
No. 1 in peso preferred shares issues
Participated in
41 debt & equity transactions of
30 companies that belong to the top
1,000 Philippine corporations
TOTAL CAPITAL RAISED
63% infrastructure
18% electrification
19%others
81%aligned with
the SDGs
203-2
P805 billionworth of issuances, including two
Retail Treasury Bond issuances of the Philippine Government amounting to
P436 billion
China Bank Annual Financial and Sustainability Report 201722

Supporting infrastructure China Bank Capital was one of the joint issue managers and joint lead underwriters of Eagle Cement’s Initial Public Offering. The proceeds went to the construction of a cement plant in Cebu and distribution centers and marine terminals in Southern Luzon, Visayas and Mindanao, in preparation for the aggressive infrastructure program of the government as well as the continued boom in the real estate market and the expanding tourism sector.
China Bank Capital was the issue manager, underwriter, and bookrunner of Vista Land and Lifescapes’ Fixed Rate Retail Bonds issuance. The bond proceeds directly financed the development, construction, and completion of the Evia Lifestyle Center Expansion and Vistamall Malolos, as well as for general corporate purposes.
Supporting electrification China Bank Capital was one of the joint lead arrangers for SMC Consolidated Power Corporation syndicated term loan which financed the acquisition of an existing 2x150 MW Circulating Fluidized Bed (CFB) coal-fired power plant and financing of development and construction activities for a new 2x150 MW CFB coal-fired power plant in Limay, Bataan.
Supporting education China Bank Capital acted as one of the joint issue managers and joint lead underwriters of STI Education Services Group’s Fixed Rate Retail Bonds offer which financed investments that deliver access to quality education, namely campus expansion projects. Other portions of the bond proceeds were used for land acquisition, future expansion, and general corporate purposes.
23Business Review

Small and medium scale enterprises (SMEs), which account for 95% of business establishments in the Philippines, are crucial for the country’s economic growth and competitiveness. Through China Bank Savings (CBS), we are enabling SMEs by providing them with the financial products, services, and advice they need to start and succeed. CBS’ SME lending continued to rise in 2017, reflective of our commitment to help SMEs meet their business challenges and realize their full potential.
EMPOWERING SMEs
1,812 SME borrowers in 2017
24% Real Estate Activities
22% Wholesale and Retail Trade:
Repair of Motor Vehicles
7% Accommodation and Food Service Activities
9% Financial and Insurance
Activities
13% Manufacturing
4% Electricity, Gas, Steam, and Air-Conditioning Supply
Transportation and Storage6%
4% Construction
3% Education
2% Agriculture, Forestry, and Fishing
5% Professional, Scientific, Technical, Admin,and Social Work Activities
1% Water Supply, Sewerage, Waste Management and Remediation
2017 SME LOANS
203-2
P31 billion SME loans up 6%
P17 million average loan amount
China Bank Annual Financial and Sustainability Report 201724

Dedicated to SMEsCBS has specialized lending divisions that cater to the specific needs of SMEs, particularly in acquiring real estate and vehicles to start and grow their businesses. The Real Estate Lending Division, formed in 2015, is focused on serving horizontal sub-urban developers to help them build affordable housing and enable more Filipinos to acquire their first homes. The Bus and Truck Lending Division, which started in the middle of 2017, supports bus companies in Metro Manila that are looking to phase out their old models and procure more efficient units, in response to the re-fleeting program of the government. In just half a year, CBS has supported 50% of the market.
25Business Review

BOOSTING BUSINESS EFFICIENCY
Managing working capital and cash flow can be a complex endeavor. We help businesses of all sizes optimize funds, accelerate collections, manage the payment cycle, and streamline and automate processes with our comprehensive suite of cash management solutions designed for better liquidity, receivables, and disbursements management. In 2017, the number of cash management transactions more than doubled, which likewise translated to increased efficiency and reduced expenses for the companies we serve.
5,000 corporate customers,
13,000 user accounts
31% increase
in new corporate customers
50% increase in receivables
management transactions
26% increase in payables
management transactions
25% increase in government payment transactions
25% increase in retail POS
transactions
141% increase in cash management
transaction count to 13.2 million
China Bank Annual Financial and Sustainability Report 201726

More robust China Bank Online-CorporateChina Bank Online-Corporate was enhanced in 2017 to meet the increasingly sophisticated needs of our corporate customers. The new and improved online banking facility has multi-factor authentication for greater security, a user-friendlier account management dashboard capable of displaying account balances, including those in third party banks, for a 360-degree view of cash position, and a mobile approval function for added convenience and flexibility.
Convenient cash withdrawals at the point of saleChina Bank partnered with Universal Storefront Services Corp. (USSC) to enable customers to withdraw cash from point-of-sale (POS) terminals in USSC branches. The POS Cash Out service is available at 95 of USSC outlets nationwide. Customers can save time by making POS withdrawals as they can combine purchasing and withdrawal transactions. Meanwhile, this facility enables USSC to attract additional customers who visit their branches because they need cash. USSC runs one of the country’s largest networks of one-stop service shops specializing in money transfer, transport ticketing, and payment collection, among others. China Bank plans to expand this facility to more partners in the near future to further enhance its service to all Bancnet-member Bank customers.
27Business Review

Growing and Preserving Assets
China Bank Annual Financial and Sustainability Report 20172828

With a mission to be a catalyst of wealth creation, China Bank is committed to help customers save and invest at any life stage and secure their financial future. We endeavor to understand our customers’ financial situation and ambitions in order to offer them the best possible advice and services and help them navigate the challenges of creating wealth, seeing it grow over time, and preserving and passing it down to the next generation.
29Business Review 29

For us, banking is a matter of trust. We place great importance on earning and maintaining our customers’ trust and giving them peace of mind that the money they entrusted to us is always safe. Aside from basic deposit products and services, we provide customers with a wide range of treasury, trust, wealth management, bancassurance products and services, and sound financial advice to help them grow and preserve their wealth. Our team of seasoned trust officers and relationship managers ensure our clients make well-informed decisions—aligned with their investment objectives, time horizon, and risk tolerance.
BUILDING WEALTH ON A FOUNDATION OF TRUST
TRUST BANKING
China Bank is one of the leading institutions in trust banking. Through our Trust and Asset Management Group, we offer unit investment trust funds (UITF), personal management fund, investment management, escrow, and corporate trust services to meet our customers’ unique financial needs. In 2017, our Assets Under Management (AUM) grew 28% to P132 billion, placing China Bank among the top 5 in terms of AUM among privately-owned local banks.
29%UITF
71%non-UITF
TRUST BANKING ASSETS UNDER MANAGEMENT (AUM)
TREASURY INVESTMENTS
We provide customers with a range of investment options as they enjoy affordable investment amounts, no management fees, and attractive returns. China Bank is a Government Securities Eligible Dealer (GSED), a registered broker-dealer of fixed income securities with the Securities and Exchange Commission, and a brokering participant in the Fixed Income Trading Platform of the Philippine Dealing and Exchange Corporation. We offer access to direct investments in government securities issued by the Bureau of Treasury and to highly-rated bonds of various maturities issued by prime Philippine corporations.
P132 billion AUM
Up 28%
14% increase in number of UITF accounts
UITF
13% increase in
Pension Fund
23% increase in Investment
Management Account
Among the Top 10 Best-Performing
GSEDs
China Bank Annual Financial and Sustainability Report 201730

Best Managed FundFor the second year in a row, the Chartered Financial Analyst (CFA) Society Philippines named China Bank Dollar Bond Fund as the “Best Managed Fund of the Year” in the Dollar Long-Term Bond category. CFA Society Philippines President Cristina Arceo handed the award to China Bank CFO Patrick Cheng (former Trust and Asset Management Group Head) at the 2017 Charter Awards Ceremony.
Insights from expertsChina Bank conducts learning sessions and market outlook forums year-round to help customers better understand financial and estate planning, and the market developments that have an impact on investments. In 2017, we had 34 pocket events attended by more than 200 customers.
DELIVERING BEST RETURNS FOR INVESTORS
Rank UITF 2017 (year-on-year) returns
No. 1 China Bank Balanced Fund 14.62%
No. 1 China Bank Intermediate Fixed-Income Fund 2.13%
No. 1 China Bank Short-Term Fund 2.10%
No. 3 China Bank High Dividend Equity Fund 21.63%
No. 5 China Bank Institutional Money Market Fund 1.74%
Source: www.uitf.com.ph
31Business Review

WEALTH MANAGEMENT
We are committed to managing, growing, and protecting our clients’ wealth for generations. Through our Wealth Management Group, we serve the specialized needs of the high net worth segment. Our open architecture platform enables us to optimize our clients’ portfolios with the best-in-class solutions—our proprietary products as well as those of other financial institutions. Our highly skilled relationship managers provide dedicated, on-call service to conduct our clients’ banking needs expertly, swiftly, and in total confidence. In 2017, we sustained our momentum as preferred Wealth Managers.
BANCASSURANCE
Planning for financial security must always account for the unexpected. Through Manulife China Bank Life Assurance Corporation (MCBL),our bancassurance joint venture with one of the largest insurers in the world, Manulife, we offer a full range of innovative insurance products to help our customers prepare for life’s eventualities. And when they do happen, customers are assured that claims will be handled promptly and efficiently. In 2017, MCBL’s 10th year, we reaffirmed our commitment to provide the best insurance protection for our customers, with each policy underpinned by our strong claims-paying ability.
15% increase in number
of Private Banking accounts
NUMBER OF LIVES COVERED
BUILDING WEALTH ON A FOUNDATION OF TRUST
71,027 policies in force
CHINABANK
16% increase in
lives covered Existing New In-Force
2015 2016 2017
84%82%
16%
71.03
18%
57.33
80%
20%
46.77
80
70
60
50
40
30
20
10
0
Thou
sand
s
P84.7 billion AUM
Up 7%
P406 million net incomeUp 34%
China Bank Annual Financial and Sustainability Report 201732

Peso Smart Financial Literacy ProgramManulife Philippines partnered with volunteer organization Hands On Manila (HOM) to launch Peso Smart, a series of financial literacy classes designed to teach public school students the basics of saving and investing. Manulife employees designed the curriculum with Hands On Manila’s partner educators and served as mentors during the weekly Peso Smart sessions with 30 grade 6 pupils from pilot schools Nueve de Febrero, Pembo, and Plainview.
P77 billion total insurance
coverage amountUp 20%
P148 million in claims disbursed
Up 53%
INSURANCE Total Exposure / Face Amount
INSURANCE - Total Claim Proceeds
23.90%
76.10%
45.39%
20.27%
34.10%
119.88
97.25
148.47
20.53%
79.47%
41.29%
3.72%
54.73%
20.27%
79.73%
17.59%
28.32%
53.50%
47.39
76.87
61.22
Death/Rider Claims Maturities Surrenders Div/Ex Refunds/Others
Existing New In-Force
2015 2016 2017
2015 2016 2017
80
70
60
50
40
30
20
10
0
Bill
ions
160
140
120
100
80
60
40
20
0
Mill
ions
33Business Review

Fostering Financial Inclusion
China Bank Annual Financial and Sustainability Report 20173434

35
China Bank is well positioned to help consumers manage their money and secure their financial future. Cognizant of the negative impact of lack of financial knowledge and access to financial services to people’s lives, their future, and even the country’s economic growth, we mobilize our resources and expertise to make banking more inclusive and to promote financial literacy. We provide financial information through a variety of accessible channels, we expand our nationwide footprint and develop products and services to reach the underserved markets, and deploy digital platforms to make banking easy and convenient anytime, anywhere.
Business Review 35

BRANCH BANKING
We believe that there is no technological substitute to meeting the people you are entrusting with your money. Our network of branches, manned by competent, honest, and friendly banking professionals, is still our main distribution channel. Even in the digital age, our branches remain crucial for acquiring new customers and growing relationship with the existing ones. Transactions such as opening an account, getting financial advice, or taking out a mortgage are exclusively done in our branches.
PROVIDING MORE CONVENIENT ACCESS
Banking is a people business at heart. Our relationship with our customers starts in our branches and we stay connected with them through our electronic banking channels, effectively combining technological advances with the time-tested advantages of face-to-face interactions. In 2017, we continued to expand and enhance our physical and digital distribution network to provide customers with even more convenient, secure, and easy access to our products and services.
596 888 EMV 24/7 Branches ATMs All ATMs China Bank Online & ATM Cards China Bank Mobile App China Bank TellerPhone
55 branches
opened in 2017
11% increase
in customers
65 in Visayas
436 China Bank
315 in Metro Manila
596 BRANCHES NATIONWIDE
160 China Bank Savings
173 in Luzon
43 in Mindanao
P3.7 billionNet income of the
Retail Banking Business
China Bank Annual Financial and Sustainability Report 201736

E-BANKING
We serve our customers offline and online—from our branches to our ATMs, China Bank Online, China Bank Mobile Banking App, and China Bank TellerPhone. We recognize that today’s customers are mobile and demand the convenience and flexibility of managing their finances anywhere, anytime, on any device. Thus, we continue to invest in up-to-date technology and efficient and secure systems not only to be available to our customers 24/7, virtually anywhere, but to provide them with a seamless and consistent experience across all channels.
83 ATMs deployed in 2017
888 ATMS NATIONWIDE, ONE OF THE FIRST TO BEEMV-COMPLIANT
TRANSACTIONS ARE SHIFTING TO ELECTRONIC CHANNELS
589 on-branch
61% over-the-counter
299 off-branch
39% electronic
724 China Bank
49%electronic
164 China Bank
savings
51% over-the-counter
2016 2017
37Business Review

ENCOURAGING SAVINGS
We offer various types of deposit accounts with low or zero initial deposit and low maintaining balance to make it easy for customers to manage their household budget or business finances, set aside money for emergencies, and build their funds for future needs. By opening more branches in the last ten years, especially in the provinces, we are able to reach out to our previously un-served communities and offer them a better and more secure option than just stashing away money at home or in an informal system of saving and lending money. All China Bank deposits are insured up to P500,000 by the Philippine Deposit Insurance Corporation.
24% increase in Current & Savings
accounts (CASA)
11% increase in the number
of new savings and checking accounts
P292 billion time deposits
P343 billionCASA
P635 billion in total deposits in 2017
up 17%
China Bank Annual Financial and Sustainability Report 201738

Working abroad, enduring home sickness is a price a lot of Filipinos are willing to pay to provide for their loved ones. Through China Bank On-Time Remittance and Overseas Kababayan Services, we help overseas Filipino workers (OFWs) make the most of their hard-earned money. Combined with our vast network of international remittance partners, domestic pay-out partners, and various modes of remittance, sending and receiving money through China Bank is fast, secure, and affordable. In 2017, we processed 2.9 million remittance transactions. Our remittance volume more than doubled to US$2.87 billion, accounting for 10% of the total OFW remittances sent though banks last year.
Empowering OFWs with money management skillsChina Bank conducts financial literacy lectures for OFWs as part of the Pre-Deployment Orientation Seminar (PDOS). A mandatory requirement for all OFWs, the PDOS aims to make them aware of the realities of working in a foreign country. At the China Bank PDOS Center in Ermita, Manila, our remittance officers share practical tips and information on budgeting, saving, and investing to help OFWs secure their family’s future. In 2017, we conducted 18 financial literacy lectures attended by a total of 7,550 OFWs bound for Asia and the Middle East.
BRIDGING FAMILIES
US$1.35 billionOFW remittances sent
through China Bank
US$2.87 billionOFW remittances sent
through China Bank
US$26.09 BillionTotal OFW remittances
sent through banks
US$28.06 BillionTotal OFW remittances
sent through banks
2016 2017
IMPROVED MARKET SHARE FROM 5% IN 2016 TO 10% IN 2017
29 Domestic and International remittance partners with
branches worldwide
5 domestic payout partners
with over 8,000
branches and outlets all over the Philippines
39Business Review

REAL ESTATE LOANS
Our low interest rates and flexible payment terms make it easy and affordable for customers to buy or build a home, renovate their homes, refinance an existing housing loan, or reimburse a recent purchase or construction of a residential or commercial property. Our consolidated real estate loans increased 24% to P40 billion in 2017. Residential loans accounted for 89% of our outstanding retail real estate loans, reflective of our commitment to help Filipino families have their very own homes.
MAKING DREAMS COME TRUE
People dream of having their own home, acquiring their own vehicle for business/livelihood, or traveling to their dream destination. Helping our customers achieve their dreams is one of the most significant things we can do for them. In 2017, our consumer loans increased 25% to P63 billion, translating to more dreams realized.
89% residential
11% commercial
203-2
4,559 real estate loans
up 18%
P40 billion in outstanding
real estate loans in 2017up 24%
P11.6 billion loan volume up 25%
China Bank Annual Financial and Sustainability Report 201740
VEHICLE LOANS
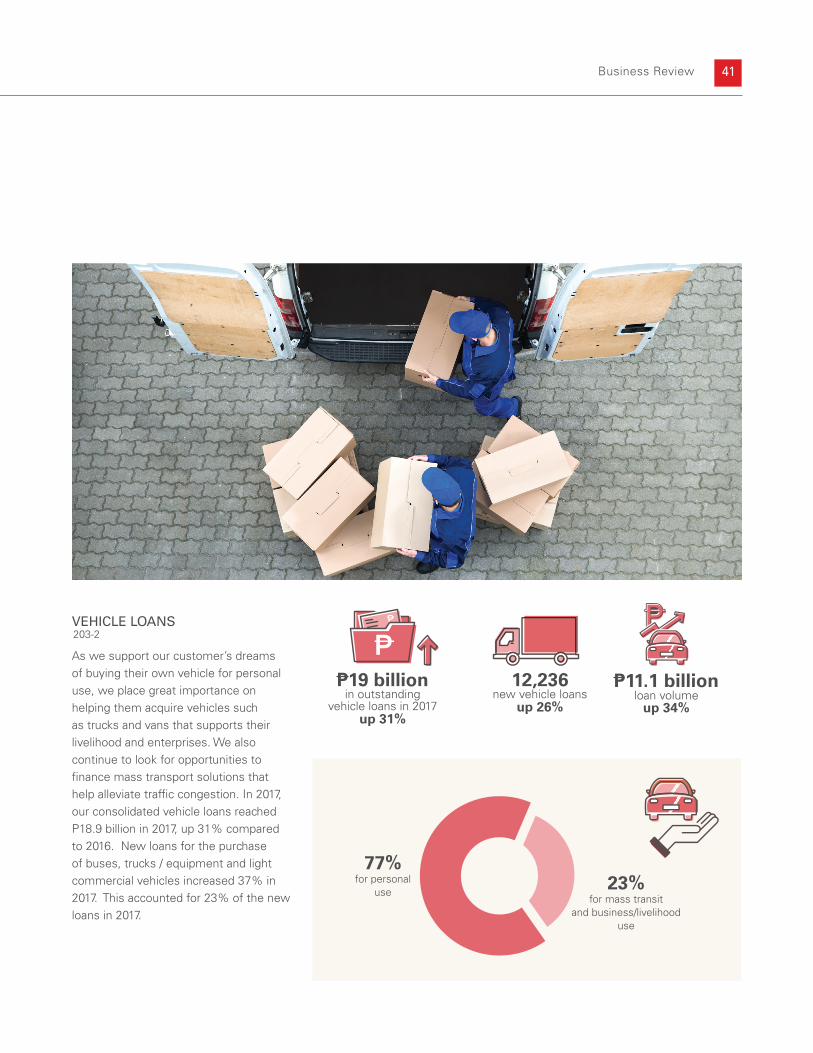
As we support our customer’s dreams of buying their own vehicle for personal use, we place great importance on helping them acquire vehicles such as trucks and vans that supports their livelihood and enterprises. We also continue to look for opportunities to finance mass transport solutions that help alleviate traffic congestion. In 2017, our consolidated vehicle loans reached P18.9 billion in 2017, up 31% compared to 2016. New loans for the purchase of buses, trucks / equipment and light commercial vehicles increased 37% in 2017. This accounted for 23% of the new loans in 2017.
12,236 new vehicle loans
up 26%
23% for mass transit
and business/livelihood use
77% for personal
use
203-2
P19 billion in outstanding
vehicle loans in 2017up 31%
loan volume up 34%
P11.1 billion
41Business Review

Teaching the teachers financial empowermentCBS helps teachers become more financially empowered through “China Bank Savings DepEd Venture: Alay sa mga Guro”. The program was launched during the National Teachers’ Month and World Teachers’ Day on October 6, 2017 wherein CBS gathered 600 public school teachers and DepEd employees from 59 participating schools for a day of leisure and learning activities, including a financial wellness seminar conducted by business coach and motivational speaker Rex Mendoza. Discussed during the seminar was the value of investing and regularly setting aside a portion of their income for savings no matter how little they earn, and using credit wisely, such as allocating borrowed funds to gainful purposes like investing in property or business or to cover their family’s health and education needs.
DepEd LOANS203-2
Like any consumer, teachers sometimes have problems with cash shortage. Through China Bank Savings (CBS), we are helping the Department of Education’s public school teachers and non-teaching employees with their cash flow problems and keeping them from borrowing from loan sharks and being trapped in debt. CBS offers Easi-APDS Loan, an affordable, non-collateral loan for the teaching and non-teaching personnel of the Department of Education (DepEd). Since the launch of Easi-APDS Loan in 2015, CBS has lent almost P2 billion to help over 16,000 DepEd teachers and employees with their financial emergencies, home repairs, education, and business needs.
DISTRIBUTION OF AMOUNT OF LOAN DISBURSED PER AREA
Luzon
Visayas
Mindanao
DISTRIBUTION OF AMOUNT OF LOAN DISBURSED BASED ON PURPOSE
3% Hospitalization
9% Housing
7% Business
20% Educational
Generalneedsof theclients
LoanProceedsdirectly contributingto SDG
11,432new loan accounts in 2017
90%
9%1%
NUMBER OF BORROWERS PER PROCEED TYPE
Pers
onal
Con
sum
ptio
n
Edu
catio
nal
Bus
ines
s
Hou
sing
Hos
pita
lizat
ion
12000
10000
8000
6000
4000
2000
0
No.
of
borr
ower
s
MAKING DREAMS COME TRUE
P1.4 billion loan released in 2017
42 China Bank Annual Financial and Sustainability Report 2017

CREDIT CARDS
In today’s economy, a credit card is an important part of life. Aside from being a more secure mode of payment for just about everything, a credit card is handy for emergencies. We offer three credit card variants that fit various consumer lifestyles and spending habits. In 2017, we had three big raffle promos and launched the “#LiveRewarded with China Bank Mastercard” campaign to make it even more rewarding for customers to use their China Bank MasterCard for gastronomic experiences (“#DineRewarded”), for discovering the world (“#TravelRewarded”), or for making occasional shopping splurges
44,792 cards in force
CHINABANK
CHINABANK
Big prizes and surprises In February, we had the “Tokyo Holiday Treats Raffle Promo” and gave away an all-expense paid vacation prize package for 2 to Tokyo, Japan. This was followed in June with the “Splendid London Raffle Promo” that awarded a lucky cardholder with the experience of a lifetime in London. We capped off the year with the “12 Weeks of Christmas” campaign that truly brought the holiday cheer to 920 daily winners of P1,000 worth of SM Gift Pass, 12 weekly winners of P20,000 worth of SM Gift Pass, and 1 grand raffle winner of P100,000 worth of SM Gift Pass.
Delights for every occasion We intensified our card usage programs with tie-ups with merchants like Giordano, Burgoo, and Gumbo and with tactical promotions like with Zalora for Chinese New Year, Island Rose for Mother’s Day, and Techno Marine for Father’s Day. We also established programs with hotels, travel, and leisure partners like Raffles & Fairmont Makati, Spectrum, Two Seasons, and The Oriental Hotels. Our ongoing partnership with Mastercard Priceless Experiences provided exciting cross-border offers in Macau, Japan, Korea, and Singapore. New partnerships with online merchants like Lazada, ShopBack and Jinio strengthened our online presence. The year ended with over 60 merchants in total, and still growing.
China Bank Prime, China Bank Platinum, and China Bank World MasterCard Launched in 2015
that they deserve (“#ShopRewarded”). Our merchant partnerships were also intensified so cardholders can enjoy more perks and discounts.
P5.2 billion in gross billings in 2017
up 14%
Bus
ines
s
P289 million in installment billings
43Business Review

China Bank Annual Financial and Sustainability Report 201744
Environmental, Social, and Governance
China Bank Annual Financial and Sustainability Report 201744
julesperez
Sticky Note

45
We take our responsibility to our customers, employees, investors, and society very seriously. While serving our customers well is the core of our business strategy, we approach all of our stakeholders with the same sense of responsibility and commitment. We closely monitor the changing environment in which we operate to ensure that we remain relevant, responsive, and able to capture and manage our environmental, social, and governance (ESG) issues on an ongoing basis. We aim to manage the impact of our activities and balance our interests with those of our stakeholders to ensure our long-term profitability, drive economic progress, and generate sustainable value for all.
Environmental, Social, and Governance

UNDERSTANDING WHAT MATTERS MOST
46 China Bank Annual Financial and Sustainability Report 2017
Addressing what’s important to our stakeholders and our business is an opportunity for us to strengthen our Bank, improve the way we do businesses, and create sustainable value. In 2017, we conducted a materiality assessment for the first time to identify and prioritize material sustainability topics that are of significance to both the Bank’s business and our stakeholders. We engaged an external consultant, Philippine Business for the Environment, to provide additional rigor and analysis to the process.
Materiality Process102-42, 102-46, 102-47
BENCHMARKING We researched competitors and peer companies to establish a baseline understanding of trends, best practices, and material topics in the banking industry.
IDENTIFICATIONWe consulted our key stakeholder groups to identify an array of environmental, social, and governance topics. To gain broader perspective on these topics of interest, we also reviewed various stakeholder reports, investor briefing materials, results of our customer satisfaction surveys, and other sources.
PRIORITIZATIONWe conducted working sessions, face-to-face interviews, and phone/email consultations with our senior management and various business groups and select external stakeholders. We asked the respondents to select issues that present significant risk, leadership opportunities, or long-term effects on our business.
VALIDATIONWe consolidated their feedback, confirmed with the various business groups that all significant aspects and impacts have been considered, and presented the materiality results to senior management.

47
Category Material Topics How we measure our performance BoundaryGovernance Efficiency in dispensing of fiduciary
duties
Adherence to our core values
Transparency
Trustworthiness
Alignment with BSP, SEC and PSE rules,
and with international
best practices
GRI 102 Governance
GRI 205 Anti-corruption
Internal
Economic Financial performance
Pricing of products and services
Managing risks
GRI 201 Economic Performance
GRI 203 Indirect Economic Impacts
Internal
and External
Environment Resource Management GRI 302 Energy
GRI 303 Water
GRI 305 Emissions
Internal
People Employee retention and talent
management
Healthy workplace
Client relationship
Local community development
GRI 401 Employment
GRI 404 Training and Education
GRI 403 Occupational Health and
Safety
GRI 405 Diversity and Equal Opportunity
GRI 413 Local Communities
GRI 418 Customer Privacy
Internal
Value Creation Impact of our financial products on
sustainable development
Financial contribution to SDG Investment
Areas
Internal
and External
Environmental, Social, and Governance
Material Topics102-47
Resulting from the materiality process are key topics that are highly significant to our stakeholders and to building a more sustainable company. These topics will serve as our points for review in the succeeding reporting periods.

Engaging our stakeholders 102-40, 102-43, 102-44
Engaging with our stakeholders is essential to building trust and strong relationships. By understanding their needs, concerns, and expectations, and more importantly, embedding their feedback into our strategy and our daily business, we are able to develop long term-solutions, make responsible business decisions, and perform better. We will continue to engage with our stakeholders on a regular basis to keep a pulse on their rising expectations and the changing sustainability landscape.
China Bank Annual Financial and Sustainability Report 201748
Our stakeholders
How we engage them and how often
What matters to them What we are doing
Customers • Daily customer interactions: face-to-face with personnel at branches; via e-mail, telephone, and social media channels
• Annual customer satisfaction surveys
• Regular visits to select customers
• Year-round events: market outlook briefings, wealth forums, etc.
• Service quality • Availability and accessibility
of electronic banking channels
• Easy account opening and loan application requirements and processes
• Sound financial advice• Capable personnel to
address concerns
• Continuous service, process, and technology improvements
• On-going capacity building: hiring people with the right qualifications, competencies, and attitude and further developing their skills through training
Investors • Regular investor meetings• Periodic roadshows of Investor
Relations• Annual stockholders’ meeting
• Shareholder returns• Financial performance• Continued growth, well-
managed risks
• Timely and transparent updates and disclosures
Employees • Regular face-to-face meetings, trainings, and digital interactions through email, Intranet, and e-Learning Portal
• Monthly area meetings• Annual National Convention• Annual performance evaluation
• Career development• Work-life balance• Understanding of
organizational goals
• Continuous implementation and enhancement of employee development and employee volunteerism programs
• Cascade of Wildly Important Goals (WIGs)
Regulators • Regular correspondence via letters and email
• Regular audits• Annual BSP examination
• Transparency and accountability
• Compliance with relevant Philippine laws, rules, and regulations
• Updates on the performance of the Bank
• Responsible lending• Ethics and compliance
• Prompt response to inquiries and requests for explanation on certain matters
• Timely and transparent disclosures and regulatory compliance reports
• Annual conduct of internal and external audits
Analysts • Regular correspondence via letters and email
• Periodic roadshows of Investor Relations
• Periodic one-on-one dialogues
• Shareholder returns• Financial performance• Continued growth, well-
managed risks
• Prompt response to inquiries• Timely and transparent
updates and disclosures• Complete, self-explanatory
disclosures
Suppliers and contractors
• Accreditation• Regular correspondence via
letters and email• Regular dialogues during FRP
process
• Procurement policies • Cascade of policies and regular updates
Industry groups
• Membership• Periodic general membership
meetings, working committee meetings, conferences, and fellowship activities
• Continuing membership• Discussion of industry
trends, updates, and common concerns
• Adoption of new rules and regulations
• Collaboration • Participation in socio-civic
projects
• Active membership• Attendance in meetings,
conferences, and fellowship activities
• Participation in meetings with key policy decision makers
NGOs and charitable institutions
• Regular correspondence via letters and email
• Periodic partnerships or sponsorships
• Post-event feedback
• Support for projects and initiatives
• Collaboration• Feedback on activities
conducted
• Participation in and support of worthy causes
• Continuous enhancement of community relations

Environmental, Social, and Governance 49
2017 DIRECT ECONOMIC VALUE
P32.64billion
Generated
Distributed
P3.55billion
Retained
TOTAL P29.09 BILLION
ProvisionsP754.17
million
Other OperatingCostsP7.84billion
Payments toEmployees
P5.70billion
Payments to Providers of Capital
P10.89billion
Community InvestmentsP371.39thousand
Payments to GovernmentP3.92billion
GENERATING AND DISTRIBUTING VALUE
Our strong financial performance makes it possible for us to achieve our long-term growth objectives and deliver sustainable value to our stakeholders. With solid earnings, we are able to invest in technologies, branches, systems, and processes for delivering excellent customer service, provide fair wages and benefits to our employees, distribute dividends to our shareholders, and contribute to government revenues and to community development. We are driven to succeed knowing that our success ripples through the economy and benefits the people and the communities where we operate.
ECONOMIC VALUE GENERATEDAs the revenue we generate progressively increases over the years, economic value distributed to our stakeholders also grew. In 2015, we distributed P21.29 billion in economic value, which increased 12% to P23.86 billion in 2016. Last year, we distributed P29.09 billion in economic value, 22% higher compared to 2016.
201-1
40
35
30
25
20
15
10
5
0
Bill
ions
89.44%88.42%
89.14%
10.56%11.58%
10.86%
23.8026.99
32.64
2015 2016 2017
Economic value distributed Economic value retained

China Bank Annual Financial and Sustainability Report 201750
MANAGING OUR ENVIRONMENTAL IMPACT102-11
Water Consumption303-1
HEAD OFFICE AND OTHER OFFICES
66,089 cubic metersWater consumption in 2017
Head Office
Head Office Parking
Binondo Business Center
VGP, TMBC
Shaw, Haig
Valenzuela
63%
22%
11%
3%
0%
1%
BRANCHES(China Bank only)
ANNUAL AVERAGE WATER CONSUMPTION / YEAR / BRANCH
2017
P25,280391 branches*
2016
P26,180352 branches*
AVERAGE WATER CONSUMPTION IN BRANCHESIn thousand pesos per month
2016 20170
0.6
1.8
1.2
2.4
3.0
2.18 2.11
We are committed to managing our operations responsibly and running our business in a way that supports the protection of the environment. We recognize that our stakeholders increasingly view environmental performance as an essential part of business performance and thus strive to reduce our carbon footprint while we grow our business. Through the years, we have been digitizing customer services and communications, investing in energy-efficient technology in our offices and branches, and promoting the practice of reducing, reusing, and recycling bank-wide through our Going Green Campaign. We are seeking ways to become more eco-efficient in the coming years to further reduce our environmental impact.
We are currently monitoring our consumption to come up with a water conservation plan
* Excluding new branches opened during the year

Environmental, Social, and Governance 51
Energy Consumption and GHG Emissions 302-1, 302-2, 305-2, 305-3
3,425 tonnes CO2of Scope 2 GHG emissions in 2017
645 tonnes CO2of Scope 3 GHG emissions in 2017
5,679,000 kWh
77% 7% 16%
84%
1%
12%
2%
1%
0%
0%
Head Office Building
Head Office Parking
Binondo Business Center
BDO Equi-Tower
VGP, TMBC
Shaw, Haig
Valenzuela
Admin - Motorpool (Diesel)
Canteen (LPG)
Admin - Motorpool (Gasoline)
3.42% reduction in electricity consumption despite opening 45 new branches
P1,000 savings branch/month
(China Bank only)
ANNUAL AVERAGE ELECTRICITY CONSUMPTION / YEAR / BRANCH
2017
P335,920391 branches*
2016
P347,820352 branches*
AVERAGE ELECTRICITY CONSUMPTION IN BRANCHESIn thousand pesos per month
2016
28.9927.99
0
5
15
25
10
20
30
2017
CO2
HEAD OFFICE AND OTHER OFFICES
BRANCHES
* Excluding new branches opened during the year

Diversity and Inclusion 102-7, 102-8, 401-1, 405-1
As a leading bank in the Philippines with nationwide operations, we believe that diversity in expertise, perspectives, age, gender, and culture in all our offices and branches makes us a smarter organization, leading to better decision-making and improved business performance. The more diverse we are, the greater insight we have of our customers and the better we can understand and serve their needs. Thus, in both recruitment and career advancement, we offer equal opportunities to all potential and current employees based on their qualifications and suitability, without discrimination.
SUCCEEDING WITH A HIGHLY ENGAGED AND PRODUCTIVE TEAM
2,134 new employees hired in 2017
1,423Female
711Male
9,124 total employees in 2017
BY AGE
4,804
3,777
543
BY RANK
Rank and File
Junior OfficersSenior Officers
Below 30 years old
30-50 years old
Over 50 years old
2,835
307
Our employees are vital to our ability to serve our customers well, run our business profitably, and achieve our goals for the Bank and society at large. We are committed to strengthen our high performance, close-knit family culture where everyone in the team is contributing, continuously learning, and communicating openly. In line with this, we welcome diversity, provide equal opportunities for employment, skills development, and career advancement, and foster a safe and engaging work environment.
NCRLuzon
Visayas
Mindanao
BY REGION
5,931
526 904
1,763
BY GENDER
2,917Male
6,207Female
BY COMPANY
2,324 China Bank
Savings
172China Bank
PCCI
85 China Bank Insurance26
China Bank Capital
11China Bank Securities
6,506China Bank
5,982
China Bank Annual Financial and Sustainability Report 201752

Compensation and Benefits102-41, 401-2
We value our employees and want them to enjoy a fulfilling career with us. We provide fair and competitive compensation, consistent with industry standards, and comprehensive benefits, including group accident insurance, term life insurance, comprehensive healthcare plan, retirement benefits, employee assistance plans (loans, car plan, tuition reimbursement, etc.), sick leave, vacation leave, and more. Our merit-based rewards system ensures that promotions, merit increases, profit sharing*, and performance bonuses are based on the individual employee performance rating and contributions to the Bank.
In 2017, we concluded a new collective bargaining agreement (CBA) with the CBC Employees’ Association. The 2017-2020 CBA*, provides for wage increases, improvements in benefits like HMO dependents, medical allowance, teller allowance, rice subsidy, and sick leave benefits, accident insurance coverage for employees with regular field assignments, and a contract signing bonus for China Bank’s rank and file employees nationwide.
* For parent bank only ** Employees participated in several courses during the year
Talent Development404-1
We care deeply about our employees’ growth and development and want to help them reach their full potential. Professional training and development programs are offered through both in-house and bank-sponsored external training courses to build our employees’ operational, technical, marketing, service, communication, and leadership skills. In addition, we provide financial support to employees who pursue Master’s degrees related to banking and investments
through our Tuition Refund Program for Graduate Studies*.
3,993 Total no. of employees covered by
CBA*
61% Percentage of employees covered
by CBA*
19,884**Total no. of employees trained
221,487Total training hours
5,39214,492
63,210158,277
BY GENDER
BY EMPLOYEE CATEGORY
Employees trained
Training hours
FEMALE MALE
Rank and file 14,317 174,977
Middle management 5,285 44,822
Senior management 282 1,688
11.14Average traininghours per employee
53Environmental, Social, and Governance
EMPLOYEESTRAINED
TRAINING HOURS

Career Advancement and Succession404-2
We encourage our employees to constantly strive for excellence and empower them with the requisite tools, training, and support to succeed in their careers and contribute to the Bank’s success. We have established clearly defined roles and expectations to ensure that each employee works purposely and productively, motivating them to pursue the many opportunities in the Bank for career advancement. Our Performance Management System ensures that promotions are based on meritorious performance. Meanwhile, our Succession Management Program ascertains that we have a pool of potential successors for our future leadership needs. We conduct periodic reviews of the talent pipeline and implement
individual career development plans.
1,074 EMPLOYEES PROMOTED IN 2017
649rank and file
425officers
Health and Safety We take a holistic approach to ensure our employees thrive at China Bank. We believe that productivity is tied to safe and healthy working conditions; thus, our human resources policies and programs are not only in line with occupational safety and health standards, but also support and promote overall wellness and active and balanced living. We hold annual earthquake and fire drills, release regular health and safety bulletins, and conduct annual physical check-ups and various wellness events and sports activities. We also have first aid kits at all branches and well-stocked clinics at our head office, VGP and Philcom offices, Binondo Business Center, and
Cebu Business Center.
China Bank Annual Financial and Sustainability Report 201754

4 batches conducted
in 2017
55 total participants
7.8 out of 10
Average satisfaction rating
Engagement and Work-Life Balance401-1
We constantly engage with our employees to motivate and energize them to do their best work everyday. With our open communication approach, various engagement and work-life integration programs (see page 56), and the inspiring leadership of our senior management, our people feel that they are doing work that matters, that we understand and respond to what matters to them, and that they should stay with China Bank because they truly matter to us. The progressive drop in our attrition rates reflects the increasing satisfaction of our employees with their jobs and the Bank.
Engagement Programs*
Our employees’ thoughts, opinions, and suggestions are important to us. We have programs in place to gauge genuine employee sentiment and honest feedback at any point of their employment with us. The feedback and insights gained are analyzed and used to improve existing processes, policies, and programs and to develop new ones to boost employee engagement, productivity, and loyalty. We likewise have mechanisms in place to ensure that employees feel free to voice out their concerns without fear of reproach.
SharePoint Café An idea-sharing program that utilizes the World Café method to facilitate collaborative dialogue with bank officers to gain insights on their concerns, ideas, level of satisfaction, and reasons for choosing and staying with the Bank.
Voice Avenue A retention tool for assessing rank and file employees’ current disposition and perception about their job and the Bank to gain insights on what makes employees stay, what keeps them engaged, and how to prevent future resignations.
Third Month QuestionnaireA follow-up mechanism for monitoring the extent of adjustment of new employees (rank and file and officers) on their third month with the Bank with regard to their work, training, relationships with peers and superiors.
Exit InterviewA mechanism for getting feedback from employees who leave the Bank for various reasons.
7 batches
of assessments in 2017
100 total participants
235 officer respondents
in 2017
8.05 out of 10
Average satisfaction rating
684Exit interviews conducted
in 2017
97% of respondents said they
will recommend China Bank as a place of work
ATTRITION
Officers Rank and File Total
2016 11.50% 19.13% 16.56% 2017 10.42% 14.57% 13.15%
1,053 rank and file respondents
in 2017
8.86 out of 10
Average satisfaction rating
Officers Rank and File Total
2016 305 996 1,301 2017 308 826 1,134
EMPLOYEE TURN-OVER
Environmental, Social, and Governance 55
* For parent bank only

Work-Life Integration Programs*
As a way of institutionalizing Habit 7 of The Seven Habits of Highly Effective People, one of our core programs on personal effectiveness, we keep our team motivated, healthy, and energized with work-life integration programs (WLIPs). We place prime importance on our employees’ personal growth and thus provide them with activities to enjoy other pursuits that will contribute to their mental, physical, and emotional well-being. In 2017, a total of 18 WLIPs were conducted:11 in Manila, 6 in Cebu, and 1 in Cagayan de Oro.
JANUARY Basic Calligraphy
JULYVismin Region: Makeup Workshop
MAYParent and Child: No Bake Desserts
MARCHSelf Defense for Females
JUNEGentle Flow Yoga
JUNE VisMin Region: Basics of Baking
NOVEMBERBasic Painting Workshop
AUGUSTVismin Region: Basic Photography Workshop
SEPTEMBER VisMin Region: Meat
Preservation Techniques
* For parent bank only
China Bank Annual Financial and Sustainability Report 201756

Fair Treatment We believe in treating all our customers fairly and honestly. We provide clear, accurate, truthful, and accessible information so customers can make informed decisions about our products and services. All consumer information materials mandated by the Bangko Sentral ng Pilipinas (BSP) are prominently displayed in our branches. We make recommendations in good faith and based on what is suitable to our customers. We have policies in place to protect customers from over-indebtedness. Moreover, our friendly branch personnel and Customer Contact Center are trained to answer questions (via phone, email, or social media) about our products and services, explain the risks that certain products or services carry, and advise customers on financial matters. Transaction SecurityThe safety of our customers’ money is our number one priority, and we work hard to prevent our customers from becoming victims of financial crime. We have security systems and protocols that are regularly monitored and updated to ensure the security of customer transactions across all our banking channels. We also provide timely advice via our branch personnel, posters, email, website, and social media on guarding against scams and protecting ATM and credit card and sensitive information like PINs and passwords. Reporting captured, missing and stolen cards, and fraud cases is easy through our 24/7 Customer Support Hotline.
Data Privacy103-2 We go to great lengths to provide a secure and confidential environment to protect our customers’ data. We comply with all applicable privacy laws and maintain customer data confidentiality except when a disclosure is obliged by the Court or other authorities, or disclosure is made with the
written consent of the customer. Access to customer data is restricted to authorized personnel only. The confidentiality of China Bank customer data also extends to our subsidiaries, affiliates, and third party suppliers and contractors.
Customer Assistance We are driven to earn our customers’ loyalty through great customer service. We appreciate the chance to assist them with any aspect of their accounts, our products or services, and to make things right for them should they have concerns. Our customers can reach us through a variety of convenient channels: Customer Support Hotline, e-mail, “Contact Us” page of our website, Facebook, Twitter, and our vast network of branches nationwide. Our Customer Contact Center (CCC), headed by our Chief Consumer Assistance Officer, is our designated Consumer Assistance Office. Supported by our Customer Contact Management System (CCMS), CCC ensures that requests and concerns sent through any channel are well documented, efficiently handled, and promptly investigated and resolved.
SERVING CUSTOMERS WELL102-43, 102-44
Our customers are the center of what we do at China Bank. We develop customer-centric products, policies, and processes to create great customer experiences and build enduring relationships of trust with our customers. Our Board is on top of our robust Consumer Protection Framework which guides us in serving our customers, protecting their rights and interests, and handling their requests, concerns, and complaints to their satisfaction.
Environmental, Social, and Governance 57

Customer Satisfaction Survey Customer feedback is important to us. We encourage customers who visit our branches to let us know how we served them via a simple customer satisfaction survey. We have customer feedback drop boxes in our branches and the feedback forms are collected and tallied on a monthly basis. The 2017 overall results revealed that 93% of the respondents are satisfied or very satisfied with our service. Customers rated us on Service – queue time, branch staff service for account opening and deposit/withdrawal, and ATM services, and premises – overall look of the branches and security guard.
Customer Interactions 81% of the customer interactions captured by our CCMS in 2017 were inquiries and requests. Complaints only accounted for 5% from 6% in 2016.
CLIENTS INTERACTION
2017 CUSTOMER SATISFACTION SURVEY Inquiry58%
Request27%
Complaint5%
Others10%
2017
Inquiry60%
Request26%
2016
Complaint6%
Others8%
Toll-free numbers: 1800-1888-5-888 (PLDT) Provinces 1800-3888-5-888 (Digitel) Provinces
001-800-1-888-5888 Hong Kong / Singapore / Korea / Thailand 00-800-1-888-5888 Italy/China011-800-1-888-5888 USA/Canada0011-800-1-888-5888 Australia010-800-1-888-5888: 0061010-800-1-888-5888 (mobile phone/pay phone) Japan
Overall Rating Services Premises
in Percentage of 2,094 Respondents
100
80
40
90
50
70
30
60
20
10
7874 76
1520 20
3 3 2 4 3 2
Very Satisfied
Very Dissatisfied
Satisfied Dissatisfied0
24/7 CUSTOMER SUPPORT (Press “0” to speak to a phone banker) 88-55-888 Metro Manila
China Bank Annual Financial and Sustainability Report 201758

Others5%
Deposits &Branch Banking
2%
AlternativeChannels
54%
39%
REPORTED CONCERNS
AlternativeChannels
71%
Others2%
Deposits &Branch Banking
3%
Credit Card24%
Beyond TAT6%
WithinTAT
94%
Reported Concerns Although it is notable that the share of alternative channels (ATM, Internet Banking, Phone Banking, POS) increased from 54% in 2016 to 71% in 2017, concerns related to these channels generally decreased by 5%. Similarly, Credit Card-related concerns dropped to 24% as credit card processes were enhanced. The common client concerns in 2017 were mostly related to ATM withdrawals, captured cards and other online banking transactions, such as bills payment and fund transfer. Credit card-related concerns received were mostly on declined card transactions, statement-related complaints, and transaction disputes. Despite the switch to EMV and the ensuing ATM re-carding and deactivation of non-EMV ATM cards last year, there was no increase in ATM-related concerns. Overall, concerns received in 2017 were 27% less vs. 2016.
Complaints Resolved 94% of the complaints received in 2017 were resolved within the BSP standard turnaround time.
Customer Contact Center China Bank Building, 8745 Paseo de Roxas corner Villar Street, Makati City 1226 Philippines
(02) 519-0143
www.chinabank.ph
www.facebook.com/chinabankph
www.twitter.com/chinabankph
@
2017
2017
2016Credit Card
Environmental, Social, and Governance 59

SUPPORTING OUR COMMUNITIES 413-1
MARCH
PC Donation to Nagkaisang Nayon Elementary School, Quezon City
The first leg of China Bank and CBS' donation of personal computers to help modernize public schools in the country.
APRIL
Tindang Bigay Tulong Part 2China Bank’s rummage sale that raised over
P15,000 to help fund the various projects of the Human Resources Group’s Personal Social Responsibility Program.
MAY
Brigada Eskwela200 CBS volunteers helped clean and refurbish
classrooms and campus facilities of 40 public elementary and high schools in four Metro Manila cities and 15 provinces.
JUNE
Buhay PunlaanIn partnership with Haribon Foundation, China
Bank employees and their relatives joined the forest restoration activity at Buhay Punlaan, a nursery of native tree species and living laboratory showcasing rainforestation technology in Lumban, Laguna. The Bank donated cash to the Haribon Foundation and the volunteers helped bag soil mixture, transfer 200 grown
Narra seedlings to soil-ready polyethylene bags, prune overgrown roots of 300 Narra seedlings, transfer grown Narra seedlings to elevated seedling beds to get more sunlight, and plant Laniteng Gubat and Molave trees.
JULY
Tulong sa MarawiCBS turned over 200 student starter kits, 200
basic teaching kits, 100 hygiene kits, six boxes of slippers and assorted clothing in response to the urgent appeal of the Department Education for aid to teachers and primary school students of Marawi during the several weeks of fierce battles between government forces and insurgents.
PC Donation to Moonwalk National High School, Parañaque
The second leg of China Bank and CBS' donation of personal computers to help modernize public schools in the country.
AUGUST
PC Donation to San Fernando Elementary School, Pampanga
The third leg of China Bank and CBS' donation of personal computers to help modernize public schools in the country.
Donation to Philippine Red Cross' Blood Samaritan Project
China Bank donated 174 blood units to 62 indigent families as part of the Bank's continued humanitarian support to the Philippine Red Cross.
9
27
15
24
18
24
15
We are committed to the well-being of the communities where we operate. By fostering local economic development activities and providing jobs, as well as through community engagement and charitable giving, we contribute economic and social benefits and help address important community issues. Our community-based giving program encourages employee volunteerism and builds a sense of shared pride in supporting causes and initiatives that our employees are passionate about. Over the years, China Bank and China Bank Savings (CBS) have made generous donations of time and resources to public schools, hospitals, environmental organizations, and various charities through our branches and offices in the communities where we operate.
16
China Bank Annual Financial and Sustainability Report 201760

SEPTEMBER
Busog-Lusog ProjectCBS joined the observance of Nutrition Month
with a Busog Lusog nutrition activity for Grade 1 pupils of Lakandula Elementary School in Tondo, Manila.
PC Donation to Santor Elementary School, Bulacan
The fourth leg of China Bank and CBS' donation of personal computers to help modernize public schools in the country.
Clean-up of the Las Piñas-Paranaque Critical Habitat and Ecotourism Area (LPPCHEA)In partnership with Haribon Foundation, China Bank
helped remove as much trash as possible from LPPCHEA, considered as the last refuge for migratory birds in Metro Manila.
OCTOBER
DepED Venture: Alay sa mga GuroAn event conducted by CBS to commemorate National Teachers’ Month and World Teachers Day
attended by 600 teachers and non-teaching staff from 59 public schools across Metro Manila. The highlight was the exclusive seminar on financial wellness by leading financial literacy and expert motivational speaker Rex Mendoza.
Run for MarawiCBS employees joined the benefit run for displaced Marawi residents. The event was organized by the
Bankers Club of Negros Occidental and was held in Bacolod.
NOVEMBER
Project RAISE for Education/Empowerment of Dumagats (RED)
CBS launched Project RED as an ongoing program to support volunteer teachers of AGAP Buhay in the Dumagat communities in Rizal province. The program aims to collect both new and pre-loved books, art supplies, teaching aids, and school materials for the benefit of the Remontado Dumagat communities in upland Barangay Laiban in Tanay, Rizal and Talim Island in Laguna de Bay.
DECEMBER
Caring is Sharing ActivityChina Bank employees shared the joy and
blessings of Christmas with the abandoned children cared for by the Asilo de San Vicente de Paul. The volunteers spent a fun-filled day with the children, shared a sumptuous meal with them, and distributed 80 gift packs of school lunch kits, umbrellas, and tumblers. For the institution, they donated 10 sacks of rice, canned goods and powdered milk, and vitamins for kids and adults.
Regalong Pamasko Para sa mga Pamilyang Walang Tahanan
CBS employees distributed 144 comfort packages to homeless families along Roxas Boulevard, Manila. The packages contained gifts of rice, pasta and noodle packs, assorted canned goods, biscuits, sweets, juice mix, drinking water, toys, and clothing.
14
15
23
6
26
23
18
19
Environmental, Social, and Governance 61

Environmental, Social, and GovernanceChina Bank Annual Financial and Sustainability Report 201762 63
Continuously Strengthening our Governance102-12, 102-17
Our Board adopts a policy of full compliance with the Code of Corporate Governance (the “Code”). To carry out the Board’s mandate, the Compliance Office oversees the effective implementation and monitoring of the Bank’s compliance with the Code. In 2017, we fully complied with all the material requirements of a publicly-listed company, as set forth in the Code. To enhance our position as one of the best-governed banks in the Philippines, we continue to strengthen our corporate governance practices by implementing new initiatives, including addressing the few remaining recommendations in the Integrated Annual Corporate Governance Report.
1. Updated the Corporate Governance Manual (CG Manual) to align with the recently issued regulations and international best practices.
2. Enhanced the Related Party Transactions (RPT) framework, policy, processes, practices, and updated the committee charter to comply with applicable rules and regulations.
3. Complied with the requirements of the Code for publicly listed companies and the ASEAN Corporate Governance Scorecard. The following are some of the changes in the Board: • Appointment of a lead independent director,
Roberto F. Kuan
DOING BUSINESS THE RIGHT WAY102-16
• Election of one female Independent Director, Margarita L. San Juan
• Appointment of a new President, William C. Whang• Updating of the diversity policy and its disclosure
with the skill set matrix and the measurable objectives – available in our Corporate Governance micro site: http://chinabank.ph/corgov.aspx
• Reorganization of the Audit, Corporate Governance, and Risk Oversight Committees
4. Reviewed and revised the committee charters to align with the latest issuances.
5. Conducted the annual assessment for the Board, Board level committees, and the President and Chief Executive Officer (CEO).
6. Conducted an annual training for directors and officers on corporate governance, anti-money laundering, data privacy, and board skill on decision making (Butterfly Perspective).
Board of DirectorsThe Board is the highest governing authority at China Bank. The Board sets the tone for and leads the practice of ethical business conduct, guides our overall corporate philosophy and direction, and carries out oversight responsibility for business and risk strategy, financial soundness, and regulatory compliance.
Good corporate governance is vital to China Bank’s success and sustainability. We are committed to doing business the right way—in accordance with the law, the best practices, and the best interest of our stakeholders. Our robust governance, compliance, and risk management system ensures that we have a strong foundation to pursue our goals and deliver on our commitments.
Guided by the principles of accountability, transparency, fairness, and integrity, we are driven to continuously improve and uphold the highest standards of corporate governance to remain strongly positioned for value creation.

Environmental, Social, and GovernanceChina Bank Annual Financial and Sustainability Report 201762 63
The current Board is composed of 11 directors and two advisors who bring with them diversity in skills, expertise, experience, age, gender, and educational background. Of the 11, two are executive directors, three are Independent and the rest are non-executive directors creating an appropriate mix that is commensurate to the size and complexity of our operations.
To ensure that directors can perform their duties to the Bank diligently, our CG Manual states that directorships in other publicly-listed companies shall be limited to five.
Chairman and Chief Executive Officer102-23
The roles of Chairman of the Board and Chief Executive Officer are clearly separated and their responsibilities have been set out in our CG Manual. The Chairman, a non-executive director, is responsible for the leadership and effective running of the Board, while the President leads the senior executive team in the day-to-day running of China Bank, primarily responsible for the achievement of agreed objectives and the execution of strategies as established by the Board.
On October 31, 2017, Ricardo R. Chua who served as China Bank President & CEO for three years, and prior to that as Chief Operating Officer for 20 years, officially retired. He was succeeded by William C. Whang as our new President on November 1, 2017.
An executive director is defined in our CG Manual as a director who has executive responsibility of day-to-day operations of a part or the whole of the organization, while a non-executive director has no executive responsibility and does not perform any work related to the operations of the corporation. Independent Directors are also non-executive directors.
Independent Directors To create a strong element of independence in the Board, we have three independent directors. To lead the Board in cases where management has clear conflict of interest, a Lead Independent Director was appointed in 2017 with the following functions:
• Serves as an intermediary between the Chairman and the other directors when necessary;
• Convenes and chairs meeting of the non-executive directors; and
• Contributes to the performance evaluation of the Chairman, as required
We define an Independent Director as someone holding no interests or relationships with China Bank, the controlling shareholders, or the Management that would influence their decisions or interfere with their exercise of independent judgment, among others.

Environmental, Social, and GovernanceChina Bank Annual Financial and Sustainability Report 201764 65
We have fully complied with all the applicable rules on their nomination and election. And based on the 2017 annual assessment of directors, the Board was satisfied that our three Independent Directors continue to be independent and free from any business or other relationship that could interfere with their exercise of independent judgment.
As stated in the CG Manual, our independent directors serve a cumulative term of up to nine years (reckoned from 2012 based on the rules of the Securities and Exchange Commission). While they are on the China Bank Board, they are not allowed to hold interlocking directorships in more than five listed companies.
Board Nomination and Election102-24
We have a rigorous and transparent procedure for the nomination and election of new directors to the Board to ensure a diverse and well-balanced approach. To the extent practicable, directors may be selected from a broad pool of qualified candidates. The Board may use professional search firms or other external sources of candidates when searching for candidates for the Board.
The shareholders nominate candidates by submitting the nomination to any member of the Nominations Committee, the Corporate Governance Committee, or the Corporate Secretary on or before the prescribed date. The Nominations Committee reviews and evaluates the qualifications of the candidates in line with the fit and proper standards, the full Board confirms these candidates’ nominations, and the shareholders elect the directors during the Annual Stockholders’ Meeting.
Upon their election, the Directors are issued a copy of their general and specific duties and responsibilities as prescribed by the Manual of Regulations for Banks (MORB), which they acknowledge to have received and certified to have read and fully understood. Copies of the acknowledgement receipt and certification are submitted to the Bangko Sentral ng Pilipinas (BSP) within the prescribed period. Moreover, the directors also individually submit a Sworn Certification that they posses all the qualifications as enumerated in the MORB. These certifications are submitted to the BSP after their election. Additional certifications are executed by Independent Directors to comply with the Securities Regulation Code and BSP rules which are then submitted to the SEC.
Retirement and SuccessionThe Board is responsible for ensuring and adopting an effective succession planning program for directors, key officers and management to ensure growth and a continued increase in the shareholders’ value. To promote dynamism in the corporation, as a matter of policy, a director shall remain in the Board of the Bank for as long he/she remains to be fit and proper for the position of a director, in accordance with the requirements of the MORB.
Succession, replacement or vacancy in the Board due to retirement or any other reason, is addressed in our By-Laws, stating that vacancies in the Board may be filled by appointment or election of the remaining directors, if still constituting a quorum; otherwise, the stockholders shall fill such vacancy in a regular or special meeting called for this purpose.
Board Orientation and Training ProgramContinuous education is important to keep our Directors up-to-date with industry developments and to strengthen the Board’s competencies in dealing with corporate governance, risk management, and strategic issues faced by the banking industry in general, and China Bank in particular.
We have a full orientation program for newly-elected Directors, which includes branch visits and comprehensive training materials and operations manuals, and a continuing education program for all our Directors, which includes briefings on relevant new laws, risk management updates, and changes in accounting standards at Board/Board Committee meetings and seminars on Corporate Governance and anti-money laundering conducted by SEC-accredited training providers. In order to maintain professional integrity, enhance his/her skills, knowledge and understanding of the development in banking industry, the Directors are required to attend, at least once a year a training course/seminar on corporate governance or relevant topics.
2017Exclusive Corporate Governance Training for Directors
and Key Officers
2016Exclusive Corporate Governance Training for Directors
and Key Officers2015 Exclusive Corporate Governance Training
2014Exclusive Corporate Governance Workshop Anti-Money Laundering Seminar
2009 Anti-Money Laundering Seminar
2002Special Seminar on Corporate Governance for Bank
Chairmen & CEOs

Environmental, Social, and GovernanceChina Bank Annual Financial and Sustainability Report 201764 65
Corporate Secretary To enable our Directors to discharge their duties efficiently and effectively, they have full and unrestricted access to Management and employees of the Bank and affiliated companies, external consultants and advisors, and the Corporate Secretary.
The Corporate Secretary is a senior, strategic-level corporate officer who has the vital role of official record keeper responsible for the administrative side of board and committee meetings, corporate governance gatekeeper responsible for overseeing sound board practices, and board liaison who works and deals fairly and objectively with the board, management, stockholders and other stakeholders. The Corporate Secretary is required to attend all Board meetings.
Board MeetingsThe Board meets at least once a month, set to be every first Wednesday, to review China Bank’s financial performance, approve strategies, policies, and business plans, as well as to consider business and other proposals which require the Board’s approval. Special Board meetings may also be called to deliberate and assess corporate proposals or business issues that also require Board approval. For Board decisions, a minimum quorum of at least 2/3 of the Board members present, unless a different voting requirement is required by existing laws, rules, and regulations.
The directors are expected to prepare for, attend, and participate in these meetings, and to act judiciously, in good faith, and in the best interest of China Bank and our shareholders.
Under China Bank’s CG Manual, a Director may participate by telephone-conferencing when exigencies prevent him from attending a Board meeting in person.
The Board is provided with the information and resources needed to effectively discharge its fiduciary duty. The Board is informed on an ongoing basis of the Bank’s performance, major business issues, new developments, and the impact of the economic and regulatory environment. All Directors are supplied with the relevant information and materials such as the agenda for each board meeting, together with detailed reports and proposal papers, at least five business days before the board meeting date. Members of Senior Management are invited to attend board meetings to provide the Board with detailed explanations and clarifications on proposals to enable the Board to make an informed decision. The meetings of the Board and its committees are recorded in minutes, and all resolutions are documented.
In 2017, the China Bank Board had 17 meetings, including the organizational meeting regularly held after the Annual Stockholders’ Meeting.
Director Attendance %Hans T. Sy (Chairman) 16 94Gilbert U. Dee (Vice Chairman) 17 100Ricardo R. Chuaa 15 100William C. Whangb 2 100Peter S. Dee 17 100Joaquin T. Dee 17 100Herbert T. Sy 14 82Harley T. Sy 15 88Alberto S. Yao 17 100Roberto F. Kuan 17 100Jose T. Sio 16 94Margarita L. San Juanc 9 100
a Retired on October 31, 2017b Elected on November 1, 2017c Elected on May 4, 2017
Board Committees102-19
China Bank has nine board-level committees and five management-level committees.
Each committee has a charter and operates within its specific delegated authority and functions. The committee charters, which are reviewed annually and amended when necessary, are posted in our Corporate Governance microsite: http://chinabank.ph/corgov.aspx.
The members of the different committees are appointed by the Board at the annual organizational meeting, taking into account the optimal mix of skills and experience of the members.

Environmental, Social, and GovernanceChina Bank Annual Financial and Sustainability Report 201766 67
Executive Committee (ExCom) has the powers of the Board, when the latter is not in session, in the management of the business and affairs of China Bank to the fullest extent permitted under Philippine law.
The ExCom convened 41 times in 2017, including 2 joint meetings with the Risk Oversight Committee (formerly Risk Management Committee).
Director Attendance %Hans T. Sy (Chairman) 36 88Gilbert U. Dee 41 100Peter S. Dee 34 83Joaquin T. Dee 40 98Ricardo R. Chuaa 33 94William C. Whangb 6 100
a Attended 33 out of 35 meetings from January 2017 until his retirement effective October 31, 2017
b Attended 6 out of 6 meetings from his election effective November 1, 2017
Corporate Governance Committee is responsible for ensuring that the Bank’s Corporate Governance framework is regularly reviewed and updated, and implemented accordingly at all times. It provides assistance to the Board by overseeing the orientation and training programs for its members, as well as facilitating the performance evaluation of the Board, Board-level committees and senior management.
The Corporate Governance Committee had 25 meetings in 2017, including joint meetings with the following: Audit Committee – 6, Compliance Committee – 4, and Nominations Committee – 15.
Director Attendance %Roberto F. Kuan (Chairman) 20 80Alberto S. Yao 25 100Hans T. Sya 13 87Joaquin T. Deeb 15 100Margarita L. San Juanc 8 80
a Member up to May 3, 2017; attended 13 out of 5 joint meetings of Nominations & Corporate Governance Committees, 4 joint meetings of Compliance & Corporate Governance Committees, and 6 joint meetings of Audit, Compliance and Corporate Governance Committees
b Member up to May 3, 2017; attended 15 out of 5 joint meetings of Nominations & Corporate Governance Committees, 4 joint meetings of Compliance & Corporate Governance Committees, and 6 joint meetings of Audit, Compliance and Corporate Governance Committees
c Member from May 4, 2017; attended 8 out of 10 meetings
Audit Committee oversees all matters pertaining to audit, primarily the evaluation of the adequacy and effectiveness of the Bank’s internal control system and integrity of financial statements, with explicit authority to investigate any matter within its terms of reference, to ensure the strength of the Bank’s internal controls. It also appoints, reviews, and concurs in the appointment or replacement of the Chief Audit Executive (CAE) and the External Auditor, and is responsible for ensuring that the CAE and the internal and external auditors remain independent, an annual review is performed, and the Bank complies with the Institute of Internal Auditors’ International Standards for the Professional Practice of Internal Auditing and Code of Ethics.
The Audit Committee had 14 meetings in 2017, including 6 joint meetings with the Compliance and Corporate Governance Committees
Director Attendance %Alberto S. Yao (Chairman) 14 100Joaquin T. Dee 14 100Roberto F. Kuana 9 75
a Member from May 4, 2017
Compliance Committee is tasked to monitor compliance with established banking laws, rules and regulations specifically in creating a dynamic and responsive compliance risk management system to identify and mitigate risks that may erode the franchise value of the Bank, and ensures that Management is doing business in accordance with the said prescribed laws, including policies, procedures, guidelines and best practices.
The Compliance Committee convened 10 times in 2017, including joint meetings with the Audit and Corporate Governance Committees – 6, and with the Corporate Governance Committee – 4.

Environmental, Social, and GovernanceChina Bank Annual Financial and Sustainability Report 201766 67
Director Attendance %Hans T. Sy (Chairman) 9 90Joaquin T. Dee 10 100Alberto S. Yao 10 100
Risk Oversight Committee (formerly Risk Management Committee) is responsible for the development and oversight of the Bank’s risk management functions, including the evaluation of the effectiveness of the enterprise risk management framework and ensuring that corrective actions are in place to address risk management concerns in a timely manner. It oversees the risk taking activities of the Bank and ensures the continued relevance, comprehensiveness, and overall value of the institutional risk management plan.
The Risk Oversight Committee had 14 meetings in 2017, including 2 joint meetings with the ExCom.
Director Attendance %Joaquin T. Dee (Chairman)a 5 100Hans T. Sy 12 86Gilbert U. Deea 5 100Alberto S. Yao 14 100Margarita L. San Juanb 8 89
a Member up to May 3, 2017; attended 5 out of 5 meetings b Member from May 4, 2017; attended 8 out of 9 meetings
Nominations Committee, composed entirely of Independent Directors, is responsible for reviewing and evaluating the qualifications of all persons nominated to the Board and other appointments that require Board approval, including promotions favorably endorsed by the Promotions Review Committee. It is also tasked to review the qualifications of the candidates to ensure that their qualities and/or skills are appropriate for leading and assisting the Bank in achieving its vision and corporate goals.
The Nominations Committee had 15 joint meetings with the Corporate Governance Committee in 2017.
Director Attendance %Roberto F. Kuan (Chairman) 13 87Alberto S. Yao 15 100Margarita L. San Juana 8 80
a Member from May 4, 2017; attended 8 out of 10 meetings
Compensation or Remuneration Committee provides oversight over the remuneration of senior management and other key personnel, ensuring that compensation is consistent with the interest of all stakeholders and the Bank’s culture, strategy, and control environment.
The Compensation or Remuneration Committee had 4 meetings in 2017.
Director Attendance %Roberto F. Kuan (Chairman) 3 75Hans T. Sy 4 100Alberto S. Yao 4 100Harley T. Sy 4 100Margarita L. San Juan 3 75
Related Party Transactions Committee, composed entirely of Independent Directors, is responsible for reviewing all material related party transactions (RPT) to ensure that they are conducted at arm’s length basis and at fair terms as those offered to non-related parties, overseeing the proper implementation of the RPT Policy, and ensuring that corresponding transactions are duly identified, measured, monitored, controlled, and reported.
The Related Party Transactions Committee had 12 meetings in 2017.
Director Attendance %Roberto F. Kuan (Chairman) 12 100Alberto S. Yao 12 100Margarita L. San Juana 7 100
a Member from May 4, 2017; attended 7 out of 7 meetings

Environmental, Social, and GovernanceChina Bank Annual Financial and Sustainability Report 201768 69
Trust Investment Committee provides oversight functions and overall strategic business development and financial policy directions to the Trust and Asset Management Group. It oversees the trust, investment management, and fiduciary activities of the Bank, and ensures that they are conducted in accordance with applicable rules and regulations, and judicious practices. Moreover, it ensures that prudent operating standards and internal controls are in place and that the Board’s objectives are clearly understood and duly implemented by the concerned units and personnel.
The Trust Investment Committee convened 11 times in 2017.
Director Attendance %Herbert T. Sy (Chairman) 8 73Harley T. Sya 5 100Jose T. Sio 10 91Peter S. Deeb 6 100Ricardo R. Chuac 9 90William C. Whangd 1 100Patrick D. Chenge 11 100Carina L. Yandocf - -
a Chairman until May 2017; attended 5 out of 5 meetings b Member effective June 2017; attended 6 out of 6 meetingsc Member until October 2017; attended 9 out of 10 meetingsd Member effective November 2017; attended 1 out of 1 meetinge Member Until November 2017f Member effective December 2017
Board Evaluation System102-28
China Bank has an annual self-assessment to determine the individual Directors, Committees, the whole Board, and the President & CEO’s level of compliance with leading practices and principles on good governance and to identify areas for improvement. The Compliance Office summarizes the results of the evaluation and the Corporate Governance Committee reports it to the Board.
Based on the results of the 2017 evaluation, there are no significant deviations and in general, the Bank has fully complied with the provisions and requirements of the CG Manual.
Board RemunerationChina Bank Directors are entitled to a per diem of P500.00 for attendance at each Board/Board Committee meeting and to 4% of the Bank’s net earnings. Executive Directors
receive performance-related compensation based on their performance, banking experience, position, and rank in the Bank, while non-executive Directors do not receive any performance-related compensation. The remuneration policy for employees (staff to senior officers) are in the Governance Policies section on page 75.
Other Committees
Management Committee (ManCom) formulates the Bank’s business plans and budget as directed by the Board and reports to the Board on the implementation of corporate strategies designed to fulfill the Bank’s corporate mission and business goals. At the operating level, it covers top management matters such as, but not limited to, environmental assessment, objectives setting, performance and budget review, asset/liability management, organizational and human resource development, product development, and major operating policies.
Asset & Liability Committee (ALCO) oversees the implementation of the asset-liability management policies that govern the structure of the financial resources of the Bank.
Credit Committee (CreCom) reviews and approves all credit applications within its credit approval authority. It also reviews all credit applications exceeding its credit approval authority, and if found acceptable, endorses such to the ExCom or the Board of Directors.
Technology Steering Committee (TSC) oversees and manages the IT resources of the Bank. Except for strategic initiatives and IT expenditures, all matters pertaining to IT resource management and performance measurement are fully delegated to the TSC as provided for in its Charter.
Operations Committee (OpsCom) reviews and recommends improvement on current operations, review, design, and implementation of new projects.
Board of Trustees of CBC Employees’ Retirement Plan is responsible for the investment and disbursement of CBC Employees’ Retirement Plan assets in accordance with SEC regulations and the best interests of the plan holders.

BOARD OF TRUSTEESOF CBC RETIREMENT
CORPORATE SECRETARY AUDITTRUST
INVESTMENT
TRUST & ASSET MANAGEMENT
GROUP
RELATED PARTY TRANSACTIONS NOMINATIONS
INFORMATION SECURITY OFFICE
PROJECT MGT. OFFICE
SECURITY OFFICE
LENDINGBUSINESS SEGMENT
BUSINESSOPERATIONS
SUPPORT SEGMENT
CORPORATESUPPORT SEGMENT
RETAIL BANKING BUSINESS SEGMENT
FINANCE SEGMENT
CHIEF OPERATING OFFICER
OPERATIONS COMMITTEE
FINANCIAL MARKETSSEGMENT
CB Capital TreasuryRemittance & Credit Card
Business
ConsumerBanking
WealthManagement
Centralized Operations
CreditManagement
Legal & Collections
Human Resources
Digital Banking Business
Investor & Corporate Relations
BOARD OF DIRECTORS
BOARD COMMITTEES
EXECUTIVE COMMITTEE
OFFICE OF THE VICE CHAIRMAN
PRESIDENT
CREDIT COMMITTEE
MANAGEMENT COMMITTEE
ASSET & LIABILITYCOMMITTEE
TECHNOLOGYSTEERING
COMMITTEE
RISK OVERSIGHT
InstitutionalBanking
Lilian Yu Ryan Martin L. Tapia
Benedict L. Chan Angela D. Cruz Delia Marquez Melissa F. Corpus Belenette C. Tan Alexander C. Escucha
Maria RosannaCatherine L. Testa
COMPENSATION OR REMUNERATION COMPLIANCE CORPORATE
GOVERNANCE
Environmental, Social, and GovernanceChina Bank Annual Financial and Sustainability Report 201768 69
ORGANIZATIONAL CHART102-18
Corazon I. Morando
William C. Whang
Gilbert U. Dee AUDIT DIVISION
Marilyn G. Yuchenkang
RISK MANAGEMENT
GROUPAnanias S. Cornelio III
COMPLIANCE DIVISION
Aileen Paulette S. de JesusMary Ann T. Lim
Hanz Irvin S. Yoro Melecio C. Labalan, Jr.
Romeo D. Uyan, Jr.
Rosemarie C. Gan Patrick D. Cheng
Renato K. de Borja, Jr.
Lilibeth R. Cariño

Environmental, Social, and GovernanceChina Bank Annual Financial and Sustainability Report 201770 71
Citymall 34%
100%
MANULIFE-CHINA BANK LIFE ASSURANCE CORP. (MCBLIFE)
40%
SM Retail Inc.77.3%RETAIL
Leisure & Tourism
Commercial
Hotels & Conventions
Residential
Malls
Banco de Oro44.7%
CHINA BANKING CORPORATION (CHIB)
19.9%
SM Prime Holdings, Inc. 50%PROPERTY
SM Stores
SM Supermarket
SM Hypermarket
SaveMore
BANKING
SMINVESTMENT
CORPORATION(SMIC)
CHINA BANK SECURITIES CORP.
CBC ASSETS ONE (SPC), INC.
Financial Allied Subsidiary Financial Allied AssociateNon-Financial Allied Subsidiary
CONGLOMERATE MAP
CHINA BANK SAVINGS, INC. (CBSI)
98.3%
CHINA BANK CAPITAL CORPORATION (CBCC)
100%
CBC PROPERTIES AND COMPUTER CENTER, INC. (CBC PCCI)
100%
CHINA BANK INSURANCE BROKERS, INC. (CIBI)
100%

Environmental, Social, and GovernanceChina Bank Annual Financial and Sustainability Report 201770 71
INTERNAL CONTROLS102-11
The Board is responsible for the establishment and review of China Bank’s system of internal controls, while the day-to-day responsibility for internal control rests with Management. All of our employees are involved to a certain degree in our internal control process.
Our internal control system is comprised of a well-defined organizational structure with clear authorities, responsibilities, and operating procedures; a robust compliance function executed by the Compliance Office and overseen by the Compliance and Corporate Governance committees; an enterprise risk management function performed by the Risk Management Group (RMG) and supervised by the Risk Oversight Committee; and an internal audit function, independently exercised by the Audit Division and watched over by the Audit Committee.
Based on the Audit Committee’s continuing review and monitoring of the Bank’s internal control system, in 2017, material controls, risk management systems and framework remain adequate and effective to the Bank’s size and complexity of transactions. COMPLIANCE SYSTEMOur Compliance Office plays a crucial role in fostering a culture of group-wide compliance in all facets of the Bank, assists the Board in the discharge of its governance function to protect China Bank’s reputation and our stakeholders’ interests, and ensures the Bank’s safety and soundness. In place is a compliance risk management system that is designed specifically to identify and mitigate risks that may erode the franchise value of the Bank.
Our Compliance Office is headed by the Chief Compliance Officer (CCO) who reports functionally to the Compliance and the Corporate Governance committees and administratively to the Bank’s President. The Compliance function is supported by a duly approved Compliance Charter that defines the duties and responsibilities, mandate, independence, and manner on which compliance is implemented. At the helm of this function is the Regulatory
Compliance Unit. The Corporate Governance Unit assists the CCO in its governance mandates, while the IT Compliance Unit assists in the IT system support. All units in the Bank have Compliance Coordinators to ensure that all risks associated to the operations and business of the individual units are identified, monitored, and mitigated.
To enhance regulatory and compliance awareness and continuously strengthen our compliance culture, the Compliance Office cascades all recent laws, rules, and regulations to all concerned and regularly conducts trainings on corporate governance, related party transaction, bank fraud, anti-money laundering, and consumer protection, among others. It also acts as liaison for the Board and Management on regulatory compliance matters with the regulatory agencies; provides advisory services, including reviewing proposed China Bank products and services; updates our Compliance Manual annually to align with recent regulatory requirements.
RISK MANAGEMENTWe recognize that the business of banking necessarily entails risk, and that proper risk mitigation, not outright risk avoidance, is the key to long-term success. Our risk management principle centers on determining how much risk we are willing to bear for a given return, deciding if the risks represent viable opportunities, and finding intelligent approaches to managing risks. Our corporate governance structure keeps pace with the changing risks that China Bank faces and will be facing in the coming years with a dynamic risk management program that calls for the continuing reassessment of risks and controls and the timely reporting of these risks to the Board.
The Risk Management Group (RMG) executes the risk management function which is generally responsible for identifying, assessing, monitoring and mitigating the key risks inherent to the operations of China Bank as a financial institution. RMG is headed by the Chief Risk Officer and reports to the Board through the Risk Oversight Committee, a separate board-level independent committee with explicit authority and responsibility for determining China Bank’s risk tolerance level and overseeing the implementation of risk management policies.

Environmental, Social, and GovernanceChina Bank Annual Financial and Sustainability Report 201772 73
Market and Liquidity RiskThe objective of our market risk policies is to obtain the best balance of risk and return while meeting our stakeholders’ requirements. Meanwhile, our liquidity risk policies center on maintaining adequate liquidity at all times to be in a position to meet all obligations as they fall due.
To measure market risk exposures, we use Historical Simulation Value-at-Risk (VaR) approach for all treasury traded instruments, including fixed income bonds, foreign exchange swaps and forwards, interest rate swaps, and equity securities. Market risk exposures are measured and monitored through reports from the Market Risk Management System implemented in 2016 to enhance risk measurement and automate daily reporting.
Liquidity and interest rate risk exposures are measured and monitored through the Maximum Cumulative Outflow (MCO) and Earnings-at-Risk (EaR) reports from the Asset and Liability Management (ALM) system. The ALM system was implemented in 2013 and upgraded in 2016 to a new version with modules for calculating liquidity ratios.
Market risk, interest rate risk, and liquidity risk exposures are adequately managed through limits and triggers that are in accordance with the risk appetite of the Board.
Since 2014, our Internal Audit has been independently validating the internal risk measurement models – VaR, EaR and MCO – annually. The latest validation results concluded that these internal risk measurement models are appropriate for the measurement of its market, interest rate, and liquidity risks, respectively.
To further enhance the analysis of the Bank’s accrual portfolio, RMG will continue to explore other metrics such as the Economic Value of Equity.
Credit RiskOur policies for managing credit risk are determined at the business level with specific procedures for different risk environments and business goals. Risk limits and thresholds have been established to monitor and manage credit risk from individual and counterparties and/or group of counterparties, and industry divisions. Periodic assessments are also conducted to review the creditworthiness of our counterparties.
We have an existing Internal Credit Risk Rating System (ICRRS) to measure in a consistent manner the credit risk for corporate borrowers with total assets, total facilities, or total exposures amounting to P15 million and above. For retail and small and medium entities and individual loan accounts, we have a credit scoring system, the Borrower Credit Score (BCS). There is also an existing application scorecard for consumer loans (auto loans, housing loans, credit card).
In addition, the Board approved a Sovereign Risk Rating Model in 2016 to assess the strength of the country rated with reference to its economic fundamentals, fiscal policy, institutional strength, and vulnerability to extreme events.
In 2014, RMG engaged Moody’s Analytics for the quantitative and qualitative validation of the internal CRRS, which was followed by the model recalibration in 2015. In 2016, with the assistance of Teradata as our technology provider, RMG completed the statistical validation of the BCS using the same methodology applied to the validation of the corporate risk rating model. A validation of the recalibrated model recommended by Teradata and the RMG-enhanced model was performed in 2017.
Operational, Business Continuity Management (BCM) and Information Technology (IT) RiskWe have a framework of policies, procedures, and the tools to ensure that China Bank’s operational and IT risks are managed in a timely and efficient manner. RMG continues to effectively assess, monitor, control, and communicate such risks as well as take initiatives to further improve the Bank’s disaster preparedness.
RMG spearheads the bank-wide operational risk identification and self-assessment process to determine priority risks areas, ascertain that proper checks and

Environmental, Social, and GovernanceChina Bank Annual Financial and Sustainability Report 201772 73
balances are in place, and introduce additional measures to strengthen overall operational controls. In addition, RMG maintains a Centralized Loss Database (CLD) where all the reported incidents of losses are recorded. Information captured are processed and analysed to pinpoint general control weaknesses and operational vulnerabilities; and collects data to establish the appropriate Key Risk Indicators with the corresponding thresholds which are monitored on a periodic basis.
Our risk-based and scenario-driven BCM Program is underpinned by our commitment to always be of service to our customers. The program includes appropriate resiliency strategies, recovery procedures, facilities, contingency measures, communication, and crisis management plans across the organization to ensure we are prepared for any disaster and capable of quickly resuming operations in the event of a major disruption. RMG regularly conducts a Business Impact Analysis (BIA) to determine the critical business processes and system dependencies. The results of the BIA are used to further enhance our recovery strategy and appropriately align with defined Recovery Point and Recovery Time Objectives. In 2017, several disaster preparedness tests and simulation exercises were carried out. RMG, IT Audit, and Information Security Office assessed the results, covering both infrastructure and procedural matters and using existing regulations and industry best practices to benchmark the Bank’s ability to respond to different scenarios.
In managing the Bank’s IT Risks, we are guided by a robust IT Risk Management Framework anchored on our business strategy, capabilities, and risk appetite. RMG identifies IT-related vulnerabilities and determines the effectiveness of our IT controls through the IT risk assessment process. All our IT Risk Management processes are aligned with the standards and operating principles provided in BSP Circular No. 808 (Guidelines on IT Risk Management) and BSP Circular No. 982 (Enhanced Guidelines on Information Security Management). Trust RiskWe manage our trust risk based on the regulations specified in BSP Circular 766 or the Guidelines in Strengthening Corporate Governance and Risk Management Practices on Trust, Other Fiduciary Business, and Investment Management Activities. RMG continues to strengthen China Bank’s risk management practices on Trust by enhancing the
policies, processes, and procedures for market risk, liquidity risk, credit risk, operational risk and compliance risks specific to our Trust business. Legal, strategic, and reputational risks were also incorporated in the Trust Risk Management Guidelines. In 2017, our Trust and Asset Management Group started testing a new trust banking enterprise solution which would cover front, middle and back office functionalities, including risk and compliance.
INTERNAL AUDITInternal audit is vital to China Bank’s success and sustainability. Our Audit Division is responsible for the internal audit function, assisting the Board of Directors, through the Audit Committee, in the discharge of the Board’s governance and control responsibilities, and providing independent and objective assessment of China Bank’s operations, including risk management, control and governance processes to achieve the Bank’s goals and objectives. The Audit Division advocates the Institute of Internal Auditors’ new mission to enhance and protect organizational value by providing risk-based and objective assurance, advice, and insight.
The Audit Division, headed by the Chief Audit Executive, has dual reporting lines to ensure independence: functionally to the Audit Committee and administratively to the President. It has a Board-approved Internal Audit Charter with the authority and access that cut across all functions, units, processes, records, and personnel; a risk-based plan/approach that focuses on significant risks that are linked to Bank’s objectives and strategies; and experienced auditors capable of performing their tasks competently and efficiently.
In 2017, the Audit Division continued to improve audit efficiency and effectiveness, enhancing existing practices and implementing new initiatives in line with its vision to be an innovator of best practices which promotes excellence, continuous growth, and improvement across the organization and the banking industry. The Data Analytics Unit was created under the IT Audit Department to optimize the use of Audit Command Language Data Analytics, an audit tool that assists auditors in the collection and processing of data in a computerized environment. Some of the Unit’s main activities include developing scripts for regular or repetitive audit procedures. To further enhance the skills and competencies of our auditors, they attended a total of 26 internal trainings and 41 external trainings. In addition, three of our IT auditors obtained international certifications,

Environmental, Social, and GovernanceChina Bank Annual Financial and Sustainability Report 201774 75
namely: Certified Information Systems Auditor (CISA), Certified in Risk and Information Systems Control (CRISC) and Certified Payment-Card Industry Security Implementer (CPISI).
EXTERNAL AUDITOur external auditor fulfills a critical function in ensuring that our financial statements are accurate and presented in accordance with the Philippine Financial Reporting Standards. SyCip Gorres Velayo & Co./ Ernst & Young (SGV) has been our external auditor for over 20 years, with the signing partners rotated every five years in compliance with the SEC laws.
Fiscal Year Audit Fees and Audit-Related Fees
Non-Audit Fees
2017 P8,192,800 P254,2402016 P6,994,960 P448,970
The above audit and audit-related fees cover services rendered for the performance of the audit or review of the Bank’s financial statements, including the combined financial statements of the Trust and Asset Management Group, and the issuance of comfort letters relative to our 2017 Stock Rights Offering and the Second Tranche offering of Long Term Negotiable Certificates of Deposits. The audit fees were taken up and approved by the Audit Committee at its regular meetings on February 21, 2018 and February 15, 2017, respectively.
Tax fees related to the audit of tax accounting and compliance are already incorporated in the year-end audit fees under Audit and Audit-Related Fees category as this is part of the audit process conducted by the external auditors.
The Board/Audit Committee likewise discussed, approved, and authorized to engage SGV in non-audit work for the independent validation of votes in the annual stockholders’ meeting and for the compliance certificate issued to international bank lenders. Payment for these services, and seminar fees are included under Non-Audit Fees.
Throughout the years that SGV has been auditing the Bank, it has not found any significant exceptions, such as cases of fraud or dishonesty, and any other matters which could potentially result in material losses to the Bank and our stakeholders. In 2017, SGV confirmed that
they did not have any disagreement with Management that could be significant to the Bank’s financial statements or their auditor’s report. Further, there are no matters that in their professional judgment may reasonably be thought to bear on their independence or that they gave significant consideration to in reaching the conclusion that independence has not been impaired.
SGV representatives are present at the Bank’s Annual Stockholders Meeting to respond to matters concerning their audit of the Bank.
SGV is again recommended for appointment at the 2018 Annual Stockholders Meeting.
GOVERNANCE POLICIES
The Board of Directors, Management, employees and shareholders believe that good corporate governance is a necessary component of what constitutes sound strategic business management and will therefore undertake greater effort necessary to create more and continuing awareness within the organization.
Code of Ethics102-17
In the conduct of our business and dealings with stakeholders, we are guided by the relevant rules and regulations and our own CG Manual and Code of Business Conduct and Ethics. The Manual contains our corporate governance policies, structure, principles, as well as the general and specific duties and responsibilities of the Board and the individual Directors. It is regularly updated to ensure alignment with the latest regulatory issuances. Meanwhile, the Code provides clear guidelines on acceptable and unacceptable behavior and business practices.
All China Bank Directors, officers, and staff are required to abide by and fully comply with the Manual and the Code. Our CCO monitors compliance with the Manual and responds to inquiries from employees regarding good corporate governance policies and practices. Our Human Resources Group ensures that every China Bank employee is aware of and upholds the Code. All new employees are given a copy of the Code of Ethics booklet and undergo the

Environmental, Social, and GovernanceChina Bank Annual Financial and Sustainability Report 201774 75
New Employees’ Orientation Course (NEOC) wherein the Code is comprehensively discussed.
For easy reference, both the Manual and the Code are posted on our Intranet facility and our website
Dividends China Bank declares cash dividends at a payout ratio of at least thirty percent (30%) of the net income of the prior year, subject to the conditions and limitations set forth in more detail in the policy statement contained in the Corporate Governance Manual.
The Dividend Policy is an integral component of our Capital Management Policy and Process. Its fundamental and overriding philosophy is sustainability. Dividend pay-outs are reviewed annually and are calibrated based on the prior year’s earnings while taking into consideration dividend yields, future earnings streams and future business opportunities. In declaring dividend payouts, we use a combination of cash or stock dividends.
Remuneration We aim to attract, motivate, and retain the best people to best serve our customers. Our general remuneration policy is to provide fair and competitive salary and benefits to China Bank employees commensurate with their experience, responsibilities, job grade/corporate rank, and position title. An employee’s level in the organization is determined by the job grade (for rank and file employees) or corporate rank (for officers) identified with their position, which is the basis of compensation and benefits relative to the banking industry. The position title of an employee defines the general description of his/her function (e.g., Customer Relations Assistant, Branch Head, Chief Operating Officer), while the job grade or corporate rank determines the hierarchy in terms of pay and benefits (e.g. Rank and File IV, Assistant Vice President, Senior Vice President).
For senior officers, our remuneration policy is to likewise provide them with fair and competitive salary and benefits commensurate with their experience, responsibilities, rank and position, and reasonably proportional to the Bank’s economic situation. In determining senior officer compensation, we also benchmark against the executive
compensation for the same positions in comparable organizations (similar size, organizational structure, business risk, and management complexity).
Selection and Appointment of Senior Officers China Bank is committed to developing a competent workforce led by a high performing senior management team. In accordance with the Corporate Governance Manual, the Board is primarily responsible for approving the selection of Top Management as led by the President. On top of the “fit and proper” rule, senior officer appointments (VPs-up) are based on who is the most qualified and best suited for the position, in line the Bank’s strategic objective of having the highest-caliber leaders who inspire the trust and confidence of our employees, customers, investors, and other stakeholders. Our Top Management and Human Resources Group Head ensure that the policies and procedures for building our talent pipeline and filling up key positions through internal promotion (Succession Management Program) or external sourcing are upheld throughout the selection and appointment process. Senior positions monitored by BSP with the rank of FVP and up are coursed through our Corporate Governance Committee and approved by the Board.
Anti-Money LaunderingChina Bank is committed to the consistent and continuing compliance with the Anti-Money Laundering (AML) law, rules, and regulations. The Board of Directors through the Compliance Committee ensures that programs and controls are in place, implemented, monitored, and regularly updated to ensure that our Bank, employees, products, and services are not used for money laundering and terrorist financing activities.
We have our own Money Laundering and Terrorist Financing Prevention Program (MLPP) which embodies the policies and procedures in complying with the AML requirements. The MLPP is regularly updated in line with regulatory changes and best practices. Our Compliance Office is responsible for managing, updating, and implementing the MLPP, including ensuring that our employees have sufficient and up-to-date knowledge of the AML law, regulations, and policies through communication and classroom and electronic-based training.

Environmental, Social, and GovernanceChina Bank Annual Financial and Sustainability Report 201776 77
Whistleblowing102-17
Without fear of any retaliation, our employees, customers, shareholders, and third party service providers may report questionable or illegal activity, unethical behavior, fraud or any other malpractice by mail, phone or e-mail. The identity of the whistleblower is kept confidential and all reports are investigated accordingly. If determined sufficient in form and substance, the disclosure is referred either to the Audit Division or the Human Resources Group (HRG) for further investigation. If the report is found to be baseless, the Whistleblower is informed of the status within 24 hours from receipt. Meritorious disclosure, as may be determined, will be given recognition and may be entitled to an award as deemed necessary by the HRG or the Investigation Committee. The CCO is the primary driver in the implementation of our Whistleblowing Policy. Disclosures are directed to the CCO who is responsible for determining the sufficiency and validity of the report. The policy also allows reporting of any disclosure to the Chief Audit Executive, Chief Risk Officer, and the HRG Head.
Reports/disclosures may be sent to any China Bank Officer or to:
CHIEF COMPLIANCE OFFICERChina Banking CorporationP. O. Box 2182, Makati Central Post Office1226 Makati City, PhilippinesMobile number: 0947-9960573E-mail address: [email protected] disclosure form is also available atwww.chinabank.ph
Conflict of Interest 102-17 Conflict of interest between the Bank and employees should be avoided at all times. However, should a conflict arise, the interest of the Bank must prevail. Employees are not permitted to have or be involved in any financial interests that are in conflict or appear to be in conflict with their duties and responsibilities to China Bank. They are likewise barred from engaging in work outside of the Bank unless with duly-approved permission, as well as work that lies in direct competition with the Bank.
Guidelines on Dealings in China Bank Shares102-17
China Bank employs strict policies on securities transactions to support and uphold all applicable laws against insider trading. This prohibits directors, officers, and employees who are considered to have knowledge of material facts or changes in the affairs of China Bank which have not yet been publicly disclosed—including any information likely to affect the share price of the Bank’s stock—to directly or indirectly engage in financial transactions that make use of “insider information”. This also includes consultants and advisers and all other employees who are made aware of undisclosed material information.
Any transactions by the Directors and principal officers involving the Bank’s shares are required to be disclosed within three business days from the date of the transaction.
Anti Bribery & Corruption102-17
China Bank is committed to honest and ethical business practices and does not tolerate any form of bribery and corruption. We take our legal responsibilities very seriously and expect our directors and employees at all levels and grades to do the same. China Bank directors and employees are to act professionally, fairly, and with integrity in all our business dealings and relationships wherever we operate; thus, they 1) must never offer, promise, or give a financial or other advantage to any person or party, including public officials, with the intention of inducing or rewarding improper performance by them of their duties or to facilitate the transaction of the Bank, and 2) must never directly or indirectly accept or agree to receive a financial or other advantage as a reward for performing any act prejudicial to the Bank, the director/employee himself, or a third party. In 2017, a total of 5,209 employees underwent anti-corruption training.
Education and TrainingChina Bank’s compliance culture is constantly reinforced through education and training. The Compliance Office regularly briefs Compliance Coordinators in all branches and head office units to raise their awareness and understanding of the principles and concepts of good corporate governance, with which they are required to cascade to their respective colleagues. All new hires of the Bank are given mandatory orientations on Compliance, Anti-Money Laundering, Whistle-Blowing, and Corporate Governance. Lectures on compliance are also conducted during the Officers Development Program (ODP) and Supervisory Development Program (SDP).

Environmental, Social, and GovernanceChina Bank Annual Financial and Sustainability Report 201776 77
Supplier/Contractor SelectionWe practice utmost professionalism in managing the Bank’s resources. We process all matters of due diligence and compliance to ensure that any service or goods procurement will pose the greatest benefit to the Bank, while posing little to no negative impact on stakeholders. This entails a thorough evaluation on the procurement’s risk to personnel, company assets, the environment, equipment, and service to customers. Consequently, we only transact with suppliers who have been assessed to have the necessary experience, capability, and financial viability, and who conduct business using economic, environmental and professionally sound methods while remaining compliant with all applicable laws and regulations.
China Bank is committed to fair market practices, engaging in the services of suppliers and contractors that have passed through a legitimate evaluation process that ensures a fair competition among other service providers under consideration. The Bank follows standards of objectivity, impartiality and equal opportunity, and evaluates based on thorough criteria such as quality, price, service, and overall value to the business, ensuring that we prevent any favoritism or conflicts of interest. All prospective suppliers must also undergo and pass a preliminary accreditation process before any contract is awarded to them. They are also assessed on their actual performance as compared to promised delivery dates, quality of work / goods, and adherence to agreed specifications and purchase order prices.
Disclosure and TransparencyThe Bank is a staunch advocate of transparency and accountability, maintaining a high standard of disclosure to facilitate public understanding of the Bank’s financial condition and the state of its corporate governance in order for them to make a well-informed decision. All material information about China Bank is adequately and promptly disclosed in accordance with SEC and PSE’s disclosure policy like the publication of our quarterly financial statements in national broadsheets and presentation of a detailed annual report for our Stockholders’ Meetings. Furthermore, we disclose market-sensitive information like dividend declarations, joint ventures and acquisitions, sale and disposition of significant assets, as well as financial and non-financial information that may affect the decision of the investing public via press releases on broadsheets and internal publications. We also electronically file our disclosures through the Electronic Disclosure Generation Technology (Edge) of PSE, making them available on the PSE website. Our corporate website is likewise regularly updated to include the latest news and current information about the Bank.
Social Media PolicyChina Bank’s expansive brand of customer and public service spans all modern channels of communication including social media and online networking platforms. The Bank’s social media presence is guided by the mandate of its Code of Ethics, and is one of the first in the industry to have policies in place to ensure that our employees’ interaction with the online public is consistent with the Bank’s core value of professionalism. Social Media Administrators serve as overseers of any online post made in the Bank’s name. In the same way, employees are constantly instructed and reminded to extend their professional demeanor to their personal online interactions. China Bank employees are cautioned to abide by the policies on personal posts, comments and statements relating to the Bank, that they may avoid online publication of any content or statement disparaging the Bank or its clients, or otherwise jeopardize the Bank’s and its clients’ interests. They are likewise informed against posting of prohibited content such as incitement to commit crime, drug paraphernalia, pornographic media, and the like. The Bank continues to exert efforts to enhance its social media policies to better accommodate the guidelines on mitigating social media risk issued by the BSP.
Related Party Transactions102-17
We recognize that Related Party Transactions (RPT) may give rise to a conflict of interest; thus, we are careful in dealing with related parties. Transactions with such parties are thoroughly reviewed and verified as having been conducted in the ordinary course of business, at arm’s length basis, at fair market prices, and upon terms not less favorable to the Bank, in the same terms as those offered to others, by the RPT Committee before they are endorsed to the Board for approval. All material RPT are ratified by the stockholders during the Annual Stockholders’ Meeting.
Our RPT Framework serves as a guide to the China Bank group in dealing with related parties. The Bank’s RPT policy is kept relevant and aligned with recent regulatory issuances. No director is allowed to participate in the discussion or deliberation, including approval of a transaction where he is a related party, to prevent conflict of interest.
A related party transaction is considered material if it is P50 million and up. Starting 2018, our materiality threshold shall be on a per transaction basis, aligned with recent regulatory requirements.

Name of CounterpartyType of
TransactionAmount/
Contract Price
Angela T. Dee-Cruz(Officer)
LineOutstanding
63.0 M 17.0 M
Alberto, Anthoniette & Joan Ross Yao(Director and his close family members)
Trust 84.0 M
Elizabeth Sy(Close family member of a director)
Trust 50.0 M
Elizabeth T. Sy & Eric Charles Uy(Close family members of a director)
Trust70.0 M
Henry Sy, Sr.(Honorary Chairman)
Loan Outstanding
300.0 M300.0 M
Hans T. Sy (Director) Trust 22.3 B
Herbert T. Sy & Hendrik T. Sy(Director)
Trust50.0 M53.5 M61.4 M
Herbert T. Sy & Herbert T. Sy, Jr.(Director and his close family member)
Trust51.2 M50.0 M
100.2 MHerbert T. Sy & Harley T. Sy (Director) Trust 100.0 MSps. Irwin and Consuelo Ponce(Close family member of a director)
Line127.0 M
BDO Universal Bank (Affiliate)
Bonds/FX
400.0 M100.0 M14.0 B
7.3 B1.6 B4.8 B
309.9 M20.1 B
265.6 M8.3 B
600.8 M 742.5 M
11.5 B4.2 B
600.0 M4.7 B5.2 B
64.4 M13.7 B
7.7 B50.0 M
7.1 B
BDO Private Bank, Inc.(Affiliate)
Bonds / FX
1.0 B850.0 M150.5 M50.2 M
151.4 M100.9 M202.7 M 252.1 M 450.0 M
1.1 B 600.0 M 609.6 M 50.0 M
306.7 M 257.5 M 150.0 M 303.5 M
BDO Private Bank Wealth Advisory and Trust Group (Affiliate)
Bonds 514.4 M 253.3 M
BDO Securities Corporation (Affiliate) Equity Investments 1.6 B
CBC Trust Group (A Group in the Bank)
Bonds
1.9 M 1.7 B1.4 M
499.0 M330.9 M
5.8 B5.9 B
China Bank Capital Corporation(Affiliate)
Money Market Fund 700.0 MRedemption of Money Market 500.0 MBond 130.0 M
China Bank Securities Corporation(Subsidiary)
Sale of CHIB Shares 362.6 M
Name of CounterpartyType of Transaction
Amount/Contract Price
China Bank Savings Inc.(Subsidiary)
Investment in SSA (Short Term)
250.0 M$ 1.5 M
200.0 M 1.2 B
500.0 M
Bonds
100.0 M 84.0 M 50.0 M
199.0 M 100.0 M
Foreign Exchange 51.5 MJJACCIS Development Corporation(Other Related Party)
Loan Outstanding
600.0 M 257.4 M
Manulife Chinabank Life Assurance Corp. (Associate)
Bonds
528.9 M729.0 M
2.4 B2.6 B
665.0 M1.4 B
National Reinsurance Corporation (Affiliate) Bonds 50.0 M
Rizal Commercial Banking Corporation(Other Related Party)
Bonds
574.3 M 752.4 M
3.8 B3.3 B
300.4 M4.1 B
600.0 M3.1 B
875.0 M900.0 M250.0 M
3.3 B200.0 M500.0 M501.6 M
FX
4.1 B 4.1 B6.6 B2.6 B
RCBC Savings Bank(Other Related Party)
Bonds250.8 M100.0 M50.0 M
SM Investments Corporation(Stockholder)
Loan 8.0 B$ 32.5 M
SM Investments Corp./Sybase Equity Investments Corp./ Multi-Realty Development Corp.(Stockholder / Affiliates)
Loan
15.5 BSM Prime Holdings Inc./Costa Del Hamilo, Inc./SM Hotels and Conventions Corp.(Affiliates)
Loan Line3.1 B
SM Prime Holdings, Inc. (Affiliate) ROPA 161.6 MSM Development Corp. (Affiliate) Loan 1.1 BSummerhills Home Development Corp.(Affiliate)
Loan500.0 M
Sunlife Grepa Financial, Inc.(Other Related Party)
Bonds
100.0 M60.0 M
150.0 M144.0 M50.0 M
Sysmart, Inc.(Stockholder)
LoanOutstanding
5.0 B3.8 B
Super Industrial Corp.(Other related party)
Loan50.0 M
Anchor Land Holdings Inc. & Subsidiaries(Other Related Party)
Contract to Sell 348.3 M
One Network Bank(Affiliate)
Bonds 400.0 M100.0 M
National Grid Corporation of the Philippines(Other Related Party)
Loan 12.0 B79.0 M
2Go Group, Inc.(Other Related Party)
Loan 1.0 B100.0 M
Posh Properties Development Corp. and Gotamco Realty Investment Corp.(Other Related Party)
Loan1.0 B
Posh Properties Development Corp.(Other Related Party)
Loan 3.7 B1.3 B
Significant (P50M and above) Related Party Transactions as of December 2017(In Philippine Peso unless otherwise indicated)
Environmental, Social, and GovernanceChina Bank Annual Financial and Sustainability Report 201778 79

INFORMATION FOR STOCKHOLDERS
Date of FoundationChina Bank was incorporated on July 20, 1920 and opened for business on August 16, 1920. The Bank is registered with the Securities and Exchange Commission under SEC registration number 443. China Bank’s amended By-laws may be downloaded from our website, www.chinabank.ph, or requested from the Office of the Corporate Secretary:
ATTY. CORAZON I. MORANDOVice President and Corporate Secretary11/F China Bank Building8745 Paseo De Roxas corner Villar StreetMakati City 1226, PhilippinesTel. Nos.: (+632) 885-5131, 885-5132Fax No.: (+632) 885-5135Email: [email protected]
Record and Beneficial Owners Holding 5% or More of Voting Securities (as of February 28, 2018)102-5
Title of ClassName, Address of Record Owner &
Relationship with Issuer
Name of Beneficial Owner & Relationship
with Record OwnerCitizenship
No. of Shares Held
Percentage
Common
PCD Nominee Corporation *37th Floor Tower I, The Enterprise Center, 6766 Ayala Ave. corner Paseo de Roxas, Makati CityStockholder
Various stockholders/clients Non-Filipino 721,420,468 26.86%
CommonSM Investments Corporation10th Floor L.V. Locsin Bldg., 6752 Ayala Avenue, Makati City Stockholder
Sy FamilyPCD Nominee Corporation Stockholders
Filipino 461,975,661 17.20%
Common
Sysmart Corporation10th Floor L.V. Locsin Bldg., 6752 Ayala Avenue, Makati CityStockholder
Henry Sy, Sr. and FamilySycamore Pacific CorporationStockholders
Filipino 415,995,323 15.49%
Common
PCD Nominee Corporation * 37th Floor Tower I, The Enterprise Center, 6766 Ayala Ave. corner Paseo de Roxas, Makati CityStockholder
Various stockholders/clients Filipino 402,575,155 14.99%
* Based on the list provided by the Philippine Depository & Trust Corporation to the Bank’s transfer agent, Stock Transfer Service, Inc., as of February 28, 2018, The Hong Kong and Shanghai Banking Corporation Limited (396,732,386 shares or 14.77%) holds 5% or more of the Bank’s securities. The beneficial owners, such as the clients of PCD Nominee Corporation, have the power to decide how their shares are to be voted.
Authorized and Issued CapitalAuthorized Capital Issued Shares:
P33.0 Billion divided into 3.3 Billion shares with a par value of P10.00 per share
2,685,899,812 common shares
Environmental, Social, and GovernanceChina Bank Annual Financial and Sustainability Report 201778 79

Trading in Company Shares by and Total Shareholdings of Bank Directors and Executive Officers(as of December 31, 2017)
A. Directors
Name PositionShareholdings
as of January 1, 2017
Number of Shares Disposed
Number of Shares Acquired
Shareholdings as of
December 31, 2017Percent
Hans T. Sy Chairman of the Board 2,584,069 - 957,350 3,541,419 0.132%Gilbert U. Dee Vice Chairman 10,652,714 1,083,254 3,263,446 12,832,906 0.478%William C. Whang Director & President 13,063 - 4,455 17,518 0.001%Peter S. Dee Director 278,986 - 22,319 301,305 0.011%Joaquin T. Dee Director 38,542,777 - 13,144,135 51,686,912 1.924%Herbert T. Sy Director 380,747 - 129,845 510,592 0.019%Harley T. Sy Director 194,785 - 66,426 261,211 0.010%Jose T. Sio Director 2,623 - 894 3,517 0.000%Alberto S. Yao Independent Director 6,619 - 542,257 548,876 0.020%Roberto F. Kuan Independent Director 25,161 - 307,932 333,093 0.012%Margarita L. San Juan Independent Director 71,019 - 24,219 95,238 0.004%
TOTAL 70,132,587 2.611%
B. Executive Officers (In addition to Messrs. Gilbert U. Dee and William C. Whang)
Name PositionShareholdings
as of January 1, 2017
Number of Shares Disposed
Number of Shares Acquired
Shareholdings as of December 31, 2017
Percent
Rosemarie C. Gan Executive Vice President
96,965 - 33,067 130,032 0.005%
Patrick D. Cheng Senior Vice President & CFO
457,491 - 160,265 617,756 0.023%
Alexander C. Escucha Senior Vice President - - 83,886 83,886 0.003%Benedict L. Chan First Vice President II &
Treasurer- - 15,678 15,678 0.001%
Renato K. De Borja, Jr. First Vice President II 500 - 169 669 0.000%Gerard T. Dee First Vice President II 5,864 - 272,000 277,864 0.010%Delia Marquez First Vice President II 17,236 - 6,324 23,560 0.001%Lilibeth R. Cariño First Vice President 3,049 - 1,118 4,167 0.000%Angela D. Cruz First Vice President 1,222,851 - 417,025 1,639,876 0.061%Elizabeth C. Say First Vice President 2,561 - 872 3,433 0.000%Shirley G.K.T. Tan First Vice President 11,910 - 953 12,863 0.000%Maria Rosanna Catherina L. Testa
First Vice President - - 6,340 6,340 0.000%
Stephen Y. Tan First Vice President - - 2,746 2,746 0.000% TOTAL 2,818,870 0.105%
GRAND TOTAL 72,951,457 2.716%
Summary of Filipino and Non-Filipino Holdings (as of February 28, 2018)
NationalityNumber of
StockholdersNumber of Shares Percentage
Filipino 1,852 1,957,095,364 72.866%Non-Filipino (PCD) 1 721,420,468 26.860%Chinese 49 3,350,169 0.125%American 20 2,678,157 0.100%Australian 1 1,956 0.000%British 2 97,631 0.004%Canadian 3 463,403 0.017%Dutch 1 62,198 0.002%Spanish 1 107 0.000%Taiwanese 3 730,359 0.027%TOTAL 1,933 2,685,899,812 100%
Environmental, Social, and GovernanceChina Bank Annual Financial and Sustainability Report 201780 81

MARKET INFORMATION
Principal market where the equity is traded: Philippine Stock Exchange, Inc. (PSE)
Market ValueActual Prices
2017 HIGH LOW CLOSEJan - Mar 41.55 38.00 40.70April - Jun 41.60 34.50 36.70Jul – Sept 36.90 35.00 35.35Oct – Dec 36.20 32.80 33.30
Adjusted Prices (due to stock rights and 8% stock dividend)2017 HIGH LOW CLOSE
Jan - Mar 36.65 33.51 35.90April - Jun 36.69 31.94 33.98Jul – Sept 34.17 32.41 32.73Oct – Dec 34.50 32.78 33.30
Market value as of December 29, 2017 (last trading day): P33.30
Price Information as of February 28, 2018 (latest practicable trading date): P35.20
Dividend History2017 2016 2015 2014 2013
Stock Dividend 8% 8% 8% 8% 10%Cash Dividend 8% 10% 10% 10% 12%
Investor RelationsInquiries from investors, analysts, and the financial community are handled by the Investor & Corporate Relations Group:
ALEXANDER C. ESCUCHASenior Vice President and HeadInvestor and Corporate Relations Group28/F BDO Equitable Tower8751 Paseo De RoxasMakati City 1226, PhilippinesTel. No.: (+632) 885-5609Email: [email protected]
2017 HIGH LOW CLOSEJan - Mar 39.50 33.50 39.15April - Jun 40.25 37.00 38.00Jul – Sept 39.00 37.60 38.00Oct – Dec 38.30 37.60 38.00
2017 HIGH LOW CLOSEJan - Mar 36.57 31.02 36.25April - Jun 38.50 35.23 38.00Jul – Sept 39.00 37.60 38.00Oct – Dec 38.30 37.60 38.00
Environmental, Social, and GovernanceChina Bank Annual Financial and Sustainability Report 201780 81

HENRY SY, SR.Honorary Chairman and Advisor to the Board93 years old, FilipinoFounder: SM Group Chairman Emeritus: SM Investments Corp.*, BDO Unibank, Inc.*, and SM Prime Holdings, Inc.* Education: Associate in Commercial Science, Far Eastern University; Honorary Doctorate in Business Management, De La Salle University
HANS T. SYChairman (Non-executive director)62 years old, Filipino31 years on the China Bank BoardNominated by: Sysmart Corporation Current China Bank Board Committee memberships: Executive and Compliance (Chairman), Risk Oversight, and Compensation or RemunerationDirector and Chairman of the Executive Committee: SM Prime Holdings, Inc.* Adviser to the Board: SM Investments Corp.*Education: Bachelor of Science in Mechanical Engineering, De La Salle University
China Bank Annual Financial and Sustainability Report 201782
SETTING THE TONE AT THE TOP:OUR BOARD OF DIRECTORS
* Publicly-listed company

GILBERT U. DEEVice Chairman (Executive director)82 years old, Filipino48 years on the China Bank BoardNominated by: Linda Susan T. Mendoza Current China Bank Board Committee memberships: Executive Chairman: CBC Properties and Computer Center, Inc. (CBC-PCCI) and Union Motor Corp. Director: Super Industrial Corp.Education: Bachelor of Science in Banking, De La Salle University; Masters in Business Administration, University of Southern California
WILLIAM C. WHANGDirector and President (Executive director)59 years old, FilipinoLess than 1 year on the China Bank BoardNominated by: George C. Yap Current China Bank Board Committee memberships: Executive and Trust InvestmentChairman: China Bank Securities Corp. (CBSC)Director: China Bank Savings, Inc. (CBSI), China Bank Insurance Brokers, Inc. (CBC-IBI), China Bank Capital Corp. (CBCC), CBC-PCCI, Manulife China Bank Life Assurance Corp. (MCBLife), and BancNet, Inc. Education: Bachelor of Science in Commerce, Major in Business Management, De La Salle University
PETER S. DEEDirector (Non-executive)76 years old, Filipino40 years on the China Bank BoardNominated by: Nancy D. Yang Current China Bank Board Committee memberships: Executive and Trust InvestmentDirector: CBC-PCCI, CBC-IBI, Hydee Management & Resources Corp., Commonwealth Foods, Inc., and GDSK Development Corp. Independent director: City & Land Developers, Inc.* and Cityland Development Corp.*Former President & CEO: China BankEducation: Bachelor of Science in Commerce, De La Salle University/ University of the East; Special Banking Course, American Institute of Banking
Board of Directors 83
* Publicly-listed company

China Bank Annual Financial and Sustainability Report 201784
SETTING THE TONE AT THE TOP:OUR BOARD OF DIRECTORS
* Publicly-listed company
JOSE T. SIODirector (Non-executive)78 years old, Filipino10 years on the China Bank BoardNominated by: SM Investments Corp.Current China Bank Board Committee membership: Trust InvestmentChairman: SM Investments Corp.* and Belle Corp.* Director: Atlas Consolidated Mining and Development Corp.*, Concrete Aggregates Corp.*, OCLP Holdings, Inc., Manila North Tollways Corp., and CityMall Commercial Centers, Inc.Adviser: Premium Leisure Corp.* and BDO Unibank, Inc.* Adviser of Audit Committee / Risk Oversight Committee: SM Prime Holdings, Inc.*President: SM Foundation, Inc. and GlobalFund Holdings, Inc. Education: Certified Public Accountant; Bachelor of Science in Commerce, Major in Accounting, University of San Agustin; MBA, New York University, U.S.A.
HERBERT T. SYDirector (Non-executive)61 years old, Filipino24 years on the China Bank BoardNominated by: Sysmart CorporationCurrent China Bank Board Committee memberships: Trust Investment (Chairman) Chairman: Supervalue, Inc., Super Shopping Market, Inc., Sondrik, Inc., and Sanford Marketing Corp.Director: SM Prime Holdings, Inc.* and National University Education: Bachelor of Science in Management, De La Salle University
JOAQUIN T. DEEDirector (Non-executive)82 years old, Filipino33 years on the China Bank BoardNominated by: Christopher T. DeeCurrent China Bank Board Committee memberships: Executive, Audit, and ComplianceChairman: JJACCIS Development Corp.Director/President: Enterprise Realty Corp.Director/Treasurer: Suntree Holdings Corp. Education: Bachelor of Science in Commerce, Letran College
HARLEY T. SYDirector (Non-executive)58 years old, Filipino16 years on the China Bank BoardNominated by: SM Investments Corp.Current China Bank Board Committee membership: Compensation or Remuneration Director: SM Investments Corp.*, SM Retail Inc., and SM Synergy Properties Holdings Corp. Education: Bachelor of Science in Commerce, Major in Finance, De La Salle University

Board of Directors
* Publicly-listed company
ALBERTO S. YAOIndependent Director71 years old, Filipino13 years on the China Bank Board Committee memberships: Audit (Chairman), Corporate Governance, Compliance, Risk Oversight, Nominations, Compensation or Remuneration, and Related Party Transactions Independent Director: CBSI, CBCC, and CBSC President & CEO: Richwell Trading Corp., Richwell Phil., Inc., Europlay Distributor Co., Inc., and Internationale Globale Marques, Inc. President: Richphil House Inc. and Megarich Property Ventures Corp. Member: Philippine Constitution AssociationEducation: Bachelor of Science
in Business Administration, Minor in Accounting, Mapua Institute of Technology
ROBERTO F. KUANLead Independent Director69 years old, Filipino12 years on the China Bank BoardCurrent China Bank Board
Committee memberships: Corporate Governance,
Nominations, Compensation or Remuneration, Related
Party Transactions (Chairman), and Audit
Independent Director: CBSI, CBCC, CBSC, and Far Eastern University, Inc.*Member of the Board of Trustees:
St. Luke‘s Medical Center, SLMC Global City, Inc.,St Luke‘s
College of Medicine-William H. Quasha Memorial, Brent International School, Inc., Seaoil Phils., Inc., Roosevelt College Inc., and Towers Watson Insurance Brokers Philippine Inc.
Education: Bachelor of Science in Business Administration, University of the Philippines; Masters in Business Management, Asian Institute of Management (AIM); Honorary Doctorate in Humanities, Lyceum Northwestern University
MARGARITA L.SAN JUANIndependent Director64 years old, FilipinoLess than 1 year on the China Bank BoardCurrent China Bank Board Committee memberships: Risk Oversight (Chairman), Corporate Governance, Nominations, Compensation or Remuneration, and Related Party TransactionsIndependent Director: CBSI and CBCC Education: Bachelor of Science in Business Administration, Major in Financial Management, University of the Philippines; Advance Bank Management, AIM
RICARDO R. CHUAAdvisor to the Board66 years old, FilipinoFormer President & CEO: China BankDirector: CBSI, CBC-IBI, CBC-PCCI, CBCC, CAVACON Corp., and Sun & Earth Corp. Education: Certified Public Accountant; Bachelor of Science in Business Administration, Major in Accounting, University of the East (cum laude); MBM, AIM
85

1
2
4 6
5
3
7
MAKING IT HAPPEN:OUR MANAGEMENT COMMITTEE
8
China Bank Annual Financial and Sustainability Report 201786
1 Gilbert U. Dee, Vice Chairman of the Board 2 William C. Whang, President 3 Romeo D. Uyan, Jr., Executive Vice President and Chief Operating Officer 4 Patrick D. Cheng, Senior Vice President and Chief Finance Officer 5 Rosemarie C. Gan, Executive Vice President and Segment Head of Retail Banking Business 6 Alberto Emilio V. Ramos*, Executive Vice President and President of China Bank Savings, Inc. 7 Alexander C. Escucha, Senior Vice President and Head of the Investor and Corporate Relations Group 8 Ryan Martin L. Tapia, President, China Bank Capital Corporation
*Ex-officio member

9 11
14
13
12
10
15 16
Management Team 87
9 Benedict L. Chan, First Vice President, Treasurer, and Head of Treasury Group 10 Lilian Yu, First Vice President and Head of Institutional Banking Group11 Renato K. De Borja, Jr., First Vice President and Head of Remittance and Credit Card Business Group 12 Jose L. Osmeña, Jr., First Vice Presidentand Deputy Group Head of Retail Banking Business 13 Delia Marquez, First Vice President and Head of Centralized Operations Group and Business Process Management Division 14 Lilibeth R. Cariño, First Vice President and Head of Consumer Banking Group 15 Ananias S. Cornelio III*, First Vice Presidentand Chief Risk Officer 16 Maria Rosanna Catherina L. Testa, First Vice President and Head of Human Resources Group
*Ex-officio member

OUR SENIOR OFFICERS
CORPORATE SECRETARY 1 Corazon I. Morando
FIRST VICE PRESIDENTS2 Cristina P. Arceo, Division Head, Treasury Group-Fixed Income 3 Filemon Cecilio A. Cabungcal, Cluster Head, Treasury Group-Sales Cluster 4 Virgilio O. Chua, seconded to China Bank Capital as Managing Director, Treasurer, and Investment Banking Head 5 Melissa F. Corpus, Group Head, Credit Management Group 6 Angela D. Cruz, Group Head, Wealth Management Group 7 Gerard Majella T. Dee, Division Head, IBG-Commercial Banking 2 8 Maria Luz B. Favis, Division Head, Asset Quality & Recovery Management 9 Victor O. Martinez, Division Head, IBG-Corporate Banking 2 10 Elizabeth C. Say, Division Head, RBB-Branches Administration 11 Shirley G.K. T. Tan, Region Head, RBB-Metro Manila West Region 12 Stephen Y. Tan, Region Head, RBB-Visayas Region 13 Marisol M. Teodoro, seconded to China Bank Securities as President and CEO 14 Geoffrey D. Uy, Division Head, Risk Management Group-Market and Liquidity Risk
1
15 23
24
19
20
21
22
5
11
8
9
10
6
12
7
13
14
2
16
3
17
25
4
18
26
27
China Bank Annual Financial and Sustainability Report 201788
VICE PRESIDENTS15 Luis M. Afable,Jr., Division Head, IBG-Factoring 16 Layne Y. Arpon, Division Head, IBG-Corporate Banking 1 17 Betty L. Biunas, Team Head, IBG-Commercial Banking 2,Team 15 18 Richard S. Borja, Division Head, Centralized Operations Group-Binondo Business Center 19 Victor Geronimo S. Calo, Division Head, RBB-Branch Operations Support 20 Jeannette H. Chan, Center Head, RBB-Metro Manila West Region, Binondo Business Center 21 Marie Carolina L. Chua, Division Head, Alternative Channels 22 Domingo P. Dayro, Jr., Division Head, Cash Management 23 James Christian T. Dee, seconded to China Bank Savings as Treasury Head 24 Aileen Paulette S. De Jesus, Chief Compliance Officer and Head of Compliance Office 25 Norman C. Del Carmen, Division Head, TAMG-Investment and Trading, 26 Gemma B. Deladia, Division Head, TAMG-Trust Operations and Finance 27 Therese G. Escolin, Cluster Head, Wealth Management Group-Business Development, Makati Cluster

Management Team 89
30
31
32
33
34
38
37
36
35
39
43
44
45
46
50
49
48
47
51
52
53
54
40
41
42
28
29
28 Madelyn V. Fontanilla, Division Head, RBB-Branch Operations 29 Cesare’ Edwin M. Garcia, Deputy Group Head, Wealth Management Group 30 Cristina F. Gotuaco, Division Head, IBG-Commercial Banking 1 31 Jerry Ron T. Hao, Division Head, Treasury Group-Foreign Exchange & Derivatives 32 Ma. Cristina C. Hernandez, Department Head,Treasury Group-Financial Institution 33 Marlon B. Hernandez, Division Head, Remittance Business 34 Shirley C. Lee, Account Officer, RBB-Metro Manila West Region, Binondo Business Center 35 Carina L. Yandoc, Division Head, TAMG-Sales 36 Mary Ann T. Lim, Group Head, TAMG 37 Juan Jesus C. Macapagal, Team Head, IBG-Corporate Banking 3, Team 7 38 Jennifer Y. Macariola, Cluster Head, Wealth Management Group-Business Center, Kalookan 39 Dorothy T. Maceda, Division Head, Central Accounting 40 Mandrake P. Medina, Region Head, RBB-South Luzon Region 41 Jocelyn T. Pavon, Area Head, RBB-Metro Manila West Region, Area II 42 Danilo T. Sarita, Business Center Head, RBB-Metro Manila West Region, Kalookan Business Center 43 Francisco Eduardo A. Sarmiento, Division Head, Centralized Operations Group-Treasury Operations 44 Clara C. Sy, Region Head,RBB-Metro Manila East Region 45 Belenette C. Tan, Group Head, Legal and Collection 46 Irene C. Tanlimco, Cluster Head, Wealth Management Group-Business Development, Binondo Cluster 47 Manuel M. Te, Region Head, RBB-Metro Manila South Region 48 Jasmin O. Ty, Area Head, RBB-Metro Manila North Region, Area III 48 Noemi L. Uy, Region Head, RBB-Metro Manila North Region 50 Virginia Y. Uy, Department Head, Business Process Management Division 51 Clarissa Maria A. Villalon, Division Head, CBG-Operations 52 Charon B. Wambangco, Division Head, CBG-Real Estate Marketing 53 George C. Yap, Team Head, IBG-Corporate Banking 2, Team 4 54 Marilyn G. Yuchenkang, Chief Audit Executive and Head of Audit Division
RBB- Retail Banking Business IBG - Institutional Banking Group CBG - Consumer Banking Group TAMG - Trust and Asset Management Group

China Bank Annual Financial and Sustainability Report 201790
VICE CHAIRMANGilbert U. Dee
PRESIDENTWilliam C. Whang
EXECUTIVE VICE PRESIDENTS Rosemarie C. Gan Alberto Emilio V. Ramos Romeo D. Uyan Jr.
SENIOR VICE PRESIDENTSPatrick D. ChengAlexander C. Escucha
FIRST VICE PRESIDENTS Cristina P. ArceoFilemon Cecilio A. CabungcalLilibeth R. Cariño Benedict L. Chan Virgilio O. Chua Ananias S. Cornelio IIIMelissa F. Corpus Angela D. Cruz Renato K. De Borja, Jr. Gerard Majella T. DeeMaria Luz B. Favis Delia Marquez Victor O. Martinez Jose L. Osmeña, Jr. Elizabeth C. Say Shirley G. K. T. TanStephen Y. TanMarisol M. TeodoroMaria Rosanna Catherina L. TestaGeoffrey D. Uy Lilian Yu
VICE PRESIDENTS Luis M. Afable, Jr.Juan Emmanuel B. AndayaLayne Y. Arpon Betty L. Biunas Richard S. BorjaVictor Geronimo S. CaloJeanette H. ChanMarie Carolina L. Chua Domingo P. Dayro, Jr.Aileen Paulette S. De Jesus James Christian T. Dee Norman D.C. Del Carmen Gemma B. DeladiaTherese G. EscolinMadelyn V. Fontanilla
Cesaré Edwin M. Garcia Cristina F. GotuacoJerry Ron T. HaoMa. Cristina C. HernandezMarlon B. HernandezShirley C. LeeRegina Karla LibatiqueMary Ann T. LimJuan Jesus C. Macapagal Jennifer Y. Macariola Dorothy T. Maceda Mandrake P. Medina Corazon I. Morando Jocelyn T. PavonDanilo T. Sarita
Francisco Eduardo A. SarmientoClara C. Sy Belenette C. Tan Irene C. Tanlimco Manuel M. Te Jasmin O. Ty Noemi L. Uy Virginia Y. UyClarissa Maria A. Villalon Charon B. Wambangco Carina L. YandocGeorge C. YapMarilyn G. Yuchenkang
Emmanuel L. Abesamis Baldwin A. Aguilar Evelyn T. AlamedaMa. Hildelita P. Alano Patrick Y. Ang Marissa A. AuditorFaye Theresa S. Babasa Love Virgilynn T. Baking Ma. Luisa O. Baylosis Yasmin I. Biticon Jonathan C. Camarillo Victoria G. Capacio Camilo S. CapeGrace A. CruzPatricia J. Custodio
Ma. Jeanette D. Cuyco Esperose S. De ClaroRicardo J. De Guzman III Rhodin Evan O. Escolar Pablito P. FloresFrancisco Javier C. GalangGrace Y. HoJosefina Anna T. JustinianoVivian T. KhoMaria Margaret U. KuaMa. Arlene Mae G. LazaroEric Y. LeeAngelyn Claire C. C. LiaoGlenn B. LothoOrdon P. Maningding
Ronald R. Marcaida Enrico J. Ong Josephine D. ParedesMani Thess Q. Peña-Lee Frederick M. Pineda Arnulfo H. RoldanAna Ma. Raquel Y. Samala Julie Ann P. Santiago Alejandro F. SantosCherie S. SiaMa. Cecilia D. So Cynthia U. Surpia Jeanny C. TanRoxana Angela S. Tan Ma. Cecilia V. Tejada
Jinky T. Dela TorreMa. Edita Lynn Z. TrinidadChristopher T. TyHudson Q. UyRoderick Iluminado U. Vallejo III Esmeralda R. VicenteAnthony Ariel C. Vilar Rosario D. Yabut Sandra Mae Y. YaoMichelle Y. Yap-BersalesHanz Irvin S. YoroMary Joy L. Yu
ASSISTANT VICE PRESIDENTS Agnes O. AdvientoRommel M. Agacita Nellie S. AlarRamiro A. Amanquiton Jay Angelo N. Anastacio Luis R. ApostolRoberto P. BasilioCherie Germaine T. BautistaEric Von D. BavieraRobert O. BlanchJesus S.M. Belaniso IIIMaria Charmina B. Bonifacio Maria Consuelo D.P. Cabale-TiczonAgnes C. Calimbahin Alex M. Campilan Sherry Ann F. CanillasNorman Roque V. CausingCrisostomo L. Celaje Victoria L. ChuaMa. Rosalie F. Cipriano
Maria Luisa C. Corpus Amelia Consolacion B. CruzMa. Lourdes L. Dela VegaKatherine Jean S. DiamanteEliseo P. DoroteoMary Ann R. Ducanes Eleanor Q. FaigaoAngelito T. Fernandez Susan U. Ferrer Hyacinth M. GalangMa. Salome D. L. Garcia Marissa G. Garcia Dennis S. Go IIIVirginia G. GoRuth D. HolmesGladys Antonette Marcel P. IsidroAlex A. JacobMelecio C. Labalan, Jr. Ma. Teresa O. LaoMary Ann L. Llanes
Maria Merlinda O. Lo Katherine N. Manguiat Sheila Jane F. Medrero Jose L. Nario, Jr. Tadeos R. NatividadGil P. NavelgasWendy G. NgoErlan Antonio B. Olavere Remedios Emilia R. Olivar Sonia M. OngLilian B. OrlinaSheilah B. Paglinawan Ma. Victoria G. Pantaleon Christine G. Peñafiel Noreen S. Purificacion Alvin A. QuintanillaRhoel T. ReyesNiña May Q. ReynosoEleanor D. Rosales Anita Y. Samala
Charmaine V. Santos Edgardo M. Santos Fernando S. Santos III Ma. Graciela C. SantosMaria Sheila V. Sarmenta-DayaoErnanie V. SilvinoMichaela L. Teng Jacqueline T. TomacruzEdna A. Torralba Cristina C. Ty Norman P. UretaDavid Andrew P. ValdellonLauro C. Valera Catherine D. Yabes April Marie O. Yago Manuel O. Yap
CHINA BANK MANAGEMENT TEAM
SENIOR ASSISTANT VICE PRESIDENTS

Awards and Distinctions 91
AWARDS AND DISTINCTIONS
Special Citation - Among the top 5 publicly-listed companies for 6 straight years2017 Bell Awards for Corporate Governance Philippine Stock Exchange
Asia’s Best CEO, Investor Relations - Ricardo R. Chua Best Investor Relations Company Philippines - China BankBest Investor Relations Professional Philippines -
Alexander C. Escucha The 7th Asian Excellence Awards 2017 Corporate Governance Asia
Best Bank in Corporate Governance 2017Global Banking and Finance Review AwardsGlobal Banking and Finance Review (U.K)
Best Core Banking Implementation (Mid-size banks)The Asian Banker Technology Innovation Awards 2017 The Asian Banker
Best Managed Fund of the Year Award - Dollar Long-Term Bond Category
2017 Charter AwardsChartered Financial Analyst (CFA) Society Philippines
Top Investment House in Corporate Bond Issues 201713th PDS Awards NightPhilippine Dealing System (PDS) Group
Best Bond Adviser (Domestic) - China Bank Capital Corporation
Best Follow-On (Philippines)- Del Monte Pacific US$200 Million Preferred Shares
Best Corporate Bond (Philippines) - Ayala Corporation US$400 Million Fixed-For-Life Bonds
Best Local Currency Bond (Philippines) - P4.3B Ayala Land Inc. Short Dated Notes
Best Bond Deal for Retail Investors in Southeast Asia - P181B Republic of the Philippines Bureau of the Treasury’s Retail Treasury Bonds
2017 Triple A Asia AwardsThe Asset Magazine
Power Deal of the Year (Philippines) - GNPower Dinginin Limited Company US$670 million/P7.5 billion project financing facilities
2017 Triple A Asia Infrastructure AwardsThe Asset Magazine
Rank 2 - Top Banks in the Secondary Markets in Asian Currency Bonds (Corporate Bonds-Philippines)
Rank 1 - Best Individual in Trading (Philippines) - Cristina P. Arceo
2017 Benchmark Research Awards The Asset Magazine
Silver Anvil - China Bank 2016 Annual Report53rd Anvil Awards Public Relations Society of the Philippines

China Bank Annual Financial and Sustainability Report 201792

Financial Statements 93
94 Management’s Discussion on Result of Operations and Financial Condition
95 Disclosure on Capital Structure and Capital Adequacy
105 Report of the Audit Committee
106Certificate on the Compilation Services for the Preparation of the Financial Statements and Notes to the Financial Statements
107 Statement of Management’s Responsibility for Financial Statements
108 Independent Auditors’ Report
111 Balance Sheets
112 Statements of Income
113 Statements of Comprehensive Income
114 Statements of Changes in Equity
116 Statements of Cash Flows
118 Notes to Financial Statements
FINANCIAL STATEMENTS CONTENT

China Bank Annual Financial and Sustainability Report 201794
RESULT OF OPERATIONS
China Bank recorded a 16.44% improvement in net income to P7.52 billion for 2017, which translated to a 10.01% return on equity and 1.12% return on assets.
Total operating income consisting of net interest income and fee-based income increased by 18.08% or P3.94 billion to P25.73 billion with the growth in core businesses across all market segments. Total operating expenses (including provision for impairment and credit losses) increased by 17.71% or P2.51 billion as a result of the on-going business expansion.
Net Interest Income improved to P19.63 billion, up by 17.56%, driven by the rise in interest revenue from loans and trading & investment securities. However, net interest margin fell to 3.11% from 3.20% as impact of rising funding costs tempered topline gains. Total fee-based income improved by 19.76% to P6.10 billion due to higher fees & commissions, significant revenues from the sale of investment properties, and booking of one-off gains. Service charges, fees, and commissions grew by 14.99% to P2.44 billion from the upswing in investment banking fees, credit card commissions, and transactional fee revenues. Meanwhile, trading and securities gain dropped to P479.96 million from P918.09 million because of rate volatilities that affected both the dealership business and returns on tradable securities. Trust fees exceeded previous year’s gains by 13.97% and reached P376.31 million with the expansion in assets under management. Gain on sale of investment properties saw a 51.27% improvement to P670.61 million from robust sales of the Bank’s foreclosed assets. Miscellaneous income increased by 72.64% to P1.52 billion from the higher recoveries of charged-off assets and recognition of one-off gains.
With the Bank’s on-going expansion, operating expenses (excluding provision for impairment and credit losses) rose 19.56% or P2.61 billion to P15.96 billion. The material components of operating expenses include compensation & fringe benefits which accounted for 35.77% of total operating expenses, taxes & licenses at 14.18%, occupancy costs at 13.24%, and insurance at 9.02%. Provision for impairment and credit losses figured at P754.17 million, 11.33% lower from prudent credit expansion coupled with the reduction in defaults & soured loans.
The Bank’s sustained profitability contributed to its capital strength and enabled it to consistently pay dividends to stockholders. For 2017, China Bank paid cash dividends of P0.8 per share or a total of P1.99 billion, which represents a total payout of 30.79% of prior years’ net income. The Bank also declared a 8% stock dividend or a total of P1.99 billion.
FINANCIAL CONDITION
The Bank’s total assets expanded by 18.67% to P751.45 billion from P633.20 billion mainly from the robust growth in liquid assets and core business.
The Bank’s loan portfolio (net, inclusive of UDSCL) grew by 16.06% to P448.97 billion from P386.83 billion mainly from higher demand across all customer segments (corporate, commercial and consumer). Consumer loans grew by 25% for 2017. The Bank’s non-performing loans ratio improved to 1.41% from last year’s 1.86%, while loan loss coverage ratio was computed at 99.02%, up from 91.0% in 2016.
Total investment securities which consist of Financial Assets at Fair Value through Profit or Loss, Available-for-Sale and Held-to-Maturity Financial Assets totalled P127.97 billion, up by 29.29% from P98.98 billion, resulting in a higher share to total assets of 17.03% from 15.63% in 2016. The Bank’s liquidity ratio stood at 36.40%, better than last year’s 34.39%.
On the liabilities side, total deposits increased by 17.27% to P635.09 billion from P541.58 billion mainly from the ongoing branch expansion and more customer acquisition efforts. Low-cost CASA (checking & savings ) were P66.59 billion or 24.09% higher at P343.01 billion, improving the low-cost funding mix to 54.01% from 51.04% in 2016. The Bank also issued the second tranche of its long-term negotiable certificate of deposits (LTNCD) amounting to P6.4 billion in June 2017, bringing the Bank’s total LTNCD to P15.9 billion.
Total capital funds grew to P83.66 billion, 31.98% higher than last year’s P63.39 billion primarily from the P15 billion stock rights offering and retained profits. The Bank’s Common Equity Tier 1 (CET 1) and total CAR were computed at 13.47% and 14.22%, respectively.
MANAGEMENT’S DISCUSSION ON RESULT OF OPERATIONS AND FINANCIAL CONDITION

Financial Statements 95
Capital Fundamentals
We believe that China Bank can only achieve sustainable growth by maintaining strong capital fundamentals. Major business initiatives are undertaken with the appropriate capital planning which also takes into consideration constraints and changes in the regulatory environment. This is necessary to ensure that the Bank’s commercial objectives are equally aligned with its ability to maintain a capital position at par with the industry. The Board and Senior Management recognizes that a balance should be achieved with respect to China Bank’s earnings outlook vis-à-vis capital fundamentals that can take advantage of growth opportunities while maintaining sufficient capacity to absorb shocks.
Risk-based capital components, including deductions, on a parent and consolidated basis:
Qualifying Capital (Basel III) Consolidated Parent CompanyIn PhP Million 2017
Common Equity Tier 1 Capital Paid-up common stock 26,859.00 26,859.00 Additional paid-in capital 17,122.63 17,122.63 Retained Earnings 35,370.61 34,552.59 Other Comprehensive Income (1,370.94) (1,373.38) Minority Interest 104.55 - Less: Unsecured DOSRI (189.98) (173.50) Less: Deferred Tax Assets (2,097.87) (1,932.56) Less: Goodwill (563.47) (222.84) Less: Other Intangible Assets (3,072.14) (442.12) Less: Defined Benefit Pension Fund Assets/Liabilities (991.39) (991.39) Less: Investment in Subsidiary (406.30) (9,981.50) Less: Significant Minority Investment (87.18) (87.18) Less: Other Equity Investment (25.60) (23.41)Total CET 1 Capital 70,651.92 63,306.34Additional Tier 1 Capital - -Total Tier 1 Capital 70,651.92 63,306.34Tier 2 Capital General Loan Loss Provision 3,970.35 3,409.98Total Tier 2 Capital 3,970.35 3,409.98Total Qualifying Capital 74,622.27 66,716.32
Qualifying Capital (Basel III) Consolidated Parent CompanyIn PhP Million 2016
Common Equity Tier 1 Capital Paid-up common stock 20,020.28 20,020.28 Additional paid-in capital 6,987.56 6,987.56 Retained Earnings 32,341.53 31,617.74 Other Comprehensive Income (1,279.51) (1,216.81) Minority Interest 100.32 - Less: Unsecured DOSRI (440.48) (419.44) Less: Deferred Tax Assets (2,165.10) (2,165.10) Less: Goodwill (563.47) (222.84) Less: Other Intangible Assets (3,065.71) (442.12) Less: Defined Benefit Pension Fund Assets/Liabilities (682.43) (682.43) Less: Investment in Subsidiary (370.55) (9,189.25) Less: Significant Minority Investment (26.92) (26.92) Less: Other Equity Investment (23.10) (20.91)Forward
DISCLOSURE ON CAPITAL STRUCTURE AND CAPITAL ADEQUACY

China Bank Annual Financial and Sustainability Report 201796
Qualifying Capital (Basel III) Consolidated Parent CompanyIn PhP Million 2016
Total CET 1 Capital 50,832.42 44,239.76Additional Tier 1 Capital - -
Total Tier 1 Capital 50,832.42 44,239.76Tier 2 Capital General Loan Loss Provision 4,076.47 3,513.93Total Tier 2 Capital 4,076.47 3,513.93Total Qualifying Capital 54,908.89 47,753.69
Risk-based capital ratios:Basel III Consolidated Parent Company
2017 In PhP MillionCET 1 capital 78,085.85 77,160.83Less regulatory adjustments 7,433.93 13,854.49Total CET 1 capital 70,651.92 63,306.34Additional Tier 1 capital - -Total Tier 1 capital 70,651.92 63,306.34Tier 2 capital 3,970.35 3,409.98Total qualifying capital 74,622.27 66,716.32Risk weighted assets 524,667.93 451,523.36CET 1 capital ratio 13.47% 14.02%Tier 1 capital ratio 13.47% 14.02%Total capital ratio 14.22% 14.78%
Basel III Consolidated Parent Company2016
In PhP MillionCET 1 capital 58,170.18 57,408.77 Less regulatory adjustments 7,337.76 13,169.02 Total CET 1 capital 50,832.42 44,239.76 Additional Tier 1 capital - - Total Tier 1 capital 50,832.42 44,239.76 Tier 2 capital 4,076.47 3,513.93 Total qualifying capital 54,908.89 47,753.69 Risk weighted assets 449,683.04 382,679.13 CET 1 capital ratio 11.30% 11.56%Tier 1 capital ratio 11.30% 11.56%Total capital ratio 12.21% 12.48%
The regulatory Basel III qualifying capital of the Group consists of Common Equity Tier 1 capital (going concern capital), which comprises paid-up common stock, additional paid-in capital, surplus including current year profit, other comprehensive income and minority interest less required deductions such as unsecured credit accommodations to DOSRI, deferred income tax, other intangible assets, goodwill, defined benefit pension fund assets/liabilities, and investment in subsidiaries. The other component of regulatory capital is Tier 2 capital (gone-concern capital), which includes general loan loss provision. A capital conservation buffer of 2.5% comprised of CET 1 capital is likewise imposed in the Basel III capital ratios.
DISCLOSURE ON CAPITAL STRUCTURE AND CAPITAL ADEQUACY

Financial Statements 97
Full reconciliation of all regulatory capital elements back to the balance sheet in the audited financial statements is presented below:
Parent Company2017 2016
Qualifying Capital
Reconciling Items
Audited Financial
StatementsQualifying
CapitalReconciling
Items
Audited Financial
StatementsCommon stock 26,859 11 26,848 20,020 - 20,020Additional paid-in capital 17,123 26 17,096 6,988 - 6,988Retained Earnings 34,553 (6,735) 41,287 31,618 (6,133) 37,751Net unrealized gains or losses on AFS securities (1,536) 278 (1,813) (1,313) 286 (1,599)Cumulative foreign currency translation and
others 162 (70) 233 96 (135) 231Deductions (13,854) (13,854) - (13,169) (13,169) -Tier 1 (CET1) capital/Total equity 63,307 (20,344) 83,651 44,240 (19,151) 63,391Tier 2 capital 3,410 3,410 - 3,514 3,514 -Total qualifying capital/Total equity 66,717 (16,934) 83,651 47,754 (15,638) 63,391
Group2017 2016
Qualifying Capital
Reconciling Items
Audited Financial
Statements
Qualifying Capital
Reconciling Items
Audited Financial
StatementsCommon stock 26,859 11 26,848 20,020 - 20,020Additional paid-in capital 17,123 27 17,096 6,988 - 6,988Retained Earnings 35,371 (5,916) 41,287 32,342 (5,409) 37,751Net unrealized gains or losses on AFS securities (1,536) 277 (1,813) (1,313) 286 (1,599)Cumulative foreign currency translation and others 165 (68) 233 33 (198) 231Non-controlling interest 105 100 5 100 106 (5)Deductions (7,434) (7,434) - (7,338) (7,338) -Tier 1 (CET1) capital/Total equity 70,653 (13,003) 83,656 50,832 (12,554) 63,386Tier 2 capital 3,970 3,970 - 4,076 4,076 -Total qualifying capital/Total equity 74,623 (9,033) 83,656 54,909 (8,477) 63,386
The capital requirements for Credit, Market and Operational Risk are listed below, on a parent and consolidated basis:
Capital Requirement Consolidated Parentin PhP Million 2017 2016 2017 2016
Credit Risk 48,095.62 41,438.12 41,545.70 35,265.13 Market Risk 766.46 457.53 754.04 433.90 Operational Risk 3,604.71 3,072.65 2,852.60 2,568.88Total Capital Requirements 52,466.79 44,968.30 45,152.34 38,267.91

China Bank Annual Financial and Sustainability Report 201798
Credit Risk
On-balance sheet exposures, net of specific provisions and not covered by Credit Risk Mitigants (in PhP million):
December 2017
On-Balance Sheet Assets Consolidated Parent
Exposures, net of Specific Provisions
Exposures not Covered by CRM
Exposures, net of Specific Provisions
Exposures not Covered by CRM
Cash on Hand 11,967.20 11,967.20 10,473.04 10,473.04 Checks and Other Cash Items 105.31 105.31 86.31 86.31 Due from BSP 98,490.46 98,490.46 91,717.49 91,717.49 Due from Other Banks 15,641.48 15,641.48 14,066.62 14,066.62 Financial Assets at FVPL 3,421.44 3,411.69 3,421.44 3,411.69 Available-for-Sale Financial Assets 46,569.31 45,594.23 43,303.71 42,328.63 Held-to-Maturity Financial Assets 66,079.64 66,079.64 62,284.34 62,284.34 Unquoted Debt Securities Classified as Loans 1,126.59 1,126.59 1,021.49 1,021.49 Loans and Receivables 451,658.56 424,289.21 390,162.15 367,704.31 Loans and Receivables arising from Repurchase
Agreements 18,755.60 18,755.60 17,350.99 17,350.99 Sales Contract Receivables 922.96 922.96 178.73 178.73 Real and Other Properties Acquired 4,135.94 4,135.94 418.63 418.63 Other Assets 11,577.51 11,577.51 8,274.34 8,274.34
Total On-Balance Sheet Assets 730,452.01 702,097.82 642,759.29 619,316.62
December 2016
On-Balance Sheet AssetsConsolidated Parent
Exposures, net of Specific Provisions
Exposures not Covered by CRM
Exposures, net of Specific Provisions
Exposures not Covered by CRM
Cash on Hand 11,817.72 11,817.72 10,502.02 10,502.02 Checks and Other Cash Items 172.22 172.22 152.44 152.44 Due from BSP 91,791.03 91,791.03 85,133.66 85,133.66 Due from Other Banks 10,013.41 10,013.41 8,370.13 8,370.13 Financial Assets at FVPL 2,472.60 2,462.89 2,472.60 2,462.89 Available-for-Sale Financial Assets 33,937.65 32,966.67 31,374.20 30,403.22 Held-to-Maturity Financial Assets 58,131.81 58,131.81 54,755.05 54,755.05 Unquoted Debt Securities Classified as Loans 4,106.19 4,106.19 4,000.98 4,000.98 Loans and Receivables 387,185.32 362,850.92 330,301.95 311,073.96 Loans and Receivables arising from Repurchase
Agreements 3,452.13 3,452.13 2,959.06 2,959.06
Sales Contract Receivables 909.20 909.20 228.43 228.43 Real and Other Properties Acquired 4,298.03 4,298.03 605.71 605.71 Other Assets 10,518.86 10,518.86 6,890.90 6,890.90
Total On-Balance Sheet Assets 618,806.17 593,491.08 537,747.14 517,538.46
DISCLOSURE ON CAPITAL STRUCTURE AND CAPITAL ADEQUACY

Financial Statements 99
December 2015
On-Balance Sheet AssetsConsolidated Parent
Exposures, net of Specific Provisions
Exposures not Covered by CRM
Exposures, net of Specific Provisions
Exposures not Covered by CRM
Cash on Hand 11,315.70 11,315.70 9,997.94 9,997.94 Checks and Other Cash Items 128.93 128.93 125.72 125.72 Due from BSP 86,107.22 86,107.22 76,791.60 76,791.60 Due from Other Banks 20,727.94 20,727.94 18,721.97 18,721.97 Financial Assets at FVPL 2,309.16 2,299.97 2,309.16 2,299.97 Available-for-Sale Financial Assets 49,212.27 48,293.27 47,349.01 46,430.01 Held-to-Maturity Financial Assets 16,449.17 16,449.17 14,228.65 14,228.65 Unquoted Debt Securities Classified as Loans 1,291.55 1,291.55 1,021.55 1,021.55 Loans and Receivables 312,709.73 296,968.77 262,396.76 251,552.50 Loans and Receivables arising from Repurchase
Agreements 0.00 0.00 0.00 0.00
Sales Contract Receivables 977.75 977.75 251.54 251.54 Real and Other Properties Acquired 3,415.27 3,415.27 721.69 721.69 Other Assets 11,525.08 11,525.08 8,665.47 8,665.47
Total On-Balance Sheet Assets 516,169.78 499,500.62 442,581.07 430,808.62
Credit equivalent amount for off-balance sheet items, broken down by type of exposures (in PhP million):
Off-balance Sheet Assets
2017 2016 2015Consolidated Parent Consolidated Parent Consolidated Parent
Notional Principal
Credit Equivalent
Notional Principal
Credit Equivalent
Notional Principal
Credit Equivalent
Notional Principal
Credit Equivalent
Notional Principal
Credit Equivalent
Notional Principal
Credit Equivalent
Direct Credit Substitutes 0.00 0.00 0.00 0.00 0.00 0.00 0.00 0.00 0.00 0.00 0.00 0.00
Transaction-related contingencies
17,856.22
8,928.11
17,643.24
8,821.62 17,129.58 8,564.79 16,795.09 8,397.55 18,642.19 9,321.10 18,312.08 9,156.04
Trade-related contingencies arising from movement of goods
8,244.10 1,648.82 8,079.90 1,615.98 5,211.89 1,042.38 5,174.63 1,034.93 8,780.79 1,756.16 4,168.27 833.65
Other commitments (which can be unconditionally cancelled at any time by the bank without prior notice)
148,317.90 0.00 145,897.78 0.00 149,582.52 0.00 144,594.20 0.00 134,164.24 0.00 130,113.85 0.00
Total Notional Principal and Credit Equivalent Amount
174,418.22 10,576.93 171,620.92 10,437.60 171,923.98 9,607.17 166,563.93 9,432.47 161,587.23 11,077.26 152,594.21 9,989.70
Credit equivalent amount for counterparty credit risk in the trading book, broken down by type of exposures (in PhP million):
December 2017
Standardized ApproachConsolidated Parent
Notional Principal Credit Equivalent Notional Principal Credit EquivalentInterest Rate Contracts 9,991.39 41.21 9,991.39 41.21 Exchange Rate Contracts 33,068.49 625.66 33,068.49 625.66 Equity Contracts 0.00 0.00 0.00 0.00Credit Derivatives 0.00 0.00 0.00 0.00
Total Notional Principal and Credit Equivalent Amount 43,059.88
666.87 43,059.88
666.87

China Bank Annual Financial and Sustainability Report 2017100
December 2016
Standardized ApproachConsolidated Parent
Notional Principal Credit Equivalent Notional Principal Credit Equivalent
Interest Rate Contracts 10,823.40 72.93 10,823.40 72.93 Exchange Rate Contracts 16,830.93 343.13 16,830.93 343.13 Equity Contracts 0.00 0.00 0.00 0.00Credit Derivatives 0.00 0.00 0.00 0.00
Total Notional Principal and Credit Equivalent Amount 27,654.33 416.07 27,654.33 416.07
December 2015
Standardized ApproachConsolidated Parent
Notional Principal Credit Equivalent Notional Principal Credit Equivalent
Interest Rate Contracts 6,950.00 31.62 6,950.00 31.62Exchange Rate Contracts 29,022.60 551.18 29,022.60 551.18Equity Contracts 0.00 0.00 0.00 0.00Credit Derivatives 0.00 0.00 0.00 0.00
Total Notional Principal and Credit Equivalent Amount 35,972.60 582.80 35,972.60 582.80
Net Exposures after CRM for counterparty credit risk in the banking book, broken down by type of exposures (in PhP million):
December 2017
Standardized ApproachConsolidated Parent
Fair Value/ Carrying Amount
Net Exposures after CRM
Fair Value/ Carrying Amount
Net Exposures after CRM
Derivative Transactions 0.00 0.00 0.00 0.00 Repo-Style Transactions 17,415.76 3,546.90 17,415.76 3,546.90
Total Fair Value/Carrying Amount and Net Exposures after CRM 17,415.76 3,546.90 17,415.76 3,546.90
December 2016
Standardized ApproachConsolidated Parent
Fair Value/ Carrying Amount
Net Exposures after CRM
Fair Value/ Carrying Amount
Net Exposures after CRM
Derivative Transactions 0.00 0.00 0.00 0.00 Repo-Style Transactions 9,520.22 1,447.43 9,520.22 1,447.43
Total Fair Value/Carrying Amount and Net Exposures after CRM 9,520.22 1,447.43 9,520.22 1,447.43
December 2015
Standardized ApproachConsolidated Parent
Fair Value/ Carrying Amount
Net Exposures after CRM
Fair Value/ Carrying Amount
Net Exposures after CRM
Derivative Transactions 0.00 0.00 0.00 0.00 Repo-Style Transactions 13,020.27 1,967.19 13,020.27 1,967.19
Total Fair Value/Carrying Amount and Net Exposures after CRM 13,020.27 1,967.19 13,020.27 1,967.19
DISCLOSURE ON CAPITAL STRUCTURE AND CAPITAL ADEQUACY

Financial Statements 101
The following credit risk mitigants are used in the December 2017 CAR Report:• ROP warrants• ROP guarantees• HGC guarantee• Holdout vs. Peso deposit / Deposit substitute• Holdout vs. FCDU deposit of resident• Holdout vs. FCDU deposit of non-resident• Assignment / Pledge of Government Securities
Total credit exposure after risk mitigation, broken down by type of exposures, risk buckets, as well as those that are deducted from capital (in PhP million):
Weight Band
2017Consolidated Parent Company
On-balance sheet
Off-balance sheet Counterparty Total On-balance
sheetOff-balance
sheet Counterparty Total
Below 100% 299,057.46 0.00 4,065.92 303,123.38 268,167.72 0.00 4,065.92 272,233.64 100% and
Above403,040.36 10,576.93 147.84 413,765.14 351,148.90 10,437.60 147.84 361,734.34
Total 702,097.82 10,576.93 4,213.77 716,888.52 619,316.62 10,437.60 4,213.77 633,967.98
Weight Band
2016Consolidated Parent Company
On-balance sheet
Off-balance sheet Counterparty Total On-balance
sheetOff-balance
sheet Counterparty Total
Below 100% 252,534.01 21.86 1,805.97 254,361.84 224,540.77 21.86 1,805.97 226,368.61 100% and
Above 340,957.07 9,585.31 57.53 350,599.91 292,997.69 9,410.61 57.53 302,465.83
Total 593,491.08 9,607.17 1,863.50 604,961.75 517,538.46 9,432.47 1,863.50 528,834.43
Weight Band
2015Consolidated Parent Company
On-balance sheet
Off-balance sheet Counterparty Total On-balance
sheetOff-balance
sheet Counterparty Total
Below 100% 220,502.35 966.22 2,369.43 223,838.01 193,175.37 43.72 2,369.43 195,588.52100% and
Above 278,998.27 10,111.03 180.55 289,289.86 237,633.25 9,945.98 180.55 247,759.78
Total 499,500.62 11,077.26 2,549.99 513,127.87 430,808.62 9,989.70 2,549.99 443,348.31
Total credit risk-weighted assets, broken down by type of exposures (in PhP million):
Weight Band
2017Consolidated Parent Company
On-balance sheet
Off-balance sheet Counterparty Total On-balance
sheetOff-balance
sheet Counterparty Total
Below 100% 61,429.58 0.00 1,990.76 63,420.34 50,785.80 0.00 1,990.76 52,776.56 100% and
Above 406,743.33 10,576.93 147.84 417,468.11 352,027.29 10,437.60 147.84 362,612.73 Covered by
CRM 67.74 0.00 0.00 67.74 67.74 0.00 0.00 67.74 Excess GLLP 0.00 0.00 Total 468,240.65 10,576.93 2,138.60 480,956.18 402,880.83 10,437.60 2,138.60 415,457.04

China Bank Annual Financial and Sustainability Report 2017102
Weight Band
2016Consolidated Parent Company
On-balance sheet
Off-balance sheet Counterparty Total On-balance
sheetOff-balance
sheet Counterparty Total
Below 100% 58,436.20 4.37 542.12 58,982.70 48,001.61 4.37 542.12 48,548.10 100% and
Above 345,656.04 9,585.31 57.53 355,298.88 294,570.61 9,410.61 57.53 304,038.75
Covered by CRM 99.63 0.00 0.00 99.63 64.40 0.00 0.00 64.40
Excess GLLP 0.00 0.00
Total 404,191.88 9,589.68 599.65 414,381.20 342,636.62 9,414.98 599.65 352,651.25
Weight Band
2015Consolidated Parent Company
On-balance sheet
Off-balance sheet Counterparty Total On-balance
sheetOff-balance
sheet Counterparty Total
Below 100% 54,350.83 8.74 900.65 55,260.22 45,237.43 8.74 900.65 46,146.81100% and
Above 283,011.77 10,111.03 180.55 293,303.36 239,142.00 9,945.98 180.55 249,268.53
Covered by CRM 76.21 0.00 0.00 76.21 71.18 0.00 0.00 71.18
Excess GLLP (490.54) (603.52)
Total 337,438.81 10,119.78 1,081.20 348,149.25 284,450.60 9,954.72 1,081.20 294,883.00
The credit ratings given by the following rating agencies were used to determine the credit risk weight of On-balance sheet, Off-balance sheet, and Counterparty exposures:
For all rated credit exposures regardless of currency Standard & Poor (S&P) Moody’s Fitch For PHP-denominated debts of rated domestic entities Philratings
DISCLOSURE ON CAPITAL STRUCTURE AND CAPITAL ADEQUACY

Financial Statements 103
Market Risk-Weighted Assets
The Standardized Approach is used in China Bank’s market risk-weighted assets. The total market risk-weighted asset of the Bank as of December 2017 is P7.54 billion and P7.67 billion for parent company and consolidated basis, respectively. This is composed of Interest Rate exposures amounting to P6.94 billion and Foreign Exposures amounting to P0.60 billion for the parent bank, while it is composed of Interest Rate exposures amounting to P6.97 billion, Equity exposures amounting to P0.09 billion and Foreign Exposures amounting to P0.60 billion on a consolidated basis.
Interest Rate Exposures (in PhP Mn)Consolidated Parent Company Consolidated Parent Company
2017 2016Specific Risk 176.92 176.37 63.53 60.92General Market Risk
PHP 124.23 123.60 41.59 34.99USD 256.58 255.27 80.66 72.35
Total Capital Charge 557.73 555.24 185.78 168.26 Adjusted Capital Charge 697.17 694.05 232.23 210.33 Subtotal Market Risk-Weighted Assets 6,971.70 6,940.52 2,322.27 2,103.25
Consolidated Parent Company Consolidated Parent CompanyEquity Exposures 2017 2016Total Capital Charge 7.47 - - -Adjusted Capital Charge 9.33 - - -Subtotal Market Risk-Weighted Assets 93.33 - - -Total Market Risk-Weighted Assets 93.33 - - -
Consolidated Parent Company Consolidated Parent CompanyForeign Exchange Exposures 2017 2016Total Capital Charge 47.97 47.99 180.24 178.86 Ad justed Capital Charge 59.96 59.98 225.30 223.58 Subtotal Market Risk-Weighted Assets 599.61 599.83 2,253.05 2,235.80
Total Market Risk-Weighted Assets 7,664.64 7,540.35 4,575.31 4,339.05

China Bank Annual Financial and Sustainability Report 2017104
Operational, Legal, and Other Risks
Operational risks arise from inadequate or failed internal processes, people and systems or from external events. The Bank employs several tools to identify, assess, monitor and control the operational risk inherent to the Bank.
Tools such as the Risks and Controls Self-Assessment (RCSA), IT Risk Assessment (ITRA), the analysis of historical loss reports, the monitoring of Key Risk Indicators (KRI) and the Business Impact Analysis further allow risk management to identify high risk areas, loss drivers, and trends which can be acted upon by management to prevent material failures in our processes, people, systems, and resiliency measures against external events. These results are periodically reported to management and cover all aspects of the business from core operating capabilities of the units, all products and services, outstanding legal cases, and even its sales and marketing practices. In addition, the Bank has a product review and approval process. It seeks to outline a standard approach involved in implementing the product management mandate for all product categories in the Bank and will ultimately reflect the Bank’s operating and risk management philosophy in the context of its over-all business goals and strategies. Further, the Bank through its Legal & Collection Division identified and assessed potential losses attributed to Legal Risk and amount is not material to significantly affect the Bank’s capital position.
The operational risk exposure of the Bank is profiled using a number of methodologies which also include a scenario analysis exercise as part of the Internal Capital Adequacy Assessment Process (ICAAP) to validate if the computed capital requirement using the Basic Indicator Approach (BIA) is enough to cover estimated losses arising from adverse operating conditions and major incidents. The Bank allocated the amount of P2.85 billion in capital as of December 2017 for operational risk which is more than adequate to cover the resulting exposure based on the scenario analysis exercise. In fact, the BIA provides a capital buffer of as much as P2.39 billion.
Operational Risk-Weighted Assets
The BIA is used to determine the equivalent operational risk-weighted assets of China Bank. On a parent basis, the Bank’s operational risk-weighted asset as of December 2017 is P28.53 billion while on a consolidated basis, the Bank’s operational risk-weighted assets is 36.05 billion. On a parent basis, the Bank’s operational risk-weighted asset as of December 2016 is P25.69 billion while on a consolidated basis, the Bank’s operational risk-weighted assets is P30.73 billion.
Internal measurement of interest rate risk in the banking book
The Bank’s interest rate risk (IRR) originates from its holdings of interest rate sensitive assets and interest rate sensitive liabilities. Internally, the Earnings-at-Risk (EaR) method is used to determine the effects of interest rate movements on the Bank’s interest earnings. The Bank’s loans is assumed affected by interest rate movements on its repricing date for floating rates and on its maturity for fixed rates. Demand and savings deposits, on the other hand, are generally not interest rate sensitive. Provided in the table below are the approximate addition and reduction in annualized interest income of a 100bps change across the PhP and USD yield curves.
Earnings-at-Risk in PhP MillionConsolidated Parent
2017 2016 2017 2016
PHP IRR ExposuresUpward 752 237 867) 387 Downward (752) (237) (867) (387)
USD IRR ExposuresUpward (342) (183) (328) (169) Downward 301 201 287 187

Financial Statements 105
The Audit Committee of the Bank is chaired by independent director Alberto S. Yao, with non-executive director Joaquin T. Dee and independent director Roberto F. Kuan as members. All of them have accounting, auditing, or related financial management expertise or experience commensurate with the size, complexity of operations and risk profile of the Bank.
With primary oversight of all matters pertaining to audit, the Committee looks into the Bank’s internal audit function and performance, the integrity of the Bank’s financial statements, and the Bank’s accounting processes in general. It likewise provides oversight on the senior management’s activities, as well as the internal and external auditors, and monitors and evaluates the adequacy and effectiveness of the Bank’s internal control system. The Committee also plays an important role in empowering and elevating the status of the internal audit activity throughout the organization as provider of quality and significant assurance and consulting services that adds value to the Bank’s governance, risk management, and internal control processes.
The Audit Committee met 14 times during the year ended December 31, 2017, including six joint meetings with the Compliance and Corporate Governance Committees, to tackle various matters including the following:
Oversight of Financial Reporting and Policies
The Committee reviewed and discussed with the external auditor, SyCip Gorres Velayo & Co./Ernst & Young, the audited financial statements, focusing on key audit matters, any change/s in accounting policies and practices, standards and interpretations and related impact; major judgmental areas including reasonableness of estimates and assumptions used in the preparation of financial statements; significant adjustments resulting from the audit; compliance with accounting and auditing standards; compliance with Bureau of Internal Revenue (BIR), Securities and Exchange Commission (SEC) and Bangko Sentral ng Pilipinas (BSP) regulations and/or requirements; completeness and timeliness of communication with external auditor; and other material issues that affect the audit and financial reporting.
Oversight of Internal Control
To establish and maintain an adequate, effective and efficient internal control framework, the Committee ensured that systems and processes are designed to provide assurance in areas including reporting, monitoring compliance with laws, regulations and internal policies, efficiency and effectiveness of operations, and safeguarding of assets. It reviewed and discussed the adequacy of internal controls, and monitored the internal control issues noted during internal regular, special and limited audits of various branches, units and services of the Bank, together with the management’s responses and determined that appropriate actions have been taken to address significant deficiencies and weaknesses. Included in the Committee’s monitoring and evaluation is the effectiveness of the information technology security and control.
Oversight of External Audit
The scope and plan of the annual audit were reviewed and discussed by the Committee, including coordination of audit effort with internal audit and rotation process of auditor/firm. The annual audited financial statements, management letters, regulatory and accounting issues and developments and their effect on the financial statements were also taken up. In addition, the members of the Committee reviewed the qualifications, performance, competence and independence of the external auditor, recommended to the Board the re-engagement/re-appointment of SyCip Gorres Velayo & Co./Ernst & Young as the Bank’s external auditor, and approved their fees. Such re-engagement/re-appointment will be subject to stockholders’ ratification.
Oversight of Internal Audit
To assess the effectiveness of the internal audit function, the Audit Committee approved the plans and budget of internal audit’s Quality Assurance and Control Department, Branch Audit Department, Head Office and Subsidiaries Audit Department, and IT Audit Department; monitored their accomplishments versus plans on semestral and annual basis; evaluated the additions, deferments, or any other changes in audit engagements; and reviewed the internal audit reports and recommendations to address the weaknesses and deficiencies noted. Ensuring that the internal audit function maintains an open communication with the Committee, the members of the Committee deliberated on several issues which affect or may affect internal audit’s process and independence, and approved guidelines in handling management acceptance of risk.
The Committee confirmed the professional opinion of the Chief Audit Executive of adherence to the Institute of Internal Auditors’ Standard 2130 and Practice Advisory 2130-1 on Control based on the results of audit conducted for the covered period, and that the Bank’s control processes, operating across the organization, are in place, adequate and working effectively to mitigate risks that could adversely affect the achievement of Bank objectives. The Committee also confirmed that in adherence to the Institute of Internal Auditors’ Standard 1100 on Independence and Objectivity, for Audit year 2017, the internal audit activity is independent from any conditions that would threaten its ability to carry out internal audit responsibilities in an unbiased manner, which are evidenced by the dual reporting lines to the Board and President, and the functional roles that are within the scope of internal audit activity, and that internal audit members have an impartial, unbiased attitude and avoid any conflict of interest in the performance of their duties and responsibilities, in observance of the Standards and Code of Ethics. Further, the Committee evaluated the performance of the Chief Audit Executive, including her accomplishment versus plans and budget. Among the noted accomplishments for the period were the updating of the Audit Manual, revision of the Audit Committee Charter, and setting up of the Data Analytics Unit for the automation of audit procedures to implement continuous auditing.
Based on the foregoing, the Audit Committee views that the internal control and financial reporting systems and policies of the Bank are in place, adequate, effective and efficient.
Makati City, March 21, 2018.
ALBERTO S. YAOChairman
JOAQUIN T. DEE Member
ROBERTO F. KUAN Member
REPORT OF THE AUDIT COMMITTEE

China Bank Annual Financial and Sustainability Report 2017106
I hereby certify that I am the Certified Public Accountant who performed the compilation services related to the preparation and presentation of financial information of an entity in accordance with an applicable financial reporting framework and reports required by accounting and auditing standards for China Banking Corporation for the period ended December 31, 2017.
In discharging this responsibility, I hereby declare that I am an officer under Controllership Group of China Banking Corporation.
Furthermore, in the compilation services for preparation of the Financial Statements and Notes to the Financial Statements, I was not assisted by or did not avail of the services of Sycip Gorres Velayo & Co., who is the external auditor who rendered the audit opinion for the said Financial Statement and Notes to the Financial Statements.
I hereby declare, under penalties of perjury and violation of the Revised Accountancy Law, that my statements are true and correct.
Edgar S. Neri Jr.CPA Certificate No. 122893Valid until September 14, 2019CPA Accreditation filed on December 9, 2016 and is pending at the PRC
March 1, 2018
Doc. No. 257Page No. 54Book No. 10Series of 2018
CERTIFICATE ON THE COMPILATION SERVICES FOR THE PREPARATION OF THE FINANCIAL STATEMENTS AND NOTES TO THE FINANCIAL STATEMENTS

Financial Statements 107
The management of China Banking Corporation (the Bank) is responsible for the preparation and fair presentation of the consolidated financial statements including the schedules attached therein, for the years ended December 31, 2017 and 2016, in accordance with the prescribed financial reporting framework indicated therein, and for such internal control as management determines is necessary to enable the preparation of consolidated financial statements that are free from material misstatement, whether due to fraud or error.
In preparing the consolidated financial statements, management is responsible for assessing the Bank’s ability to continue as a going concern, disclosing, as applicable, matters related to going concern and using the going concern basis of accounting unless management either intends to liquidate the Bank or to cease operations, or has no realistic alternative but to do so.
The Board of Directors is responsible for overseeing the Bank’s financial reporting process.
The Board of Directors reviews and approves the consolidated financial statements including the schedules attached therein, and submits the same to the stockholders.
SyCip Gorres Velayo & Co., the independent auditors appointed by the stockholders, has audited the consolidated financial statements of the Bank in accordance with Philippine Standards on Auditing, and in its report to the stockholders, has expressed its opinion on the fairness of presentation upon completion of such audit.
Hans T. Sy William C. Whang Patrick D. Cheng Chairman of the Board President Chief Financial Officer
Republic of the PhilippinesCity of Makati } S. S.
Signed this 1st day of March 2018, affiants exhibiting to me their Social Security System Nos. as follows:
Name SSS Nos. Hans T. Sy 03-4301174-3 William C. Whang 03-5882607-5 Patrick D. Cheng 03-8328014-9
Doc. No.: 253Page No.: 52Book No.: 52Series of: 2018
STATEMENT OF MANAGEMENT’S RESPONSIBILITY FOR FINANCIAL STATEMENTS

China Bank Annual Financial and Sustainability Report 2017108
The Board of Directors and StockholdersChina Banking Corporation 8745 Paseo de Roxas cor. Villar St.Makati City
Report on the Consolidated and Parent Company Financial Statements
Opinion
We have audited the consolidated financial statements of China Banking Corporation and its subsidiaries (the Group) and the parent company financial statements of China Banking Corporation, which comprise the consolidated and parent company balance sheets as at December 31, 2017 and 2016, and the consolidated and parent company statements of income, consolidated and parent company statements of comprehensive income, consolidated and parent company statements of changes in equity and consolidated and parent company statements of cash flows for each of the three years in the period ended December 31, 2017, and notes to the consolidated and parent company financial statements, including a summary of significant accounting policies.
In our opinion, the accompanying consolidated and parent company financial statements present fairly, in all material respects, the financial position of the Group and the Parent Company as at December 31, 2017 and 2016, and their financial performance and their cash flows for each of the three years in the period ended December 31, 2017 in accordance with Philippine Financial Reporting Standards (PFRSs).
Basis for Opinion
We conducted our audits in accordance with Philippine Standards on Auditing (PSAs). Our responsibilities under those standards are further described in the Auditor’s Responsibilities for the Audit of the Consolidated and Parent Company Financial Statements section of our report. We are independent of the Group and the Parent Company in accordance with the Code of Ethics for Professional Accountants in the Philippines (Code of Ethics) together with the ethical requirements that are relevant to our audit of the consolidated and parent company financial statements in the Philippines, and we have fulfilled our other ethical responsibilities in accordance with these requirements and the Code of Ethics. We believe that the audit evidence we have obtained is sufficient and appropriate to provide a basis for our opinion.
Key Audit Matters
Key audit matters are those matters that, in our professional judgment, were of most significance in our audit of the consolidated and parent company financial statements of the current period. These matters were addressed in the context of our audit of the consolidated and parent company financial statements as a whole, and in forming our opinion thereon, and we do not provide a separate opinion on these matters. For each matter below, our description of how our audit addressed the matter is provided in that context.
We have fulfilled the responsibilities described in the Auditor’s Responsibilities for the Audit of the Consolidated and Parent Company Financial Statements section of our report, including in relation to these matters. Accordingly, our audit included the performance of procedures designed to respond to our assessment of the risks of material misstatement of the consolidated and parent company financial statements. The results of our audit procedures, including the procedures performed to address the matters below, provide the basis for our audit opinion on the accompanying consolidated and parent company financial statements.
Applicable to the audit of the Consolidated and Parent Company Financial Statements
Adequacy of allowance for credit losses on loans and receivables
Loans and receivables comprise 59.75% and 57.59% of the total assets of the Group and the Parent Company as of December 31, 2017, respectively. Reflecting these assets and the related allowance for credit losses at their appropriate amounts is a key area of judgment for management. The Group determines the allowance for credit losses on an individual basis for individually significant loans and receivables. In contrast, allowance for credit losses on loans and receivables that are not individually significant or are not specifically impaired are collectively determined. The identification of impairment and the determination of the recoverable amount involve various assumptions and factors such as the financial condition of the borrower, estimated future cash flows, observable market prices and estimated net selling prices of the collateral. The use of assumptions could produce significantly different estimates of provision for credit losses.
The disclosures in relation to credit losses are included in Notes 3, 6 and 16 to the financial statements.
Audit Response
For provision for credit losses calculated on an individual basis, we selected a sample of impaired loans and obtained an understanding of the borrower’s business and financial capacity. We also tested the assumptions underlying the impairment identification and quantification of the provision for credit losses. This was done by assessing whether the forecasted cash flows are based on the borrower’s current financial condition, checking the payment history of the borrower including payments made subsequent to yearend, agreeing the value of the collateral to the appraisal reports, checking whether the discount rate represents the original effective interest rate (EIR) or the current EIR of the loan, and re-performing the impairment calculation.
INDEPENDENT AUDITORS’ REPORT

Financial Statements 109
For provision for credit losses calculated on a collective basis, we tested the underlying models and the inputs to those models, such as historical loss rates. This was done by agreeing the details of the loan information used in the calculation of loss rates to the Group’s records and subsidiary ledgers, validating the delinquency age buckets of the loans and loan groupings and re-performing the calculation of the provision for credit losses.
Impairment testing of goodwill
Under PFRS, the Group and the Parent Company are required to annually test the amount of goodwill for impairment. As of December 31, 2017, the goodwill recognized in the consolidated and parent company financial statements amounting to P222.84 million is attributed to the Parent Company’s Retail Banking Business (RBB) segment, while goodwill of P616.91 million in the consolidated financial statements is attributed to the subsidiary bank, China Bank Savings, Inc. (CBSI). The impairment assessment process requires significant judgment and is based on assumptions, specifically loan and deposit growth rates, discount rate and the terminal value growth rate.
The Group’s disclosures about goodwill are included in Notes 3, 11 and 14 to the financial statements.
Audit Response
We involved our internal specialist in evaluating the methodologies and the assumptions used. These assumptions include loan and deposit growth rates, discount rate and the terminal value growth rate. We compared the key assumptions used, such as loan and deposit growth rates against the historical performance of the RBB and CBSI, industry/market outlook and other relevant external data. We tested the parameters used in the determination of the discount rate against market data. We also reviewed the Group’s disclosures about those assumptions to which the outcome of the impairment test is most sensitive; specifically those that have the most significant effect on the determination of the recoverable amount of goodwill.
Applicable to the audit of the Consolidated Financial Statements
Recoverability of deferred tax assets
The Group has recognized and unrecognized deferred taxes. The recoverability of deferred tax assets recognized depends on the Group’s ability to continuously generate sufficient future taxable income. The analysis of the recoverability of deferred tax assets was significant to our audit because the assessment process is complex and judgmental, and is based on assumptions that are affected by expected future market or economic conditions and the expected performance of the Group.
The disclosures in relation to deferred income taxes are included in Notes 3 and 27 to the financial statements.
Audit Response
We reviewed the management’s assessment on the availability of future taxable income in reference to financial forecast and tax strategies. We evaluated management’s forecast by comparing loan portfolio and deposit growth rates with that of the industry and the historical performance of the Group. We also reviewed the timing of the reversal of future taxable and deductible temporary differences.
Other Information
Management is responsible for the other information. The other information comprises the information included in the SEC Form 20-IS (Definitive Information Statement), SEC Form 17A and Annual Report for the year ended December 31, 2017, but does not include the consolidated and parent company financial statements and our auditor’s report thereon. The SEC Form 20-IS (Definitive Information Statement), SEC Form 17A and Annual Report for the year ended December 31, 2017 are expected to be made available to us after the date of this auditor’s report.
Our opinion on the consolidated and parent company financial statements does not cover the other information and we will not express any form of assurance conclusion thereon.
In connection with our audits of the consolidated and parent company financial statements, our responsibility is to read the other information identified above when it becomes available and, in doing so, consider whether the other information is materially inconsistent with the consolidated and parent company financial statements or our knowledge obtained in the audits, or otherwise appears to be materially misstated.
Responsibilities of Management and Those Charged with Governance for the Consolidated and Parent Company Financial Statements
Management is responsible for the preparation and fair presentation of the consolidated and parent company financial statements in accordance with PFRSs, and for such internal control as management determines is necessary to enable the preparation of consolidated and parent company financial statements that are free from material misstatement, whether due to fraud or error.
In preparing the consolidated and parent company financial statements, management is responsible for assessing the Group’s and Parent Company’s ability to continue as a going concern, disclosing, as applicable, matters related to going concern and using the going concern basis of accounting unless management either intends to liquidate the Group and the Parent Company or to cease operations, or has no realistic alternative but to do so.
Those charged with governance are responsible for overseeing the Group’s and Parent Company’s financial reporting process.

China Bank Annual Financial and Sustainability Report 2017110
Auditor’s Responsibilities for the Audit of the Consolidated and Parent Company Financial Statements
Our objectives are to obtain reasonable assurance about whether the consolidated and parent company financial statements as a whole are free from material misstatement, whether due to fraud or error, and to issue an auditor’s report that includes our opinion. Reasonable assurance is a high level of assurance, but is not a guarantee that an audit conducted in accordance with PSAs will always detect a material misstatement when it exists. Misstatements can arise from fraud or error and are considered material if, individually or in the aggregate, they could reasonably be expected to influence the economic decisions of users taken on the basis of these consolidated and parent company financial statements.
As part of an audit in accordance with PSAs, we exercise professional judgment and maintain professional skepticism throughout the audit. We also:
• Identify and assess the risks of material misstatement of the consolidated and parent company financial statements, whether due to fraud or error, design and perform audit procedures responsive to those risks, and obtain audit evidence that is sufficient and appropriate to provide a basis for our opinion. The risk of not detecting a material misstatement resulting from fraud is higher than for one resulting from error, as fraud may involve collusion, forgery, intentional omissions, misrepresentations, or the override of internal control.
• Obtain an understanding of internal control relevant to the audit in order to design audit procedures that are appropriate in the circumstances, but not for the purpose of expressing an opinion on the effectiveness of the Group’s and Parent Company’s internal control.
• Evaluate the appropriateness of accounting policies used and the reasonableness of accounting estimates and related disclosures made by management.
• Conclude on the appropriateness of management’s use of the going concern basis of accounting and, based on the audit evidence obtained, whether a material uncertainty exists related to events or conditions that may cast significant doubt on the Group’s and Parent Company’s ability to continue as a going concern. If we conclude that a material uncertainty exists, we are required to draw attention in our auditor’s report to the related disclosures in the consolidated and parent company financial statements or, if such disclosures are inadequate, to modify our opinion. Our conclusions are based on the audit evidence obtained up to the date of our auditor’s report. However, future events or conditions may cause the Group and the Parent Company to cease to continue as a going concern.
• Evaluate the overall presentation, structure and content of the consolidated and parent company financial statements, including the disclosures, and whether the consolidated and parent company financial statements represent the underlying transactions and events in a manner that achieves fair presentation.
• Obtain sufficient appropriate audit evidence regarding the financial information of the entities or business activities within the Group to express an opinion on the consolidated financial statements. We are responsible for the direction, supervision and performance of the audit. We remain solely responsible for our audit opinion.
We communicate with those charged with governance regarding, among other matters, the planned scope and timing of the audit and significant audit findings, including any significant deficiencies in internal control that we identify during our audit.
We also provide those charged with governance with a statement that we have complied with relevant ethical requirements regarding independence, and to communicate with them all relationships and other matters that may reasonably be thought to bear on our independence, and where applicable, related safeguards.
From the matters communicated with those charged with governance, we determine those matters that were of most significance in the audit of the consolidated and parent company financial statements of the current period and are therefore the key audit matters. We describe these matters in our auditor’s report unless law or regulation precludes public disclosure about the matter or when, in extremely rare circumstances, we determine that a matter should not be communicated in our report because the adverse consequences of doing so would reasonably be expected to outweigh the public interest benefits of such communication.
Report on the Supplementary Information Required Under Revenue Regulations 152010
Our audits were conducted for the purpose of forming an opinion on the basic financial statements taken as a whole. The supplementary information required under Revenue Regulations 152010 in Note 37 to the financial statements is presented for purposes of filing with the Bureau of Internal Revenue and is not a required part of the basic financial statements. Such information is the responsibility of the management of China Banking Corporation. The information has been subjected to the auditing procedures applied in our audit of the basic financial statements. In our opinion, the information is fairly stated, in all material respects, in relation to the basic financial statements taken as a whole.
The engagement partner on the audit resulting in this independent auditor’s report is Ray Francis C. Balagtas.
SYCIP GORRES VELAYO & CO.
Ray Francis C. BalagtasPartnerCPA Certificate No. 108795SEC Accreditation No. 1510-A (Group A), October 1, 2015, valid until September 30, 2018Tax Identification No. 216-950-288BIR Accreditation No. 08-001998-107-2015, March 4, 2015, valid until March 3, 2018PTR No. 6621226, January 9, 2018, Makati City
February 28, 2018
INDEPENDENT AUDITORS’ REPORT

Financial Statements 111
Consolidated Parent CompanyDecember 31
2017 2016 2017 2016ASSETSCash and Other Cash Items P12,685,984 P12,010,543 P11,160,173 P10,580,748Due from Bangko Sentral ng Pilipinas (Notes 7 and 17) 98,490,014 91,964,495 91,717,037 85,307,128Due from Other Banks (Notes 7 and 18) 15,641,476 11,332,236 14,066,620 9,689,165Securities Purchased under Resale Agreements (Note 8) 18,751,845 3,451,543 17,347,522 2,958,465Financial Assets at Fair Value through Profit or Loss (Note 9) 16,238,888 7,703,899 16,056,823 7,232,882Available-for-Sale Financial Assets (Note 9) 46,445,391 33,873,723 42,937,083 31,153,750Held-to-Maturity Financial Assets (Note 9) 65,286,267 57,404,800 61,533,493 54,069,021Loans and Receivables (Notes 10 and 29) 448,970,942 386,827,300 386,554,498 329,069,859Accrued Interest Receivable 3,718,505 3,014,529 3,189,083 2,666,353Investment in Subsidiaries (Note 11) – – 13,560,733 12,169,037Investment in Associates (Note 11) 329,422 276,559 329,422 276,559Bank Premises, Furniture, Fixtures and Equipment (Note 12) 6,875,864 6,496,268 5,464,582 5,143,981 Investment Properties (Note 13) 5,072,156 5,349,739 1,550,503 1,760,876Deferred Tax Assets (Note 27) 1,778,081 1,666,267 1,297,271 1,508,150Intangible Assets (Notes 11 and 14) 4,104,032 4,089,715 800,861 805,582Goodwill (Notes 11 and 14) 839,748 839,748 222,841 222,841Other Assets (Note 15) 6,218,895 6,896,647 3,481,225 4,504,100
P751,447,510 P633,198,011 P671,269,770 P559,118,497
LIABILITIES AND EQUITYLiabilitiesDeposit Liabilities (Notes 17 and 29)Demand P154,286,415 P135,263,113 P138,929,906 P122,265,663Savings 188,723,947 141,155,766 179,593,323 132,772,300Time 292,083,031 265,164,139 240,712,750 215,924,029
635,093,393 541,583,018 559,235,979 470,961,992Bills Payable (Note 18) 20,118,031 16,954,998 20,118,031 16,954,998Manager’s Checks 2,441,042 2,029,778 1,709,248 1,445,585Income Tax Payable 362,041 437,303 339,155 354,212Accrued Interest and Other Expenses (Note 19) 2,627,619 1,868,190 2,283,948 1,561,351Derivative Liabilities (Note 25) 267,533 243,198 267,533 243,198Deferred Tax Liabilities (Note 27) 1,161,653 1,161,414 – –Other Liabilities (Notes 20 and 23) 5,720,701 5,533,908 3,665,115 4,205,745
667,792,013 569,811,807 587,619,009 495,727,081EquityEquity Attributable to Equity Holders of the Parent CompanyCapital stock (Note 23) 26,847,717 20,020,278 26,847,717 20,020,278Capital paid in excess of par value (Note 23) 17,096,228 6,987,564 17,096,228 6,987,564Surplus reserves (Notes 23 and 28) 926,689 861,630 926,689 861,630Surplus (Notes 23 and 28) 40,360,563 36,889,099 40,360,563 36,889,099Net unrealized losses on available-for-sale financial assets (Note 9) (1,813,280) (1,598,600) (1,813,280) (1,598,600)Remeasurement gain on defined benefit asset (Note 24) 283,763 253,945 283,763 253,945Cumulative translation adjustment (38,698) (22,500) (38,698) (22,500)Remeasurement loss on life insurance reserves (12,221) – (12,221) –
83,650,761 63,391,416 83,650,761 63,391,416Non-controlling Interest 4,736 (5,212) – –
83,655,497 63,386,204 83,650,761 63,391,416P751,447,510 P633,198,011 P671,269,770 P559,118,497
See accompanying Notes to Financial Statements.
BALANCE SHEETS(Amounts in Thousands)

China Bank Annual Financial and Sustainability Report 2017112
Consolidated Parent CompanyYears Ended December 31
2017 2016 2015 2017 2016 2015INTEREST INCOMELoans and receivables (Notes 10 and 29) P21,751,647 P17,889,252 P15,900,727 P17,537,017 P14,122,287 P12,324,959Trading and investments (Note 9) 3,966,999 3,282,963 3,100,802 3,673,802 3,060,325 2,946,914Due from Bangko Sentral ng Pilipinas and
other banks and securities purchased under resale agreements (Notes 7 and 8) 820,699 719,414 315,805 634,906 555,788 182,662
26,539,345 21,891,629 19,317,334 21,845,725 17,738,400 15,454,535INTEREST EXPENSEDeposit liabilities (Notes 17 and 29) 6,521,935 4,831,555 4,008,288 5,210,803 3,629,127 2,881,166Bills payable and other borrowings (Note 18) 391,007 365,879 223,862 391,007 354,961 184,280
6,912,942 5,197,434 4,232,150 5,601,810 3,984,088 3,065,446NET INTEREST INCOME 19,626,403 16,694,195 15,085,184 16,243,915 13,754,312 12,389,089Service charges, fees and commissions (Note 21) 2,441,724 2,123,469 1,834,318 1,394,998 1,319,448 1,456,140Gain on sale of investment properties 670,612 443,315 375,754 614,587 338,088 353,249Trading and securities gain - net (Notes 9 and 21) 479,960 918,089 466,834 399,760 852,870 459,996Foreign exchange gain - net (Note 25) 386,015 318,135 330,056 389,692 299,113 306,541Trust fee income (Note 28) 376,312 330,197 276,240 371,947 326,091 272,251Gain on asset foreclosure and dacion transactions
(Note 13) 157,415 172,480 274,978 71,888 140,747 150,177Share in net income (losses) of subsidiaries (Note 11) – – – 836,004 464,999 (201,901)Share in net income (losses) of an associate (Note 11) 73,133 (89,384) (37,893) 73,133 (89,384) (37,893)Miscellaneous (Notes 21 and 29) 1,516,523 878,445 966,855 1,391,657 800,097 891,953TOTAL OPERATING INCOME 25,728,097 21,788,941 19,572,326 21,787,581 18,206,381 16,039,602Compensation and fringe benefits (Notes 24 and 29) 5,708,948 4,982,934 4,674,469 4,288,096 3,752,229 3,532,596Taxes and licenses 2,264,025 2,000,404 1,587,118 1,819,331 1,573,887 1,252,878Occupancy cost (Notes 26 and 29) 2,112,602 1,830,675 1,723,277 1,528,876 1,281,107 1,207,677Insurance 1,440,153 1,163,507 990,788 1,241,575 991,179 827,026Depreciation and amortization (Notes 12, 13 and 14) 1,217,489 1,124,786 979,412 877,240 775,210 676,286Provision for impairment and credit losses (Note 16) 754,171 850,546 966,574 423,922 521,475 487,485Transportation and traveling 378,703 298,666 311,587 289,903 218,136 222,276Professional fees, marketing and other related services 312,042 268,394 245,760 222,509 182,275 187,773Entertainment, amusement and recreation 287,105 242,710 276,809 182,172 146,993 156,289Stationery, supplies and postage 268,901 241,786 241,151 197,567 193,232 150,956Repairs and maintenance 104,298 123,025 160,902 69,276 87,734 102,882Miscellaneous (Notes 21 and 29) 1,867,552 1,073,986 1,001,934 1,490,658 941,489 800,742TOTAL OPERATING EXPENSES 16,715,989 14,201,419 13,159,781 12,631,125 10,664,946 9,604,866INCOME BEFORE INCOME TAX 9,012,108 7,587,522 6,412,545 9,156,456 7,541,435 6,434,736PROVISION FOR INCOME TAX (Note 27) 1,489,177 1,126,552 809,969 1,642,484 1,083,139 828,070NET INCOME P7,522,931 P6,460,970 P5,602,576 P7,513,972 P6,458,296 P5,606,666Attributable to: Equity holders of the Parent Company (Note 32) P7,513,972 P6,458,296 P5,606,666 Non-controlling interest 8,959 2,674 (4,090)
P7,522,931 P6,460,970 P5,602,576Basic/Diluted Earnings Per Share (Note 32) P2.91 P2.88 P2.50*
* Weighted average number of outstanding common shares in 2016 and 2015 was recomputed after giving retroactive effect to stock rights and stockdividends distributed in 2017 (Note 23).See accompanying Notes to Financial Statements.
STATEMENTS OF INCOME(Amounts in Thousands)

Financial Statements 113
Consolidated Parent CompanyYears Ended December 31
2017 2016 2015 2017 2016 2015
NET INCOME P7,522,931 P6,460,970 P5,602,576 P7,513,972 P6,458,296 P5,606,666OTHER COMPREHENSIVE INCOME (LOSS)Items that recycle to profit or loss in subsequent
periods: Changes in fair value of available-for-sale financial
assets: Fair value gain (loss) for the year, net of tax 158,946 449,110 (487,124) 113,020 512,562 (464,471) Gains taken to profit or loss (Note 21) (365,145) (918,673) (638,723) (342,146) (856,031) (629,642) Share in changes in other comprehensive income of
an associate (Note 11) (8,049) (5,457) (123,397) (8,049) (5,457) (123,397)Share in changes in other comprehensive income of
subsidiaries (Note 11) – – – 55,692 (87,594) (56,844) Cumulative translation adjustment (15,972) 12,455 (14,242) (29,255) (3,636) (14,914)Items that do not recycle to profit or loss in
subsequent periods:Remeasurement gain (loss) on defined benefit asset,
net of tax (Note 24) 30,149 71,075 (16,734) 9,678 50,560 10,030Remeasurement loss on life insurance reserves (12,221) – – (12,221) – –
OTHER COMPREHENSIVE LOSS FOR THE YEAR, NET OF TAX (212,292) (391,490) (1,280,220) (213,281) (389,596) (1,279,238)
TOTAL COMPREHENSIVE INCOME FOR THE YEAR P7,310,639 P6,069,480 P4,322,356 P7,300,691 P6,068,700 P4,327,428Total comprehensive income attributable to: Equity holders of the Parent Company P7,300,691 6,068,700 4,327,428 Non-controlling interest 9,948 780 (5,072)
P7,310,639 6,069,480 4,322,356
See accompanying Notes to Financial Statements.
STATEMENTS OF COMPREHENSIVE INCOME(Amounts in Thousands)

China Bank Annual Financial and Sustainability Report 2017114
ConsolidatedEquity Attributable to Equity Holders of the Parent Company
Capital Stock (Note 23)
Capital Paid in Excess of Par Value
(Note 23)
Surplus Reserves
(Notes 23 and 28) Surplus
(Notes 23 and 28)
Net Unrealized Gains (Losses) on Available- for-Sale Financial Assets
(Note 9)
Remeasurement Gain on Defined Benefit Asset or Liability
(Note 24)
Cumulative Translation Adjustment
Remeasurement Loss on Life Insurance Reserve Total Equity
Non- Controlling Interest
(Note 11) Total EquityBalance at January 1, 2017 P20,020,278 P6,987,564 P861,630 P36,889,099 (P1,598,600) P253,945 (P22,500) P– P63,391,416 (P5,212) P63,386,204Transfer from surplus to surplus reserves – – 65,059 (65,059) – – – – – – –Total comprehensive income (loss) for the year – – – 7,513,972 (214,680) 29,818 (16,198) (12,221) 7,300,691 9,948 7,310,639Issuance of common shares (P31.00 per share) 4,838,710 10,160,753 – – – – – – 14,999,463 – 14,999,463Transaction cost on the issuance of common shares – (52,089) – – – – – – (52,089) – (52,089)Stock dividends - 8.00% 1,988,729 – – (1,988,729) – – – – – – –Cash dividends - P0.80 per share – – – (1,988,720) – – – – (1,988,720) – (1,988,720)Balance at December 31, 2017 P26,847,717 P17,096,228 P926,689 P40,360,563 (P1,813,280) P283,763 (P38,698) (P12,221) P83,650,761 P4,736 P83,655,497Balance at January 1, 2016 P18,537,285 P6,987,564 P828,406 P33,800,748 (P1,126,080) P183,155 (P34,634) P– P59,176,444 (P5,540) P59,170,904Total comprehensive income (loss) for the year – – – 6,458,296 (472,520) 70,790 12,134 – 6,068,700 780 6,069,480Additional acquisition of non-controlling interest – – – – – – – – – (452) (452)Transfer from surplus to surplus reserves – – 33,224 (33,224) – – – – – – –Stock dividends - 8.00% 1,482,993 – – (1,482,993) – – – – – – – Cash dividends - P1.00 per share – – – (1,853,728) – – – – (1,853,728) – (1,853,728)Balance at December 31, 2016 P20,020,278 P6,987,564 P861,630 P36,889,099 (P1,598,600) P253,945 (P22,500) P– P63,391,416 (P5,212) P63,386,204Balance at January 1, 2015 P17,164,143 P6,987,564 P800,006 P31,312,038 P122,920 P199,152 (P20,392) P– P56,565,431 P2,053 P56,567,483Total comprehensive income (loss) for the year – – – 5,606,666 (1,249,000) (15,997) (14,242) – 4,327,427 (5,072) 4,322,356Additional acquisition of non-controlling interest – (2,521) (2,521)Transfer from surplus to surplus reserves – – 28,400 (28,400) – – – – – – –Stock dividends - 8.00% 1,373,142 – – (1,373,142) – – – – – – –Cash dividends - P1.00 per share – – – (1,716,414) – – – – (1,716,414) (1,716,414)Balance at December 31, 2015 P18,537,285 P6,987,564 P828,406 P33,800,748 (P1,126,080) P183,155 (P34,634) P– P59,176,444 (P5,540) P59,170,904
See accompanying Notes to Financial Statements.
Parent Company
Capital Stock (Note 23)
Capital Paid in Excess of Par Value (Note 23)
Surplus Reserves (Notes 23 and 28)
Surplus (Notes 23 and 28)
Net Unrealized Gains (Losses) on Available-for- Sale Financial Assets (Note 9)
Remeasurement Gain on Defined Benefit Asset or Liability
(Note 24)
Cumulative Translation Adjustment
Remesasurement Loss on Life Insurance Reserve Total Equity
Balance at January 1, 2017 P20,020,278 P6,987,564 P861,630 P,889,099 (P1,598,600) P253,945 (P22,500) P– P63,391,416Transfer from surplus to surplus reserves – – 65,059 (65,059) – – – – –Total comprehensive income (loss) for the year – – – 7,513,972 (214,680) 29,818 (16,198) (12,221) 7,300,691Issuance of common shares (31.00 per share) 4,838,710 10,160,753 – – – – – – 14,999,463Transaction cost on the issuance of common shares – (52,089) – – – – – – (52,089)Stock dividends - 8.00% 1,988,729 – – (1,988,729) – – – – –Cash dividends - P0.80 per share – – – (1,988,720) – – – – (1,988,720)Balance at December 31, 2017 P26,847,717 P17,096,228 P926,689 P40,360,563 (P1,813,280) P283,763 (P38,698) (P12,221) P83,650,761Balance at January 1, 2016 P18,537,285 P6,987,564 P828,406 P33,800,748 (P1,126,080) 183,155 (34,634) – 59,176,444Total comprehensive income (loss) for the year – – – 6,458,296 (472,520) 70,790 12,134 – 6,068,700Transfer from surplus to surplus reserves – – 33,224 (33,224) – – – – –Stock dividends - 8.00% 1,482,993 – – (1,482,993) – – – – –Cash dividends - P1.00 per share – – – (1,853,728) – – – – (1,853,728)Balance at December 31, 2016 P20,020,278 P6,987,564 P861,630 P36,889,099 (P1,598,600) P253,945 (P22,500) P– P63,391,416Balance at January 1, 2015 P17,164,143 P6,987,564 P800,006 P31,312,038 122,920 199,152 (20,392) – 56,565,431Total comprehensive income (loss) for the year – – – 5,606,666 (1,249,000) (15,997) (14,242) – 4,327,427Transfer from surplus to surplus reserves – – 28,400 (28,400) – – – – –Stock dividends - 8.00% 1,373,142 – – (1,373,142) – – – – –Cash dividends - P1.00 per share – – – (1,716,414) – – – – (1,716,414)Balance at December 31, 2015 P18,537,285 P6,987,564 P828,406 P33,800,748 (P1,126,080) P183,155 (P34,634) P– P59,176,444
See accompanying Notes to Financial Statements.
STATEMENTS OF CHANGES IN EQUITY(Amounts in Thousands)

Financial Statements 115
ConsolidatedEquity Attributable to Equity Holders of the Parent Company
Capital Stock (Note 23)
Capital Paid in Excess of Par Value
(Note 23)
Surplus Reserves
(Notes 23 and 28) Surplus
(Notes 23 and 28)
Net Unrealized Gains (Losses) on Available- for-Sale Financial Assets
(Note 9)
Remeasurement Gain on Defined Benefit Asset or Liability
(Note 24)
Cumulative Translation Adjustment
Remeasurement Loss on Life Insurance Reserve Total Equity
Non- Controlling Interest
(Note 11) Total EquityBalance at January 1, 2017 P20,020,278 P6,987,564 P861,630 P36,889,099 (P1,598,600) P253,945 (P22,500) P– P63,391,416 (P5,212) P63,386,204Transfer from surplus to surplus reserves – – 65,059 (65,059) – – – – – – –Total comprehensive income (loss) for the year – – – 7,513,972 (214,680) 29,818 (16,198) (12,221) 7,300,691 9,948 7,310,639Issuance of common shares (P31.00 per share) 4,838,710 10,160,753 – – – – – – 14,999,463 – 14,999,463Transaction cost on the issuance of common shares – (52,089) – – – – – – (52,089) – (52,089)Stock dividends - 8.00% 1,988,729 – – (1,988,729) – – – – – – –Cash dividends - P0.80 per share – – – (1,988,720) – – – – (1,988,720) – (1,988,720)Balance at December 31, 2017 P26,847,717 P17,096,228 P926,689 P40,360,563 (P1,813,280) P283,763 (P38,698) (P12,221) P83,650,761 P4,736 P83,655,497Balance at January 1, 2016 P18,537,285 P6,987,564 P828,406 P33,800,748 (P1,126,080) P183,155 (P34,634) P– P59,176,444 (P5,540) P59,170,904Total comprehensive income (loss) for the year – – – 6,458,296 (472,520) 70,790 12,134 – 6,068,700 780 6,069,480Additional acquisition of non-controlling interest – – – – – – – – – (452) (452)Transfer from surplus to surplus reserves – – 33,224 (33,224) – – – – – – –Stock dividends - 8.00% 1,482,993 – – (1,482,993) – – – – – – – Cash dividends - P1.00 per share – – – (1,853,728) – – – – (1,853,728) – (1,853,728)Balance at December 31, 2016 P20,020,278 P6,987,564 P861,630 P36,889,099 (P1,598,600) P253,945 (P22,500) P– P63,391,416 (P5,212) P63,386,204Balance at January 1, 2015 P17,164,143 P6,987,564 P800,006 P31,312,038 P122,920 P199,152 (P20,392) P– P56,565,431 P2,053 P56,567,483Total comprehensive income (loss) for the year – – – 5,606,666 (1,249,000) (15,997) (14,242) – 4,327,427 (5,072) 4,322,356Additional acquisition of non-controlling interest – (2,521) (2,521)Transfer from surplus to surplus reserves – – 28,400 (28,400) – – – – – – –Stock dividends - 8.00% 1,373,142 – – (1,373,142) – – – – – – –Cash dividends - P1.00 per share – – – (1,716,414) – – – – (1,716,414) (1,716,414)Balance at December 31, 2015 P18,537,285 P6,987,564 P828,406 P33,800,748 (P1,126,080) P183,155 (P34,634) P– P59,176,444 (P5,540) P59,170,904
See accompanying Notes to Financial Statements.
Parent Company
Capital Stock (Note 23)
Capital Paid in Excess of Par Value (Note 23)
Surplus Reserves (Notes 23 and 28)
Surplus (Notes 23 and 28)
Net Unrealized Gains (Losses) on Available-for- Sale Financial Assets (Note 9)
Remeasurement Gain on Defined Benefit Asset or Liability
(Note 24)
Cumulative Translation Adjustment
Remesasurement Loss on Life Insurance Reserve Total Equity
Balance at January 1, 2017 P20,020,278 P6,987,564 P861,630 P,889,099 (P1,598,600) P253,945 (P22,500) P– P63,391,416Transfer from surplus to surplus reserves – – 65,059 (65,059) – – – – –Total comprehensive income (loss) for the year – – – 7,513,972 (214,680) 29,818 (16,198) (12,221) 7,300,691Issuance of common shares (31.00 per share) 4,838,710 10,160,753 – – – – – – 14,999,463Transaction cost on the issuance of common shares – (52,089) – – – – – – (52,089)Stock dividends - 8.00% 1,988,729 – – (1,988,729) – – – – –Cash dividends - P0.80 per share – – – (1,988,720) – – – – (1,988,720)Balance at December 31, 2017 P26,847,717 P17,096,228 P926,689 P40,360,563 (P1,813,280) P283,763 (P38,698) (P12,221) P83,650,761Balance at January 1, 2016 P18,537,285 P6,987,564 P828,406 P33,800,748 (P1,126,080) 183,155 (34,634) – 59,176,444Total comprehensive income (loss) for the year – – – 6,458,296 (472,520) 70,790 12,134 – 6,068,700Transfer from surplus to surplus reserves – – 33,224 (33,224) – – – – –Stock dividends - 8.00% 1,482,993 – – (1,482,993) – – – – –Cash dividends - P1.00 per share – – – (1,853,728) – – – – (1,853,728)Balance at December 31, 2016 P20,020,278 P6,987,564 P861,630 P36,889,099 (P1,598,600) P253,945 (P22,500) P– P63,391,416Balance at January 1, 2015 P17,164,143 P6,987,564 P800,006 P31,312,038 122,920 199,152 (20,392) – 56,565,431Total comprehensive income (loss) for the year – – – 5,606,666 (1,249,000) (15,997) (14,242) – 4,327,427Transfer from surplus to surplus reserves – – 28,400 (28,400) – – – – –Stock dividends - 8.00% 1,373,142 – – (1,373,142) – – – – –Cash dividends - P1.00 per share – – – (1,716,414) – – – – (1,716,414)Balance at December 31, 2015 P18,537,285 P6,987,564 P828,406 P33,800,748 (P1,126,080) P183,155 (P34,634) P– P59,176,444
See accompanying Notes to Financial Statements.

China Bank Annual Financial and Sustainability Report 2017116
Consolidated Parent CompanyYears Ended December 31
2017 2016 2015 2017 2016 2015CASH FLOWS FROM OPERATING ACTIVITIESIncome before income tax P9,012,108 P7,587,522 P6,412,545 P9,156,456 P7,541,435 P6,434,736Adjustments for:
Depreciation and amortization (Notes 12, 13 and 14) 1,217,489 1,124,786 979,412 877,240 775,210 676,286Provision for impairment and credit losses (Note 16) 754,171 850,546 966,574 423,922 521,745 487,485Trading and securities gain on available-for-sale and
held-to-maturity financial assets (Note 21) (365,145) (918,673) (638,723) (342,146) (856,031) (629,642)Gain on sale of investment properties (670,612) (443,315) (375,754) (614,587) (338,088) (353,249)Gain on asset foreclosure and dacion transactions
(Note 13) (157,415) (172,480) (274,978) (71,888) (140,747) (150,177)Share in net losses of an associate (Notes 2 and 11) (73,133) 89,384 37,893 (73,133) 89,384 37,893Share in net losses (income) of subsidiaries
(Notes 2 and 11) – – – (836,004) (464,999) 201,900 Changes in operating assets and liabilities: Decrease (increase) in the amounts of: Financial assets at FVPL (8,510,654) (1,282,482) 2,160,869 (8,799,606) (1,590,640) 2,511,781 Loans and receivables (63,393,487) (78,836,033) (21,441,441) (57,873,074) (70,542,734) (15,073,046) Other assets 6,159 (1,225,573) (444,632) 275,322 (882,576) (1,230,263) Increase (decrease) in the amounts of: Deposit liabilities 93,510,375 102,317,332 39,964,142 88,273,987 97,358,575 32,518,781 Manager’s checks 411,264 573,280 235,103 263,663 704,106 (80,700) Accrued interest and other expenses 759,429 283,916 (46,474) 722,597 300,356 (51,480) Other liabilities 177,618 827,790 1,070,312 (540,630) 759,981 1,262,845Net cash generated from operations 32,678,167 30,776,000 28,604,848 30,842,119 33,234,977 26,563,150Income taxes paid (1,554,045) (973,575) (507,801) (1,274,667) (863,477) (414,842)Net cash provided by operating activities 31,124,122 29,802,425 28,097,047 29,567,452 32,371,500 26,148,308CASH FLOWS FROM INVESTING ACTIVITIESAdditions to bank premises, furniture, fixtures and
equipment (Note 12) (1,752,173) (1,258,911) (1,493,982) (1,387,684) (1,065,308) (1,400,741)Additions to equity investments (Note 11) – – – (500,000) (2,700,452) (4,002,521)Liquidation of a subsidiary (Note 11) – – – – 50,000 –Purchases of: Held-to-maturity financial assets (23,618,560) (41,647,865) (4,490,149) (23,599,743) (41,007,909) (3,081,425) Available-for-sale financial assets (54,304,672) (89,249,294) (54,192,915) (53,171,027) (87,747,373) (53,870,729)Proceeds from sale/maturity of: Held-to-maturity financial assets 15,737,093 374,569 463,346 16,135,271 884,532 489,568 Available-for-sale financial assets 41,891,950 104,653,914 43,031,164 41,500,714 103,940,382 43,647,299
Investment properties 1,335,946 977,963 1,137,792 846,974 675,003 327,682 Bank premises, furniture, fixtures and equipment 275,109 151,286 567,758 242,202 199,460 571,677Net cash used in investing activities (20,435,307) (25,998,338) (14,976,986) (19,933,293) (26,771,665) (17,319,190)CASH FLOWS FROM FINANCING ACTIVITIESProceeds from bills payable 252,268,556 18,588,791 19,151,089 252,268,556 18,588,791 18,488,559Settlement of bills payable (249,105,524) (20,718,973) (6,386,489) (249,105,524) (20,056,443) (5,243,510)Settlement of subordinated debt (Note 18) – – (1,188,762) – – –Payments of cash dividends (Note 23) (1,988,720) (1,853,728) (1,716,414) (1,988,720) (1,853,728) (1,716,414)Acquisitions of non-controlling interest (Note 11) – (452) (2,521) – – –Proceeds from issuance of common shares (Note 23) 14,999,463 – – 14,999,463 – –Transaction cost on the issuance of common shares
(Note 23) (52,089) (52,089)Net cash provided by (used in) financing activities 16,121,687 (3,984,362) 9,856,903 16,121,687 (3,321,380) 11,528,635NET INCREASE (DECREASE) IN CASH AND
CASH EQUIVALENTS 26,810,502 (180,277) 22,976,964 25,755,846 2,278,455 20,357,753(Forward)
STATEMENTS OF CASH FLOWS(Amounts in Thousands)

Financial Statements 117
Consolidated Parent Company
Years Ended December 312017 2016 2015 2017 2016 2015
NET INCREASE (DECREASE) IN CASH AND CASH EQUIVALENTS P26,810,502 (P180,277) P22,976,964 P25,755,846 P2,278,455 P20,357,753
CASH AND CASH EQUIVALENTS AT BEGINNING OF YEAR
Cash and other cash items 12,010,543 11,377,101 10,734,059 10,580,748 10,052,891 9,295,130Due from Bangko Sentral ng Pilipinas (Note 7) 91,964,495 86,318,501 67,451,648 85,307,128 77,003,616 60,543,867Due from other banks (Note 7) 11,332,236 21,243,492 17,552,823 9,689,165 19,200,544 15,836,701Securities purchased under resale agreements (Note 8) 3,451,543 – 223,600 2,958,465 – 223,600
118,758,817 118,939,094 95,962,130 108,535,506 106,257,051 85,899,298CASH AND CASH EQUIVALENTS AT END OF YEARCash and other cash items 12,685,984 12,010,543 11,377,101 11,160,173 10,580,748 10,052,891Due from Bangko Sentral ng Pilipinas (Note 7) 98,490,014 91,964,495 86,318,501 91,717,037 85,307,128 77,003,616Due from other banks (Note 7) 15,641,476 11,332,236 21,243,492 14,066,620 9,689,165 19,200,544Securities purchased under resale agreements (Note 8) 18,751,845 3,451,543 – 17,347,522 2,958,465 –
P145,569,319 P118,758,817 P118,939,094 P134,291,352 P108,535,506 P106,257,051
OPERATING CASH FLOWS FROM INTEREST
Consolidated Parent CompanyAs of December 31
2017 2016 2015 2017 2016 2017Interest paid P6,652,755 P5,028,667 P4,240,401 P5,359,209 P3,812,560 P3,020,972Interest received 25,835,369 21,498,837 18,932,577 21,322,995 17,273,294 15,163,965
See accompanying Notes to Financial Statements.

China Bank Annual Financial and Sustainability Report 2017118
1. CORPORATE INFORMATION
China Banking Corporation (the Parent Company) is a publicly listed universal bank incorporated in the Philippines. The Parent Company acquired its universal banking license in 1991. It provides expanded commercial banking products and services such as deposit products, loans and trade finance, domestic and foreign fund transfers, treasury products, trust products, foreign exchange, corporate finance and other investment banking services through a network of 436 and 391 local branches as of December 31, 2017 and 2016, respectively.
The Parent Company acquired its original Certification of Incorporation issued by the Securities and Exchange Commission (SEC) on July 20, 1920. On December 4, 1963, the Board of Directors (BOD) of the Parent Company approved the Amended Articles of Incorporation to extend the corporate term of the Parent Company for another 50 years or until July 20, 2020, which was confirmed by the stockholders on December 23, 1963, and approved by the SEC on October 5, 1964. On March 2, 2016, the BOD approved the amendment of the Third Article of the Parent Company’s Articles of Incorporation, to further extend the corporate term for another 50 years from and after July 20, 2020, the expiry date of its extended term. The approval was ratified by the stockholders during their scheduled annual meeting on May 5, 2016. On November 7, 2016, the SEC issued the Certificate of Filing of Amended Articles of Incorporation, amending the Third Article thereof to extend the term of corporate existence of the Parent Company.
The Parent Company has the following subsidiaries:
Subsidiary
Effective Percentages ofOwnership Country of
Incorporation Principal Activities2017 2016Chinabank Insurance Brokers, Inc. (CIBI) 100.00% 100.00% Philippines Insurance brokerageCBC Properties and Computer Center, Inc. (CBC-PCCI) 100.00% 100.00% Philippines Computer servicesChina Bank Savings, Inc. (CBSI) 98.29% 98.29% Philippines Retail and consumer bankingChina Bank Capital Corporation (CBCC) 100.00% 100.00% Philippines Investment houseCBC Assets One (SPC) Inc.* 100.00% 100.00% Philippines Special purpose corporationChina Bank Securities Corporation (CBCSec)** 100.00% − Philippines Stock Brokerage
*Established in 2016, 100% owned through CBCC**Obtained control on March 6, 2017, 100% owned through CBCC (see note 11)
The Parent Company has no ultimate parent company. SM Investments Corporation, its significant investor, has effective ownership in the Parent Company of 19.90% as of December 31, 2017 and 2016.
The Parent Company’s principal place of business is at 8745 Paseo de Roxas cor. Villar St., Makati City.
2. SUMMARY OF SIGNIFICANT ACCOUNTING POLICIES
Basis of PreparationThe accompanying consolidated financial statements include the financial statements of the Parent Company and its subsidiaries (collectively referred to as “the Group”).
The accompanying financial statements have been prepared on a historical cost basis except for financial instruments at fair value through profit or loss (FVPL) and available-for-sale (AFS) financial assets. The financial statements are presented in Philippine peso, and all values are rounded to the nearest thousand peso except when otherwise indicated.
The financial statements of the Parent Company reflect the accounts maintained in the Regular Banking Unit (RBU) and Foreign Currency Deposit Unit (FCDU). The financial statements of these units are combined after eliminating inter-unit accounts.
Each entity in the Group determines its own functional currency and items included in the financial statements of each entity are measured using that functional currency. The functional currency of the Parent Company’s subsidiaries is the Philippine peso.
Statement of ComplianceThe financial statements of the Group and the Parent Company have been prepared in compliance with Philippine Financial Reporting Standards (PFRS).
Presentation of Financial StatementsThe balance sheets of the Group and of the Parent Company are presented in order of liquidity. An analysis regarding recovery of assets or settlement of liabilities within 12 months after the reporting date (current) and more than 12 months after the reporting date (non-current) is presented in Note 22.
NOTES TO FINANCIAL STATEMENTS

Financial Statements 119
Financial assets and financial liabilities are offset and the net amount reported in the balance sheets only when there is a legally enforceable right to offset the recognized amounts and there is an intention to settle on a net basis, or to realize the assets and settle the liability simultaneously. The Group and the Parent Company assess that they have currently enforceable right of offset if the right is not contingent on a future event, and is legally enforceable in the normal course of business, event of default, and event of insolvency or bankruptcy of the Group, the Parent Company and all of the counterparties.
Income and expenses are not offset in the statement of income unless required or permitted by any accounting standard or interpretation, and as specifically disclosed in the accounting policies of the Group and the Parent Company.
Basis of Consolidation and Investments in SubsidiariesThe consolidated financial statements of the Group are prepared for the same reporting year as the Parent Company, using consistent accounting policies. All significant intra-group balances, transactions and income and expenses resulting from intra-group transactions are eliminated in full.
Subsidiaries are consolidated from the date on which control is transferred to the Parent Company.The Group controls an investee if and only if the Group has:
• power over the investee (i.e., existing rights that give it the current ability to direct the relevant activities of the investee);• exposure, or rights, to variable returns from its involvement with the investee, and• the ability to use its power over the investee to affect its returns.
When the Group has less than a majority of the voting or similar rights of an investee, the Group considers all relevant facts and circumstances in assessing whether it has power over an investee, including:
• the contractual arrangement with the other vote holders of the investee• rights arising from other contractual arrangements• the Group’s voting rights and potential voting rights.
The Group re-assesses whether or not it controls an investee if facts and circumstances indicate that there are changes to one or more of the three elements of control. Consolidation of a subsidiary begins when the Group obtains control over the subsidiary and ceases when the Group loses control of the subsidiary. Assets, liabilities, income and expenses of a subsidiary acquired or disposed of during the year are included in the statement of comprehensive income from the date the Group gains control until the date the Group ceases to control the subsidiary. Profit or loss and each component of other comprehensive income (OCI) are attributed to the equity holders of the Group and to the non-controlling interests. When necessary, adjustments are made to the financial statements of the subsidiary to bring its accounting policies into line with the Group’s accounting policies. All intra-group assets and liabilities, equity, income, expenses and cash flows relating to transactions between members of the Group are eliminated in full on consolidation.
A change in the ownership interest of a subsidiary, without a loss of control, is accounted for as an equity transaction. If the Group loses control over a subsidiary, it:
• Derecognizes the assets (including goodwill) and liabilities of the subsidiary• Derecognizes the carrying amount of any non-controlling interest• Derecognizes the related OCI recorded in equity and recycle the same to profit or loss or surplus• Recognizes the fair value of the consideration received• Recognizes the fair value of any investment retained• Recognizes the remaining difference in profit or loss• Reclassifies the parent’s share of components previously recognized in OCI to profit or loss or retained earnings, as appropriate, as would
be recognized if the Group had directly disposed of the related assets or liabilities
Non-Controlling InterestNon-controlling interest represents the portion of profit or loss and net assets not owned, directly or indirectly, by the Parent Company.
Non-controlling interest is presented separately in the consolidated statement of income, consolidated statement of comprehensive income, and within equity in the consolidated balance sheet, separately from parent shareholders’ equity. Any losses applicable to the non-controlling interest are allocated against the interests of the non-controlling interest even if this results in the non-controlling interest having a deficit balance.

China Bank Annual Financial and Sustainability Report 2017120
Changes in Accounting Policies and Disclosures
The accounting policies adopted are consistent with those of the previous financial year except for the following new, amendments and improvements to PFRS, Philippine Accounting Standards (PAS) and Philippine Interpretation which became effective as of January 1, 2017. Except as otherwise indicated, these changes in the accounting policies did not have any significant impact on the financial position or performance of the Group:
• New and Amended Standards• Amendments to PAS 7, Statement of Cash Flows, Disclosure Initiative
On January 1, 2017, the Group adopted the amendments to PAS 7, Statement of Cash Flows, Disclosure Initiative. The amendments require an entity to provide disclosures that enable users of financial statements to evaluate changes in liabilities arising from financial activities, including both changes arising from cash flows and non-cash changes (such as foreign exchange gains or losses). On initial application of the amendments, entities are not required to provide comparative information to preceding periods.
The reconciliation analysis of liabilities arising from financing activities is presented in Note 34.
• Amendments to PAS 12, Income Taxes, Recognition of Deferred Tax Assets for Unrealized Losses
• Annual Improvements to PFRSs (2014 – 2016 Cycle)• Amendment to PFRS 12, Clarification of the Scope of the Standard
Significant Accounting Policies
Foreign Currency TranslationThe consolidated financial statements are presented in Philippine peso, which is the Parent Company’s functional currency.
Transactions and balancesThe books of accounts of the RBU are maintained in Philippine peso, the RBU’s functional currency, while those of the FCDU are maintained in United States (US) dollars (USD), the FCDU’s functional currency. For financial reporting purposes, the foreign currency-denominated monetary assets and liabilities in the RBU are translated in Philippine peso based on the Philippine Dealing System (PDS) closing rate prevailing at end of the year, and foreign currency-denominated income and expenses, at the exchange rates on transaction dates. Foreign exchange differences arising from restatements of foreign currency-denominated assets and liabilities are credited to or charged against operations in the period in which the rates change. Non-monetary items that are measured in terms of historical cost in a foreign currency are translated using the exchange rates as at the dates of the initial transactions. Non-monetary items measured at fair value in a foreign currency are translated using the exchange rates at the date when the fair value was determined.
FCDUAs at the reporting date, the assets and liabilities of the FCDU are translated into the Parent Company’s presentation currency (the Philippine Peso) at the PDS closing rate prevailing at the reporting date, and its income and expenses are translated at the PDSWAR for the year. Exchange differences arising on translation are taken directly to the statement of comprehensive income under ‘Cumulative translation adjustment’. Upon actual remittance or transfer of the FCDU income to RBU, the related exchange difference arising from translation lodged under ‘Cumulative translation adjustment’ is recognized in the statement of income of the RBU books.
Fair Value MeasurementThe Group measures financial instruments, such as financial instruments at FVPL and AFS financial assets at fair value at each reporting date. Also, fair values of financial instruments measured at amortized cost are disclosed in Note 5.
Fair value is the price that would be received to sell an asset or paid to transfer a liability in an orderly transaction between market participants at the measurement date. The fair value measurement is based on the presumption that the transaction to sell the asset or transfer the liability takes place either:
• in the principal market for the asset or liability, or• in the absence of a principal market, in the most advantageous market for the asset or liability.
The principal or the most advantageous market must be accessible by the Group. The fair value of an asset or a liability is measured using the assumptions that market participants would use when pricing the asset or liability, assuming that market participants act in their economic best interest.
If an asset or a liability measured at fair value has a bid price and an ask price, the price within the bid - ask spread that is most representative of fair value in the circumstances shall be used to measure fair value regardless of where the input is categorized within the fair value hierarchy.

Financial Statements 121
A fair value measurement of a non-financial asset takes into account a market participant’s ability to generate economic benefits by using the asset in its highest and best use or by selling it to another market participant that would use the asset in its highest and best use.
The Group uses valuation techniques that are appropriate in the circumstances and for which sufficient data are available to measure fair value, maximizing the use of relevant observable inputs and minimizing the use of unobservable inputs.
All assets and liabilities for which fair value is measured or disclosed in the financial statements are categorized within the fair value hierarchy, described as follows, based on the lowest level input that is significant to the fair value measurement as a whole:
• Level 1 - Quoted (unadjusted) market prices in active markets for identical assets or liabilities• Level 2 - Valuation techniques for which the lowest level input that is significant to the fair value measurement is directly or indirectly
observable• Level 3 - Valuation techniques for which the lowest level input that is significant to the fair value measurement is unobservable
For assets and liabilities that are recognized in the financial statements on a recurring basis, the Group determines whether transfers have occurred between Levels in the hierarchy by re-assessing categorization (based on the lowest level input that is significant to the fair value measurement as a whole) at the end of each reporting period.
Cash and Cash EquivalentsFor purposes of reporting cash flows, cash and cash equivalents include cash and other cash items, due from BSP and other banks, and securities purchased under resale agreement (SPURA) that are convertible to known amounts of cash which have original maturities of three months or less from dates of placements an d that are subject to an insignificant risk of changes in value. Due from BSP includes the statutory reserves required by the BSP which the Group considers as cash equivalents wherein withdrawals can be made to meet the Group’s cash requirements as allowed by the BSP.
Securities Purchased under Resale Agreement Securities purchased under agreements to resell at a specified future date (‘reverse repos’) are not recognized in the balance sheet. The corresponding cash paid including accrued interest, is recognized in the balance sheet as SPURA. The difference between the purchase price and resale price is treated as interest income and is accrued over the life of the agreement using the EIR method.
Financial Instruments - Initial Recognition and Subsequent MeasurementDate of recognitionPurchases or sales of financial assets, except for derivative instruments, that require delivery of assets within the time frame established by regulation or convention in the marketplace are recognized on the settlement date. Settlement date accounting refers to (a) the recognition of an asset on the day it is received by the Group, and (b) the derecognition of an asset and recognition of any gain or loss on disposal on the day that such asset is delivered by the Group. Any change in fair value of unrecognized financial asset is recognized in the statement of income for assets classified as financial assets at FVPL, and in equity for assets classified as AFS financial assets. Derivatives are recognized on a trade date basis. Deposits, amounts due to banks and customers loans and receivables are recognized when cash is received by the Group or advanced to the borrowers.
Initial recognition of financial instrumentsAll financial instruments are initially recognized at fair value. Except for financial assets and financial liabilities at FVPL, the initial measurement of financial instruments includes transaction costs. The Group classifies its financial assets in the following categories: financial assets at FVPL, held-to-maturity (HTM) financial assets, AFS financial assets, and loans and receivables while financial liabilities are classified as financial liabilities at FVPL and financial liabilities carried at amortized cost. The classification depends on the purpose for which the investments were acquired and whether they are quoted in an active market. Management determines the classification of its investments at initial recognition and, where allowed and appropriate, re-evaluates such designation at every reporting date.
‘Day 1’ differenceWhere the transaction price in a non-active market is different with the fair value from other observable current market transactions in the same instrument or based on a valuation technique whose variables include only data from observable market, the Group recognizes the difference between the transaction price and fair value (a ‘Day 1’ difference) in the statement of income. In cases where the transaction price used is made of data which is not observable, the difference between the transaction price and model value is only recognized in the statement of income when the inputs become observable or when the instrument is derecognized. For each transaction, the Group determines the appropriate method of recognizing the ‘Day 1’ difference amount.
Financial instruments at FVPLFinancial instruments at FVPL include financial assets and liabilities held for trading purposes, financial assets and financial liabilities designated upon initial recognition as at FVPL, and derivative instruments.
Financial instruments held for tradingFinancial instruments held for trading (HFT) include government and corporate debt securities purchased and held principally with the intention of selling them in the near term. These securities are carried at fair value, and realized and unrealized gains and losses on these instruments are recognized as ‘Trading and securities gain - net’ in the statement of income. Interest earned or incurred on financial instruments held for trading is reported in the statement of income under ‘Interest income’ (for financial assets) and ‘Interest expense’ (for financial liabilities).

China Bank Annual Financial and Sustainability Report 2017122
Financial instruments designated at FVPLFinancial instruments are designated as at FVPL by management on initial recognition when any of the following criteria is met:
• the designation eliminates or significantly reduces the inconsistent treatment that would otherwise arise from measuring the assets or liabilities or recognizing gains or losses on them on a different basis; or
• the assets and liabilities are part of a group of financial assets, financial liabilities or both which are managed and their performance evaluated on a fair value basis, in accordance with a documented risk management or investment strategy; or
• the financial instrument contains an embedded derivative, unless the embedded derivative does not significantly modify the cash flows or it is clear, with little or no analysis, that it would not be separately recorded.
Financial instruments at FVPL are recorded in the balance sheet at fair value. Changes in fair value are recognized in ‘Trading and securities gain - net’ in the statement of income. Interest earned or incurred is reported in the statement of income under ‘Interest income’ or ‘Interest expense’, respectively, while dividend income is reported in the statement of income under ‘Miscellaneous income’ when the right to receive payment has been established.
As of December 31, 2017 and 2016, financial assets designated as at FVPL consist of instruments in shares of stocks.
Derivative instrumentsThe Parent Company is a party to derivative instruments, particularly, forward exchange contracts, interest rate swaps (IRS) and warrants. These contracts are entered into as a service to customers and as a means of reducing and managing the Parent Company’s foreign exchange risk, and interest rate risk as well as for trading purposes, but are not designated as hedges. Such derivative financial instruments are stated at fair value through profit or loss.
Any gains or losses arising from changes in fair value of derivative instruments that do not qualify for hedge accounting are taken directly to the statement of income under ‘Foreign exchange gain (loss) - net’ for forward exchange contracts and ‘Trading and securities gain-net’ for IRS and warrants.
Embedded derivatives that are bifurcated from the host financial and non-financial contracts are also accounted for as financial instruments at FVPL.
An embedded derivative is separated from the host contract and accounted for as a derivative if all of the following conditions are met: (a) the economic characteristics and risks of the embedded derivative are not closely related to the economic characteristic of the host contract; (b) a separate instrument with the same terms as the embedded derivative would meet the definition of a derivative; and (c) the hybrid or combined instrument is not recognized at fair value through profit or loss.
The Group assesses whether embedded derivatives are required to be separated from the host contracts when the Group first becomes a party to the contract. Reassessment of embedded derivatives is only done when there are changes in the contract that significantly modifies the contractual cash flows that would otherwise be required.
Held-to-maturity financial assetsHTM financial assets are quoted non-derivative financial assets with fixed or determinable payments and fixed maturities for which the Group’s management has the positive intention and ability to hold to maturity. Where the Group would sell other than an insignificant amount of HTM financial assets, the entire category would be tainted and reclassified as AFS financial assets and the Group would be prohibited from classifying any financial asset under HTM category during the current year and two succeeding years thereafter unless for sales or reclassifications that:• are so close to maturity or the financial asset’s call date (for example, less than three months before maturity) that changes in the market
rate of interest would not have a significant effect on the financial asset’s fair value;• occur after the entity has collected substantially all of the financial asset’s original principal through scheduled payments or prepayments;
or• are attributable to an isolated event that is beyond the entity’s control, is non-recurring and could not have been reasonably anticipated by
the entity.
After initial measurement, these investments are subsequently measured at amortized cost using the effective interest method, less any impairment in value. Amortized cost is calculated by taking into account any discount or premium on acquisition and fees that are an integral part of the effective interest rate (EIR). The amortization is included in ‘Interest income’ in the statement of income. Gains and losses are recognized in income when the HTM financial assets are derecognized and impaired, as well as through the amortization process. The losses arising from impairment of such investments are recognized in the statement of income under ‘Provision for impairment and credit losses’. The effects of translation of foreign currency-denominated HTM financial assets are recognized in the statement of income. This account consists of government and corporate debt securities.

Financial Statements 123
Loans and receivableThis accounting policy relates to the balance sheet captions ‘Due from BSP’, ‘Due from other banks’, ‘SPURA’, ‘Loans and receivables’, ‘Accrued interest receivable’, ‘Accounts receivable’, ‘Sales contract receivable’ (SCR), ‘Returned checks and other cash items’ (RCOCI), and ‘Miscellaneous financial assets’. These are financial assets with fixed or determinable payments that are not quoted in an active market, other than:
• those that the Group intends to sell immediately or in the near term and those that the Group, upon initial recognition, designates as FVPL;• those that the Group, upon initial recognition, designates as AFS; and • those for which the Group may not cover substantially all of its initial investment, other than because of credit deterioration.
After initial measurement, these are subsequently measured at amortized cost using the effective interest method, less allowance for impairment. Amortized cost is calculated by taking into account any discount or premium on acquisition and fees and costs that are an integral part of the EIR. The amortization is included under ‘Interest income’ in the statement of income. The losses arising from impairment are recognized under ‘Provision for impairment and credit losses’ in the statement of income.
Available-for-sale financial assetsAFS financial assets are those which are designated as such or do not qualify to be classified as financial assets at FVPL, HTM financial assets, or loans and receivables. They are purchased and held indefinitely, and may be sold in response to liquidity requirements or changes in market conditions. They include equity investments, money market papers and government and corporate debt securities.
After initial measurement, AFS financial assets are subsequently measured at fair value. The effective yield component of AFS debt securities, as well as the impact of translation of foreign currency-denominated AFS debt securities, is reported in the statement of income. The unrealized gains and losses arising from the fair valuation of AFS financial assets are excluded, net of tax, from reported earnings and are reported as ‘Net unrealized gains (losses) on AFS financial assets’ under OCI.
When the security is disposed of, the cumulative gain or loss previously recognized in OCI is recognized as ‘Trading and securities gain - net’ in the statement of income. Interest earned on holding AFS debt securities are reported as ‘Interest income’ using the EIR. Dividends earned on holding AFS equity instruments are recognized in the statement of income as ‘Miscellaneous income’ when the right to the payment has been established. The losses arising from impairment of such investments are recognized as ‘Provision for impairment and credit losses’ in the statement of income.
Other financial liabilitiesThese are issued financial instruments or their components which are not designated as at FVPL and where the substance of the contractual arrangement results in the Group having an obligation either to deliver cash or another financial asset to the holder, or to satisfy the obligation other than by the exchange of a fixed amount of cash or another financial asset for a fixed number of its own equity shares. The components of issued financial instruments that contain both liability and equity elements are accounted for separately, with the equity component being assigned the residual amount after deducting from the instrument as a whole the amount separately determined as the fair value of the liability component on the date of issue.
After initial measurement, other financial liabilities not qualified and not designated as at FVPL are subsequently measured at amortized cost using the effective interest method. Amortized cost is calculated by taking into account any discount or premium on the issue and fees that are an integral part of the EIR.
This accounting policy relates to the balance sheet captions ‘Deposit liabilities’, ‘Bills payable’, ‘Manager’s checks’, and financial liabilities presented under ‘Accrued interest and other expenses’ and ‘Other liabilities’.
Reclassification of Financial AssetsThe Group may reclassify, in rare circumstances, non-derivative financial assets out of the HFT investments category and into the AFS financial assets, Loans and Receivables or HTM financial assets categories. The Group may also reclassify, in certain circumstances, financial instruments out of the AFS financial assets to loans and receivables category. Reclassifications are recorded at fair value at the date of reclassification, which becomes the new amortized cost.
The Group may reclassify a non-derivative trading asset out of HFT investments and into the Loans and Receivable category if it meets the definition of loans and receivables, the Group has the intention and ability to hold the financial assets for the foreseeable future or until maturity and only in rare circumstances. If a financial asset is reclassified, and if the Group subsequently increases its estimates of future cash receipts as a result of increased recoverability of those cash receipts, the effect of that increase is recognized as an adjustment to the EIR from the date of the change in estimate.
For a financial asset reclassified out of the AFS financial assets category, any previous gain or loss on that asset that has been recognized in OCI is amortized to profit or loss over the remaining life of the investment using the effective interest method. Any difference between the new amortized cost and the expected cash flows is also amortized over the remaining life of the asset using the effective interest method. If the asset is subsequently determined to be impaired then the amount recorded in OCI is recycled to the statement of income. Reclassification is at the election of management, and is determined on an instrument by instrument basis. The Group does not reclassify any financial instrument into the FVPL category after initial recognition. An analysis of reclassified financial assets is disclosed in Note 9.

China Bank Annual Financial and Sustainability Report 2017124
Derecognition of Financial Assets and LiabilitiesFinancial assetsA financial asset (or, where applicable a part of a financial asset or part of a group of financial assets) is derecognized when:
• the rights to receive cash flows from the asset have expired; or• the Group retains the right to receive cash flows from the asset, but has assumed an obligation to pay them in full without material delay
to a third party under a “pass-through” arrangement; or• the Group has transferred its rights to receive cash flows from the asset and either (a) has transferred substantially all the risks and rewards
of the asset, or (b) has neither transferred nor retained the risks and rewards of the asset but has transferred control of the asset.
Where the Group has transferred its rights to receive cash flows from an asset or has entered into a pass-through arrangement, and has neither transferred nor retained substantially all the risks and rewards of the asset nor transferred control of the asset, the asset is recognized to the extent of the Group’s continuing involvement in the asset. Continuing involvement that takes the form of a guarantee over the transferred asset is measured at the lower of the original carrying amount of the asset and the maximum amount of consideration that the Group could be required to repay.
Financial liabilitiesA financial liability is derecognized when the obligation under the liability is discharged, cancelled or has expired. Where an existing financial liability is replaced by another from the same lender on substantially different terms, or the terms of an existing liability are substantially modified, such an exchange or modification is treated as a derecognition of the original liability and the recognition of a new liability, and the difference in the respective carrying amounts is recognized in the statement of income.
Impairment of Financial AssetsThe Group assesses at each reporting date whether there is objective evidence that a financial asset or group of financial assets is impaired. A financial asset or a group of financial assets is deemed to be impaired if, and only if, there is objective evidence of impairment as a result of one or more events that has occurred after the initial recognition of the asset (an incurred ‘loss event’) and that loss event (or events) has an impact on the estimated future cash flows of the financial asset or the group of financial assets that can be reliably estimated. Evidence of impairment may include indications that the borrower or a group of borrowers is experiencing significant financial difficulty, default or delinquency in interest or principal payments, the probability that they will enter bankruptcy or other financial reorganization and where observable data indicate that there is measurable decrease in the estimated future cash flows, such as changes in arrears or economic conditions that correlate with defaults.
Financial assets carried at amortized costFor financial assets carried at amortized cost, the Group first assesses whether objective evidence of impairment exists individually for financial assets that are individually significant, or collectively for financial assets that are not individually significant.
If there is objective evidence that an impairment loss has been incurred, the amount of the loss is measured as the difference between the asset’s carrying amount and the present value of the estimated future cash flows (excluding future credit losses that have not been incurred). The present value of the estimated future cash flows is discounted at the financial asset’s original EIR.
If a loan has a variable interest rate, the discount rate for measuring any impairment loss is the current EIR, adjusted for the original credit risk premium. The calculation of the present value of the estimated future cash flows of a collateralized financial asset reflects the cash flows that may result from foreclosure less costs for obtaining and selling the collateral, whether or not foreclosure is probable.
The carrying amount of the asset is reduced through use of an allowance account and the amount of loss is charged to the statement of income. Interest income continues to be recognized based on the original EIR of the asset. The financial assets, together with the associated allowance accounts, are written off when there is no realistic prospect of future recovery and all collateral has been realized.
If the Group determines that no objective evidence of impairment exists for individually assessed financial asset, whether significant or not, it includes the asset in a group of financial assets with similar credit risk characteristics and collectively assesses for impairment. Those characteristics are relevant to the estimation of future cash flows for groups of such assets by being indicative of the debtors’ ability to pay all amounts due according to the contractual terms of the assets being evaluated. Assets that are individually assessed for impairment and for which an impairment loss is, or continues to be, recognized are not included in a collective assessment for impairment.
For the purpose of a collective evaluation of impairment, financial assets are grouped on the basis of such credit risk characteristics as industry, collateral type, past-due status and term. Future cash flows in a group of financial assets that are collectively evaluated for impairment are estimated on the basis of historical loss experience for assets with credit risk characteristics similar to those in the group. Historical loss experience is adjusted on the basis of current observable data to reflect the effects of current conditions that did not affect the period on which the historical loss experience is based and to remove the effects of conditions in the historical period that do not exist currently. Estimates of changes in future cash flows reflect, and are directionally consistent with changes in related observable data from period to period (such as changes in unemployment rates, property prices, commodity prices, payment status, or other factors that are indicative of incurred losses in the Group and their magnitude). The methodology and assumptions used for estimating future cash flows are reviewed regularly by the Group to reduce any differences between loss estimates and actual loss experience.
If, in a subsequent year, the amount of the estimated impairment loss decreases because of an event occurring after the impairment was recognized, the previously recognized impairment loss is reduced by adjusting the allowance account. If a future write-off is later recovered, the recovery is credited to ‘Miscellaneous income’.

Financial Statements 125
Financial assets carried at costIf there is objective evidence that an impairment loss on an unquoted equity instrument that is not carried at fair value because its fair value cannot be reliably measured, or on a derivative asset that is linked to and must be settled by delivery of such an unquoted equity instrument has been incurred, the amount of loss is measured as the difference between the asset’s carrying amount and the present value of estimated future cash flows discounted at the current market rate of return for a similar financial asset.
Available-for-sale financial assetsFor AFS financial assets, the Group assesses at each reporting date whether there is objective evidence that a financial asset or group of financial assets is impaired.
In the case of equity investments classified as AFS financial assets, this would include a significant or prolonged decline in the fair value of the investments below its cost. Where there is evidence of impairment, the cumulative loss - measured as the difference between the acquisition cost and the current fair value, less any impairment loss on that financial asset previously recognized in the statement of income - is removed from OCI and recognized in the statement of income. Impairment losses on equity investments are not reversed through the statement of income. Increases in fair value after impairment are recognized directly in OCI.
In the case of debt instruments classified as AFS financial assets, impairment is assessed based on the same criteria as financial assets carried at amortized cost. However, the amount recorded for impairment is the cumulative loss measured as the difference between the amortized cost and the current fair value, less any impairment loss on that investment previously recognized in profit or loss. Future interest income is based on the reduced carrying amount and is accrued based on the rate of interest used to discount future cash flows for the purpose of measuring impairment loss. Such accrual is recorded as part of ‘Interest income’ in the statement of income. If, in subsequent years, the fair value of a debt instrument increased and the increase can be objectively related to an event occurring after the impairment loss was recognized in the statement of income, the impairment loss is reversed through the statement of income.
Restructured loansWhere possible, the Group seeks to restructure loans rather than to take possession of collateral. This may involve extending the payment arrangements and the agreement of new loan conditions. Once the terms have been renegotiated, the loan is no longer considered past due. Management continuously reviews restructured loans to ensure that all criteria are met and that future payments are likely to occur. The loans continue to be subject to an individual or collective impairment assessment, calculated using the loan’s original EIR. The difference between the recorded value of the original loan and the present value of the restructured cash flows, discounted at the original EIR, is recognized in ‘Provision for impairment and credit losses’ in the statement of income.
Investment in AssociatesAssociates pertain to all entities over which the Group has significant influence but not control, generally accompanying a shareholding of between 20.00% and 50.00% of the voting rights. In the consolidated and parent company financial statements, investments in associates are accounted for under the equity method of accounting.
Under the equity method, an investment in an associate is carried in the balance sheet at cost plus post-acquisition changes in the Group’s share of the net assets of the associates. Goodwill, if any, relating to an associate is included in the carrying value of the investment and is not amortized. The statement of income reflects the share of the results of operations of the associate. Where there has been a change recognized directly in the equity of the associate, the Group recognizes its share of any changes and discloses this, when applicable, in the statement of changes in equity.
When the Group’s share of losses in an associate equals or exceeds its interest in the associate, including any other unsecured receivables, the Group does not recognize further losses, unless it has incurred obligations or made payments on behalf of the associate. Profits or losses resulting from transactions between the Group and an associate are eliminated to the extent of the interest in the associate.
Dividends earned on this investment are recognized in the Parent Company’s statement of income as a reduction from the carrying value of the investment.
The financial statements of the associate are prepared for the same reporting period as the Parent Company. Where necessary, adjustments are made to bring the accounting policies in line with those of the Group.
Upon loss of significant influence over the associate, the Group measures and recognizes any retained investment at its fair value. Any difference between the carrying amount of the associate upon loss of significant influence and the fair value of the retained investment and proceeds from disposal is recognized in profit or loss.
Investment in SubsidiariesIn the parent company financial statements, investment in subsidiaries is accounted for under the equity method of accounting similar to the investment in associates.
Business Combinations and GoodwillBusiness combinations are accounted for using the acquisition method. The cost of an acquisition is measured as the aggregate of the consideration transferred, measured at acquisition date fair value and the amount of any non-controlling interest in the acquiree. For each business combination, the acquirer measures the non-controlling interest in the acquiree either at fair value or at the proportionate share of the acquiree’ s identifiable net assets. Acquisition costs incurred are charged to profit or loss.

China Bank Annual Financial and Sustainability Report 2017126
When the Group acquires a business, it assesses the financial assets and liabilities assumed for appropriate classification and designation in accordance with the contractual terms, economic circumstances and pertinent conditions as at the acquisition date. This includes the separation of embedded derivatives in host contracts by the acquiree.
If the business combination is achieved in stages, the acquisition date fair value of the acquirer’s previously held equity interest in the acquiree is remeasured to fair value at the acquisition date through profit or loss.
Any contingent consideration to be transferred by the acquirer will be recognized at fair value at the acquisition date. Subsequent changes to the fair value of the contingent consideration which is deemed to be an asset or liability, will be recognized in accordance with PAS 39, either in profit or loss or as a charge to OCI. If the contingent consideration is classified as equity, it should not be remeasured until it is finally settled within equity.
Goodwill is initially measured at cost being the excess of the aggregate of fair value of the consideration transferred and the amount recognized for non-controlling interest over the net identifiable assets acquired and liabilities assumed. If this consideration is lower than the fair value of the net assets of the subsidiary acquired, the difference is recognized in profit or loss as gain on bargain purchase under ‘Miscellaneous income’.
After initial recognition, goodwill is measured at cost less any accumulated impairment losses.
Goodwill is tested for impairment annually or more frequently if events or changes in circumstances indicate the carrying value may be impaired. For the purpose of impairment testing, goodwill acquired in a business combination is, from the date of acquisition, allocated to each of the Group’s CGUs, or groups of CGUs, that are expected to benefit from the synergies of the combination, irrespective of whether other assets or liabilities of the acquiree are assigned to those units or group of units. Each unit or group of units to which the goodwill is allocated:
• represents the lowest level within the Group at which the goodwill is monitored for internal management purposes; and• is not larger than an operating segment identified for segment reporting purposes.
Where goodwill forms part of a CGU (or group of CGUs) and part of the operation within that unit is disposed of, the goodwill associated with the operation disposed of is included in the carrying amount of the operation when determining the gain or loss on disposal of the operation. Goodwill disposed of in this circumstance is measured based on the relative values of the operation disposed of and the portion of the CGU retained.
Cash Dividend and Non-cash Distribution to Equity Holders of the Parent CompanyThe Group recognizes a liability to make cash or non-cash distributions to equity holders of the parent company when the distribution is authorized and the distribution is no longer at the discretion of the Group.
A corresponding amount is recognized directly in equity.
Non-cash distributions are measured at the fair value of the assets to be distributed with fair value remeasurement recognized directly in equity.
Upon distribution of non-cash assets, any difference between the carrying amount of the liability and the carrying amount of the assets distributed is recognized in the statement of income.
Bank Premises, Furniture, Fixtures and EquipmentLand is stated at cost less any impairment in value while depreciable properties such as buildings, leasehold improvements, and furniture, fixtures and equipment are stated at cost less accumulated depreciation and amortization, and any impairment in value. Such cost includes the cost of replacing part of the bank premises, furniture, fixtures and equipment when that cost is incurred and if the recognition criteria are met, but excluding repairs and maintenance costs.
Construction-in-progress is stated at cost less any impairment in value. The initial cost comprises its construction cost and any directly attributable costs of bringing the asset to its working condition and location for its intended use, including borrowing costs. Construction-in-progress is not depreciated until such time that the relevant assets are completed and put into operational use.
Depreciation and amortization is calculated using the straight-line method over the estimated useful life (EUL) of the depreciable assets as follows:
EULBuildings 50 yearsFurniture, fixtures and equipment 3 to 5 yearsLeasehold improvements Shorter of 6 years or the related
lease terms

Financial Statements 127
The depreciation and amortization method and useful life are reviewed periodically to ensure that the method and period of depreciation and amortization are consistent with the expected pattern of economic benefits from items of bank premises, furniture, fixtures and equipment and leasehold improvements.
An item of bank premises, furniture, fixtures and equipment is derecognized upon disposal or when no future economic benefits are expected from its use or disposal. Any gain or loss arising on derecognition of the asset (calculated as the difference between the net disposal proceeds and the carrying amount of the asset) is included in the statement of income in the year the asset is derecognized.
Investment PropertiesInvestment properties include real properties acquired in settlement of loans and receivables which are measured initially at cost, including certain transaction costs. Investment properties acquired through a nonmonetary asset exchange is measured initially at fair value unless (a) the exchange lacks commercial substance or (b) the fair value of neither the asset received nor the asset given up is reliably measurable. The difference between the fair value of the investment property upon foreclosure and the carrying value of the loan is recognized under ‘Gain on asset foreclosure and dacion transactions’ in the statement of income. Subsequent to initial recognition, depreciable investment properties are stated at cost less accumulated depreciation and any accumulated impairment in value except for land which is stated at cost less impairment in value.
Expenditures incurred after the investment properties have been put into operation, such as repairs and maintenance costs, are normally charged to income in the period in which the costs are incurred.
Depreciation is calculated on a straight-line basis using the remaining EUL of the building and improvement components of investment properties which ranged from 10 to 33 years from the time of acquisition of the investment properties.
Investment properties are derecognized when they have either been disposed of or when the investment properties are permanently withdrawn from use and no future benefit is expected from their disposal. Any gains or losses on the derecognition of an investment property are recognized as ‘Gain on sale of investment properties’ in the statement of income in the year of derecognition.
Transfers are made to investment properties when, and only when, there is a change in use evidenced by ending of owner occupation, commencement of an operating lease to another party or ending of construction or development. Transfers are made from investment properties when, and only when, there is a change in use evidenced by commencement of owner occupation or commencement of development with a view to sale.
Intangible AssetsIntangible assets include software cost and branch licenses resulting from the Parent Company’s acquisition of CBSI, Unity Bank and PDB (Notes 11 and 14).
Software costsCosts related to software purchased by the Group for use in operations are amortized on a straight-line basis over 3 to 10 years. The amortization method and useful life are reviewed periodically to ensure that the method and period of amortization are consistent with the expected pattern of economic benefits embodied in the asset.
Branch licensesThe branch licenses are initially measured at fair value as of the date of acquisition and are deemed to have an indefinite useful life as there is no foreseeable limit to the period over which they are expected to generate net cash inflows for the Group.
Such intangible assets are not amortized, instead they are tested for impairment annually either individually or at the CGU level. Impairment is determined by assessing the recoverable amount of each CGU (or group of CGUs) to which the intangible asset relates. Recoverable amount is the higher of the CGU’s fair value less costs to sell and its value in use. Where the recoverable amount of the CGU is less than its carrying amount, an impairment loss is recognized.
Gains and losses arising from derecognition of an intangible asset are measured as the difference between the net disposal proceeds and the carrying amount of the asset and are recognized in earnings when the asset is derecognized.
Impairment of Nonfinancial AssetsAt each reporting date, the Group assesses whether there is any indication that its nonfinancial assets (e.g., investment in associates, investment properties, bank premises, furniture, fixtures and equipment, goodwill and intangible assets) may be impaired. When an indicator of impairment exists or when an annual impairment testing for an asset is required, the Group makes a formal estimate of recoverable amount.
Recoverable amount is the higher of an asset’s (or CGU’s) fair value less costs to sell and its value in use and is determined for an individual asset, unless the asset does not generate cash inflows that are largely independent of those from other assets or groups of assets, in which case the recoverable amount is assessed as part of the CGU to which it belongs. Where the carrying amount of an asset (or CGU) exceeds its recoverable amount, the asset (or CGU) is considered impaired and is written down to its recoverable amount. In assessing value in use, the estimated future cash flows are discounted to their present value using a pre-tax discount rate that reflects current market assessments of the time value of money and the risks specific to the asset (or CGU).

China Bank Annual Financial and Sustainability Report 2017128
An impairment loss is charged to operations in the year in which it arises.
For nonfinancial assets, excluding goodwill and branch licenses, an assessment is made at each reporting date as to whether there is any indication that previously recognized impairment losses may no longer exist or may have decreased. If such indication exists, the recoverable amount is estimated. A previously recognized impairment loss is reversed, except for goodwill, only if there has been a change in the estimates used to determine the asset’s recoverable amount since the last impairment loss was recognized. If that is the case, the carrying amount of the asset is increased to its recoverable amount. That increased amount cannot exceed the carrying amount that would have been determined, net of depreciation, had no impairment loss been recognized for the asset in prior years. Such reversal is recognized in the statement of income. After such a reversal, the depreciation expense is adjusted in future years to allocate the asset’s revised carrying amount, less any residual value, on a systematic basis over its remaining life.
LeasesThe determination of whether an arrangement is, or contains a lease is based on the substance of the arrangement and requires an assessment of whether the fulfillment of the arrangement is dependent on the use of a specific asset or assets and the arrangement conveys a right to use the asset. A reassessment is made after inception of the lease only if one of the following applies:
(a) there is a change in contractual terms, other than a renewal or extension of the arrangement; or(b) a renewal option is exercised or extension granted, unless that term of the renewal or extension was initially included in the lease term; or(c) there is a change in the determination of whether fulfillment is dependent on a specified asset; or(d) there is a substantial change to the asset.
Where a reassessment is made, lease accounting shall commence or cease from the date when the change in circumstances gave rise to the reassessment for scenarios (a), (c), or (d) above, and at the date of renewal or extension period for scenario (b).
Group as a lesseeLeases where the lessor retains substantially all the risks and benefits of ownership of the asset are classified as operating leases. Operating lease payments are recognized as an expense in the statement of income on a straight-line basis over the lease term and included in ‘Occupancy cost’ in the statement of income.
Group as a lessorLeases where the Group does not transfer substantially all the risks and benefits of ownership of the assets are classified as operating leases. Initial direct costs incurred in negotiating operating leases are added to the carrying amount of the leased asset and recognized over the lease term on the same basis as the rental income. Contingent rents are recognized as revenue in the period in which they are earned.
Capital StockCapital stocks are recorded at par. Proceeds in excess of par value are recognized under equity as ‘Capital paid in excess of par value’ in the balance sheet. Incremental costs incurred which are directly attributable to the issuance of new shares are shown in equity as a deduction from proceeds, net of tax.
Revenue RecognitionRevenue is recognized to the extent that it is probable that the economic benefits will flow to the Group and the revenue can be reliably measured, regardless of when the payment is being made. Revenue is measured at the fair value of the consideration received or receivable, taking into account contractually defined terms of payment and excluding taxes or duty. The Group assesses its revenue arrangements against specific criteria in order to determine if it is acting as principal or agent. The Group has concluded that it is acting as a principal in all of its revenue arrangements.
The following specific recognition criteria must also be met before revenue is recognized:
Interest incomeFor all financial instruments measured at amortized cost and interest-bearing financial instruments classified as FVPL and AFS financial assets, interest income is recorded at EIR, which is the rate that exactly discounts estimated future cash payments or receipts through the expected life of the financial instrument or a shorter period, where appropriate, to the net carrying amount of the financial asset or financial liability. The calculation takes into account all contractual terms of the financial instrument (for example, prepayment options), includes any fees or incremental costs that are directly attributable to the instrument and are an integral part of the EIR, as applicable, but not future credit losses. The adjusted carrying amount is calculated based on the original EIR. The change in carrying amount is recorded as ‘Interest income’.
Once the recorded value of a financial asset or group of similar financial assets has been reduced due to an impairment loss, interest income continues to be recognized using the original EIR applied to the new carrying amount.

Financial Statements 129
Fee and commission incomeThe Group earns fee and commission income from a diverse range of services it provides to its customers. Fee income can be divided into the following two categories:
a. Fee income earned from services that are provided over a certain period of timeFees earned for the provision of services over a period of time that are accrued over that period. These fees include investment fund fees, custodian fees, fiduciary fees, commission income, credit related fees, asset management fees, portfolio and other management fees, and advisory fees. Loan commitment fees for loans that are likely to be drawn down are deferred (together with any incremental costs) and recognized as an adjustment to the EIR on the loan. If the commitment expires without the Group making the loan, the commitment fees are recognized as other income on expiry.
b. Fee income from providing transactions servicesFees arising from negotiating or participating in the negotiation of a transaction for a third party - such as underwriting fees, corporate finance fees and brokerage fees for the arrangement of the acquisition of shares or other securities or the purchase or sale of businesses - are recognized on completion of the underlying transaction. Fees or components of fees that are linked to a certain performance are recognized after fulfilling the corresponding criteria. Loan syndication fees are recognized in the statement of income when the syndication has been completed and the Group retains no part of the loans for itself or retains part at the same EIR as for the other participants.
Service charges and penaltiesService charges and penalties are recognized only upon collection or accrued where there is a reasonable degree of certainty as to their collectability.
Dividend incomeDividend income is recognized when the Group’s right to receive payment is established.
Trading and securities gainThis represents results arising from trading activities including all gains and losses from changes in fair value of financial assets held for trading and designated at FVPL. It also includes gains and losses realized from sale of AFS financial assets.
Other incomeIncome from sale of service is recognized upon rendition of the service. Income from sale of properties is recognized when risks and rewards have been transferred and when the collectability of the sales price is reasonably assured.
Expense RecognitionExpense is recognized when it is probable that a decrease in future economic benefits related to a decrease in an asset or an increase in liability has occurred and the decrease in economic benefits can be measured reliably. Revenues and expenses that relate to the same transaction or other event are recognized simultaneously.
Interest expenseInterest expense for all interest-bearing financial liabilities are recognized in ‘Interest expense’ in the statement of income using the EIR of the financial liabilities to which they relate.
Other expensesExpenses encompass losses as well as those expenses that arise in the ordinary course of business of the Group. Expenses are recognized when incurred.
Retirement BenefitsDefined benefit planThe net defined benefit liability or asset is the aggregate of the present value of the defined benefit obligation at the end of the reporting period reduced by the fair value of plan assets and adjusted for any effect of limiting a net defined benefit asset to the asset ceiling. The defined benefit obligation is calculated annually by an independent actuary. The present value of the defined benefit obligation is determined by discounting the estimated future cash outflows using interest rates on government bonds that have terms to maturity approximating the terms of the related retirement liability. The asset ceiling is the present value of any economic benefits available in the form of refunds from the plan or reductions in future contributions to the plan.
The cost of providing benefits under the defined benefit plans is actuarially determined using the projected unit credit method.
Defined benefit costs comprise the following:(a) service cost;(b) net interest on the net defined benefit liability or asset; and(c) remeasurements of net defined benefit liability or asset.

China Bank Annual Financial and Sustainability Report 2017130
Service costs which include current service costs, past service costs and gains or losses on non-routine settlements are recognized as expense in profit or loss. Past service costs are recognized when plan amendment or curtailment occurs.
Net interest on the net defined benefit liability or asset is the change during the period in the net defined benefit liability or asset that arises from the passage of time which is determined by applying the discount rate based on Philippine government bonds to the net defined benefit liability or asset. Net interest on the net defined benefit liability or asset is recognized as expense or income in profit or loss.
Remeasurements comprising actuarial gains and losses, return on plan assets and any change in the effect of the asset ceiling (excluding net interest on defined benefit liability) are recognized immediately in OCI in the period in which they arise. Remeasurements are not reclassified to profit or loss in subsequent periods.
Plan assets are assets that are held by a long-term employee benefit fund. Plan assets are not available to the creditors of the Parent Company, nor can they be paid directly to the Parent Company. The fair value of plan assets is based on market price information. When no market price is available, the fair value of plan assets is estimated by discounting expected future cash flows using a discount rate that reflects both the risk associated with the plan assets and the maturity or expected disposal date of those assets (or, if they have no maturity, the expected period until the settlement of the related obligations).
The Parent Company’s right to be reimbursed of some or all of the expenditure required to settle a defined benefit obligation is recognized as a separate asset at fair value when and only when reimbursement is virtually certain. If the fair value of the plan assets is higher than the present value of the defined benefit obligation, the measurement of the resulting defined benefit asset is limited to the present value of economic benefits available in the form of refunds from the plan or reductions in future contributions to the plan.
Employee leave entitlementEmployee entitlements to annual leave are recognized as a liability when they are accrued to the employees. The undiscounted liability for leave expected to be settled after the end of the annual reporting period is recognized for services rendered by employees up to the end of the reporting period.
Provisions and ContingenciesProvisions are recognized when the Group has a present obligation (legal or constructive) as a result of a past event and it is probable that an outflow of resources embodying economic benefits will be required to settle the obligation and a reliable estimate can be made of the amount of the obligation. Where the Group expects some or all of a provision to be reimbursed, for example, under an insurance contract, the reimbursement is recognized as a separate asset but only when the reimbursement is virtually certain. The expense relating to any provision is presented in the statement of income, net of any reimbursement. If the effect of the time value of money is material, provisions are determined by discounting the expected future cash flows at a pre-tax rate that reflects current market assessments of the time value of money and, where appropriate, the risks specific to the liability. Where discounting is used, the increase in the provision due to the passage of time is recognized as an interest expense.
Contingent liabilities are not recognized in the financial statements but are disclosed unless the possibility of an outflow of resources embodying economic benefits is remote. Contingent assets are not recognized but are disclosed in the financial statements when an inflow of economic benefits is probable.
Income TaxesCurrent taxCurrent tax assets and liabilities for the current and prior periods are measured at the amount expected to be recovered from or paid to the taxation authorities. The tax rates and tax laws used to compute the amount are those that are enacted or substantively enacted as of the reporting date.
Deferred taxDeferred tax is provided, using the balance sheet liability method, on all temporary differences at the reporting date between the tax bases of assets and liabilities and their carrying amounts for financial reporting purposes.
Deferred tax liabilities are recognized for all taxable temporary differences. Deferred tax assets are recognized for all deductible temporary differences, carry forward of unused tax credits from the excess of minimum corporate income tax (MCIT) over the regular corporate income tax (RCIT), and unused net operating loss carryover (NOLCO), to the extent that it is probable that sufficient taxable profit will be available against which the deductible temporary differences and carry forward of unused tax credits from MCIT and unused NOLCO can be utilized. Deferred tax, however, is not recognized on temporary differences that arise from the initial recognition of an asset or liability in a transaction that is not a business combination and, at the time of the transaction, affects neither the accounting income nor taxable income.
Deferred tax liabilities are not provided on non-taxable temporary differences associated with investments in domestic subsidiaries and associates.
The carrying amount of deferred tax assets is reviewed at each reporting date and reduced to the extent that it is no longer probable that sufficient taxable profit will be available to allow all or part of the deferred tax asset to be utilized. Unrecognized deferred tax assets are reassessed at each reporting date and are recognized to the extent that it has become probable that future taxable profit will allow the deferred tax asset to be recovered.

Financial Statements 131
Deferred tax assets and liabilities are measured at the tax rates that are applicable to the period when the asset is realized or the liability is settled, based on tax rates (and tax laws) that have been enacted or substantively enacted at the reporting date.
Current tax and deferred tax relating to items recognized directly in equity is also recognized in equity and not in the statement of income.
Deferred tax assets and deferred tax liabilities are offset if a legally enforceable right exists to set off current tax assets against current tax liabilities and deferred taxes relate to the same taxable entity and the same taxation authority.
Earnings per ShareBasic earnings per share (EPS) is computed by dividing net income for the year by the weighted average number of common shares outstanding during the year after giving retroactive effect to stock splits, stock dividends declared and stock rights exercised during the year, if any.
The Parent Company has no outstanding dilutive potential common shares.
Dividends on Common SharesDividends on common shares are recognized as a liability and deducted from equity when approved by the respective shareholders of the Parent Company and its subsidiaries. Dividends declared during the year that are approved after the reporting date are dealt with as an event after the reporting date.
Segment ReportingThe Group’s operating businesses are organized and managed separately according to the nature of the products and services provided, with each segment representing a strategic business unit that offers different products and serves different markets. Financial information on business segments is presented in Note 31. The Group’s revenue producing assets are located in the Philippines (i.e., one geographical location). Therefore, geographical segment information is no longer presented.
Fiduciary ActivitiesAssets and income arising from fiduciary activities together with related undertakings to return such assets to customers are excluded from the financial statements where the Parent Company acts in a fiduciary capacity such as nominee, trustee or agent.
Events after the Reporting PeriodAny post year-end events that provide additional information about the Group’s position at the reporting date (adjusting event) are reflected in the Group’s financial statements. Post year-end events that are not adjusting events, if any, are disclosed when material to the financial statements.
Standards Issued but Not Yet Effective
Effective beginning on or after January 1, 2018Amendments to PFRS 2, Share-based Payment, Classification and Measurement of Share-based Payment Transactions
The amendments to PFRS 2 address three main areas: the effects of vesting conditions on the measurement of a cash-settled share-based payment transaction; the classification of a share-based payment transaction with net settlement features for withholding tax obligations; and the accounting where a modification to the terms and conditions of a share-based payment transaction changes its classification from cash settled to equity settled.
On adoption, entities are required to apply the amendments without restating prior periods, but retrospective application is permitted if elected for all three amendments and if other criteria are met. Early application of the amendments is permitted.
The above amendments have no impact on the Group’s financial statements as the Group does not have share-based payment schemes.
Amendments to PFRS 4, Insurance Contracts, Applying PFRS 9, Financial Instruments, with PFRS 4The amendments address concerns arising from implementing PFRS 9, the new financial instruments standard before implementing the forthcoming insurance contracts standard. They allow entities to choose between the overlay approach and the deferral approach to deal with the transitional challenges. The overlay approach gives all entities that issue insurance contracts the option to recognize in OCI, rather than profit or loss, the volatility that could arise when PFRS 9 is applied before the new insurance contracts standard is issued. On the other hand, the deferral approach gives entities whose activities are predominantly connected with insurance an optional temporary exemption from applying PFRS 9 until the earlier of application of the forthcoming insurance contracts standard or January 1, 2021.
These amendments are not expected to have any significant impact on the Group.
PFRS 9, Financial InstrumentsPFRS 9 replaces PAS 39, Financial Instruments: Recognition and Measurement and is effective for annual periods beginning on or after January 1, 2018. Early application is permitted if an entity applies all the requirements of the standard.

China Bank Annual Financial and Sustainability Report 2017132
PFRS 9 is required to be applied on a retrospective basis, with certain exceptions. As permitted, the Group will not restate the Group prior period comparative consolidated financial statements when the Group adopts the requirements of the new standard. Differences in the carrying amounts of financial instruments resulting from the adoption of PFRS 9 will be recognized in the opening January 1, 2018 surplus and OCI as if the Group had always followed the new requirements.
In the period of initial application, the requirements of PFRS 9 on the classification and measurement of financial assets and on the recognition of expected credit losses will have an impact on the Group’s and Parent Company’s financial statements. The opening January 1, 2018 surplus and OCI in the Group’s and Parent Company’s statement of financial position are expected to change as a result of applying PFRS 9’s requirements on classification and measurement of financial assets. This change will result from reclassifications of financial assets depending on the Group’s and the Parent Company’s application of its business models and its assessment of the financial assets’ cash flow characteristics. The opening January 1, 2018 surplus and OCI in the Group’s and Parent Company’s statement of financial position are also expected to change as a result of applying PFRS 9’s requirements on the recognition of expected credit losses. This change depends on whether there have been significant increases in the credit risk of the Group’s and Parent Company’s financial assets since initial recognition and on the Group’s and Parent Company’s evaluation of factors relevant to the measurement of expected credit losses such as a range of possible outcomes and information about past events, current conditions and forecasts of future economic conditions. During 2018, PFRS 9’s requirements will have an impact on the Group’s and Parent Company’s financial statements depending on certain factors such as the financial assets’ corresponding business models, cash flow characteristics, and changes in credit risks. The Group is still completing its assessment of the impact of PFRS 9.
In the period of initial application, the requirements of PFRS 9 on the classification and measurement of financial liabilities and on the application of hedge accounting are not expected to have an impact on the Group’s and Parent Company’s financial statements.
The key changes to the Group’s accounting policies resulting from the adoption of PFRS 9 are described below.
Classification and measurementThe PFRS 9 classification and measurement model requires that all debt financial assets that do not meet the “solely payment of principal and interest” (SPPI) test, including those that contain embedded derivatives, be classified at initial recognition as at fair value through profit or loss (FVPL). The intent of the SPPI test is to ensure that debt instruments that contain non-basic lending features, such as conversion options and equity linked pay-outs, are measured at FVPL. Subsequent measurement of instruments classified as FVPL under PFRS 9 operates in a similar manner to financial instruments held for trading under PAS 39.
For debt financial assets that meet the SPPI test, classification at initial recognition will be determined based on the business model under which these instruments are managed. Debt instruments that are managed on a “held for trading” or “fair value” basis will be classified as at FVPL. Debt instruments that are managed on a “hold to collect and for sale” basis will be classified as at fair value through OCI (FVOCI) for debt. Debt instruments that are managed on a “hold to collect” basis will be classified as at amortized cost. Subsequent measurement of instruments classified as at FVOCI and amortized cost classifications under PFRS 9 operate in a similar manner to AFS financial assets for debt financial assets and loans and receivables, respectively, under existing PAS 39, except for the impairment provisions which are discussed below.
For those debt financial assets that would otherwise be classified as at FVOCI or amortized cost, an irrevocable designation can be made at initial recognition to instead measure the debt instrument at FVPL under the fair value option (FVO) if doing so eliminates or significantly reduces an accounting mismatch.
All equity financial assets are required to be classified at initial recognition as at FVPL unless an irrevocable designation is made to classify the instrument as at FVOCI for equities. Unlike AFS for equity securities under PAS 39, the FVOCI for equities category results in all realized and unrealized gains and losses being recognized in OCI with no recycling to profit and loss. Only dividends will continue to be recognized in profit and loss.
The classification and measurement of financial liabilities remain essentially unchanged from the current PAS 39 requirements, except that changes in fair value of FVO liabilities attributable to changes in own credit risk are to be presented in OCI, rather than profit and loss.
Derivatives will continue to be measured at FVPL under PFRS 9.
ImpairmentThe new impairment guidance sets out an expected credit loss (ECL) model applicable to all debt instrument financial assets classified as amortized cost or FVOCI. In addition, the ECL model applies to loan commitments and financial guarantees that are not measured at FVPL.
Expected Credit Loss MethodologyThe application of ECL will significantly change the Group credit loss methodology and models. ECL allowances represent credit losses that reflect an unbiased and probability-weighted amount which is determined by evaluating a range of possible outcomes, the time value of money and reasonable and supportable information about past events, current conditions and forecasts of future economic conditions. ECL allowances will be measured at amounts equal to either: (i) 12-month ECL; or (ii) lifetime ECL for those financial instruments which have experienced a significant increase in credit risk (SICR) since initial recognition or when there is objective evidence of impairment. This compares to the present incurred loss model that incorporates a single best estimate, the time value of money and information about past events and current conditions and which recognizes lifetime credit losses when there is objective evidence of impairment and also allowances for incurred but not identified credit losses.

Financial Statements 133
Stage Migration and Significant Increase in Credit RiskFinancial instruments subject to the ECL methodology are categorized into three stages.
For non-impaired financial instruments:Stage 1 is comprised of all non-impaired financial instruments which have not experienced a SICR since initial recognition. Entities are required to recognize 12-month ECL for stage 1 financial instruments. In assessing whether credit risk has increased significantly, entities are required to compare the risk of a default occurring on the financial instrument as at the reporting date, with the risk of a default occurring on the financial instrument as at the date of initial recognition.
Stage 2 is comprised of all non-impaired financial instruments which have experienced a SICR since initial recognition. Entities are required to recognize lifetime ECL for stage 2 financial instruments. In subsequent reporting periods, if the credit risk of the financial instrument improves such that there is no longer a SICR since initial recognition, then entities shall revert to recognizing 12 months of ECL. In contrast to stage 1 and stage 2, inherent within the incurred loss methodology under PAS 39, allowances are provided for non-impaired financial instruments for credit losses that are incurred but not yet identified.
For impaired financial instruments:Financial instruments are classified as stage 3 when there is objective evidence of impairment as a result of one or more loss events that have occurred after initial recognition with a negative impact on the estimated future cash flows of a financial instrument or a portfolio of financial instruments. The ECL model requires that lifetime ECL be recognized for impaired financial instruments, which is similar to the current requirements under PAS 39 for impaired financial instruments.
PFRS 15, Revenue from Contracts with CustomersPFRS 15 establishes a new five-step model that will apply to revenue arising from contracts with customers. Under PFRS 15, revenue is recognized at an amount that reflects the consideration to which an entity expects to be entitled in exchange for transferring goods or services to a customer. The principles in PFRS 15 provide a more structured approach to measuring and recognizing revenue.
The new revenue standard is applicable to all entities and will supersede all current revenue recognition requirements under PFRSs. Either a full or modified retrospective application is required for annual periods beginning on or after January 1, 2018. The Group plans to adopt the modified retrospective method.
The Group is currently assessing the impact of adopting this standard.
Amendments to PAS 28, Measuring an Associate or Joint Venture at Fair Value (Part of Annual Improvements to PFRSs 2014 - 2016 Cycle)The amendments clarify that an entity that is a venture capital organization, or other qualifying entity, may elect, at initial recognition on an investment-by-investment basis, to measure its investments in associates and joint ventures at fair value through profit or loss. They also clarify that if an entity that is not itself an investment entity has an interest in an associate or joint venture that is an investment entity, the entity may, when applying the equity method, elect to retain the fair value measurement applied by that investment entity associate or joint venture to the investment entity associate’s or joint venture’s interests in subsidiaries. This election is made separately for each investment entity associate or joint venture, at the later of the date on which (a) the investment entity associate or joint venture is initially recognized; (b) the associate or joint venture becomes an investment entity; and (c) the investment entity associate or joint venture first becomes a parent. The amendments should be applied retrospectively, with earlier application permitted.
These amendments are not expected to have any impact on the Group.
Amendments to PAS 40, Investment Property, Transfers of Investment PropertyThe amendments clarify when an entity should transfer property, including property under construction or development into, or out of investment property. The amendments state that a change in use occurs when the property meets, or ceases to meet, the definition of investment property and there is evidence of the change in use. A mere change in management’s intentions for the use of a property does not provide evidence of a change in use. The amendments should be applied prospectively to changes in use that occur on or after the beginning of the annual reporting period in which the entity first applies the amendments. Retrospective application is only permitted if this is possible without the use of hindsight.
The Group does not expect any effect on its financial statements upon adoption of these amendments.
Philippine Interpretation IFRIC-22, Foreign Currency Transactions and Advance ConsiderationThe interpretation clarifies that in determining the spot exchange rate to use on initial recognition of the related asset, expense or income (or part of it) on the derecognition of a non-monetary asset or non-monetary liability relating to advance consideration, the date of the transaction is the date on which an entity initially recognizes the nonmonetary asset or non-monetary liability arising from the advance consideration. If there are multiple payments or receipts in advance, then the entity must determine a date of the transactions for each payment or receipt of advance consideration. The interpretation may be applied on a fully retrospective basis. Entities may apply the interpretation prospectively to all assets, expenses and income in its scope that are initially recognized on or after the beginning of the reporting period in which the entity first applies the interpretation or the beginning of a prior reporting period presented as comparative information in the financial statements of the reporting period in which the entity first applies the interpretation.

China Bank Annual Financial and Sustainability Report 2017134
The Group does not expect any effect on its financial statements upon adoption of these amendments.
Effective beginning on or after January 1, 2019PFRS 16, LeasesUnder the new standard, lessees will no longer classify their leases as either operating or finance leases in accordance with PAS 17, Leases. Rather, lessees will apply the single-asset model. Under this model, lessees will recognize the assets and related liabilities for most leases on their balance sheets, and subsequently, will depreciate the lease assets and recognize interest on the lease liabilities in their profit or loss. Leases with a term of 12 months or less or for which the underlying asset is of low value are exempted from these requirements.
The accounting by lessors is substantially unchanged as the new standard carries forward the principles of lessor accounting under PAS 17. Lessors, however, will be required to disclose more information in their financial statements, particularly on the risk exposure to residual value.
Entities may early adopt PFRS 16 but only if they have also adopted PFRS 15. When adopting PFRS 16, an entity is permitted to use either a full retrospective or a modified retrospective approach, with options to use certain transition reliefs.
The Group is currently assessing the impact of adopting this standard.
Amendments to PFRS 9, Prepayment Features with Negative CompensationThe amendments to PFRS 9 allow debt instruments with negative compensation prepayment features to be measured at amortized cost or fair value through other comprehensive income. An entity shall apply these amendments for annual reporting periods beginning on or after January 1, 2019. Earlier application is permitted.
Amendments to PAS 28, Long-term Interests in Associates and Joint VenturesThe amendments to PAS 28 clarify that entities should account for long-term interests in an associate or joint venture to which the equity method is not applied using PFRS 9. An entity shall apply these amendments for annual reporting periods beginning on or after January 1, 2019. Earlier application is permitted.
The amendment are not expected to have any impact on the Group.
Philippine Interpretation IFRIC-23, Uncertainty over Income Tax TreatmentsThe interpretation addresses the accounting for income taxes when tax treatments involve uncertainty that affects the application of PAS 12 and does not apply to taxes or levies outside the scope of PAS 12, nor does it specifically include requirements relating to interest and penalties associated with uncertain tax treatments.
The interpretation specifically addresses the following:• Whether an entity considers uncertain tax treatments separately• The assumptions an entity makes about the examination of tax treatments by taxation authorities• How an entity determines taxable profit (tax loss), tax bases, unused tax losses, unused tax credits and tax rates• How an entity considers changes in facts and circumstances
An entity must determine whether to consider each uncertain tax treatment separately or together with one or more other uncertain tax treatments. The approach that better predicts the resolution of the uncertainty should be followed.
The Group is currently assessing the impact of adopting this interpretation.
Deferred effectivityAmendments to PFRS 10 and PAS 28, Sale or Contribution of Assets between an Investor and its Associate or Joint VentureThe amendments address the conflict between PFRS 10 and PAS 28 in dealing with the loss of control of a subsidiary that is sold or contributed to an associate or joint venture. The amendments clarify that a full gain or loss is recognized when a transfer to an associate or joint venture involves a business as defined in PFRS 3, Business Combinations. Any gain or loss resulting from the sale or contribution of assets that does not constitute a business, however, is recognized only to the extent of unrelated investors’ interests in the associate or joint venture. On January 13, 2016, the Financial Reporting Standards Council deferred the original effective date of January 1, 2016 of the said amendments until the International Accounting Standards Board (IASB) completes its broader review of the research project on equity accounting that may result in the simplification of accounting for such transactions and of other aspects of accounting for associates and joint ventures.
3. SIGNIFICANT ACCOUNTING JUDGMENTS AND ESTIMATES
The preparation of the financial statements in accordance with PFRS requires the Group to make judgments and estimates that affect the reported amounts of assets, liabilities, income and expenses and disclosure of contingent assets and contingent liabilities at reporting date. Future events may occur which will cause the judgments and assumptions used in arriving at the estimates to change. The effects of any change in judgments and estimates are reflected in the financial statements as they become reasonably determinable.

Financial Statements 135
Judgments and estimates are continually evaluated and are based on historical experience and other factors, including expectations of future events that are believed to be reasonable under the circumstances.
Judgmentsa. Fair value of financial instruments
The Group classifies financial assets by evaluating, among others, whether the asset is quoted or not in an active market. Included in the evaluation on whether a financial asset is quoted in an active market is the determination of whether quoted prices are readily and regularly available, and whether those prices represent actual and regularly occurring market transactions conducted on an arm’s length basis.
Where the fair values of financial assets and financial liabilities recorded on the balance sheet or disclosed in the notes cannot be derived from active markets, they are determined using discounted cash flow model, incorporating inputs such as current market rates of comparable instruments. The carrying values and corresponding fair values of financial instruments, as well as the manner in which fair values were determined, are discussed in more detail in Note 5.
b. HTM financial assetsThe classification to HTM financial assets requires significant judgment. In making this judgment, the Group evaluates its intention and ability to hold such investments to maturity. If the Group fails to keep these investments to maturity other than in certain specific circumstances - for example, selling an insignificant amount close to maturity - it will be required to reclassify the entire portfolio as part of AFS financial assets. The investments would therefore be measured at fair value and not at amortized cost.
Details of AFS financial assets reclassified to HTM are disclosed in Note 9.
c. ContingenciesThe Group is currently involved in various legal proceedings. The estimate of the probable costs for the resolution of these claims has been developed in consultation with outside counsel handling the Group’s defense in these matters and is based upon an analysis of potential results. The Group currently does not believe that these proceedings will have a material adverse effect on the financial statements (Note 30). It is possible, however, that future results of operations could be materially affected by changes in the estimates or in the effectiveness of the strategies relating to these proceedings.
Estimatesa. Credit losses on loans and receivables
The Group reviews its loans and receivables at each reporting date to assess whether an allowance for credit losses should be recorded in the balance sheet and any changes thereto in the statement of income. In particular, judgment by management is required in the estimation of the amount and timing of future cash flows when determining the level of allowance required. Such estimates are based on assumptions about a number of factors such as the financial condition of the borrower, estimated future cash flows, observable market prices and estimated net selling prices of the related collateral. Actual results may also differ, resulting in future changes to the allowance.
In addition to specific allowance against individually significant loans and receivables, the Group also makes a collective impairment assessment on exposures which, although not specifically identified as requiring a specific allowance, have a greater risk of default than when originally granted. The resulting collective allowance is based on historical loss experience adjusted on the basis of current observable data for assets with similar credit risk characteristics.
The carrying values of loans and receivables and the related allowance for credit losses of the Group and the Parent Company are disclosed in Notes 10 and 16.
b. Impairment of goodwillGoodwill is reviewed for impairment, annually or more frequently if events or changes in circumstances indicate that the carrying value may be impaired. Impairment is determined for goodwill by assessing the recoverable amount of the cash generating unit CGU to which the goodwill relates. The recoverable amount of the CGU is determined based on a VIU calculation using cash flow projections from financial budgets approved by senior management covering a five-year period. For VIU, the Group estimates the discount rate used for the computation of the net present value by reference to industry cost of capital. Impairment assessment process requires significant judgement and based on assumptions, specifically loan and deposit growth rates, discount rate and the terminal value growth rates.
Where the recoverable amount is less than the carrying amount of the CGU to which goodwill has been allocated, an impairment loss is recognized immediately in the statement of income. Impairment losses relating to goodwill cannot be reversed for subsequent increases in its recoverable amount in future periods. The carrying values of the Group’s goodwill are disclosed in Note 14.
c. Impairment of branch licensesThe Group conducts an annual review for any impairment in the value of branch licenses. Branch licenses are written down for impairment where the recoverable value is insufficient to support the carrying value. The recoverable amount of branch licenses is the higher between fair value less costs of disposal (FVLCD) and its value-in-use (VIU). FVLCD of branch licenses is based on the special licensing fee of BSP on branches operating on identified restricted areas. The recoverable amount of the CGU is determined based on a VIU calculation using cash flow projections from financial budgets approved by senior management covering a five-year period. For VIU, the Group estimates the discount rate used for the computation of the net present value by reference to industry cost of capital. Impairment assessment process requires significant judgement and based on assumptions, specifically loan and deposit growth rates, discount rate and the terminal value growth rates.

China Bank Annual Financial and Sustainability Report 2017136
The carrying values of the Group’s branch licenses are disclosed in Note 14.
d. Net plan assets and retirement expenseThe determination of the Group’s net plan assets and annual retirement expense is dependent on the selection of certain assumptions used in calculating such amounts. These assumptions include, among others, discount rates and salary rates.
The assumed discount rates were determined using the market yields on Philippine government bonds with terms consistent with the expected employee benefit payout as of the reporting date.
The present value of the retirement obligation and fair value of plan assets, including the details of the assumptions used in the calculation are disclosed in Note 24.
e. Recognition of deferred income taxesDeferred tax assets are recognized for all unused tax losses to the extent that it is probable that taxable profit will be available against which the losses can be utilized. Management discretion is required to determine the amount of deferred tax assets that can be recognized, based on the forecasted level of future taxable profits and the related future tax planning strategies. Key assumptions used in forecast of future taxable income include loan portfolio and deposit growth rates.
The Group believes it will be able to generate sufficient taxable income in the future to utilize its recorded deferred tax assets. Taxable income is sourced mainly from interest income from lending activities and earnings from service charge, fees, commissions and trust activities.
The recognized and unrecognized deferred tax assets are disclosed in Note 27.
f. Impairment on non-financial assetsThe Group assesses impairment on its nonfinancial assets (e.g., investment properties and bank premises, furniture, fixtures and equipment) and considers the following impairment indicators:
• significant underperformance relative to expected historical or projected future operating results;• significant changes in the manner of use of the acquired assets or the strategy for overall business; and• significant negative industry or economic trends.
An impairment loss is recognized whenever the carrying amount of an asset exceeds its recoverable amount. Except for investment properties where recoverable amount is determined based on fair value less cost to sell, the recoverable amount of all other nonfinancial assets is determined based on the asset’s value in use computation which considers the present value of estimated future cash flows expected to be generated from the continued use of the asset. The Group is required to make estimates and assumptions that can materially affect the carrying amount of the asset being assessed.
The carrying values of the Group’s nonfinancial assets are disclosed in Notes 12 and 13.
4. FINANCIAL INSTRUMENT CATEGORIES
The following table presents the total carrying amount of the Group’s and the Parent Company’s financial instruments per category:
Consolidated Parent Company2017 2016 2017 2016
Financial assetsCash and other cash items P12,685,984 P12,010,543 P11,160,173 P10,580,748Financial assets at FVPL 16,238,888 7,703,899 16,056,823 7,232,882AFS financial assets 46,445,391 33,873,723 42,937,083 31,153,750HTM financial assets 65,286,267 57,404,800 61,533,493 54,069,021Loans and receivables: Due from BSP 98,490,014 91,964,495 91,717,037 85,307,128 Due from other banks 15,641,476 11,332,236 14,066,620 9,689,165 SPURA 18,751,845 3,451,543 17,347,522 2,958,465 Loans and receivables 448,970,942 386,827,300 386,554,498 329,069,859 Accrued interest receivable 3,718,505 3,014,529 3,189,083 2,666,353 Other assets 3,645,678 4,933,768 1,594,757 2,990,134
589,218,460 501,523,871 514,469,517 432,681,104 Total financial assets P729,874,990 P612,516,836 P646,157,089 P535,717,505*Other assets include accounts receivables, SCR, RCOCI and miscellaneous financial assets (Note 15).

Financial Statements 137
Consolidated Parent Company2017 2016 2017 2016
Financial liabilities Other financial liabilities: Deposit liabilities P635,093,393 P541,583,018 P559,235,979 P470,961,992 Bills payable 20,118,031 16,954,998 20,118,031 16,954,998 Manager’s checks 2,441,042 2,029,778 1,709,248 1,445,585 Accrued interest and other expenses* 1,381,441 870,204 1,068,572 577,550 Other liabilities** 5,399,076 5,238,408 3,509,795 4,089,817
664,432,983 566,676,406 585,641,625 494,029,942Financial liabilities at FVPL: Derivative liabilities 267,533 243,198 267,533 243,198 Total financial liabilities P664,700,516 P566,919,604 P585,909,158 P494,273,140*Accrued interest and other expenses includes accrued interest payable and accrued other expenses payable (Note 19).**Other liabilities exclude withholding taxes payable and retirement liabilities (Note 20).
5. FAIR VALUE MEASUREMENT
The Group has assets and liabilities in the consolidated and Parent Company balance sheets that are measured at fair value on a recurring and non-recurring basis after initial recognition. Recurring fair value measurements are those that another PFRS requires or permits to be recognized in the balance sheet at the end of each financial reporting period. These include financial assets and liabilities at FVPL and AFS financial assets. Non-recurring fair value measurements are those that another PFRS requires or permits to be recognized in the balance sheet in particular circumstances. For example, PFRS 5 requires an entity to measure an asset held for sale at the lower of its carrying amount and fair value less costs to sell. Since the asset’s fair value less costs to sell is only recognized in the balance sheet when it is lower than its carrying amount, that fair value measurement is non-recurring.
As of December 31, 2017 and 2016, except for the following financial instruments, the carrying values of the Group’s financial assets and liabilities as reflected in the balance sheets and related notes approximate their respective fair values:
Consolidated2017 2016
Carrying Value Fair Value Carrying Value Fair ValueFinancial AssetsHTM financial assets (Note 9) Government bonds P52,998,477 P51,488,294 P42,638,409 P40,492,328 Private bonds 12,287,790 12,110,870 14,766,391 14,581,086Loans and receivables (Note 10) Corporate and commercial loans 365,117,654 349,880,762 315,140,091 294,494,449 Consumer loans 71,577,984 74,207,566 58,528,805 53,251,627 Trade-related loans 12,062,711 12,041,107 12,767,908 12,945,460 Others 212,593 196,307 390,496 309,048Sales contracts receivable (Note 15) 918,147 1,060,191 893,084 876,406Financial LiabilitiesDeposit liabilities (Note 17) 292,083,031 282,586,204 265,164,139 257,683,489Bills payable (Note 18) − − 16,954,998 16,409,581

China Bank Annual Financial and Sustainability Report 2017138
Parent Company2017 2016
Carrying Value Fair Value Carrying Value Fair ValueFinancial AssetsHTM financial assets (Note 9) Government bonds P50,263,703 P48,754,016 P39,952,630 P37,832,994 Private bonds 11,269,790 11,354,669 14,116,391 13,939,793Loans and receivables (Note 10) Corporate and commercial loans 333,430,383 315,853,285 283,740,901 264,258,587 Consumer loans 42,556,905 41,952,821 34,149,927 29,357,086 Trade-related loans 10,513,204 10,417,129 11,110,851 11,289,013 Others 54,006 63,198 68,180 79,805Sales contracts receivable (Note 15) 184,092 200,134 224,149 267,688Financial LiabilitiesDeposit liabilities (Note 17) 240,712,750 236,777,045 215,924,029 207,506,093Bills payable (Note 18) − − 16,954,998 16,409,581
The methods and assumptions used by the Group and Parent Company in estimating the fair values of the financial instruments follow:
Cash and other cash items, due from BSP and other banks, SPURA and accrued interest receivable - The carrying amounts approximate their fair values in view of the relatively short-term maturities of these instruments.
Debt securities - Fair values are generally based on quoted market prices. If the market prices are not readily available, fair values are estimated using either values obtained from independent parties offering pricing services or adjusted quoted market prices of comparable investments or using the discounted cash flow methodology.
Equity securities - For publicly traded equity securities, fair values are based on quoted prices. For unquoted equity securities for which no reliable basis for fair value measurement is available, these are carried at cost net of impairment, if any.
Loans and receivables and sales contracts receivable (SCR) included in other assets - Fair values of loans and receivables and SCR are estimated using the discounted cash flow methodology, where future cash flows are discounted using the Group’s current incremental lending rates for similar types of loans and receivables.
Accounts receivable, RCOCI and other financial assets included in other assets - Quoted market prices are not readily available for these assets. These are reported at cost and are not significant in relation to the Group’s total portfolio of securities.
Derivative instruments (included under FVPL) - Fair values are estimated based on discounted cash flows, using prevailing interest rate differential and spot exchange rates.
Deposit liabilities (time, demand and savings deposits) - Fair values of time deposits are estimated using the discounted cash flow methodology, where future cash flows are discounted using the Group’s current incremental borrowing rates for similar borrowings and with maturities consistent with those remaining for the liability being valued. For demand and savings deposits, carrying amounts approximate fair values considering that these are currently due and demandable.
Bills payable - Fair values are estimated using the discounted cash flow methodology, where future cash flows are discounted using the current incremental borrowing rates for similar borrowings and with maturities consistent with those remaining for the liability being valued.
Manager’s checks and accrued interest and other expenses - Carrying amounts approximate fair values due to the short-term nature of the accounts.
Other liabilities - Quoted market prices are not readily available for these liabilities. These are reported at cost and are not significant in relation to the Group’s total portfolio.

Financial Statements 139
Fair Value HierarchyThe Group uses the following hierarchy for determining and disclosing the fair value of assets and liabilities by valuation technique:
Level 1: quoted prices in active markets for identical assets or liabilities;Level 2: inputs other than quoted prices included in Level 1 that are observable for the asset or liability, either directly (as prices) or indirectly (derived from prices); andLevel 3: inputs that are not based on observable market data or unobservable inputs.
As of December 31, 2017 and 2016, the fair value hierarchy of the Group’s and the Parent Company’s assets and liabilities are presented below:
Consolidated2017
Level 1 Level 2 Level 3 TotalRecurring fair value measurements(a)
Financial assets at FVPL Held-for-trading Government bonds P5,792,345 P119,314 P– P5,911,659 Treasury notes 1,413,940 479,252 – 1,893,192
Treasury bills 315,996 1,709,371 – 2,025,367Private bonds 2,663,397 – – 2,663,397
Financial assets designated at FVPL 3,411,686 – – 3,411,686 Derivative assets – 333,587 – 333,587AFS financial assets Government bonds 25,761,577 9,467,927 – 35,229,504 Quoted private bonds 11,051,657 38,781 – 11,090,438 Quoted equity shares 67,903 – – 67,903
P50,478,501 P12,148,232 P– P62,626,733Financial liabilities at FVPL Derivative liabilities P– P267,533 P– P267,533
P– P267,533 P– P267,533Fair values of assets carried at amortized cost/cost(a)
HTM financial assets Government bonds P51,488,294 P– P– P51,488,294 Private bonds 12,110,870 – – 12,110,870Loans and receivables Corporate and commercial loans – – 349,880,762 349,880,762 Consumer loans – – 74,207,566 74,207,566 Trade-related loans – – 12,041,107 12,041,107 Others – – 196,307 196,307Sales contracts receivable – – 1,060,191 1,060,191Investment properties(b)
Land – – 7,091,280 7,091,280 Buildings and improvements – – 2,406,887 2,406,887
P63,599,164 P– P446,884,100 P510,483,264Fair values of liabilities carried at amortized cost(a)
Deposit liabilities P– P– P625,596,566 P625,596,566Bills payable P– P– P19,825,796 P19,825,796
P– P– P645,422,362 P645,422,362(a) valued as of December 31, 2017(b) valued at various dates in 2017 and 2016

China Bank Annual Financial and Sustainability Report 2017140
Consolidated2016
Level 1 Level 2 Level 3 TotalRecurring fair value measurements(a)
Financial assets at FVPL Held-for-trading Government bonds P2,322,038 P82,011 P– P2,404,049 Treasury notes 307,455 724,220 – 1,031,675 Treasury bills papers − 994,203 – 994,203 Private bonds 594,798 − – 594,798 Financial assets designated at FVPL 2,462,886 − – 2,462,886 Derivative assets − 216,288 – 216,288AFS financial assets Government bonds 21,822,016 − – 21,822,016 Quoted private bonds 4,735,050 6,682,562 – 11,417,612 Quoted equity shares 80,947 − – 80,947
P32,325,190 P8,699,284 P– P41,540,049Financial liabilities at FVPL Derivative liabilities P− P243,198 P− P243,198
P− P243,198 P− P243,198Fair values of assets carried at amortized cost/cost(a)
HTM financial assets Government bonds P40,492,328 P− P− P40,492,328 Private bonds 14,581,086 − − 14,581,086Loans and receivables Corporate and commercial loans − − 294,494,449 294,494,449 Consumer loans − − 53,251,627 53,251,627 Trade-related loans − − 12,945,460 12,945,460 Others − − 309,048 309,048Sales contracts receivable − − 876,406 876,406Investment properties(b)
Land − − 6,763,387 6,763,387 Buildings and improvements − − 2,221,151 2,221,151
P55,073,414 P− P370,861,528 P425,934,942 Fair values of liabilities carried at amortized cost(a)
Deposit liabilities P− P− P534,102,368 P534,102,368Bills payable − − 16,409,581 16,409,581
P− P− P550,511,949 P550,511,949(a) valued as of December 31, 2016(b) valued at various dates in 2016 and 2015

Financial Statements 141
Parent Company2017
Level 1 Level 2 Level 3 TotalRecurring fair value measurements(a)
Financial assets at FVPL Held-for-trading Government bonds P5,757,518 P119,314 P− P5,876,832 Treasury notes 1,313,369 479,252 − 1,792,621 Treasury bills 315,996 1,709,371 − 2,025,367 Private bonds 2,616,730 – − 2,616,730 Financial assets designated at FVPL 3,411,686 – − 3,411,686 Derivative assets − 333,587 − 333,587AFS financial assets
Government bonds 22,905,417 9,467,927 − 32,373,344Quoted private bonds 10,483,794 − − 10,483,794Quoted equity shares 67,903 − − 67,903
P46,872,413 P12,109,451 P− P58,981,864Financial liabilities at FVPL Derivative liabilities P− P267,533 P− P267,533
P− P267,533 P− P267,533Fair values of assets carried at amortized cost/cost(a)
HTM financial assets Government bonds P48,754,016 P− P− P46,784,643 Private bonds 11,354,669 − − 13,324,042Loans and receivables Corporate and commercial loans − − 315,853,285 315,853,285 Consumer loans − − 41,952,821 41,952,821 Trade-related loans − − 10,417,129 10,417,129 Others − − 63,198 63,198Sales contracts receivable − − 200,134 200,134Investment properties(b) Land − − 4,225,706 4,225,706 Buildings and improvements − − 970,099 970,099
P60,108,685 P− P373,682,372 P433,791,057Fair values of liabilities carried at amortized costDeposit liabilities P− P− P549,154,172 P549,154,172Bills payable − − 19,825,796 19,825,796
P− P− P568,979,968 P568,979,968(a) valued as of December 31, 2017(b) valued at various dates in 2017 and 2016

China Bank Annual Financial and Sustainability Report 2017142
Parent Company2016
Level 1 Level 2 Level 3 TotalRecurring fair value measurements(a)
Financial assets at FVPL Held-for-trading Government bonds P2,158,476 P82,012 P− P2,240,488 Treasury notes − 724,219 − 724,219 Treasury bills − 994,203 − 994,203 Private bonds 594,798 − − 594,798 Financial assets designated at FVPL 2,462,886 − − 2,462,886 Derivative assets − 216,288 − 216,288AFS financial assets
Government bonds 20,561,662 − − 20,561,662Quoted private bonds 3,809,166 6,682,562 − 10,157,258
Quoted equity shares 80,947 − − 80,947P29,667,935 P8,699,284 P− P38,032,749
Financial liabilities at FVPL Derivative liabilities P− P243,198 P− P243,198
P− P243,198 P− P243,198Fair values of assets carried at amortized cost/cost(a)
HTM financial assets Government bonds P37,832,994 P− P− P37,832,994 Private bonds 13,939,793 − − 13,939,793Loans and receivables Corporate and commercial loans − − 264,258,587 264,258,587 Consumer loans − − 29,357,086 29,357,086 Trade-related loans − − 11,289,013 11,289,013 Others − − 79,805 79,805Sales contracts receivable − − 267,688 267,688Investment properties(b)
Land − − 4,526,165 4,526,165 Buildings and improvements − − 1,074,228 1,074,228
P51,772,787 P− P310,852,572 P362,625,359Fair values of liabilities carried at amortized costDeposit liabilities P− P− P462,544,056 P462,544,056Bills payable − − 16,409,581 16,409,581
P− P− P478,953,637 P478,953,637(a) valued as of December 31, 2016(b) valued at various dates in 2016 and 2015
There were no transfers between Level 1 and Level 2 fair value measurements and no transfers into and out of Level 3 fair value measurements in 2017 and 2016.
The inputs used in the fair value measurement based on Level 2 are as follows:
Government securities - interpolated rates based on market rates of benchmark securities as of reporting date.
Private bonds and commercial papers - quoted market price of comparable investments with credit risk premium that is insignificant to the entire fair value measurement.
Derivative assets and liabilities - fair values are calculated by reference to the prevailing interest differential and spot exchange rate as of the reporting date, taking into account the remaining term to maturity of the derivative assets and liabilities.

Financial Statements 143
Inputs used in estimating fair values of financial instruments carried at cost and categorized under Level 3 include risk-free rates and applicable risk premium.
The fair values of the Group’s and Parent Company’s investment properties have been determined by the appraisal method by independent external and in-house appraisers based on highest and best use of property being appraised. Valuations were derived on the basis of recent sales of similar properties in the same areas as the investment properties and taking into account the economic conditions prevailing at the time the valuations were made and comparability of similar properties sold with the property being valued.
The table below summarizes the valuation techniques used and the significant unobservable inputs valuation for each type of investment properties held by the Group and the Parent Company:
Valuation Techniques Significant Unobservable Inputs
Land Market Data Approach Price per square meter, size, location, shape, time element and corner influence
Land and Building Market Data Approach and Cost Approach Reproduction Cost New
Description of the valuation techniques and significant unobservable inputs used in the valuation of the Group and the Parent Company’s investment properties are as follows:
Valuation TechniquesMarket Data Approach A process of comparing the subject property being appraised to similar comparable properties recently
sold or being offered for sale.
Cost Approach It is an estimate of the investment required to duplicate the property in its present condition. It is reached by estimating the value of the building “as if new” and then deducting the depreciated cost. Fundamental to the Cost Approach is the estimate of Reproduction Cost New of the improvements.
Significant Unobservable InputsReproduction Cost New The cost to create a virtual replica of the existing structure, employing the same design and similar
building materials.
Size Size of lot in terms of area. Evaluate if the lot size of property or comparable conforms to the average cut of the lots in the area and estimate the impact of lot size differences on land value.
Shape Particular form or configuration of the lot. A highly irregular shape limits the usable area whereas an ideal lot configuration maximizes the usable area of the lot which is associated in designing an improvement which conforms with the highest and best use of the property.
Location Location of comparative properties whether on a Main Road, or secondary road. Road width could also be a consideration if data is available. As a rule, properties located along a Main Road are superior to properties located along a secondary road.
Time Element “An adjustment for market conditions is made if general property values have appreciated or depreciated since the transaction dates due to inflation or deflation or a change in investors’ perceptions of the market over time”. In which case, the current data is superior to historic data.
Discount Generally, asking prices in ads posted for sale are negotiable. Discount is the amount the seller or developer is willing to deduct from the posted selling price if the transaction will be in cash or equivalent.
Corner influence Bounded by two (2) roads.

China Bank Annual Financial and Sustainability Report 2017144
6. FINANCIAL RISK MANAGEMENT OBJECTIVES AND POLICIES
The Group’s activities are principally related to the profitable use of financial instruments. Risks are inherent in these activities but are managed by the Group through a rigorous, comprehensive and continuous process of identification, measurement, monitoring and mitigation of these risks, partly through the effective use of risk and authority limits and thresholds, process controls and monitoring, and independent controls. As reflected in its corporate actions and organizational improvements, the Group has placed due importance on expanding and strengthening its risk management process and considers it as a vital component to the Group’s continuing profitability and financial stability. Central to the Group’s risk management process is its adoption of a risk management program intended to avoid unnecessary risks, manage and mitigate unavoidable risks and maximize returns from taking acceptable risks necessary to sustain its business viability and good financial position in the market.
The key financial risks that the Group faces are: credit risk, market risk (i.e. interest rate risk, foreign currency risk and equity price risk) and liquidity risk. The Group’s risk management objective is primarily focused on controlling and mitigating these risks. The Parent Company and its subsidiaries manage their respective financial risks separately. The subsidiaries, particularly CBSI, have their own risk management processes but are structured similar to that of the Parent Company. To a large extent, the respective risk management programs and objectives are the same across the Group. The gravity of the risks, the magnitude of the financial instruments involved, and regulatory requirements are primary considerations to the scope and extent of the risk management processes put in place for the subsidiaries.
Risk Management StructureThe BOD of the Parent Company is ultimately responsible for the oversight of the Parent Company’s risk management process. On the other hand, the risk management processes of the subsidiaries are the separate responsibilities of their respective BODs. The BOD of the Parent Company created a separate board-level independent committee with explicit authority and responsibility for managing and monitoring risks.
The BOD has delegated to the Risk Oversight Committee (ROC) the implementation of the risk management process which includes, among others, the development of various risk strategies and principles, control guidelines policies and procedures, implementation of risk measurement tools, monitoring of key risk indicators, and the imposition and monitoring of risk limits and thresholds. The ROC is composed of three members of the BOD, two of whom are independent directors.
The Risk Management Group (RMG) is the direct support of the ROC in the day-to-day risk management and the implementation of the risk management strategies approved by the ROC. The implementation cuts across all departments of the Parent Company and involves all of the Parent Company’s financial instruments, whether “on-books” or “off-books.” The RMG is likewise responsible for monitoring the implementation of specific risk control procedures and enforcing compliance thereto. The RMG is also directly involved in the day-to-day risk measurement and monitoring to make sure that the Parent Company, in its transactions and dealings, engages only in acceptable and manageable financial risks. The RMG also ensures that risk measurements are accurately and completely captured on a timely basis in the management reporting system of the Parent Company. The RMG regularly reports the results of the risk measurements to the ROC. The RMG is headed by the Chief Risk Officer (CRO).
Apart from RMG, each business unit has created and put in place various process controls which ensure that all the external and internal transactions and dealings of the unit are in compliance with the unit’s risk management objectives.
The Internal Audit Division also plays a crucial role in risk management primarily because it is independent of the business units and reports exclusively to the Audit Committee which, in turn, is comprised of independent directors. The Internal Audit Division focuses on ensuring that adequate controls are in place and on monitoring compliance to controls. The regular audit covers all processes and controls, including those under the risk management framework handled by the RMG. The audit of these processes and controls is undertaken at least annually. The audit results and exceptions, including recommendations for their resolution or improvement, are discussed initially with the business units concerned before these are presented to the Audit Committee.
Risk Management ReportingThe CRO and other members of the RMG report to the ROC and are a resource to the Management Committee (ManCom) on a monthly and a weekly basis, respectively. The CRO reports on key risk indicators and specific risk management issues that would need resolution from top management. This is undertaken after the risk issues and key risk indicators have been discussed with the business units concerned.
The key risk indicators were formulated on the basis of the financial risks faced by the Parent Company. The key risk indicators contain information from all business units that provide measurements on the level of the risks taken by the Parent Company in its products, transactions and financial structure. Among others, the report on key risk indicators includes information on the Parent Company’s aggregate credit exposure, credit metric forecasts, hold limit exceptions, Value-at-Risk (VaR) analysis, utilization of market and credit limits and thresholds, liquidity risk limits and ratios, overall loan loss provisioning and risk profile changes. Loan loss provisioning and credit limit utilization are, however, discussed in more detail in the Credit Committee. On a monthly basis, detailed reporting of single-name and sectoral concentration is included in the discussion with the ROC. On the other hand, the Chief Internal Auditor reports to the Audit Committee on a monthly basis on the results of branch or business unit audits and for the resolution of pending but important internal audit issues.
Risk MitigationThe Parent Company uses derivatives to manage exposures in its financial instruments resulting from changes in interest rates and foreign currencies exposures. However, the nature and extent of use of these financial instruments to mitigate risks are limited to those allowed by the BSP for the Parent Company and its subsidiaries.

Financial Statements 145
To further mitigate risks throughout its different business units, the Parent Company formulates risk management policies and continues to improve its existing policies. These policies further serve as the framework and set of guidelines in the creation or revisions of operating policies and manuals for each business unit. In the process design and implementation, preventive controls are preferred over detection controls. Clear delineation of responsibilities and separation of incompatible duties among officers and staff, as well as, among business units are reiterated in these policies. To the extent possible, reporting and accounting responsibilities are segregated from units directly involved in operations and front line activities (i.e., players must not be scorers). This is to improve the credibility and accuracy of management information. Any inconsistencies in the operating policies and manuals with the risk framework created by the RMG are taken up and resolved in the ROC and ManCom.
Based on the approved Operational Risk Assessment Program, RMG spearheaded the bankwide (all Head Office units and branches) risk identification and self-assessment process. This would enable determination of priority risk areas, assessment of mitigating controls in place, and institutionalization of additional measures to ensure a controlled operating environment. RMG was also mandated to maintain and update the Parent Company’s Centralized Loss Database wherein all reported incidents of losses shall be encoded to enable assessment of weaknesses in the processes and come up with viable improvements to avoid recurrence.
Monitoring and controlling risks are primarily performed based on various limits and thresholds established by the top management covering the Group’s transactions and dealings. These limits and thresholds reflect the Group’s business strategies and market environment, as well as, the levels of risks that the Group is willing to tolerate, with additional emphasis on selected industries. In addition, the Parent Company monitors and measures the overall risk-bearing capacity in relation to the aggregate risk exposure across all risk types and activities.
Liquidity and interest rate risk exposures are measured and monitored through the Maximum Cumulative Outflow and Earnings-at-Risk reports from the Asset and Liability Management (ALM) system. It was implemented in 2013 and was upgraded in 2016 to a new version which include modules for calculating Liquidity Coverage Ratio (LCR) and Net Stable Funding Ratio (NSFR). The system also has a Funds Transfer Pricing module used by the Treasury Group and Corporate Planning Group.
For the measurement of market risk exposures, the Bank uses Historical Simulation VaR approach for all treasury traded instruments, including fixed income bonds, foreign exchange swaps and forwards, interest rate swaps and equity securities. Market risk exposures are measured and monitored through reports from the Market Risk Management System which has been implemented in 2016 to enhance risk measurement and automate daily reporting.
BSP issued Circular No. 639 dated January 15, 2009 which mandated the use of the Internal Capital Adequacy Assessment Process (ICAAP) by all universal and commercials banks to determine their minimum required capital relative to their business risk exposures. In this regard, the Board approved the engagement of the services of a consultant to assist in the bank-wide implementation and embedding of the ICAAP, as provided for under Pillar 2 of Basel II and BSP Circular No. 639.
On April 5, 2017, the BOD approved the inclusion of cybersecurity as part of the priority risks related to Information Technology. This is in addition to the priority risks set in the 2009 Risk Self-assessment Survey and voting conducted among selected members of the BOD and Senior Management which were retained on the basis that there is no significant change in either the business model of the Bank or its ownership structure. In addition, the BOD also approved the changes in the trigger events for the review of Capital Ratios MAT and the retention of the methodology for the CET1 ratio limit and the Management Action Trigger (MAT) on capital ratios. There were no changes made in the approved trigger events for the review of Priority Risks.
The Parent Company submitted its annually updated ICAAP document, in compliance with BSP requirements on March 31, 2017. The document disclosed that the Parent Company has an appropriate level of internal capital relative to the Group’s risk profile.
For the ICAAP document submitted on March 31, 2017, the Parent Company retained the Pillar 1 Plus approach using the Pillar 1 capital as the baseline. The process of allocating capital for all types of risks above the Pillar 1 capital levels includes quantification of capital buffer for Pillar 2 risks under normal business cycle/condition, in addition to the quantification based on the results of the Integrated Stress Test (IST). The adoption of the IST allows the Parent Company to quantify its overall vulnerability to market shocks and operational losses in a collective manner driven by events rather than in silo. The capital assessment in the document discloses that the Group and the Parent Company has appropriate and sufficient level of internal capital.
Credit Risk
Credit Risk and Concentration of Assets and Liabilities and Off-Balance Sheet ItemsCredit risk is the risk of financial loss on account of a counterparty to a financial product failing to honor its obligation. The Group faces potential credit risks every time it extends funds to borrowers, commits funds to counterparties, guarantees the paying performance of its clients, invests funds to issuers (i.e., investment securities issued by either sovereign or corporate entities) or enters into either market-traded or over-the-counter derivatives, through implied or actual contractual agreements (i.e., on or off-balance sheet exposures). The Group manages its credit risk at various levels (i.e., strategic level, portfolio level down to individual credit or transaction).
The Group established risk limits and thresholds for purposes of monitoring and managing credit risk from individual counterparties and/or groups of counterparties, as well as industry divisions. It also conducts periodical assessment of the creditworthiness of its counterparties. In addition, the Group obtains collateral where appropriate, enters into master netting agreements and collateral arrangements with counterparties, and limits the duration of exposures.

China Bank Annual Financial and Sustainability Report 2017146
In compliance with BSP requirements, the Group established an internal Credit Risk Rating System (CRRS) for the purpose of measuring credit risk for corporate borrowers in a consistent manner, as accurately as possible, and thereafter uses the risk information for business and financial decision making. The CRRS covers corporate borrowers with total assets, total facilities, or total credit exposures amounting to P15.00 million and above.
Further, the CRRS was designed within the technical requirements defined under BSP Circular No. 439. It has two components, namely: a) Borrower Risk Rating which provides an assessment of the creditworthiness of the borrower, without considering the proposed facility and security arrangements, and b) Loan Exposure Rating which provides an assessment of the proposed facilities as mitigated or enhanced by security arrangements. The CRRS rating scale consists of ten grades, six of which fall under unclassified accounts, with the remaining four falling under classified accounts in accordance with regulatory provisioning guidelines.
On March 5, 2014, the Parent Company approved the engagement of a third-party consultant, Moody’s Analytics, for the quantitative and qualitative validation of the internal CRRS. The validation engagement was completed in December 2014 followed by the model recalibration, closing the project in December 2015.
Aside from the internal CRRS, the Parent Company launched in 2011 the Borrower Credit Score (BCS), a credit scoring system designed for retail small and medium entities and individual loan accounts. In 2016, RMG completed the statistical validation of the BCS using the same methodology applied to the validation of the corporate risk rating model. The validation process was conducted with the assistance of Teradata which provided the analytics platform, tools and technical guidance for both credit model performance assessment and recalibration.
Furthermore, RMG also developed a Sovereign Risk Rating Model, which provided the tool for the Bank to assess the strength of the country rated in reference to its economic fundamentals, fiscal policy, institutional strength, and vulnerability to extreme events. The Model was approved by the Board on September 7, 2016.
Excessive Risk ConcentrationConcentrations arise when a number of counterparties are engaged in similar business activities, or activities in the same geographic region, or have similar economic features that would cause their ability to meet contractual obligations to be similarly affected by changes in economic, political or other conditions. Concentrations indicate the relative sensitivity of the Parent Company’s performance to developments affecting a particular industry or geographical location.
In order to avoid excessive concentrations of risk, the Parent Company’s policies and procedures include specific guidelines focusing on maintaining a diversified portfolio. Identified concentrations of credit risks are controlled and managed accordingly.
The distribution of the Group’s and Parent Company’s assets and liabilities, and credit commitment items (Note 30) by geographic region as of December 31, 2017 and 2016 (in millions) follows:
Consolidated2017 2016
Assets Liabilities Commitment Assets Liabilities Commitment Geographic Region
Philippines P711,801 P651,283 P58,135 P557,597 P549,944 P56,813Asia 8,530 3,850 20,151 8,065 13,200 3,629Europe 5,442 2,952 5,431 3,608 1,050 808United States 499 6,616 2,794 33,336 1,240 6,287Others 3,603 − 4 9,911 1,486 14
P729,875 P664,701 P86,515 P612,517 P566,920 P67,551
Parent Company2017 2016
Assets Liabilities Commitment Assets Liabilities Commitment Geographic Region
Philippines P629,802 P572,601 P187,151 P480,892 P477,297 P52,965 Asia 6,905 3,740 20,151 8,065 13,200 3,629 Europe 5,442 2,952 5,431 3,608 1,050 808 United States 405 6,616 2,794 33,242 1,240 6,287 Others 3,603 − 4 9,911 1,486 14
P646,157 P585,909 P215,531 P535,718 P494,273 P63,703

Financial Statements 147
Information on credit concentration as to industry of loans and receivables is presented in Note 10 to the financial statements.
Maximum exposure to credit riskThe tables below provide the analysis of the maximum exposure to credit risk of the Group and the Parent Company’s financial instruments, excluding those where the carrying values as reflected in the balance sheets and related notes already represent the financial instrument’s maximum exposure to credit risk, before and after taking into account collateral held or other credit enhancements:
Consolidated2017
Gross maximum exposure Net exposure
Financial effect of collateral or
credit enhancementCredit risk exposure relating to on-balance sheet items
are as follows Loans and receivables P448,970,942 P237,847,050 P211,123,892 SPURA 18,751,845 1,865 18,749,980 Sales contracts receivable 894,843 – 894,843
P468,617,630 P237,848,915 P230,768,715
Consolidated2016
Gross maximum exposure Net exposure
Financial effect of collateral or
credit enhancement
Credit risk exposure relating to on-balance sheet items are as follows
Loans and receivables P386,827,300 P209,916,716 P176,779,137 SPURA 3,451,543 343 3,451,200 Sales contracts receivable 893,084 – 893,084
P391,171,927 P209,917,059 P181,123,421
Parent Company2017
Gross maximum exposure Net exposure
Financial effect of collateral or
credit enhancement
Credit risk exposure relating to on-balance sheet items are as follows
Loans and receivables P386,554,498 P229,957,505 P126,596,993 SPURA 17,347,522 2,000 17,345,522 Sales contracts receivable 184,091 – 184,091
P404,086,111 P229,960,505 P144,216,606
Parent Company2016
Gross maximum exposure Net exposure
Financial effect of collateral or
credit enhancement
Credit risk exposure relating to on-balance sheet items are as follows
Loans and receivables P329,069,859 P189,224,249 P139,845,609 SPURA 2,958,465 341 2,958,124 Sales contracts receivable 224,149 – 224,149
P332,252,473 P189,224,590 P143,027,882

China Bank Annual Financial and Sustainability Report 2017148
For the Group, the fair values of collateral held for loans and receivables and sales contracts receivable amounted to P330.43 billion and P1.34 billion, respectively, as of December 31, 2017 and P250.62 billion and P1.60 billion, respectively, as of December 31, 2016.
For the Parent Company, the fair values of collateral held for loans and receivables and sales contracts receivable amounted to P294.54 billion and P1.04 billion, respectively, as of December 31, 2017 and P202.74 billion and P1.36 billion, respectively, as of December 31, 2016.
Credit risk, in respect of derivative financial products, is limited to those with positive fair values, which are included under financial assets at FVPL (Note 9). As a result, the maximum credit risk, without taking into account the fair value of any collateral and netting agreements, is limited to the amounts on the balance sheet plus commitments to customers such as unused commercial letters of credit, outstanding guarantees and others as disclosed in Note 30 to the financial statements.
Collateral and other credit enhancementsThe amount and type of collateral required depends on an assessment of the credit risk of the counterparty. Guidelines are implemented with regard to the acceptability of types of collateral and valuation parameters.
The main types of collateral obtained are as follows:• For securities lending and reverse repurchase transactions - cash or securities• For consumer lending - real estate and chattel over vehicle• For corporate lending and commercial lending- real estate, chattel over properties, assignment of deposits, shares of stocks, bonds,
and guarantees
Management requests additional collateral in accordance with the underlying agreement and takes into consideration the market value of collateral during its review of the adequacy of allowance for credit losses.
It is the Group’s policy to dispose of repossessed properties in an orderly fashion. The proceeds are used to reduce or repay the outstanding claim. In most cases, the Parent Company does not occupy repossessed properties for business use.
Credit quality per class of financial assetsThe credit quality of financial assets is managed by the Group using an internal credit rating system for the purpose of measuring credit risk in a consistent manner as accurately as possible. The model on risk ratings is assessed regularly because the Group uses this information as a tool for business and financial decision making. Aside from the periodic review by the Bank’s Internal Audit Group, the Bank likewise engaged the services of third-party consultants in 2014, 2015, and 2016 for purposes of conducting an independent validation of the credit risk rating model.
It is the Parent Company’s policy to maintain accurate and consistent risk ratings across the credit portfolio. This facilitates focused management of the applicable risks and the comparison of credit exposures across all lines of business, geographic regions and products. The rating system is supported by a variety of financial analytics, combined with processed market information to provide the main inputs for the measurement of counterparty risk. All internal risk ratings are tailored to the various categories and are derived in accordance with the Parent Company’s rating policy. The attributable risk ratings are assessed and monitored regularly. The standard credit rating equivalent grades are relevant only for certain exposures in each risk rating class.
The following table shows the description of the internal CRRS grade:
CRRS Grade Description1 Excellent2 Strong3 Good4 Satisfactory5 Acceptable6 Watchlist7 Especially Mentioned8 Substandard9 Doubtful10 Loss
The credit grades are defined as follows:
Excellent - This category applies to a borrower with a very low probability of going into default in the coming year. The borrower has a high degree of stability, substance, and diversity. It has access to raise substantial amounts of funds through the public markets at any time. The borrower has a very strong debt service capacity and a conservative use of balance sheet leverage. The track record in profit terms is very good. The borrower is of highest quality under virtually all economic conditions.

Financial Statements 149
Strong - This category applies to a borrower with a low probability of going into default in the coming year. The borrower normally has a comfortable degree of stability, substance, and diversity. Under normal market conditions, the borrower in this category has good access to public markets to raise funds. The borrower has a strong market and financial position with a history of successful performance. The overall debt service capacity as measured by cash flow to total debt service is deemed very strong; the critical balance sheet ratios (vis-à-vis industry) are conservative.
Good - This category covers the smaller corporations with limited access to public capital markets or access to alternative financial markets. This access is however limited to favorable economic and/or market conditions. Typical for this type of borrower is the combination of comfortable asset protection and acceptable balance sheet structure (vis-à-vis industry). The debt service capacity, as measured based on cash flows, is strong.
Satisfactory - This category represents the borrower where clear risk elements exist and the probability of default is somewhat greater. This probability is reflected in volatility of earnings and overall performance. The borrower in this category normally has limited access to public financial markets. The borrower should be able to withstand normal business cycles, but any prolonged unfavorable economic period would create deterioration beyond acceptable levels. Typical for this kind of borrower is the combination of reasonably sound asset and cash flow protection. The debt service capacity as measured by cash flow is deemed adequate. The borrower has reported profits for the past fiscal year and is expected to report a profit in the current year.
Acceptable - The risk elements for the Parent Company are sufficiently pronounced, although the borrower should still be able to withstand normal business cycles. Any prolonged unfavorable economic and/or market period would create an immediate deterioration beyond acceptable levels.
Watchlist - This category represents the borrower for which unfavorable industry or company-specific risk factors represent a concern. Operating performance and financial strength may be marginal and it is uncertain whether the borrower can attract alternative sources of financing. The borrower will find it very hard to cope with any significant economic downturn and a default in such a case is more than a possibility. It includes the borrower where the credit exposure is not a risk of loss at the moment, but the performance of the borrower has weakened, and unless present trends are reversed, could lead to losses.
Especially Mentioned - This category applies to the borrower that is characterized by a reasonable probability of default, manifested by some or all the following: (a) evidence of weakness in the borrower’s financial condition or creditworthiness; (b) unacceptable risk is generated by potential or emerging weaknesses as far as asset protection and/or cash flow is concerned; (c) the borrower has reached a point where there is a real risk that the borrower’s ability to pay the interest and repay the principal timely could be jeopardized; (d) the borrower is expected to have financial difficulties and exposure may be at risk. Closer account management attention is warranted.
Concerted efforts should be made to improve lender’s position (e.g., demanding additional collateral or reduction of account exposure). These potential weaknesses, if left uncorrected or unmitigated, would affect the repayment of the loan and, thus, increase credit risk to the Parent Company.
Substandard - This category represents the borrower where one or more of the following factors apply: (a) the collection of principal or interest becomes questionable regardless of scheduled payment date, by reason of adverse developments on account of a financial, managerial, economic, or political nature, or by important weaknesses in cover; (b) the probability of default is assessed at up to 50%. Substandard loans are loans or portions thereof which appear to involve a substantial and unreasonable degree of risk to the Parent Company because of unfavorable record or unsatisfactory characteristics. There exists in such loans the possibility of future loss to the Parent Company unless given closer supervision.
Doubtful - This category includes the borrower with “non-performing loan” status or with any portion of interest and/or principal payment is in arrears for more than ninety (90) days. The borrower is unable or unwilling to service debt over an extended period of time and near future prospects of orderly debt service is doubtful. Doubtful loans are loans or portions thereof which have the weaknesses inherent in those classified as “Substandard”, with the added characteristics that existing facts, conditions, and values make collection or liquidation in full highly improbable and in which substantial loss is probable.
Loss - This category represents the borrower whose prospect for re-establishment of creditworthiness and debt service is remote. It also applies where the Parent Company will take or has taken title to the assets of the borrower and is preparing a foreclosure and/or liquidation of the borrower’s business. These are loans or portions thereof which are considered uncollectible or worthless and of such little value that their continuance as bankable assets is not warranted although the loans may have some recovery or salvage value.
The ratings of the borrowers covered by the BCS were mapped to the abovementioned CRRS grades in accordance with the approved guidelines by the BOD.

China Bank Annual Financial and Sustainability Report 2017150
The Group’s loans and receivables from customers were classified according to credit quality as follows:
Credit Quality Rating CriteriaNeither Past Due Nor Impaired High Loans with risk rating of 1 and 2 Standard Loans with risk rating of 3 to 5 Sub-Standard Generally, loans with risk rating of 6 to 8Past Due and Impaired Past Due but not Impaired Those that were classified as Past Due per BSP guidelines or those that are still in
current status but have objective evidence of impairment; Generally, loans with risk rating of 9 to 10
Impaired
The table below shows the Group’s and the Parent Company’s loans and receivables, excluding other receivables (gross of allowance for impairment and credit losses and unearned discounts) as of December 31, 2017 and 2016 (in millions) classified according to credit quality:
Consolidated2017
Neither Past Due nor Impaired
High GradeStandard
GradeSubstandard
Grade Unrated*Past Due ButNot Impaired
Past Dueand Impaired Total
Corporate and commercial lending P56,547 P222,688 P81,679 P1,654 P2,341 P4,235 P369,144
Consumer lending 28,208 6,650 4,088 31,631 3,149 134 73,860Trade-related lending 2,397 8,117 1,671 – 37 28 12,250Others 18 1 3 164 27 152 365 Total P87,170 P237,456 P87,441 P33,448 P5,554 P4,549 P455,619* Includes auto/housing loans to individuals and credit card exposures that have been subjected to application scorecards resulting in PASS or FAIL assessments instead of credit grades
Consolidated2016
Neither Past Due nor Impaired
High GradeStandard
GradeSubstandard
Grade Unrated*Past Due ButNot Impaired
Past Dueand Impaired Total
Corporate and commercial lending P51,949 P194,211 P63,431 P2,941 P1,051 P6,150 P319,733
Consumer lending 22,997 5,989 3,308 24,388 3,155 579 60,416Trade-related lending 2,122 9,861 961 20 6 76 13,046Others 317 1 – 212 5 8 543Total P77,385 P210,062 P67,700 P27,561 P4,217 P6,813 P393,738* Includes auto/housing loans to individuals and credit card exposures that have been subjected to application scorecards resulting in PASS or FAIL assessments instead of credit grades
Parent Company2017
Neither Past Due nor Impaired
High GradeStandard
GradeSubstandard
Grade Unrated*Past Due ButNot Impaired
Past Due and Impaired Total
Corporate and commercial lending P27,318 P222,621 P81,297 P1,654 P1,395 P2,867 P337,152
Consumer lending 16 6,538 4,083 31,631 1,636 133 44,037Trade-related lending 835 8,118 1,670 – 37 28 10,688Others – 1 – 53 – – 54 Total P28,169 P237,278 P87,050 P33,338 P3,068 P3,028 P391,931* Includes auto/housing loans to individuals and credit card exposures that have been subjected to application scorecards resulting in PASS or FAIL assessments instead of credit grades

Financial Statements 151
Parent Company2016
Neither Past Due nor Impaired
High GradeStandard
GradeSubstandard
Grade Unrated*Past Due ButNot Impaired
Past Dueand Impaired Total
Corporate and commercial lending P23,263 P194,185 P63,039 P2,942 P761 P3,932 P288,122
Consumer lending 10 5,968 3,308 24,388 1,157 578 35,409Trade-related lending 453 9,861 961 20 6 76 11,377Others – 1 – 68 – – 69 Total P23,726 P210,015 P67,308 P27,418 P1,924 P4,586 P334,977* Includes auto/housing loans to individuals and credit card exposures that have been subjected to application scorecards resulting in PASS or FAIL assessments instead of credit grades
Depository accounts with the BSP and counterparty banks, Trading and Investment SecuritiesFor these financial assets, outstanding exposure is rated primarily based on external risk rating (i.e. Standard and Poor’s (S&P), otherwise, rating is based on risk grades by a local rating agency or included under “Unrated”, when the counterparty has no available risk grade.
The external risk rating of the Group’s depository accounts with the BSP and counterparty banks, trading and investment securities, is grouped as follows:
Credit Quality Rating External Credit Risk Rating Credit Rating AgencyHigh grade AAA, AA+, AA, AA- S&P
Aaa, Aa1, Aa2, Aa3 Moody’sAAA, AA+, AA, AA- Fitch
Standard grade A+, A, A-, BBB+, BBB, BBB- S&PA1, A2, A3, Baa1, Baa2, Baa3 Moody’sA+, A, A-, BBB+, BBB, BBB- Fitch
Substandard grade BB+, BB, BB-, B/B+, CCC, R, SD & D S&PBa1, Ba2, Ba3, B1, B2, R, SD & D Moody’sBB+, BB, BB-, B/B+, CCC, R, SD & D Fitch
Following is the credit rating scale applicable for foreign banks, and government securities (aligned with S&P ratings):
AAA - An obligor has extremely strong capacity to meet its financial commitments.
AA - An obligor has very strong capacity to meet its financial commitments. It differs from the highest-rated obligors at a minimal degree.
A - An obligor has strong capacity to meet its financial commitments but is somewhat more susceptible to the adverse effects of changes in circumstances and economic conditions than obligors in higher-rated categories.
BBB and below:
BBB - An obligor has adequate capacity to meet its financial commitments. However, adverse economic conditions or changing circumstances are more likely to lead to a weakened capacity of the obligor to meet its financial commitments.
BB - An obligor is less vulnerable in the near term than other lower-rated obligors. However, it faces major ongoing uncertainties and exposure to adverse business, financial, or economic conditions which could lead to the obligor’s inadequate capacity to meet its financial commitments.
B - An obligor is more vulnerable than the obligors rated ‘BB’, but the obligor currently has the capacity to meet its financial commitments. Adverse business, financial, or economic conditions will likely impair the obligor’s capacity or willingness to meet its financial commitments.
CCC - An obligor is currently vulnerable and is dependent upon favorable business, financial, and economic conditions for the obligor to meet its financial commitments.
CC - An obligor is currently vulnerable. The rating is used when a default has not yet occurred, but expects default to be a virtual certainty, regardless of the anticipated time to default.

China Bank Annual Financial and Sustainability Report 2017152
R - An obligor is under regulatory supervision owing to its financial condition. During the pendency of the regulatory supervision, the regulators may have the power to favor one class of obligations over others or pay some obligations and not others.
SD and D - An obligor is in default on one or more of its financial obligations including rated and unrated financial obligations but excluding hybrid instruments classified as regulatory capital or in non-payment according to terms.
The tables below show the credit quality of deposits and investments as of December 31, 2017 and 2016 (in millions), based on external risk ratings (gross of allowance for credit losses).
Consolidated2017
High Grade Standard GradeSubstandard
Grade TotalDue from BSP P– P98,490 P– P98,490Due from other banks 4,245 10,787 13 15,045SPURA – 18,752 – 18,752Financial assets at FVPL 1,194 10,013 85 11,292AFS financial assets 8,062 28,528 1,515 38,105HTM financial assets 320 57,917 1,416 59,653
P13,821 P224,487 P3,029 P241,337
Consolidated2016
High Grade Standard GradeSubstandard
Grade TotalDue from BSP P– P91,964 P– P91,964Due from other banks 1,527 6,569 875 8,971SPURA – 3,452 – 3,452Financial assets at FVPL 36 4,622 237 4,895AFS financial assets 10,119 13,970 1,593 25,682HTM financial assets 318 48,513 3,056 51,887
P12,000 P169,090 P5,761 P186,851
Parent Company2017
High Grade Standard GradeSubstandard
Grade TotalDue from BSP P– P91,717 P– P91,717Due from other banks 4,124 9,921 13 14,058SPURA – 17,348 – 17,348Financial assets at FVPL 1,194 9,877 85 11,156AFS financial assets 8,062 25,672 1,485 35,219HTM financial assets 320 55,182 1,166 56,668
P13,700 P209,717 P2,749 P226,166
Parent Company2016
High Grade Standard GradeSubstandard
Grade TotalDue from BSP P– P85,307 P– P85,307Due from other banks 1,527 6,394 1,624 9,545SPURA − 2,958 − 2,958Financial assets at FVPL 36 4,151 237 4,424AFS financial assets 10,117 11,614 1,592 23,323HTM financial assets 319 45,177 3,056 48,552
P11,999 P155,601 P6,509 P174,109

Financial Statements 153
Due from other banks and government securitiesThe external risk rating of the Group’s depository accounts with counterparty banks, trading and investment securities, is grouped as follows (aligned with the Philippine Ratings System):
Credit Quality Rating External Credit Risk RatingHigh grade PRSAAA, PRSAa+, PRSAa, PRSAa-Standard grade PRSA+, PRSA, PRSA-, PRSBaa+, PRSBaa, PRSBaa-Substandard grade PRSBa+, PRSBa, PRSBa-, PRSB+, PRSB, PRSB-, PRSCaa+, PRSCaa, PRSCaa-,
PRSCa+, PRSCa, PRSCa-, PRSC+, PRSC, PRSC-
PRSAaa - The obligor’s capacity to meet its financial commitment on the obligation is extremely strong.
PRSAa - The obligor’s capacity to meet its financial commitment on the obligation is very strong.
PRSA - With favorable investment attributes and are considered as upper-medium grade obligations. Although obligations rated ‘PRSA’ are somewhat more susceptible to the adverse effects of changes in economic conditions, the obligor’s capacity to meet its financial commitments on the obligation is still strong.
PRSBaa - An obligation rated ‘PRS Baa’ exhibits adequate protection parameters. However, adverse economic conditions and changing circumstances are more likely to lead to a weakened capacity of the obligor to meet its financial commitment on the obligation. PRSBaa-rated issues may possess certain speculative characteristics.
PRSBa - An obligation rated ‘PRSBa’ is less vulnerable to nonpayment than other speculative issues. However, it faces major ongoing uncertainties relating to business, financial or economic conditions, which could lead to the obligor’s inadequate capacity to meet its financial commitment on the obligation.
PRSB - An obligation rated ‘PRSB’ is more vulnerable to nonpayment than obligations rated ‘PRSBa’, but the obligor currently has the capacity to meet its financial commitment on the obligation. Adverse economic conditions will likely impair the obligor’s capacity to meet its financial commitment on the obligation. The issue is characterized by high credit risk.
PRSCaa - An obligation rated ‘PRSCaa’ is presently vulnerable to nonpayment and is dependent upon favorable business, financial and economic conditions for the obligor to meet its financial commitments on the obligation. In the event of adverse economic conditions, the obligor is not likely to have the capacity to meet its financial commitment on the obligation. The issue is considered to be of poor standing and is subject to very high credit risk.
PRSCa - An obligation rated “PRSCa” is presently highly vulnerable to nonpayment. Likely already in or very near default with some prospect for partial recovery of principal or interest.
PRSC - An obligation is already in default with very little prospect for any recovery of principal or interest.
The tables below show the credit quality of deposits and investments, by class, as ofDecember 31, 2017 and 2016 (in millions), based on risk grades of a local rating agency (gross of allowance for credit losses).
Consolidated2017
High Grade Standard GradeSubstandard
Grade TotalDue from other banks P308 P– P– P308Financial assets at FVPL 652 P– – 652AFS financial assets 3,011 P– – 3,011HTM financial assets 1,078 P– – 1,078Total P5,049 P– P– P5,049
Consolidated2016
High Grade Standard GradeSubstandard
Grade TotalDue from other banks P145 P– P– P145Financial assets at FVPL 487 P– – 487AFS financial assets 1,470 P– – 1,470HTM financial assets 534 P– – 534Total P2,636 P– P– P2,636

China Bank Annual Financial and Sustainability Report 2017154
Parent Company2017
High Grade Standard GradeSubstandard
Grade TotalFinancial assets at FVPL P652 P– P– P652AFS financial assets 2,636 – – 2,636HTM financial assets 610 – – 610Total P3,898 P– P– P3,898
Parent Company2016
High Grade Standard GradeSubstandard
Grade TotalDue from other banks P144 P– P– P144Financial assets at FVPL 487 – – 487AFS financial assets 1,435 – – 1,435HTM financial assets 534 534Total P2,600 P– P– P2,600
The table below shows the breakdown of unrated deposits and investments (gross of allowance for credit losses) as of December 31, 2017 and 2016 (in millions):
Consolidated Parent Company2017 2016 2017 2016
Due from other banks P287 P2,216 P9 P–Financial assets at FVPL 4,295 2,322 4,248 2,322AFS financial assets 5,368 6,760 5,089 6,402HTM financial assets 4,556 4,983 4,256 4,983Other assets* 4,413 5,652 2,136 3,605Total P18,919 P21,933 P15,738 P17,312*Other assets include accounts receivables, sales contract receivable, RCOCI and miscellaneous financial assets (Note 15).
The tables below show the aging analysis of gross past due but not impaired loans and receivables that the Group and Parent Company held as of December 31, 2017 and 2016 (in millions). Under PFRS 7, a financial asset is past due when a counterparty has failed to make a payment when contractually due.
Consolidated
December 31, 2017Less than
30 days 31 to 60 days 61 to 90 daysMore than
91 days TotalLoans and receivables
Corporate and commercial lending P919 P186 P296 P940 P2,341Consumer lending 120 148 366 2,515 3,149Trade-related lending 5 2 30 − 37Others − − − 27 27Total P1,044 P336 P692 P3,482 P5,554
Consolidated
December 31, 2016Less than
30 days 31 to 60 days 61 to 90 daysMore than
91 days TotalLoans and receivables
Corporate and commercial lending P567 P70 P86 P328 P1051Consumer lending 296 113 317 2,429 3,155Trade-related lending − − − 6 6Others − − − 5 5Total P863 P183 P403 P2,768 P4,217

Financial Statements 155
Parent Company
December 31, 2017Less than
30 days 31 to 60 days 61 to 90 daysMore than
91 days TotalLoans and receivables
Corporate and commercial lending P872 P122 P211 P189 P1,394Consumer lending 105 127 196 1,208 1,636Trade-related lending 6 2 30 − 38Total P983 P251 P437 P1,398 P3,068
Parent Company
December 31, 2016Less than
30 days 31 to 60 days 61 to 90 daysMore than
91 days TotalLoans and receivables
Corporate and commercial lending P530 P69 P71 P91 P761Consumer lending 213 56 204 684 1,157Trade-related lending − − − 6 6Total P743 P125 P275 P781 P1,924
The following table presents the carrying amount of financial assets of the Group and Parent Company as of December 31, 2017 and 2016 that would have been considered past due or impaired if not renegotiated:
Consolidated Parent Company2017 2016 2017 2016
Loans and advances to customers Corporate and commercial lending P807,247 P773,888 P224,743 P358,760 Consumer lending 42,487 14,669 37,587 9,777 Total renegotiated financial assets P849,734 P788,557 P262,330 P368,537
Impairment assessmentThe main considerations for the loan impairment assessment include whether any payment of principal or interest is overdue by more than 90 days, or there are known difficulties in the cash flows of counterparties, credit rating downgrades, or infringement of the original terms of the contract. The Group addresses impairment assessment in two areas: individually assessed allowances and collectively assessed allowances.
Individually assessed allowancesThe Group determines the allowances appropriate for each individually significant loan or advance on an individual basis. Items considered when determining allowance amounts include the sustainability of the counterparty’s business plan, its ability to improve performance once a financial difficulty has arisen, projected receipts and the expected dividend payout should bankruptcy ensue, the availability of other financial support and the realizable value of collateral, and the timing of the expected cash flows. The impairment losses are evaluated at each reporting date, unless unforeseen circumstances require more careful attention.
Collectively assessed allowancesAllowances are assessed collectively for losses on loans and advances that are not individually significant (including residential mortgages and unsecured consumer lending) and for individually significant loans and advances where there is no objective evidence of individual impairment yet. Allowances are evaluated on each reporting date with each portfolio receiving a separate review.
The collective assessment takes account of impairment that is likely to be present in the portfolio even though there is no objective evidence of the impairment yet per an individual assessment. Impairment losses are estimated by taking into consideration the following information: historical losses on the portfolio, current economic conditions, the approximate delay between the time a loss is likely to have been incurred and the time it will be identified as requiring an individually assessed impairment allowance, and expected receipts and recoveries once impaired.
Management is responsible for deciding the length of this period which can extend for as long as one year. The impairment allowance is then reviewed by credit management to ensure alignment with the Group’s overall policy.
Credit ReviewIn accordance with BSP Circular 855, credit reviews are conducted on loan accounts to evaluate whether loans are granted in accordance with the Bank’s policies, to assess loan quality and appropriateness of classification and adequacy of loan loss provisioning. Results of credit reviews are promptly reported to management to apprise them of any significant findings for proper corrective actions.

China Bank Annual Financial and Sustainability Report 2017156
Market RiskMarket risk is the risk of loss that may result from changes in the value of a financial product. The Parent Company’s market risk originates from its holdings of domestic and foreign-denominated debt securities, foreign exchange instruments, equities, foreign exchange derivatives and interest rate derivatives.
The RMG of the Parent Company is responsible for assisting the ROC with its responsibility for identifying, measuring, managing and controlling market risk. Market risk management measures the Parent Company market risk exposures through the use of VaR. VaR is a statistical measure that estimates the maximum potential loss from a portfolio over a holding period, within a given confidence level.
VaR assumptionsThe Parent Company calculates the Bankwide VaR in certain trading activities. The Parent Company uses the Historical Simulation Full Valuation approach to measure VaR for all treasury traded instruments, using a 99.00% confidence level and a 1-day holding period.
The use of a 99.00% confidence level means that, within a one day horizon, losses exceeding the VaR figure should occur, on average, not more than once every hundred days. The validity of the VaR model is verified through back testing, which examines how frequently actual and hypothetical daily losses exceeds daily VaR. The Parent Company measures and monitors the VaR and profit and loss on a daily basis.
Since VaR is an integral part of the Parent Company’s market risk management, VaR limits have been established for all trading positions and exposures are reviewed daily against the limits by management. Further, stress testing is performed for monitoring extreme events.
Limitations of the VaR MethodologyThe VaR models are designed to measure market risk in a normal market environment using equally weighted historical data. The use of VaR has limitations because it is based on historical correlations and volatilities in market prices and assumes that future price movements will follow the same distribution. Due to the fact that VaR relies heavily on historical data to provide information and may not clearly predict the future changes and modifications of the risk factors, the probability of large market moves may be underestimated if changes in risk factors fail to align with the assumptions. VaR may also be under- or over-estimated due to the assumptions placed on risk factors and the relationship between such factors for specific instruments. Even though positions may change throughout the day, the VaR only represents the risk of the portfolios at the close of each business day, and it does not account for any losses that may occur beyond the 99.00% confidence level.
In practice, the actual trading results will differ from the VaR calculation and, in particular, the calculation does not provide a meaningful indication of profits and losses in stressed market conditions. To determine the reliability of the VaR models, actual outcomes are monitored regularly to test the validity of the assumptions and the parameters used in the VaR calculation. Market risk positions are also subject to regular stress tests to ensure that the Group would withstand an extreme market event.
A summary of the VaR position of the trading portfolio of the Parent Company is as follows:
Interest Rate1Foreign
Exchange2 Equity3 Interest Rate4 Interest Rate5
(In Millions)201731 December P120.05 P7.78 P45.24 P4.00 P1.76Average daily 82.27 28.20 23.34 3.78 5.29Highest 146.71 73.74 46.21 6.97 9.21Lowest 37.58 2.99 3.43 1.44 1.48
201631 December P44.79 P24.31 P11.70 P6.17 P8.95Average daily 52.60 7.79 18.43 3.72 1.82Highest 109.59 29.59 53.39 10.12 9.17Lowest 16.00 1.30 0.01 0.77 0.55
1 Interest rate VaR for debt securities (Interest rate VaR for foreign currency denominated debt securities are translated to PHP using daily closing rate)
2 FX VaR is the bankwide foreign exchange risk3 Price VaR for equity securities4 Interest rate VaR for FX swaps and FX forwards 5 Interest rate VaR for IRS

Financial Statements 157
Interest Rate RiskThe Group’s interest rate risk originates from its holdings of interest rate sensitive assets and interest rate sensitive liabilities. The Parent Company follows prudent policies in managing its exposures to interest rate fluctuations, and constantly monitors its assets and liabilities.
As of December 31, 2017 and 2016, 64.76% % and 51.89% of the Group’s total loan portfolio, respectively, comprised of floating rate loans which are repriced periodically by reference to the transfer pool rate which reflects the Group’s internal cost of funds. In keeping with banking industry practice, the Group aims to achieve stability and lengthen the term structure of its deposit base, while providing adequate liquidity to cover transactional banking requirements of customers.
Interest is paid on demand accounts, which constituted 24.29% and 24.98% of total deposits of the Parent Company as of December 31, 2017 and 2016, respectively.
Interest is paid on savings accounts and time deposits accounts, which constitute 29.72% and 45.99%, respectively, of total deposits of the Parent Company as of December 31, 2017, and 26.06% and 48.96%, respectively, as of December 31, 2016.
Savings account interest rates are set by reference to prevailing market rates, while interest rates on time deposits and special savings accounts are usually priced by reference to prevailing rates of short-term government bonds and other money market instruments, or, in the case of foreign currency deposits, inter-bank deposit rates and other benchmark deposit rates in international money markets with similar maturities.
The Group is likewise exposed to fair value interest rate risk due to its holdings of fixed rate government bonds as part of its AFS and FVPL portfolios. Market values of these investments are sensitive to fluctuations in interest rates.
The following table provides for the average effective interest rates of the Group and of the Parent Company as of December 31, 2017 and 2016:
Consolidated Parent Company2017 2016 2017 2016
PesoAssetsDue from BSP 0.13% 0.39% 0.13% 0.30%Due from banks 0.24% 0.24% 0.19% 0.22%Investment securities* 4.21% 4.00% 4.10% 3.95%Loans and receivables 5.53% 5.65% 5.22% 5.34%
LiabilitiesDeposit liabilities 1.15% 1.01% 1.04% 0.85%Bills payable 2.99% 7.86% 2.99% 7.86%
USDAssetsDue from banks 0.17% 0.11% 0.16% 0.08%Investment securities* 3.60% 4.36% 3.61% 4.90%Loans and receivables 3.40% 3.56% 3.40% 3.48%
LiabilitiesDeposit liabilities 1.13% 1.23% 1.12% 1.24%Bills payable 1.94% 1.94% 1.94% 1.91%* Consisting of financial assets at FVPL, AFS financial assets and HTM financial assets.
The asset-liability gap analysis method is used by the Group to measure the sensitivity of its assets and liabilities to interest rate fluctuations. This analysis measures the Group’s susceptibility to changes in interest rates. The repricing gap is calculated by first distributing the assets and liabilities contained in the Group’s balance sheet into tenor buckets according to the time remaining to the next repricing date (or the time remaining to maturity if there is no repricing), and then obtaining the difference between the total of the repricing (interest rate sensitive) assets and the total of repricing (interest rate sensitive) liabilities.
A gap is considered negative when the amount of interest rate sensitive liabilities exceeds the amount of interest rate sensitive assets. A gap is considered positive when the amount of interest rate sensitive assets exceeds the amount of interest rate sensitive liabilities.

China Bank Annual Financial and Sustainability Report 2017158
Accordingly, during a period of rising interest rates, a bank with a positive gap would be in a position to invest in higher yielding assets earlier than it would need to refinance its interest rate sensitive liabilities. During a period of falling interest rates, a bank with a positive gap would tend to see its interest rate sensitive assets repricing earlier than its interest rate sensitive liabilities, restraining the growth of its net income or resulting in a decline in net interest income.
The following tables set forth the repricing gap position of the Group and Parent Company as of December 31, 2017 and 2016 (in millions):
Consolidated2017
Up to 3Months
>3 to 12Months
>12Months Total
Financial AssetsDue from BSP P98,490 P– P– P98,490Due from other banks 15,641 – – 15,641Investment securities 9,702 471 117,797 127,970Loans and receivables 243,419 32,312 173,240 448,971Total financial assets 367,252 32,783 291,037 691,072Financial LiabilitiesDeposit liabilities 256,633 14,206 364,254 635,093Bills payable 20,118 – – 20,118Total financial liabilities 276,751 14,206 364,254 655,211Repricing gap P90,501 P18,577 (P73,217) P35,861
Consolidated2016
Up to 3Months
>3 to 12Months
>12Months Total
Financial AssetsDue from BSP P91,964 P– P– P91,964Due from other banks 11,332 – – 11,332Investment securities 11,216 77 87,689 98,982Loans and receivables 195,911 38,156 152,760 386,827Total financial assets 310,423 38,233 240,449 589,105Financial LiabilitiesDeposit liabilities 236,806 15,099 289,678 541,583Bills payable 13,685 2,718 552 16,955Total financial liabilities 250,491 17,817 290,230 558,538Repricing gap P59,932 P20,416 (P49,781) P30,567
Parent Company2017
Up to 3Months
>3 to 12Months
>12Months Total
Financial AssetsDue from BSP P91,717 P– P– P91,717Due from other banks 14,067 – – 14,067Investment securities 7,364 466 112,697 120,527Loans and receivables 218,899 23,005 144,651 386,555Total financial assets 332,047 23,471 257,348 612,866Financial Liabilities Deposit liabilities 215,735 12,112 331,389 559,236Bills payable 20,118 – – 20,118Total financial liabilities 235,853 12,112 331,389 579,354Repricing gap P96,194 P11,359 (P74,042) P33,512

Financial Statements 159
Parent Company2016
Up to 3Months
>3 to 12Months
>12Months Total
Financial AssetsDue from BSP P85,307 P– P– P85,307Due from other banks 9,689 – – 9,689Investment securities 9,678 – 82,778 92,456Loans and receivables 179,102 26,169 123,799 329,070Total financial assets 283,776 26,169 206,577 516,522Financial Liabilities Deposit liabilities 199,467 12,083 259,412 470,962Bills payable 13,685 2,718 552 16,955Total financial liabilities 213,152 14,801 259,964 487,917Repricing gap P70,624 P11,368 (P53,387) P28,605
The Group also monitors its exposure to fluctuations in interest rates by using scenario analysis to estimate the impact of interest rate movements on its interest income. This is done by modeling the impact to the Group’s interest income and interest expenses to parallel changes in the interest rate curve in a given 12-month period.
The following tables set forth the estimated change in the Group’s and Parent Company’s annualized net interest income due to a parallel change in the interest rate curve as of December 31, 2017 and 2016:
Consolidated2017
Change in interest rates (in basis points)100bp rise 50bp rise 50bp fall 100bp fall
Change in annualized net interest income P1,046 P523 (P523) (P1,046)As a percentage of the Group’s net interest income for
the year ended December 31, 2017 5.33% 2.66% (2.66%) (5.33%)
Consolidated2016
Change in interest rates (in basis points)100bp rise 50bp rise 50bp fall 100bp fall
Change in annualized net interest income P752 P376 (P376) (P752)As a percentage of the Group’s net interest income for
the year ended December 31, 2016 4.50% 2.25% (2.25%) (4.50%)
Parent Company2017
Change in interest rates (in basis points)100bp rise 50bp rise 50bp fall 100bp fall
Change in annualized net interest income P1,049 P525 (P525) (P1,049)As a percentage of the Parent Company’s net interest
income for the year ended December 31, 2017 6.46% 3.23% (3.23%) (6.46%)
Parent Company2016
Change in interest rates (in basis points)100bp rise 50bp rise 50bp fall 100bp fall
Change in annualized net interest income P791 P396 (P396) (P791)As a percentage of the Parent Company’s net interest
income for the year ended December 31, 2016 5.75% 2.88% (2.88%) (5.75%)

China Bank Annual Financial and Sustainability Report 2017160
The following tables set forth the estimated change in the Group’s and Parent Company’s income before tax and equity due to a reasonably possible change in the market prices of quoted bonds classified under financial assets at FVPL and AFS financial assets, brought about by movement in the interest rate curve as of December 31, 2017 and 2016 (in millions):
Consolidated2017
Change in interest rates (in basis points)25bp rise 10bp rise 10bp fall 25bp fall
Change in income before tax (P146) (P58) P58 P146Change in equity (637) (255) 255 637
Consolidated2016
Change in interest rates (in basis points)25bp rise 10bp rise 10bp fall 25bp fall
Change in income before tax (P47) (P19) P19 P47Change in equity (377) (151) 151 377
Parent Company2017
Change in interest rates (in basis points)25bp rise 10bp rise 10bp fall 25bp fall
Change in income before tax (P145) (P58) P58 P145Change in equity (600) (240) 240 600
Parent Company2016
Change in interest rates (in basis points)25bp rise 10bp rise 10bp fall 25bp fall
Change in income before tax (P40) (P16) P16 P40Change in equity (339) (136) 136 339
Foreign Currency RiskThe Group’s foreign exchange risk originates from its holdings of foreign currency-denominated assets (foreign exchange assets) and foreign currency-denominated liabilities (foreign exchange liabilities).
Foreign exchange liabilities generally consist of foreign currency-denominated deposits in the Group’s FCDU account made in the Philippines or generated from remittances to the Philippines by persons overseas who retain for their own benefit or for the benefit of a third party, foreign currency deposit accounts with the Group.
Foreign currency liabilities are generally used to fund the Group’s foreign exchange assets which generally consist of foreign currency-denominated loans and investments in the FCDU. Banks are required by the BSP to match the foreign currency-denominated assets with liabilities held in the FCDU that are denominated in the same foreign currency. In addition, the BSP requires a 30.00% liquidity reserve on all foreign currency-denominated liabilities held in the FCDU.
The Group’s policy is to maintain foreign currency exposure within existing regulations, and within acceptable risk limits. The Group believes in ensuring its foreign currency is at all times within limits prescribed for financial institutions who are engaged in the same types of businesses in which the Group and its subsidiaries are engaged.

Financial Statements 161
The table below summarizes the Group’s and Parent Company’s exposure to foreign exchange risk. Included in the table are the Group’s and Parent Company’s assets and liabilities at carrying amounts (stated in US Dollars), categorized by currency:
Consolidated2017 2016
USD Other Currencies Total PHP USD
Other Currencies Total PHP
AssetsCash and other cash items $2,447 $3,173 $5,620 P1,101,805 $15,366 $2,781 $18,147 P896,335Due from other banks 64,664 15,524 80,188 12,250,862 141,279 8,623 150,352 7,422,444Financial assets at FVPL 60,427 − 60,427 11,237,326 95,587 7 95,594 4,752,967AFS financial assets 71,057 6,324 77,381 24,952,423 460,901 − 460,901 22,859,924HTM financial assets 31,952 9,791 41,743 36,580,224 702,957 8,560 711,517 35,252,391Loans and receivables 30,809 7,385 38,194 41,199,173 658,657 913 659,570 32,771,104Accrued interest receivable 992 133 1,125 1,151,126 18,691 55 18,746 929,765Other assets 24,851 2 24,853 1,770,016 38,175 7 38,182 1,898,142
287,199 42,332 329,531 130,242,955 2,132,064 20,941 2,153,011 106,783,072LiabilitiesDeposit liabilities 59,445 36,388 95,833 108,853,092 $1,631,011 $18,875 $1,649,886 81,835,829Bills payables 128,720 132,510 261,230 20,118,031 341,865 − 341,865 16,997,522Accrued interest and other
expenses 512 7 519 242,686 2,897 2 2,899 143,929
Other liabilities 11,317 877 12,194 2,007,057 60,462 840 61,302 2,981,638199,994 169,782 369,776 131,220,866 2,036,235 19,717 2,055,952 101,958,918
Currency spot (8,054) − (8,054) (402,136) (3,027) 51 (2,976) (148,562)Currency forwards (59,709) 136,301 76,591 3,526,925 (59,371) 10,790 (48,581) (2,414,102)Net Exposure $19,442 $8,851 $28,292 P2,146,878 $32,980 $12,070 $45,050 P2,261,490
Parent Company2017 2016
USD Other Currencies Total PHP USD
Other Currencies Total PHP
AssetsCash and other cash items $250 $3,173 $3,423 P992,120 $13,224 $2,781 $16,005 P795,534Due from other banks 56,536 15,524 72,060 11,845,037 121,834 8,62 130,457 6,486,192Financial assets at FVPL 59,729 − 59,729 11,202,500 95,587 7 95,594 4,752,967AFS financial assets 49,997 6,324 56,321 23,900,888 439,821 − 439,821 21,867,906HTM financial assets − 9,791 9,791 34,984,879 670,955 8,560 679,515 33,746,382Loans and receivables 23,323 7,385 30,708 40,825,401 650,077 913 650,990 32,367,332Accrued interest receivable 96 133 229 1,106,380 17,827 55 17,882 889,109Other assets 24,790 2 24,792 1,766,967 38,098 7 38,105 1,894,483
214,721 42,332 257,053 126,624,172 2,047,423 20,946 2,068,370 102,799,905LiabilitiesDeposit liabilities 501 36,388 36,889 105,910,018 1,557,612 18,875 1,576,487 78,381,671Bills payables 128,720 132,510 261,230 20,118,031 341,865 − 341,865 16,997,522Accrued interest and other
expenses 418 7 425 238,020 2,825 2 2,827 140,518Other liabilities 9,050 877 9,927 1,893,891 54,153 840 54,993 2,684,710
138,689 169,782 308,471 128,159,960 1,956,455 19,717 1,976,172 98,204,421Currency spot (8,054) − (8,054) (402,136) (3,027) 51 (2,976) (148,562)Currency forwards (59,709) 136,301 76,591 3,526,925 (59,371) 10,790 (48,581) (2,414,102)Net Exposure $8,269 $8,851 $17,119 P1,589,001 $28,570 $12,070 $40,640 P2,032,020

China Bank Annual Financial and Sustainability Report 2017162
The following table sets forth, for the period indicated, the impact of the range of reasonably possible changes in the US$ exchange rate and other currencies per Philippine peso on the pre-tax income and equity (in millions).
Consolidated
Change in Foreign Exchange Rate
Sensitivity of Pretax Income
Sensitivity of Equity
2017USD 2% 134 595Other 1% 3 3USD (2%) (134) (595)Other (1%) (3) (3)
2016USD 2% 54 164Other 1% − −USD (2%) (54) (164)Other (1%) − −
Parent Company Change in Foreign Exchange Rate
Sensitivity of Pretax Income
Sensitivity of Equity
2017USD 2% 133 573Other 1% 3 3USD (2%) (133) (573)Other (1%) (3) (3)
2016USD 2% 51 143Other 1% − −USD (2%) (51) (143)Other (1%) − −
The impact in pre-tax income and equity is due to the effect of foreign currency behaviour to Philippine peso.
Equity Price RiskEquity price risk is the risk that the fair values of equities change as a result of movements in both the level of equity indices and the value of individual stocks. The non-trading equity price risk exposure arises from the Group’s investment portfolio.
The effect on the Group and Parent Company’s equity as a result of a change in the fair value of equity instruments held as AFS due to a reasonably possible change in equity indices, with all other variables held constant, is as follows (in millions):
Consolidated Change in equity index
Effect on Equity
2017 +10% 10.5-10% 4.1
2016 +10% 19.8-10% 12.1

Financial Statements 163
Parent Company Change in equity index
Effect on Equity
2017 +10% 10.5-10% 4.1
2016 +10% 19.8-10% 12.1
Liquidity Risk and Funding ManagementLiquidity risk is generally defined as the current and prospective risk to earnings or capital arising from the Parent Company’s inability to meet its obligations when they become due without incurring unacceptable losses or costs.
The Parent Company’s liquidity management involves maintaining funding capacity to accommodate fluctuations in asset and liability levels due to changes in the Parent Company’s business operations or unanticipated events created by customer behavior or capital market conditions. The Parent Company seeks to ensure liquidity through a combination of active management of liabilities, a liquid asset portfolio composed of deposits reserves and high quality securities, the securing of money market lines, and the maintenance of repurchase facilities to address any unexpected liquidity situations.
The tables below show the maturity profile of the Parent Company’s assets and liabilities, based on contractual undiscounted cash flows (in millions):
December 31, 2017
On demand Less than
1 year 1 to 2 years 2 to 3 years 3 to 5 years TotalFinancial AssetsCash and other cash items P11,160 P– P– P– P– P11,160Due from BSP 91,717 – – – – 91,717Due from other banks 14,067 – – – – 14,067SPURA – 17,348 – – – 17,348Financial assets at FVPL – 2,673 844 760 14,001 18,278AFS financial assets – 8,360 4,802 4,786 35,082 53,030Loans and receivables – 149,393 23,651 25,443 268,251 466,738
106,944 177,774 29,297 30,989 317,334 672,338Financial LiabilitiesDeposit liabilities Demand 138,930 – – – – 138,930 Savings 179,593 – – – – 179,593 Time – 235,825 799 5,012 348 241,984Bills payable – 20,177 – – – 20,177Manager’s checks – 1,709 – – – 1,709Accrued interest and other expenses – 1,062 – – – 1,062Derivative liabilities – 268 – – – 268Other liabilities: Accounts payable – 1,828 – – – 1,828 Acceptances payable – 470 – – – 470 Due to PDIC – 532 – – – 532 Margin deposits – 3 – – – 3 Other credits - dormant – 214 – – – 214 Due to the Treasurer of the Philippines – 34 – – – 34 Miscellaneous – 510 – – – 510Total liabilities 318,523 262,632 799 5,012 348 587,314Net Position (P211,580) (P84,858) P28,498 P25,977 P317,398 P85,186

China Bank Annual Financial and Sustainability Report 2017164
December 31, 2016
On demandLess than
1 year1 to 2 years
2 to 3 years 3 to 5 years TotalFinancial AssetsCash and other cash items P10,581 P− P− P− P− P10,581 Due from BSP 85,307 − − − − 85,307 Due from other banks 9,689 − − − − 9,689 SPURA − 2,958 − − − 2,958Financial assets at FVPL − 583 326 1,484 5,400 7,793 AFS financial assets − 12,192 1,676 3,705 19,709 37,282Loans and receivables − 141,925 17,948 21,115 195,228 376,216
105,577 157,658 19,950 26,304 220,337 529,826Financial LiabilitiesDeposit liabilities Demand 122,266 − − − − 122,266 Savings 132,772 − − − − 132,772 Time − 211,755 3,440 724 962 216,881 Bills payable − 9,236 7,813 − − 17,049 Manager’s checks − 1,446 − − − 1,446 Accrued interest and other expenses − 578 − − − 758 Derivative liabilities − 243 − − 243 Other liabilities: − − − − Accounts payable − 1,731 − − − 1,731 Acceptances payable − 1,172 − − − 1,172 Due to PDIC − 428 − − − 428 Margin deposits − 2 − − − 2 Other credits - dormant − 304 − − − 304 Due to the Treasurer of the Philippines − 24 − − − 24 Miscellaneous − 429 − − − 289Total liabilities 255,038 227,348 11,253 724 962 495,325 Net Position (P149,461) (P69,690) P8,697 P25,580 P219,375 P34,501
Liquidity risk is monitored and controlled primarily by a gap analysis of maturities of relevant assets and liabilities reflected in the MCO report, as well as an analysis of available liquid assets. Instead of relying solely on contractual maturities profile, the Parent Company uses Behavioral MCO to capture a going concern view. Furthermore, internal liquidity ratios and monitoring of large funds providers have been set to determine sufficiency of liquid assets over deposit liabilities. In 2016, the Bank started submitting quarterly Liquidity Coverage Ratio as prescribed by the BSP for a 2 year observation period. Liquidity is managed by the Parent and subsidiaries on a daily basis, while scenario stress tests are conducted periodically.
7. DUE FROM BSP AND OTHER BANKS
Due from BSPThis account consists of:
Consolidated Parent Company2017 2016 2017 2016
Demand deposit account P95,790,000 P84,480,394 P89,017,023 P78,773,027Special deposit account 2,700,000 7,450,000 2,700,000 6,500,000Others 14 34,101 14 34,101
P98,490,014 P91,964,495 P91,717,037 P85,307,128

Financial Statements 165
Due from Other BanksThis comprises of deposit accounts with:
Consolidated Parent Company2017 2016 2017 2016
Local banks P6,600,456 P6,296,727 P6,479,014 P4,747,467 Foreign banks 9,041,020 5,035,509 7,587,605 4,941,698
P15,641,476 P11,332,236 14,066,620 P9,689,165
Interest Income on Due from BSP and Other Banks
This account consists of:
Consolidated Parent Company2017 2016 2015 2017 2016 2015
Due from BSP P213,879 P266,204 P209,395 P112,851 P246,888 P161,994Due from other banks 138,850 221,843 95,399 50,296 115,528 20,657
P352,729 P488,047 P304,794 P163,147 P362,416 P182,651
8. SECURITIES PURCHASED UNDER RESALE AGREEMENT
This account represents overnight placements with the BSP where the underlying securities cannot be sold or repledged to parties other than the BSP.
In 2017, 2016 and 2015, the interest rates of SPURA equals to 3.50%, 2.90%, and range from 0.01% to 2.20%, respectively, for the Group and Parent Company.
9. TRADING AND INVESTMENT SECURITIES
Financial Assets at FVPLThis account consists of:
Consolidated Parent Company2017 2016 2017 2016
Held for trading Government bonds (Note 28) P5,911,659 P2,404,049 P5,876,832 P2,240,488 Treasury notes 1,893,192 1,031,675 1,792,621 724,219 Treasury bills 2,025,367 994,203 2,025,367 994,203 Private bonds 2,663,397 594,798 2,616,730 594,798
12,493,615 5,024,725 12,311,550 4,553,708Financial assets designated at FVPL 3,411,686 2,462,886 3,411,686 2,462,886Derivative assets (Note 25) 333,587 216,288 333,587 216,288Total P16,238,888 P7,703,899 P16,056,823 P7,232,882
Financial assets designated at FVPL of the Parent Company consist of investments in shares of stocks which contain multiple embedded derivatives which are deemed not clearly and closely related to its equity host. In this regard, PAS 39 provides that if a contract contains one or more embedded derivatives, an entity may designate the entire hybrid contract at FVPL unless the embedded derivative does not significantly modify the cash flows that otherwise would be required by the contract, or it is clear with little or no analysis when a similar hybrid instrument is first considered that separation of the embedded derivative is prohibited. On this basis, management has determined that the investments shall be designated as at FVPL.
Dividends earned by the Parent Company from its investment in shares designated at FVPL amounted to P82.83 million, P182.13 million, and P247.10 million in 2017, 2016 and 2015, respectively (Note 21).
As of December 31, 2017 and 2016, HFT securities include fair value loss of P65.56 million and P63.97 million, respectively, for the Group, and fair value loss of P69.22 million and P51.06 million, respectively, for the Parent Company.

China Bank Annual Financial and Sustainability Report 2017166
Effective interest rates for peso-denominated financial assets at FVPL for both the Group and the Parent Company range from 0.64% to 5.49% in 2017, 2.08% to 6.88% in 2016 and from 1.63% to 13.75% in 2015. Effective interest rates for foreign currency-denominated financial assets at FVPL for the Group range from 2.29% to 10.16% in 2017, 0.99% to 7.24% in 2016, and from 1.37% to 10.63% in 2015. Effective interest ra tes for foreign currency-denominated financial assets at FVPL for the Parent Company range from 2.29% to 10.16% in 2017, from 0.99% to 6.80% in 2016, and from 2.50% to 10.63% in 2015.
AFS Financial AssetsThis account consists of:
Consolidated Parent Company2017 2016 2017 2016
Quoted Government bonds (Notes 18 and 28) P35,229,504 P22,337,592 P32,373,344 P20,561,662 Private bonds 11,090,438 11,417,612 10,483,794 10,491,728 Equities 67,903 80,947 67,903 80,947
46,387,845 33,836,150 42,925,041 31,134,337Unquoted Equities - net * 57,546 37,572 12,042 19,413
57,546 37,572 12,042 19,413Total P46,445,391 P33,873,722 P42,937,083 P31,153,750* Includes fully impaired equity investments with acquisition cost of P38.83 million for the Group and P6.32 million for the Parent Company as of December 31, 2017 and 2016 (Note 16).
Unquoted equity securitiesThis account comprises of shares of stocks of various unlisted private corporations.
Net unrealized gains (losses)AFS financial assets include fair value losses of P1.81 billion for the Group and Parent Company as of December 31, 2017, and fair value losses of P1.60 billion for the Group and Parent Company as of December 31, 2016. The fair value gains or losses are recognized under OCI. Impairment loss on AFS financial assets of the Group, which was charged to operations, amounted to P0.06 million in 2015. No impairment loss was recognized in 2017 and 2016.
Effective interest rates for peso-denominated AFS financial assets for the Group range from 2.95% to 8.92% in 2017, 1.34% to 7.00% in 2016, and from 2.14% to 7.25% in 2015. Effective interest rates for peso-denominated AFS financial assets for the Parent Company range from 2.95% to 8.92% in 2017, 2.08% to 7.00% in 2016, and from 2.14% to 7.25% in 2015.
Effective interest rates for foreign currency-denominated AFS financial assets for both the Group and Parent Company range from 0.99% to 5.75% in 2017, 0.37% to 7.45% in 2016, and from 1.50% to 7.45% in 2015.
HTM Financial AssetsThis account consists of:
Consolidated Parent Company2017 2016 2017 2016
Government bonds (Note 18) P46,718,014 P38,610,521 P44,032,555 P36,243,699Private bonds 11,465,164 12,180,159 10,697,164 11,530,159
58,183,178 50,790,680 54,729,719 47,773,858Unamortized premium - net 7,103,089 6,614,120 6,803,774 6,295,163
P65,286,267 P57,404,800 P61,533,493 P54,069,021
Effective interest rates for peso-denominated HTM financial assets for the Group range from 2.82% to 7.75% in 2017, 2.05% to 6.63% in 2016, and from 1.35% to 9.13% in 2015. Effective interest rates for foreign currency-denominated HTM financial assets range from 0.21% to 8.50% in 2017, 0.21% to 8.93% in 2016, and from 2.26% to 10.72% in 2015.

Financial Statements 167
Effective interest rates for peso-denominated HTM financial assets of the Parent Company range from 2.82% to 5.53% in 2017, 2.82% to 5.25% in 2016 and from 4.13% to 9.13% in 2015. Effective interest rates for foreign currency-denominated HTM financial assets range from 0.21% to 8.50% in 2017, 0.21% to 8.93% in 2016, and from 2.26% to 10.72% in 2015.
Reclassification of Financial Assets2016 ReclassificationThe Group transferred certain securities from AFS financial assets to HTM financial assets on various dates in November 2016 (reclassification dates). The decision to effect this transfer was reached by balancing the need to reduce the market risk sensitivity of the balance sheet without reducing the portfolio of liquid assets.
Details of reclassified financial assets follow:
Consolidated2017
Face Value
Carrying Value at Reclassification Date
Carrying Value as of December 31
Fair Value at Reclassification Date
Unamortized Net Unrealized Loss Deferred in Equity Amortization
(in original currency)Philippine peso denominated
government bonds P10,106,378 P11,636,529 P10,977,243 P11,039,842 (P544,126) P52,561US dollar denominated
government bonds USD103,371 135,851 126,762 129,074 (6,372) 405
Consolidated2016
Face Value
Carrying Value at Reclassification Date
Carrying Value as of December 31
Fair Value at Reclassification Date
Unamortized Net Unrealized Loss Deferred in Equity Amortization
(in original currency)Philippine peso denominated
government bonds P10,106,378 P11,636,529 P11,032,214 P11,039,842 (P591,635) P5,052US dollar denominated
government bonds USD103,371 135,851 128,776 129,074 (6,731) 46
Parent2017
Face Value
Carrying Value at Reclassification Date
Carrying Value as of December 31
Fair Value at Reclassification Date
Unamortized Net Unrealized Loss Deferred in Equity Amortization
(in original currency)Philippine peso denominated
government bonds P9,856,378 P11,350,542 P10,704,207 P10,765,719 (P533,349) P51,474US dollar denominated
government bonds USD96,871 126,204 118,144 120,350 (5,556) 298
Parent2016
Face Value
Carrying Value at Reclassification Date
Carrying Value as of December 31
Fair Value at Reclassification Date
Unamortized Net Unrealized Loss Deferred in Equity Amortization
(in original currency)Philippine peso denominated
government bonds P9,856,378 P11,350,542 P10,758,190 P10,765,719 (P579,859) P4,964US dollar denominated
government bonds USD96,871 126,204 120,063 120,350 (5,812) 42

China Bank Annual Financial and Sustainability Report 2017168
Had these securities not been transferred to HTM, additional fair value gain on Philippine peso denominated government bonds that would have been charged against the statement of comprehensive income amounted to P14.92 million and P7.86 million in 2017, and P172.13 million and P167.44 million in 2016, for the Group and the Parent Company, respectively. Additional fair value gain of USD2.85 million (P142.30 million) and USD2.67 million (P133.31 million) for the Group and Parent Company, respectively, in 2017, and fair values losses of USD8.21 million (P408.20 million) and USD7.11 million (P353.51 million) for the Group and Parent Company, in 2016 would have been charged against to the statement of comprehensive income on US dollar denominated government bonds.
The effective interest rates on Philippine peso denominated government bond at reclassification dates range from 4.05% to 5.07% for both the Group and Parent Company . The effective interest rates for US dollar denominated bonds range from 2.82% to 4.17% at the time of their reclassification for both the Group and Parent Company. The Group and Parent Company expect to recover 100% of the principal and the interest due on these transferred assets. These securities are also unimpaired as of December 31, 2017.
The unrealized losses deferred under ‘Net unrealized gains (losses) on AFS Financial Assets’ at reclassification date amounted to P584.82 million and USD5.85 million for Philippine peso denominated and US dollar denominated government bonds, respectively.
2008 ReclassificationIn 2008, as approved by its BOD, the Parent Company identified assets for which it had a clear change of intent to hold the investments to maturity rather than to exit or trade these investments in the foreseeable future and reclassified those investments from AFS financial assets to HTM financial assets effective October 2, 2008.
As of October 2, 2008, the total carrying value of AFS financial assets reclassified to HTM financial assets amounted to P9.04 billion, with unrealized losses of P47.44 million deferred under ‘Net unrealized gains (losses) on AFS financial assets’. HTM financial assets reclassified from AFS financial assets with total face amount of P798.13 million and P1.57 billion matured in 2017 and 2016, respectively.
As of December 31, 2017 and 2016, HTM financial assets reclassified from AFS financial assets consist of government bonds which have the following balances:
Face Value* Original Cost
Carrying Value as of December 31
Fair Value at reclassification date
Unamortized Net Unrealized Loss Deferred in Equity Amortization
2017 P491,811 P592,315 P509,646 P531,918 (P4,427) P24,0162016 1,284,516 1,553,572 1,311,014 1,367,155 (8,127) 6,496*Consist of US dollar-denominated bonds with face value of $9.85 million and $25.84 million as of December 31, 2017 and 2016, respectively.
Had these securities not been reclassified to HTM financial assets, additional fair value gain that would have been credited to the statement of comprehensive income amounted to P22.27 million, P395.74 million, and P324.67 million in 2017, 2016 and 2015, respectively. Effective interest rate on the reclassified securities is 6.21%. The Parent Company expects to recover 100.00% of the principal and interest due on the reclassified investments. No impairment loss was recognized on these securities in 2017, 2016 and 2015.
Interest Income on Trading and Investment SecuritiesThis account consists of:
Consolidated Parent Company2017 2016 2015 2017 2016 2015
Financial assets at FVPL P410,889 P204,882 P262,027 P398,777 P179,406 P232,464AFS financial assets 1,309,755 1,538,173 1,840,978 1,176,831 1,439,037 1,785,184HTM financial assets 2,246,355 1,539,908 997,797 2,098,194 1,441,882 929,266
P3,966,999 P3,282,963 P3,100,802 P3,673,802 P3,060,325 P2,946,914

Financial Statements 169
10. LOANS AND RECEIVABLES
This account consists of:
Consolidated Parent Company2017 2016 2017 2016
Loans and discounts Corporate and commercial lending P369,145,536 P319,733,478 P337,153,332 P288,122,032 Consumer lending 73,858,213 60,416,106 44,035,292 35,409,327
Trade-related lending 12,249,287 13,045,531 10,688,002 11,376,697 Others* 364,975 543,021 54,551 68,870
455,618,011 393,738,136 391,931,177 334,976,926Unearned discounts (307,886) (255,841) (267,099) (198,042)
455,310,125 393,482,295 391,664,078 334,778,884Allowance for impairment and credit losses (Note 16) (6,339,183) (6,654,995) (5,109,580) (5,709,025)
P448,970,942 P386,827,300 P386,554,498 P329,069,859*Others include employee loans and foreign bills purchased.
The Group’s and Parent Company’s loans and discounts under corporate and commercial lending include unquoted debt securities with carrying amount of P1.10 billion and P1.00 billion as of December 31, 2017, respectively, and P4.08 billion and P3.98 billion as of December 31, 2016, respectively.
BSP ReportingInformation on the amounts of secured and unsecured loans and receivables (gross of unearned discounts and allowance for impairment and credit losses) of the Group and Parent Company are as follows:
Consolidated Parent Company2017 2016 2017 2016
Amounts % Amounts % Amounts % Amounts %Loans secured by Real estate P71,900,048 15.78 P55,840,410 14.18 P44,232,910 11.29 P33,443,459 9.98 Chattel mortgage 30,900,443 6.78 29,496,094 7.49 18,831,553 4.80 19,713,062 5.88 Deposit hold out 3,980,670 0.87 3,806,062 0.97 2,893,239 0.74 2,251,423 0.67 Shares of stock of
other banks 5,060,000 1.11 2,710,000 0.69 5,060,000 1.29 2,710,000 0.81 Guarantee by the Republic of the Philippines 7,082,500 1.55 8,487,000 2.16 7,082,500 1.81 8,487,000 2.53 Others 80,947,148 17.77 76,814,028 19.49 78,703,585 20.08 73,171,797 21.86
199,870,809 43.87 177,153,594 44.98 156,803,787 40.01 139,776,741 41.73Unsecured loans 255,747,202 56.13 216,584,543 55.02 235,127,390 59.99 195,200,185 58.27
P455,618,011 100.00 P393,738,136 100.00 P391,931,177 100.00 P334,976,926 100.00
Information on the concentration of credit as to industry of the Group and Parent Company follows:
Consolidated2017 2016
Amounts % Amounts %Real estate, renting and business services P113,424,302 24.89 P97,201,490 24.69Wholesale and retail trade 53,818,092 11.81 57,498,702 14.60Electricity, gas and water 53,514,587 11.75 40,385,429 10.26Financial intermediaries 52,341,750 11.49 40,750,252 10.35Transportation, storage and communication 40,464,073 8.88 33,885,852 8.61Manufacturing 29,583,222 6.49 27,602,087 7.01Arts, entertainment and recreation 13,959,186 3.06 7,511,725 1.91(Forward)

China Bank Annual Financial and Sustainability Report 2017170
Consolidated2017 2016
Amounts % Amounts %Accommodation and food service activities P12,260,862 2.69 P8,227,872 2.09Construction 8,732,720 1.92 10,167,766 2.58Public administration and defense 6,232,000 1.37 7,544,000 1.92Agriculture 6,051,546 1.33 5,782,267 1.47Professional, scientific and technical activities 4,079,383 0.90 5,760,184 1.46Education 3,869,247 0.85 3,819,309 0.97Mining and quarrying 887,231 0.19 1,419,481 0.36Others* 56,399,810 12.38 46,181,720 11.73
P455,618,011 100.00 P393,738,136 100.00*Others consist of administrative and support service, health, household and other activities.
Parent Company2017 2016
Amounts % Amounts %Real estate, renting and business services P91,809,744 23.42 P76,873,563 22.95Electricity, gas and water 52,050,493 13.28 40,103,651 11.97Financial intermediaries 49,950,420 12.74 37,826,049 11.29Wholesale and retail trade 46,238,179 11.80 49,143,056 14.67Transportation, storage and communication 38,376,551 9.79 31,858,356 9.51Manufacturing 25,622,331 6.54 23,465,857 7.01Arts, entertainment and recreation 13,895,619 3.55 7,470,098 2.23Accommodation and food service activities 10,285,048 2.62 6,511,668 1.94Construction 7,349,908 1.88 8,829,298 2.64Public administration and defense 6,232,000 1.59 7,544,000 2.25Professional, scientific and technical activities 3,760,091 0.96 5,318,354 1.59Agriculture 4,442,522 1.13 3,762,789 1.12Education 2,845,294 0.73 2,807,735 0.84Mining and quarrying 884,686 0.23 1,257,731 0.38Others* 38,188,291 9.74 32,204,721 9.61
P391,931,177 100.00 P334,976,926 100.00*Others consist of administrative and support service, health, household and other activities.
The BSP considers that loan concentration exists when the total loan exposure to a particular industry or economic sector exceeds 30.00% of total loan portfolio. As of December 31, 2017 and 2016, the Parent Company does not have credit concentration in any particular industry.
As of December 31, 2017 and 2016, secured and unsecured non-performing loans (NPLs) of the Group and the Parent Company follow:
Consolidated Parent Company2017 2016 2017 2016
Secured P3,164,209 P3,038,413 P687,318 P1,086,882 Unsecured 3,237,418 4,274,659 2,235,931 2,642,103
P6,401,627 P7,313,072 P2,923,249 P3,728,985
Generally, NPLs refer to loans whose principal and/or interest is unpaid for thirty (30) days or more after due date or after they have become past due in accordance with existing BSP rules and regulations. This shall apply to loans payable in lump sum and loans payable in quarterly, semi-annual, or annual installments, in which case, the total outstanding balance thereof shall be considered nonperforming.
In the case of loans that are payable in monthly installments, the total outstanding balance thereof shall be considered nonperforming when three (3) or more installments are in arrears.

Financial Statements 171
In the case of loans that are payable in daily, weekly, or semi-monthly installments, the total outstanding balance thereof shall be considered nonperforming at the same time that they become past due in accordance with existing BSP regulations, i.e., the entire outstanding balance of the receivable shall be considered as past due when the total amount of arrearages reaches twenty percent (20.00%) of the total loan balance.
Loans are classified as nonperforming in accordance with BSP regulations, or when, in the opinion of management, collection of interest or principal is doubtful. Loans are not reclassified as performing until interest and principal payments are brought current or the loans are restructured in accordance with existing BSP regulations, and future payments appear assured.
Loans which do not meet the requirements to be treated as performing loans shall also be considered as NPLs. Gross and net NPLs of the Parent Company as reported to BSP amounted to P2.92 billion and P0.98 billion, respectively, in 2017 and P3.73 billion and P1.42 billion, respectively, in 2016. Gross and net NPL ratios of the Parent Company are 0.76% and 0.25%, respectively, in 2017 and 1.12% and 0.43%, respectively, in 2016.
Interest Income on Loans and ReceivablesThis account consists of:
Consolidated Parent Company2017 2016 2015 2017 2016 2015
Receivables from customers P21,663,571 P17,812,793 P15,813,206 P17,455,018 P14,055,123 P12,257,457Unquoted debt securities 88,076 76,459 87,521 81,999 67,164 67,502
P21,751,647 P17,889,252 P15,900,727 P17,537,017 P14,122,287 P12,324,959
As of December 31, 2017 and 2016, 65.01% and 52.53%, respectively, of the total receivables from customers of the Group were subject to interest repricing. As of December 31, 2017 and 2016, 67.67% and 53.29%, respectively, of the total receivables from customers of the Parent Company were subject to interest repricing. Remaining receivables carry annual fixed interest rates ranging from 2.08% to 10.50% in 2017, from 1.00% to 11.00% in 2016, and from 1.82% to 8.00% in 2015 for foreign currency-denominated receivables and from 0.95% to 30.00% in 2017, and from 1.00% to 30.00% in 2016 and 2015 for peso-denominated receivables.
11. EQUITY INVESTMENTS
This account consists of investments in:
A. Subsidiaries2017 2016
Equity Method:Balance at beginning of the year
CBSI P11,047,530 P8,486,452 CBCC 732,541 300,000 CBC Forex Corporation – 50,000 CBC-PCCI 22,853 12,805 CIBI 366,113 291,922
12,169,037 9,141,179Share in net income
CBSI 514,396 153,260 CBCC 276,161 231,514 CBC-PCCI 5,851 8,915 CIBI 39,596 71,310
836,004 464,999Share in Other Comprehensive IncomeItems that recycle to profit or loss in subsequent periods:
Net unrealized gain (loss) on AFS CBSI 24,765 (119,626) CBCC 1,926 1,027 CIBI (4,196) (2,211)
22,495 (120,811)(Forward)

China Bank Annual Financial and Sustainability Report 2017172
2017 2016Cumulative translation adjustments
CBSI P13,058 P26,57513,058 26,575
Items that do not recycle to profit or loss in subsequent periods:Remeasurement gain on defined benefit assets
CBSI 18,964 9,001 CBCC 2,272 – CBC-PCCI (798) 1,134 CIBI (298) 5,091
20,140 15,226Surplus Reserves
CBSI – (8,584) – (8,584)
Additional Investments CBSI – 2,500,452 CBCC 500,000 200,000
500,000 2,700,452Divestments
CBC Forex Corporation – (50,000) – (50,000)
Balance at end of the year CBSI 11,618,713 11,047,530 CBCC 1,512,899 732,541 CBC-PCCI 27,905 22,853 CIBI 401,215 366,113
P13,560,733 P12,169,037
B. Associates:
2017 2016Equity Method:Balance at beginning of the year P276,559 P371,399Share in net income (loss) 73,133 (89,384)Share in OCI:Items that do not recycle to profit or loss in subsequent periods Remeasurement loss on life insurance reserves (12,221) –Items that recycle to profit or loss in subsequent periods: Net unrealized loss on AFS (8,050) (5,456)Balance at end of the year P329,422 P276,559
CBSICost of investment includes the original amount incurred by the Parent Company from its acquisition of CBSI in 2007 amounting to P1.07 billion. The capital infusions to CBSI in 2016 amounting to P1.50 billion and P1.00 billion were approved by the Parent Company’s Executive Committee on December 1, 2016 and September 21, 2016, respectively.
Merger of CBSI with PDBThe BOD of both CBSI and PDB, in their meeting held on June 26, 2014, approved the proposed merger of PDB with CBSI, with the latter as the surviving bank. The terms of the Plan of Merger of CBSI with PDB were approved by CBSI and PDB’s stockholders owning at least 2/3 of each corporation’s outstanding common stocks in separate meetings held on August 14, 2014. The Plan of Merger permits the issuance of 1.23 PDB common shares for every CBSI common share.
On November 6, 2015, the BSP issued the Certificate of Authority on the Articles of Merger and the Plan of Merger, as amended, of CBSI and PDB.

Financial Statements 173
On December 17, 2015, CBSI obtained SEC’s approval of its merger with PDB, whereby the entire assets and liabilities of PDB shall be transferred to and absorbed by CBSI.
Acquisition of PDBIn 2014, the Parent Company made tender offers to non-controlling stockholders of PDB. As of December 31, 2014, the Parent Company owns 99.85% and 100.00% of PDB’s outstanding common and preferred stocks, respectively.
As of December 31, 2014, the Parent Company’s cost of investment in PDB consists of:
Acquisition of majority of PDB’s capital stock P1,421,346Additional capital infusion 1,300,000Tender offers 255,354
P2,976,700
On March 31, 2015, the Parent Company made additional capital infusion to PDB amounting to P1.70 billion. Of the total cost of investment, the consideration transferred for the acquisition of PDB follows:
Acquisition of majority of PDB’s capital stock P1,421,346Tender offers 255,354
P1,676,700
In 2015, the MB of the BSP granted to the Group investment and merger incentives in the form of waiver of special licensing fees for 67 additional branch licenses in restricted areas. This is in addition to the initial investment and merger incentives of 30 new branches in restricted areas and 35 branches to be transferred from unrestricted to restricted areas granted to the Parent Company by the MB in 2014. These branch licenses were granted under the Strengthening Program for Rural Bank (SPRB) Plus Framework.
The branch licenses have the following fair values:
114 Commercial Bank branch licenses P2,280,00018 Thrift Bank branch licenses 270,000
2,550,000Deferred tax liability 765,000
P1,785,000
On April 6, 2016, the Parent Company’s BOD has approved the allocation of the 67 additional branch licenses in restricted areas as follows: 49 to the Parent Company and 18 to CBSI. Pursuant to a memorandum dated March 18, 2016, the 67 branch licenses were awarded as incentives by the Monetary Board as a result of the Parent Company’s acquisition of PDB. Goodwill from acquisition of PDB is computed as follows:
Consideration transferred P1,676,700Less: Fair value of identifiable assets and liabilities acquired (Note 15) Net liabilities of PDB (P725,207) Branch licenses, net of deferred tax liability (Note 13) 1,785,000 1,059,793
P616,907
CBCCOn April 1, 2015, the BOD approved the investment of the Parent Company in an investment house subsidiary, CBCC, up to the amount of P500.00 million, subject to the requirements of relevant regulatory agencies. On April 30, 2015, the BSP approved the request of the Parent Company to invest up to 100% or up to P500.00 million common shares in CBCC, subject to certain conditions. On November 27, 2015, the SEC approved the Articles of Incorporation and By-Laws of CBCC. It also granted CBCC the license to operate as an investment house. Actual capital infusion to CBCC amounted to P200.00 million and P300.00 million in 2016 and 2015, respectively.
On January 19, 2017, the BOD of CBCC approved the increase in authorized capital stock of CBCC from P500.00 million to P2.00 billion to enable CBCC to handle bigger deals. The approval was ratified by the BOD of the Parent Company on February 1, 2017. On April 27, 2017, the Parent Company paid CBCC P500.00 million for additional subscription of 50,000,000 shares.
CBCC acquisition of CBCSec (formerly ATC Securities, Inc.)On May 19, 2016, the BOD of CBCC approved the acquisition of ATC Securities, Inc. (ATC).

China Bank Annual Financial and Sustainability Report 2017174
On June 29, 2016, CBCC and the shareholders of ATC (the Original Shareholders) entered into an Agreement for the Purchase of Shares (Agreement), whereby CBCC agreed to buy, and the Original Shareholders agreed to sell, 3,800,000 shares representing 100% of the issued and outstanding shares of ATC.
The initial purchase price for the acquisition of ATC was set at P21,767,997.50, payable as follows:
a. 10% – on signing date of the Agreement (June 29, 2016) b. 70% of the purchase price – on closing date (March 6, 2017)c. 10% of the purchase price – upon receipt of Certificates Authorizing Registration and Tax Clearance Certificatesd. 10% of the purchase price – one year from the closing date (March 6, 2018), subject to any deduction for certain losses
On February 22, 2017, the Philippine Stock Exchange approved ATC’s application for change in controlling interest through CBCC’s acquisition of 100% of the issued and outstanding shares of ATC.
In view of the prolonged period since the Agreement was signed and the resulting change in the financial position, prospects, and other circumstances of ATC and its Original Shareholders, the parties agreed to negotiate an adjustment to the purchase price that is mutually acceptable to CBCC and the Original Shareholders.
On March 6, 2017, CBCC and the Original Shareholders agreed to fix the final purchase price of the acquisition at P26,704,341, and the Original Shareholders executed deeds of absolute sale of their respective shares in ATC in favor of CBCC. By virtue of this transaction, CBCC assumed ownership and control of ATC.
On March 6, 2017, CBCC and ATC entered into a Subscription Agreement, whereby CBCC subscribed to 7,200,000 common shares of ATC at a price of P10.00 per share or a total subscription price of P72.00 million.
The fair values of identifiable assets and liabilities arising from the acquisition as of March 6, 2017 are as follows:
AssetsCash and cash equivalents P9,196,017 Accounts receivable 348,024 Computer software (net) 559,375 Office equipment (net) 149,264 Trading rights 8,500,000 Prepaid expenses 1,755,945 Condominium 12,063,309 Other assets 3,004,295 Total Assets 35,576,228 LiabilitiesAccounts payable 406,250 Payable to customer 2,256,733 Payable to clearing house 61,519 Other liabilities 56,820 Total Liabilities 2,781,321 Net Book Value P32,794,907
The acquisition by CBCC of ATC Securities, Inc. resulted in recognition of gain on bargain purchase which is determined as follows:
Cost of acquisition P26,704,341Less net assets recognized 32,794,907Gain on bargain purchase P6,090,566
The gain from a bargain purchase identified as the excess of the fair value of the net assets of ATC Securities, Inc. over the cost of acquisition is mainly attributable to the mutually agreed price that accounts for intention of the Original Shareholders to ultimately retire from the business, prevention of further outlay of funds from the Original Shareholders to ensure compliance with regulatory capital requirements and their relative ability to divest of the said shares in an expeditious manner.
Gain on bargain purchase is included under ‘Miscellaneous income’ in the consolidated statements of income (Note 21).

Financial Statements 175
Cash flow on acquisition follows:
Cash and cash equivalents acquired from ATC Securities, Inc. P9,196,017Cash paid 24,033,906Net Cash Outflow P14,837,889
From the date of acquisition, CBCSec’s operating income and net income included in the consolidated statement of comprehensive income amounted to P6.37 million. If the acquisition had taken place at the beginning of the year, the Group’s total operating income and net income would have increased by P5.69 million.
On July 6, 2017, the SEC approved the change of name from ATC Securities, Inc. to China Bank Securities Corporation.
On August 23, 2017, CBCC subscribed to the remaining 4,000,000 unissued common shares of CBCSec at a price of P10.00 per share or a total subscription price of P40.00 million, to provide CBCSec with sufficient capital buffer as its transition and ramps up its operations as the equities brokerage house of the Group.
CBC Assets One (SPC) Inc. CBC Assets One (SPC) Inc. was incorporated on June 15, 2016 as a wholly-owned special purpose company of CBCC for asset-backed securitization. It has not yet commenced commercial operations.
CBC Forex CorporationOn May 5, 2009, the BOD approved to dissolve the operations of CBC Forex by shortening its corporate life until December 31, 2009. On December 28, 2015, the Parent Company obtained the approval from the SEC of its Certificate of Filing of Amended Articles of Incorporation (Amending the Article IV by shortening the term of its existence, thereby dissolving the Corporation) dated November 6, 2015. On December 19, 2016, the Parent Company’s investment with CBC Forex Corporation amounting P50.00 million was liquidated.
Investment in AssociatesInvestment in associates in the consolidated and Parent Company’s financial statements pertain to investment in MCB Life and CBC-PCCI’s investment in Urban Shelters (accounted for by CBC-PCCI in its financial statements as an investment in an associate) which is carried at nil amount as of December 31, 2017 and 2016.
The following tables show the summarized financial information of MCB Life:
2017 2016Total assets P31,656,389 P26,419,046Total liabilities 30,834,456 25,727,647Equity 821,933 691,398
2017 2016Revenues P6,268,406 P7,663,417Benefits, claims and operating expenses 6,066,765 7,860,618Income (loss) before income tax 201,641 (197,201)Net income (loss) 182,833 (223,460)
MCB LifeOn August 2, 2006, the BOD approved the joint project proposal of the Parent Company with Manufacturers Life Insurance Company (Manulife). Under the proposal, the Parent Company will invest in a life insurance company owned by Manulife, and such company will be offering innovative insurance and financial products for health, wealth and education through the Parent Company’s branches nationwide. The life insurance company was incorporated as The Pramerica Life Insurance Company Inc. in 1998. The name was changed to Manulife China Bank Life Assurance Corporation on March 23, 2007. The Parent Company acquired 5.00% interest in MCB Life on August 8, 2007. This investment is accounted for as an investment in an associate by virtue of the Bancassurance Alliance Agreement which provides the Parent Company to be represented in MCB Life’s BOD and, thus, exercise significant influence over the latter.
The BSP requires the Parent Company to maintain a minimum of 5.00% ownership over MCB Life in order for MCB Life to be allowed to continue distributing its insurance products through the Parent Company’s branches.
On September 12, 2014, the BSP approved the request of the Parent Company to raise its capital investment in MCB Life from 5.00% to 40.00% of its authorized capital through purchase of 1.75 million common shares.
Commission income earned by the Parent Company from its bancassurance agreement with MCB Life amounting to P360.01 million, P383.48 million and P337.41 million in 2017, 2016 and 2015, respectively, is included under ‘Miscellaneous income’ in the statements of income (Note 21).

China Bank Annual Financial and Sustainability Report 2017176
12. BANK PREMISES, FURNITURE, FIXTURES AND EQUIPMENT
The composition of and movements in this account follow:
Consolidated
Land(Note 23)
Furniture, Fixtures and Equipment Buildings
Leasehold Improvements
Construction- in-Progress
2017 Total
CostBalance at beginning of year P3,345,404 P7,163,737 P1,893,525 P1,482,415 P86,405 P13,971,486Additions − 988,658 73,800 679,305 10,410 1,752,173Disposals/transfers* − (258,867) (25,583) (306,155) (35,326) (625,931)Balance at end of year 3,345,404 7,893,528 1,941,742 1,855,565 61,489 15,097,728Accumulated Depreciation
and AmortizationBalance at beginning of year − 5,562,502 1,013,296 897,049 − 7,472,847Depreciation and amortization − 674,334 74,625 183,435 − 932,394Disposals/transfers* − (157,787) 15,729 (42,467) − (184,525)Balance at end of year − 6,079,049 1,103,650 1,038,017 − 8,220,716Allowance for Impairment Losses
(Note 16)Balance at beginning of year − − 2,371 − − 2,371Reclassification − − (1,223) − − (1,223)Balance at end of year − − 1,148 − − 1,148Net Book Value at End of Year P3,345,404 P1,814,479 P836,944 P817,548 P61,489 P6,875,864*Includes transfers from investment properties amounting to P10.82 million.
Consolidated
Land(Note 23)
Furniture, Fixtures and Equipment Buildings
Leasehold Improvements
Construction- in-Progress
2016 Total
CostBalance at beginning of year P3,347,222 P6,601,919 P1,832,834 P1,338,260 P90,873 P13,211,108Additions − 809,311 99,911 215,122 11,307 1,135,651Disposals/transfers* (1,818) (247,493) (39,220) (70,967) (15,775) (375,273)Balance at end of year 3,345,404 7,163,737 1,893,525 1,482,415 86,405 13,971,486Accumulated Depreciation
and AmortizationBalance at beginning of year − 5,097,654 895,859 861,406 − 6,854,919Depreciation and amortization − 624,690 114,196 103,330 − 842,216Disposals/transfers* − (159,842) 3,241 (67,687) − (224,288)Balance at end of year − 5,562,502 1,013,296 897,049 − 7,472,847Allowance for Impairment Losses
(Note 16) − −Balance at beginning of year − − 2,070 − − 2,070Reclassification − − 301 − − 301Balance at end of year − − 2,371 − − 2,371Net Book Value at End of Year P3,345,404 P1,601,235 P877,858 P585,366 P86,405 P6,496,268*Includes transfers from investment properties amounting to P4.69 million

Financial Statements 177
Parent Company
Land (Note 23)
Furniture, Fixtures and Equipment Buildings
Leasehold Improvements
Construction- in-Progress
2017 Total
CostBalance at beginning of year P2,786,310 P6,082,009 P1,077,608 P1,093,494 P80,139 P11,119,560Additions − 786,776 40,422 550,076 10,410 1,387,684Disposals/transfers* − (200,484) (32,362) (291,701) (29,063) (553,610)Balance at end of year 2,786,310 6,668,301 1,085,668 1,351,869 61,486 11,953,634Accumulated Depreciation
and AmortizationBalance at beginning of year − 4,775,377 517,491 682,711 − 5,975,579Depreciation and amortization − 537,338 26,456 115,273 − 679,067Disposals/transfers* − (123,299) (72) (42,223) − (165,594)Balance at end of year − 5,189,416 543,875 755,761 − 6,489,052Net Book Value at End of Year P2,786,310 P1,478,885 P541,793 P596,108 P61,486 P5,464,582*Includes transfers from investment properties amounting to P10.82 million.
Parent Company
Land(Note 23)
Furniture, Fixtures and Equipment Buildings
Leasehold Improvements
Construction- in-Progress
2016 Total
CostBalance at beginning of year P2,786,350 P5,612,477 P1,027,236 P999,819 P88,054 P10,513,936Additions − 675,734 89,359 169,256 7,701 942,050Disposals/transfers* (40) (206,202) (38,987) (75,581) (15,616) (336,426)Balance at end of year 2,786,310 6,082,009 1,077,608 1,093,494 80,139 11,119,560Accumulated Depreciation
and AmortizationBalance at beginning of year − 4,386,057 462,552 668,125 − 5,516,734Depreciation and amortization − 482,832 27,819 85,160 − 595,811Disposals/transfers* − (93,512) 27,120 (70,574) − (136,966)Balance at end of year − 4,775,377 517,491 682,711 − 5,975,579Net Book Value at End of Year P2,786,310 P1,306,632 P560,117 P410,783 P80,141 P5,143,981*Includes transfers from investment properties amounting to P4.69 million.
The Group adopted the deemed cost model as of January 1, 2004 and considered the carrying value of the land determined under its previous accounting method (revaluation method) as the deemed cost of the asset as of January 1, 2005. Accordingly, revaluation increment amounting to P1.28 billion was closed to surplus (Note 23) in 2011.
As of December 31, 2017 and 2016, the gross carrying amount of fully depreciated furniture, fixtures and equipment still in use amounted to P2.89 billion for the Group and P2.31 billion for the Parent Company.
Gain on sale of furniture, fixtures and equipment amounting to P2.11 million, P2.97 million and P0.89 million in 2017, 2016 and 2015, respectively, for the Group and P1.69 million, P2.17 million and P0.50 million in 2017, 2016 and 2015, respectively, for the Parent Company are included in the statements of income under ‘Miscellaneous income’ account (Note 21).
In 2015, depreciation and amortization amounting to P822.76 million and P580.06 million for the Group and Parent Company, respectively, are included in the statements of income under ‘Depreciation and amortization’ account.

China Bank Annual Financial and Sustainability Report 2017178
13. INVESTMENT PROPERTIES
The composition of and movements in this account follow:
Consolidated
Land Buildings and Improvements
2017 Total
CostBalance at beginning of year P4,730,076 P2,788,397 P7,518,473Additions 299,806 279,283 579,089Disposals/write-off/transfers* (424,821) (421,131) (845,952)Balance at end of year 4,605,061 2,646,549 7,251,610Accumulated Depreciation and AmortizationBalance at beginning of year – 755,763 755,763Depreciation and amortization – 191,338 191,338Disposals/write-off/transfers* – (205,030) (205,030)Balance at end of year – 742,071 742,071Allowance for Impairment Losses (Note 16)Balance at beginning of year 1,028,013 384,958 1,412,971Disposals/write-off/reclassification* – 24,412 24,412Balance at end of year 1,028,013 409,370 1,437,383Net Book Value at End of Year P3,577,048 P1,495,108 P5,072,156*Includes transfers to bank premises amounting to P10.82 million (Note 12).
Consolidated
Land Buildings and Improvements
2016 Total
CostBalance at beginning of year P4,810,128 P2,588,845 P7,398,973Additions 363,175 421,240 784,415Disposals/write-off/transfers* (443,227) (221,688) (664,915)Balance at end of year 4,730,076 2,788,397 7,518,473Accumulated Depreciation and AmortizationBalance at beginning of year − 713,023 713,023Depreciation and amortization − 173,007 173,007Disposals/write-off/transfers* − (130,267) (130,267)Balance at end of year − 755,763 755,763Allowance for Impairment Losses (Note 16)Balance at beginning of year 1,023,837 263,974 1,287,811Reversal during the year − (797) (797)Disposals/write-off/reclassification* 4,176 121,781 125,957Balance at end of year 1,028,013 384,958 1,412,971Net Book Value at End of Year P3,702,063 P1,647,676 P5,349,739*Includes transfers to bank premises amounting to P4.69 million (Note 12).

Financial Statements 179
Parent Company
Land Buildings and Improvements
2017 Total
CostBalance at beginning of year P2,019,065 P1,511,349 P3,530,414Additions 40,573 86,079 126,652Disposals/write-off/transfers* (200,283) (199,760) (400,043)Balance at end of year 1,859,355 1,397,668 3,257,023Accumulated Depreciation and AmortizationBalance at beginning of year – 563,120 563,120Depreciation and amortization – 104,638 104,638Disposals/write-off/transfers* – (167,656) (167,656)Balance at end of year – 500,102 500,102Allowance for Impairment Losses (Note 16)Balance at beginning and end of year 1,004,729 201,689 1,206,418Net Book Value at End of Year P854,626 P695,877 P1,550,503*Includes transfers to bank premises amounting to P10.82 million (Note 12).
Parent Company
Land Buildings and Improvements
2016 Total
CostBalance at beginning of year P2,176,474 P1,520,017 P3,696,491Additions 164,833 132,011 296,844Disposals/write-off/transfers* (322,242) (140,679) (462,921)Balance at end of year 2,019,065 1,511,349 3,530,414Accumulated Depreciation and AmortizationBalance at beginning of year – 590,211 590,211Depreciation and amortization – 98,915 98,915Disposals/write-off/transfers* – (126,006) (126,006)Balance at end of year – 563,120 563,120Allowance for Impairment Losses (Note 16)Balance at beginning and end of year 1,004,729 201,689 1,206,418Net Book Value at End of Year P1,014,336 P746,540 P1,760,876*Includes transfers to bank premises amounting to P4.69 million (Note 12).
The Group’s investment properties consist entirely of real estate properties acquired in settlement of loans and receivables. The difference between the fair value of the investment property upon foreclosure and the carrying value of the loan is recognized under ‘Gain on asset foreclosure and dacion transactions’ in the statements of income.
In 2015, depreciation and amortization amounting to P142.28 million and P81.85 million for the Group and Parent Company, respectively, are included in the statements of income under ‘Depreciation and amortization’ account.
Details of rental income earned and direct operating expenses incurred on investment properties follow:
Consolidated2017 2016 2015
Rent income on investment properties P32,499 P20,190 P31,100Direct operating expenses on investment properties
generating rent income 924 4,767 2,392Direct operating expenses on investment properties not
generating rent income 52,029 67,619 52,429

China Bank Annual Financial and Sustainability Report 2017180
Parent Company2017 2016 2015
Rent income on investment properties P8,250 P39,734 P7,020Direct operating expenses on investment properties
generating rent income 799 886 1,069Direct operating expenses on investment properties not
generating rent income 33,405 44,089 35,270
Rent income earned from leasing out investment properties is included under ‘Miscellaneous income’ in the statements of income (Note 21).
On August 26, 2011, the Parent Company was registered as an Economic Zone Information Technology (IT) Facilities Enterprise with the Philippine Economic Zone Authority (PEZA) to operate and maintain a proposed 17-storey building located inside the CBP-IT Park in Barangays Mabolo, Luz, Hipodromo, Carreta, and Kamputhaw, Cebu City, for lease to PEZA-registered IT enterprises, and to be known as Chinabank Corporate Center. This registration is under PEZA Registration Certificate No. 11-03-F.
Under this registration, the Parent Company is entitled to five percent (5.00%) final tax on gross income earned from locator IT enterprises and related operations in accordance with existing PEZA rules. The Parent Company shall also be exempted from the payment of all national and local taxes in relation to this registered activity.
14. GOODWILL AND INTANGIBLE ASSETS
GoodwillGoodwill represents the excess of the acquisition costs over the fair value of the identifiable assets and liabilities of companies acquired by the Group.
The Group attributed the goodwill arising from its acquisition of CBSI and PDB to factors such as increase in geographical presence and customer base due to the branches acquired. None of the goodwill recognized is expected to be deductible for income tax purposes. CBSI as surviving entity from the merger with PDB, is the identified CGU for this goodwill. The Parent Company’s Retail Banking Business (RBB) has been identified as the CGU for impairment testing of the goodwill from its acquisition of CBSI.
As of December 31, 2017 and 2016, amount of goodwill per CGU follows: Consolidated Parent Company
RBB P222,841 P222,841CBSI 616,907 –Total P839,748 P222,841
The recoverable amount of the CGUs have been determined based on a value-in-use calculation using cash flow projections from financial budgets approved by senior management covering a five-year period, which do not include restructuring activities that the Group is not yet committed to or significant future investments that will enhance the asset base of the CGU being tested. The significant assumptions, and the most sensitive, used in computing for the recoverable values of the CGUs follow:
RBB CBSIGrowth ratesLoans 9.84% 16.90%Deposits 13.56% 16.40%Discount rate 6.41% 7.83%Terminal value growth rate 1.00% 1.00%
With regard to the assessment of value-in-use of the CGU, management believes that no reasonably possible change in any of the above key assumptions would cause the carrying value of the goodwill to materially exceed its recoverable amount as of December 31, 2017 and 2016.
Branch LicensesBranch licenses of the Group arose from the acquisitions of CBSI, Unity Bank, and PDB. As of December 31, 2017 and 2016, details of branch licenses in the Group’s and Parent Company’s financial statements follow:
Consolidated Parent Company2017 2016 2017 2016
Branch license from CBSI acquisition P420,600 P477,600 P398,000 P455,000Branch license from Unity Bank acquisition 347,400 347,400 – –Branch license from PDB acquisition (Note 11) 2,839,500 2,839,500 – –Total P3,607,500 P3,664,500 P398,000 P455,000

Financial Statements 181
The individual branches have been identified as the CGU for impairment testing of the branch licenses. The recoverable amounts of the CGUs for impairment testing of the branch licenses have been determined based on the higher between fair value less cost to sell and value-in-use calculations.
FVLCD is based on special licensing fee of BSP on branches operating on identified restricted areas. Value-in-use calculation uses cash flow projections from financial budgets approved by senior management covering a five-year period, which do not include restructuring activities that the Group is not yet committed to or significant future investments that will enhance the asset base of the CGU being tested. The significant assumptions used in computing for the recoverable values of the CGUs follow:
Growth ratesLoans 10.00%Deposits 10.00%
Discount rate 6.41%Terminal value growth rate 1.00%
The calculation of the value-in-use of the CGU is most sensitive to the following assumptions:
• Discount rates• Terminal value growth rate used to extrapolate cash flows beyond the budget period
With regard to the assessment of value-in-use of the CGU, the Parent Company recognized an impairment loss related to certain unrestricted branch licenses from the acquisition of CBSI amounting to P57.00 million as of December 31, 2017.
Capitalized software costs
The movements in the account follow:
Consolidated Parent Company2017 2016 2017 2016
CostBalance at beginning of year P549,156 P322,186 P445,444 P322,186Additions 165,074 226,970 145,814 123,258Balance at end of year 714,230 549,156 591,258 445,444Accumulated Depreciation and AmortizationBalance at beginning of year 123,940 143,777 94,861 14,378Depreciation and amortization 93,757 109,563 93,535 80,484Balance at end of year 217,697 123,940 188,396 94,862Net Book Value at End of Year P496,533 P425,216 P402,862 P350,582
15. OTHER ASSETS
This account consists of:
Consolidated Parent Company2017 2016 2017 2016
Financial assetsAccounts receivable P2,884,628 P4,153,356 P1,686,205 P3,120,990SCR 979,046 953,734 208,496 254,485RCOCI 179,935 107,193 83,636 92,651Others 369,034 437,919 157,380 136,374
4,412,643 5,652,202 2,135,717 3,604,500
(Forward)

China Bank Annual Financial and Sustainability Report 2017182
Consolidated Parent Company2017 2016 2017 2016
Nonfinancial assetsNet plan assets (Note 24) P995,050 P754,754 P991,386 P754,754Prepaid expenses 124,526 155,016 114,121 146,036Creditable withholding taxes 378,143 266,599 321,231 211,159Security deposit 231,838 194,043 205,400 175,224Documentary stamps 309,642 244,272 182,778 164,057Sundry debits 235,136 84,824 71,552 62,736Miscellaneous 298,882 263,371 – –
2,573,217 1,962,879 1,886,468 1,513,9666,985,860 7,615,081 4,022,185 5,118,466
Allowance for impairment and credit losses (Note 16) (766,965) (718,434) (540,960) (614,366)P6,218,895 P6,896,647 P3,481,225 P4,504,100
Accounts receivableAs of December 31, 2016, about 41.92% of the Group’s accounts receivable represents final withholding taxes (FWT) imposed by the Bureau of Internal Revenue (BIR) and withheld by the Bureau of Treasury (BTr) from the proceeds collected by the Group upon maturity of the Poverty Eradication and Alleviation Certificates (PEACe) bonds on October 18, 2011.
On October 17, 2011, the Parent Company together with seven other banks filed a joint petition against the BIR’s decision to impose 20.00% FWT on PEACe bonds. The Supreme Court (SC) issued a temporary restraining order in favor of these banks on the same day and ordered these banks to place in escrow an amount equivalent to the disputed withholding tax until final decision is rendered. However, the BTr withheld the 20.00% FWT from the proceeds of the PEACe bonds and held it in an escrow account with the Land Bank of the Philippines.
On January 13, 2015, the SC ordered the BTr to release to the investor banks the amount corresponding to the 20.00% final withholding tax. On March 13, 2015, the BIR filed a motion for reconsideration and clarification. Pursuant to a resolution dated April 21, 2015 by the SC, the banks filed a consolidated comment on the motions filed by the respondents.
In an en banc ruling received on October 5, 2016, the SC upheld its October 2011 decision ordering the BTr to return the P4.97 billion to the petitioners and for the BTr to pay legal interest for failure to comply with the SC’s earlier ruling in favor of the holders of the said bonds. In late October 2016, the Government filed a motion for partial reconsideration with regard to the October 2016 ruling.
In an en banc ruling received on January 17, 2017, the SC denied the motion for partial reconsideration. No further pleadings or motions shall be entertained by the SC.
On April 11, 2017, the BTr paid the Parent Company together with the seven banks the withheld amount and 4.00% interest per annum from October 19, 2011 to April 10, 2017. Total settlement amount were paid in the form of 3-year Retail Treasury Bonds with interest of 4.25% per annum. The settlement resulted in gain amounting to P381.65 million and P356.77 million for the Group and Parent Company, respectively, which is presented under ‘Miscellaneous income’ (Note 21).
Accounts receivable also includes non-interest bearing advances to officers and employees, with terms ranging from 1 to 30 days and receivables of the Parent Company from automated teller machine (ATM) transactions of clients of other banks that transacted through any of the Parent Company’s ATM terminals.
Sales Contract ReceivableThis refers to the amortized cost of assets acquired in settlement of loans through foreclosure or dation in payment and subsequently sold on installment basis whereby the title to the said property is transferred to the buyers only upon full payment of the agreed selling price.
SCR bears fixed interest rate per annum in 2017 and 2016 ranging from 5.00% to 10.25% and 5.00% and 12.25%, respectively.
MiscellaneousMiscellaneous consists mainly of unissued stationery and supplies, inter-office float items, and deposits for various services.

Financial Statements 183
16. ALLOWANCE FOR IMPAIRMENT AND CREDIT LOSSES
Changes in the allowance for impairment and credit losses are as follows:
Consolidated Parent Company2017 2016 2017 2016
Balances at beginning of year Loans and receivables P6,654,995 P6,994,670 P5,709,025 P6,151,786 Investment properties 1,412,971 1,287,811 1,206,418 1,206,418 Accrued interest receivable 179,339 69,331 62,019 68,342 AFS financial assets 38,742 38,742 6,323 6,323
Bank premises, furniture, fixtures and equipment 2,371 2,070 – –Intangible assets – – – –
Other assets 718,434 741,589 614,366 626,1039,006,852 9,134,213 7,598,151 8,058,972
Provisions charged to operations 754,171 850,546 423,922 521,475Accounts charged off and others (1,012,065) (977,907) (1,100,523) (982,296)
(257,894) (127,361) (676,601) (460,821)Balances at end of year Loans and receivables (Note 10) 6,339,183 6,654,995 5,109,580 5,709,025 Investment properties (Note 13) 1,437,383 1,412,971 1,206,418 1,206,418 Accrued interest receivable 165,452 179,339 58,269 62,019 AFS financial assets (Note 9) 38,827 38,742 6,323 6,323 Bank premises, furniture, fixtures and equipment
(Note 12) 1,148 2,371 – – Other assets (Note 15) 766,965 718,434 540,960 614,366
P8,748,958 P9,006,852 P6,921,550 P7,598,151
At the current level of allowance for impairment and credit losses, management believes that the Group has sufficient allowance to cover any losses that may be incurred from the non-collection or non-realization of its loans and receivables and other risk assets.
The separate valuation allowance of acquired loans and receivables from PDB amounting to P1.59 billion was not recognized by the Group on the effectivity date of acquisition as these receivables were measured at fair value at acquisition date. Any uncertainties about future cash flows of these receivables were included in their fair value measurement (Note 11). Also, the separate valuation allowance of acquired investment properties from PDB amounting to P199.15 million was not recognized by the Group on the effectivity date of acquisition as these properties were measured at fair value on acquisition date.
A reconciliation of the allowance for credit losses on loans and receivables from customers, AFS financial assets and accrued interest receivable follows:
Consolidated2017
Loans and Receivables AFS Financial Assets
Accrued Interest Receivable
Corporate and Commercial Lending
Consumer Lending
Trade-related Lending Others Total
Unquoted Equity Securities
Balance at beginning of year P4,593,387 P1,631,460 P277,623 P152,525 P6,654,995 P38,742 P179,339Provisions during the year 224,815 453,404 158 – 678,377 – 37,821Transfers/others (897,841) (5,000) (91,205) (143) (994,189) 85 (51,708)Balance at end of year P3,920,361 P2,079,864 P186,576 P152,382 P6,339,183 P38,827 P165,452Individual impairment 950,102 925,165 54,429 151,836 2,081,532 38,827 165,452Collective impairment 2,970,259 1,154,699 132,147 546 4,257,651 – –
P3,920,361 P2,079,864 P186,576 P152,382 P6,339,183 P38,827 P165,452

China Bank Annual Financial and Sustainability Report 2017184
Consolidated2016
Loans and Receivables AFS Financial Assets
Accrued Interest Receivable
Corporate and Commercial
Lending Consumer Lending
Trade-related Lending Others Total
Unquoted Equity Securities
Balance at beginning of year P5,289,222 P1,313,023 P390,326 P2,099 P6,994,670 P38,742 P69,331Provisions (recoveries)
during the year311,242 410,941 (258) 689 722,614 - 43,174
Transfers/others (1,007,077) (92504) (112,445) 149,737 (1,062,289) (4,464) 66,834Balance at end of year P4,593,387 P1,631,460 P277,623 P152,525 P6,654,995 P34,278 P179,339Individual impairment 1,462,699 729,796 145,476 151,836 2,489,807 38,302 179,339Collective impairment 3,130,688 901,664 132,147 689 4,165,188 - -
P4,593,387 P1,631,460 P277,623 P152,525 P6,654,995 P38,302 P179,339
Parent Company2017
Loans and ReceivablesAFS Financial
AssetsAccrued Interest
Receivable
Corporate and Commercial
LendingConsumerLending
Trade-related Lending Others Total
Unquoted Equity
SecuritiesBalance at beginning of year P4,381,126 P1,061,364 P265,846 P689 P5,709,025 P6,323 P62,019Provisions during the year 138,503 252,010 158 – 390,671 – 141Transfers/others (898,767) – (91,206) (143) (990,116) – (3,891)Balance at end of year P3,620,862 P1,313,374 P174,798 P546 P5,109,580 P6,323 P58,269Individual impairment 728,378 925,165 46,061 – 1,699,604 6,323 58,269Collective impairment 2,892,484 388,209 128,737 546 3,409,976 – –
P3,620,862 P1,313,374 P174,798 P546 P5,109,580 P6,323 P58,269
Parent Company2016
Loans and Receivables AFS Financial Assets
Accrued Interest Receivable
Corporate and Commercial Lending
Consumer Lending
Trade-related Lending Others Total
Unquoted Equity Securities
Balance at beginning of year P5,053,830 P707,616 P390,327 P14 P6,151,786 P6,323 P68,342 Provisions (recoveries) during the year 266,007 230,000 (258) 689 496,437 - (27)Transfers/others (938,711) 123,749 (124,222) (14) (939,198) - (6,296)Balance at end of year P4,381,126 P1,061,365 P265,847 P689 P5,709,025 P6,323 P62,019 Individual impairment 1,292,911 729,796 137,109 - 2,159,816 6,323 62,019 Collective impairment 3,088,214 331,569 128,737 689 3,549,209 - -
P4,381,125 P1,061,365 P265,846 P689 P5,709,025 P6,323 P62,019
The following tables present the reconciliation of the movement of the allowance for impairment and credit losses on other assets:
Consolidated Accounts Receivable SCR Miscellaneous
2017 Total
Balance at beginning of year P436,751 P60,650 P221,033 P718,434Provisions (recoveries) during the year 33,175 – 4,798 37,973Transfers/others (Note 10) (75,426) 250 85,734 10,558Balance at end of year P394,500 P60,900 P311,565 P766,965

Financial Statements 185
Consolidated Accounts Receivable SCR Miscellaneous
2016 Total
Balance at beginning of year P521,705 P54,787 P165,097 P741,589Provisions during the year 49,453 75 36,027 85,555Transfers/others (Note 10) (134,407) 5,788 19,909 (108,710)Balance at end of year P436,751 P60,650 P221,033 P718,434
Parent Company Accounts Receivable SCR Miscellaneous
2017 Total
Balance at beginning of year P396,592 P30,336 P187,438 P614,366Provisions (recoveries) during the year 33,175 – (65) 33,110Transfers/others (Note 10) (98,904) (5,932) (1,680) (106,516)Balance at end of year P330,863 P24,404 P185,693 P540,960
Parent Company Accounts Receivable SCR Miscellaneous
2016 Total
Balance at beginning of year P444,444 P25,809 P155,850 P626,103Provisions (recoveries) during the year 24,986 – 79 25,065Transfers/others (Note 10) (72,838) 4,527 31,509 (36,802)Balance at end of year P396,592 P30,336 P187,438 P614,366
17. DEPOSIT LIABILITIES
As of December 31, 2017 and 2016, 36.13% and 39.42% respectively, of the total deposit liabilities of the Group are subject to periodic interest repricing. The remaining deposit liabilities bear annual fixed interest rates ranging from 0.13% to 3.65% in 2017, 0.13% to 3.25% in 2016, 0.13% to 2.75% in 2015.
Interest Expense on Deposit LiabilitiesThis account consists of:
Consolidated Parent Company2017 2016 2015 2017 2016 2015
Demand P233,984 P197,595 P165,228 P163,524 P143,917 P122,277Savings 1,120,422 819,991 743,365 1,072,849 567,447 490,603Time 5,167,529 3,813,969 3,099,695 3,974,430 2,917,763 2,268,286
P6,521,935 P4,831,555 P4,008,288 P5,210,803 P3,629,127 P2,881,166
BSP Circular No. 830 requires reserves against deposit liabilities. As of December 31, 2017 and 2016, due from BSP amounting to P95.90 billion and P84.52, respectively, for the Group and P89.17 billion and P78.78 billion, respectively, for the Parent Company were set aside as reserves for deposit liabilities per latest report submitted to the BSP. As of December 31, 2017 and 2016, the Group is in compliance with such regulation.
LTNCDOn August 3, 2016, the BOD of the Parent Company approved the issuance of Long Term Negotiable Certificates of Deposits (LTNCD) of up to P20.00 billion in tranches of P5.00 billion to P10.00 billion each and with tenors ranging from 5 to 7 years to support the Group’s strategic initiatives and business growth. On October 27, 2016, the Monetary Board of the BSP approved the LTNCD issuances. On November 18, 2016, the Parent Company issued the first tranche at par with aggregate principal amount of P9.58 billion due May 18, 2022. The LTNCDs bear a fixed coupon rate of 3.65% per annum, payable quarterly in arrears. Subject to BSP rules, the Group has the option to pre-terminate the LTNCDs as a whole but not in part, prior to maturity and on any interest payment date at face value plus accrued interest covering the accrued and unpaid interest.

China Bank Annual Financial and Sustainability Report 2017186
On June 2, 2017, the Parent Company issued at par LTNCDs with aggregate principal amount of P6.35 billion due December 22, 2022, representing the second tranche of the P20.00 billion.
The LTNCDs are included under the ‘Time deposit liabilities’ account.
18. BILLS PAYABLE
Bills PayableThe Group’s and the Parent Company’s bills payable consist of:
Consolidated Parent Company2017 2016 2017 2016
Interbank loans payable P16,378,274 P16,954,998 P16,378,274 P16,954,998Trade finance 3,739,757 − 3,739,757 −
P20,118,031 P16,954,998 P20,118,031 P16,954,998
Interbank loans payableInterbank loans payable consists of short-term dollar-denominated borrowings of the Parent Company with annual interest ranging from 0.12% to 2.28% and from 1.25% to 1.68% in 2017 and 2016, respectively.
As of December 31, 2017, the carrying amount of foreign currency-denominated HTM and AFS financial assets pledged by the Parent Company as collateral for its interbank borrowings amounted to P3.43 billion and P3.72 billion, respectively. The carrying amount of peso-denominated HTM, AFS and HFT financial assets pledged by the Parent Company as collateral for its interbank borrowings amounted to P10.25 billion, P0.10 billion and P0.49 billion, respectively. The fair value of HTM financial assets pledged as collateral amounted to P13.24 billion as of December 31, 2017 (Note 9).
As of December 31, 2016, the carrying amount of foreign currency-denominated HTM and AFS financial assets pledged by the Parent Company as collateral for its interbank borrowings amounted to P8.96 billion and P0.53 billion, respectively. The fair value of HTM financial assets pledged as collateral amounted to P8.41 billion as of December 31, 2016 (Note 9).
As of December 31, 2017 and 2016, margin deposits amounting to P497.26 million and P74.68, respectively, are deposited with various counterparties to meet the collateral requirements for its interbank bills payable.
As of December 31, 2016, interbank loans payable includes a US$158.00 million unsecured, three-year term loan facility from regional and international banks which will mature in June 2018. The facility carries an interest margin of 1.40% per annum over 3-month LIBOR. The term of the loan provides for a financial covenant such that the Parent Company shall ensure that its minimum capital adequacy ratio (CAR) will, at all times, be equal to or greater of (a) the percentage prescribed by BSP from time to time and (b) 10.00%. Otherwise, the loan shall become immediately due and payable. The borrowing was measured initially at fair value and was subsequently carried at amortized cost. As of December 31, 2016, the carrying value of the loan amounted to P7.81 billion.
The Parent Company paid one year ahead the US$158.00 million borrowing. The strong growth in foreign currency deposits and favorable changes in market conditions enabled the Parent Company to raise the balance earlier than expected. The loan was paid in two tranches: US$60.00 million was paid in March 2017 and the remaining balance in June 2017.
Trade financeAs of December 31, 2017, trade finance consists of the Parent Company’s borrowings from financial institutions using bank trade assets as the basis for borrowing foreign currency. The refinancing amount should not exceed the aggregate amount of trade assets.
19. ACCRUED INTEREST AND OTHER EXPENSES
This account consists of: Consolidated Parent Company2017 2016 2017 2016
Accrued payable for employee benefits P963,774 P789,691 P956,348 P786,014Accrued interest payable 813,068 552,881 707,342 464,741Accrued lease payable 166,246 121,139 162,875 119,950Accrued taxes and other licenses 116,158 87,156 96,153 77,837Accrued other expenses payable 568,373 317,323 361,230 112,809
P2,627,619 P1,868,190 P2,283,948 P1,561,351

Financial Statements 187
20. OTHER LIABILITIES
This account consists of:
Consolidated Parent Company2017 2016 2017 2016
Financial liabilitiesAccounts payable P3,131,826 P2,801,269 P1,827,956 P1,731,365Due to PDIC 531,645 428,308 531,645 428,308Acceptances payable 469,518 1,172,158 469,518 1,172,158Other credits-dormant 281,008 318,701 213,681 304,036Due to the Treasurer of the Philippines 43,174 28,131 33,950 23,716Margin deposits 3,004 1,702 3,004 1,702Miscellaneous (Note 23) 938,901 488,139 430,041 428,532
5,399,076 5,238,408 3,509,795 4,089,817Nonfinancial liabilitiesWithholding taxes payable 202,174 150,814 155,320 115,928Retirement liabilities (Note 24) 119,451 144,686 – –
321,625 295,500 155,320 115,928P5,720,701 P5,533,908 P3,665,115 P4,205,745
Accounts payable includes payables to suppliers and service providers, and loan payments and other charges received from customers in advance.
Miscellaneous mainly includes sundry credits, inter-office float items, and dormant deposit accounts.
21. OTHER OPERATING INCOME AND MISCELLANEOUS EXPENSES
Service Charges, Fees and CommissionsDetails of this account are as follows:
Consolidated Parent Company2017 2016 2015 2017 2016 2015
Service and collection charges:Deposits P540,323 P597,294 P628,191 P539,941 P535,397 P572,448Remittances 311,768 302,184 248,615 311,768 302,184 248,615Loans 276,054 214,237 170,070 34,758 40,301 34,785Others 112,725 114,791 169,744 99,116 93,452 90,019
1,240,870 1,228,506 1,216,620 985,583 971,334 945,867Fees and commissions 1,200,854 894,963 617,698 409,415 348,114 510,273
P2,441,724 P2,123,469 P1,834,318 P1,394,998 P1,319,448 P1,456,140
Trading and Securities Gain - NetThis account consists of:
Consolidated Parent Company2017 2016 2015 2017 2016 2015
AFS financial assets P363,350 P918,673 P638,723 P340,351 P856,031 P629,642Financial assets designated at
FVPL (Note 9) 170,352 111,615 (120,134) 170,352 111,615 (120,134)Held-for-trading (Note 9) (55,257) (135,709) (50,330) (112,458) (138,286) (48,087)Derivative assets (Note 25) (3,510) 23,510 (1,425) (3,510) 23,510 (1,425)HTM financial assets 5,025 – – 5,025 – –
P479,960 P918,089 P466,834 399,760 P852,870 P459,996

China Bank Annual Financial and Sustainability Report 2017188
Miscellaneous IncomeDetails of this account are as follows:
Consolidated Parent Company2017 2016 2015 2017 2016 2015
Bancassurance (Note 11) P360,009 P383,483 P337,521 P360,009 P383,483 P337,407Dividends (Note 9) 91,073 193,229 263,330 91,073 193,229 255,407Rental on bank premises 111,651 91,591 51,731 83,911 67,134 39,516Fund transfer fees 59,682 50,658 56,621 59,682 50,658 56,621Rental safety deposit boxes 24,933 24,627 23,139 24,825 24,269 22,768Recovery of charged off assets 199,014 18,734 15,620 184,272 10,523 7,943Miscellaneous income (Notes 12, 13 and 15) 670,161 116,123 218,893 587,885 70,801 172,291
P1,516,523 P878,445 P966,855 P1,391,657 P800,097 P891,953
Miscellaneous ExpensesDetails of this account are as follows:
Consolidated Parent Company2017 2016 2015 2017 2016 2015
Information technology P402,314 P108,458 P371,949 P339,214 P227,627 P280,973Service charges 219,430 225,889 181,216 219,430 225,889 181,216Litigations 176,602 117,363 100,947 22,815 43,261 26,486Freight 38,909 34,331 25,534 27,953 27,354 21,338Membership fees and dues 18,642 29,329 17,012 17,160 28,135 14,861Clearing and processing fee 21,252 27,379 14,337 16,320 24,525 11,591Broker’s fee 39,129 12,403 22,970 39,128 12,403 22,970Miscellaneous expense 951,274 518,834 267,969 808,638 352,295 241,307
P1,867,552 P1,073,986 P1,001,934 P1,490,658 P941,489 P800,742
22. MATURITY ANALYSIS OF ASSETS AND LIABILITIES
The following tables present both the Group’s and Parent Company’s assets and liabilities as of December 31, 2017 and 2016 analyzed according to when they are expected to be recovered or settled within one year and beyond one year from the respective reporting date:
Consolidated2017 2016
Within Twelve Months
Over Twelve Months Total
Within Twelve Months
Over Twelve Months Total
Financial assetsCash and other cash items P12,685,984 P– P12,685,984 P12,010,543 P– P12,010,543Due from BSP 98,490,014 – 98,490,014 91,964,495 – 91,964,495Due from other banks 15,641,476 – 15,641,476 11,332,236 – 11,332,236SPURA 18,751,845 – 18,751,845 3,451,543 – 3,451,543Financial assets at FVPL 12,730,270 3,508,618 16,238,888 7,703,899 – 7,703,899AFS financial assets - gross 7,389,865 39,094,353 46,484,218 11,849,322 22,063,143 33,912,465HTM financial assets 628,196 64,658,071 65,286,267 2,112,503 55,292,297 57,404,800Loans and receivables - gross 163,581,848 292,036,163 455,618,011 150,962,924 242,775,212 393,738,136Accrued interest receivable - gross 3,883,957 – 3,883,957 3,193,868 – 3,193,868Other assets - gross 3,188,970 1,223,673 4,412,643 4,698,468 953,734 5,652,202
336,972,425 400,520,878 737,493,303 299,279,801 321,084,386 620,364,187(Forward)

Financial Statements 189
Consolidated2017 2016
Within Twelve Months
Over Twelve Months Total
Within Twelve Months
Over Twelve Months Total
Nonfinancial assetsBank premises, furniture, fixtures
and equipment - net of accumulated depreciation and amortization P– P6,877,012 P6,877,012 P– P6,498,639 P6,498,639
Investment properties - net of accumulated depreciation – 6,509,539 6,509,539 – 6,762,710 6,762,710
Deferred tax assets – 1,778,081 1,778,081 – 1,666,267 1,666,267Investments in associates – 329,422 329,422 – 278,752 278,752Intangible assets – 4,104,032 4,104,032 – 4,089,715 4,089,715Goodwill – 839,748 839,748 – 839,748 839,748Other assets – gross 1,281,008 1,292,209 2,573,217 944,754 1,015,932 1,960,686
1,281,008 21,730,043 23,011,051 944,754 21,151,763 22,096,517Allowance for impairment and credit losses (Note 16) (8,748,958) (9,006,852)Unearned discounts (Note 10) (307,886) (255,841)
(9,056,844) (9,262,693)P751,447,510 P633,198,011
Financial liabilitiesDeposit liabilities 602,734,404 32,358,989 635,093,393 P513,517,732 P28,065,286 P541,583,018Bills payable 20,118,031 – 20,118,031 16,954,998 – 16,954,998Manager’s checks 2,441,042 – 2,441,042 2,029,778 – 2,029,778Accrued interest and other
expenses* 1,114,252 267,189 1,381,441 870,204 – 870,204Derivative liabilities 267,533 – 267,533 243,198 – 243,198Other liabilities 5,399,076 – 5,399,076 5,238,408 – 5,238,408
632,074,338 32,626,178 664,700,516 538,854,318 28,065,286 566,919,604Nonfinancial liabilitiesAccrued interest and other
expenses 105,468 1,140,710 1,246,178 87,156 910,830 997,986Deferred tax liabilities – 1,161,653 1,161,653 – 1,161,414 1,161,414Income tax payable 362,041 – 362,041 437,303 – 437,303Other liabilities 202,174 119,451 321,625 150,814 144,686 295,500
P632,744,021 P35,047,992 P667,792,013 P539,529,591 P30,282,216 P569,811,807*Accrued interest and other expenses include accrued interest payable and accrued other expenses payable (Note 19).
Parent Company2017 2016
Within Twelve Months
Over Twelve Months Total
Within Twelve Months
Over Twelve Months Total
Financial assetsCash and other cash items P11,160,173 P– P11,160,173 P10,580,748 P– P10,580,748Due from BSP 91,717,037 – 91,717,037 85,307,128 – 85,307,128Due from other banks 14,066,620 – 14,066,620 9,689,165 – 9,689,165SPURA 17,347,522 – 17,347,522 2,958,465 – 2,958,465Financial assets at FVPL 12,633,520 3,423,303 16,056,823 7,232,882 – 7,232,882AFS financial assets - gross 6,733,105 36,210,301 42,943,406 11,159,904 20,000,169 31,160,073 HTM financial assets 346,208 61,187,285 61,533,493 2,087,861 51,981,160 54,069,021Loans and receivables - gross 136,176,920 255,754,257 391,931,177 131,527,458 203,449,468 334,976,926 Accrued interest receivable - gross 3,247,352 – 3,247,352 2,728,373 – 2,728,373Other assets - gross 1,927,221 208,496 2,135,717 3,350,015 254,485 3,604,500
295,355,678 356,783,642 652,139,320 266,621,999 275,685,282 542,307,281( Forward)

China Bank Annual Financial and Sustainability Report 2017190
Parent Company2017 2016
Within Twelve Months
Over Twelve Months Total
Within Twelve Months
Over Twelve Months Total
Nonfinancial assetsBank premises, furniture, fixtures
and equipment - net of accumulated depreciation and amortization – 5,464,582 5,464,582 – 5,143,981 5,143,981
Investment properties - net of accumulated depreciation – 2,756,921 2,756,921 – 2,967,294 2,967,294
Deferred tax assets – 1,297,271 1,297,271 – 1,508,150 1,508,150Investments in subsidiaries – 13,560,733 13,560,733 – 12,169,037 12,169,037Investment in associates – 329,422 329,422 – 276,559 276,559Intangible assets – 800,861 800,861 – 805,582 805,582Goodwill – 222,841 222,841 – 222,841 222,841Other assets - gross 895,082 991,386 1,886,468 759,212 754,754 1,513,966
895,082 25,424,017 26,319,099 759,212 23,848,198 24,607,410 Allowances for impairment and credit losses (Note 16) (6,921,550) (7,598,152)Unearned discounts (Note 10) (267,099) (198,042)
(7,188,649) (7,796,194)P671,269,770 P559,143,914
Financial liabilitiesDeposit liabilities P534,657,559 P24,578,420 P559,235,979 P455,816,577 P15,145,414 P470,961,991Bills payable 20,118,031 – 20,118,031 16,954,998 – 16,954,998Manager’s checks 1,709,248 – 1,709,248 1,445,585 – 1,445,585Accrued interest and other
expenses* 1,068,572 – 1,068,572 577,550 – 577,550Derivative liabilities 267,533 – 267,533 243,198 – 243,198Other liabilities 3,509,795 – 3,509,795 4,089,817 – 4,089,817
561,330,738 24,578,420 585,909,158 479,127,725 15,145,414 494,273,139Nonfinancial liabilitiesAccrued interest and other
expenses 96,153 1,119,223 1,215,376 77,836 905,965 983,801Income tax payable 339,155 – 339,155 354,212 – 354,212Other liabilities 155,320 – 155,320 115,928 – 115,928
P561,921,366 P25,697,643 P587,619,009 P479,675,701 P16,051,379 P495,727,080*Accrued interest and other expenses include accrued interest payable and accrued other expenses payable (Note 19).
23. EQUITY
The Parent Company’s capital stock consists of (amounts in thousands, except for number of shares):2017 2016
Shares Amount Shares AmountCommon stock - P10.00 par value Authorized – shares 3,300,000,000 2,500,000,000 Issued and outstanding
Balance at beginning of year 2,002,027,836 P20,020,278 1,853,728,497 P18,537,285 Stock rights 483,870,967 4,838,710 – –Stock dividends* 198,872,913 1,988,729 148,299,339 1,482,993
2,684,771,716 P26,847,717 2,002,027,836 P20,020,278 *The stock dividends declared include fractional shares equivalent to 1,009 and 1,060 in 2017 and 2016, respectively.

Financial Statements 191
The Parent Company shares are listed in the Philippine Stock Exchange.
Stock Rights OfferingOn February 22, 2017, the BOD authorized the Parent Company to conduct a rights issue by way of offering common shares to certain eligible shareholders. The BSP approved the stock rights offering on March 6, 2017.
Each eligible shareholder was entitled to one share, at P31.00 apiece, per 4.1375 existing common shares as of April 19, 2017. The stock rights offering yielded a subscription of 483,870,967 common shares which were listed at the Philippine Stock Exchange on May 10, 2017. The total proceeds of the stock rights offering amounted to P14.9 billion, net of stock issuance cost of P52.09 million which was deducted from additional paid in capital.
The additional capital enabled the Parent Company to grow its loan portfolio, expand its branch network, and support its other strategic business initiatives.
Increase in the Parent Company’s Authorized Capital StockOn March 15, 2017 and May 4, 2017 the BOD approved and the stockholders ratified, respectively, the increase in the Parent Company’s authorized capital stock from P25.00 billion to P33.00 billion, or from 2.50 billion to 3.30 billion shares with par value of P10.00 per share. The increase in the Parent Company’s authorized capital stock was subsequently approved by the BSP and the SEC on August 2, 2017 and September 29, 2017, respectively. On June 7, 2017, the Parent Company and the Trust and Asset Management Group (on behalf of the CBC Employees Retirement Plan) entered into a subscription agreement whereas the latter will subscribe to 1,128,096 new common shares of the Parent Company at a subscription price per share equal to the higher between the closing price of the Parent Company’s stock dividend or the par value of P10.00 per share.
On January 24, 2018, the BOD of the Parent Company, during a special board meeting, confirmed the issuance of the shares to CBC Employees Retirement Plan in accordance with the subscription agreement which was paid at a subscription price of P33.40 per share (closing price of the Group’s shares at the Philippine Stock Exchange on October 20, 2017 which is the record date of the Parent Company’s stock dividend) recorded under “Other Liabilities.”
The summarized information on the Parent Company’s registration of securities under the Securities Regulation Code follows:
Date of SEC Approval Authorized Shares*April 12, 1991 100,000October 7, 1993 150,000August 30, 1994 200,000July 26, 1995 250,000September 12, 1997 500,000September 5, 2005 1,000,000September 14, 2007 1,600,000September 5, 2008 2,000,000August 29, 2014 2,500,000September 29, 2017 3,300,000* Restated to show the effects of the ten-for-one stock split in 2012
As reported by the Parent Company’s transfer agent, Stock Transfer Service, Inc., the total number of stockholders is 1,934 and 1,959 as of December 31, 2017 and 2016, respectively.
DividendsDetails of the Parent Company’s cash dividend payments follow:
Cash Dividends
Date of Date of Date of Cash DividendDeclaration Record Payment Per ShareMay 04, 2017 May 18, 2017 June 02, 2017 0.80May 05, 2016 May 23, 2016 June 03, 2016 1.00May 07, 2015 August 12, 2015 September 09, 2015 1.00May 08, 2014 September 19, 2014 October 15, 2014 1.00May 02, 2013 July 19, 2013 August 14, 2013 1.20

China Bank Annual Financial and Sustainability Report 2017192
Stock Dividends
Date of Date of Date of Stock DividendDeclaration Record Payment Per ShareMarch 15, 2017 October 20, 2017 November 03, 2017 8%May 05, 2016 May 23, 2016 June 03, 2016 8%May 07, 2015 August 12, 2015 September 09, 2015 8%May 08, 2014 September 19, 2014 October 15, 2014 8%May 02, 2013 July 19, 2013 August 14, 2013 10%
The computation of surplus available for dividend declaration in accordance with SEC Memorandum Circular No. 11 issued in December 2008 differs to a certain extent from the computation following BSP guidelines.
As of December 31, 2017 and 2016, surplus includes the amount of P1.28 billion, net of deferred tax liability of P547.40 million, representing transfer of revaluation increment on land which was carried at deemed cost when the Group transitioned to PFRS in 2005 (Note 12). This amount will be available to be declared as dividends upon sale of the underlying land.
In the consolidated financial statements, a portion of the Group’s surplus corresponding to the net earnings of the subsidiaries and associates amounting to P851.57 million and P607.74 million as of December 31, 2017 and 2016, respectively, is not available for dividend declaration. The accumulated equity in net earnings becomes available for dividends upon declaration and receipt of cash dividends from the investees.
ReservesIn compliance with BSP regulations, 10.00% of the Parent Company’s profit from trust business is appropriated to surplus reserve. This annual appropriation is required until the surplus reserves for trust business equals 20.00% of the Parent Company’s authorized capital stock.
Capital ManagementThe primary objectives of the Group’s capital management are to ensure that it complies with externally imposed capital requirements and that it maintains strong credit ratings and healthy capital ratios in order to support its business and to maximize shareholders’ value.
The Group manages its capital structure and makes adjustments to it in light of changes in economic conditions and the risk characteristics of its activities. In order to maintain or adjust the capital structure, the Group may adjust the amount of dividend payment to shareholders, return capital to shareholders or issue capital securities. No changes were made in the objectives, policies and processes as of December 31, 2017 and 2016.
Regulatory Qualifying CapitalUnder existing BSP regulations, the determination of the Parent Company’s compliance with regulatory requirements and ratios is based on the amount of the Parent Company’s unimpaired capital (regulatory capital) as reported to the BSP. This is determined on the basis of regulatory accounting policies which differ from PFRS in some respects.
In addition, the risk-based capital ratio of a bank, expressed as a percentage of qualifying capital to risk-weighted assets (RWA), should not be less than 10.00% for both solo basis (head office and branches) and consolidated basis (Parent Company and subsidiaries engaged in financial allied undertakings but excluding insurance companies). Qualifying capital and RWA are computed based on BSP regulations. RWA consists of total assets less cash on hand, due from BSP, loans covered by hold-out on or assignment of deposits, loans or acceptances under letters of credit to the extent covered by margin deposits and other non-risk items determined by the Monetary Board of the BSP.
On August 4, 2006, the BSP, under BSP Circular No. 538, issued the prescribed guidelines implementing the revised risk-based capital adequacy framework for the Philippine banking system to conform to Basel II capital adequacy framework. The BSP guidelines took effect on July 1, 2007. Thereafter, banks were required to compute their CAR using these guidelines.
Standardized credit risk weights were used in the credit assessment of asset exposures. Third party credit assessments were based on ratings by Standard & Poor’s, Moody’s and Fitch, while PhilRatings were used on peso-denominated exposures to Sovereigns, MDBs, Banks, LGUs, Government Corporations, Corporates.
On January 15, 2013, the BSP issued Circular No. 781, Basel III Implementing Guidelines on Minimum Capital Requirements, which provides the implementing guidelines on the revised risk-based capital adequacy framework particularly on the minimum capital and disclosure requirements for universal banks and commercial banks, as well as their subsidiary banks and quasi-banks, in accordance with the Basel III standards. The circular took effect on January 1, 2014.

Financial Statements 193
The Circular sets out a minimum Common Equity Tier 1 (CET1) ratio of 6.00% and Tier 1 capital ratio of 7.50%. It also introduces a capital conservation buffer of 2.50% comprised of CET1 capital. The BSP’s existing requirement for Total CAR remains unchanged at 10.00% and this ratio shall be maintained at all times.
Further, existing capital instruments as of December 31, 2010 which do not meet the eligibility criteria for capital instruments under the revised capital framework shall no longer be recognized as capital upon the effectivity of Basel III. Capital instruments issued under BSP Circular Nos. 709 and 716 (the circulars amending the definition of qualifying capital particularly on Hybrid Tier 1 and Lower Tier 2 capitals), starting January 1, 2011 and before the effectivity of BSP Circular No. 781, shall be recognized as qualifying capital until December 31, 2015. In addition to changes in minimum capital requirements, this Circular also requires various regulatory adjustments in the calculation of qualifying capital.
The CAR of the Group and the Parent Company as of December 31, 2017 as reported to the BSP are shown in the table below.
Consolidated Parent Company2017 2016 2017 2016
(Amounts in Million Pesos)CET 1 Capital P78,086 P58,170 P77,161 P57,409Less: Regulatory Adjustments 7,434 7,338 13,854 13,169
70,652 50,832 63,307 44,240Additional Tier 1 Capital − − − −Less: Regulatory Adjustments − − − −
− − − −Net Tier 1 Capital 70,652 50,832 63,307 44,240Tier 2 Capital 3,970 4,076 3,410 3,514Less: Regulatory Adjustments − − − −Net Tier 2 Capital 3,970 4,076 3,410 3,514Total Qualifying Capital P74,622 P54,908 P66,717 P47,754
Consolidated Parent Company2017 2016 2017 2016
(Amounts in Million Pesos)Credit RWA P480,956 P414,381 P451,457 P352,651Market RWA 7,665 4,575 7,540 4,339Operational RWA 36,047 30,727 28,526 25,689Total RWA P524,668 P449,683 P487,523 P382,679
CET 1 capital ratio 13.47% 11.30% 14.02% 11.56%Tier 1 capital ratio 13.47% 11.30% 14.02% 11.56%Total capital ratio 14.22% 12.21% 14.78% 12.48%
The Parent Company has complied with all externally imposed capital requirements throughout the period.
The issuance of BSP Circular No. 639 covering the ICAAP in 2009 supplements the BSP’s risk-based capital adequacy framework under Circular No. 538. In compliance with this circular, the Parent Company has adopted and developed its ICAAP framework to ensure that appropriate level and quality of capital are maintained by the Group. Under this framework, the assessment of risks extends beyond the Pillar 1 set of credit, market and operational risks and onto other risks deemed material by the Parent Company. The level and structure of capital are assessed and determined in light of the Parent Company’s business environment, plans, performance, risks and budget, as well as regulatory edicts. BSP requires submission of an ICAAP document every March 31. The Group has complied with this requirement.
24. RETIREMENT PLAN
The Group has separate funded noncontributory defined benefit retirement plans covering substantially all its officers and regular employees. The retirement plans are administered by the Parent Company’s Trust Group which acts as the trustee of the plans. Under these retirement plans, all covered officers and employees are entitled to cash benefits after satisfying certain age and service requirements. The latest actuarial valuation studies of the retirement plans were made as of December 31, 2017.

China Bank Annual Financial and Sustainability Report 2017194
The Group’s annual contribution to the retirement plan consists of a payment covering the current service cost, unfunded actuarial accrued liability and interest on such unfunded actuarial liability.
The amounts of net defined benefit asset in the balance sheets follow:
Consolidated Parent Company2017 2016 2017 2016
Net plan assets (Note 15) P995,050 P754,754 P991,386 P754,754Retirement liabilities (Note 20) (119,451) (144,686) – –
P875,599 P610,068 P991,386 P754,754
The movements in the defined benefit asset, present value of defined benefit obligation and fair value of plan assets follow:
Consolidated
2017
Remeasurements in OCI
January 1, 2017
Net benefit cost
Benefits paid
Return on plan assets (excluding amount included in net interest)
Actuarial changes arising from experience adjustments
Actuarial changes arising from changes in financial assumptions
Changes in remeasurement gains (losses)
Contribution by employer
Current service cost Net interest
Net pension expense*
Actuarial changes arising from changes in demographic assumptions
December 31, 2017
(a) (c) (d) (e) = c + d (f) (g) (h) (i) (j) = g + h + i (k)(l) = a + b + e + f
+ j + k
Fair value of plan assets P4,521,109 P− P217,203 P217,203 (P288,014) (P153,076) P− P− P− (P153,076) P571,200 P4,868,423
Present value of defined benefit obligation 3,911,041 375,598 188,654 564,252 (288,014) − 48,675 (243,130) − (194,455) − 3,992,824
Net defined benefit asset P610,068 (P375,598) P28,549 (P347,049) P− (P153,076) (P48,675) P243,130 P− P41,379 P571,200 P875,599
*Presented under Compensation and fringe benefits in the statements of income.
Consolidated
2016
Remeasurements in OCI
January 1, 2016
Net benefit cost
Benefits paid
Return on plan assets (excluding amount included in net interest)
Actuarial changes arising from experience adjustments
Actuarial changes arising from changes in financial assumptions
Actuarial changes arising from changes
in demographic assumptions
Changes in remeasurement gains (losses)
Contribution by employer
December 31, 2016
Current service cost Net interest
Net pension expense*
(a) (c) (d) (e) = c + d (f) (g) (h) (i) (j) = g + h + i (k)(l) = a + b + e + f
+ j + k
Fair value of plan assets P4,472,990 P− P179,522 P179,522 (P644,384) P278,115 P− P− P− P278,115 P234,867 P4,521,109
Present value of defined benefit obligation 3,851,428 302,347 148,206 450,553 (644,384) − 72,293 165,252 15,900 253,444 − 3,911,041
Net defined benefit asset P621,562 (P302,347) P31,316 (P271,031) P− P278,115 (P72,293) (P165,252) (P15,900) P24,671 P234,867 P610,068
*Presented under Compensation and fringe benefits in the statements of income.
Parent Company
2017
Remeasurements in OCI
January 1, 2017
Net benefit cost
Benefits paid
Return on plan assets (excluding amount included in net interest)
Actuarial changes arising from experience adjustments
Actuarial changes arising from changes in financial assumptions
Changes in remeasurement gains (losses)
Contribution by employer
December 31, 2017
Current service cost Net interest
Net pension expense*
(a) (c) (d) (e) = c + d (f) (g) (h) (i) (j) = g + h + i (k)(l) = a + b + e + f
+ j + k
Fair value of plan assets P4,315,996 P− P206,736 P206,736 (P273,001) (P141,532) P− P− (P141,532) P450,000 P4,558,199
Present value of defined benefit obligation 3,561,242 264,989 170,583 435,573 (273,001) − 50,525 (207,525) (157,000) − 3,566,813
Net defined benefit asset P754,754 (P264,989) P36,153 (P288,837) P− (P141,532) (P50,525) P207,525 P15,468 P450,000 P991,386
*Presented under Compensation and fringe benefits in the statements of income.

Financial Statements 195
Parent Company
2016
Remeasurements in OCI
January 1, 2016
Net benefit cost
Benefits paid
Return on plan assets (excluding amount included in net interest)
Actuarial changes arising from experience adjustments
Actuarial changes arising from changes in financial assumptions
Changes in remeasurement gains (losses)
Contribution by employer
December 31, 2016
Current service cost Net interest
Net pension expense*
(a) (c) (d) (e) = c + d (f) (g) (h) (i) (j) = g + h + i (k)(l) = a + b + e + f
+ j + k
Fair value of plan assets P3,892,350 P− P173,210 P173,210 (P183,784) P284,221 P− P− P284,221 P150,000 P4,315,997
Present value of defined benefit obligation 3,106,532 288,262 138,241 426,503 (183,784) 49,966 162,025 211,991 3,561,243
Net defined benefit asset P785,818 (P288,262) P34,969 (P253,293) P− P284,221 (P49,966) (P162,025) P72,230 P150,000 P754,754
*Presented under Compensation and fringe benefits in the statements of income.
The Parent Company expects to contribute P459.49 million to its defined benefit pension plan in 2018.
In 2017 and 2016, the major categories of plan assets as a percentage of the fair value of total plan assets are as follows:
Consolidated Parent Company2017 2016 2017 2016
Parent Company shares (Note 29) 36.30% 40.13% 38.75% 42.04%Equity instruments 20.97% 21.76% 21.59% 22.18%Cash and cash equivalents 9.94% 6.13% 7.54% 3.57%Debt instruments 14.74% 16.19% 12.93% 15.67%Other assets 18.05% 15.79% 19.19% 16.54%
100.00% 100.00% 100.00% 100.00%
As of December 31, 2017 and 2016, the retirement fund’s ownership with the Parent Company is 1.98% and 2.29%, respectively.
The following table shows the breakdown of fair value of the plan assets:
Consolidated Parent Company2017 2016 2017 2016
Due from BSP P– P53,580 P– P46,000Deposits in banks 486,822 223,432 345,702 108,259Financial assets at FVPL 993,381 976,684 967,053 956,163AFS financial assets
Quoted debt securities 513,233 555,553 404,197 515,123Quoted equity securities 33,652 7,054 23,121 5,481Parent Company shares 1,777,250 1,814,531 1,777,250 1,814,531
Investments in unit investment trust fund 199,557 167,840 179,913 152,278Corporate bonds 8,750 8,750 8,750 8,750
Loans and receivable 688,029 553,339 685,179 552,379Investment properties* 143,799 147,154 143,799 143,799Other assets 52,078 13,284 51,219 13,234
P4,896,551 P4,521,201 P4,586,183 P4,315,997* Investment properties comprise properties located in Manila.
The carrying value of the plan assets of the Group and Parent Company amounted to P4.90 billion and P4.59 billion, respectively, as of December 31, 2017, and P4.52 billion and P4.32 billion, respectively, as of December 31, 2016.

China Bank Annual Financial and Sustainability Report 2017196
The principal actuarial assumptions used in 2017 and 2016 in determining the retirement asset (liability) for the Group’s and Parent Company’s retirement plans are shown below:
2017Parent CBSI CIBI CBC-PCCI CBCC CBSC
Discount rate: January 1 4.79% 5.08% 5.14% 5.14% 5.19% – December 31 5.60% 5.63% 5.82% 5.82% 5.85% 5.85%Salary increase rate 6.00% 6.00% 6.00% 6.00% 6.00% 6.00%
2016Parent CBSI PDB CIBI CBC-PCCI
Discount rate: January 1 4.45% 4.99% 5.10% 5.10% – December 31 4.79% 5.08% 5.14% 5.14% 5.19%Salary increase rate 6.00% 6.00% 6.00% 6.00% 6.00%
The sensitivity analysis below has been determined based on the impact of reasonably possible changes of each significant assumption on the defined benefit liability as of the end of the reporting period, assuming all other assumptions were held constant:
December 31, 2017 Parent CBSI CIBI CBC-PCCI CBCC CBSCDiscount rate (+1%) (P176,120) (P39,471) (P1,138) (P6,434) (P1,157) (P218) (-1%) 266,156 50,838 1,568 11,519 1,460 285
Salary increase rate (+1%) 250,898 48,520 1,504 11,019 1,414 272 (-1%) (171,429) (38,611) (1,115) (6,328) (1,146) (212)
December 31, 2016 Parent CBSI CIBI CBC-PCCI CBCCDiscount rate (+1%) (P246,034) (P35,473) (P1,566) (P9,072) (P814) (-1%) 330,859 45,560 2,073 12,454 1,025
Salary increase rate (+1%) 310,338 43,290 1,946 11,854 983 (-1%) (237,969) (34,585) (1,522) (8,860) (799)
The weighted average duration of the defined benefit obligation are presented below:
December 31, 2017
December 31, 2016
Parent Company 13 13CBSI 18 18CIBI 19 19CBC-PCCI 19 19CBCC 23 22CBSC 25 –

Financial Statements 197
The maturity analyses of the undiscounted benefit payments as of December 31, 2017 and 2016 are as follows:
December 31, 2017 Parent CBSI CIBI CBC-PCCI CBCC CBSC1 year and less P927,473 P12,666 P– P17,059 P– P–More than 1 year
to 5 years 935,382 70,067 1,571 8,957 – 2,038More than 5 years
to 10 years 2,183,572 178,995 16,915 47,035 5,212 665More than 10 years
to 15 years 2,452,767 635,724 8,790 60,509 13,184 –More than 15 years
to 20 years 3,614,035 1,034,331 – 151,035 103,356 1,751More than 20 years 22,632,896 10,283,386 477,064 1,267,884 402,263 164,340
December 31, 2016 Parent CBSI CIBI CBC-PCCI CBCC1 year and less P884,693 P9,290 P– P– P–More than 1 year to 5 years 846,426 64,223 1,571 20,508 –More than 5 years to 10 years 2,115,399 140,944 12,533 41,384 7,925More than 10 years to 15 years 2,680,694 541,073 25,081 41,182 13,494More than 15 years to 20 years 3,146,044 1,023,406 – 159,992 104,806More than 20 years 21,735,037 8,360,827 393,003 1,173,627 275,604
25. DERIVATIVE FINANCIAL INSTRUMENTS
Occasionally, the Parent Company enters into forward exchange contracts as an accommodation to its clients. These derivatives are not designated as accounting hedges. The aggregate notional amounts of the outstanding buy US dollar currency forwards as of December 31, 2017 and 2016 amounted to US$228.48 million and US$148.58 million, respectively, while the sell US dollar forward contracts amounted to US$164.89 million and US$197.06 million, respectively. Weighted average buy US dollar forward rate as of December 31, 2017 is P51.13 and P46.76 in 2016, while the weighted average sell US dollar forward rates are P51.41 and P44.26, respectively.
The aggregate notional amounts of the outstanding buy Euro currency forwards as of December 31, 2017 and 2016 amounted to €113 million and €2 million, respectively while the aggregate notional amounts of the outstanding sell Euro currency forwards as of the December 31, 2017 and 2016 amounted to nil and €6 million, respectively. The weighted average buy Euro forward rates as of December 31, 2017 is P59.32 and P53.40 in December 31, 2016 while the weighted average sell Euro forward rate as of December 31, 2016 is P51.85.
The aggregate notional amounts of the outstanding buy Hongkong dollars (HKD) currency forwards as of December 31, 2017 and December 31, 2016 amounted to nil and HKD155.15 million, respectively. The weighted average buy HKD forward rates as of December 31, 2016 is P6.41.
The aggregate notional amounts of the outstanding sell Chinese Yuan (CNY) currency forwards as of December 31, 2017 and December 31, 2016 amounted to nil and CNY34.91 million. The weighted average sell CNY forward rates as of December 31, 2016 is P7.12.
The aggregate notional amounts of the outstanding IRS as of December 31, 2017 and 2016 amounted to P9.99 billion and P10.82 billion, respectively.
The aggregate notional amounts of the outstanding buy US Dollar NDF as of December 31, 2017 amounted to US$5.00 million. The weighted average buy NDF rate as of December 31, 2017 is P49.85.
As of December 31, 2017 and 2016, the fair values of derivatives follow:
2017 2016 Derivative Asset
Derivative Liability
Derivative Asset
Derivative Liability
Currency forwards P294,873 P235,787 P176,513 P213,788 IRS 28,963 31,746 30,065 29,410 Warrants 9,751 – 9,710 –
P333,587 P267,533 P216,288 P243,198

China Bank Annual Financial and Sustainability Report 2017198
Fair Value Changes of DerivativesThe net movements in fair value changes of derivative instruments are as follows:
2017 2016Balance at beginning of year (P26,910) P233,553 Fair value changes during the year 132,805 (183,640)Settled transactions (39,841) (76,823)Balance at end of year P66,054 (P26,910)
The net movements in the value of the derivatives are presented in the statements of income under the following accounts:
2017 2016 2015Foreign exchange gain (loss) P96,401 (P283,973) P47,031Trading and securities gain (loss)* (Note 21) (3,437) 23,510 (1,425)
P92,964 (P260,463) P45,606*Net movements in the value related to embedded credit derivatives and IRS.
26. LEASE CONTRACTS
The lease contracts are for periods ranging from one to 25 years from the dates of contracts and are renewable under certain terms and conditions. Various lease contracts include escalation clauses, most of which bear an annual rent increase of 5.00% to 10.00%.
Annual rentals on these lease contracts included in ‘Occupancy cost’ in the statements of income in 2017, 2016 and 2015 amounted to P782.30 million, P681.05 million and P615.00 million, respectively, for the Group, and P518.47 million, P450.53 million and P396.88 million, respectively, for the Parent Company.
Future minimum rentals payable of the Group and the Parent Company under non-cancelable operating leases follow:
Consolidated Parent Company2017 2016 2017 2016
Within one year P601,876 P573,623 P551,239 P506,446After one year but not more than five years 2,230,498 1,900,916 1,984,453 1,677,595After five years 1,335,370 1,152,237 915,394 724,682
P4,167,744 P3,626,776 P3,451,086 P2,908,723
The Group and the Parent Company have also entered into commercial property leases on its investment properties (Note 13).
Future minimum rentals receivable under noncancellable operating leases follow:
Consolidated Parent Company2017 2016 2017 2016
Within one year P26,521 P5,044 P19,913 P4,865After one year but not more than five years 19,246 22,047 1,042 2,977After more than five years 7,810 27,653 − −
P53,577 P54,744 P20,955 P7,842
27. INCOME AND OTHER TAXES
Income taxes include corporate income tax and FCDU final taxes, as discussed below, and final tax paid at the rate of 20.00% on gross interest income from government securities and other deposit substitutes. These income taxes, as well as the deferred tax benefits and provisions, are presented as ‘Provision for income tax’ in the statements of income.
Republic Act (RA) No. 9337, An Act Amending National Internal Revenue Code, provides that RCIT rate shall be 30.00% while interest expense allowed as a deductible expense is reduced to 33.00% of interest income subject to final tax.

Financial Statements 199
An MCIT of 2.00% on modified gross income is computed and compared with the RCIT. Any excess MCIT over RCIT is deferred and can be used as a tax credit against future income tax liability for the next three years. In addition, the NOLCO is allowed as a deduction from taxable income in the next three years from the year of inception.
Effective in May 2004, RA No. 9294 restored the tax exemption of FCDUs and offshore banking units (OBUs). Under such law, the income derived by the FCDU from foreign currency transactions with nonresidents, OBUs, local commercial banks including branches of foreign banks is tax-exempt while interest income on foreign currency loans from residents other than OBUs or other depository banks under the expanded system is subject to 10.00% gross income tax.
Interest income on deposit placements with other FCDUs and OBUs is taxed at 7.50%, while all other income of the FCDU is subject to the 30.00% corporate tax.
On March 15, 2011, the BIR issued Revenue Regulation (RR) No. 4-2011 which prescribes the attribution and allocation of expenses between FCDUs/EFCDUs or OBU and RBU and within RBU. Pursuant to the regulations, the Parent Company made an allocation of its expenses in calculating income taxes due for RBU and FCDU.
Current tax regulations also provide for the ceiling on the amount of entertainment, amusement and recreation (EAR) expense that can be claimed as a deduction against taxable income. Under the regulations, EAR expense allowed as a deductible expense is limited to the actual EAR paid or incurred but not to exceed 1.00% of the Parent Company’s net revenue.
The provision for income tax consists of:Consolidated Parent Company
2017 2016 2015 2017 2016 2015Current Final tax P677,450 P498,750 P435,649 P607,136 P458,011 P417,227 RCIT 977,968 907,782 1,007,447 829,109 785,800 941,923 MCIT – – 29,935 – – –
1,655,418 1,406,5321,473,031
1,436,245 1,243,8111,359,150
Deferred (166,241) (279,980) (663,062) 206,239 (160,672) (531,080)P1,489,177 P1,126,552 P809,969 P1,642,484 P1,083,139 P828,070
The details of net deferred tax assets (liabilities) follow:Consolidated Parent Company2017 2016 2017 2016
Deferred tax assets (liabilities) onAllowance for impairment and credit losses P2,585,512 P2,429,146 P2,076,465 P2,249,967Revaluation Increment on land (Notes 11 and 22) (547,405) (547,405) (547,405) (547,405)Fair value adjustments on asset foreclosure and dacion
transactions - net of depreciated portion (210,800) (91,030) (222) 32,014Net defined benefit asset (297,416) (183,020) (297,416) (226,426)Fair value adjustments on net assets (liabilities) of PDB and
Unity Bank (805,515) (1,102,839) – –Others (107,948) 65,849 –
P616,428 P504,852 P1,297,271 P1,508,150
The Group did not set up deferred tax assets on the following temporary differences as it believes that it is highly probable that these temporary differences will not be realized in the near foreseeable future:
Consolidated Parent Company2017 2016 2017 2016
Allowance for impairment and credit losses P2,306,353 P3,525,592 P− P98,262Accrued compensated absences 171,431 87,499 65,384 53,003NOLCO − − − −Excess of MCIT over RCIT − 52,929 − −Others 371,427 67,793 − −
P2,849,211 P3,733,813 P65,384 P151,265

China Bank Annual Financial and Sustainability Report 2017200
As of December 31, 2017, details of excess of MCIT over RCIT of the Group follow:
InceptionYear OriginalAmount
UsedAmount
Expired Amount
Remaining Balance
ExpiryYear
2014 P13,054 P13,054 P− P− 20172015 35,414 35,414 − − 20182016 − − − − 20192017 − − − − 2020
P48,468 P48,468 P− P−
The reconciliation of the statutory income tax to the provision for income tax follows:
Consolidated Parent Company2017 2016 2015 2017 2016 2015
Statutory income tax P2,703,632 P2,276,256 P1,923,764 P2,746,937 P2,262,431 P2,002,359Tax effects of - FCDU income (498,029) (549,881) (459,351) (496,062) (543,591) (472,787) Non-taxable income (939,179) (219,042) (300,817) (837,850) (179,507) (330,074) Interest income subjected to final tax (279,914) (464,491) (168,700) (266,103) (604,445) (180,071) Nondeductible expenses 771,915 243,937 (63,433) 612,065 146,205 (232,661) Others (269,248) (160,227) (121,494) (116,503) 2,046 41,304Provision for income tax P1,489,177 P1,126,552 P809,969 P1,642,484 P1,083,139 P828,070
28. TRUST OPERATIONS
Securities and other properties (other than deposits) held by the Parent Company in fiduciary or agency capacities for clients and beneficiaries are not included in the accompanying balance sheets since these are not assets of the Parent Company (Note 30).
In compliance with the requirements of current banking regulations relative to the Parent Company’s trust functions : (a) government bonds included under HFT financial assets and AFS financial assets with total face value of P1.176 billion and P994.05 million as of December 31, 2017 and 2016, respectively, are deposited with the BSP as security for the Parent Company’s faithful compliance with its fiduciary obligations (Note 9); and (b) a certain percentage of the Parent Company’s trust fee income is transferred to surplus reserve. This yearly transfer is required until the surplus reserve for trust function equals 20.00% of the Parent Company’s authorized capital stock.
29. RELATED PARTY TRANSACTIONS
Parties are considered to be related if one party has the ability, directly or indirectly, to control the other party or exercise significant influence over the other party in making financial and operating decisions. The Group’s related parties include:
• key management personnel, close family members of key management personnel and entities which are controlled, significantly influenced by or for which significant voting power is held by key management personnel or their close family members,
• significant investors• subsidiaries, joint ventures and associates and their respective subsidiaries, and• post-employment benefit plans for the benefit of the Group’s employees.
The Group has several business relationships with related parties. Transactions with such parties are normally made in the ordinary course of business and based on the terms and conditions discussed below.
Transactions with Retirement PlansUnder PFRS, certain post-employment benefit plans are considered as related parties. The Group has business relationships with a number of its retirement plans pursuant to which it provides trust and management services to these plans. Income earned by the Group and Parent Company from such services amounted to P42.89 million and P41.69 million, respectively, in 2017, P44.35 million and P41.41 million, respectively, in 2016, and P44.19 million and P41.35 million, respectively, in 2015.
The Group’s retirement funds may hold or trade the Parent Company’s shares or securities. Significant transactions of the retirement fund, particularly with related parties, are approved by the Trust Investment Committee (TIC) of the Parent Company. The members of the TIC are directors and key management personnel of the Parent Company.

Financial Statements 201
A summary of transactions with related party retirement plans follows:
Consolidated Parent Company2017 2016 2017 2016
Deposits in banks P486,822 P223,432 P345,702 P108,259AFS financial assets 1,777,250 1,814,531 1,777,250 1,814,531Dividend income 47,751 44,214 47,751 44,214Interest income 2,037 2,069 1,520 1,172Total market value of shares 1,777,250 1,814,531 1,777,250 1,814,531Number of shares held 51,571 47,751 51,571 47,751
In 2015, dividend income and interest income of the retirement plan from investments and placements in the Parent Company amounted to P40.94 million and P0.70 million, respectively, for the Group, and P40.94 million and P0.51 million, respectively, for the Parent Company.
AFS financial assets represent shares of stock of the Parent Company. Voting rights over the Parent Company’s shares are exercised by an authorized trust officer.
Remunerations of Directors and other Key Management PersonnelKey management personnel are those persons having authority and responsibility for planning, directing and controlling the activities of the Group, directly or indirectly. The Group considers the members of the ManCom to constitute key management personnel for purposes of PAS 24.
Total remunerations of key management personnel are as follows:
Consolidated Parent Company2017 2016 2015 2017 2016 2015
Short-term employee benefits P482,345 P380,394 P411,833 P408,311 P315,284 P325,324 Post-employment benefits 2,501 4,774 6,526 2,501 2,194 3,946
P484,846 P385,168 P418,359 P410,812 P317,478 P329,270
Members of the BOD are entitled to a per diem of P500.00 for attendance at each meeting of the Board or of any committees and to four percent (4.00%) of the Parent Company’s net earnings, with certain deductions in accordance with BSP regulation. Non-executive directors do not receive any performance-related compensation. Directors’ remuneration covers all Parent Company’s Board activities and membership of committees and subsidiary companies.
The Group also provides banking services to directors and other key management personnel and persons connected to them. These transactions are presented in the tables below.
Other Related Party TransactionsTransactions between the Parent Company and its subsidiaries meet the definition of related party transactions. Transactions between the Group and its associated companies also qualify as related party transactions. Details of the Parent Company’s subsidiaries and associate are disclosed in Notes 1 and 10.
GroupRelated party transactions of the Group by category of related party are presented below.
December 31, 2017Category Amount / Volume Outstanding Balance Terms and ConditionsSignificant InvestorLoans and receivables P6,682,725 Partially secured Loans with interest rate of 2 - 5.12%
and maturity of two to seven years.Issuances P5,624,213Repayments (1,651,488)
Deposit liabilities 257 These are checking accounts with annual average rate of 0.13%.Deposits 3,164,475
Withdrawals (3,164,441)

China Bank Annual Financial and Sustainability Report 2017202
December 31, 2017Category Amount / Volume Outstanding Balance Terms and ConditionsAssociateDeposit liabilities P77,722 These are savings accounts with annual average
interest rates ranging from 0.25% to 1.00%.Deposits P1,175,969Withdrawals (1,386,319)
Key Management PersonnelLoans and receivables 39,312 Unsecured Officer’s accounts from Credit card with
interest of 3% and currently maturing and Fully secured OEL accounts with interest of 6%;Secured; no impairment; with annual fixed interest rates ranging from 0% to 5.50%
Issuances 417
Repayments 2,238Deposit liabilities 18,772 These are checking, savings and time deposits with
annual average interest rates ranging from 0.25% to 1.00%.
Deposits 279,554Withdrawals (276,612)
Other Related PartiesDeposit liabilities 51,563 These are checking and savings accounts with annual
average interest rates ranging from 0.13% to 1.00%.Deposits 16,038,034Withdrawals (16,008,489)
December 31, 2016Category Amount / Volume Outstanding Balance Terms and ConditionsSignificant InvestorLoans and receivables P2,710,000 These are secured loans with interest rate of 5.13% and
maturity of four years; collateral includes shares of stocks with fair value of P28.44 billion.
Issuances P–Repayments –
Deposit liabilities 223 These are checking accounts with annual average rate of 0.13%.Deposits 2,053,853
Withdrawals (10,270,042)AssociateDeposit liabilities 288,072 These are savings accounts with annual average interest
rates ranging from 0.25% to 1.00%.Deposits 437,486Withdrawals (1,097,863)
Key Management PersonnelLoans and receivables 11,703 This includes secured and unsecured loans amounting
to P16.12 million and P8.02 million, respectively. Secured loans bear annual interest rate of 6.00% and maturity of 15 years. Collateral includes real properties with fair value of P32.82 million.
Issuances 557Repayments 8,463
Deposit liabilities 15,830 These are checking, savings and time deposits with annual average interest rates ranging from 0.25% to 1.00%.
Deposits 209,071Withdrawals (228,679)
Other Related PartiesDeposit liabilities 22,019 These are checking and savings accountswith annual
average interest rates ranging from 0.13% to 1.00%.Deposits 8,122,268Withdrawals (33,781,787)

Financial Statements 203
Interest income earned and interest expense incurred from the above loans and deposit liabilities in 2017, 2016, and 2015 follow:
Significant Investor Associate2017 2016 2015 2017 2016 2015
Interest income P169,706 P138,944 P142,662 P– P– P1,288Interest expense 61 12 8 1,849 1,513 2,411
Key Management Personnel Other Related Parties2017 2016 2015 2017 2016 2015
Interest income P17,102 P385 P1,039 P– P– P–Interest expense 47 40 1,270 69 11 125
Related party transactions of the Group with significant investor, associate and other related parties pertain to transactions of the Parent Company with these related parties.
Parent CompanyRelated party transactions of the Parent Company by category of related party, except those already presented in the Group disclosures, are presented below.
December 31, 2017Category Amount / Volume Outstanding Balance Nature, Terms and ConditionsSignificant InvestorLoans and receivables P6,682,725 These are secured loans with interest rate of 5.13% and
maturity of four years; collateral includes shares of stocks with fair value of P28.44 billion
Issuances P5,624,213Repayments (1,651,488)
Deposit liabilities 257 These are checking accounts with annual average rate of 0.13%.Deposits 3,164,475
Withdrawals (3,164,441)SubsidiariesDeposit liabilities 32,801 These are checking and savings accounts with annual
average interest rates ranging from 0.13% to 1.00%.Deposits 330,111Withdrawals (311,528)
AssociateDeposit liabilities 77,722 These are savings accounts with annual average interest
rates ranging from 0.25% to 1.00%.Deposits 1,175,969Withdrawals (1,386,319)
Key Management PersonnelLoans and receivables 952
Issuances 417Repayments (714)
Deposit liabilities 18,772 These are savings account with annual average interest rates ranging from 0.25% to 1.00%.Deposits 279,554
Withdrawals (276,612)Other Related PartiesDeposit liabilities 51,563 These are checking and savings accounts with annual
average interest rates ranging from 0.13% to 1.00%.Deposits 16,038,034Withdrawals (16,008,489)

China Bank Annual Financial and Sustainability Report 2017204
December 31, 2016Category Amount / Volume Outstanding Balance Nature, Terms and ConditionsSignificant investor
Loans and receivables P2,710,000 These are secured loans with interest rate of 5.13% and maturity of four years; collateral includes shares of stocks with fair value of P28.44 billion.
Issuances P–Repayments –Deposit liabilities 223 These are checking accounts with annual average rate
of 0.13%.Deposits 2,053,853Withdrawals (10,270,042)
SubsidiariesDeposit liabilities 14,218 These are checking and savings accounts with annual
average interest rates ranging from 0.13% to 1.00%.Deposits 273,603Withdrawals (6,767,542)
AssociateDeposit liabilities 288,072 These are savings accounts with annual average interest
rates ranging from 0.25% to 1.00%.Deposits 437,486Withdrawals (4,700,011)
Key Management PersonnelLoans and receivables 1,249 Loans with interest rates ranging from 6.00% to 8.00%
and maturity of 15 years.Issuances 557Repayments (1,060)
Deposit liabilities 15,830 These are savings account with annual average interest rates ranging from 0.25% to 1.00%.Deposits 209,071
Withdrawals (206,142)Other Related PartiesDeposit liabilities 22,019 These are checking and savings accounts with annual
average interest rates ranging from 0.13% to 1.00%.Deposits 8,122,268Withdrawals (33,709,401)
In 2017, the Parent Company sold its investment property to a related party for a total cash selling price of P161.58 million and recognized gain of P142.61 million.
In 2015, PDB sold its investment property to the Parent Company for a total selling price of P464.52 million. PDB recognized gain on such sale amounting to P55.30 million. PDB’s gain on sale was eliminated at the group level. In addition, CBSI assigned its portfolio of receivables to PDB amounting to P2.83 billion.
The related party transactions shall be settled in cash. There are no provisions for credit losses in 2017, 2016 and 2015 in relation to amounts due from related parties.
Interest income earned and interest expense incurred from the above loans and deposit liabilities in 2017, 2016 and 2015 follow:
Subsidiaries Associate2017 2016 2015 2017 2016 2015
Interest expense P46 P33 P137 P1,849 P1,513 P19
Key Management Personnel Other Related Parties2017 2016 2015 2017 2016 2015
Interest income P46 P56 P78 P– P– P–Interest expense 47 40 76 69 11 27
Significant Investor2017 2016 2015
Interest income P169,706 P138,944 P142,662Interest expense 61 12 8

Financial Statements 205
Outright purchases and outright sale of debt securities of the Parent Company with its subsidiaries in 2017 and 2016 follow:
Subsidiaries2017 2016
Peso-denominatedOutright purchase P675,016 P1,504,879Outright sale 18,902,488 1,128,000
The following table shows the amount and outstanding balance of other related party transactions included in the financial statements:
Subsidiaries2017 2016 Nature, Terms and Conditions
Balance SheetAccounts receivable P2,741 P5,187 This pertains to various expenses advanced by CBC in behalf of CBSISecurity deposits 2,736 3,050 This pertains to the rental deposits with CBSI for office space leased out
to the Parent CompanyAccounts payable 10,607 10,623 This pertains to various unpaid rental to CBSI
Subsidiaries2017 2016 2015 Nature, Terms and Conditions
Income StatementMiscellaneous income P1,800 P1,800 P1,800 Human resources functions provided by the Parent
Company to its subsidiaries (except CBC Forex and Unity Bank) such as recruitment and placement, training and development, salary and benefits development, systems and research, and employee benefits. Under the agreement between the Parent Company and its subsidiaries, the subsidiaries shall pay the Parent Company an annual fee
Occupancy cost 24,532 22,255 16,266 Certain units of the condominium owned by CBSI are being leased to the Parent Company for a term of five years, with no escalation clause
Miscellaneous expense 193,651 169,658 122,260 This pertains to the computer and general banking services provided by CBC-PCCI to the Parent Company to support its reporting requirements
Regulatory ReportingAs required by the BSP, the Group discloses loan transactions with its and affiliates and investees and with certain directors, officers, stockholders and related interests (DOSRI). Under existing banking regulations, the limit on the amount of individual loans to DOSRI, of which 70.00% must be secured, should not exceed the regulatory capital or 15.00% of the total loan portfolio, whichever is lower. These limits do not apply to loans secured by assets considered as non-risk as defined in the regulations.
BSP Circular No. 423, dated March 15, 2004, amended the definition of DOSRI accounts. The following table shows information relating to the loans, other credit accommodations and guarantees classified as DOSRI accounts under regulations existing prior to said Circular, and new DOSRI loans, other credit accommodations granted under said Circular:
Consolidated Parent Company2017 2016 2017 2016
Total outstanding DOSRI loans P11,507,281 P7,023,635 P11,500,850 P7,015,002Percent of DOSRI loans granted under regulations existing prior to
BSP Circular No. 423 − − − −
Percent of DOSRI loans granted under BSP Circular No. 423 − − − −Percent of DOSRI loans to total loans 2.54% 1.81% 2.95% 2.12%Percent of unsecured DOSRI loans to total DOSRI loans 1.52% 5.99% 1.51% 5.98%Percent past due DOSRI loans to total DOSRI loans − − − −Percent of non-performing DOSRI loans to total DOSRI loans − − − −
The amounts of loans disclosed for related parties above differ with the amounts disclosed for key management personnel since the composition of DOSRI is more expansive than that of key management personnel.

China Bank Annual Financial and Sustainability Report 2017206
BSP Circular No. 560 provides that the total outstanding loans, other credit accommodation and guarantees to each of the bank’s/quasi-bank’s subsidiaries and affiliates shall not exceed 10.00% of the net worth of the lending bank/quasi-bank, provided that the unsecured portion of which shall not exceed 5.00% of such net worth. Further, the total outstanding loans, credit accommodations and guarantees to all subsidiaries and affiliates shall not exceed 20.00% of the net worth of the lending bank/quasi-bank; and the subsidiaries and affiliates of the lending bank/quasi-bank are not related interest of any director, officer and/or stockholder of the lending institution, except where such director, officer or stockholder sits in the BOD or is appointed officer of such corporation as representative of the bank/quasi-bank.
On May 12, 2009, BSP issued Circular No. 654 allowing a separate individual limit of twenty-five (25.00%) of the net worth of the lending bank/quasi-bank to loans of banks/quasi-banks to their subsidiaries and affiliates engaged in energy and power generation.
30. COMMITMENTS AND CONTINGENT ASSETS AND LIABILITIES
In the normal course of the Group’s operations, there are various outstanding commitments and contingent liabilities which are not reflected in the accompanying financial statements. Management does not anticipate any material losses as a result of these transactions.
The following is a summary of contingencies and commitments of the Group and the Parent Company with the equivalent peso contractual amounts:
Consolidated Parent Company2017 2016 2017 2016
Trust department accounts (Note 28) P131,813,251 P104,373,741 P131,577,983 P102,862,792Unused commercial letters of credit (Note 29) 21,596,174 17,801,390 21,383,196 17,801,205Future exchange bought 18,736,175 8,922,411 18,736,175 8,922,411Future exchange sold 15,179,964 11,267,749 15,179,964 11,267,749Credit card lines 10,359,997 8,883,196 10,359,997 8,883,196IRS receivable 9,991,390 10,823,400 9,991,390 10,823,400Outstanding guarantees issued 3,079,993 4,827,530 744,547 1,140,440Inward bills for collection 2,386,848 234,588 2,386,848 234,588Standby credit commitment 2,274,398 3,029,782 2,274,398 3,029,782Spot exchange sold 1,399,180 558,487 1,399,180 558,487Spot exchange bought 996,333 409,940 996,333 409,940Deficiency claims receivable 291,831 294,632 291,831 294,632Late deposits/payments received 127,832 417,559 116,313 405,838Outward bills for collection 93,772 73,702 91,943 57,227Others 1,614 2,575 1,354 2,348
31. SEGMENT INFORMATION
The Group’s operating businesses are recognized and managed separately according to the nature of services provided and the markets served, with each segment representing a strategic business unit.
The Group’s business segments are as follows:
a. Lending Business – principally handles all the lending, trade finance and corollary banking products and services offered to corporate and institutional customers as well as selected middle market clients. It also handles home loans, contract-to-sell receivables, auto loans and credit cards for individual and/or corporate customers. Aside from the lending business, it also provides cash management services and remittance transactions;
b. Retail Banking Business – principally handles retail and commercial loans, individual and corporate deposits, overdrafts and funds transfer facilities, trade facilities and all other services for retail customers;
c. Financial Markets – principally provides money market, trading and treasury services, manages the Group’s funding operations by the use of government securities, placements and acceptances with other banks as well as offers advisory and capital-raising services to corporate clients and wealth management services to high-net-worth customers; and
d. Others – handles other services including but not limited to trust and investment management services, asset management, insurance brokerage, credit management, thrift banking business, operations and financial control, and other support services.

Financial Statements 207
The Group’s businesses are organized to cater to the banking needs of market segments, facilitate customer engagement, ensure timely delivery of products and services as well as achieve cost efficiency and economies of scale. Accordingly, the corresponding segment information for all periods presented herein are restated to reflect such change.
The Group reports its primary segment information to the Chief Operating Decision Maker (CODM) on the basis of the above-mentioned segments. The CODM of the Group is the President.
Segment assets are those operating assets that are employed by a segment in its operating activities that are either directly attributable to the segment or can be allocated to the segment on a reasonable basis.
Segment liabilities are those operating liabilities that result from the operating activities of a segment and that either are directly attributable to the segment or can be allocated to the segment on a reasonable basis.
Interest income is reported net as management primarily relies on the net interest income as performance measure, not the gross income and expense.
The segment results include internal transfer pricing adjustments across business units as deemed appropriate by management. Transactions between segments are conducted at estimated market rates on an arm’s length basis. Interest is charged/credited to the business units based on a pool rate which approximates the marginal cost of funds.
Other operating income mainly consists of trading and securities gain (loss) - net, service charges, fees and commissions, trust fee income and foreign exchange gain - net. Other operating expense mainly consists of compensation and fringe benefits, provision for impairment and credit losses, taxes and licenses, occupancy, depreciation and amortization, stationery, supplies and postage and insurance. Other operating income and expense are allocated between segments based on equitable sharing arrangements.
The Group has no significant customers which contributes 10.00% or more of the consolidated revenues.
The Group’s asset producing revenues are located in the Philippines (i.e., one geographical location); therefore, geographical segment information is no longer presented.
The following tables present relevant financial information regarding business segments measured in accordance with PFRS as of and for the years ended December 31, 2017, 2016 and 2015:
Lending Business Retail Banking Business2017 2016 2015 2017 2016 2015
Results of OperationsNet interest income Third party P13,876,995 P11,234,520 P9,884,601 P855,933 P477,635 P247,320 Intersegment (8,438,704) (6,185,045) (5,226,806) 7,915,744 7,067,165 6,377,212
5,438,291 5,049,475 4,657,795 8,771,677 7,544,800 6,624,532Other operating income 1,317,298 907,182 885,555 1,465,962 1,234,356 1,420,568Total revenue 6,755,589 5,956,657 5,543,350 10,237,639 8,779,156 8,045,100Other operating expense (2,294,490) (2,228,638) (1,361,427) (6,536,859) (5,759,880) (5,472,577)Income before income tax 4,461,099 3,728,019 4,181,923 3,700,780 3,019,276 2,572,523Provision for income tax 236,856 96,461 − − (6,833) (5,000)Net income P4,697,955 P3,824,480 P4,181,923 P3,700,780 P3,012,443 P2,567,523Total assets P299,052,197 P251,890,331 P200,906,783 P431,622,883 P361,036,278 P124,073,281Total liabilities P1,171,742 P2,233,433 P1,050,634 P444,030,414 P365,417,688 P336,671,277Depreciation and amortization P61,988 P51,266 P39,019 P378,597 P313,745 P300,010Provision for impairment and
credit losses P668,360 P916,974 P258,725 P238,645 P126,025 P217,447Capital expenditures P63,136 P451,770 P15,713 P118,378 P647,525 P15,880

China Bank Annual Financial and Sustainability Report 2017208
Financial Markets Other Business and Support Units2017 2016 2015 2017 2016 2015
Results of OperationsNet interest income Third party P1,661,494 P2,039,741 P2,446,783 P3,231,982 P2,942,296 P2,506,480 Intersegment 1,124,033 (424,779) (567,059) (601,073) (457,341) (583,347)
2,785,527 1,614,962 1,879,724 2,630,909 2,484,955 1,923,133Other operating income 879,737 1,386,223 1,393,658 2,438,697 1,566,985 787,361Total revenue 3,665,264 3,001,185 3,273,382 5,069,606 4,051,943 2,710,494Other operating expense (1,264,773) (959,151) (651,534) (6,619,869) (5,253,750) (5,674,243)Income before income tax 2,400,491 2,042,034 2,621,848 (1,550,263) (1,201,807) (2,963,749)Provision for income tax (547,624) (388,807) (357,864) (1,178,409) (827,373) (447,105)Net income P1,852,867 P1,653,227 P2,263,984 (P2,728,672) (P2,029,180) (P3,410,854)Total assets P168,052,729 P128,281,917 P104,004,670 (P147,280,299) (P108,010,515) P97,842,229Total liabilities P140,321,883 P124,409,814 P59,108,627 P82,267,974 P77,750,872 P70,825,521Depreciation and amortization P41,852 P30,449 P20,199 P735,052 P729,326 P620,184Provision for impairment and
credit losses P– P– P– (P152,834) (P192,453) P490,402Capital expenditures P63,795 P230,076 P8,799 P389,402 (P193,719) P1,453,590
Total2017 2016 2015
Results of OperationsNet interest income Third party P19,626,404 P16,694,192 P15,085,184 Intersegment − − −
19,626,404 16,694,192 15,085,184Other operating income 6,101,694 5,094,746 4,487,142Total revenue 25,728,098 21,788,941 19,572,326Other operating expense (16,715,991) (14,201,419) (13,159,781)Income before income tax 9,012,107 7,587,522 6,412,545Provision for income tax (1,489,177) (1,126,552) (809,969)Net income P7,522,930 P6,460,970 P5,602,576Total assets P751,447,510 P633,198,011 526,826,963Total liabilities P667,792,013 P569,811,807 P467,656,059Depreciation and amortization P1,217,489 P1,124,786 P979,412Provision for impairment and
credit losses P754,171 P850,546 P966,574Capital expenditures P634,711 P1,135,652 P1,493,982
The Group’s share in net income (loss) of an associate included in other operating income amounting to P73.13 million, (P89.38 million) and (P37.89 million) in 2017, 2016 and 2015, respectively are reported under ‘Other Business and Support Units’.
32. EARNINGS PER SHARE
Basic EPS amounts are calculated by dividing the net income for the year by the weighted average number of common shares outstanding during the year (adjusted for stock dividends).
The following reflects the income and share data used in the basic earnings per share computations:
2017 2016 2015a. Net income attributable to equity holders of the parent P7,513,972 P6,458,296 P5,606,666b. Weighted average number of common shares outstanding (Note 23) 2,581,182 2,243,086 2,243,086c. EPS (a/b) P2.91 P2.88 P2.50

Financial Statements 209
As of December 31, 2017, 2016 and 2015, there were no outstanding dilutive potential common shares. Before consideration of the stock rights and 8.00% stock dividends distributed in 2017, the EPS for 2016 and 2015 were P3.23 and P2.80, respectively.
33. FINANCIAL PERFORMANCE
The following basic ratios measure the financial performance of the Group and the Parent Company:
Consolidated Parent Company2017 2016 2015 2017 2016 2015
Return on average equity 10.01% 10.42% 9.62% 10.01% 10.32% 9.57%Return on average assets 1.12% 1.16% 1.17% 1.27% 1.33% 1.35%Net interest margin 3.11% 3.20% 3.37% 2.91% 3.03% 3.20%
34. SUPPLEMENTARY INFORMATION FOR CASH FLOW ANALYSIS
The following is a summary of certain non-cash investing activities that relate to the analysis of the statements of cash flows:
Consolidated2017 2016 2015
Addition to investment properties from settlement of loans P579,089 P784,415 P960,332Fair value gain in AFS financial assets 158,946 405,722 (610,521)Addition to equity investment − − −Cumulative translation adjustment (15,970) (3,637) (16,734)Addition to chattel mortgage from settlement of loans 559,283 334,553 112,056
Parent Company2017 2016 2015
Addition to investment properties from settlement of loans P126,652 P296,844 P257,851Fair value gain in AFS financial assets 113,020 405,722 (464,471)Addition to equity investment − − −Cumulative translation adjustment (16,197) (3,637) (14,914)Addition to chattel mortgage from settlement of loans 10,824 19,088 2,244
The following table shows the reconciliation analysis of liabilities arising from financing activities for the period ended December 31, 2017:
Balance at beginning of year P16,954,998 Cash flows during the year Proceeds 252,268,556 Settlement (249,219,839) 3,048,717 Non-cash changes Foreign exchange movement 71,613 Amortization of transaction cost 42,703 114,316Balance at end of year P20,118,031

China Bank Annual Financial and Sustainability Report 2017210
35. OFFSETTING OF FINANCIAL ASSETS AND LIABILITIES
The amendments to PFRS 7 require the Group to disclose information about rights of offset and related arrangements (such as collateral posting requirements) for financial instruments under an enforceable master netting agreements or similar arrangements. The effects of these arrangements are disclosed in the succeeding table.
December 31, 2017
Financial instrumentsrecognized at
end of reportingperiod by type
Gross carryingamounts (before
offsetting)
Gross amountsoffset in
accordance withthe offsetting
criteria
Net amountpresented in
statements offinancialposition
[a-b]
Effects of remaining rights of set-off (including rights to set
off financial collateral) thatdo not meet PAS 32 offsetting
criteria
Net exposure[c-d]
Financialinstruments
Fair value offinancialcollateral
[a] [b] [c] [d] [e]Financial assetsSPURA P18,751,845 P− P18,751,845 P18,751,845 P18,749,980 P1,865Currency forwards 117,562 − 117,562 32,748 − 84,814IRS 28,963 − 28,963 8,361 − 20,602
P146,525 P− P146,525 P41,109 P− P105,416Financial liabilitiesBills payable P14,306,179 P− P14,306,179 P17,984,923 P17,453,765 P−Currency forwards 62,555 − 62,555 32,748 − 29,807IRS 31,745 − 31,745 8,361 − 23,384
P14,400,479 P− P14,400,479 P18,026,032 P17,453,765 P53,191
December 31, 2016
Financial instrumentsrecognized at
end of reportingperiod by type
Gross carryingamounts (before
offsetting)
Gross amountsoffset in
accordance withthe offsetting
criteria
Net amountpresented instatements of
financialposition
[a-b]
Effects of remaining rights of set-off (including rights to set
off financial collateral) thatdo not meet PAS 32 offsetting
criteria
Net exposure[c-d]
Financialinstruments
Fair value offinancialcollateral
[a] [b] [c] [d] [e]Financial assetsCurrency forwards P17,631 P− P17,631 P17,310 P− P321IRS 30,065 − 30,065 16,496 − 13,569
P47,696 P− P47,696 P33,806 P− P13,890Financial liabilitiesBills payable P8,072,782 P− P8,072,782 9,520,216 P8,943,902 P−Currency forwards 67,611 − 67,611 17,310 − 50,301IRS 29,410 − 29,410 16,496 − 12,914
P8,169,803 P− P8,169,803 P9,554,022 P8,943,902 P63,215
The amounts disclosed in column (d) include those rights to set-off amounts that are only enforceable and exercisable in the event of default, insolvency or bankruptcy. These include amounts related to financial collateral both received and pledged, whether cash or non-cash collateral, excluding the extent of over-collateralization.

Financial Statements 211
36. APPROVAL OF THE FINANCIAL STATEMENTS
The accompanying consolidated and parent company financial statements were authorized for issue by the Parent Company’s BOD on February 28, 2018.
37. SUPPLEMENTARY INFORMATION REQUIRED UNDER RR NO. 15-2010
In compliance with the requirements set forth by RR 15-2010, hereunder are the details of percentage and other taxes paid or accrued by the Parent Company in 2017.
Gross receipts tax P972,112Documentary stamps tax 759,058Local taxes 64,989Fringe benefit tax 5,509Others 17,662Balance at end of year P1,819,330
Withholding TaxesDetails of total remittances of withholding taxes in 2017 and amounts outstanding as of December 31, 2017 are as follows:
Total remittances
Amounts outstanding
Final withholding taxes P934,030 P88,350Withholding taxes on compensation and benefits 639,612 46,242Expanded withholding taxes 131,791 9,183
P1,705,433 P143,775

CHINA BANK BRANCHES102-6
China Bank Annual Financial and Sustainability Report 2017212
MAKATI MAIN BRANCH (HO)CBC Bldg., 8745 Paseo de Roxas cor. Villar Sts., Makati CityTrunkline: 885-5555(Private Exchange Connecting All Departments)
BINONDO BUSINESS CENTERCBC Bldg., Dasmariñas cor. Juan Luna Sts., Binondo, ManilaTrunklines: 247-5388; 8855-222(Private Exchange Connecting All Departments)
METRO MANILA
999 MALL BRANCH Unit 3D-5; 3D-7 999 Shopping Mall Bldg. 2 Recto-Soler Sts., Binondo, ManilaTel. Nos.: 523-1216/1217 1218/ 1219
A. BONIFACIO-MAUBAN BRANCHG/F Urban Oasis Residences, 423-431., A. Bonifacio Ave., Brgy. San Jose, Quezon CityTel. No.: 282-1991/94
ALABANG HILLS BRANCHG/F RBC-MDC Corporate Center, Don Jesus Blvd., Alabang Hills Village, Muntinlupa CityTel. Nos.: 877-8567; 877-8604
ALVARADO BRANCHAlvarado St., Binondo, ManilaTel. Nos.: 562-3863; 562-3866
ANTIPOLO CITY BRANCHG/F BudgetLane Arcade, No. 6, Provincial RoadBrgy. San Jose, Antipolo City, RizalTel. Nos.: 650-3277; 650-2087 695-1509
ANTIPOLO-SUMULONG HIGHWAY BRANCHNo. 219 Sumulong Highway, Brgy. Mambugan, Antipolo City, RizalTel. Nos.: 632-7309; 632-7573 655-8087
ANTIPOLO CITY-TAKTAK BRANCHSumulong Highway cor. Taktak Road, Brgy. Dela Paz, Antipolo City, RizalTel. Nos.: 721-6320; 721-6316
ARANETA AVE. BRANCHPhilippine Whithasco Bldg.420 Araneta Avenue cor. Bayani St.,Quezon CityTel. Nos.: 731-2252; 731-2261 732-4153; 731-2243 410-6753
ARRANQUE BRANCHDon Felipe Building675 Tomas Mapua St., Sta. Cruz, ManilaTel. Nos.: 733-3477; 734-4777 733-7704 733-8335 to 40 734-4497; 734-4501/06
ASUNCION BRANCHUnits G6 & G7 Chinatown Steel Towers, Asuncion St., San Nicolas, ManilaTel. Nos.: 241-2311/52/59/61
AURORA BLVD.-NEW MANILA BRANCHAurora Blvd., Brgy. Valencia, Quezon CityTel. Nos.: 727-4192; 727-4171
AYALA-ALABANG BRANCHG/F, CBC-Building Acacia Ave., Madrigal Business Park, Ayala Alabang, Muntinlupa CityTel. Nos.: 807-0673-74 850-3785/9640/8888
AYALA AVE.-AMORSOLO BRANCH G/F Teleperformance Bldg. Ayala Ave., Makati CityTel. Nos.: 541-7348; 541-5958
AYALA-COLUMNS BRANCHG/F The Columns Tower 3, Ayala Avenue, Makati CityTel. Nos.: 915-3672/3673 915-3674/3675
BACLARAN-F.B. HARRISON BRANCHBAGPI Main Bldg., 2935 F.B. Harrison cor. Ortigas St., Pasay CityTel. Nos.: 838-6187; 838-5038
BALINTAWAK-BONIFACIO BRANCH657 A. Bonifacio AvenueBalintawak, Quezon CityTel. Nos.: 361-3449; 361-7825 362-3660; 361-0450
BALUT BRANCHNorth Bay Shopping CenterHonorio Lopez Boulevard Balut, Tondo, ManilaTel. Nos.: 253-9921/29; 253-9620 251-1182/86
BANAWE BRANCHCBC Building, 680 Banawe Avenue, Sta. Mesa Hts. District I, Quezon CityTel. Nos.: 743-7486/88 416-7028/7030 711-8694
BANAWE-MA. CLARA BRANCHG/F Prosperity Bldg., Banawe St. Quezon CityTel. Nos.: 732-1060; 740-4864 743-8967
BEL-AIR BRANCH2/F Saville Bldg., Gil Puyat Ave. cor. Paseo de Roxas St., Makati CityTel. Nos.: 897-2212 899-4186/0685
BETTER LIVING SUBD. BRANCH128 Doña Soledad Ave., Parañaque CityTel. Nos.: 556-3467; 556-3468 556-3470
BF HOMES BRANCH, United BF Homes, Parañaque CityTel. Nos.: 825-6138/6891/6828
BF HOMES-AGUIRRE BRANCHMargarita Centre, Aguirre Ave. corner Elsie Gaches Street, BF Homes, Parañaque CityTel. Nos.: 799-4707/4942 659-3359/3360 556-5845
BF RESORT VILLAGE BRANCHBF Resort Drive cor. Gloria Diaz St., BF Resort Village, Talon Dos, Las Piñas CityTel. Nos.: 873-4542, 873-4541 873-4540
BGC-ICON PLAZA BRANCHG/F Icon Plaza Bldg., 25th cor. 5th Sts., Bonifacio South, Fort Bonifacio Global City, Taguig CityTel. Nos.: 777-1943; 800-1474
BGC-ONE WORLD PLACE BRANCHG/F One World Place, 32nd Avenue, Fort Bonifacio Global City, Taguig City Tel. Nos.: 869-6309; 843-2448
BGC- W TOWER BRANCHG/F W Tower 39th St., North Bonifacio Triangle BGC, Taguig City,1634Tel. Nos.: 552-3311; 551-9072
BGC- WORLD PLAZA BRANCHG/F (Unit 5) World Plaza, L4B5 E-Square Information Technology Park, Crescent Park West, 5th Avenue, Bonifacio Global City, Taguig City Tel. Nos.: 541-3447; 541-4220
BINANGONAN BRANCHNational Highway, Bo. Tagpos, Binangonan, Rizal Tel. Nos.: 669-1530; 669-1659
BLUMENTRITT BRANCH1777-1781 Cavite corner Leonor Rivera St., Blumentritt, Sta. Cruz, ManilaTel. Nos.: 742-0254; 711-8589
BO. KAPITOLYO BRANCHG/F P&E Building, 12 United corner First Sts., Bo. Kapitolyo, Pasig CityTel. Nos.: 634-8370/8915/3697
BONNY SERRANO BRANCHG/F Greenhills Garden Square, 297 Col. Bonny Serrano Ave., Quezon CityTel. Nos.: 410-0677; 997-8043 997-8031
CAINTA BRANCHCBC Bldg. (Beside Sta. Lucia East Mall)Felix Ave. (Imelda Ave.), Cainta, RizalTel. Nos.: 646-0691/93; 645-9974 682-1795
CAINTA-POBLACION BRANCHA. Bonifacio Ave., Poblacion, Cainta, RizalTel. Nos.: 637-1935; 637-6634
CAPITOL HILLS BRANCHG/F 88 Design Pro Building Capitol Hills, Old Balara, Quezon CityTel. Nos.: 952-7776/7805/7804
CENTURY CITY-KNIGHTSBRIDGE BRANCHUnit 17 & 18 Knightsbridge Residences, Century City, Kalayaan Ave., Makati CityTel. Nos.: 866-3937; 866-3803
COMMONWEALTH AVENUE BRANCHLGF Ever Gotesco Mall, Commonwealth CenterCommonwealth Avenue cornerDon Antonio Road, Quezon CityTel. Nos.: 932-0818/0820 431-5000/01
COMMONWEALTH AVE. EXT.- CASA MILAN BRANCHALX Center Building, Commonwealth Ave. Ext. North Fairview, Quezon CityTel. No.: 463-5714
CONGRESSIONAL AVENUE BRANCHG/F Unit C The Arete Square, Congressional Ave., Project 8, Quezon CityTel. Nos.: 351-8648; 351-8645 351-8646
CONGRESSIONAL AVE. EXTENSION -MIRA NILA BRANCHCBC Bldg. Congressional Ave. Ext., Quezon CityTel. Nos.: 932-2372; 932-2370
CORINTHIAN HILLS BRANCHG/F The Clubhouse, Corinthian Hills, Temple Drive, Brgy. Ugong Norte, Quezon CityTel. Nos.: 637-3170/3180/1915
CUBAO-ARANETA BRANCHShopwise Arcade Building, Times Square St., Araneta Shopping Center, Cubao, Quezon CityTel. Nos.: 911-2369/70 438-3830-32; 911-2397
CUBAO-AURORA BRANCH911 Aurora Boulevard Extension cor. Miami Street, Cubao, Quezon CityTel. Nos.: 912-5164/57 913-4675/76; 911-3524
CUBAO-P. TUAZON BRANCHNo. 287 P. Tuazon Ave. near corner 18th Avenue, Brgy. San Roque, Cubao, Quezon CityTel. Nos.: 911-5896; 911-8416
CULIAT-TANDANG SORA BRANCHG/F Royal Midway Plaza, No. 419, Tandang Sora Ave. Brgy. Culiat, 1128 Quezon CityTel. Nos.: 288-2575; 288-5114
D. TUAZON BRANCH148 D. Tuazon St., Brgy. Lourdes,Sta. Mesa Heights, Quezon CityTel. Nos.: 731-2516/2508
DAMAR VILLAGE BRANCHClubhouse, Damar Village, Quezon CityTel. Nos.: 442-3581; 367-5517 DASMARIÑAS VILLAGE BRANCH2283 Pasong Tamo Ext. corner Lumbang Street, Makati CityTel. Nos.: 894-2392/93; 813-2958
DEL MONTE AVENUE BRANCHNo. 497 Del Monte Ave. Bgry. Manresa, Quezon CityTel. Nos.: 413-2826; 413-2825 961-8828; 871-2745
DEL MONTE-MATUTUM BRANCHNo. 202 Del Monte Avenue near corner Matutum St., Brgy St. Peter, Quezon CityTel. Nos.: 731-2535; 731-2571 413-2118; 416-7791
DIVISORIA-STA. ELENA BRANCHNew Divisoria Condominium Center632 Sta. Elena St., Binondo, ManilaTel. Nos.: 247-1435/36/37

Directories 213
DON ANTONIO BRANCHG/F Royale Place, Don Antonio Ave.,Brgy. Old Balara, Quezon CityTel. Nos.: 932-9477 952-9678/9354
E. RODRIGUEZ-ACROPOLIS BRANCHG/F Suncrest Building, E. Rodriguez Jr. Ave., Quezon City Tel. Nos.: 654-3607; 654-3586
E. RODRIGUEZ-CORDILLERA BRANCHNo. 291 (G/F Units 285 & 287) E. Rodriguez Sr. Blvd., Brgy. Doña Josefa, Quezon City Tel. Nos.: 257-1512; 256-5292 E. RODRIGUEZ-HILLCREST BRANCHNo. 402 E. Rodriguez Sr. Blvd., Cubao, Quezon CityTel. Nos.: 571-8927; 571-8928 571-8929
E. RODRIGUEZ SR. BLVD. BRANCHCBC Bldg., #286 E. Rodriguez Sr. Blvd. Brgy. Damayang Lagi, Quezon CityTel. Nos.: 416-3166; 722-5860 722-5893
EASTWOOD CITY BRANCHUnit D, Techno Plaza One, Eastwood City Cyberpark, E. Rodriguez Jr. Ave., (C-5) Bagumbayan, Quezon CityTel. Nos.: 706-3491/3493/1979 706-3320/3448
EDSA-KALOOKAN BRANCHNo. 531 (Lot 5 Block 30) EDSA near corner Biglang Awa Street, Kalookan CityTel. Nos.: 442-4338; 442-4339 442-4340
EDSA-PHILAM BRANCH (formerly SM City North EDSA-Annex Branch)917 EDSA, Brgy. Philam, Quezon CityTel. Nos.: 374-2345; 374-2362 287-3106
EDSA-TIMOG AVE. BRANCH G/F Richwell Corporate Center, 102 Timog Ave., Brgy. Sacred Heart, Quezon CityTel. Nos.: 441-5225, 441-5226 441-5227
ELCANO BRANCHG/F Elcano Tower, Elcano Street, San Nicolas, ManilaTel. Nos.: 244-6760; 244-6765 244-6779
ERMITA BRANCHGround Floor A, Ma. Natividad Bldg.,#470 T. M. Kalaw cor. Cortada Sts.,Ermita, ManilaTel. Nos.: 525-6477;536-7794 525-6544;523-0074 523-9862
ESPAÑA BRANCHEspaña cor. Valencia Sts., Sampaloc, ManilaTel. Nos.: 741-9572/6209 741-6208/9565
EXAMINER BRANCHNo. 1525 Quezon Ave. cor. Examiner St., West Triangle, Quezon CityTel. Nos.: 376-3313/3314 376-3317/3318
EVANGELISTA BRANCHEvangelista corner Gen. Estrella Sts., Bangkal, Makati CityTel. Nos.: 759-5095; 759-5096 856-0434; 856-0433
FAIRVIEW BRANCHG/F Angelenix House, Fairview Ave. corner Camaro St., Quezon CityTel. Nos.: 937-5597; 938-9636 937-8086; 461-3004
FAIRVIEW TERRACES BRANCHLGF Fairview Terraces, Quirino Highway corner Maligaya Drive, Brgy. Pasong Putik, Novaliches, Quezon CityTel. Nos.: 285-5956; 285-6058
FILINVEST CORPORATE CITY BRANCHG/F Wilcon Depot, Alabang-Zapote Road cor. Bridgeway Ave., Filinvest Corporate City, Alabang, MuntinlupaTel. Nos.: 775-0097/0126 842-1993/2198
FILINVEST CORP. CITY- COMMERCENTER BRANCHG/F Commercenter Alabang, Commerce Ave. cor. Filinvest Ave., Filinvest Corporate City, Alabang, Muntinlupa CityTel. Nos.: 805-0824; 805-0827
FILINVEST CORP. CITY-NORTHGATE BRANCHG/F Aeon Centre Building, Northgate Cyberzone, Filinvest Corporate City, Alabang, Muntinlupa CityTel. Nos.: 776-1985; 551-5569
FIVE E-COM CENTER BRANCHG/F Five E-com Center, Harbor Drive, MOA Complex, Pasay City Tel. Nos.: 815-1883; 815-1884 815-1887
FORT BONIFACIO GLOBAL CITY BRANCHG/F Marajo Tower, 26th Street cor. 4th Avenue Fort Bonifacio Global City, Taguig CityTel. Nos.: 799-9072/9074 856-4416/4891/5196 403-1558 (MCB)
GEN. LUIS-KATIPUNAN BRANCHCBC Bldg., Gen. Luis St. corner Katipunan SB Road, Brgy. Nagkaisang Nayon, Novaliches, Quezon CityTel. Nos.: 285-5664; 285-5665
GIL PUYAT AVENUE BRANCHMitsu Bldg., No. 65 Sen. Gil Puyat Ave. Brgy. Palanan, Makati CityTel. Nos.: 844-0492/94 844-0688/90
GIL PUYAT-ELIZABETH PLACE BRANCHG/F Elizabeth Place, Gil Puyat Ave., Makati CityTel. Nos.: 776-0502; 776-3234
GIL PUYAT AVE.-REPOSO BRANCHNo. 331 Gil Puyat Ave., Makati CityTel. Nos.: 541-3739; 541-3735
GREENBELT 1 BRANCHG/F Greenbelt 1, Legaspi Street near corner Paseo de Roxas, Makati CityTel. Nos.: 836-1387; 836-1405 836-1406
GREENHILLS BRANCHG/F Gift Gate Bldg., Greenhills Shopping Center, San Juan, Metro ManilaTel. Nos.: 721-0543/56; 721-3189 727-9520; 724-5078 724-6173; 727-2798
GREENHILLS-CONNECTICUT BRANCHG/F Missouri Square Bldg., Missouri cor. Connecticut St. Northeast Greenhills, San Juan CityTel. Nos.: 997-3452; 997-3455
GREENHILLS-ORTIGAS BRANCHCBC Bldg., 14 Ortigas Avenue Greenhills, San Juan, Metro ManilaTel. Nos.: 723-0530/01 723-0502/04 726-1492; 727-4163
HEROES HILLS BRANCHQuezon Ave. cor. J. Abad Santos St., Heroes Hills, Quezon CityTel. Nos.: 351-4359/5121 411-3375; 412-5697
HOLY SPIRIT DRIVE BRANCHCBC Bldg., Lot 18 Block 6 Holy Spirit Drive, Don Antonio Heights, Brgy. Holy Spirit, Quezon CityTel. No.: 355-8665
ILAYA BRANCH#947 APL-YSL Bldg., Ilaya, Tondo, ManilaTel. Nos.: 245-2416; 245-2548 245-2557
INTRAMUROS BRANCHNo. 409 A. Soriano Avenue, Intramuros, ManilaTel. Nos.: 528-4241; 536-1044 536-5971; 310-5122
J. ABAD SANTOS AVENUE BRANCH2159 J. Abad Santos Ave., cor. Batangas St., Tondo, ManilaTel. Nos.: 255-1201 to 02 255-1204
J. ABAD SANTOS AVE.-QUIRICADA BRANCHJ. Abad Santos Ave. near corner Quiricada Street, ManilaTel. Nos.: 253-6803; 253-6804
JUAN LUNA BRANCHG/F Aclem Building, 501 Juan Luna St.Binondo, ManilaTel. Nos.: 247-3570/3795/3786 480-0211
KALAYAAN AVE. BRANCHG/F PPS Building, Kalayaan Avenue, Quezon CityTel. Nos.: 332-3858; 332-3859 332-3860
KALOOKAN BRANCHCBC Bldg., 167 Rizal Avenue Extension Grace Park, Kalookan CityTel. Nos.: 364-0515/35 364-0717/31 364-0494; 364-9948 366-9457
KALOOKAN-8th AVE. BRANCHNo. 279 Rizal Avenue corner 8th Ave., Grace Park, Kalookan CityTel. Nos.: 287-0001; 287-0262
KALOOKAN-10th AVE. BRANCHNo. 275 10th Ave. corner 3rd Street, Grace Park, Kalookan CityTel. Nos.: 287-5484; 287-5489
KALOOKAN-CAMARIN BRANCHL8B4 La Forteza Subd., Brgy. 175, Camarin, Kalookan CityTel. Nos.: 442-6830; 442-7541
KALOOKAN-MONUMENTO BRANCH779 McArthur Highway, Kalookan CityTel. Nos.: 364-2571; 361-3270 921-3043
KAMIAS BRANCHG/F CRM Building II, 116 Kamias Road corner Kasing-Kasing St., Quezon CityTel. Nos.: 433-6007; 920-7367 920-8770
KAMUNING BRANCH#47 SKY47 Bldg., Kamuning Road, Quezon CityTel. Nos.: 287-3369; 287-3368
KARUHATAN BRANCHNo. 248 McArthur Highway, Karuhatan, Valenzuela CityTel. Nos.: 291-0431/0175 440-0033
KATIPUNAN AVE.-LOYOLA HEIGHTS BRANCHElizabeth Hall, Katipunan Ave., Loyola Heights, Quezon CityTel. Nos.: 287-9218; 287-9221
KATIPUNAN AVE.-ST. IGNATIUS BRANCHCBC Bldg., No. 121 Katipunan Ave., Brgy. St. Ignatius, Quezon CityTel. Nos.: 913-5532; 912-5003 913-3226
LAGRO BRANCHCBC Bldg., Lot 32 Blk 125 Quirino Highway, Greater Lagro, Quezon CityTel. Nos.: 372-8226; 372-8223
LAS PIÑAS BRANCHCBC Bldg., Alabang-Zapote Road cor. Aries St., Pamplona Park Subd., Las Piñas CityTel. Nos.: 874-6204; 874-6210
LAS PIÑAS-MANUELA BRANCHAlabang-Zapote Road cor. Philamlife Ave., Pamplona Dos, Las Piñas City Tel. Nos.: 872-9801/9572/9533 871-0770

CHINA BANK BRANCHES
China Bank Annual Financial and Sustainability Report 2017214
LAS PIÑAS-MARCOS ALVAREZ AVE. BRANCHMetro Towne Center, 2020 Marcos Alvarez Ave., Talon V, Moonwalk, Las Piñas CityTel. No.: 370-9724
LAS PIÑAS-NAGA ROAD BRANCHLot 3, Naga Road, Pulanglupa2, Las Piñas CityTel. No.: 541-1671; 541-1674
LAVEZARES BRANCHNo. 412 Lavezares Street, San Nicolas, ManilaTel. Nos.: 521-6978; 521-7132 521-7128
LEGASPI VILLAGE-AIM BRANCHG/F Cacho-Gonzales Building,101 Aguirre cor. Trasierra Streets,Legaspi Village, Makati CityTel. Nos.: 818-8156; 818-0734 818-9649 894-5882 to 85
LEGASPI VILLAGE-AMORSOLO BRANCHG/F CAP Bldg., Herrera cor. Amorsolo Sts., Legaspi Village, Makati City Tel. Nos.: 832-6871; 833-5668
LEGASPI VILLAGE-C. PALANCA BRANCHSuite A, Basic Petroleum Building104 C. Palanca Jr. StreetLegaspi Village, Makati CityTel. Nos.: 894-5915/18; 810-1464
LEGASPI VILLAGE-ESTEBAN BRANCHG/F PPI Bldg., No. 109 Esteban St., Legaspi Village, Makati City
LEGASPI VILLAGE-PEREA BRANCHG/F Greenbelt Mansion, 106 Perea St., Legaspi Village, Makati CityTel. Nos.: 893-2273/2272/2827
LEGASPI VILLAGE-SALCEDO BRANCHG/F Fedman Suites, 199 Salcedo Street, Legaspi Village, Makati CityTel. Nos.: 893-7680; 893-2618 759-2462; 893-1503 816-0905
MACAPAGAL AVE.-ASEANA SQUAREAseana Square (Caltex Area), D. Macapagal Ave., Aseana City, Parañaque CityTel. Nos.: 881-5124; 881-5179
MACAPAGAL AVE.-BIOPOLIS BRANCHG/F The Biopolis, Central Business Park 1-A 076/01, Diosdado Macapagal Avenue, Pasay CityTel. Nos.: 785-6431; 785-6434
MACAPAGAL AVE.- DOUBLEDRAGON BRANCHDD Meridian Park Plaza, Macapagal Ave. cor. EDSA Ext., Pasay CityTel. Nos.: 838-3805; 838-3804
MAGALLANES VILLAGE BRANCHG/F DHI Bldg., No. 2 Lapu-Lapu Ave. corner EDSA, Magallanes Village, Makati CityTel. Nos.: 757-0272/0240 852-1290; 852-1245
MAKATI AVENUE BRANCHG/F CBC Bldg., Makati Ave. cor. Hercules St., Makati CityTel. Nos.: 890-6971 to 74
MAKATI-COMEMBO BRANCHNo. 46 JP Rizal Ext., Brgy. Comembo, Makati City Tel. Nos.: 802-2616; 802-2614 802-2613
MAKATI-JP RIZAL BRANCHJP Rizal corner Honradez Streets, Makati CityTel. No.: 815-6036 to 38
MAKATI-KALAYAAN AVE. BRANCHKalayaan Avenue, Makati CityTel. Nos.: 838-7253; 838-7252
MALABON-CONCEPCION BRANCHGen. Luna corner Paez Streets,Concepcion, MalabonTel. Nos.: 281-0102/03/04/05 281-0293
MALABON-GOV. PASCUAL BRANCHCBC Bldg., Gov. Pascual Avenue,Malabon CityTel. Nos.: 352-1816; 352-1817 352-1822; 961-2147
MALABON-POTRERO BRANCHCBC Bldg., McArthur Highway, Potrero, MalabonTel. Nos.: 448-0524/25 361-8671/7056
MALANDAY BRANCHCBC Bldg., McArthur Highway, Malanday, Valenzuela CityTel. Nos.: 432-9787; 292-6956/57 445-3201; 432-9785
MANDALUYONG-BONI AVE. BRANCHG/F VOS Bldg., Boni Avenue corner San Rafael Street, Mandaluyong CityTel. Nos.: 746-6283/85; 534-2289
MANDALUYONG-D. GUEVARAG/F 19 Libertad Plaza, Domingo Guevara St., Mandaluyong City Tel. Nos.: 534-5528; 534-5529
MANDALUYONG-PIONEER BRANCHUG-05 Globe Telecom Plaza Tower IPioneer Street, Mandaluyong CityTel. Nos.: 746-6949; 635-4198 632-1399
MANILA-MACEDA BRANCHDaguman Bldg., Maceda St., Sampaloc ManilaTel. Nos.: 521-6644; 521-6643
MARIKINA-FAIRLANE BRANCHG/F E & L Patricio Building, No. 809 J.P. Rizal Ave., Concepcion Uno, Marikina CityTel. Nos.: 997-0684; 997-0897 998-1817 948-6120 (MCB)
MARIKINA-GIL FERNANDO BRANCHBlock 9, Lot 14 Gil Fernando Ave., Marikina CityTel. Nos.: 646-0780; 646-8032 358-2138
MARIKINA-SSS VILLAGE BRANCHLilac St., Rancho Estate IV, Concepcion Dos, Marikina CityTel. Nos.: 948-5135; 941-7709 997-3343
MARIKINA-STA. ELENA BRANCH250 J.P. Rizal Street, Sta. Elena, Marikina CityTel. Nos.: 646-4281; 646-4277 646-4279; 646-1807
MASANGKAY BRANCH959-961 G. Masangkay Street,Binondo, ManilaTel. Nos.: 244-1828/35/48/56/59
MASANGKAY-LUZON BRANCH1192 G. Masangkay St., Sta. Cruz, ManilaTel. Nos.: 255-0739; 254-9974 254-9335
MAYON BRANCH480 Mayon St., Maharlika Sta. Mesa Heights, Quezon City Tel. Nos.: 731-9054/2766 741-2409
MINDANAO AVE. BRANCHG/F LJC Building, 189 Mindanao Ave. Bahay Toro, Quezon CityTel. Nos.: 277-4768; 277-4782
MUNTINLUPA-PUTATAN BRANCHG/F Teknikos Bldg., National Highway, Brgy. Putatan, Muntinlupa CityTel. Nos.: 511-0980; 808-1817
N. DOMINGO BRANCHG/F The Main Place, No. 1 Pinaglabanan cor. N. Domingo Sts., San Juan CityTel. Nos.: 470-2915; 470-2916 470-2917
NAVOTAS BRANCHNo. 500 M. Naval St. near corner Lacson St., Brgy. North Bay Boulevard North (NBBN), Navotas CityTel. Nos.: 283-0752 to 54
NOVALICHES BRANCH954 Quirino Highway, Novaliches Proper, Novaliches, Quezon CityTel. Nos.: 936-3512 937-1133/35/36
NOVALICHES-SANGANDAAN BRANCHCBC Building, Quirino Highway corner Tandang Sora Ave., Brgy. Sangandaan, Novaliches, Quezon CityTel. Nos.: 935-3049; 935-3491
NOVALICHES-STA. MONICA BRANCHG/F E & V Bldg., Quirino Highway corner Dumalay St., Novaliches, Quezon CityTel. Nos.: 288-3683; 288-2302
NOVALICHES-TALIPAPA BRANCH528 Copengco Bldg., Quirino Highway, Talipapa, Novaliches, Quezon CityTel. Nos.: 936-2202; 936-3311 936-7765
NOVALICHES-ZABARTEG/F C.I. Bldg, 1151 Quirino Highway cor. Zabarte Road, Brgy. Kaligayahan, Novaliches, Quezon CityTel. Nos.: 461-7691; 461-7694 461-7698
NUEVA BRANCHUnit Nos. 557 & 559 G/F Ayson Building, Yuchengco St., Binondo, ManilaTel. Nos.: 247-6374; 247-6396 247-0493; 480-00-66
ONGPIN BRANCHG/F Se Jo Tong Building,808 Ongpin Street, Sta. Cruz, ManilaTel. Nos.: 733-8962 to 66 735-5362
OROQUIETA BRANCH1225-1227, Oroquieta St., Sta. Cruz, ManilaTel. Nos.: 521-6648; 521-6650
ORTIGAS-ADB AVE. BRANCHLGF City & Land Mega PlazaADB Ave. cor. Garnet Road Ortigas Center, Pasig CityTel. Nos.: 687-2457/58 687-2226/3263
ORTIGAS AVE. EXT.-RIVERSIDE BRANCHUnit 2-3 Riverside Arcade Ortigas Avenue Extension corner Riverside Drive, Brgy. Sta. Lucia, Pasig CityTel. Nos.: 748-18-08; 748-4426 655-7403; 655-8350
ORTIGAS CENTER BRANCHUnit 101 Parc Chateau CondominiumOnyx corner Sapphire Streets, Ortigas Center, Pasig CityTel. Nos.: 633-7960/70/53/54 634-0178
ORTIGAS COMPLEX BRANCHG/F Padilla Building, F. Ortigas Jr. Road (formerly Emerald Avenue), Ortigas Center, Pasig City.Tel. Nos.: 634-3469; 631-2772
ORTIGAS-JADE DRIVE BRANCHUnit G-03, Antel Global Corporate Center, Jade Drive, Ortigas Center, Pasig Tel. Nos.: 638-4489; 638-4490 638-4510; 638-4540
ORTIGAS-TEKTITE BRANCHUnit EC-06B PSE Center (Tektite) Ortigas Center, Pasig CityTel. Nos.: 637-0231; 637-0238
PACO BRANCHGen. Luna corner Escoda Street, Paco, ManilaTel. Nos.: 526-6492 536-6630/31/72

Directories 215
PACO-ANGEL LINAO BRANCHUnit 1636 & 1638 Angel Linao St. Paco, ManilaTel. Nos.: 242-2849; 242-3416
PACO-OTIS BRANCHG/F Union Motor Corp. Bldg., 1760 Dra. Paz Guazon St., Paco, ManilaTel. Nos.: 561-6902; 561-6981 564-2247
PADRE FAURA BRANCHG/F Regal Shopping Center, A. Mabini cor. P. Faura Sts., Ermita, ManilaTel. Nos.: 526-0586; 527-3202 527-7865
PARAÑAQUE-BACLARAN BRANCHQuirino Avenue cor. Aragon St., Baclaran, Parañaque CityTel. Nos.: 581-1057; 663-0435
PARAÑAQUE-MOONWALK BRANCHMilky Way St. cor. Armstrong Avenue, Moonwalk, Parañaque CityTel. Nos.: 846-9729; 846-9739 846-9771
PARAÑAQUE-NAIA BRANCHNinoy Aquino Ave., Parañaque CityTel. Nos.: 541-8857; 541-8858
PARAÑAQUE-SAN ANTONIO VALLEY BRANCHSan Antonio Shopping Center, San Antonio Road, Brgy. San Antonio Valley 1, Parañaque CityTel. Nos.: 816-2448; 816-2451 PARAÑAQUE-SUCAT BRANCHNo. 8260 (between AMA Computer School and PLDT), Dr. A. Santos Ave., Brgy. SanIsidro, Parañaque CityTel. Nos.: 820-8951/52; 820-2044 825-2501; 804-3054
PASAY-LIBERTAD BRANCHCBC-Building, 184 Libertad Street, Antonio Arnaiz Ave., Pasay CityTel. Nos.: 551-7159; 834-8978 831-0306; 831-0498
PASAY-ROXAS BLVD. BRANCHGF Unit G-01 Antel Seaview Towers2626 Roxas Blvd., Pasay CityTel. Nos.: 551-9067/68/69 833-5048
PASIG-A. MABINI BRANCHA. Mabini Street, Brgy. Kapasigan, Pasig City Tel. Nos.: 534-5178; 634-4028
PASIG-C. RAYMUNDO BRANCHG/F MicMar Apartments No. 6353 C. Raymundo Avenue, Brgy. Rosario, Pasig CityTel. Nos.: 642-3652; 628-3912 628-3922
PASIG-DELA PAZ BRANCHAmang Rodriguez Avenue, Brgy. Dela Paz, Pasig CityTel. Nos.: 637-7874; 637-7876
PASIG-MERCEDES BRANCHCommercial Motors Corp. Compound Mercedes Ave., Pasig CityTel. Nos.: 628-0197/0209/0201
PASIG-SAN JOAQUIN BRANCHNo. 43 M. Concepcion Ave., San Joaquin, Pasig CityTel. Nos.: 997-2815; 997-2816 997-2817
PASIG-SANTOLAN BRANCHG/F Felmarc Business Center, Amang Rodriguez Avenue, Santolan, Pasig CityTel. Nos.: 646-0635; 682-3474 682-3514; 681-4575
PASIG-SM SUPERCENTER BRANCHG/F SM Supercenter Pasig, Frontera Drive, C-5, Ortigas, Pasig CityTel. Nos.: 706-3207/3208/3209
PASIG-VALLE VERDE BRANCHG/F Reliance IT Center, E. Rodriguez Jr. Ave., Ugong, Pasig CityTel. Nos.: 706-9242; 706-9243
PASO DE BLAS BRANCHG/F CYT Bldg., No. 178 Paso de Blas, Valenzuela CityTel. Nos.: 292-3215/3213/3216
PASONG TAMO BAGTIKAN BRANCHG/F Trans-Phil House 1177 Chino Roces Ave. cor. Bagtikan St., Makati City Tel. Nos.: 403-4820; 403-4821 403-4822; 738-7591
PASONG TAMO-CITYLAND BRANCHUnits UG30-UG32 Cityland Pasong Tamo Tower, 2210 Pasong Tamo St., Makati CityTel. Nos.: 817-9337/47/51/60/82
PASONG TAMO-LA FUERZA BRANCHLa Fuerza Plaza 1, Chino Roces Ave., Makati CityTel. Nos.: 541-8850; 541-8851
PATEROS BRANCHG/F Adela Building, M. Almeda St., Brgy. San Roque, PaterosTel. Nos.: 531-6929; 531-6810 654-3079
PHILAM BRANCH#8 East Lawin Drive, Philam Homes, QCTel. Nos.: 927-9841; 924-2872 929-5734
PROJECT 8-SHORTHORN BRANCHShorthorn Street, Project 8, Quezon CityTel. Nos.: 373-3363; 373-3369
QUEZON AVE. BRANCHNo. 18 G & D Bldg., Quezon Ave. cor. D. Tuazon St., Q.C.Tel. Nos.: 712-3676; 712-0424 740-7779/80; 712-1105 416-8891 732-2137 (MCB)
QUIAPO BRANCH216-220 Villalobos St., Quiapo, ManilaTel. Nos.: 733-2052/59/61 733-6282/86
REGALADO AVE. BRANCHCBC Building, Regalado Ave., North Fairview, Quezon CityTel. Nos.: 921-5678; 921-5359
RIZAL-ANGONO BRANCHLot 3 Blk. 4 M.L Quezon Ave. Richmond Subd., Angono, RizalTel. Nos.: 633-5198; 633-7513
RIZAL-SAN MATEO BRANCH#63 Gen. Luna corner Simon St., Banaba, San Mateo, Rizal Tel. Nos.: 650-2230; 650-1837
ROCKWELL-ORTIGAS BRANCHG/F Tower 1 Rockwell Business Center, Ortigas Avenue, Pasig City
ROOSEVELT AVE. BRANCHCBC Bldg., #293 Roosevelt Ave., San Francisco Del Monte, Quezon CityTel. Nos.: 371-5133 to 35 410-2160; 410-1957 371-2766
ROOSEVELT AVE.-FRISCO BRANCHG/F Norita Bldg., #51 H. Francisco St. corner Roosevelt Ave., Brgy. Paraiso, Quezon CityTel. Nos.: 709-7552; 921-0866
SALCEDO VILLAGE-L.P. LEVISTE BRANCHUnit 1-B G/F The Athenaeum San Agustin – LP Leviste St., Salcedo Village, Makati City Tel. Nos.: 869-3128; 869-3132 869-3134
SALCEDO VILLAGE-TORDESILLAS BRANCHG/F Prince Tower Condominium14 Tordesillas St., Salcedo Village, Makati CityTel. Nos.: 813-4901/32/33 813-4944/52
SALCEDO VILLAGE-VALERO BRANCHG/F Valero Tower, 122 Valero StreetSalcedo Village, Makati CityTel. Nos.: 892-7768/69; 812-9207 893-8188/96
SALES-RAON BRANCH611 Sales St., Quiapo, ManilaTel. Nos.: 734-5806; 734-7427 734-6959
SAN ANTONIO VILLAGE- KAMAGONG BRANCHKamagong near corner St. Paul Streets, San Antonio Village, Makati CityTel. Nos.: 777-4950; 777-4951
SAN ANTONIO VILL.-P. OCAMPO BRANCHJM Macalino Auto Center, P. Ocampo Street cor. Dungon St., San Antonio Village, Makati Tel. Nos.: 869-5648; 869-5649
SAN JUAN BRANCH17 (new) F. Blumentritt St., San Juan, M. M.Tel. Nos.: 724-8263; 726-4826 744-5616 to 18 723-7333
SAN JUAN-J. ABAD SANTOS BRANCHUnit 3 Citiplace Bldg., 8001 Jose Abad Santos Street, Little Baguio, San Juan City Tel. Nos.: 470-8292; 656-8329
SCT. BORROMEO BRANCHG/F The Forum Building, 71- A Sct. Borromeo St., Diliman, Quezon CityTel. Nos.: 426-1431; 426-1340
SHAW-HAIG BRANCHG/F First of Shaw Bldg., Shaw Blvd. corner Haig St., Mandaluyong City Tel. Nos.: 534-1073; 534-0744 718-0218; 621-6459
SHAW-PASIG BRANCHG/F RCC Center, No. 104 Shaw Boulevard, Pasig CityTel. Nos.: 634-5018/19 634-3343/44 747-7812; 634-3340
SHAW-SUMMIT ONE BRANCHUnit 102 Summit One Office Tower530 Shaw Boulevard, Mandaluyong CityTel. Nos.: 531-3970; 531-5736 531-4058; 531-1304 533-8723; 533-4948
SM AURA PREMIER BRANCHL/G SM Aura Premier, McKinley Parkway, Fort Bonifacio Global City, Taguig CityTel. Nos.: 808-9727; 808-9701
SM CITY BICUTAN BRANCHLGF, Bldg. B, SM City BicutanDoña Soledad Ave. cor. West Service Rd., Parañaque CityTel. Nos.: 821-0600/0700 777-9347
SM CITY BF PARAÑAQUE BRANCHG/F SM City BF Parañaque, Dr. A. Santos Ave. corner President’s Avenue, Parañaque CityTel. Nos.: 825-3201; 825-2990 825-3095; 820-0911
SM CITY FAIRVIEW BRANCHLGF, SM City FairviewQuirino Avenue corner Regalado Avenue, Fairview, Quezon CityTel. Nos.: 417-2878; 939-3105
SM CITY MARIKINA BRANCHG/F SM City Marikina, Marcos Highway, Brgy. Calumpang, Marikina CityTel. Nos.: 477-1845/46/47 799-6105
SM CITY MASINAG BRANCHSM City Masinag, Marcos Highway, Brgy. Mayamot, Antipolo CityTel. Nos.: 655-8764; 655-9124 655-8771

China Bank Annual Financial and Sustainability Report 2017216
SM CITY NORTH EDSA BRANCHCyberzone Carpark Bldg., SM City North Avenuecorner EDSA, Quezon CityTel. Nos.: 456-6633; 454-8108/21 925-4273
SM CITY SAN LAZARO BRANCHUGF (Units 164-166) SM City San Lazaro, Felix Huertas Street corner A.H. Lacson Extension, Sta. Cruz, ManilaTel. Nos.: 742-1572; 742-2330 493-7115
SM CITY TAYTAY BRANCHUnit 147 Bldg. B, SM City Taytay, Manila East Road, Brgy. Dolores, Taytay, RizalTel. Nos.: 286-5844; 286-5979 661-2276, 661-2277
SM MALL OF ASIA BRANCHG/F Main Mall Arcade, SM Mall of Asia, Bay Blvd., Pasay CityTel. Nos.: 556-0100/0102/0099 625-2246
SM MEGAMALL BRANCHLGF Building A, SM Megamall, E. delos Santos Avenue corner J. Vargas St., Mandaluyong CityTel. Nos.: 633-1611/12 633-1788/89 638-7213 to15
SM SOUTHMALL BRANCHUGF SM Southmall, Alabang-Zapote Road, Talon 1, Almanza, Las Piñas CityTel. Nos.: 806-6116/19; 806-3536 806-3547
SOLEMARE BRANCHG-11 Solemare Parksuites, 5A Bradco Avenue, Aseana Business Park, Parañaque CityTel. Nos.: 366-3237; 366-3219 366-3199
SOLER-168 BRANCHG/F R & S Bldg, Soler St., ManilaTel. Nos.: 242-1041; 242-1674 242-1685
SOUTH TRIANGLE BRANCHG/F Sunshine Blvd. Plaza, Quezon Ave. cor. Sct. Santiago and Panay Ave., Bgry. South Triangle, Quezon City Tel. Nos.: 277-7947; 277-7948
STA. MESA BRANCH 1-B G. Araneta Avenue, Brgy. Doña Imelda, Quezon City Tel. Nos.: 516-0764; 516-0765 516-0766
STO. CRISTO BRANCH622-39 Sto. Cristo St., Binondo, ManilaTel. Nos.: 242-4668/73; 242-5361 241-1243; 242-5449 242-3670
STO. DOMINGO AVE. BRANCHSto. Domingo Ave., Quezon CityTel. Nos.: 251-6005; 251-5852
T. ALONZO BRANCHAbeleda Business Center908 T. Alonzo corner Espeleta Streets,Sta. Cruz, ManilaTel. Nos.: 733-9581/82 734-3231 to 33
TAFT AVE.-QUIRINO BRANCH2178 Taft Avenue near corner Quirino Avenue, Malate, ManilaTel. Nos.: 521-7825; 527-3285 527-6747
TANDANG SORA-VISAYAS AVE. BRANCH#250 Tandang Sora Ave., Quezon CityTel. Nos.: 426-3818; 426-3541
TAYTAY-ORTIGAS EXENSION BRANCHOrtigas Ave. Ext., Taytay, RizalTel. No.: 727-1667
TAYTAY-SAN JUAN BRANCHVelasquez St., Sitio Bangiad, Brgy. San Juan, Taytay, Rizal Tel. No.: 998 - 6649
TIMOG AVE. BRANCHG/F Prince Jun Condominium,42 Timog Ave., Q.C.Tel. Nos.: 371-4523/24 371-4522/06
TOMAS MAPUA-LAGUNA BRANCHCBC Bldg., Tomas Mapua St. Sta. Cruz, ManilaTel. Nos.: 495-0302; 495-0294
TOMAS MORATO-E. RODRIGUEZ BRANCH1427 Tomas Morato Ave., Quezon CityTel. Nos.: 470-3037; 477-1472
TOMAS MORATO EXTENSION BRANCHTomas Morato Ave., Quezon CityTel. Nos.: 373-4960; 373-4961
TRINOMA BRANCHUnit P002, Level P1, Triangle North of Manila, North Avenue corner EDSA, Quezon CityTel. Nos.: 901-5570/5573
TUTUBAN PRIME BLOCK BRANCHRivera Shophouse, Podium Area,Tutuban Center Prime Block,C.M. Recto Ave. corner Rivera Street, ManilaTel. Nos.: 255-1414/15
UP TECHNO HUB BRANCHUP AyalaLand Techno Hub, Commonwealth Ave., Quezon CityTel. Nos.: 441-1331/1332/1334
UP VILLAGE-MAGINHAWA BRANCHLTR Bldg., No. 46 Maginhawa St., UP Village, Quezon City Tel. Nos.: 373-3349; 373-3354
V. LUNA BRANCHG/F AGGCT Bldg., No. 32 V. Luna cor. Matapat Sts., Brgy. Pinyahan, Quezon CityTel. Nos.: 772-8992; 772-8564
VALENZUELA BRANCHCBC Bldg., McArthur Highway cor. V. Cordero St., Marulas, Valenzuela CityTel. Nos.: 293-8920; 293-6160 293-5088 to 90 293-8919
VALENZUELA-GEN. LUIS BRANCHAGT Building, 425 Gen. Luis StreetPaso de Blas, Valenzuela City Tel. Nos.: 443-6160/61 983-3861/62
VALENZUELA-MALINTA BRANCHMacArthur Highway, Brgy. Malinta, Valenzuela CityTel. Nos.: 282-2160; 282-2013
VISAYAS AVE. BRANCHCBCBldg., Visayas Avenue cornerCongressional Ave. Ext., Quezon CityTel. Nos.: 454-0189; 925-2173 455-4334/35
WEST AVE. BRANCH82 West Avenue, Quezon CityTel. Nos.: 924-3131/3143 924-6363;920-6258 411-6010/6011 928-3270;
XAVIERVILLE BRANCH65 Xavierville Ave., Loyola Heights, Quezon CityTel. Nos.: 433-8696; 929-1265 927-9826
LUZON
ALBAY BRANCHRizal St. cor. Gov. Reynold Street, Old Albay District, Legazpi CityTel. Nos.: (052) 742-0893 (052) 742-0894
ANGELES CITY BRANCHCBC Bldg., 949 Henson St.,Angeles CityTel. Nos.: (045) 887-1549 323-5343 887-1550/2291 625-8660/61
ANGELES CITY-BALIBAGO BRANCHDiamond Square, Service Road McArthur Highway cor. Charlotte St. Balibago, Angeles City, PampangaTel. Nos.: (045) 892-5136 892-5144
ANGELES CITY-MARQUEE MALL BRANCHG/F Marquee Mall, Angeles City, PampangaTel. Nos.: (045) 436-4013 304-0850; 889-0975
ANGELES-MCARTHUR HIGHWAY BRANCHCBC Bldg., San Pablo St. corner McArthur Highway, Angeles CityTel. Nos.: (045) 323-5793 887-6028; 625-9362
ANGELES-STO. ROSARIO BRANCHAngeles Business Center Bldg., Teresa Avenue, Nepo Mart Complex, Angeles City, PampangaTel. Nos.: (045) 888-5175 322-9596
APALIT BRANCHCBC Bldg., McArthur Highway, San Vicente, Apalit, PampangaTel. No.: (045) 652-1131
BAGUIO CITY BRANCHG/F Juniper Bldg., A. Bonifacio Rd., Baguio CityTel. Nos.: (074) 442-9581 443-5908 443-8659 to 60 442-9663
BAGUIO CITY-ABANAO BRANCHG/F Paladin Hotel, No. 136 Abanao Ext. corner Cariño St., Baguio CityTel. Nos.: (074) 424-4837 424-4838
BALANGA CITY BRANCHG/F Dilig Building, Don Manuel Banzon Street, Balanga City, BataanTel. Nos.: (047) 237-9388/89 791-1779
BALER BRANCHProvincial Road, Barrio Suklayain, Baler, AuroraTel. Nos.: (042) 724-0026 (02) 703-3331
BALIWAG BRANCHKm. 51, Doña Remedios Trinidad (DRT) Highway, Baliwag, BulacanTel. Nos.: (044) 766-1066/5257 673-5338
BATAAN-DINALUPIHAN BRANCHGNI Building, San Ramon Highway corner Doña Rosa Street and Mabini Ext., Dinalupihan, BataanTel Nos. (047) 636-1452 (047) 636-1451
BATANGAS CITY BRANCHP. Burgos Street, Batangas CityTel. Nos.: (043) 723-0953 (02) 520-6118
BATANGAS-BALAYAN BRANCHCBC Bldg., Barrio Ermita, Balayan, BatangasTel. Nos.: (043) 741-5028 (043) 741-5180
BATANGAS-BAUAN BRANCH62 Kapitan Ponso St., Bauan, Batangas Tel. Nos.: (043) 702-4481 702-5383
BATANGAS-LEMERY BRANCHMiranda Building, Ilustre Avenue, Lemery, Batangas Tel. Nos.: (043) 409-3467 (02) 984-0206
BATANGAS-ROSARIO BRANCHDr. Gualberto Ave., Brgy. Namunga, Rosario, Batangas Tel. Nos.: (043) 312-3748 312-3776
BATANGAS-TANAUAN BRANCHJ.P. Laurel Highway, Tanauan City, Batangas Tel. Nos.: (043) 702-8956 702-8957
CHINA BANK BRANCHES

Directories 217
BULACAN-BALAGTAS BRANCHMacArthur Highway, Brgy. San Juan, Balagtas, BulacanTel. Nos.: (044) 769-4376 769-0359
BULACAN-PLARIDEL BRANCHCBC Bldg., Cagayan Valley Road, Plaridel, BulacanTel. Nos.: (044) 931-2332 325-0069
BULACAN-STA. MARIA BRANCHJ.P Rizal corner C. de Guzman St., Poblacion, Sta. MariaTel. Nos.: (044) 288-2006 815-2951; 913-0334
CABANATUAN CITY BRANCHMelencio cor. Sanciangco Sts.Cabanatuan CityTel. Nos.: (044) 600-4265 463-0935 to 36
CABANATUAN-MAHARLIKA BRANCHCBC Bldg. CBC Building, Maharlika HighwayCabanatuan CityTel. Nos.: (044) 463-8586/87 463-7964; 600-3590 940-2395
CALAPAN CITY BRANCHJ.P. Rizal St., San Vicente, Calapan City, Oriental MindoroTel. Nos.: (043) 288-8978/8508 441-0382
CAMALANIUGAN BRANCHCBC Bldg., National Highway, Camalaniugan, CagayanTel. Nos.: (078) 377-2836 377-2837
CANDON CITY BRANCHCBC Bldg., National Road,Poblacion, Candon City, Ilocos SurTel. Nos.: (077) 674-0574 674-0554
CARMONA BRANCHCBC Bldg., Paseo de Carmona Brgy. Maduya, Carmona, CaviteTel. Nos.: (046) 430-1969/1277 430-3568; (02) 475-3941
CAUAYAN CITY BRANCHG/F Prince Christopher Bldg., Maharlika Highway, Cauayan City, IsabelaTel. Nos.: (078) 652-1849 897-1338; 652-0061
CAVITE-DASMARIÑAS BRANCHG/F CBC Bldg., Gen. E. Aguinaldo Highway, Dasmariñas, CaviteTel. Nos.: (046) 416-5036/39/40 (02) 584-4083
CAVITE-IMUS BRANCHG/F CBC Bldg., Nueno AvenueTanzang Luma, Imus, CaviteTel. Nos.: (046) 970-8726/64 471-2637; 471-7094
CAVITE-MOLINO BRANCHPatio Jacinto, Molino Road, Molino 3, Bacoor, CaviteTel. Nos.: (046) 431-0632 484-6295
CAVITE-ROSARIO BRANCHG/F CBC Bldg., Gen Trias Drive,Rosario, CaviteTel. Nos.: (046) 437-0057 to 59
CAVITE-SILANG BRANCHCBC Bldg., J.P Rizal St. Poblacion, Silang, CaviteTel. Nos.: (046) 413-5095 413-4826; 413-5500 413-5417
CLARK FREEPORT ZONE BRANCHStotsenberg Lifestyle Center, Quirino Sr. cor. N. Aquino Streets, Clark Freeport Zone, Angeles City, PampangaTel. Nos.: (045) 499-8060 499-8062; 499-8063 DAET BRANCHVinzons Avenue, Daet, Camarines NorteTel. Nos.: (054) 440-0066 440-0067
DAGUPAN-M.H. DEL PILAR BRANCHCarried Realty Bldg., No. 28 M.H. del Pilar Street, Dagupan CityTel. Nos.: (075) 523-5606 522-8929; 632-0430 632-0583
DAGUPAN-PEREZ BRANCHSiapno Building, Perez Boulevard, Dagupan CityTel. Nos.: (075) 522-2562 to 64
DOLORES BRANCHCBC Bldg., McArthur Highway, Dolores, City of San Fernando, PampangaTel. Nos.: (045) 963-3413 to 15 860-1780/81
GAPAN BRANCHG/F Waltermart Center-Gapan, Maharlika Highway, Brgy. Bayanihan, Gapan, Nueva EcijaTel. Nos.: (044) 486-0217 486-0434; 486-0695
GUAGUA BRANCHYabut Building, Plaza Burgos, Guagua, PampangaTel. Nos.: (045) 458-1043 458-1045; 458-1046
ILOCOS NORTE-SAN NICOLAS BRANCHNational Highway, Brgy. 2 San Baltazar, San Nicolas, Ilocos NorteTel. Nos.: (077) 600-0994 600-0995
IRIGA CITYHighway 1, JP Rizal St., San Roque, Iriga City, Camarines SurTel. Nos.: (054) 299-7000 456-1498
ISABELA-ILAGAN BRANCHG/F North Star Mall, Maharlika Highway, Brgy. Alibagu, Ilagan, IsabelaTel. Nos.: (078) 323-0179 323-0178
ISABELA-ROXAS BRANCHNational Road, Brgy. Bantug, Roxas, IsabelaTel. Nos.: (078) 376-0422 376-0434
LA TRINIDAD BRANCHG/F SJV Bulasao Building, KM. 4, La Trinidad, BenguetTel. Nos.: (074) 422-2065/2590 309-1663
LA UNION-AGOO BRANCHNational Highway, San Jose Norte, Agoo, La UnionTel. Nos.: (072) 682-0350; 682-0391
LA UNION-SAN FERNANDO BRANCH Roger Pua Phee Building, National Highway, Brgy. 3,San Fernando, La UnionTel. Nos.: (072) 607-8931/8932 607-8933/8934
LAGUNA-BIÑAN BRANCHG/F Raja Cordelle Bldg., National Highway, Brgy. San Vicente, Biñan, LagunaTel. Nos.: (049) 511-3196 (02) 245-0440
LAGUNA-CABUYAO BRANCHG/F Centro Mall, Cabuyao City, Laguna Tel. Nos.: (049) 544-2287 544-2289
LAGUNA-CALAMBA BRANCHCBC Bldg., National Highway,Crossing, Calamba, LagunaTel. Nos.: (049) 545-7134 to 38
LAGUNA-LOS BAÑOS BRANCHNational Road, San Antonio, Los Baños, LagunaTel. Nos.: (049) 557-3223/557-3224
LAGUNA-SAN PEDRO BRANCH No. 365 Brgy. Nueva, National Highway, San Pedro City, LagunaTel. Nos.: 816-3864; 816-4862
LAGUNA-STA. CRUZ BRANCHA. Regidor St., Sta. Cruz, LagunaTel. Nos.: (049) 501-4977 501-4107; 501-4085
LAOAG CITY BRANCHLiberato Abadilla Street, Brgy. 17 San Francisco Laoag CityTel. Nos.: (077) 772-1024/27 771-4688; 771-4417
LEGAZPI CITY BRANCHG/F Emma Chan Bldg.F. Imperial St., Legazpi CityTel. Nos.: (052) 480-6048 480-6519; 214-3077
LIPA CITY-TAMBO BRANCHTambo, Lipa City, BatangasTel. Nos.: (043) 757-6331 757-6332
LUCENA CITY BRANCH233 Quezon Avenue, Lucena CityTel. Nos.: (042) 373-2317 373-3872/80/87 660-7861
MABALACAT-DAU BRANCHR.D. Policarpio Bldg., McArthur Highway, Dau, Mabalacat, PampangaTel. Nos.: (045) 892-4969 892-6040
MALOLOS CITY BRANCHG/F Graceland Mall, BSU Grounds, McArthur Highway, Guinhawa,Malolos City, BulacanTel. Nos.: (044) 794-5840 662-2013
MARILAO BRANCHG/F, SM City Marilao, KM. 21, Brgy. Ibayo, Marilao, BulacanTel. Nos.: (044) 815-8956/8957
MARIVELES-FAB BRANCH Tamayo’s Building, Avenue of the Phils., Brgy. Malaya, Freeport Area of Bataan (FAB), Mariveles, BataanTel. Nos. (047) 633-9569 (047) 633-9699
MASBATE BRANCHEspinosa Bldg., Zurbito St., Masbate City, MasbateTel. Nos.: (056) 333-2363/65
MEYCAUAYAN BRANCHCBC Bldg., Malhacan Road, Meycauayan, BulacanTel. Nos.: (044) 815-6889 815-6961; 815-6958
NAGA CITY BRANCHCentro- Peñafrancia Street,Naga CityTel. Nos.: (054) 472-1359 472-1358; 473-7920
NUEVA ECIJA-STA. ROSA BRANCHCBC Bldg., Maharlika Highway, Poblacion, Sta. Rosa, Nueva EcijaTel. Nos.: (044) 333-6215 940-1407
OCC. MINDORO-SAN JOSE BRANCHLiboro corner Rizal Street, San Jose, Occidental Mindoro Tel. Nos.: (043) 491-0095 491-0096
OLONGAPO-DOWNTOWN BRANCHNo. 2 corner 20th St., East Bajac-Bajac, Olongapo CityTel. No.: (047) 610-9826
PANGASINAN-ALAMINOS CITY BRANCHMarcos Avenue, Brgy. Palamis, Alaminos City, PangasinanTel. Nos.: (075) 551-3859 654-0286
PANGASINAN-BAYAMBANG BRANCHCBC Bldg., No. 91, Poblacion Sur, Bayambang, PangasinanTel. Nos.: (075) 632-5776 632-5775

China Bank Annual Financial and Sustainability Report 2017218
PANGASINAN-ROSALES BRANCHCBC Bldg., Calle Dewey, Rosales, Pangasinan Tel. Nos.: (075) 633-3852 633-3853
PANGASINAN-URDANETA BRANCH EF Square Bldg., McArthur Highway, Poblacion Urdaneta City, PangasinanTel. Nos.: (075) 632-2637 632-0541; 656-2022 656-2618
PASEO DE STA. ROSA BRANCHUnit 3, Paseo 5, Paseo de Sta. Rosa, Sta. Rosa City, LagunaTel. Nos.: (049) 837-1831 502-3016; 502-2859 827-8178; (02) 420-8042
QUEZON-CANDELARIA BRANCHPan Philippine Highway cor. Del Valle Street, Poblacion, Candelaria, QuezonTel. Nos.: 797-4298; 797-4299
SAN FERNANDO BRANCHCBC Bldg., V. Tiomico StreetCity of San Fernando, PampangaTel. Nos.: (045) 961-3542/49 963-5458 to 60 961-5651; 860-1925 892-3211
SAN FERNANDO-SINDALAN BRANCHJumbo Jenra Sindalan, Brgy. Sindalan, San Fernando City, PampangaTel. Nos.: (045) 866-5464 455-0569
SAN JOSE CITY BRANCHMaharlika Highway, Brgy. Malasin, San Jose CityTel. Nos.: (044) 958-9094 958-9096; 511-2898
SAN PABLO CITY BRANCHM. Paulino Street, San Pablo CityTel. Nos.: (049) 562-5481 to 84
SANTIAGO CITYNavarro Bldg., Maharlika Highway near corner Bayaua St., Santiago City, IsabelaTel. Nos.: (078) 682-7024 to 26
SM CITY BACOOR BRANCHLGF SM City BacoorTirona Highway corner Aguinaldo Highway, Bacoor, CaviteTel. Nos.: (046) 417-0572/0746 417-0623/0645
SM CITY CABANATUANUGF SM City Cabanatuan, Maharlika Highway, Brgy. H. Concepcion, Cabanatuan City, Nueva EcijaTel. Nos.: (044) 958-1916 486-5501
SM CITY CLARK BRANCHG/F (Units 172-173) SM City Clark, M. Roxas St., CSEZ, Angeles City, PampangaTel. Nos.: (045) 499-0252 to 54
SM CITY DASMARIÑAS BRANCHLGF SM City Dasmariñas, Governor’s Drive, Pala-pala, Dasmariñas, CaviteTel. No.: (046) 424-1134
SM CITY LIPA BRANCHG/F (Units 1111-1113) SM City Lipa, Ayala Highway, Brgy. Maraouy, Lipa City, BatangasTel. Nos.: (043) 784-0212 784-0213
SM CITY NAGA BRANCHSM City Naga, CBD II, Brgy. Triangulo, Naga City Tel. Nos.: (054) 472-1366 472-1367
SM CITY OLONGAPO BRANCHSM City Olongapo, Magsaysay Dr. cor. Gordon Ave., Brgy. Pag-asa, Olongapo City, ZambalesTel. Nos.: (047) 602-0039 602-0040
SM CITY PAMPANGA BRANCHUnit AX3 102, Building 4, SM City Pampanga, Mexico, PampangaTel. Nos.: (045) 455-0304/0305 455-0306/0307
SM CITY SAN JOSE DEL MONTE BRANCHUGF SM City San Jose Del Monte, San Jose Del Monte City, BulacanTel. Nos.: (044) 913-1562 (02) 985-3067
SM CITY SAN PABLO BRANCHG/F SM City San Pablo National Highway, Brgy. San Rafael, San Pablo City, LagunaTel. Nos.: (049) 521-0071 to 72
SM CITY STA. ROSA BRANCHG/F SM City Sta. Rosa, Bo. Tagapo, Sta. Rosa, LagunaTel. Nos.: (049) 534-4640/4813
SOLANO BRANCHNational Highway, Brgy. Quirino, Solano, Nueva Vizcaya Tel. Nos.: (078) 326-6559/60/61
SORSOGON BRANCHCBC Bldg., Ramon Magsaysay Ave.,Sorsogon City, SorsogonTel. Nos.: (056) 211-1610 421-5105
SUBIC BAY FREEPORT ZONE BRANCHCBC Bldg., Subic Bay Gateway Park, Rizal Highway, Subic Bay Freeport ZoneTel. Nos.: (047) 252-1568 252-1575; 252-1591
TABACO CITY BRANCHZiga Ave. corner Berces Street, Tabaco City, AlbayTel. Nos.: (052) 487-7150 830-4178
TAGAYTAY CITY BRANCHFoggy Heights Subdivision, E. Aguinaldo Highway, Tagaytay City, CaviteTel. Nos.: (046) 483-0609 483-0608
TALAVERA BRANCHCBC Bldg., Marcos District, Talavera, Nueva EcijaTel. Nos.: (044) 940-2620 940-2621
TARLAC BRANCHCBC Bldg., Panganiban near corner F. Tanedo Street, Tarlac City, TarlacTel. Nos.: (045) 982-7771 to 75
TARLAC-BAMBAN BRANCHNational Road, Bgry. Anupul, Bamban, TarlacTel. Nos.: (045) 925-0402
TARLAC-CAMILING BRANCHSavewise Super Market, Poblacion, Camiling, TarlacTel. Nos.: (045) 491-6445 934-5085; 934-5086
TARLAC-CONCEPCION BRANCHG/F Descanzo Bldg., F. Timbol St. San Nicolas Poblacion, Concepcion, TarlacTel. Nos.: (045) 491-2987 491-3028
TARLAC-PANIQUI BRANCHCedasco Building, M. H del Pilar St., Poblacion, Paniqui, TarlacTel. Nos.: (045) 491-8465 491-8464
TARLAC-SAN RAFAEL BRANCHCBC Bldg., Brgy. San Rafael, Tarlac City, TarlacTel. Nos.: (045) 456-0150 456-0121
THE DISTRICT IMUS BRANCHG/F The District Imus, Anabu II, Imus, Cavite Tel. Nos.: (046) 416-1417 416-4294
TRECE MARTIRES G/F Waltermart, Governor’s Drive corner City Hall Road, Brgy. San Agustin, Trece Martires City, CaviteTel. Nos.: (046) 460-4897 460-4898; 460-4899
TUGUEGARAO CITY BRANCHA. Bonifacio Street, Tuguegarao,Cagayan Tel. Nos.: (078) 844-0175 844-0831; 846-1709
TUGUEGARAO-BALZAIN BRANCHBalzain Highway, Tuguegarao City, CagayanTel. Nos.: (078) 396-2207 396-2208
VIGAN CITY BRANCHBurgos Street near corner Rizal Street, Vigan City, Ilocos SurTel. Nos.: (077) 722-6968 674-2272
VIRAC BRANCHGogon, Virac, CatanduanesTel. Nos.: (052) 811-4321 811-4322
ZAMBALES-BOTOLAN BRANCHNational Highway, Brgy. Batonlapoc, Botolan, ZambalesTel. Nos.: (047) 811-1322 811-1372
VISAYAS ANTIQUE-SAN JOSE BRANCHFelrosa Building, Gen. Fullon St. corner Cerdena St., San Jose, Antique Tel. Nos.: (036) 540-7095 540-7097
BACOLOD-ARANETA BRANCHCBC Bldg., Araneta corner San Sebastian Streets, Bacolod CityTel. Nos.: (034) 435-0247/48 433-3818/19 433-7152/53; 709-1618
BACOLOD-LACSON BRANCHSoliman Bldg., Lacson cor. Luzurriaga Sts., Bacolod City, Negros OccidentalTel. Nos.: (034) 474-2451 474-2452
BACOLOD-LIBERTAD BRANCHLibertad Street, Bacolod City, Negros OccidentalTel. Nos.: (034) 435-1645 435-1646
BACOLOD-MANDALAGAN BRANCHLacson Street, Mandalagan, Bacolod City, Negros OccidentalTel. Nos.: (034) 441-0500 441-0388; 709-0067
BACOLOD-NORTH DRIVE BRANCHAnesa Bldg., B.S. Aquino Drive, Bacolod CityTel. Nos.: (034) 435-0063 to 65 709-1658
BAYBAY BRANCHMagsaysay Avenue, Baybay, LeyteTel. Nos.: (053) 335-2899/98 563-9228
BORONGAN BRANCHBalud II, Poblacion, BoronganEastern SamarTel. Nos.: (055) 560-9948 560-9938; 261-5888
CALBAYOG CITY BRANCHCajurao cor. Gomez Sts., Balud, Calbayog Dist., Calbayog City, SamarTel. Nos.: (055) 209-1358 533-8842
CATARMAN BRANCHCor. Rizal & Quirino Sts., Jose P. Rizal St., Catarman, Northern, SamarTel. Nos.: (055) 251-8802/8821 500-9921
CATBALOGAN BRANCHCBC Bldg., Del Rosario St. cor. Taft Avenue, Catbalogan City, SamarTel. Nos.: (055) 251-2897/98 543-8121
CEBU-AYALA BRANCHUnit 101 G/F Insular Life, Cebu Business Center, Mindanao Ave. cor. Biliran Road, Cebu Business Park, Cebu CityTel. Nos.: (032) 262-1839 260-6524
CHINA BANK BRANCHES

Directories 219
CEBU-BANAWA BRANCHG/F The J Block, Duterte St., Banawa, Guadalupe, Cebu City, CebuTel. Nos.: (032) 340-9561 416-3827
CEBU-BANILAD BRANCHCBC Bldg., AS Fortuna St., Banilad, Cebu CityTel. Nos.: (032) 346-5870/81 416-1001
CEBU-BASAK-SAN NICOLAS BRANCHN. Bacalso Ave., Basak, San Nicolas, Cebu City, Cebu Tel. Nos.: (032) 340-8113 414-4742
CEBU-BOGO BRANCHSim Building, P. Rodriguez Street, Bogo City, CebuTel. Nos.: (032) 434-7119 266-3251
CEBU BUSINESS CENTER CBC Bldg., Samar Loop corner Panay Road, Cebu Business Park, Cebu CityTel. Nos.: (032) 239-3760 to 239-3764
CEBU-CARCAR BRANCHDr. Jose Rizal St., Poblacion I, Carcar, CebuTel. Nos.: (032) 487-8103 487-8209; 266-7093
CEBU-CONSOLACION BRANCHG/F SM City Consolacion, Brgy. Lamac, Consolacion, CebuTel. Nos.: (032) 260-0024 260-0025
CEBU-ESCARIO BRANCHUnits 3 & 5 Escario Central, Escario Road, Cebu City, CityTel. Nos.: (032) 416-5860 520-9229
CEBU-F. RAMOS BRANCHF. Ramos Street, Cebu CityTel. Nos.: (032) 253-9463 254-4867; 412-5858
CEBU-GORORDO BRANCHNo 424. Gorordo Ave., Bo. Camputhaw, Lahug District, Cebu City, CebuTel. Nos.: (032) 414-0509 239-8654
CEBU-GUADALUPE BRANCHCBC Bldg., M. Velez Street, cor. V. Rama Ave., Guadalupe, Cebu CityTel. Nos.: (032) 254-7964; 254-8495 254-1916
CEBU-IT PARK BRANCHG/F The Link, Cebu IT Park, Apas, Cebu City, CebuTel. Nos.: (032) 266-2559 262-0982
CEBU-LAHUG BRANCHJY Square Mall, No. 1 Salinas Dr., Lahug, Cebu CityTel. Nos.: (032) 417-2122; 233-0977 234-2062
CEBU-LAPU LAPU CENTRO BRANCHG.Y dela Serna St., Opon, Poblacion, Lapu-Lapu City, Cebu Tel. Nos.: (032) 231-3247 493-5078
CEBU-LAPU LAPU PUSOK BRANCHG/F Goldberry Suites, President Quezon National Highway, Pusok, Lapu-Lapu City Tel. Nos.: (032) 340-2098 494-0631; 340-2099
CEBU-MAGALLANES BRANCH CBC Bldg., Magallanes corner Jakosalem Sts., Cebu CityTel. Nos.: (032) 255-0022/23/25/28 253-0348; 255-6093 255-0266; 412-1877
CEBU-MANDAUE BRANCHSV Cabahug Building, 155-B SB Cabahug Street, Brgy. Centro, Mandaue City, CebuTel. Nos.: (032) 346-5636/37 346-2083; 344-4335 422-8188
CEBU-MANDAUE-CABANCALAN BRANCHM.L. Quezon St., Cabancalan, Mandaue City, CebuTel. Nos.: (032) 421-1364 505-9908
CEBU-MANDAUE-J CENTRE MALL BRANCHLGF J Centre Mall, A.S Fortuna Ave., Mandaue City, CebuTel. Nos.: (032) 520-2898 421-1567
CEBU-MANDAUE NORTH ROAD BRANCHG/F Units G1-G3, Basak Commercial Building (Kel-2) Basak, Mandaue CityTel. Nos.: (032) 345-8861 345-8862; 420-6767
CEBU-MANDAUE NRA BRANCHG/F Bai Hotel Cebu Ouano Ave. cor. Seno Blvd., North Reclamation Area, Mandaue City, CebuTel. No.: (032) 272-6985
CEBU-MINGLANILLA BRANCHUnit 9, Plaza Margarita Lipata, Minglanilla, CebuTel. Nos.: (032) 239-7234 490-6025
CEBU-NAGA BRANCHLeah’s Square, National South Highway, East Poblacion, Naga City, Cebu Tel. Nos.: (032) 238-7623 489-8218
CEBU-SM CITY BRANCHUpper G/F, SM City Cebu, Juan Luna cor. A. Soriano Avenue, Cebu CityTel. Nos.: (032) 232-0754/55 231-9140; 412-9699
CEBU-SM SEASIDE CITY BRANCHLGF SM Seaside City Cebu, South Road Properties, 6000 Cebu City, CebuTel. No.: (032) 262-1772
CEBU-SUBANGDAKU BRANCHG/F A.D. Gothong I.T. Center,Subangdaku, Mandaue City, CebuTel. Nos.: (032) 344-6561 422-3664; 344-6621
CEBU-TALAMBAN BRANCHUnit UG-7 Gaisano Grand Mall, Brgy. Talamban, Cebu City Tel. Nos.: (032) 236-8944 418-0796
CEBU-TALISAY BRANCHCBC Bldg., 1055 Cebu South National Road, Bulacao, Talisay City, CebuTel. Nos.: (032) 272-3342/48 491-8200
DUMAGUETE CITY BRANCHCBC Bldg., Real Street Dumaguete City, Negros OrientalTel. Nos.: (035) 422-8058 225-5442; 225-5441 225-4284; 225-5460
ILOILO-IZNART BRANCHG/F John A. Tan Bldg., Iznart St., Iloilo CityTel. Nos.: (033) 337-9477 509-9868; 300-0644
ILOILO-JARO BRANCHCBC Building, E. Lopez St. Jaro, Iloilo City, IloiloTel. Nos.: (033) 320-3738 320-3791
ILOILO-MABINI BRANCHA. Mabini Street, Iloilo CityTel. Nos.: (033) 335-0295 335-0370; 509-0599
ILOILO-MANDURRIAO BRANCHBenigno Aquino Ave., Brgy. San Rafael, Mandurriao, Iloilo City, IloiloTel. Nos.: (033) 333-3988 333-4088
ILOILO-RIZAL BRANCH CBC Building, Rizal cor. Gomez Sts., Brgy. Ortiz, Iloilo City Tel. Nos.: (033) 336-0947 338-2136; 509-8838
KALIBO BRANCHAklan Catholic College,Arch. Gabriel M. Reyes St., 5600, Kalibo, AklanTel. Nos.: (036) 500-8088 500-8188; 268-2988
MAASIN CITY BRANCHG/F SJC Bldg., Tomas Oppus St., Brgy. Tunga-Tunga, Maasin City, Southern LeyteTel. Nos.: (053) 381-2287 381-2288; 570-8488
NEGROS OCC.-KABANKALAN BRANCHCBC Building, National Highway, Brgy. 1, Kabankalan, Negros OccidentalTel. Nos.: (034) 471-3349; 471-3364 471-3738
NEGROS OCC.-SAN CARLOS BRANCHRizal corner Carmona Streets, San Carlos, Negros OccidentalTel. Nos.: (034) 312-5818; 312-5819 729-3276
ORMOC CITY BRANCHCBC Bldg., Real cor. Lopez Jaena Sts., Ormoc City, LeyteTel. Nos.: (053) 255-3651 to 53
PUERTO PRINCESA CITY BRANCHMalvar Street near corner Valencia Street, Puerto Princesa City, PalawanTel. Nos.: (048) 434-9891-93
ROXAS CITY BRANCH1063 Roxas Ave. cor. Bayot Drive, Roxas City, CapizTel. Nos.: (036) 621-3203 621-1780; 522-5775
SILAY CITY BRANCHRizal St., Silay City, Negros OccidentalTel. Nos.: (034) 714-6400 495-5452; 495-0480
TACLOBAN CITY BRANCHUytingkoc Building, Avenida Veteranos, Tacloban City, Leyte Tel. Nos.: (053) 325-7706 to 08 523-7700/7800
TAGBILARAN CITY BRANCHG/F Melrose Bldg., Carlos P. Garcia Avenue, Tagbilaran City, BoholTel. Nos.: (038) 501-0688 501-0677; 411-2484
MINDANAO
BUTUAN CITY BRANCHCBC Building, J.C. Aquino AvenueButuan CityTel. Nos.: (085) 341-5159 341-7445 (085) 815-3454/55 225-2081
CAGAYAN DE ORO-CARMEN BRANCHG/F GT Realty Building, Max Suniel St. corner Yakal St., Carmen, Cagayan de Oro CityTel. Nos.: (08822) 723-091 724-372 (088) 858-3902/03
CAGAYAN DE ORO-DIVISORIA BRANCHRN Abejuela St., South Divisoria,Cagayan de Oro CityTel. Nos.: (08822) 722-641 (088) 857-5759
CAGAYAN DE ORO-LAPASAN BRANCHCBC Building, Claro M. Recto Avenue, Lapasan, Cagayan de Oro CityTel. Nos.: (08822) 722-240 724-540; 726-242 (088) 856-1325/1326
CAGAYAN DE ORO-PUERTO BRANCHLuis A.S. Yap Building, Zone 6, Brgy. Puerto, Cagayan de Oro City, Misamis Oriental Tel. Nos.: (088) 880-7183 880-7185

China Bank Annual Financial and Sustainability Report 2017220
CDO-GAISANO CITY MALL BRANCHG/F Gaisano City Mall, C. M. Recto corner Corrales Extension, Cagayan de Oro CityTel. Nos.: (08822) 745-877 745-880 (088) 880-1051 880-1052
COTABATO CITY BRANCHNo. 76 S.K. Pendatun Avenue, Cotabato City, MaguindanaoTel. Nos.: (064) 421-4685/4653
DAVAO-BAJADA BRANCHB.I. Zone Building, J.P. Laurel Ave., Bajada, Davao CityTel. Nos.: (082) 221-0184 221-0319
DAVAO-BUHANGIN BRANCHBuhangin Road, Davao CityTel. Nos.: (082) 300-8335 227-9764; 221-5970
DAVAO-CALINAN BRANCHDavao-Bukidnon National Highway – Riverside, Calinan Proper, Davao CityTel. Nos.: (082) 224-9229 (082) 224-9135
DAVAO-INSULAR VILLAGE BRANCH(formerly Davao–Lanang Branch)Insular Village I, KM. 8, Lanang, Davao CityTel. Nos.: (082) 300-1892 234-7166; 234-7165
DAVAO-MA-A BRANCHG/F Lapeña Building, McArthur Highway, Matina, Davao CityTel. Nos.: (082) 295-0472 295-1072
DAVAO-MATINA BRANCHKM. 4 McArthur Highway, Matina, Davao CityTel. Nos.: (082) 297-4288 297-4455; 297-5880/81
DAVAO-MONTEVERDE BRANCHDoors 1 & 2, Sunbright Bldg., Monteverde Ave., Davao CityTel. Nos.: (082) 225-3680 225-3679
DAVAO-PANABO CITY BRANCHPJ Realty, Barangay New Pandan,Panabo City, Davao del NorteTel. Nos.: (084) 628-4057 628-4065
DAVAO-RECTO BRANCHCBC Bldg., C.M. Recto Ave. cor. J. Rizal St., Davao CityTel. Nos.: (082) 221-4481/ 7028 221-6021/6921/4163 226-3851; 226-2103
DAVAO-STA. ANA BRANCHR. Magsaysay Avenue corner F. Bangoy Street, Sta. Ana District, Davao CityTel. Nos.: (082) 227-9501/51 227-9601 221-1054/55; 221-6672
DAVAO-SM LANANG BRANCHG/F SM Lanang Premier, J. P. Laurel Avenue, Davao CityTel. Nos.: (082) 285-1064 285-1053
DAVAO-TAGUM BRANCH153 Pioneer Avenue, Tagum, Davao del NorteTel. Nos.: (084) 655-6307/08 400-2289/90
DAVAO-TORIL BRANCHMcArthur Highway corner St. Peter Street, Crossing Bayabas, Toril, Davao CityTel. Nos.: (082) 303-3068; 295-2334 295-2332
DIPOLOG CITY BRANCHCBC Building, Gen. Luna corner Gonzales Streets, Dipolog CityTel. Nos.: (065) 212-6768 to 69 908-2008
GEN. SANTOS CITY BRANCHCBC Bldg., I. Santiago Blvd., Gen. Santos CityTel. Nos.: (083) 553-1618; 552-8288
GEN. SANTOS CITY-DADIANGAS BRANCHM. Roxas Ave. corner Lapu-Lapu Street, Brgy. Dadiangas East, Gen. Santos City, South CotabatoTel. No.: (083) 552-8576
ILIGAN CITY BRANCHLai Building, Quezon Avenue ExtensionPala-o, Iligan CityTel. Nos.: (063) 221-5477/79 492-3009; 221-3009
ILIGAN CITY-SOLANA DISTRICT BRANCHAndres Bonifacio Highway, Brgy. San Miguel, Iligan City, Lanao del NorteTel. Nos.: (063) 224-7664; 224-7665
KIDAPAWAN CITY BRANCHG/F EVA Building, Quezon Blvd. cor. Tomas Claudio Street, National Highway, Kidapawan CityTel. Nos.: (064) 278-3509; 278-3510
KORONADAL CITY BRANCHGen. Santos Drive corner Aquino St., Koronadal City, South CotabatoTel. Nos.: (083) 228-7838 228-7839; 520-1788
MALAYBALAY CITY BRANCHBethelda Building, Sayre Highway, Malaybalay City, BukidnonTel. No.: (088) 813-3372
MIDSAYAP BRANCHCBC Bldg., Quezon Ave., Poblacion 2, Midsayap, Cotabato Tel. No.: (064) 229-9700
OZAMIZ CITY BRANCHGomez corner Kaamino Streets, Ozamiz CityTel. Nos.: (088) 521-2658 to 60
PAGADIAN CITY BRANCHMarasigan Building, F.S. Pajares Avenue,Pagadian CityTel. Nos.: (062) 215-2781/82 925-1116
SM CDO DOWNTOWN PREMIER(formerly Cagayan De Oro-Borja Branch)G/F SM CDO Downtown Premier, Cagayan de Oro CityTel. Nos.: (088) 857-2212; 857-3742 (088) 859-1053; 859-1054
SURIGAO CITY BRANCHCBC Bldg., Amat St., Barrio Washington, Surigao City, Surigao del NorteTel. Nos.: (086) 826-3958, 826-3968
VALENCIA BRANCHA. Mabini Street, Valencia, BukidnonTel. Nos.: (088) 828-2048/49 222-2356; 222-2417
ZAMBOANGA CITY BRANCHCBC Bldg., Gov. Lim Avenue cornerNuñez Street, Zamboanga CityTel. Nos.: (062) 991-2978/79 991-1266
ZAMBOANGA-GUIWAN BRANCHG/F Yang’s Tower, M.C. Lobregat National Highway, Guiwan, Zamboanga CityTel. Nos.: (062) 984-1751; 984-1754
ZAMBOANGA-SAN JOSE GUSU BRANCHYubenco Supermarket, San Jose Gusu, Zamboanga City, Zamboanga del SurTel. Nos.: (062) 995-6154; 955-6155
SOON TO OPEN
ARNAIZ AVE. BRANCHUnited Life Assurance Building, A. Arnaiz Ave. (Pasay Road), Makati City
BATANGAS CITY-KUMINTANG ILAYA BRANCHCBC Bldg. (for construction), Brgy. Kumintang Ilaya,Batangas City, Batangas
DILIMAN-MATALINO BRANCHMatalino Street, Diliman, Quezon City
GREENHILLS-ANNAPOLIS BRANCHAnnapolis St., Greenhills, San Juan City
JUPITER BRANCHJupiter Street, Makati City
MANDALUYONG - BONI AVE. BARANGKA Bonifacio Ave. cor. San Roque St., Barangka Ilaya, Mandaluyong City
PUREZA BRANCH Solicarel Bldg., R. Magsaysay Blvd.,Sta. Mesa, Manila
QUEZON AVE.-SCT. CHUATOCO BRANCH Estuar Building, No. 880 Quezon Ave., Brgy. Paligsahan, Quezon City
REGALADO AVE.-WEST FAIRVIEW BRANCHCBC Bldg. (for construction)Regalado Ave. corner Bulova St., Quezon City
SM NORTH TOWERS BRANCHSM City North EDSA North Towers, SM City North EDSA Complex, Quezon City
STO. CRISTO-CM RECTO BRANCH858 Sto. Cristo Street, Manila
TAFT AVE.-NAKPIL BRANCHG Square Taft Ave. corner Nakpil St., Malate, Manila
CHINA BANK BRANCHES

Directories 221
METRO MANILA AND RIZAL
ACACIA ESTATES–SAVEMOREAcacia Taguig Town CenterAcacia Estates, Ususan, Taguig CityTel. Nos: (02) 633-5472; 633-3245
ADRIATICO–HYPERMARKETM.H. Del Pilar, AdriaticoMalate, ManilaTel. No.: (02) 525-6286 Mobile No.: 0917 580-7061
ALABANG HILLS Alabang Commercial Citi ArcadeDon Jesus BoulevardAlabang, Muntinlupa CityTel. Nos.: (02) 828-4854 403-2801
AMANG RODRIGUEZ–SAVEMOREAmang Rodriguez Avenue corner Evangelista Street Santolan, Pasig CityTel. No.: (02) 654-0564Mobile No.: 0917 510-5962
AMORANTO AVENUEUnit 101 R Place Building255 N.S Amoranto Sr. AvenueQuezon CityTel. Nos.: (02) 966-9075; 251-6592Mobile. No.: 0917 805-6964
ANGONOManila East Road corner Don Benito StreetBrgy. San Roque, Angono, RizalTel. No.: (02) 651-1782
ANONAS–SAVEMORE Maamo Street, Road Lot 30V. Luna Street and Anonas ExtensionSikatuna, Quezon CityTel. No.: (02) 351-4928Mobile No.: 0917 863-6157
ANTIPOLOEMS Building, M.L. Quezon corner F. Dimailig Street, Brgy. San Roque Antipolo City, RizalTel. No.: (02) 697-1066
ARANETA CENTER C.O.D.– SAVEMOREGen. Romulo Street, Araneta Center Cubao, Quezon CityTel. No.: (02) 921-3149Mobile No.: 0917 809-9670
AYALA AVENUE VGP Center6772 Ayala Avenue, Makati CityTel. Nos.: (02) 988-9555 loc. 8101-8104
BACLARAN3751 Quirino Avenue corner Sta. Rita StreetBaclaran, Parañaque City Tel Nos.: 975-2172; 816-1956Mobile No.: 0917 703-2503
BANAWE247-249 Banawe StreetSta. Mesa HeightsBrgy. Lourdes, Quezon CityTel. Nos.: (02) 412-6249; 256-4941
BANGKALAmara Building1661 Evangelista Street Bangkal, Makati CityTel. Nos.: (02) 621-3459; 621-3461
BINONDO–JUAN LUNA694-696 Juan Luna StreetBinondo, ManilaTel Nos.: (02) 254-7337; 964-1327Mobile No.: 0917 510-6072
BLUMENTRITT Blumentritt Street, near Oroquieta Street, Sta. Cruz, Manila Tel. no.: (02) 968-4759Mobile No.: 0917 827-3205
BONI AVENUE Raymond Tower Boni 615 Boni Avenue, Plainview, Mandaluyong City
BUENDIA CBS Building314 Sen. Gil Puyat Avenue, Makati CityTel. No.: (02) 812-9359Trunkline: (02) 884-7600 locals 3900 to 3902 and 7645
COMMONWEALTH AVENUEJocFer BuildingCommonwealth AvenueBrgy. Holy Spirit, Quezon CityTel. Nos.: (02) 957-0559; 282-5946 282-5975; 988-9555 loc 4857Mobile No.: 0917 521-3469
CUBAOFernandina 88 Condominium 222 P. Tuazon BoulevardAraneta Center, Cubao, Quezon CityTel. Nos.: (02) 913-5209; 913-4903
DEL MONTE392 Del Monte AvenueBrgy. Sienna, Quezon CityTel. No.: (02) 741-2447
DIVISORIA DRAGON8Dragon 8 Shopping Center, 3/F C.M Recto Avenue corner Dagupan Street, Divisoria, ManilaTel. Nos.: (02) 616-1146; 247-3300 247-3299Mobile No.: 0917 317-5106
E. RODRIGUEZ SR.–HEMADYHemady Square, E. Rodriguez Avenue corner Doña Hemady StreetNew Manila, Quezon CityTel .Nos.: (02) 987- 4966 531-9676 Mobile No.: 0917 808-5214
ESPAÑA–SUNMALLSun Mall, España Boulevard corner Mayon Street Brgy. Sta. Teresita, Quezon CityTel. Nos.: (02) 244-2477; 987-4962Mobile No: 0917 810-3097
FELIX HUERTAS–JT CENTRALEJT Centrale Mall, G/F Unit 103Fugoso corner Felix Huertas StreetSta. Cruz, ManilaMobile No: 0917 5538446
FILINVEST CORPORATE CITYBC Group Building, East Asia Drive near corner Commerce AvenueFilinvest Corporate CityAlabang, Muntinlupa CityTel. No.: (02) 511-1152
FTI–TAGUIG HYPERMARKETDBP Avenue, Food Terminal Incorporated, Western Bicutan, Taguig CityTel. Nos.: (02) 834-0408; 507-4090
G. ARANETA AVENUE 195 G. Araneta Avenue Quezon City Tel No.: 978-6448 Mobile No.: 0917 828-7829
GIL PUYAT–BAUTISTA Lot 25 Blk 74 Bautista Street cornerSen. Gil Puyat Avenue, MakatiTel. No.: 838-2312
GREENHILLS–ORTIGAS AVENUEVAG Building, Ortigas Avenue Greenhills, San Juan CityTel. Nos.: (02) 721-0105; 724-752
GREENHILLS–WILSON219 Wilson StreetGreenhills, San Juan CityTel .Nos.: (02) 748-7625 584-5946
KALOOKAN Augusto Building, Rizal Avenue Grace Park, Kalookan CityTel. Nos.: (02) 365-7593 363-2752Mobile No.: 0917 572-9118
KALOOKAN–MABINIAJ Building353 A. Mabini Street, Kalookan CityTel. Nos.: (02) 961-2628; 709-3435
KATIPUNAN AVENUEOne Burgundy CondominiumKatipunan Avenue, Loyola Heights Quezon City Tel. Nos.: (02) 931-1123; 211-7882Mobile No.: 0917 628-3318
LAGROBonaza BuildingQuirino Highway, Greater LagroNovaliches, Quezon CityTel. Nos.: (02) 936-4988; 461-7214
LAS PIÑASParco SupermarketJ. Aguilar Avenue, Las Piñas CityTel. Nos.: (02) 548-0368; 548-0367
LAS PIÑAS–ALMANZA UNOAlabang - Zapote RoadAlmanza Uno, Las Piñas CityTel. Nos.: (02) 551-4724; 966-9001Mobile No.: 0917 817-3526
MAKATI–CHINO ROCES Graceland Plaza2176 Chino Roces AvenuePio del Pilar, Makati CityTel. Nos.: (02) 831-0477; 964-1322 831-0486
MAKATI–JP RIZAL882 J.P. Rizal StreetPoblacion, Makati City Tel. Nos.: (02) 890-1026; 890-1027Mobile No.: 0917 510-5919
MALABON–SAVEMOREFrancis Market, Governor Pascual corner M.H. Del Pilar Street, Malabon City Tel. Nos.: (02) 931-6326; 931- 6323
MANDALUYONGPaterno’s Building572 New Panaderos StreetBrgy.Pag-asa, Mandaluyong CityTel. Nos.: (02) 238-3745, 238-3744
MANDALUYONG–SHAW BOULEVARD 500 Shaw Tower, 500 Shaw Boulevard Mandaluyong CityTel. Nos.: (02) 941-9412; 941-9231
MANILA–STA.ANA SAVEMORESavemore Pedro Gil StreetSta. Ana, ManilaTel. Nos.: (02) 523-8606 987-4975; 523-8574
MANILA–STA. CRUZMulti-Pacific Business Inc. (MBI) Building, Plaza Sta. Cruz, Sta. Cruz, ManilaTel. Nos.: (02) 596-5826; 618-2241
MARIKINA33 Bayan-Bayanan AvenueBrgy. Concepcion 1, Marikina CityTel. Nos.: (02) 477-2445; 477-2443
MARIKINA–GIL FERNANDO AVE.CTP BuildingGil Fernando Avenue, Marikina CityTel. Nos.: (02) 681-2810; 645-8169
McKINLEY HILLCommerce & Industry PlazaUpper Basement McKinley Town Center Fort Bonifacio, Taguig City Tel. Nos.: (02) 798-0357; 403-9413
MUÑOZ JACKMAN–SAVEMOREJackman Plaza, Lower Ground FloorEDSA – Muñoz, Quezon City Tel. Nos.: (02) 442-6282; 442-4829Mobile No.: 0917 863-6069
NEPA-Q MART–SAVEMORE770 Saint Rose BuildingEDSA and K-G Street West Kamias, Quezon CityTel. Nos.: (02) 351-4883; 351-4883
NINOY AQUINO AVENUE Skyfreight Building, G/F Ninoy Aquino Avenue corner Pascor Drive, Parañaque CityTel. Nos.: (02) 843-2447; 239-0574
NOVA PLAZA MALL–SAVEMORENovaliches Plaza MallQuirino Highway corner Ramirez StreetNovaliches Proper, Quezon CityTel. Nos.: (02) 983-1512; 983-1511
CHINA BANK SAVINGS BRANCHES

China Bank Annual Financial and Sustainability Report 2017222
ORTIGAS–CITRA Unit B1, OMM Citra BuildingSan Miguel AvenueOrtigas Center, Pasig City Tel. Nos.: (02) 637-9778; 637-9824 637-2018
ORTIGAS CENTERHanston Square, San Miguel AvenueOrtigas Center, Pasig CityTel. Nos.: (02) 654-1912; 477-3439Mobile No.: 0917 807-8394
PARAÑAQUE–BETTER LIVING90 Doña Soledad AvenueBetter Living SubdivisionBicutan, Parañaque CityTel. Nos.: (02) 831-8507
PARAÑAQUE–BF HOMES284 Aguirre AvenueB.F. Homes, Parañaque CityTel. Nos.: (02) 553-5412; 553-5414Mobile No.: 0917 510-5911
PARAÑAQUE–JAKA PLAZAJaka Plaza CenterDr. A. Santos Avenue (Sucat Road)Brgy. San Isidro, Parañaque City Tel. No.: (02) 820-6093
PARAÑAQUE–LA HUERTA1070 Quirino AvenueLa Huerta, Parañaque CityTel.Nos.: (02) 893-1226; 893-1227
PARAÑAQUE–MOONWALKKassel ResidenceE. Rodriguez AvenueMoonwalk, Parañaque CityTel. Nos.: (02) 664-1923, 957-2339Mobile No.: 0917 621-8321
PASAY–LIBERTAD 533 Cementina Street. Libertad, Pasay CityTel. Nos.: 541-1697; 541-1698; 709-3435; 961-2628
PASIG–CANIOGAN KSN Building, C. Raymundo AvenueCaniogan, Pasig CityTel. No.: (02) 957-0817Mobile No.: 0917 520-6966
PASIG MUTYA Richcrest Building, Caruncho corner Market Avenue, San Nicolas, Pasig CityTel. No.: (02) 642-2870
PASIG–PADRE BURGOS114 Padre Burgos StreetKapasigan, Pasig CityTel. Nos.: (02) 650-3356; 650-3354Mobile No.: 0917-5747874
PASO DE BLAS Andoks Building, 629 Gen. Luis StreetMalinta Interchange – NLEXPaso de Blas, Valenzuela City Tel.Nos.: (02) 984-8258; 443-5069
TAYUMAN 1925-1929 Rizal Avenue near corner Tayuman StreetSta. Cruz, Manila Tel. Nos.: (02) 230-3091; 247-0683 586-1618
TIMOG Jeinkinsen Towers Condominium80 Timog Avenue, Quezon CityTel. Nos.: (02) 371-8303; 371-8304 371-8305
TWO E-COMTwo E-Com Center Tower BOcean Drive corner Bayshore DriveMall of Asia Complex, Pasay CityTel. Nos.: (02) 802-3068; 802-5583 587-4753Mobile No.: 0917 506-8303
UN AVENUE552 United Nations AvenueErmita, Manila Tel. Nos.: (02) 400-5468 400-5467
VALENZUELA–MARULAS 92-J MacArthur HighwayMarulas, Valenzuela CityTel. Nos.: (02) 291-6542; 291-6541
VISAYAS AVENUE Wilcon City Center MallUpper Ground Floor Visayas Avenue Quezon City Tel. Nos.: (02) 990-7717; 990-6544
NORTH LUZON
ANGELES–RIZAL639 Rizal Street, Angeles City Tel. Nos.: (045) 458-0297 458-0298 884-7600 loc 4833
ANGELES–SAN JOSESto. Rosario StreetSan Jose, Angeles CityTel. Nos.: (045) 409-0234 887-6433; 988-9555 loc. 4785
ARAYATCacutud, Arayat, PampangaTel. Nos.: (045) 409-9559 885-2390Ma. Rowena C. Cura
BAGUIO–SESSION B 108 Lopez Building, Session Road corner Assumption Road, Baguio City Tel. Nos.: (074) 446-3993 446-3994Mobile No.: 0917 868-3506
BALAGTASUltra Mega SupermarketMacArthur Highway Burol 1st, Balagtas, BulacanTel.Nos. (044) 693-1849 (02) 884-7600 loc. 4316
PATEROS500 Elisco RoadSto. Rosario, Pateros CityTel. Nos.: (02) 641-9556
PATEROS–ALMEDA120 M. Almeda StreetPateros CityTel. Nos.: (02) 641-6768; 641-6760
PEDRO GIL–SAVEMOREPedro Gil corner Singalong Street Paco, ManilaTel. Nos.: (02) 354-3117; 521-4056
QUEZON AVENUE–PALIGSAHAN 1184-A Ben-Lor BuildingBrgy. Paligsahan, Quezon City Tel. Nos.: (02) 376-4548; 376-4546
QUEZON AVENUEGJ Building, 385 Quezon AvenueWest Triangle, Quezon CityTel. Nos.: (02) 332-2639; 332-2638Mobile Nos.: 0917 538-2423
QUIAPO–QUEZON BOULEVARD416 Quezon BoulevardQuiapo, Manila Tel. Nos.: (02) 247-3297; 247-3298
RADA–LEGASPI HRC Center, 104 Rada StreetLegaspi Village, Makati City Tel. Nos.: (02) 810-9369; 818-2368 812-2577
ROOSEVELT 342 Roosevelt AvenueQuezon City Tel No.: (02) 957-0796 Mobile No.: 0917 520-4972
SAN JUAN CITYMadison Square264 N. Domingo StreetBrgy. Pasadena, San Juan CityTel. No.: (02) 507-4147Mobile No.: 0917 561-5639
STA. MESA 4128 Ramon Magsaysay Boulevard Sta. Mesa Manila Tel Nos.: (02) 507-6515 252- 3289; 252-3286Mobile No.: 0917 835-3352
TAFT MASAGANA–SAVEMOREParkview Plaza, Trida BuildingTaft Avenue corner T.M. Kalaw StreetErmita, Manila Tel. Nos.: (02) 554-0617; 554-0697
TANDANG SORA Cecile Ville Bldg. III 670 Tandang Sora Avenue corner General Avenue Tandang Sora, Quezon City Mobile No.: 0917 801-7585
TAYTAYC. Gonzaga Building IIManila East Road, Taytay, RizalTel. No.: (02) 623-6113Mobile No.: 0917 578-6978
BALANGA–D.M. BANZOND.M. Banzon StreetBalanga City, BataanTel. Nos.: (047) 237-3667 237-3666
BALIBAGOJEV Building, MacArthur HighwayBalibago, Angeles CityTel. Nos.: (045) 892-3325 332-1030
BALIUAGMariano Ponce BuildingPlaza Naning, Baliuag, BulacanTel. Nos.: (044) 766-2014 673-1338; 884-7600 loc. 4312
CABANATUANKm. 115 Cagayan Valley RoadMaharlika Highway near corner Sanciangco StreetCabanatuan City, Nueva EcijaTel. Nos.: (044) 940-6943 988-9555 loc. 4800
CABANATUAN–BAYAN Burgos Avenue, Cabanatuan City Tel. Nos.: (044) 600-2888 463-0441 (02) 884-7600 loc. 4321
DAGUPANLyceum – North Western University, Ground Floor, Tapuac District, Dagupan CityTel. Nos.: (075) 523-3637 988-9555 loc. 4802
DAUMacArthur HighwayDau, Mabalacat, PampangaTel. Nos.: (045) 892-2216 892 – 2215; 988-9555 loc. 4868
DOLORESSTCI Building, MacArthur Highway Brgy. San Agustin, City of San Fernando, PampangaTel. No.: (045) 649-3150
GUAGUAPlaza Burgos, Guagua, PampangaTel. Nos.: (045) 901-0641 901-0640; 901-0966
LA UNION A.G. Zambrano BuildingQuezon Avenue, San Fernando City La UnionTel. No.: (072) 700-3800
LAOAG CITYLC Square BuildingJ.P. Rizal corner M.V. Farinas StreetsLaoag City, Ilocos NorteTel. No.: (077) 600-1008 600-1009
MACABEBEPoblacion, Macabebe, PampangaTel. No.: (045) 435-5507
CHINA BANK SAVINGS BRANCHES

Directories 223
MALOLOSCanlapan Street, Sto. Rosario City of Malolos, BulacanTel. No.: (044) 794-2793Mobile No.: 0917 835-4684
MALOLOS–CATMONPaseo Del RosarioCatmon, City of Malolos, BulacanTel. No.: (044) 791-2461
MASANTOL San Nicolas, Masantol, PampangaTel. No.: (045) 435-2906
MEYCAUAYAN Mancon BuildingMacArthur HighwayCalvario, Meycauayan, BulacanTel. Nos.: (044) 884-0099 228 -2416; (02) 884-7600 loc. 4326
MOUNT CARMEL Km. 78 MacArthur Highway Brgy. Saguin, San Fernando City Pampanga Tel.Nos.: (045) 435-6055 884-7600 loc. 4330
PLARIDEL 0226 Cagayan Valley RoadBanga 1st, Plaridel, BulacanTel. Nos.: (044) 795-0105 670-1067
OLONGAPOCity View Hotel Building 25 Magsaysay DriveNew Asinan, Olongapo CityTel. No.: (047) 222-1891Mobile No.: 0917 807-8509
ORANIBrgy.Balut, Orani, BataanTel. Nos.: (047) 638-1282 (02) 988-9555 loc. 4871
ORANI–CALLE REAL Calle Real, Orani, BataanTel. Nos.: (047) 638-1130 884-7600 loc. 4323
PORACCangatba, Porac, PampangaTel. Nos.: (045) 329-3188 0917 870-3305
SAN FERNANDOKhy Trading BuildingSan Fernando – Gapan RoadCity of San Fernando, PampangaTel. Nos.: (045) 961-1415 286-6811 (02) 988-9555 loc. 4812Mobile No.: 0917 851-5172
SAN FERNANDO–BAYANJSL Building, Consunji StreetCity of San Fernando, PampangaTel. Nos.: (045) 961-8168, 961-4575 (02) 884-7600 loc. 4320
SAN ILDEFONSO–SAVEMORESavemore BuildingCagayan Valley RoadPoblacion, San Ildefonso, BulacanTel. Nos.: (044) 797-0742 797-0974 (02) 988-9555 loc. 4853
SAN JOSE DEL MONTEGiron Building, Gov. Halili Avenue, Tungkong Mangga, City of San Jose Del Monte, BulacanTel. Nos.: (044) 233-6501 (02) 988-9555 loc. 4001Mobile No.: 0917 835-4675
SAN MIGUELNorberto Street, San Miguel, BulacanTel. Nos.: (044) 764-0162 (02) 884-7600 loc. 4311
SAN NARCISOBrgy. Libertad, San Narciso, ZambalesTel. Nos.: (047) 913-2245 913-2288
SAN RAFAELCagayan Valley corner Cruz na Daan RoadSan Rafael, BulacanTel. Nos.: (044) 815-8915 913-7629; (02) 988-9555 loc. 4799
SANTIAGO–VICTORY NORTE JECO Building, Maharlika Highway corner Quezon Street, Victory Norte, Santiago City, IsabelaTel Nos.: (078) 305-0260 305-0252; (02) 884-7600 loc. 4374
STA. ANAPoblacion, Sta. Ana, PampangaTel.Nos.: (045) 409-0335 409- 9818 (02) 988-9555 loc. 4793
STA. MARIAGen. Luna corner De Leon StreetPoblacion, Sta. Maria, BulacanTel. Nos.: (044) 288-2453 884-7600 loc. 4319
STA. RITASan Vicente, Sta. Rita, PampangaTel. Nos.: (045) 900-0658 (02) 988-9555 loc. 4791
SUBICBaraca, Subic, ZambalesTel. Nos.: (047) 232-6104 232-6105 (02) 988-9555 loc. 4852
TARLAC–MACARTHUR MacArthur HighwaySan Nicolas, Tarlac CityTel.Nos.: (045) 982-9652 (02) 884-7600 loc. 4337
TUGUEGARAOMetropolitan Cathedral Parish RectoryComplex Rizal Street, Tuguegarao CityTel. Nos.: (078) 844-0484 (02) 884-7600 loc.4338
URDANETA MacArthur Highway, NancayasanUrdaneta City, PangasinanTel. Nos.: (075) 656 – 2331 (02) 884-7600 loc. 4372
VIGAN Agdamag Building, Quezon Avenue corner Calle Mabini, Vigan City,Ilocos SurTel. Nos.: (077) 674-0300 (02) 884-7600 loc. 4359
SOUTH LUZON
BACOOR–MOLINOAvon Building, 817 Molino Road Molino III, City of Bacoor, CaviteTel Nos.: (046) 431-9907 235-7542 (02) 988-9555 loc. 4878
BACOOR–TALABACoastal Road corner Aguinaldo Highway, Brgy.Talaba, City of Bacoor, CaviteTel. Nos.: (046) 417-5930 417-5940 (02) 884-7600 loc. 4369
BATANGAS–P. BURGOS No. 4 Burgos Street, Batangas CityTel. Nos.: (043) 723-1510 723-7652 (02) 884-7600 loc. 4324
BIÑAN Nepa Highway, San Vicente,Biñan City, Laguna Tel.Nos.: (049) 511-3638 (02) 884-7600 loc. 4327
CALAMBAHK Building II, National HighwayBrgy. Halang, Calamba City, LagunaTel.Nos.: (049) 306-0238 306-0234; (02) 988-9555 loc. 4844 and 4845
CAVITE CITY 485 P. Burgos Street Barangay 34, Caridad, Cavite City, CaviteTel. Nos.: (046) 417-3102 (02) 988-9555 loc. 4879 Mobile No: 0917-5615780
DARAGA–ALBAYN & H Building, Rizal StreetBrgy. San Roque, Daraga, AlbayTel. Nos.: (052) 483-0706 (02) 988-9555 loc 4822
DASMARIÑAS Veluz Plaza BuildingZone 1, Aguinaldo HighwayDasmariñas City, Cavite Tel. Nos.: (046) 416-0510 416-0501 (02) 884-7600 loc.4368
FILOIL–TANAUAN SUPLANGFilOil Gas Station, Brgy.Suplang, Tanauan City, BatangasMobile No.: 0917 863-6160
IMUS–TANZANG LUMAOLMA Building, Aguinaldo HighwayTanzang Luma, Imus City, Cavite Tel. Nos.: (046) 471-4715 476-0927 (02) 884-7600 loc. 4349
LAGUNA–STA. CRUZE & E Building, Pedro Guevarra AvenueSta. Cruz, Laguna Tel. Nos.: (049) 501-3084 (02) 988-9555 loc.4817Mobile No.: 0917 561-5715
LIPA–CM RECTO China Bank Savings BuildingC.M Recto Avenue, Lipa City Tel. Nos.: (043) 75-1414; 756-1022 (02) 884-7600 loc.4325
LOS BAÑOS–CROSSINGLopez Avenue, Batong MalakeLos Baños, Laguna Tel. Nos.: (049) 536-2596 536-0549; (02) 884-7600 loc. 4375
LUCENA Merchan corner Evangelista StreetLucena CityTel. Nos.: (042) 660-6964 (02) 884-7600 loc.4347
NAGARL Building, Panganiban StreetLerma, Naga City, Camarines SurTel.Nos.: (054) 472- 5424 472-1947 (02) 884-7600 loc. 4373
SAN PABLO–RIZAL AVENUERizal Avenue cornerA. Fule Street (former Lopez Jaena)San Pablo CityTel. Nos.: (049) 562-0697 (02) 884-7600 loc.4322
SAN PEDROGen–Ber Building, National HighwayLandayan, San Pedro City, LagunaTel. Nos.: (02) 847- 0585 869-8220; 988-9555 loc. 4837
STA. ROSASta. Rosa-Tagaytay HighwaySta. Rosa City, Laguna Tel. Nos.: (049) 502-9134 (02) 988-9555 loc. 4872
STA. ROSA–BALIBAGO Old National Highwaycorner Roque Lazaga StreetSta. Rosa City, LagunaTel. Nos.: (049) 534-1167 (02) 520-8448

China Bank Annual Financial and Sustainability Report 2017224
CEBU MANDAUE–BASAK Cebu North RoadBasak, Mandaue City, CebuTel. No.: (032) 346-6959
DAVAO8990 Corporate CenterQuirino Avenue, Davao CityTel. Nos.: (082) 221- 3873 321-0273 to 74
DAVAO–RECTO C. Villa Abrille BuildingC.M. Recto Avenue, Davao CityTel. Nos.: (082) 305-5808 (02) 884-7600 loc. 4344
GENERAL SANTOS Go Chay Ching BuildingI. Santiago BoulevardGeneral Santos City Tel. Nos.: (083) 552-6329 552-6330 (02) 884-7600 loc. 4350
KALIBO–CITY MALL F. Quimpo Street connecting Mabini and Toting Reyes Street,Kalibo AklanMobile No.: 0917-8047837
ILOILO–JAROLopez Jaena corner El 98 StreetJaro, IloiloTel. Nos.: (033) 320-0370 320-0426 (02) 988- 9555 loc. 4861 and 4862
ILOILO–QUEZON132 Quezon Street, Iloilo CityTel. Nos.: (033) 335-0213 321- 0940 (02) 988-9555 loc. 4863 and 4864
TAGUM–CITY MALL Maharlika Highway corner Lapu- lapu Extension
STO. TOMAS–MAHARLIKA The Lifestyle Street, Maharlika Highway, San Antonio, Sto. Tomas, BatangasTel. Nos.: (043) 318-0582; 778-3247; (02) 884-7600 loc. 4389
TAGAYTAY–SAVEMOREMendez Crossing WestTagaytay-Nasugbu Highwaycorner Mendez-Tagaytay Road, Tagaytay CityTel. Nos.: (046) 413-3871 413- 3872; (02) 988-9555 loc. 4876Mobile No.: 0917-561-5334
VISAYAS-MINDANAO
BACOLODSKT Saturn BuildingLacson corner Rizal StreetBacolod City, Negros OccidentalTel.Nos. (034) 435-6983 435-7143; 708-2041 (02) 988-9555 loc 4810 and 4811
CAGAYAN DE OROSergio Osmeña StreetCogon District, Cagayan de Oro City Tel. Nos.: (088) 859-0169 859-0740; 852-2006
CEBU–LAHUGSkyrise IT BuildingBrgy. Apas, Lahug, Cebu CityTel. Nos.: (032) 236-0809 236-0869
CEBU–MANDAUEA. Del Rosario AvenueMantuyong, Mandaue City, CebuTel. Nos.: (032) 520-2770 422-8019 (02) 884- 7600 loc. 4310
CEBU–MANGOJSP Mango Realty Building Gen. Maxilom Avenue corner Echavez Street, Cebu CityTel. Nos.: (032) 231-4304 231-4736; 884-7600 loc. 4346
TALISAY NEGROS–SAVEMORESavemore TalisayMabini Street, Zone 12, Paseo MabiniTalisay City, Negros OccidentalTel. Nos.: (034) 441-6264 441-6267; 441-6264
ZAMBOANGA–CITY MALLCity Mall Don Alfaro StreetTetuan, Zamboanga CityTel.Nos.: (062) 955-8709 955-0563
CBS OFF-BRANCH ATMs
ISAAC & CATALINA MEDICAL CENTERCalero StreetIbayo, Balanga, Bataan
LA SALLE COLLEGE ANTIPOLO1985 La Salle AvenueBrgy. San Luis, Antipolo City, Rizal
MABALACAT MUNICIPAL HALLDelfin DriveMabalacat, Pampanga
RIS COMPOUNDRIS Development Corporation168 Mercado StreetTabe, Guiguinto, Bulacan
ZAMECO COMPOUNDZAMECO II Head OfficeNational RoadBgy. Magsaysay, Castillejos, Zambales
CHINA BANK SAVINGS BRANCHES

Directories 225
BUSINESS OFFICES
BAGUIO SALES OFFICEB108 Lopez Building, 2nd FloorSession Road corner Assumption Road Baguio CityTel No.: (02) 884-7600 local 4232
BALIUAG SALES OFFICEMariano Ponce Building, 2nd FloorPlaza Naning, Poblacion, Baliuag, BulacanTel. Nos.: (02) 884-7600 locals 4202; 4261
BALAGTAS SALES OFFICE China Bank Savings Building, Borol 1st, McArthur Highway Balagtas, BulacanTel Nos.: (044) 693-1849 (02) 884-7600 local 4316
CABANATUAN SALES OFFICEDuran BuildingBurgos Avenue, Cabanatuan CityTel. No.: (02) 884-7600 local 4254
CAGAYAN DE ORO SALES OFFICESergio Osmeña StreetCogon District, Cagayan De Oro City Tel. No.: (02) 884-7600 local 4234
CEBU BUSINESS CENTERJSP Plaza Building, 2nd FloorGeneral Maxilom corner Echaves StreetCebu City Tel. Nos.: (032) 232-5061; 232-6263 (02) 884-7600 locals 4207 4209; 4205; 4206
DAVAO BUSINESS CENTER8990 Corporate Center, 3rd FloorQuirino Avenue, Davao City Tel. Nos.: (082) 298-4569 (02) 884-7600 local 4218
GENERAL SANTOS SALES OFFICE Go Chay Ching BuildingI. Santiago BoulevardGeneral Santos City Tel. Nos.: (083) 301-5042 (02) 884-7600 local 4271
ILOILO SALES OFFICEMSL BuildingQuezon Street, Iloilo City Tel. Nos.: (033) 337-6421; 508-3628 (02) 884-7600 local 4219; 4225
IMUS SALES OFFICEOLMA BuildingAguinaldo HighwayTanzang Luma, Imus City, CaviteTel. Nos.: (046) 416-4992 (02) 884-7600 local 4268
LA UNION BUSINESS CENTERA.G Zambrano BuildingQuezon AvenueSan Fernando City, La UnionTel. Nos.: (072) 888-7477 (02) 884-7600 local 4227
LIPA BUSINESS CENTERChina Bank Savings Building,2nd Floor, C.M Recto AvenueLipa CityTel. Nos.: (043) 756-5003 (02) 884-7600 local 4253
MARIKINA SALES OFFICECTP Building, 3rd FloorGil Fernando Avenue, Marikina City Tel. Nos.: (02) 645-9819 (02) 884-7600 local 4238
NAGA SALES OFFICERL Building, 3rd FloorPanganiban Street, Lerma, Naga City Tel. Nos.: (054) 472-1947 (02) 884-7600 local 4273
SAN FERNANDO PAMPANGA BUSINESS CENTER JSL Building, 3rd Floor Consunji Street, City of San Fernando, Pampanga Tel. Nos.: (045) 961-0005; 961-0008 (02) 884-7600 locals 4221 4236; 4237
SAN PABLO SALES OFFICEChina Bank Savings Building, 2nd FloorRizal Avenue corner A. Fule StreetSan Pablo CityTel. Nos.: (049) 800-3917
SANTIAGO SALES OFFICEJeco BuildingMaharlika HighwayVictory Norte, Santiago City Tel. No.: (02) 884-7600 local 4374
URDANETA SALES OFFICE China Bank Savings, NancayanUrdaneta City, Pangasinan Tel. Nos.: (075) 522-0498 (075) 656- 2331 (02) 884-7600 loc. 4372
VIGAN SALES OFFICEAgdamag Building, 2nd FloorQuezon Avenue corner Calle MabiniVigan City, Ilocos Sur Tel. No.: (02) 884-7600 loc. 4233
REGION 7 CEBU BUSINESS CENTER Ground Floor Skyrise IT Building Brgy. Apas, Lahug, Cebu City Tel. No.: (032) 238-7820 Mobile No.: 0917 303-3932
REGION 10 CAGAYAN DE ORO BUSINESS CENTER Sergio Osmeña StreetCogon District, Cagayan De Oro City Mobile No.: 0935 565-2010
REGION 11 DAVAO BUSINESS CENTER 3/F 8990 Corporate CenterQuirino Avenue, Davao City Tel. No.: (082) 287-6824Mobile No.: 0977 463-4707
REGION 12 GENERAL SANTOS BUSINESS CENTER Go Chay Ching BuildingI. Santiago Boulevard,General Santos City Tel. No.: (083) 554-0211Mobile No.: 0907 881-5270
REGION 18 BACOLOD BUSINESS CENTER SKT Saturn BuildingLacson corner Rizal Street, Bacolod City Tel. No.: (034) 474-2262Mobile No.: 0922 811-2680
NAGA BUSINESS CENTER 2nd Floor RL BuildingPanganiban DriveNaga City, Camarines Sur Tel. No.: (054) 881-2557
LUCENA BUSINESS CENTER Merchan corner Evangelista StreetLucena City Tel. No.: (042) 717-9387
SAN PABLO BUSINESS CENTER Rizal Avenue corner A. Fule Street (former Lopez Jaena) San Pablo City, Laguna Tel. No.: (049) 521-3991 Mobile No.: 0939 109-6360
TAGUM BUSINESS CENTER City Mall Maharlika Highway corner Lapu-Lapu Extension Brgy. Magupo, Tagum CityTel No.: 0925 542-1223
VIGAN BUSINESS CENTER Ground Floor Plaza Maestro Convention Center Florentino Street, Brgy. I, Vigan City, Ilocos Sur Mobile No.: 0917 836-4204
APD SALARY LOAN CENTERS
NATIONAL CAPITAL REGION BUSINESS CENTER 2nd Floor, G.J. Building385 Quezon Avenue, Quezon City Tel. Nos.: (02) 372-7926; 978-7754 Mobile No.: 0905 558 -2542
CORDILLERA AUTONOMOUS REGION BUSINESS CENTER 8990 B 108 Lopez BuildingSession Road corner Assumption RoadBaguio City Tel. No.: (074) 619-2097 Mobile No.: 0927 345-8502
REGION 1 LA UNION BUSINESS CENTER A.G Zambrano BuildingQuezon Avenue, San Fernando City, La Union Tel. No.: (072) 687-2218 Mobile No.: 0905 465-6289 0927 345-8502
REGION 2 TUGUEGARAO BUSINESS CENTER Ground Floor, Metropolitan Cathedral Parish Rectory Complex, Rizal Street, Tuguegarao City Tel. No.: (078) 375-4471 Mobile No.: 0917 353-6503
REGION 3 SAN FERNANDO BUSINESS CENTER JSL Building, Consunji Street, San Fernando City, Pampanga Tel. No.: (045) 280-8215
REGION 4-A TAYTAY BUSINESS CENTER2nd Floor, C Gonzaga Building 2Manila East Road, Taytay, RizalTel. No.: (02) 633-3988 Mobile No.: 0919 754-1907
REGION 5 DARAGA BUSINESS CENTER N & H BuildingRizal Street, Brgy. San RoqueDaraga, AlbayTel. No.: (052) 483-7783
REGION 6 ILOILO BUSINESS CENTER Ground Floor, Golden Finance Building Iznart Street, Iloilo City Tel. No.: 0927 567-7973

China Bank Annual Financial and Sustainability Report 2017226
Dasmariñas Village Association Office1417 Campanilla St., Dasmariñas Village, Makati City
Eastwood City Walk 2G/F ATM 1 Eastwood City Walk Ph. 2, Eastwood City Cyberpark, 188 E. Rodriguez Jr. Ave., Bagumbayan, Quezon City
Eastwood CyberMall2F Eastwood Cybermall, Eastwood Ave., Eastwood City Cyberpark, Bagumbayan, Quezon City
Eastwood MallLevel 1 ATM 2 Ph. 2, Eastwood Mall, E. Rodriguez Jr. Ave., Bagumbayan, Quezon City
Gateway MallBooth 4 Level 2 Gateway Mall, Cubao, Quezon City
Glorietta 4 Glorietta 4, Ayala Center, Makati City
Glorietta 5G/F Glorietta 5, Ayala Center, Makati City
Greenbelt 3Greenbelt 3 Drop-off Area, Makati Ave., Makati City
Greenhills Theater MallMain Entrance Greenhills Theater Mall, San Juan City
Greenmeadows ClubhouseLovebird St., Green Meadows Subdivision, Brgy. Ugong Norte, Quezon City
iAcademy BuendiaG/F iAcademy Plaza, H.V. Dela Costa St., Makati City
Jackman EmporiumJackman Emporium Department Store Bldg., Grace Park, Kalookan City
Jackman Plaza-MuñozJackman Plaza Muñoz, EDSA, Muñoz, Quezon City
JGC AlabangJGC PHILS. Bldg., 2109 Prime St., Madrigal Business Park Ph III, Ayala Alabang, Muntinlupa City
Katarungan VillageKatarungan Village Admin Office, F. Reria cor. University Road, Muntinlupa City
Kimston PlazaKimston Plaza, P. Victor St. cor. P. Burgos St., Guadalupe Nuevo, Makati City
Landmark-MakatiG/F The Landmark Bldg., Makati Ave., Ayala Center, Makati City
Landmark-TrinomaATM Slot 4, 2F Landmark Trinoma, North Ave. cor. EDSA, Quezon City
Liana’s-Sampaloc537 Earnshaw St., Sampaloc, Manila
Malabon CitisquareG/F Malabon Citisquare, C-4 Road cor. Dagat-dagatan Ave., Malabon City
Market! Market! 1Market! Market!, Fort Bonifacio Global City, Taguig City
Market! Market! 22F Market! Market!, Fort Bonifacio Global City, Taguig City
Market! Market! 3G/F ATM Center in Fiesta Market, Market! Market!, Fort Bonifacio Global City, Taguig City
Medical CityMedical City, Ortigas Ave., Pasig City
Metro Point Mall3F Metro Point Mall, EDSA cor. Taft Ave., Pasay City
MetrowalkATM 1 Bldg. C, G/F Metrowalk Commercial Complex, Meralco Ave., Pasig City
Midas HotelMidas Hotel, 2702 Roxas Blvd., Pasay City
MRT-Boni StationMRT-Boni Station, EDSA, Mandaluyong
MRT-Cubao StationMRT-Cubao Station, EDSA, Quezon City
MRT-North Ave.MRT-North Avenue Station, EDSA, Quezon City
MRT-ShawMRT-Shaw Station, EDSA, Mandaluyong City
Multinational ClubhouseClubhouse, Nazareth cor. Judea St., Multinational Village, Parañaque City
Newport Mall 4F4F Newport Mall, Resorts World, Newport City, Pasay City
Nova SquareG/F Nova Square, Quirino Highway, Brgy. San Bartolome, Novaliches, Quezon City
One E-Com CenterG/F One E-Com Center, Palm Coast Ave., SM MOA Complex, Pasay City
Puregold-Blumentritt286 Blumentritt St., Sta. Cruz, Manila
Puregold-E. RodriguezATM # 1 Puregold E. Rodriguez, Cosco Bldg., Rodriguez Ave. cor. G. Araneta Ave., Quezon City
Puregold-LakefrontPuregold Lakefront, Presidio Subdivision, Lakefront, Muntinlupa City
Puregold-Paso de BlasLGF Puregold Paso de Blas, Paso de Blas cor. Gen. Luis St., Malinta Exit, Valenzuela City
Puregold Jr.-PandacanPuregold Jr. Pandacan, West J. Zamora St., Pandacan, Manila
Quicklean Maybunga 369 Dr. Sixto Antonio Ave., Maybunga, Pasig City
Resorts World Gaming AreaG/F Casino Gaming Area, Resorts World, Pasay City
Robinsons Forum PioneerATM Center Pioneer Side, Forum Robinsons, Pioneer St. cor. EDSA, Mandaluyong City
Robinsons GalleriaRobinsons Galleria, EDSA cor. Ortigas Ave., Pasig City
Robinsons Galleria 2Robinsons Galleria, EDSA cor. Ortigas Ave., Pasig City
Robinsons Galleria 3West Wing, Robinsons Galleria, EDSA cor. Ortigas Ave., Pasig City
Robinsons Place-ManilaG/F Padre Faura Entrance, Robinsons Place Manila, Pedro Gil cor. Adriatico St., Ermita, Manila
Rockwell Business CenterRockwell Business Center, Ortigas Ave., Pasig City
Rockwell Power PlantStall No. 060 Ground Level, Power Plant Mall, Makati City
Savers CenterG/F Savers Center (right side of Main Entrance), along EDSA cor. Taft Ave., Pasay City
Shop and Ride248 Gen. Luis St., Brgy. Nova Proper, Novaliches, Quezon City
METRO MANILA
168 Mall3F Food Court, 168 Mall, Sta. Elena St., Binondo, Manila
999 Shopping MallBasement Lobby, 999 Shopping Mall, 1002-1062 Soler St., Brgy. 293, Zone 28, District 3, Binondo, Manila
999 Shopping Mall 2Basement, 999 Shopping Mall Bldg. 2, Recto-Soler Sts., Binondo, Manila
Alabang MallAlabang Town Center, Alabang- Zapote Road cor. Madrigal Ave., Muntinlupa City
Alfamart MAAXUnit 111 Mall of Asia Annex Bldg. (MAAX), Seaside Blvd., San Rafael, Pasay City
Alfamart Naga Road Las PiñasAlfamart, Naga Road, Pulang Lupa 2, Las Piñas City
Ali MallATM Booth #1 UGF Ali Mall, P. Tuazon Blvd., Araneta Center, Quezon City
Ali Mall 2LGF Times Square Entrance, Ali Mall, P. Tuazon Blvd., Araneta Center, Quezon City
Ateneo De Manila UniversityG/F Kostka Hall, Ateneo De Manila University, Katipunan Ave.,Loyola Heights, Quezon City
Cash & Carry2/F Cash & Carry Mall, between South Super Highway & Filmore St., Brgy. Palanan, Makati City
CBS Head Office LobbyCBS Lobby, 314 Sen. Gil J. Puyat Ave., Makati City
Chiang-Kai-ShekChiang Kai Shek College, 1274 P. Algue St., Tondo, Manila
China Bank Online CenterStarbucks, CBC Building, 8745 Paseo De Roxas cor. Villar St., Makati City
Comembo Commercial Complex Comembo Commercial Complex, J.P. Rizal Ext. cor. Sampaguita St., Comembo, Makati City
Commerce CenterCommerce Ave. cor. Filinvest Ave., Alabang, Muntinlupa City
Conrad S Maison Mall2F Conrad Hotel, Coral Ave., SM MOA Complex, Pasay City
CHINA BANK OFF-BRANCH ATMs

Directories 227
Shop and Ride 2ATM 2, 248 Gen. Luis St., Brgy. Nova Proper, Novaliches, Quezon City
Shopwise-AntipoloShopwise Bldg., M.L. Quezon St. cor. Circumferential Road, San Roque, Antipolo City
Shopwise-CommonwealthShopwise, Blk 17, Commonwealth Ave., Quezon City
SM Center Las PiñasG/F SM Center Las Piñas, Alabang-Zapote Road, Las Piñas City
SM Center AngonoSM Center Angono, Quezon Ave., Angono, Rizal
SM Hypermarket-Mandaluyong SM Hypermarket Mandaluyong, 121 Shaw Blvd. cor. E. Magalona St., Brgy. Bagong Silang, Mandaluyong City
SM ManilaUGF SM Manila Main Entrance, Natividad A. Lopez cor. Antonio Villegas St., Ermita, Manila
SM Megamall Bldg. BLevel 2 Bldg. B, SM Megamall, EDSA cor. Julia Vargas St., Mandaluyong City
SM MOA HypermarketG/F SM Hypermarket, SM Mall of Asia, Pasay City
SM MOA Seaside Ferry TerminalSM MOA Seaside Blvd. near Esplanade, Pasay City
SM MuntinlupaATM 2 G/F (beside Rear Entrance) SM Muntinlupa, National Road, Brgy. Tunasan, Muntinlupa City
SM Taytay2F Bldg. A, SM Taytay, Manila East Road, Brgy. Dolores, Taytay, Rizal
Solaire Manila 2Entertainment City, Aseana Ave., Tambo, Parañaque City
Solaire Resort & CasinoEntertainment City, Aseana Ave., Tambo, Parañaque City
Southgate MallAlphaland Southgate Mall, EDSA cor. Chino Roces Ave., Makati City
St. Francis SquareBasement 1, St. Francis Square, Doña Julia Vargas Ave. cor. Bank Drive, Ortigas Center, Mandaluyong City
St. Jude CollegeDimasalang St. cor. Don Quijote St., Sampaloc, Manila
St. Luke’s-Quezon CitySt. Luke’s Medical Center,Med. Arts Bldg., E. Rodriguez Sr. Blvd., Quezon City
St. Luke’s-The FortBasement, St. Luke’s Medical Center, 5th Ave., Fort Bonifacio Global City, Taguig City
St. Luke’s-The Fort 2Basement, St. Luke’s Medical Center, 5th Ave., Fort Bonifacio Global City, Taguig City
STI-Delos Santos Medical Center201 E. Rodriguez Sr. Blvd.,Quezon City
Taft-U.N.G/F Times Plaza, T.M Kalaw cor. Gen. Luna St., Ermita, Manila
The A VenueG/F Valdez Site, The A Venue, 7829 Makati Ave., Makati City
TiendesitasTiendesitas, Ortigas Ave. cor. E. Rodriguez Ave., Pasig City
Trinoma 1Level 1 Trinoma, North Ave. cor. EDSA, Quezon City
Trinoma 2Level 1 Trinoma, North Ave. cor. EDSA, Quezon City
Two Shopping CenterTwo Shopping Center, Taft Ave. Ext., 026 Zone 10, Pasay City
Unimart GreenhillsB1 Unimart Greenhills Shopping Center, Ortigas Ave., San Juan
UP Town Center2F UP Town Center, Katipunan Ave., Brgy. UP Campus Diliman,Quezon City
UPM-PGHFaculty Medical Arts Bldg., PGH Compound, Taft Ave., Ermita, Manila
UST-Doctor’s ClinicUniversity of Sto. Tomas Hospital, Vestibule and New Doctor’s Clinic, A.H. Lacson Ave., Sampaloc, Manila
UST HospitalUniversity of Sto. Tomas Hospital, A.H. Lacson Ave., Sampaloc, Manila
UST Hospital 3G/F Clinic Division, University of Sto. Tomas Hospital, A.H. Lacson Ave., Sampaloc, Manila
Victory Central MallATM 2 G/F Victory Central Mall, #717 Old Victory Compound, Rizal Ave., Monumento, Caloocan City
Victory Food Market BaclaranVictory Food Market, Redemptorist Road, Baclaran, Parañaque City
Victory Pasay MallVictory Pasay Mall, Antonio S. Arnaiz Ave., Pasay, Metro Manila
Wack Wack Golf and Country ClubMain Lobby Clubhouse, Wack Wack Golf and Country Club, Shaw Blvd., Mandaluyong City
Walter Mart-MakatiG/F Walter Mart Makati, 790 Chino Roces cor. Antonio Arnaiz, Makati City
Walter Mart-North EDSAWalter Mart Bldg., EDSA, Quezon City
Walter Mart-SucatWalter Mart Sucat, Dr. A. Santos Ave., Brgy. San Isidro, Sucat, Parañaque
Zabarte Town CenterBasement Zabarte Town Center, 588 Camarin Road corner Zabarte Road, Kalookan City
PROVINCIAL
2 Mango Avenue2 Mango Ave.-Solara Bldg., General Maxilom Ave., Cebu City
A. Bonifacio-McDonald’s Baguio Villanueva Bldg., Lower Bonifacio St., Baguio City, Benguet
Abreeza MallAbreeza Mall, J.P. Laurel Ave., Bajada, Davao City, Davao del Sur
Adventist University of the Philippines Adventist University of the Philippines, Sta. Rosa-Tagaytay Road, Puting Kahoy, Silang, Cavite
AG&PAtlantic Gulf & Pacific Company of Manila Inc., Brgy. San Roque, Bauan, Batangas
Alfamart Filinvest TanzaAlfamart Filinvest Tanza, Filinvest Ave., Westwood Place Subd. Ph.2, Brgy. Paradahan, Tanza, Cavite
Alfamart Golden CityMolino-Paliparan Road, Salawag, Dasmariñas City, Cavite
Alfamart Ilang-Ilang TanzaAlfamart Ilang-Ilang Tanza, Ilang-Ilang St., De Roman Subd., Daang Amaya 1, Tanza, Cavite
Alfamart LancasterAlfamart Lancaster, MCS Bldg., Advincula Ave., Alapan II-A, Imus, Cavite
Alfamart L’Paseo Arcade Indang LGF L’Paseo Building, Indang- Trece Martires Road, Indang, Cavite
Alfamart LuminaAlfamart Lumina, Aguinaldo Highway cor. Nueno Ave., Imus, Cavite
Alfamart Pacita ComplexAlfamart, Block 3 Phase 3A, Pacita Complex, San Pedro, Laguna
Alfamart Poblacion RosarioAlfamart Poblacion Rosario, 153 Gen. Trias Drive, Brgy. Poblacion, Rosario, Cavite
Alfamart Trece MartiresCPC Bldg., Governor’s Drive cor. Hugo Perez, Trece Martires, Cavite
Alfamart Villa Catalina DasmariñasLot 6123 Don Placido Campos Avenue, San Agustin, Dasmariñas City, Cavite
Alfamart Yakal Silang CaviteG/F Alfamart Yakal Silang Cavite, 137 Pedro Montoya St. cor. Yakal, Silang, Cavite

China Bank Annual Financial and Sustainability Report 2017228
Allen Avenue CatbaloganCentro Mall, Allen Ave., Brgy. 04, Catbalogan City, Samar
AlwanaNational Highway, Brgy. Cugman, Cagayan de Oro City, Misamis Oriental
Angel SupermarketLuna St. cor. Burgos St., Brgy. Quirino, Solano, Nueva Vizcaya
Angeles University Foundation Medical CenterBasement, Angeles University Foundation Medical Center, McArthur Highway cor. Diego Silang St., Angeles City, Pampanga
Araullo UniversityAraullo University, Maharlika Highway, Brgy. Bitas, Cabanatuan City, Nueva Ecija
Ateneo de Davao UniversityAteneo de Davao University, Roxas Ave., Poblacion District, Davao City, Davao del Sur
Avenue Hotel BacolodAvenue Suites Hotel and Spa, 12th St. cor. Lacson St., Bacolod City, Negros Occidental
Ayala Center CebuLevel 3 ATM 1 Ayala Center Cebu, Cebu Business Park, Cebu City
Budget Wise SupermarketBudget Wise Supermarket, Veterans Ave., Zamboanga City, Zamboanga del Sur
Caltex-SLEX 1South Luzon Expressway-Northbound, Brgy. San Antonio, San Pedro, Laguna
Camayan Beach Resort & HotelCamayan Wharf, West Ilanin Forest Area, Subic Bay Freeport Zone, Olongapo City, Zambales
CB Mall UrdanetaCB Mall, McArthur Highway, Nancayasan, Urdaneta City, Pangasinan
CDO Medical CenterCDO Medical Center Bldg. 2, Tiano Brothers cor. Nacalaban St.,Cagayan de Oro City, Misamis Oriental
Cebu Doctors’ HospitalCebu Doctors’ University Hospital, Osmeña Blvd., Cebu City, Cebu
Cebu Doctors’ UniversityCebu Doctors’ University Hospital, #1 Potenciano Larrazabal Ave., North Reclamation Area, Mandaue City, Cebu
Celebes Coconut ButuanKm 9, Brgy. Taguibo, Butuan City, Agusan Del Norte
Centrio MallG/F Centrio Mall, CM Recto cor. Corrales St., Cagayan de Oro, Misamis Oriental
Clark GatewayClark Gateway Commercial Complex, Gil Puyat Ave., Brgy. San Francisco, Mabalacat, Pampanga
Corpus ChristiCorpus Christi School, Tomas Saco St., Macasandig, Cagayan de Oro City, Misamis Oriental
Davao Adventist HospitalDavao Adventist Hospital, Km. 7 McArthur Highway, Bangkal, Davao City, Davao del Sur
Davao Metro ShuttlePereyras Terminal 1, Magugpo West, Tagum City, Davao Del Norte
Dipolog Center MallDipolog Center Mall, 138 Rizal Ave., Dipolog City, Zamboanga del Norte
DIPSSCORDavao Integrated Port and Stevedoring Services Corporation Bldg., International Port of Davao, Sasa Wharf, Davao City, Davao del Sur
DLSU-DasmariñasCollege of Engineering, DLSU Dasmariñas, Dasmariñas City, Cavite
DLSU-Health Science CampusDe La Salle University Health Science Campus Inc., Congressional Road, Dasmariñas City, Cavite
DLSU MACG/F Medical Arts Centre Bldg., DLSU Medical Center Compound, Congressional Road, Dasmariñas City, Cavite
Eagle Ridge Country ClubClubhouse, Eagle Ridge and Country Club, Brgy. Javalera, Gen. Trias, Cavite
ECCO BuildingG/F ECCO Bldg. (beside unit A) Fil-Am Friendship Highway, Brgy. Anunas, Angeles City, Pampanga
Friendship Supermarket Muñoz NED. Delos Santos St., Science City of Muñoz, Nueva Ecija
Gaisano-Bajada DavaoGaisano Mall of Davao, J.P. Laurel Ave., Bajada, Davao City, Davao del Sur
Gaisano-BuluaGaisano Bulua Mall, Bulua St., Cagayan de Oro City, Misamis Oriental
Gaisano-Cagayan de OroUnit #3 Level 2 Atrium Gaisano Mall, Corrales Extension cor. CM Recto Ave., Cagayan de Oro City, Misamis Oriental
Gaisano-IliganG/F Gaisano Citi Super Mall, Iligan City, Lanao Del Norte
Gaisano-Lapu-Lapu CityGaisano Mactan Island Mall, Pusok, Lapu-Lapu City, Cebu
Gaisano-MasbateGaisano Capital Masbate, Quezon St., Crossing, Masbate City, Masbate
Gaisano-PuertoUnit #1 ATM - 2nd Level Gaisano Puerto, Sayre Highway, Puerto, Cagayan de Oro City, Misamis Oriental
Galeria VictoriaGaleria Victoria Mall, J. P. Rizal St., Poblacion, City of Balanga, Bataan
Golden Prince HotelGolden Prince Hotel & Suites, Acacia St. cor. Archbishop Reyes Ave., Cebu City, Cebu
Good Samaritan HospitalGood Samaritan Compound, Burgos Ave., Cabanatuan City, Nueva Ecija
Grosvenor SquareGrosvenor Square, Josefa St., Angeles City, Pampanga
Holy Angel University 2G/F Holy Angel University Student’s Center, Sto. Rosario St., Angeles City, Pampanga
Jenra MallJenra Grand Mall, Sto. Rosario St., Angeles City, Pampanga
Jollibee-MabalacatATM 2 ATM Center, McArthur Highway, Brgy. San Francisco, Mabalacat City, Pampanga
KCC Mall-GenSanG/F KCC Mall GenSan, J. Catolico Sr. Ave., Gen. Santos City, South Cotabato
KCC Mall de ZamboangaKCC Mall de Zamboanga, Gov. Camins Rd., Camino Nuevo, Zamboanga City, Zamboanga del Sur
KMSCIKidapawan Medical Specialist Center Inc., Sudapin, Kidapawan City, North Cotabato
La Nueva MinglanillaLa Nueva Supermart Inc., Poblacion, Minglanilla, Cebu
La Nueva SupermartLa Nueva Supermart Inc., G.Y. Dela Serna St., Lapu-Lapu, Cebu City, Cebu
LB Supermarket - ZamboangaLB Realty Complex, Veteran’s Ave. Extension, Zamboanga City, Zamboanga Del Sur
LCC PeñarandaLCC Supermarket, Peñaranda cor. Rizal St., Legazpi City, Albay
Lee HypermarketG/F Lee Plaza Hypermart, Jose E. Romero Sr. Ave., Bagacay, Dumaguete City, Negros Oriental
Lee Super PlazaG/F Lee Super Plaza, M. Perdices cor. San Jose St., Dumaguete City, Negros Oriental
LimKetKai MallM4-193B Limketkai Mall, Limketkai Drive, Cagayan de Oro City, Misamis Oriental
Lopue’s East CenterLopue’s East Centre, Burgos St. cor. Carlos Hilado National Highway, Bacolod City, Negros Occidental
Lorma HospitalLorma Medical Center, San Fernando, La Union
Lotus Central MallG/F Lotus Central Mall, Nueno Ave., Imus, Cavite
MAAPMaritime Academy of Asia and the Pacific, Kamaya Point Road, Mariveles, Bataan
Mactan Isla ResortAgus Road, Ibabao, Marigondon, Lapu-Lapu City, Cebu
Mactan Marina MallG/F Mactan Marina Mall, MEPZ 1, Lapu-Lapu City, Cebu
Magic MallG/F Magic Mall, Alexander St., Poblacion, Urdaneta City, Pangasinan
Magic StarmallUGF Magic Star Mall, Romulo Boulevard, Brgy. Cut-Cut 1, Tarlac City, Tarlac
MalolosG/F Graceland Mall, Bulacan State University Grounds, McArthur Highway, Guinhawa, Malolos City, Bulacan
Malta Hospital TorilMalta Hospital Toril, McArthur Highway, Toril, Davao City, Davao del Sur
CHINA BANK OFF-BRANCH ATMs

Directories 229
Maria Reyna HospitalBeside Hospital Entrance/Exit, Maria Reyna Hospital, T.J. Hayes St., Cagayan de Oro City, Misamis Oriental
Mariton Grocery Don DomingoMariton Grocery, Don Domingo, Tuguegarao City, Cagayan
Market CityMarket City Bldg., Bus Terminal, Agora, Cagayan de Oro, Misamis Oriental
Marquee Mall 1G/F Activity Center, Marquee Mall, Aniceto Gueco St., Angeles City, Pampanga
Matina Town SquareG/F Strip Bldg., Matina Town Center, along McArthur Highway, Matina, Davao City, Davao del Sur
MCIA-Departure Check-in SouthwingMactan Cebu International Airport, Lapu-Lapu Airport Road, Lapu-Lapu City, Cebu
MCIA-Domestic Check-in AreaMactan Cebu International Airport, Lapu Lapu Airport Road, Lapu-Lapu City, Cebu
MCIA-Domestic Departure HallMactan Cebu International Airport, Lapu-Lapu Airport Road, Lapu-Lapu City, Cebu
MCIA Domestic ArrivalMactan Cebu International Airport, Lapu-Lapu Airport Road, Lapu-Lapu City, Cebu
Mindanao Sanitarium and HospitalMindanao Sanitarium and Hospital, Tibanga Highway, Iligan City, Lanao del Norte
MJS HospitalManuel J. Santos Hospital, 554 Montilla Blvd., Butuan City, Agusan del Norte
Muzon UptownG/F Muzon Uptown, Brgy. Muzon, San Jose Del Monte, Bulacan
Nagaland E-MallP. Diaz cor. Elias Angeles St., San Francisco, Naga City, Cebu
Nepo Mall-AngelesNepo Mall Angeles, Doña Teresa Ave. cor. St. Joseph St., Nepo Mart Complex, Angeles, Pampanga
Nepo Mall-DagupanG/F Nepo Mall Dagupan, Arellano St., Dagupan City, Pangasinan
Northside Doctors HospitalNorthside Doctors Hospital, Guimod, Bantay, Vigan City, Ilocos Sur
Notre Dame De Chartres HospitalNotre Dame De Chartres Hospital,#25 Gen. Luna Road, Baguio City, Benguet
Nueva Ecija Doctors HospitalNueva Ecija Doctors Hospital, Maharlika Highway, Cabanatuan City, Nueva Ecija
Nuvali Solenad 2G/F Solenad 2 Nuvali, Sta. Rosa-Tagaytay Road, Don Jose, Sta. Rosa, Laguna
Nuvali Solenad 3 Bldg. B G/F Bldg. B Solenad 3 Nuvali, Sta. Rosa-Tagaytay Road, Don Jose, Sta. Rosa, Laguna
Nuvali Solenad Hawkers MarketHawkers Market, Solenad 3 Nuvali, Sta. Rosa-Tagaytay Road, Don Jose, Sta. Rosa, Laguna
Ocean AdventureOcean Adventure, Camayan Wharf, West Ilanin Forest Area, Subic Bay Freeport Zone, Zambales
Orchard Golf and Country ClubGate 2, The Orchard Golf and Country Club Inc., Jose Abad Santos, Dasmariñas City, Cavite
OSPA-Farmers’ Medical CenterOrmoc Sugarcane Planters Association - Farmers Medical Center, Carlota Hills, Brgy. Can-Adieng, Ormoc City, Leyte
Our Lady of the PillarG/F Our Lady of the Pillar Medical Center (near Emergency Room), Tamsui Ave., Bayan Luma II, Imus, Cavite
Pacific Mall 2Pacific Mall Bldg., Landco Business Park, F. Imperial St., Legazpi Port District, Legazpi City
Pangasinan Medical CenterPangasinan Medical Center, Nable St., Dagupan City, Pangasinan
Pavilion MallG/F Bldg. A, Pavilion Mall, Km. 35 Brgy. San Antonio, Biñan, Laguna
Plaza Fina MagalangPlaza Fina, Don Andres Luciano St., Magalang, Pampanga
Porta Vaga MallPorta Vaga Mall, Along Session Road, Baguio City, Benguet
PPL McDonald’s OrmocG/F IAL Building, Burgos St. cor. Rizal St., Ormoc City, Leyte
Prince Hypermart Daanbantayan Prince Hypermart, Poblacion, Daanbantayan, Cebu
Prince Mall of BaybayPrince Town Baybay, Andres Bonifacio cor. Manuel L. Quezon St., Baybay, Leyte
Puregold-DauLot 9 Blk 19 Cosco Building, McArthur Highway, Dau, Mabalacat, Pampanga
Puregold-ObandoPuregold Obando, P. Sevilla St.,Brgy. Catanghalan, Obando, Bulacan
Quickmart Daraga Quickmart Bldg., Rizal St., Daraga, Albay
Rivera Hospital PanaboRivera Medical Center, National Highway, 7302 Brgy. San Francisco, Panabo City, Davao del Norte
Robinsons CalasiaoRobinsons Place Pangasinan, Brgy. San Miguel, Calasiao, Pangasinan
Robinsons GensanG/F Robinsons Gensan, Jose Catolico Sr. Ave., Brgy. Lagao, General Santos City, South Cotabato
Robinsons TagumNational Highway,Tagum, Davao del Norte
Royce HotelRoyce Hotel, Manuel A. Roxas Highway cor. Ninoy Aquino Avenue, Clark Freeport Zone, Mabalacat, Pampanga
Royce Hotel 2Royce Hotel, Manuel A. Roxas Highway cor. Ninoy Aquino Avenue, Clark Freeport Zone, Mabalacat, Pampanga
RPGMC TuguegaraoRonald P. Guzman Medical Center, Enrile Blvd., Carig, Tuguegarao City, Cagayan
SAMULCOSta. Ana Multi-Purpose Cooperative, Bldg. 1, Monteverde St., Davao City, Davao Del Sur
San Fernandino HospitalSan Fernandino Hospital, McArthur Highway, Bo. Dolores, San Fernando, Pampanga
Savewise-PozorrubioSavewise Bldg., Caballero St., Brgy. Cablong, Pozzorubio, Pangasinan
Shopwise-CebuShopwise Bldg., N. Bacalso Ave., Basak, San Nicolas, Cebu City, Cebu
Shopwise-San PedroShopwise, National Highway, Brgy. Landayan, San Pedro, Laguna
Sibalom Municipal AntiqueG/F Sibalom Municipal Hall, Sibalom, Antique
Skyrise RealtyG/F Skyrise IT Bldg., Gorordo Ave. cor. N. Escario St., Cebu City, Cebu
SM BaguioSM Baguio, Luneta Hill, Upper Session Road, Baguio City, Benguet
SM Center Tuguegarao2F SM Center Tuguegarao Downtown, Luna St. cor. Mabini St., Tuguegarao City
SM City BacolodG/F Bldg. A, ATM #3 SM City Bacolod, Reclamation Area, Bacolod City, Negros Occidental
SM City BaliwagG/F SM City Baliwag, Doña Remedios Trinidad Highway, Brgy. Pagala, Baliwag, Bulacan
SM City BatangasSM City Batangas, M. Pastor Ave., Pastor Village, Brgy. Pallocan Kanluran, Batangas City, Batangas
SM City Batangas 2SM City Batangas, M. Pastor Ave., Pastor Village, Brgy. Pallocan Kanluran, Batangas City, Batangas
SM City CabanatuanATM Center, SM City Cabanatuan, Maharlika Highway, Brgy. H. Concepcion, Cabanatuan City, Nueva Ecija
SM City Cagayan De OroATM Center 2, Main Entrance, SM City Cagayan de Oro, Masterson Ave., Cagayan de Oro, Misamis Oriental
SM City CalambaG/F SM City Calamba, National Road, Brgy. Real, Calamba City, Laguna
SM City Calamba 22F SM City Calamba, National Road, Brgy. Real, Calamba City, Laguna

China Bank Annual Financial and Sustainability Report 2017230
SM City Calamba 3SM City Calamba, National Road, Brgy. Real, Calamba City, Laguna
SM City CauayanMaharlika Highway, Brgy. District II, Cauayan City, Isabela
SM City ClarkATM #1 SM City Clark (in-front of Transport Terminal), M. Roxas Highway, CSEZ, Angeles City, Pampanga
SM City Dasmariñas 2G/F SM City Dasmariñas, Governor’s Drive cor. Aguinaldo Highway, Brgy. Sampaloc 1, Dasmariñas, Cavite
SM City General SantosSM City General Santos, Santiago Blvd. cor. San Miguel St., Brgy. Lagao, Gen. Santos City, South Cotabato
SM City LipaATM 2, SM City Lipa, Ayala Highway, Brgy. Maraouy, Lipa City, Batangas
SM City TarlacG/F SM City Tarlac, McArthur Highway, Brgy. San Roque, Tarlac City, Tarlac
SM City DavaoATM Center 1, SM City Davao, Quimpo Blvd. cor. Tulip Drive,Barangay Matina, Davao City, Davao del Sur
SM Lanang PremierUGF SM Lanang Premier, J.P. Laurel Ave., Brgy. San Antonio, Davao City, Davao del Sur
SM LemerySM Center Lemery, Ilustre Avenue, Lemery, Batangas
SM MarilaoG/F SM City Marilao, MacArthur Highway, Marilao, Bulacan
SM Market MallATM 3 SM Market Mall Dasmariñas, Congressional Ave., Dasmariñas Bagong Bayan, Dasmariñas City, Cavite
SM Supercenter MolinoG/F SM Supercenter Molino, Molino Road, Brgy. Molino 4, Bacoor, Cavite
SOCSARGEN County HospitalSocsargen County Hospital, Arradaza St., General Santos City, South Cotabato
South Town Centre TalisaySouth Gate Mall, Tabunok, Talisay, Cebu
Southway MallThe Southway Square Mall, Gov. Lim Ave. cor. La Purisima St., Zamboanga City, Zamboanga del Sur
Sta. Rosa HospitalSta. Rosa Hospital and Medical Center, San Lorenzo Road, Brgy. Balibago, Sta. Rosa, Laguna
Super Metro CarcarNatalio B. Bacalso, National Highway, Carcar City, Cebu
SuperL Phils BacolorAngeles Industrial Park, PEZA, Brgy. Calibutbut, Bacolor, Pampanga
Target Mall 1G/F Target Mall, Sta. Rosa Commercial Complex, Brgy. Balibago, Sta. Rosa, Laguna
Target Mall 2ATM 4 Canopy Area, Target Mall, Sta. Rosa Commercial Complex, Brgy. Balibago, Sta. Rosa, Laguna
The District-DasmariñasG/F The District-Dasmariñas, Molino - Paliparan Road, Dasmariñas City, Cavite
The District-ImusThe District Imus, Aguinaldo Highway cor. Daang Hari Road, Brgy. Anabu II-D, Imus, Cavite
Toyota San NicolasBrgy. 16 San Marcos, San Nicolas, Ilocos Norte
Union Christian CollegeUnion Christian College, Widdoes St., Brgy. II, San Fernando City, La Union
University of Perpetual Help-BiñanDr. Jose Tamayo Medical Bldg., University of Perpetual Help System Laguna, Brgy. Sto. Niño, Biñan, Laguna
University of BaguioUniversity of Baguio, Assumption Road, Baguio City, Benguet
University of BoholUniversity of Bohol, Ma. Clara St., Tagbilaran City, Bohol
University of San CarlosUniversity of San Carlos Main University Bldg., Pantaleon del Rosario St., Cebu City, Cebu
USC-TalambanUSC Talamban Campus, Gov. M. Cuenco Ave., Brgy. Nasipit, Talamban, Cebu City, Cebu
USJR Basak CebuUniversity of San Jose Recoletos Basak, N. Bacalso Ave., Basak Pardo, Cebu City, Cebu
Walter Mart-CabanatuanMaharlika Highway, Brgy. Dicarma, Cabanatuan City, Nueva Ecija
Walter Mart-CalambaG/F Walter Mart Calamba, Real St., Brgy. Real, Calamba City, Laguna
Walter Mart-CarmonaG/F Walter Mart Carmona, Macaria Business Center, Governor’s Drive, Carmona, Cavite
Walter Mart-DasmariñasG/F Walter Mart Dasmariñas,Barrio Burol, Aguinaldo Highway, Dasmariñas City, Cavite
Walter Mart-Gen. TriasG/F Walter Mart General Trias, Governor’s Drive, Barrio Manggahan, Gen. Trias, Cavite
Walter Mart-San FernandoWalter Mart San Fernando, McArthur Highway, Brgy. San Agustin, San Fernando, Pampanga
Walter Mart-Sta. Rosa 1LGF Walter Mart Sta. Rosa, Balibago Road, Brgy. Balibago, Sta. Rosa, Laguna
Walter Mart-Sta. Rosa 2UGF Walter Mart Sta. Rosa, Balibago Road, Brgy. Balibago, Sta. Rosa, Laguna
Walter Mart-Sta. Rosa Bel-AirWalter Mart Bel-Air, Sta. Rosa-Tagaytay Road, Pulong Sta. Cruz, Sta. Rosa, Laguna
Walter Mart-TagaytayG/F Ayala Mall Serin, Tagaytay- Nasugbu Road, Silang Junction South, Tagaytay City, Cavite
Walter Mart-TanauanWalter Mart Tanauan, J.P. Laurel National Highway, Brgy. Darasa, Tanauan, Batangas
Wesleyan UniversityWesleyan University of the Philippines, Mabini St. Extension, Cabanatuan City, Nueva Ecija
WNU STI UniversitySTI West Negros University, Burgos cor. Hilado St., Bacolod City, Negros Occidental
Xavier UniversityG/F Library Annex, Xavier University, Corrales Ave., Cagayan De Oro City, Misamis Oriental
Yashano Mall LegazpiYashano Mall, F. Imperial St.cor. Terminal Rd. 1, Legazpi Port District, Legazpi City, Albay
Yubenco StarmallYubenco Starmall, Maria Clara Lorenzo Lobregat Highway, Putik, Zamboanga City, Zamboanga Del Sur
Yu-Yu Café & Dessert Shoppe TagumNational Highway cor. Quirante II St., Magugpo Poblacion, Tagum City, Davao del Norte
Zamboanga Peninsula Medical CenterZamboanga Peninsula Medical Center, Maria Clara Lorenzo Lobregat Highway, Putik, Zamboanga City, Zamboanga del Sur
CHINA BANK OFF-BRANCH ATMs

Directories 231
BUSINESS OFFICES
CONSUMER BANKING CENTERS
CBG BACOLOD CENTERChina Bank - Bacolod Araneta2/F CBC Bldg., Araneta St.Bacolod CityTel. Nos.: (034) 435-0250 / 435-0647Fax No.: (034) 435-0647Email: [email protected] Head: Jasmin Mae E. De Las Alas
CBG BATANGAS CENTERChina Bank - Batangas City Branch3/F CBC Bldg., P. Burgos St.Batangas CityTel. Nos.: (043) 723-7127 / 723-4294Fax No.: (02) 520-6161Email: [email protected] Head: Evelyn G. Ricardo
CBG CABANATUAN CENTERChina Bank – Cabanatuan, Maharlika Branch2/F CBC Bldg., Brgy. Dicarma, Maharlika HighwayCabanatuan City, Nueva EcijaTel. Nos.: (044) 600-1575/ 4631063Fax No.: (044) 464-0099Email: [email protected] Person: Emilie R. Gatdula
CBG CAGAYAN DE ORO CENTERChina Bank Cagayan de Oro Divisoria Branch2/F CBC Bldg. R.N. Abejuela St.,Divisoria, Cagayan de Oro CityTel. Nos.: (088) 859-1232Fax Nos.: (088) 856-2409Email: [email protected] Head: Joanna Marie G. Garcia (OIC)
CBG CEBU CENTERChina Bank - Cebu Business Park2/F CBC Corporate Center, Samar Loopcor. Panay Road, Cebu Business Park, Cebu CityTel. Nos.: (032) 416-1606; (032) 346-4448 (032) 416-1915; (032) 239-3733Fax No.: (032) 346-4450Email: [email protected] Head: Kinard Hutchinson L. Tan
CBG DAGUPAN CENTERChina Bank - Dagupan-Perez BranchSiapno Bldg., Perez BoulevardDagupan CityTel. No.: (075) 522-8471Fax No.: (075) 522-8472Email: [email protected] Head: Maricris P. Macaranas (OIC)
CBG DAVAO CENTERChina Bank - Davao-Recto Branch2/F CBC Bldg., C.M. Rectocor. J. Rizal Sts., Davao CityTel. Nos.: (082) 226-2103 / (082) 221-4163 (082) 222-5761Fax No.: (082) 222-5021Email: [email protected] Head: Renato C. Sanchez II
CBG ILOILO CENTERChina Bank - Iloilo-Rizal Branch2/F CBC Bldg., Rizal cor. Gomez Sts.Brgy. Ortiz, Iloilo CityTel. Nos.: (033) 336-7918; (033) 503-2845Fax No.: (033) 336-7909Email: [email protected] Head: Marvin D. Celajes
CBG PAMPANGA CENTERChina Bank - San Fernando Branch2/F CBC Bldg., V. Tiomico St.Sto. Rosario Poblacion, City of San FernandoPampangaTel. Nos.: (045) 961-5344; (045) 961-0467Fax No.: (045) 961-8351Email: [email protected] Head: Anthony Ariel C. Vilar (OIC)
WEALTH MANAGEMENT GROUP
MAKATI HEAD OFFICE15/F China Bank Building, 8745 Paseo de Roxascor. Villar Sts., Makati City, Philippines
Angela D. CruzTel. No.: (02) 885-5641Email: [email protected]
Cesaré Edwin M. GarciaTel. No.: (02) 812-5320Email: [email protected]
Therese G. EscolinTel. No.: (02) 885-5693Email: [email protected]
Grace C. SantosTel. No.: (02) 885-5697Email: [email protected]
Eric Von D. BavieraTel. No.: (02) 885-5688Email: [email protected]
Karen W. TuaTel. No.: (02) 885-5643Email: [email protected]
Yvette O. ChuaTel. No.: (02) 885-5691Email: [email protected]
Josefa S. FernandezTel. No.: (02) 230-6985Email: [email protected]
WEALTH MANAGEMENT OFFICES
QUEZON CITY OFFICE82 West Ave., Quezon City
Jaydee Cheng-Tan(02) 426-6980 / [email protected]
Ma. Luisa B. Tan(02) 4414685/ [email protected]
ALABANG OFFICE2/F Unit D CBC Bldg., Acacia Ave.Madrigal Business Park, Ayala AlabangMuntinlupa City
Sheila V. Sarmenta-Dayao(02) 659-2463 / [email protected]
Claire L. Ramirez(02) 659-2464 / [email protected]
Marvin Frederick M. Joel (02) 552-1682/ [email protected]
SAN FERNANDO OFFICE2/F V. Tiomico St., San Fernando City, Pampanga
Ma. Cristina D. Puno(045) 961-0486 / [email protected]
BACOLOD OFFICE2/F CBC Bldg., Bacolod Araneta BranchLacson cor. San Sebastian Sts.Bacolod City
(034) 431-5549 / [email protected]
CEBU OFFICECBC Bldg., Samar Loop cor. Panay RoadCebu Business Park, Cebu City
Eleanor D. Rosales(032) 415-5881; (032) 239-3740 up to [email protected]
Geraldine U. Go (032) 239-3741/[email protected] DAVAO OFFICEKm. 4 McArthur Highway, Matina, Davao City
Mc Queen Benigno-Jamora(082) 297-6268 / [email protected] (082) 297-2335
GREENHILLS OFFICE14 Ortigas Ave., GreenhillsSan Juan, Metro Manila
Ma. Victoria G. Pantaleon(02) 727-7884 / [email protected] Desiree Jade T. Go (02) 727-7645 /[email protected]
BINONDO OFFICE6/F China Bank Bldg., Dasmariñascor. Juan Luna, Binondo, Manila
Irene C. Tanlimco(02) 241-1452 / [email protected]
Genelin U. Yu(02) 247-8341/ [email protected]
KALOOKAN OFFICE167 Rizal Ave. Extension, Kalookan City
Jennifer Y. Macariola(02) 366-8669 / [email protected]
Sheryl Ann C. Hokia(02) 352-3789 / [email protected]
Mary Grace C. Tan(02) 352-3789/ [email protected]

China Bank Annual Financial and Sustainability Report 2017232
China Bank Savings, Inc. (CBS) began operations on September 8, 2008, following the acquisition of Manila Bank by China Bank in 2007. Subsequent mergers with Unity Bank and Planters Development Bank have bolstered CBS as a leading thrift bank in the industry. With 160 branches nationwide and a strong platform for retail banking, auto, housing, teachers, and enterprise finance, CBS is dedicated to servicing the needs of entry-level customers, the broad consumer market, and the strategic Small and Medium Enterprise (SME) sector. CBS is committed to promoting financial inclusiveness and uplifting the quality of life of consumers and entrepreneurs, in line with its Easy Banking for You brand of service.
BOARD OF DIRECTORS
Chairman Ricardo R. Chua
Vice ChairNancy D. Yang
PresidentAlberto Emilio V. Ramos
DirectorsPatrick D. ChengAlexander C. EscuchaRosemarie C. GanJose L. Osmeña, Jr.William C. Whang
Independent DirectorsRoberto F. Kuan Margarita L. San Juan Alberto S. Yao
Acting Corporate SecretaryAtty. Odel C. Janda
SUBSIDIARIES AND AFFILIATE
PresidentAlberto Emilio V. Ramos
Senior Vice PresidentsJose F. AcetreAssets Recovery Group Head
Agerico G. AgustinBranch Banking Group Head
Maria Teresita R. DeanSME Lending Group Head
First Vice PresidentsJan Nikolai M. LimConsumer Lending Group Head
Luis Bernardo A. PuhawanController and Controllership Group
Head
Vice PresidentsJames Christian T. DeeTreasurer and Treasury Head
Sonia B. OstreaCentralized Operations Group Head
Senior Assistant Vice PresidentNiel C. JumawanAutomatic Payroll Deduction (APD)
Lending Group Head
First Vice PresidentsAtty. Odel C. JandaAdonis C. Yap
Vice PresidentsChristian Hermes M. BiteKristine Michele M. ChavezMarjorie T. EsplanaEmmanuel Antonio R. GomezAngel Maria P. IngallaVirgilio I. Libunao, Jr.Alfredo C. Mojica, Jr.Rosalinda T. MunsayacMa. Lilibeth C. ParaderoMatilde M. RamosoJoseph Nestor T. ReyesMaria Consuelo S. RuffyEdmundo D. SinagPablito C. VeloriaAnna Maria P. Ylagan
Senior Assistant Vice PresidentsRaymond C. ApoEmmanuelito M. GomezMary Grace F. GuzmanCharmaine S. HaoRudcen Mark M. IglesiaMyrna G. MendozaCymbeline Margaret T. MirandaJulius Joseph L. RomabilesRaymond Martin C. RosasBrenda SantiagoJay Araceli L. Suria
With Interlocking position in China BankAtty. Aileen Paulette S. De JesusChief Compliance Officer
Marilyn G. YuchenkangChief Audit Executive
Editha N. YoungChief Technology Officer
Hanz Irvin S. YoroInformation Security Head
1
2
4
7
8
6
5
93
1 Alberto Emilio V. Ramos 2 Jose F. Acetre 3 Agerico G. Agustin 4 Maria Teresita R. Dean 5 James Christian T. Dee 6 Niel C. Jumawan 7 Jan Nikolai M. Lim 8 Sonia B. Ostrea 9 Luis Bernardo A. Puhawan
CBS Building, 314 Sen. Gil Puyat Ave., Makati CityTel. No.: (632) 988-9555 www.cbs.com.ph
MANAGEMENT COMMITTEE SENIOR OFFICERS

Directories 233
BOARD OF DIRECTORS
ChairmanRicardo R. Chua
Vice ChairmanRomeo D. Uyan, Jr.
DirectorsRyan Martin L. TapiaWilliam C. WhangAlberto Emilio V. RamosLilian Yu
China Bank Capital Corporation is China Bank‘s investment house subsidiary. China Bank Capital provides a wide range of services that include debt and equity capital raising, corporate finance, financial advisory, and securitization to public and private companies. China Bank Capital has acted as issue manager, arranger, and underwriter in various landmark deals.
China Bank Securities Corporation is the stock brokerage arm of China Bank Capital. China Bank Securities complements China Bank Capital’s equity underwriting activities covering initial and secondary public offerrings in terms of distribution and marketing to retail and institutional clients. China Bank Group’s clients likewise benefit with access to stock brokerage services for stock trading transactions at the Philippine Stock Exchange as well as a suite of research reports on listed companies, industry sectors and markets, in general.
BOARD OF DIRECTORS
ChairmanWilliam C. Whang
Vice ChairmanRomeo D. Uyan, Jr.
Independent DirectorsRoberto F. KuanAlberto S. YaoMargarita L. San Juan
Corporate Secretary and Compliance OfficerDivine Grace F. Dagoy
DirectorsMarisol M. TeodoroRyan Martin L. TapiaLilian Yu
Independent DirectorsRoberto F. KuanAlberto S. Yao
MANAGEMENT TEAM
President Ryan Martin L. Tapia
Managing Director, Treasurer, Coverage and Origination HeadVirgilio O. Chua
DirectorsMaria Angelica C. BalangueMichael L. ChongGrace T. ChuaJuan Paolo E. ColetDivine Grace F. DagoyCharles A. Gamo
MANAGEMENT TEAM
President and Chief Executive OfficerMarisol M. Teodoro
Research DirectorGarie G. Ouano
Treasurer, Corporate Secretary and Business Operations DirectorMary Antonette E. Quiring
Sales and Trading DirectorJulius M. German
1 Ryan Martin L. Tapia 2 Virgilio O. Chua3 Maria Angelica C. Balangue 4 Michael L. Chong 5 Charles A. Gamo 6 Marisol M. Teodoro
1
4
62
5
3
28F BDO Equitable Tower 8751 Paseo de Roxas, Makati City Tel. No.: (632) 885 5798 • Fax No.: (632) 804 1740
28F BDO Equitable Tower8751 Paseo de Roxas, Makati CityTel. No.: (632) 230-6980

China Bank Annual Financial and Sustainability Report 2017234
Chinabank Insurance Brokers, Inc. (CIBI) is a wholly-owned subsidiary of the Bank established on November 3, 1998 as a full service insurance brokerage. It provides direct insurance broking for retail and corporate customers, with a wide and comprehensive range of plans for life and non-life insurance. The life insurance retail products include Whole Life, Endowment, Investment-Linked, Education, Term, and Life Protection with Hospitalization and Critical Illness Cover. Under the Non-Life insurance category, programs forresidential, personal, corporate, and industrial clients are available, with insurance coverages such as Property, Motor, Marine, Accident, and Liability.
President
Julieta P. Guanlao
CBC Properties and Computer Center, Inc. (PCCI ) was created on April 14,1982 to provide computer-related services solely to the China Bank Group. It manages the Bank’s electronic banking and e-commerce requirements, including sourcing, developing and maintaining software and hardware, financial systems, access devices, and networks to foster the safety and soundness of China Bank’s technology infrastructure and keep its processing capabilities in top shape.
General Manager Chief Technology Officer
Phillip M. Tan Editha N. Young
Vice President
Augusto P. Samonte
Senior Assistant Vice Presidents
Joseph Jeffrey B. JavierBenjamin S. SeñiresJoseph T. Yu
Assistant Vice Presidents
Restituto B. BayudanGeorgia Lourdes F. MaogBelinda D. MendozaAriel A. Soner
1 2
54
3
1 Phillip M. Tan 2 Editha N. Young 3 Augusto P. Samonte 4 Julieta P. Guanlao 5 Regina Karla F. Libatique
SUBSIDIARIES AND AFFILIATE
Manulife China Bank Life Assurance Corporation (MCBL) is a strategic alliance between Manulife Philippines and China Bank, providing a wide range of innovative insurance products and services to China Bank and China Bank Savings customers. MCBL aims to ensure that every client receives the best possible solution to meet his or her individual financial and insurance needs. In 2014, China Bank raised its equity stake to 40% in MCBL.
President and Chief Executive Officer
Robert D. Wyld*
Vice President for Bancassurance
Regina Karla F. Libatique
*until April 30, 2018
24/F LKG Tower, 6801 Ayala Ave., Makati CityTel. No.: (632) 884-5433 • Fax No.: (632) 845-0980Customer Care Line: (632) 884-7000E-mail : [email protected]
4/F & 15/F China Bank Building8745 Paseo de Roxas cor. Villar St., Makati CityTel. Nos.: (632) 885-5555; 885-5053885-5060; 885-5051; 885-5052Fax No.: (632) 885-5047; 885-9458
8/F VGP Center, 6772 Ayala Ave.Makati City 1226, PhilippinesTel. No.: (632) 885-5555VGP Center: (632) 751-6000

Directories 235
TRUST SERVICESUnit Investment Trust Funds • China Bank Money Market Fund • China Bank Institutional Money Market Fund • China Bank Short-Term Fund • China Bank Intermediate Fixed Income Fund • China Bank Fixed Income Fund • China Bank Balanced Fund • China Bank Equity Fund • China Bank High Dividend Equity Fund • China Bank Dollar FundWealth Management • Investment Management Arrangement • Personal Management TrustCorporate Trust Services • Escrow Services • Employee Benefit Plan • Collecting and Paying Agency • Facility Agency, Security Trusteeship and
Paying Agency
TREASURY SERVICESPeso-Denominated Government and Corporate
Bond Issues and Perpetual NotesDollar-Denominated Government and Corporate
Bond Issues and Perpetual NotesLTNCDPromissory NotesForeign Exchange • Spot, Forward, and Swaps Derivatives • Interest Rate and Cross Currency Swaps
INSURANCE PRODUCTSBancassurance • Protection
o MCBL Legacy Protect 100 o Base Protect / Base Protect Plus
• Educationo MCBL Invest
• Healtho MCBL Health Choice
• Wealtho Platinum Invest Elite o MCBL Enrich Max o MCBL Affluence Incomeo Affluence Max Elite
• Retiremento MCBL Enricho MCBL Invest
• Group Life InsuranceNon-Life Insurance • Fire Insurance
o Residentialo Commercial §Industrial All-Risk Insurance§Commercial All-Risk Insurance§Condominium Insurance
o Trust Receipts • Motor Car Insurance
o Individualo Fleet Program
• Marine Insuranceo Hull Insuranceo Cargo Insurance
• Engineering Insurance o Contractors All-Risk Insurance
o Electronic Equipment Insuranceo Erectors All-Risk Insuranceo Machinery Breakdown Insuranceo Equipment Floater
• Liability Insuranceo Comprehensive General Liability Insuranceo Product Liability Insuranceo Professional Indemnity Insuranceo Directors and Officers Liability Insurance
• Crime Insuranceo Money, Security & Payroll Insuranceo Fidelity Insuranceo Cyber Crime Insuranceo Kidnap and Ransom Insurance
• Bondso Surety Bonds§Bidders Bond §Surety / Downpayment Bond§Performance Bond§Warranty Bond§Heirs Bond
o Fidelity Bonds • Employee Benefit
o Group Personal Accident Insuranceo Group Life Insuranceo HMOo Travel Insurance
PAYMENT & SETTLEMENT SERVICESElectronic Banking Channels • China Bank Automated Teller Machine (ATM) • China Bank TellerPhone • China Bank Online • Cash Accept Machine • Point-Of-Sale (POS)
CASH MANAGEMENT SOLUTIONSAccount Management via China Bank Online Corporate • Account Portfolio • Transaction History • Checkbook Reorder • Bank Certification Request • Stop Payment Order • Buy Foreign Currency • Sell Foreign Currency • Fund Transfer Own • Fund Transfer Third Party • Outward Remittance • Value Added Services:
o Host-to-Host
Liquidity Management • Multi-Bank SOA Concentration (via China Bank Online
Corporate) • Account Sweeping (via China Bank Online Corporate) • Reverse Account Sweeping (via China Bank Online
Corporate) • SCCP Broker’s Solution • e – SOA in SWIFT MT940 Format
Receivables Management • Automatic Debit Arrangement (ADA) • Check Depot • Bills Pay Plus • Collection Arrangement Report (via China Bank Online
Corporate)
Payables Management • Check Write Plus Outsourced (Manager’s Check or
Corporate Check) • Check Write Plus Software • Corporate Inter-Bank Fund Transfer • Outward Remittance (via China Bank Online Corporate) • Automatic Credit Arrangement (ACA) • Payroll Crediting • China Pay (Payroll Software) • Payroll Processing
POS Solutions • China Debit POS • POS Cash Out
Government Payments and Collections • BIR eTax Payment • eGov Payment
o Social Security System (SSS)o Philippine Health Insurance Corporation (PhilHealth)o Pag-IBIG
• SSS Sickness Maternity and Employee Compensation (SSS SMEC)
CHINA BANK SECURITIESStock Brokerage Securities and Investment Research
DEPOSITS & RELATED SERVICESPeso DepositsChecking
• ChinaCheck PlusSavings
• Passbook Savings• ATM Savings• MoneyPlus Savings• SSS Pensioner’s Account
Time• Regular Time Deposit• Diamond Savings
Foreign Currency Deposits (USD, Euro, and Yuan)• Savings• Time
Cash CardManager’s/Gift Check/Demand DraftSafety Deposit BoxNight Depository ServicesCash Delivery and Deposit Pick-up ServicesOut-of-town Checks
LOANS & CREDIT FACILITIESCorporate Notes and LoansCommercial LoansLoan SyndicationsProject Finance FacilitiesStructured FinancingWorking Capital and Revolving Credit FacilitiesReceivables FactoringConsumer Loans
• HomePlus Real Estate Loans• Contract to Sell Financing• AutoPlus Vehicle Loans• Credit Cards
INTERNATIONAL BANKINGPRODUCTS & SERVICESLetters of CreditStandby Letters of CreditShipping GuaranteeDocuments Against PaymentDocuments Against AcceptanceOpen AccountNegotiation of Export Letter of CreditImport / Export FinanceCustoms and Duties Tax PaymentsAdvising of Letters of Credit and Standby Letters
of CreditTelegraphic Transfer (Domestic and International)Foreign Currency Accounts (Time Deposit and Savings)Foreign Currency LoansForeign Currency Bank DraftsPurchase and Sale of Foreign ExchangeInward and Outward Remittance Service-Domestic
and International
INVESTMENT BANKING SERVICESDebt Financing • Bonds • Syndicated Loan • Corporate Notes • Structured Loan • Project Finance • LTNCD • Short Dated Notes / QB NotesEquity Financing • Initial Public Offering (Common Shares) • Follow On Offering (Common Shares) • Preferred Shares • Convertible/Exchangeable SharesMergers & Acquisition / Financial Advisory / Corporate Restructuring/ Valuation/ Securitization
OVERSEAS KABABAYAN SERVICESChina Bank RemittanceOverseas Kababayan Savings (OKS) AccountChina Bank Money Transfer
PRODUCTS AND SERVICES102-7

China Bank Annual Financial and Sustainability Report 2017236
ANNUAL STOCKHOLDERS’ MEETING
May 3, 2018, Thursday, 4:00 p.m.Penthouse, China Bank Building8745 Paseo de Roxas cor. Villar St.Makati City 1226, Philippines
SHAREHOLDER SERVICES
For inquiries or concerns regarding dividend payments, accountstatus, change of address or lost or damaged stock certificates,please get in touch with:
Stocks and External RelationsOffice of the Corporate SecretaryChina Banking Corporation11/F China Bank Building8745 Paseo de Roxas cor. Villar St.Makati City 1226, Philippines
Contact persons:Atty. Angeli Anne L. Gumpal / Jaime G. Dela Cruz
Tel. No.: (+632) 885-5132; 230-6987Fax No.: (+632) 885-5135Email: [email protected] [email protected]
Stock Transfer Service, Inc.Unit 34-D Rufino Pacific Tower6784 Ayala Ave.Makati City 1226, Philippines
Contact persons:Antonio M. LaviñaRicardo D. Regala, Jr.
Tel. Nos.: (+632) 403-2410; 403-2412; 403-9853Fax No.: (+632) 403-2414
We welcome letters or all such communications on matterspertaining to the management of the Bank, stockholders’ rights, or any other bank-related issues of importance. Stockholders who wish to communicate with any or all of the members of the China Bank Board of Directors may send letters to:
Atty. Corazon I. MorandoVice President and Corporate SecretaryChina Banking Corporation11/F China Bank Building8745 Paseo de Roxas cor. Villar St.Makati City 1226, PhilippinesEmail: [email protected] [email protected] [email protected]
INVESTOR INQUIRIES
We welcome inquiries from investors, analysts, and the financialcommunity. For information about the developmentsat China Bank, please contact:
Alexander C. EscuchaSenior Vice President and HeadInvestor & Corporate Relations GroupChina Banking Corporation28/F BDO Equitable Tower8751 Paseo de RoxasMakati City 1226, PhilippinesTel. No.: (+632) 885-5609Email: [email protected]: www.chinabank.ph
CUSTOMER INFORMATION
We welcome inquiries from customers and other stakeholders.Please contact:
Customer Contact CenterCustomer Experience Management DivisionChina Bank Tellerphone (Available 24/7)Hotline # (632) 88-55-888Domestic Toll-Free #s:1-800-1888-5888 (PLDT)1-800-3888-5888 (Digitel)
Fax No: (632) 519-0143Email: [email protected] Page:www.facebook.com/chinabank.phTwitter Page: www.twitter.com/chinabankph
China Bank Building8745 Paseo de Roxas cor. Villar St.Makati City 1226, Philippines
INVESTOR INFORMATION

237GRI Index
GRI CONTENT INDEX
GRI Standard Disclosure Page Number Omission
GRI 101: Foundation 2016General DisclosuresGRI 102: General Disclosures 2016
Organizational Profile
102-1 Name of the organization 1102-2 Activities, brands, products, and services 1, 17, 235102-3 Location of headquarters 1, 236102-4 Location of operations 1, 212-231102-5 Ownership and legal form 79-80, 118102-6 Markets served 1, 212102-7 Scale of the organization 4-9, 52, 235102-8 Information on employees and other
workers52-56
102-9 Supply chain 16102-10 Significant changes to the organization
and its supply chainThere are no significant changes in the organization and supply chain.
102-11 Precautionary principle or approach 50, 71-78102-12 External initiatives 62
102-13 Membership of associations Trust Officers Association of the Philippines; ACI Philippines; Association of Bank Compliance Officers, Inc.; Association of Bank Remittance Officers, Inc.; Association of Philippine Correspondent Banking Officers, Inc.; Bankers’ Association of the Philippines; Bankers Institute of the Philippines Inc.; Bank Marketing Association of the Philippines; Business Continuity Managers Association of the Philippines; Chamber of Thrift Banks; Credit Card Association of the Philippines; Credit Management Association of the Philippines; Financial Executives of the Philippines; Fund Managers Association of the Philippines; Good Governance Advocates and Practitioners of the Philippines; Information Security Officers Group; Investment House Association of the Philippines; Money Market Association of the Philippines; Philippine Association of National Advertisers; Personnel Management Association; Philippine Business for the Environment; Philippine Payments Management, Inc.; Public Relations Society of the Philippines; UNISDR Private Sector Alliance for Disaster Resilient Societies; Various local business clubs

China Bank Annual Financial and Sustainability Report 2017238
GRI Standard Disclosure Page Number Omission
Strategy102-14 Statement from senior decision-maker 10102-15 Key impacts, risks, and opportunities 10Ethics and Integrity102-16 Values, principles, standards, and norms
of behavior1, 62-78
102-17 Mechanisms for advice and concerns about ethics
62, 74, 76, 77
Governance102-18 Governance structure 69102-19 Delegating authority 65 102-23 Chair of the highest governance body 63102-24 Nominating and selecting the highest
governance body64
102-28 Evaluating the highest governance body’s performance
68
Stakeholder engagement102-40 List of stakeholder groups 48102-41 Collective bargaining agreements 53102-42 Identifying and selecting stakeholders 46
102-43 Approach to stakeholder engagement 48, 57
102-44 Key topics and concerns raised 48, 57
Reporting Practice102-45 Entities included in the consolidated
financial statementsAs listed in Note 1 of Financial Statement: China Bank Insurance Brokers, Inc., CBC Properties and Computer Center, Inc., China Bank Savings, Inc., China Bank Capital Corporation, CBC Assets One, Inc., China Bank Securities Corporation
102-46 Defining report content and topic boundaries
46
102-47 List of material topics 46, 47102-48 Restatements of information There are no restatements of information.102-49 Changes in reporting There are no changes in reporting.102-50 Reporting period i102-51 Date of most recent report i102-52 Reporting cycle i102-53 Contact point for questions regarding the
report 81, 113, 236
102-54 Claims of reporting in accordance with the GRI standards
i
102-55 GRI content index i, 237-240102-56 External assurance This report is not externally assured.

239GRI Index
MATERIAL TOPICS
GRI Standard Disclosure Page Number Omission
GRI 200 Economic Standard Series
Economic PerformanceGRI 103:Management Approach 2016
103-1 Explanation of the material topic and its boundary 47, 49103-2 The management approach and its components 49103-3 Evaluation of the management approach 49
GRI 201: Economic Performance 2016
201-1 Direct economic value generated and distributed 49
Indirect Economic ImpactsGRI 103:Management Approach 2016
103-1 Explanation of the material topic and its boundary 20, 22, 24, 40, 47
103-2 The management approach and its components 20-25, 40-42GRI 203:Indirect Economic Impacts 2016
203-2 Significant indirect economic impacts 20-25, 40-42
Anti-corruptionGRI 103:Management Approach 2016
103-1 Explanation of the material topic and its boundary 47, 76103-2 The management approach and its components 76103-3 Evaluation of the management approach 76
GRI 205:Anti-corruption 2016
205-2 Communication and training about anti-corruption policies and procedures
76
205-3 Confirmed incidents of corruption and actions taken
There are no confirmed incidents of corruption.
GRI 300 Environmental Standard Series
EnergyGRI 103:Management Approach 2016
103-1 Explanation of the material topic and its boundary 47, 50103-2 The management approach and its components 50103-3 Evaluation of the management approach 51
GRI 302:Energy 2016
302-1 Energy consumption within the organization 51302-2 Energy consumption outside of the organization 51
WaterGRI 103:Management Approach 2016
103-1 Explanation of the material topic and its boundary 47, 50103-2 The management approach and its components We continue to enhance
our process and the components.
103-3 Evaluation of the management approach We continue to review our measurements for the succeeding years.
GRI 303:Water 2016
303-1 Water withdrawal by source 50
EmissionsGRI 103:Management Approach 2016
103-1 Explanation of the material topic and its boundary 47, 50103-2 The management approach and its components 50103-3 Evaluation of the management approach 51305-1 Direct (scope 1) GHG emissions No available data yet, but
systems are being put in place for data gathering for the next reporting cycle.
305-2 Energy indirect (scope 2) GHG emissions 51305-3 Other indirect (scope 3) GHG emissions 51

China Bank Annual Financial and Sustainability Report 2017240 GRI Index
GRI Standard Disclosure Page Number Omission
GRI 400 Social Standard SeriesEmploymentGRI 103:Management Approach 2016
103-1 Explanation of the material topic and its boundary 47, 52, 53, 55103-2 The management approach and its components 52, 53, 55103-3 Evaluation of the management approach 52, 55
GRI 401:Employment 2016
401-1 New employee hires and employee turnover 52, 55401-2 Benefits provided to full-time employees that are
not provided to temporary or part-time employees53
Occupational Health and SafetyGRI 103:Management Approach 2016
103-1 Explanation of the material topic and its boundary 47, 54103-2 The management approach and its components 54103-3 Evaluation of the management approach The policies are in place
and we continue to review our evaluation of our programs for a healthy workplace, and to enhance its measurements.
GRI 403:Occupational Health and Safety 2016
403-2 Types of injury and rates of injury, occupational diseases, lost days, absenteeism, and number of work-related fatalities
We are enhancing our tracking system.
Training and EducationGRI 103:Management Approach 2016
103-1 Explanation of the material topic and its boundary 47, 53, 54103-2 The management approach and its components 53, 54103-3 Evaluation of the management approach 53, 54
GRI 404:Training and Education 2016
404-1 Average hours of training per year per employee 53404-2 Programs for upgrading employee skills and
transition assistance programs54
Diversity and Equal OpportunityGRI 103:Management Approach 2016
103-1 Explanation of the material topic and its boundary 47, 52103-2 The management approach and its components 52103-3 Evaluation of the management approach 52
GRI 405:Diversity and Equal Opportunity 2016
405-1 Diversity in governance bodies and employees 52
Local CommunitiesGRI 103:Management Approach 2016
103-1 Explanation of the material topic and its boundary 60103-2 The management approach and its components 60103-3 Evaluation of the management approach 60
GRI 413:Local Communities 2016
413-1 Operations with local community engagement, impact assessments, and development programs
60
Customer PrivacyGRI 103:Management Approach 2016
103-1 Explanation of the material topic and its boundary 47103-2 The management approach and its components 57103-3 Evaluation of the management approach The management
approach is deemed successful since there are no substantiated complaints on breach of customer privacy.
GRI 418: Customer Privacy 2016
418-1 Substantiated complaints concerning breaches of customer privacy and losses of customer data
There were no substantiated complaints on customer privacy breach.


CHINA BANKING CORPORATIONChina Bank Building
8745 Paseo de Roxas corner Villar StreetMakati City 1226, Philippines
www.chinabank.ph
POST-CONSUMER RECOVERED FIBERThe cover of this China Bank Annual Report is printed on Radiance New Evolution White 280gsm. Radiance is an uncoated felt-marked paper that captures the exrtraordinary printing definition and effects of a coated paper, certified by the Forest Stewardship Council (FSC) which promotes environmentally appropriate, socially beneficial, and economically viable management of the world’s forest.
The main report is printed on Limited Edition Fine Smooth 90gsm, 30% Recycled waste and FSC certified fibres. Made carbon neutral, Limited Edition Fine Smooth is produced with the use of 100% wind-generated electricity. All pulps are made elemental chlorine free helping to reduce harmful by-products.
The Financial Statement of this report is printed on FSC certified 9 Lives Recycled Offset 100% Recycled 80gsm that is made from 100% post consumer fiber.