How does financial system efficiency affect the growth impact of FDI in China?
19
China Finance Review International Macro-factors on gold pricing during the financial crisis Wei Fan Sihai Fang Tao Lu Article information: To cite this document: Wei Fan Sihai Fang Tao Lu , (2014),"Macro-factors on gold pricing during the financial crisis", China Finance Review International, Vol. 4 Iss 1 pp. 58 - 75 Permanent link to this document: http://dx.doi.org/10.1108/CFRI-09-2012-0097 Downloaded on: 07 November 2014, At: 00:04 (PT) References: this document contains references to 31 other documents. To copy this document: [email protected] The fulltext of this document has been downloaded 266 times since 2014* Users who downloaded this article also downloaded: Victor Fang, Chien#Ting Lin, Warren Poon, (2007),"An examination of Australian gold mining firms’ exposure over the collapse of gold price in the late 1990s", International Journal of Accounting & Information Management, Vol. 15 Iss 2 pp. 37-49 Scott Sumner, (2001),"Roosevelt, Warren, and the gold-buying program of 1933", Research in Economic History, Vol. 20 pp. 135-172 Edward Everett Hale, (2001),"The problem of monetary standards (1933)", Research in the History of Economic Thought and Methodology, Vol. 19 Part 2 pp. 57-66 Access to this document was granted through an Emerald subscription provided by 367394 [] For Authors If you would like to write for this, or any other Emerald publication, then please use our Emerald for Authors service information about how to choose which publication to write for and submission guidelines are available for all. Please visit www.emeraldinsight.com/authors for more information. About Emerald www.emeraldinsight.com Emerald is a global publisher linking research and practice to the benefit of society. The company manages a portfolio of more than 290 journals and over 2,350 books and book series volumes, as well as providing an extensive range of online products and additional customer resources and services. Emerald is both COUNTER 4 and TRANSFER compliant. The organization is a partner of the Committee on Publication Ethics (COPE) and also works with Portico and the LOCKSS initiative for digital archive preservation. *Related content and download information correct at time of download. Downloaded by Shanghai Jiao Tong University, Ms Huixia Lu At 00:04 07 November 2014 (PT)
Transcript of How does financial system efficiency affect the growth impact of FDI in China?
China Finance Review InternationalMacro-factors on gold pricing during the financial crisisWei Fan Sihai Fang Tao Lu
Article information:To cite this document:Wei Fan Sihai Fang Tao Lu , (2014),"Macro-factors on gold pricing during the financial crisis", ChinaFinance Review International, Vol. 4 Iss 1 pp. 58 - 75Permanent link to this document:http://dx.doi.org/10.1108/CFRI-09-2012-0097
Downloaded on: 07 November 2014, At: 00:04 (PT)References: this document contains references to 31 other documents.To copy this document: [email protected] fulltext of this document has been downloaded 266 times since 2014*
Users who downloaded this article also downloaded:Victor Fang, Chien#Ting Lin, Warren Poon, (2007),"An examination of Australian gold mining firms’exposure over the collapse of gold price in the late 1990s", International Journal of Accounting &Information Management, Vol. 15 Iss 2 pp. 37-49Scott Sumner, (2001),"Roosevelt, Warren, and the gold-buying program of 1933", Research in EconomicHistory, Vol. 20 pp. 135-172Edward Everett Hale, (2001),"The problem of monetary standards (1933)", Research in the History ofEconomic Thought and Methodology, Vol. 19 Part 2 pp. 57-66
Access to this document was granted through an Emerald subscription provided by 367394 []
For AuthorsIf you would like to write for this, or any other Emerald publication, then please use our Emerald forAuthors service information about how to choose which publication to write for and submission guidelinesare available for all. Please visit www.emeraldinsight.com/authors for more information.
About Emerald www.emeraldinsight.comEmerald is a global publisher linking research and practice to the benefit of society. The companymanages a portfolio of more than 290 journals and over 2,350 books and book series volumes, as well asproviding an extensive range of online products and additional customer resources and services.
Emerald is both COUNTER 4 and TRANSFER compliant. The organization is a partner of the Committeeon Publication Ethics (COPE) and also works with Portico and the LOCKSS initiative for digital archivepreservation.
*Related content and download information correct at time of download.
Dow
nloa
ded
by S
hang
hai J
iao
Ton
g U
nive
rsity
, Ms
Hui
xia
Lu
At 0
0:04
07
Nov
embe
r 20
14 (
PT)
Macro-factors on gold pricingduring the financial crisis
Wei FanSchool of Public, Policy and Management, Tsinghua University, Beijing, China
Sihai FangSchool of Economics and Management,
University of Electronic Science and Technology of China, Chengdu, China, and
Tao LuSchool of Engineering,
Hong Kong University of Science and Technology, Hong Kong
Abstract
Purpose – This study aims to propose the idea of which macro-factors and how the macro-factorsimpact on the gold price.
Design/methodology/approach – An EGARCH model is applied to test the volatility of gold price.A VAR method is applied to validate the idea by decomposing gold’s value into three parts accordingto its features.
Findings – Three macro-factors have significant impact on the gold’s price. The USDX index isnegatively correlated with the gold price, while the CRB index and the US Treasury CDS spreads arepositively correlated with the gold price. In particular, it is found that the one-lagged CRB index, one-laggedUSDX index, and two-lagged US Treasury CDS spreads have significant impact on the gold price.
Research limitations/implications – The findings in this study suggest a normal case of the goldprice. However, in particular cases, new models or new parameters may need to be introduced.
Practical implications – This paper bridges the gap between theory and practice on the goldpricing model. The three-factor model can be used for trading in the field of gold investment.
Originality/value – This paper provides a composite idea for investors and researchers to study thegold price.
Keywords Financial crisis, Gold, Macro-factors
Paper type Research paper
1. IntroductionGold, as a special commodity and a historical currency, is largely reserved by mostcentral banks. A growing number of investors take gold as an underlying investmentinstrument, especially during the financial crisis. For example, the gold ETF-SPDRholds more than 1,000 tons gold, which is more than many central banks. Moreover,gold influences the discount-factor of asset prices, by driving the risk premium. Thus,gold has great impact on the stock market, bond market, currency market andcommodity market. The financial crisis started from US boosted the gold price andrisk-free asset. However, it depressed the risky asset, such as stocks.
The multiple properties of gold make it more complicated to price gold than otherordinary commodities. During the first stage of the financial crisis, the gold price is not
The current issue and full text archive of this journal is available at
www.emeraldinsight.com/2044-1398.htm
JEL classification – E44, F31, G12
China Finance Review InternationalVol. 4 No. 1, 2014pp. 58-75q Emerald Group Publishing Limited2044-1398DOI 10.1108/CFRI-09-2012-0097
CFRI4,1
58
Dow
nloa
ded
by S
hang
hai J
iao
Ton
g U
nive
rsity
, Ms
Hui
xia
Lu
At 0
0:04
07
Nov
embe
r 20
14 (
PT)
simply determined by the supply and demand of gold products, but a comprehensiveresult of its special features as a commodity, a currency and a hedging instrument.Since the August 2007, gold has demonstrated its significant hedging and currencyproperties. As a result, the gold price distinctly departed from ordinary commoditiessuch as crude oil and copper, which attracts the investors’ attention globally.
In order to properly price gold, we decompose gold’s value into three parts: thecommodity value, the currency value and the risk premium value. We choose the CRBindex, the USDX index, and the US Treasury CDS spreads as the proxy variables in ourvector auto regression (VAR) model. As a result, we find that the USDX index isnegatively correlated with the gold price, while the CRB index and the US Treasury CDSspreads are positively correlated with the gold price. In particular, it is found that theone-lagged CRB index, one-lagged USDX index, and two-lagged US Treasury CDSspreads have significant impact on the gold price. Further, we statistically find that thevolatility of gold price has properties of clustering and long memory, but no asymmetry.
The paper is organized as follows. In Section 2, we give a comprehensive literaturereview. In Section 3, we describe the price and volatility of gold during the first stage ofthe financial crisis. In Section 4, we discuss the relationship between the gold price andthe CRB index, the USDX index, and the US Treasury CDS spreads. In Section 5, theimpact of the three macro-factors on the gold price is studied by applying the VARmethod. Finally, we summarize and conclude in Section 6.
2. Literature reviewAs a currency in history and an important asset in modern capital market, goldremains a hot topic in both literature and industry. Lots of research and study has beendone, not only focusing on its price, but also on its impact to foreign exchange rate andcapital market, etc.
As an important raw material source for the jewellery industry, manufacturing andmodern high-tech industry, gold has the attribute of commodity: disinflation. Thecommodity attribute provides a benchmark to measure the value of gold. Kennedy (2002)believes that there is a very strong positive correlation between gold and inflation. In theinitial stage of inflation, the rise of gold price was much less than the rise of othercommodities, but in later stage it will exceed other commodities and achieve its function ofdisinflation. Kennedy did not explain the reasons. In our opinion, there is usually arelatively strong economic growth in the initial stage of inflation. Because of the industrialapplications, other commodities (such as oil, copper, etc.) will have stronger demand thangold. As a result the rise of gold price will be less than other commodities. However, in laterstage of inflation, the growth of real economy has declined and demands for oil and copperbegins to slow down, leading to stagflation; under the fears of recession of the realeconomy, gold’s hedging property strengthens, therefore its price continues to rise whileoil and copper start to depreciate. This is proved by Blose (2009). Blose points out thatmany scholars encouraged investors to buy gold for hedging in the period of inflation,because they believe that the gold price reflects the inflation level. Some scholars even tookgold price as a substitute variable of inflation in their empirical researches.
Besides, gold has currency feature. Even though it is no longer currency, goldremains potential alternative of paper-money in the modern credit currencysystem because of its currency history. There is a subtle relationship between goldand US dollar. From the perspective of exchange rate, Sjaastad and Scacciavillani (1996)
Macro-factorson gold pricing
59
Dow
nloa
ded
by S
hang
hai J
iao
Ton
g U
nive
rsity
, Ms
Hui
xia
Lu
At 0
0:04
07
Nov
embe
r 20
14 (
PT)
study the influence of the exchange rate on gold price with the data from 1982 to 1990.They show out that the exchange rate is an important factor that affects the gold price.Since the collapse of Bretton Woods system, the exchange rate has become the mostimportant factor which drives the fluctuations of gold price. In particular, the exchangerate[1] in European countries has more significant impact on the gold price. In 2008,Sjaastad studied the same subject again with the updated data from January 1991 to June2004. The new study has finds that the exchange rate of euro is no longer the key factorwhich affects the gold price, but the exchange rate of US dollar against euro and Japaneseyen has significant influence on the gold price. Sjaastad (2008) also finds that the exchangerate of major gold producing countries (South Africa, Russia and Australia) does not havesignificant impact on the gold price, which indicates that gold is not a simple commoditydetermined by supply-demand relationship, moreover an implicit global currency. In thefollowing sections, we will further investigate the currency feature of gold.
The investment properties of gold are determined by its natural quality andcurrency attribute. Gold, which has come down from the altar, is still a popular specialcommodity and investment underlying around the world, shines from time to timeduring the financial crisis. In the past few years, the gold price has doubled, evenreaching a peak of $1,900 per oz. However, Goldman Sachs and other internationalinvestment banks think that, due to its scarcity, the gold price will continue to rise and$1,900 per oz is not the final price. The investigation in this aspect concentrates on theeffect of gold in improving the return/risk structure of a portfolio, the relationshipbetween gold and stock, and the relationship between gold and other precious metals.
In addition, numerous scholars are enthusiastic about the research on therelationship between gold price and stock index. Aggarwal and Soenen (1988) find thatthere is positive and relatively weak correlation between gold and stock index.Carter et al. (1982), Blose and Shieh (1995), Larsen and McQueen (1995) and McCownand Zimmerman (2006) address that the gold price has a non-significant relationshipwith stock price. Blose (1996) discusses that the gold price has a negative correlationwith the stock market. Based on the aforementioned research, Baur and Lucey (2006)recognize that the gold price has some relationship with the stock market, though ofnot inevitably causal. Therefore, different sample data produces different relationshipbetween gold and stock market.
With respect to the role of gold in portfolios, Jaffe (1989) argues that a portfolioincluding gold has an improved return/risk structure. Hiller and Faff (2006) includesgold assets in the stock index assets (including SP500 and EAFE) from 1976 to 2004and optimizes the return of the portfolio, finding that gold accounts for 9.5 percent inthe portfolio. Fan and Song (2009) and Fan (2009) discuss that the return/risk ofportfolios including gold can be improved based on the mean-var model. They usehistorical return, historical volatility, GARCH model volatility and Sharpe index toconduct the comparative analysis on the return, risk and risk premium of variousassets through the data from 2003 to 2009, finding that gold accounts for about16 percent in the optimal portfolio.
With respect to the relationship between gold and other precious metals, manyscholars focus on the study of the relationship between gold and silver. Both have everbeen monetary standards and have similar characteristics. After testing the pricecorrelation between gold and silver, Wahab et al. (1994) find that both show a strongpositive correlation in daily data of future price or spot price. Using monthly data to
CFRI4,1
60
Dow
nloa
ded
by S
hang
hai J
iao
Ton
g U
nive
rsity
, Ms
Hui
xia
Lu
At 0
0:04
07
Nov
embe
r 20
14 (
PT)
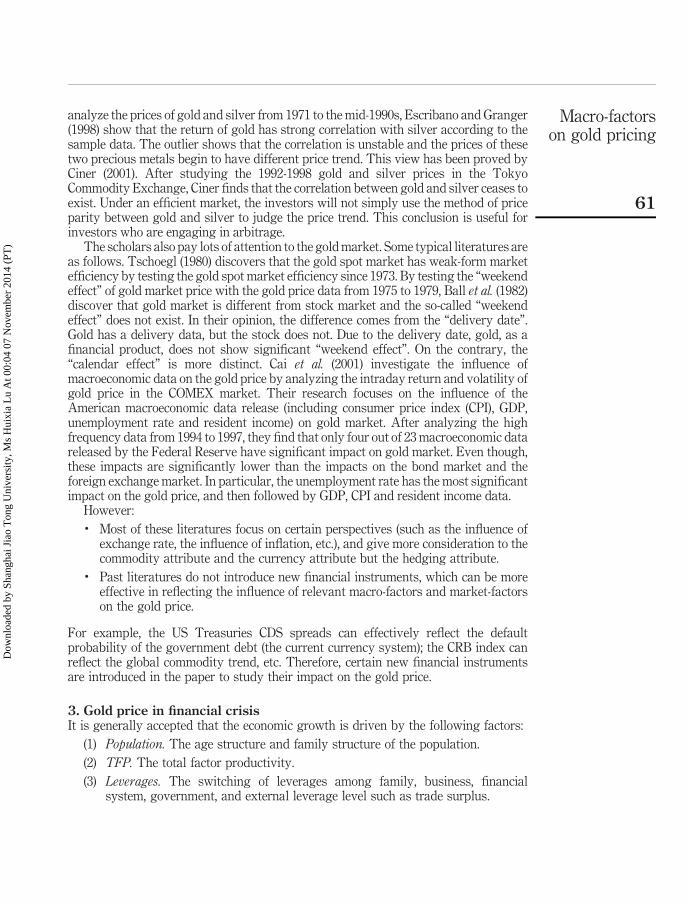
analyze the prices of gold and silver from 1971 to the mid-1990s, Escribano and Granger(1998) show that the return of gold has strong correlation with silver according to thesample data. The outlier shows that the correlation is unstable and the prices of thesetwo precious metals begin to have different price trend. This view has been proved byCiner (2001). After studying the 1992-1998 gold and silver prices in the TokyoCommodity Exchange, Ciner finds that the correlation between gold and silver ceases toexist. Under an efficient market, the investors will not simply use the method of priceparity between gold and silver to judge the price trend. This conclusion is useful forinvestors who are engaging in arbitrage.
The scholars also pay lots of attention to the gold market. Some typical literatures areas follows. Tschoegl (1980) discovers that the gold spot market has weak-form marketefficiency by testing the gold spot market efficiency since 1973. By testing the “weekendeffect” of gold market price with the gold price data from 1975 to 1979, Ball et al. (1982)discover that gold market is different from stock market and the so-called “weekendeffect” does not exist. In their opinion, the difference comes from the “delivery date”.Gold has a delivery data, but the stock does not. Due to the delivery date, gold, as afinancial product, does not show significant “weekend effect”. On the contrary, the“calendar effect” is more distinct. Cai et al. (2001) investigate the influence ofmacroeconomic data on the gold price by analyzing the intraday return and volatility ofgold price in the COMEX market. Their research focuses on the influence of theAmerican macroeconomic data release (including consumer price index (CPI), GDP,unemployment rate and resident income) on gold market. After analyzing the highfrequency data from 1994 to 1997, they find that only four out of 23 macroeconomic datareleased by the Federal Reserve have significant impact on gold market. Even though,these impacts are significantly lower than the impacts on the bond market and theforeign exchange market. In particular, the unemployment rate has the most significantimpact on the gold price, and then followed by GDP, CPI and resident income data.
However:. Most of these literatures focus on certain perspectives (such as the influence of
exchange rate, the influence of inflation, etc.), and give more consideration to thecommodity attribute and the currency attribute but the hedging attribute.
. Past literatures do not introduce new financial instruments, which can be moreeffective in reflecting the influence of relevant macro-factors and market-factorson the gold price.
For example, the US Treasuries CDS spreads can effectively reflect the defaultprobability of the government debt (the current currency system); the CRB index canreflect the global commodity trend, etc. Therefore, certain new financial instrumentsare introduced in the paper to study their impact on the gold price.
3. Gold price in financial crisisIt is generally accepted that the economic growth is driven by the following factors:
(1) Population. The age structure and family structure of the population.
(2) TFP. The total factor productivity.
(3) Leverages. The switching of leverages among family, business, financialsystem, government, and external leverage level such as trade surplus.
Macro-factorson gold pricing
61
Dow
nloa
ded
by S
hang
hai J
iao
Ton
g U
nive
rsity
, Ms
Hui
xia
Lu
At 0
0:04
07
Nov
embe
r 20
14 (
PT)

The superposition of the above three factors drives the macroeconomic cycles. Thesecond item and third one are closely related. In general, the TFP will be depressedwhen the government increases leverage. Chen and Zheng (2011) state that the highfinancial leverage in modern economy is the offender of the global financial crisis.
The global financial crisis was divided into four stages by the switching of theleverages. In the first stage, from August 2007 to June 2009, the US financial systemwas deleveraging. In the second stage, the US Government added leverage byquantitative easing (QE). In February 2010, the European Sovereign debt crisis startedthe third stage, when the European countries were deleveraging. In September 2011,the US federal reserve applied operation twist (OT) instead of QE3 (the 3rd roundquantitative easing). It symbolized the beginning of the fourth stage.
In the first stage, global economy and financial market changed dramatically.All kinds of asset prices fluctuate intensively. As an important class of asset, golddraws a lot of investors’ attention. The gold price becomes an important marketindicator which measures the risk degree and the risk premium during the financialcrisis. In this article, we analyze the market data of gold price from August 1, 2007 toJune 30, 2009. The reason is that this period is typically known as the first stage offinancial crisis began from American.
In comparison to the performance of NYMEX crude oil and LME copper (Figures 1and 2), gold’s commodity property is weakened while its currency property isstrengthened. When commodity prices fell sharply in the second half of 2008, the goldprice appeared to be defensive; when the commodity prices rebounded in the first halfof 2009, the gold price remained stable. The statistics in Table I shows that the returnof gold price during financial crisis was positive, with an average daily return rate ashigh as 0.05 percent; while the return of crude oil and copper were negative, theaverage daily return rate were 20.02 and 20.09 percent, respectively. It indicates thatthe gold performed much better than the crude oil and copper during the first stage ofthe financial crisis period. Especially for the volatilities during the financial crisisperiod, the annual volatilities of crude oil and copper were as high as 57.97 and45.50 percent, respectively. However, the volatility of gold price was only 26.81 percent,which is about half of the crude oil and copper. Thus, the gold price was relativelystable during the first stage of the financial crisis.
Figure 1.Gold and NYMEXcrude oil
Gold and NYMEX Crude Oil
0200400600800
1,0001,200
2007
-8-1
2007
-9-3
2007
-10-
4
2007
-11-
6
2007
-12-
7
2007
-1-1
0
2008
-2-1
2
2008
-3-1
4
2008
-4-1
6
2008
-5-1
9
2008
-6-2
0
2008
-6-2
3
2008
-7-2
4
2008
-8-2
6
2008
-9-2
9
2008
-10-
30
2008
-12-
2
2009
-1-6
2009
-2-9
2009
-3-1
2
2009
-4-1
5
2009
-5-1
8
2009
-6-1
8
30
50
70
90
110
130
150
Gold NYMEX Crude Oil (right axis)
CFRI4,1
62
Dow
nloa
ded
by S
hang
hai J
iao
Ton
g U
nive
rsity
, Ms
Hui
xia
Lu
At 0
0:04
07
Nov
embe
r 20
14 (
PT)
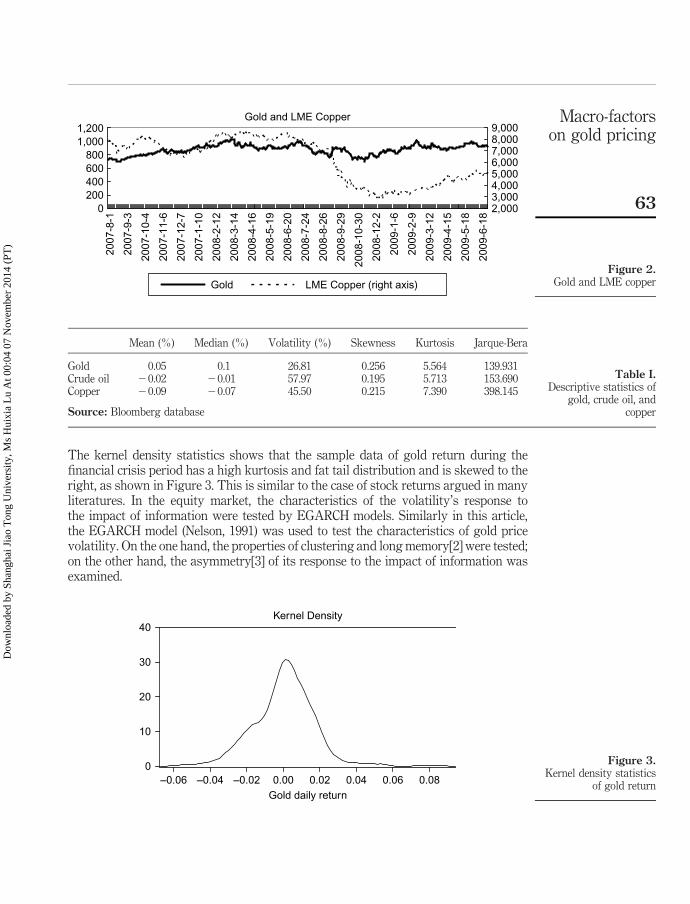
The kernel density statistics shows that the sample data of gold return during thefinancial crisis period has a high kurtosis and fat tail distribution and is skewed to theright, as shown in Figure 3. This is similar to the case of stock returns argued in manyliteratures. In the equity market, the characteristics of the volatility’s response tothe impact of information were tested by EGARCH models. Similarly in this article,the EGARCH model (Nelson, 1991) was used to test the characteristics of gold pricevolatility. On the one hand, the properties of clustering and long memory[2] were tested;on the other hand, the asymmetry[3] of its response to the impact of information wasexamined.
Figure 2.Gold and LME copper
Gold and LME Copper
0200400600800
1,0001,200
2,0003,0004,0005,0006,0007,0008,0009,000
Gold LME Copper (right axis)
2007
-8-1
2007
-9-3
2007
-10-
4
2007
-11-
6
2007
-12-
7
2007
-1-1
0
2008
-2-1
2
2008
-3-1
4
2008
-4-1
6
2008
-5-1
9
2008
-6-2
0
2008
-7-2
4
2008
-8-2
6
2008
-9-2
9
2008
-10-
30
2008
-12-
2
2009
-1-6
2009
-2-9
2009
-3-1
2
2009
-4-1
5
2009
-5-1
8
2009
-6-1
8
Mean (%) Median (%) Volatility (%) Skewness Kurtosis Jarque-Bera
Gold 0.05 0.1 26.81 0.256 5.564 139.931Crude oil 20.02 20.01 57.97 0.195 5.713 153.690Copper 20.09 20.07 45.50 0.215 7.390 398.145
Source: Bloomberg database
Table I.Descriptive statistics of
gold, crude oil, andcopper
Figure 3.Kernel density statistics
of gold return
0
10
20
30
40
–0.06 –0.04 –0.02 0.00 0.02 0.04 0.06 0.08
Gold daily return
Kernel Density
Macro-factorson gold pricing
63
Dow
nloa
ded
by S
hang
hai J
iao
Ton
g U
nive
rsity
, Ms
Hui
xia
Lu
At 0
0:04
07
Nov
embe
r 20
14 (
PT)
Applying the EGARCH (1,1) model to the volatility, we get the model as follows:
rt ¼ mþ 1t; ð1Þ
1t ¼ stZ t; Zt , N ð0; 1Þ; ð2Þ
lns 2t ¼ cþ a
1t21
st21
��������þ l
1t21
st21þ b lns 2
t21; ð3Þ
where rt indicates the return of gold price during interval t in the mean equation (1). rthasa constant mean m. In the variance equation (3), a, l, bmeasure innovation, asymmetry,and persistence, respectively. The EGARCH model describes the asset volatility verywell. It weights the most recent price changes, and takes the asymmetry of volatility intoconsideration. The asymmetry measures the difference between the impact to thefluctuation caused by good and bad information. Applying the market gold price databetween August 2007 and June 2009, we get the EGARCH (1, 1) model of gold as follows:
rt ¼ 0:00071 þ 1t
ð0:312Þ ½4�ð4Þ
lns 2t ¼
20:241þ
ð0:002Þ
0:088 1t21
st21
������2
ð0:003Þ
0:028 1t21
st21þ
ð0:137Þ
0:978 lns 2t21
ð0:000Þð5Þ
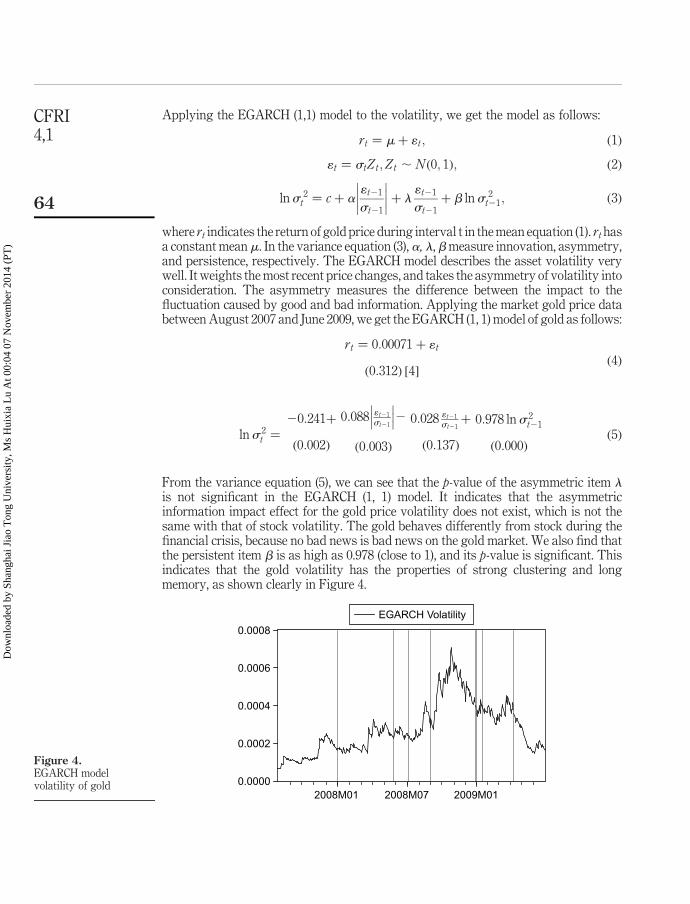
From the variance equation (5), we can see that the p-value of the asymmetric item lis not significant in the EGARCH (1, 1) model. It indicates that the asymmetricinformation impact effect for the gold price volatility does not exist, which is not thesame with that of stock volatility. The gold behaves differently from stock during thefinancial crisis, because no bad news is bad news on the gold market. We also find thatthe persistent item b is as high as 0.978 (close to 1), and its p-value is significant. Thisindicates that the gold volatility has the properties of strong clustering and longmemory, as shown clearly in Figure 4.
Figure 4.EGARCH modelvolatility of gold 0.0000
0.0002
0.0004
0.0006
0.0008
2008M01 2008M07 2009M01
EGARCH Volatility
CFRI4,1
64
Dow
nloa
ded
by S
hang
hai J
iao
Ton
g U
nive
rsity
, Ms
Hui
xia
Lu
At 0
0:04
07
Nov
embe
r 20
14 (
PT)
4. Motivation and variables4.1 MotivationThis paper is based on two motivations. First, with the further development offinancial market, a growing number of new financial products and new indices arecreated to reflect certain macro-factors which were difficult to measure directly in thepast. For example, the CDS spreads can directly reflect the underlying credit defaultprobability. The US Treasury CDS spreads can effectively reflect the defaultprobability of current international currency system and the credit currency system.Second, the further development of financial market strengthens the efficiency ofvarious financial assets, including the foreign exchange market, the fixed incomemarket, the commodity market, and the stock market, etc. Because assets prices reflectthe information of real economy and macroeconomic policies, the assets prices arecorrelated with each other. Sometimes one asset is a driver of another.
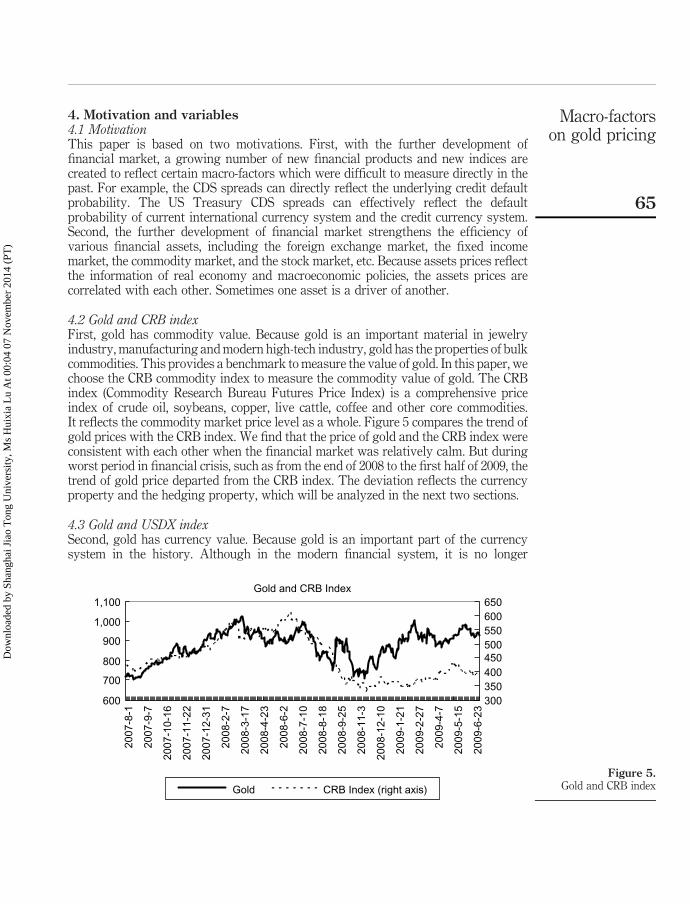
4.2 Gold and CRB indexFirst, gold has commodity value. Because gold is an important material in jewelryindustry, manufacturing and modern high-tech industry, gold has the properties of bulkcommodities. This provides a benchmark to measure the value of gold. In this paper, wechoose the CRB commodity index to measure the commodity value of gold. The CRBindex (Commodity Research Bureau Futures Price Index) is a comprehensive priceindex of crude oil, soybeans, copper, live cattle, coffee and other core commodities.It reflects the commodity market price level as a whole. Figure 5 compares the trend ofgold prices with the CRB index. We find that the price of gold and the CRB index wereconsistent with each other when the financial market was relatively calm. But duringworst period in financial crisis, such as from the end of 2008 to the first half of 2009, thetrend of gold price departed from the CRB index. The deviation reflects the currencyproperty and the hedging property, which will be analyzed in the next two sections.
4.3 Gold and USDX indexSecond, gold has currency value. Because gold is an important part of the currencysystem in the history. Although in the modern financial system, it is no longer
Figure 5.Gold and CRB index
Gold and CRB Index
600
700
800
900
1,000
1,100
2007
-8-1
2007
-9-7
2007
-10-
16
2007
-11-
22
2007
-12-
31
2008
-2-7
2008
-3-1
7
2008
-4-2
3
2008
-6-2
2008
-7-1
0
2008
-8-1
8
2008
-9-2
5
2008
-11-
3
2008
-12-
10
2009
-1-2
1
2009
-2-2
7
2009
-4-7
2009
-5-1
5
2009
-6-2
3
300350400450500550600650
Gold CRB Index (right axis)
Macro-factorson gold pricing
65
Dow
nloa
ded
by S
hang
hai J
iao
Ton
g U
nive
rsity
, Ms
Hui
xia
Lu
At 0
0:04
07
Nov
embe
r 20
14 (
PT)
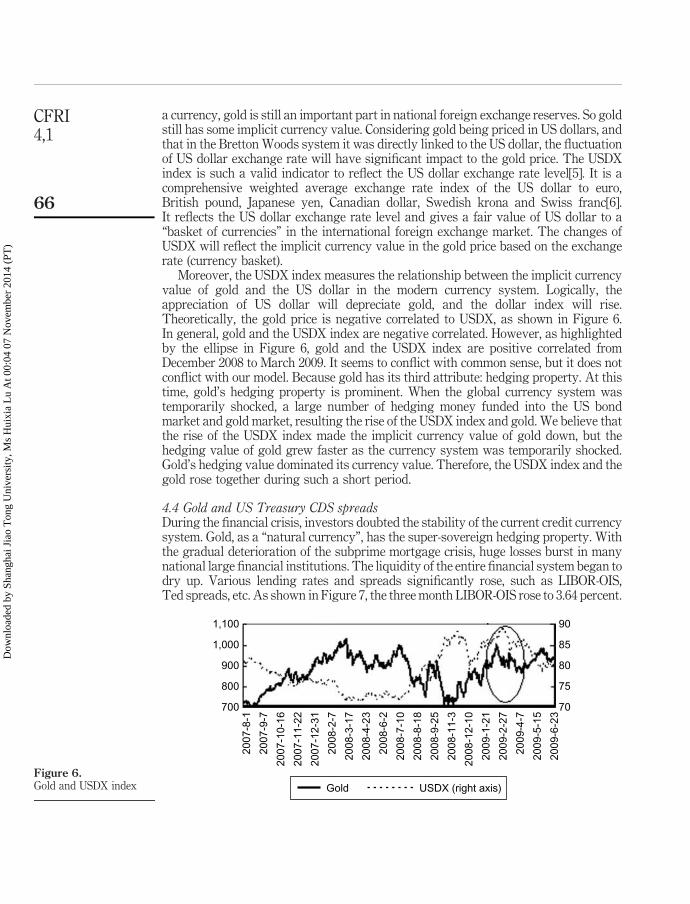
a currency, gold is still an important part in national foreign exchange reserves. So goldstill has some implicit currency value. Considering gold being priced in US dollars, andthat in the Bretton Woods system it was directly linked to the US dollar, the fluctuationof US dollar exchange rate will have significant impact to the gold price. The USDXindex is such a valid indicator to reflect the US dollar exchange rate level[5]. It is acomprehensive weighted average exchange rate index of the US dollar to euro,British pound, Japanese yen, Canadian dollar, Swedish krona and Swiss franc[6].It reflects the US dollar exchange rate level and gives a fair value of US dollar to a“basket of currencies” in the international foreign exchange market. The changes ofUSDX will reflect the implicit currency value in the gold price based on the exchangerate (currency basket).
Moreover, the USDX index measures the relationship between the implicit currencyvalue of gold and the US dollar in the modern currency system. Logically, theappreciation of US dollar will depreciate gold, and the dollar index will rise.Theoretically, the gold price is negative correlated to USDX, as shown in Figure 6.In general, gold and the USDX index are negative correlated. However, as highlightedby the ellipse in Figure 6, gold and the USDX index are positive correlated fromDecember 2008 to March 2009. It seems to conflict with common sense, but it does notconflict with our model. Because gold has its third attribute: hedging property. At thistime, gold’s hedging property is prominent. When the global currency system wastemporarily shocked, a large number of hedging money funded into the US bondmarket and gold market, resulting the rise of the USDX index and gold. We believe thatthe rise of the USDX index made the implicit currency value of gold down, but thehedging value of gold grew faster as the currency system was temporarily shocked.Gold’s hedging value dominated its currency value. Therefore, the USDX index and thegold rose together during such a short period.
4.4 Gold and US Treasury CDS spreadsDuring the financial crisis, investors doubted the stability of the current credit currencysystem. Gold, as a “natural currency”, has the super-sovereign hedging property. Withthe gradual deterioration of the subprime mortgage crisis, huge losses burst in manynational large financial institutions. The liquidity of the entire financial system began todry up. Various lending rates and spreads significantly rose, such as LIBOR-OIS,Ted spreads, etc. As shown in Figure 7, the three month LIBOR-OIS rose to 3.64 percent.
Figure 6.Gold and USDX index
85
90
80
70
75
1,000
900
800
700
2007
-8-1
2007
-9-7
2007
-10-
16
2007
-11-
22
2007
-12-
31
2008
-2-7
2008
-3-1
7
2008
-4-2
3
2008
-6-2
2008
-7-1
0
2008
-8-1
8
2008
-9-2
5
2008
-11-
3
2008
-12-
10
2009
-1-2
1
2009
-2-2
7
2009
-4-7
2009
-5-1
5
2009
-6-2
3
1,100
Gold USDX (right axis)
CFRI4,1
66
Dow
nloa
ded
by S
hang
hai J
iao
Ton
g U
nive
rsity
, Ms
Hui
xia
Lu
At 0
0:04
07
Nov
embe
r 20
14 (
PT)
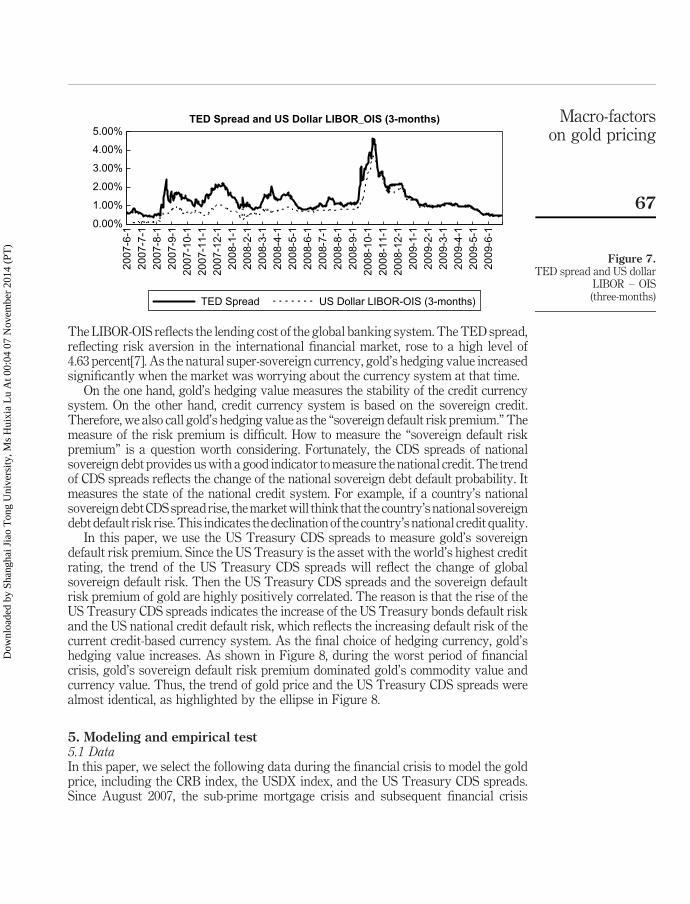
The LIBOR-OIS reflects the lending cost of the global banking system. The TED spread,reflecting risk aversion in the international financial market, rose to a high level of4.63 percent[7]. As the natural super-sovereign currency, gold’s hedging value increasedsignificantly when the market was worrying about the currency system at that time.
On the one hand, gold’s hedging value measures the stability of the credit currencysystem. On the other hand, credit currency system is based on the sovereign credit.Therefore, we also call gold’s hedging value as the “sovereign default risk premium.” Themeasure of the risk premium is difficult. How to measure the “sovereign default riskpremium” is a question worth considering. Fortunately, the CDS spreads of nationalsovereign debt provides us with a good indicator to measure the national credit. The trendof CDS spreads reflects the change of the national sovereign debt default probability. Itmeasures the state of the national credit system. For example, if a country’s nationalsovereign debt CDS spread rise, the market will think that the country’s national sovereigndebt default risk rise. This indicates the declination of the country’s national credit quality.
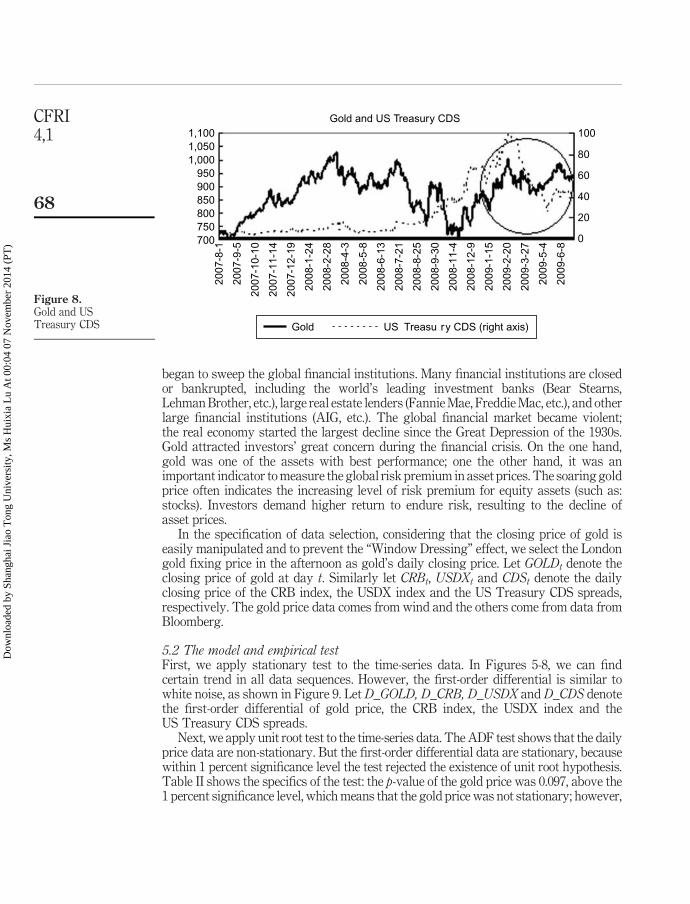
In this paper, we use the US Treasury CDS spreads to measure gold’s sovereigndefault risk premium. Since the US Treasury is the asset with the world’s highest creditrating, the trend of the US Treasury CDS spreads will reflect the change of globalsovereign default risk. Then the US Treasury CDS spreads and the sovereign defaultrisk premium of gold are highly positively correlated. The reason is that the rise of theUS Treasury CDS spreads indicates the increase of the US Treasury bonds default riskand the US national credit default risk, which reflects the increasing default risk of thecurrent credit-based currency system. As the final choice of hedging currency, gold’shedging value increases. As shown in Figure 8, during the worst period of financialcrisis, gold’s sovereign default risk premium dominated gold’s commodity value andcurrency value. Thus, the trend of gold price and the US Treasury CDS spreads werealmost identical, as highlighted by the ellipse in Figure 8.
5. Modeling and empirical test5.1 DataIn this paper, we select the following data during the financial crisis to model the goldprice, including the CRB index, the USDX index, and the US Treasury CDS spreads.Since August 2007, the sub-prime mortgage crisis and subsequent financial crisis
Figure 7.TED spread and US dollar
LIBOR – OIS(three-months)
TED Spread and US Dollar LIBOR_OIS (3-months)
0.00%
1.00%
2.00%
3.00%
4.00%
5.00%20
07-6
-1
2007
-7-1
2007
-8-1
2007
-9-1
2007
-10-
1
2007
-11-
1
2007
-12-
1
2008
-1-1
2008
-2-1
2008
-3-1
2008
-4-1
2008
-5-1
2008
-6-1
2008
-7-1
2008
-8-1
2008
-9-1
2008
-10-
1
2008
-11-
1
2008
-12-
1
2009
-1-1
2009
-2-1
2009
-3-1
2009
-4-1
2009
-5-1
2009
-6-1
TED Spread US Dollar LIBOR-OIS (3-months)
Macro-factorson gold pricing
67
Dow
nloa
ded
by S
hang
hai J
iao
Ton
g U
nive
rsity
, Ms
Hui
xia
Lu
At 0
0:04
07
Nov
embe
r 20
14 (
PT)
began to sweep the global financial institutions. Many financial institutions are closedor bankrupted, including the world’s leading investment banks (Bear Stearns,Lehman Brother, etc.), large real estate lenders (Fannie Mae, Freddie Mac, etc.), and otherlarge financial institutions (AIG, etc.). The global financial market became violent;the real economy started the largest decline since the Great Depression of the 1930s.Gold attracted investors’ great concern during the financial crisis. On the one hand,gold was one of the assets with best performance; one the other hand, it was animportant indicator to measure the global risk premium in asset prices. The soaring goldprice often indicates the increasing level of risk premium for equity assets (such as:stocks). Investors demand higher return to endure risk, resulting to the decline ofasset prices.
In the specification of data selection, considering that the closing price of gold iseasily manipulated and to prevent the “Window Dressing” effect, we select the Londongold fixing price in the afternoon as gold’s daily closing price. Let GOLDt denote theclosing price of gold at day t. Similarly let CRBt, USDXt and CDSt denote the dailyclosing price of the CRB index, the USDX index and the US Treasury CDS spreads,respectively. The gold price data comes from wind and the others come from data fromBloomberg.
5.2 The model and empirical testFirst, we apply stationary test to the time-series data. In Figures 5-8, we can findcertain trend in all data sequences. However, the first-order differential is similar towhite noise, as shown in Figure 9. Let D_GOLD, D_CRB, D_USDX and D_CDS denotethe first-order differential of gold price, the CRB index, the USDX index and theUS Treasury CDS spreads.
Next, we apply unit root test to the time-series data. The ADF test shows that the dailyprice data are non-stationary. But the first-order differential data are stationary, becausewithin 1 percent significance level the test rejected the existence of unit root hypothesis.Table II shows the specifics of the test: the p-value of the gold price was 0.097, above the1 percent significance level, which means that the gold price was not stationary; however,
Figure 8.Gold and USTreasury CDS
1,1001,0501,000
950900850800750700
2007
-8-1
2007
-9-5
2007
-10-
10
2007
-11-
14
2007
-12-
19
2008
-1-2
4
2008
-2-2
8
2008
-4-3
2008
-5-8
2008
-6-1
3
2008
-7-2
1
2008
-8-2
5
2008
-9-3
0
2008
-11-
4
2008
-12-
9
2009
-1-1
5
2009
-2-2
0
2009
-3-2
7
2009
-5-4
2009
-6-8
100
80
60
40
20
0
Gold and US Treasury CDS
Gold US Treasu ry CDS (right axis)
CFRI4,1
68
Dow
nloa
ded
by S
hang
hai J
iao
Ton
g U
nive
rsity
, Ms
Hui
xia
Lu
At 0
0:04
07
Nov
embe
r 20
14 (
PT)
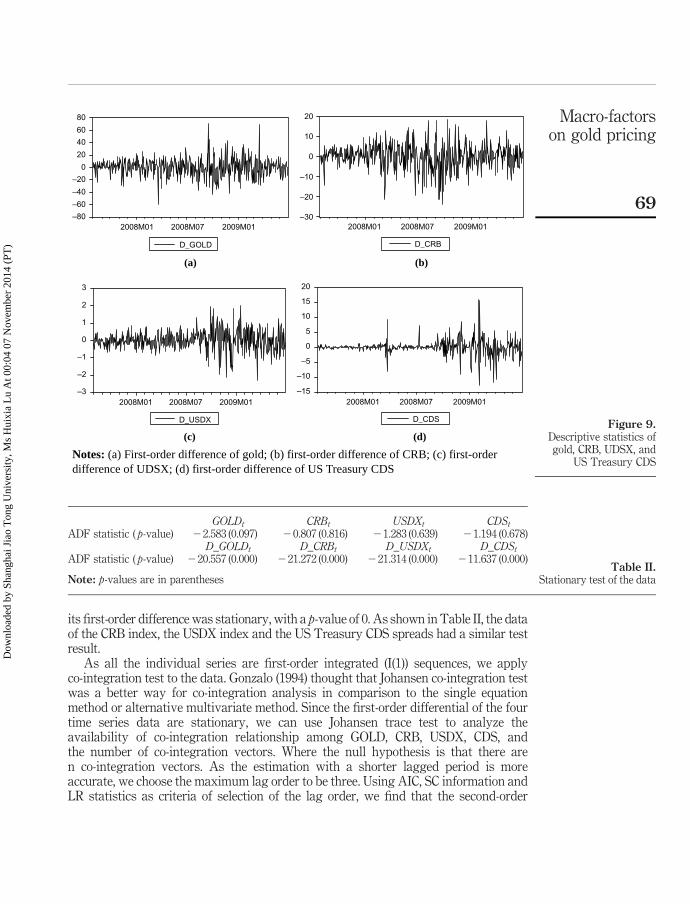
its first-order difference was stationary, with a p-value of 0. As shown in Table II, the dataof the CRB index, the USDX index and the US Treasury CDS spreads had a similar testresult.
As all the individual series are first-order integrated (I(1)) sequences, we applyco-integration test to the data. Gonzalo (1994) thought that Johansen co-integration testwas a better way for co-integration analysis in comparison to the single equationmethod or alternative multivariate method. Since the first-order differential of the fourtime series data are stationary, we can use Johansen trace test to analyze theavailability of co-integration relationship among GOLD, CRB, USDX, CDS, andthe number of co-integration vectors. Where the null hypothesis is that there aren co-integration vectors. As the estimation with a shorter lagged period is moreaccurate, we choose the maximum lag order to be three. Using AIC, SC information andLR statistics as criteria of selection of the lag order, we find that the second-order
GOLDt CRBt USDXt CDStADF statistic ( p-value) 22.583 (0.097) 20.807 (0.816) 21.283 (0.639) 21.194 (0.678)
D_GOLDt D_CRBt D_USDXt D_CDStADF statistic ( p-value) 220.557 (0.000) 221.272 (0.000) 221.314 (0.000) 211.637 (0.000)
Note: p-values are in parenthesesTable II.
Stationary test of the data
Figure 9.Descriptive statistics ofgold, CRB, UDSX, and
US Treasury CDS
D_GOLD D_CRB
(a) (b)
D_USDX D_CDS
(c) (d)
Notes: (a) First-order difference of gold; (b) first-order difference of CRB; (c) first-orderdifference of UDSX; (d) first-order difference of US Treasury CDS
–80
–60
–40
–20
0
20
40
60
80
2008M01 2008M07 2009M01–30
–20
–10
0
10
20
2008M01 2008M07 2009M01
–3
–2
–1
0
1
2
3
2008M01 2008M07 2009M01–15
–10
–5
0
5
10
15
20
2008M01 2008M07 2009M01
Macro-factorson gold pricing
69
Dow
nloa
ded
by S
hang
hai J
iao
Ton
g U
nive
rsity
, Ms
Hui
xia
Lu
At 0
0:04
07
Nov
embe
r 20
14 (
PT)
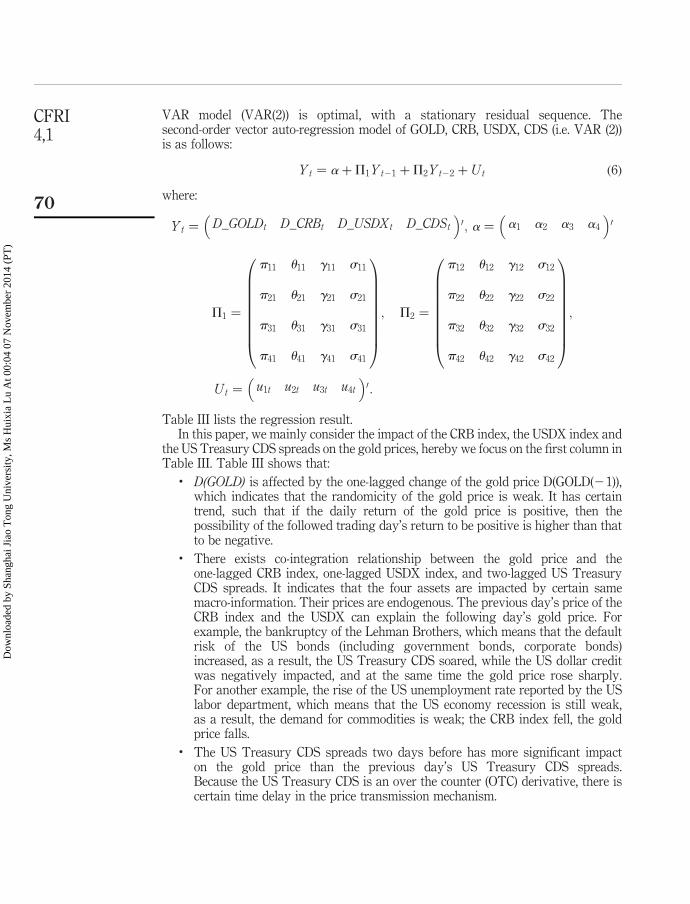
VAR model (VAR(2)) is optimal, with a stationary residual sequence. Thesecond-order vector auto-regression model of GOLD, CRB, USDX, CDS (i.e. VAR (2))is as follows:
Yt ¼ aþP1Yt21 þP2Yt22 þ Ut ð6Þ
where:
Yt ¼ D_GOLDt D_CRBt D_USDXt D_CDSt
� �0; a ¼ a1 a2 a3 a4
� �0
P1 ¼
p11 u11 g11 s11
p21 u21 g21 s21
p31 u31 g31 s31
p41 u41 g41 s41
0BBBBBBBB@
1CCCCCCCCA; P2 ¼
p12 u12 g12 s12
p22 u22 g22 s22
p32 u32 g32 s32
p42 u42 g42 s42
0BBBBBBBB@
1CCCCCCCCA;
Ut ¼ u1t u2t u3t u4t
� �0:
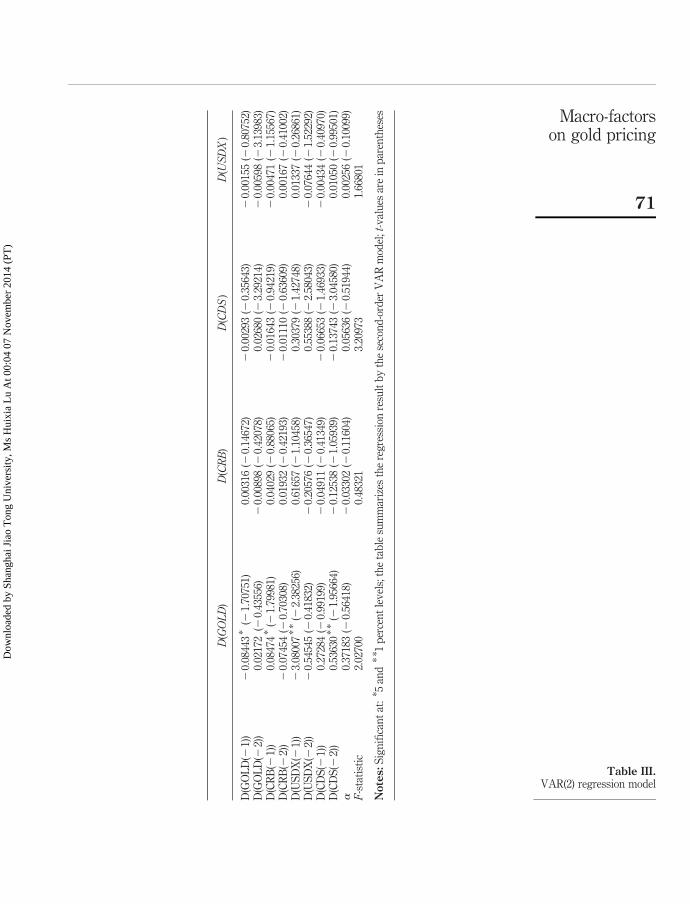
Table III lists the regression result.In this paper, we mainly consider the impact of the CRB index, the USDX index and
the US Treasury CDS spreads on the gold prices, hereby we focus on the first column inTable III. Table III shows that:
. D(GOLD) is affected by the one-lagged change of the gold price D(GOLD(21)),which indicates that the randomicity of the gold price is weak. It has certaintrend, such that if the daily return of the gold price is positive, then thepossibility of the followed trading day’s return to be positive is higher than thatto be negative.
. There exists co-integration relationship between the gold price and theone-lagged CRB index, one-lagged USDX index, and two-lagged US TreasuryCDS spreads. It indicates that the four assets are impacted by certain samemacro-information. Their prices are endogenous. The previous day’s price of theCRB index and the USDX can explain the following day’s gold price. Forexample, the bankruptcy of the Lehman Brothers, which means that the defaultrisk of the US bonds (including government bonds, corporate bonds)increased, as a result, the US Treasury CDS soared, while the US dollar creditwas negatively impacted, and at the same time the gold price rose sharply.For another example, the rise of the US unemployment rate reported by the USlabor department, which means that the US economy recession is still weak,as a result, the demand for commodities is weak; the CRB index fell, the goldprice falls.
. The US Treasury CDS spreads two days before has more significant impacton the gold price than the previous day’s US Treasury CDS spreads.Because the US Treasury CDS is an over the counter (OTC) derivative, there iscertain time delay in the price transmission mechanism.
CFRI4,1
70
Dow
nloa
ded
by S
hang
hai J
iao
Ton
g U
nive
rsity
, Ms
Hui
xia
Lu
At 0
0:04
07
Nov
embe
r 20
14 (
PT)
D(GOLD
)D
(CRB
)D
(CDS
)D
(USDX
)
D(G
OL
D(2
1))
20.
0844
3*
(21.
7075
1)0.
0031
6(2
0.14
672)
20.
0029
3(2
0.35
643)
20.
0015
5(2
0.80
752)
D(G
OL
D(2
2))
0.02
172
(20.
4355
6)2
0.00
898
(20.
4207
8)0.
0268
0(2
3.29
214)
20.
0059
8(2
3.13
983)
D(C
RB
(21)
)0.
0847
4*
(21.
7998
1)0.
0402
9(2
0.88
065)
20.
0164
3(2
0.94
219)
20.
0047
1(2
1.15
567)
D(C
RB
(22)
)2
0.07
454
(20.
7030
8)0.
0193
2(2
0.42
193)
20.
0111
0(2
0.63
609)
0.00
167
(20.
4100
2)D
(US
DX
(21)
)2
3.08
007
**
(22.
3825
6)0.
6165
7(2
1.10
458)
0.30
379
(21.
4274
8)0.
0133
7(2
0.26
861)
D(U
SD
X(2
2))
20.
5454
5(2
0.41
832)
20.
2057
6(2
0.36
547)
0.55
388
(22.
5804
3)2
0.07
644
(21.
5229
2)D
(CD
S(2
1))
0.27
284
(20.
9919
9)2
0.04
911
(20.
4134
9)2
0.06
653
(21.
4693
3)2
0.00
434
(20.
4097
0)D
(CD
S(2
2))
0.53
630
**
(21.
9566
4)2
0.12
538
(21.
0593
9)2
0.13
743
(23.
0458
0)0.
0105
0(2
0.99
501)
a0.
3718
3(2
0.56
418)
20.
0330
2(2
0.11
604)
0.05
636
(20.
5194
4)0.
0025
6(2
0.10
099)
F-s
tati
stic
2.02
700
0.48
321
3.20
973
1.66
801
Notes:
Sig
nifi
can
tat
:* 5
and
** 1
per
cen
tle
vel
s;th
eta
ble
sum
mar
izes
the
reg
ress
ion
resu
ltb
yth
ese
con
d-o
rder
VA
Rm
odel
;t-v
alu
esar
ein
par
enth
eses
Table III.VAR(2) regression model
Macro-factorson gold pricing
71
Dow
nloa
ded
by S
hang
hai J
iao
Ton
g U
nive
rsity
, Ms
Hui
xia
Lu
At 0
0:04
07
Nov
embe
r 20
14 (
PT)
. The USDX index has a significant negative effect on the gold price. When the USdollar is appreciated, gold will be depreciated, and vice versa.
. The CRB index and US Treasury CDS spreads have significant positive impactson the gold price. When the CRB index rises, reflecting stronginflation expectations, then the gold price will follow up; when the USTreasury CDS spreads rise, which implies the increasing of US sovereign debtdefault risk, the investors’ risk aversion increases, and then the gold price willfollow up.
In general, the CRB index, the USDX index and the US Treasury CDS spreads havesignificant impact on the gold price because of its three properties: the commodityproperty, the currency property and the risk premium property. It has been repeatedlyvalidated in industry. Therefore, the model has certain significance for both theoreticalresearchers and market participations.
6. ConclusionsThe 2007 financial crisis makes the non-currency gold an important asset again. Gold’scurrency property and investment property are strengthened. First, it becomes animportant asset in assets allocation. A growing number of investors weight the rationof gold and related derivatives in their asset portfolio. Second, the gold price becomesan important indicator to reflect the investors’ risk premium level. It influences allassets prices by changing the risk premium level in the discount factor. Finally, thegold price also affects the macro-policies. As gold’s currency property still exists,especially in the currency crisis or when credit currency is challenged, the gold price isalways important for central banks to consider with.
This paper investigates the macro-factors that impact on the gold pricing modelunder the current currency system. Comprehensively considering gold’s commodity,currency and hedging properties, we decompose gold’s value into three parts: thecommodity value, the currency value and the hedging value. The CRB index, the USDXindex and the US Treasury CDS spreads are selected as the macro-factors that impacton the gold price during the financial crisis. The VAR model shows that there existssignificant relationship between the gold price and the one-lagged CRB index,one-lagged USDX dollar index, and two-lagged US Treasury CDS spreads. It verifiesthat the gold price is driven by multiple macro-factors (the three features of gold).Another finding is that the volatility of the gold price has properties of clustering andlong memory and non-asymmetry.
Notes
1. There was no euro at that time, the author of this paper refers to changes in exchange rate ofthe major European currencies (such as: Mark, Franc, Pound, Lira, etc.).
2. The clustering property describes the following observations: if the volatility is large, thenthe following volatilities usually are large; if the volatility is small, then the followingvolatilities usually are small.
3. The asymmetry means that the bad news usually will cause larger fluctuation in the marketthan good news. The asymmetry property was initially introduced by Black (1976).Nelson (1991) proposed the EGARCH model, which combined the asymmetry property withGARCH model.
CFRI4,1
72
Dow
nloa
ded
by S
hang
hai J
iao
Ton
g U
nive
rsity
, Ms
Hui
xia
Lu
At 0
0:04
07
Nov
embe
r 20
14 (
PT)
4. The number in the parentheses of equations (4) and (5) are the p-value.
5. The data from 1982 to 1990 shows that the exchange rates between Europeancountries had significant impact to the gold price during that period. The updated datafrom 1991 to 2004 show that the exchange rates of US dollar against euro and Japaneseyen have significant impact to the gold price currently. Thus, we choose the USDX index inthis paper.
6. In USDX index, the weights of the exchange rates of the six currencies are as follows:euro 57.6 percent, Japanese yen 13.6 percent, British pound 11.9 percent, Canadian dollar9.1 percent, Swedish krona 4.2 percent, Swiss franc 3.6 percent.
7. The LIBOR-OIS and Ted spreads are ten times larger than average.
References
Aggarwal, R. and Soenen, A. (1988), “The nature and efficiency of the gold market”, Journal ofPortfolio Management, No. 14, pp. 18-21.
Ball, C., Torous, W. and Tschoegl, A. (1982), “Gold and the weekend effect”, Journal of FuturesMarkets, Vol. 2 No. 2, pp. 175-182.
Baur, G. and Lucey, M. (2006), “Is gold a hedge or a safe haven? An analysis of stocks,bonds and gold”, The Institute for International Integration Studies Discussion PaperSeries.
Black, F. (1976), “Studies of stock market volatility changes”, Proceedings of the AmericanStatistical Association Business and Economic Statistics Section, American StatisticalAssociation, Chicago, IL, Pearson Press, Upper Saddle River, NJ, pp. 177-181.
Blose, E. (1996), “Gold price risk and the returns on gold mutual funds”, Journal of Economicsand Business, Vol. 48, pp. 499-513.
Blose, E. (2009), “Gold prices, cost of carry, and expected inflation”, Journal of Economics andBusiness, Vol. 62 No. 2, pp. 35-47.
Blose, E. and Shieh, P. (1995), “The impact of gold price on the value of gold mining stock”,Review of Financial Economics, Vol. 4, pp. 125-139.
Cai, J., Cheung, Y. and Wong, M. (2001), “What moves the gold market”, Journal of FuturesMarkets, Vol. 21 No. 3, pp. 257-278.
Carter, J., Affleck-Graves, J. and Money, H. (1982), “Are gold shares better than gold fordiversification?”, Journal of Portfolio Management, No. 9, pp. 52-55.
Chen, K. and Zheng, C. (2011), “The effect mechanism of credit constraint on cycle’s formation”,China Finance Review International, No. 4, pp. 408-424.
Ciner, C. (2001), “On the long-run relationship between gold and silver prices: a note”,Global Finance Journal, Vol. 12 No. 2, pp. 299-303.
Escribano, A. and Granger, J. (1998), “Investigating the relationship between gold and silverprice”, Journal of Forecasting, Vol. 17 No. 2, pp. 81-107.
Fan, W. (2009), “On the gold in the asset allocation”, Gold Market, No. 4, pp. 42-47(in Chinese).
Fan, W. and Song, H. (2009), “Asset allocation based on the mean-VaR model”, GoldMarket, No. 3,pp. 36-41 (in Chinese).
Gonzalo, J. (1994), “Five alternative methods of estimating long-run equilibrium relationship”,Journal of Econometrics, Vol. 60 No. 1, pp. 203-233.
Macro-factorson gold pricing
73
Dow
nloa
ded
by S
hang
hai J
iao
Ton
g U
nive
rsity
, Ms
Hui
xia
Lu
At 0
0:04
07
Nov
embe
r 20
14 (
PT)
http://www.emeraldinsight.com/action/showLinks?crossref=10.1002%2Ffut.3990020209&isi=A1982PF57400007
Hiller, D. and Faff, R. (2006), “Do precious metal shine? An investment perspective”, FinancialAnalyst Journal, Vol. 62 No. 2, pp. 15-21.
Jaffe, J. (1989), “Gold and gold stocks as investments for institutional portfolios”, FinancialAnalysts Journal, Vol. 45 No. 2, pp. 53-59.
Larsen, B. and McQueen, R. (1995), “REITs, real estate, and inflation: lessons from the goldmarket”, Journal of Real Estate Finance and Economics, No. 10, pp. 285-297.
McCown, R. and Zimmerman, R. (2006), “Is gold a zero-beta asset? Analysis of the investmentpotential of precious metals”, Social Science Research Network Working Paper.
Nelson, D. (1991), “Conditional heteroscedasticity in asset returns: a new approach”,Econometrica, Vol. 59 No. 2, pp. 347-370.
Sjaastad, L. (2008), “The price of gold and the exchange rates: once again”, Resource Policy,Vol. 33 No. 1, pp. 118-124.
Sjaastad, L. and Scacciavillani, F. (1996), “The price of gold and the exchange rate”, Journal ofInternational Money and Finance, Vol. 15 No. 4, pp. 879-897.
Tschoegl, E. (1980), “Efficiency in the gold market”, Journal of Banking and Finance, Vol. 4 No. 4,pp. 371-379.
Wahab, M., Cohn, R. and Lashgari, M. (1994), “The gold-silver spread: integration,cointegration, predictability and ex-ante arbitrage”, Journal of Future Markets, Vol. 14No. 6, pp. 707-756.
Further reading
Adrangi, B., Chatrath, A. and Raffiee, P. (2003), “Economic activity, inflation, andhedging: the case of gold and silver investments”, Journal of Wealth Management, No. 6,pp. 60-77.
Antonino, P., Franco, P. and David, D. (2007), “Forecasting gold price changes: rolling andrecursive neutral network models”, Journal of Multinational Financial Management,Vol. 22 No. 3, pp. 1-11.
Edel, T. and Brian, L. (2007), “A power GARCH examination of the gold market”, InternationalBusiness and Finance, Vol. 21 No. 3, pp. 317-324.
Fang, S. (2012), “Who is driving the baseline variables of global macro? Gold and US dollar indeximplicit calibration on global macro cycles”, working paper.
Goodman, B. (1956), “The price of gold and international liquidity”, Journal of Finance, Vol. 11No. 1, pp. 15-28.
Grudnitski, G. and Osburn, L. (1993), “Forecasting S&P and gold futures prices: an applicationof neural networks”, Journal of Futures Markets, Vol. 13 No. 6, pp. 631-643.
Stephen, S. and Dale, H. (1978), “Market anticipations of government policies and the priceof gold”, Journal of Political Economy, Vol. 86 No. 4, pp. 627-648.
About the authorsWei Fan is a Post Doctor of School of Public, Policy and Management, Tsinghua University.He has authored more than 20 academic papers in International Financial Review,New Mathematics and Natural Computation, International Review of Applied Financial Issuesand Economics, Journal of Management (in Chinese), Operation and Management (in Chinese),Management Review (in Chinese), etc. Besides, he has been in charge of three National NaturalScience Foundation Projects and one Securities Association of China Project. Research field:asset pricing.
CFRI4,1
74
Dow
nloa
ded
by S
hang
hai J
iao
Ton
g U
nive
rsity
, Ms
Hui
xia
Lu
At 0
0:04
07
Nov
embe
r 20
14 (
PT)
http://www.emeraldinsight.com/action/showLinks?crossref=10.1002%2Ffut.3990130605&isi=A1993LR80800004
Sihai Fang is a Professor at Economics & Finance, School of Economics and Management,University of Electronic Science and Technology of China; Chief Economist and Chief FinancialEngineer of Hongyuan Securities Co., Ltd; Visiting Professor, Institute of InternationalEconomics, Nankai University; Academic Adviser, Finance and Law Project, The Ninth ParisUniversity; Invited Senior Economist, China News Agency; Academic Vice President, ShanghaiInstitute of Finance and Law. In the past years, more than 30 academic papers and300 commercial reports have been published. Research field: global macro and asset pricing.Sihai Fang is the corresponding author and can be contacted at: [email protected]
Tao Lu is a PhD of the Hong Kong University of Science and Technology. Withresearch interest in optimization and financial engineering, including game theory,derivatives, volatility smiles and high-frequency trading strategies, he has a shortexperience in a security company as Financial Engineering Analyst. Research field: globalmacro and asset pricing.
Macro-factorson gold pricing
75
To purchase reprints of this article please e-mail: [email protected] visit our web site for further details: www.emeraldinsight.com/reprints
Dow
nloa
ded
by S
hang
hai J
iao
Ton
g U
nive
rsity
, Ms
Hui
xia
Lu
At 0
0:04
07
Nov
embe
r 20
14 (
PT)