sustainability - MDPI
19
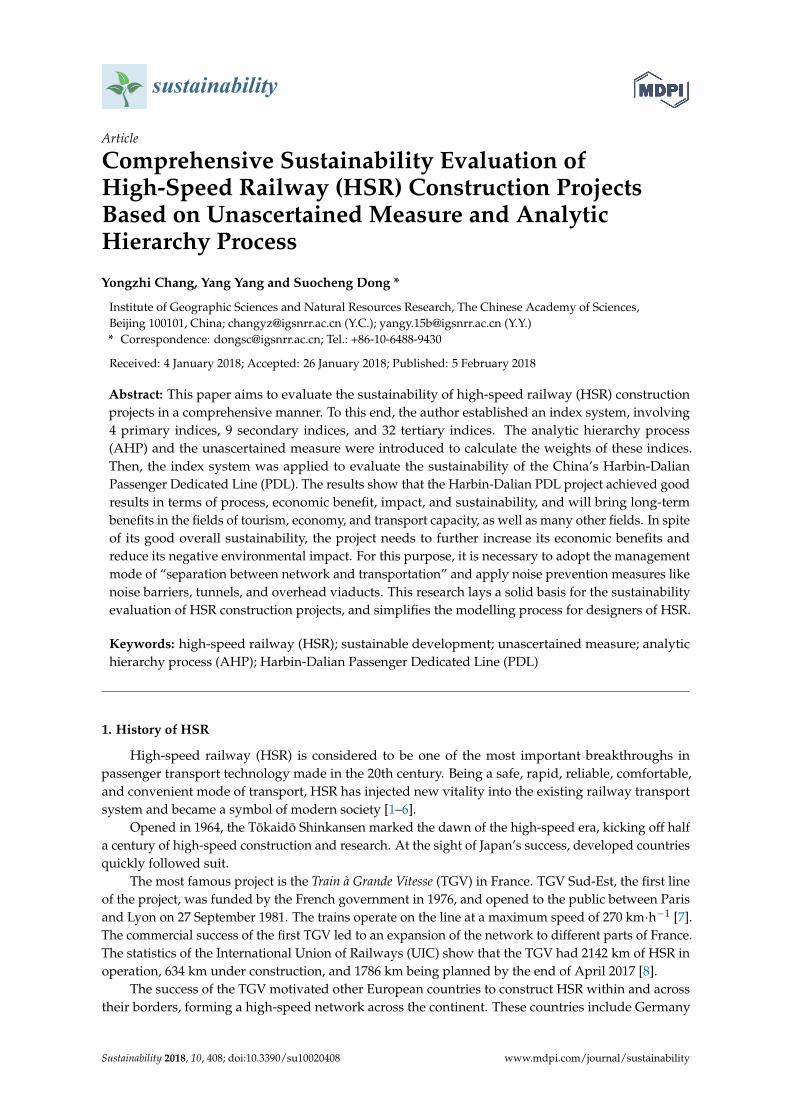
sustainability Article Comprehensive Sustainability Evaluation of High-Speed Railway (HSR) Construction Projects Based on Unascertained Measure and Analytic Hierarchy Process Yongzhi Chang, Yang Yang and Suocheng Dong * Institute of Geographic Sciences and Natural Resources Research, The Chinese Academy of Sciences, Beijing 100101, China; [email protected] (Y.C.); [email protected] (Y.Y.) * Correspondence: [email protected]; Tel.: +86-10-6488-9430 Received: 4 January 2018; Accepted: 26 January 2018; Published: 5 February 2018 Abstract: This paper aims to evaluate the sustainability of high-speed railway (HSR) construction projects in a comprehensive manner. To this end, the author established an index system, involving 4 primary indices, 9 secondary indices, and 32 tertiary indices. The analytic hierarchy process (AHP) and the unascertained measure were introduced to calculate the weights of these indices. Then, the index system was applied to evaluate the sustainability of the China’s Harbin-Dalian Passenger Dedicated Line (PDL). The results show that the Harbin-Dalian PDL project achieved good results in terms of process, economic benefit, impact, and sustainability, and will bring long-term benefits in the fields of tourism, economy, and transport capacity, as well as many other fields. In spite of its good overall sustainability, the project needs to further increase its economic benefits and reduce its negative environmental impact. For this purpose, it is necessary to adopt the management mode of “separation between network and transportation” and apply noise prevention measures like noise barriers, tunnels, and overhead viaducts. This research lays a solid basis for the sustainability evaluation of HSR construction projects, and simplifies the modelling process for designers of HSR. Keywords: high-speed railway (HSR); sustainable development; unascertained measure; analytic hierarchy process (AHP); Harbin-Dalian Passenger Dedicated Line (PDL) 1. History of HSR High-speed railway (HSR) is considered to be one of the most important breakthroughs in passenger transport technology made in the 20th century. Being a safe, rapid, reliable, comfortable, and convenient mode of transport, HSR has injected new vitality into the existing railway transport system and became a symbol of modern society [1–6]. Opened in 1964, the T ¯ okaid ¯ o Shinkansen marked the dawn of the high-speed era, kicking off half a century of high-speed construction and research. At the sight of Japan’s success, developed countries quickly followed suit. The most famous project is the Train à Grande Vitesse (TGV) in France. TGV Sud-Est, the first line of the project, was funded by the French government in 1976, and opened to the public between Paris and Lyon on 27 September 1981. The trains operate on the line at a maximum speed of 270 km·h -1 [7]. The commercial success of the first TGV led to an expansion of the network to different parts of France. The statistics of the International Union of Railways (UIC) show that the TGV had 2142 km of HSR in operation, 634 km under construction, and 1786 km being planned by the end of April 2017 [8]. The success of the TGV motivated other European countries to construct HSR within and across their borders, forming a high-speed network across the continent. These countries include Germany Sustainability 2018, 10, 408; doi:10.3390/su10020408 www.mdpi.com/journal/sustainability
-
Upload
khangminh22 -
Category
Documents
-
view
1 -
download
0
Transcript of sustainability - MDPI
sustainability
Article
Comprehensive Sustainability Evaluation ofHigh-Speed Railway (HSR) Construction ProjectsBased on Unascertained Measure and AnalyticHierarchy Process
Yongzhi Chang, Yang Yang and Suocheng Dong *
Institute of Geographic Sciences and Natural Resources Research, The Chinese Academy of Sciences,Beijing 100101, China; [email protected] (Y.C.); [email protected] (Y.Y.)* Correspondence: [email protected]; Tel.: +86-10-6488-9430
Received: 4 January 2018; Accepted: 26 January 2018; Published: 5 February 2018
Abstract: This paper aims to evaluate the sustainability of high-speed railway (HSR) constructionprojects in a comprehensive manner. To this end, the author established an index system, involving4 primary indices, 9 secondary indices, and 32 tertiary indices. The analytic hierarchy process(AHP) and the unascertained measure were introduced to calculate the weights of these indices.Then, the index system was applied to evaluate the sustainability of the China’s Harbin-DalianPassenger Dedicated Line (PDL). The results show that the Harbin-Dalian PDL project achieved goodresults in terms of process, economic benefit, impact, and sustainability, and will bring long-termbenefits in the fields of tourism, economy, and transport capacity, as well as many other fields. In spiteof its good overall sustainability, the project needs to further increase its economic benefits andreduce its negative environmental impact. For this purpose, it is necessary to adopt the managementmode of “separation between network and transportation” and apply noise prevention measures likenoise barriers, tunnels, and overhead viaducts. This research lays a solid basis for the sustainabilityevaluation of HSR construction projects, and simplifies the modelling process for designers of HSR.
Keywords: high-speed railway (HSR); sustainable development; unascertained measure; analytichierarchy process (AHP); Harbin-Dalian Passenger Dedicated Line (PDL)
1. History of HSR
High-speed railway (HSR) is considered to be one of the most important breakthroughs inpassenger transport technology made in the 20th century. Being a safe, rapid, reliable, comfortable,and convenient mode of transport, HSR has injected new vitality into the existing railway transportsystem and became a symbol of modern society [1–6].
Opened in 1964, the Tokaido Shinkansen marked the dawn of the high-speed era, kicking off halfa century of high-speed construction and research. At the sight of Japan’s success, developed countriesquickly followed suit.
The most famous project is the Train à Grande Vitesse (TGV) in France. TGV Sud-Est, the first lineof the project, was funded by the French government in 1976, and opened to the public between Parisand Lyon on 27 September 1981. The trains operate on the line at a maximum speed of 270 km·h−1 [7].The commercial success of the first TGV led to an expansion of the network to different parts of France.The statistics of the International Union of Railways (UIC) show that the TGV had 2142 km of HSR inoperation, 634 km under construction, and 1786 km being planned by the end of April 2017 [8].
The success of the TGV motivated other European countries to construct HSR within and acrosstheir borders, forming a high-speed network across the continent. These countries include Germany
Sustainability 2018, 10, 408; doi:10.3390/su10020408 www.mdpi.com/journal/sustainability
Sustainability 2018, 10, 408 2 of 19
(1988), Italy (1988), Spain (1992), Belgium (1997), the United Kingdom (2003), and the Netherlands(2009). After the turn of the century, the high-speed boom spread eastwards to Asia. Different forms ofHSR were built in Korea (2004) and China (2008).
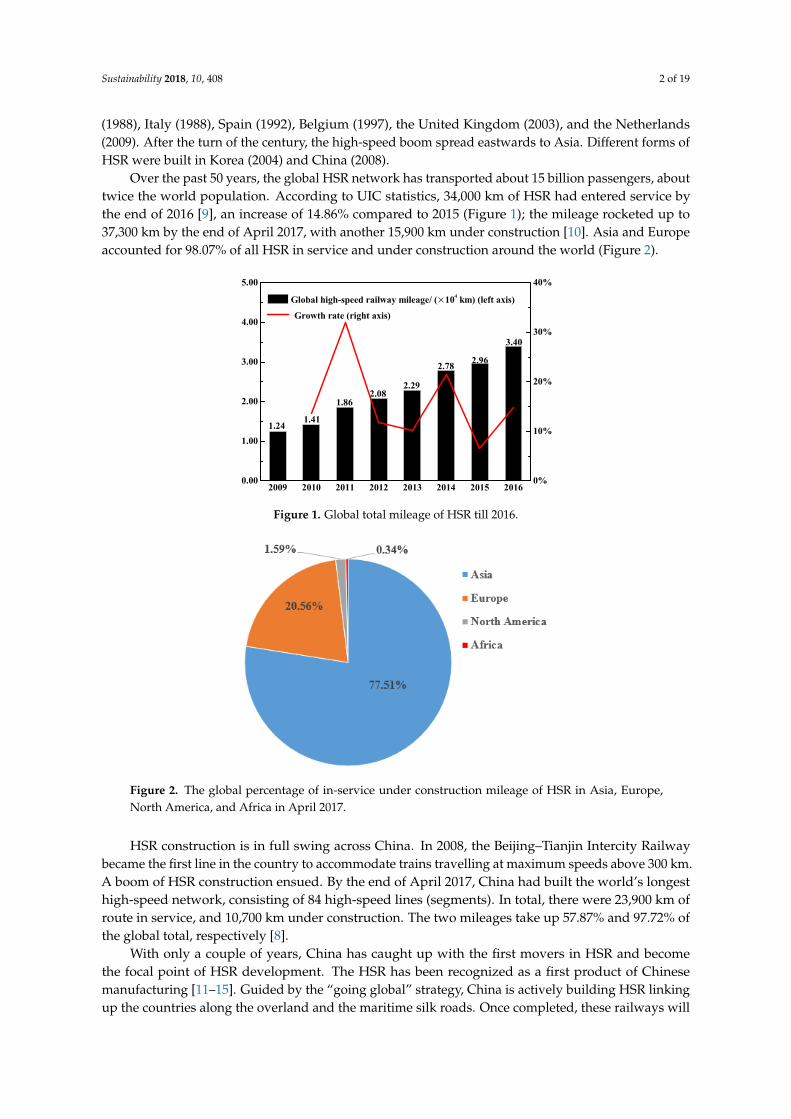
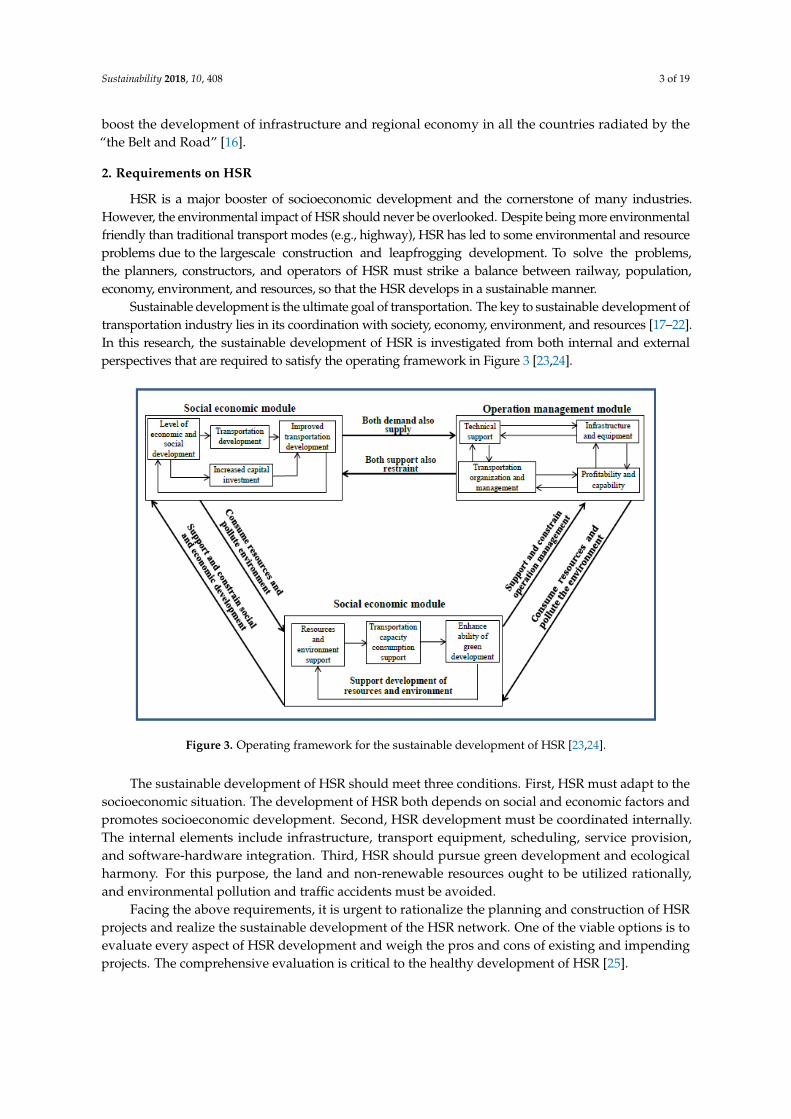
Over the past 50 years, the global HSR network has transported about 15 billion passengers, abouttwice the world population. According to UIC statistics, 34,000 km of HSR had entered service bythe end of 2016 [9], an increase of 14.86% compared to 2015 (Figure 1); the mileage rocketed up to37,300 km by the end of April 2017, with another 15,900 km under construction [10]. Asia and Europeaccounted for 98.07% of all HSR in service and under construction around the world (Figure 2).
Sustainability 2018, 10, x FOR PEER REVIEW 2 of 19
(1988), Italy (1988), Spain (1992), Belgium (1997), the United Kingdom (2003), and the Netherlands (2009). After the turn of the century, the high-speed boom spread eastwards to Asia. Different forms of HSR were built in Korea (2004) and China (2008).
Over the past 50 years, the global HSR network has transported about 15 billion passengers, about twice the world population. According to UIC statistics, 34,000 km of HSR had entered service by the end of 2016 [9], an increase of 14.86% compared to 2015 (Figure 1); the mileage rocketed up to 37,300 km by the end of April 2017, with another 15,900 km under construction [10]. Asia and Europe accounted for 98.07% of all HSR in service and under construction around the world (Figure 2).
2009 2010 2011 2012 2013 2014 2015 20160.00
1.00
2.00
3.00
4.00
5.00
Global high-speed railway mileage/ (×104 km) (left axis)
0%
10%
20%
30%
40%
3.40
2.962.78
2.292.08
1.86
1.41
Growth rate (right axis)
1.24
Figure 1. Global total mileage of HSR till 2016.
Figure 2. The global percentage of in-service under construction mileage of HSR in Asia, Europe, North America, and Africa in April 2017.
HSR construction is in full swing across China. In 2008, the Beijing–Tianjin Intercity Railway became the first line in the country to accommodate trains travelling at maximum speeds above 300 km. A boom of HSR construction ensued. By the end of April 2017, China had built the world’s longest high-speed network, consisting of 84 high-speed lines (segments). In total, there were 23,900 km of route in service, and 10,700 km under construction. The two mileages take up 57.87% and 97.72% of the global total, respectively [8].
With only a couple of years, China has caught up with the first movers in HSR and become the focal point of HSR development. The HSR has been recognized as a first product of Chinese manufacturing [11–15]. Guided by the “going global” strategy, China is actively building HSR linking up the countries along the overland and the maritime silk roads. Once completed, these railways will boost the development of infrastructure and regional economy in all the countries radiated by the “the Belt and Road” [16].
Figure 1. Global total mileage of HSR till 2016.
Sustainability 2018, 10, x FOR PEER REVIEW 2 of 19
(1988), Italy (1988), Spain (1992), Belgium (1997), the United Kingdom (2003), and the Netherlands (2009). After the turn of the century, the high-speed boom spread eastwards to Asia. Different forms of HSR were built in Korea (2004) and China (2008).
Over the past 50 years, the global HSR network has transported about 15 billion passengers, about twice the world population. According to UIC statistics, 34,000 km of HSR had entered service by the end of 2016 [9], an increase of 14.86% compared to 2015 (Figure 1); the mileage rocketed up to 37,300 km by the end of April 2017, with another 15,900 km under construction [10]. Asia and Europe accounted for 98.07% of all HSR in service and under construction around the world (Figure 2).
2009 2010 2011 2012 2013 2014 2015 20160.00
1.00
2.00
3.00
4.00
5.00
Global high-speed railway mileage/ (×104 km) (left axis)
0%
10%
20%
30%
40%
3.40
2.962.78
2.292.08
1.86
1.41
Growth rate (right axis)
1.24
Figure 1. Global total mileage of HSR till 2016.
Figure 2. The global percentage of in-service under construction mileage of HSR in Asia, Europe, North America, and Africa in April 2017.
HSR construction is in full swing across China. In 2008, the Beijing–Tianjin Intercity Railway became the first line in the country to accommodate trains travelling at maximum speeds above 300 km. A boom of HSR construction ensued. By the end of April 2017, China had built the world’s longest high-speed network, consisting of 84 high-speed lines (segments). In total, there were 23,900 km of route in service, and 10,700 km under construction. The two mileages take up 57.87% and 97.72% of the global total, respectively [8].
With only a couple of years, China has caught up with the first movers in HSR and become the focal point of HSR development. The HSR has been recognized as a first product of Chinese manufacturing [11–15]. Guided by the “going global” strategy, China is actively building HSR linking up the countries along the overland and the maritime silk roads. Once completed, these railways will boost the development of infrastructure and regional economy in all the countries radiated by the “the Belt and Road” [16].
Figure 2. The global percentage of in-service under construction mileage of HSR in Asia, Europe,North America, and Africa in April 2017.
HSR construction is in full swing across China. In 2008, the Beijing–Tianjin Intercity Railwaybecame the first line in the country to accommodate trains travelling at maximum speeds above 300 km.A boom of HSR construction ensued. By the end of April 2017, China had built the world’s longesthigh-speed network, consisting of 84 high-speed lines (segments). In total, there were 23,900 km ofroute in service, and 10,700 km under construction. The two mileages take up 57.87% and 97.72% ofthe global total, respectively [8].
With only a couple of years, China has caught up with the first movers in HSR and becomethe focal point of HSR development. The HSR has been recognized as a first product of Chinesemanufacturing [11–15]. Guided by the “going global” strategy, China is actively building HSR linkingup the countries along the overland and the maritime silk roads. Once completed, these railways will
Sustainability 2018, 10, 408 3 of 19
boost the development of infrastructure and regional economy in all the countries radiated by the“the Belt and Road” [16].
2. Requirements on HSR
HSR is a major booster of socioeconomic development and the cornerstone of many industries.However, the environmental impact of HSR should never be overlooked. Despite being more environmentalfriendly than traditional transport modes (e.g., highway), HSR has led to some environmental and resourceproblems due to the largescale construction and leapfrogging development. To solve the problems,the planners, constructors, and operators of HSR must strike a balance between railway, population,economy, environment, and resources, so that the HSR develops in a sustainable manner.
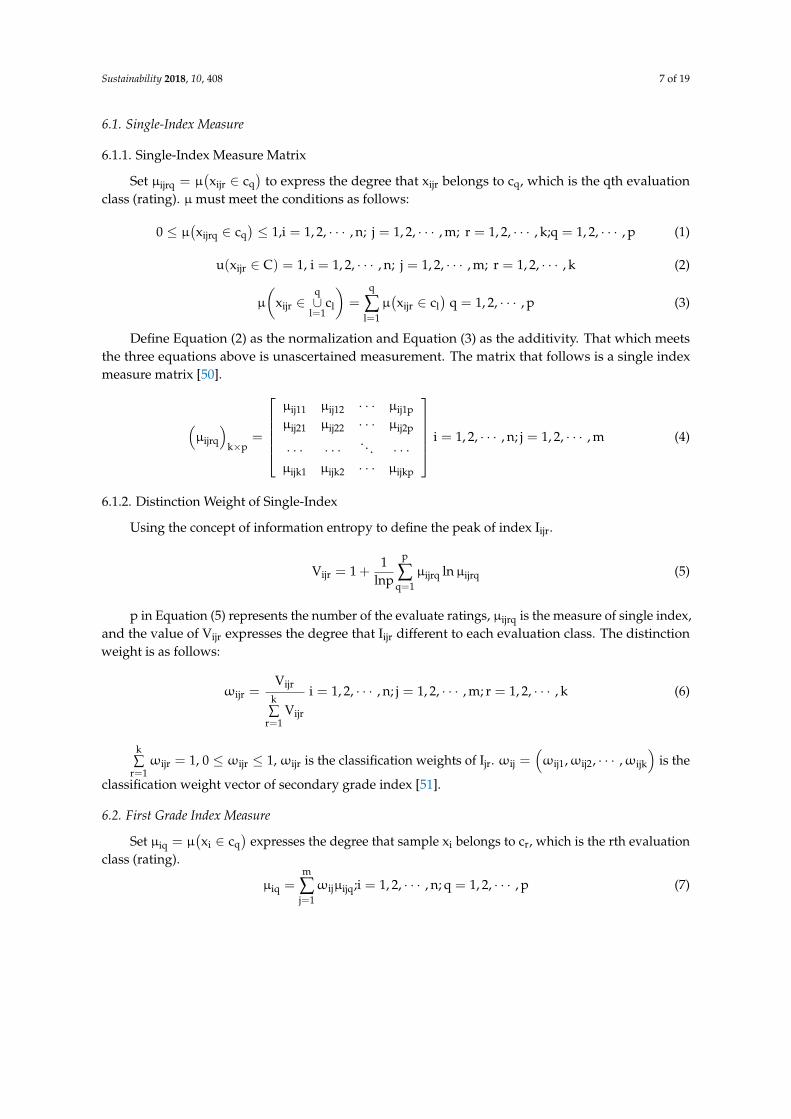
Sustainable development is the ultimate goal of transportation. The key to sustainable development oftransportation industry lies in its coordination with society, economy, environment, and resources [17–22].In this research, the sustainable development of HSR is investigated from both internal and externalperspectives that are required to satisfy the operating framework in Figure 3 [23,24].
Sustainability 2018, 10, x FOR PEER REVIEW 3 of 19
2. Requirements on HSR
HSR is a major booster of socioeconomic development and the cornerstone of many industries. However, the environmental impact of HSR should never be overlooked. Despite being more environmental friendly than traditional transport modes (e.g., highway), HSR has led to some environmental and resource problems due to the largescale construction and leapfrogging development. To solve the problems, the planners, constructors, and operators of HSR must strike a balance between railway, population, economy, environment, and resources, so that the HSR develops in a sustainable manner.
Sustainable development is the ultimate goal of transportation. The key to sustainable development of transportation industry lies in its coordination with society, economy, environment, and resources [17–22]. In this research, the sustainable development of HSR is investigated from both internal and external perspectives that are required to satisfy the operating framework in Figure 3 [23,24].
The sustainable development of HSR should meet three conditions. First, HSR must adapt to the socioeconomic situation. The development of HSR both depends on social and economic factors and promotes socioeconomic development. Second, HSR development must be coordinated internally. The internal elements include infrastructure, transport equipment, scheduling, service provision, and software-hardware integration. Third, HSR should pursue green development and ecological harmony. For this purpose, the land and non-renewable resources ought to be utilized rationally, and environmental pollution and traffic accidents must be avoided.
Facing the above requirements, it is urgent to rationalize the planning and construction of HSR projects and realize the sustainable development of the HSR network. One of the viable options is to evaluate every aspect of HSR development and weigh the pros and cons of existing and impending projects. The comprehensive evaluation is critical to the healthy development of HSR [25].
Figure 3. Operating framework for the sustainable development of HSR [23,24].
3. Literature Review
The sustainability evaluation of HSR construction projects started late at home and abroad. The existing research emphasizes theoretical analysis over empirical evidence and lacks sufficient
Figure 3. Operating framework for the sustainable development of HSR [23,24].
The sustainable development of HSR should meet three conditions. First, HSR must adapt to thesocioeconomic situation. The development of HSR both depends on social and economic factors andpromotes socioeconomic development. Second, HSR development must be coordinated internally.The internal elements include infrastructure, transport equipment, scheduling, service provision,and software-hardware integration. Third, HSR should pursue green development and ecologicalharmony. For this purpose, the land and non-renewable resources ought to be utilized rationally,and environmental pollution and traffic accidents must be avoided.
Facing the above requirements, it is urgent to rationalize the planning and construction of HSRprojects and realize the sustainable development of the HSR network. One of the viable options is toevaluate every aspect of HSR development and weigh the pros and cons of existing and impendingprojects. The comprehensive evaluation is critical to the healthy development of HSR [25].

Sustainability 2018, 10, 408 4 of 19
3. Literature Review
The sustainability evaluation of HSR construction projects started late at home and abroad.The existing research emphasizes theoretical analysis over empirical evidence and lacks sufficientevaluation contents, systematic indices and feasible methods. The rationality, normality, and feasibilityof the evaluation are yet to be improved.
The current evaluation methods include analytical hierarchy process (AHP) [26–28], neuralnetwork [29], fuzzy mathematics [27,30,31], multi-criteria decision analysis [32,33], fault treeanalysis [34], visco-elastic model [35], transfer function [36], finite element [37], etc. Most of theseapproaches tackle a single aspect of sustainable development. Only a few support comprehensiveevaluation, namely, neural network and fuzzy mathematics. The problem is these few methodsperform poorly in index selection and weight determination.
The sustainability evaluation of HSR construction projects involves much uncertainty and covertness.In particular, many attributes are uncertain in the decision-making process. Hence, the evaluation shouldcover both quantitative and qualitative indices. The unascertained measure theory is an ideal way todeal with uncertain information and achieve a comprehensive evaluation. Nevertheless, it is difficult todetermine the weight of a complex index system that relies solely on the unascertained measure theory.
To overcome the defect, it is necessary to introduce the AHP to the evaluation process. Taking theobject as a system, the AHP makes decisions through decomposition, comparative judgment,and totalization. By this method, the factors of a complex system are divided into interconnected,orderly layers; the importance of each layer relative to the other layer is quantified, and the weight ofeach layer is determined mathematically. In this way, the decision is made according to objective reality.
In view of the above facts and the features of HSR construction projects, this paper establishesa complete index system for sustainability evaluation. The system has such four primary indices asprocess, economic benefits, effect, and sustainability. Then, the unascertained measure was adopted tocreate the sustainability evaluation model for HSR construction projects. Then, the model was appliedto the sustainability evaluation of the Harbin-Dalian Passenger Dedicated Line (PDL). This researchlays a solid basis for sustainability evaluation of HSR construction projects and simplifies the modellingprocess for designers of HSR.
4. Establishment of Evaluation Index System
The index system is essential to the accuracy and reliability of the sustainability evaluation.Based on the literature review, the author decided to carry out a questionnaire survey beforesetting up the index system. The questionnaire was prepared after interviewing 30 HSR expertsworking in national and local governments, construction companies, design institutions, railwaymanagement departments, advisory bodies, and research institutes. Prior to the survey, the preliminaryquestionnaire was validated with selected samples and optimized into a formal questionnaire. After thesurvey, a field investigation was carried out to extract common factors through the factor analysis.
Considering the correlation between the factors, the author constructed the index system for thesustainability evaluation of HSR construction projects. Four layers of indices were introduced, namelythe target layer (main index), criteria layer (primary indices), sub-criteria layer (secondary indices),and solution layer (tertiary indices). The solution layer consists of 32 indices that explain the factors onthe sub-criteria layer (Table 1). The goal is to describe the elements in the tertiary indices and obtainthe values of the evaluation indices in light of the actual situation of the object. As mentioned above,the index system has such four primary indices as process, economic benefits, effect, and sustainability.

Sustainability 2018, 10, 408 5 of 19
Table 1. The evaluation index system for the sustainable development of HSR construction project [23,27].
Total Index First Index Secondary Index Third Index
Index system ofsustainable development
on HSR constructionproject X
process evaluation F1
process evaluationof pre-biddecision-making S1
necessity of project construction T1
scientific of decision-making program T2
survey and design T3
construction processevaluation S2
safety management T4
main technical indices T5
construction quality T6
investment control T7
time limit T8
operation processevaluation S3
preparation of operational effect T9
operation management level T10
evaluation ofeconomic benefits F2
financial benefitevaluation S4
payback period of investment T11
debt service coverage ratio (DSCR) T12
national economicbenefits evaluation S5
contribution to GDP T13
freight cost reduction benefits T14
economic internal rate of return (IRR) T15
economic net present value (NPV) T16
effect evaluation F3
social effectevaluation S6
drive labor and employment T17
appreciation rate of land and house T18
outage rate of cars and planes along the line T19
increased transport capacity T20
average travel time T21
per Capita GNP along the line T22
compensate degree of benefit damage group T23
boost national prestige T24
environmental effectevaluation S7
ecological environmental effect T25
project pollution control T26
sustainabilityevaluation F4
evaluation of internalsustainability factors S8
project management mechanism T27
growth rate of traffic volume T28
technical factors T29
evaluation of externalsustainability factors S9
benign circulation factors T30
project satisfaction T31
capital factors T32
The process evaluation index covers pre-bid decision-making, construction, and operation.These indices evaluate the actual project situation in the early stage, including work performance,construction quality, and operation efficiency. Based on the evaluation results, one can learn from thesuccesses and failures, enhance the project quality, and elevate the management level.
The economic benefits include financial benefit and national economy. As its name suggests,the former index measures the financial benefit of the project. To evaluate the index, the income andexpenses were acquired from the project’s financial statements, and the implementation of the nationaltax system was taken as a reference. According to Railway construction project economic evaluation methodsand parameters (3nd edition) (Ministry of Housing and Urban-Rural Development of the PRC, NationalDevelopment and Reform Commission of the PRC, Ministry of Railways of the PRC, 2012) [38] andliterature [39], the financial benefit of the project was further split into profitability and debt payingability. The latter index, national economy, is fundamental to the sustainable development of HSRconstruction projects. The index reflects the net contribution of project to the national economy,and discloses the economic effect of project cost and investment.
The social effect evaluation exists in the forms of social effect and environmental effect.From the sociological angle, this paper explores the social effect from four dimensions (Table 2).The environmental effect refers to the chemicals, wastes, noises, and electromagnetic radiations

Sustainability 2018, 10, 408 6 of 19
released during project construction and operations in the natural environment (e.g., water, air and soil).The evaluation results make it possible to minimize the adverse effects on the life of local residentsand ecological system.
Table 2. The index system of social effect evaluation.
Index Contains the Content Content Description
Social Effect Evaluation
effect on residents’ livesPer Capita GNP along the lineAverage travel time
effect on the interest groupdrive labor and employmentappreciation rate of land and housecompensate degree of benefit damage group
effect on traffic structureoutage rate of cars and planes along the lineincreased transport capacity
effect on the national image boost national prestige
The sustainability evaluation is prospective in nature. For sustainable development, the relevantinternal and external factors are evaluated in scientific means, along with the realization and influenceof the project. In light of the evaluation results, one can give advice on how to promote sustainabledevelopment from the perspectives of technology, economy, society, and environment.
5. Unascertained Measure Theory
Uncertainty exists extensively in objective and subjective worlds; the uncertain informationincludes two basic meanings: randomness and ambiguity [40,41]. In 1836, Mill [42] proposed firstlythe concept of “uncertainty”. Stochastic problem was first proposed by the Soviet mathematicianKolmogorov in 1933, and he established probability theory and the axiomatic method [43]. In 1965,the concept of fuzzy information and fuzzy set theory was created by American scholar Zaden,who developed the study field of uncertainty [44]. Chinese scholar Deng founded the grey systemtheory in 1982 [45]. In 1991, Wang built a universal grey set on the basis of grey system theory;it involved a lot uncertain information [46]. Academician Wang, a famous Chinese scientist, put forwardvarious types of information concepts, namely, unascertained information in 1990, which are differentfrom random information and fuzzy information [47]. At present, there is a unified understandingof fuzzy information, random information, and gray information in uncertain information, but thereis no uniform definition for unascertained information. However, theorists basically agree thatunascertained information is the subjective uncertainty of decision makers because they lackinformation to determine the real state and quantity of the object. This creates subjective andcognitive uncertainty for decision makers due to the lack of objective information. It is fundamentallydifferent from concepts like randomness (which only deals with what happens in the future), fuzziness(which reflects the nature of a certain object that does not have a clear definition or an evaluationtarget), and grayness.
Thanks to the concerted efforts of scholars like Álvaro [48] and Wu [49], so far, a systematictheory and method have been developed for unascertained information, which was first proposed byAcademician Wang [47].
6. Establishment of Unascertained Measure Model
Set x1, x2, · · · , xn as evaluation objects of news sensitivity, set universe U = {x1, x2, · · · , xn}.The evaluation xi ∈ U (i = 1, 2, · · · , n) has m first indices I1, I2, · · · , Im and I = {I1, I2, · · · , Im}.For Ii ∈ I has k secondary evaluation indices Ii1, Ii2, · · · , Iik, and Ii = {Ii1, Ii2, · · · , Iik}. Therefore, xij can
be expressed as k dimensional vector xij ={
xij1, xij2, · · · , xijk
}, xijr means the value of the secondary
indices of Ij, which is xi’s first index. Each xijr has p evaluate grades c1, c2, · · · , cp, the evaluation spaceis C = {c1, c2, · · · , cp} [40,41].
Sustainability 2018, 10, 408 7 of 19
6.1. Single-Index Measure
6.1.1. Single-Index Measure Matrix
Set µijrq = µ(xijr ∈ cq
)to express the degree that xijr belongs to cq, which is the qth evaluation
class (rating). µmust meet the conditions as follows:
0 ≤ µ(xijrq ∈ cq
)≤ 1,i = 1, 2, · · · , n; j = 1, 2, · · · , m; r = 1, 2, · · · , k;q = 1, 2, · · · , p (1)
u(xijr ∈ C) = 1, i = 1, 2, · · · , n; j = 1, 2, · · · , m; r = 1, 2, · · · , k (2)
µ
(xijr ∈
q∪
l=1cl
)=
q
∑l=1µ(xijr ∈ cl
)q = 1, 2, · · · , p (3)
Define Equation (2) as the normalization and Equation (3) as the additivity. That which meetsthe three equations above is unascertained measurement. The matrix that follows is a single indexmeasure matrix [50].
(µijrq
)k×p
=
µij11 µij12 · · · µij1pµij21 µij22 · · · µij2p
· · · · · · . . . · · ·µijk1 µijk2 · · · µijkp
i = 1, 2, · · · , n; j = 1, 2, · · · , m (4)
6.1.2. Distinction Weight of Single-Index
Using the concept of information entropy to define the peak of index Iijr.
Vijr = 1 +1
lnp
p
∑q=1
µijrq lnµijrq (5)
p in Equation (5) represents the number of the evaluate ratings, µijrq is the measure of single index,and the value of Vijr expresses the degree that Iijr different to each evaluation class. The distinctionweight is as follows:
ωijr =Vijr
k∑
r=1Vijr
i = 1, 2, · · · , n; j = 1, 2, · · · , m; r = 1, 2, · · · , k (6)
k∑
r=1ωijr = 1, 0 ≤ ωijr ≤ 1,ωijr is the classification weights of Ijr. ωij =
(ωij1,ωij2, · · · ,ωijk
)is the
classification weight vector of secondary grade index [51].
6.2. First Grade Index Measure
Set µiq = µ(xi ∈ cq
)expresses the degree that sample xi belongs to cr, which is the rth evaluation
class (rating).
µiq =m
∑j=1ωijµijq;i = 1, 2, · · · , n; q = 1, 2, · · · , p (7)

Sustainability 2018, 10, 408 8 of 19
Due to 0 ≤ µiq ≤ 1, andp∑
q=1µiq =
p∑
q=1
m∑
j=1ωijµijq =
m∑
j=1ωij
p∑
q=1µijq =
m∑
j=1ωij = 1, µiq is the
unascertained measure. Define(µi1,µi2, · · · ,µip
)as measure evaluation vector of xi’s composite
indicator. The matrix(µiq
)n×p
is measure matrix of comprehensive index [52].
(µiq
)n×p
=
µ11 µ12 · · · µ1pµ21 µ22 · · · µ2p
· · · · · · . . . · · ·µn1 µn2 · · · µnp
(8)
6.3. Determination of First Grade Index Weight by AHP
AHP was proposed by Saaty, an American operational research expert, in the 1970s [53]. It isa method of combining qualitative and quantitative, systematized and hierarchical qualities. It is aprocess of modeling and quantifying decision makers’ decision thinking processes for complex systems.By using AHP, decision makers decompose the complex problems into several levels and factors,and make simple comparisons and calculations among the factors, so that they can get the weight ofdifferent plans and provide the basis for the best plan selection. In AHP, in order to make the judgmentquantified, the key is to quantitatively describe the relative superiority of any two schemes to a certaincriterion. For a single criterion, the comparison between the two plans can always demonstrate theadvantages and disadvantages. AHP adopts the 1–9 scale method to give the quantitative scale forthe evaluation of different situations. This scale is adopted in matrices to look for relative criteria’sweights and to compare the alternatives linked to every criterion. Table 3 summarizes the basic ratioscale. All final weighted coefficients are shown in matrices. Alternatives and criteria can be rankedbased on the overall aggregated weights in matrices. The alternative with the highest overall weightwould be the most preferable [28,54].
Table 3. Saaty’s scale for AHP pairwise comparisons [28,54].
Weight Description
1 equal importance3 moderately more important5 strongly more important7 very strongly more important9 dominant importance
2, 4, 6, 8 representing the intermediate values of the above adjacent judgmentsReciprocals anti-comparison
Based on this first index’s judgment matrix, the weights of every first grade index can be calculatedby the geometric calculation method of mean.
ωi = n
√√√√ n
∏j=1
aij (i = 1, 2, · · · , n; j = 1, 2, · · · , n) (9)
Then, by employing normalized processing, using the following equation:
ωi =ωi
n∑
i=1ωi
(10)
The weight vector of first index is obtained: ω = (ω1,ω2, · · · ,ωn)T.
Sustainability 2018, 10, 408 9 of 19
The largest characteristic roots λmax = 1n
n∑
i=1
(AW)iWi
can be calculated.
When solving practical problems, due to the complexity of objective phenomena and the mind’scognitive limitations, our understanding of the problem is subjective and involves one-sidedness andfuzzy judgment; the structure of the judgment matrix is, therefore, may not fully meet the requirementsof consistency, and often includes some deviation. The constructed judgement matrix does not alwaysmeet consistency condition. If the judgement matrix passes the consistency test, the calculated indexweight can be adopted; if the consistency test is not passed, the judgement matrix needs to be adjusted.The consistency index is divided into complete consistency (CI) and satisfactory consistency (CR),CI = λmax−n
n−1 .When CI = 0, the judgment matrix is considered to be completely consistent. CI 6= 0, it is
considered that the judgment matrix is not completely consistent. CR = CIRI , RI is the average random
consistency index, and the value of RI are shown in Table 4 for the judgment matrix of n = 1–14.
Table 4. The mean random consistency index.
Order 1 2 3 4 5 6 7 8 9 10 11 12 13 14
RI 0 0 0.52 0.86 1.10 1.26 1.34 1.40 1.43 1.49 1.51 1.54 1.56 1.58
6.4. Identification
When the evaluation level is divided in order, the maximum membership degree is no longerapplicable, so the credible degree criterion is usually adopted. For positive sequence partitioning,the confidence level is usually assumed to be λ (λ > 0.5), and the value of λ is 0.6 or 0.7. Set:
k0 = mink
{k :
k
∑l=1µil ≥ λ, k = 1, 2, · · · , p
}(11)
7. Case Study
7.1. Overview
This section applies the established index system to evaluate the sustainable development of theHarbin-Dalian PDL, a typical HSR project in China. Harbin-Dalian PDL is put into operation by theend of 2012, marking the basic formation of “Four Vertical” in the “Four Vertical and Four Horizontal”of Chinese railway mainline. Harbin-Dalian PDL had finished the connection with existing HSR lineof the Beijing-Shanghai and Beijing-Guangzhou. Since the operation of Harbin-Dalian PDL, it has notonly shortened the distance of Heilongjiang, Jilin, and Liaoning provinces, but it has also strengthenedregional economic integration.
Harbin-Dalian PDL runs through three provinces in Northeast China, 4 sub-provincial cities,and 6 prefecture-level cities. The total length stands at 921 km, including 553 km in Liaoning Province,270 km in Jilin Province, and 81 km in Heilongjiang Province. Harbin-Dalian PDL starts from Dalian,through Yingkou, Anshan, Liaoyang, Shenyang, Tieling, Siping, Changchun, and Songyuan, and finallyto Harbin (see Figure 4). According to the statistics of 2015, the 10 cities account for 40.90% oftourism resources, 46.53% of the population, and 59.87% of the total GDP in Northeast China [55].Since its opening, the railway has effectively stimulated tourism in the cities along its route and acrossNortheast China.

Sustainability 2018, 10, 408 10 of 19
1
Figure 4. Images of Harbin-Dalian PDL in China.
Harbin-Dalian PDL is the most advanced technology integration of China’s HSR, and its operationhas become the most powerful explanation for China’s export of “China Railway High-speed” tocountries along “the Belt and Road”.
Through the investigation and analysis of the HSR construction project, the comprehensiveevaluation index can be divided into 5 grades: V = {very poor, poor, qualified, good, excellent},correspond to V = {v1, v2, v3, v4, v5}. The direct choice of experts is given according to themulti-layered set of factors, and the number of experts supported as judgement of the index. In lightof Saaty’s 1–9 ratio scale estimation, V = {1, 3, 5, 7, 9} .
The secondary indices are quantified based on the basic data and expert scoring (by an expertpanel consisting of 10 experts in the industry). The single measure vectors of the third indices(See Table 5) are obtained in light of the scores and the membership degree equation.
Thus, according to the vector measures, the measurement matrix of the secondary index isestablished as follows:
I1 : µ1 =
0 0 0.2 0.5 0.30 0 0.2 0.5 0.30 0 0 0.5 0.50 0 0 0.5 0.50 0 0.1 0.5 0.40 0 0 0.7 0.30 0.1 0.3 0.5 0.10 0 0 0.6 0.40 0 0.2 0.5 0.30 0 0 0.7 0.3
I2 : µ2 =
0 0 0.1 0.5 0.40 0.1 0.2 0.4 0.30 0 0 0.6 0.40 0.4 0.5 0.1 00 0 0.2 0.6 0.20 0 0.2 0.6 0.2

Sustainability 2018, 10, 408 11 of 19
I3 : µ3 =
0 0 0 0.6 0.40 0 0 0.8 0.20 0 0.1 0.6 0.30 0 0.2 0.6 0.20 0 0.1 0.6 0.30 0 0 0.5 0.50 0.1 0.2 0.6 0.10 0 0.1 0.7 0.20 0 0.1 0.5 0.40 0.1 0.1 0.5 0.3
I4 : µ4 =
0 0 0.1 0.7 0.20 0 0 0.6 0.40 0 0.1 0.6 0.30 0 0 0.7 0.30 0 0 0.6 0.40 0 0.1 0.6 0.3
Table 5. The weights of hierarchy and expert scoring results.
TotalIndex
FirstIndex
SecondaryIndex Third Index
Evaluation Results of 10 Experts
Very Poor Poor Qualified Good Excellent
X
F1(0.300)
S1(0.341)
T1 (0.305) 0 0 2 5 3T2 (0.37) 0 0 2 5 3T3 (0.325) 0 0 0 5 5
S2(0.361)
T4 (0.087) 0 0 0 5 5T5 (0.285) 0 0 1 5 4T6 (0.306) 0 0 0 7 3T7 (0.225) 0 1 3 5 1T8 (0.097) 0 0 0 6 4
S3(0.298)
T9 (0.6) 0 0 2 5 3T10 (0.4) 0 0 0 7 3
F2(0.339)
S4(0.25)
T11 (0.5) 0 0 1 5 4T12 (0.5) 0 1 2 4 3
S5(0.75)
T13 (0.532) 0 0 0 6 4T14 (0.127) 0 4 5 1 0T15 (0.172) 0 0 2 6 2T16 (0.169) 0 0 2 6 2
F3(0.251)
S6(0.75)
T17 (0.08) 0 0 0 6 4T18 (0.095) 0 0 0 8 2T19 (0.091) 0 0 1 6 3T20 (0.139) 0 0 2 6 2T21 (0.157) 0 0 1 6 3T22 (0.125) 0 0 0 5 5T23 (0.215) 0 1 2 6 1T24 (0.098) 0 0 1 7 2
S7(0.25)
T25 (0.75) 0 0 1 5 4T26 (0.25) 0 1 1 5 3
F4(0.110)
S8(0.5)
T27 (0.199) 0 0 1 7 2T28 (0.386) 0 0 0 6 4T29 (0.415) 0 0 1 6 3
S9(0.5)
T30 (0.182) 0 0 0 7 3T31 (0.428) 0 0 0 6 4T32 (0.39) 0 0 1 6 3
Sustainability 2018, 10, 408 12 of 19
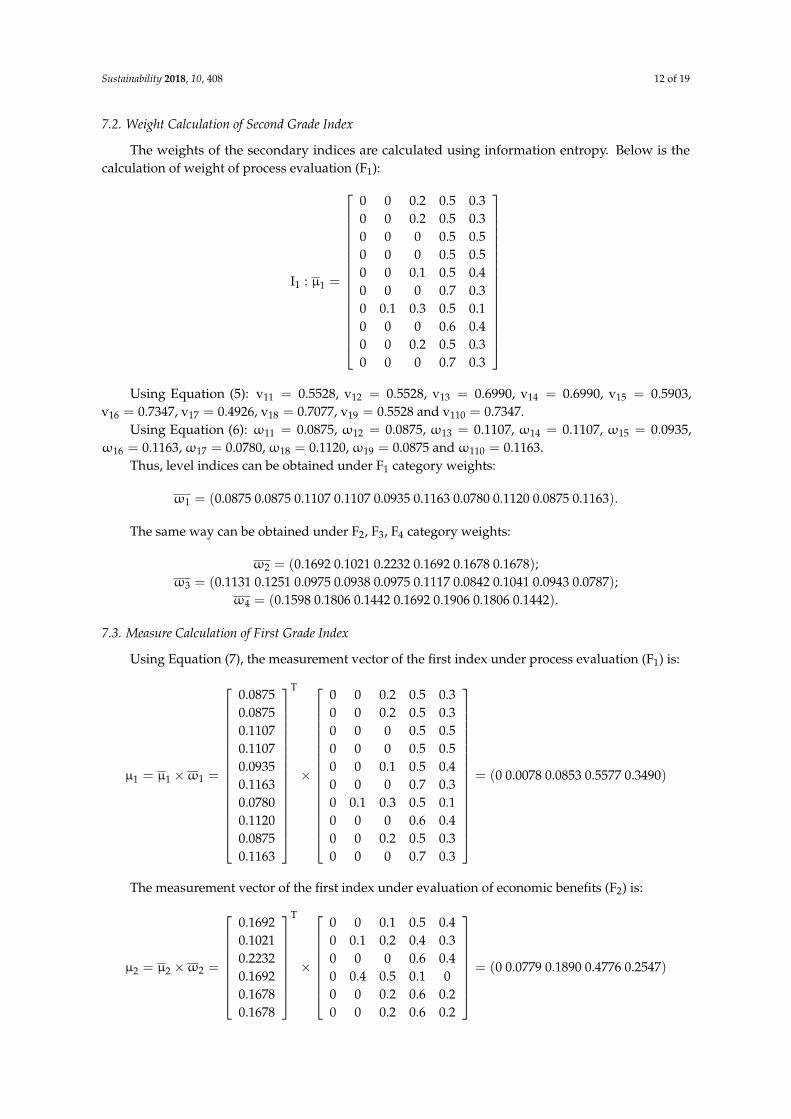
7.2. Weight Calculation of Second Grade Index
The weights of the secondary indices are calculated using information entropy. Below is thecalculation of weight of process evaluation (F1):
I1 : µ1 =
0 0 0.2 0.5 0.30 0 0.2 0.5 0.30 0 0 0.5 0.50 0 0 0.5 0.50 0 0.1 0.5 0.40 0 0 0.7 0.30 0.1 0.3 0.5 0.10 0 0 0.6 0.40 0 0.2 0.5 0.30 0 0 0.7 0.3
Using Equation (5): v11 = 0.5528, v12 = 0.5528, v13 = 0.6990, v14 = 0.6990, v15 = 0.5903,
v16 = 0.7347, v17 = 0.4926, v18 = 0.7077, v19 = 0.5528 and v110 = 0.7347.Using Equation (6): ω11 = 0.0875, ω12 = 0.0875, ω13 = 0.1107, ω14 = 0.1107, ω15 = 0.0935,
ω16 = 0.1163,ω17 = 0.0780,ω18 = 0.1120,ω19 = 0.0875 andω110 = 0.1163.Thus, level indices can be obtained under F1 category weights:
ω1 = (0.0875 0.0875 0.1107 0.1107 0.0935 0.1163 0.0780 0.1120 0.0875 0.1163).
The same way can be obtained under F2, F3, F4 category weights:
ω2 = (0.1692 0.1021 0.2232 0.1692 0.1678 0.1678);ω3 = (0.1131 0.1251 0.0975 0.0938 0.0975 0.1117 0.0842 0.1041 0.0943 0.0787);
ω4 = (0.1598 0.1806 0.1442 0.1692 0.1906 0.1806 0.1442).
7.3. Measure Calculation of First Grade Index
Using Equation (7), the measurement vector of the first index under process evaluation (F1) is:
µ1 = µ1 ×ω1 =
0.08750.08750.11070.11070.09350.11630.07800.11200.08750.1163
T
×
0 0 0.2 0.5 0.30 0 0.2 0.5 0.30 0 0 0.5 0.50 0 0 0.5 0.50 0 0.1 0.5 0.40 0 0 0.7 0.30 0.1 0.3 0.5 0.10 0 0 0.6 0.40 0 0.2 0.5 0.30 0 0 0.7 0.3
= (0 0.0078 0.0853 0.5577 0.3490)
The measurement vector of the first index under evaluation of economic benefits (F2) is:
µ2 = µ2 ×ω2 =
0.16920.10210.22320.16920.16780.1678
T
×
0 0 0.1 0.5 0.40 0.1 0.2 0.4 0.30 0 0 0.6 0.40 0.4 0.5 0.1 00 0 0.2 0.6 0.20 0 0.2 0.6 0.2
= (0 0.0779 0.1890 0.4776 0.2547)
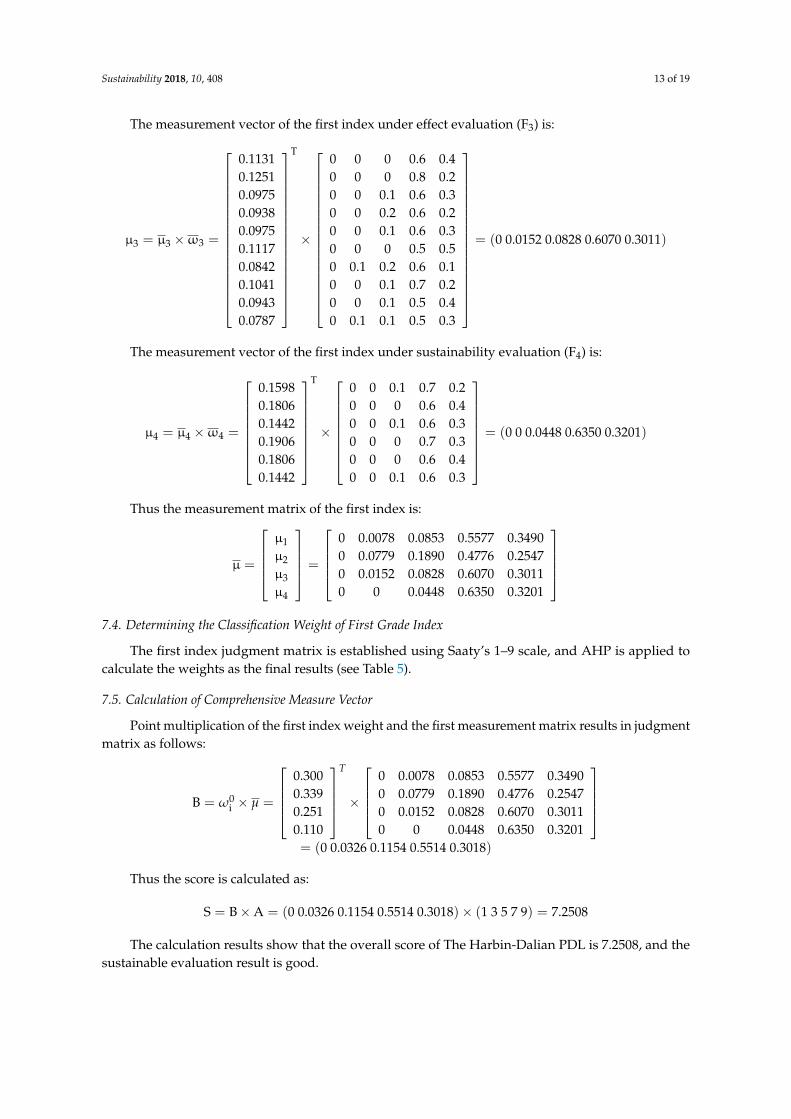
Sustainability 2018, 10, 408 13 of 19
The measurement vector of the first index under effect evaluation (F3) is:
µ3 = µ3 ×ω3 =
0.11310.12510.09750.09380.09750.11170.08420.10410.09430.0787
T
×
0 0 0 0.6 0.40 0 0 0.8 0.20 0 0.1 0.6 0.30 0 0.2 0.6 0.20 0 0.1 0.6 0.30 0 0 0.5 0.50 0.1 0.2 0.6 0.10 0 0.1 0.7 0.20 0 0.1 0.5 0.40 0.1 0.1 0.5 0.3
= (0 0.0152 0.0828 0.6070 0.3011)
The measurement vector of the first index under sustainability evaluation (F4) is:
µ4 = µ4 ×ω4 =
0.15980.18060.14420.19060.18060.1442
T
×
0 0 0.1 0.7 0.20 0 0 0.6 0.40 0 0.1 0.6 0.30 0 0 0.7 0.30 0 0 0.6 0.40 0 0.1 0.6 0.3
= (0 0 0.0448 0.6350 0.3201)
Thus the measurement matrix of the first index is:
µ =
µ1µ2µ3µ4
=
0 0.0078 0.0853 0.5577 0.34900 0.0779 0.1890 0.4776 0.25470 0.0152 0.0828 0.6070 0.30110 0 0.0448 0.6350 0.3201
7.4. Determining the Classification Weight of First Grade Index
The first index judgment matrix is established using Saaty’s 1–9 scale, and AHP is applied tocalculate the weights as the final results (see Table 5).
7.5. Calculation of Comprehensive Measure Vector
Point multiplication of the first index weight and the first measurement matrix results in judgmentmatrix as follows:
B = ω0i × µ =
0.3000.3390.2510.110
T
×
0 0.0078 0.0853 0.5577 0.34900 0.0779 0.1890 0.4776 0.25470 0.0152 0.0828 0.6070 0.30110 0 0.0448 0.6350 0.3201
= (0 0.0326 0.1154 0.5514 0.3018)
Thus the score is calculated as:
S = B×A = (0 0.0326 0.1154 0.5514 0.3018)× (1 3 5 7 9) = 7.2508
The calculation results show that the overall score of The Harbin-Dalian PDL is 7.2508, and thesustainable evaluation result is good.

Sustainability 2018, 10, 408 14 of 19
7.6. Confidence Level Recognition
Confidence level recognition is performed using Equation (11) and the calculated comprehensivemeasurement vector. Here, λ is set as 0.7:
When λ = 0.7, k0 = mink∑
l=1µil ≥ 0.7, k = 5; it shows that the confidence level recognition is good.
7.7. Result Discussion
According to the evaluation of the primary evaluation indices, the measurement vectors of processevaluation (F1), economic benefits (F2), effect evaluation (F3) and sustainability evaluation (F4) wereall good. Thus, the results were discussed in the four aspects below.
7.7.1. Process Evaluation
In terms of process, the project performs well in decision-making, construction and operation.Good decision-making is revealed in route selection, as the railway links up four importantsub-provincial cities and six prefecture-level cities. Moreover, the project lives up to all the technicalrequirements, especially the solution to frost heaving and snow accumulation. Since the railway wasput into service, almost all performance parameters (e.g., ridership, operating cost, and equipmentutilization) have reached the desired level.
Nonetheless, the project lags behind in investment control, mainly because of the constructiondifficulty and the management structure. (1) Construction difficulty: The Harbin-Dalian PDL, as theworld’s first HSR in severe cold region, was constructed with the strictest standards. Due to thelack of precedent, the project budget was poorly estimated. For example, the cost of frost heavingcontrol was not even included in the budget. (2) Management structure: The government is thesole financier of the project, and any attempt to reform the financing mode requires governmentapproval. The investment is managed in a backward way with unclear responsibilities. What is worse,the investment and financing risk is poorly controlled. Specifically, the ticket pricing mechanism isunreasonable, the funds utilization is not well supervised, the relevant polices and regulations areincomplete, and the local governments fail to provide a good risk control platform.
7.7.2. Economic Benefits
In terms of economic benefits, the project boasts good financial and economic benefits. The PDLhas contributed to the regional GDP, optimized resource allocation and utilization, acceleratedindustrial restructuring, and motivated tourism and other tertiary industries along its route.
However, due to high investment and heavy loans, the early phase of operation is overshadowedby huge pressure of repayment, resulting in poor financial performance. The financial dilemmais partially attributable to the outdated management mode. In Harbin-Dalian PDL, the railwaynetwork infrastructure (network) and the passenger/freight transportation (transportation) are stillmanaged by the same entity. This goes against the more efficient and rational management mode of“separation between network and transportation” [56]. The new mode encourages competition andyields more profits.
7.7.3. Effect Evaluation
In terms of effect, the project has exerted fairly good social and environmental effects. The socialeffect is manifested by the optimized transport capacity and structure in the region, as well as theshorter travel time and rising income of local residents. As for the environmental effect, the pollution,noise, and electromagnetic radiation should be better despite the overall good environmentalperformance of the railway. In particular, the noise and radiation generated during the operation ofthe railway has disturbed the daily life of the residents.
Sustainability 2018, 10, 408 15 of 19
To eliminate the noise effect, noise barriers should be installed along the route. The barriersmust be able to suppress the noise on both sides of the railway from 65~75 dB to about 30~40 dB,such that the residents living along the route can sleep well at night. When the railway passes throughthe urban areas, it should be covered like a tunnel. The top cover can be made of cement of suitablethickness, and the supports can be made of steel mesh. Another solution is to build an undergroundtunnel for the railway in the urban areas. This approach can basically eliminate the negative effect onthe environment along the route, but it is too costly to realize. Therefore, the basic principle of HSRconstruction is to maximize the use of overhead viaducts and avoidance of densely populated areas.
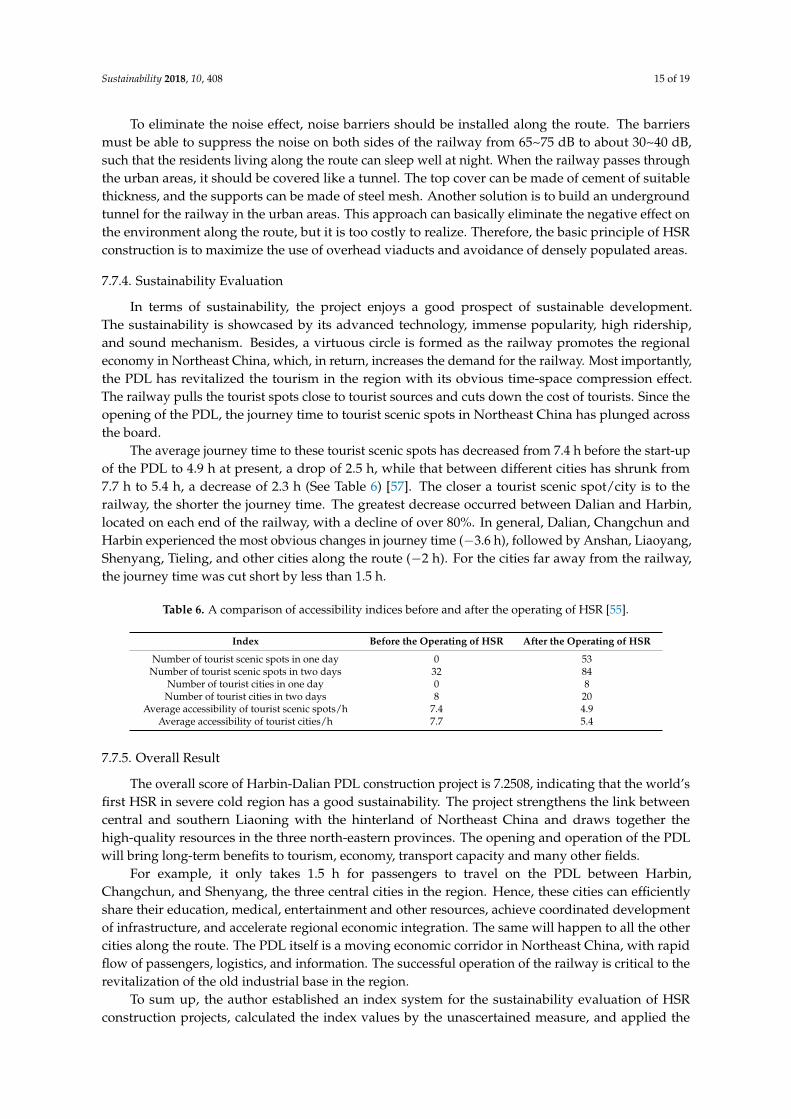
7.7.4. Sustainability Evaluation
In terms of sustainability, the project enjoys a good prospect of sustainable development.The sustainability is showcased by its advanced technology, immense popularity, high ridership,and sound mechanism. Besides, a virtuous circle is formed as the railway promotes the regionaleconomy in Northeast China, which, in return, increases the demand for the railway. Most importantly,the PDL has revitalized the tourism in the region with its obvious time-space compression effect.The railway pulls the tourist spots close to tourist sources and cuts down the cost of tourists. Since theopening of the PDL, the journey time to tourist scenic spots in Northeast China has plunged acrossthe board.
The average journey time to these tourist scenic spots has decreased from 7.4 h before the start-upof the PDL to 4.9 h at present, a drop of 2.5 h, while that between different cities has shrunk from7.7 h to 5.4 h, a decrease of 2.3 h (See Table 6) [57]. The closer a tourist scenic spot/city is to therailway, the shorter the journey time. The greatest decrease occurred between Dalian and Harbin,located on each end of the railway, with a decline of over 80%. In general, Dalian, Changchun andHarbin experienced the most obvious changes in journey time (−3.6 h), followed by Anshan, Liaoyang,Shenyang, Tieling, and other cities along the route (−2 h). For the cities far away from the railway,the journey time was cut short by less than 1.5 h.
Table 6. A comparison of accessibility indices before and after the operating of HSR [55].
Index Before the Operating of HSR After the Operating of HSR
Number of tourist scenic spots in one day 0 53Number of tourist scenic spots in two days 32 84
Number of tourist cities in one day 0 8Number of tourist cities in two days 8 20
Average accessibility of tourist scenic spots/h 7.4 4.9Average accessibility of tourist cities/h 7.7 5.4
7.7.5. Overall Result
The overall score of Harbin-Dalian PDL construction project is 7.2508, indicating that the world’sfirst HSR in severe cold region has a good sustainability. The project strengthens the link betweencentral and southern Liaoning with the hinterland of Northeast China and draws together thehigh-quality resources in the three north-eastern provinces. The opening and operation of the PDLwill bring long-term benefits to tourism, economy, transport capacity and many other fields.
For example, it only takes 1.5 h for passengers to travel on the PDL between Harbin,Changchun, and Shenyang, the three central cities in the region. Hence, these cities can efficientlyshare their education, medical, entertainment and other resources, achieve coordinated developmentof infrastructure, and accelerate regional economic integration. The same will happen to all the othercities along the route. The PDL itself is a moving economic corridor in Northeast China, with rapidflow of passengers, logistics, and information. The successful operation of the railway is critical to therevitalization of the old industrial base in the region.
To sum up, the author established an index system for the sustainability evaluation of HSRconstruction projects, calculated the index values by the unascertained measure, and applied the

Sustainability 2018, 10, 408 16 of 19
established model to evaluate the sustainability of Harbin-Dalian PDL. The evaluation resultsare consistent with the actual construction and operation status of the PDL, an evidence for therationality and feasibility of the index system. The index system can improve the design, construction,and operation of HSR, and strengthen its ability to resist risks. The development of HSR plays animportant role in increasing economic vitality, it is in line with the needs of the sustainable developmentof China’s economy. HSR will become the backbone transportation mode in the modern and integratedtransportation system. We will further the planning and construction of HSR network, enrich therailway transportation infrastructure of “the Belt and Road”, accelerate China’s HSR going out pace.
8. Conclusions
Considering the various influencing factors on HSR sustainability, this paper created an evaluationindex system from four primary aspects: process, economic benefits, effect, and sustainability.Then, the unascertained measure was introduced for comprehensive evaluation. The main conclusionsand innovation points of this research are listed as follows.
(1) The AHP was adopted to realize simultaneous qualitative and quantitative evaluations ofinfluencing factors. Then, the weights were assigned in a rational and consistent manner, such thatthe importance of each index was measured correctly. This reflects the significance differentamong evaluation factors in the sustainability evaluation system.
(2) The sustainability evaluation shows that the Harbin-Dalian PDL project achieved good resultsin process, economic benefits, effects, and sustainability, thanks to the excellent performance ofdecision-making, construction and operation. The opening and operation of the PDL will bringlong-term benefits to tourism, the economy, transport capacity, and many other fields.
(3) In spite of its good overall sustainability, the Harbin-Dalian PDL project needs to further increaseits economic benefits and reduce its negative environmental effect. For this purpose, it is necessaryto adopt the management mode of “separation between network and transportation” and applynoise prevention measures like noise barriers, tunnels, and overhead viaducts.
(4) Facing the increasingly rapid development and construction of HSR, the sustainability evaluationof HSR construction projects needs to learn from the relatively mature research methods at homeand abroad, in order to make up for the shortcomings of the existing research methods in terms ofbreadth and accuracy. The scientific evaluation system should be constructed to make the citationand index selection more scientific in the empirical research, and to strengthen the predictionof the impact capacity of the future construction of HSR, not just to analyze the impact of theexisting HSR.
All in all, this research lays a solid basis for the sustainability evaluation of HSR constructionprojects and simplifies the modelling process for designers of HSR.
Acknowledgments: The authors gratefully acknowledge financial support from National Science and TechnologyBasic Work of Special Key Projects (2017FY10130), supported by National Natural Science Foundation of China(41511130033), supported by Research project of the Chinese Academy of Sciences (Y66Q034).
Author Contributions: This paper presents a team work research result written by the co-authors, Yongzhi Chang,Yang Yang, and Suocheng Dong. Suocheng Dong conceived and designed the study; Yongzhi Chang and Yang Yanganalyzed the HSR construction project the data. With cross discussions of the research results, the co-authors havecontributed substantially to the work reported.
Conflicts of Interest: The authors declare no conflict of interest.
References
1. Yao, E.J.; Yang, Q.R.; Zhang, Y.S.; Sun, X.A. Study on high-speed rail pricing strategy in the context ofmodes competition. Discret. Dyn. Nat. Soc. 2013, 2013, 4–9. [CrossRef]
2. Wang, Y.H.; Deng, X.M.; Marcucci, D.J.; Le, Y.E. Sustainable development planning of protected areas nearcities: Case study in China. J. Urban Plan. Dev. 2013, 139, 133–143. [CrossRef]
Sustainability 2018, 10, 408 17 of 19
3. Ericson, J.A. A participatory approach to conservation in the Calakmul Biosphere Reserve, Campeche, Mexico.Landsc. Urban Plan. 2006, 74, 242–266. [CrossRef]
4. Jansson, Å. Reaching for a sustainable, resilient urban future using the lens of ecosystem services. Ecol. Econ.2013, 86, 285–291. [CrossRef]
5. The State Council of the People’s Republic of China. About Print and Distribute “the Notice of NationalResources City Sustainable Development Planning (2013–2020)” [EB/OL]. The Central Government PortalWebsite. Available online: http://www.gov.cn/zwgk/2013-12/03/content_2540070.htm (accessed on3 December 2013).
6. Moretti, L.; Moretti, M.; Ricci, S. Upgrading of Florence public transport to incorporate new tramlines.Ing. Ferrov. 2017, 72, 569–584.
7. Arduin, J.P.; Ni, J.C. French TGV network development. Jpn. Railw. Trans. Rev. 2005, 40, 22–28.8. Huang, Y.; Ge, Y.J.; Ma, T.; Liu, X.F. Geopolitical space of China’s high-speed railway diplomacy. Prog. Geogr.
2017, 36, 1489–1499.9. Wu, H.; Liu, W.; Choul, K.S. The strategic marketing of China high-speed railway: Government behavior or
market behavior. J. Mark. Stud. 2017, 25, 185–194.10. Lin, Y.T. Travel costs and urban specialization patterns: Evidence from China’s high speed railway system.
J. Urban Econ. 2017, 98, 98–123. [CrossRef]11. Li, H.; Zhang, P.Y.; Cheng, Y.Q. Economic vulnerability of mining city—A case study of Fuxin City,
Liaoning Province, China. Chin. Geogr. Sci. 2009, 19, 211–218. [CrossRef]12. Hayter, R.; Barnes, T.J. Labor market segmentation, flexibility and recession: A British Colombian case study.
Environ. Plan. 1992, 10, 333–353. [CrossRef]13. Randall, J.E.; Ironside, R.G. Communities on the edge: An economic geography of resource-dependent
communities in Canada. Can. Geogr. 1996, 40, 17–35. [CrossRef]14. Hilson, G. Sustainable development policies in Canada mining sector: An overview of government and
industry efforts. Environ. Sci. Policy 2003, 3, 110.15. Jin, X.F.; Dong, S.C.; Liu, W.; Li, X. Study on relationship between industrial chain extension and evolution
of resource-based city—A case study on Tongling city. Econ. Geogr. 2010, 30, 403–408.16. Swaine, M.D. Chinese Views and Commentary on the “One Belt, One Road” Initiative. China Leadersh. Monit.
2015, 1, 1–24.17. Greene, D.L.; Wegener, M. Sustainable transport. J. Transp. Geogr. 1997, 5, 177–190. [CrossRef]18. Hoogma, R.; Kemp, R.; Schot, J.; Truffer, B. Experimenting for sustainable transport: The Approach of
Strategic Niche Management. Technol. Anal. Strateg. 2002, 23, 517–518.19. Litman, T. Developing Indicators for comprehensive and sustainable transport planning. Transp. Res. Rec. J.
Transp. Res. Board 2007, 43, 10–15. [CrossRef]20. Elvik, R. The non-linearity of risk and the promotion of environmentally sustainable transport. Accid. Anal. Prev.
2009, 41, 849–855. [CrossRef] [PubMed]21. Hickman, R. Automobility in transition: A socio-technical analysis of sustainable transport. Transp. Rev.
2012, 33, 128–129. [CrossRef]22. O’Brien, O.; Cheshire, J.; Batty, M. Mining bicycle sharing data for generating insights into sustainable
transport systems. J. Transp. Geogr. 2014, 34, 262–273. [CrossRef]23. Chang, Y.Z.; Dong, S.C. Study on green ecological assessment of high-speed railway construction project
based on unascertained measure and AHP. Teh. Vjesn. 2017, 24, 1579–1589.24. Liu, Y.H. Study on Sustainable Development of China’s High-Speed Railways; Press of University of Chinese
Academy of Sciences: Beijing, China, 2014.25. Litman, T.; Burwell, D. Issues in sustainable transportation. Int. J. Glob. Environ. 2006, 6, 331–347. [CrossRef]26. Chen, X.Y.; Chang, Y.L. The Study of evacuation passenger service level of Shanghai-Nanjing high-speed
railway stations. Procedia Soc. Behav. Sci. 2013, 96, 265–269. [CrossRef]27. Chang, Y.Z.; Dong, S.C. Study on Post Evaluation of High-Speed Railway Based on FAHP and Matlab
Simulation Calculation. Teh. Vjesn. 2017, 24, 1749–1758.28. Moretti, L.; Di Mascio, P.; Bellagamba, S. Environmental, human health and socio-economic effects of
cement powders. Int. J. Environ. Res. Public Health 2017, 14, 645. [CrossRef] [PubMed]29. Chen, J.H.; Yang, L.R.; Su, M.C.; Lin, J.Z. A rule extraction based approach in predicting derivative use for
financial risk hedging by construction companies. Expert Syst. Appl. 2010, 37, 6510–6514. [CrossRef]
Sustainability 2018, 10, 408 18 of 19
30. Wang, Y.M.; Elhag, T.M.S. Fuzzy TOPSIS method based on alpha level sets with an application to bridgerisk assessment. Expert Syst. Appl. 2006, 31, 309–319. [CrossRef]
31. Cucala, A.P.; Fernández, A.; Sicre, C.; Domínguez, M. Fuzzy optimal schedule of high-speed train operationto minimize energy consumption with uncertain delays and driver’s behavioral response. Eng. Appl. Intell.2012, 25, 1548–1557. [CrossRef]
32. Chen, S.K.; Leng, Y.; Mao, B.H.; Liu, S. Integrated weight-based multi-criteria evaluation on transfer in largetransport terminals: A case study of the Beijing South Railway Station. Transp. Res. Part A Policy Pract. 2014,66, 13–26. [CrossRef]
33. Luca, D.M.; Dell’Acqua, G.; Lamberti, R. High-speed rail track design using GIS and multi-criteria analysis.Procedia Soc. Behav. Sci. 2012, 54, 608–617. [CrossRef]
34. Liu, P.; Yang, L.X.; Gao, Z.Y.; Li, S.K.; Gao, Y. Fault tree analysis combined with quantitative analysis forhigh-speed railway accidents. Saf. Sci. 2015, 79, 344–357. [CrossRef]
35. Di Mascio, P.; Loprencipe, G.; Maggioni, F. Visco-elastic modeling for railway track structure layers.Ing. Ferrov. 2014, 69, 207–222.
36. D’Andrea, A.; Loprencipe, G.; Xhixha, E. Vibration induced by rail traffic: Evaluation of attenuationproperties in a bituminous sub-ballast layer. Procedia Soc. Behav. Sci. 2012, 53, 245–255. [CrossRef]
37. Zoccali, P.; Cantisani, G.; Loprencipe, G. Ground-vibrations induced by trains: Filled trenches mitigationcapacity and length influence. Constr. Build. Mater. 2015, 74, 1–8. [CrossRef]
38. Ministry of Housing and Urban-Rural Development of the PRC; National Development and ReformCommission of the PRC; Ministry of Railways of the PRC. Railway Construction Project Economic EvaluationMethods and Parameters, 3nd ed.; China Planning Press: Beijing, China, 2012.
39. Shuai, B.; Huang, W.C.; Li, M.L.; Wang, S.; Li, K.N. Railway benefit assessment summary of the World Bankand the Asian Development Bank. J. Transp. Syst. Eng. Inf. Technol. 2017, 3, 222–228.
40. Chang, Y.Z.; Dong, S.C. Evaluation of sustainable development of resources-based cities in Shanxi Provincebased on unascertained measure. Sustainability 2016, 8, 585. [CrossRef]
41. Chang, Y.Z.; Dong, S.C. Study on evaluation model of international trade in agricultural products based onunascertained measure. Chem. Eng. Trans. 2016, 51, 673–678.
42. Mill, J. Whether political economy is useful? Lond. Rev. 1836, 2, 535–572.43. Kolmogorov, A.H. Foundations of the Theory Probability, 2nd ed.; Chelsea Publishing Company: New York,
NY, USA, 1956.44. Zaden, L.A. Fuzzy sets. Inf. Control 1965, 8, 338–353.45. Deng, J.L. The Grey System (Society Economic); National Defence Industry Press: Beijing, China, 1985.46. Wang, Q.Y. Grey Mathematical Basis; HUST Press: Wuhan, China, 1996.47. Wang, G.Y. Unascertained information and its mathematical treatment. J. Harbin. Univ. Civ. Eng. Archit.
1990, 4, 1–3.48. Álvaro, F.; Sánchez, J.A.; Benedí, J.M. An integrated grammar-based approach for mathematical expression
recognition. Pattern Recognit. 2016, 51, 135–147. [CrossRef]49. Wu, H.B.; Xu, J.H.; Ji, Y.; Wu, M. Uncertain flow calculations of a distribution network containing DG based
on blind number theory. IET Gener. Transm. Distrib. 2017, 11, 1591–1597. [CrossRef]50. Chen, X.; Liu, Y.; Zhao, X.; Liang, Y.X. Coal industry international competitiveness research. Adv. Sci. Technol. Lett.
2016, 121, 222–226.51. Guo, C.Y.; Liu, Z.Q.; Zhang, C.Y. Evaluation on the express enterprise’s service quality of customers
perception based on SPSS and unascertained measure model. Int. J. U E Ser. Sci. Technol. 2016, 9, 17–26.52. Li, S.C.; Wu, J.N.; Xu, Z.H.; Li, L.P. Unascertained measure model of water and mud inrush risk evaluation
in karst tunnels and its engineering application. KSCE J. Civ. Eng. 2017, 21, 1170–1182. [CrossRef]53. Saaty, T.L. The Analytic Hierarchy Process; McGraw-Hill: New York, NY, USA, 1980.54. Javid, P.J.; Nejat, A.; Hayhoe, K. Selection of CO2 mitigation strategies for road transportation in the United
States using a multi-criteria approach. Renew. Sustain. Energy Rev. 2014, 38, 960–972. [CrossRef]55. National Bureau of Statistics. International City Statistical Yearbook 2016; China Statistics Press: Beijing, China, 2016.56. Di Mascio, P.; Loprencipe, G.; Moretti, L. Competition in rail transport: Methodology to evaluate economic
impact of new trains on track. Sustainability, Eco-Efficiency and Conservation in Transportation InfrastructureAsset Management. In Proceedings of the 3rd International Conference on Transportation Infrastructure(ICIT), Pisa, Italy, 27 April 2014; pp. 669–675.

Sustainability 2018, 10, 408 19 of 19
57. Guo, J.K.; Wang, S.B.; Wang, H.; Liu, T.B. Impact of Harbin-Dalian high-speed railway on the spatialdistribution of tourism supply and demand markets in Northeast China cities: Based on the accessibility ofthe scenic spots. Prog. Geogr. 2016, 35, 504–514.
© 2018 by the authors. Licensee MDPI, Basel, Switzerland. This article is an open accessarticle distributed under the terms and conditions of the Creative Commons Attribution(CC BY) license (http://creativecommons.org/licenses/by/4.0/).