Science for Sustainability
416
Science for Sustainability International Scientific Conference for PhD Students University of West Hungary Győr, March 19-20, 2013 Proceedings
-
Upload
khangminh22 -
Category
Documents
-
view
0 -
download
0
Transcript of Science for Sustainability
Science for Sustainability
International Scientific Conference for PhD Students University of West Hungary
Győr, March 19-20, 2013
Proceedings


Science for Sustainability International Scientific Conference for PhD Students
University of West Hungary Győr, March 19-20, 2013
Proceedings
Edited by Miklós Neményi
László Varga Ferenc Facskó Ildikó Lőrincz
(University of West Hungary)
University of West Hungary Press
Sopron

Publication of this book was made possible by TÁMOP 4.2.2.B–10/1–2010–0018 project entitled
TALENTUM – Comprehensive development of conditions for student talent management at the University of West Hungary .
Research work of professional staff in the Doctoral School for Environmental Sciences was supported by
TÁMOP 4.2.2.A–11/1/KONV–2012–0013 project entitled AGRÁRKLÍMA – Impact assessment of projected climatic changes and
adaptation possibilities in the forestry and agrarian sectors.
This work is licensed under a Creative Commons
Attribution-NonCommercial 3.0 Unported License. University of West Hungary, Sopron, 2013
ISBN 978-963-334-103-2

5
Contents Foreword ............................................................................................................................................................................ 11 STAFFORD, J. V.: Precision agriculture: meeting current challenges...............................................................13 József Cziráki Doctoral School of Wood Sciences and Technologies Section 1.1 Structure and Properties of Wood BABIAK, M.: Rheology model of wood.........................................................................................................................15 ŠTRBOVÁ, M. – WESSERLE, F. – KÚDELA, J.: Contact angle measurement on wood by
drop shape analysis .................................................................................................................................................16 PAPP É. A. – CSIHA Cs.: Surface energy analysis of sanded and planed wood surfaces ............................. 22 VALENT, J. – CSIHA Cs.: The surface tension of some solid wood surfaces heat treated in oil ............... 28 HALACHAN, P. – HRČKA, R.: Diffusion coefficients of water in coniferous wood........................................ 34 LONSTAK N. – SZABÓ P.: Fire protection of wood structures............................................................................. 39 BURAWSKA, I. – ZBIEĆ, M. – BEER, P.: Rational and efficient utilization of wood stock
by repair engineering............................................................................................................................................. 44 KLARIĆ, M. – PERVAN, S. – ŠPANIĆ, N. – BIČANIĆ, K.: Characterization of oven-dry
oak wood (Quercus robur L.) emissivity in LWIR Spectral Waveband................................................. 49 GÖNCZ B. – DIVÓS F.: Detecting red heart in beech (Fagus sylvatica L.) ....................................................... 54 Section 1.2 Processing and Utilization of Wood HAPLA, F.: Availability and processing of wood in the future ........................................................................... 59 ROZANSKA, A. – BEER, P.: Sustainable wood parquet finishing by means of oils and waxes ................... 60 SCHLOSSER M. – ALPÁR T. L.: Developing building materials from cement-bonded
reed and straw composites .................................................................................................................................. 68 ĽALÍK, J. – JAROVEK, Ľ.: Dependence of the axial force from the clearance angle and feed speed ......... 76 TSALAGKAS, D. – CSÓKA L.: BCNs films and its potential as energy harvesting material...........................81 NAGY V. – BOŽANIĆ, D. K. – DIMITRIJEVIĆ-BRANKOVIĆ, S. – LUYT, A. S. – GROZDITS, G. –
DJOKOVIĆ, V. – CSÓKA L.: Viscoelastic properties and antimicrobial activity of cellulose fiber sheets impregnated with Ag nanoparticles ....................................................................... 87
MIKLEČIĆ, J. – JIROUŠ-RAJKOVIĆ, V. – ŠPANIĆ, N.: Usage of stains with incorporated TiO2 and ZnO nanoparticles in finishing of thermally modified wood ................................................ 93
ŠPANIĆ, N. – JAMBREKOVIĆ, V. – KLARIĆ, M. – MIKLEČIĆ, J.: Possibilities of bio matrices synthesis from waste MDF boards ................................................................................................. 99

6
Pál Kitaibel Doctoral School of Environmental Sciences Section 2.1 Application of Geoinformatics in Environment Sciences STROBL, J.: From organizing geospatial information to organizing information geospatially .............105 KOLLÁR SZ. – VEKERDY Z. – MÁRKUS B.: Geostatistical characterization of wetland habitats ..............106 KONDRACKI, K. – STRZELIŃSKI, P. – SULŁKOWSKI, S.: Estimating the accuracy of DHB
measurements in the Scots pine stands on the basis of terrestrial laser scanning data ................ 111 KOTTYÁN L.: A remeshing method for plant modelling ..................................................................................... 116 PINTÉRNÉ NAGY E.: Light Trapping with diverse artificial lights in Sopron .............................................. 121 Section 2.2. Ecosystems and Climate Change: Impact Monitoring and Projections VAN OIJEN, M.: Uncertainties in modelling ecosystem response to environmental change:
the Bayesian approach.........................................................................................................................................126 KELEMEN F. D. – PRÁGER T.: Precipitation conditions in the Carpathian Basin related
to Mediterranean cyclones ................................................................................................................................ 131 DOBOR L. – BARCZA Z. – HLÁSNY, T. – HAVASI Á.: Creation of the FORESEE database to
support climate change related impact studies...........................................................................................137 TROMBIK, J. – HLÁSNY, T. – DOBOR L. – BARCZA Z.: Climatic exposure of forests in the
Carpathians: exposure maps and anticipated development .................................................................. 142 BEDE-FAZEKAS Á.: Modeling the future distribution of Mediterranean Pinus species .......................... 151 NAGY J. – BARTHOLY J. – PONGRÁCZ R. – PIECZKA I. – BREUER H. – HUFNAGEL L.: Analysis
of the impacts of global warming on European terrestrial wild mammals’ range areas in the 21st century using ENSEMBLES climate simulations .................................................................157
PIASTA, A. – SKORUPSKI, M. – PASTWIK, E. – ZASADA, M.: Changes of Mesostigmata mite fauna caused by silver birch (Betula pendula Roth.) secondary natural succession on agricultural fields..................................................................................................................................................162
MENYHÁRT L. – ANDA A.: Albedo measurements above Lake Balaton..........................................................168 GULYÁS K. – BERKI I.: Health condition of sessile oak (Quercus petraea) in Hungary ............................174 PIPOLY I. – BÓKONY V. – SZABÓ K. – LIKER A.: Effects of weather conditions on the
reproductive success of house sparrows .......................................................................................................175 HORVÁTH N. – MATICS H. – DOMONKOS M. – BIRÓ B.: Monitoring of microbial abundance
and the selection of propylene-glycol degrading bacteria from contaminated soil.........................176 “Precision Crop Production Methods” Doctoral School of Applied Plant Sciences Section 3.1 The Plant Biotechnology and The Sustainable Agriculture VAN STADEN, J. – KULKARNI, M. G.: Plant biotechnology and sustainable agriculture ........................... 181 ÖRDÖG V. – BÁLINT P. – VÖRÖS L.: Practice-oriented algal culture collection of
Mosonmagyaróvár (MACC) ..............................................................................................................................182 PÖTHE P. – GERGELY I. – ÖRDÖG V.: Effect of microalgal biomass from MACC-612
Nostoc enthophytum and MACC-430 Tetracystis sp. on sunflower production..............................183 KONIZAR, T. – TARNAWSKI, M. – BARAN, A.: Content of heavy metals and phytotoxkit of
bottom sediments collected from the Chancza reservoir ........................................................................188 RICZU P. – MESTERHÁZY P. Á. – NAGY G. – TAMÁS J.: Topology in a fruit plantation.................................193

7
PAP N. – PAP J.: Yield estimate and analysis as a basis of precision crop growing ................................... 199 MATUS L. – SCHMIDT R.: Effect of Zn on maize (Zea mays L.) yield and chemical composition
in soil fertilization experiments ......................................................................................................................205 Section 3.2 New Technologies in The Precision Site Specific Plant Production NEMÉNYI M.: Precision crop production and sustainability ........................................................................... 211 LESNY, J.: Perspectives of radioanalytical methods in precision plant production research............... 212 PINKE Gy.: Factors influencing the arable weed vegetation of Hungary with special
attention to the incidence of Ambrosia artemisiifolia.............................................................................. 213 TOLNER I. – FENYVESI L. – NEMÉNYI N.: Evaluating the effect of acidity generated humidity
change on the optical characteristic of a soil sample ...............................................................................214 NYÉKI A. – MILICS G. – KOVÁCS A. J. – NEMÉNYI M.: Improvement of decision support models
in a site-specific precision plant production system ................................................................................ 219 VIRÁG I. – MILICS G. – NEMÉNYI M.: Investigation of Fusarium ear rot symptoms on maize
(Zea mays L.) using a spectroradiometer..................................................................................................... 224 GÓR A.: The advantages and disadvantages of precision farming .................................................................229 BURJÁN Z. – GYŐRI Z.: The effect of different production area and NPK fertilizer on Ca and
Mg content of winter wheat (Triticum aestivum L.) grains....................................................................234 Gyula Roth Doctoral School of Forestry and Wildlife Management Sciences
Section 4.1 New Methods/Principles in Forest Management ZASADA, M.: New methods in forest management ..............................................................................................239 FACSKÓ F.: Modelling methods in forestry........................................................................................................... 240 MARKÓNÉ NAGY K.: Cold effect and plant reaction as influential factors in population
density of the Gypsy moth (Lymantria dispar L.) ......................................................................................246 PASTWIK, E. – SKORUPSKI, M. – PIASTA, A. – JAGIDZIŃSKI, A. M.: Mesostigmata mites of afforested
post-industrial habitats on lignit mine spoil Heap in Bełchatów – a preliminary study............... 251 SUŁKOWSKIA, S. – STRZELIŃSKIA, P. – KONDRACKIA, K.: Analysis of wind resistance of
stands based on the Oleśnica Śląska Forest District.................................................................................257 SZABÓ O. – KOVÁCS G. –HEIL B.: Nutrient supplies in short rotation coppice............................................263 ZALITE, Z. – AUZINA, A: Sustainable forest management in Latvian state-owned forests .....................267 Section 4.2 Current matters of Wildlife Management and Nature Conservation SKORUPSKI, M.: Natural secondary succession in forest ecosystems on the example of soil
mesofauna - long term researches ..................................................................................................................274 OSMÓLSKA, A.: The application of GIS technology in game management: a case study of roe
deer (Capreolus capreolus) management.....................................................................................................275 PREISZNER B. - BÓKONY V. - LIKER A.: The role of individual problem – solving success in social
status of house sparrows (Passer domesticus) ............................................................................................280

8
István Széchenyi Doctoral School of Management and Organisation Sciences Section 5.1 Business and Financing Strategies MAU, M.: Relevance of environmental performance (Sustainability) in Business Strategies ............ 283 HERCZEG L. – HERCZEG I.: Purchasing strategies in the praxis ...................................................................... 284 KOVÁCS A.: Modern management techniques and the opportunities of applying Balanced
Scorecard in health care .................................................................................................................................... 289 LINGESIYA Y.: Impact of capital structure on profitability: a study on listed manufacturing
companies in Colombo stock exchange, Sri Lanka ................................................................................... 293 BAKONYI Z.: Network management in the insurance broker industry – a dual agency problem......... 302 BRÁNYI T.: Supply chain characteristics ............................................................................................................... 307 Section 5.2 Responses of Economics and Social Sciences to the Present Challenges KULCSAR J. L.: Unappreciated but unavoidable: The role of social sciences in addressing global
challenges ................................................................................................................................................................314 CSEH T.: Crisis in Europe – in view of national accounts .................................................................................315 MOLNÁR I.: Forces and organization forms.......................................................................................................... 320 SEREK, R.: The Unsubstitutable role of trust in ethical approach to management innovation ........... 328 VAJAY Zs.: Financial possibilities for the SME sector in Hungary............................................................... 334 BÁCSI J.: The cluster ordering as possibility in the Hungarian SMEs sector............................................ 338 MALATINEC, T.: Principles of Slovak public administration in the field of small trade
business................................................................................................................................................................... 344 MAROSBÉ KUNA Zs.: Challeges of the ageing society ......................................................................................... 349 Imre Ujhelyi Doctoral School of Animal Sciences Section 6.1 Manufacturing Health Foods KNEIFEL, W.: Challenges and hurdles for health foods – the probiotic case.............................................. 357 VARGA L.: Health-promoting fermented milks ................................................................................................... 358 SÜLE J.: Comparative evaluation of conventional plating methods for selective enumeration of
viable lactic acid bacteria and Bifidobacteria cells ................................................................................... 359 MECH-NOWAK, A. – ŚWIDERSKI, A. – SKRZYŃSKI, J.: Comparison of importance of the
anthocyanins from dogwood and cherry, as health benefits compounds in human diet .............. 360 KAPCSÁNDI V. – NEMÉNYI M. – LAKATOS E.: Low-power microwave radiation effect on
fermentation of grape must ...............................................................................................................................361 GRABOWSKI, M. – SKRZYŃSKI, J. – MACNAR, K.: Postharvest heat treatment of apples as
ecological method of improving the quality of storage fruits................................................................. 366 LŐRINCZ B. – GARAMVÖLGYI R. – BAJZIK G. – SZÁNTÓ A. – NAGY F. – LELOVICS Zs. –
REPA I.: MRI-diagnostic of epileptic dogs .....................................................................................................371 PETRYNKA, M. – KLOCEK, C.: Vocalization and welfare..................................................................................... 374 PYŚ, J. B. – SZAŁATA, A. – KARPOWICZ, A. – GRZYB, J.: Effect of various additives on
fermentation quality, microbiological composition and aerobic stability of corn silages ........... 378 GABORSKA, M. – ŁUCZAK, I.: The fauna of thrips (Thysanoptera) occurring in carrot
cultivation ...............................................................................................................................................................381

9
Section 6.2 Sustainable Rural Development and Agriculture KADLEČÍKOVÁ, M.: Sustainable rural development and income diversification in new
European Union countries ................................................................................................................................386 TELL I.: Strategic management in rural development.......................................................................................387 D. NÉMETH ZS.: Sustainability in the Hungarian agriculture with RES ......................................................388 TÓTH, A.: Green infrastructure planning for sustainable rural development ...........................................392 KERN Á.: Thermal tourism as one of the breakout potentials of the subregion.........................................397 MARTIN G. – MAKAI K.: Indicating and assessing the impacts of road traffic on agricultural
areas in Hungary ...................................................................................................................................................401 BENKE H.: Competitive marketing strategies in the poultry housing equipment market .....................405 OLCZAK, K. – TISCHNER, M.: Stress intensity in young hucul horses during grooming and
training..................................................................................................................................................................... 411

10
The papers of this volume were reviewed by:
Dr. Tibor ALPÁR Associate Professor University of West Hungary, Sopron, Hungary Dr. Angéla ANDA DSc, Professor University of Pannonia, Georgikon Faculty of Agricultural
Sciences, Keszthely, Hungary Dr. Marian BABIAK Professor Technical University in Zvolen, Slovakia, Zvolen Dr. Ágnes BALI-PAPP PhD, Professor University of West Hungary, Mosonmagyaróvár, Hungary Dr. Pál BENEDEK DSc, Professor University of West Hungary, Mosonmagyaróvár, Hungary Dr. Etele CSANÁDY Professor University of West Hungary, Sopron, Hungary Dr. Csilla CSIHA Associate Professor University of West Hungary, Sopron, Hungary Dr. Levente CSÓKA Associate Professor University of West Hungary, Sopron, Hungary Dr. habil. Attila Fábián PhD, Associate Professor University of West Hungary, Sopron, Hungary Dr. Richard von FUCHS PhD, Lecturer University of West Hungary, Sopron, Hungary Anna GAGOL Headmaster of ELT Wyzsa Szkola Informatyki Stosowanej I Zaradazania,
Warsawa, Poland Dr. István GERGELY PhD, Associate Professor University of West Hungary, Sopron, Hungary Dr. habil. Zsolt GILÁNYI PhD, Associate Professor University of West Hungary, Sopron, Hungary Dr. Attila József KOVÁCS PhD, Associate Professor University of West Hungary,
Mosonmagyaróvár, Hungary Dr. Zsolt KOVÁCS Professor University of West Hungary, Sopron, Hungary Dr. László KULCSÁR CSc, Professor University of West Hungary, Sopron, Hungary Dr. habil. Ferenc LAKATOS Professor University of West Hungary, Sopron, Hungary Dr. Endre MAGOSS Associate Professor University of West Hungary, Sopron, Hungary Dr. Csaba MÁTYÁS Professor University of West Hungary, Sopron, Hungary Dr. Markus MAU Professor University of West Hungary, Sopron, Hungary Dr. Gábor MILICS PhD, Assistant Professor University of West Hungary, Sopron, Hungary Dr. Róbert NÉMETH Associate Professor University of West Hungary, Sopron, Hungary Dr. Csilla OBÁDOVICS PhD University of West Hungary, Sopron, Hungary Dr. Vince ÖRDÖG PhD, Professor University of West Hungary, Sopron, Hungary Dr. László PATAKI PhD, Associate Professor University of West Hungary, Sopron, Hungary Dr. habil. Tamás RÉTFALVI Associate Professor University of West Hungary, Sopron, Hungary Dr. Rezső SCHMIDT CSc, Professor University of West Hungary, Sopron, Hungary Dr. Dr. h.c. Johannes van STADEN MHAS, Professor University of KwaZulu-Natal, Durban,
South Africa Dr. Péter SZABÓ Associate Professor University of West Hungary, Sopron, Hungary Dr. Pál SZAKÁL PhD, Professor University of West Hungary, Sopron, Hungary Dr. Csaba SZÉKELY DSc, Professor University of West Hungary, Sopron, Hungary Dr. Imre TELL PhD, Associate Professor University of West Hungary, Sopron, Hungary Dr. László TOLVAJ DSc, Professor University of West Hungary, Sopron, Hungary Dr. Tamás TÓTH PhD, Associate Professor University of West Hungary, Mosonmagyaróvár,
Hungary Dr. Dénes VARGA Research Fellow University of West Hungary, Sopron, Hungary Dr. László VARGA PhD, Professor University of West Hungary, Mosonmagyaróvár, Hungary Dr. Zoltán VARGA PhD, Associate Professor University of West Hungary, Sopron, Hungary

11
FOREWORD
The University of West Hungary (UWH) currently has six accredited Doctoral Schools, which conduct education and research activities in the following disciplines and fields:
• Environmental Sciences (Pál Kitaibel Doctoral School of Environmental Sciences): Bioenvironmental sciences, Geoenvironmental sciences, Environmental pedagogy, Geoinformatics;
• Forestry and Wildlife Management (Gyula Roth Doctoral School of Forestry and Wildlife Management Sciences): Ecology and diversity of forest ecosystems, Biological basis of forest management, Forest assets management, Forest machinery, Wildlife management, Nature conservation;
• Crop Production and Horticulture (“Precision Crop Production Methods” Doctoral School of Applied Plant Sciences): Microorganisms in the crop-soil system, Precision agriculture: production-oriented integration of crop protection and crop treatment methods, Development of crop production technologies;
• Animal Husbandry (Imre Ujhelyi Doctoral School of Animal Sciences): Animal breeding and management, Animal nutrition, Animal product processing and quality assurance, Energy-efficient and quality-preserving dehydration, storage and processing of biological materials, Economic aspects of animal agriculture;
• Wood Sciences and Technologies (József Cziráki Doctoral School of Wood Sciences and Technologies): Wood science, Wood processing technologies, Wood structures, Pulp and fiber technology, Informatics and management in the wood industry;
• Business and Management (István Széchenyi Doctoral School of Management and Organizational Sciences): Public economics, Marketing, International economics, Business economics and management, Social and economic contexts of human resources.
In an attempt to comprehensively develop its talent management system, UWH started a major project called Talentum in June 2011. One of Talentum’s three subprojects have focused on Doctoral Schools by (i) implementing special education and research programs for PhD students, (ii) helping disseminate their research findings, and (iii) promoting developments in terms of both infrastructure and human resources in the Doctoral Schools.
The present international conference entitled “Science for Sustainability” is meant to be a landmark event of the Talentum project by providing an opportunity for domestic and foreign PhD students to exchange views in the presence of distinguished academics and researchers from several disciplines.
The Program Committee has worked hard to assemble an excellent set of sessions consisting of interesting presentations. Special thanks are extended to Doctoral School Heads for their diligent work to review submissions and plan sessions for a unique and timely scientific program.
This volume contains peer-reviewed full papers and selected abstracts authored by oral and poster presenters. The articles included in the conference proceedings have been grouped according to sessions, and are preceded by the abstracts of keynote presentations of invited speakers, who represent eight countries, such as Austria, Germany, Hungary, Poland, Slovakia, South Africa, the UK and the USA.

12
This conference is a significant undertaking that required careful and thorough planning. It would not have been possible without the dedicated work of the Talentum staff and the participation of invited speakers, PhD students and dissertation advisers, who largely contributed to the scientific content of this event. We thank all contributors for sharing their research and advancing our knowledge in the fields of agricultural, forestry, environmental, wood, management and related sciences. March 18, 2013
Prof. Miklós Neményi
Corresponding Member of the Hungarian Academy of Sciences,
Former Vice Rector for Science and International Relations (UWH)
Prof. László Varga
Subproject Manager, Vice Rector for Science and International
Relations (UWH)

Science for Sustainability University of West Hungary International Scientific Conference for PhD Students March 19-20, 2013 – Győr
13
Precision Agriculture: Meeting Current Challenges
STAFFORD, John V.
President, ISPA; Co-Editor-in-Chief, Precision Agriculture Journal Silsoe Solutions, Ampthill, UK
Precision agriculture today is mainstream. Just 20 years ago, in the days when GPS receivers were the size of a small suitcase, it was for the innovator, the enthusiast. The average producer was cynical! Yet, in many ways, through the ages, good farmers have always sought to be as precise as possible. The big difference today is the availability of high technology – even within the often-hostile environment of crop fields! Global navigation satellite systems enable the producer to locate field machinery – and even individual plants – to within millimetres whilst sensors, control systems and the internet enable field operations to be carried out to an accuracy and repeatability undreamt of even 20 years ago.
Agriculture faces a number of challenges, not least the need to feed an ever-growing population (heading towards 9 billion within 30 years) whilst reducing negative impacts on the environment and farming in a sustainable manner. Soil quality, water conservation, efficient use of resources (agro-chemicals, fertilisers, fuel), end-customer assurance are further problems for today’s farmers. In an information-intense age, technology is a blessing and a curse; on the one hand, soil and crop data can be accrued, processed and turned into useful information; on the other hand, ever more sensitive, accurate and low-cost sensors, able to sense an increasing range of parameters, keep legislators producing more and more restrictive directives for the farming community. The socially-responsible farmer is well-aware of what society demands of him, what are his responsibilities as a good steward of the land resource under his control and the capabilities of technology to aid him in helping to meet these challenges.
I would be the first to state that precision agriculture alone cannot be the answer to many of these challenges. However, application of precision agriculture through site-specific application of inputs such as fertiliser and herbicides, interpretation of yield maps, auto-guidance of field machinery and crop-to-food audit trails are making a positive contribution to meeting these challenges. Also, much research in the topic is beginning to provide part-answers to some of the pressures that producers are facing all over the world. To encompass the worldwide interest in precision agriculture, three years ago the International Society for Precision Agriculture – ISPA – was formed with Prof Raj Khosla as its first President, a post which I was privileged to take over last July. As editor of the leading journal on precision agriculture, I have perhaps a unique over-view of research in PA. The Journal is now into its 14th volume with over 1000 papers published and an Impact Factor of 1.55. In the presentation, I will illustrate – using example research from the Journal – how PA is beginning to or has the potential to meet some of these challenges that are facing agriculture and for which solutions are essential in an ever-more crowded and interconnected world.


Science for Sustainability University of West Hungary International Scientific Conference for PhD Students March 19-20, 2013 – Győr
15
József Cziráki Doctoral School of Wood Sciences and Technologies
Section 1.1 Structure and Properties of Wood
Rheological Model of Wood
BABIAK , Marian
Technical university in Zvolen Abstract – Rheological properties of wood are not so well known as other mechanical properties. The lecture deals with modeling of rheological properties using simple Burger’s model consisting of Maxwell’s (spring and dashpot in series) and Kelvin’s (spring and dashpot parallel). In the simple case it is supposed that stress applied and all the characteristics (two moduli of elasticity and two viscosities) are constant. Then the equation describing the strain is
−++= .t
η
Eexp1
E
1
η
t
E
1σε
vel
vel
velplel
Where the first term describes elastic strain, the second plastic strain and the third one describes visco-elastic strain. The sense of relaxation time T = ̶ηvel/Evel is explained. Further it is shown what mathematical complications occur if the stress and/or characteristics are variables.
Some results of the measurements of rheological characteristics are presented, as well as estimation of their relationship with temperature. Methods of measurement and evaluation procedures are also demonstrated.
Finally it is shown that the equation
−= .
T
texp1
E
σε
vel
describing Kelvin’s model of viscoelastic deformations has much wider applicability. Generally it describes how a thermodynamic system approaches its equilibrium and it can be
applied to the description of the chemical reaction of the first order, it has been applied to the kinetics of swelling and it can be also applied to the description of the boundary condition of the first order for the solution of the heat conduction and diffusion equation.

Science for Sustainability University of West Hungary International Scientific Conference for PhD Students March 19-20, 2013 – Győr
16
Contact Angle Measurement on Wood by Drop Shape Analysis
ŠTRBOVÁ, Martina* – WESSERLE, František – KÚDELA, Jozef
Department of Wood Science, Technical University in Zvolen, Zvolen, Slovakia
Abstract – Measurement of the contact angle formed by a droplet of a liquid placed on wood surface is a widely used method for assessment of surface wettability and calculation of surface free energy. There are several methods for calculation of the contact angle derived from the drop profile. The purpose of our work was to compare five methods and to find out which one describes the drop shape on wood surface most accurately. The time evolution of the drop base diameter was monitored too. The values of contact angle and drop base diameter were measured along the wood grain. We observed that the circle method and height-width method were suitable for rough wood surface because they were not very sensitive to distortions caused by surface irregularities, and they were also suitable for small drops and small contact angles. The polynomial method required clear noiseless images (microtomed wood surface).
Keywords: sessile drop / contact angle / drop shape analysis
1. INTRODUCTION
The best measure of quality of wetting process is the contact angle between the solid substrate and the wetting liquid. The contact angle values are also useful for assessment of other properties of the system solid − liquid − gas. The correctness and accuracy of the contact angle measurements determine the accuracy of estimation of wood surface free energy with its polar and disperse components, thermodynamic work of adhesion, etc. (LIPTÁKOVÁ et al. 1998). This is also a reason why the methods for measurement of contact angle have been treated with a special attention since long (LIPTÁKOVÁ − KÚDELA 1994, SUNGUO − JOHANSSON 1996, WALINDER − LI 1996, KAZAYAWOKO et al. 1997, SCHEIKL − DUNKY 1998, SCHEIKL et al. 2001, SHI − GARDNER 2001, GINDL 2002, PIAO et al. 2010 and others).
The above cited works provide information on several experimental methods used in wood wetting. Therefore also several different methods exist for contact angle determination, and these methods differ in the results obtained.
Perhaps the most commonly used is the method determining the contact angle from profiles of sessile drops on solid substrates. However, the results obtained are loaded with certain discrepancies – due to different concepts of steady state and due to different methods used for calculation of the contact angle from the drop profile.
Wettability is investigated based on the energy equilibrium at the phase contact wood − liquid – gas expressed by the Young’s equation,
γ θ γ γLV SV SLcos = − (1)
where γSV is the surface free energy at the phase contact solid - vapour, γSL is the surface free energy at the phase contact solid − liquid, γLV is the surface free energy at the phase contact liquid − vapour and θ is the equilibrium contact angle. * Corresponding author: [email protected], T. G. Masaryka 24, 960 53 Zvolen, Slovakia

Science for Sustainability University of West Hungary International Scientific Conference for PhD Students March 19-20, 2013 – Győr
17
Equation (1) is only valid for ideal smooth, homogeneous and firm surfaces which are in equilibrium state with the other phases (ADAMSON 1967). But the wood wetting process is much more complex due to wood surface roughness and heterogeneity as well as due to the porosity, hydrophilicity and anisotropy of this material. The wetting of wood surface is associated with a permanent change of contact angle as the time proceeds, so there are problems with unique concept of the equilibrium state – for which is given evidence in the literature (LIPTÁKOVÁ − KÚDELA 1994, LIPTÁKOVÁ et al. 1998).
The contact angle is commonly measured at the beginning of the wetting process or at another preliminary fixed time. (GRAY 1962, HERZEG 1965, HSE 1972, NGUYEN and JOHNS 1978, JAIC et al. 1996, ZHANG et al. 1997, KAJITA − SKAAR 1992, GINDL 2002). LIPTÁKOVÁ and KÚDELA (1994) express doubts about correctness of this approach. They suggest that the equilibrium state at the phase contact wood – liquid is associated with the moment when all wood surface inequalities have just been filled with the liquid and when the advancing contact angle has just been turned to receding one. This moment occurs when the drop base diameter d (Figure 1) stops growing because the drop starts receding from the surface. However, also this method has been put in doubts as for correctness (SUNGUO − JOHANSSON 1996, PIAO et al. 2010).
Figure 1. Sessile drop
The choice of the method for determining contact angle values from the values of various parameters of drop profile should be deliberated carefully. There are several methods for calculation of the contact angle derived from the drop profile (tangent method 1 (ellipse), tangent method 2 (polynomial), circle method, height-width method, Young-Laplace method). THOMSEN (2008) described usage, advantages and disadvantages of these models on smooth and non-porous substrates. Since wood is rough and porous, phase boundary is not so clear and wood fibres can also stand up during wetting process, especially on sanded surface. In some cases this can be avoided by usage of microtomed wood surfaces. Liquid drop spreads and penetrates into wood, so that drop height, width and volume change as the time proceeds and so does the contact angle. Some drops are symmetrical, some are not. All this has influence on choice of the suitable model.
Our aim was to test the above discussed methods for contact angle evaluation in wood wetting process and to choose the most suitable one. We also investigated the time-dependent evolution of the contact angle and tried to determine the moment corresponding to equilibrium conditions.
2. MATERIALS AND METHODS
The drops were investigated on microtomed and sanded tangential and radial surface of beech (Fagus sylvatica, L.) specimens; the test liquid was redistilled water and the drop volume was 1.8 μl. We used a goniometer Krüss DSA30 Standard, consisting of a sample table, a syringe, a light source and a camera.
Each drop was deposed on the horizontal wood surface by the syringe moving down – so that the drop touched the wood surface, and then up – so that the needle did not distort the drop. Immediately after the deposition, the drop evolution along the wood grain was recorded on a video

Science for Sustainability University of West Hungary International Scientific Conference for PhD Students March 19-20, 2013 – Győr
18
and stored in the computer. Each video was evaluated by software Krüss DSA3 using all the five above mentioned methods.
Software program DSA3 for drop shape analysis determines the contact angle in two steps. In the first step the drop image is subjected to a grey level analysis. The result is an optically determined contour line around the drop. In the second step this contour is described mathematically. The contact angle is obtained from the angle between this drop contour function and the sample surface, whose projection in the drop image is known as the baseline (THOMSEN 2008).
For every video frame, we scanned the values of contact angle and drop base diameter developing in time, up to the complete soaking of the liquid into the substrate. The data were exported to Excel, and graphs of time evolution of these parameters were created. Printscreen images from evaluation of some video frames were saved in order to see how the lines created by software fit the actual drop contour.
3. RESULTS AND DISCUSSION
During wetting the beech wood surface, all the parameters of the sessile drop were changing as the liquid was spreading and penetrating. The drop height and diameter altered continually with the time. Over all the period related, there also decreased the contact angle, regardless the method used for its calculation (Figure 2).
In most cases, the contact angle values showed similar trends, regardless the method for their calculation (Figure 2a). Figure 2b, c demonstrates exceptions with considerable differences. The quantitative changes were even more pronounced. As all the testing methods were implemented on the same drop, the discrepancies seem to be caused by the methods themselves.
Tangent method 1 (ellipse – Figure 3a) uses the whole profile of a sessile drop, which is fitted to a general conic section equation. The contact angle is determined as the angle between the baseline and the tangent at the conic section curve at the three-phase contact point. It takes in account slightly asymmetrical drops by slight rotating of the ellipse. This method is not suitable for wood as a material with considerable roughness. With advance time, where the contact angle turns small, the contact angle values calculated by this method are higher than the actual ones (Figure 2). They may be even total mistaken (Figure 2b, c).
Tangent method 2 (polynomial – Figure 3b) uses only a part of the profile of a sessile drop which lies near the baseline and it is fitted to a polynomial function. Basically there is no geometrical requirement for the contour shape: the polynomial adapts itself to any curve that can be thought of at the three-phase contact point. Since the method evaluates only the phase contact region, it is sensitive to distortions caused by contaminants or surface irregularities at the sample surface. It requires a high image quality, especially in the region of the three-phase contact point. It is suitable for some measurements on microtomed wood surface.
Circle method (Figure 3c): The contact angle is calculated by fitting the drop contour to a circular arc. The smaller drop volume, the more accurate the approximation because smaller drops are more similar to the theoretically assumed spherical cap form. This method has the disadvantage that the drops are regarded as being symmetrical, so that the same contact angle is obtained for both sides, even when differences between the two sides can be seen in the actual drop image. This method is also preferred by KAJITA − SKAAR (1992) and MUSZYŃSKI et al. (2006).

Science for Sustainability University of West Hungary International Scientific Conference for PhD Students March 19-20, 2013 – Győr
19
0
10
20
30
40
50
60
70
80
90
0 10 20 30 40 50 60 70 80 90 100 110 120 130 140
Time (s)
Co
nta
ct a
ng
le (
deg
)
Tangent 1
Tangent 2
Circle
Young-Laplace
Height-Width
2,5
3,0
3,5
4,0
4,5
5,0
5,5
0 10 20 30 40 50 60 70 80 90 100 110 120 130 140
Time (s)
Dro
p b
ase
dia
met
er (
mm
)
Tangent 1
Tangent 2
Circle
Young-Laplace
Height-Width
0
10
20
30
40
50
60
70
80
90
0 10 20 30 40 50 60 70 80 90 100 110 120 130 140
Time (s)
Co
nta
ct a
ng
le (
deg
)
Tangent 1
Tangent 2
Circle
Young-Laplace
Height-Width
2,5
3,0
3,5
4,0
4,5
0 10 20 30 40 50 60 70 80 90 100 110 120 130 140
Time (s)
Dro
p b
ase
dia
met
er
(mm
)
Tangent 1
Tangent 2
Circle
Young-Laplace
Height-Width
0
10
20
30
40
50
60
70
80
90
0 5 10 15 20 25 30
Time (s)
Co
nta
ct a
ng
le (
deg
)
Tangent 1
Tangent 2
Circle
Young-Laplace
Height-Width
2,5
3,0
3,5
4,0
4,5
0 5 10 15 20 25 30
Time (s)
Dro
p b
ase
dia
met
er (
mm
) Tangent 1
Tangent 2
Circle
Young-Laplace
Height-Width
Figure 2. Time-depended evolution of contact angle and drop base diameter on tangential (a,b)
and radial (c) surface Young-Laplace method (Figure 3d) takes into account the fact that the drop is also distorted
by the weight of the liquid it contains. It is suitable for symmetrical drop shapes. The whole drop contour is evaluated. After the successful fitting of the Young-Laplace equation, the contact angle is determined as the slope of the contour line at the three-phase contact point.
Height-width method (Figure 3e) is a version of the circle fitting method. The height and width of the drop shape are determined. The contour line enclosed by a rectangle is regarded as being a segment of a circle, so the contact angle is calculated from the height-width relationship of the enclosing rectangle. The contact angle values obtained by this method differ very little from the values obtained by the circle method (Figure 2).
a)
b)
c)

Science for Sustainability University of West Hungary International Scientific Conference for PhD Students March 19-20, 2013 – Győr
20
Figure 3. Underlying principles of the methods for contact angle calculation. a) tangent method 1, b) tangent method 2, c) circle method, d) Young-Laplace method, e) height-width method
The accuracy of determining of contact angle was also found to be influenced by the
experimental layout (camera setting, sample illumination, sample size, drop placement on the sample surface etc.). This all can cause considerable distortion of contact angle values determined regardless the model used. This fact is in accordance with WOODWARD (1999) and WILLIAMS et al. (2010).
According to the experimental measurements, another important sessile drop parameter – the drop base diameter was extending until a certain moment, and then followed a stepwise decrease (Figure 2), similar as observed by LIPTÁKOVÁ – KÚDELA (1994). However, the time necessary for complete drop soaking into the wood substrate was very variable (Figure 2), ranging from a few seconds to several hundreds. This variability was due to a range of factors (material heterogeneity, way of mechanical treatment, etc.). For this reason, it is not correct to measure the contact angle only at the beginning of the wetting process or at any other fixed moment. The last cited authors state that even one single series of measurements may result in qualitatively different contact angles. We support the opinion that the equilibrium condition at the phase contact wood – liquid should be considered at the moment when the drop base diameter d stops increasing because the drop starts receding from the substrate. LIPTÁKOVÁ et al. (1998) suggest that just at this moment all surface irregularities are filled with the liquid, and the advancing contact angle turns to receding one. This state is the closest to the equilibrium condition.
t = 0s t = 90s t = 180sa)
b)
c)
d)
e)
Science for Sustainability University of West Hungary International Scientific Conference for PhD Students March 19-20, 2013 – Győr
21
5. CONCLUSIONS
The five software models for contact angle measurement on sessile drop were used on beech wood. Their results were compared and it was found that for different measurement conditions different models are suitable. Tangent method 1 (ellipse) was the least accurate. Tangent 2 was suitable for asymmetrical drops, but required clear phase boundary, noiseless three-phase point area. Circle method was the best model for rough wood surface, small drop volumes and small contact angles. Height-width method was similar to circle. Values obtained from Young-Laplace method were often inaccurate. There was no advantage of using this method for small volume drops. The profile of such drop is circle-shaped because this drop is not distorted by gravitation.
The results of measurements of baseline diameter d allow us to conclude that the time most appropriately corresponding to the equilibrium condition is the moment when this parameter stops increasing and starts decreasing gradually. The contact angle value measured at this moment can be considered as the equilibrium contact angle.
Acknowledgement: This work was supported by the project IPA TUZVO (No 34/2012).
References ADAMSON, A. W. (1967): Physical chemistry of surfaces. Inter Science Publishers a division of John Willey and
Sons, New York – London – Sydney. 747 p. GINDL, M. (2002): Effects free surface energy on the coating properties of wood (Doctoral Thesis). Universitet
fűr Bodenkultur Wien, Vienna. 68 p. GRAY, V. R. (1962): The wettability of wood. Forest Prod. J. 12: 452−461. HERCEG, A. (1965): Wettability of wood. Forest Prod. J. 15: 499−505. Hse, C. Y. (1972): Wettability of southern pine veneer by phenol formaldehyde wood adhesives. Forest Prod.
J., 22 (1): 51–56. JAIĆ, M. – ŽIVANOVIĆ, R. – FILIPOVIĆ, D. J. – PETROVIĆ-DAKOV, D. (1996): Investigation of the interaction
between a polyurethane coating and the surface of some hardwood species. J. Serb. Chem. Soc. 61 (3): 197−205.
KAJITA, H. – SKAAR, CH. (1992): Wettability of the surface of some American softwoods species. Mokuzai Gakkaishi 38 (5): 516−521.
KAZAYAWOKO, M. – NEUMANN, A. W. – BALATINECZ, J. J. (1997): Estimating the wettability of wood by the axisymmetric drop shape analysis-contact diameter method. Wood Sci. Technol. 31 (2): 87−95.
KRÜSS (2011): Measurement Contact Angle. KRÜSS GmbH, Hamburg, Germany. Online: http://www.kruss.de/en/theory/measurements/contact-angle/measurement-contact-angle.html
LIPTÁKOVÁ, E. – KÚDELA, J. (1994): Analysis of the wood − wetting process. Holzforschung 48 (2): 139−144 LIPTÁKOVÁ, E. – KÚDELA, J. – SARVAŠ, J. (1998): Problems concerning equilibrium state on the phase boundary
wood liquid material. In: Proceedings of 3rd IUFRO Symposium “Wood structure and properties 98”. Slovakia. September 1998. 109–114.
MUSZYŃSKI, L. – BAPTISTA, D. – GARDNER, D. J. (2006): A simple geometrical model to predict evaporative behavior of spherical sessile droplets on impermeable surfaces. In: MITAL, K. L. (ed.): Contact Angle, Wettability and Adhesion. vol. 4, VSP, Utrecht the Netherlands: 61−76.
NGUYEN, T. – JOHNS, W. E. (1978): Polar and dispersion force contributions to the total surface free energy of wood. Wood Sci.Technol. 12 (1): 63−74.
PIAO, C. – WINANDY, J. E. – SHUPE, T. F. (2010): From hydrophilicity to hydrophobicity: a critical review: Part I. Wettability and surface behavior. Wood Fiber. Sci. 42 (4): 490–510.
SCHEIKL, M. – DUNKY, M. (1998): Measurement of dynamic and static contact angels on wood for the determination of its surface tension and the penetration of liquids into the wood surface. Holzforschung 52 (1): 89−94.
SCHEIKL, M. – WÅLINDER, M. – PICHELIN, F. – DUNKY, M. (2001): Bonding process. In: DUNKY, M. – PIZZI, T. – LEEMPUT, M. V. (eds.): Wood adhesion and glued products, COST Action E13. State of the Art – Report, Dynea. 89–119.
SHI, S. Q. – GARDNER, D. J. (2001): Dynamic adhesive wettability of wood. Wood Fiber. Sci. 33 (1): 58–68.
Science for Sustainability University of West Hungary International Scientific Conference for PhD Students March 19-20, 2013 – Győr
22
SUNGUO, W. – JOHANSSON, I. (1996): Evaluation of a polar and acid-base properties of wood surfaces by contact angle measurements (Paper I). In: Modern adhesion theory − applied on coating and gluing of wood. Teknisk rapport Inst. för Produktinssystem avd. Träteknologi Kungl Tekniska Högskolan, Stockholm. 1−27.
THOMSEN, F. (2008): Practical contact angle measurement 4 – Measuring with method - but with which one? KRÜSS Newsletter vol. 19 (05/2008).
WÅLINDER, M. – LI, J. (1996): Determination of interfacial surface tension and its acid-base components in wood by dynamic contact angle analysis using Wilhelmy plate principle. (Paper II.) In: Modern adhesion theory − applied on coating and gluing of wood. Teknisk rapport Inst. för Produktinssystem avd. Träteknologi Kungl Tekniska Högskolan, Stockholm. 1−14.
Williams, D. L. – Kuhn, A. T. – Amann, M. A. – Hausinger, M. B. – Konarik, M. M. – Nesselrode, E. I. (2010): Computerised Measurement of Contact Angles. Galvanotechnik 101 (11): 2502–2512.
WOODWARD, R. P. (1999): Contact Angle Measurements Using the Drop Shape Method. VA: First Ten Angstroms Inc., Portsmouth, United Kingdom.
ZHANG, H. J. – GARDNER, D. J. – WANG, J. Z. – SHI, Q. (1997): Surface tension, adhesive wettability, and bondabilility of artificially weathered CCA-treated southern pine. Forest Prod. J. 47 (10): 69−72.
Surface Energy Analysis of Sanded and Planed Wood Surfaces
PAPP Éva A.a – CSIHA Csillaa* a University of West Hungary, Faculty of Wood Sciences, Institute of Product
Design and Manufacturing , Sopron, Hungary Abstract – Surface free energy of wood (referred also as surface tension) is one of the most important attributes when gluing or coating wood. The state of the adherent surfaces is critical for the achievement of the necessary adhesion. According to the Young-Dupré equation the higher the surface tension of a solid the better its wetting is. Common pine (Picea abies) samples were prepared with four different machining techniques: planed, hydroplaned and sanded with 120 and 150 grit size sandpaper. The conclusion was drawn that the highest roughness (Rz=34.79 µm), was achieved on surfaces sanded with bands of grit size120, whilst the lowest roughness was achieved on samples planed with hydroplaner (Rz=26.40 µm). The highest wood surface tension (γ120=53.72 N/m) was measured on samples sanded with bands of grit size120. There was no significant difference in the surface roughness of samples hydroplaned (Rz=26.40 µm) and sanded with grit size 150 (Rz=29.39 µm), neither in their surface tension (γHP=50.69 N/m; γ150=50.85 N/m). Generally, the higher the surface roughness, the higher the surface tension of solid wood surface was in the investigated region of wood surface roughness.
Keywords: surface tension /contact angle / sanded / planed wood surfaces / radial cut section
1. INTRODUCTION
Surface tension of solid wood is the main attribute of sufficient wetting and good adhesion of fluids like adhesives and lacquers (SHUTTLEWORTH 1950). Wetting is good when the contact angle becomes very small, or disappears (RIVER et al. 1991). A freshly prepared wood surface assures the highest adhesion. Sernek et al. investigated the wettability and adhesion of reactivated southern pine surfaces. Improvement in adhesion due to surface chemical treatment was not

Science for Sustainability University of West Hungary International Scientific Conference for PhD Students March 19-20, 2013 – Győr
23
evident for all specimens; the choice of the adhesive drastically impacted the adhesion of bonded assemblies (SERNEK et al. 2008). Varga D. showed that the contact angle between wood and water depends on wood species (VARGA 2008).
Mantanis et al. investigated the contribution of thermodynamic work of adhesion and contact angle to the wettability and surface tension of Sitka Spruce and Douglas fir. They found that 75-80% of the total surface free energy was attributed to the dispersion forces (MANTANIS – YOUNG 1997). Gindl et al. described an increase of carbon atom composition with 6% after 7 days ageing in natural conditions and in the same time a decrease with 6% of oxygen atom composition on the microtomed beech surfaces (GINDL et al. 2004). Meijer et al. conducted a comparison of surface energy determination methods of spruce and meranti. Measurements of acid and base parameters of wood surfaces seemed not to be very reliable because of its strong dependence on the measuring conditions. It was noted that thermodynamic equilibrium conditions assumed by Young’s equation are generally not fulfilled with wood surfaces because of chemical heterogeneity, surface roughness and the absorption of the test solvent. Based on the upper considerations during our tests the testing time was set at 1 second after release of the drop (MEIJER et al. 1999).
According to our earlier research results the surface tension varies with the roughness of the wood surfaces (CSIHA et al. 2012) whilst roughness depends (CSIHA 2004) from the type of surface machining (GURAU et al. 2005). Form error removal (GURAU 2009) and evaluation of sanded surfaces were examined (GURAU 2011). The dependence of adhesion of an adhesive from the surface roughness (CSIHA, GURAU 2011) of samples sanded with grit size from 60 to 600 was described as having 3 distinguished sections: grit size 100 was identified as the upper limit of the first section, whilst 120 was identified as the starting point of section two. Section one was characterized by an increase in adhesion till grit size 100. In section two samples sanded with grit size 120 showed somewhat higher (2%) adhesion than samples sanded with grit size 150, which is accordance with the actual results.
Surface tension or surface free energy of wood surfaces is one of the most important attributes of gluing and coating wood. The state of the adherent surfaces is critical for the achievement of the necessary adhesion. According to the Young-Dupré equation the higher the surface tension of a solid the better its wetting is. According to the Wenzel’s equation the higher the roughness of the solid the higher the solid’s surface energy is. Surface roughness is a parameter easy to influence and control during machining and in our presumption is supposed to be the tool of adjusting adhesion. In order to investigate which of the commonly used surface machining types offers the best adhesion of a coating, the surface energy of four differently machined common spruce surfaces was investigated in relation with their surface roughness.
2. MATERIAL AND METHODS
2.1. Sample preparation
Four samples of common spruce (Picea abies), each finger-jointed from 3 lamellae, with dimension of 20×50×750 mm3 were prepared with four different types of machining: sanded with bands of grit size 120, sanded with bands of grit size 150, planed with 3 knife planer and hydroplaned, resulting 16 samples. Their surface roughness and surface tension were measured. 20 measurements on each sample type were performed. All samples were conditioned at 20 oC and 65% relative humidity prior to tests and during the investigations. The MC of the samples ranged around 12.1%.
Science for Sustainability University of West Hungary International Scientific Conference for PhD Students March 19-20, 2013 – Győr
24
2.2. Measurement of surface tension
Surface tension was measured by means of a PGX Goniometer, taking 20 measurements on each sample type. During the measurements a drop of liquid was placed on the surface of wood sample. It was assumed, that the liquid does not react with the solid. It was emphasized that contrary to ideal smooth surfaces, the drop of water is distorted along the grains, taking a form of a semi oval sphere. The volume of the measuring drop was of 0,5 µl, and the contact angle was automatically detected and measured at 1 sec after the release of the droplet, as previously agreed. As test liquid distilled water was used. Before each measurement the measuring instrument was calibrated. The contact angle was measured as the angle between the outline tangent of the smaller diameter and surface and the surface free energy was automatically calculated by the computer equipped Goniometer.
2.3. Measurement of surface roughness
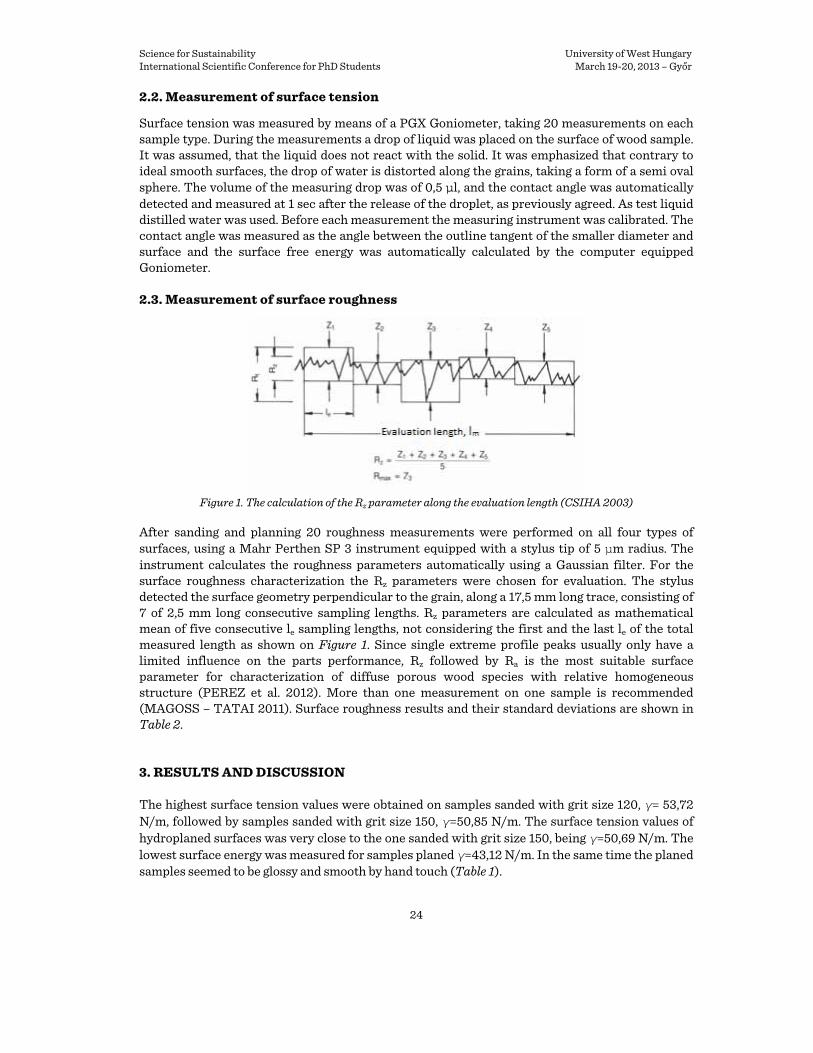
Figure 1. The calculation of the Rz parameter along the evaluation length (CSIHA 2003)
After sanding and planning 20 roughness measurements were performed on all four types of surfaces, using a Mahr Perthen SP 3 instrument equipped with a stylus tip of 5 μm radius. The instrument calculates the roughness parameters automatically using a Gaussian filter. For the surface roughness characterization the Rz parameters were chosen for evaluation. The stylus detected the surface geometry perpendicular to the grain, along a 17,5 mm long trace, consisting of 7 of 2,5 mm long consecutive sampling lengths. Rz parameters are calculated as mathematical mean of five consecutive le sampling lengths, not considering the first and the last le of the total measured length as shown on Figure 1. Since single extreme profile peaks usually only have a limited influence on the parts performance, Rz followed by Ra is the most suitable surface parameter for characterization of diffuse porous wood species with relative homogeneous structure (PEREZ et al. 2012). More than one measurement on one sample is recommended (MAGOSS – TATAI 2011). Surface roughness results and their standard deviations are shown in Table 2.
3. RESULTS AND DISCUSSION
The highest surface tension values were obtained on samples sanded with grit size 120, γ= 53,72 N/m, followed by samples sanded with grit size 150, γ=50,85 N/m. The surface tension values of hydroplaned surfaces was very close to the one sanded with grit size 150, being γ=50,69 N/m. The lowest surface energy was measured for samples planed γ=43,12 N/m. In the same time the planed samples seemed to be glossy and smooth by hand touch (Table 1).

Science for Sustainability University of West Hungary International Scientific Conference for PhD Students March 19-20, 2013 – Győr
25
Table 1. Surface tension values of the different specimens [N/m] Sanded (grit size: 120) Sanded (grit size: 150) Planed Hydro-planed
36,44 48,32 41,73 51,83
42,34 50,92 39,77 50,27
57,44 65,08 44,62 47,59
43,25 60,59 42,05 47,37
58,16 61,28 38,87 49,18
42,52 51,54 38,14 48,06
57,98 49,76 44,66 48,82
50,74 50,13 42,02 48,82
59,57 52,01 41,76 49,07
58,09 51,14 49,84 49,51
59,1 49,33 38,83 65,08
57,33 51,65 44,26 50,78
58,16 52,37 37,17 50,99
57,47 48,42 45,56 48,68
58,92 45,42 44,3 48,21 57,84 43,36 43,1 51,83 56,64 45,75 46,18 50,99 47,63 45,75 43,83 53,31 56,75 46,98 48,42 54,47 58,05 47,19 47,19 48,97 Mean: 53,72 50,85 43,12 50,69 Std dev.: 7,15 5,59 3,46 3,87
The highest surface roughness values were detected on samples sanded with grit size 120,
average value Rz= 34,79 µm, followed by the roughness of planed samples Rz=33,03 µm. Roughness of samples sanded with grit size 150 was Rz=29,39 µm and the lowest surface roughness of all was measured on samples hydroplaned Rz=26,40 µm.
Although hydroplaned surfaces seemed rougher by hand touch than the planed surfaces, their measured roughness was significantly lower (p=5%) (Table 2).
According to the Wenzel’s equation the higher the roughness of a solid, the higher the surface energy is (MARMUR 2003). Our results showed that whilst the roughness of the sanded (grit size 120) and planed samples was the highest (and nearly equal), the surface tension of sanded samples (grit size 120) was the highest but the surface energy of planed samples was the lowest between all. Furthermore the samples sanded with grit size150 and hydroplaned had significantly different roughness: 29,39 µm and 26,40 µm whilst their surface tension was nearly the same. In case of samples sanded with grit size 120 the relation of roughness and surface energy was in accordance Wenzel’s equation.
This situation leads to the conclusion that when evaluating the relation of wood surface tension and roughness other phenomena should also be considered. It is supposed that on hydroplaned surfaces where the roughness is low, but the surface tension is high, the rose petal effect manifests. On our planed surfaces since they looked very smooth and glossy it is very probable that they get „ironed” by a less sharp cutting edge, resulting a relative high measured roughness, whilst the surface energy was the lowest besides all. Ironing of plain surfaces may result a glossy and smooth plain surface, but ironing the microstructure of wood by the order of 20-
Science for Sustainability University of West Hungary International Scientific Conference for PhD Students March 19-20, 2013 – Győr
26
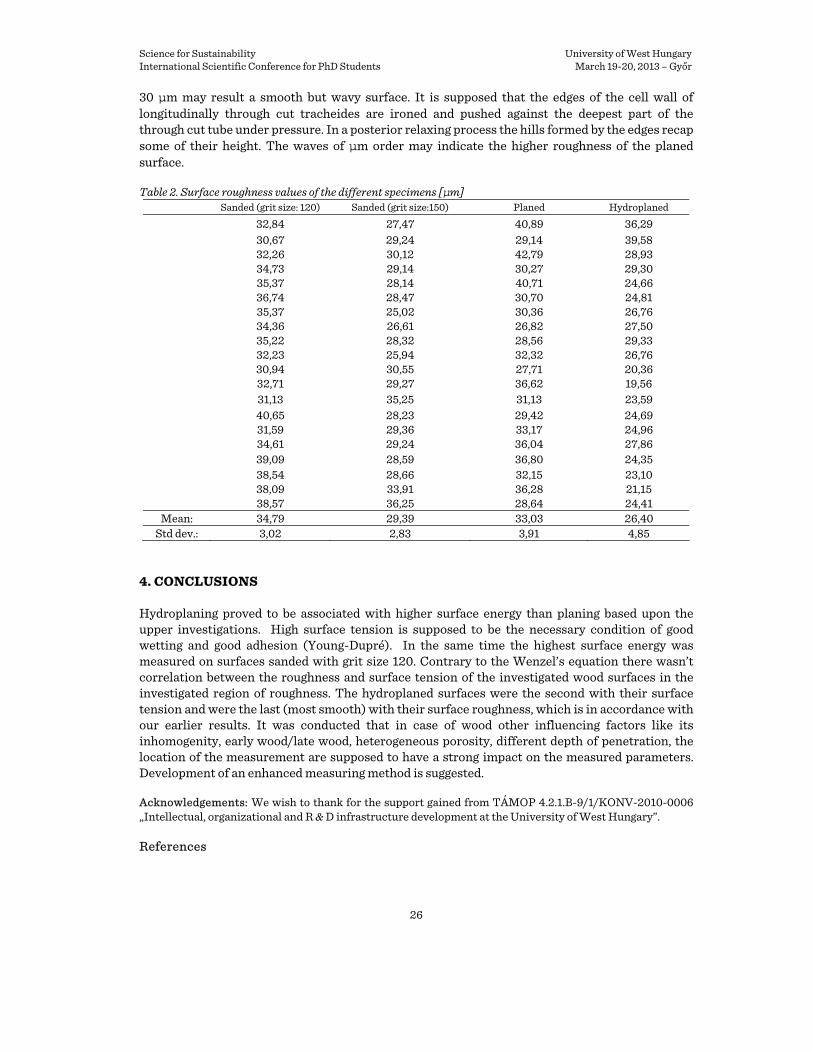
30 µm may result a smooth but wavy surface. It is supposed that the edges of the cell wall of longitudinally through cut tracheides are ironed and pushed against the deepest part of the through cut tube under pressure. In a posterior relaxing process the hills formed by the edges recap some of their height. The waves of µm order may indicate the higher roughness of the planed surface.
Table 2. Surface roughness values of the different specimens [µm]
Sanded (grit size: 120) Sanded (grit size:150) Planed Hydroplaned 32,84 27,47 40,89 36,29 30,67 29,24 29,14 39,58 32,26 30,12 42,79 28,93 34,73 29,14 30,27 29,30 35,37 28,14 40,71 24,66 36,74 28,47 30,70 24,81 35,37 25,02 30,36 26,76 34,36 26,61 26,82 27,50 35,22 28,32 28,56 29,33 32,23 25,94 32,32 26,76 30,94 30,55 27,71 20,36 32,71 29,27 36,62 19,56 31,13 35,25 31,13 23,59 40,65 28,23 29,42 24,69 31,59 29,36 33,17 24,96 34,61 29,24 36,04 27,86 39,09 28,59 36,80 24,35 38,54 28,66 32,15 23,10 38,09 33,91 36,28 21,15 38,57 36,25 28,64 24,41
Mean: 34,79 29,39 33,03 26,40 Std dev.: 3,02 2,83 3,91 4,85
4. CONCLUSIONS
Hydroplaning proved to be associated with higher surface energy than planing based upon the upper investigations. High surface tension is supposed to be the necessary condition of good wetting and good adhesion (Young-Dupré). In the same time the highest surface energy was measured on surfaces sanded with grit size 120. Contrary to the Wenzel’s equation there wasn’t correlation between the roughness and surface tension of the investigated wood surfaces in the investigated region of roughness. The hydroplaned surfaces were the second with their surface tension and were the last (most smooth) with their surface roughness, which is in accordance with our earlier results. It was conducted that in case of wood other influencing factors like its inhomogenity, early wood/late wood, heterogeneous porosity, different depth of penetration, the location of the measurement are supposed to have a strong impact on the measured parameters. Development of an enhanced measuring method is suggested. Acknowledgements: We wish to thank for the support gained from TÁMOP 4.2.1.B-9/1/KONV-2010-0006 „Intellectual, organizational and R & D infrastructure development at the University of West Hungary”. References

Science for Sustainability University of West Hungary International Scientific Conference for PhD Students March 19-20, 2013 – Győr
27
CSIHA, CS. – GURAU, L. (2011): Study on the influence of surface roughness on the adhesion of waterbased PVAC. In: Proceedings of International Conference “Wood Science and Engineering” – ICWSE 2011. Brasov, Romania. 2011.11.02-2011.11.04. 411-419.
CSIHA, CS. (2003): Faanyagok felületi érdességének vizsgálata P és R profilon, különös tekintettel a nagyedényes fafajokra, [Investigation of wood surface roughness on P and R profile, with special attention on big porous species] Doctoral thesis, University of West Hungary, Sopron. (in Hungarian)
CSIHA, CS. – PAPP, É. A., VALENT, J. (2012): Feature of contact angle of ageing Beech and Birch surfaces In: Németh R, Teischinger A (editor) Proceedings of the “Hardwood Science and Technology” - Hungary, 10-11 September 2012 41-49. I-II.
CSIHA, CS. (2004): Roughness measuring of wooden surfaces – new valuation criteria: Internationale FachtagungDresden 11-13 Mai 2004, Werkstoffe und Verfahren für Möbelfertigung und Innenausbau. 235-240.
GINDL, M. – REITERER, A. – SINN, G. – STANZL – TSCHEGG, S. E. (2004): Effects of surface ageing on wettability, surface chemistry and adhesion of wood. Springer-Verlag, Holz als Roh und Werkstoff Vol. (62): 273-280.
GURAU, L. – MANSFIELD – WILLIAMS, H. – IRLE, M. (2005): Processing roughness of sanded wood surfaces. Springer – Verlag, Holz als Roh und Werkstoff Vol. (63): 43-52.
GURAU, L. – MANSFIELD – WILLIAMS, H. – IRLE, M. (2006): Filtering the roughness of sanded wood surface. Springer – Verlag, Holz als Roh und Werkstoff Vol. (64): 363-371.
GURAU, L. . – MANSFIELD – WILLIAMS, H. – IRLE, M. (2009): Form error removal of sanded wood surfaces. Springer – Verlag, European Journal of Wood Products, 219-227.
GURAU, L. – MANSFIELD – WILLIAMS, H. – IRLE, M. (2011): Evaluating the roughness of sanded wood surfaces. In: J Paulo DAWIN (editor): Wood Machining. (6th chapter) University of Aveiro, Portugal, 2011. 217-261
MAGOSS, E. – TATAI, S. (2009): Surface roughness of natural wood – rality versus measured figures. In: Proceedings of the 20th International Wood Machining Seminar. Skelleftea, Sweden.
MANTANIS, G.I. – YOUNG, R. A. (1997): Wetting of wood. Springer-Verlag, Wood science and technology Vol. (31): 339-353.
MARMUR, A. (2003): Wetting of hydrophobic rough surfaces: To be heterogeneous or not to be. Langmuir Vol. 19 (20): 8343–8348.
MEIJER, M. – HAEMERS S. – COBBEN, W. – MILITZ, H. (1999): Surface energy determinations of wood: a comparison of methods and wood species, Interactions between wood and coatings with low organic solvent content, Doctoral thesis, Wageningen Universiteit.
PEREZ A. G. – SALCĂ, E. A. – MALDONADO, I. B. – HIZIROGLU, S. (2012): Evaluation of surface quality of medium density fiberboards (MDF) and particleboards as function of weathering. Pro Ligno Journal Vol. (8): 10-17.
RIVER, B. H. – VICK, C. B. – GILLESPIE, R. H. (1991): Wood as an adherend. Treatise on Adhesion and Adhesives Chapter 1 Vol. (7): 89-90. Marcell Decker
SERNEK, M. – GLASSER, W. G: – KAMKE, F. A. (2008): Wettability and adhesion of reactivated wood surfaces In: Enhancing Bondline Performance – Final Conference of COST E34 Bonding of Timber. Sopron. Hungary. May 2008. 6-7
SHUTTLEWORTH, R. (1950): The surface tension of solids. In: Proceedings of the Physical Society A 63 444, Section A, Vol. (63): 5.
VARGA, D., VAN DER ZEE M. E. (2008): Influence of steaming on selected wood properties of four hardwood species. Holz als Roh- und Werkstoff. 66 (1): 11-18.

Science for Sustainability University of West Hungary International Scientific Conference for PhD Students March 19-20, 2013 – Győr
28
The Surface Tension of Some Solid Wood Surfaces Heat Treated in Oil
VALENT, Jozef a – CSIHA Csilla a* aUniversity of West Hungary, Faculty of Wood Sciences, Institute of Product
Design and Manufacturing , Sopron, Hungary
Abstract – The wood samples treated in hot oil achieve new mechanical properties, even increased weathering resistance depending on the treating circumstances. The wood window production welcomes the enhanced properties of the wood, but the finishability of the samples impregnated with oil is an open question. According to the Young-Dupré equation the higher the surface tension of a solid the better its wetting is. Four different wood species beech (Fagus sylvatica L.), turkey oak (Quercus cerris), black locust (Robinia pseudoacacia) and common spruce (Picea abies) were investigated with regard to their surface tension before and after the heat treatment in oil. As result of heat treatment in oil the wetting of the four different surfaces with water decreased. During our experiments we tried to elaborate chemical free treating techniques to reduce the amount of oil in the near surface, by boiling the samples in hot water after the treatment in oil and by further supposing them to vacuum and afterwards to extra pressure. During the surface tension investigations on oak samples we got increasing surface tension due to the boiling in water and vacuum treatment. But in case of black locust, beech and common spruce samples the surface tension decreased, the wetting became worse due to the ulterior treatment in water and vacuum.
Keywords: surface tension / wetting of wood / heat treatment in oil / vacuum / beech / oak / black locust / spruce
1. INTRODUCTION
The aim of treating wood species in oil is to enhance their durability in outdoor conditions. The vegetable oil at temperatures between 180 and 220oC serves as medium to transport heat into wooden beams and to separate oxygen from immersed wood. After several hours of deep frying the wood became modified with new properties strongly increased dimensional stability biological durability and brittleness (RAPP - SAILER 2001).
M. de Meijer conducted a comparison of surface energy determination methods of spruce and meranti. It was noted that thermodynamic equilibrium conditions assumed by Young’s equation are generally not fulfilled with wood surfaces because of chemical heterogeneity, surface roughness and the absorption of the test solvent. Based on the upper considerations during our tests the testing time was set at 1 second after release of the drop (MEIJER et al. 1999). Wang and Cooper (2005) found that Slack wax was better than palm oil or soy oil in improving the moisture performance of thermally treated wood and treatment at 220oC was superior to treatment at 200oC with 4 hour being generally better than 2 hours of treatment.
Generally wood is exposed to environmental impacts in coated condition. Outdoor coatings are mostly film forming water based glazes. Oils are known as being water repellent, suiting wood also with hydrophobic property. Hydrophobic surfaces are hard to wet by water and such the adhesion of water based glazes is also supposed to be low. (RAPP - SAILER 2001) stated that for oil heat treated pine with higher oil uptake only modified glues lead to good adhesion results.
In order to enhance wettability of oil treated surfaces by water based glazes two types of post treatment were performed: one batch of samples was held in boiling water, to reduce the amount of oil in the near surface by washing out and another batch of samples were supposed to vacuum treatment to eliminate oil reminiscences. Surface tension of solid wood is the main attribute of sufficient wetting and good adhesion of fluids like adhesives and lacquers/glazes (SHUTTLEWORTH 1950). Wetting is good when the contact angle becomes very small, or disappears (RIVER et al. 1991). The feature of surface tension before and after treatment was
Science for Sustainability University of West Hungary International Scientific Conference for PhD Students March 19-20, 2013 – Győr
29
investigated on four wood species: Beech (Fagus sylvatica L.), Oak (Quercus cerris), Black Locust (Robinia pseudoacacia) and common spruce (Picea abies) in order to test the effect of the suggested oil reducing treatments.
2. MATERIAL AND METHODS
2.1. Sample preparation
After preconditioning, 28 samples of 25 mm X 25 mm X 100 mm dimension were prepared from each wood species: Beech (Fagus sylvatica L.), Oak (Quercus cerris), Black Locust (Robinia pseudoacacia) and common spruce (Picea abies). All samples were of radial cut, their surface planed with a 3 knife planer, 5800 RPM, feeding speed of 9 m/min, depth of cut 2 mm, cutting tool diameter 60 mm with 58f00 rot/min, sharpened with magnetic grinder.
2.2. Treatment method
From each wood species 21 samples were boiled in sunflower oil at 200oC, on atmospheric pressure during 4 hours in a pot in such a manner to not to come in contact neither with the walls of the pot neither with each other and kept immersed during treatment.
After oil treatment 7 samples were conditioned to 20oC during 1 week, than boiled in 100oC distilled water for 2 hours similar to the upper boiling conditions. During boiling there was a water uptake registered. After boiling the samples in water they were conditioned at 35oC in a drying chamber till the mass of the samples following oil treatment.
Another 7 samples were supposed to vacuum in a pot specially designed for this purpose, immersed in distilled water in such a manner to not to come in contact neither with the walls of the pot neither with each other and kept immersed during treatment. Duration of the cyclic treatment was 120 minutes as follows: 20 minutes at -0.8 bar, 40 min at 2.5 bar, 20 min at -0.8 bar and finally 40 minutes at 2.5 bar pressure. During the process the air within the microstructure of wood was replaced by water and in the same time excess of oil was also washed out. After vacuuming the samples in water they were conditioned at 35oC in a drying chamber till the mass of the samples following oil treatment.
2.3. Measurement of contact angle
Surface tension was measured by means of a PGX Goniometer, taking 2 measurements on each sample. During the measurements a drop of liquid was placed on the surface of wood sample. It was assumed, that the liquid does not react with the solid. It was emphasized that contrary to ideal smooth surfaces, the drop of water is distorted along the grains, taking a form of a semi oval sphere. The contact angle was measured as the angle between the outline tangent of the smaller diameter and surface. The volume of the measuring drop was of 0.5 µl, and the contact angle was automatically detected and measured at 1 sec after the release of the droplet, as previously agreed. As test liquid distilled water was used. Before each measurement the measuring instrument was calibrated. All measurements were performed in a laboratory conditioned to 65% RH and 22oC.
2.4. Measurement of surface roughness
Roughness measurements were performed, by means of Mahr Perthen SP 3 being a stylus tip instrument with 5μm radius. The instrument calculates the roughness parameters automatically
Science for Sustainability University of West Hungary International Scientific Conference for PhD Students March 19-20, 2013 – Győr
30
using a Gaussian filter. For the surface roughness characterization the Rz parameters were chosen for evaluation, and 5 measurements/sample were made.
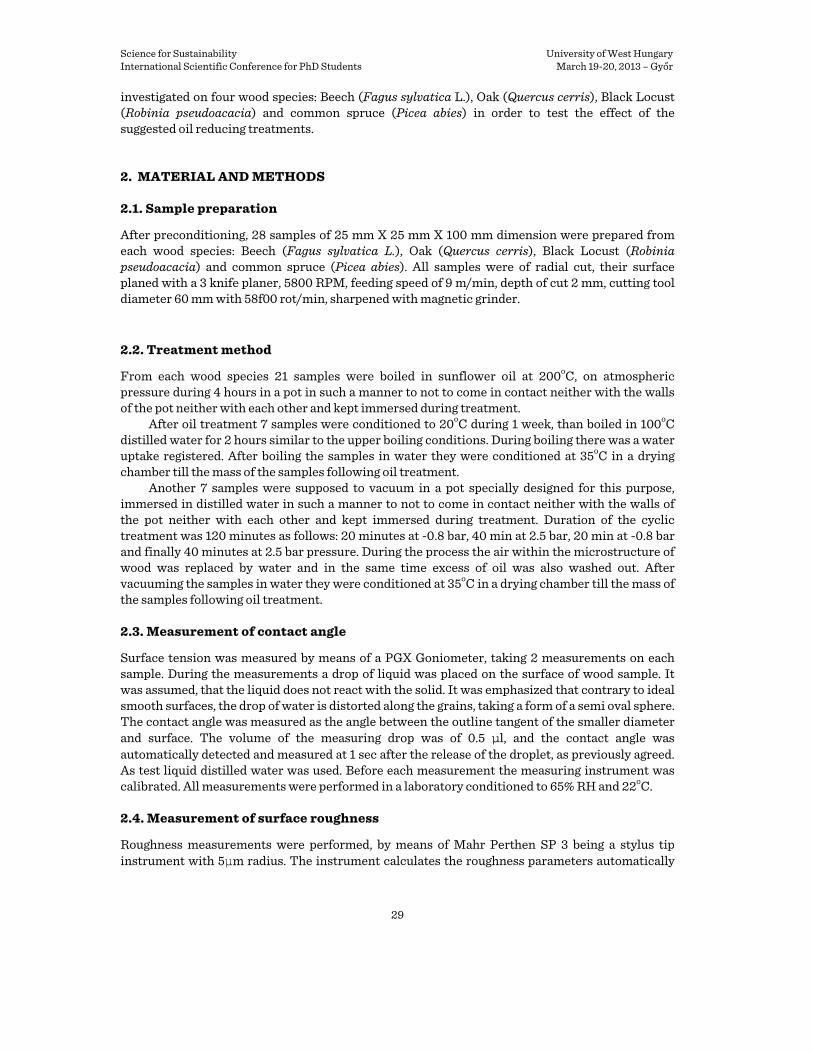
The stylus detected the surface geometry perpendicular to the grain, along a 17.5 mm long trace, consisting of 7 of 2.5mm long (Figure 1) consecutive sampling lengths. Rz parameters are calculated as mathematical mean of five consecutive le sampling lengths, not considering the first and the last le of the total measured length as shown on Fig.1. Since single extreme profile peaks usually only have a limited influence on the parts performance, Rz fallowed by Ra is the most suitable surface parameter for characterization of diffuse porous wood species with relative homogeneous structure (PEREZ - SALCA 2012). More than one measurement on one sample is recommended (MAGOSS - TATAI 2011).
Figure 1. The calculation of the Rz parameter along the evaluation length
3. RESULTS AND DISCUSSION
3.1. Beech samples
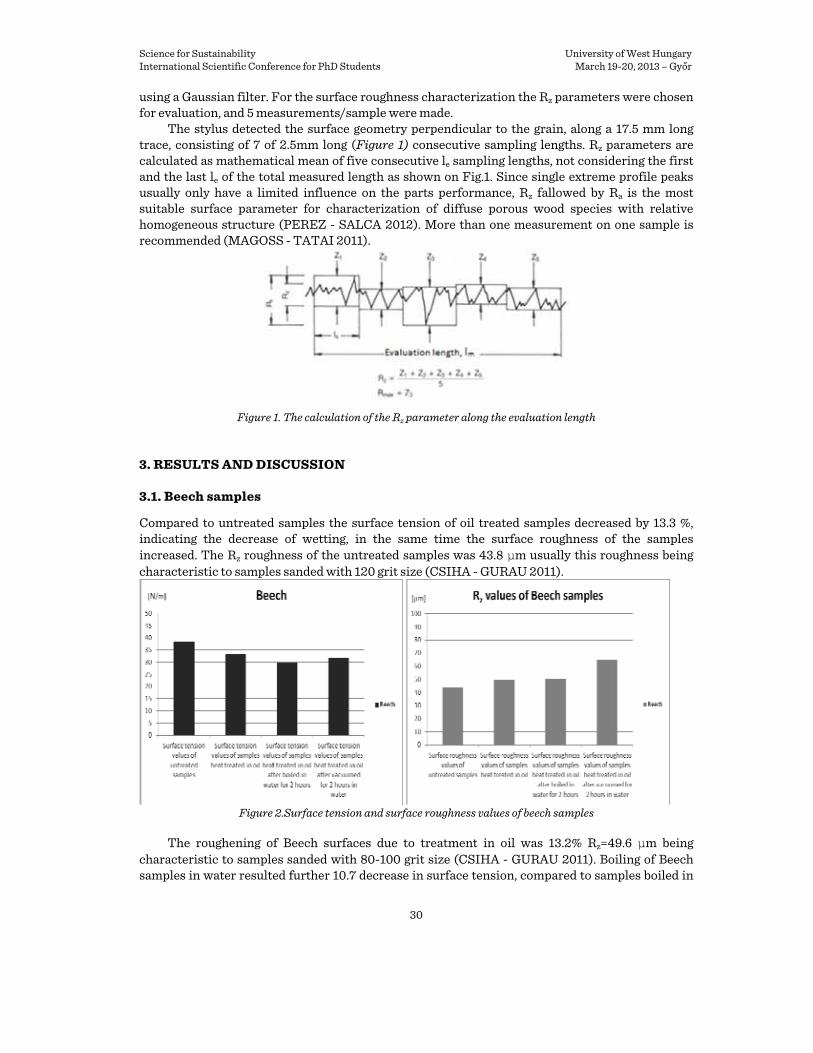
Compared to untreated samples the surface tension of oil treated samples decreased by 13.3 %, indicating the decrease of wetting, in the same time the surface roughness of the samples increased. The Rz roughness of the untreated samples was 43.8 μm usually this roughness being characteristic to samples sanded with 120 grit size (CSIHA - GURAU 2011).
Figure 2.Surface tension and surface roughness values of beech samples
The roughening of Beech surfaces due to treatment in oil was 13.2% Rz=49.6 μm being
characteristic to samples sanded with 80-100 grit size (CSIHA - GURAU 2011). Boiling of Beech samples in water resulted further 10.7 decrease in surface tension, compared to samples boiled in

Science for Sustainability University of West Hungary International Scientific Conference for PhD Students March 19-20, 2013 – Győr
31
oil, indicating further worsening of the wetting. In the same time boiling in water of oil treated samples doesn’t changed their surface roughness. On samples supposed to vacuum the surface tension γvac= 31.9 N/m was higher than in case of samples boiled in water γw= 29.7 N/m (Figure 2) but even so lower than the surface tension of oil treated samples γot=33.4 N/m, indicating further worsening of the surface wetting compared to the one of samples treated in oil. In the same time the surface roughness increased significantly (p=5%) probably due to the pulling effect of the vacuum.
Was not possible to find a clear correlation between surface roughness and surface tension in case of the investigated samples prepared according to the given conditions.
3.2. Common Pine samples
Figure 3.Surface tension and surface roughness values of common pine samples
The surface tension of oil treated samples compared to untreated samples decreased by 20.6%, indicating the decrease of wetting, in the same time the surface roughness of the samples increased. The Rz roughness of the untreated samples was 57.1 μm usually this roughness being characteristic to samples sanded with 80 grit size (CSIHA - GURAU 2011). The roughening of Common pine surfaces due to treatment in oil was 19.7% Rz=68.44 μm being characteristic to samples sanded with 60 grit size (CSIHA - GURAU 2011). Boiling of Common Pine samples in water resulted further 10.7 decrease in surface tension, compared to samples boiled in oil, indicating further worsening of the wetting in comparison with treatment in oil. In the same time boiling in water of oil treated samples doesn’t changed their surface roughness significantly (p=5 %). On samples supposed to vacuum the surface tension γvac= 31.1 N/m (Figure 3) was nearly equal with the one of samples boiled in water γw= 29.7 N/m but even so lower than the surface tension of oil treated samples γot=42.1 N/m, indicating further worsening of the surface wetting compared to the one of samples treated in oil. In the same time the surface roughness increased significantly (p=5%) probably due to the pulling effect of the vacuum.
3.3. Oak samples
In comparison with untreated samples the surface tension of oil treated samples decreased by 23.6%, indicating the decrease of wetting, in the same time the surface roughness of the samples increased. The Rz roughness of the untreated samples was 84.45 μm usually this roughness being characteristic to samples sanded with 40 grit size (CSIHA - GURAU 2011), but in this case the presence of large open pores indicates the high roughness not the rude quality of machining. The

Science for Sustainability University of West Hungary International Scientific Conference for PhD Students March 19-20, 2013 – Győr
32
roughening of Oak surfaces due to treatment in oil was 11.5% Rz=94.2 μm. Boiling of Oak samples in water resulted 13.8% increase in surface tension, compared to samples boiled in oil, indicating some improvement of the wetting but the wettability of untreated samples was still not reached. In the same time boiling in water of oil treated samples resulted a 5.9% increase of surface roughness as well. On samples supposed to vacuum the surface tension γvac= 34.24 N/m was nearly equal with the one of samples boiled in water γw= 34.47 N/m and higher than the surface tension of oil treated samples γot=30.27 N/m, indicating improvement of the surface wetting compared to the one of samples treated in oil (Figure 4). In case of vacuum treated samples the roughness decreased to 86.7 μm near to the roughness of the untreated samples. By the way it is not proved that the phenomenon can be interpreted as real “reduction” in roughness it is much more likely that it is due to a measuring failure: probably the large open pores were not so numerous along the 17.5 mm long measuring trace than for oil treated and boiled samples.
Figure 4.Surface tension and surface roughness values of oak samples
On oil treated Black Locust samples the surface tension decreased by 8.2%, compared to untreated samples indicating the decrease of wetting, in the same time the surface roughness of the samples increased, but with this result Black Locust had the lowest decrease in surface tension besides all four investigated species. The Rz roughness of the untreated samples was 61.48 μm usually this roughness being characteristic to samples sanded with 80 grit size (CSIHA - GURAU 2011), but in this case the presence of large open pores indicates the high roughness not the rude quality of machining. The roughening of Black Locust surfaces due to treatment in oil was 10.2% Rz=67.7 μm. Boiling of Black Locust samples had no effect on surface tension, neither the treatment in vacuum (Figure 5). In case of boiled samples the roughness doesn’t changed significantly in comparison with the roughness of oil treated samples, neither in case of vacuum treated samples.
By the way it is not proved that the phenomenon can be interpreted as real “stagnation” in roughness it is much more likely that it is due to a measuring failure: probably the large open pores were not so numerous along the 17.5mm long measuring trace than for oil treated and boiled samples.
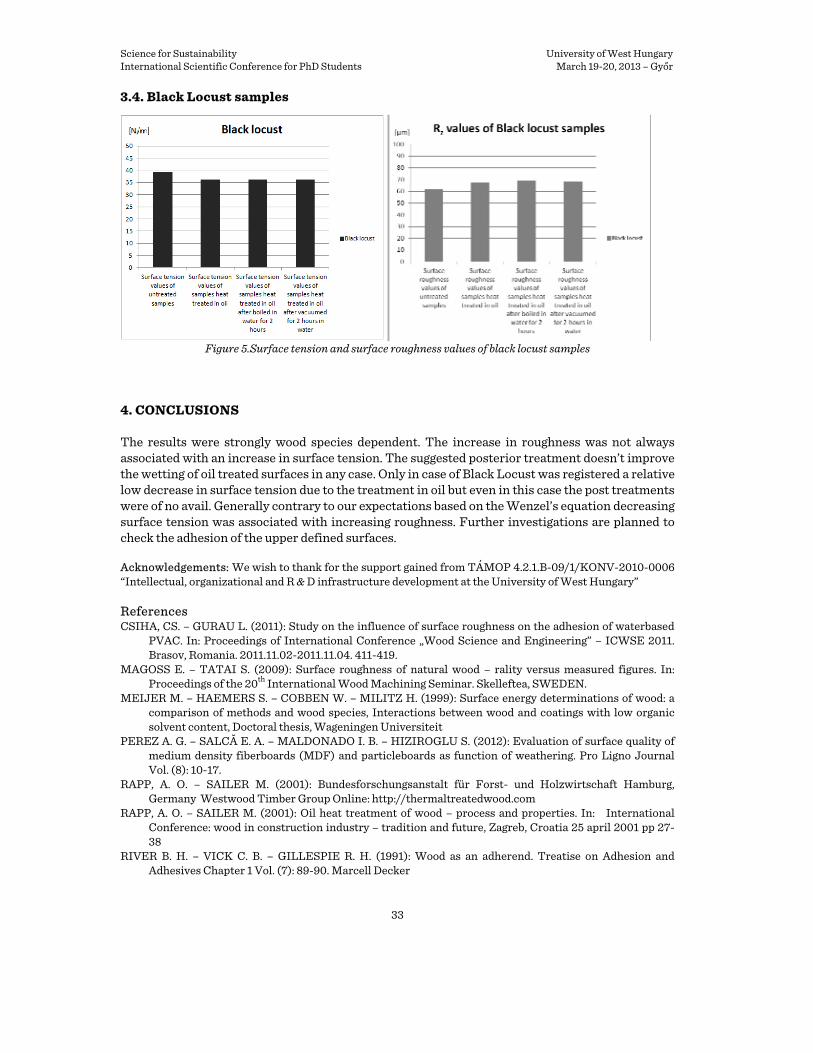
Science for Sustainability University of West Hungary International Scientific Conference for PhD Students March 19-20, 2013 – Győr
33
3.4. Black Locust samples
Figure 5.Surface tension and surface roughness values of black locust samples
4. CONCLUSIONS
The results were strongly wood species dependent. The increase in roughness was not always associated with an increase in surface tension. The suggested posterior treatment doesn’t improve the wetting of oil treated surfaces in any case. Only in case of Black Locust was registered a relative low decrease in surface tension due to the treatment in oil but even in this case the post treatments were of no avail. Generally contrary to our expectations based on the Wenzel’s equation decreasing surface tension was associated with increasing roughness. Further investigations are planned to check the adhesion of the upper defined surfaces. Acknowledgements: We wish to thank for the support gained from TÁMOP 4.2.1.B-09/1/KONV-2010-0006 “Intellectual, organizational and R & D infrastructure development at the University of West Hungary” References CSIHA, CS. – GURAU L. (2011): Study on the influence of surface roughness on the adhesion of waterbased
PVAC. In: Proceedings of International Conference „Wood Science and Engineering” – ICWSE 2011. Brasov, Romania. 2011.11.02-2011.11.04. 411-419.
MAGOSS E. – TATAI S. (2009): Surface roughness of natural wood – rality versus measured figures. In: Proceedings of the 20th International Wood Machining Seminar. Skelleftea, SWEDEN.
MEIJER M. – HAEMERS S. – COBBEN W. – MILITZ H. (1999): Surface energy determinations of wood: a comparison of methods and wood species, Interactions between wood and coatings with low organic solvent content, Doctoral thesis, Wageningen Universiteit
PEREZ A. G. – SALCĂ E. A. – MALDONADO I. B. – HIZIROGLU S. (2012): Evaluation of surface quality of medium density fiberboards (MDF) and particleboards as function of weathering. Pro Ligno Journal Vol. (8): 10-17.
RAPP, A. O. – SAILER M. (2001): Bundesforschungsanstalt für Forst- und Holzwirtschaft Hamburg, Germany Westwood Timber Group Online: http://thermaltreatedwood.com
RAPP, A. O. – SAILER M. (2001): Oil heat treatment of wood – process and properties. In: International Conference: wood in construction industry – tradition and future, Zagreb, Croatia 25 april 2001 pp 27-38
RIVER B. H. – VICK C. B. – GILLESPIE R. H. (1991): Wood as an adherend. Treatise on Adhesion and Adhesives Chapter 1 Vol. (7): 89-90. Marcell Decker
Science for Sustainability University of West Hungary International Scientific Conference for PhD Students March 19-20, 2013 – Győr
34
Shuttleworth R.(1950): The surface tension of solids. In: Proceedings of the Physical Society A 63 444, Section A, Vol. 63. Number 5.
WANG J. Y. – COOPER P. A. (2005): Effect of oil type, temperature and time on moisture properties of hot oil-treated wood. Holz als Roh- und Werkstoff. Vol. (63): 417-422
Diffusion Coefficients of Water in Coniferous Wood
HALACHAN, Pavol* – HRČKA, Richard
Faculty of Wood Sciences and Technology, Department of Wood Science, Technical University in Zvolen *Corresponding author: [email protected]; Technical University in Zvolen,
Masarykova 24, SK-960 53 Zvolen, Slovak Republic
Abstract- The paper deals with the measurement of water diffusion coefficients in wood. The aim of the paper is to identify water diffusion coefficients for three species to compare them for samples with insulated lateral surfaces. Diffusion coefficients were determined for three coniferous woods: Norway spruce (Picea abies L.), Scots Pine (Pinus sylvestris L.), Silver Fir (Abies alba Mill.), and in all main directions. Samples were dried to 0% and placed to the 98% humidity. Samples were measured on balances in ascending time intervals. This work utilizes non-stationary method along with determining diffusion coefficients after experimental work. The experiment with non-insulated samples was divided into two parts. At the beginning we measured Norway spruce and Scots pine sapwood and afterwards Scots pine heartwood and Silver fir. The third part was the experiment with insulated samples. Insulated samples were only samples of Norway spruce and Scots pine sapwood. Samples were insulated with hydrophobic material (silicon). The results of experiments were evaluated in office program MS Excel. The evaluation program works on the principle of non-linear regression. Non-linear regression (Solver) evaluated measurement data with the theoretical values. The results confirmed the fact that the increasing moisture diffusion coefficient with moisture content according stationary method, but our results showed such increase only for some moisture content. The results of this work are very important not only for researching and exploring physical properties of wood but they can help understanding water movement in construction, drying wood processes etc.
Key words: coniferous species / diffusion coefficient / water in wood / bound water
1. INTRODUCTION
Moisture in wood exists in two basic forms: bound water within cell wall and free water in liquid form in the voids of wood (SIAU 1984). Diffusion is characterized by the movement of bound water. Diffusion is one of processes, which influence changes of MC in wood. Fick´s laws describe diffusion. We can use Fick´s laws to find moisture content of some point inside a solid in exact time, and amount of accepted or evaporated water from whole solid, and amount of water that diffused through wood (HRČKA 2008). Diffusion coefficient is the number that describes water movement of bound water in wood. It is an integral parameter which quantitatively characterizes the physical, respectively physical-chemical action. The aim of this paper is to determine diffusion coefficients for three coniferous woods and to compare them with older results and compare results for samples that have insulated lateral surfaces.

Science for Sustainability University of West Hungary International Scientific Conference for PhD Students March 19-20, 2013 – Győr
35
2. MATERIAL AND METHODS
For experiments we used wood of three species Norway spruce (Picea abies L.), Scots pine (Pinus sylvestris L.), Silver Fir (Abies alba Mill.). We used samples with dimensions 3×3×1 cm3 and ten samples for every principal anatomical direction. We used for unsteady method aquarium with φ = 98% humidity (Figure 1). At first, samples were dried to 0% and placed to φ= 98% relative humidity (RH). Aquarium was placed in conditioning chamber with constant temperature (20°C). KURJATKO (1990) measured weight in time intervals: 0h, 1h, 2h, 4h, 8h, 1d, 3d, 5d, 7d, 14d, 28d. But in our experiment we measured samples on balances in ascending time intervals. At beginning we measured samples every half hour. The samples were measured on balances for three decimal places. For nonlinear regression we used MS Excel (procedure Solver). We repeated this experiment with samples with insulated lateral surfaces.
A: B: Figure 1. A: Schematic representation of aquarium with φ = 98% RH.
1) Top with insulation, 2) Sample, 3) Desiccator, 4) Fan, 5) Aqueous solution of CuSO4·5H2O [φ = 98%], B: Air-conditioned room.
A: B: Figure 2. A: Sample with insulated lateral surfaces, B: Experiment
Non- stationary methods are based on Fick´s second law:
2
2
xcD
tc
∂∂=
∂∂
(1) Equation (1) is only for one direction, on condition that the diffusion coefficient is constant. The concentration is a potential of water transport in wood:
(2) ρrw - basic density, ρ0- oven dry density. We used boundary condition of the form:
(3) s- half thickness of the sample, α- mass transfer coefficient, cr- equilibrium concentration

Science for Sustainability University of West Hungary International Scientific Conference for PhD Students March 19-20, 2013 – Győr
36
We used average concentration:
=S
dxtxcS
tc0
),(1
)( (4)
The solution is (POŽGAJ et al. 1997):
(5) Biot criterion is defined as:
(6) It follows for average moisture content (HRČKA 2008):
(7) D and α are unknown and can be determined by least squares method. Solver uses least-squares criterion in the following form:
[ ]2
.exp.1
,
−
=
∞∞=Σ=
er
t
teor
tN
i ww
wwDQ
MINIMUM
α
(8)
3. RESULTS AND DISCUSSION
Here we presented only the main results of the experiments. All charts, graphs, results and statistical results only with non-insulated samples are published in HALACHAN (2012).
Figure 3. Graph of diffusion coefficient depending on the moisture for pine heartwood
In the samples of Pine heartwood, the diffusion coefficient in the longitudinal direction is
significantly different from radial or tangential direction. Radial and tangential directions are almost identical (Figure 3).
Samples of Silver fir show theoretical differences between anatomical directions (Figure 4). Diffusion coefficient reaches maximal value at 13% [MC] in longitudinal direction. After 13 % MC, further towards EMC, diffusion coefficient decreased.
Samples of Norway spruce (Figure 5) show highest D in longitudinal direction. Radial and tangential directions are almost identical.
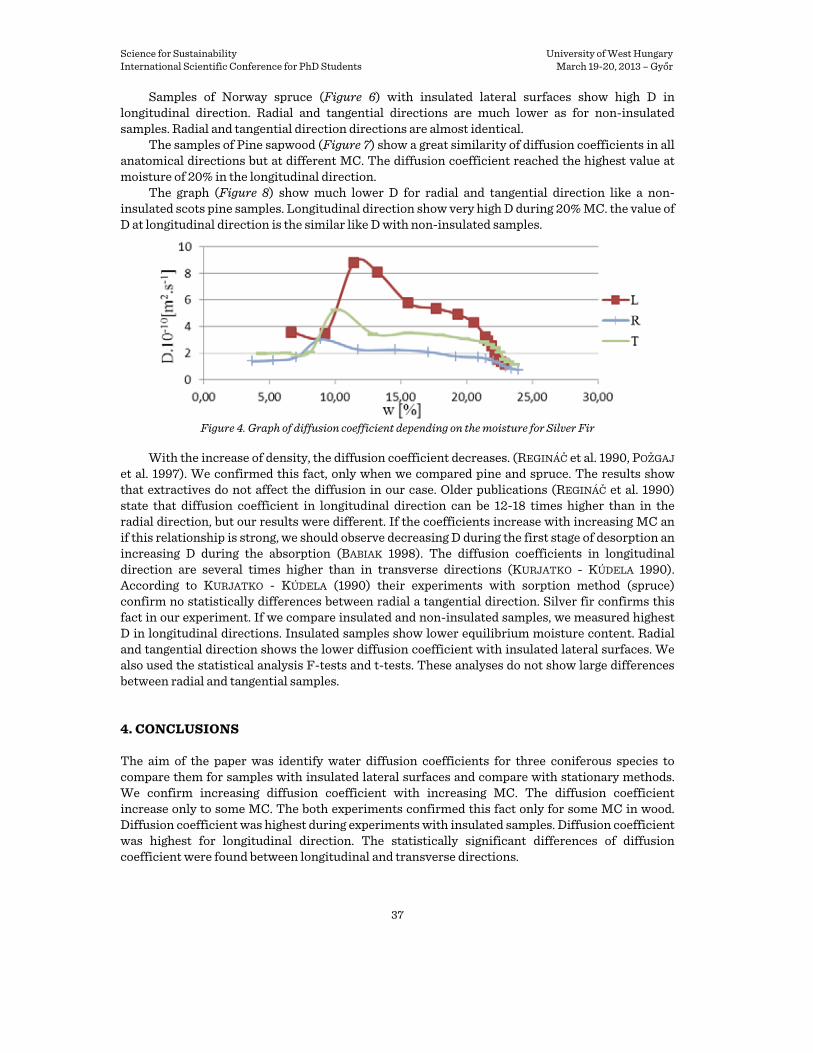
Science for Sustainability University of West Hungary International Scientific Conference for PhD Students March 19-20, 2013 – Győr
37
Samples of Norway spruce (Figure 6) with insulated lateral surfaces show high D in longitudinal direction. Radial and tangential directions are much lower as for non-insulated samples. Radial and tangential direction directions are almost identical.
The samples of Pine sapwood (Figure 7) show a great similarity of diffusion coefficients in all anatomical directions but at different MC. The diffusion coefficient reached the highest value at moisture of 20% in the longitudinal direction.
The graph (Figure 8) show much lower D for radial and tangential direction like a non-insulated scots pine samples. Longitudinal direction show very high D during 20% MC. the value of D at longitudinal direction is the similar like D with non-insulated samples.
Figure 4. Graph of diffusion coefficient depending on the moisture for Silver Fir
With the increase of density, the diffusion coefficient decreases. (REGINÁČ et al. 1990, POŽGAJ
et al. 1997). We confirmed this fact, only when we compared pine and spruce. The results show that extractives do not affect the diffusion in our case. Older publications (REGINÁČ et al. 1990) state that diffusion coefficient in longitudinal direction can be 12-18 times higher than in the radial direction, but our results were different. If the coefficients increase with increasing MC an if this relationship is strong, we should observe decreasing D during the first stage of desorption an increasing D during the absorption (BABIAK 1998). The diffusion coefficients in longitudinal direction are several times higher than in transverse directions (KURJATKO - KÚDELA 1990). According to KURJATKO - KÚDELA (1990) their experiments with sorption method (spruce) confirm no statistically differences between radial a tangential direction. Silver fir confirms this fact in our experiment. If we compare insulated and non-insulated samples, we measured highest D in longitudinal directions. Insulated samples show lower equilibrium moisture content. Radial and tangential direction shows the lower diffusion coefficient with insulated lateral surfaces. We also used the statistical analysis F-tests and t-tests. These analyses do not show large differences between radial and tangential samples.
4. CONCLUSIONS
The aim of the paper was identify water diffusion coefficients for three coniferous species to compare them for samples with insulated lateral surfaces and compare with stationary methods. We confirm increasing diffusion coefficient with increasing MC. The diffusion coefficient increase only to some MC. The both experiments confirmed this fact only for some MC in wood. Diffusion coefficient was highest during experiments with insulated samples. Diffusion coefficient was highest for longitudinal direction. The statistically significant differences of diffusion coefficient were found between longitudinal and transverse directions.
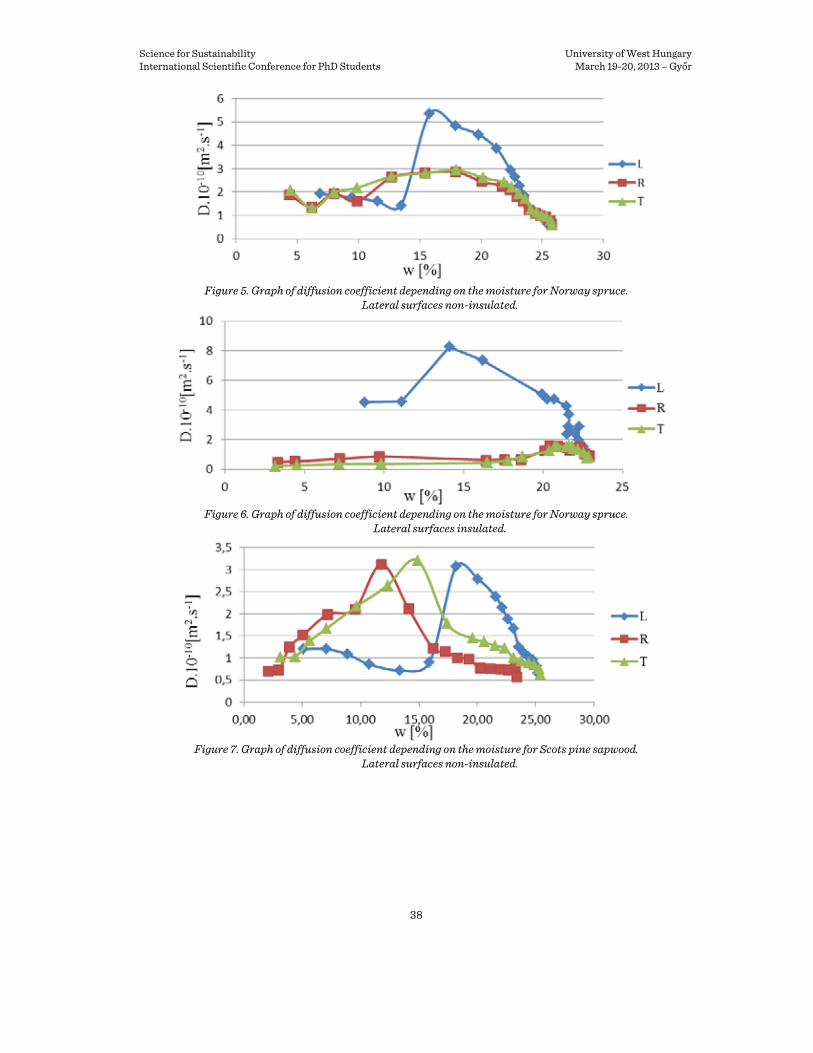
Science for Sustainability University of West Hungary International Scientific Conference for PhD Students March 19-20, 2013 – Győr
38
Figure 5. Graph of diffusion coefficient depending on the moisture for Norway spruce.
Lateral surfaces non-insulated.
Figure 6. Graph of diffusion coefficient depending on the moisture for Norway spruce.
Lateral surfaces insulated.
Figure 7. Graph of diffusion coefficient depending on the moisture for Scots pine sapwood.
Lateral surfaces non-insulated.

Science for Sustainability University of West Hungary International Scientific Conference for PhD Students March 19-20, 2013 – Győr
39
Figure 8. Graph of diffusion coefficient depending on the moisture for Scots pine sapwood.
Lateral surfaces insulated. References BABIAK, M. (1998): Diffusion coefficients of beech and black locust wood. Wood structure and properties ´98,
Technical University in Zvolen, Zvolen 65 – 70 pp. HALACHAN, P. (2012): Measurement of transport characteristics of wood, Technical University in Zvolen,
Zvolen, 67 pp. HRČKA, R. (2008): Diffusion of water in wood of diffuse-porous species in longitudinal direction. Acta
facultatis – Xylologiae, Zvolen, 57 – 59 pp. KURJATKO, S. (1970): Návody na cvičenia z fyzikálnych vlastností dreva a drevných materiálov. (Physical
properties of wood an wood based materials, Guides exercises) VŠLD, 90 pp. KURJATKO, S. – KÚDELA, J. (1990): Bound water diffusion coefficients based on the sorption method. Latest
achievements in research of wood structure and physics, Zvolen, 187 – 198 pp. POŽGAJ, A. – CHOVANEC, D. – KRJATKO, S. – BABIAK, M., (1997): Wood structure and properties. (Štruktúra
a vlastnosti dreva) Bratislava, Priroda 486 pp. (in Slovak) REGINÁČ, L. a kol. (1990): Náuka o dreve II. (Wood science) 5 vyd. Zvolen, Edičné stredisko VŠLD, 1990. 424 s. SIAU, J. (1984): Transport processes in wood. Springer-Verlag Berlin Heidelberg New York. 245 pp.
Fire Protection of Wood Structures
(Technical Guide to the Fire Protection of Slender and Visible Wooden Brackets)
LONSTÁK Nóraa1 –SZABÓ Pétera
a1Nóra LONSTÁK, PhD student, University of West Hungary, Faculty of Wood Sciences, Department of Architecture, Sopron, Hungary
Abstract – The paper reports on the Eurocode standard defines the sizing of wood structures in complicated way. More tables has been made in order to help the sizing. These tables are helpful for those who are not familiar with the use of Eurocode standard, or for those who needs a value for planning in advance only. The limit values of fire resistance of slim, visible wood support structures can be seen in the tables made by me. Different examined parameters have major influence to the conformity of the structural elements. Calculations have shown that if the utilization of the structural component on normal temperature falls below 100%, the fire resistance of the structure increasing. The segregation of fire exposed pages makes it even more significant. Based on these results we can conclude that the investigated cross-sections (with few exceptions) correspond to the most frequently used, fifteen minutes fire resistance requirements.
1 Corresponding author: e-mail: [email protected], H-9400 Sopron, Bajcsy-Zs. u. 4.

Science for Sustainability University of West Hungary International Scientific Conference for PhD Students March 19-20, 2013 – Győr
40
Keywords: fire protection / wood structures / fire resistance / Eurocode standard / slender and visible wooden brackets
1. INTRODUCTION
During many centuries nations have used materials and structural designs that have been easily accessible and feasible. Nowadays, the proximity of building materials is not so significant and modern technologies enable us to construct special structures. Due to this increase in possibilities, architects have discovered wood, as building material, again. Wood in architecture reflects friendly, warm and environmentally friendly atmosphere. Its advantageous aesthetic features are best visible when used in slab structures. There are two forms of slabs: inter-floor and roof slabs. However, in many cases the construction of a given structure conflicts with strict fire safety requirements (sometimes unreasonably). In many cases only treatments with preservatives or coating can solve this problem. As a consequence, the natural and environmentally friendly atmosphere of wood is lost, not to mention the costs of such processes. There are two ways to prove the compliance with requirements. One of the methods is the standardised analysis in accredited laboratories, but this is expensive and time-consuming. The other method is the calculation according to the Eurocode standard series based on former measuring and calibration results. Organisations, independent from standardization processes, have prepared guide lines to assist the application of the latter method. These guides enable us to prove the compliance of most frequently used structures and materials without calculation and by using related charts. The process of guide lines preparation is still going on. The chart I have prepared is such a guide for those who are not experienced in using the Eurocode standard series or need the value in question during preliminary planning. My chart gives the compliance of slender, bent wooden brackets with fire safety requirements according to cross section, material quality and other parameters. The data of the chart shows the cross section that has the fire resistance limits needed to meet the requirements of the National Fire Protection Standards.
2. METHODS
While preparing this chart I always put great emphasis on filling it with data and categorize them according to parameters that meet the requirements needed when planning the fire safety of structures used in architecture.
Taking the preservation of wood naturalness into consideration, I worked with natural, i.e. D-s2, d0, fire safety class wood in my analyses. The search for practical application possibilities made it necessary for us to limit the use of structural elements to categories 1 and 2. This means that analysed structures are constructed in covered, closed and open spaces thus their equilibrium moisture content does not exceed 20%.
While assembling this chart, I took structures into account that are properly supported against buckling.
I chose three materials as the bases for my analyses that are often used as bent brackets: pine, hardwood and laminated-glued brackets. The fire safety characteristics of these materials are significantly different. This is primarily true for burn speed and reliability (quality) safety factors.
The basic idea of the analysis was to determine the fire resistance limits of slender brackets with small cross sections. I chose the cross section sizes of brackets according to this.
The fire safety of a bracket element is always expressed by the number of minutes it resists fire. I took into consideration the values (minutes) that are most frequent in requirements (15, 30 and 45 minutes).

Science for Sustainability University of West Hungary International Scientific Conference for PhD Students March 19-20, 2013 – Győr
41
Fire reaches structural elements from different directions in various structures. The number of sides of structures exposed to fire causes the greatest differences in fire resistance limits. I analysed one-, three- and four-sided fire exposures while preparing my chart.
The logic of the chart, as technical guide, is based on the following: Step 1: determining the solidity of intact material; Step 2: determining burn depth; Step 3: checking load capacity limits.
If torque value is smaller than the calculated torque limit of extraordinary condition due to load, the given structure meets the fire safety time requirements used in burn depth determination. Thus this value, expressed in minutes, can be considered as the fire resistance limit of the given structural element.
We determined cross section factors according to known cross sections of structural elements. Based on the material of brackets I chose material safety factor and flexural strength (the basis of quality categorisation). Further values result from the type of slabs, inter floor or roof. According to the type of slab, I selected the duration of load and the related modifying factor. The torque of extraordinary conditions can be calculated with the help of bracket utilization.
After that I determined the burn speed characteristic for the bracket material based on the supposed fire exposure time. Based on burn speed, decreased cross section and cross section factor caused by fire can be calculated. Using the latter one, I determined the torque limit of extraordinary conditions. It shows whether the bracket keeps its load capacity during fire exposure. As the last step of filling this chart, I selected the maximal duration – from analysed values - that the given bracket compliances with.
Using the above-mentioned data, I constructed my charts in a way that we can select the fire resistance limits of a bracket of given cross section based on material, function, utilization at normal temperatures and the number of sides exposed to fire. In addition, there is the distance of the greatest lateral support (lmax) to be built in without risking buckling.
3. EXAMPLE
An example for fire resistance limit determination based on charts Visible, pine-beam, untreated, inter floor slab

Science for Sustainability University of West Hungary International Scientific Conference for PhD Students March 19-20, 2013 – Győr
42
calibration chart for pine brackets
50 100 3500 R45 R15 R15 R45 R15 R15 R45 R15 R15 R45 R15 R15 R45 R15 R15 R45 R15 R1550 150 2333 R45 R15 R15 R45 R15 R15 R45 R15 R15 R45 R15 R15 R45 R15 R15 R45 R15 R1550 200 1750 R45 R15 R15 R45 R15 R15 R45 R15 R15 R45 R15 R15 R45 R15 R15 R45 R15 R1560 120 4200 R45 R15 R15 R45 R15 R15 R45 R15 R15 R45 R15 R15 R45 R15 R15 R45 R15 R1560 140 3600 R45 R15 R15 R45 R15 R15 R45 R30 R15 R45 R15 R15 R45 R15 R15 R45 R15 R1560 160 3150 R45 R15 R15 R45 R15 R15 R45 R30 R15 R45 R15 R15 R45 R15 R15 R45 R15 R1560 200 2520 R45 R15 R15 R45 R15 R15 R45 R30 R15 R45 R15 R15 R45 R15 R15 R45 R15 R1560 240 2100 R45 R15 R15 R45 R15 R15 R45 R30 R15 R45 R15 R15 R45 R15 R15 R45 R15 R1580 120 7467 R45 R30 R15 R45 R30 R15 R45 R30 R30 R45 R15 R15 R45 R30 R15 R45 R30 R1580 140 6400 R45 R30 R15 R45 R30 R15 R45 R30 R30 R45 R15 R15 R45 R30 R15 R45 R30 R1580 160 5600 R45 R30 R15 R45 R30 R30 R45 R30 R30 R45 R15 R15 R45 R30 R15 R45 R30 R3080 200 4480 R45 R30 R30 R45 R30 R30 R45 R30 R30 R45 R30 R15 R45 R30 R15 R45 R30 R3080 240 3733 R45 R30 R30 R45 R30 R30 R45 R30 R30 R45 R30 R15 R45 R30 R30 R45 R30 R30100 100 14000 R45 R15 R15 R45 R30 R15 R45 R30 R15 R45 R15 - R45 R15 R15 R45 R30 R15100 120 11667 R45 R15 R15 R45 R30 R15 R45 R30 R15 R45 R15 - R45 R15 R15 R45 R30 R15100 140 10000 R45 R30 R15 R45 R30 R15 R45 R30 R15 R45 R15 R15 R45 R15 R15 R45 R30 R15100 150 9333 R45 R30 R15 R45 R30 R15 R45 R30 R15 R45 R15 R15 R45 R30 R15 R45 R30 R15100 160 8750 R45 R30 R15 R45 R30 R15 R45 R30 R30 R45 R15 R15 R45 R30 R15 R45 R30 R15100 200 7000 R45 R30 R15 R45 R30 R30 R45 R30 R30 R45 R15 R15 R45 R30 R15 R45 R30 R30100 240 5833 R45 R30 R15 R45 R30 R30 R45 R30 R30 R45 R15 R15 R45 R30 R15 R45 R30 R30
inter floor slabutilization utilization
80% 60%80% 60% 100%
b [m
m]
h [m
m]
l max
[m
m]
100%
roof slab
R15: A beam with a cross section of 100×140 mm can keep its load capacity for 15 minutes in case of fire exposure on three sides if lateral supports are not longer than 10,000 mm and when used as a beam in an inter floor slab made of untreated pine of fire safety category D.
4. CONCLUSIONS
The charts introduced demonstrate that analysed structures differ significantly according to the cross section of the bracket. Elements of smaller cross section often have minimal, 15-minute resistance limits. The reason for this is, naturally, the high rate of burnt area compared to intact structure in given time duration. The planned utilization of a given bracket has a smaller yet
Result: R15 fire resistance limit
Bracket cross section: b=100mm h=140mm
Limit of use (lmax)
Based on function: Inter floor slab
Based on static calculation: utilization 80%
h
b l
Based on structure: Three-side fire

Science for Sustainability University of West Hungary International Scientific Conference for PhD Students March 19-20, 2013 – Győr
43
significant impact on fire safety values. It is clear that the smaller the utilization, the greater the fire safety of the wooden structure element is. The number of sides exposed to fire influences the fire safety of a structural element most significantly. If only one side is exposed to fire, all studied structures meet the requirements of a 45-minute fire resistance limit.
Wood type also influences compliance with regulations. Hardwood brackets proved to be the most resistant. However, their construction results in increased costs and they tend to crack more than pine brackets.
In the case of small cross sections, the fire resistance limit of 30 minutes differs from material to material. This safety limit can occur in the case of pine merely if it is used as roof slab. As for hardwood and laminated-glued brackets, inter floor slabs can be constructed using small cross sections and still reach fire resistance limit of this duration. Whatever material is considered, 30 minutes can be accomplished only if utilization is 60%.
If cross section is bigger (above 80 mm), compliances vary not only according to material type but according to the increase in bracket cross section. In the case of one- and three-side fire exposure, mainly the increase in cross section influences compliance. On the other hand, in the case of four-side fire exposure, mainly stocky brackets meet the requirements of 30-minute resistance regulations.
A fire resistance of 45 minutes can be achieved in the case of pine if fire exposure is one-sided or if cross section is great. If utilization is reduced, more and more cross section sizes are suitable for achieving 45-minute fire resistance. This fire resistance limit can be reached in the case of inter floor and roof slabs in significantly different ways. The latter ones can only reach the given limit if their cross sections are great.
lmax value – providing the applicability limits of charts and brackets - means the length of lateral support to be built in without risking buckling. It decreases significantly if slenderness (h/b ratio) increases but becomes higher if cross section increases. This is due to the fact that slenderer structures buckle on lower load levels. Greater cross sections can take up greater load so they need fewer load-bearing supporting structural elements.
If a given bracket element does not meet fire safety requirements, an increase of cross section is often needed. This, however, has architectural and structural consequences.
References 28/2011 (IX. 6.) BM rendelet az Országos Tűzvédelmi Szabályzatról. [regulation] (In iHungarian) KULCSÁR B. (2010): Tartószerkezetek tűzvédelme. [Fire Protection of Structures.] lecture notes, Szent
István University, Budapest (in Hungarian) MOLNÁR S. (2004): Faanyagismeret. [Knowledge of Wood.] Mezőgazdasági Szaktudás Kiadó, Budapest (in
Hungarian) KIRÁLY B. (2010): Faszerkezetek tűzvédelme. [Fire protection of wood structures.] lecture notes, University
of West Hungary, Sopron (in Hungarian) SZITÁNYINÉ SIKLÓSI M. (2004): Faszerkezetek tűzállósági méretezése. [Sizing of fire resistance of timber
structures.] (in Hungarian) In: Védelem 2004 XI. year 1. SZITÁNYINÉ SIKLÓSI M. (2009): A faanyagú tartószerkezetek - Eurocode szerinti - tűzhatásra történő
tervezése. [The wood-term effects of structural fire design – by Eurocode.] (in Hungarian) www.vedelem.hu
SZABÓ P. (2010): Szabadon formált felületek a faépítészetben. [Free-formed surfaces in timber construction.] (in Hungarian) In: Magyar Asztalos és Faipar, Sopron, ISSN 1417-0949 3.
SUNLEY, J. – BEDDING, B. (1985): Timber in Construction, BT Batsford Ltd., London VERES, Gy. - ZELENY L. (2009): A fa tűzvédelme. [Fire protection of wood.] www.vedelem.hu(in Hungarian) SCHWANER, K. (1990): Eine Dokumentation des Informationsdienst Holz - Beispiele moderner
Holzarchitektur. Holzwirtschaftlicher Verlag der Arbeitsgemeinschaft Holz e.V., Düsseldorf

Science for Sustainability University of West Hungary International Scientific Conference for PhD Students March 19-20, 2013 – Győr
44
Rational and Efficient Utilization of Wood Stock by Repair Engineering
BURAWSKA, Izabelaa2 – ZBIEĆ, Marcina – BEER, Piotra aFaculty of Wood Technology, Warsaw University of Life Sciences, Warsaw, Poland
Abstract – The objective of this article is to present one of the repair engineering techniques of naturally defected timber beam; a method, leading to rational and efficient utilization of wooden structural members. The proposed repair technique is focused on local reinforcement with synthetic material, lowering the impact of natural wood defects, especially of loosed or decayed knots in solid timber beams. Local reinforcement was applied with the assumption that disturbance of uniform stress field, in vicinity of the disturbance, is only of local character. CFRP tape reduces the influence of loosed or decayed knots on the mechanical properties of wood, as well as limits the impact by inclusions and structure disturbances.
Keywords: reinforcement / repair engineering / CFRP tape / bending strength / stiffness
1. GENESIS OF THE WORK
1.1. Background
Woodworking and furniture industry of the European Union is among the leaders of industrial infrastructure. Depending on the particular member state, share of this branch ranges from 2 to 4% of total industry output. Woodworking industry is highly important to EU countries, because of the 3mln employment count in over 330 thousand enterprises. Woodworking enterprises generate return of 123 billion euro, which is 8% of gross, industry generated income (WYG INTERNATIONAL 2011). High volumes of worldwide logging testify about wide application of the stock. Worldwide logging in 2009 reached 3275.1 million m3, with 34.6 million m3 in Poland, which show gain of 8% in comparison to 2005 values (FAO 2009).
European and Polish woodworking sectors show mainly material character, because of high dependence on availability of the wood. Worldwide economic development and constant increase of natural resources utilization leads do gradual decrease of woodlands in many regions of the country. It is estimated that yearly out of the earth’s woodlands, an area equal to polish territory is being logged. As a result of deforestation of numerous regions of the world, availability of the wood stock of high mechanical parameters decreases. Additionally, measurements show, that on an average, only approximately 15% of timber log volume is knotless, what makes the shortage of material even more painful, forcing lower grade wood stock application.
1.2. Lower quality material
Timber, especially for structural works should conform to specific standard requirements, regarding its quality. Because of safety requirements, lumber undergoes visual or machine grading, determining its class, providing minimal guaranteed strength. The most essential criteria, determining timber grade, are presence, soundness, quantity and distribution of the knots, being the most dangerous natural wood defects. Knots are the commonest wood defect at the same time, causing local disturbances in grain direction. Additionally, higher density and hardness in comparison to surrounding wood results in notch effect, initiating cracks leading to destruction.
2 Corresponding author: [email protected]; Nowoursynowska St. 166; 02-787 Warsaw

Science for Sustainability University of West Hungary International Scientific Conference for PhD Students March 19-20, 2013 – Győr
45
Negative influence of knot on mechanical properties manifests mainly through lowered tensile strength, bending strength and to a lesser degree compression strength (Table 1).
Table 1. Knot influence on wood strength (KOLLMANN - CÔTÉ 1968) Pine Density Tension Compression Static bending in Static bending in wood parallel to the radial the tangential grain direction direction kg/m³ N/mm² N/mm² N/mm² N/mm² Clear 500 78 40.3 50.2 55.2 Few, small knots 530 38.4 36.1 47.1 50.8 Many, larger knots 570 11 31.4 42 36.6
Because of shortages in high quality material (knotless, or small amount of healthy knots without concurrent natural wood defects), it is purposeful to develop effective repair engineering techniques. Such applications enable utilization of cheaper and widely available material, replacing more expensive, higher grades of the stock.
2. THE AIM OF THE STUDY
The article's objective is to present one of the repair engineering techniques of naturally defected timber beam as a method leading to rational and efficient utilization of wooden structural members.
3. EXPERIMENT
Testing was performed using pine samples, as a species most commonly used in construction works.
Pilot experiment was made on small samples (20x20x300mm) without any natural defects. Pilot study was to determine the parameters of testing procedures for further research, important from a scientific point of view. Very high costs are associated with tests on full-size elements.
Test samples were divided into 5 series: A – reference sample – defect free, B – sample weakened by 4mm weakening bore (Figure 1A), C - sample weakened by 6mm weakening bore (Figure 1B), D - sample weakened by 4mm weakening bore, locally reinforced with composite material
(Figure 1C), E - sample weakened by 6mm weakening bore, locally reinforced with composite material
(Figure 1D). A bore, playing a weakening role, when placed in the middle of the bent sample, initiates
destructive crack. Drilled hole to some extent simulates the presence of loose or decayed knot. Literature states, that influence of the hole caused by loose or rotten knot is similar to sound knot effect (KRZYSIK 1978). Later works describe knotholes as even more adverse, causing disturbances in stress distribution around notch area (BURAWSKA et al. 2011A).

Science for Sustainability University of West Hungary International Scientific Conference for PhD Students March 19-20, 2013 – Győr
46
Figure 1.Weakening methods: a) series B, b) series C, and strengthening methods: c) series D, d) series E
All samples were cut out of one single piece of wood, in aim to limit influence of the structure
on final results. Additionally, subsequent samples of each series were arranged as mirror ones. Wood used for pilot test had average density of 504kg/cm3 (Table 2) and 8±0,5% moisture content. Table 2. Density of pine samples Series Av. density Standard deviation Coeff. of variation kg/cm3 kg/cm3 % A 504 7.2 1.42 B 501 6.1 1.22 C 509 1.7 3.28 D 499 27.8 5.59 E 505 25.2 4.99 F 587 90.7 15.45 G 589 72.0 12.20
The main test was performed on full size, 50 by100 by 2200 mm beams. Test pieces were randomly divided into two groups: F – weakened by 18mm port (Figure 2A) and G – weakened as above, and reinforced with composite material of previously calculated length (Figure 2B).
Figure 2. Weakening method: a) series F; and strengthening method: b) series G
Average moisture content of the samples reached 8±0,5%, with an average density
of588kg/m3 (Table 2). As a reinforcing material, CFRP S&P Lamelle 150/2000 tape was used (Table 3). In aim to turn tape into reinforcement, it was glued to the underneath of the tested element in
the tensile area, with two-component epoxy glue. Length of reinforcement in pilot tests was equal to 1/3 of the active length, in the main research it was optimized (downsized) with numerical calculations. Strength model of wood loaded in the presence of structural defect, simulated by an
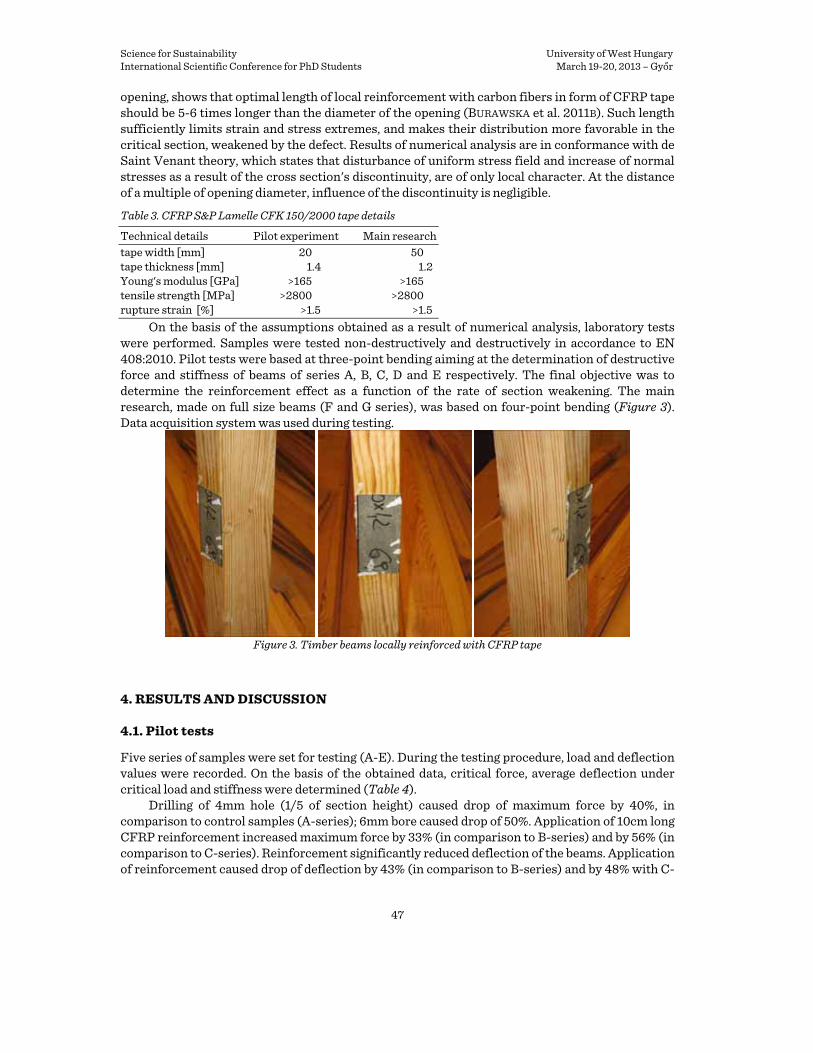
Science for Sustainability University of West Hungary International Scientific Conference for PhD Students March 19-20, 2013 – Győr
47
opening, shows that optimal length of local reinforcement with carbon fibers in form of CFRP tape should be 5-6 times longer than the diameter of the opening (BURAWSKA et al. 2011B). Such length sufficiently limits strain and stress extremes, and makes their distribution more favorable in the critical section, weakened by the defect. Results of numerical analysis are in conformance with de Saint Venant theory, which states that disturbance of uniform stress field and increase of normal stresses as a result of the cross section's discontinuity, are of only local character. At the distance of a multiple of opening diameter, influence of the discontinuity is negligible.
Table 3. CFRP S&P Lamelle CFK 150/2000 tape details
Technical details Pilot experiment Main research tape width [mm] 20 50 tape thickness [mm] 1.4 1.2 Young's modulus [GPa] >165 >165 tensile strength [MPa] >2800 >2800 rupture strain [%] >1.5 >1.5
On the basis of the assumptions obtained as a result of numerical analysis, laboratory tests were performed. Samples were tested non-destructively and destructively in accordance to EN 408:2010. Pilot tests were based at three-point bending aiming at the determination of destructive force and stiffness of beams of series A, B, C, D and E respectively. The final objective was to determine the reinforcement effect as a function of the rate of section weakening. The main research, made on full size beams (F and G series), was based on four-point bending (Figure 3). Data acquisition system was used during testing.
Figure 3. Timber beams locally reinforced with CFRP tape
4. RESULTS AND DISCUSSION
4.1. Pilot tests
Five series of samples were set for testing (A-E). During the testing procedure, load and deflection values were recorded. On the basis of the obtained data, critical force, average deflection under critical load and stiffness were determined (Table 4).
Drilling of 4mm hole (1/5 of section height) caused drop of maximum force by 40%, in comparison to control samples (A-series); 6mm bore caused drop of 50%. Application of 10cm long CFRP reinforcement increased maximum force by 33% (in comparison to B-series) and by 56% (in comparison to C-series). Reinforcement significantly reduced deflection of the beams. Application of reinforcement caused drop of deflection by 43% (in comparison to B-series) and by 48% with C-

Science for Sustainability University of West Hungary International Scientific Conference for PhD Students March 19-20, 2013 – Győr
48
series. Deflection values of D and E-series beams were in fact lower than of non-weakened A-series. Stiffness of reinforced samples increased in comparison to A, B and C-series. Highest gain of stiffness was noticed in D-series, which in comparison to non-reinforced sample attained 49%, and in comparison to A-series it showed 50% increase. Pilot testing confirmed that CFRP tape applied in tensile area of bent wooden elements increases load capacity and stiffness, and reduces deflection.
Table 4. Test results of sample series A to E Series A B C D E Maximum force [N] 2159.0 1295.7 1080.6 1717.7 1681.4 Standard deviation [N] 203.0 148.8 195.1 183.7 209.5 Deflection [mm] 7.6 6.8 6.0 3.9 3.1 Standard deviation [mm] 0.5 1.8 2.7 0.7 0.1 Stiffness [N/mm] 0.451 0.455 0.433 0.677 0.506 Standard deviation [N/mm] 0.059 0.040 0.055 0.064 0.035
4.2. Main research
In aim to determine stiffness characteristics before and after local reinforcement, wooden beams were strength tested twice. After initial testing, the same beams were reinforced and tested again, destructively. Additionally, during destructive tests load capacity, bending strength and deflection at 3000N was determined (Table 5).
Table 5. Stiffness of beams of F and G-series Parameter F-series G-series Gain/reduction [%] Stiffness [N/mm] 442.0 465.3 5.3 St. deviation [N/mm] 80.3 2.5 Coeff. of variation [%] 18.2 17.7 Deflection at 3000N [mm] 7.24 6.88 5.0 St. deviation [mm] 1.67 1.55 Coeff. of variation [%] 23.0 23.0 Destructive force [N] 5619.4 7933.2 41.2 St. deviation [N] 1636.4 1660.1 Coeff. of variation [%] 29.0 21.0 Bending strength [N/mm²] 38.2 53.8 40.6 St. deviation [N/mm2] 11.3 11.4 Coeff. of variation [%] 29.0 21.0
5. CONCLUSIONS
Local reinforcement with CFRP tape is purposeful for lumber in structural applications. Such tape reduces the influence of loose or decayed knots on the mechanical properties of wood, as well as limits the impact by inclusions and structure disturbances. Local reinforcement is equivalent to whole-length one. Its effectiveness is comparable to strengthening with CFRP tape of full length vertically arranged in grooves (NOWAK 2007), which induces obviously higher application costs and technical difficulties. the impact by inclusions and structure disturbances. References BURAWSKA, I. - TOMUSIAK, A. - TURSKI, M. - BEER, P. (2011): Local concentration of stresses as a result of the
notch in different positions to the bottom surface of bending solid timber beam based on numerical analysis in Solidworks Simulation environment. Annals of Warsaw University of Life Sciences-SGGW, Forestry and Wood Technology 73: 192-198
Science for Sustainability University of West Hungary International Scientific Conference for PhD Students March 19-20, 2013 – Győr
49
BURAWSKA, I. - TOMUSIAK, A. - BEER P. (2011): Influence of the length of CFRP tape reinforcement adhered to the bottom part of the bent element on the distribution of normal stresses and on the elastic curve. Annals of Warsaw University of Life Sciences-SGGW, Forestry and Wood Technology 73: 186-191
FAO (2009): Forest products 2005-2009. FAO, Rome, Italy. Online: www.fao.org/docrep/014/i1211m/i1211m00.pdf
KOLLMANN, F.F.P. - CÔTÉ, W.A (1968): Principles of Wood Science and Technology I. Springer-Verlag Berlin Heidelberg New York
KRZYSIK, F. (1978): Nauka o drewnie [Wood Science] (in polish). Warsaw, PWN NOWAK, T. (2007): Analiza pracy statycznej zginanych belek drewnianych wzmacnianych przy użyciu CFRP
[Analysis of static work of bending timber beams reinforced with CFRP] (in polish), Politechnika Wrocławska, PhD thesis, Wrocław
WYG INTERNATIONAL (2011): Analiza trendów rozwojowych w zakresie technologii i nowych myśli technologicznych w Polsce, Europie i świecie dla branży drzewno-meblarskiej. [Analysis of development trends of new technologies and technical thinking for furniture and woodworking industry in Poland, Europe and Worldwide.] (in polish) Projekt "Transfer Wiedzy w regionie poprzez rozwój sieci współpracy, realizowany w ramach Priorytetu VIII Regionalne kadry gospodarki, Działania 8.2 Transfer wiedzy, Poddziałania 8.8.8 Regionalne strategie innowacji Programu Operacyjnego Kapitał Ludzki współfinansowanego z Europejskiego Funduszu Społecznego [Community Support Framework, Operational Programme "Human Resources Development",
http://www.google.pl/url?sa=t&rct=j&q=&esrc=s&source=web&cd=10&cad=rja&ved=0CGcQFjAJ&url=http%3A%2F%2Fwww.wzp.pl%2Fdownload%2Findex%2Fbiblioteka%2F7560&ei=9XHcUPyyCOb24QS2uoCYBw&usg=AFQjCNFMvP2twU1u5VknIsm6-vg_k2TO3w&bvm=bv.1355534169,d.bGE
Characterization of Oven-dry Oak Wood (Quercus robur L.) Emissivity in LWIR Spectral Waveband
KLARIĆ, Miljenkoa* – PERVAN, Stjepana – ŠPANIĆ, Nikolaa – BIČANIĆ, Kristinaa a Wood Technology Department, Faculty of Forestry, University of Zagreb, Zagreb, Croatia
Abstract – This research paper reports on oven-dry oak wood (Quercus robur L.) emissivity value. Emissivity is very important property of material and it is used in infrared (IR) thermography. IR thermography is a non-destructive testing (NDT) method for measuring the temperature distribution of an observed object surface. It is applicable in a wide range of industrial and science applications. Currently in literature available emissivity values for wood differ from one another, and there is insufficient important complementary data. Often temperature, IR spectral waveband, wood specie, texture and other relevant wood information are not specified. Therefore the experiment for establishing oven-dry oak wood emissivity values within spectral range 7.5 – 13 μm (LWIR) was conducted, and the obtained results are presented in this research paper. Determined oak wood emissivity along with all important supporting data will facilitate the application of infrared thermography in wood related processes.
Keywords: oak wood / oven-dry / emissivity / LWIR / infrared thermography
1. INTRODUCTION
Infrared thermography (IRT) is a non-destructive testing (NDT) method for measuring the temperature distribution of an observed object surface. This is achieved through radiation
* Corresponding author: [email protected]; HR-10 002 Zagreb, Svetošimunska 25, p.p. 422

Science for Sustainability University of West Hungary International Scientific Conference for PhD Students March 19-20, 2013 – Győr
50
intensity detecting within infrared (IR) waveband of the electromagnetic spectrum (Figure 1). As well as all other NDT techniques, IRT has also its advantages and disadvantages. The advantages of IRT application is that it is non–destructive and non–contact measuring method which has fast inspection rate, with no harmful influences on the operator. Of course IRT method also may involve measurement performance in the presence of plants under voltage and highly heated equipment. In those cases it is the responsibility of the operator to ensure appropriate safety conditions during measurement. Also it is applicable in a wide range of industrial and science applications. On the other hand deficiency of IRT is in the large number of influences that can affect the accuracy of conducted measurements because IR thermography is an indirect method for surface temperature measurement. There is emissivity problem that is manifested through its dependency on wavelength, temperature, object surface (opacity, roughness, orientation), and angle of measurement. Another important factor of influence is atmosphere, because IR radiation while passing through it, is partially absorbed and scattered, therefore distance between object and IR camera is important parameter. The atmospheric absorption is mainly caused by carbon dioxide and water vapour, therefore the absorption in the atmosphere also varies with the air humidity (HAMRELIUS 1992). High equipment costs should be also mentioned, because that is great disadvantage.
Figure 1. Simplified scheme of general thermographic measurement principle
Atmospheric transmissivity for IR radiation is relatively good in certain parts of the IR
spectrum. ANDRASSY et al. (2008) stated that there are atmospheric windows where transmission is better for IR radiation between 3 – 5 μm and 8 – 14 μm. Consequently most of the IR cameras operate in these ranges.
Following previously mentioned, knowing sub-division of IR spectral band is crucial in IRT. Infrared spectral band is located in a part of electromagnetic spectrum between visible light and microwaves and encompasses wavelengths between 0.74 and 1000 μm. In general, there is no fundamental difference between radiations in the different bands (wavelength regions) of the electromagnetic spectrum, because all bands are governed by the same laws and only difference is in wavelength. The infrared band is commonly arbitrarily subdivided into smaller bands. ISO standard 20473:2007: Optics and photonics – Spectral bands, divides infrared band according to

Science for Sustainability University of West Hungary International Scientific Conference for PhD Students March 19-20, 2013 – Győr
51
wavelengths into: Near infrared (NIR) 0.78 – 3 μm, Mid infrared (MIR) 3 – 50 μm, and Far infrared (FIR) 50 – 1000 μm. Infrared band can also be divided according to the response of various detectors. Another commonly used sub–division scheme is shown in Table 1.
In wood industry and related science IR thermography among other things can be applied in production quality control, monitoring of manufacturing equipment and plants for hydrothermal wood processing, wood properties characterization, defects detection (particularly holes, rot and drying cracks), and heat flux in wood (PERVAN et al. 2012).
Table 1. Commonly used sub – division scheme of infrared spectral waveband
Sub – division name Abbreviation Wavelength [μm] Near IR NIR 0.75 – 1.4 Short – wavelength IR SWIR 1.4 – 3 Mid – wavelength IR MWIR 3 – 8 Long – wavelength IR LWIR 8 – 15 Far IR FIR 15 – 1000
In order to successfully apply IRT for determination of object surface temperature
distribution, known and correctly specified emissivity value is required, along with the application of correct measuring procedures. Nowadays, there is a deficiency of data regarding the emissivity of wood as a material. Currently available emissivity values in literature differ from one another, and there is insufficient important complementary data. Often temperature, infrared spectral band, wood specie, texture and other relevant wood information are not specified. Therefore the experiment for establishing oak wood emissivity values within spectral range 7.5 – 13 μm was conducted, and the obtained results are presented in this research paper. The oak wood was chosen because it is one of the most used hardwood species in Croatia.
2. MATERIAL AND METHODS
2.1. Apparatus
For the experiment an infrared camera with following characteristics was used. Imaging and optical data were as follows: field of view 25° x 25°, minimum focus distance 0.1 m, focal length 10 mm, instantaneous field of view (spatial resolution) 2.42 mrad, F-number 1.5, NETD 100 mK, image frequency 9 Hz. Detector type: FPA, uncooled microbolometer, with spectral range 7.5 – 13 μm (LWIR, ISO – MIR), IRR 180 x 180 pixels. Relative humidity and temperature were monitored with Testo 610 measuring device, while air circulation was monitored with Testo 425 anemometer.
2.2. Material
Oak wood (Quercus robur L.) elements were sawn and dried in conventional drying kiln to a 9 ± 2 % final moisture content. After kiln drying, elements were four sides planed and then sanded with 80 grit sandpaper. Final dimensions of oak wood specimens (Figure 2) were 250 mm (length) by 63 mm (width) by 24 mm (thickness). Polyvinyl chloride material with known emissivity in applied spectral range was procured, and its emissivity was verified.
2.3. Experiment procedure
Experiment was conducted in ambient conditions, ambient temperature was 22 °C, and relative air humidity was 56 %. Air circulation was inhibited. Background temperature was 22.6 °C. IR

Science for Sustainability University of West Hungary International Scientific Conference for PhD Students March 19-20, 2013 – Győr
52
camera lens was distanced 0.11 m from the surface of the observed specimens, at the angle of 15 ° in relation to the object surface normal. Before the measurement, oak wood elements were oven-dried to a 0 % of moisture content according to EN 13183-1:2002/AC:2003. On oven-dried elements surface modifying polyvinyl chloride material with known emissivity was applied. Then the specimens were heated at 50 °C until they attained temperature equilibrium. There were 30 specimens and by means of thermographic analysis, thermograms were obtained (Figure 3) and then the emissivity values were determined by an area box FLIR software tool. Thermograms of the opposite sides of specimens were obtained, and the results were compared.
Figure 2. Oak wood specimens
Figure 3. Example of oak wood thermogram
3. RESULTS AND CONCLUSIONS
Descriptive statistics were determined for obtained emissivity values, and the results are shown in Figure 4 and Table 2.
Two sample independent t-test was made for the obtained values and the results are as given (two-sample t(58) = -0.193250, p = 0.847438). Front and back side measurements were observed as two independent groups of samples, because of the specimens thickness, and the differences in natural structure and texture between two sides of specimens. As well the emissivity of the material is only a characteristic of the surface layer. The result shows that there is no significant difference between the emissivity values of the front side and the back side of the specimens.
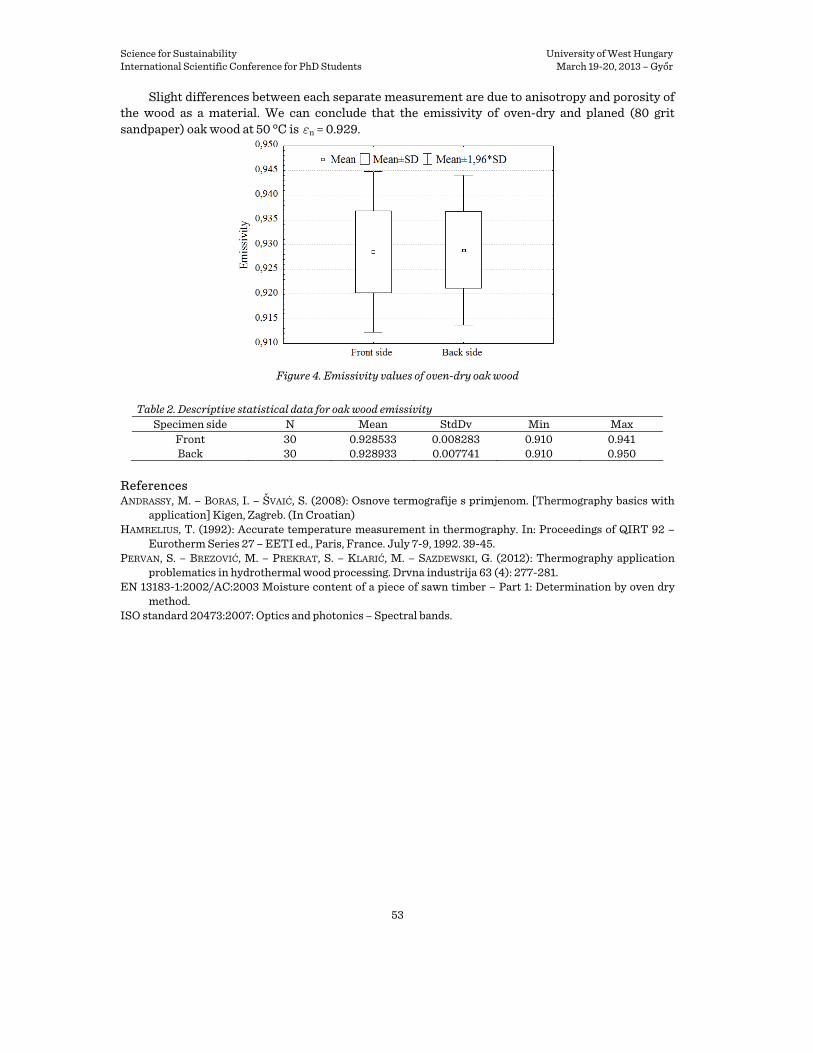
Science for Sustainability University of West Hungary International Scientific Conference for PhD Students March 19-20, 2013 – Győr
53
Slight differences between each separate measurement are due to anisotropy and porosity of the wood as a material. We can conclude that the emissivity of oven-dry and planed (80 grit sandpaper) oak wood at 50 °C is εn = 0.929.
Figure 4. Emissivity values of oven-dry oak wood
Table 2. Descriptive statistical data for oak wood emissivity
Specimen side N Mean StdDv Min Max Front 30 0.928533 0.008283 0.910 0.941 Back 30 0.928933 0.007741 0.910 0.950
References ANDRASSY, M. – BORAS, I. – ŠVAIĆ, S. (2008): Osnove termografije s primjenom. [Thermography basics with
application] Kigen, Zagreb. (In Croatian) HAMRELIUS, T. (1992): Accurate temperature measurement in thermography. In: Proceedings of QIRT 92 –
Eurotherm Series 27 – EETI ed., Paris, France. July 7-9, 1992. 39-45. PERVAN, S. – BREZOVIĆ, M. – PREKRAT, S. – KLARIĆ, M. – SAZDEWSKI, G. (2012): Thermography application
problematics in hydrothermal wood processing. Drvna industrija 63 (4): 277-281. EN 13183-1:2002/AC:2003 Moisture content of a piece of sawn timber – Part 1: Determination by oven dry
method. ISO standard 20473:2007: Optics and photonics – Spectral bands.
Science for Sustainability University of West Hungary International Scientific Conference for PhD Students March 19-20, 2013 – Győr
54
Detecting Red Heart in Beech (Fagus sylvatica L.)
GÖNCZ Balázs 1 – DIVÓS Ferenc 2 1 PhD student, Faculty of Wood Sciences, University of West Hungary, Sopron, Hungary∗
2 Professor, Faculty of Wood Sciences, University of West Hungary, Sopron, Hungary Abstract– The main object of this research is to detect red heart in beech without any distraction of trees. The electrical quality of red heart is different from normal wood material therefore the non-destructive detection of red heart is possible. A ‘simple system’ was created which is able to detect red heart by voltage measurements. This system consist four electrodes, a standard volt meter and an alternating current source. To check up the suitability of this ‘simple system’ and to complete it, an electric impedance tomogram was used. The ‘simple system’ and the impedance tomogram were tested in beech forests around Sopron. After the evaluation of data, it was proved that both tools are able to determine read hart reliably. In case of the ‘simple system’, higher voltage data determine smaller size of red heart and conversely, lower voltage dates determine bigger size of red heart. In case of impedance tomogram, various colours determine the size and place of red heart.
Keywords: red heart / electric measurement / ‘simple system’ / impedance tomography
1. INTRODUCTION
The most frequent defect of beech is red heart (MOLNÁR 2004). It usually occur aged trees but it also appears in young ones. Red heart causes several difficulties for the wood industry (KOCH et al. 2003) and it also reduces the market value of timber (GÖNCZ 2010). However, in some cases red heart can be also an advantage e.g. in furniture industry because of its different appearance.
The electrical quality of red heart material is lower (transmits electric current better) (BÍRÓ 2004) than the so called white wood therefore a ‘simple system’ was created which is able to detect red heart by voltage measurements.
2. EXPERIMENTAL METHODS
A ‘simple system’ was created which consists of four electrodes, a standard volt meter and an alternating current source. To test this system, fresh cut beech disks were used. One of these was a white disk and the other one had red heart inside. Firstly, 8 electrodes were placed at the circumference of the disks. Various electrode arrangements were tested to find the highest difference among the measured voltages. After the evaluation of data it was detected that the best placement of the electrodes (the highest difference between the measured voltages) is when two pairs are placed at one-one side of the disks. Therefore, later only 4 electrodes were used (Figure 1).
∗ Balázs Göncz, [email protected] H-9400 Sopron, Ady E. Street 5.

Science for Sustainability University of West Hungary International Scientific Conference for PhD Students March 19-20, 2013 – Győr
55
Figure 1. The applied measurement set-up
To verify the reliability of this ‘simple system’ an electric impedance tomogram was used.
This tool creates a map about the cross section of tree (Figure 2). It uses maximum 24 electrodes and makes 253 measurements in approx. 5 minutes.
The ‘simple system’ and the impedance tomogram were tested in beech forests around Sopron and their measured data were compared with the cross-section of cut timbers. The reliability and the borders of the tools were researched. The age of trees ware about 70 - 110 years but their diameters varied between 40 and 80 cm. Only those trees were tested which were judged for cutting. Therefore, soon after their measurements the results of experiments could be controlled.
Figure 2. Testing the impedance tomogram
3. RESULTS AND DISCUSSION
Many trees were tested in the forests around Sopron to control how small that red heart is which is still detectable Among the trees many types of red heart could be found in many cases also white wood. In some forest sections (S150B) forking form of beeches was very usual. This type of beech has always red heart inside.
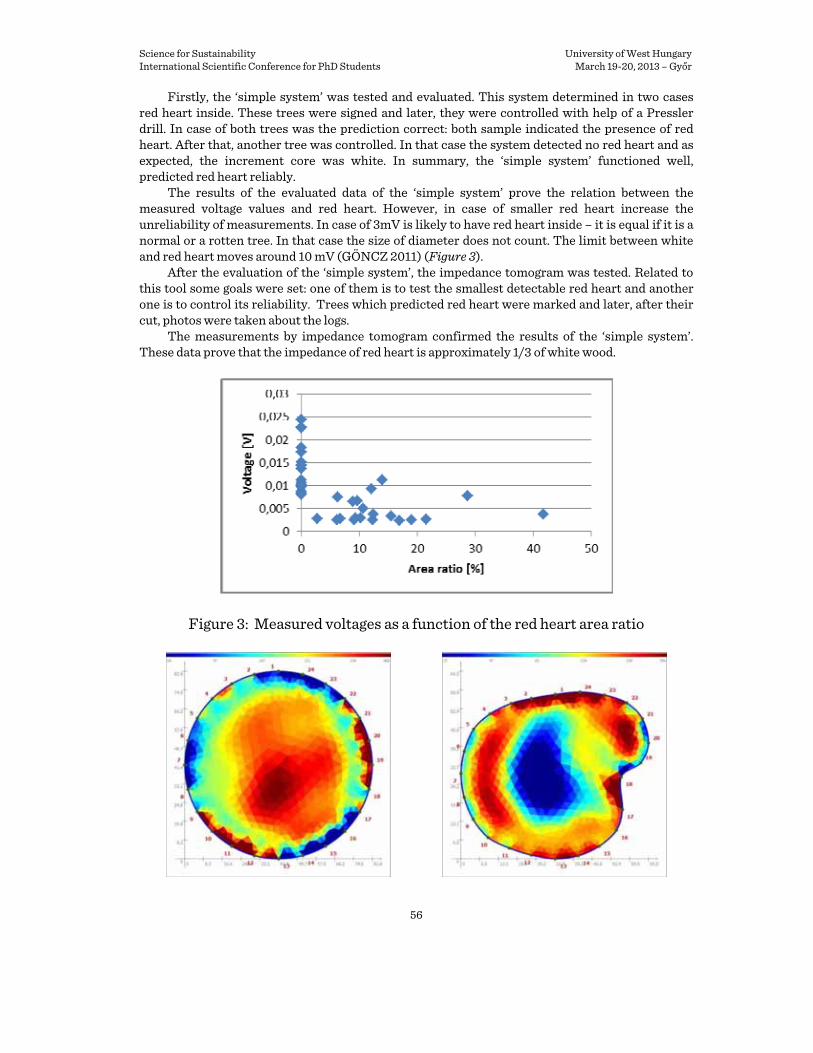
Science for Sustainability University of West Hungary International Scientific Conference for PhD Students March 19-20, 2013 – Győr
56
Firstly, the ‘simple system’ was tested and evaluated. This system determined in two cases red heart inside. These trees were signed and later, they were controlled with help of a Pressler drill. In case of both trees was the prediction correct: both sample indicated the presence of red heart. After that, another tree was controlled. In that case the system detected no red heart and as expected, the increment core was white. In summary, the ‘simple system’ functioned well, predicted red heart reliably.
The results of the evaluated data of the ‘simple system’ prove the relation between the measured voltage values and red heart. However, in case of smaller red heart increase the unreliability of measurements. In case of 3mV is likely to have red heart inside – it is equal if it is a normal or a rotten tree. In that case the size of diameter does not count. The limit between white and red heart moves around 10 mV (GÖNCZ 2011) (Figure 3).
After the evaluation of the ‘simple system’, the impedance tomogram was tested. Related to this tool some goals were set: one of them is to test the smallest detectable red heart and another one is to control its reliability. Trees which predicted red heart were marked and later, after their cut, photos were taken about the logs.
The measurements by impedance tomogram confirmed the results of the ‘simple system’. These data prove that the impedance of red heart is approximately 1/3 of white wood.
Figure 3: Measured voltages as a function of the red heart area ratio
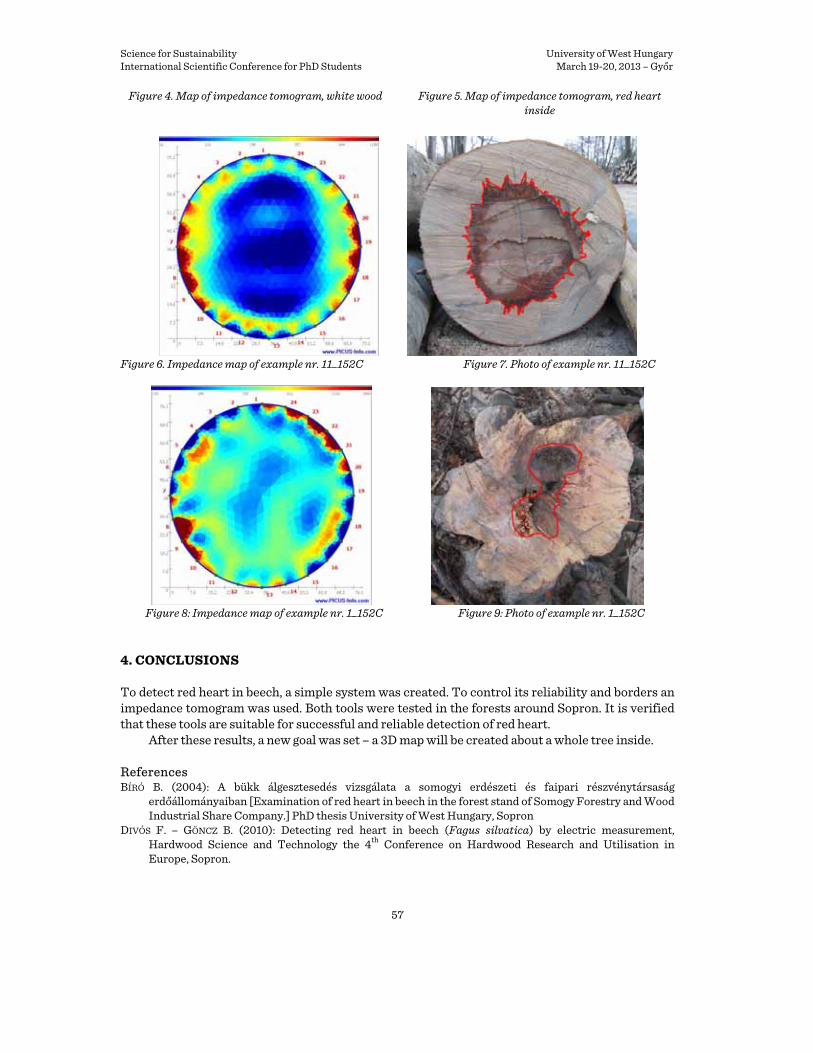
Science for Sustainability University of West Hungary International Scientific Conference for PhD Students March 19-20, 2013 – Győr
57
Figure 4. Map of impedance tomogram, white wood Figure 5. Map of impedance tomogram, red heart inside
Figure 6. Impedance map of example nr. 11_152C Figure 7. Photo of example nr. 11_152C
Figure 8: Impedance map of example nr. 1_152C Figure 9: Photo of example nr. 1_152C
4. CONCLUSIONS
To detect red heart in beech, a simple system was created. To control its reliability and borders an impedance tomogram was used. Both tools were tested in the forests around Sopron. It is verified that these tools are suitable for successful and reliable detection of red heart.
After these results, a new goal was set – a 3D map will be created about a whole tree inside. References BÍRÓ B. (2004): A bükk álgesztesedés vizsgálata a somogyi erdészeti és faipari részvénytársaság
erdőállományaiban [Examination of red heart in beech in the forest stand of Somogy Forestry and Wood Industrial Share Company.] PhD thesis University of West Hungary, Sopron
DIVÓS F. – GÖNCZ B. (2010): Detecting red heart in beech (Fagus silvatica) by electric measurement, Hardwood Science and Technology the 4th Conference on Hardwood Research and Utilisation in Europe, Sopron.

Science for Sustainability University of West Hungary International Scientific Conference for PhD Students March 19-20, 2013 – Győr
58
GÖNCZ B. (2010): Bükk álgeszt kimutatása impedancia mérés segítségével [Detecting red heart with impedance measurement.] Thesis, University of West Hungary, Sopron
GÖNCZ B. (2011): Detecting red heart in beech (Fagus sylvatica) by electric measurement, 17th International Non-destructive Testing and Evaluation of Wood Symposium, Sopron. pp.121-126
KOCH G. – PULS J. – BAUCH J. (2003): Topochemical Characterisation of Phenolic Extractives in Discoloured Beechwood (Fagus sylvatica L.), Holzforschung, 57 (2003) 339–345
MOLNÁR S. (2004.): Faanyagismeret [Timber knowledge.] Mezőgazdasági Szaktudás Kiadó Budapest, pp. 363-364.
MOLNÁR S. (2006): Fahibák, fakárosítások, [Wood defects, wood damages.] Hillebrand Nyomda Kft. Sopron, pp. 44-45., 6-7., 82-85.
MOLNÁR S. et al. (2000.): Faipari kézikönyv I. [Handbook of the wood industry I.] Faipari Tudományos Alapítvány, Sopron, p. 96.
MOLNÁR S. – BARISKA M. (2002.): Magyarország ipari fái [Industrial wood of Hungary.] Szaktudás Kiadó Ház Budapest, pp. 70-77.

Science for Sustainability University of West Hungary International Scientific Conference for PhD Students March 19-20, 2013 – Győr
59
Section 1.2 Processing and Utilization of Wood
Availability and Processing of Wood in the Future
HAPLA, František
University of Göttingen, Germany Abstract - Almost a third of Germany’s land area, i.e. 11.1 million hectares, is covered with forests. The wood stock is larger than that of the traditional forest countries, Sweden and Finland. The main use of Germany’s forests concerns just a few tree species. At present, several softwood and broad-leaved tree species play a minor role in forestry. Spruce accounts for the largest share among the tree species (28%), followed by pine (24%), beech (15%) and oak trees (10 %). Since 2010 the energetic use of raw wood and wood-based products is higher than the material use in Germany. Wood’s share - including industrial wood residues and waste wood – in respect of energy generation as well as private households’ wood consumption for energy purposes alone increases steadily. The heterogeneous situation of the raw wood supply and demand in the European Union is presented against the background of raw wood shortage in the future.
At present, several factors promote a development which can lead to a medium-term supply shortfall on the German timber market regarding the coniferous raw wood. The main reasons are a strong prospective advancement of deciduous tree species and an implementation of forest policy abandoning programs. Several possible approaches for securing raw wood supply are discussed: Tree species with a promising future should be strongly promoted from a sustainable forest management as well as from innovative wood utilisation point of view. Mobilisation of unused timber stock in small private forest area and short rotation plantations on farmland are additional possible approaches. Further renewable resources are available in the landscape area.
Renewable resources from agriculture and forestry can basically be used as raw materials, as energy or both. The quantities and qualities of the raw materials, the market situation and the political conditions impact the subsequent production processes strongly. All three aspects need to be considered when defining resource efficiency. Raw materials’ quality and quantity can be influenced by processing and, in the long term, by research and development, but they are also always liable to natural processes like annually changing weather conditions, or unpredictable catastrophes, also caused by climate change. Combined production as well as the reuse and recycling of by-products on an industrial scale is well established in respect of forestry resources. Likewise, product and resource substitution and their effects concerning the supply and demand sides play an important role. However, the increasing substitution of fossil-based energy production with bio-energy concepts leads to a competition for renewable products on the market. Utilisation conflicts thus occur between energy use, material use and food production. Open research questions concern the cascading use of bio-materials, since at present often only certain parts of a plant can be used in one or another application.
Science for Sustainability University of West Hungary International Scientific Conference for PhD Students March 19-20, 2013 – Győr
60
Sustainable Wood Parquet Finishing by Means of Oils and Waxes
ROZANSKA, Annaa∗ – BEER, Piotra
Department of Technology, Organization and Management in Wood Industry, Faculty of Wood Technology, Warsaw University of Life Sciences – SGGW
Abstract – In antique buildings, until the 1st half of the 20th century, old, historical techniques of surface finishing were used: varnishing (repeated soaking with hot varnish until full saturation of wood surface) and waxing. These are traditional techniques that make use of natural substances and ecological technologies. Applied when hot, the substances penetrate deeply into the wood’s structure, without creating a layer on its surface that could be, potentially, quickly damaged, losing its decorative value. In case of lacquer when damaged, repair is problematic, it is not enough to simply „refresh” the parquet by applying the substance again, but there is also a need of sanding, not the case of wax and varnish. Moreover, wax and varnish leave the effect of natural wood structure, with a beautifully highlighted pattern. Studies of the resistance properties related with the application of traditional finishing materials show that it is possible to use them nowadays, as their properties are similar to the contemporary methods.
Keywords: antique wooden parquet / traditional surface finishing techniques / wood durability / resistance to abrasion / resistance to scratches / colour and gloss changes
1. INTRODUCTION
1.1. Aim of study
In antique buildings, until the 1st half of the 20th century, old, historical techniques of surface finishing were used. Varnishing (with the use of linseed oil) is the oldest known method of surface finishing with substances that reduce the sorption of wood and protect the parquet against dirt penetration and the forming of stains. It consists of repeated soaking with hot varnish until full saturation of wood surface. Waxing was also used as the finishing method of antique parquets, and it was popular in furniture making since the baroque era. As to wax application, it was melted and shaped into bars, then those bars were pressed against the surface - leaving streaks, which were then rubbed into the wood by polishing with a piece of felt. During that process, as a result of rubbing, the temperature would rise, making it easier for wax to penetrate into the wood. Only after World War II, pastes for the maintenance of wooden parquets appeared, which could be used without raising the temperature. They contained wax and paraffin, dissolved in volatile organic solvents such as turpentine, gasoline or BTEX. Lately, synthetic oils that are petroleum derivatives are becoming more and more popular in the conservation of wooden parquets.
Saturating the wood with oils and wax are traditional techniques that make use of natural substances and ecological technologies. Applied when hot, the substances penetrate deeply into the wood’s structure, without creating a layer on its surface that could be, potentially, quickly damaged, losing its decorative value. In such cases, as in the case of lacquer, damage repair is problematic, because it is not enough to simply “refresh” the parquet by applying the substance
∗ e-mail: [email protected], 166 Nowoursynowska street, 02-787 Warszaw, Poland
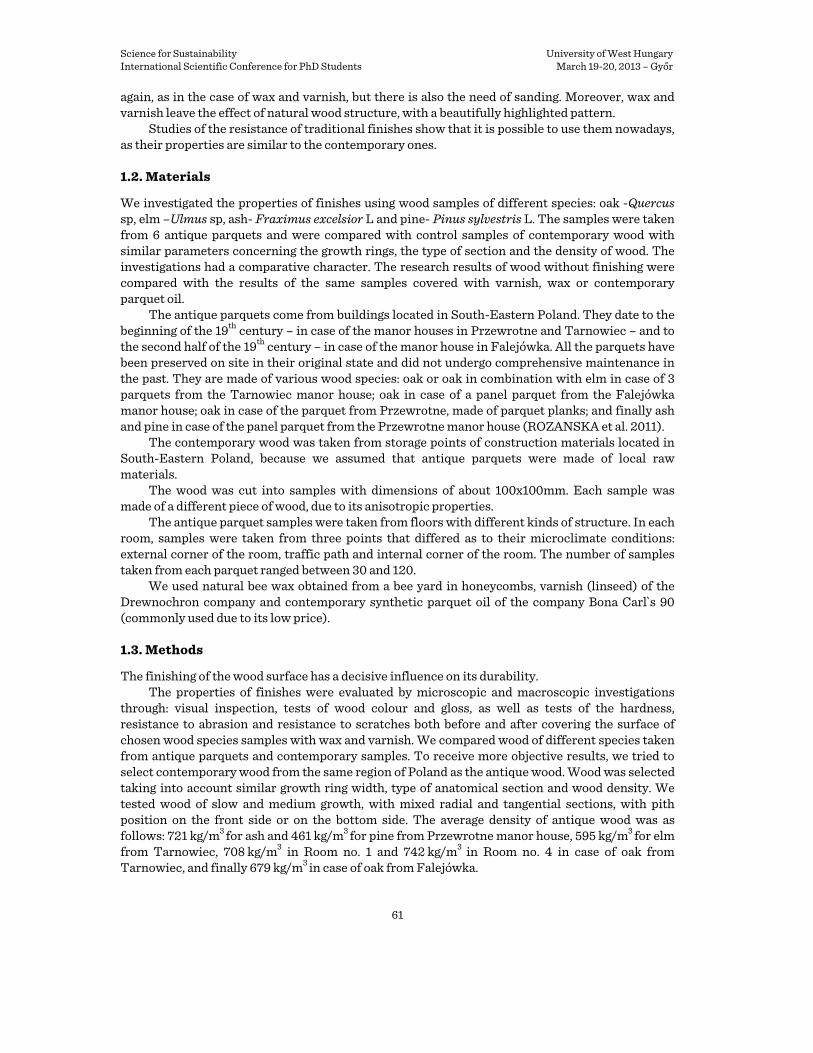
Science for Sustainability University of West Hungary International Scientific Conference for PhD Students March 19-20, 2013 – Győr
61
again, as in the case of wax and varnish, but there is also the need of sanding. Moreover, wax and varnish leave the effect of natural wood structure, with a beautifully highlighted pattern.
Studies of the resistance of traditional finishes show that it is possible to use them nowadays, as their properties are similar to the contemporary ones.
1.2. Materials
We investigated the properties of finishes using wood samples of different species: oak -Quercus sp, elm –Ulmus sp, ash- Fraximus excelsior L and pine- Pinus sylvestris L. The samples were taken from 6 antique parquets and were compared with control samples of contemporary wood with similar parameters concerning the growth rings, the type of section and the density of wood. The investigations had a comparative character. The research results of wood without finishing were compared with the results of the same samples covered with varnish, wax or contemporary parquet oil.
The antique parquets come from buildings located in South-Eastern Poland. They date to the beginning of the 19th century – in case of the manor houses in Przewrotne and Tarnowiec – and to the second half of the 19th century – in case of the manor house in Falejówka. All the parquets have been preserved on site in their original state and did not undergo comprehensive maintenance in the past. They are made of various wood species: oak or oak in combination with elm in case of 3 parquets from the Tarnowiec manor house; oak in case of a panel parquet from the Falejówka manor house; oak in case of the parquet from Przewrotne, made of parquet planks; and finally ash and pine in case of the panel parquet from the Przewrotne manor house (ROZANSKA et al. 2011).
The contemporary wood was taken from storage points of construction materials located in South-Eastern Poland, because we assumed that antique parquets were made of local raw materials.
The wood was cut into samples with dimensions of about 100x100mm. Each sample was made of a different piece of wood, due to its anisotropic properties.
The antique parquet samples were taken from floors with different kinds of structure. In each room, samples were taken from three points that differed as to their microclimate conditions: external corner of the room, traffic path and internal corner of the room. The number of samples taken from each parquet ranged between 30 and 120.
We used natural bee wax obtained from a bee yard in honeycombs, varnish (linseed) of the Drewnochron company and contemporary synthetic parquet oil of the company Bona Carl`s 90 (commonly used due to its low price).
1.3. Methods
The finishing of the wood surface has a decisive influence on its durability. The properties of finishes were evaluated by microscopic and macroscopic investigations
through: visual inspection, tests of wood colour and gloss, as well as tests of the hardness, resistance to abrasion and resistance to scratches both before and after covering the surface of chosen wood species samples with wax and varnish. We compared wood of different species taken from antique parquets and contemporary samples. To receive more objective results, we tried to select contemporary wood from the same region of Poland as the antique wood. Wood was selected taking into account similar growth ring width, type of anatomical section and wood density. We tested wood of slow and medium growth, with mixed radial and tangential sections, with pith position on the front side or on the bottom side. The average density of antique wood was as follows: 721 kg/m3 for ash and 461 kg/m3 for pine from Przewrotne manor house, 595 kg/m3 for elm from Tarnowiec, 708 kg/m3 in Room no. 1 and 742 kg/m3 in Room no. 4 in case of oak from Tarnowiec, and finally 679 kg/m3 in case of oak from Falejówka.

Science for Sustainability University of West Hungary International Scientific Conference for PhD Students March 19-20, 2013 – Győr
62
Brinell hardness tests were conducted according to PN-EN ISO 5470-1:2001 standard. The tests were done on the front side of the samples, 8 tests on each sample. Abrasion resistance tests were conducted with the use of a Taber device in accordance to the PN-EN ISO 5470-1:2001 standard, consisting in the calculation of the sample’s mass loss after 100 and 1000 revolutions. The number of revolutions depended on the scope of investigations. In case of tests of different antique and contemporary wood species, the results of mass loss were much more accurate after 1000 revolutions, than in case of 100 revolutions. However, the influence of the finishes on the abrasion resistance became less clear, as the finishes penetrated into the wood up to about 2 mm. Resistance to scratches tests were conducted with the use of a Taber device on the basis of the PN-EN 438-2:2005 standard. In order to increase their precision, the results were assumed as the depth of scratches determined by means of 3D scanning for forces of 1-5N or as the average width of scratch done by applying the force of 1N, 2N, 3N, 4N, 5N.
In case of hardness, resistance to abrasion and resistance to scratches, we gave average test results for samples without surface finishes, and we observed the changes in hardness after specific oak and elm samples were covered with wax and varnish.
The change in gloss and colour was determined in accordance with the PN-EN ISO 7724-1:2003, PN-EN ISO 7724-2:2003, PN-EN ISO 4892-1:2001 and PN-EN ISO 4892-2:2006 standards. Photometric parameters were measured with a X-Rite SP60 spectrometer. We did 4 tests per sample, on the front side, both without finish and after applying the coatings of each sample. The total colour difference ΔE*ab was calculated on the basis of the PN-ISO 7724-3:2003 standard. Gloss was measured in accordance to the PN-EN ISO 2813 standard, with the help of a portable glossmeter Picogloss Model 503 of the Erichsen company, 4 times on the front side of each sample: along and across the fibres, before and after the coatings were applied.
Before applying the coatings, the surface of samples was prepared by polishing with sand paper with grit of ca. 50- 100- 150. This task was performed manually, to avoid the changes to the properties of wood surface that occur as a result of high temperature that is created during mechanical processing. This technique corresponded to the traditional manners of antique parquet surface finishing through smoothing with a hand scraper along fibres. In order to perform this task, the parquet was locally wetted with hot water. After smoothing, the parquet was sanded with steel shavings.
Varnish was applied hot, with the help of a brush, until the surface was entirely saturated. Due to the sample dimensions, one application was enough.
Wax was applied by pressing wax bars (made of melted bee wax) against the surface and then it was rubbed into it by polishing with a piece of felt.
Contemporary oil was applied with the help of a hard applicator made of gum. Oil was applied until the surface got saturated. The process was repeated 2 times, and afterwards the surface was polished first with a red pad and then a soft cloth. After two days, that is after the oil had dried completely, we applied another layer of wax-oil of the company Fiddes Hard Wax Oil.
The tests were carried out one month after the application of finishes. Before the tests, samples were acclimatised in normal climate conditions (± 20°C, ± 60% of relative air humidity). The wood moisture equivalent differed depending on the wood species and its state of preservation and amounted to 9.4% on average. The lowest humidity was observed in case of the antique wood from Przewrotne Manor House (8.3%), the highest – in case of antique wood from Room no. 4 in Tarnowiec (10.2%).
2. RESULTS
The following observations were made. The wood soaked with hot varnish changed colour – it darkened and the pattern got intensely saturated (Figure 1 and 2). Moreover, stains and

Science for Sustainability University of West Hungary International Scientific Conference for PhD Students March 19-20, 2013 – Győr
63
discolourations became more visible, which is a disadvantage of using this kind of finishing for antique wood surface, but does not cause problems when applied as a finishing method on contemporary parquets. Similarly, the finishing oil that is available nowadays also caused the wood colour to darken and made its pattern intensely saturated, just as in the case of varnish. For antique wood, wax is especially recommended, because when rubbed into the wood, it refills the mechanical damages of its surface: gaps, indentations and cracks. Another additional advantage consists in the fact that it does not cause a significant colour change of the wood, it only makes it intense. It does not increase the visibility of stains and wood discolourations. Both cracks and indentations (the most frequent damages of wooden surfaces) become less visible and do not accelerate wood degradation. In spite of their presence, the surface of wood is adequately protected against humidity and dirt.
0
2
4
6
8
10
12
14
16
18
20
oak Tarnow iecroom 4 -point 1
oak Tarnow iecroom 4 -point 2
oakTarnow iecroom 4 -point 3
elm Tarnow iecroom 5 -point 1
elm Tarnow iecroom 5 -point 2
elm Tarnow iecroom 5 -point3
∆E
* ab
Figure 1. Changes in colour and gloss of samples covered with contemporary parquet oil and samples
covered with varnish and wax (samples covered with contemporary oil , with varnish , with wax )
Figure 2. Visualization and table of changes in colour and gloss of samples without finishing and
samples covered with varnish and wax (samples without finishing , samples covered with varnish , samples covered with wax , gloss )
Brinell hardness tests performed on antique parquets and on the wood of contemporary
parquet materials – in accordance to what we expected – showed that the hardness of antique pine and ash from the parquet in Przewrotne is much smaller than the hardness of corresponding samples of contemporary wood (Figure 3). It is undoubtedly related to the fact of microbiological destruction of antique wood. This phenomenon is less obvious in case of oak wood, which is more resistant to microbiological factors. The hardness of antique oak wood was comparable or even higher (with the reservation that the test results were very dispersed) with the hardness of
Sample number ΔL* Δa* Δb* Δ gloss T4-1-4 -17.7 4.4 -7.2 1.2 T5-3-6 -13.6 3 -0.8 0
T4-1-37 -6.6 1.7 0.5 6 T5-3-17 -3.6 1.8 2.6 6.7
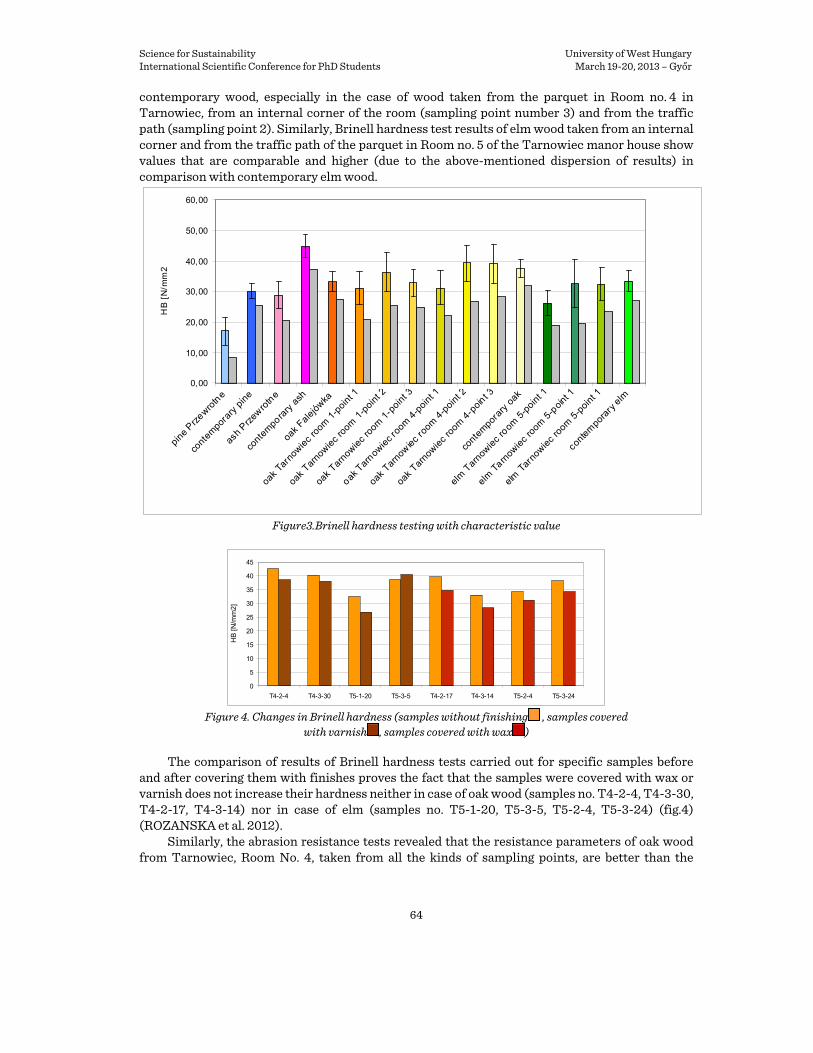
Science for Sustainability University of West Hungary International Scientific Conference for PhD Students March 19-20, 2013 – Győr
64
contemporary wood, especially in the case of wood taken from the parquet in Room no. 4 in Tarnowiec, from an internal corner of the room (sampling point number 3) and from the traffic path (sampling point 2). Similarly, Brinell hardness test results of elm wood taken from an internal corner and from the traffic path of the parquet in Room no. 5 of the Tarnowiec manor house show values that are comparable and higher (due to the above-mentioned dispersion of results) in comparison with contemporary elm wood.
0,00
10,00
20,00
30,00
40,00
50,00
60,00
pine
Prz
ewrotn
e
cont
empo
rary
pin
e
ash
Przew
rotn
e
cont
empo
rary
ash
oak
Falej
ówka
oak
Tarn
owie
c ro
om 1
-poi
nt 1
oak
Tarno
wiec
room
1-p
oint
2
oak
Tarno
wiec
room
1-p
oint
3
oak T
arnow
iec r
oom
4-p
oint
1
oak
Tarno
wiec
room
4-p
oint
2
oak
Tarno
wiec
room
4-p
oint 3
cont
empo
rary
oak
elm
Tar
nowie
c ro
om 5
-poi
nt 1
elm
Tarn
owie
c ro
om 5
-poin
t 1
elm T
arno
wiec
room
5-p
oint
1
cont
empo
rary
elm
HB
[N
/mm
2
Figure3.Brinell hardness testing with characteristic value
0
5
10
15
20
25
30
35
40
45
T4-2-4 T4-3-30 T5-1-20 T5-3-5 T4-2-17 T4-3-14 T5-2-4 T5-3-24
HB
[N/m
m2
]
Figure 4. Changes in Brinell hardness (samples without finishing , samples covered
with varnish , samples covered with wax )
The comparison of results of Brinell hardness tests carried out for specific samples before and after covering them with finishes proves the fact that the samples were covered with wax or varnish does not increase their hardness neither in case of oak wood (samples no. T4-2-4, T4-3-30, T4-2-17, T4-3-14) nor in case of elm (samples no. T5-1-20, T5-3-5, T5-2-4, T5-3-24) (fig.4) (ROZANSKA et al. 2012).
Similarly, the abrasion resistance tests revealed that the resistance parameters of oak wood from Tarnowiec, Room No. 4, taken from all the kinds of sampling points, are better than the

Science for Sustainability University of West Hungary International Scientific Conference for PhD Students March 19-20, 2013 – Győr
65
results of contemporary oak (Figure 5). This correlation repeats in case of elm wood from Room no. 5 of the Tarnowiec manor house and pine wood from Przewrotne.
0,000
0,200
0,400
0,600
0,800
1,000
1,200
1,400
pine
Przew
rotn
e
cont
empo
rary
pine
ash
Przew
rotn
e
cont
empo
rary
ash
oak F
alejów
ka
oak T
arno
wiec ro
om 1
-poin
t 1
oak T
arno
wiec ro
om 1
-poin
t 2
oak T
arno
wiec ro
om 1
-poin
t 3
oak T
arno
wiec ro
om 4
-poin
t 1
oak T
arno
wiec ro
om 4
-poin
t 2
oak T
arno
wiec ro
om 4
-poin
t 3
cont
empo
rary
oak
elm T
arno
wiec ro
om 5
-poin
t 1
elm T
arno
wiec ro
om 5
-poin
t 1
elm T
arno
wiec ro
om 5
-poin
t 1
cont
empo
rary
elm
Loss
of
mas
s af
ter
1000
rev
olut
ions
[g]
Figure 5. Abrasion resistance testing (mass loss after 1000 revolutions)
Figure 6. Changes in abrasion resistance after 100 revolutions of samples without
finishing and samples covered with varnish and wax (samples without finishing , samples covered with varnish , samples covered with wax )
Considering that wax and varnish are not film-forming, but penetrate into the wood, the
abrasion resistance tests depend greatly on the wood itself. Therefore, the changes in abrasion resistance were analysed for each sample separately. This eliminates the impact of wood density and humidity on test results. Surface finishing with wax and varnish clearly increases the resistance to abrasion of the samples (Figure 6). Test results show that varnish increases the resistance to abrasion more than wax does, both in case of oak samples: no. T4-1-12, T4-12-4, T4-1-2, T4-2-6, and of elm samples: no. T5-1-14, T5-2-24, T5-1-9, T5-2-38.
The resistance to scratches of antique wood is always worse than of contemporary wood, both in case of oak (samples: no. T4-3-30, T4-3-14) and elm (samples: no. T5-1-18, T5-3-16) (Figure 7).
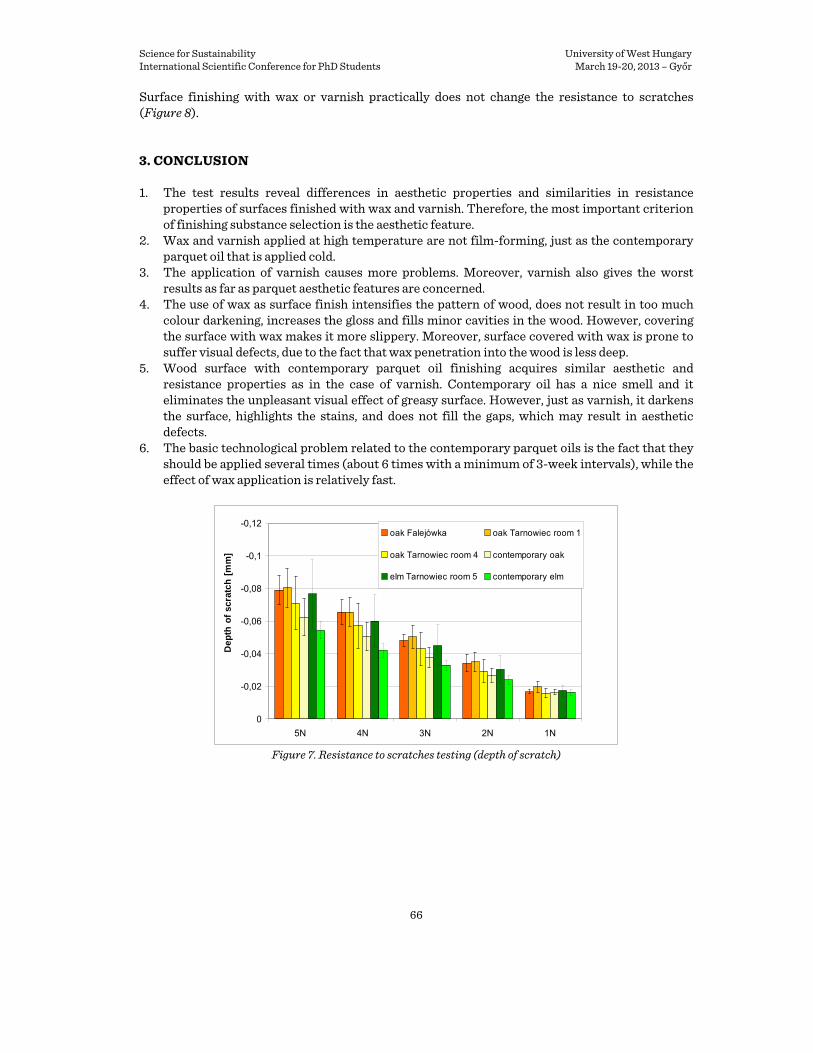
Science for Sustainability University of West Hungary International Scientific Conference for PhD Students March 19-20, 2013 – Győr
66
Surface finishing with wax or varnish practically does not change the resistance to scratches (Figure 8).
3. CONCLUSION
1. The test results reveal differences in aesthetic properties and similarities in resistance properties of surfaces finished with wax and varnish. Therefore, the most important criterion of finishing substance selection is the aesthetic feature.
2. Wax and varnish applied at high temperature are not film-forming, just as the contemporary parquet oil that is applied cold.
3. The application of varnish causes more problems. Moreover, varnish also gives the worst results as far as parquet aesthetic features are concerned.
4. The use of wax as surface finish intensifies the pattern of wood, does not result in too much colour darkening, increases the gloss and fills minor cavities in the wood. However, covering the surface with wax makes it more slippery. Moreover, surface covered with wax is prone to suffer visual defects, due to the fact that wax penetration into the wood is less deep.
5. Wood surface with contemporary parquet oil finishing acquires similar aesthetic and resistance properties as in the case of varnish. Contemporary oil has a nice smell and it eliminates the unpleasant visual effect of greasy surface. However, just as varnish, it darkens the surface, highlights the stains, and does not fill the gaps, which may result in aesthetic defects.
6. The basic technological problem related to the contemporary parquet oils is the fact that they should be applied several times (about 6 times with a minimum of 3-week intervals), while the effect of wax application is relatively fast.
-0,12
-0,1
-0,08
-0,06
-0,04
-0,02
0
5N 4N 3N 2N 1N
Dep
th o
f sc
ratc
h [
mm
]
oak Falejówka oak Tarnowiec room 1
oak Tarnowiec room 4 contemporary oak
elm Tarnowiec room 5 contemporary elm
Figure 7. Resistance to scratches testing (depth of scratch)
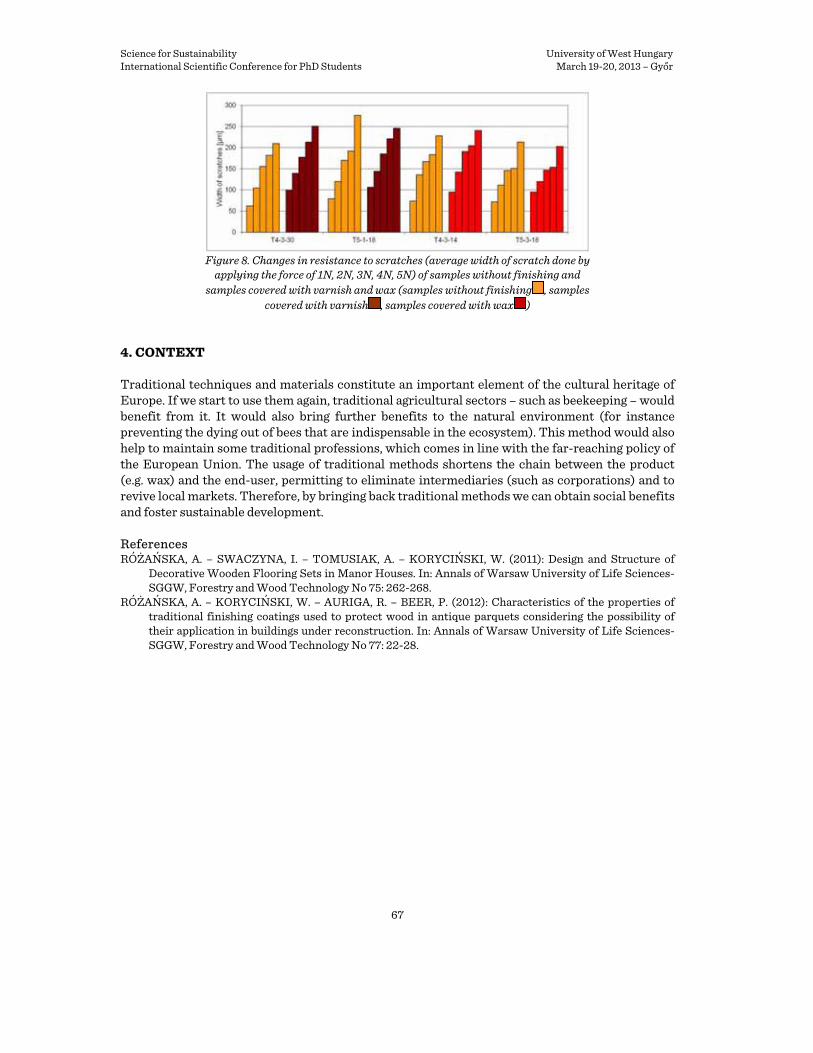
Science for Sustainability University of West Hungary International Scientific Conference for PhD Students March 19-20, 2013 – Győr
67
Figure 8. Changes in resistance to scratches (average width of scratch done by
applying the force of 1N, 2N, 3N, 4N, 5N) of samples without finishing and samples covered with varnish and wax (samples without finishing , samples
covered with varnish , samples covered with wax )
4. CONTEXT
Traditional techniques and materials constitute an important element of the cultural heritage of Europe. If we start to use them again, traditional agricultural sectors – such as beekeeping – would benefit from it. It would also bring further benefits to the natural environment (for instance preventing the dying out of bees that are indispensable in the ecosystem). This method would also help to maintain some traditional professions, which comes in line with the far-reaching policy of the European Union. The usage of traditional methods shortens the chain between the product (e.g. wax) and the end-user, permitting to eliminate intermediaries (such as corporations) and to revive local markets. Therefore, by bringing back traditional methods we can obtain social benefits and foster sustainable development. References RÓŻAŃSKA, A. – SWACZYNA, I. – TOMUSIAK, A. – KORYCIŃSKI, W. (2011): Design and Structure of
Decorative Wooden Flooring Sets in Manor Houses. In: Annals of Warsaw University of Life Sciences-SGGW, Forestry and Wood Technology No 75: 262-268.
RÓŻAŃSKA, A. – KORYCIŃSKI, W. – AURIGA, R. – BEER, P. (2012): Characteristics of the properties of traditional finishing coatings used to protect wood in antique parquets considering the possibility of their application in buildings under reconstruction. In: Annals of Warsaw University of Life Sciences-SGGW, Forestry and Wood Technology No 77: 22-28.
Science for Sustainability University of West Hungary International Scientific Conference for PhD Students March 19-20, 2013 – Győr
68
Developing Building Materials from Cement-bonded Reed and Straw Composites
SCHLOSSER Mátyás a3- ALPÁR Tibor L. b
a1Mátyás SCHLOSSER, PhD student, University of West Hungary, Faculty of Wood Sciences, Institute of Wood and Paper Composites, Sopron, Hungary
bTibor L. ALPÁR, associate professor, University of West Hungary, Faculty of Wood Sciences, Institute of Wood and Paper Composites, Sopron, Hungary
Abstract – The aim of this research was to examine the cement compatibility of agricultural wastes (reed and wheat straw) to produce cost effective, bio-based products for the building industry. An additional goal is to help decreasing the load on the environment by decreasing the impact of industrial waste. Currently, there are two major companies in Hungary that produce two different kinds of wood-based cement-bonded building materials: cement bonded wood wool board made of poplar (Populus euramericana cv. “I214”) and cement bonded particleboards made of Scots pine (Pinus sylvestris). Based on our survey there are 50 thousand tons of harvestable reed material available each year on Lake Fertő alone. The harvestable reed is currently not utilized completely, only about 10-20% of it is used for traditional reed products as roofing or flooring. Beside this, there is a significant amount of wheat straw in agriculture, which is only marginally utilized for industrial purposes. Also the paper industry generates a waste material called pulp sludge, which is currently dumped, even though it still contains short fibers that may be utilized in other processes. This research consists of two parts. First the selected raw materials were tested for compatibility with cement hydration. Because lignocellulosic materials contain inhibitors like sugars, tannin, wax, which inhibit curing of cement, it is important to test the amount of these materials in the sampled raw materials. In the second stage of the research, cement bonded products insulation boards and high density panels were produced in laboratory condition. Four cement compatibility tests, including tannin content, sugar content, wax content, and hydration temperature measurement on small cement-lignocelleulose mixture samples were conducted. During this research, the total sugar and tannin content of all three raw materials were determined by analytical methods, based on hot water extraction. MOR, MOE and thermal conductivity, where relevant, were tested on experimental boards. The results can be summarized as follows: Reed has a high concentration of inhibitors, 0.50% sugar, 0.60% tannin and 4.11% of wax. Strength and swelling tests were performed on high density reed panels, 3 months after production. The average MOR, IB strength and thickness swelling of the panels was 3.96 N/mm2, 0.1932 N/mm2 and 1,982%, respectively. The average thermal conductivity values, measured on insulating reed boards was 0.09545 W/mK.
Keywords: cement bonded products / reed / straw / insulation board
1. INTRODUCTION
This study was carried out to explore the possibility of creating cement-bonded composite building products using reed (Phragmites australis) and straw (Triticum aestivum).
Cement bonded products may come in the form of panels or moulded products. Their matrix may be portland or magnesia cement, and their reinforcing material may be wood wool, cellulose fibre, wood particles, wood chips, wood fibre or annual plant parts.
3 Corresponding author: e-mail: [email protected], H-9400 Sopron, Bajcsy-Zs. u. 4.
Science for Sustainability University of West Hungary International Scientific Conference for PhD Students March 19-20, 2013 – Győr
69
Wood–cement composites have been used in the fabrication of construction materials from 1908. They have the potential to provide a wide range of products for building applications by using different forms of wood-based materials. The development and application of wood–cement composites attest to their attraction as building materials (OKINO et al., 2004).
By 4000 B.C., Egyptians used sun dried bricks made out of clay and straw in building entire villages. Even today, clay, combined with straw is used as building material in Egyptian rural areas, as in the Hungarian folk arcvhitecture. (MANSOUR et al. 2007) Reed is also one of the oldest natural building materials. Different cultures from all over the world have used reed as construction material due to its excellent properties, normally combined with mud and wood, creating shelters and cabins for thousands of years. Reeds is a species with many different uses: a very well known one is the use of their stems or canes as construction material for huts, roofs, etc., whether they be individually placed or joined together, forming a reed screen. In landscaping, reed is used for example as a material for fences or wind protection walls.
One of the panel producers general problems is the lack of available cheap raw materials. Thus, cement bonded composite products lose their competitive edge on the market. It is worth looking at alternative lignocellulosic materials to replace wood in these products.
On the Hungarian side of Lake Fertő, there are about 5-6000 ha of harvestable reed, while on Lake Balaton two thirds of the 1200 ha is harvestable (resource of the Fertő Reed Company). The theoretical yield is 10-12 t/ha. This means about 50 thousand tons of reed on Lake Fertő alone (ALPÁR et al 2012).
Cereal (wheat, barley, rice, and others) straw is a major by-product of agricultural activities, available in excess amounts (SOROUSHIAN and HASSAN 2012).
The cement compatibility is still a problem in developing of cement bonded lignocellulosic materials. Organic materials have been found to inhibit cement setting and reduce cement strength (OKINO et al 2004).
The reasons for this are, as follows: - The inorganic binders used either do not bond with the wood at all, or do so only partially.
This is the greatest problem with wood-cement systems. There are no primary bonds between cement and wood. The strength of these composites are mainly due to the physical connection between the components.
- There are significant differences between the elasto-mechanical behavior and the shrinkage and swelling of the components. This further deteriorates the above mentioned physical connections and affects the strength adversely.
- The wood that makes up the framework of the composite affects the setting of the cement binder (TAKATS et al. 2004).
Straw and reed, just like wood, are lignocellulosic materials and they affect cement hydration significantly.
First of all the inhibitor content of reed and straw were assessed, followed by a number of hydration tests to evaluate the cement hydration processes in the presence of reed and straw. Then, experimental panels were produced using the best recipes. Strength and thermal conductivity were tested to verify the panels physical and mechanical properties.
2. MATERIALS AND METHODS
Standard Portland cement (CEM I) and chips made of common reed (Phragmites australis) obtained from the Fertő Lake Reed Company and straw (Triticum aestivum) were used for our studies.
Two types of reed and straw chips were used: a small size reed and straw material made under the same conditions using a Rapid 150-21 Solo granulator machine with an 8 mm hole diameter

Science for Sustainability University of West Hungary International Scientific Conference for PhD Students March 19-20, 2013 – Győr
70
screen. These chips were used for high density reed panels in case of reed, partly for the isolating reed and straw panels and for the chemical analysis. For the insulating panels larger chips were used in form of 3-4 cm long sections in which the hollow conical tube of the reed was preserved. Reed insulating panels, the straw insulating panels where made from two types of chips. Two thirds of the straw used was in the form of 10-15 cm long selections, the other third of the straw was small size chips, made with the same Rapid 150-21 Solo granulator machine with an 8 mm hole diameter screen.
Water glass (Na2SiO3) was used as an accelerator for cement hydration. 49.5% solution of sodium silicate was obtained from Kemikál PLC. Water glass has a double role in cement bonded panel production. One is to accelerate hydration, which decreases the time available for inhibitors to leach out of wood. The other is to increase the initial strength.
Chip moisture content was determined using an air-circulating dryer at 105 °C, the chips were dried until there was no change in weight. Net moisture content, calculated based on dry mass, was 10.2 %, for the reed chips, and 9.7% for the straw chips.
The amount of water to be added during mixing depends on chip moisture content. Besides determination of moisture content, the following tests were carried out on chips:
- Tannin content determination: based on a lead-acetate laboratory test. - Sugar content determination: based on a Fehling reaction laboratory test. - Ph determination: based on ph paper test. - Wax content determination: based on Hungarian Standard MSZ 8233-86 for determining
the extractive content of pulp. This method is based on extracting the cellulose in an organic solvent, and measuring the mass after evaporating the solvent, and drying out the extractum (wax).
- Hydration tests: test materials were stored, and hydration temperature data was sampled on room temperature. Data acquisition was done by an AHLBORN 8590-9 type data collection instrument. The instrument has 9 channels, and allowed simultaneous measurements on 9 samples. NiCr-Ni type, glass silk insulated thermocouples with measurement rage is -25 °C through +400 °C were used. Samples were prepared in plastic cups, and placed in polystyrene insulating containers. The exposed ends of the thermocouples were inserted into the reed/straw-cement mixture.
- Thermal conductivity determination: heat flow is proportional to the heat differential, the cross section perpendicular to the heat flow and a constant called thermal conductivity. This constant equals to the amount of heat passing through a material of unit thickness and surface area, due to one unit of temperature differential between the two surfaces. Its unit is J/s·m·K, or W/m·K, and its usual notation is �. Higher density materials typically, but with some notable exceptions, have higher conductivity, while low density, loose – fibrous or porous – materials exhibit lower values. The conductivity of various building materials cover a wide range (including insulating foams and aluminium, with thermal conductivities of 0.03 W/m·K and 200 W/m·K, respectively.) After sample preparation, thermal conductivity was measured using the testing machine in the Innovation Centre of the Faculty of Wood Sciences, UWH. The testing instrument was developed for measuring the conductivity and thermal insulation parameters of wood. It takes measurements at pre-determined intervals. The actual conductivity values are provided after reaching a steady-state flow.
- Bending properties: bending strength and modulus of elasticity was measured using a three-point setup according to MSZ EN 312. Thickness swelling after soaking: soaking times are included in the standards for various panels. We used the most general, 24 hour period. Measurements were taken according to the relevant standard EN 317. The tests were made in the FAIMEI Material and Product Testing Laboratory of Faculty of Wood Sciences at UWH.

Science for Sustainability University of West Hungary International Scientific Conference for PhD Students March 19-20, 2013 – Győr
71
3. RESULTS AND EVALUATION
3. 1. Tannin, sugar and wax content
Tannin, sugar and wax content determination results are shown in Table 1. The values of Scots pine and I 214 poplar, used for cement-bonded chipboard and wood wool panel manufacture, respectively, are provided for comparison.
Table 1. Extractive contents of reed, straw, Scots pine and I 214 poplar Straw Reed SP I 214
Sugar 0.50%≤ ≤ 0.50 % 0.42 %* 0.51 %** Tannin 2.25% 0.60 % 0.39 %* 0.17 %** Wax 5.2% 4.11 % 3.20 %* 2.60 %***
(*Alpár 2000, **Alpár et al 2011, ***Vámos 1980)
The results (Table 1) show that reed and straw has a high concentration of inhibitors. The Ph of the reed and straw were 7 (neutral).
3. 2. Hydration tests
Various recipes were used during the preliminary experiments, and it was found that, for creating adequate bonding in the reed-cement and straw-cement composite, the amount of sodium silicate needs to be increased significantly compared to the usual cement bonded particleboard recipes. Based on these experiences, the samples for the first successful hydration experiment were done according to the recipes shown in Table 2.
Table 2. Recipes for hydration test
Figure 1. Hydration lines of cement-straw composites I.
The results on Figure 1 and Figure 2 show that samples with higher sodium silicate content resulted in more vigorous hydration reaction. The highest hydration temperature was measured in case of the sample with the most sodium silicate.
Further testing was done to assess the effect of further increasing the amount of sodium silicate. The recipes are shown in Table 3. Both straw and reed were tested with the same conditions.
Sample nr. Reed/Straw [g] Water [g] Cement [g] Sodium silicate solution [g] I. (Control) X 20.00 20.00 X
II. 16.54 17.80 33.00 1.40 III. 16.54 17.80 33.00 3.40 IV. 16.00 12.00 34.00 8.00 V. 16.00 32.00 34.00 X

Science for Sustainability University of West Hungary International Scientific Conference for PhD Students March 19-20, 2013 – Győr
72
Figure 2. Hydration lines of cement-reed composites I.
Table 3. Recipes for further hydration tests Sample nr. Reed/Straw [g] Water [g] Cement [g] Sodium silicate [g] I. (Control) X 20.00 20.00 X
II. 16.00 12.00 34.00 8.00 III. 16.00 12.00 34.00 16.00
Adding more sodium silicate leads to more rapid heat generation again, which indicates a
vigorous reaction. Maximum temperatures on Figure 3. were almost the same in samples reed 2 and reed 3, despite the fact that there are twice as much water glass in the latter sample.
Higher reaction speed was observed when using more waterglass in the straw-cement experiments. In case of sample ‘straw 3’ (Figure 4) a 10°C temperature increase was registered which indicates a more active reaction.
3. 3. Panel production experiments
The recipes for experimental board production were assembled based on the hydration tests’ experiences. The goal was to produce two kinds of reed-cement composite boards, one with high density, similar to conventional cement-bonded particleboard, and one that is specifically suited for heat insulation. Heat insulation boards were made with straw too, under the same conditions to be comparable to reed. The recipes of the panels are shown in Table 4.
The high density reed-cement panel was pressed for 24 hours, using 5.7 MPa specific pressure, in a Siempelkamp type single daylight laboratory press at the Institute of Wood and Polymer Technology, UWH. Ten high-density panels were produced using the recipe in Table 4.
The reed insulating panels are made of different type of reed chips. Two thirds of the reed were made form of 3-4 cm long selections in which the hollow conical shape of the reed was preserved. The additional one third of the reed chips was small size material made with the Rapid 150-21 Solo granulator machine. The panels were pressed for 24 hours, at a temperature of 60 °C and a pressure of 0.6 MPa.
As the reed insulating panels, the straw panels where made from two types of chips, two thirds of the used straw was in the form of 10-15 cm long selections in, the other third of the straw was small size chips, made with the same Rapid 150-21 Solo granulator.
The insulation boards were pressed for 24 hours, at a temperature of 60 °C and a pressure of 0.6 MPa. Panel production was successful; 10-10 low density panels were produced of both raw materials under the same conditions for further investigation.

Science for Sustainability University of West Hungary International Scientific Conference for PhD Students March 19-20, 2013 – Győr
73
Figure 3. Hydration lines of cement-reed composites II.
Figure 4. Hydration lines of cement-straw composites II.
Table 4. Recipes for panel manufacture
Raw materials High density reed panel Heat insulation reed/straw panel Reed (g) 585.37 810.00
Cement (g) 1243.90 1800.00 Sodium silicate solution (g) 292.68 450.00
Water (g) 878.05 1440.00 Total (g) 3000.00 4500.00
Mat size (mm) 400x400 500x500 Panel thickness (mm) 12 35
3. 4. Thermal conductivity measurements
Thermal conductivity was measured on the insulating boards. Table 5 shows the results.

Science for Sustainability University of West Hungary International Scientific Conference for PhD Students March 19-20, 2013 – Győr
74
Table 5. Thermal conductivity values measured on insulating boards Reed panel Thermal conductivity, W/m·K
Mean 0.09284 Standard deviation 0.00165
Straw panel Thermal conductivity, W/m·K Mean 0.09317
Standard deviation 0.00159
The analytical results achieved on reed-cement test panels were better than those of Alpar et al, 2012, where the thermal conductivity was 0.09545 W/m·K, at 10.25% moisture content. This might be caused by the lower moisture content used in the more recent tests, which was 8.3% and 7.8% for reed panels and straw panels respectively.
Reed-cement insulation boards exhibited somewhat lower thermal conductivity values than the boards made from wheat straw. In the same time the straw-cement boards were more solid, with higher strength.
Thermal conductivity of a commercial wood wool panel (Heraklith by Knauf, 25 mm thick) was measured as control. Its thermal conductivity was 0.08744 W/m·K with very low moisture content (6.0%) (ALPAR et al 2012.).
3. 5. Strength and swelling tests
High density reed panels were tested, 3 months after production. The results were, as follows (average of 10 specimens):
- The standard specification for the bending strength of cement-bonded particleboard (EN 634-2) is 9 N/mm2. Unfortunately, our panel fell seriously behind this value, with an average MOR of 3.96 N/mm2.
- The average internal bond of the samples was 0.1932 N/mm2. This is, again, much inferior to the standard specification of 0.5 N/mm2 (EN 634-2).
- The average percent value of thickness swelling was 1.982%. This again does not comply with the standard specification of 1.5 % (EN 634-2).
4. CONCLUSIONS
The main expected outcome of this research was to help to introduce a novel sustainable building material for low-cost housing in Hungary.
The amount of cement bonding inhibitors in reed and straw was determined during laboratory tests. It was found that the examined reed and straw was found to have higher tannin and sugar content compared to conventional raw material of cement-bonded products (poplar (Populus euamericana I214), Scots pine (Pinus sylvestris)). It was found that increased use of water glass could accelerate the hydration of cement so it could prevent inhibitors from leaching out.
An environmentally preferred approach to theeffective use of straw and reed in cement- based products involves accelerated CO2 curing to overcome the inhibitory effects of straw on hydration of cement, and to lower the alkalinity of the cement-based matrix for improved compatibility with straw and reed. Once the inhibitory and stability concerns are addressed, straw and reed offers desirable reinforcement attributes for use in cement-based products.
In terms of the high density panels, the standard specifications of cement-bonded particleboard could not be reached, but the insulation boards showed very good performance in terms of thermal conductivity. The thermal testing demonstrated that the srtaw- and reed-cement

Science for Sustainability University of West Hungary International Scientific Conference for PhD Students March 19-20, 2013 – Győr
75
composites could be used as thermal insulation units. The use of thermal insulation helps reduce energy costs, while creating pleasant indoor temperatures.
These attributes add to the value of straw and reed as an economical and environmentally friendly substitute for thermal insulation wood-cement products. Acknowledgements: This research was supported by European Union, European Social Funds, TÁMOP 4.2.1.B-09/1/KONV-2010-0006. References ALPÁR T. (2000): Kötésgyorsítási módszerek a cementkötésű forgácslapok gyártásánál. [Methods on
accelerating curing of cement when producing cement bonded particleboards.] Ph.D. thesies, University of Sopron. Sopron, (In Hungarian), p. 5.
ALPÁR, T. - PAVLEKOVICS, A. - CSOKA, L.- HORVATH L (2011): Wood wool cement boards produced with nano minerals, 3rd International Scientific Conference on Hardwood Processing (ISCHP32011) I: Peer reviewed contributions October 16 – 18, 2011, p 76.
ALPÁR, T. L. - SCHLOSSER, M. - HAJDU I. - BEJÓ L. (2012): Developing Building Materials from Cement-bonded Reed Composite Based on Waste Materials. International Scientific Conference on Sustainable Development & Ecological Footprint. March 26-27 2012. Sopron, Hungary, ISBN 9789633340479, p. 359-362.
MANSOUR, A. – SREBRIC, J. – BURLEY, B.J. (2007): Development of Straw-cement Composite Sustainable Building Material for Low-cost Housing in Egypt. Journal of Applied Sciences Research, 3(11) p. 1571-1580.
MOLNÁR S. – VARGA F.-NÉ – FEHÉR S. – NÉMETH R. (2000): A faanyag műszaki tulajdonságai. [Technical characteristics of wood.] (in Hungarian) In: MOLNÁR S. (ed.) Faipari kézikönyv I. [Wood Handbook I.] Faipari Tudományos Alapítvány, Sopron., ISBN 9630042311 (in Hungarian) p. 59-88.
OKINO, E.Y.A., DE SOUZA, M.R., SANTANA, M.A.E., ALVES, M.V.D.S., DE SOUSA, M.E., TEIXEIRA, D.E., (2004): Cement-bonded wood particleboard with a mixture of eucalypt and rubberwood. Cem. Concr. Compos. 26 (6), p. 729–734.
SOROUSHIAN, P – HASSAN, M. (2012): Evaluation of cement-bonded strawboard against alternative cement-based siding products , Construction and Building Materials 34 p. 77–82.
TAKÁTS P. - BEJÓ L. - VASS N. (2004): Különböző fa- és adalékanyagok hatása a cement hidratációjára cementkötésű kompozit termékekben. I. rész: elméleti háttér [The effect of various wood materials and additives on cement hydration. Part 1: theorectical background.] Faipar 52(4) (in Hungarian) p. 3.
VÁMOS GY. (ed) (1980): Papíripari Kézikönyv [Paper Handbook.], Műszaki Könyvkiadó, Budapest,. ISBN 9631030229 (in Hungarian) p: 190-203.

Science for Sustainability University of West Hungary International Scientific Conference for PhD Students March 19-20, 2013 – Győr
76
Dependence of the Axial Force from the Clearance Angle and Feed Speed
ĽALÍK, Jaroslav* –JAVOREK, Ľubomír
Department of Wood Working Machines and Equipment, Technical University in Zvolen, Zvolen, Slovakia
Abstract – Drilling is the most widely used method of production holes for pins, screws, thread required for joining of parts. This article describes the impact of the clearance angle and feed speed to the axial force during drilling steel. We compared the measured values of axial force at different clearance angles and different feed speed.
Keywords: drill bit / feed speed / axial force /
1. INTRODUCTION
Drilling is one of the advanced methods of machining metal and wood but also all other materials. The process belongs to the category of combined cutting, in which the chip formed only based upon features drilled material and technological conditions of the cutting wedge shape but also significantly shaped groove in the body of the drill. Development of measuring devices has contributed to the results of monitoring the process of drilling, particularly axial forces, respectively, torque contributions published in (JAVOREK, OSWALD 2001; JAVOREK, SVOREŇ 2003) can be verified with much greater accuracy. Application of high-speed camera (BARBU, BADESCU, JAVOREK 2010) has brought new insights into the formation of particles and especially the phenomena of partial destruction of the material in the range from drill drilled material. This paper presents partial results of measurements of axial force and torque for drilling steel.
2. DRILLING CHARACTERISTICS
2.1. Cross-sectional chips parameters
When the tool has got one cutting edge, the resulting cross-section removed layer is given by:
[mm2] (Eq. 1) For tool with two cutting edges will be theoretical cross-section removed layer for one cutting
edge given by:
[mm2] (Eq. 2) When the tool has got two cutting edges, the resulting cross-section removed layer is given by:
* Corresponding author: e-mail: [email protected], Department of wood working machines and equipment, Faculty of environmental and manufacturies technologies, Technical University in Zvolen, T.G. Masaryka 24, SK -960 53 Zvolen, Slovakia

Science for Sustainability University of West Hungary International Scientific Conference for PhD Students March 19-20, 2013 – Győr
77
[mm2] (Eq. 3)
Figure 1. Cross-sectional chips parameters for drilling
where: vf… feed speed; hD… chip thickness; bD… chip width; ap…radial depth of cut; ae… axial depth of cut; fz… feed per tooth; Dn…tool diameter ; αx…clearance angle; γx…rake angle
2.2. Force and energy parameters
The process of drilling is classified into categories of closed cutting. It is difficult to calculate the values of forces, so the values of forces are determined experimentally. Generally, for calculating the cutting force Fc, as the tangential component of the resultant force acting on the arm Dn / 4, is the following equation:
(Eq. 4) The cutting torque corresponds to this force is expressed as follows:
(Eq. 5) When the holes are drilled deeply, the cutting moment is the sum of torque for removing chips
, then the friction torque of margin and the hole face, and the friction torque of chips and flute of drill and hole.
(Eq. 6)
If is the hole depth increasing then are increases parameters and .To calculate the axial force from value of the cutting force Fc is used following equation:
(Eq. 7) The constant k is determined according to the size of the blunting of tool and its size varies within a wide range. As the resulting torque also the resultant axial force is given by following equation:
(Eq.8)
3. EXPERIMENT
3.1. Machine
As drilling machine was used type 2H 135 from manufacturer VIL Industry (Figure 2). Specifications are given in (Table 1).

Science for Sustainability University of West Hungary International Scientific Conference for PhD Students March 19-20, 2013 – Győr
78
Table 1. Technical parameters of drill press
3.2. Tool
For drilling were used 3 pieces of drill (Ø21) with taper shank from the manufacturer Format (Figure 3). Drills were regrinded before the experiment and on each was created a different clearance angle. Values of clearance angle were 8°, 10° and 12°.
Figure 3. Bits used in drilling
3.3. Measuring equipment
Axial cutting force and torque moment was measured by piezoelectric dynamometer type Kistler (Figure 4). The measuring chain consists of dynamometer type 9272 (axial force measurement range -5 kN to 20 kN, torque moment range -200 Nm to 200 Nm), multi-channel amplifier, 5070, 16-bit A / D converter 5697 and a laptop with a measurement program Dynoware.
Figure 4. Measuring chain Kistler
Parameters (L× W × H) 785 mm × 915 mm × 2350 mm Spindle speed 31,5 – 1400 rpm Feed per rev. 0,1 mm – 1,6 mm
Max. diameter of drill bit 35 mm Working table dimensions (L × W) 450 mm × 500 mm
Motor 4 kW
Figure 2. Drill press

Science for Sustainability University of West Hungary International Scientific Conference for PhD Students March 19-20, 2013 – Győr
79
3.4. Workpiece and condition of experiment
For experiment were used samples with dimensions (L x W x H - 60 mm x 40 mm x 19 mm) made of steel 12 050, which were after normalization treatment. Rotation speed of tool was set at 250 rpm. Feed speed was changed in: 0.2 mm/rev, 0.28 mm/rev and 0.4 mm/rev.
4. RESULTS AND DISCUSSION
4.1. Inpact of feed rate on axial force
On the graph (Figure 5) is clearly visible that the change of feed rate significantly influences the axial force. Average value of axial force was 4400 N when we have set feed rate on 0.2 mm/rev.When we changed feed rate from 0.2 mm/rev to 0.28 mm/rev the axial force approximately increased about 25% to the average value 5400 N. When feed rate was doubled to 0.4 mm/rev average value of axial force increased on to 7500 N what is an increase about 75%. This measurement shows that the axial force increases nearly linearly with the increasing feed rate.
4.2. Impact of clearance angle on axial force
With changing the clearance angle is shown, that the axial force changed. But as the graf (Figure 6) shown, the axial force in the measurement did not change linearly with the changing the clearance angle of tool. According to the measured values of clearance angle 12° seems to be the best because the smallest values of axial force was measured. The average value of axial force of clearance angle 12° was 5400 N. The angle of 10° during the measurement shows an increase of the average value axial force by 730 N, compared to the measuring with an angle of 12°. An angle of 8° increased average values about 220 N compared to values with 12° clearance angle. Angle of 10° at this measurement seems to be the worst for driling, but its unsuitability should be verified by other experiments. When we measured with drill which clearance angle was 10° then occurred a destruction of cutting edge (Figure 7).
Figure 5. Axial force measured for various feed rate

Science for Sustainability University of West Hungary International Scientific Conference for PhD Students March 19-20, 2013 – Győr
80
Figure 6. Axial force measured at different clearance angle
Figure 7. Destruction of cutting edge
5. CONCLUSION
This measurement showed that the axial force during drilling steel with screw drill increased approximately linearly with increasing feed speed of tool. After doubling the feed speed increased axial force of approx. 75%. Comparing the tools in terms of impact clearance angle the experiment demonstrated the best tool with clearance angle of 12°. Tools with clearance angle 8° in this experiment shows, that the axial force increases by 2% compared to the tool with clearance angle of 12°. For tool with clearance angle of 10° the increase of axial force was up to 11% compared to tool with clearance angle of 12°. To verify the measured data would be useful to repeat the measurement even using large-scale changes in the clearance angle of the tool. References JAVOREK, Ľ. – OSWALD, J. (2001): Possibilities for monitoring of drilling. International scientific
conference: ”Wood science and engineering in the third millennium“. Brašov. BARBU, S. M. – BADESCU, L. – JAVOREK, Ľ. (2010): Studies concerning the chip formation at the
longitudinal drilling of the beech wood with help high speed camera”. In Annals of Warsaw university of life sciences. Forestry and Wood Technology. Warszawa: Warszaw University of Life Sciences Press. ISSN 1898-5912. No. 72. p. 9 – 12.
JAVOREK, Ľ. – OSWALD, J. (2001): Monitoring feed force during machining. In: MVK Trendy lesníckej, drevárskej a environmentálnej techniky a jej aplikácie vo výrobnom procese. Sekcia č. 1– Lesná, mobilná a drevárska technika. Zvolen 4.– 6. September 2001. s. 79–84.

Science for Sustainability University of West Hungary International Scientific Conference for PhD Students March 19-20, 2013 – Győr
81
JAVOREK, Ľ. – SVOREŇ, J. et all. (2003): Influence of grain orientation and feed speed to cutting power during boring. In: MVK CO-MAT-TECH 2003. Trnava. 16.–17. 10. 2003. Bratislava. ISBN 80-227-1949-8. s. 139–140.
BCNs Films and Its Potential as Energy Harvesting Material
TSALAGKAS, Dimitriosa – CSÓKA Leventea* aInstitute of Wood and Paper Technology, University of West Hungary, Sopron, Hungary
Abstract – The paper reports on the investigation of the piezoelectric effect of bacterial cellulose nanocrystals (BCNs) films and their potential as energy harvesting material. BCNs were obtained from Nata de coco with application of active cavitation by a high power ultrasound device combined with the addition of NaOH and HCl or only NaOH. Thin films of BCNs aqueous suspensions were developed by shear assembly on aluminum foils. Then BCNs films were used under mechanical strain to produce piezoelectricity and the electric signals were recorded by laboratory digital oscilloscope. Results showed that BCNs thin films can demonstrate different signals related to the treatment, ranging from some mV up to 200 mV. Maximum piezoelectric constant, found to be 210x10-12 C/N and energy conversion efficiency around 8%.
Keywords: cellulose nanocrystals / piezoelectricity / energy conversion efficiency
1. INTRODUCTION
Numerous research groups in the field of nanomaterials has shown considerable progress toward self-powered energy sources by scavenging energy from ambient environments (solar, thermal, mechanical vibration etc.) (CHANG et al. 2012).
One of the most promising techniques to produce an energy harvesting device is kinetic or mechanical energy harvesting. Kinetic energy harvesting is expected to be an energy source for micro power devices, such as micro sensors, actuators, wireless network devices and so on applications. Mechanical strains due to the bending, vibration or compression of the thin-film structure can be the source of the energy generation. The principle behind kinetic energy harvesting is the mechanical deformation of a material inside the energy harvesting device. This displacement or deformation can be directly converted to electrical energy by using certain piezoelectric materials, where deformations produced by different means is directly converted to electrical charge via direct piezoelectric effect (LEINONEN et al. 2009).
One fundamental issue for the implementation of these harvesters, especially for small-scale applications is the design and selection of structural materials for efficient conversion of mechanical energy into electricity (CHANG et al. 2010). In particular, the use of piezoelectric generators by nanomaterials as a simple solution for mechanical energy harvesting has attracted much attention. (KIM et al. 2009). Piezoelectric effect is expected to have advantages in obtaining high energy conversion efficiency and minimizing the device size compared to other harvesters using electrostatic or electromagnetic induction. In vibration energy harvesting the direct piezoelectric effect is more important than the converse piezoelectric effect (MIYABUCHI et al. 2011). * Dimitrios Tsalagkas: [email protected], Baross ut 4-6, H-9400 Sopron, Hungary.

Science for Sustainability University of West Hungary International Scientific Conference for PhD Students March 19-20, 2013 – Győr
82
The term piezoelectricity (from the greek word “piezein” meaning to press or squeeze) refers to the production of bound electrical charges in the surface of a material or crystals specimens by the imposition of some form of elastic, mechanical or electrical stress (BALLATO 1996). When mechanical stress is imposed on a certain type of crystal such as tourmaline, quartz or wood an electrical polarization is produced leading to an effective net dipole moment. This phenomenon is called direct piezoelectric effect (FUKADA 1968, PLACKNER 2009).
The observation and experimental verification of piezoelectric effects in wood was first demonstrated by Bazhenov in 1950 and Fukada in 1955 respectively. Piezoelectricity exists in many biological substances such as bone and wood because of its polar nature and the anisotropic crystal symmetry in crystal structure denoted by D∞ (FUKADA 1995).
The piezoelectric effect of wood or any other cellulose source (bacterial, tunicates, wooden pulp, ramie etc.) exists due to the chemical and crystalline structure of cellulose fibrils, and the magnitude of piezoelectric constant depends on the degree of crystallinity, the alignment of its disordered and amorphous regions and the orientation of cellulose crystals. In general any kind of cellulose (native or regenerated) is capable of producing piezoelectricity. (FUKADA 2000, HIRAI et al. 2011). The magnitude of the piezoelectric constant in wood is quite small due to the random distribution and the small amount of crystalline cellulose in the lignocellulose matrix (CSOKA et al. 2012). Further, the piezoelectricity in wood varies depending on the type of wood, orientation of wood samples, moisture and temperature (KIM et al. 2007).
Piezoelectricity in cellulose is generated from dipole orientation and the monoclinic or triclinic crystal structure in cellulose chains. Dipoles are oriented in the crystalline phases inside lamellae and in the interfaces between the crystalline and noncrystalline phases. Cellulose crystals due to its chemical structure are naturally oriented and exhibit shear piezoelectricity due to the internal rotation of polar atomic groups associated with the chirality of asymmetric carbon atoms (FUKADA 2000). These polar dipoles are the hydroxyl groups in crystal lattice of cellulose (FUKADA 1968). Hydrogen bonding patterns and the type of hydroxymethyl conformation at the C-6 position are responsible for the cellulose fibers composition into wood, as well as for its inter- and intermolecular interactions and the physical properties of wood (KONDO 2005).
CSOKA et al. (2012) reported the first experimental results indicating that cellulose nanocrystals have a large piezoelectric response. In addition, the fabricated ultrathin films yielded a piezoelectric coefficient ranging from 0.7 to 2.10 x 10⁻¹⁰ C/N related to the electromechanical actuation and strain which changes as a function of the orientation and alignment of cellulose nanocrystals.
Aim of this study was to investigate the production of “green” bacterial cellulose nanocrystals without the involvement of hazardous chemical treatments, such as strong acid hydrolysis and the fabrication of thin films which could be used as energy harvesting materials.
2. MATERIALS AND METHODS
Bacterial cellulose, while identical to plant cellulose in chemical structure is produced without contaminant molecules and its macromolecular structure and properties differ from the latter one. Bacterial cellulose demonstrate unique properties including high mechanical strength, high crystallinity, high water holding capacity and high porosity which makes it a very useful biomaterial in many different industrial processes (CZAJA et al. 2004, CZAJA et al. 2006). Furthermore, bacterial cellulose is remarkable for its ability to be engineered structurally and chemically at nano-, micro- and macroscales (PETERSEN - GATENHOLM 2011).
Bacterial cellulose nanocrystals (BCNs) were extracted from Nata de coco. The Nata de coco cubes were first washed with normal water and blended using a laboratory blended at maximum
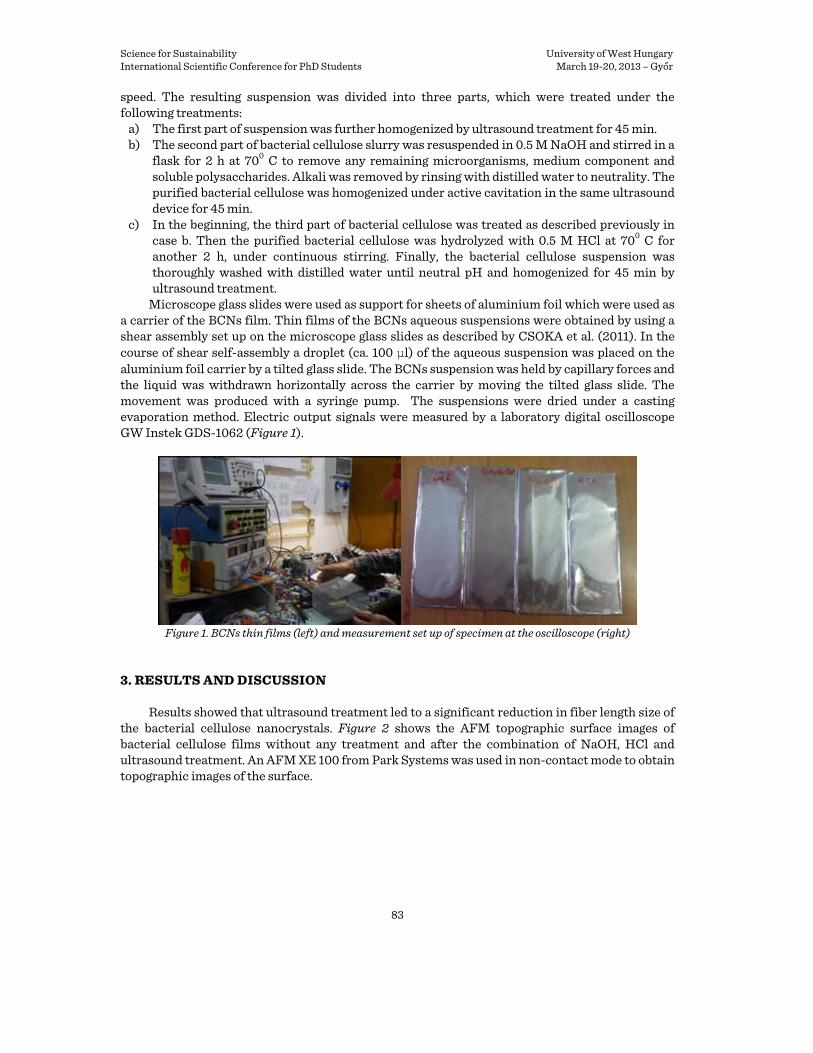
Science for Sustainability University of West Hungary International Scientific Conference for PhD Students March 19-20, 2013 – Győr
83
speed. The resulting suspension was divided into three parts, which were treated under the following treatments:
a) The first part of suspension was further homogenized by ultrasound treatment for 45 min. b) The second part of bacterial cellulose slurry was resuspended in 0.5 M NaOH and stirred in a
flask for 2 h at 700 C to remove any remaining microorganisms, medium component and soluble polysaccharides. Alkali was removed by rinsing with distilled water to neutrality. The purified bacterial cellulose was homogenized under active cavitation in the same ultrasound device for 45 min.
c) In the beginning, the third part of bacterial cellulose was treated as described previously in case b. Then the purified bacterial cellulose was hydrolyzed with 0.5 M HCl at 700 C for another 2 h, under continuous stirring. Finally, the bacterial cellulose suspension was thoroughly washed with distilled water until neutral pH and homogenized for 45 min by ultrasound treatment.
Microscope glass slides were used as support for sheets of aluminium foil which were used as a carrier of the BCNs film. Thin films of the BCNs aqueous suspensions were obtained by using a shear assembly set up on the microscope glass slides as described by CSOKA et al. (2011). In the course of shear self-assembly a droplet (ca. 100 μl) of the aqueous suspension was placed on the aluminium foil carrier by a tilted glass slide. The BCNs suspension was held by capillary forces and the liquid was withdrawn horizontally across the carrier by moving the tilted glass slide. The movement was produced with a syringe pump. The suspensions were dried under a casting evaporation method. Electric output signals were measured by a laboratory digital oscilloscope GW Instek GDS-1062 (Figure 1).
Figure 1. BCNs thin films (left) and measurement set up of specimen at the oscilloscope (right)
3. RESULTS AND DISCUSSION
Results showed that ultrasound treatment led to a significant reduction in fiber length size of the bacterial cellulose nanocrystals. Figure 2 shows the AFM topographic surface images of bacterial cellulose films without any treatment and after the combination of NaOH, HCl and ultrasound treatment. An AFM XE 100 from Park Systems was used in non-contact mode to obtain topographic images of the surface.
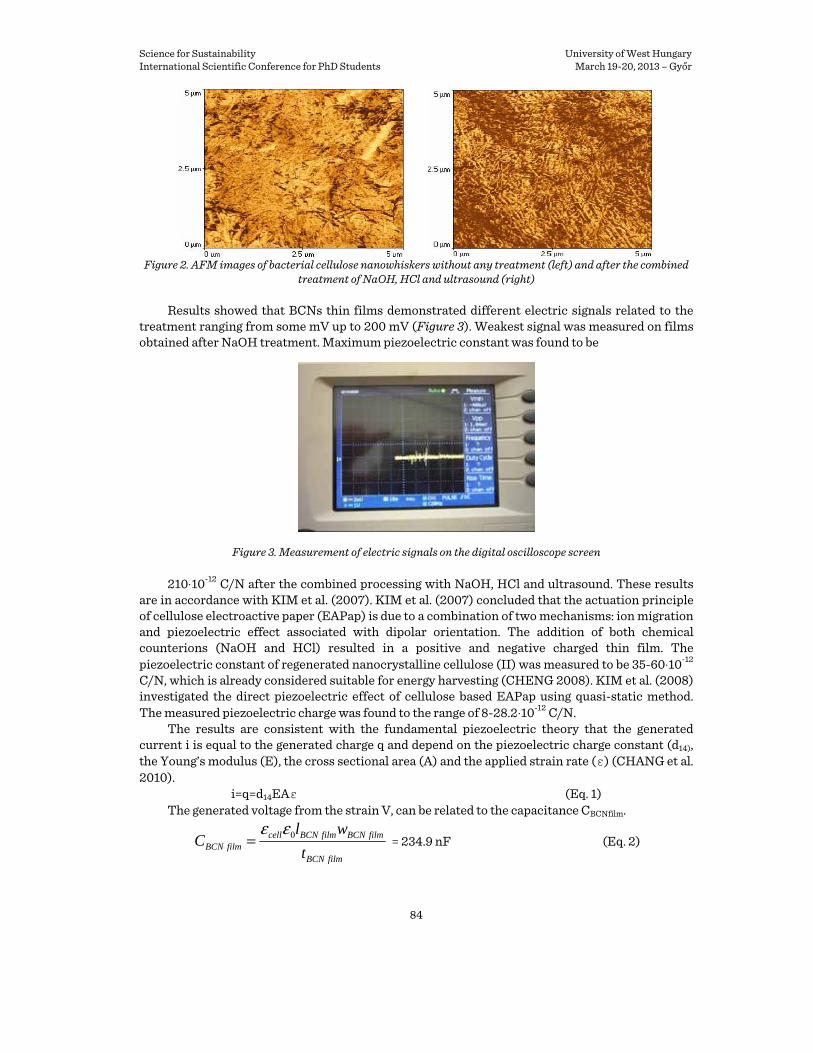
Science for Sustainability University of West Hungary International Scientific Conference for PhD Students March 19-20, 2013 – Győr
84
Figure 2. AFM images of bacterial cellulose nanowhiskers without any treatment (left) and after the combined
treatment of NaOH, HCl and ultrasound (right) Results showed that BCNs thin films demonstrated different electric signals related to the
treatment ranging from some mV up to 200 mV (Figure 3). Weakest signal was measured on films obtained after NaOH treatment. Maximum piezoelectric constant was found to be
Figure 3. Measurement of electric signals on the digital oscilloscope screen 210⋅10-12 C/N after the combined processing with NaOH, HCl and ultrasound. These results
are in accordance with KIM et al. (2007). KIM et al. (2007) concluded that the actuation principle of cellulose electroactive paper (EAPap) is due to a combination of two mechanisms: ion migration and piezoelectric effect associated with dipolar orientation. The addition of both chemical counterions (NaOH and HCl) resulted in a positive and negative charged thin film. The piezoelectric constant of regenerated nanocrystalline cellulose (II) was measured to be 35-60⋅10-12 C/N, which is already considered suitable for energy harvesting (CHENG 2008). KIM et al. (2008) investigated the direct piezoelectric effect of cellulose based EAPap using quasi-static method. The measured piezoelectric charge was found to the range of 8-28.2⋅10-12 C/N.
The results are consistent with the fundamental piezoelectric theory that the generated current i is equal to the generated charge q and depend on the piezoelectric charge constant (d14), the Young’s modulus (E), the cross sectional area (A) and the applied strain rate (ε) (CHANG et al. 2010).
i=q=d14EAε (Eq. 1) The generated voltage from the strain V, can be related to the capacitance CBCNfilm.
filmBCN
filmBCNfilmBCNcellfilmBCN t
wlC 0εε
= = 234.9 nF (Eq. 2)

Science for Sustainability University of West Hungary International Scientific Conference for PhD Students March 19-20, 2013 – Győr
85
where εcell is the relative permittivity of cellulose (4.032 F/m), ε0 is the permittivity (8.85 x 10⁻¹² F/m) and the dimensions of the film are lBCNfilm = 5⋅10-2, wBCNfilm = 5⋅10-3 and tBCNfilm = 38⋅10-9 m corresponding to the length, width and thickness, respectively.
The applied voltage V is given by the following equation
== dtC
tEdC
dAdVfilmBCNt
filmBCN
filmBCN
filmBCN
εσ 1414 = 23.54 mV (Eq. 3)
where E is the Young’s modulus of bacterial cellulose, assumed to be 135 GPa (GEA et al. 2011), d14 is the piezoelectric coefficient (210⋅10-12 C/N), εtBCNfilm the strain (0.10), dt the displacement due to the external mechanical force (3.9 ⋅10-9 m).
The energy conversion efficiency is an important measure for energy scavenging applications. The energy conversion efficiency (η) can be estimated as the ratio between generated electrical energy and applied mechanical energy. The output electrical energy is calculated as
We = V I dt = 4.09 x 10⁻⁹ J (Eq. 4)
where V (23.54 mV) and I (173.67 nA) are the generated output voltage and electric current respectively. The total mechanical deformation energy stored in the BCNs thin film is
Wm = ½ E A (t-tBCNfilm)2/tBCNfilm = 5.13 x 10⁻⁸ (Eq. 5) where A is the cross sectional area (1.9⋅10-9 m), t0 is the original thickness and t is the
thickness after straining (4.19⋅10-8). Energy conversion efficiency was measured 7.9%. For practical applications piezoelectric polymers are compared with piezoelectric ceramics
(FUKADA 2000). CHANG et al. (2010) measured the energy conversion efficiency of piezoelectric PVDF nanogenerators, which was found to be as high as 21.8% with an average of 12.5%. This value was greater than typical power generators made from experimental and commercial PVDF thin films (0.5-4% and 0.5-2.6% respectively).
4. CONCLUSIONS
Cellulose in general and especially bacterial cellulose due to its anisotropic crystal structure and its unique properties including high mechanical strength, high crystallinity and the ability of developing a “net dipole moment” are capable of producing piezoelectricity.
In the present investigation, ultrasound effect proved to be useful in the production of cellulose nanofibers or nanocrystals and enhanced the decrease of their size. The applications of piezoelectric nanofibers strongly rely on the good piezoelectric properties. BCNs thin films exhibited well piezoelectric properties and seem to be a promising material for energy scavenging applications. However, the piezoelectric voltage constant of the piezoelectric bacterial cellulose nanomaterials and output voltage and power of their thin films still needs further improving for practical applications. References BALLATO, A. (1996): Piezoelectricity: History and new thrusts. In: “Proceedings of 1996 IEEE Ultrasonics
Symposium”. San Antonio, Texas. November 1996. 575-583 Vol. 1. CHANG, J. – DOMMER, M. – CHANG, C. – LIN, L. (2012): Piezoelectric nanofibers for energy scavenging
applications. Nano Energy 1 (3): 356-371. CHANG, J. – TRAN, V. – WANG, J. – FUH, Y. – LIN, L. (2010): Direct-write piezoelectric polymeric
nanogenerator with high energy conversion efficiency. Nano Lett. 10 (2): 726-731. CHENG, H. (2008): Flexoelectric nanobiopolymers (FEPs) exhibiting higher mechanical strength (7.5 Gpa),
modulus (250 Gpa) and energy transfer efficiency (75%). WW-EAP Newsletter 10 (2): 5-7. CSOKA, L. – HOEGER, I. – ROJAS, O J. – PESZLEN, I. – PAWLAK, J. – PERALTA, P. (2012): Piezoelectric
effect of cellulose nanocrystals thin films. Macro Lett. 1 (7): 867-870.

Science for Sustainability University of West Hungary International Scientific Conference for PhD Students March 19-20, 2013 – Győr
86
CSOKA, L. – HOEGER, I. – PERALTA, P. – PESZLEN, I. – ROJAS, O J. (2011): Dielectrophoresis of cellulose nanocrystals and alignment in ultrathin films by electric field-assisted shear assembly. Journal of Colloid and Interface Science 363 (1): 206-212.
CZAJA, W. – KRYSTYNOWICZ, A. – BIELECKI, S. – BROWN RM Jr. (2006): Microbial cellulose-the natural power to heal wounds. Biomaterials 27 (2): 145-151.
CZAJA, W. – ROMANOVICZ, D. – BROWN RM Jr. (2004): Structural investigations of microbial cellulose produced in stationary and agitated culture. Cellulose 11 (3-4): 403-411.
FUKADA, E. (2000): History and recent progress in piezoelectric polymers. IEEE Transactions on Ultrasonics, Ferroelectrics and Frequency Control 47 (6): 1277-1290.
FUKADA, E. (1995): Piezoelectricity of biopolymers. Biorheology 32 (6): 593-609. FUKADA, E. (1968): Piezoelectricity as a fundamental property of wood. Wood Science and Technology 2 (4):
299-307. GEA, S. – REYNOLDS, C T. – ROOHPOUR, N. – WIRJOSENTONO, B. – SOYKEABKAEW, N. – BILOTTI, E.
– PEIJS, T. (2011): Investigation into the structural, morphological, mechanical and thermal behavior of bacterial cellulose after a two-step purification process. Bioresour. Technol. 102 (19): 9105-9110.
HIRAI, N. – SOBUE, N. – DATE, M. (2011): New piezoelectric moduli of wood: d31 and d32. Journal of Wood Science 57 (1): 1-6.
KIM, H. – TADESSE, Y. – PRIYA, S. (2009): Piezoelectric energy harvesting. In: PRIYA, S.- INMAN, D. (eds.): Springer Science+Business Media, LLC, New York: 3-39.
KIM, H. – LI, Y. – KIM, J. (2008). Electro-mechanical behavior and direct piezoelectricity of cellulose electro-active paper. Sensors and Actuators A: Physical 147 (1):304-309.
KIM, J. – WANG, N. – CHEN, Y. – LEE, S. – YUN, G. (2007): Electroactive-paper actuator made with cellulose/NaOH/urea and sodium alginate. Cellulose 14 (3):217-223.
KONDO, T. (2005): Hydrogen bonds in cellulose and cellulose derivatives. In: DUMITRIU, S. (eds.): Marcel Dekker, New York: 69-98.
LEINONEN, M. – PALOSAARI, J. – HANNU, J. – JUUTI, J. – JANTUNEN, H. (2009): Piezoelectric energy harvesting for powering low power electronics. In: “Proceedings of the EnerPro Conference”. Oulu, Finland. June 2009. 105-109.
MIYABUCHI, H. – YOSHIMURA, T. – FUJIMURA, N. (2011): Direct piezoelectricity of PZT films and application to vibration energy harvesting. Journal of the Korean Physical Society 59 (3): 2524-2527.
PETERSEN, N. – GATENHOM, P. (2011): Bacterial cellulose-based materials and medical devices: current state and perspectives. Appl. Microbiol. Biotechnol. 91 (5): 1277-1286.
PLACKNER, J. (2009): The converse piezoelectric effect in wood and cellulose materials. Master’s thesis, University of Natural Resources and Applied Life Sciences (BOKU), Vienna, Austria.

Science for Sustainability University of West Hungary International Scientific Conference for PhD Students March 19-20, 2013 – Győr
87
Viscoelastic Properties and Antimicrobial Activity of Cellulose Fiber Sheets Impregnated with Ag Nanoparticles
NAGY Veronika1* – BOŽANIĆ, Dušan K.2 – DIMITRIJEVIĆ-BRANKOVIĆ, Suzana3 – LUYT, Adriaan S.4 – GROZDITS, George5 – DJOKOVIĆ, Vladimir2 – CSÓKA Levente 1
1University of West Hungary, Institute of Wood and Paper Technology, Bajcsy Zs. E. u. 4, 9400 Sopron, Hungary 2Vinča Institute of Nuclear Sciences, University of Belgrade, P.O. Box 522, 11001 Belgrade, Serbia
3Department of Bioengineering and Biotechnology, Faculty of Technology and Metallurgy, University of Belgrade, Karnegijeva 4, 11120 Belgrade, Serbia
4Department of Chemistry, University of the Free State (Qwaqwa Campus), Private Bag X13, Phuthaditjhaba 9866, South Africa
5School of Forestry, Louisiana Tech University, Ruston, LA 71272, USA *E-mail: [email protected]
Abstract – A silver nanoparticle colloid was prepared by a modified Tollens method using D-glucose as the reduction agent. The obtained nanoparticles were used for the modification of pine, linter and recycled cellulose fibers. Although the silver contents were relatively low (0.05–0.13 wt %), the cellulose-sheets prepared from the modified fibers show improved mechanical and viscoelastic properties. The tensile index (strength) increased with up to 30% in comparison to the index of the sheets obtained from the untreated fibers. The influence of the nanoparticles on the viscoelastic properties of the cellulose sheets was investigated by dynamic mechanical analysis (DMA) in the temperature range from −120 to 20 ˚C and with a force frequency of 100 Hz. A broad relaxation transition positioned at −80˚C was observed in the loss modulus spectrum of all the cellulose sheets, while the Ag-modified sheets exhibited higher storage moduli values in the whole temperature range. The antimicrobial activity tests show that the pine, linter and recycled cellulose fiber sheets with silver nanoparticles can be successfully employed to prevent the viability and growth of the common pathogens Staphylococcus aureus, Escherichia coli and Candida albicans.
Keywords: antimicrobial properties / paper / dynamic mechanical analysis / silver nanoparticles
1. INTRODUCTION
Paper is a relatively inhomogeneous material which on a structural level can be described as a dense network of cellulosic wood pulp fibers. The essential feature of this network is that the fibers are bonded i.e. the cohesion in paper is achieved rather by hydrogen bonding at the fiber-fiber contact points and not by their simple mechanical entanglement (Dodson, 1970; Haslach, 2000). In the present study, we exploited a tendency of silver nanoparticles to interact with OH groups (Mbhele et al., 2003) in order to modify cellulose fibers and to use them for the preparation of sheets with enhanced mechanical and viscoelastic properties.
Cellulose and its derivatives have been proved to be good materials for functionalization with metallic nanoparticles since they have a large number of hydroxyl groups that are accessible for chemical modification (CAI et al., 2009; SON et al., 2006; SHIN et al., 2007; SHIN et al., 2008; PINTO et al., 2009; DROGAT et al., 2011; Diez et al., 2011). Several groups exploited this property in order to stabilize silver nanoparticles on the cellulose nanocrystals/fibers and investigated the antimicrobial activity of the obtained nanostructures (PINTO et al. 2009; DROGAT et al. 2011; DIEZ et al. 2011). The silver nanoparticles were synthesized by a green procedure using D-glucose as reducing agent and after that mixed with three types of cellulose fibers: pine, linter and recycled.

Science for Sustainability University of West Hungary International Scientific Conference for PhD Students March 19-20, 2013 – Győr
88
As will be seen, the incorporation of the modified fibers into the network structure significantly increase the strength of the obtained sheets while at the same time they exhibit a strong activity against the common pathogens Staphylococcus aureus, Escherichia coli and Candida albicans. The observed effects are especially important in the case of sheets prepared from recycled fibers. It is well known that recycled paper usually has poor mechanical properties because the recycled fibers are short, damaged and hornificated. Also, these fibers might originate from sources that are more exposed to different microorganisms. The modification of recycled fibers by silver nanoparticles can address both these problems. Besides the activity against possible pathogens, the silver nanoparticles attached on the surface of the fibers can facilitate fiber-fiber bonding and consequently improve the web formation.
Another, equally important, part of this study concerns the dynamic mechanical behavior of the obtained fiber sheets as function of temperature. Paper is the viscoelastic material but the methods usually employed to study its viscoelastic properties are creep and stress relaxation (DEMAIO & PATTERSON 2006; DEMAIO & PATTERSON 2007; ALFTHAN 2004; ALFTHAN 2010; MUSTALAHTI et al. 2010). To our best knowledge, there is only one article that reports on the mechanical relaxation processes observed in the dynamical mechanical spectrum of paper. In the early eighties, Roylance, McElroy and McGarry from MIT investigated the viscoelastic properties of paper used for preparation of cones for loudspeakers (ROYLANCE, MCELROY, & MCGARRY 1980). It was found that paper has a broad mechanical relaxation transition positioned at approximately -40 °C. Unfortunately, their work stayed widely unnoticed probably due to rather complicated experimental procedure at that time which included dynamical mechanical analysis at an extremely high force frequency of 110 Hz in a wide temperature range from -120 °C to room temperature. We believe that the mentioned procedure, easily accessible with modern DMA instruments, could provide additional information about the changes in the viscoelastic properties of the fiber sheets induced by modification with silver nanoparticles but also by some other factors such as density, bonding agents, length of the fibers etc. In that sense, our attempt to draw attention on the mentioned method might also be useful to the researchers from the other fields of the paper science and technology.
2. MATERIALS AND METHODS
2.1 Materials
2.1.1 Cellulose fibers
Three types of cellulose fibers were used in this study: pine, linter and recycled. Bleached linter and pine fibers were received from Buckeye Technologies Inc. and Robert Placzek GmbH., respectively. The recycled fibers were collected from Hartmann Hungary Ltd, a recovery paper processing company.
2.1.2 Preparation of silver nanoparticle colloid
Silver nanoparticles were prepared by a “green” synthetic approach using D-glucose as reducing agent. Silver nitrate (AgNO3) and D-glucose were purchased from Sigma Aldrich Co. and used as received. In a typical procedure, 5 ml of 0.1 M solution of D-glucose was added to 100 ml of a 2 mM aqueous solution of AgNO3 and the mixture was stirred and purged with argon gas for 20 min at room temperature. After that, 5 ml of the mixture was transferred to a separate vial and the pH of solution was set to 8.5 by adding a few drops of 10 % NH4OH. Finally, the obtained solution was treated in microwave oven at 750 W for 30 s.

Science for Sustainability University of West Hungary International Scientific Conference for PhD Students March 19-20, 2013 – Győr
89
Figure 2. a) Storage tensile modulus (E’), b) loss modulus (E’’) and c) loss angle tangent (tanδ) versus temperature for the L-Ag-0 (curve 1), L-Ag-5 (curve 2) and L-Ag-10 (curve 3) samples. The measurements were carried out at 100 Hz.
2.1.3 Modification of cellulose fibers with silver nanoparticles
The silver colloid solution was added to a water suspension of pine, linter or recycled cellulose fibers (3 g of fibers in 300 ml of water). In order to check whether the concentration of the nanoparticles affects the viscoelastic properties of the obtained fiber sheets, the amount of silver colloid used in the modification procedure was varied to 15 ml and 30 ml (or 5 and 10 ml of colloid per gram of fibers).
2.1.4 Preparation of the fiber sheets
Hand-sheets of as received (untreated) and modified pulps were made with a basis weight of 100 g⋅m-2 by using HAAGE D-4330 Systems laboratory sheet former according to DIN EN ISO 5269-2. After drying, all the samples were conditioned at 50% relative humidity and a temperature of 23 °C.
2.2 Characterization
2.2.1 Scanning electron microscopy (SEM)
Scanning electron microscopy of untreated and silver nanoparticle modified fibers was carried out using a JEOL JSM-6610LV instrument at an accelerating voltage of 30 kV. Prior to observation, the samples were covered with a thin layer of silver.
2.2.2 UV-VIS absorption spectroscopy
The UV–VIS absorption measurements of Ag-colloid solution as well as the water suspensions of Ag-modified pine, linter or recycled cellulose fibers were carried out on a Thermo Evolution 600 spectrophotometer.
2.2.3 Tensile tests
Tensile tests of unmodified (P-Ag-0, L-Ag-0 and R-Ag-0) and Ag nanoparticle modified (P Ag 10, L-Ag-10 and R-Ag-10) cellulose shits were performed on a FRANK type Tensile Tester machine according to EN ISO 1924-2 standard. The cross head speed was 20 mm ⋅ min-1 and the distance between the clamps was 180 mm. The samples were rectangular in shape with a size width of 15 mm and an approximate thickness of ~ 0.7 mm.
2.2.4 Dynamic mechanical analysis (DMA)
Dynamic mechanical analyses of the fiber sheets were carried out in tensile mode in the temperature range from -120 to 20 °C on a Perkin Elmer Diamond DMA with a 10 μm strain amplitude and a 50 mN initial force amplitude. The measuring frequency was 100 Hz and the heating rate was 2 °C ⋅ min-1. The specimens were in a rectangular shape (20 mm × 10 mm), with an approximate thickness of ~ 0.7 mm. The distance between the clamps was 10 mm.
2.2.5 Inductively coupled plasma-atomic spectrometry
The atomic spectrometry (ICP-OES method) was used to determine the amount of silver nanoparticles in the cellulose sheets. In order to find the silver content in the cellulose sheets, the
Science for Sustainability University of West Hungary International Scientific Conference for PhD Students March 19-20, 2013 – Győr
90
digestion of the samples was performed on an Advanced Microwave Digestion System (ETHOS 1, Milestone, Italy) using HPR-1000/10S high pressure segmented rotor. The temperature was controlled with a predetermined power program. Temperature was typically raised to 200 °C in the first 15 min, kept constant at peak temperature of 200 °C in the next 15 min, and then cooled down rapidly. The weight percentage of silver was stated in the Table 1 (last column).
2.3 Microorganisms and antimicrobial activity
2.3.1 Microorganisms and culture conditions
The antimicrobial activity tests were carried out using common pathogens as indicator strains: gram-negative bacteria Escherichia coli ATCC 25923, gram-positive bacteria Staphylococcus aureus ATCC 25922 and yeast Candida albicans ATCC 24433. The initial numbers of S. aureus, E. coli and C. albicans in the testing medium were 3.52⋅105 CFU⋅ml-1, 3.74⋅105 CFU⋅ml-1, and 8.12⋅105 CFU⋅ml-1, respectively.
2.3.2 Antimicrobial activity testing
The percentage of bacterial reduction (R, %) was calculated by following equation:
1000
0 ×−
=C
CCR , (1)
where C0 (CFU – colony forming units) is the number of bacterial colonies from the control saline and C (CFU) is the number of bacterial colonies from samples.
3. CONCLUSIONS
The present study shows the mechanical and viscoelastic properties of cellulose sheets which can be significantly improved through modification of the cellulose fibers with low concentrations (~0.1 wt. %) of silver nanoparticles. The sheets made of pine, linter and recycled modified fibers exhibited higher tensile indices (strengths) compared to their unmodified counterparts (Fig. 1). It was demonstrated for the first time that dynamical mechanical thermal analysis (DMTA) at 100 Hz can be successfully used for studying the changes in the viscoelastic properties of the sheets
Figure 1. Tensile index of the cellulose sheets obtained from untreated and silver nanoparticle
modified linter, pine and recycled fibers.

Science for Sustainability University of West Hungary International Scientific Conference for PhD Students March 19-20, 2013 – Győr
91
induced by silver nanoparticle modification. The sheets that contained silver showed higher storage moduli and lower loss tangent (tan δ) values over the whole temperature range of the measurement (from -120 to 20 °C) (Fig. 2). The obtained results were discussed in terms of effects of the nanoparticles on the inter-fiber bonding in the cellulose web. We believe that the present approach can also be applied in studying the influence of other factors such as density, bonding agents, length of the fibers etc. on the viscoelastic properties of paper.
The pine, linter and recycled sheets made of silver nanoparticle modified fibers showed strong activity against gram-negative bacteria (E. coli), gram-positive bacteria (S. aureus) and pathogen fungus (C. albicans). The antimicrobial activity increased with increasing silver concentration, while the pine sheets were the most effective with more than 99% reduction of all three pathogens after one hour of exposure.
The strong antimicrobial activity makes these sheets promising materials for food packing i.e. the prevention of contamination as well as food preservation. Also, the fact that the preparation with modified cellulose fibers had a positive effect on the mechanical and viscoelastic properties of the sheets could be a great advantage during the paper making process.
Table 1. Viable cells reduction activity of silver-cellulose fiber sheets on E. coli, S. aureus and C. albicans after 1 h of exposure.
S. aureus E. coli C. albicans Sample Ag release after 1h [μg/ml] CFU/ml R [%] CFU/ml R [%] CFU/ml R [%]
P-Ag-0 -- 2.90 105 -- 3.36 105 -- 8.50 105 --- P-Ag-5 0.36 7.10 103 97.55 6.00 103 98.21 --- 100
P-Ag-10 0.42 1.56 103 99.46 1.00 103 99.7 --- 100 L-Ag-0 -- 1.90 105 -- 4.96 105 -- 5.10 105 --- L-Ag-5 0.31 6.90 103 96.37 1.10 104 97.78 3.60 103 99.29
L-Ag-10 0.34 4.60 103 97.58 9.30 103 98.13 2.40 103 99.53 R-Ag-0 -- 1.90 105 -- 1.25 105 -- 6.00 104 --- R-Ag-5 0.27 1.60 104 91.58 8.00 103 93.60 1.50 103 97.5
R-Ag-10 0.30 1.10 104 94.21 5.00 103 96.00 1.13 103 98.12 Acknowledgments. This work was supported in part by the Ministry of Education and Science, Republic of Serbia (Project Nos. 172056 and 45020) and TAMOP 4.2.1.B-09/1/KONV-2010-0006 Intellectual, Organizational and R+D Infrastructural Development of University of West Hungary. Also, this research – as a part of the Development of Student Talent Fostering at WHU, TAMOP 4.2.2. B–10/1-2010 project – was sponsored by the EU/European Social Foundation. The financial supports are gratefully acknowledged. References ALFTHAN, J. (2004): The Effect of Humidity Cycle Amplitude on Accelerated Tensile Creep of Paper.
Mechanics of Time-Dependent Materials, 8, 289–302. ALFTHAN, J. (2010): Experimental study of non-linear stress relaxation and creep of paper materials and the
relation between the two types of experiments. Nordic Pulp and Paper Research Journal, 25, 351-7. ASHARANI, P. V. – MUN, G. L. K. – HANDE, M. P. – VALIYAVEETTIL, S. (2009): Cytotoxicity and genotoxicity of
silver nanoparticles in human cells. ACS Nano, 3, 279-90. BANERJEE, M. – MALLICK, S. – PAUL, A. – CHATTOPADHYAY, A. – GHOSH, S. S. (2010): Heightened reactive oxygen
species generation in the antimicrobial activity of a three component iodinated chitosan−silver nanoparticle composite. Langmuir, 26, 5901-8.
CAI, J. – KIMURA, S. – WADA, M. – KUGA, S. (2009): Nanoporous cellulose as metal nanoparticles support. Biomacromolecules, 10, 87–94.
CHALOUPKA, K. – MALAM, Y. – SEIFALIAN, A. M. (2010): Nanosilver as a new generation of nanoproduct in biomedical applications. Trends in Biotechnology, 28, 580-8.
CONSIDINE, J. M. – SCOTT, C. T. – GLEISNER, R. – ZHU, J. Y. (2005): Use of digital image correlation to study the local deformation field of paper and paperboard, 13th Fundamental Research Symposium, Cambridge, September, p. 613-30.
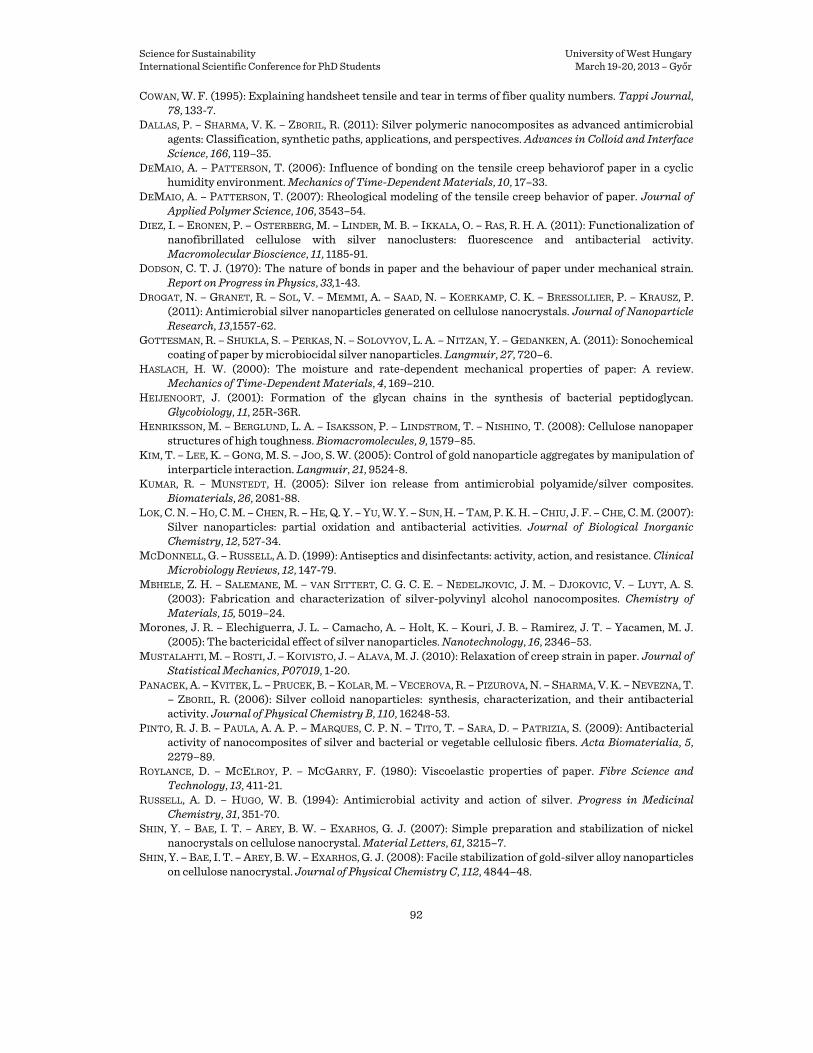
Science for Sustainability University of West Hungary International Scientific Conference for PhD Students March 19-20, 2013 – Győr
92
COWAN, W. F. (1995): Explaining handsheet tensile and tear in terms of fiber quality numbers. Tappi Journal, 78, 133-7.
DALLAS, P. – SHARMA, V. K. – ZBORIL, R. (2011): Silver polymeric nanocomposites as advanced antimicrobial agents: Classification, synthetic paths, applications, and perspectives. Advances in Colloid and Interface Science, 166, 119–35.
DEMAIO, A. – PATTERSON, T. (2006): Influence of bonding on the tensile creep behaviorof paper in a cyclic humidity environment. Mechanics of Time-Dependent Materials, 10, 17–33.
DEMAIO, A. – PATTERSON, T. (2007): Rheological modeling of the tensile creep behavior of paper. Journal of Applied Polymer Science, 106, 3543–54.
DIEZ, I. – ERONEN, P. – OSTERBERG, M. – LINDER, M. B. – IKKALA, O. – RAS, R. H. A. (2011): Functionalization of nanofibrillated cellulose with silver nanoclusters: fluorescence and antibacterial activity. Macromolecular Bioscience, 11, 1185-91.
DODSON, C. T. J. (1970): The nature of bonds in paper and the behaviour of paper under mechanical strain. Report on Progress in Physics, 33,1-43.
DROGAT, N. – GRANET, R. – SOL, V. – MEMMI, A. – SAAD, N. – KOERKAMP, C. K. – BRESSOLLIER, P. – KRAUSZ, P. (2011): Antimicrobial silver nanoparticles generated on cellulose nanocrystals. Journal of Nanoparticle Research, 13,1557-62.
GOTTESMAN, R. – SHUKLA, S. – PERKAS, N. – SOLOVYOV, L. A. – NITZAN, Y. – GEDANKEN, A. (2011): Sonochemical coating of paper by microbiocidal silver nanoparticles. Langmuir, 27, 720–6.
HASLACH, H. W. (2000): The moisture and rate-dependent mechanical properties of paper: A review. Mechanics of Time-Dependent Materials, 4, 169–210.
HEIJENOORT, J. (2001): Formation of the glycan chains in the synthesis of bacterial peptidoglycan. Glycobiology, 11, 25R-36R.
HENRIKSSON, M. – BERGLUND, L. A. – ISAKSSON, P. – LINDSTROM, T. – NISHINO, T. (2008): Cellulose nanopaper structures of high toughness. Biomacromolecules, 9, 1579–85.
KIM, T. – LEE, K. – GONG, M. S. – JOO, S. W. (2005): Control of gold nanoparticle aggregates by manipulation of interparticle interaction. Langmuir, 21, 9524-8.
KUMAR, R. – MUNSTEDT, H. (2005): Silver ion release from antimicrobial polyamide/silver composites. Biomaterials, 26, 2081-88.
LOK, C. N. – HO, C. M. – CHEN, R. – HE, Q. Y. – YU, W. Y. – SUN, H. – TAM, P. K. H. – CHIU, J. F. – CHE, C. M. (2007): Silver nanoparticles: partial oxidation and antibacterial activities. Journal of Biological Inorganic Chemistry, 12, 527-34.
MCDONNELL, G. – RUSSELL, A. D. (1999): Antiseptics and disinfectants: activity, action, and resistance. Clinical Microbiology Reviews, 12, 147-79.
MBHELE, Z. H. – SALEMANE, M. – VAN SITTERT, C. G. C. E. – NEDELJKOVIC, J. M. – DJOKOVIC, V. – LUYT, A. S. (2003): Fabrication and characterization of silver-polyvinyl alcohol nanocomposites. Chemistry of Materials, 15, 5019–24.
Morones, J. R. – Elechiguerra, J. L. – Camacho, A. – Holt, K. – Kouri, J. B. – Ramirez, J. T. – Yacamen, M. J. (2005): The bactericidal effect of silver nanoparticles. Nanotechnology, 16, 2346–53.
MUSTALAHTI, M. – ROSTI, J. – KOIVISTO, J. – ALAVA, M. J. (2010): Relaxation of creep strain in paper. Journal of Statistical Mechanics, P07019, 1-20.
PANACEK, A. – KVITEK, L. – PRUCEK, B. – KOLAR, M. – VECEROVA, R. – PIZUROVA, N. – SHARMA, V. K. – NEVEZNA, T. – ZBORIL, R. (2006): Silver colloid nanoparticles:� synthesis, characterization, and their antibacterial activity. Journal of Physical Chemistry B, 110, 16248-53.
PINTO, R. J. B. – PAULA, A. A. P. – MARQUES, C. P. N. – TITO, T. – SARA, D. – PATRIZIA, S. (2009): Antibacterial activity of nanocomposites of silver and bacterial or vegetable cellulosic fibers. Acta Biomaterialia, 5, 2279–89.
ROYLANCE, D. – MCELROY, P. – MCGARRY, F. (1980): Viscoelastic properties of paper. Fibre Science and Technology, 13, 411-21.
RUSSELL, A. D. – HUGO, W. B. (1994): Antimicrobial activity and action of silver. Progress in Medicinal Chemistry, 31, 351-70.
SHIN, Y. – BAE, I. T. – AREY, B. W. – EXARHOS, G. J. (2007): Simple preparation and stabilization of nickel nanocrystals on cellulose nanocrystal. Material Letters, 61, 3215–7.
SHIN, Y. – BAE, I. T. – AREY, B. W. – EXARHOS, G. J. (2008): Facile stabilization of gold-silver alloy nanoparticles on cellulose nanocrystal. Journal of Physical Chemistry C, 112, 4844–48.

Science for Sustainability University of West Hungary International Scientific Conference for PhD Students March 19-20, 2013 – Győr
93
SILVER, S. (2003): Bacterial silver resistance: molecular biology and uses and misuses of silver compounds. FEMS Microbiology Reviews, 27, 341-353.
SMETANA, A. – KLABUNDE, K. – MARCHIN, G. – SORENSEN, C. (2008): Biocidal activity of nanocrystalline silver powders and particles. Langmuir, 24, 7457-64.
Usage of Stains with Incorporated TiO2 and ZnO Nanoparticles in Finishing of Thermally Modified Wood
MIKLEČIĆ, Josipa4 – JIROUŠ-RAJKOVIĆ, Vlatkaa – ŠPANIĆ, Nikolaa a Faculty of Forestry, Universuty of Zagreb, Zagreb, Croatia
Abstract – The paper reports on research on the use of nanaoparticles titanium-dioxide (TiO2) and zinc-oxide (ZnO) as UV absorbers in polyacrylate water borne stain in the colour and gloss stabilisation, and appearance of cracks of thermally modified and unmodified beech wood. Unmodified and thermally modified beech wood at 190 °C and 212 °C coated with three types of coatings in which nanoparticles are added were exposed 840 h to UV radiation, water spray and humidity using QUV tester equipped with UVA-340 fluorescent lamps. Before and after 168, 336, 504, 672, and 840 hours of accelerated weathering changes in colour and gloss, and the appearance of surface cracks were measured on the samples. Colour change (ΔE*) was recorded on all tested wood samples after accelerated exposure. It has been established that the coating with TiO2 nanoparticles reduced colour changes of thermally modified beech wood. After accelerated exposure the gloss decreased in all samples regardless of the type of used coating.
Keywords: TiO2 / ZnO / beech wood / QUV / colour changes / gloss
1. INTRODUCTION
Due to improved properties such as dimensional stability and biological resistance, and because of dark colour resembling tropical wood, thermally modified wood is used in many exterior applications for decks, siding, garden furniture and fences. Unfortunately, it has been established that the dark colour of the modified wood formed by degradation reactions of wood components during thermal modification is not resistant to sunlight and the direct exposure to sunlight leads to bleaching (greying) of surface and creating surface cracks (JÄMSÄ et al. 2000). MILITZ (2002) established that the resistance of thermally modified wood against weathering (UV-light, wetting) is not changed largely when compared to untreated wood, making a surface treatment with coatings necessary.
Wood colour is very important feature for users and often decisive in the choice of materials. Besides the colour, colour stability is an important property of wood that can be defined as the resistance of material to change in colour that can be caused by light, especially ultraviolet (UV) light. If we want to maintain the original characteristics of natural wood, the most preferable method is to use clear coatings as protection. Unfortunately, transparent coatings perform badly on wood during interior or exterior exposure because these types of coatings cannot absorb UV light which cause photodegradation of wood. Undesirable consequences of the photodegradation can be substantially limited by using UV absorbers (ALOUI et al. 2006).
4 Corresponding author: [email protected]; HR-10000 Zagreb, Svetosimunska 25

Science for Sustainability University of West Hungary International Scientific Conference for PhD Students March 19-20, 2013 – Győr
94
Over the last decade there has been an increased interest in the use of inorganic UV absorbers incorporated as nanoparticles in clear wood coatings for photostabilization of wood surfaces. CRISTEA et al. (2010) established a high compatibility of TiO2 and ZnO nanoparticles with acrylic resin. FUFA et al. (2012) concluded that adding of TiO2 nanoparticles in stain improved colour stability and water vapour resistance of coated wood. The main reason for a large interest of nanotechnology in wood finishing coatings lies in the ability of this technology to improve mechanical properties (such as resistance to scratching, wear and tear) and colour stability of coating, while maintaining the transparency of the coatings. Due to their small size, nanoparticles reduce light dispersion considerably, helping to maintain coating transparency, and an appropriate mixture, size and shape of nanoparticles may also affect the coating porosity in the presence of water vapour. Inorganic UV absorbers are used for long-term protection of coating because they do not lose their performance during weathering by migration or destruction.
This paper presents research on the use of nanaoparticles TiO2 and ZnO as UV absorbers in polyacrylate water borne stain in the colour and gloss stabilisation, and appearance of cracks of thermally modified beech wood.
2. MATERIAL AND METHODS
Unmodified (mark U) and thermally modified beech wood (Fagus sylvatica L.) at 190°C and (mark L) at 212°C (mark D) was used in this study. Wood samples were thermally modified with water, steam, and high temperature using the Thermo Wood process (www.thermowood.fi). Selected samples were radial texture, free from defects and even colour, conditioned at (23 ± 2)°C and (50 ± 5)% relative humidity (rh) for four weeks. The dimensions of the samples were 150 mm × 70 mm × 18 mm (axial × radial × tangential).
There were four groups of wood samples: 1. uncoated samples, 2. samples coated with transparent polyacrylate water borne stain without UV absorbers, 3. samples coated with transparent polyacrylate water borne stain with 0.5% of TiO2 nanoparticles, and 4. samples coated with transparent polyacrylate water borne stain with 2% of ZnO nanoparticles. Nanoparticles were added in stain as water dispersions. Stains were applied manually by brush in two layers in the amount of 70 g/m2 per layer, and the drying time between layers was 24 hours.
Coatings were prepared by adding water dispersion of TiO2 (rutil mixture) and ZnO nanoparticles in the stain in mass ration, which was followed by shaking the stain for 30 min, and then mixing the stain with a homogenizer at 1250 r/min for 20 min. The amount of water dispersion added into the coating depended on the content of nanoparticles in dispersion in order to obtain the desired concentration of nanoparticles in the stain. TiO2 nanoparticles were added in smaller concentration than ZnO nanoparticles because TiO2 nanoparticles have higher influence on the coating transparency.
Two samples of each type of surface treatment were exposed 840 hours (5 cycles) to UV-light in QUV lightfastness tester (Q-Panel Company) equipped with UVA-340 fluorescent lamps. The parameters of the cycle of accelerated weathering were as follows: total duration of one cycle 168 h (1 week), 15 min spraying water 6-7 L/min with no light and no temperature control, 3 h 45 min condensation at (45 ± 3) °C, 8 h UV lamps at (60 ± 3)°C and 0.77 W/m2/nm radiation
Before and after 168, 336, 504, 672, and 840 hours of accelerated weathering changes in colour and gloss, and the appearance of surface cracks were measured on the samples. The measurement of colour change was made with a portable spectrophotometer Microflash 100d produced by Datacolor (d/8° measuring geometry, 10° standard observer, D65 standard illuminate, xenon flash lamp source) always on the same eight marked locations on sample. The overall colour change (ΔE*) was calculated using the CIE L* a* b* colour system, where L * describes the lightness, a* and b* describe the chromatic coordinates on the red-green and yellow-blue axis. ΔE*

Science for Sustainability University of West Hungary International Scientific Conference for PhD Students March 19-20, 2013 – Győr
95
is the colour difference between the initial colour of the sample and the colour of the sample after exposure and it was calculated as follows:
ΔE* = [(ΔL*)2+(Δa*)2+(Δb*)2]1/2 where ΔL*, Δa*, and Δb* are the colour coordinate change. The measurement of gloss was made with a portable glossmeter KHJ with 60° measuring geometry on the three locations on sample. The surface of samples was visually checked for any cracking visible to the naked eye or visible under microscope magnification of 10 times, and was assessed using a scale from 0-5 (0-no cracks, 5-greatest cracks).
3. RESULTS AND DISCUSSION
Colour changes (ΔE*) of wood samples during accelerated weathering in QUV are presented in Figure 1.
It can be seen that all samples changed colour after first 168 h of exposure. During the exposure it can be seen a different trend in colour change of uncoated and coated unmodified wood samples (UMW), and thermally modified wood samples (TMW). Unmodified wood samples had at the beginning of exposure higher colour change than at the end of exposure (Figure 1a), while TMW had at the end of exposure higher colour change than at the beginning of exposure (Figure 1b, and c). This could be explained by intensive darkening of lighter unmodified wood at the beginning of weathering, and gradually lightening of darker thermally modified wood during weathering. Stain with TiO2 nanoparticles stabilised colour of UMW, and reduced colour change of TMW during accelerate weathering what is in agreement with the research of CRISTEA et al. (2012). Polyacrylate stain with ZnO nanoparticles stabilised colour of UMW until 504 h of exposure, when the colour changes decreased. This decreasing does not present improving colour stability because of bleaching of surface. The surface bleaching can be result of formation hydrogen peroxide when ZnO nanoparticles react with water adhered to the surface of ZnO under UV radiation (LIN et al. 2005). On TMW at 190 °C polyacrylate stain with ZnO nanoparticles reduced colour changes until 504 h when it started to increase. On TMW at 212 °C coated with polyacrylate stain with ZnO nanoparticles colour changes was similar as on TMW coated with polyacrylate stain without nanoparticles until 672 h of exposure, when TMW at 212 °C coated with polyacrylate stain with ZnO nanoparticles exhibited higher colour changes. This increasing could be due to increasing of degree of cracking (ALOUI at al. 2007), which can be seen in Table 1.
On TMW the smallest colour changes after 840 h weathering were reported for polyacrylate stain with TiO2 nanoparticles. The highest colour changes on TMW at 190 °C were reported for polyacrylate stain with ZnO nanoparticles, and on TMW at 212 °C for uncoated samples. The better colour stability of samples coated with polyacrylate stain with TiO2 nanoparticles can be due to reducing of surface bleaching, what is more noticeable on darker wood samples.
Figure 2 shows gloss values of UMW and TMW during accelerated weathering. It can be seen that surface treatment with all stains enhanced gloss of wood. The highest gloss values (50 GU) before weathering were measured on coated TMW at 212 °C (Figure 2c) because of dark colour and homogeneous surface of samples. The content of 0.5% TiO2 and 2% ZnO had no influence on gloss of wood samples coated with polyacrylate water borne stain, which is in accordance with the research of AUCLAIR et al. (2011). In Figure 2c can be also seen a rapidly decreasing in gloss at first 168 h of weathering of coated TMW at 212 °C, which could be in correlation with increasing in lightening. After 168 h the gloss values of coated TMW at 212 °C gradually decreased and that decreasing was similar to coated UMW and TMW at 190 °C. The trend of gloss was similar for stains with and without nanoparticals, which indicates that nanoparticles did not improve gloss stability of coated UMW and TMW during accelerated weathering.

Science for Sustainability University of West Hungary International Scientific Conference for PhD Students March 19-20, 2013 – Győr
96
Figure 1 Colour changes of unmodified samples (a), thermally modified samples at 190 °C (b) and thermally
modified samples at 212 °C (c) during accelerated weathering
In Table 1 can be seen that cracks appeared on uncoated samples after first 168 h accelerated weathering. Furthermore higher degree of cracking during weathering can be observed on TMW compared to UMW. The reason for this is decreasing of mechanical properties and increasing of brittleness of wood after thermal modification (JÄMSÄ – VIITANIEMI 2001). Polyacrylate stain decreased degree of cracking on all samples, and this is the most prominent on TMW at 212 °C. The degree of cracking of samples did not differ on TMW at 190 °C coated with polyacrylate stain with and without TiO2 and ZnO nanoparticles. On TMW at 212 °C can be seen that on samples coated with polyacrylate stain with TiO2 nanoparticles cracks appear earlier then on samples coated with stain without TiO2 nanoparticles. This is in agreement with research of Nakayama and Hayashi (2007), who established that embedded TiO2 nanparticles decompose the structure of polymer. After 504 h there is no difference in degree of cracking between stains without and with TiO2 nanoparticles. Adding nanoparticles ZnO increased degree of cracking of polyacrylate stain for one mark on TMW at 212 °C. On UMW investigated nanoparticles reduced degree of cracking of polyacrylate stain for one mark, but cracks appear earlier.
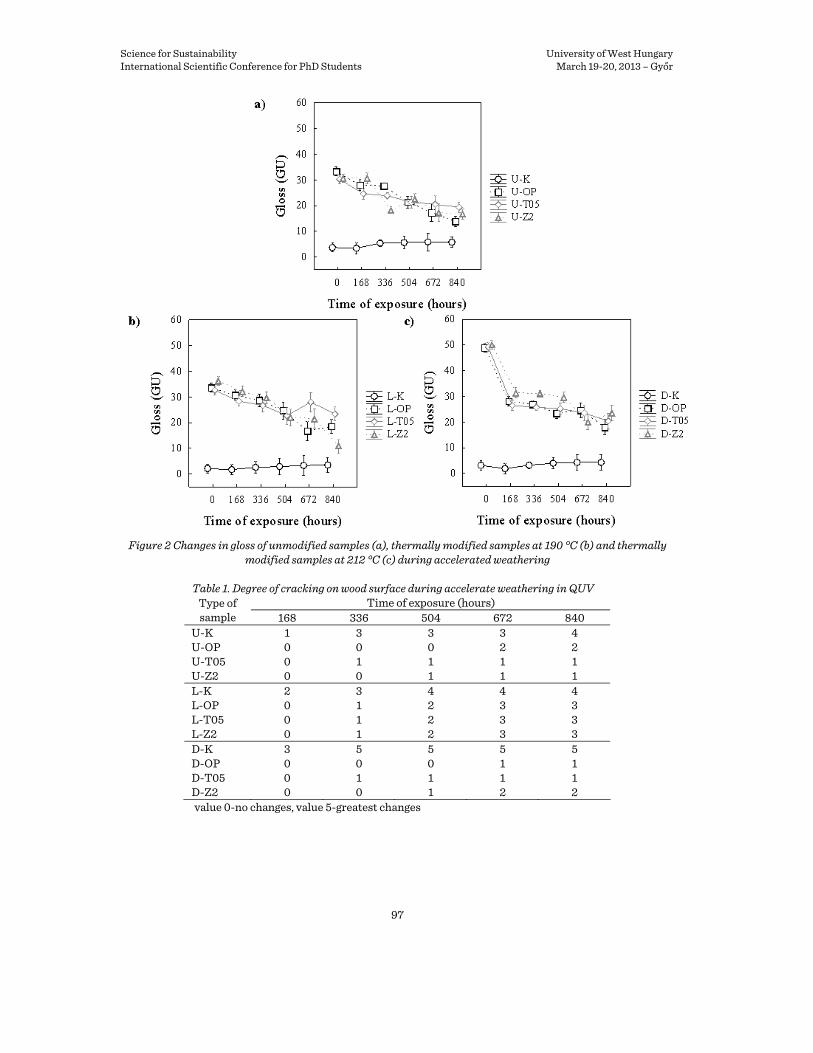
Science for Sustainability University of West Hungary International Scientific Conference for PhD Students March 19-20, 2013 – Győr
97
Figure 2 Changes in gloss of unmodified samples (a), thermally modified samples at 190 °C (b) and thermally
modified samples at 212 °C (c) during accelerated weathering
Table 1. Degree of cracking on wood surface during accelerate weathering in QUV Time of exposure (hours) Type of
sample 168 336 504 672 840 U-K 1 3 3 3 4 U-OP 0 0 0 2 2 U-T05 0 1 1 1 1 U-Z2 0 0 1 1 1 L-K 2 3 4 4 4 L-OP 0 1 2 3 3 L-T05 0 1 2 3 3 L-Z2 0 1 2 3 3 D-K 3 5 5 5 5 D-OP 0 0 0 1 1 D-T05 0 1 1 1 1 D-Z2 0 0 1 2 2 value 0-no changes, value 5-greatest changes

Science for Sustainability University of West Hungary International Scientific Conference for PhD Students March 19-20, 2013 – Győr
98
4. CONCLUSION
Colour changes (ΔE*) on thermally modified wood samples are smaller at the beginning of accelerated weathering compare to unmodified samples, and on thermally modified wood samples colour changes increase gradually during weathering.
Nanoparticles TiO2 added in polyacrylate water borne stain increase colour stability of thermally modified wood samples, while there is no notable difference in colour changes between thermally modified wood samples coated with polyacrylate stains without nanoparticles and with nanoparticles ZnO.
Coating the wood samples with polyacrylate water borne stain highly increases their gloss, which is most noticeable on samples thermally modified at higher temperature (212 °C). Gloss values of coated samples during the weathering are gradually decreased, and there is no significant deference between samples coated with polyacrylate stains with and without nanoparticles.
With increasing the temperature of modification higher degree of cracking during accelerated weathering can be observed. Coating the wood samples with polyacrylate water borne stain decreases the degree of cracking. References ALOUI, F. – AHAJJI, A. – IRMOULI, Y. – GEORGE, B. – CHARRIER, B. – MERLIN, A. (2006):
Photostabilisation of the “wood-clearcoatings” systems with UV absorbers: correlation with their effect on the glass transition temperature. Journal of Physics: Conference Series 40: 118-123.
ALOUI, F. – AHAJJI, A. – IRMOULI, Y. – GEORGE, B. – CHARRIER, B. – MERLIN, A. (2007): Inorganic UV absorbers for the photostabilisation of wood-clearcoating systems: Comparison with organic UV absorbers. Applied Surface Science 253 (8): 3737-3745.
AUCLAIR, N. – RIEDL, B. – BLANCHARD, V. – BLANCHET, P. (2011): Improvement of photoprotection of wood coatings by using inorganic nanoparticles as ultraviolet absorbers. Forest Products Journal 61(1): 20-27.
CRISTEA, M. V. – RIEDL, B. – BLANCHET, P. (2010): Enhancing the performance of exterior waterborne coatings for wood by inorganic nanosized UV absorbers. Progress in Organic Coatings 69 (4): 432-441.
CRISTEA, M. V. – RIEDL, B. – BLANCHET, P. – JIMENEZ-PIQUE, E. (2012): Nanocharacterization techniques for investigation the durability of wood coatings. Macromolecular Nanotechnology 48 (3): 441-453.
FUFA, S. M. – JELLE, B. P. – HOVDE, P. J. – RORVIK, P. M. (2012): Coated wooden claddings and the influence of nanoparticles on the weathering performance. Progress in Organic Coatings 75 (1-2): 72-78.
JÄMSÄ, S. – AHOLA, P. – VIITANIEMI, P. (2000): Long-term natural weathering of coated ThermoWood. Pigment and Resin Technology 29 (2): 68-74.
JÄMSÄ, S. – VIITANIEMI, P. (2001): Heat treatment of wood – better durability without chemicals. In: Proceedings of the special seminar on heat treatments “Review on heat treatments of wood”. Luxembourg. February 2001.9.
LIN, H-F. – LIAO, S-C. – HUNG, S-W. (2005): The ds thermal plasma synthesis of ZnO nanoparticles for visible-light photocatalyst. Journal of Photochemistry and Photobiology A: Chemistry 174 (1): 82-87.
MILITZ, H. (2002): Heat treatment technologies in Europe: Scientific background and technological state-of –art. In: Proceedings of conference on “Enhancing the durability of lumber and engineered wood products”. United States. February 2002.11-13.
NAKAYAMA, N. – HAYASHI, T. (2007): Preparation and characterization of poly(L-latic acid)/TiO2 nanoparticle nanocomposite films with high transparency and efficient photodegradability. Polymer Degradation and Stability 97 (7) : 1255-1264.

Science for Sustainability University of West Hungary International Scientific Conference for PhD Students March 19-20, 2013 – Győr
99
Possibilities of Bio Matrices Synthesis from Waste MDF Boards
ŠPANIĆ, Nikolaa5 − JAMBREKOVIĆ, Vladimira − KLARIĆ, Miljenkoa − MIKLEČIĆ, Josipa a Wood Technology Department, Faculty of Forestry, University of Zagreb, Zagreb, Croatia
Abstract − This paper reports on research of possibilities for composite materials bio matrices synthesis from MDF boards withdrawn from usage. Bio matrices were cast produced using re-defibrated wood fibres as raw material for cellulose polymorphs isolation and acetylation. As acetylation reaction time and temperature directly influence cellulose acetate yield, apparent acetyl content and its degree of substitution, three different time spans and two different temperatures of acetylation process were examined. Transfer from cellulose to cellulose acetate was determined using FTIR spectroscopy and cellulose acetate yield was determined quantitatively. The degree of substitution was calculated based on results of apparent acetyl content determined according to ASTM D817-96 standard. Results of FTIR analysis confirmed cellulose transformation to cellulose acetate, and that cellulose acetate yield and degree of substitution change almost proportionally with extension of reaction time and temperature. Therefore results of this research should contribute to further understanding of the specific problems regarding bio matrices synthesis.
Keywords: bio matrices / MDF boards / acetylation / time / temperature / FTIR
1. INTRODUCTION
Due to increasing quantities of waste materials and limited fossil fuels reserves, scientific efforts are focused on research and development of new ecologically friendly composite materials, that is bio composite materials. Bio composite materials are sustainable ecologically acceptable bio-based products derived from renewable sources capable of recycling (MOHANTY et al. 2002). One type of such composite material is that in which wood is used as raw material for bio matrices synthesis as well as for filler and reinforcement. As term bio matrix denotes polymer part of bio composite material, wood and/or particular wood constituent must be chemically changed in such way that they allow the synthesis of bio polymer. For instance, cellulose acetate (CA) is typical and well-known example of wood derived bio polymer.
Cellulose acetate is wood derived product that finds its application in many fields, such as for cigarettes filters, textile fibre, as substrate for motion picture camera film, as an ingredient in sheet and moulded objects and as an additive in surface coatings and inks (CHENG et al. 2010). In typical CA is made by acetylation reaction from high purity wood pulp. Common industrial process of cellulose acetylation includes treatment of wood pulp with mixture of acetic anhydride (300 parts), sulphuric acid (1 part) as reaction catalyst and methylene chloride (400 parts) as triacetate solvent. Thus prepared reaction mixture is then heated to 25-35 °C and mixed through 7 hours. Partial hydrolysis is then achieved through addition of 50 % acetic acid which removes sulphuric and access acetic groups. After about 72 hours of reaction at ambient temperature proper hydrolysis degree is achieved and catalyst access is neutralised by addition of sodium acetate. To lower the acetylation cost methylene chloride can also be distilled (ANDRIČIĆ 2009). Still, the usage of chlorine based solvents, due to the presence of halogenic Cl is not supported, so in later technologies methylene chloride is regularly replaced with other types of less harmful solvents (e.g. alcohols).
In opposite to commercial acetylation process which includes the acetylation of relatively expensive high purity wood pulp, experimental work have been done on using substitute
5 (Corresponding author: [email protected]; HR-10 002, Zagreb, Svetošimunska cesta 25, p.o. Box 422.)
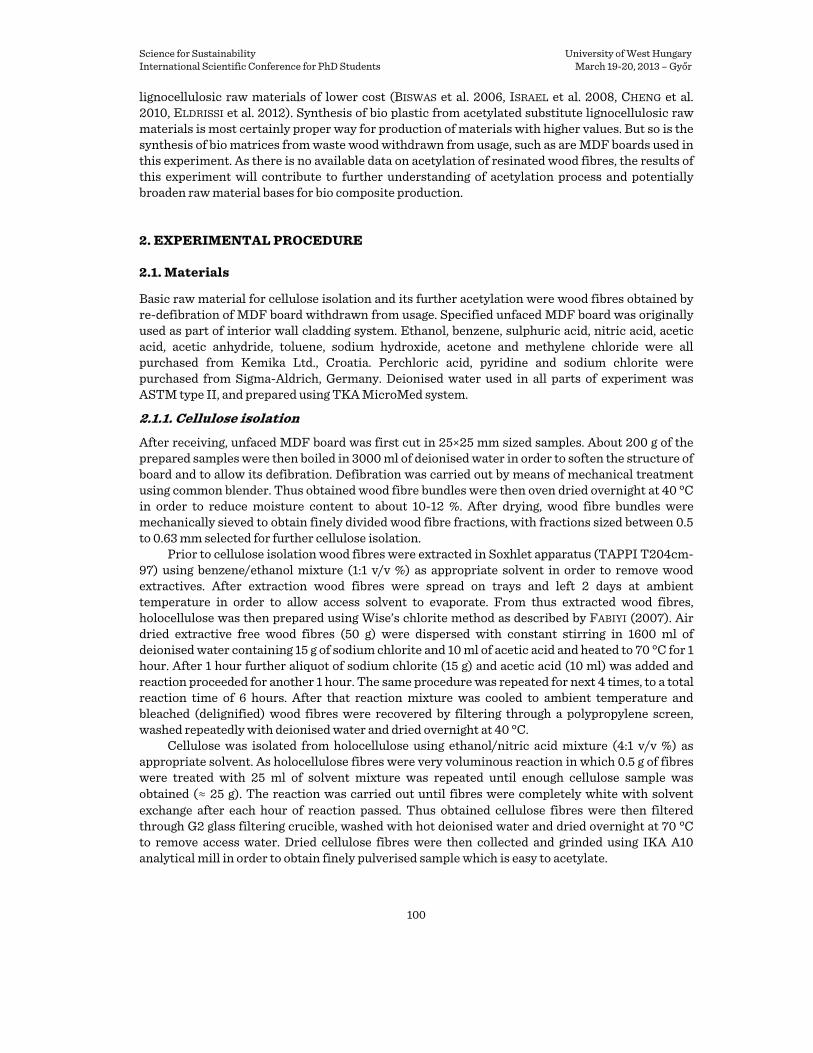
Science for Sustainability University of West Hungary International Scientific Conference for PhD Students March 19-20, 2013 – Győr
100
lignocellulosic raw materials of lower cost (BISWAS et al. 2006, ISRAEL et al. 2008, CHENG et al. 2010, ELDRISSI et al. 2012). Synthesis of bio plastic from acetylated substitute lignocellulosic raw materials is most certainly proper way for production of materials with higher values. But so is the synthesis of bio matrices from waste wood withdrawn from usage, such as are MDF boards used in this experiment. As there is no available data on acetylation of resinated wood fibres, the results of this experiment will contribute to further understanding of acetylation process and potentially broaden raw material bases for bio composite production.
2. EXPERIMENTAL PROCEDURE
2.1. Materials
Basic raw material for cellulose isolation and its further acetylation were wood fibres obtained by re-defibration of MDF board withdrawn from usage. Specified unfaced MDF board was originally used as part of interior wall cladding system. Ethanol, benzene, sulphuric acid, nitric acid, acetic acid, acetic anhydride, toluene, sodium hydroxide, acetone and methylene chloride were all purchased from Kemika Ltd., Croatia. Perchloric acid, pyridine and sodium chlorite were purchased from Sigma-Aldrich, Germany. Deionised water used in all parts of experiment was ASTM type II, and prepared using TKA MicroMed system.
2.1.1. Cellulose isolation
After receiving, unfaced MDF board was first cut in 25×25 mm sized samples. About 200 g of the prepared samples were then boiled in 3000 ml of deionised water in order to soften the structure of board and to allow its defibration. Defibration was carried out by means of mechanical treatment using common blender. Thus obtained wood fibre bundles were then oven dried overnight at 40 °C in order to reduce moisture content to about 10-12 %. After drying, wood fibre bundles were mechanically sieved to obtain finely divided wood fibre fractions, with fractions sized between 0.5 to 0.63 mm selected for further cellulose isolation.
Prior to cellulose isolation wood fibres were extracted in Soxhlet apparatus (TAPPI T204cm-97) using benzene/ethanol mixture (1:1 v/v %) as appropriate solvent in order to remove wood extractives. After extraction wood fibres were spread on trays and left 2 days at ambient temperature in order to allow access solvent to evaporate. From thus extracted wood fibres, holocellulose was then prepared using Wise’s chlorite method as described by FABIYI (2007). Air dried extractive free wood fibres (50 g) were dispersed with constant stirring in 1600 ml of deionised water containing 15 g of sodium chlorite and 10 ml of acetic acid and heated to 70 °C for 1 hour. After 1 hour further aliquot of sodium chlorite (15 g) and acetic acid (10 ml) was added and reaction proceeded for another 1 hour. The same procedure was repeated for next 4 times, to a total reaction time of 6 hours. After that reaction mixture was cooled to ambient temperature and bleached (delignified) wood fibres were recovered by filtering through a polypropylene screen, washed repeatedly with deionised water and dried overnight at 40 °C.
Cellulose was isolated from holocellulose using ethanol/nitric acid mixture (4:1 v/v %) as appropriate solvent. As holocellulose fibres were very voluminous reaction in which 0.5 g of fibres were treated with 25 ml of solvent mixture was repeated until enough cellulose sample was obtained (≈ 25 g). The reaction was carried out until fibres were completely white with solvent exchange after each hour of reaction passed. Thus obtained cellulose fibres were then filtered through G2 glass filtering crucible, washed with hot deionised water and dried overnight at 70 °C to remove access water. Dried cellulose fibres were then collected and grinded using IKA A10 analytical mill in order to obtain finely pulverised sample which is easy to acetylate.
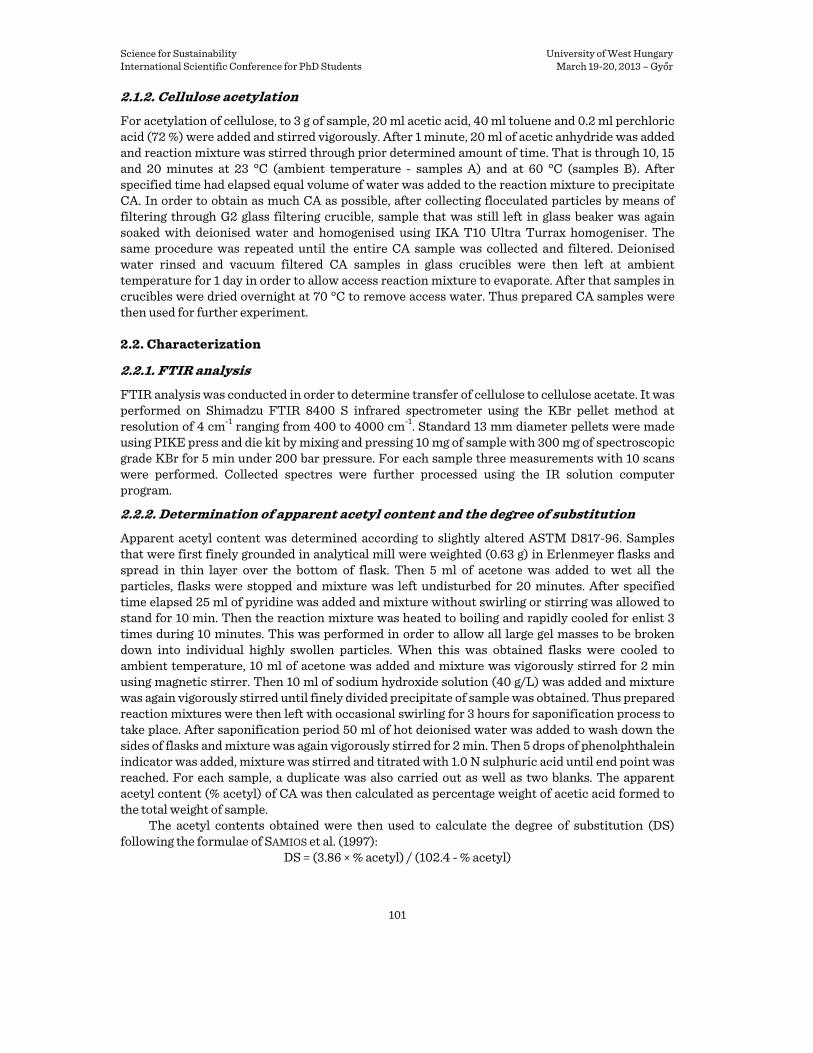
Science for Sustainability University of West Hungary International Scientific Conference for PhD Students March 19-20, 2013 – Győr
101
2.1.2. Cellulose acetylation
For acetylation of cellulose, to 3 g of sample, 20 ml acetic acid, 40 ml toluene and 0.2 ml perchloric acid (72 %) were added and stirred vigorously. After 1 minute, 20 ml of acetic anhydride was added and reaction mixture was stirred through prior determined amount of time. That is through 10, 15 and 20 minutes at 23 °C (ambient temperature - samples A) and at 60 °C (samples B). After specified time had elapsed equal volume of water was added to the reaction mixture to precipitate CA. In order to obtain as much CA as possible, after collecting flocculated particles by means of filtering through G2 glass filtering crucible, sample that was still left in glass beaker was again soaked with deionised water and homogenised using IKA T10 Ultra Turrax homogeniser. The same procedure was repeated until the entire CA sample was collected and filtered. Deionised water rinsed and vacuum filtered CA samples in glass crucibles were then left at ambient temperature for 1 day in order to allow access reaction mixture to evaporate. After that samples in crucibles were dried overnight at 70 °C to remove access water. Thus prepared CA samples were then used for further experiment.
2.2. Characterization
2.2.1. FTIR analysis
FTIR analysis was conducted in order to determine transfer of cellulose to cellulose acetate. It was performed on Shimadzu FTIR 8400 S infrared spectrometer using the KBr pellet method at resolution of 4 cm-1 ranging from 400 to 4000 cm-1. Standard 13 mm diameter pellets were made using PIKE press and die kit by mixing and pressing 10 mg of sample with 300 mg of spectroscopic grade KBr for 5 min under 200 bar pressure. For each sample three measurements with 10 scans were performed. Collected spectres were further processed using the IR solution computer program.
2.2.2. Determination of apparent acetyl content and the degree of substitution
Apparent acetyl content was determined according to slightly altered ASTM D817-96. Samples that were first finely grounded in analytical mill were weighted (0.63 g) in Erlenmeyer flasks and spread in thin layer over the bottom of flask. Then 5 ml of acetone was added to wet all the particles, flasks were stopped and mixture was left undisturbed for 20 minutes. After specified time elapsed 25 ml of pyridine was added and mixture without swirling or stirring was allowed to stand for 10 min. Then the reaction mixture was heated to boiling and rapidly cooled for enlist 3 times during 10 minutes. This was performed in order to allow all large gel masses to be broken down into individual highly swollen particles. When this was obtained flasks were cooled to ambient temperature, 10 ml of acetone was added and mixture was vigorously stirred for 2 min using magnetic stirrer. Then 10 ml of sodium hydroxide solution (40 g/L) was added and mixture was again vigorously stirred until finely divided precipitate of sample was obtained. Thus prepared reaction mixtures were then left with occasional swirling for 3 hours for saponification process to take place. After saponification period 50 ml of hot deionised water was added to wash down the sides of flasks and mixture was again vigorously stirred for 2 min. Then 5 drops of phenolphthalein indicator was added, mixture was stirred and titrated with 1.0 N sulphuric acid until end point was reached. For each sample, a duplicate was also carried out as well as two blanks. The apparent acetyl content (% acetyl) of CA was then calculated as percentage weight of acetic acid formed to the total weight of sample.
The acetyl contents obtained were then used to calculate the degree of substitution (DS) following the formulae of SAMIOS et al. (1997):
DS = (3.86 × % acetyl) / (102.4 - % acetyl)
Science for Sustainability University of West Hungary International Scientific Conference for PhD Students March 19-20, 2013 – Győr
102
2.2.3. Cellulose acetate yield
Cellulose acetate yield was determined as percentage calculated on difference between total weight of sample used for dissolution and weight of cast produced bio matrix. Thus on every 0.63 g of CA sample 25 ml of methylene chloride was added and reaction mixture was vigorously stirred using magnetic stirrer for 20 minutes. After that partially dissolved samples were filtered using G1 glass filter crucible into 50 mm diameter glass Petri dishes. Petri dishes were then left for 6 hours undisturbed on ambient temperature in order to allow solvent to evaporate. After evaporation formed CA films were further dried for 4 hours at 70 °C and after cooling they were weighted. For each sample duplicate cast was also carried out.
3. RESULTS AND DISCUSSION
3.1. Results of FTIR analysis
FTIR analysis confirmed transformation of cellulose to CA (Figure 1), which can be observed through formation of peaks at 1750 cm-1, 1373 cm-1 and 1236 cm-1.
Strong intensity band at 1750 cm-1 is assigned to the stretching of the carbonyl group of CA (C=O bond), while those at 1373 cm-1 and 1236 cm-1 are assigned to C−H bonds in an –C−CH3 group and to –C−O stretching of acetyl group respectively. The absence of weak intensity bands at 1760-1840 cm-1 and 1700 cm-1 in case of CA prepared at 60 °C and their presence in case of CA prepared at 23 °C indicates the absence/presence of acetic acid and acetic anhydride. Almost unchanged intensity of bands at 902 cm-1 can be assigned to β-glucosidic linkages between sugar units of cellulose. It suggests that during acetylation, cellulose macromolecules did not degrade.
3.2. Results of cellulose acetylation
Results of cellulose acetylation that is determination of apparent acetyl content, the degree of substitution and cellulose acetate yield for CA samples prepared at 23 °C show that acetylation at such low temperatures results in very low values of all examined properties (Table 1). Stated is most noticeable regarding results of weight yield and DS which are almost unchanged with extension of reaction time.
Results of acetylation at 60 °C show much better results (Table 2) and examined properties changed almost proportional with extension of reaction time. Results of sample B-3 indicate that almost all of hydroxyls occurring in the less ordered amorphous region of cellulose were derivatized, which is characteristic of commercially produced CA.
Almost similar values of acetyl content and DS for A-1 and B-1 samples indicate that 10 minutes of reaction is insufficient time period for long cellulose chains to be cleaved by the reaction conditions, regardless of reaction temperature. Significant difference between acetyl contents of samples acetylated at 23 °C and 60 °C is in accordance with intensity changes in FTIR spectres (Figure 1). As for weight yield it is important to state that they would probably change if some other type of polar aprotic solvent such is tetrahydrofuran or dimethylformamide was used. Nonetheless weight yield of 51.65 % for B-3 sample is rather high for this type of acetylation, and it would most certainly change if some other type of acetylation was performed, such as iodine-catalyzed reaction. But if such reaction was to be conducted, DS of CA would most probably increase to values >3 which would then indicate that cellulose crystalline regions have been disrupted and that inter-chain hydrogen bonds have been reduced. Thus prepared CA would then be soluble in common solvents, and so appropriate for extrusion.
Science for Sustainability University of West Hungary International Scientific Conference for PhD Students March 19-20, 2013 – Győr
103
Figure 1. FTIR spectres of cellulose and cellulose acetates (samples A-2 and B-3)
Table 1. Parameters and results of acetylation at 23 °C
Sample Cellulose weight* (g)
Acetylation time (min)
Weight yield* (%)
Acetyl content* (%) DS*
A-1 0.63 10 15.96 23.39 1.14 A-2 0.63 15 13.52 24.51 1.21 A-3 0.63 20 14.65 23.46 1.14
* Results are presented as average for duplicate runs Table 2. Parameters and results of acetylation at 60 °C
Sample Cellulose weight* (g)
Acetylation time (min)
Weight yield* (%)
Acetyl content* (%) DS*
B-1 0.63 10 33.48 23.49 1.14 B-2 0.63 15 49.14 32.11 1.76 B-3 0.63 20 51.65 38.18 2.29
* Results are presented as average for duplicate runs
4. CONCLUSION
This work is only small piece of scientific efforts to broaden the aspects of used wood utilization as feedstock for chemical industry. It is noteworthy that acetylation was conducted successfully and that CA prepared at 60 °C in 20 minutes reaction has properties similar to commercial CA produced by acetylation of high purity wood pulp. Nonetheless, it is almost impossible to remove resin residues from MDF structure. Presence of resin is probably the reason why obtained cellulose acetate yields weren’t as high as expected. Therefore a method for complete removal of resin, even before extraction, should be investigated. Although results of acetylation conducted under such conventional conditions gave interesting results, iodine-catalysed reaction should be performed in order to compare properties of synthesised cellulose acetates, and to further investigate possibilities of producing bio matrices from waste MDF boards. References ANDRIČIĆ, B. (2009): Prirodni polimerni materijali [Natural polymeric materials]. Faculty of Chemistry and
Technology, University of Split, 19 p.

Science for Sustainability University of West Hungary International Scientific Conference for PhD Students March 19-20, 2013 – Győr
104
ASTM (2010): D817-96 – Standard Test Methods of Testing Cellulose Acetate Propionate and Cellulose Acetate Butyrate.
BISWAS, A. – SAHA, B.C. – LAWTON, J.W. – SHONGREN, R.L. – WILLETT, J.L. (2006): Process for obtaining cellulose from agricultural by-products. Carbohydrate Polymers 64: 134-137 p.
CHENG, H.N. – DOWD, M.K. – SELLING, G.W. – BISWAS, A. (2010): Synthesis of cellulose acetate from cotton byproducts. Carbohydrate Polymers 80: 449-452 p.
ELDRISSI, A. – EL BARKANY, S. – AMHAMDI, H. – MAAROUFI, A. – HAMMOUTI, B. (2012): New approach to predict the solubility of polymers. Application: Cellulose Acetate at various DS, prepared from Alfa “Stipa-tenassicima” of Eastern Morocco. Journal of Materials and Environmental Sciences 3(2): 270-285 p.
FABIYI, J.S. (2007): Chemistry of wood plastic composite weathering. Doctoral dissertation. University of Idaho, 133 p.
ISRAEL, A.U. – OBOT, I.B. – UMOREN, S.A. – MKPENIE, V. – ASUQUO, J.E. (2008): Production of cellulosic polymers from agricultural wastes. E-journal of Chemistry 5(1):81-85 p.
MOHANTY, A.K. – MISRA, M. – DRZAL, L.T. (2002): Sustainable Bio-Composites from Renewable Resources: Opportunities and Challenges in the Green Materials World. Journal of Polymers and the Environment 10(1/2): 19-26 p.
SAMIOS, E. – DART, R.K. – DAWKINS, J.W. (1997): Preparation, characterization and biodegradation studies on cellulose acetates. Polymer 38(12): 3045-3054.
TAPPI (1997): Test Method T204 cm-97 – Solvent Extractives of wood and pulp.

Science for Sustainability University of West Hungary International Scientific Conference for PhD Students March 19-20, 2013 – Győr
105
Pál Kitaibel Doctoral School of Environmental Sciences
Section 2.1 Application of Geoinformatics in Environment Sciences
From Organizing Geospatial Information to Organizing Information Geospatially
STROBL, Josef
University of Salzburg, Interfaculty Department of Geoinformatics
Abstract – Spatial data typically is associated with maps, remote sensing imagery and any kind of digitally recorded features located on our planet by latitude and longitude. ‘Spatial’ disciplines therefore traditionally are distinguished by their use of spatial documents and media to record, manage, analyse and communicate information. While disciplines like surveying, geography, planning and resource management clearly are focused on understanding and planning our environments, we increasingly understand that virtually all aspects of societies, economies and environments only can be managed by taking the spatial domain into account. Most things happen at a place, which puts this event or observation into the context of its surrounding space. Just like Google has given itself the mission “to geographically organize the world's information and make it universally accessible and useful”, any kind of sustainable management needs to explicitly consider the clearly limited resource of our planet’s surface area.
Today, the segregation of spatial disciplines from others does not make a lot of sense anymore. Geography, and a geospatial view much rather serve as one of several general organizing principles for a multitude and maybe even majority of sciences. Public health and epidemiology cannot really operate without a spatial perspective, similarly criminology and all others related to population sciences, and of course ecology, oceanography and all sciences dealing with the geo-, bio- and atmosphere and the resources contained within these. Environmental sciences, in a wider sense defined as systems sciences of the spaces surrounding all kinds of places, clearly are based on a spatial perspective in urgent need of a geographic organizing principle.
Geoinformatics today provides the foundations for organizing, analysing and communicating spatial data, turning these data into indispensable information for environmental and other disciplines. Spatially enabled databases handle location for any kind of object. Elements of services-based distributed architectures interact through open standards defining interfaces with unique location identifiers. Geoportals serve as user interfaces facilitated by semantic-aware metadata, enabling searches across heterogeneous catalogues.
These kinds of spatial data infrastructures (SDIs) increasingly serve as the foundation for the spatial organisation of observations and the establishment of relationships in the environmental sciences and beyond. A universal set of spatial analytical methods identifies, qualifies and quantifies

Science for Sustainability University of West Hungary International Scientific Conference for PhD Students March 19-20, 2013 – Győr
106
instances of relationships based on spatial concepts. A spatial perspective thus is an indispensable prerequisite for developing and testing hypotheses, for creating novel insights and knowledge, and thus for progress across many scientific disciplines. Beyond that, only a spatial perspective translates generic knowledge back into the personal domains of ourselves as individuals, our environments and action spaces.
Geostatistical Characterization of Wetland Habitats
KOLLÁR Szilviaa,b* – VEKERDY Zoltánc – MÁRKUS Bélab a Department of RIM, Faculty of Spatial Planning, Technical University of Dortmund, 44221, Germany
b Faculty of Geoinformatics, University of West Hungary, 8000 Székesfehérvár, Hungary c Department of Water Resources, ITC, 7500 AE Enschede, The Netherlands
Abstract – Based on archive aerial imagery the present study aims at differentiating between wetland vegetation habitats in the Szigetköz Danubian floodplain (Hungary) for certain years. Semi-automatized digital image analysis technique has been applied to each year with the additional use of texture measures, hence providing an objective, time-efficient and cost-effective method. The combination of spectral and texture based classification resulted in a significant improvement regarding classification accuracies in comparison to solely spectral based classification. The comparability of texture measures for spatially equal image objects is the subject of further research.
Keywords: wetland vegetation / remote sensing / aerial imagery / texture analysis
1. INTRODUCTION
Aerial photography has a unique place within remote sensing and ecology (Morgan et al. 2010). With the use of archive imagery it is possible to reconstruct historic ecosystem conditions which are essential for characterizing the historic range of variability within ecosystems and hereby for developing strategies aimed at managing for ecological integrity (Landres et al. 1999). Providing spatially and temporally continuous data (e.g. aerial images) is vital for the monitoring of ecosystems, including the most productive, but vulnerable ones, the wetlands. They have a particular value among other ecosystems due to their high biodiversity, critical habitats for many plants and animals and being a natural element in the maintenance of water quality. Their conservation and sustainable development strategy has been the subject of the Ramsar Convention on Wetlands (1971), because of the vulnerable state mainly caused by human intervention.
Remote sensing applications offer a cost-effective and time-efficient method with the development of automated image analysis techniques which have a great potential in the rapid processing of imagery, contrary to visual photo-interpretation based on manual delineation. However, the mapping of complex vegetation patches can be hardly applied on pixel-basis due to the high spectral variance of each vegetation class, that’s why another technique based on the combination of spectral and texture characteristics on object-basis, has to be tested for appropriate classification results.
* Corresponding author: [email protected]; D-44221 Dortmund, August-Schmidt Str. 10

Science for Sustainability University of West Hungary International Scientific Conference for PhD Students March 19-20, 2013 – Győr
107
The present study attempts to make a rapid classification of riparian wetland vegetation in a Hungarian floodplain based on archive aerial imagery where we suppose that the additional use of texture measures will significantly improve the classification accuracies.
2. STUDY SITE
This study focuses on the Szigetköz Danubian floodplain in Hungary, which one together with the Slovakian Csallóköz is the most extended wetland in the Upper-Danube region with high biodiversity (Illés–Szabados 2008). It belongs to the Directorate of Fertő-Hanság National Park with a whole area of 37 500 ha, from which 9157 ha became landscape protected area in 1987 and nowadays it includes NATURA 2000 SCI (sites of community interest), SPA (special protected area) and IBA (important bird areas) (SZABÓ 2005). In 1992 severe changes have occurred in the region due to the Danube-diversion, leading approximately 80 % of the water discharge into the bypass canal of the Gabčikovo Hydroelectric Power Plant. The changed flow and sediment regime have significantly affected the unique diverse pattern of habitat types, which have been altered from aquatic or aquatic-related forms to more terrestrial species (IJJAS et al. 2010). Due to its vulnerability Szigetköz has got national importance and the Hungarian Scientific Academy has built an interdisciplinary research group for continuous monitoring purposes concentrating on distinct fields. Regarding the former remote sensing related investigations, land use maps have been created annually since 1996 with visual photo-interpretation techniques and land use changes have been detected (LICSKÓ 2008).
3. DATA
Aerial imagery from 2008, 2005 and from 1999 has been involved in the analysis about a test site (2.5 km2) near to the village Dunaremete. The images from 2008 (CIR) and 2005 (RGB) are available at the Institute of Geodesy, Cartography and Remote Sensing (FÖMI, Budapest), the image 1999 is provided by the University of West Hungary, acquired in the framework of the Phare CBC Project by Eurosense Company. The most important characteristics of the photos are summarized in Table 1.
Table 1. Aerial imagery. Orthophoto Image 2008 Image 2005 Image 1999 Scale 1 : 74 000 1 : 30 000 1 : 30 000 Ground Spatial Resolution 0,5 m/pixel 0,5 m/pixel 1,25 m/pixel Spectral resolution NIR, G, B R, G, B NIR, R, G Acquisition time 06.08.2008 29.07.2005 03.08.1999 The images 2008 and 2005 have been resampled by bilinear interpolation to the coarser
geometric resolution of the image 1999 (1.25 m/pixel) due to the fact that different ground spatial resolutions of aerial imagery have a significant effect on the image analysis.
The detailed mapping of riparian vegetation is not concentrating on a general land cover classification scheme, but rather on local characteristics, related to the certain riparian wetland area, presented by the sample site, spreading out until the dams. An exact description of local characteristics is possible in an approximate scale of 1:10 000, therefore botanical and silvicultural inventory data has been gathered on the region (Table 2), which has those appropriate scales.
Target classes for the vegetation classification have been defined based on these inventories, personal field survey and visual image interpretation.

Science for Sustainability University of West Hungary International Scientific Conference for PhD Students March 19-20, 2013 – Győr
108
Table 2. Ancillary data. Ancillary data Habitat map Silvicultural map Number of classes (in the test site) 13 8 Scale 1 : 12 500 1 : 10 000 Acquisition time 2000, 2004; July-Oct. 2003-2010
4. METHODS
Object-based image analysis method (later: OBIA) has been chosen for the study which is based on the principle of grouping pixels into meaningful objects before the classification. Besides tone or colour, size, shape, texture, shadow, landscape context and position can be involved in the analysis, and hereby OBIA mimics the manual interpretation to a certain extent, and suites better for the analysis of high or very high resolution data than pixel-based classifiers (MORGAN et al. 2010). CSERHALMI et al. (2010) applied this technique to the analysis of archive black & white imagery in order to detect vegetation changes in a mire ecosystem in Hungary. LANGANKE et al. (2007) investigated the conservation status of a bog site based on different types of aerial photographs (black & white, colour infrared and true colour) and combined standard photo-interpretation with multi-scale object-based classification besides landscape metric analysis, in the framework of the pan-European conservation programme Natura-2000, where they concluded that OBIA overcomes several problems of the solely manual based image interpretation.
In our study after the combination of quad-tree and multi-resolution segmentation algorithms a prior classification of water bodies has been applied based on vegetation indices where the indices were defined differently for each year according to the spectral resolutions (image 2008: (NIR-G)/(NIR+G); image 2005: (2G-R-B)-(1,4*R-B); image 1999: (NIR-R)/(NIR+R)).
Water image segments can be clearly identified based on this method, whilst the classification of the target vegetation classes remained difficult, because of their complex spectral characteristics. The result after the multi-resolution segmentation approach demonstrates the significance of the spectral behaviour during the segmentation procedure and that spectrally similar pixels belong to the same object and spectrally inhomogeneous fields are separated. In numerous studies related to the issue of sufficient mapping of vegetated areas and forest structures from high-resolution imagery, it has been presented that an additional approach is needed to the spectral classification (ZHANG 2001; LÉVESQUE – KING 2003), because of those features which in general cannot be differentiated on the basis of spectral reflectance. MORGAN et al. (2010) have listed a number of remote sensing related applications with the use of image texture, e.g. the analysis of landscape heterogeneity, biophysical parameters, forest structural characteristics, prediction of species distribution and biodiversity patterns. LALIBERTE et al. (2008, 2009) have analysed high spatial resolution imagery where they showed a significant improvement regarding classification accuracies with the use of GLCM features for rangeland classification. SU et al. (2008) have examined urban areas based on a QuickBird image scene and also got improved accuracies with the application of textural (including GLCM features) and local spatial statistics information.
Texture measures can be grouped as features based on local variation measures (first-order statistics) such as standard deviation, those based on second-order statistics (co-occurrence) and features based on spatial statistics, like local semi-variances or autocorrelations within a pixel neighbourhood (TUOMINEN – PEKKARINEN 2005). In case of second-order statistics features are computed from the so-called grey-level co-occurrence matrices (GLCM). HARALICK et al. (1973) firstly defined 14 different features extracted from each of these matrices for various angular relationships and distances between neighbouring resolution cell pairs on the image. For the

Science for Sustainability University of West Hungary International Scientific Conference for PhD Students March 19-20, 2013 – Győr
109
calculation of GLCM texture values the following variables have to be defined: (1) moving window size (in our study: the target object size), (2) direction of the offset (which means that pixels will be compared only in a specific direction, where the 4 available directions are 0°, 45°, 90° and 135°, however, the use of the average is also possible), (3) distance of the offset (as default it is 1, which means the reference pixel and its immediate neighbour are taken into account), (4) image channel, (5) specific measure by equation (HARALICK et al. 1973).
In the present analysis, for a consistent and objective study, the textures of unique image segments have been analysed. Those segments resulted from the chessboard segmentation approach dividing the image into regular square-shaped objects with a user-defined size. Based on the literature (TUOMINEN – PEKKARINEN 2005) and visual investigation of actual vegetation patterns 20 m×20 m size (16×16 pixels due to the 1.25m/pixel ground spatial resolution) has been chosen for the segments. Regarding the GLCM direction, firstly, all directional GLCM features have been calculated, which means the average of each direction and later, due to the specific solar azimuth angles of the aerial images, directional GLCM measures have been defined, calculated and used for the classification separately. The offset-distance was 1 and as image channel the 1st principal component (PC1) has been chosen for each image.
Regarding the choice of certain GLCM features Hall-Beyer (2007) has recommended the use of one contrast measure (from Contrast, Dissimilarity and Homogeneity), one orderliness measure (from Angular Second Moment, Maximum Probability, Entropy) and two or three of the descriptive statistics (from Mean, Variance or Standard Deviation, Correlation) for classification purposes. This was also corroborated by LALIBERTE – RANGO (2008). Therefore GLCM Contrast, Entropy, Mean, Standard Deviation and Correlation have been primarily tested for training samples and feature value ranges have been compared for each class-pair. GLCM Entropy, Correlation and Standard Deviation have provided the best results regarding the complete separability (no or minimal overlap between feature value ranges) of certain class-pairs and therefore those have been chosen for further analysis.
For a supervised classification approach training samples from the square-shaped image objects have been chosen based on thematic maps and visual image interpretation, starting with the 1999 image. The number of training samples fitted to the size of the test area and to the target classes and thus, 20-20 samples were defined for reed, poplar, special poplar and willow & poplar classes, 30 samples for willow class. The next step was the choice of features taken into account in the classification.
The first observed features concentrated solely on spectral characteristics (mean of PC1 and vegetation index), secondly on GLCM textural measures (related to the average of all directions), the third group of features was the combination of spectral and textural without the mean of PC1, and the last one was a similar combination as in the 3rd case with the difference that directional GLCM features have been chosen there. The application of directional GLCM is reasonable due to the fact that the presence of different shadows coming from altering acquisition parameters (certain solar azimuth angles due to date and time of acquisition) has a great influence on the estimated texture characteristics. Because of these differences in the solar azimuth angle (2008: 125.6°; 2005: 209.4°; 1999: 111.6°) directional GLCM features have been tested with appropriate directions, which means choosing the nearest one from the 4 main directions defined for GLCM calculation (2008: 135°; 2005: 45°; 1999: 90°).
The classification algorithm was based on the membership values of certain image segments according to the class descriptions where the chosen features and value ranges came from the training samples for each class. The membership value of a specific image object is compared to a list of selected classes resulting in a fuzzy class evaluation with the first three best classes and the classification result is updated according to the first best class (Trimble 2012).
It has been tested that the same texture feature value intervals cannot be applied for the classification of the same or similar habitats in different years. Although, image 2008 represents

Science for Sustainability University of West Hungary International Scientific Conference for PhD Students March 19-20, 2013 – Győr
110
also a CIR image as image 1999, it has a different spectral resolution (NIR, G, B). Nevertheless, the definition of same or similar target classes with a 3-year and 9-year time difference is a complex problem, related to the question of under which circumstances we will or we could differentiate between vegetation habitats. Vegetation succession stages play an important role in this.
Based on new training samples for 2005 and 2008, texture measure ranges have been updated for the same spectral and textural features applied before and classifications have been carried out with new class descriptions.
5. RESULTS
The study has concentrated on vegetation classification where different combinations of features have been tested for vegetation separation in order to show which combination will give the best classification accuracy.
The overall accuracy and the Kappa index can be compared for each type of classification result related to a specific feature combination. For 1999 and for 2005, ‘GLCM only’ classification provided better accuracies than the sole use of spectral characteristics (mean of PC1 and vegetation index), however, the best result was reached by the combination of spectral and textural characteristics, using GLCM directional features. In case of the image 2008 the application of spectral or textural characteristics only, provided similar accuracies (Kappa spectral = 0.704; Kappa textural = 0.691), whereas their combination: firstly GLCM (directional) with VI (vegetation index), and then GLCM (average) with VI showed a significant improvement (overall: 0.936; Kappa: 0.920).
6. CONCLUSIONS
Involving texture characteristics into the classification approach of riparian vegetation habitats improved the classification accuracies apparently, where the sole use of spectral descriptors, e.g. mean of a given channel, vegetation indices could not give sufficient results. However, classification accuracies have differed significantly for the three years (2008-overall: 0.936; 2005-overall: 0.856; 1999-overall: 0.789) because of the difference in the aerial image material (e.g. analogue versus digital, original spectral and spatial resolutions). In this case accurate vegetation change analysis could be hardly reached based on post-classification-comparison. Future research is aiming at better classification accuracies for distinct years, involving the statistical separability analysis for the best descriptors regarding vegetation habitats and besides, the development of an image segment based change detection analysis based on textural changes. Acknowledgements: Special thanks given to the Trimble Geospatial Munich regarding the use of eCognition Developer software; to the Fertő-Hanság National Park (Sarród); to the Forestry Directorate in Szombathely because of the provided botanical and silvicultural data and to István Hahn for his guidance during field investigations and support regarding the botanical aspect of the study. References CSERHALMI, D. – NAGY, J. – NEIDERT, D. – KRISTÓF, D. (2010): The reconstruction of vegetation change in
Nyíres-tó mire (ne Hungary): An image-segmentation study. In: Acta Botanica Hungarica 52 (1-2), 89–102.
HALL-BEYER, M. (2007): The GLCM Tutorial Home Page, http://fp.ucalgary.ca/mhallbey/tutorial.htm (accessed 18th Dec. 2012).
HARALICK, R. M. – SHANMUGAM, K. – DINSTEIN, I. (1973): Textural Features for Image Classification. In: Man and Cybernetics Systems 3 (6), 610–621.

Science for Sustainability University of West Hungary International Scientific Conference for PhD Students March 19-20, 2013 – Győr
111
IJJAS, I. – KERN, K. – KOVÁCS, GY. (eds) (2010): Feasibility Study. The Rehabilitation of the Szigetköz Reach of the Danube. 326 p.
ILLÉS G. – SZABADOS I. (2008): 20 éves az erdészeti monitoring a Szigetközben. In: Erdészeti Kutatások 2007-2008 92, 95–120.
LALIBERTE, A. – RANGO, A. (2008): Correlation of object-based texture measures at multiple scales in sub-decimeter resolution aerial photography. In: ISPRS Proceedings. XXXVIII-4/C1.
LALIBERTE, A. – RANGO, A. (2009): Texture and Scale in Object-Based Analysis of Subdecimeter Resolution Unmanned Aerial Vehicle (UAV) Imagery. In: IEEE Trans. Geosci. Remote Sensing 47 (3), 761–770.
LANDRES, P. B. – MORGAN, P. – SWANSON, F. J. (1999): Overview of the use of natural variability concepts in managing ecological systems. In: Ecological Applications 9 (4), 1179–1188.
LANGANKE, T. – BURNETT, C. – LANG, S. (2007): Assessing the mire conservation status of a raised bog site in Salzburg using object-based monitoring and structural analysis. In: Landscape and Urban Planning 79 (2), 160–169.
LÉVESQUE, J. – KING, D. J. (2003): Spatial analysis of radiometric fractions from high-resolution multispectral imagery for modelling individual tree crown and forest canopy structure and health. In: Remote Sensing of Environment 84 (4), 589–602.
LICSKÓ, B. (2008): A szigetközi területhasználatok térképezése légifelvételek készítésével és feldolgozásával. MTA Szigetközi Munkacsoportja. Budapest (A szigetközi környezeti monitoring eredményei). http://www.szigetkoz.biz/monitoring/MTA2008/page_2008.htm (accessed 18th Dec. 2012).
MORGAN, J. L. – GERGEL, S. E. – COOPS, N. C. (2010): Aerial Photography: A Rapidly Evolving Tool for Ecological Management. In: BioScience 60 (1), 47–59.
SU, W. – LI, J. – CHEN, Y. – LIU, Z. – ZHANG, J. – LOW, T. M. – SUPPIAH, I. – HASHIM, S. A. M. (2008): Textural and local spatial statistics for the object‐oriented classification of urban areas using high resolution imagery. In: International Journal of Remote Sensing 29 (11), 3105–3117.
SZABÓ M. (2005): Vizes élőhelyek tájökológiai jellemvonásai a Szigetköz példáján. MTA academical PhD. ELTE, Budapest.
TRIMBLE (Ed.) (2012): eCognition Developer 8.7.1. Reference Book. Trimble Germany GmbH. München. TUOMINEN, S. – PEKKARINEN, A. (2005): Performance of different spectral and textural aerial photograph
features in multi-source forest inventory. In: Remote Sensing of Environment 94 (2), 256–268. ZHANG, Y. (2001): Texture-Integrated Classification of Urban Treed Areas in High-Resolution Color-Infrared
Imagery. In: Photogrammetric Engineering & Remote Sensing 67 (12), 1359–1365.
Estimating the Accuracy of DBH Measurements in Scots Pine Stands on the Basis of Terrestrial Laser Scanning Data
KONDRACKI, Kamila*– SUŁKOWSKI, Sławomira – STRZELIŃSKI, Paweła aDepartment of Forest Management, Faculty of Forestry, Poznań University of Life Sciences, Poznań, Poland
Abstract – This paper presents the use of selected tools available in GIS software (FUSION, ArcGIS ArcMap and QuantumGIS 1.7 Wrocław) to analyze the distribution of point cloud from terrestrial laser scanning to determine the feasibility and accuracy of determining diameter at breast height (DBH) of scanned trees. Data from terrestrial laser scanning (collected with a FARO LS HE880 scanner) were pre-processed in the SCENE 4.7 software (FARO), then prepared by two established methods (using selected tools in the FUSION and ArcGIS ArcMap sofware) and analyzed in QuantumGIS 1.7 Wrocław software. The results were compared with measurements acquired with SCENE 4.7 and using traditional methods to give an average difference of 0.5 cm (at the differences from -4.5 cm to 12.4 cm) with p-values ranges from 0.6753 to 0.9949 for the presented methods. This allows us to
* Corresponding author: [email protected]; ul. Wojska Polskiego 71 C, 60-625 Poznań

Science for Sustainability University of West Hungary International Scientific Conference for PhD Students March 19-20, 2013 – Győr
112
conclude that DBH (accurate to 0.5 cm) may be determined on the basis of terrestrial laser scanning data using the methods presented in this paper.
Keywords: DBH / Terrestrial Laser Scanning / FUSION / ArcGIS / QuantumGIS
1. INTRODUCTION
The LiDAR technology (Light Detection and Ranging) makes it possible to collect large amounts of precise data within a short time. Aerial and terrestrial laser scanning is a fast and effective tool of high precision in the determination of selected parameters of the forest inventory (VAN LEEUWEN – NIEUWENHUIS 2010). As it was shown by DASSOT et al. (2011), terrestrial laser scanning is applied e.g. to determine such forest inventory parameters as diameter at breast height, height, tree stocking, basal area or estimation of wood volume at the sample plot level, or - as it was indicated by VAN LEEUWEN et al. (2011) - to measure wood quality indicators. Also MOSKAL et al. (2009) described the application of TLS in the estimation of Leaf Area Index (LAI) and determination of crown volume as a significant factor in the spread of wildfire.
2. STUDY AREA
The sample plot is located around a research station (53º 11' N, 16º 5' E) established to record measurements of carbon dioxide exchanged between the forest ecosystem and the atmosphere in the Tuczno Forest District (Regional Directorate of the State Forests in Piła).
The stand where the measurements were carried out is composed in 99% of Scots pine (Pinus sylvestris L.) and 1% of silver birch (Betula pendula ROTH). The undergrowth consists mainly of common beech (Fagus sylvatica L.) and European hornbeam (Carpinus betulus L.). Mean DBH of the trees is ca. 21 centimeters at the mean tree height of approx. 20 m. The age of the stand recorded in the year of measurements (2008) was 54 years.
3. METHODS
3.1. Field works
In 2008 a FARO LS HE880 terrestrial laser scanner was used within the two projects: “Estimation of net carbon dioxide flows exchanged between the forest ecosystem and the atmosphere” (STRZELIŃSKI 2010) and “The carbon balance in biomass of major forest-forming species of Poland” in remote recording of selected tree parameters.
Terrestrial laser scanning was performed on 71 points located on ca. 100-meter transects distributed in the northern, southern, eastern and western directions from the research station. Positions of the TLS set was identified by a Trimble GeoExplorer XT CE GPS receiver. Scanning was performed at ¼ of full resolution. Reference data for scanning were also collected, such as DBH (accurate to 1 mm). DBH was measured using a caliper.
3.2. Processing the data
3.2.1. Preliminary processing of the data
Preliminary processing of the data was based on filtering and merging of scans followed by separation of sections in SCENE 4.7 software (the condition of point cloud coverage >= 50% of

Science for Sustainability University of West Hungary International Scientific Conference for PhD Students March 19-20, 2013 – Győr
113
stem circumference at breast height). The sections were exported in full resolution to the ASCII file with the *.xyz extension.
3.2.2. Preparation of data for further analyses based on method I
The first method is based on transformation from a point cloud to a raster file (firstly in the *.dtm format and next the *.asc format) in FUSION/LDV software (MCGAUGHEY 2010) and next narrowing the distribution of section pixels in the raster calculator (Spatial Analyst extension in ArcGIS ArcMap) in order to eliminate the impact of tapering - even on a segment of several centimeters in length in a separated and processed section.
The raster’s layer subject to further analyses was reduced applying a relation operator as a method used in the Raster Map Algebra.
This operator makes it possible to construct a logic test, which gives a result if a specific condition is met. In such a case the test will yield the value of “1” (synonymous to “TRUTH”) if higher values are found above the established value of the section height. The following expression was formulated:
output_file = con([input_file] >= d½, 1) where: output_file – name of output raster file, con – condition – a function of relation, input_file – name of analyzed input raster file, “>=” – condition of relation, d½ – value of middle height of section, „1” – result value if the condition is met (synonym to “TRUTH”).
Such processed rasters, i.e. their pixels, are transformed to vector object points (in the *.shp format), which distribution is finally analyzed in terms of the determination of section diameter.
3.2.3. Preparation of data for further analyses based on method II
The second method of data preparation for analyses consisted in the conversion of the exported file in the *.xyz format (from the SCENE 4.7 program) to the point object class in the *.shp format.
3.2.4. Analysis of dbh determination on the basis of measurements of image intensity
The determination of diameter at breast height in the SCENE 4.7 application was verified by manual measurements of the distance between pixels on a planar image of stem intensity. This method is referred to as PIXEL (WĘŻYK et al. 2007, WĘŻYK – SROGA 2010).
3.2.5. Analysis of point distribution in exported sections in terms of diameter determination
Sections prepared using both methods were analyzed in terms of the point distribution in the Quantum GIS 1.7 Wrocław program to verify the determination of section diameter. Analysis of point distribution in the Quantum GIS 1.7 Wrocław program consisted in the plotting of a rectangular vector polygon object on the outermost points of the analyzed section. Sides of the formed rectangular vector polygon object, denoted as WIDTH and HEIGHT, represented diameter d1 and diameter d2, respectively. Prior to analysis each section was examined visually to assess point distribution. The aim was to manually eliminate outliers. The term outliers refers to points (or clusters of points), which distance is evidently greater than the mean distance between the nearest neighboring points representing the analyzed section. Such points were most typically

Science for Sustainability University of West Hungary International Scientific Conference for PhD Students March 19-20, 2013 – Győr
114
undeleted noises left after filtration of data or points representing e.g. twig elements, and they were found in the field of selection when sections had been exported in the SCENE 4.7 program.
The distribution of points was analyzed using the “Polygon from layer extent” tool (Vector, Research Tools, Polygon from layer extent). The results of the analysis comprised a rectangular polygon layer in the *.shp file format including information on e.g. the length of its sides (WIDTH, HEIGHT – respectively diameters d1 and d2 of analyzed sections), area (AREA) and coordinates of layer center (CNTX, CNTY).
4. RESULTS
The table below presents descriptive statistics for the results of analyses obtained with the use of both analytical methods in comparison to the results of measurements recorded in SCENE 4.7 and taken using conventional methods. Table 1. Descriptive statistics for results of analyses
Method Traditional measurements SCENE difference I method difference II method difference
No. of valid samples 39 39 39 30 30 39 39 Mean 28,5 28,0 0,5 28,5 -0,5 29,0 -0,4 Median 28,2 27,0 0,3 27,3 -0,3 27,9 -0,7 Minimum 20,0 20,0 -3,8 21,3 -4,5 20,7 -4,5 Maximum 40,5 41,1 10,9 40,8 4,4 41,1 12,4 Range 20,5 21,1 14,7 19,5 8,9 20,5 16,9 Variance 27,7 28,6 5,1 25,1 2,4 26,6 6,7 Standard deviation 5,3 5,3 2,2 5,0 1,5 5,2 2,6 Confidence interval standard deviation -95.000%
4,3 4,4 1,8 4,0 1,2 4,2 2,1
Confidence interval standard deviation +95,000%
6,8 6,9 2,9 6,7 2,1 6,7 3,3
CV 18,5 19,1 - 17,6 - 17,8 - Standard error 0,8 0,9 0,4 0,9 0,3 0,8 0,4
5. DISCUSSION AND CONCLUDING REMARKS
This study applied the method of manual determination of diameter at breast height based on measurements taken on the intensity image in the SCENE 4.7 program as well as two methods (methods I and II of data processing), making it possible to analyze the distribution of sections of point clouds and thus the determination of their diameters (which are equivalent to the determination of dbh). The above objective was realized obtaining the following mean values of diameter measurements:
• For the method analyzing the diameter based on the manual dbh measurement on the intensity image in the SCENE 4.7 application the mean value of dbh measurement was 28.0 cm.
• For data processing method I the mean value of dbh measurement was 28.5 cm. • For data processing method II the mean value of dbh measurement was 29.0 cm.
The mean value of diameter at breast height determined using the conventional measurement methods was 28.5 cm.
Science for Sustainability University of West Hungary International Scientific Conference for PhD Students March 19-20, 2013 – Győr
115
The mean for the differences recorded in the course of analyses applying the three above mentioned methods in relation to the results obtained by conventional measurement methods was 0.5 cm (at the range of differences from -4.5 cm to 12.4 cm).
Based on the t-test for independent samples (at the significance level α=0.05) it may be stated that the recorded dbh measurement results for analyzed sections do not differ significantly from the results obtained using conventional measurement methods. With high probability p amounting to:
• 0.675257 – for measurements in SCENE 4.7., • 0.994889 – for data processing method I, • 0.709707 – for data processing method II,
we may assume that the methods of analysis presented in this study for the distribution of point clouds are not statistically significantly different and facilitate an accurate determination of diameter (dbh).
Conducted analyses indicate a considerable potential applicability of terrestrial laser scanning in forest inventory at the level of mean sample plots.
It may be expected that advances in technology in this respect will result in the accelerated data acquisition with an increase in their precision.
6. CONCLUSIONS
Results of measurements recorded with a terrestrial laser scanner are characterized by high precision (mean error for diameter determination of 0.5 cm).
Accuracy of measurements taken with a scanner was confirmed by results of statistical analyses showing a lack of significant differences between the results of measurements in the discussed analytical methods.
In the course of the analyses applicability was shown for the analysis of point cloud distribution from terrestrial laser scanning to determine diameter at breast height using tools available in the selected GIS software (FUSION, ArcGIS ArcMap and QuantumGIS 1.7 Wrocław).
It is great importance to conduct further studies on the potential automatic determination of diameter at breast height and other tree and stand inventory parameters at the mean sample level. Acknowledgements: Data used in this study were collected within the framework of two projects: 1. “Estimation of net carbon dioxide flows exchanged between the forest ecosystem and the atmosphere”,
realized on commission of the General Directorate of the State Forests, Project realized in the years 2007 - 2011.
2. “The carbon balance in biomass of major forest-forming species of Poland” realized on commission of the General Directorate of the State Forests, Project realized in the years 2007 - 2011.
References DASSOT, M. – CONSTANT, T. – FOURNIER, M. (2011): The use of terrestrial LiDAR technology in forest science:
application fields, benefits and challenges. Annals of Forest Science. Volume 68 (5): 959-974. MCGAUGHEY, R. J. (2010): FUSION/LDV: Software for LIDAR Data Analysis and Visualization – FUSION
Version 2.80. Software manual. USDA Forest Service. Pacific Northwest Research Station. (accessed 19.12.2011. http://forsys.cfr.washington.edu/fusion/FUSION_manual.pdf).
Moskal, L. M. – Erdody, T. L. – Kato, A. – Richardson, J. – Zheng, G. – Briggs, D. (2009): Lidar Applications in Precision Forestry. (accessed 19.12.2011. depts.washington.edu/rsgal/pubs/Moskaletal_Silvilaser2009.pdf).
STRZELINSKI, P. (2010): Wybrane możliwości zastosowania laserowego skaningu naziemnego [Selected applications for terrestrial laser scanning] (in Polish). (accessed 19.12.2011. http://www.lasypolskie.pl/pliki/publikacje/praktyczne_aspekty_zastosowania_laserowego_skaningu_naziemnego.pdf).
Science for Sustainability University of West Hungary International Scientific Conference for PhD Students March 19-20, 2013 – Győr
116
VAN LEEUWEN, M. – NIEUWENHUIS, M. (2010): Retrieval of forest structural parameters using LiDAR remote sensing. Eur. J. Forest Res. 129: 749-770.
VAN LEEUWEN, M. – HILKER, T. – COOPS, N. C. – FRAZER, G. – WULDER, M. – NEWNHAM, G. J. – CULVENOR, D. S. (2011): Assessment of standing wood and fiber quality using ground and airborne laser scanning: A review. Forest Ecology and Management. Volume 261: 1467-1478.
WEZYIK, P. – KOZIOL, K. – GLISTA, M. – PIERZCHALSKI, M. (2007): Terrestrial laser scanning versus traditional forest inventory. First results from the polish forests. In: ISPRS Workshop on Laser Scanning 2007 and SilviLaser 2007. Espoo, September 12-14, 2007, Finland. 424-430. (accessed 19.12.2011. http://www.isprs.org/proceedings/XXXVI/3-W52/final_papers/Wezyk_2007.pdf).
WEZYIK, P. – SROGA, R. (2010): Naziemny skaning laserowy w inwentaryzacji miąższości drzewostanów sosnowych [Terrestrial laser scanning in the inventory of scots pine stand volume]. Roczniki Geomatyki. Volume 8, 7(43): 63-73. (in Polish)
A Remeshing Method for Plant Modelling
KOTTYÁN László1 1University of West Hungary Faculty of Geoinformatics, Székesfehérvár,
H-8000, Hungary E-mail: [email protected] Abstract – The purpose of this paper is to present a new method for displaying and manipulating real-time, highly-detailed, three-dimensional plant models on handheld devices equipped with hardware accelerated 3D support. The remeshing method applied on plant objects makes it possible to reduce the number of rendered polygons.
Keyword: 3D modelling / polygon mesh
1. INTRODUCTION
This paper describes a result of a research activity which was performed in the international IGIT project, at the Spatial Information Research Center of Fujian in China. IGIT stands for ”Integrated geo-spatial information technology and its application to resource and environmental management towards the GEOSS”. It is an EU supported project in cooperation between European and Chinese partners, targeting integrated geo-spatial information acquisition and management in various application fields. (IGIT 2011)
Some of the project activities focused on three-dimensional plant modelling. At Spatial Information Research Center of Fujian, a set of software was developed to produce and render sophisticated real-time three-dimensional plant models on desktop computers.
In recent years, handheld devices equipped with powerful processing capability including hardware accelerated 3D support, such as smartphones or tablets, are presented on market. Targeting these devices in development, real-time three-dimensional models can be rendered on them. Nevertheless, the capacity of mobile device and generally any computer determines the size and complexity of three-dimensional models which can be used.
A sophisticated plant model, which is created at the Spatial Information Research Center of Fujian, can contain tens of thousands of polygons (LIN 2011). In order to render the existing highly detailed plant models on handheld devices a method was elaborated and implemented as a client-server software.

Science for Sustainability University of West Hungary International Scientific Conference for PhD Students March 19-20, 2013 – Győr
117
2. METHOD
The elaborated method provides a solution to manage the models with large number of geometries on mobile devices. It is an optimization of the three-dimensional model without changing or reducing its vertices.
A three-dimensional plant object is composed of polygon meshes. A polygon mesh might store vertices, edges, faces, normals, UV coordinates, color information or related texture image. Polygon meshes can be represented using different methods to store these data and several file formats are available. (SMITH, 2006) The plant models, using the desktop architecture, were produced as VRML models in wrl format.
The concept of the elaborated method is to restructure or remesh the plant object in order to reduce the number of polygons to be rendered in a certain view. On low-level rendering, the polygon meshes of model object as arrays (array of vertices, array of faces, etc.) is passed to the renderig engine (e.g. OpenGL) which renders the object. A textured three-dimensional model from a certain view is partially visible, a part of the model is hidden. Using the remeshing method, the hidden part of the model can be determined in any view and the majority of the hidden polygons is not given to the rendering engine for processing.
A plant model polygon mesh basically contains the following data: • vertex array • UV array • array of normals • array of faces • texture image name
The vertex array contains the x, y, z coordinate values. The other arrays refer to the index positions of vertices. For example, if the vertex array has the v1(0,0,0), v2(1,2,0), v3(3,1,0) and v4(2,-1,0) vertices, the verex array is [0, 0, 0, 1, 2, 0, 3, 1, 0, 2, -1, 0]. If one triangle is constructed from v1, v2 and v3 vertices and another triangle is constructed from v1, v3 and v4, the array of faces is [0, 1, 2, 0, 3, 4], where the index of the first vertex is 0.
The remeshing method is based on twenty-six determined camera positions (Figure 1). The positions are given by direction vectors (x, y, z) where x, y, z values are -1, 0 or 1. The positions are named according to the coordinate values (Table 1). In the remeshing algorithm the camera always points to the origin (MMM position) from the twenty-six camera positions.
Table 1. Naming of coordinate values
1 0 -1 x R (right) M (middle) L (left) y U (up) M (middle) D (down) z F (front) M (middle) B (back)
Using these positions, an algorithm detects the visible surfaces of a three-dimensional plant
object which is centered at the origin (MMM position) and restructures the object.

Science for Sustainability University of West Hungary International Scientific Conference for PhD Students March 19-20, 2013 – Győr
118
The steps of the remeshing algorithm are the following: 1. For each camera position repeat:
1.1. Read the plant model and for each mesh: 1.1.1. Order a unique color code to each polygon (triangle). 1.1.2. Save mesh id, position name and color codes.
1.2. Render the model centered in MMM position and colorize each polygon according to the given color code.
1.3. Read the screen pixel color values and detect which polygons are displayed. 1.4. Based on the detected polygons, for each mesh:
1.4.1. Create a new array of faces in the mesh. In the end of this process a mesh of the object contains twenty-six new face arrays. When a restructured plant object is displayed in an application, a rendering algorithm
renders the visible parts of the meshes in a certain view. For example, if a camera is in (-0.8,-3.6,6) position, it can correspond to the LDF position, therefore the LDF face arrays are rendered from the meshes (Figure 2).
As a result, the remeshing method makes it possible to render and manipulate highly detailed plant models without processing the majority of its hidden polygons.
3. IMPLEMENTATION
The remeshing method was implemented in a client-server application. The server part of the application is located on a desktop computer, the client part of it is located on a smartphone.
On server-side an adjustment module remeshes the existing plant models (Figure 3) and stores them in a document-oriented database. The adjusment module is a Python application which connects to a MongoDB database server.
The client connects to the database server and downloads plant models. The client is an Android application. On client-side a local SQLite database supports the rendering process.
The main functions of the Android application are: • Connect to database, download and upload plant objects and store in local database. • Select plant models and display them in Center or in Fly mode. • In Center mode, the camera can be rotated horizontally or vertically around the origin of the
model space. It is possible to zoom in or zoom out of the display. (Figure 4) • In Fly mode, the camera can be shifted horizontally in a given vertical position. Shifting is
changing the center of the model space. In this database-centric architecture, some database operations were also implemented to
manipulate plant objects: • Cloning: the selected objects are duplicated in the database. • Moving: the selected plant object is repositioned, the coordinate values of object is modified and
saved to the database. • Delete plant object from the database.
4. CONCLUSION
The implemented client application was tested on a Google Nexus S smartphone using two highly-detailed plant models (Table 2).
During the adjustment, the plant objects were centered and fitted in a 800x400 pixel OpenGL window. The adjustment resulted that the average number of rendered polygons in the twenty-six views were 356 in case of Plant 1 (Figure 5) and 514 in case of Plant 2 (Figure 3, Figure 4).

Science for Sustainability University of West Hungary International Scientific Conference for PhD Students March 19-20, 2013 – Győr
119
Table 2. Test plants
Number of vertices Number of faces Plant 1 3177 671 Plant 2 39974 18597
Figure 1. Camera positions
Figure 2. Positions and corresponding positions

Science for Sustainability University of West Hungary International Scientific Conference for PhD Students March 19-20, 2013 – Győr
120
Figure 3. An adjusted tupelo tree from different positions
Figure 4. A tupelo tree displayed on smartphone screen
Figure 5. Plant 1
Science for Sustainability University of West Hungary International Scientific Conference for PhD Students March 19-20, 2013 – Győr
121
As a conclusion, using the remeshing method, a highly detailed restructured three-dimensional plant model is rendered with less polygons than the original one, therefore less hardware resources are required for the rendering process. References IGIT project (2011): Home page, Online: http://igit.geo.info.hu LIN, D. (2011): A Technical Introduction of OntoPlant-ParaTree software, Fuzhou, China SMITH, C. (2006): On Vertex-Vertex Systems and Their Use in Geometric and Biological Modelling. Ph.D.
dissertation, University of Calgary, Online: http://algorithmicbotany.org/papers/smithco.dis2006.html
Light Trapping with Diverse Artificial Lights in Sopron
PINTÉRNÉ NAGY Edit6
Institute of Forest- and Wood Protection, Faculty of Forestry, University of West Hungary, Sopron, Hungary Abstract - The paper reports on the results of light trapping with various artificial lights. Our aim was to assess the effect of the artificial light sources on the natural environment, in particular on insects. The experiment has been carried out with three different light types (Na light 150 W, mixed HMLI light 150 W and compact light 36 W), with special (Jermy type) light traps designed for insect capture. The investigated areas were illuminated at three different levels: a) area without any illumination, b) suburban areas with some additional light sources and c) city area of Sopron with a high level of artificial lights. Trapping was made from June to August 2012 according to the moon phases. The insects that were caught were counted and determined at the order level. The dominance of the orders has been examined and evaluated. We caught 138225 insects. The highest number were collected in June (118915), the lowest in August (6448). The experiment has shown that the highest number of flies (Diptera, 8706) were attracted by the sodium lamp, the highest number of cicada (Hemiptera, 102818) were attracted by the mixed HMLI lamp. The insects caught by the sodium lamp were mostly flies (Diptera, 59,6 %), followed by cicadas (Hemiptera,18,9 %) and moths (Lepidoptera, 9,1 %). Mixed light and sodium lamp attracted the most insects. The dominant orders were moths (Lepidoptera), flies (Diptera) and cicadas (Hemiptera).
Keywords: light / illuminate / insect / trapping / dominance
1. INTRODUCTION
The extreme use of artificial lights can cause light pollution. When talking about light pollution, we mean the change of natural overnight lighting that has increased the background illumination of the sky, and the visibility of natural lights, which becomes impossible at certain places. Artificial lights disrupt the habitat and orientation of insects and it can also cause their extinction. According to lepidopterologists, the effect of street lights can be blamed for the decrease of different Lepidoptera. The high level of street illumination can stop their flight, the unique light deceives the insects, and therefore the insects fly spirally. This way the outdoor illumination can produce selective effects on the population. This means that some species and individuals are attracted by the artificial light much stronger than others. Increasing open air illumination leads to the share of habitat and it creates isolated and fragmented insect colonies (NOWINSZKY 2007). In my research, with the help of light trapping, I examined what attractive effects different artificial lights have on insects.
6 Corresponding author: [email protected]; H-9400 Sopron, Ady E. út 5.

Science for Sustainability University of West Hungary International Scientific Conference for PhD Students March 19-20, 2013 – Győr
122
2. MATERIAL AND METHOD
2.1. Examination areas
According to the illumination of artificial lights, I have set up light traps in Sopron and its suburban areas. The first place is in a forest district of Sopron’s mountainous area, which is a natural area without any effect of artificial light. The second area is at an intermediate position in the outskirts, far away from the centre of the city, in a suburban area, where the lights appear from the houses and streets, but they are not as strong as in the artificial area. The third area was in the centre of the city, where there is a high level of background light.
2.2. Instruments of light trapping
I have investigated light trapping with special (Jermy type) light-traps, designed for insect capture, which the Hungarian light trap net also uses (NOWINSZKY 2003). The light traps are suitable for determination of night insects’ swarming range, their beginning of swarming (BÜRGÉS 1976), the prediction of pestiferous species and they are also suitable for prognostic investigation. The experiment was carried out with three different light types (HMLI light 160 W, Na light 150 W and a compact light 36 W).
2.3. Timing of light trapping
Light traps were installed from June to August 2012, and the control time were chosen according to the moon phases: June (10, 11 (wane of the moon), 12, 18, 19 (new moon), 20, 26, 27 (prime of the moon), 28), July (2, 3 (full moon), 4, 10, 11 (wane of the moon), 12, 17, 18, 19 (new moon), 26 (prime of the moon), 27, 28), August (7, 8, 9 (wane of the moon), 16, 17, (new moon), 18, 23, 24 (prime of the moon), 25, 30, 31 (full moon). The light traps operated from night until morning daylight.
3. RESULTS
The insects that were caught were counted and determined at the order level. I also defined the dominance of the orders and the number of individuals.
3.1. Examination of the number of individuals according to months
I caught a total of 138225 insects during the examination. The highest number was collected in June (118915), the lowest in August (6448).
3.2. Examination of the number of individuals according to light types
The different light types attracted the insects differently. The sodium lamp attracted flies (Diptera) the higherst number, the mixed HMLI cicada (Hemiptera) and the compact also flies (Diptera).
3.3. Dominance
The dominance examination was carried out throughout the whole duration of light trapping with the following statistical analysis (KOVÁCS 2008):
D = 100*b/a (%)

Science for Sustainability University of West Hungary International Scientific Conference for PhD Students March 19-20, 2013 – Győr
123
where b = number of individuals of a given order a = total number of individuals
In Table 1 we can see the insects’ dominance according to light-types. In case of the sodium lamp, the flies (Diptera) and cicadas (Hemiptera) were eudominant orders. It means that the highest number of these individuals was attracted by the sodium lamp. In case of the mixed HMLI light, cicadas (Hemiptera) were eudominant and flies (Diptera) dominant.
Figure 1. : Number of insects caught according to different light types
Table 1. Dominance values according to insect orders
Category D (%) Category D (%) Category D (%) Order Na HMLI Compact Diptera eudominant 59.6 dominant 7.6 eudominant 54.8 Hemiptera eudominant 18.9 eudominant 89.4 eudominant 18.3 Lepidoptera dominant 9.1 recens 1.5 eudominant 12.7 Hymenoptera dominant 6.9 subrecent 0.4 subdominant 3.7 Heteroptera subdominant 2.7 subrecent 0.2 subdominant 3.5 Coleoptera recent 1.4 subrecent 0.5 subdominant 4.9 Planipennia subrecent 0.5 subrecent 0.1 subrecent 0.4 Trichoptera subrecent 0.5 subrecent 0.1 subrecent 0.9 Ephemeroptera subrecent 0.2 subrecent 0.1 subrecent 0.1 Blattodea subrecent 0.1 subrecent 0 subrecent 0.3 Odonata subrecent 0 subrecent 0 subrecent 0
The number of individuals caught by the compact light tube is a lot lower than with a sodium or mixed HMLI light. According to insect orders, the insects caught can be categorised only in three dominance classes.

Science for Sustainability University of West Hungary International Scientific Conference for PhD Students March 19-20, 2013 – Győr
124
3.4. Differences among areas
Figure 2. Number of insect individuals caught by sodium lamp
Figure 3. Number of insect individuals caught by HMLI lamp
On the basis of the three diagrams, it we can state that insects caught in the highest number
belongs to flies (Diptera) and cicada (Hemiptera) orders. With the sodium light, flies (Diptera) were caught in the transitional and on the artificial areas, the cicada (Hemiptera) order in natural areas were in the highest number (Figure 2). With the mixed HMLI light, the cicada (Hemiptera) order has a very high number in the natural area, flies (Diptera) in the transitional, and there is a significant number of individuals in the artificial area (Figure 3). The compact light attracted the highest number of insects in the transitional area, and these insects belong to the order of flies (Diptera). In the artificial area it was also the flies (Diptera) order which dominated but with a lower number of individuals. It can be seen that in the natural area the highest number of individuals belongs to the cicada (Hemiptera) order (Figure 4).

Science for Sustainability University of West Hungary International Scientific Conference for PhD Students March 19-20, 2013 – Győr
125
Figure 4. Number of insect individuals caught by compact lamp
4. CONCLUSIONS
Based on our results, we can declare that the light traps collected most of the insects in June. With regard to the light sources, sodium and compact light attracted flies (Diptera), and the HMLI lamp attracted cicadas (Hemiptera) in the highest number. Individuals, belonging to all the five dominances, were only attracted by sodium lamps. The least of them were caught by compact lights. In the pattern areas lit by three different ways, the light traps attracted mostly those individuals belonging to three orders, as follows: flies (Diptera), cicadas (Hemiptera) and butterflies (Lepidoptera). Acknowledgements: We wish to thank „TALENTUM PROJECT” TÁMOP 4.2.2.B-10/1-2010-0018. References BÜRGÉS, GY. – GÁL, T- EKE, I. (1976): A szelídgesztenye- és tölgytermés kártevőinek előrejelzése. [Prediction of
Pests of Sweet Chestnut and Oak Corp]. Erdészeti Lapok 2 pp.:73-76. (in Hungarian) KOVÁCS, A. (2008): Futóbogár fauna felmérés a Soproni Hidegvíz-völgy Erdőrezervátumban. [Assessment of
Ground Beetle Fauna in the Sopron Hidegvízvölgy Forest Reservation.] Thesis, University of West - Hungary, pp. 16-18. (in Hungarian)
NOWINSZKY, L. (2003): A fénycsapdázás kézikönyve. [Handbook of Light Trapping.] Savaria University Press, Szombathely, pp. 7-9. (in Hungarian)
NOWINSZKY, L. (2007): A Jermy típusú fénycsapda gyűjtési távolsága fényszennyezett környezetben. [Collection Capacity of Jermy-type Light Traps in a Light Polluted Area.] Növényvédelem 43 (1):31-36. (in Hungarian)

Science for Sustainability University of West Hungary International Scientific Conference for PhD Students March 19-20, 2013 – Győr
126
Section 2.2 Ecosystems and Climate Change: Impact Monitoring and Projections
Uncertainties in Modelling Ecosystem Response to Environmental Change: The Bayesian Approach
VAN OIJEN, Marcel
Centre for Ecology and Hydrology (CEH-Edinburgh), U.K. ([email protected])
1. INTRODUCTION
Process-based models (PBMs) are common tools for analysing and predicting the impact of environmental change on ecosystems. PBMs are used because ecosystems are not static: they are dynamic systems that change over time in response to the environment. Here, we focus on PBMs that simulate the dynamics of soil-vegetation systems such as grasslands and forests.
Most PBMs for vegetation are complex deterministic simulators that are highly nonlinear. The models simulate the cycling of carbon, water and nutrients within vegetation and across the boundaries with soil and atmosphere. The PBMs are written as sets of differential equations which are solved numerically, making the models computationally demanding. Uncertainties associated with process-based modelling are often not quantified and analysed fully. We review recent work on PBM uncertainties and show how Bayesian methods can be used to reduce the uncertainties.
2. UNCERTAINTIES IN PROCESS-BASED MODELLING
A PBM can be seen as a function that transforms inputs (environmental drivers and parameters) into outputs. All uncertainty in the outputs of PBMs for any specific site thus derives from uncertainty about model structure and about model inputs. Uncertainty about the appropriate structure of ecosystem PBMs is large, as is evident from the large number of very different models that have been proposed in the literature. For example, the Register of Ecological Models (REM; http://ecobas.org/www-server) currently holds 78 forest models and 34 grassland models, and many more models can be found in the literature. The second type of uncertainty, about model inputs, is caused by incomplete knowledge of past and future weather conditions, inaccurate and imprecise soil maps, and poorly known process parameters and initialisation constants of the model’s state variables. LEVY et al. (2004) quantified the forward propagation of both structural and input uncertainty in forest modelling by feeding multiple PBMs with parameter values sampled from probability distributions that reflected the lack of unanimity in the literature. In their analysis, the structural and input uncertainties were so large that the capacity of PBMs to predict the impact on forests of atmospheric nitrogen deposition was severely limited (Figure 1).

Science for Sustainability University of West Hungary International Scientific Conference for PhD Students March 19-20, 2013 – Győr
127
Jmax
-100 0 100 200 300 400 500
0.00
0.04
0.08
0.12
0.16
Vmax
-50 0 50 100 150 200 250 300
0.00
0.05
0.10
0.15
0.20
0.25
umax,root
-0.05 0.00 0.05 0.10 0.15 0.20 0.25 0.30
0.00
0.05
0.10
0.15
0.20
0.25
0.30
froot
-0.5 0.0 0.5 1.0 1.5
0.00
0.05
0.10
0.15
0.20
0.25
Initial Csoluble
-0.05 0.00 0.05 0.10 0.15 0.20 0.25 0.30 0.35
0.00
0.05
0.10
0.15
0.20
Initial Cstarch
-0.05 0.00 0.05 0.10 0.15 0.20 0.25 0.30 0.35
0.00
0.05
0.10
0.15
0.20
Initial Wtotal
Value
-0.01 0.00 0.01 0.02 0.03 0.04 0.05 0.06
0.0
0.1
0.2
0.3
0.4
0.5
Initial Nsoluble
Value
-0.01 0.00 0.01 0.02 0.03 0.04 0.05 0.06
0.00
0.05
0.10
0.15
0.20
Photosynthesis
Fre
qu
ency
Parameter value
Parameter value
Allocation
C-pools
N-pools
bgc
century
hybrid
bgc
0.0
0.1
0.2
0.3
0.4
century
qy
0.0
0.1
0.2
0.3
0.4
hybrid
-40 -20 0 20 40 60 80
0.0
0.1
0.2
0.3
0.4
NdepUE (kg C kg-1 N)
Increase in C-stock per unit deposited N
Figure 1. Propagation of uncertainty in process-based modelling, from inputs (left) to outputs (right).
3. BAYESIAN METHODS: BC AND BMC
All uncertainties can be expressed as probability distributions. Common choices are normal (Gaussian) distributions for uncertainty about measurement error, and log-normal distributions for uncertainty about model parameters. The advantage of using probability distributions is that we can use the tools of probability theory to reduce uncertainties (OGLE & BARBER 2008). The main tool to use is Bayes’ Theorem. It can be used in so-called Bayesian Calibration (BC), where information from measurements is used to change a high-uncertainty prior probability distribution for parameters into a posterior distribution with lower uncertainty. Bayes’ Theorem can also be used to reduce uncertainty about which one from a collection of competing models is the most plausible one, and then we speak of Bayesian Model Comparison (BMC) (e.g. TUOMI et al. 2008; VAN OIJEN 2008).
Applying BC and BMC to PBMs is computationally demanding: both methods require running the models for many different settings of the parameters. However, efficient sampling algorithms have been developed, mainly of the MCMC-family (Markov Chain Monte Carlo), which permit easy use for all but the slowest PBMs (GILKS et al. 1996).
4. EXAMPLES OF BC AND BMC
The following is a very small selection of examples of the use of BC and BMC with PBMs: • YELURIPATI et al. (2009) showed that the practice of spinning-up PBMs (initialising soil
carbon pools by running the models to equilibrium) can be replaced by BC if soil respiration data are available.
• VAN OIJEN et al. (2005) showed how BC can be used to determine which kind of measurements would be most beneficial in reducing model uncertainty.
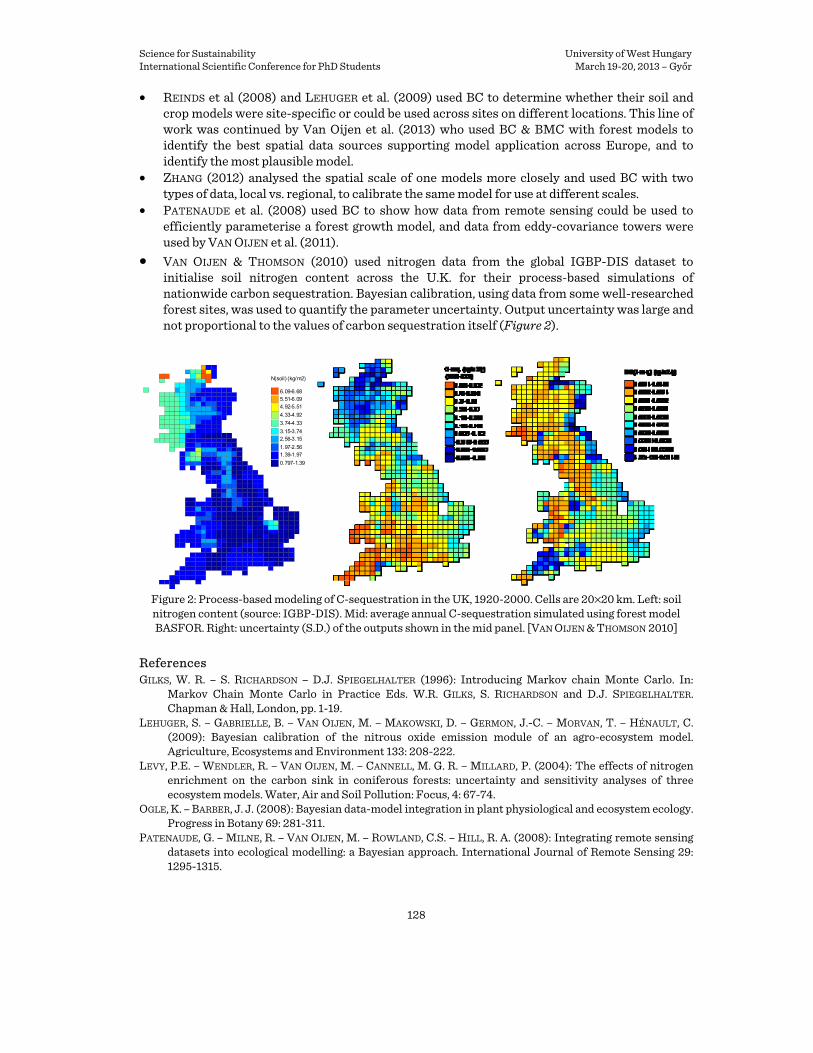
Science for Sustainability University of West Hungary International Scientific Conference for PhD Students March 19-20, 2013 – Győr
128
• REINDS et al (2008) and LEHUGER et al. (2009) used BC to determine whether their soil and crop models were site-specific or could be used across sites on different locations. This line of work was continued by Van Oijen et al. (2013) who used BC & BMC with forest models to identify the best spatial data sources supporting model application across Europe, and to identify the most plausible model.
• ZHANG (2012) analysed the spatial scale of one models more closely and used BC with two types of data, local vs. regional, to calibrate the same model for use at different scales.
• PATENAUDE et al. (2008) used BC to show how data from remote sensing could be used to efficiently parameterise a forest growth model, and data from eddy-covariance towers were used by VAN OIJEN et al. (2011).
• VAN OIJEN & THOMSON (2010) used nitrogen data from the global IGBP-DIS dataset to initialise soil nitrogen content across the U.K. for their process-based simulations of nationwide carbon sequestration. Bayesian calibration, using data from some well-researched forest sites, was used to quantify the parameter uncertainty. Output uncertainty was large and not proportional to the values of carbon sequestration itself (Figure 2).
0.797-1.39
1.39-1.971.97-2.56
2.56-3.153.15-3.74
3.74-4.33
4.33-4.92
4.92-5.515.51-6.096.09-6.68
N(soil) (kg/m2)
Figure 2: Process-based modeling of C-sequestration in the UK, 1920-2000. Cells are 20×20 km. Left: soil nitrogen content (source: IGBP-DIS). Mid: average annual C-sequestration simulated using forest model BASFOR. Right: uncertainty (S.D.) of the outputs shown in the mid panel. [VAN OIJEN & THOMSON 2010]
References GILKS, W. R. – S. RICHARDSON – D.J. SPIEGELHALTER (1996): Introducing Markov chain Monte Carlo. In:
Markov Chain Monte Carlo in Practice Eds. W.R. GILKS, S. RICHARDSON and D.J. SPIEGELHALTER. Chapman & Hall, London, pp. 1-19.
LEHUGER, S. – GABRIELLE, B. – VAN OIJEN, M. – MAKOWSKI, D. – GERMON, J.-C. – MORVAN, T. – HÉNAULT, C. (2009): Bayesian calibration of the nitrous oxide emission module of an agro-ecosystem model. Agriculture, Ecosystems and Environment 133: 208-222.
LEVY, P.E. – WENDLER, R. – VAN OIJEN, M. – CANNELL, M. G. R. – MILLARD, P. (2004): The effects of nitrogen enrichment on the carbon sink in coniferous forests: uncertainty and sensitivity analyses of three ecosystem models. Water, Air and Soil Pollution: Focus, 4: 67-74.
OGLE, K. – BARBER, J. J. (2008): Bayesian data-model integration in plant physiological and ecosystem ecology. Progress in Botany 69: 281-311.
PATENAUDE, G. – MILNE, R. – VAN OIJEN, M. – ROWLAND, C.S. – HILL, R. A. (2008): Integrating remote sensing datasets into ecological modelling: a Bayesian approach. International Journal of Remote Sensing 29: 1295-1315.
Science for Sustainability University of West Hungary International Scientific Conference for PhD Students March 19-20, 2013 – Győr
129
REINDS, G. J. – VAN OIJEN, M. – HEUVELINK, G. B. M. – KROS, H. (2008): Bayesian calibration of the VSD soil acidification model using European forest monitoring data. Geoderma 146: 475-488.
TUOMI, M. – VANHALA, P. – KARHU, K. – FRITZE, H. – LISKI, J. (2008): Heterotrophic soil respiration – Comparison of different models describing its temperature dependence. Ecological Modelling 211: 182-190.
VAN OIJEN, M. (2008): Bayesian Calibration (BC) and Bayesian Model Comparison (BMC) of process-based models: Theory, implementation and guidelines. CEH, 19 pp. Freely downloadable from http://nora.nerc.ac.uk/6087/
Van Oijen, M. – Cameron, D. R. – Butterbach-Bahl, K. – Farahbakhshazad, N. – Jansson, P.-E. – Kiese, R. – Rahn, K.-H. – Werner, C. – Yeluripati, J.B. (2011): A Bayesian framework for model calibration, comparison and analysis: application to four models for the biogeochemistry of a Norway spruce forest. Agriculture and Forest Meteorology 151: 1609-1621.
Van Oijen, M. – Reyer, C. – Bohn, F. J. – Cameron, D. R. – Deckmyn, G. – Flechsig, M. – Härkönen, S. – Hartig, F. – Huth, A. – Kiviste, A. – Lasch, P. – Mäkelä, A. – Mette, T. – Minunno, F. – Rammer, W. (2013): Bayesian calibration, comparison and averaging of six forest models, using data from Scots pine stands across Europe. Forest Ecology and Management 289: 255-268.
VAN OIJEN, M. – ROUGIER, J. – SMITH, R. (2005): Bayesian calibration of process-based forest models: bridging the gap between models and data. Tree Physiology 25: 915-927.
VAN OIJEN, M. – THOMSON, A. (2010): Towards Bayesian uncertainty quantification for forestry models used in the United Kingdom Greenhouse Gas Inventory for land use, land use change, and forestry. Climatic Change 103: 55-67.
YELURIPATI, J.B. – VAN OIJEN, M. – WATTENBACH, M. – NEFTEL, A. – AMMANN, A. – PARTON, W.J. – SMITH, P. (2009): Bayesian calibration as a tool for initialising the carbon pools of dynamic soil models. Soil Biology and Biochemistry 41: 2579-2583.
ZHANG, W. (2012): Spatial upscaling of a forest ecosystem model. MSc-thesis Univ. Edinburgh.
Precipitation Conditions in the Carpathian Basin Related to Mediterranean Cyclones
KELEMEN Fanni Dóraa* – PRÁGER Tamása aDepartment of Meteorology, Eötvös Loránd University, Busapest, Hungary
Abstract – The aim of this study is to give a climatologic analysis of Mediterranean cyclones, and the precipitation events related to them in the Carpathian Basin. This analysis will be further used to validate the capability of a regional climate model' (RegCM) to reproduce Mediterranean cyclones, and their precipitation. Information about the performance of the model is necessary for interpreting its results, and it also may help to improve the model and reduce precipitation bias. These improvements are especially essential for impact studies where the model outputs are directly used. Keywords: cyclone identification / mean sea level pressure / vorticity / reanalysis
1. INTRODUCTION
The weather of the Carpathian Basin is mainly formed by mid-latitude cyclones, but among these cyclones there are some differences regarding their origin and other parameters. In this study we
* Corresponding author: [email protected], Eötvös Loránd University, Department of Meteorology, H-1117, Budapest, Pázmány Péter sétány 1/A.

Science for Sustainability University of West Hungary International Scientific Conference for PhD Students March 19-20, 2013 – Győr
130
are focusing on cyclones which have their origin in the Mediterranean area. These disturbations are usually smaller in size and their pressure field is also weaker than that of the typical mid-latitude cyclones of the Euro-Atlantic area, formed over the Atlantic. However, the precipitation associated with them is important for our region. The dynamics of these cyclones are highly influenced by the Mediterranean Sea, which is a moisture and energy (latent heat) source for the atmosphere, and in this way a genesis and reinforcement area for cyclones.
The aim of this paper is to describe cyclone climatology of the Mediterranean region based on reanalysis of atmospheric conditions, and to investigate the precipitation amount related to the cyclonic activity in the Carpathian Basin. The motivation for this study is to give a basis for the performance analysis of a regional climate model (RegCM) considering Mediterranean cyclones. The investigation of RegCM is not presented here, since the model simulations have not been completed yet.
Objective cyclone identification methods may consider mean sea level pressure (MSLP) fields, and associate cyclones with local pressure minima (SERREZE 1995, BARTHOLY et al. 2008), or investigate only the geopotential field at 1000 hPa, and search also for local minima (TRIGO et al. 1999). The sea level pressure field can be analysed after a band-pass Lanczos digital filter (LIONELLO – GIORGI 2007), which filters the synoptical signals also called storm tracks from the field. Since cyclones are not only pressure depressions, but also three dimensional vortices, their identification can be achieved by using quasi-geostrophic relative vorticity (Laplacian of pressure), and low-tropospheric vorticity fields, where they appear as local maxima (HOSKINS – HODGES 2002, PINTO et al. 2005). Vorticity is more suitable for the identification of smaller scale systems, since this field is less influenced by large spatial scales like the MSLP field (HOSKINS – HODGES 2002). The other drawback of the MSLP field against vorticity field is that MSLP is an extrapolated field, and may be sensitive to the way the extrapolation was performed and to the representation of orography during the extrapolation.
The cyclone identification in this paper is performed on a reanalysis dataset for the Mediterranean region and the Carpathian Basin using data of the period 1981-2010. To improve the localization of cyclones, a bicubic spline interpolation is accomplished from the original 2.5°×2.5° horizontal resolution to a regular 0.5°×0.5° grid. The identification algorithm searches for cyclone centres as local pressure minima in the mean sea level pressure field and vorticity maxima at the 850 hPa isobaric level. The mean sea level pressure field is an essential indicator for cyclones as low pressure systems. Also, the vorticity field is considered as a feasible indicator of smaller scale systems, like Mediterranean cyclones. The precipitation dataset used in this study is the E-OBS daily gridded observational data. The daily data gridpoints which can be associated with cyclonic activity are selected and analysed.
The structure of the paper is as follows: In Section 2 a description of the data and the method used is given, in Section 3 the results are presented, and finally Section 4 summarizes the main conclusions of the study.
2. DATA AND METHOD
2.1. NCEP-DOE Reanalysis 2
The basis of our cyclone identification algorithm is the reanalysis data of the National Centers for Environmental Prediction (NCEP) and the National Energy Research Supercomputing Center (NERSC) of the Department of Energy (DOE) (KANAMITSU et al. 2002) (NCEP-DOE R-2), which is the updated NCEP/ NCAR (National Center for Atmospheric Research) reanalysis, covering the period 1979.01.–2012.06. Reanalysis datasets are global analyses of the atmosphere for research purposes, produced by assimilation of past data. The NCEP-DOE reanalysis consists of the

Science for Sustainability University of West Hungary International Scientific Conference for PhD Students March 19-20, 2013 – Győr
131
assimilation of land surface, ship, aircraft, radiosonde, satellite and many other data, and uses an unvarying state-of-the-art data assimilation system (KALNAY et al. 1996).
Reanalysis data were chosen to be used for our study because cyclone identification requires a spatially and temporally regular and quite dense data set, which is not the case when using only raw observational data. As mentioned above, for the cyclone identification we used mean sea level pressure and 850 hPa vorticity fields. The pressure field has been explicitly available from the NCEP-DOE R-2 database, the vorticity field was calculated by derivating the 850 hPa isobaric level v (northward wind component) and u (eastward wind component) fields of the reanalysis (Eq. 1).
yu
xv
∂∂−
∂∂=ζ (Eq. 1)
From the global data we selected the Mediterranean region, from 25.25° to 57.25°N and from 17.25°W to 47.25°E.
The dowloaded data was on a 2.5°×2.5° resolution lon-lat grid, which we interpolated to a 0.5°×0.5° grid. The interpolation was made by a bicubic spline, since it has been found that the use of spline interpolation improves the localisation of cyclones (PINTO et al 2005). The improvement is mainly due to the better spatial representation of cyclone centers, however, this method does not add any extra information to the original data. The other reason for choosing the interpolation was that the RCM that will be considered runs on a 50 km horizontal resolution rectangular grid, which is nearly the same as the 0.5°×0.5° lon-lat grid. The bicubic spline interpolation produces a smooth field from the original data, since it utilizes also the first and the second derivatives of the original data. The interpolation formula is smooth in the first derivative and continuous in the second derivative. The interpolation was first performed on the MSLP, v and u fields, and after the interpolation the vorticity field was calculated with a numerical derivation formula (finite difference scheme). The interpolation was produced first, and then the calculation of the vorticity field, since this way the errors from the interpolation and the numerical derivation was smaller than if we first calculated the vorticity field and then interpolated it.
2.2. E-OBS
For the estimation of the cyclonic precipitation, a European land-only daily high-resolution gridded data set, called E-OBS was used (HAYLOCK et al. 2008). The dataset consists of time series of meteorological observations interpolated to a regular grid, it starts in 1950 and lasts till the recent past. The dataset is continously updated. The data is available on a 0.25 and 0.5 degree regular lat-lon grid, and on a 0.22 and 0.44 degree rotated pole grid. In this study we used the 0.5 degree regular lon-lat grid version. The available variables are daily precipitation sum, daily minimum, maximun and mean surface temperature, and daily average sea level pressure. In this study only the precipitation dataset was used. The sea surface pressure data was not applied for the cyclone identification, since E-OBS is a land-only dataset, and we investigate the Mediterranean region, where the main cylogenesis centers are above the Mediterranean Sea.
2.3. Method
The cyclone identification algorithm used in our study first detects local maxima in the 850 hPa vorticity field and local minima in the MSLP field. The extremes are selected as the centers of 21×21 grid boxes. The size of the grid boxes was chosen to be 21 grids, since this size is around 1000 km, and it was shown by TRIGO et al. (1999) that the radius of the majority of Mediterranean cyclones is less than 550 km. In the next step the algorithm searches for a pressure minimum in the vicinity of the vorticity maximum, namely in the 21×21 grid box where the actual vorticity

Science for Sustainability University of West Hungary International Scientific Conference for PhD Students March 19-20, 2013 – Győr
132
maximum is located. If it finds one pressure minimum, then it is considered as a cyclone center. After the identification of the cyclone center the algorithm defines the area of the cyclon. Those grids are considered as part of the cyclon which are around one detected center, in which the pressure is lower than 1013.5 hPa, and whose vorticity is positive. The thresholds used here were selected after considering the literature (TRIGO et al. 1999, PICORNELL et al. 2001, BARTHOLY et al. 2009) and with the use of several empirical validations. For the validation the synoptic analyses of the Hungarian Meteorological Service were used.
Actually, the algorithm detects the majority of the occuring real systems, it dismisses mainly the shallow systems, and the bigger Atlantic systems which appear at the northern edge of the domain. These inaccuracies are mainly due to the fact that the thresholds were selected for Mediterranean cyclones.
After detecting the cyclones from the reanalysis fields, the data of the cyclonic areas have been compared with the E-OBS precipitation dataset by selecting those precipitation events which could be attached to a cyclone passing through the area.
3. RESULTS AND DISCUSSION
In this section the main results of our study are presented. It has been found that the precipitation related to those cyclones which were detected by our algorithm make up approximately 30% of the total precipitation amount over the Charpatian Basin. The multi-year monthly and the anual precipitation sums showed the same 30% rate between the cyclonic and the total precipitation.
The results of the multi-year monthly cyclonic precipitation analysis is shown in Figure 1. The largest ammount of precipitation from the detected cyclones on the monthly distribution appear in June, and the less intense period is in January. According to the exemination of the total precipitation sums for these months, the most intense month is April, where 44% of the total precipitation fall from the detected cyclones.
Multi-year montly cyclonic precipitation sum in Hungary
0
100
200
300
400
500
600
700
1 2 3 4 5 6 7 8 9 10 11 12
month
[mm
]
Figure 1. The multi-year cyclonic precipitation sums in Hungary for the period 1981-2010.
The spatial distribution of this data was investigated too, but due to the length constraints of
this paper we only introduce the two extreme months, January and June (Figure 2). In January a southwest-northeast gradient can be seen, which means that in January the cyclonic precipitation strongly depends on the distance from the Mediterranean Sea. In June mainly the effect of orography can be seen on the precipitation field.

Science for Sustainability University of West Hungary International Scientific Conference for PhD Students March 19-20, 2013 – Győr
133
a, January
b, June
Figure 2. The spatial distribution of the cyclonic precipitation for the 30 years in the Carpathian Basin for a, January and for b, June.
Finally, the time series of the cyclonic precipitation are shown in Figure 3. The average
annual cyclonic precipitation in Hungary according to our cyclone identification algorithm is 157 mm. From the time series it is easily seen that the wettest year was 2010 and the driest was 1990.
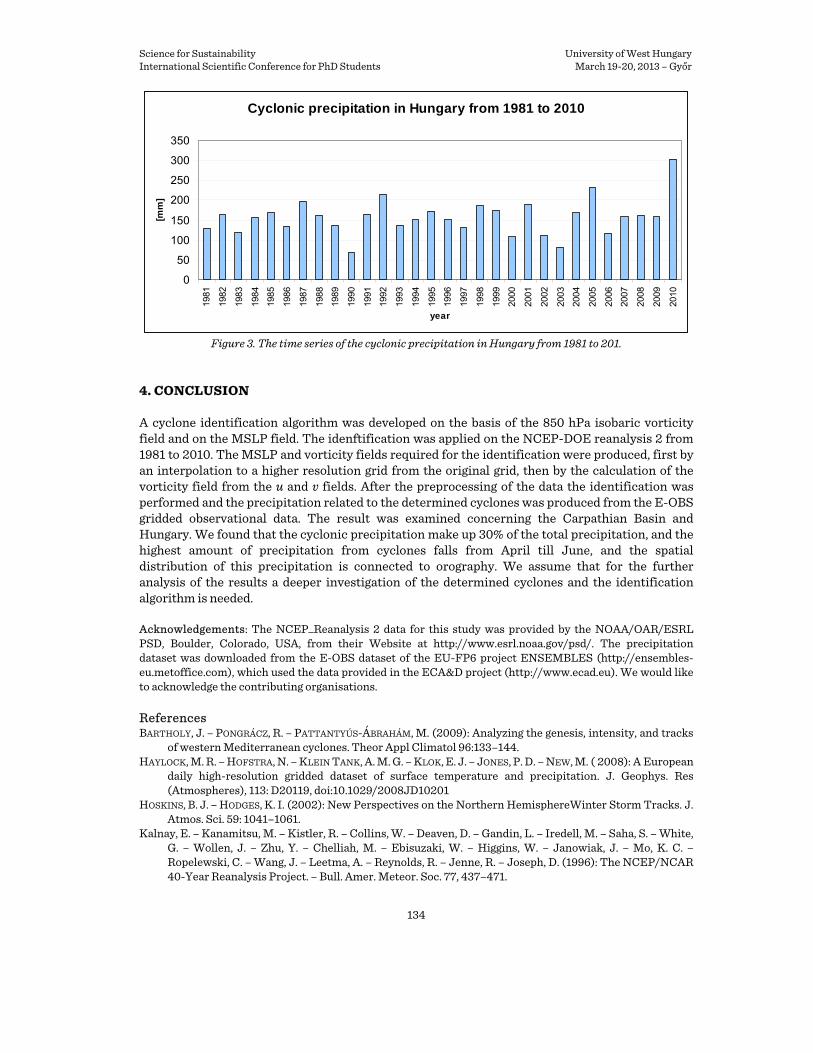
Science for Sustainability University of West Hungary International Scientific Conference for PhD Students March 19-20, 2013 – Győr
134
Cyclonic precipitation in Hungary from 1981 to 2010
0
50
100
150
200
250
300
350
1981
1982
1983
1984
1985
1986
1987
1988
1989
1990
1991
1992
1993
1994
1995
1996
1997
1998
1999
2000
2001
2002
2003
2004
2005
2006
2007
2008
2009
2010
year
[mm
]
Figure 3. The time series of the cyclonic precipitation in Hungary from 1981 to 201.
4. CONCLUSION
A cyclone identification algorithm was developed on the basis of the 850 hPa isobaric vorticity field and on the MSLP field. The idenftification was applied on the NCEP-DOE reanalysis 2 from 1981 to 2010. The MSLP and vorticity fields required for the identification were produced, first by an interpolation to a higher resolution grid from the original grid, then by the calculation of the vorticity field from the u and v fields. After the preprocessing of the data the identification was performed and the precipitation related to the determined cyclones was produced from the E-OBS gridded observational data. The result was examined concerning the Carpathian Basin and Hungary. We found that the cyclonic precipitation make up 30% of the total precipitation, and the highest amount of precipitation from cyclones falls from April till June, and the spatial distribution of this precipitation is connected to orography. We assume that for the further analysis of the results a deeper investigation of the determined cyclones and the identification algorithm is needed. Acknowledgements: The NCEP_Reanalysis 2 data for this study was provided by the NOAA/OAR/ESRL PSD, Boulder, Colorado, USA, from their Website at http://www.esrl.noaa.gov/psd/. The precipitation dataset was downloaded from the E-OBS dataset of the EU-FP6 project ENSEMBLES (http://ensembles-eu.metoffice.com), which used the data provided in the ECA&D project (http://www.ecad.eu). We would like to acknowledge the contributing organisations. References BARTHOLY, J. – PONGRÁCZ, R. – PATTANTYÚS-ÁBRAHÁM, M. (2009): Analyzing the genesis, intensity, and tracks
of western Mediterranean cyclones. Theor Appl Climatol 96:133–144. HAYLOCK, M. R. – HOFSTRA, N. – KLEIN TANK, A. M. G. – KLOK, E. J. – JONES, P. D. – NEW, M. ( 2008): A European
daily high-resolution gridded dataset of surface temperature and precipitation. J. Geophys. Res (Atmospheres), 113: D20119, doi:10.1029/2008JD10201
HOSKINS, B. J. – HODGES, K. I. (2002): New Perspectives on the Northern HemisphereWinter Storm Tracks. J. Atmos. Sci. 59: 1041–1061.
Kalnay, E. – Kanamitsu, M. – Kistler, R. – Collins, W. – Deaven, D. – Gandin, L. – Iredell, M. – Saha, S. – White, G. – Wollen, J. – Zhu, Y. – Chelliah, M. – Ebisuzaki, W. – Higgins, W. – Janowiak, J. – Mo, K. C. – Ropelewski, C. – Wang, J. – Leetma, A. – Reynolds, R. – Jenne, R. – Joseph, D. (1996): The NCEP/NCAR 40-Year Reanalysis Project. – Bull. Amer. Meteor. Soc. 77, 437–471.

Science for Sustainability University of West Hungary International Scientific Conference for PhD Students March 19-20, 2013 – Győr
135
Kanamitsu, M. – Ebisuzaki, W. – Woollen, J. – Yang, S-K. – Hnilo, J. J. – Fiorino, M. – Potter, G. L. (2002): NCEP–DOE AMIP-II Reanalysis (R-2). Bull. Amer. Meteor. Soc. 83 (11): 1631-1643
LIONELLO, P. – GIORGI, F. (2007): Winter precipitation and cyclones in the Mediterranean region: future climate scenarios in a regional simulation. Adv. Geosci. 12 : 153–158.
PICORNELL, M. – JANSA, A. – GENOVES, A. – CAMPINS, J. (2001): Automated database of mesocyclones from the HIRLAM(INM)−0.5° analyses in the western Mediterranean. Int J Climatol 21: 335–354.
PINTO, J. G. – SPANGEHL, T. – ULBRICH, U. – SPETH, P. (2005): Sensitivities of a cyclone detection and tracking algorithm: individual tracks and climatology. Meteorol Zeitschrift 14: 823–838.
SERREZE, M.C., (1995): Climatological aspects of cyclone development and decay in the Arctic. Atmosphere-Ocean 33 (1): 1–23.
TRIGO, I. F. – DAVIES, T. D. – BIGG, GR (1999): Objective climatology of cyclones in the Mediterranean region. J Climate 12: 1685–1696.
Creation of the FORESEE Database to Support Climate Change Related Impact Studies
DOBOR Lauraa* – BARCZA Zoltána,b – HLÁSNY, Tomášc,d – HAVASI Ágnese a Department of Meteorology, Eötvös Loránd University, Budapest, Hungary
b Institute of Ecology and Botany Centre for Ecological Research, Hungarian Academy of Sciences, Vácrátót, Hungary c National Forest Centre – Forest Research Institute, Zvolen, Slovakia
d Faculty of Forestry and Wood Sciences, Czech University of Life Sciences, Prague, Czech Republic e Department of Applied Analysis and Computational Mathematics, Eötvös Loránd University, Budapest, Hungary
Abstract – Regional climate model (RCM) based scenarios are fundamental tools for the estimation of climate change effects on the environment, ecosystems and society. Our aim was to create RCM-based climate scenarios that contain daily meteorological data (precipitation, maximum and minimum temperature) to support climate change related impact studies. We utilized the results of ten RCM experiments that were produced and made accessible within the framework of the ENSEMBLES FP6 project. We performed bias correction using the cumulative distribution functions fitting technique, which allowed for correcting the systematic errors in the RCM results. In case of precipitation both the intensity and the frequency of precipitation was corrected. The resulting database – the so called FORESEE database – contains daily meteorological data based on the ten RCM results for 2010-2100, and observation based data for the period 1951-2009 interpolated to 1/6×1/6 degree spatial resolution grid. Central Europe is the target area of the FORESEE database. Keywords: meteorological data / climate change / daily meteorology / bias correction
1. INTRODUCTION
Despite significant efforts, anthropogenic greenhouse gas emission is not expected to be reduced to the desired level (for current trends see PETERS et al. 2012), and thus mankind cannot reduce the strength of climate change significantly. In order to mitigate the potential damage caused by the changing environmental conditions we have to estimate the impacts of climate change and develop adaptation strategies (IPCC 2007a). Increasing demand on impact studies calls for reliable climate data feeding the impact models (DOSIO – PARUOLO 2011). As many natural and socio-economic systems are affected by the meteorological conditions, reliable meteorological data are substantial for the investigation of both past and future effects on climate on such systems. For the past, direct * Corresponding author: [email protected]; H-1117 Budapest, Pázmány P. sétány 1/A

Science for Sustainability University of West Hungary International Scientific Conference for PhD Students March 19-20, 2013 – Győr
136
measurements or observation-based gridded datasets are available, while climate model results can be used for the decription of future climates (IPCC 2007b).
In the past, many research organisations developed and ran climate models, and disseminated their results freely via the Internet to provide the support for climate change impact studies. Such data has been broadly used in many fields of research; however, not everybody is aware of the availability and characteristics of climate model outputs. Climatologists recognize that outputs of any climate model contain systematic errors (CHRISTENSEN et al. 2008). Fortunately, these systematic errors are quite stable in time (MARAUN 2012), thus the errors are not causing problems if only the expected changes are examined. However, problems may arise when such data are to be used for climate change related impact study, which generally requires realistic daily meteorology.
For these reasons, our aim was to create a database providing the scientific community with essential daily meteorological data suitable for impact studies in various sectors in Central Europe.
2. MATERIALS AND METHODS
We used observation based datasets and climate model results to create a daily meteorological database for the period 1951-2100 for Central Europe (Figure 1), which contains minimum/maximum temperature and precipitation time series.
Figure 1. The target area of the FORESEE database (dotted rectangle) containing climatic data for the period
1951-2100. The data are distributed in 5,408 (104×52) grid cells organized in 1/6×1/6° regular grid.
For the past (1951-2009) the daily E-OBS database (created within the framework of the ENSEMBLES FP6 project; HAYLOCK et al. 2008) and the monthly CRU TS 1.2 (Climatic Research Unit, University of East Anglia, UK; MITCHELL et al. 2004) high resolution gridded dataset were used. For practical reasons, we used version 3.0 of E-OBS for 1951-1961, and a newer version (precipitation: version 5.0; temperature: version 7.0) for the period 1961-1990. We found that the CRU based data provides better estimates for Hungary than the E-OBS database on the monthly time scale. Thus, we first corrected the E-OBS database using the monthly CRU TS 1.2 dataset, and such data set has been used for the bias correction and for the reconstruction of past meteorological conditions.
For future climate description, we selected ten RCM-GCM (Regional Climate Model – Global Climate Model) couplings (Table 1; data is provided by the ENSEMBLES FP6 project; VAN DER LINDEN et al. 2009), and we executed a state-of-the-art bias correction on the daily meteorology fields for the period 1951-2100. All RCMs used were driven by the A1B greenhouse gas emission scenario (a balanced emphasis on all energy sources; IPCC 2000). As there were differences between the datasets (i.e., regarding the used calendar and coordinate system), all RCM results

Science for Sustainability University of West Hungary International Scientific Conference for PhD Students March 19-20, 2013 – Győr
137
were converted to a 365-day calendar. Then all of the data were interpolated to a common 1/6×1/6 degree horizontal resolution grid using an inverse distance interpolation technique.
Table 1. Bias corrected models included in the FORESEE database model
ID model name
(RCM-GCM) Developing institute
1 ALADIN-ARPEGE National Centre for Meteorological Research (CNRM) 2 CLM-HadCM3Q0 Swiss Federal Institute of Technology Zürich (ETHZ) 3 HadRM3Q0- HadCM3Q0 Hadley Centre for Climate Prediction and Research (HC) 4 HIRHAM5-ARPEGE Danish Meteorological Institute (DMI) 5 HIRHAM5-ECHAM5 Danish Meteorological Institute (DMI) 6 RACMO-ECHAM5 Royal Netherlands Meteorological Institute (KNMI) 7 RCA-ECHAM5 Sweden's Meteorological and Hydrological Institute (SMHI) 8 RCA-HadCM3Q0 Sweden's Meteorological and Hydrological Institute (SMHI) 9 REGCM-ECHAM5 The Abdus Salam International Centre for Theoretical Physics (ICTP)
10 REMO-ECHAM5 Max-Planck-Institute for Meteorology (MPI) For the bias correction the period 1951-2009 was selected as a reference. This is the longest
period for which both observation-based data and RCM results are available. The applied bias correction method is based on the cumulative density function fitting technique. First, the climate model results and the observation based datasets were compared for the reference period, and correction factors were defined based on the monthly comparison. These correction factors were then applied to the daily climate model results for the past and also for the future. In case of the temperature the correction is a shifting, while in case of rate of precipitation it is a multiplication.
The correction of precipitation was done using more complicated procedure as monthly precipitation is not just characterized by the sum but also the frequency of precipitation. In order to adopt a state-of-the-art bias algorithm we corrected not just the rate but also the frequency of precipitation (DÉQUÉ 2007, INES – HANSEN 2007).
The methodology is described in detail in DOBOR et al. (2012).
3. RESULTS
Bias correction was performed on ten RCM results retrieved from the database of the ENSEMBLES project (Table 1). The final daily time series cover the period 1951-2100. As the corrected RCM results are consistent with the observations used for the correction, in the period 1951-2009 the RCM results were replaced by the CRU corrected E-OBS database. This is a necessary requirement of scientists performing impact studies as they generally validate their models using observations. Validation would be impossible if the RCM results were used, as they differ from the realization of the past weather.
Figure 2 shows a so-called thermopluviogram (temperature-precipitation plots using long term averages) based on the ten bias corrected RCM results for the whole target area. This type of plot can be used for fast visual investigation of relations between the RCMs, and can support the selection of models used for impact studies. In Figure 2 the green colour represents the mean annual temperature and precipitation amount for the period 1961-1990. The blue and the red colours show the 30-year means for the ten RCM-GCM couplings for the periods 2021-2050 and 2071-2100, respectively. Some properties of model results could be clearly seen in the thermopluviogram. The dashed lines show the average of the ten models for the given time slice. The model mean represents a drier and warmer climate for the future. Each model reveals a warming tendency, while course of change in precipitation differs among models.
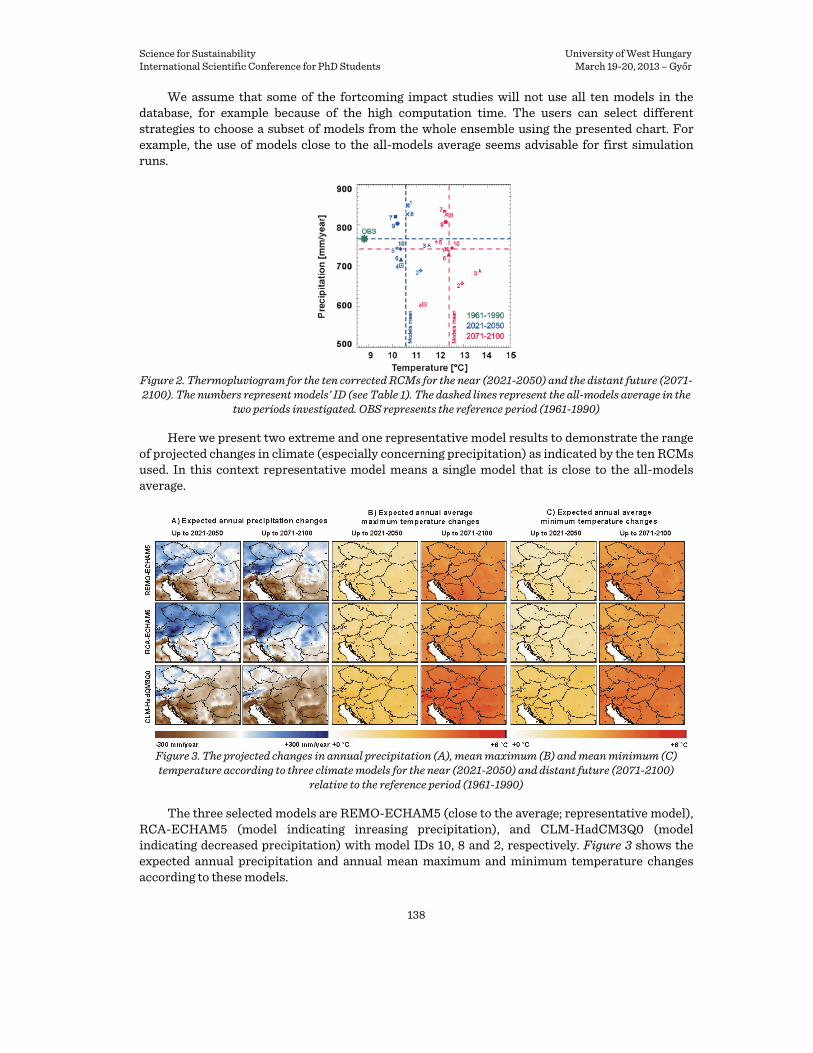
Science for Sustainability University of West Hungary International Scientific Conference for PhD Students March 19-20, 2013 – Győr
138
We assume that some of the fortcoming impact studies will not use all ten models in the database, for example because of the high computation time. The users can select different strategies to choose a subset of models from the whole ensemble using the presented chart. For example, the use of models close to the all-models average seems advisable for first simulation runs.
Figure 2. Thermopluviogram for the ten corrected RCMs for the near (2021-2050) and the distant future (2071-2100). The numbers represent models’ ID (see Table 1). The dashed lines represent the all-models average in the
two periods investigated. OBS represents the reference period (1961-1990)
Here we present two extreme and one representative model results to demonstrate the range of projected changes in climate (especially concerning precipitation) as indicated by the ten RCMs used. In this context representative model means a single model that is close to the all-models average.
Figure 3. The projected changes in annual precipitation (A), mean maximum (B) and mean minimum (C) temperature according to three climate models for the near (2021-2050) and distant future (2071-2100)
relative to the reference period (1961-1990)
The three selected models are REMO-ECHAM5 (close to the average; representative model), RCA-ECHAM5 (model indicating inreasing precipitation), and CLM-HadCM3Q0 (model indicating decreased precipitation) with model IDs 10, 8 and 2, respectively. Figure 3 shows the expected annual precipitation and annual mean maximum and minimum temperature changes according to these models.

Science for Sustainability University of West Hungary International Scientific Conference for PhD Students March 19-20, 2013 – Győr
139
Figure 3 suggests that the Mediterranean is expected to become drier according to all three models, while inside the land area the annual precipitation rates decrease to a smaller extent or even increase. The line between expected precipitation increase and decrease is usually oriented southwest-northeast and it is located north to the Carpathian Basin. In case of the temperature changes, each model estimates warming for the future, as has also been indicated by the thermopluviogram in Figure 2.
3. CONCLUSIONS
We introduced a new database that was created to support climate change related impact studies in Central Europe as well as to provide the essential daily meteorological data for studies concentrating on the past 60 years in this region. The database is called the FORESEE database (Open Database FOR ClimatE Change Related Impact Studies in CEntral Europe). The motivation for this work came up from our experience on needs of impact studies, and the fact that – up to our knowledge – there is no such database available for Central Europe. Specifically, the database should reflect the general needs of climate change impact studies, where the methodology of database construction is transparent, and all characteristics of the model results are described in detail. In the present study – due to length constraints – we could only provide a brief description of the main characteristics of the database. In the future we plan to further analyze the data and to provide climate maps for all models, and intra-annual characteristics of all ten models will be discussed.
We intend to create an open website for the dissemination of the FORESEE database, where the users will have easy access to the complete database, or alternatively to subsets of the data. Due to the high political and scientific pressure on estimating the anticipated impacts of the changing environment, we believe that construction and dissemination of the FORESEE database will be useful for the scientific community. Presently, the FORESEE database is available from the authors upon request (e-mail: [email protected]; bzoli@ elte.hu). Acknowledgements: The Project is supported by the European Union and co-financed by the European Social Fund (grant agreement no. TAMOP 4.2.1/B-09/1/KMR-2010-0003). We acknowledge the E-OBS dataset of the EU FP6 project ENSEMBLES (http://ensembles-eu.metoffice.com) and the data providers in the ECA&D project (http://eca.knmi.nl). The ENSEMBLES data used in this work was kindly provided by the EU FP6 Integrated Project ENSEMBLES (Contract number 505539). This research was funded by the Hungarian Scientific Research Foundation (OTKA K104816 and K67672), by the BioVeL project (Biodiversity Virtual e-Laboratory project, FP7-Infrastructures-2011-2, project number 283359) and by the CarpathCC project (Framework Contract Number ENV.D.1/FRA/2011/0006). The authors gratefully acknowledge the Climatic Research Unit of the University of East Anglia, UK, for providing the monthly high resolution dataset CRU TS 1.2. References CHRISTENSEN, J .H. – BOBERG, F. – CHRISTENSEN, O. B. – LUCAS-PICHER, P. (2008): On the need for bias
correction of regional climate change projections of temperature and precipitation. Geophys. Res. Lett., 35. L20709.
DÉQUÉ, M. (2007): Frequency of precipitation and temperature extremes over France in an anthropogenic scenario: Model results and statistical correction according to observed values. Glob. Plan. Change, 57, 16-26.
DOBOR L. – BARCZA Z. – HAVASI Á. – HLÁSNY T. (2012): Construction of a daily meteorological database for climate change related impact studies. In: Proceedings, The Atmosphere as risk and resource (eds.: Mika, J. et al.). 23 November, 2012, Eger, Hungary. CD-ROM (in press)
DOSIO, A. – PARUOLO, P. (2011): Bias correction of the ENSEMBLES high-resolution climate change projections for use by impact models: Evaluation on the present climate. J. Geophys. Res., 116, D16106.
Science for Sustainability University of West Hungary International Scientific Conference for PhD Students March 19-20, 2013 – Győr
140
GIORGI, F. (1990): Simulation of regional climate using a limited area model nested in general circulation model, J. Clim., 3, 941-963.
HAYLOCK, M. R. – HOFSTRA, N. – KLEIN TANK, A. M. G. – KLOK, E. J. – JONES, P. D. – NEW, M. (2008): A European daily high-resolution gridded data set of surface temperature and precipitation for 1950–2006. J. Geophys. Res., 113, D20119.
INES, A. – HANSEN, J. (2006): Bias correction of daily GCM rainfall for crop simulation studies. Agric. For. Meteorol., 138, 44-53.
IPCC (2000): Emissions scenarios. In: Nebojsa Nakicenovic and Rob Swart (eds.) Contribution of Working Group III to the Special Report of the Intergovernmental Panel on Climate Change. Cambridge University Press, Cambridge, United Kingdom. 570 pp
IPCC (2007a): Climate change 2007: Impacts, adaptation and vulnerability. In: M.L. Parry, O.F. Canziani, J.P. Palutikof, P.J. van der Linden and C.E. Hanson (eds.) Contribution of Working Group II to the Fourth Assessment Report of the Intergovernmental Panel on Climate Change. Cambridge University Press, Cambridge, United Kingdom and New York, NY, USA. 976 pp
IPCC (2007b): Climate change 2007: The physical science basis. In: Solomon, S., Qin, D., Manning, M., Chen, Z., Marquis, M., Averyt, K.B., Tignor, M., Miller, H.L. (eds.), Contribution of Working Group I to the Fourth Assessment Report of the Intergovernmental Panel on Climate Change. Cambridge University Press, Cambridge, United Kingdom and New York, NY, USA. 996p.
MARAUN, D. (2012): Nonstationarities of regional climate model biases in European seasonal mean temperature and precipitation sums, Geophys. Res. Lett., 39, L06706.
MITCHELL T. – CARTER T. R. – JONES P. D. – HULME M. – NEW M. (2004): A comprehensive set of high-resolution grids of monthly climate for Europe and the globe: the observed record (1901-2000) and 16 scenarios (2001-2100). Tyndall Centre. Working Paper 55.
Peters, G. P. – Andrew, R. M. – Boden, T. – Canadell, J .G. – Ciais, P. – Le Quéré, C. – Marland, G. – Raupach, M. R. – Wilson C. (2012): The challenge to keep global warming below 2 °C. Nature Clim. Change, 3, 4-6,
PIANI, C. – HAERTER, J. O. – COPPOLA, E. (2009): Statistical bias correction for daily precipitation in regional climate models over Europe. Theor. Appl. Climatol., 99, 187-192.
VAN DER LINDEN, P. – MITCHELL, J. F. B. (2009): ENSEMBLES: Climate Change and its Impacts: Summary of research and results from the ENSEMBLES project. Met Office Hadley Centre, FitzRoy Road, Exeter EX1 3PB, UK. 160pp.
Climatic Exposure of Forests in the Carpathians: Exposure Maps and Anticipated Development
TROMBIK, Jiřía* – HLÁSNY, Tomáša,b – DOBOR Laurac –BARCZA Zoltánc,d
A Faculty of Forestry and Environment, Czech University of Life Sciences, Prague, Czech Republic b National Forest Centre – Forest Research Institute in Zvolen, Zvolen, Slovakia
c Department of Meteorology, Eötvös Loránd University, Budapest, Hungary d Institute of Ecology and Botany, Centre for Ecological Research, Hungarian Academy of Sciences, Vácrátót, Hungary
Abstract – The Carpathians represent the largest European mountain range with diverse ecosystems and landuse. Recent recognition of climate change related threats to mountain ecosystems initiated an array of researches on this topic. This study investigates the anticipated development of selected bioclimatic variables in the Carpathians using an ensemble of climate change scenarios; and it presents the analysis of European beech climatic exposure as a part of integrated forest vulnerability assessment. Bioclimatic variables used are Holdridge`s annual
* Corresponding author: [email protected], Kamýcká 129, 165 21, Prague, Czech Republic

Science for Sustainability University of West Hungary International Scientific Conference for PhD Students March 19-20, 2013 – Győr
141
biotemperature and Ellenberg climatic quotient. Climate data were developed within the frame of the ENSEMBLES FP6 project, and further processed and made accessible through the FORESEE database. We identified a remarkable large-scale trend in the future development of addressed bioclimatic variables indicating more intensive drying and warming of climate in the Eastern and Serbian Carpathians as compared with the Western Carpathians. Exeedance of climatic limit for European beech persistence in terms of Ellenberg climatic quotient was found in all beech stands in the Hungarian and Serbian part of the Carpathians, and in large areas of beech stands in Romania.
Keywords: climate models / Ellenberg Climatic Quotient / Holdridge`s annual biotemperature / European beech
1. INTRODUCTION
Carpathians represent the largest European mountain range passing through Austria, Czech Republic, Slovakia, Poland, Hungary, Ukraine, Romania and Serbia (RUFFINI et al. 2006). Diverse climate is driven by elevational, latitudinal and continentality gradients; such climate along with diverse landuse support exceptional biodiversity reachness (GURUNG et al. 2009). Mountain areas, however, are vulnerable to climate change (DULLINGER et al. 2012), mainly because of the presence of an array of zonal communities in relatively limited space, and limited options for species migration to follow the shifting climate (MALCOLM et al. 2001). For these reasons, some transboundary initiatives addressing the vulnerability of Carpathian ecosystems and societies, and evaluating and implementing the adaptation options have appeared, such as Carpathian Convention, Carpathian Ecoregion Initiative, Carpathians Environmental Outlook, etc.; or EU funded projects such as CarpatClim, Carpivia or CarpathCC.
Regional climate projections imply that future climate in Central and Eastern Europe is likely to include temperature increase by as much as 3-5°C (CHRISTENSEN et al. 2007), while changes in precipitation distribution remain uncertain. In addition, future climate is likely to feature an increased frequency and severity of extreme droughts and hot spells (STERL et al. 2008). As survival of woody species is constrained by water availability, prolonged drought during vegetation season may induce episodes of large-scale tree decline (BRÉDA et al. 2006). In contrast, mountain ecosystems may benefit from prolonged vegetation season or increased nutrient input initiated by accelerated decomposition rates (FRIEDLINGSTEIN – PRENTICE 2010). The trade-off between such processes can shape the future of Carpathian forests.
In this paper, we investigate the anticipated development of selected bioclimatic variables in the Carpathians to assess the future climatic exposure of forests in this region. We focused on spatial variability of the climatic exposure of European beech (Fagus sylvatica L.) associated to the use of an ensemble of climate change scenarios. Two time period have been addressed – reference period (1961-1990) and distant future (2071-2100).
2. DATA AND METHODS
2.1. Study area
Carpathian border used in this study was designated as the union of borders specified by the Carpathian Ecoregion Initiative (www.carpates.org) and Carpathians Environment Outlook (KEO 2007) (Figure 1). The region covers parts of Austria (0.3%), Czech Republic (3.3%), Slovakia (15.9%), Poland (8.6%), Hungary (5.1%), Ukraine (11.9%), Romania (50.8%) and Serbia (4.1%). Size of the region is 229,966 km2. Elevation range is 27-2,604 m a.s.l. Forests cover 48% of the region, with 19% of coniferous, 59% percent of broadleaved and 22% of mixed forests (Corine LandCover 2000, European Environmental Agency).

Science for Sustainability University of West Hungary International Scientific Conference for PhD Students March 19-20, 2013 – Győr
142
2.2. Forest distribution data
Forest tree species distribution data were taken from statistical mapping of tree species over Europe based on the data of national forest inventories, predictive mapping and national forest statistics (BRUS et al. 2011). The result is a raster map with a resolution of 1×1 km, with information about species proportion in a cell. We corrected this data using the Corine Landcover data to remove forests identified in the statistical mapping which are distributed outside the border of forests in Corine LandCover data (see example of European beech in Annex 1b).
Figure 1. Study region position with state borders
2.3. Climate data
Used climate data was taken from the FORESEE database (DOBOR et al. 2012), which contains the modified results of regional climate simulations performed within the frame of the ENSEMBLES project (VAN DER LINDEN et al. 2009). Four Regional Climate Models (RCMs) were used for the decription of future climate – RegCM (The Abdus Salam International Centre for Theoretical Physics), HIRHAM5 (Danish Meteorological Institute), RACMO (Royal Netherlands Meteorological Institute) and REMO (Max-Planck-Institute for Meteorology). The Global Regional Model ECHAM5 and emission scenario A1B (NAKICENOVIC – SWART 2000) were used to drive the regional climate simulations. The modified and interpolated E-OBS dataset (HAYLOCK et al. 2008), which is a part of the FORESEE database as well, was used to describe the reference climate. Two time periods have been addressed in this study – 1961-1990 (reference climate) and 2071-2100 (distant future climate).
We investigated the future variability of Holdridge`s annual biotemperature (HOLDRIDGE 1947) and Ellenberg climatic quotient (ELLENBERG 1988) in relation to the distribution of European beech (Fagus sylvatica) in the Carpathians; these bioclimatic variables were derived from the described climate data. External drift kriging based interpolation was used to produce the maps of variables thereof, using elevation as supportive variable (HUDSON – WACKERNAGEL 1994, VIZI et al. 2011).
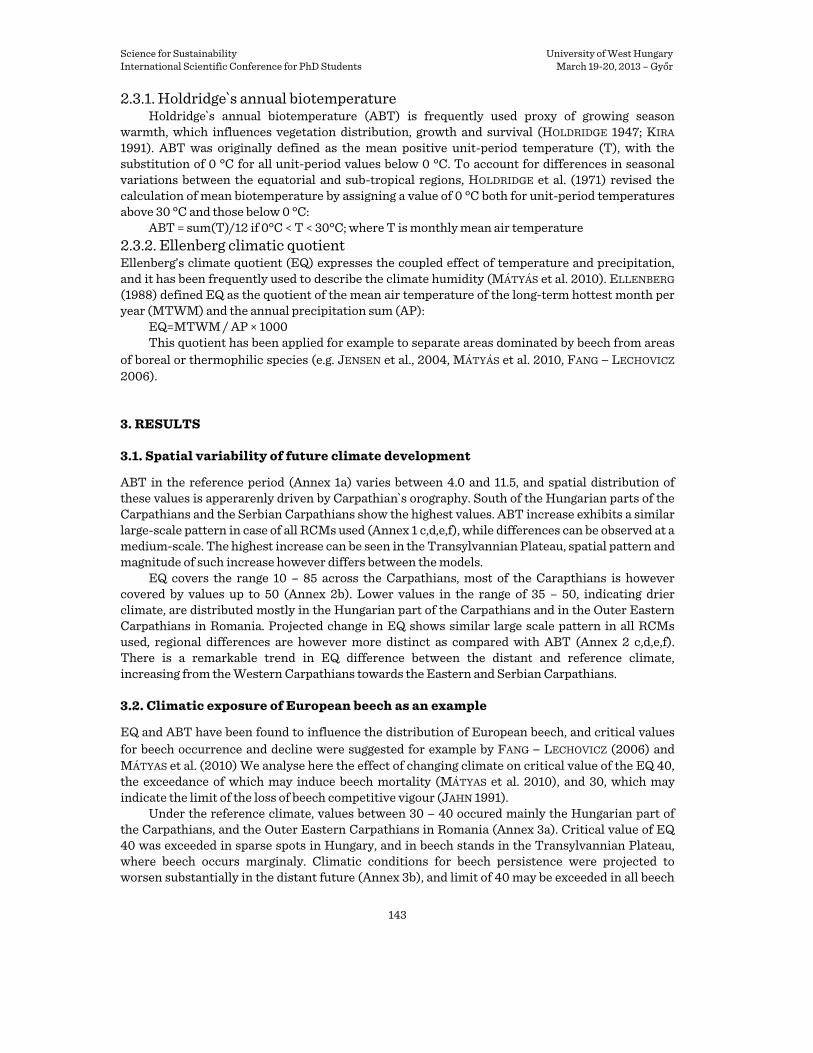
Science for Sustainability University of West Hungary International Scientific Conference for PhD Students March 19-20, 2013 – Győr
143
2.3.1. Holdridge`s annual biotemperature Holdridge`s annual biotemperature (ABT) is frequently used proxy of growing season
warmth, which influences vegetation distribution, growth and survival (HOLDRIDGE 1947; KIRA 1991). ABT was originally defined as the mean positive unit-period temperature (T), with the substitution of 0 °C for all unit-period values below 0 °C. To account for differences in seasonal variations between the equatorial and sub-tropical regions, HOLDRIDGE et al. (1971) revised the calculation of mean biotemperature by assigning a value of 0 °C both for unit-period temperatures above 30 °C and those below 0 °C:
ABT = sum(T)/12 if 0°C < T < 30°C; where T is monthly mean air temperature 2.3.2. Ellenberg climatic quotient Ellenberg’s climate quotient (EQ) expresses the coupled effect of temperature and precipitation, and it has been frequently used to describe the climate humidity (MÁTYÁS et al. 2010). ELLENBERG (1988) defined EQ as the quotient of the mean air temperature of the long-term hottest month per year (MTWM) and the annual precipitation sum (AP):
EQ=MTWM / AP × 1000 This quotient has been applied for example to separate areas dominated by beech from areas
of boreal or thermophilic species (e.g. JENSEN et al., 2004, MÁTYÁS et al. 2010, FANG – LECHOVICZ 2006).
3. RESULTS
3.1. Spatial variability of future climate development
ABT in the reference period (Annex 1a) varies between 4.0 and 11.5, and spatial distribution of these values is apperarenly driven by Carpathian`s orography. South of the Hungarian parts of the Carpathians and the Serbian Carpathians show the highest values. ABT increase exhibits a similar large-scale pattern in case of all RCMs used (Annex 1 c,d,e,f), while differences can be observed at a medium-scale. The highest increase can be seen in the Transylvannian Plateau, spatial pattern and magnitude of such increase however differs between the models.
EQ covers the range 10 – 85 across the Carpathians, most of the Carapthians is however covered by values up to 50 (Annex 2b). Lower values in the range of 35 – 50, indicating drier climate, are distributed mostly in the Hungarian part of the Carpathians and in the Outer Eastern Carpathians in Romania. Projected change in EQ shows similar large scale pattern in all RCMs used, regional differences are however more distinct as compared with ABT (Annex 2 c,d,e,f). There is a remarkable trend in EQ difference between the distant and reference climate, increasing from the Western Carpathians towards the Eastern and Serbian Carpathians.
3.2. Climatic exposure of European beech as an example
EQ and ABT have been found to influence the distribution of European beech, and critical values for beech occurrence and decline were suggested for example by FANG – LECHOVICZ (2006) and MÁTYAS et al. (2010) We analyse here the effect of changing climate on critical value of the EQ 40, the exceedance of which may induce beech mortality (MÁTYAS et al. 2010), and 30, which may indicate the limit of the loss of beech competitive vigour (JAHN 1991).
Under the reference climate, values between 30 – 40 occured mainly the Hungarian part of the Carpathians, and the Outer Eastern Carpathians in Romania (Annex 3a). Critical value of EQ 40 was exceeded in sparse spots in Hungary, and in beech stands in the Transylvannian Plateau, where beech occurs marginaly. Climatic conditions for beech persistence were projected to worsen substantially in the distant future (Annex 3b), and limit of 40 may be exceeded in all beech

Science for Sustainability University of West Hungary International Scientific Conference for PhD Students March 19-20, 2013 – Győr
144
stands in the Hungarian and Serbian part of the Carpathians, and in large areas of beech stands in Romania.
The use of multiple RCMs allows for investigating the match of zones exeeding the critical values of EQ as have been derived from the four RCMs used (Annex 3 c,d). The uncertainty of exceedance of the critical value of 30 is low, and all four models imply the same position of the above-value regions with minor uncertainty in the Western Carpathians. Uncertainty of the exceedance of value 40 is larger, and regions where only 2 or 3 models are matching are distributed across the all Carpathians.
4. DISCUSSION AND CONCLUSIONS
We explored the possibility to asses the future climate development in the Carpathians using an ensemble of climate change scenarios drawn from the recently developed FORESEE database (DOBOR et al. 2012). Instead of investigating essential climate elements, we focused on the development of two bioclimatic variables to enable us exploring more complex spatial patterns in future climate development, which have not yet been studied in detail.
We identified a remarkable trend in future development of investigated variables, increasing from the Western Carpathians towards the Eastern and Serbian Carpathians. All four regional climate models used indicated the same large-scale pattern, though different medium-scale patterns in differences between future and reference climate can be seen. This indicates higher climatic exposure of forests in the latter geomorphologic units.
Match of areas where critical values of adressed bioclimatic variables have been exceeded, as produced by four RMCs used, has been evaluated as well. Such spatially explicit information seems usefull for the identification of the critically exposed sites. This information would gain importance when simulations based on various Global Climate Models and/or emission scenarios would have been integrated.
Assessment of forest climatic exposure is – along with the sensitivity and adaptive capacity – part of the integrated forest vulnerability assessment (LINDNER et al. 2010). High climatic exposure of the Eastern and Serbian Carpathians along with the fact that economic performance of Ukraine, Romania and Serbia reaches only 36% of the Western Carpathian countries, in terms of GDP per capita (http://data.worldbank.org), remarkably limits the options for effective adaptation. These facts may generate concern about the future of forests in these regions. Acknowledgements: We acknowledge the project ISSOP (ITMS 26220220066) supported by the Research & Development Operational Programme funded by the ERDF (50%); project of the Hungarian Scientific Research Fund (OTKA K104816) (20%); project BioVel (Biodiversity Virtual e-Laboratory Project, FP7-INFRASTRUCTURES-2011-2, project number 283359) (20%); and project of the Czech Ministry of Agriculture No. QJ1220317 (10%).

Science for Sustainability University of West Hungary International Scientific Conference for PhD Students March 19-20, 2013 – Győr
145
Annex 1

Science for Sustainability University of West Hungary International Scientific Conference for PhD Students March 19-20, 2013 – Győr
146
Annex 2

Science for Sustainability University of West Hungary International Scientific Conference for PhD Students March 19-20, 2013 – Győr
147
Annex 3
References BRÉDA, N. – HUC, R. – GRANIER, A. – DREYER, E. (2006): Temperate forest trees and stands under severe
drought: a review of ecophysiological responses, adaptation processes and long-term consequences. Annals of Science 63: 625–644.
BRUS, D. J. – HENGEVELD, G. M. – WALVOORT, D. J. J. – GOEDHART, P. W. – HEIDEMA, A. H. – NABUURS, G. J. – GUNIA, K. (2011): Statistical mapping of tree species over Europe. European Journal of Forest Research 131 (1): 145–157.
Christensen, J. H. – Hewitson, B. – Busuioc, A. – Chen, A. – Gao, X. – Held, I. – Jones, R. – Kolli, R. K. – Kwon, W.-T. – Laprise, R. – Rueda, V.M. – Mearns, L. – Mene´ndez, C.G. – Ra¨isa ¨nen, J. – Rinke, A. – Sarr, A. – Whetton, P. (2007): Regional climate projections. In: Solomon, S. et al. (Eds.), Climate Change 2007: The Physical Science Basis. Contribution of Working Group I to the Fourth Assessment Report of the Inter governmental Panel on Climate Change. Cambridge University Press, Cambridge, United Kingdom/New York, NY, USA, pp. 847–940.
DOBOR, L. – BARCZA, Z. – HLÁSNY, T. – HAVASI, A (2012): Creation of the FORESEE database to support climate change related impact studies. International Scientific Conference for PhD Students. Győr, Hungary, March 19-20 2013, in press.

Science for Sustainability University of West Hungary International Scientific Conference for PhD Students March 19-20, 2013 – Győr
148
DULLINGER, S. – GATTRINGER, A. – THUILLER, W. – MOSER, D. – ZIMMERMANN, N. E. – GUISAN, A. – WILLNER, W. (2012): Extinction debt of high-mountain plants under twenty-first-century climate change. Nature Climate Change 2(8): 619-622.
ELLENBERG, H. (1988): Vegetation ecology of Central Europe, 4th ed. Cambridge University Press, Cambridge. 731 pp.
FANG, J. – LECHOWICZ, M. J. (2006): Climatic limits for the present distribution of beech ( Fagus L .) species in the world. Journal of Biogeography 33: 1804–1819.
FRIEDLINGSTEIN, P. – PRENTICE, I. C. (2010): Carbon-climate feedbacks: a review of model and observation based estimates. Curr. Opin. Environ. Sust. 2, 251-257.
GURUNG, A.B. – BOKWA, A. – CHEŁMICKI, W. – ELBAKIDZE, M. – HIRSCHMUGL, M. – HOSTERT, P. – IBISCH, P. (2009): Global Change Research in the Carpathian Mountain Region. Mountain Research and Development 29(3): 282-288.
HAYLOCK, M. R. – HOFSTRA, N. – KLEIN TANK, A. M. G. – KLOK, E. J. – JONES, P. D. – NEW, M. A. (2008): European daily high-resolution gridded data set of surface temperature and precipitation for 1950-2006. Journal of Geophysical Research 113: D20119.
HOLDRIDGE, L. R. (1947): Determination of world plant formations from simple climatic data. Science, 105: 367-368.
HOLDRIDGE, L. R. – GRENKE, W. C. – HATHEWAY, W. H. – LIANG, T. – TOSI, J. A. (1971): Forest Environments in Tropical Life Zones. Pergamon Press, Oxford. 747 pp.
HUDSON, G. – WACKERNAGEL, H. (1994): Mapping temperature using kriging with external drift: Theory and example from Scotland. International Journal of Climatology 14: 77-91.
JAHN, G. (1991): Temperate deciduous forests of Europe. Ecosystems of the world 7. Temperate deciduous forests. Elsevier, London. pp. 377–502.
JENSEN, L.U. – LAWESSON, J. E. – BALSLEV, H. – FORCHHAMMER, M. C. (2004): Predicting the distribution of Carpinus betulus in Denmark with Ellenberg’s Climate Quotient. Nordic Journal of Botany 23: 57–67.
KEO (2007): Carpathians Environment Outlook (p. 200). Geneva: United Nations Environment Programme Division of Early Warning and Assessment Europe.
KIRA, T. (1991): Forest ecosystems of east Asia and southeast Asia in a global perspective. Ecological Research 6: 185–192.
LINDNER, M. – MAROSCHEK, M. – NETHERER, S. – KREMER, A. – BARBATI, A. – GARCIA-GONZALO, J. – SEIDL, R. (2010): Climate change impacts, adaptive capacity, and vulnerability of European forest ecosystems. Forest Ecology and Management 259(4): 698–709.
MALCOLM, J. R. – MARKHAM, A. – NEILSON, R. P. (2001): Can species keep up with climate change? Conservation Biology 2: 24–25.
MÁTYÁS, C. – BERKI, I. – CZÚCZ, B. – GÁLOS, B. – MÓRICZ, N. – RASZTOVITS, E. (2010): Future of Beech in Southeast Europe from the Perspective of Evolutionary Ecology. Acta Silvatica & Lignaria Hungarica, 6: 91–110.
NAKICENOVIC, N. – SWART, R. (eds) (2000): Special report on emission scenarios. Cambridge University Press, Cambridge. 570 pp.
RUFFINI, F. L. – STREIFENEDER, T. – EISELT, B. (2006): Implementing and International Mountain Convention: An approach for the delimitation of the Carpathian Convention Area. European Accademy, Bolzano. 121 pp.
STERL, A. – SEVERIJNS, C. – DIJKSTRA, H. – HAZELEGER, W. – JAN VAN OLDENBORGH, G. – VAN DEN BROEKE, M. – BURGERS, G. – VAN DEN HURK, B. – JAN VAN LEEUWEN, P. – VAN VELTHOVEN, P. (2008): When can we expect extremely high surface temperatures? Geophysical Research Letters 35(14): L14703.
VAN DER LINDEN, P. – MITCHELL, J.F.B. (2009): ENSEMBLES: Climate Change and Its Impacts: Summary of research and results from the ENSEMBLES project. Office, 160 pp.
VIZI, L. – HLÁSNY, T. – FARDA, A. – ŠTEPÁNEK, P. – SKALÁK, P. – SITKOVÁ, Z. (2011): Geostatistical modeling of high resolution climate change scenario data. Időjárás, 115(1-2): 71–85.

Science for Sustainability University of West Hungary International Scientific Conference for PhD Students March 19-20, 2013 – Győr
149
Modeling the future distribution of Mediterranean Pinus species
BEDE-FAZEKAS Ákosa* aDepartment of Garden and Open Space Design, Corvinus University of Budapest, Budapest, Hungary
Abstract – The potential future distribution of four Mediterranean pines was aimed to be modeled supported by EUFORGEN digital area database (distribution maps), ESRI ArcGIS 10 software’s Spatial Analyst module (modeling environment), PAST (calibration of the model with statistical method), and REMO regional climate model (climatic data). The studied species were Pinus brutia, Pinus halepensis, Pinus pinaster, and Pinus pinea. The climate data were available in a 25 km resolution grid for the reference period (1961-90) and two future periods (2011-40, 2041-70). The climate model was based on the IPCC SRES A1B scenario. The model results show explicit shift of the distributions to the north in case of three of the four studied species. The future (2041-70) climate of Western Hungary seems to be suitable for Pinus pinaster.
Keywords: Mediterranean pines / climate envelope model / potential distribution / climate change / distribution modeling
1. INTRODUCTION
According to the predictions for the period of 2011-40, spatially analogue territories of Hungary – the territories with present climate similar to the future climate of Hungary – can be found in Southern Romania, Northern Bulgaria, Serbia, Macedonia and Northern Greece (HORVÁTH 2008). Therefore the ornamental plant assortment of Hungary – as the assortment of other Central and Eastern European countries – should be reconsidered. This realization inspired some previous studies (BEDE-FAZEKAS 2012a, BEDE-FAZEKAS 2012b).
The regional climate models have, by this time, good horizontal resolution and are reliable enough for creating some models based on the current distribution of tree species. Our previous researches were about modeling the future area of introduction (or potential distribution) of several Mediterranean ligneous plant species that can have importance in the future ornamental plant usage. Based on these former studies we aimed to run a new and more accurate model on four of the previously studied species. The improvement of the modeling method was achieved by statistical calibration based on an iterative error evaluation.
We aimed to create multi-layered distribution maps with GIS (Geographic Information System) software, displaying the predicted shift of the distributions. These maps can have importance not only in forestry, landscape architecture and botany, but in visualization of the climate change also for non-professionals (CZINKÓCZKY – BEDE-FAZEKAS 2012).
* Corresponding author: [email protected], H-1118 Budapest, Villányi út 27-43.

Science for Sustainability University of West Hungary International Scientific Conference for PhD Students March 19-20, 2013 – Győr
150
2. MATERIALS AND METHODS
2.1. Climate data and distribution maps
The studied species are Brutia pine (Pinus brutia Ten.), Aleppo pine (Pinus halepensis Mill.), Maritime pine (Pinus pinaster Aiton), and Italian stone pine (Pinus pinea L.), which are very close relatives according to phylogenetic studies (WANG et al. 1999). The current (latest update was achieved in 2008) continuous distribution map of the species was derived from the EUFORGEN digital area database (EUFORGEN 2008), while the discrete (fragmented) observations were ignored. In our model the distributions from 2008 were bound to the reference period. This difference may not cause any problem since the pines have long life cycle and can slowly adapt to the changing climate.
The climatic data were gained from the REMO regional climate model (RCM); the grid had a 25 km horizontal resolution. The model REMO is based on the ECHAM5 global climate model and use the IPCC SRES scenario called A1B. This scenario supposes a future world of very rapid economic growth, global population that peaks in the mid-century, and the rapid introduction of new and more efficient technologies (NAKICENOVIC – SWART 2000). The reference period was 1961-90, the two future periods of modeling were 2011-40 and 2041-70. The entire European Continent is within the domain of REMO, we used, however, only a part of the grid (25724 of the 32300 points).
36 climatic variables were used for the distribution modeling: monthly mean temperature (T, °C), monthly minimum temperature (M, °C), and monthly precipitation (P, mm). All the climatic data were averaged in the three periods. Indirectly, accumulated heat, seasonality, and some other climate parameters were applied.
2.2. Climate envelope modeling
2.2.1. Modeling approach and software
ESRI ArcGIS 10 software was used for preparing climatic data, running the model, and displaying the model results. Climatic data were managed and the expressions for modeling were prepared with the assistance of Microsoft Excel 2010 program. PAST statistic analyzer software (HAMMER et al. 2001) was used for creating the cumulative distribution function of the climatic parameters, and getting the percentile values of the parameters (model calibration).
The impact of climate change on the distribution of selected species was modeled with Climate Envelope Modeling (CEM; also known as niche-based modeling, correlative modeling) (HIJMANS – GRAHAM 2006). This method is about predicting responses of species to climate change by drawing an envelope around the domain of climatic variables where the certain species is recently found and then identifying areas predicted to fall within that domain under future scenarios (IBÁÑEZ et al. 2006). It hypothesizes that (both present and future) distributions are dependent mostly on the climatic variables (CZÚCZ 2010) which is somewhat dubious (SKOV – SVENNING 2004). Compared to mechanistic models, CEM tries to find statistical correlations between climate and the distribution of species (GUISAN – ZIMMERMANN 2000, ELITH – LEATHWICK 2009), and models the future temporal correspondence based on the present spatial correspondence between the variables (PICKETT 1989).
2.2.2. Calibration by iterative modeling
The calibration of the model has been achieved by iterative error evaluation. This technique shows several similarities with “area under the receiver operating characteristic (ROC) curve” (AUC), which is a plot of a test's true positive fractions vs. false positive fractions (HANLEY – MCNEIL 1982). The comments of LOBO et al. (2008) on AUC may also refer to the calibration

Science for Sustainability University of West Hungary International Scientific Conference for PhD Students March 19-20, 2013 – Győr
151
method used in this research. For further error-based model calibration procedures see FIELDING – BELL (1997).
The model was run iteratively to determine the optimal amount of percentiles to be left from the climatic values. Cumulative distribution functions were calculated by PAST for all climatic parameters. Then 0 to 14 percentiles has been left from the lower values of a certain type of climate parameters (e.g. 12 monthly precipitations), while the maximum values were fixed and also the other 24 climatic parameters were fixed at the extreme values. In case of a certain species 90 error evaluations were done. Two types of error values were calculated: internal (the ratio of the current distribution segment not determined by the model), and external (the ratio of area outside the current distribution, determined wrongly by the model). The errors were summarized. The increasing accumulated error function determined the appropriate number of percentiles to left: the greatest number of percentiles was chosen which produces no more than 100% summarized error.
2.2.3. Modeling method
First, climatic data were refined by Inverse Distance Weighted interpolation method. Then the modeling steps were as follows:
1. the grid points within the distribution were queried (a few hundred × 36 data; ArcGIS); 2. the percentile points of the 36 climatic parameters (101×36 data, PAST) were calculated; 3. the appropriate percentiles of the climatic parameters determined by the calibration were
selected (2×36 data, Excel); 4. modeling phrases (3 strings, Excel) were created by string functions for the three
modeling periods; 5. those territories were selected where all the climatic values of the certain period were
between the extremes selected in step 3. (ArcGIS – Raster Calculator function). The positive raster results were transformed to ESRI shapefile format (polygons). The order
of the four layers (one observed and three modeled distributions) determined that the result maps are able to display the northward expansion, not the retreat from the southern parts (trailing edge) of the current distribution.
3. RESULTS
3.1. Result of iterative modeling
Based on the iterative modeling the optimal number of percentiles to be left was determined in case of the four species, and two extremes of the three type of climate variables (Table 1). Table 1. The result of model calibration: the number of percentiles to be left
Species min(T) max(T) min(M) max(M) min(P) max(P) P. brutia 3 2 3 3 5 3 P. halepensis 9 2 9 3 3 2 P. pinaster 6 3 6 3 2 4 P. pinea 6 1 5 2 2 1
3.2. Modeled potential distributions
3.2.1. Brutia pine (Pinus brutia)
The current distribution of Pinus brutia (Figure 1) is focused on the Eastern Mediterranean region (Turkey, Cyprus, and Malta), while the model results in a much larger potential distribution for the

Science for Sustainability University of West Hungary International Scientific Conference for PhD Students March 19-20, 2013 – Győr
152
reference period that includes Southern Portugal, Southern Spain, Northern Morocco, Northern Algeria, Sardinia, Southern Italy, and Greece. Significant northern expansion is not predicted, and Hungary is not affected by the model.
3.2.2. Aleppo pine (Pinus halepensis)
Segments of the observed distribution of Pinus halepensis (Figure 1) can be found in Eastern Spain, Southern France, Italy, Southern Greece, and Northern Morocco, Algeria, Tunisia and Libya. The model cannot redraw the Libyan distribution fragment. The potential distribution for the reference period seems to be larger than the observed area: Southern Portugal and Spain, Italy, Corsica and Sardinia, the coast of the Aegean Sea, and greater North African territories are modeled to be suitable. In Spain, France, Italy, Croatia, Bosnia and Herzegovina, Serbia, Bulgaria, and in the Crimea future expansion is predicted.
Figure 1. Current distribution (dark green), modeled potential distribution in the reference period (light green),
and modeled potential distribution in the period of 2011-2040 (orange) and 2041-2070 (yellow) of the four studied Pinus species
3.2.3. Maritime pine (Pinus pinaster)
The current distribution of Pinus pinaster (Figure 1) is focused on the Western Mediterranean (Portugal, Spain, Southern France, Corsica, and Northern Italy), which is well expressed by the model. The African distribution segments are, however, not redrawn by the model. Significant northern expansion is predicted to occur in Western France, Southern England, the Balkans, and the western part of the Carpathian Basin.

Science for Sustainability University of West Hungary International Scientific Conference for PhD Students March 19-20, 2013 – Győr
153
3.2.4. Italian stone pine (Pinus pinea)
Apart from Central Spain, Pinus pinea (Figure 1) is clearly a coastal pine: its current distribution includes maritime parts of Portugal, Spain, France, Italy, Turkey, Syria and Lebanon. The potential distribution for the reference period is modeled to include North African coastal territories, Southern Portugal and Spain, Italy, and the coastline of the Eastern Mediterranean. Northern future expansion can be seen in France, Italy, and the Balkans.
4. DISCUSSION
4.1. Model evaluation
Although the aforementioned predictions are obviously valuable and spectacular, there are some questions and disadvantages concerning the model used. Opinions differ if climatic variables are by themselves sufficient or even the most important factors for explaining the distribution of species (DORMANN 2007). It should also be noted that extremes and absolute climatic values (rather than averages) may better explain the limits of distribution (KOVÁCS-LÁNG et al. 2008). The input climate data were obtained from RCM, which differ from the observed meteorological data. No bias correction was applied on the modeled climate data. Nonetheless, the model calibration technique we used seems to result in a realistic and supportable model, since the differences between the potential and observed distributions are not unacceptably large.
Various other ways can be found to determine the climate envelope, including simple regression, distance-based methods, genetic algorithms for rule-set prediction, and neural nets (IBÁÑEZ et al. 2006). Our subsequent aim is to develop a program module for ArcGIS that implements the artificial intelligence algorithm artificial neural network (ANN) for modeling the future distribution of Mediterranean tree species.
4.2. Shift of distributions
Our former research found that the extent of future shift of distributions is much larger. That model was, however, inaccurate. The results of this improved model show that the most affected territories are France and the Balkans. The greatest expansion is predicted to occur in case of Pinus pinaster, while the distribution of Pinus brutia seems to be nearly unchanged. Although the current distribution of Pinus halepensis and Pinus pinea differs remarkably, the predictions are almost the same, which is caused by the similar climatic demand and tolerance of the two species.
The North-eastern African coastline was predicted to be suitable for Pinus brutia, Pinus halepensis, and Pinus pinea. By 2070, the climate of Western Hungary seems to become suitable for Pinus pinaster. The model results show clearly and spectacularly the impacts of the predicted climate change on the distribution of Mediterranean pines. Acknowledgements: Special thanks to Levente Horváth and Levente Hufnagel (Corvinus University of Budapest, Department of Mathematics and Informatics) for their assistance. The research was supported by Project TÁMOP-4.2.1/B-09/1/KMR-2010-0005. The ENSEMBLES data used in this work was funded by the EU FP6 Integrated Project ENSEMBLES (Contract number 505539) whose support is gratefully acknowledged. References BEDE-FAZEKAS, Á. (2012a): Melegigényes díszfák telepíthetőségi területének előrejelzése a 21. századra.
[Predicting the area of introduction of warm-demand ornamental trees for the 21st century.] Thesis, Corvinus University of Budapest, Faculty of Landscape Architecture, Budapest, Hungary (in Hungarian)

Science for Sustainability University of West Hungary International Scientific Conference for PhD Students March 19-20, 2013 – Győr
154
BEDE-FAZEKAS, Á. (2012b): Methods of modeling the future shift of the so called Moesz-line. Applied Ecology and Environmental Research 10(2): 141-156.
CZINKÓCZKY, A. – BEDE-FAZEKAS, Á (2012): Visualization of the climate change with the shift of the so called Moesz-line. In: BUHMANN, E. – ERVIN, S. – PIETSCH, M. (eds.): Peer Reviewed Proceedings of Digital Landscape Architecture 2012 at Anhalt University of Applied Sciences. Herbert Wichmann Verlag, Berlin, Germany. 437-444
CZÚCZ, B. (2010): Az éghajlatváltozás hazai természetközeli élőhelyekre gyakorolt hatásainak modellezése. [Modeling the impact of climate change on natural habitats in Hungary.] Dissertation. Corvinus University of Budapest, Faculty of Horticultural Sciences, Hungary (in Hungarian)
DORMANN, C.F. (2007): Promising the future? Global change projections of species distributions. Basic and Applied Ecology. 8: 387–397.
ELITH, J. – LEATHWICK, J. R. (2009): Species Distribution Models: Ecological Explanation and Prediction Across Space and Time. Annual Review of Ecology, Evolution, and Systematics. 40(1): 677-697.
EUFORGEN (2008): Distribution maps. Bioversity International, Rome, Italy. Online: www.euforgen.org/distribution_maps.html
FIELDING, A. H. – BELL, J. F. (1997): A review of methods for the assessment of prediction errors in conservation presence/absence models. Environmental Conservation. 24(1): 38–49.
GUISAN, A. – ZIMMERMANN, N. E. (2000): Predictive habitat distribution models in ecology. Ecological Modelling. 135(2-3): 147-186.
HAMMER, Ř. – HARPER, D. A. T. – RYAN, P. D. (2001): PAST: Paleontological statistics software package for education and data analysis. Palaeontologia Electronica. 4(1): 9
HANLEY, J. A. – MCNEIL, B. J. (1982): The meaning and use of area under a receiver operating characteristics (ROC) curve. Radiology. 143(1): 29–36.
HIJMANS, R. J. – GRAHAM, C. H. (2006): The ability of climate envelope models to predict the effect of climate change on species distributions. Global Change Biology. 12: 2272-2281.
HORVÁTH, L. (2008): Földrajzi analógia alkalmazása klímaszcenáriók elemzésében és értékelésében. [Use of spatial analogy in analysis and valuation of climate scenarios.] PhD dissertation, Corvinus University of Budapest, Budapest, Hungary. (in Hungarian)
IBÁÑEZ, I. – CLARK, J. S. – DIETZE, M. C. – FEELEY, K. – HERSH, M. – LADEAU, S. – MCBRIDE, A. – WELCH, N. E. – WOLOSIN, M. S. (2006): Predicting Biodiversity Change: Outside the Climate Envelope, beyond the Species-Area Curve. Ecology. 87(8): 1896-1906.
KOVÁCS-LÁNG, E. – KRÖEL-DULAY, GY. – CZÚCZ, B. (2008): Az éghajlatváltozás hatásai a természetes élővilágra és teendőink a megőrzés és kutatás területén. [The impacts of climate change on the wildlife and our protecting und researching tasks.] Természetvédelmi Közlemények. 14: 5-39. (in Hungarian)
LOBO, J. M. – JIMENEZ-VALVERDE, A. – REAL, R. (2008): AUC: a misleading measure of the performance of predictive distribution models. Global Ecol Biogeogr. 17(2): 145-151.
NAKICENOVIC, N. – SWART, R. (eds.) (2000): Emissions Scenarios. Cambridge University Press, Cambridge, UK.
PICKETT, S. T. A. (1989): Space-for-time substitution as an alternative to long-term studies. In LIKENS, G. E. (ed.): Long-Term Studies in Ecology: Approaches and Alternatives. Springer, New York, USA. 110-135.
SKOV, F. – SVENNING, J. C. (2004): Potential impact of climatic change on the distribution of forest herbs in Europe. Ecography. 27(3): 366-380.
WANG, X.-R. – TSUMURA, Y. – YOSHIMARU, H. – NAGASAKA, K., – SZMIDT, A. E. (1999): Phylogenetic relationships of Eurasian pines (Pinus, Pinaceae) based on chloroplast rbcL, matK, rpl20-rps18 spacer, and trnV intron sequences. Amer. J. Bot. 86:1742-1753.

Science for Sustainability University of West Hungary International Scientific Conference for PhD Students March 19-20, 2013 – Győr
155
Analysis of the Impacts of Global Warming on European Terrestrial Wild Mammals’ Range Areas in the 21st Century
Using ENSEMBLES Climate Simulations
NAGY Júliaa* –BARTHOLY Judita – PONGRÁCZ Ritaa– PIECZKA Ildikóa – BREUER Hajnalkaa –HUFNAGEL Leventeb
aDepartment of Meteorology, Eötvös Loránd University, Budapest, Hungary bDepartment of Mathematics and Informatics, Corvinus University of Budapest, Budapest, Hungary
Abstract – Animals tend to occupy geographical regions with climatic conditions which are optimal to their specific needs. Due to the projected global warming wild animals’ living territory may be reshaped in the future. In this research we aim to estimate the regional impacts of climate change on European terrestrial mammals. For this purpose, first, the climate profile indicators of every species are estimated by using the E-OBS gridded database for 1961-1990. Also, pre-1970 and post-1970 range datasets of the Atlas of European Mammals are analyzed. Then, in order to assess future changes, available datasets of regional climate model experiment results are considered for 1951-2100. Simultaneous analysis of climate simulations and animal range datasets enables us to evaluate the vulnerability of the European terrestrial mammal species to regional climate change. The results suggest that rapid change and significant decline in habitats redraw the wild animals’ living territory and make them migrate northward.
Keywords: mammals / migration / Europe / regional climate change / temperature / precipitation
1. INTRODUCTION
Global climate change affects humans and the urban environment, and furthermore, the living conditions of wild animals (BARTHOLY et al. 2012). Animals tend to occupy geographical regions with climatic conditions, which are optimal to the specific needs of the given species. Due to the projected global warming and climate change wild animals’ living territory may be reshaped in the future. The analysis of phenological, geographical, and genetic impacts of climate change on wildlife is an increasingly popular research topic (e.g., THOMAS et al. 2004, CHEN et al. 2011); however, the projections of future conditions are rarely investigated due to the lack of proper methodology. Results so far clearly suggest a strong relationship between global warming and the response of wildlife. Climate is one of the abiotic factors, which primarily control the range areas of wildlife. If the climate significantly changes in a particular region, it may disturb the ecosystem, and increase the risk of extinction. Based on previous studies (e.g., WILLIAMS et al. 2007) carried out using the A2 scenario (NAKICENOVIC – SWART 2000), 12-39% of the Earth's terrestrial surface is very likely to experience significantly different climate conditions from the current climate.
The above mentioned studies all highlight the importance of this global issue and the need of further research to understand the mechanisms of climate stress on ecosystems. Such detailed analysis may help to minimize these negative impacts of global warming on the wildife and ecosystems before it becomes irreversible.
* Corresponding author: [email protected]; H-1117 Budapest, Pázmány Péter sétány 1/a.
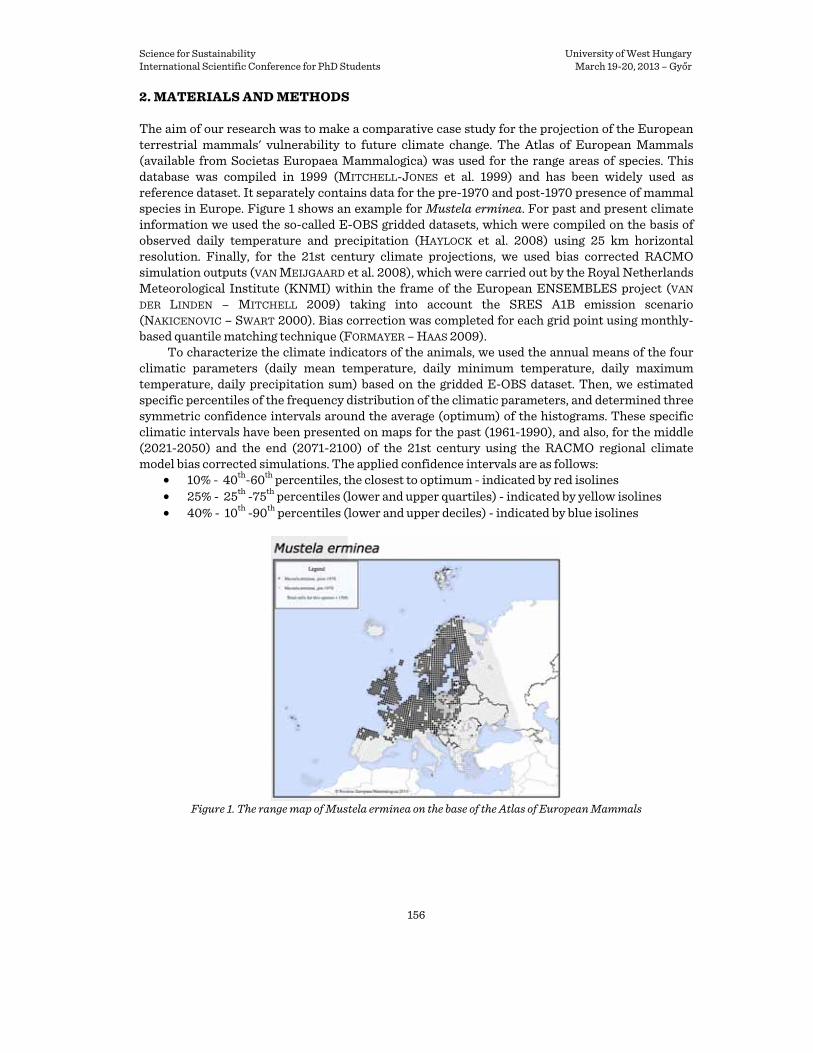
Science for Sustainability University of West Hungary International Scientific Conference for PhD Students March 19-20, 2013 – Győr
156
2. MATERIALS AND METHODS
The aim of our research was to make a comparative case study for the projection of the European terrestrial mammals' vulnerability to future climate change. The Atlas of European Mammals (available from Societas Europaea Mammalogica) was used for the range areas of species. This database was compiled in 1999 (MITCHELL-JONES et al. 1999) and has been widely used as reference dataset. It separately contains data for the pre-1970 and post-1970 presence of mammal species in Europe. Figure 1 shows an example for Mustela erminea. For past and present climate information we used the so-called E-OBS gridded datasets, which were compiled on the basis of observed daily temperature and precipitation (HAYLOCK et al. 2008) using 25 km horizontal resolution. Finally, for the 21st century climate projections, we used bias corrected RACMO simulation outputs (VAN MEIJGAARD et al. 2008), which were carried out by the Royal Netherlands Meteorological Institute (KNMI) within the frame of the European ENSEMBLES project (VAN DER LINDEN – MITCHELL 2009) taking into account the SRES A1B emission scenario (NAKICENOVIC – SWART 2000). Bias correction was completed for each grid point using monthly-based quantile matching technique (FORMAYER – HAAS 2009).
To characterize the climate indicators of the animals, we used the annual means of the four climatic parameters (daily mean temperature, daily minimum temperature, daily maximum temperature, daily precipitation sum) based on the gridded E-OBS dataset. Then, we estimated specific percentiles of the frequency distribution of the climatic parameters, and determined three symmetric confidence intervals around the average (optimum) of the histograms. These specific climatic intervals have been presented on maps for the past (1961-1990), and also, for the middle (2021-2050) and the end (2071-2100) of the 21st century using the RACMO regional climate model bias corrected simulations. The applied confidence intervals are as follows:
• 10% - 40th-60th percentiles, the closest to optimum - indicated by red isolines • 25% - 25th -75th percentiles (lower and upper quartiles) - indicated by yellow isolines • 40% - 10th -90th percentiles (lower and upper deciles) - indicated by blue isolines
Figure 1. The range map of Mustela erminea on the base of the Atlas of European Mammals
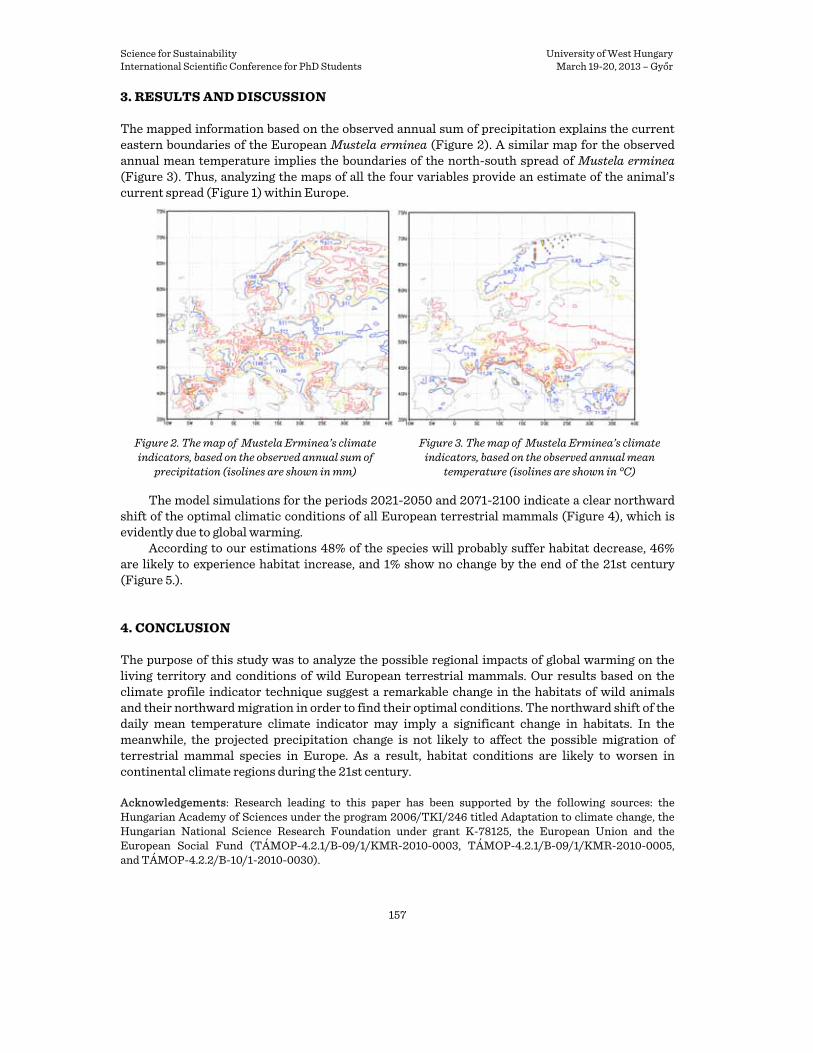
Science for Sustainability University of West Hungary International Scientific Conference for PhD Students March 19-20, 2013 – Győr
157
3. RESULTS AND DISCUSSION
The mapped information based on the observed annual sum of precipitation explains the current eastern boundaries of the European Mustela erminea (Figure 2). A similar map for the observed annual mean temperature implies the boundaries of the north-south spread of Mustela erminea (Figure 3). Thus, analyzing the maps of all the four variables provide an estimate of the animal’s current spread (Figure 1) within Europe.
Figure 2. The map of Mustela Erminea’s climate indicators, based on the observed annual sum of
precipitation (isolines are shown in mm)
Figure 3. The map of Mustela Erminea’s climate indicators, based on the observed annual mean
temperature (isolines are shown in °C)
The model simulations for the periods 2021-2050 and 2071-2100 indicate a clear northward shift of the optimal climatic conditions of all European terrestrial mammals (Figure 4), which is evidently due to global warming.
According to our estimations 48% of the species will probably suffer habitat decrease, 46% are likely to experience habitat increase, and 1% show no change by the end of the 21st century (Figure 5.).
4. CONCLUSION
The purpose of this study was to analyze the possible regional impacts of global warming on the living territory and conditions of wild European terrestrial mammals. Our results based on the climate profile indicator technique suggest a remarkable change in the habitats of wild animals and their northward migration in order to find their optimal conditions. The northward shift of the daily mean temperature climate indicator may imply a significant change in habitats. In the meanwhile, the projected precipitation change is not likely to affect the possible migration of terrestrial mammal species in Europe. As a result, habitat conditions are likely to worsen in continental climate regions during the 21st century. Acknowledgements: Research leading to this paper has been supported by the following sources: the Hungarian Academy of Sciences under the program 2006/TKI/246 titled Adaptation to climate change, the Hungarian National Science Research Foundation under grant K-78125, the European Union and the European Social Fund (TÁMOP-4.2.1/B-09/1/KMR-2010-0003, TÁMOP-4.2.1/B-09/1/KMR-2010-0005, and TÁMOP-4.2.2/B-10/1-2010-0030).

Science for Sustainability University of West Hungary International Scientific Conference for PhD Students March 19-20, 2013 – Győr
158
Annual mean temperature (°C) Annual precipitation sum (mm)
1961
–199
0
2021
–205
0
2071
–210
0
Figure 4. The map of Mustela Erminea’s climate indicators, based on the simulated periods 1961-1990, 2021-
2050, and 2071-2100

Science for Sustainability University of West Hungary International Scientific Conference for PhD Students March 19-20, 2013 – Győr
159
Figure 5. Estimated habitat change of the European terrestrial mammals by 2071-2100
References BARTHOLY, J. – PONGRÁCZ, R. – NAGY, J. – PIECZKA, I. – HUFNAGEL, L. (2012): Regional climate change impacts
on wild animals’ living territory in central Europe. Applied Ecology and Environmental Research, 10, 107–120.
CHEN, I. C. – HILL, J. K. – OHLERMÜLLER, R. – ROY, D. B. – THOMAS, C. D. (2011): Rapid range shifts of species associated with high levels of climate warming. Science, 333, 1024-1026.
FORMAYER, H. – HAAS, P. (2009): Correction of RegCM3 model output data using a rank matching approach applied on various meteorological parameters. In: Deliverable D3.2 RCM output localization methods (BOKU-contribution of the FP 6 CECILIA project), http://www.cecilia-eu.org/
HAYLOCK, M. R. – HOFSTRA, N. – KLEIN TANK, A. M. G. – KLOK, E. J. – JONES, P.D. – NEW, M. (2008): A European daily high-resolution gridded dataset of surface temperature and precipitation. J. Geophys. Res (Atmospheres), 113, D20119, doi:10.1029/2008JD10201
VAN DER LINDEN P. – MITCHELL, J. F. B. (eds.) (2009): ENSEMBLES: Climate Change and its Impacts: Summary of research and results from the ENSEMBLES project. Met Office Hadley Centre, UK., 160 p.
van Meijgaard, E. – van Ulft, L. H. – van de Berg, W. J. – Bosveld, F. C. – van den Hurk, B. J. J. M. – Lenderink, G. – Siebesma, A. P. (2008): The KNMI regional atmospheric climate model RACMO version 2.1. Technical Report, 43 p.
Mitchell-Jones, A. J. – Amori, G. – Bogdanowicz, W. – Krystufek, B. – Reijnders, P. J. H. – Spitzenberger, F. – Stubbe, M. – Thissen, J. B. M. – Vohlarik, V. – Zima, J. (1999): The Atlas of European Mammals. T A & D Poyser, 484 p.
NAKICENOVIC, N. – SWART, R. (eds.) (2000): Emissions Scenarios. A special reports of IPCC Working Group III. Cambridge University Press, UK., 570 p.
Thomas, C. D. – Cameron, A. – Green, R. E. – Bakkenes, M. – Beaumont, L. J. – Collingham, Y. C. – Erasmus, B.F.N. – Ferreira de Siquera, M. – Grainger, A. – Hannah, L. – Hughes, L. – Huntley, B. – van Jaarsveld, A. S. – Midgley, G. F. – Miles, L. – Ortega-Huerta, M. A. – Townsend, A. – Peterson, O. – Phillips, L. – Williams, S. E. (2004): Extinction risk from climate change. Nature 427, 145-148.
WILLIAMS, J. W. – JACKSON, S. T. – KUTZBACH, J. E. (2007): Projected distributions of novel and disapearing climates by 2100. AD Proceedings of the National Academy of Sciences, 104, 5738-5742.

Science for Sustainability University of West Hungary International Scientific Conference for PhD Students March 19-20, 2013 – Győr
160
Change of Mesostigmata Mite Fauna Caused by Silver Birch (Betula pendula Roth.) Secondary Natural Succession on
Agricultural Fields
PIASTA, Andrzeja – SKORUPSKI, Macieja – PASTWIK, Elżbietaa – ZASADA, Michałb
a Department of Game Management and Forest Protection, Faculty of Forestry, Poznan University of Life Sciences
Wojska Polskiego 71d, PL60625 Poznan, Poland, tel.: +48618487779, e-mail: [email protected], [email protected], [email protected]
b Department of Dendrometry and Forest Productivity, Faculty of Forestry, Warsaw University of Life Sciences-SGGW
Nowoursynowska 159, PL02776 Warsaw, Poland, tel.: +48225938080, e-mail: [email protected]
Abstract – In Poland, as in many other countries of Central and Eastern Europe, abandoned arable lands are under process of conversion into forest as a result of secondary succession. New forests are usually composed of Scots pine (Pinus sylvestris L.), silver birch (Betula pendula Roth.), black alder (Alnus glutinosa Gaertn.) or trembling aspen (Populus tremula L.). Of these species, silver birch has the largest share in the spontaneously forested areas.
The issue of silver birch spontaneous succession has a very strong environmental context. Succession creates new ecosystems which are changing dynamically. These changes are related to the physico-chemical properties of soil, the composition of plant and soil fauna communities. As a result, a unique microclimate is created and changes in the landscape appear. New plant communities become an important element of nutrient cycle and carbon sequestration.
The aim of the presented study was to determine how newly established natural birch stands affect species and functional diversity of soil mesofauna. Another question asked was, whether the intensive biomass production has a negative impact on biodiversity of soil fauna. To achieve these goals, mites from Mesostigmata order (Acari) were used. In total 120 soil samples were taken from 12 experimental plots. Analysis of the results allows us to determine the initial impact of plant communities on ther biological condition of soil environment.
Keywords: silver birch / soil mesofauna / mites / spontaneous forestation / succession
1. INTRODUCTION
In Poland, as in many other countries of Central and Eastern Europe, there are plenty of arable lands, that have been abandoned due to the social-economic changes. These areas are under the process of conversion into forest as a result of secondary succession of pioneer tree species. New forests are usually composed of Scots pine (Pinus sylvestris L.), silver birch (Betula pendula Roth.), black alder (Alnus glutinosa Gaertn.) or trembling aspen (Populus tremula L.). In some region of the country this phenomenon has a massive scale. However, the exact scope of the problem, as well as its economic and ecological consequences, are unknown. Due to the spontaneous and random nature of the process of land abandonment and the long process of their administrative conversion to the planned afforestation, these areas are exposed to the natural processes of succession for a few, or even several years. There is also an important question of the direction and course of basic ecological processes taking place in the spontaneously emerged birch stands. It is expected, that there will more typical forest species appear in the plant communities as a result of these processes (KOZAK et al. 2004). The spontaneous afforestation process manifests also a very strong environmental context, mainly because of the development of new dynamically changing ecosystems. These changes relate primarily to the soil environment, physical and chemical soil properties, and in particular, to the composition of communities of soil fauna and flora.

Science for Sustainability University of West Hungary International Scientific Conference for PhD Students March 19-20, 2013 – Győr
161
The main goal of the presented study is to assess soil mesofauna assemblages formed on agricultural land undergoing natural succession in terms of species composition and quantitative distribution. Further development of this research could lead to determine how the emerging stands affect biodiversity of species and functional groups of soil mesofauna in forest ecosystems and answer the question whether intensified biomass production will negatively impact the biodiversity of soil fauna.
2. STUDY AREA
The research material was collected from 12 experimental plots located in the Ostrołęka, Kozienice and Łochów Forest Inspectorates. Research plots were characterized by the age of the trees, the number of birch trees per hectare, the average diameter at breast height and average height. Most of the plots were located on private land. Detailed location and characteristics of the research plots are presented in Table 1.
Table 1. Location and characteristics of the research plots
Plot nr N E Age A [m2] N/ha QMD [cm] H [m] 1 53 03 573 21 29 568 4 28 86071 0.38 1.41 2 53 03 668 21 29 340 9 84 30000 1.89 4.20 3 53 03 671 21 29 290 14 368 6658 3.28 6.59 4 53 03 547 21 28 717 14 644.5 4050 7.43 11.51 5 51 24 259 21 26 715 4 13.55 37638 0.31 1.24 6 51 24 246 21 26 621 3 23.4 81624 0.85 2.24 7 51 24 275 21 26 756 12 220 6409 4.32 8.30 8 51 24 200 21 26 792 13 294 6293 6.62 10.50 9 52 33 437 22 02 014 4 41 46585 0.99 2.07
10 52 33 690 22 01 880 9 63 31746 1.93 3.81 11 52 33 410 22 02 000 13 204 9902 3.65 8.00 12 52 33 540 22 01 500 16 266 7632 5.17 10.44
A [m2] – size of the research plot expressed in square meters N/ha – number of birch trees per 1 ha QMD [cm] – quadratic mean diameter of birch trees in centimeters H [m] – average height of birch trees in meters
3. MATERIAL AND METODS
The research material was collected in spring 2012. Research plots were arranged in three chronosequences created according to the tree age (chronosequence I: 4, 9, 14, 14 years; chronosequence II: 4, 3, 12, 13 years; chronosequence III: 4, 9, 13, 16 years). There were 10 samples collected from each research plot. Samples were collected from places located between trees using a 20 cm2 sampler. They consisted of litter, humus and mineral soil up to the 5 cm depth. The total of 120 samples was collected from all 12 plots. Research material was transported to the lab and placed in Tullgren funnels for extracting mites from soil samples. Organisms were preserved in 75% ethyl alcohol, and then, the microscope preparations in lactic acid were created.
All collected specimens of the Mesostigmata order mites were identified to the species or the order, using the taxonomic rank described by BŁOSZYK (2008) and SKORUPSKI (2008). Dominance

Science for Sustainability University of West Hungary International Scientific Conference for PhD Students March 19-20, 2013 – Győr
162
index D was calculated for each mite species (D=n/N*100%), where n – a number of specimens of a given species, and N – a number of all specimens collected on the given plot (TROJAN 2000).
4. RESULTS
A total of 1571 Mesostigmata mites specimens was collected. The collected specimens were identified to the 59 species. The average number of individuals per plot was 15.2, while in particular chronosequences the average reached as much as 35. The dominance indices for each species are shown in Table 2.
The most frequently demonstrated species, having the total dominance index excessing 10%, were: Trachytes aegrota (14,7%), Paragamasus runcatellus (14,5%) and Veigaia nemorensis (12,3%). The dominance index between 5 and 10% characterized such species, as: Mixozercon selnicki (6,9%), Olodiscus minima (6,8%) and Holoparasitus calacaratus (5,2%).
Thirteen of 59 species were registered in all chronosequences, while 26 species were present only in 1 chronosequence. For individual chronosequences it can be observed, that on average the numer of individuals and the numer of species of mites increases with age of birch afforestation (ryc. 1, 2, 3). Admittedly, on plots forming chronosequence I the oposite trend is observed, (ryc. 1), but on the remaining plots and for the entire material the positive trend of changes in the number of species with the development of the secondary succession (ryc. 4). Table 2. Dominance indices of individual mites species for each research plot
Dominance on the plot [%] Species
1 2 3 4 5 6 7 8 9 10 11 12 Total
Amblyseius sp 4.1 0.7 - - - - - 1.9 - - - - 0.4
Arctoseius cetratus - 0.7 - - - - - - - 2.8 - - 0.4
Arctoseius semiscissus 0.8 - - - - - - - - - - - 0.1
Arctoseius taeniolatus 0.8 - - - - - - - - - - - 0.1
Asca aphidioides - - - - - - 0.5 1.9 - - 5.8 6.7 1.3
Asca bicornis 2.5 - - - - - - 7.5 2.5 - - - 0.5
Blattisocius tarsalis - - - - - - - - - - - 0.7 0.1
Cheiroseius curtipes 4.9 - - - - - - - - - - - 0.4
Cheiroseius serratus 0.8 - - - - - - - - - - - 0.1
Cheiroseius sp. 0.8 - - - - - - - - - - - 0.1
Dendrolaelaps angulosus - - - - - - - - - 1.9 - - 0.3
Dendrolaelaps foveolatus - 0.7 - - - 3.5 - - - - - - 0.3
Dermanyssus gallinae - - 0.4 - - 1.2 - - 2.5 - 0.6 - 0.3
Dinychus sp. - 0.7 - - - - - - - - - - 0.1
Epicriopsis sp. - - - - - - - 1.9 - - - - 0.1
Eviphis ostrinus 4.9 - - - 1.6 - - - - - 0.6 - 0.5
Gamasellodes bicolor - - - - - 1.2 - - - 1.9 0.6 - 0.4
Gamasina sp. 0.8 0.7 - - 1.6 - - 1.9 5.0 0.5 - 1.5 0.6
Geholaspis longispinosus - - 0.4 - - - - - - - - - 0.1
Holoparasitus calcaratus 9.0 4.6 1.7 6.1 3.2 9.3 8.9 5.7 - 1.9 11.6 - 5.2
Hypoaspis aculeifer - - - - - 8.1 13.0 1.9 - 2.3 - - 2.4

Science for Sustainability University of West Hungary International Scientific Conference for PhD Students March 19-20, 2013 – Győr
163
Hypoaspis gryllotalpae 11.5 - - - - - - - - - - - 0.9
Hypoaspis praesternalis 0.8 - 0.4 - - - - 5.7 - - - - 0.3
Hypoaspis sp. - 0.7 - - - - - - 2.5 - - - 0.1
Hypoaspis vacua - - - - - 1.2 1.0 5.7 - - - 1.5 0.5
Iphidonopsis minutus 8.2 - - - - - - - - - - - 0.6
Leioseius sp. 0.8 2.0 - - - - - - - - - - 0.3
Macrocheles montanus - - - 0.8 - - - - - - - - 0.1
Mixozercon sellnicki - - - 21.4 4.8 - - 9.4 - - 46.5 - 6.9
Olodiscus minima - 5.2 6.1 2.3 3.2 9.3 6.3 5.7 - 20.2 9.0 - 6.8
Ololaelaps placentula - - 2.6 - - - - - - - - - 0.4
Oodinychus karawaiewi - 15.0 - - - - - - - - - - 1.5
Paragamasus conus - - - - 21.0 - - - - - - 41.0 4.3
Paragamasus jugincola - - - - - 1.2 16.1 - - 6.1 - 6.0 3.4
Paragamasus lapponicus 1.6 2.0 3.0 - - - - - - - - - 0.8
Paragamasus runcatellus 18.0 13.7 43.5 11.5 16.1 - 4.7 13.2 35.0 8.5 2.6 6.0 14.5
Paragamasus sp. - - - - - 2.3 - - - - 1.9 3.0 0.6
Paragamasus similis - - 0.9 - - - - - - - - - 0.1
Paragamasus vagabundus - - - - - 25.6 - - - - - 3.7 1.7
Paraseiulus sp. - - - - - 1.2 - - - - - - 0.1
Parazercon radiatus - - 14.3 - - - - - - - - - 2.1
Pergamasus crassipes - - - 0.8 9.7 - 0.5 - 40.0 0.5 2.6 - 1.8 Pergamasus septentrionalis - 2.0 0.9 0.8 - - 0.5 - 12.5 2.3 - 0.7 1.1
Porrhostaspis lunulata - - - - - - - - - - 0.6 - 0.1 Prozercon kochi - 0.7 10.0 - 1.6 1.2 2.1 - - - 1.9 - 2.1
Prozercon traegardhi - - - 7.6 - - - - - - - - 0.6
Rhodocarellus silesiacus - - - 4.6 - - 5.7 - - - - - 1.1
Trachytes aegrota 5.7 19.6 7.0 21.4 8.1 5.8 5.2 30.2 - 46.0 6.5 4.5 14.7
Trachytes pauperior - 6.5 - - - - 8.9 - - - - - 1.7
Urodiaspis tecta - - 0.4 - - 4.7 1.0 - - - - - 0.4
Uropoda orbicularis - - - - - - - - - - 0.6 - 0.1
Veigaia cervus 0.8 - - 0.8 - - - - - 3.3 0.6 1.5 0.8
Veigaia decurtata - - - - 6.5 - - - - - - - 0.3
Veigaia exigua - 2.6 - 0.8 - - - - - - - - 0.3
Veigaia kochi 2.5 - - 5.3 - - 0.5 - - - - - 0.7
Veigaia nemorensis 20.5 22.2 8.3 13.0 3.2 23.3 24.5 7.5 - 1.9 7.1 8.2 12.3
Veigaia planicola - - - 0.8 - - - - - - - - 0.1
Veigaia sp. 1 - - - 2.3 - 1.2 0.5 - - - - 1.5 0.4
Zercon triangularis - - - - 19.4 - - - - - 0.6 13.4 2.0 Numer of individuals on the plot 122 153 230 131 62 86 192 53 40 213 155 134 1571
Number of species on the plot 20 18 15 16 13 16 17 14 7 14 17 15

Science for Sustainability University of West Hungary International Scientific Conference for PhD Students March 19-20, 2013 – Győr
164
Ryc. 1. A number of individuals per 1 m2 and a number of species on individual plots with trend lines in
chronosequence I.
Ryc. 2. A number of individuals per 1 m2 and a number of species on individual plots with trend lines in
chronosequence II.
Ryc. 3. A number of individuals per 1 m2 and a number of species on individual plots with trend lines in
chronosequence III.
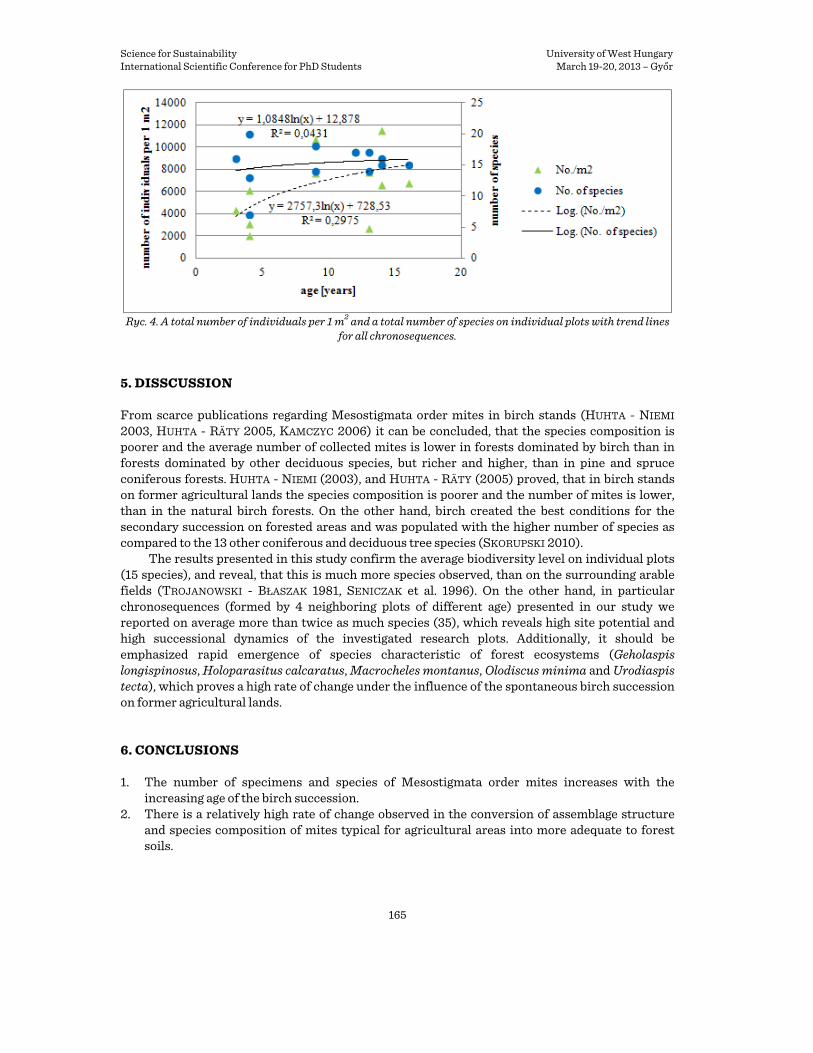
Science for Sustainability University of West Hungary International Scientific Conference for PhD Students March 19-20, 2013 – Győr
165
Ryc. 4. A total number of individuals per 1 m2 and a total number of species on individual plots with trend lines
for all chronosequences.
5. DISSCUSSION
From scarce publications regarding Mesostigmata order mites in birch stands (HUHTA - NIEMI 2003, HUHTA - RÄTY 2005, KAMCZYC 2006) it can be concluded, that the species composition is poorer and the average number of collected mites is lower in forests dominated by birch than in forests dominated by other deciduous species, but richer and higher, than in pine and spruce coniferous forests. HUHTA - NIEMI (2003), and HUHTA - RÄTY (2005) proved, that in birch stands on former agricultural lands the species composition is poorer and the number of mites is lower, than in the natural birch forests. On the other hand, birch created the best conditions for the secondary succession on forested areas and was populated with the higher number of species as compared to the 13 other coniferous and deciduous tree species (SKORUPSKI 2010).
The results presented in this study confirm the average biodiversity level on individual plots (15 species), and reveal, that this is much more species observed, than on the surrounding arable fields (TROJANOWSKI - BŁASZAK 1981, SENICZAK et al. 1996). On the other hand, in particular chronosequences (formed by 4 neighboring plots of different age) presented in our study we reported on average more than twice as much species (35), which reveals high site potential and high successional dynamics of the investigated research plots. Additionally, it should be emphasized rapid emergence of species characteristic of forest ecosystems (Geholaspis longispinosus, Holoparasitus calcaratus, Macrocheles montanus, Olodiscus minima and Urodiaspis tecta), which proves a high rate of change under the influence of the spontaneous birch succession on former agricultural lands.
6. CONCLUSIONS
1. The number of specimens and species of Mesostigmata order mites increases with the increasing age of the birch succession.
2. There is a relatively high rate of change observed in the conversion of assemblage structure and species composition of mites typical for agricultural areas into more adequate to forest soils.

Science for Sustainability University of West Hungary International Scientific Conference for PhD Students March 19-20, 2013 – Győr
166
3. Further and deeper observation of the soil fauna assemblages development occurring on the investigated plots can prove the potentiality of using the succession processes for planned afforestation of former agricultural lands.
Acknowledgements: The research was financed by the Polish National Science Center in the frame of the research project N N305 400238 titled “Ecological consequences of the silver birch (Betula pendula Roth.) secondary succession on former agricultural lands”. References BŁOSZYK J. 2008. Wykaz gatunków Acari: Uropodina (In: Bogdanowicz W., Chudzicka E., Pilipuk I. i Skibińska
E., (eds.) Fauna Polski – charakterystyka i wykaz gatunków). Muzeum i Instytut Zoologii PAN, Warszawa, 3: 76-78. [in Polish]
HUHTA V., RÄTY M. 2005. Soil animal communities of planted birch stands in central Finland. Silva Fennica 39 (1): 5-19.
HUHTA V, NIEMI R. 2003. Communities of soil mites (Acarina) in planted birch stands compared with natural forests in central Finland. Canadian Journal of Forest Research, 33 (2): 171-180.
KAMCZYC J. 2006. Microhabitat preferences of Veigaia mollis Karg, 1971 in the mountain reserve “Szczeliniec Wielki”. Biol. Lett., 43 (2): 193-195.
KOZAK I., JÓZWINA M., KOZAK O. 2004. Badania przeprowadzone metodą Automatów Komórkowych na obszarze gminy Czemierniki (woj. lubelskie)., strony http://www.kul.lublin.pl/ksk/strony/badania, Katedra Systemów Krajobrazowych KUL. [in Polish]
SENICZAK S., KACZMAREK S., RATYŃSKA H., SENICZAK A. 1996. Roztocze (Acari) glebowe strefy ekotonowej, pomiędzy zadrzewieniem śródpolnym a uprawą jęczmienia, w krajobrazie rolniczym okolic Turwi. Zesz. Nauk. ATR (Bydgoszcz), 203, Zootech., 27: 139-151. [in Polish]
SKORUPSKI M. 2008. Wykaz gatunków Acari: Mesostigmata (In: Bogdanowicz W., Chudzicka E., Pilipuk I. i Skibińska E., (eds.) Fauna Polski – charakterystyka i wykaz gatunków). Muzeum i Instytut Zoologii PAN, Warszawa, 3: 64-76.
SKORUPSKI M. 2010. Influence of selected tree species on forest ecosystem biodiversity for the example of Mesostigmata mites in a common-garden experiment. Rozprawy Naukowe 408. Wydawnictwo Uniwersytetu Przyrodniczego w Poznaniu, s. 1-106.
TROJAN P. 2000. The meaning and measurements of species diversity. Fragm. Faun. 43: 1-14. TROJANOWSKI H., BŁASZAK C. 1981. Fauna drobnych bezkręgowców lucerny. I. Acari - Roztocze. Pr. Nauk. IOR,
23 (2): 207-228. [in Polish]
Albedo Measurements above the Lake Balaton
MENYHÁRT Lászlóa*– ANDA Angélaa a Department of Meteorology and Water Management, University of Pannonia, Keszthely, Hungary
Abstract – Albedo measurements have been carried out above the Lake Balaton since 2007 near Keszthely and Siófok. The measurements of both the global and reflex radiation include systematic error. Its value varies from year to year on both sites. In this paper we present four methods to calculate these systematic errors. Comparison of these methods shows that the systematic error of both the global and the reflex radiation can be calculated with uncertainty of 2 W/m2 solely from the distribution of the radiation values measured at night-time.
Keywords: pyranometer / global radiation / reflex radiation / thermal offset
* Corresponding author: [email protected], H-8360 Keszthely, Deák F. u. 16.

Science for Sustainability University of West Hungary International Scientific Conference for PhD Students March 19-20, 2013 – Győr
167
1. INTRODUCTION
Increasingly accurate albedo values are needed for both the examination of the heat balance of the Lake Balaton and the high-resolution weather models (VÖRÖS et al. 2010). Last research program relating to the albedo of the Lake Balaton was carried out in the early seventies (WEINGARTNER 1964, DÁVID 1972, DÁVID et al. 1974, DÁVID – KOZMA 1976). Recent technological developments enabled us to carry out new, high-precision albedo measurements with higher spatial and temporal resolution. In 2007, as part of the Life Project of Lake Balaton Development Coordination Agency two hydrometeorological columns were settled into the lake-body situated far from the shore. One of them is near Siófok (lat: 46°58,28’; long: 18°03,67’), the other one is in the Keszthely Bay, a few hundred meters from the mouth of the River Zala (lat: 46°47,01’; long: 17°16,63’). Both of them are equipped with sensors measuring global radiation, reflex radiation, air temperature, relative humidity, wind direction and wind speed. The values measured by the sensors are delivered to the central computer through radio-frequency connection. The columns are taken out of the water in winter to prevent ice damage.
During the processing of data it turned out that a systematic offset error was superposed to both the global and the reflex radiation. The value of this systematic error was approximately constant per pyranometer within a year but on the other hand it varied from year to year and from pyranometer to pyranometer (Figure 1). The cause of this error is unknown. Presumably the values of these errors varied during the taking down and setting up of the devices each year.
In this paper we make an effort to determine the values of the systematic errors in order to make the measured values suitable for calculating the albedo.
2. METHODS OF CORRECTION
Each methods are based on the analysis of radiation values measured at night-time. At night when the radiation coming from the Sun is zero the thermopile pyranometer usually measure no zero values. It is caused by the temperature difference between the sensor and the dome. If the dome is cooler than the sensor the dome attracts heat from the sensor by the net infrared radiation. This heat flow causes small negative output signal which is called thermal offset. It originates from the zero offset type A and zero offset type B. In case of type A the dome cools because it emits more longwave infrared radiation toward the surroundings of lower effective temperature than it absorbs. In case of type B the variation of the air temperature directly causes the dome to become cooler − or warmer. The difference between the values measured at night-time below solar elevation of -10° and the intrinsic thermal offset error of pyranometers were examined with four methods.
2.1. Distribution by sign of the radiation values
The base of the first method is an empirical observation connecting to an other research where albedo measurements were carried out above maize stock with Kipp&Zonen CMP6 pyranometers in 2010 and 2011 in summer. The observation is that the values measured at night-time by a global radiometer are typically zero or negative whereas by a reflex radiometer are typically zero or positive. The negative night values of global radiometer is well-known whereas the positive values of the reflex radiometer follow from the fact that this device faces towards the warmer surface instead of the cooler sky.

Science for Sustainability University of West Hungary International Scientific Conference for PhD Students March 19-20, 2013 – Győr
168
Reflex radiation (W/m2) Global radiation (W/m2)
solar elevation(°) solar elevation(°)
Figure 1. Reflex and global radiation measured in Keszthely yearly
Figure 2. Distribution of values measured by the albedometer of Siófok in 2011
It is supposed that different pyranometers measure values with the same sign under identical
weather conditions. It is also supposed that the distribution of the night values above the water is the same than above the shore. It is proved by the comparison of the results of the measurements carried out with the same instrument above the water and above the shore (Figure 2).
On the basis of these assumptions the systematic error was determined as follows. In case of global radiation the highest of the values with at least 1 % relative frequency was considered as systematic error. In case of reflex radiation the lowest of the values with at least 1 % relative frequency was considered as systematic error.
2.2. Looking for zero thermal offset on the basis of air and water temperature
The substance of the second method is selecting the measurements in case of which the thermal offset error was zero. During fully overcast nights the longwave radiation loss of the global radiometer is about zero. Similarly, when the water temperature is equal to dome temperature the longwave radiation loss of the reflex radiometer is about zero. The dome temperature is considered equal to the air temperature. If there is no incoming airmass with different temperature the offset type B is also around zero. For determining the systematic error of the global radiation firstly the measurements were selected before which within 1 hour the temperature change was smaller than 0.1 °C. The highest value of them with at least 1% relative frequency was considered as the systematic error. In the case of reflex radiation the measurements were selected before which within 1 hour the temperature change was smaller than 0.1 °C and the difference of the water and air temperature was lower than 1°C. The mean of these values was considered as the systematic error.
Above theVíz felett
Part felettVíz felett
2007 2008 2009 2010 2011
2007 2008 2009 2010 2011
Rel
ativ
e fr
eque
ncy
Rel
ativ
e fr
eque
ncy
Above the shoreAbove the water
Above the shoreAbove the water
Global radiation Reflex radiation

Science for Sustainability University of West Hungary International Scientific Conference for PhD Students March 19-20, 2013 – Győr
169
According to the observation of BUSH et al. (2000) in case of 5 °C difference between the dome and the sensor it takes about 5 hours to restore the equilibrium. This is why the method was also performed with a stricter condition considering 5 hours before the measurements. Beyond the condition detailed before the following conditions were required. The change in air temperature should not exceed 1 °C per 5 hours as well as the difference between the water and air temperature should not exceed 1 °C.
2.3. Looking for zero thermal offset on the basis of cloudiness
This method was only used for the data of 2011. We selected directly the fully overcast nights through satellite images. The images were produced by the Eumetsat and were downloaded from the sat24.com site. Only the nights when the sky was fully overcast from sunset to sunrise all long were selected. The calculation of the systematic errors was identical to what was described for the previous method in 2.3 section. They were calculated from two different datasets. First, all fully overcast data were used. Next, these data were filtered on by the temperature as described in 2.3 section.
2.4. Negative thermal offset in case of reflex radiation
The upward facing pyranometer exchanges radiation primarily with the relative cold atmosphere and it results in negative zero offset at night. Conversely, the downward facing pyranometer exchanges radiation primarily with the water surface which is sometimes warmer and sometimes cooler than the dome. The warmer water surface causes positive thermal offset type A while the decreasing air temperature causes negative thermal offset type B. The measurements show that the water temperature is higher than the air temperature in about 80 percent of all cases. This is true for each year, though the ratio varied slightly by months. Therefore in this method instead of searching for the exactly zero thermal offset those records were examined where both the error type A and type B were negative. The records with lower water temperature than air temperature were selected and the highest value of them was considered as the systematic error.
3. RESULTS
The systematic errors determined with the different methods are shown in Table 1 and Table 2. The second method for reflex radiation was not executed for each years only when there was water temperature measuring. In 2011, at Keszthely there was no data meeting the requirements of 5 hours. In case of the second method, comparison of the results of 1 hour condition and the 5 hours shows that there is no considerable difference between them. Hence use of the stricter condition is not necessary.
Five to ten different night values were generally measured by pyranometer and by year. The second and the third methods were expected to pick out the only one which can be considered as the systematic error. That is, with these methods we tried to pick out the measurements where the thermal offset was around zero. Conversely, comparison of the histograms of the different methods shows that the distribution of the values changed but sorting out the only value was failed (Figure 3). It is true for both the global and reflex radiation on both sites. Neither the cloudiness by itself nor the temperature by itself is enough for selecting the measurements of zero thermal offset. However the efficiency of the method is notably improved by use of them together. Comparison of all methods shows that the systematic error of the global radiometer was determined with uncertainty of 2 W/m2.

Science for Sustainability University of West Hungary International Scientific Conference for PhD Students March 19-20, 2013 – Győr
170
Table 1. Systematic errors of pyranometers measuring global radiation
Method 2.1 2.2(1 hour)
2.2(5 hour)
2.3 (only cloud)
2.3 (cloud+temp)
2007 -26 -26 -28 2008 -29 -29 -29 2009 -13 -13 -13 2010 7 6 6 K
eszt
hely
2011 3 3 2 3 1
2007 -14 -14 -14 2008 -14 -14 -14 2009 -13 -13 -14 2010 -5 -4 -4 Si
ófok
2011 -5 -5 -5 -5 -6
Table 2. Systematic errors of pyranometers measuring reflex radiation
Method 2.1 2.2(1 hour)
2.2(5 hour)
2.3(only cloud)
2.3 (cloud+temp) 2.4
2007 -14 2008 -14 2009 -17 2010 2 3,2 3 6 K
eszt
hely
2011 2 4,4 4,7 1,0 7 2007 -15 - 2008 -16 -14,6 -14,7 -13 2009 -16 2010 0 0,8 0,8 3 Si
ófok
2011 0 1,5 1,3 1,9 0,4 4 In case of reflex radiation the values determined by the fourth method is considerably
different from the other values. To decide which method gives the more reliable systematic error the albedo calculated for clear days in two different ways were compared. First, the reflex radiation was corrected with the first method, next with the fourth one. In both cases the global radiation was corrected with the first method. Figure 4 shows the daily course of albedo calculated with the first method has no local maximum, while that corrected with the fourth method does. It is generally known that albedo has a local maximum at solar elevation around 10-12° (IQBAL 1983). It follows that the fourth method provides more accurate values.
Figure 3. Distribution of radiation values after different selection in Keszthely, 2011
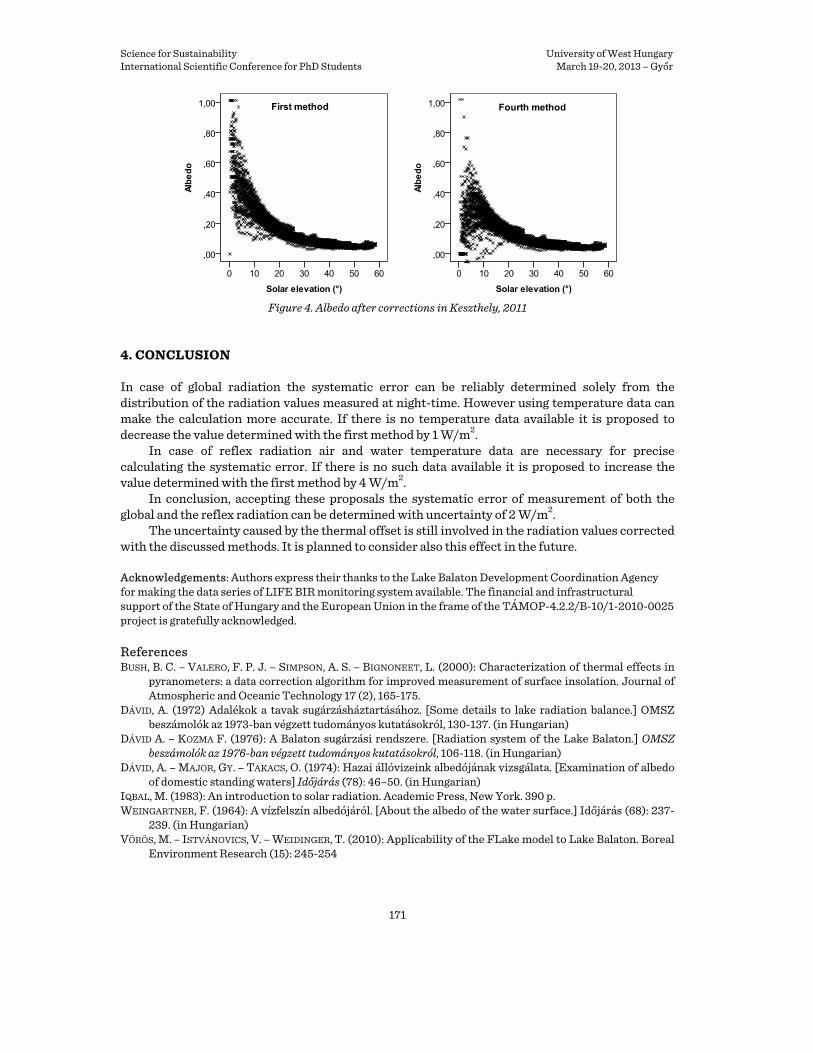
Science for Sustainability University of West Hungary International Scientific Conference for PhD Students March 19-20, 2013 – Győr
171
Figure 4. Albedo after corrections in Keszthely, 2011
4. CONCLUSION
In case of global radiation the systematic error can be reliably determined solely from the distribution of the radiation values measured at night-time. However using temperature data can make the calculation more accurate. If there is no temperature data available it is proposed to decrease the value determined with the first method by 1 W/m2.
In case of reflex radiation air and water temperature data are necessary for precise calculating the systematic error. If there is no such data available it is proposed to increase the value determined with the first method by 4 W/m2.
In conclusion, accepting these proposals the systematic error of measurement of both the global and the reflex radiation can be determined with uncertainty of 2 W/m2.
The uncertainty caused by the thermal offset is still involved in the radiation values corrected with the discussed methods. It is planned to consider also this effect in the future. Acknowledgements: Authors express their thanks to the Lake Balaton Development Coordination Agency for making the data series of LIFE BIR monitoring system available. The financial and infrastructural support of the State of Hungary and the European Union in the frame of the TÁMOP-4.2.2/B-10/1-2010-0025 project is gratefully acknowledged. References BUSH, B. C. – VALERO, F. P. J. – SIMPSON, A. S. – BIGNONEET, L. (2000): Characterization of thermal effects in
pyranometers: a data correction algorithm for improved measurement of surface insolation. Journal of Atmospheric and Oceanic Technology 17 (2), 165-175.
DÁVID, A. (1972) Adalékok a tavak sugárzásháztartásához. [Some details to lake radiation balance.] OMSZ beszámolók az 1973-ban végzett tudományos kutatásokról, 130-137. (in Hungarian)
DÁVID A. – KOZMA F. (1976): A Balaton sugárzási rendszere. [Radiation system of the Lake Balaton.] OMSZ beszámolók az 1976-ban végzett tudományos kutatásokról, 106-118. (in Hungarian)
DÁVID, A. – MAJOR, GY. – TAKACS, O. (1974): Hazai állóvizeink albedójának vizsgálata. [Examination of albedo of domestic standing waters] Időjárás (78): 46–50. (in Hungarian)
IQBAL, M. (1983): An introduction to solar radiation. Academic Press, New York. 390 p. WEINGARTNER, F. (1964): A vízfelszín albedójáról. [About the albedo of the water surface.] Időjárás (68): 237-
239. (in Hungarian) VÖRÖS, M. – ISTVÁNOVICS, V. – WEIDINGER, T. (2010): Applicability of the FLake model to Lake Balaton. Boreal
Environment Research (15): 245-254

Science for Sustainability University of West Hungary International Scientific Conference for PhD Students March 19-20, 2013 – Győr
172
Health Condition of Sessile Oak (Quercus petraea) in Hungary
GULYÁS Krisztinaa∗ – BERKI Imreb a Kitaibel Pál Doctoral School of Environmental Science, University of West Hungary, Sopron, Hungary
b Institute of Environmental and Earth Sciences, Faculty of Forestry, University of West Hungary, Sopron, Hungary
Abstract – Sessile oak (Quercus petraea Matt. Liebl.) is one of the most important native tree species in Hungary. It provides valuable raw material for the wood industry and is important from an ecological point of view too. Sessile oak covers approximately 180˙000 hectares, which is 11.1% of the total forest area; therefore the health condition of the species is essential for Hungarian silviculture (Csóka et al. 1999).
As a result of climate change, the mean annual temperature is increasing while the mean annual precipitation is decreasing, so the climate has become warmer and dryer in the second half of the last century. Several studies report that the frequency of extreme weather conditions (especially droughts) has increased. Since the 1970’s severe dry periods have triggered mass mortality of stand forming forest tree species (Quercus petraea, Quercus robur, Picea abies, Pinus sylvestris, Pinus nigra and Fagus sylvatica) in the Carpathian basin. The decline of sessile oak due to dry periods has been continuously observed for more than three decades.
Nitrogen supply has a relatively high influence on drought tolerance. According to a recent European study, nitrogen deposition correlates well with higher current increment of Scots pine, Norway spruce and oak species on sites with different site productivity, stand age and stand density (Solberg et al 2009, Laubhann et al 2009).
In order to better understand the effects of climatic extremes and of nitrogen supply on the health of sessile oak, we have examined 37 different populations to investigate the climatic sensitivity of sessile oak. The relationship between the aridity of the last decades and the health status of sessile oak stands was analysed along a transect from the semihumid region in SW Hungary to the semiarid region in NE Hungary. The climate of the sites was characterized by Ellenberg’s drought index (EQ). The actual density of the stands demonstrates the “cumulative” health status of the last decades. The number of surviving trees was compared to standard density according to yield tables We found a significant correlation between EQ, nitrogen concentration and the health decline (mortality) of oak (R2 = 0,84). The results suggest that the mortality from drought tolerance is considerably influenced by nitrogen supply. Under semihumid conditions (EQ < 30) foliar nitrogen concentration does not affect the health status, but on dryer sites, above EQ of 34, sites with a relatively high nitrogen supply display a better health.
These results may help to understand the area changes of oak forests. Furthermore, finding the reasons of these changes in the past few decades can help to better project possible changes in the future.
References CSÓKA, Gy. – TÓTH, J. – Koltay, A. (1999): Trends of the sessile oak decline in North-Eastern Hungary. In:
Forster, B. – Knízek, M. – Grodzki, W. (eds.). Methodology of Forest Insect and Disease Survey in Central Europe. Proceedings of the Second workshop of the IUFRO WP 7.03.10, April 20-23. 1999, Sion-Cháteauneuf, Switzerland.
LAUBHANN, D. – STERBA, H. – REINDS, G. J. – DE VRIES, W. (2009): The impact of atmospheric deposition and climate on forest growth in European monitoring plots: An individual tree growth model. Forest Ecol. Manage. 258: 1751–1761.
SOLBERG, S. – DOBBERTIN, M. – REINDS, G.J. – LANGE, H. – ANDREASSEN, K. – FERNANDEZ, P. G. – HILDINGSSON, A. – DE VRIES, W. (2009): Analyses of the impact of changes in atmospheric deposition and climate on
∗ Corresponding author: [email protected]; H-9400 Sopron, Ady E. út 5.

Science for Sustainability University of West Hungary International Scientific Conference for PhD Students March 19-20, 2013 – Győr
173
forest growth in European monitoring plots: A stand growth approach. Forest Ecol. Manage. 258: 1735–1750.
Effects of Weather Conditions on the Reproductive Success of House Sparrows
PIPOLY Ivett 1∗ – BÓKONY Veronika1 – SZABÓ Krisztián2 – LIKER András3
1 University of Pannonia, Department of Limnology, Veszprém, 8200. Hungary; 2 Szent István University, Department of Ecology, Budapest,1077. Hungary;
3 University of Sheffield, Department of Animal and Plant Sciences, Sheffield, S10 2TN, UK; Abstract – The effects of climatic changes on various behaviors of animals have been documented, but there is still little information about how weather variability and extreme meteorological events influence reproductive success in animal populations.
In this study we have investigated the relationship between ambient weather variability and reproductive success of House Sparrows (Passer domesticus, L.), a species of conservational concern that is declining throughout Europe. The studied population breeds in a nest-box colony in the Zoo Veszprém. We have monitored the breeding attempts from 2005 to 2010. Date of breeding attempts, number of eggs and nestlings, nestlings’ mass and tarsus length was registered in the field. Nestlings’ sex was identified by molecular sexing methods from blood samples in a subset of broods with two independent primer-pairs. Meteorological data were collected by Vmeteo Meteorological Club, Veszprém. We used the daily maximum and daily minimum temperature, and daily precipitation data to calculate 55 variables that describe the mean and variance of temperature and precipitation during incubation or nestling development. Using these variables, weather during each breeding attempt was characterized by the first four principal components from a principal component analysis: the amount (PC1) and direction (PC2) of temperature variation, aridity (PC3) and warmth (PC4). We analyzed the effects of these factors on measures of breeding success using general linear mixed effects models. Model selection was based on Akaike’s Information Criterion. “R” software was used for data analyses.
Our results show that dry, warm weather promotes both hatching and fledging success and nestling development. Fledging success increased with the frequency of warm days and decreased when temperature drops were frequent. Nestlings’ body mass and tarsus length was reduced in wetter weather. There were more male nestlings under less variable, warmer and less dry weather conditions than female nestlings. Particularly low proportion of males fledged when high variability of temperature was coupled with aridity. Nestlings’ sex ratio was 49.1 % in the study population, which did not differ significantly from unity.
Damp warm weather may be disadvantageous for hatching success as it can favor microbial infections through the eggshell. Cold and wet weather may negatively affect nestling development and survival directly through the thermoregulation of nestlings and/or indirectly by decreasing food availability or parental provisioning rate. Male and female nestlings might be differentially sensitive to weather conditions. The overall results of this study suggest that weather has complex effects on the reproductive success of House Sparrows, with heavy rainfalls being generally unfavorable and this effect depending on the degree and variability of temperature.
∗ Corresponding author: [email protected], University of Pannonia, 8200. Veszprém, Egyetem utca 10.

Science for Sustainability University of West Hungary International Scientific Conference for PhD Students March 19-20, 2013 – Győr
174
Monitoring of Microbial Abundance and the Selection of Propylene-glycol Degrading Bacteria from Contaminated
Soil
HORVÁTH Nikolettaa7 – MATICS Helénaa – DOMONKOS Mónikab – BIRÓ Borbálac
aUniversity of Pannonia, Georgikon Faculty, Keszthely, Hungary bCorvinus University, Faculty of Horticultural Science, Budapest, Hungary
cInstitute for Soil Sciences and Agricultural Chemistry, Centre for Agricultural Research, HAS, Budapest, Hungary
Abstract – Deicing fluids (DF) containing propyleneglycol (PG) are frequently used at Oslo airport. These DFs find their way into the immediate environment endangering human health and also further afield by infiltration to the subsoils. Microbial abundance and the ratio of PG degraders in the contaminated soil were tested in below-ground samples, vertically and in surface soils at an increasing distance from the runway. Isolates were taken among the dominant bacteria capable to degrade PG during snowmelt at 4oC and identified by PCR molecular techniques. Results indicated that at a low temperature nutrients and oxygen are the main limiting factors in the soils contaminated with PG, and although it is an organic chemical and easily degrades biologically, it is mobile, and in higher concentrations is toxic to bacteria. However, isolated and PCR-identified Pseudomonas strains can be efficiently used for bioremediation of DF containing PG.
Keywords: propylene-glycol / pseudomonas / (bio)degradation / environment / soil / contamination
1. INTRODUCTION
Oslo International Airport is built on Norway’s largest rain-fed groundwater aquifer. Usually the groundwater in this area is 10 meters deep, but in higher grounds it can range between 2 and 20m (SoilCAM, 2007). De-icing fluids (DF) containing propylene-glycol (PG) and other constituents are used at the airport on airplanes in winter between October and April to prevent aircraft from freezing. Anti-icing of aircraft occurs in a remote platform (OVSTEDAL és WEJDEN, 2007). During mechanical removal of snow from the runways and by the airborne drift of DF from the airplanes during take-off the DFs are mixed with snow. These chemicals infiltrate the soil surface along the runways when the snow begins to melt around April. The de-icing chemicals are easily degradable, but may still threaten groundwater due to system overloading. There is a well equipped research station in the Oslo airport that was established in 1992 to be able to follow the spreading of de-icing fluids in the soil. It is necessary to increase the biological degradation of the chemicals in order to match the environmental regulations. So far several research projects have taken place in order to estimate the effects of aircraft de-icing fluids on the environment (FRENCH et. al. 2000, 2001).
There are many types of de-icing chemicals which contain either propylene-glycol (PG) or ethylene-glycol in addition condensers, surfactants, corrosion inhibitors and UV sensitive coloring dyes. Type 1 and type 2 aircraft DFs that are used at Oslo airport are based on PG (TRANSPORT CANADA, 2005). Results from the 2005/2006 and 2006/2007 seasons indicate that it is mainly type 2 DF based on PG that is being dispersed to the area along the runways (OVSTEDALD and WEJDEN, 2007). The primary concern regarding the environmental impacts of de-icing activities relates to oxygen consumed during the decomposition of de-icing fluids. The unsaturated zone acts as a natural purification system (FRENCH et al, 2001). Although PG is easily degraded by soil bacterial communities, they still constitute a threat to the groundwater due to potential overloading of the 7 Corresponding author(s): [email protected]; [email protected]; MTA ATK TAKI, H-1022 Budapest, Herman Ottó út 15.

Science for Sustainability University of West Hungary International Scientific Conference for PhD Students March 19-20, 2013 – Győr
175
system's degradative capacity if biodegradation rates are not sufficient compared to velocities in the unsaturated zone (FRENCH, 2009). Aerobic microbial degradation is the most important environmental process affecting glycols in surface waters, whereas anaerobic metabolism of glycols is considerably slower. Knowledge on the abundance of microbial presence or absence in soils is a crucial monitoring step for designing any further scientific activities.
2. MATERIALS AND METHODS
Sampling of the site occurred in 2008 (from lysimeters) and 2009 (from the surface). The location of the soil samples are at the south-western part of the airport along the runway, contaminated with de-icing chemicals. The deep soil samples were taken from 5 lysimeters located at the research station of the airport. The samples were stored until use in plastic bags at 4 oC. From the 5 lysimeters, 23 aerob and 23 anaerob vertical samples were taken. In addition we received surface soil samples taken in an increased distance from the runway from 0.2 to 87m (horizontal samples).
Microbial abundance in the soil samples was measured by plating out 10-fold serial soil dilutions in 0.9% NaCl on nutrient (for bacteria) and Rose-Bengal (for microscopic fungi) (SIGMA-Aldrich) agar plates. Anaerocult sacks (Merck) and anaerob jars were used for the anaerobic bacterial counts. The 10-1 dilution was prepared by suspending 1g of soil in 9ml 2mM tetrasodium-pyrophosphate and vortexed for two minutes to enhance the separation of bacterial cells and soil particles. Plates were incubated for 7 days at 22 °C with at least two parallel plates per soil sample. Pseudomonas spp. CFUs (colony forming untis) in 1g soil were determined by the same method but with plating out soil dilutions on Pseudomonas selective Cetrimide agar (Merck). Strains showing highly abundant positive growth on the selective agar were isolated.
Most probable number (MPN) of soil bacteria capable of growing on 10,000 ppm type 2 DF as a sole carbon source were determined by a microplate MPN method. 10-fold serial soil dilutions were made in basal medium (NaCl, 0.8g/l; NH4Cl, 1.0g/l; KCl, 0.1g/l; MgSO4(7 H2O), 0.02g/l; KH2PO4, 1.35g/l; K2HPO4, 1.75g/l; NaHCO3, 1.5g/l; TES puffer, 4.6g/l) from 10-1 to 10-8 dilutions as described (LIBISCH et al. 2010) and then 10,000ppm DF was added. Five parallel 200μl aliquots from each dilution were transferred to sterile polystyrene 96-well microplates. Controls included inoculated dilutions with basal-medium only, without DF. After incubation at 22°C for 2 and 4 weeks the plates were tested for growth using the respiration indicator iodonitrotetrazolium violet (INT) (Sigma-Aldrich), as described (JOHNSEN and HENRIKSEN, 2009). Approximately 50μl INT solution (3g/l INT dissolved in water) was added to each well, and the plates were incubated overnight at 22°C. Metabolically active bacteria reduce INT to the corresponding formazan forming a purple precipitate. The number of growth-positive wells at each dilution was determined by visual inspection of the plates. The statistical method of Cochran was applied to calculate MPN values using the MPN calculator VB6 (COHRAN, 1949).
Strains which were able to grow on Pseudomonas selective agar have been tested for toleration of DF chemicals; and identified by molecular methods as described by (SPILKER et al. 2004). Cell disruptions were made by suspending 2-3 colonies from the plate into an eppendorf containing 30µl 0.5M NaOH. After 15 minutes of incubation 30µl 1M trizma buffer (SIGMA) and 200µl sterile distilled water were added, the supernatant contained the DNA for analysis. The DNA samples were amplified using PCR utilising genus specific primers (Table 1) matching the selected strains to identified Pseudomonas control (P. aeruginosa NCAIM B 02040).

Science for Sustainability University of West Hungary International Scientific Conference for PhD Students March 19-20, 2013 – Győr
176
Table 1. 16S rDNA-based primer sets
3. RESULTS
Lysimeter sample locations (vertical samples) were all from contaminated areas of the Oslo airport representing the different polluted sites of the airport; their depth level ranging from the surface to 110cm deep (not exatly the same for each lysimeter). During the evaluation of the results of the vertical samples the highest microbe colony forming unit number (CFU g-1) was observed in the top 20-30cm of the soil. Heterotrophic cell numbers counted on the nutrient agar (Figure 1) were 2 orders of magnitude higher than anaerobic (Figure 2) and fungal (Figure 3) cell numbers measured from the same samples. In all three groups the CFU g-1 decreases toward the deeper soil layers implying a drop in oxygen and nutrient levels. Even though the samples were taken from the same area, the five lysimeters show significant difference in microbial cell numbers.
Figure 1. Rate of the total aerob microbial CFU according to depth in lysimeters from Oslo airport.
Horizontal samples were taken at an increasing distance from the runway. Normally high
concentrations of pollutants inhibit microbial growth and reproduction. Results show that the number of microorganims increases proportionately with distance, and thus with the decreasing concentration of chemicals (Figure 4). Approximately 85m from the runway CFU g-1 numbers were around 10 times higher than in the close vicinity of centre of the pollution. MPN g-1 results from horizontal samples showed a similar trend with the CFU g-1 numbers: from the runway the most probable number of bacterial cells grows in accordance with the contamination decrease (Figure 5). During the MPN experiments only PG were added to the media, so these numbers only concern bacteria capable to degrade DF containing PG as sole carbon source. Comparing the number of PG degraders to CFU cell count results from nutrient agar - which show the total number of heterotrophic bacteria - we can see a significant difference in magnitudes. The amount
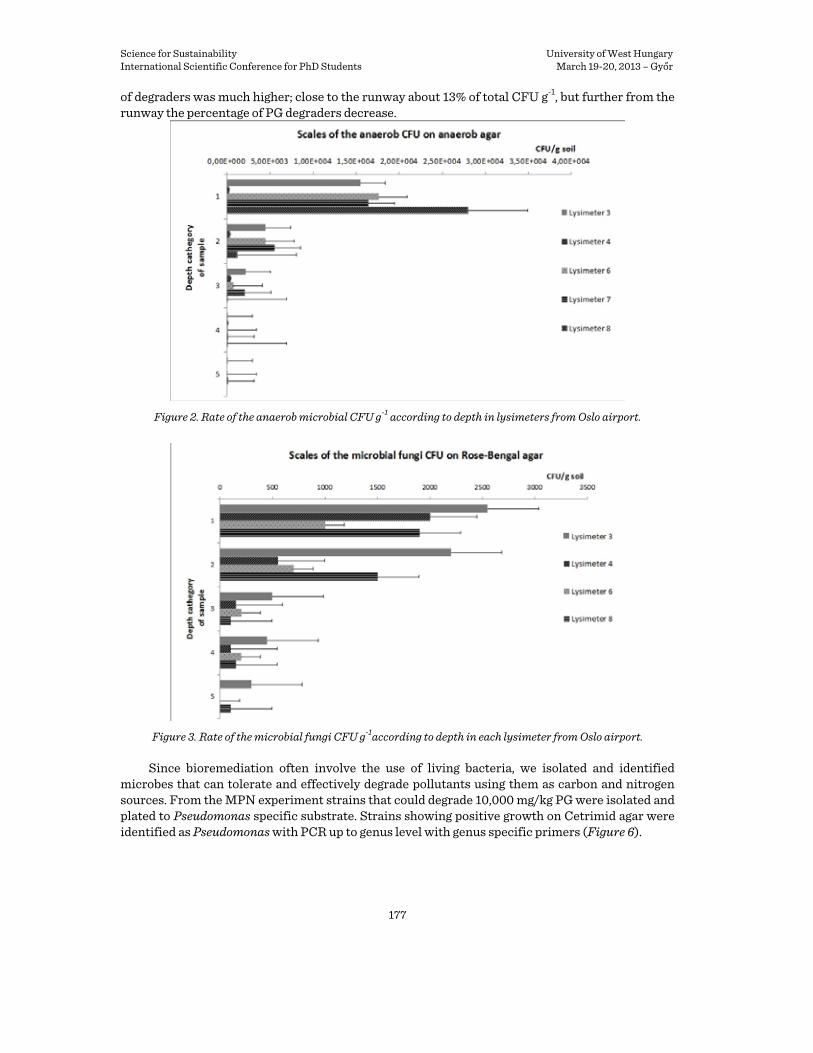
Science for Sustainability University of West Hungary International Scientific Conference for PhD Students March 19-20, 2013 – Győr
177
of degraders was much higher; close to the runway about 13% of total CFU g-1, but further from the runway the percentage of PG degraders decrease.
Figure 2. Rate of the anaerob microbial CFU g-1 according to depth in lysimeters from Oslo airport.
Figure 3. Rate of the microbial fungi CFU g-1according to depth in each lysimeter from Oslo airport.
Since bioremediation often involve the use of living bacteria, we isolated and identified
microbes that can tolerate and effectively degrade pollutants using them as carbon and nitrogen sources. From the MPN experiment strains that could degrade 10,000 mg/kg PG were isolated and plated to Pseudomonas specific substrate. Strains showing positive growth on Cetrimid agar were identified as Pseudomonas with PCR up to genus level with genus specific primers (Figure 6).

Science for Sustainability University of West Hungary International Scientific Conference for PhD Students March 19-20, 2013 – Győr
178
Figure 4. Total aerob CFU at an increased distance
from the runway in Oslo airport Figure 5. Most probable number of bacteria
capable to degrade PG at an increased distance from the runway in Oslo airport
Figure 6. Gel picture of the PCR identification of three isolates from the Oslo airport. M. marker, 1. sample M, 2.
sample N, 3. sample O, 4. controll strain (P. aeruginosa NCAIM B 02040), 5. negative controll
4. DISCUSSION
Among the environmental microbiological assays many techniques have been used since the middle of the 20th century. Even though nowadays advanced molecular technologies are common in microbiology, both of them have advantages in full scale laboratory research. Classical methods are sometimes more cost effective and easier to perform, but have their limits. Whereas molecular techniques often show more detail and present more precise data. However, they can complement each other. So for a complex microbial analysis of a site combined methods are useful. Typically, heterotrophic bacterial colony forming units in most soils are between 103 - 107 CFU g-1 (BAUSMITH and NEUFELD 1999), while microbial fungi range from 102 - 103 CFU g-1 (SMITH and DAWSON, 1944). In our case aerobic bacterial numbers were 2-3 orders of magnitude higher than anaerobic bacteria. Although aerobic numbers in every case dropped with the depth, the anaerobic numbers did not increase, and there were significant differences between lysimeters. These results indicate that the nutrient and oxygen level in the subsoil may be limiting factors to bacterial presence and degradation. Also degradation involves not just aerobic, but both facultative and obligate anaerobic microbes as well, which is difficult to differentiate. PG is an organic, degradable and mobile pollutant, however, higher concentrations are toxic to bacteria and only a part of the bacterial

Science for Sustainability University of West Hungary International Scientific Conference for PhD Students March 19-20, 2013 – Győr
179
community is capable of degrading PG in high concentrations. Along the runway DF chemicals are more concentrated, and they mix with other carbon sources and contaminants used during the operation of the airport, which results in a decrease of bacterial numbers.
To be able to involve a successful on site bioremediation for these soils they will need to either activate microbes or use degrader bacterial strains as inoculums. These strains need to be able to degrade the contaminants using them as nurients (non-invasive bioremediation) and they need to be well characterised and identified to rule out pathogen species. Pseudomonas spp. bacteria are known for their ability of glycol degradation (HAINES and ALEXANDER, 1975). After sequencing and ruling out the possible pathogens isolated Pseudomonas species may be used for bioremediation purposes combined with amendment techniques which can successfully increase the degradation rate of PG.
Besides the quantitative evaluations and identification of microorganisms, more complex experiments are required to combine further soil structural, chemical quantity and degradation data with microbiological results. These may help minimise the impact of such chemicals on the soil environment until more environmentally friendly de-icing agents are developed. Acknowledgements: We wish to thank the Soil-CAM EU-FP7 Project and the University of Pannonia for providing research background. References BAUSMITH, D. S. – NEUFELD, R. (1999): Soil biodegradation of propylene glycol based aircraft deicing fluids.
Water Environment Research, 71: /August 1999 COCHRAN, W. G. (1949): Estimation of bacterial densities by means of the „Most Probable Number”,
Biometrics, Vol. 6, No. 2, (Jun. 1950), pp. 105-116 FRENCH, H. K. – VAN DER ZEE, S. E. A. T. M. – LEIJNSE, A. (2001) Transport and degradation of propyleneglycol
and potassium acetate in the unsaturated zone. Journal of Contaminant Hydrology, 49, 23-48 FRENCH, H. K. – GODIO, A. – VAN DER ZEE, S. E. A. T. M. – GHINDA, T. (2009): Initial meta-data set and concept of
meta-model, Deliverable D 6.1, March – 2009, www.soilcam.eu LIBISCH, B. – VILLÁNYI, I. – FÜZY, A. – HORVÁTH, N. – BIRÓ, B. (2010): Identification and characterisation of
bacterial strains capable to degrade aircraft de-icing fluids at four degrees, Journal of Bacteriology/Special Abstracts 150S (2010) S1-S576, S259
JOHNSEN , A. R. – HENRIKSEN, S. (2009): Microplate MPN-enumeration of monocyclic- and dicyclic-aromatic hydrocarbon degraders via substrate phase-partitioning. Biodegradation. 20(4):581-9, 2009.
HAINES, J. R. – ALEXANDER, M. (1975): Microbial degradation of polyethylene glycols. Laboratory of Soil Microbiology, Applied Microbiology, May 1975, p. 621-625
OVSTEDAL J. – WEJDEN, B. (2007): Dispersion of deicing chemicals to the areas along the runways at Oslo airport Gardermoen; In: SAE aircraft and engine icing international conference, Seville, Spain.
SMITH, N. R. – DAWSON, V.T. (1944): The bacteriostatic action of rose-bengal in media used for plate counts of soil fungi, U.S. Department of Agriculture
SPILKER, T. C. – VANDAMME, T. P. – LIPUMA, J. J. (2004): PCR-based assay for differentiation of Pseudomonas aeruginosa from other Pseudomonas species recovered from cystic fibrosis patients, Journal of Clinical Microbiology, 42: 2074–2079
SoilCAM, official site (2007): http://www.bioforsk.no/ikbViewer/page/forside TRANSPORT CANADA: Guidelines for Aircraft Ground Icing Operations (2nd Edition) TP14052E (04/2005)


Science for Sustainability University of West Hungary International Scientific Conference for PhD Students March 19-20, 2013 – Győr
181
“Precision Crop Production Methods” Doctoral School of Applied Plant Sciences
Section 3.1 The Plant Biotechnology and The Sustainable Agriculture
Plant Biotechnology and Sustainable Agriculture
VAN STADEN, Johannes –KULKARNI, Manoj G.
Research Centre for Plant Growth and Development, School of Life Sciences University of KwaZulu-Natal Pietermaritzburg Private Bag X01, Scottsville 3209, South Africa
Tel: 27 33 2605130/1; fax: 27 33 2605897. E-mail: [email protected] Abstratct – Feeding the escalating global population has become a serious challenge. In addition, abnormal climatic conditions, desertification, and rising levels of environmental pollution are adversely affecting agricultural production. Crops are often exposed to abiotic stresses (drought, salinity, temperature, and nutrient deficiency) and are prone to diseases and pests. To overcome these stresses and to increase crop productivity, excessive use of chemical fertilizers and application of toxic pesticides are practiced. Therefore, considerable attention has to be paid to sustain the agricultural system effectively using innovative technologies.
According to the Food and Agricultural Organization of the United Nations, biotechnology in both the food and agriculture sector is an ‘appropriate technology’ to meet future demands. Improvements in conventional plant breeding techniques with supporting knowledge of different fields of science have revolutionized the agriculture system of the world today. The ‘Green Revolution’ is the evidence, which remarkably increased the productivity of crops in many parts of the developing world. There are several other age-old agricultural practices which can be valuable but they are not yet fully explored. For example, the use of fire and smoke was a common practice in traditional agricultural systems. This practice has recently been extensively studied on crop plants and is termed as ‘smoke-technology’. Smoke contains a number of active biomolecules which enhance the growth and productivity of crops under normal and abnormal abiotic conditions. In addition, it shows antimicrobial properties which can reduce infestation of bacterial and fungal diseases occurring on/in plants.
Earthworms are known as ‘friends of farmers’ because they play a major role in converting organic matter/waste into rich humus, which improves soil fertility. The use of earthworms to produce plant growth promoting substances is known as ‘vermi-technology’. Vermicomposting is a simple biotechnological process of composting; the leachate generated from it has a rich pool of nutrients and plant growth regulators. Vermicompost leachate alleviates nutrient deficiency and promotes crop growth.

Science for Sustainability University of West Hungary International Scientific Conference for PhD Students March 19-20, 2013 – Győr
182
Micro- and macro-algae have long been used to improve plant growth and crop productivity. They show vast potential in agriculture and much research on seaweed extracts has been initiated.
In considering the challenges of sustainable agriculture, the potential and feasibility of these technologies in crop improvement programs will be discussed.
Practice-oriented Algal Culture Collection of Mosonmagyaróvár (MACC)
ÖRDÖG Vince1,3 – BÁLINT Péter1 – VÖRÖS Lajos2 1Faculty of Agricultural and Food Sciences, University of West-Hungary,
Vár 2, 9200 Mosonmagyaróvár, Hungary 2Balaton Limnological Research Institute of the Hungarian Academy of Sciences,
Klebersberg st. 3., 8237 Tihany, Hungary 3Research Centre for Plant Growth and Development, University of KwaZulu-Natal,
Pietermaritzburg, P/Bag X01, Scottsville 3209, South Africa E-mail: [email protected]
Abstract – The MACC was established in 1997, and it is now the fifth largest collection in Europe. “Visible” algae growing on soil surface in Brazil, and partly in Hungary were collected and isolated. It was supposed, that soil algae, growing well under extreme conditions could produce valuable secondary metabolites. The main purpose of the Curator is to find useful strains for agriculture. Two potential uses of (soil) microalgae in agriculture area: biofertilizers and as soil conditioners. Currently there is increasing interest for their antimicrobial compounds and plant growth regulators (PGRs). In temperate regions certain palmelloid-forming green algae are the most successful soil conditioners, e.g. species of Chlamydomonas and Asterococcus. MACC contains about 60 Chlamydomonas strains. Some of them demonstrate significant polysaccharide production. The agronomic potential of N2-fixing cyanobacteria was recognized as early as 1939. There are about 200 diazotrophs in the MACC. The main practical purpose of the Curator of the MACC and an international research group is to find PGR-producing algae, and use them in the plant production. Treatment of potato and sugar beet with PGR-producing algal strains increased the number and size of tubers as well as beetroot biomass and sugar yield. EU-restrictions concerning synthetic pesticide use make the research for antibacterial and antifungal compounds of microalgae especially promising. About 100 microalgae strains in the MACC demonstrate fungistatic or fungicide activity at least against one plant pathogen. The repellent activity of microalgae against insects is a pioneer research field of the Institute of Plant Biology in Mosonmagyaróvár.

Science for Sustainability University of West Hungary International Scientific Conference for PhD Students March 19-20, 2013 – Győr
183
Effect of Microalgal Biomass from MACC-612 Nostoc enthophytum and MACC-430 Tetracystis sp. on Sunflower
Production
PŐTHE Péter1* – GERGELY István1 – ÖRDÖG Vince1,2
1University of West Hungary, Faculty of Agricultural and Food Sciences, Institute of Plant Biology.
9200 Mosonmagyaróvár, Kolbai K. Str 8.,Hungary *E-mail: [email protected]
2Research Centre for Plant Growth and Development , University of KwaZulu-Natal, Pietermaritzburg, P/Bag X01, Scottsville 3209, South Africa
Abstract – Sustainable development and environmental management play a significant role in conventional agricultural production. Global warming and extreme climatic conditions such as dryness, higher average temperatures result in an increasing challenge for plant growers. It has been established that the effects of environmental stress can be decreased in plants treated with microalgae. The aim of the present research was to determinate the optimum spraying time and microalgal concentration for sunflowers.
Trials were set up in 2012 in Mosonmagyaróvár. Sunflower (Helianthus annus L.) cv. ”Nk Ferti” was treated with the biomass of Nostoc enthophythum (MACC-612) and Tetracystis sp. (MACC-430). The microalgae originated from the Mosonmagyaróvár Algal Culture Collection (MACC). The first treatment was applied at the 4-6 leaf stage and the second treatment at the rosette growth stage of sunflower growth. Plots were treated with microalgae biomass MACC-612 and MACC-430 in a dosage of 400 and 700 g/ha (in a concentration of 0.1%). Spray amounts were 400 and 700 l/ha.
In situ plant measurements were carried out before and after microalgal treatments. The following parameters were recorded: plant height, plate diameter, plate weight, thousand achene weight, skin/kernel ratio, oil content, yield (kg/ha) and oil yield (kg/ha). The effect of the microalgae treatments were determined by analysis of variance (ANOVA) and correlation analysis. Laboratory tests were carried out at the Institute of Plant Biology, Faculty of Agriculture and Food Sciences, University of West Hungary, Mosonmagyaróvár. Statistical results are presented in figures.
Plants treated with 0.1% microalgal biomass of the strains MACC-612 Nostoc enthophytum and MACC-430 Tetracystis sp. had 7,5% and 7,2% yield increase, respectively. The treated and untreated (control) plants did not differ significantly regarding plant height, root biomass and plate diameter. However, plate and achene weight differed significantly on plots treated by different microalgae compared to the control. Larger plate diameters resulted in bigger achene weight, which indicated a positive correlation between the two parameters.
The results indicated that plant treatment with 0.1% Nostoc enthophytum biomass positively affected the growth, development and consequently the yield of sunflower.
Keywords: organic farming / sunflower / microalgae
1. INTRODUCTION
The production of oil plants has increased by 6-8% in recent years with sunflowers exceeding 24 million ha (FAOSTAT 2012).
Nowadays, sunflower has become one of the most widely planted crops in Hungary with 617.000 ha planted in 2012. Nutrient supply in sunflower cultivation has changed in recent decades in Hungary. Extreme climatic conditions (dryness, higher average temperatures) result in decreasing planth growth and yield. It has been established that effects of environmental stress can be decreased in plants treated with microalgae (ÖRDÖG – PULZ 1995). Howewer, yield increase

Science for Sustainability University of West Hungary International Scientific Conference for PhD Students March 19-20, 2013 – Győr
184
caused by algae treatment can not be explained with the nutritive effect of the algae (RODGERS et al. 1979).
Algae cells produce and secrete intra- and extracellular compounds to the environment during their life cycle. Primary metabolites are essential for algal growth and reproduction. Secondary metabolites are necessary for maintaining the relationship between algae cells and the environment. Some secondary metabolites have allelopathic effects (BOUSSIBA 1988). Other metabolites are plant growth regulators (PGRs) (ERDEI 2008). Jacobs et al. (1985) proved the IAA (indol 3 acetic acid) content of green algae with analytical methods for the first time. SERGEEVA et al. (2002) confirmed that naturally occuring symbiont cyanobacteria are also IAA producing organisms. IAA can be considered as the most physiological active form of auxin (ERDEI 2008). Its principal effect is the stimulation of cell elongation. ÖRDÖG et al. (2004) detected cytokinins in microalgae. Cytokinins regulate plant cell division and stimulate cell elongation in conjuction with auxins. Nowadays there is no doubt that microalgae produce plant hormones which can act in the higher plants.
Algal cells sprayed on the plant surface can enter the leaves through stoma and hidatoda, and transfer nutrients (and plant hormones) to plant cells via cytoplasmic fibers by indirect diffusion. The effect of algae suspension on leaves depends on the following criteria:
1. contcentration gradient between the plant and algae cells, 2. cytoplasmic fibers for functional connection berween the plant and algae cells, 3. adequate intercellular space int the intercellular layer (SZABÓ 2006). The yield surplus originated from the treatment of microalgae biomass is hindered by abiotic
environmental factors and applied agricultural techniques (e.g. usage of herbicides and pesticides). Reliable positive effect can only be anticipated from plant treatments under well elaborated plant production technology (SINGH et al. 1988). Microalgae with plant protecting and growth regulating effects can be succesfully used in plant treatments (ÖRDÖG – PULZ 1995).
In recent study we investigated the effect of two microalgae on growth and development of sunflower in different phenological stages. The aim was to determine the optimum spraying time and microalgal concentration for increasing sunflowers yield.
2. MATERIALS AND METHODS
The microalgae used in the experiments were produced in the Institute of Plant Biology, Faculty of Agriculture and Food Sciences, University of West Hungary, Mosonmagyaróvár. The microalgae originated from the Mosonmagyaróvár Algal Culture Collection (MACC). Based on their auxin and cytokinin production, two microalgae strains were selected for the plant treatments: Nostoc enthophytum (MACC-612) and MACC-430 Tetracystis sp. (STIRK et al. 2002). Sunflower (Helianthus annus L.) cv. ”Nk Ferti” was treated with the suspensions of these two microalgae strains. “Nk Ferti” can be characterized by its pre-ripening character. It is middle-high and has high assimilation capabilities. The species belong to the group of high oleic hybrids. The experiments were carried out in spring of 2012 at the Research Farm of the University of West Hungary in Mosonmagyaróvár.
The soil type of the experimental area is multi-layered humic, river-terrace soils. The upper 30 cm layer of this soil type has the following characteristics: humus content=3,09%, a Ka=45, pHH2o=8.09%, pHKCL=7,40.
The sowing date was on 4th April 2012. The plot size was 27 m2 (4,5×6m) with plant 6 rows. The net plot size included the middle 4 plant rows which were used for harvesting samples. The row distance was 75 cm, the stock distance 24 cm, and the number of stocks were 55.000 achene/ha. There were alltogether 42 experimental plots.

Science for Sustainability University of West Hungary International Scientific Conference for PhD Students March 19-20, 2013 – Győr
185
Weed control was performed mechanically during growing season. There were 7 treatments (including control) in 4 replications and arranged in a randomized block design.
Table 1 summarizes the most important basic data of treatments performed in the trial.
Table 1. Experimental design for treating sunflowers with microalgae biomass
Treatments Dose g/ha
Volume of the spray (l/ha)
Phenophase BBCH-scale Date of treatment
I. Control - - - - II. MACC-612 400 400 4-6 leafy BBCH-12 2012.05.19 III. MACC-430 400 400 4-6 leafy BBCH-12 2012.05.19 IV. MACC-612 700 700 rosette growth BBCH-18/32 2012.06.23 V. MACC-430 700 700 rosette growth BBCH-18/32 2012.06.23
400 400 4-6 leafy BBCH-12 2012.05.19 VI. MACC-612 700 700 rosette growth BBCH 18/32 2012.06.23 400 400 4-6 leafy BBCH-12 2012.05.19
VII. MACC-430 700 700 rosette growth BBCH18/32 2012.06.23
Plots were treated with microalgae biomass MACC-612 and MACC-430 in a dosage of 400
and 700 g/ha (in a concentration of 0.1%). Spray volume were 400 and 700 l/ha. Plant height was measured just before the first and second treatment and after treatments every 10 days. Measurements were carried out until the yellow ripening stage. Sampling was performed by hand always from the same rows of plots. At the end of the experiment plants were harvested and the following parameters were measured: plate diameter, plate weight, thousand achene weight, skin/kernel ratio, oil content, yield (kg/ha), oil yield (kg/ha). The obtained results were statistically evaluated by analysis of variance (ANOVA) and correlation analysis (SPSS 19.0). Minimum and maximum values and standard deviation were also calculated.
3. RESULTS AND DISCUSSION
In the experimental year 2012 the plants grew under extremely dry conditions during the growing season. Therefore crop safety and input efficiency become very important under such conditions. The dry season reflected in the plant vegetative growth. When compared to the control there was increased plant height among plants treated by microalgae even if this difference was statistically non-significant. This increased plant height resulted in increased assimilation surface. The increased root mass of the treated plants was essential to continuous nutrient supply (Figure 1.). This can improve plant condition under arid environment, however further trials are needed for more accurate results. Crop results indicate the difference between various plots treated by microalgae. Gross plate weight and achene weight differed significantly between control and treated plots (Figure 1).
Larger plate diameters resulted in bigger achene weight, which indicated a positive correlation between the two parameters (Table 2).
Crop yields were significantly increased in our experiment. Treatment VI. indicated the most significant difference in yield. Plants treated with 0.1% microalgal biomass of the strains MACC-612 Nostoc enthophytum and MACC-430 Tetracystis sp. had 7,5% and 7,2% yield increase, respectively (Figure 2).

Science for Sustainability University of West Hungary International Scientific Conference for PhD Students March 19-20, 2013 – Győr
186
20,4
24,3
21,9
22,3
21,9
25,3
22,7
86
93
92
107,6
105,4
116,4
112,4
62
67
65
68,5
69
72,3
74,6
0 20 40 60 80 100 120 140
Control
MACC-612 (BBCH-12)
MACC-430 (BBCH-12)
MACC-612 (BBCH-18/32)
MACC-430 (BBCH-18/32)
MACC-612 (BBCH-12)+(BBCH-18/32)
MACC-430 (BBCH-12)+(BBCH-18/32)
Achene weight (g)
Gross plate weight (g)
Root mass (g)
Figure 1. Mean differences between various treatments (P ≤ 0,05) in sunflower treat with microalgae
Table 2. Correlation between Gross plate weight and Achene weight in sunflowers treated with microalgae biomass Gross plate weight * Achene weight Pearson Correlation -.176* Significance level .015 Sample size: 560 * Correlation is significant at the 0.05 level (2-tailed).
4. CONCLUSION
The results indicated that plant treatment with 0.1% Nostoc enthophytum biomass positively affected the growth, development and consequently the yield of sunflower. Based on our current results and previous results performed on different plant species, it can be stated that plant treatment with microalgae strains may be a good tool for increasing plant yield under stress conditions.
Acknowledgements: We wish to thank „TALENTUM PROJECT” TÁMOP-4.2.2/B-10/1-2010-0024 and TÁMOP-4.2.1./B-09/1/KONV-2010-0007 projects. The projects are also co-financed by the European Union and the European Social Fund.

Science for Sustainability University of West Hungary International Scientific Conference for PhD Students March 19-20, 2013 – Győr
187
Figure 2. Sunflower yield depending on plant treatments. (See treatments in Table 1.)
*treatments are significantly different from control (P ≤ 0,05) References BOUSSIBA, S. (1988.): Anabaena azollae as a nitrogen biofertilizer. In: STADLER, T. – MOLLION, J. – VERDUS,, M.C.
– KARAMANOS, Y. – MORYAN, H. – CHRISTIAEN, D. (eds.), Algal Biotechnology, Elsvier Applied Sciences, England, pp. 169-178.
ERDEI L. (2008): A növekedés és fejlődés intercelluláris szabályozása. Növényi hormonok. Növényélettan, Növekedés és fejlődésélettan. Jatepress, Szeged, pp.100-104.
JÄGER K. (2005): Növényi növekedésszabályozó anyagokat (PGR) termelő algatörzsek, mint alternatív hormonforrások felhasználása magasabbrendű növények szövettenyészeteiben PhD tézis. NymE-MÉK, Mosonmagyaróvár.
JACOBS, W. P., Falkenstein, K., Hamilton, R. H. (1985): Nature and amount of auxin in algae: IAA from extracts of Caulerpa paspaloides (Siphonales). Plant Physol.78:844-848.
ÖRDÖG V. – PULZ, O. (1995.): Potential use of microalgae in the crop production. 2nd European Workshop on Biotechnology of Microalgae, September 11-12. Bergholz-Rehbrücke, pp.123-126.
ÖRDÖG, V. – STIRK, W. A. – VAN STADEN, J. – NOVÁK, O. – STRNAD, M. (2004): Endogenus cytokinin in three genera of microalgae from the Chlorophyta. J. Phycol. 40(1):88-95.
RODGERS, G. A. – BERGMAN, B. – HENRIKSSON, E. – URDIS, M. (1979.): Utilization of blue-green algae as biofertilizers. Plant Soil 52: 99-107.
SINGH, A. L. – SINGH, P. K. – SING, P. L. (1988.): Effects of different herbicides on the Azolla and blue-green algal biofertilization of rice. J.Agric.Sci.Camb. 111:451-458.
STIRK, W. A. – ÖRDÖG V. – VAN STADEN, J. – JÁGER, K. (2002): Cytokinin and auxin-like activity in Cyanophyta and microalgae. J.Appl.Phyc.14:215-221.
SERGEEVA, E. – LIAIMER, A. – BERGMAN, B. (2002): Evidence for production of the phytohormone indole-3-acetic acid by cyanobacteria. Planta 215:229-238.
SZABÓ B. (2006): Mikroorganizmus alapú biotrágyák hatása az uborka és a cukorrépa kezdeti fejlődésére. Debreceni Egyetem, Agrártudományi Centrum, Növénytani és Növényélettani tanszék, Debrecen.
2551*2621* 2603
*
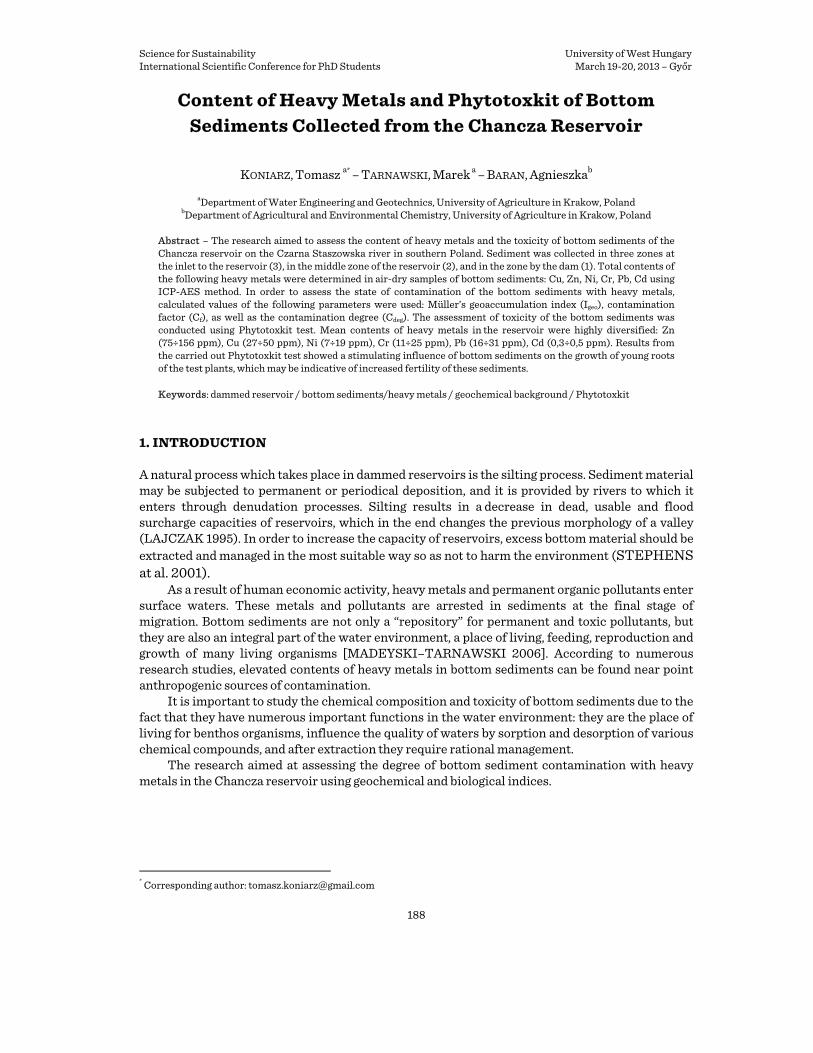
Science for Sustainability University of West Hungary International Scientific Conference for PhD Students March 19-20, 2013 – Győr
188
Content of Heavy Metals and Phytotoxkit of Bottom Sediments Collected from the Chancza Reservoir
KONIARZ, Tomasz a* – TARNAWSKI, Marek a – BARAN, Agnieszkab aDepartment of Water Engineering and Geotechnics, University of Agriculture in Krakow, Poland
bDepartment of Agricultural and Environmental Chemistry, University of Agriculture in Krakow, Poland Abstract – The research aimed to assess the content of heavy metals and the toxicity of bottom sediments of the Chancza reservoir on the Czarna Staszowska river in southern Poland. Sediment was collected in three zones at the inlet to the reservoir (3), in the middle zone of the reservoir (2), and in the zone by the dam (1). Total contents of the following heavy metals were determined in air-dry samples of bottom sediments: Cu, Zn, Ni, Cr, Pb, Cd using ICP-AES method. In order to assess the state of contamination of the bottom sediments with heavy metals, calculated values of the following parameters were used: Müller’s geoaccumulation index (Igeo), contamination factor (Cf), as well as the contamination degree (Cdeg). The assessment of toxicity of the bottom sediments was conducted using Phytotoxkit test. Mean contents of heavy metals in the reservoir were highly diversified: Zn (75÷156 ppm), Cu (27÷50 ppm), Ni (7÷19 ppm), Cr (11÷25 ppm), Pb (16÷31 ppm), Cd (0,3÷0,5 ppm). Results from the carried out Phytotoxkit test showed a stimulating influence of bottom sediments on the growth of young roots of the test plants, which may be indicative of increased fertility of these sediments.
Keywords: dammed reservoir / bottom sediments/heavy metals / geochemical background / Phytotoxkit
1. INTRODUCTION
A natural process which takes place in dammed reservoirs is the silting process. Sediment material may be subjected to permanent or periodical deposition, and it is provided by rivers to which it enters through denudation processes. Silting results in a decrease in dead, usable and flood surcharge capacities of reservoirs, which in the end changes the previous morphology of a valley (LAJCZAK 1995). In order to increase the capacity of reservoirs, excess bottom material should be extracted and managed in the most suitable way so as not to harm the environment (STEPHENS at al. 2001).
As a result of human economic activity, heavy metals and permanent organic pollutants enter surface waters. These metals and pollutants are arrested in sediments at the final stage of migration. Bottom sediments are not only a “repository” for permanent and toxic pollutants, but they are also an integral part of the water environment, a place of living, feeding, reproduction and growth of many living organisms [MADEYSKI–TARNAWSKI 2006]. According to numerous research studies, elevated contents of heavy metals in bottom sediments can be found near point anthropogenic sources of contamination.
It is important to study the chemical composition and toxicity of bottom sediments due to the fact that they have numerous important functions in the water environment: they are the place of living for benthos organisms, influence the quality of waters by sorption and desorption of various chemical compounds, and after extraction they require rational management.
The research aimed at assessing the degree of bottom sediment contamination with heavy metals in the Chancza reservoir using geochemical and biological indices.
* Corresponding author: [email protected]

Science for Sustainability University of West Hungary International Scientific Conference for PhD Students March 19-20, 2013 – Győr
189
2. STUDY AREA AND METHODS
2.1. Characteristic of the reservoir
The Chancza retention reservoir was created by building a frontal dam, partitioning the Czarna Staszowska river at 36.0 km of its course. This structure is located at a height of 216.8 meters above sea level in Korytnica, in the southern part of Poland (Fig. 1). This reservoir is characterized by small depths, significantly elongated coastline, which is typical for most lowland lakes, and by agricultural character of the river basin. The area near the reservoir outlet is intensively used for agriculture, whereas the remaining part of the adjacent area (mainly in the part by the dam) is used as recreational area. The reservoir is used for: flood protection, water intake for fish ponds and recreation (angling, water sports, swimming and sailing).
GPS coordinates N: 50o37’47.81’’ E: 21o03’26.86’’
size of catchment area 475.0 km2
water volume 20.2 million m3
area reservoir 4.7 km2 max. depth 17.0 m min. depth 0.8 m
Figure 1. Chancza Reservoir with sampling sites and the main characteristics
2.2. Methodology of collecting bottom sediment samples
Bottom sediment samples were collected in three sections (Figure 1), which were considered to be representative for particular reservoir zones: inlet – section 8, middle – section 5, by the dam – section 1. In order to average the material, the samples were collected from a few places in the radius of 5-8 meters from a determined location. The sediment was collected from each area in three points. At a depth of 2.5 m, the sediment was collected using a pole-mounted Ekman grab sampler, and at greater depths an Ekman grab sampler attached to a line was used.
2.3. Chemical analyses
The collected material was transported to a laboratory, dried and sifted through a sieve with a 2 mm mesh. Total contents of the following heavy metals were determined in air-dry samples of the bottom sediments: Cu, Zn, Ni, Cr, Pb, Cd. The content of elements in the sediments was determined after hot mineralization in a mixture of HNO3 and HClO3 (3:2) acids. Concentrations of metals in the obtained solutions were determined with an ICP-OES spectrometer (Pekin Elmer Optima 7300 DV).
2.4. Geochemical indices
In order to assess the state of contamination of the bottom sediments with heavy metals, the following were calculated: Müller’s geoaccumulation index (Igeo), contamination factor (Cf), as well as the contamination degree (Cdeg). The contamination degree was calculated as sum of
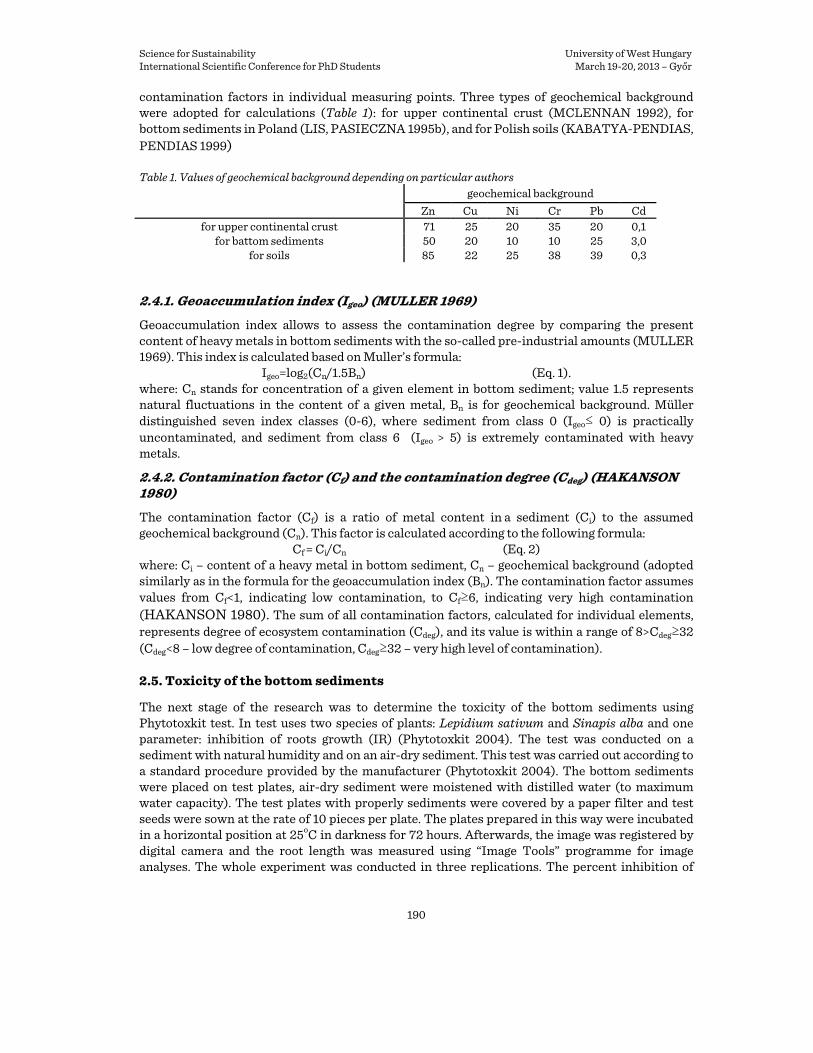
Science for Sustainability University of West Hungary International Scientific Conference for PhD Students March 19-20, 2013 – Győr
190
contamination factors in individual measuring points. Three types of geochemical background were adopted for calculations (Table 1): for upper continental crust (MCLENNAN 1992), for bottom sediments in Poland (LIS, PASIECZNA 1995b), and for Polish soils (KABATYA-PENDIAS, PENDIAS 1999)
Table 1. Values of geochemical background depending on particular authors geochemical background
Zn Cu Ni Cr Pb Cd
for upper continental crust 71 25 20 35 20 0,1 for battom sediments 50 20 10 10 25 3,0
for soils 85 22 25 38 39 0,3
2.4.1. Geoaccumulation index (Igeo) (MULLER 1969)
Geoaccumulation index allows to assess the contamination degree by comparing the present content of heavy metals in bottom sediments with the so-called pre-industrial amounts (MULLER 1969). This index is calculated based on Muller’s formula:
Igeo=log2(Cn/1.5Bn) (Eq. 1). where: Cn stands for concentration of a given element in bottom sediment; value 1.5 represents natural fluctuations in the content of a given metal, Bn is for geochemical background. Müller distinguished seven index classes (0-6), where sediment from class 0 (Igeo≤ 0) is practically uncontaminated, and sediment from class 6 (Igeo > 5) is extremely contaminated with heavy metals.
2.4.2. Contamination factor (Cf) and the contamination degree (Cdeg) (HAKANSON 1980)
The contamination factor (Cf) is a ratio of metal content in a sediment (Ci) to the assumed geochemical background (Cn). This factor is calculated according to the following formula:
Cf = Ci/Cn (Eq. 2) where: Ci – content of a heavy metal in bottom sediment, Cn – geochemical background (adopted similarly as in the formula for the geoaccumulation index (Bn). The contamination factor assumes values from Cf<1, indicating low contamination, to Cf≥6, indicating very high contamination (HAKANSON 1980). The sum of all contamination factors, calculated for individual elements, represents degree of ecosystem contamination (Cdeg), and its value is within a range of 8>Cdeg≥32 (Cdeg<8 – low degree of contamination, Cdeg≥32 – very high level of contamination).
2.5. Toxicity of the bottom sediments
The next stage of the research was to determine the toxicity of the bottom sediments using Phytotoxkit test. In test uses two species of plants: Lepidium sativum and Sinapis alba and one parameter: inhibition of roots growth (IR) (Phytotoxkit 2004). The test was conducted on a sediment with natural humidity and on an air-dry sediment. This test was carried out according to a standard procedure provided by the manufacturer (Phytotoxkit 2004). The bottom sediments were placed on test plates, air-dry sediment were moistened with distilled water (to maximum water capacity). The test plates with properly sediments were covered by a paper filter and test seeds were sown at the rate of 10 pieces per plate. The plates prepared in this way were incubated in a horizontal position at 25oC in darkness for 72 hours. Afterwards, the image was registered by digital camera and the root length was measured using “Image Tools” programme for image analyses. The whole experiment was conducted in three replications. The percent inhibition of
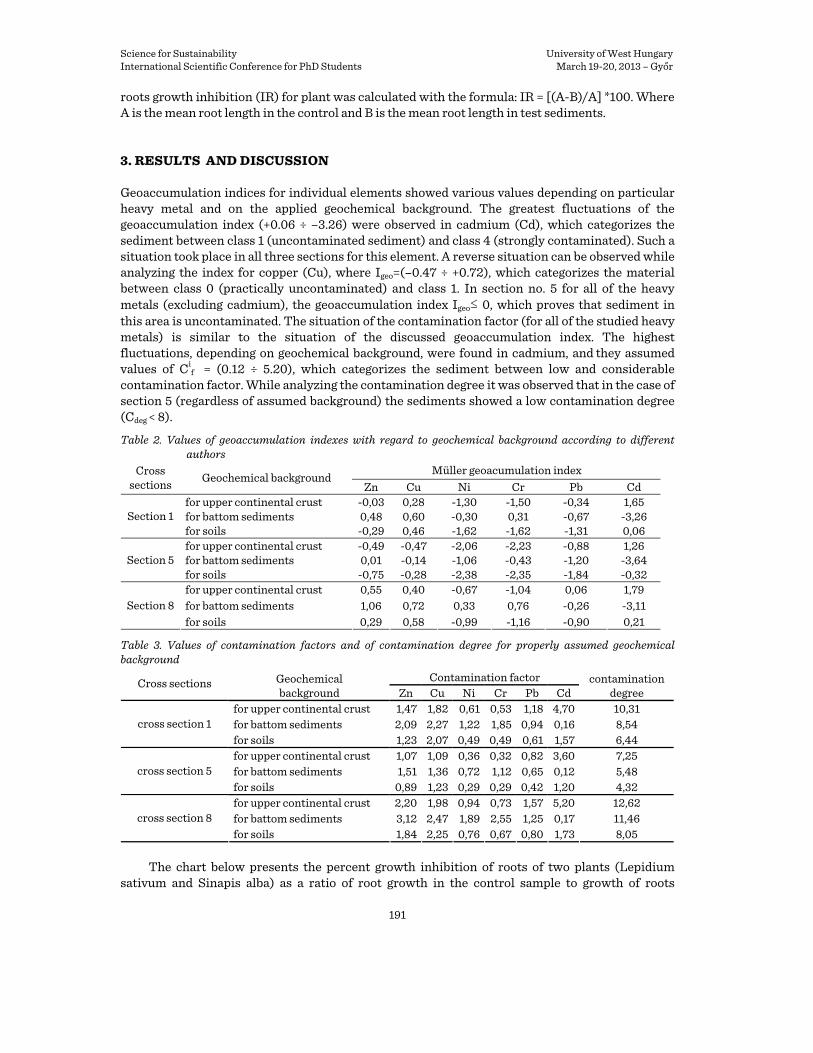
Science for Sustainability University of West Hungary International Scientific Conference for PhD Students March 19-20, 2013 – Győr
191
roots growth inhibition (IR) for plant was calculated with the formula: IR = [(A-B)/A] *100. Where A is the mean root length in the control and B is the mean root length in test sediments.
3. RESULTS AND DISCUSSION
Geoaccumulation indices for individual elements showed various values depending on particular heavy metal and on the applied geochemical background. The greatest fluctuations of the geoaccumulation index (+0.06 ÷ –3.26) were observed in cadmium (Cd), which categorizes the sediment between class 1 (uncontaminated sediment) and class 4 (strongly contaminated). Such a situation took place in all three sections for this element. A reverse situation can be observed while analyzing the index for copper (Cu), where Igeo=(–0.47 ÷ +0.72), which categorizes the material between class 0 (practically uncontaminated) and class 1. In section no. 5 for all of the heavy metals (excluding cadmium), the geoaccumulation index Igeo≤ 0, which proves that sediment in this area is uncontaminated. The situation of the contamination factor (for all of the studied heavy metals) is similar to the situation of the discussed geoaccumulation index. The highest fluctuations, depending on geochemical background, were found in cadmium, and they assumed values of Ci
f = (0.12 ÷ 5.20), which categorizes the sediment between low and considerable contamination factor. While analyzing the contamination degree it was observed that in the case of section 5 (regardless of assumed background) the sediments showed a low contamination degree (Cdeg < 8).
Table 2. Values of geoaccumulation indexes with regard to geochemical background according to different authors
Müller geoacumulation index Cross sections Geochemical background
Zn Cu Ni Cr Pb Cd for upper continental crust -0,03 0,28 -1,30 -1,50 -0,34 1,65 for battom sediments 0,48 0,60 -0,30 0,31 -0,67 -3,26 Section 1 for soils -0,29 0,46 -1,62 -1,62 -1,31 0,06 for upper continental crust -0,49 -0,47 -2,06 -2,23 -0,88 1,26 for battom sediments 0,01 -0,14 -1,06 -0,43 -1,20 -3,64 Section 5 for soils -0,75 -0,28 -2,38 -2,35 -1,84 -0,32 for upper continental crust 0,55 0,40 -0,67 -1,04 0,06 1,79 for battom sediments 1,06 0,72 0,33 0,76 -0,26 -3,11 Section 8 for soils 0,29 0,58 -0,99 -1,16 -0,90 0,21
Table 3. Values of contamination factors and of contamination degree for properly assumed geochemical background
Contamination factor Cross sections Geochemical background Zn Cu Ni Cr Pb Cd
contamination degree
for upper continental crust 1,47 1,82 0,61 0,53 1,18 4,70 10,31 for battom sediments 2,09 2,27 1,22 1,85 0,94 0,16 8,54 cross section 1 for soils 1,23 2,07 0,49 0,49 0,61 1,57 6,44 for upper continental crust 1,07 1,09 0,36 0,32 0,82 3,60 7,25 for battom sediments 1,51 1,36 0,72 1,12 0,65 0,12 5,48 cross section 5 for soils 0,89 1,23 0,29 0,29 0,42 1,20 4,32 for upper continental crust 2,20 1,98 0,94 0,73 1,57 5,20 12,62 for battom sediments 3,12 2,47 1,89 2,55 1,25 0,17 11,46 cross section 8 for soils 1,84 2,25 0,76 0,67 0,80 1,73 8,05
The chart below presents the percent growth inhibition of roots of two plants (Lepidium
sativum and Sinapis alba) as a ratio of root growth in the control sample to growth of roots

Science for Sustainability University of West Hungary International Scientific Conference for PhD Students March 19-20, 2013 – Győr
192
developing on sediment. Where: (d) is a sediment saturated with distilled water according to procedure, and (w) is a sediment which contains interstitial water.
The test sediments were not toxic to the test plants. In the studies was observed a stimulating effect of root growth on the bottom sediments (negative values). Longer roots was registered in air-dry sediments dry precipitate then in naturally wet sediments (section 3 and 5). A reverse situation is section 8, where a higher root growth was observed in plants subjected to incubation in the naturally wet sediment. Among the tested plant species, Sinapis alba have longer roots then Lepidium sativum.
-140
-120
-100
-80
-60
-40
-20
0
3 5 8section
IR [
%]
Lepidium sativum (d) Lepidium sativum (w)
-180
-160
-140
-120
-100
-80
-60
-40
-20
0
3 5 8section
IR [
%]
Sianpis alba (d) Sinapis alba (w) Figure 2. Percent growth inhibition of roots of test plants
4. SUMMARY
After analyzing all the calculations, it can be stated that interpretation of results depends mostly on assumed geochemical background. The calculated indices which take the background of earth crust into account deviate the most from the indices which take the background for soil and bottom sediments into account. The proof for this is the highest contamination degree (for McLenn’s geochemical background) in all three sections.
During analysis of the degree of contamination with heavy metals, it was observed that, regardless of assumed geochemical background (for section 5), the sediments showed a low contamination degree (Cdeg < 8). The cause of such results is probably the location of section no. 5, which is situated in the narrowest part of the reservoir where the highet flow speeds occur, which in turn leads to washing out and transport of heavy metals and other elements along the main

Science for Sustainability University of West Hungary International Scientific Conference for PhD Students March 19-20, 2013 – Győr
193
stream. The calculated indices (Igeo, Cif and Cdeg) were varied depending on which metal
was being analyzed, sediment collection zone, as well as on assumed geochemical background.
The conducted Phytotoxkit test showed a stimulating influence of bottom sediments on the growth of young roots of the test plants, which may prove their increased fertility. A higher growth inhibition of roots was observed in the naturally wet sediment (samples 3, 5), which may be a proof for presence of toxic compound in water. A lesser inhibition occurs in the samples collected in the inlet part of the reservoir (sample 8). The cause for this may be agricultural management of the coastal area and lush vegetation in this part of the reservoir which causes arrest of contaminants and their deposition at the bottom. References HAKANSON, L. (1980): An ecological risk index for aquatic pollution control. A sedimentological approach.
Water Research, 14: 975-1001. KABATA-PENDIAS, A. – PENDIAS, H. (1999): Biogeochemia pierwiastków sladowych. PWN, Warszawa. LAJCZAK, A. (1995). Studium nad zamulaniem wybranych zbiornikow zaporowych w dorzeczu Wisly. Mon.
Komitetu Gospodarki Wodnej PAN, 8, 108 p. LIS, J. – PASIECZNA, A. (1995b): Atlas geochemiczny Polski. Skala 1:250 000. PIG, Warszawa. MADEYSKI, M. – TARNAWSKI, M. (2006): Infrastruktura i Ekologia Terenow Wiejskich. Ocena stanu
ekologicznego osadow dennych wybranych małych zbiornikow wodnych., PAN, Krakow, 4/3/2006: 107-116.
MCLENNAN, S. M. (1992). Continental Crust. In Encyclopedia of Earth Sciences, Vol. (1) (W.A. Nierenberg, Ed.), Kluwer, Dortrecht, The Netherlands, 581-592.
MULLER G. (1969): Index of geoaccumulation in sediments of the Rine River. Geojournal, 2: 108-118. STEPHENS S. R. – ALLOWAY B. J. – PARKER A. – CARTER J. E. – HUDSON M.E. (2001) Changes in the
leachability of metals from dredged canal sediments during drying and oxidation. Environ Pollut. 114, 407-413.
Topology in a Fruit Plantation
RICZU Pétera* – MESTERHÁZI Péter Ákosb – NAGY Gáborc – TAMÁS Jánosa
aInstitute of Water and Environmental Management, University of Debrecen, Debrecen, Hungary
bFaculty of Food and Agricultural Sciences, University of West Hungary, Mosonmagyaróvár, Hungary
cFaculty of Geoinformatics, Department of Geoinformation Science, University of West Hungary, Hungary
Abstract – Localization of fruit trees, topology of their branch structures and spatial structure of their canopies are crucial in the planning of site-specific agro-ecological and production technology projects in an orchard. Instruments and technologies currently used in precision agriculture and horticulture provide opportunities for obtaining information about the characteristics of fruit trees given above. The study area was an intensive apple orchard on the Study and Regional Research Farm of the University of Debrecen, near Pallag. Examinations were carried out with two active remote sensors. Spectral properties of the investigated trees’ canopies were sampled using a GreenSeeker 505 Hand Held™ Optical Sensor Unit, and the collected spectral dataset was supplemented with the results gained by a Leica ScanStation C10 3D laser scanner. Based on the spectral characteristics of the
* Corresponding author: [email protected], H-4032 Debrecen, Böszörményi str. 138.
Science for Sustainability University of West Hungary International Scientific Conference for PhD Students March 19-20, 2013 – Győr
194
vegetation, the created vegetation index map indicated differences in the vigor between the trees. While the high resolution scanning made possible to detect the positions of the fruits on the trees as well as their locations and volumes. The integration of the two special data collection systems provides new opportunities in the development of a precision plant production system.
Keywords: precision agriculture / Leica ScanStation C10 laser scanner / GreenSeeker 505
1. INTRODUCTION
Currently in Hungary, less than 100,000 hectares of orchards can be found, from which cultivation of apple is one of the most dominant ones. Apple orchards make up approximately 60% of all pomiculture in Hungary, although, from the 1970s, production dropped significantly (GONDA – APATI 2011). Production of marketable horticulture products can be difficult without employing advanced and high quality horticulture practices, which, in turn, depends on appropriate management and irrigation systems, basically. Today, IT provides the farmers such tools, like global positioning system (GPS), geographic information system (GIS) and remote sensing (RS) (MILLA et al. 2005), which, at the same time, develop rapidly. Using this ternary technology at agricultural speciality is the so-called precision agriculture (TAMÁS 2001). Precision farming involves site-specific crop production, the use of variable rate technologies for integrated plant protection and pest management, as well as geostatistics, and also requires advanced electronic and information technologies in the agricultural machinery (GYŐRFFY 2000). The availability of the GPS was the primary condition for the widespread use of precision techniques. Principally, precision farming has been focused on agricultural crops (GODWIN et al. 2003, LEE et al. 2010), but some researches targeted horticultural plantations, as well. High quality fruit-growing is difficult without proper site-specific technologies, so in some cases, the positions and certain characteristics of fruit trees in intensive orchards need to be acquainted. Localization of fruit trees could be sensed traditionally or by less widespread high-tech instruments such as GPS and RS. AGGELOPOULOU et al. (2010) investigated the spatial variation in yield and quality on a small apple orchard and the potential for applying site-specific management in horticulture with GPS technology.
The geographically correct tree position could be important from other points of view. FÓRIÁN et al. (2010) prepared a digital high resolution database using field geodesic and airborne photogrammetric methods. The dataset contains name of variety, planting year, pruning, irrigation, nutrient replacement, harvested yield, agro-meteorology and hailstone damage prevention treatments for each tree. The tree level survey and database creation provide the logical query from the attribute table (FÓRIÁN et al. 2009).
RS, also called earth observation, refers to the obtaining of information about objects or areas at the Earth’s surface without being in direct physical contact with the object or area (AGGARWAL 2004). It allows researchers to gather further information for large areas in addition to traditional sampling data (BURAI 2007, TAMÁS et al. 2009, NEMÉNYI et al. 2010, GÖKMEN et al. 2012). The basis of remote sensing is incoming electromagnetic radiation to the object. When the radiation incident upon the object’s surface, it is reflected by that surface, transmitted into the surface or absorbed by the surface. Thus, it could be established that the reflection, absorption and transmission are equal to the total incoming radiation on a given wavelength (AGGARWAL 2004). Most remote sensing systems are designed to collect reflected radiation (SHORT 2011).The reflectance values are depend on the physical characteristics and the geometric structure of the object (MOLENAAR 1993). Depending on the incoming light, remote sensing can be either passive or active. Reflected sunlight is the most common source of radiation measured by passive sensors, while active sensors emit a certain radiation.

Science for Sustainability University of West Hungary International Scientific Conference for PhD Students March 19-20, 2013 – Győr
195
Remote sensing is an effective tool for monitoring the biomass production. By using certain reflectance values of adequate spectral bands vegetation indices can be calculated, which correlate well with the biomass. The plants reflect the visible (VIS) band in a small compass, but in the near infrared (NIR) band, the reflectance increases depend on the chlorophyll content of leaves and changes proportionally to produced biomass. Using the reflection of the RED (630-690 nm) and the NIR bands (760-900 nm), a plant’s green mass may be determined (TUCKER, 1979). One of the most frequently used indices for investigating surface coverage and biomass is the Normalized Difference Vegetation Index (NDVI) (ROUSE et al. 1973), based the following equation:
REDNIRREDNIRNDVI
+−=
FLYNN et al. (2008) used a special NDVI-meter (GreenSeeker) to collect information and
assess the spectral properties of pasture biomass. Based on this index, one may learn not only the condition of the examined vegetation.
There are other types of active remote sensing techniques. The laser scanning (LIDAR – LIght Detection And Ranging) is similar to RADAR systems, but in this case a laser light sweeps the object or the earth’s surface, instead of radio waves in radar systems (BELÉNYESI et al. 2008). The laser scanner analyzes a real-world or object environment to collect data on its shape. The advantage of laser scanning is the fact that it can record huge numbers of points with high accuracy in a relatively short period of time (LERMA GARCÍA et al. 2008). 3D laser scanning is useful for the determination of the position of trees and the structure of their canopies. Selected parameters (e.g. canopy expansion, distance between trees, trunk diameter) of investigated trees could be measured in up to mm scale (ROSELL et al. 2009). Determination of a laser point’s distance may be made based on 3 methods, which are triangulation based measurement techniques, time-of-flight (TOF) and phase-based methods (LERMA GARCÍA et al. 2008, VOSSELMAN – HANS-GERD 2010).
In this study, the determination of the spectral and the spatiality characteristics of fruit trees were investigated using two active remote sensing instruments.
2. MATERIAL AND METHODS
Both two surveys were carried out at fully developed canopy condition at the Study and Regional Research Farm of the University of Debrecen, near the town of Pallag. The study area was an intensive apple orchard with a drip irrigation system, protected with a hail net. The ScanStation C10 by Leica Geosystems uses the time-of-flight (TOF) principle for ranging. The scanner sweeps along the examined object with a green (532 nm) laser light, while measures the distances of several thousand points per second, creating a high resolution point cloud. We surveyed one row of study area using 7 scan stations. The scan resolution was 8 mm on 10 m; which means that the accuracy was below 1 cm on the right side of the investigated row. The processing of the raw point cloud was carried out using three softwares. The softwares are appropriate for reducing the noise from the point cloud and ideal for making several engineering calculations. Data processing and the unification of the scan stations were carried out using Leica Cyclone 7.1, which is the own software of the laser scanner. For the more sophisticated calculations, 3DReshaper and Geomagic Studio were used.
To investigate the spectral features of the, another active RS instrument was used. The GreenSeeker 505 vegetation indexmeter is suitable for measuring several vegetation indices, but the most information was provided by the NDVI value. The sensor operates by emitting light (red band and infrared band) onto a crop’s canopy, that the reflected light from the canopy is focused on a detector. The data collecting was carried out 50-100 cm from the foliage. As an interface of

Science for Sustainability University of West Hungary International Scientific Conference for PhD Students March 19-20, 2013 – Győr
196
GreenSeeker 505 was working, an AgGPS FmX integrated display by Trimble, which collected the coordinate data beside the NDVI values. The acquired data was stored in the hardware of the job computer each second. Both the AgGPS FmX and the Greenseeker 505 were mounted on a tractor. Uniform data collection was provided by the continuous speed of a tractor. For processing of data, we used Surfer 10 software. To evaluate the data, an NDVI map was created using an interpolation technique. Interpolation is a mathematical approximate method to determine unknown values based on known values. The interpolation of spatial data was carried out using the Nearest Neighbor method.
3. RESULTS AND DISCUSSION
The created NDVI map in a Surfer 10 software environment was evaluated (Figure 1). Based on the given NDVI map, it could be established where chlorophyll content was smaller or higher. The smaller NDVI values showed which trees have less leaves. Decreasing of the chlorophyll in the leaves could have more reasons, but in the investigated area, the cause of less leaf was disease (Fire Blight – Erwinia amylovora), which damaged the infected trees. An important visible distinctive feature of this disease is its necrotic symptoms. Sometimes, the tree dies from such an infection. The vigor of the foliage could be distinguished based on the differences in color on the NDVI map. The lower NDVI values on Figure 1 indicate the trees which lost their leaves in consequence of disease.
The laser scanning survey has provided opportunities for defining the tree gaps on the plantation, their position, as well as the 3D structural characteristics of the trees in the study area (Figure 2/A). The height of tree and canopy were measured, while the stem of the investigated tree was modeled. The Leica Cyclone fitted the best shape to the point cloud, which was a cylinder. Then, the diameter of it was determined (Figure 2/B).
NDVI
color scale
Figure 1. NDVI vegetation map of the investigated apple orchard

Science for Sustainability University of West Hungary International Scientific Conference for PhD Students March 19-20, 2013 – Győr
197
The point cloud was utilized for further data acquisition. Some trees on the study area had not
been harvested yet, so the instrument scanned the fruits, too. The apples were ‘created’ by the least squares method. The point clouds of the apples were not full, due to the shadowing effect of leaves, but the software fitted a sphere, based on the curvature of the point cloud (Figure 2/C). The radius of the created spheres were defined, thus the volumes of the objects were calculated.
A
C
Height of fruit tree
Height of canopy
Trunkdiameter
B
Figure 2: Spatial subset of the point cloud (A) and some important parameters of a selected apple tree in Leica
Cyclone (B) and detection of the fruits in the 3DReshaper software environment (C)
4. CONCLUSION
Using of precision farming instruments is suitable for investigation of the vegetation from several aspects. The approach of sustainable agriculture is not able to provide with uniform agrotechnical operation because of the heterogenic nature of an orchard. The results of the GreenSeeker 505 vegetation indexmeter were appropriate for use in horticulture applications. Based on Normalized Differential Vegetation Index values for the canopies, a tree’s health and vegetation activity could have been determined. The chlorophyll content of leaves was decreased in cases of infected trees. Approximately zero NDVI values have shown the dried trees by the disease or the lack in the row. Further investigations are needed to determine those minimum NDVI values which would be appropriate for early detection of the irreversible processing for the necrotic symptoms. Based on the obtained NDVI values, a precision pest management program could be devised.
Based on our initial 3D survey, the laser scanning technology provided a technique, which could be used to determine several characteristics of investigated tree in a quick, non-destructive way. The location and volume of fruits are detected in a special 3D software environment. Further investigations are needed to define densities of the apples fruits, thus it could help in yield estimation. Further studies are also necessary to estimate the leaf area using laser scanning technology, since the potential transpiration can be determined. Using these measurements, the water utilization efficiency of trees could be estimated.
Acknowledgements: The laser scanning was provided by the University of West Hungary, Faculty of Geoinformatics. The authors thank Attila Váradi from Leica Geosystems Hungary Ltd. for his assistance in Leica software processing. The authors would like to thank the 3DReshaper and Geomagic Studio software license for the point cloud work. This study is funded by the “TALENTUM PROJECT” TÁMOP 4. 2. 2. B – 10/1 – 2010 – 0018 project.
Science for Sustainability University of West Hungary International Scientific Conference for PhD Students March 19-20, 2013 – Győr
198
References AGGARWAL, S. (2004): Principles of Remote Sensing. In. SIVAKUMAR, M.V.K. – ROY, P.S. – HARSEN, K. – SAHA,
S.K. (eds.): Satellite Remote Sensing and GIS Applications in Agricultural Meteorology. World Meteorological Organisation, Geneva. 23-38.
AGGELOPOULOU, D.K. – WULFSOHN, D. – FOUNTAS, S. – GEMTOS, T.A. – NANOS, G.D. – BLACKMORE, S. (2010): Spatial variation in yield and quality in a small apple orchard. Precision Agriculture. 11 (5): 538-556.
BELÉNYESI, M. – KRISTÓF, D. – SKUTAI, J. (2008): Távérzékelés a környezetgazdálkodásban. [Remote sensing in the environmental management.] Elméleti jegyzet. Szent István Egyetem, Környezetgazdálkodási Intézet, Gödöllő. 78 p. (in Hungarian)
BURAI, P. (2007): Távérzékelési módszerek összehasonlító elemzése mezőgazdasági területeken. [Comperable analysis of remote sensing techniques in agricultural model areas.] PhD thesis. Debrecen. 143 p. (in Hungarian)
FLYNN, E.S. – DOUGHERTY, C.T. – WENDROTH, O. (2008): Assessment of pasture biomass with normalised difference vegetation index from active ground-based sensors. Agronomy Journal. 100 (1): 114–121.
FÓRIÁN T. – NAGY A. – TAMÁS J. (2009): Intenzív fajtakísérlet térinformatikai rendszerének értékelése. [The evaluation of the geoinformatics system of intensive species-experiment in fruit orchards.] Lippai János – Ormós Imre – Vas Károly Tudományos Ülésszak. Budapesti Corvinus Egyetem. Kertészettudományi Kar. 154-155.
FÓRIÁN T. – NAGY A. – TAMÁS J. (2010): Precíziós gyümölcstermesztés térinformatikai rendszerének kiépítése [Organizing of the geoinformatics system of precision fruit-growing.]. VIII. Alkalmazott Informatika Konferencia. Acta Agraria Kaposváriensis. 14 (3): 313-321.
GODWIN, R.J. – WOOD, G.A. – TAYLOR, J.C. – KNIGHT, S.M. – WELSH, J.P. (2003): Precision farming of cereal crops: A review of a six year experiment to develop management guidelines. Biosystems Engineering. 84 (4): 375–391.
GONDA, I. – APÁTI, F. (2011): Almatermesztésünk helyzete és jövőbeni kilátásai. [The currently status and future prospects of our apple production.] In: TAMÁS, J. (eds.): Almaültetvények vízkészlet-gazdálkodása. [Water resource management of apple orchards.] Debreceni Egyetem, AGTC, Kutatási és Fejlesztési Intézet, Kecskeméti Főiskola, Kertészeti Főiskolai Kar, Debrecen. 13-25. (in Hungarian)
GÖKMEN, M. – VEKERDY, Z. – VERHOEF, A. – VERHOEF, W. – BATELAAN, O. – VAN DER TOL, C. (2012) Integration of soil moisture in SEBS for improving evapotranspiration estimation under water stress conditions. Remote sensing of environment, 121: 261-274.
GYŐRFFY, B. (2000): A biogazdálkodástól a precíziós mezőgazdaságig. [From the organic farming to the precision agriculture.] Agrofórum. 11 (2): 1-4. (in Hungarian)
LEE, W.S. – ALCHANATIS, V. – YANG, C. – HIRAFUJI, M. – MOSHOU, D. – LI, C (2010): Sensing technologies for precision specialty crop production. Computers and Electronics in Agriculture. 74 (1): 2-33.
LERMA GARCÍA, J.L. – VAN GENECHTEN, B. – HEINE, E. – SANTANA QUINTERO, M. (2008): Theory and practice on Terrestrial Laser Scanning. Editorial de la Universidad Politécnica de Valencia, Valencia. 261 p.
MILLA, K. A. – LORENZO, A. – BROWN, C. (2005): GIS, GPS, and remote sensing technologies in Extension services: Where to start, what to know. Journal of Extension [On-line]. 43 (3). Available at: http://www.joe.org/joe/2005june/a6.php
MOLENAAR, M. (1993): Remote Sensing as an Earth Viewing system. In: BUITEN, H.J. – CLEVERS, J.G.P.W. (eds.): Land Observation by Remote Sensing – Theory and Applications. Overseas Publishers Association, Amsterdam. 27-36.
NEMÉNYI, M. – TAMÁS, J. – FENYVESI, L. – MILICS G. (2010): A távérzékelés alkalmazása a biomassza és a vízkészletek mennyiségének, valamint minőségének megállapításánál. [Application of remote sensing to determine the quantity and quality of biomass and water regime.] Klíma-21 Füzetek. Klímaváltozás-Hatások-Válaszok. MTA-KSZI Klímavédelmi Kutatások Koordinációs Iroda, Budapest. 59: 51-60. (in Hungarian)
ROSELL, J.R. – SANZ, R. – LLORENS, J. – ARNÓ, J. – ESCOLÀ, A. – RIBES-DASI, M. – MASIP, J. – CAMP, F. – GRÀCIA, F. – SOLANELLES, F. – PALLEJÁ, T. – VAL, L. – PLANAS, S. – GIL, E. – PALACÍN, J. (2009): A Tractor-Mounted Scanning LIDAR for the Non-Destructive Measurement of Vegetative Volume and Surface Area of Tree-Row Plantations: A Comparison with Conventional Destructive Measurements. Biosystem Engineering. 102 (2): 128-134.
ROUSE, J. W. – HAAS, R. H. – SCHELL, J. A. – DEERING, D.W. (1973): Monitoring Vegetation Systems in the Great Plains with ERTS. Third ERTS Symposium, NASA SP-351 I: 309-317.

Science for Sustainability University of West Hungary International Scientific Conference for PhD Students March 19-20, 2013 – Győr
199
SHORT, N.M. (2011): The Remote Sensing Tutorial. Online: http://rst.gsfc.nasa.gov. TAMÁS J. (2001): Precíziós mezőgazdaság. [Precision agriculture.] Mezőgazdasági Szaktudás Kiadó. Budapest.
144. p. TAMÁS, J. – LÉNÁRT, Cs. – BURAI, P. (2009): Evaluation of applicability of airborne AISA DUAL hyperspectral
imaging system to map environment conditions in orchards. CIGR V. International Conf. Argentina, Rosario. 1-14.
TUCKER, C. J. (1979): Red and Photographic Infrared Linear Combinations for Monitoring Vegetation. Remote Sensing of the Environment 8: 127-150.
VOSSELMAN, G. – HANS-GERD, M. (2010): Airborne and Terrestrial Laser Scanning. Whittles Publishing, CRC Press. Caitness. 320 p.
Yield Estimate and Analysis as a Basis of Precision Crop Growing
PAP Nárcisz1* – PAP János2
1 University of West Hungary Faculty of Agricultural and Food Sciences, PhD student 2 University of West Hungary Faculty of Agricultural and Food Sciences, assistant professor
Abstract: Sophisticated crop production technologies require that farmers should concentrate not only on the final yield, but also on factors determining yield components. Research results refer to facts that besides ecological conditions and technological procedures the time of sowing and other factors influencing crop development play a significant role in yield formation. In the experiments we established that the yield of wheat was determined by plant density, number of ears, number of seeds in ears and thousand-kernel weight. The results and our crop estimation procedure show that in the case of a 10-40 hectare field the number of samples identical with the size of the field indicate the yield within margin of error.
Keywords: crop estimation, crop analysis, ear size, ear mass, technological elements
1. INTRODUCTION, LITERATURE REVIEW
Optimization of the total process of crop growing requires – as a result of future climatic changes – the complex analysis of technological elements. First of all, elements, like yield estimate and analysis, were neglected during the past decades. Knowing these technological elements enables us to evaluate other elements, to analyse relations and to make the necessary corrections.
Yield estimate and analysis before harvest – considering the observations and measures during the vegetation period – supply us with a precise picture of the yield influencing role of different factors. Survey and yield estimate during the vegetation period presume randomly done sampling in adequate numbers. In our experiment we took samples on the same plot with the help of GPS coordinates in autumn, spring and before harvest time.
Many years of experience confirm that besides the conditions of the arable site and the well chosen agro-technology, sowing time and other elements like the origin of the seeds are now of importance not mentioning the laboratory indexes and the results arrived at under arable conditions. Among them field emergence, that can only be interpreted on the very field and in the very year together with the applied agro-technology, has a decisive impact on the yield mass.
* *[email protected], Hungary, 9200, Mosonmagyarovar, Pozsonyi street 8.
Science for Sustainability University of West Hungary International Scientific Conference for PhD Students March 19-20, 2013 – Győr
200
Field emergence is a basic and decisive factor in winter wheat growing technology. This value may greatly differ and actually differs from germination percentages calculated in laboratory. The following drop in the plant number cannot be compensated by tillering, which is often incorrectly presented in practice as a correction factor.
Experimental data also confirm that the grain yield of wheat depends on the plant number, ear number, ear mass, grain number per ear and thousand-grain-mass. Though, if there is a drastic reduction in one of the yield elements the compensating force of the other yield elements will be limited. It means that harmonizing yield elements is the condition of an optimal yield. Our analyses results show that there is a very low correlation between the grain mass and the size of the ear, but the correlation is close and significant between the ear mass and the grain mass.
Growers can positively change single external factors, like the time of sowing, the seed quantity, plant numbers per area unit, agro-technology, nutrient supply, controlling the deceases and pests. Even if these factors harmonize we cannot abandon surveying, controlling and analysing the crop throughout the year, since they enable the grower to change the technology in order to produce the highest yield at the lowest costs.
Besides other growing elements yield estimate and analysis – crop survey throughout the year – are of great importance for the crop grower, PAP (2007). Topicality and importance of yield estimate is supported by FVM decree of 109/2007 (IX.28) about the crop-state-qualification and about the preliminary and final estimates of the expectable yield. SIMON (1985) says that it is necessary to know the expectable yield well before harvest time. The reliability of subjective yield estimate is greatly influenced by the practice and experience of the estimating person and the yield influencing ecological factors as referred by SIMON (1974). The yield is influenced by several elements of vegetation through the plant development and these factors can be followed–up during the vegetation period, e.g. time of sowing, tillering and coming into ear by cereals, as well as the time of ripening and harvest, soil and climatic conditions, variety, tending and pests. Based on experiments PAP et al (2009c) calls the attention to the fact that vegetation elements should be recorded every year, because we can only get useful and correct data this way. PAP et al. (2011) emphasises the great importance of field emergence, their value can exactly be determined by the yearly survey of condition and yield estimate (PAP et al. 2009c).
KOVÁTS and RAGASITS (1981) did the objective yield estimate of wheat before harvest. They counted the numbers of ears available in the sampling area and measured the length of the first ten ears. PAP et al. (2010) found that the correlation between the length of the ear and grain mass is much lower than that of the ear mass and the grain yield. KISMÁNYOKY (1981) calculated the expectable yield of malting barley from the ear number, the average grain number per ear and the empirical thousand-grain-mass. PÁSZTOR (1981) applied the yield estimate on the basis of the numbers and the size of maize cobs for the preliminary and final numerical yield estimate. The crucial point of yield estimate is the adequate representation, i.e. the sampling areas shall provide a true picture of the whole field. We get a correct representation if we randomly arrange the sampling areas and their numbers are enough to apply the results for the whole field. SIMON (1974) applied in his experiments 200 samples per farm and per crop. According to the basic principle we should collect as much samples as we can to prepare a correct estimate – even if there are figures available – since the average figures in tables can greatly be modified by the very year, the arable site and even the growing technology, PAP (2009b).
2. MATERIAL AND METHODS
We estimated the yield on a field of 14ha in the training farm of the university. Lupus variety of the spring wheat was used with a seed norm of 200 kg/ha with seed purity by 97 %, laboratory germination by 92%, and the thousand-seed-mass by 45g. Samples were taken on 4 wheel tracks

Science for Sustainability University of West Hungary International Scientific Conference for PhD Students March 19-20, 2013 – Győr
201
and 28 sampling areas, 7 samples per wheel track. GPS coordinates were measured during the autumn survey in order to take the samples from the same site later on.
During the autumn survey and measuring we counted the numbers of plants on one quadrate meter and carried out more detailed analysis on 1-1 linear metre. We recorded the figures for plant spacing, depth of sowing, tillering, and depth of the tillering node and the plant height. Further more we conducted an overall survey on the surroundings of the sampling area. We inspected the colour and development state of the plants, the pests and pathogenic agents, the soil condition and weed-situation.
During the spring – subjective – yield estimate we measured the plant spacing, the depth of sowing, the depth of the tillering node, and the numbers of shootings and the plants’ heights by a length of 50 cm. In the direct environment of the sampling area we conducted surveys similarly to those in autumn.
Four days before harvesting – 5th July – we collected plants from an area of one quadrate meter. We weighed the total mass of samples then the mass of the ears and grains and the rate of the length of the ears on the bases of the measurements. At a length of one linear meter we pulled out the plants together with the roots and carried out a total analysis: we measured plant spacing, depth of sowing, rate of tillering, and depth of the tillering node, length of the ears, mass of the ears and numbers and mass of the grains in the ear.
The results were evaluated with the method of regression analysis (SVÁB 1981).
3. EVALUATION OF THE RESULTS
During the autumn survey – 26th November 2011 – we found that the crop was poorly developed, their colour was light green, and vole damage could have been observed among the pests. The soil cultural condition and its weed infestation corresponded with a poor qualification.
Figure 1 show the results. Compared to the average (2.1 cm) there were great differences in the plant spacing – 0.1 – 16 cm – the high value of CV shows their variation well. The most frequent plant spacing was between 0.5 and 2 cm.
There were 3.33 million plants per hectare on average. The extreme figures show plant numbers of 2.25 and 4.75 million and the high CV value refers to heterogeneity.
Average sowing depth was 3.2 cm. The 0.1 cm was the shallowest and 7 cm was the deepest. The most frequent sowing depth was between 2 and 5cm.
The development of the plants is well represented by the average plant height of 3.8 cm with extreme values of 0.5 and 6cm and high CV value. The most frequent plant height was 4 cm.
Figure 1. Plant spacing of winter wheat at the time of survey in autumn

Science for Sustainability University of West Hungary International Scientific Conference for PhD Students March 19-20, 2013 – Győr
202
The most important factor of the yield estimate and survey in autumn is field emergence. It amount 72.2% on average, being far behind the rate received in laboratory and show a high rate of variation between the lowest and the highest values: 48.7 % - 100 %.
Data of first spring survey on winter wheat. Data on plant spacing is quite the same as in autumn. The average spacing of 2.1 cm in autumn and the average of 2.5 cm in spring clearly show the rate of overwintering. It shows a loss of 10 and 16% field average. The depth of the tillering node and the sowing depth developed alike as a result of the shallow sowing depth. Both values show a considerable variation. Plants are short, only 2-15 cm high even in April with an average value of 8 cm and a high rate of variation. The average number of side shoots amounted 1.5 besides the leading shoot with very high rate of variation, the number of tillers were between 0 and 7 per plant
We took samples from one quadrate metre before harvesting and measured the yield mass and analysed the yield. From the taken samples we measured the plant spacing, the sowing depth, the rate of tillering, the number and mass of ears per plant, as well as the number and mass of grains per ear. The blanking in autumn reflects in the low numbers of plants, in the plant mass per quadrate metre and number and mass of ears at the time of harvesting.
The rate of productive tillering is low, there are 1.06 ears per plant and the CV value is very high. The values of the harvest index are remarkable that remains within the allowed variation (CV = 3.34) so the yield can be estimated quickly and precisely. The yield mass of the sampling areas 3.68 t/ha represents the harvested crop quantity of 3.3 t/ha very well.
We measured the samples from one linear metre with correlation analysis: Figures 2-5: 33% of the ears were 6cm long, and their rate was 75% together with ears 5 and 7cm in lengths, Figure 2.
Figure 2. Size of the ears Figure 3. Ear mass
We arrive at a more precise and real picture if we consider the variation of the ear mass. The majority of the ears belong to the mass group of 0 – 2.5 g. Among them ears of 0.5 – 1 g are the highest in numbers.

Science for Sustainability University of West Hungary International Scientific Conference for PhD Students March 19-20, 2013 – Győr
203
Figure 4. Correlation of ear mass and grain mass and the grain mass in ears 6cm in length
It is more rational and precise to calculate and estimate with the ear mass since the
correlation between the ear size and numbers of grains in the ear is uncertain and low (Figure 3) compared to the very close and certain correlation between the ear mass and grain mass Figure 4.
Figure 5: Correlation between the yield index Figure 6: Correlation between the field emergence and the yield and plant number
Figure 7: Correlation between the plant number Figure 8: Correlation between the ear index
and ear number and ear mass
Analysing the yield mass we measured the influence of the five main yield infl1uencing elements – plant numbers, ear numbers, average mass per ear, grain numbers per ear and thousand-grain mass. Figure 5: We calculated this index by multiplying the single yield elements and divided them by 100 Million. As a result we can conclude that the rate of the five elements in estimating the expectable yield is 75%, showing a significant correlation at P=0.1%. Among the yield elements we analysed the correlation of the plant number, as a primary factor, with the field
Science for Sustainability University of West Hungary International Scientific Conference for PhD Students March 19-20, 2013 – Győr
204
emergence, Figure 6. We can conclude that the plant number significantly depends by 40% on the rate of field emergence.
The number of ears per area unit and respectively the yield mass as the second important factor depend by about 80 % – on the plant number – Figure 7.
The ear mass per area unit depends by 50% on the ear numbers, the number of grains per ear and the thousand-grain-mass Figure 8. The index can be calculated by the arithmetical product of the three factors and divided by 100 000.
4. CONCLUSIONS
Poor field emergence and the condition of the crop basically influence the expectable yield. In 2011 the value of the field emergence – 72% – 2mainly differed from the laboratory values. Because of the inaccurate plant spacing and sowing depth the crop was heterogeneous in spring, too. In spring the development and growth of the plants were far behind the condition that was to be expected in autumn, and this was intensified by the poor tillering. Weather conditions were also unfavourable, so we could not count the compensating role of tillering, so the crop was much lower than the expectable 5 – 5.5 million plants.
Yield estimate before harvest, especially the samples taken from the quadrate metre, precisely indicate the yield to be expected at harvest. The Harvest index is featured by the CV-value that varies within a narrow and allowable margin and indicates an accurate estimate. This value can well and precisely be calculated for a very year, a variety and field technology. The rate of tillering does not correlate with the plant spacing; its value depends on other factors like the sowing depth, the grain quality, soil condition and nutrient supply.
Analysing the correlation of the ear length with the ear mass as mentioned in publications we found that there is a very low and not significant correlation between them, therefore their application in the yield estimate is very risky and we arrive at an inaccurate result. On the contrary there is a very close and significant correlation between the ear mass and the numbers of grain in the ear.
We arrived at a correlation between the arable site and the yield per plant. It is worth collecting the parameters that can be regarded as basic data. Surveys should be conducted per year per field and per variety as there can be great differences between the estimated and the measured data. Grain yield is mainly influenced by the number of plants and ear per area unit and by the average number of grains in the ear, by the grain mass and the thousand-grain-mass. Field emergence shows the numbers of plants, which also depends on the seed and the applied technology. The plant number greatly influences the expectable ear number.
Ear mass per area unit depends on the ear number, on the grain number and thousand-grain-mass.Yield estimate – survey of the crop condition – and yield analysis provide the farmer means to follow-up the crop throughout the year and find out the role of factors that influence the yield mass and of the technological elements. Yield estimate and analysis provide the farmer with pieces of information at low costs that can contribute to a better and higher yield mass in the future. References 109/2007.(IX. 28.) FVM rendelet KISMÁNYOKY T. (1981): Sörárpa. In: KOVÁTS: A Növénytermesztési praktikum. Mezőgazdasági kiadó.
Budapest. KOVÁTS A. – RAGASITS, I. (1981) Búza. In: KOVÁTS: A Növénytermesztési praktikum. Mezőgazdasági kiadó.
Budapest. PAP J. (2007): A termésbecslés szerepe és jelentősége. IKR Magazin 2007 Nyár PAP J. – PAP V. – PAP N. – TULLER P. (2009a): A szántóföldi kelés jelentősége. Mezőgazdaság és a vidék
jövőképe. Mosonmagyaróvár. Konferencia kiadvány I. kötet. 196-203.
Science for Sustainability University of West Hungary International Scientific Conference for PhD Students March 19-20, 2013 – Győr
205
PAP J. – PAP V. – PAP N. – TULLER P. (2009 b): A termésbecslés értékelése. Mezőgazdaság és a vidék jövőképe. Mosonmagyaróvár. Konferencia kiadvány II. kötet. 255-264.
PAP J. – PETRÓCZKI F. – PAP V. – GERGELY I. (2009c): A termésbecslés jelentősége. V. Növénytermesztési Tudományos Nap. Akadémiai Kiadó. 173-176
PAP J. – FÖLDESI-PAP V. (2010): A technológiafejlesztés kiindulópontja az állapotminősítés és a termésbecslés. Agrofórum. 21. évfolyam, 6. 14-18.
PAP J. – PAP N. – FÖLDESI-PAP V. (2011): A szántóföldi kelés szerepe a borsótermesztésben. Erdei Ferenc VI. Tudományos Konferencia. Kecskemét. I. Kötet. 462-466.
PÁSZTOR K. (1981): Kukorica. In: KOVÁTS: A Növénytermesztési praktikum. Mezőgazdasági kiadó. Budapest. SIMON B. (1974): Termésbecslés módszerei Mezőgazdasági Kiadó. Budapest. SIMON B. (1985): Termésbecslés, - biztosítás, kárbecslés. In: MENYHÉRT (szerk.): A kukoricatermesztés
kézikönyve. Mezőgazdasági Kiadó. Budapest. SVÁB J. (1981): Biometriai módszerek a kutatásban. Mezőgazdasági Kiadó.
Effect of Zn on Maize (Zea mays L.) Yield and Chemical Composition in Soil Fertilization Experiments
MATUS László – SCHMIDT Rezső
Department of Soil Management, Institute of Plant Production, Faculty of Agricultural and Food Sciences, University of West-Hungary H-9200 Mosonmagyaróvár, Vár 2., e-mail: [email protected]
Abstract – Small plot soil fertilization experiments were carried out with alkaline zinc-carbonate on brown forest soil of insufficient zinc supply on the fields of Farkas Kft. in Zimány in 2011. The aqueous solution of zinc-carbonate was applied on the surface of properly prepared seed bed before sowing. Our test-crop was an NK Symba maize hybrid. We applied zinc in doses of 25; 50; 75 and 100 kg/ha. As a result of the zinc treatment yield increased significantly. The highest yield increase could have been achieved at a zinc doses of 100 kg/ha. Dry matter content increased due to the increasing zinc doses. We could observe significantly higher starch content at higher zinc doses. We also measured the zinc quantity of the kernel yield. But we could not measure any significant increase in the zinc content due to the zinc treatments.
Keywords: maize / zinc / soil fertilization / yield / chemical composition
1. INTRODUCTION
Maize – due to its primary role in food supply– is one of the most important cultures of human kind besides wheat and rice (MENYHÉRT et. al. 2004). According to KSH (Central Statistical Office) its sowing area in Hungary covered about 1.24 Million ha, which accounted for about 28.8% of the 4.3 million ha arable land in 2010. The nutrition of arable crops– among them maize – was almost based on the forced use of farm yard manure until the middle of the 20th century in Hungary (BOCZ 1966). Maize needs a great amount of nutrients to develop vegetative parts. This need is satisfied by artificial fertilizers nowadays (TÉRMEG 2004). With respect to macro-nutrients we need to emphasize the proper supply of N and P. Among micro-elements adequate zinc-supply is essential for maize. Increased demand on zinc occurs first of all on lime soils that are well or very well supplied with phosphorus, when the antagonism of P-Zn and the alkalinity disturb the take up of zinc (TERBE et al. 2004). Hungary’s soils are insufficiently supplied with zinc in international comparison. 46% of Hungary’s soils are insufficiently supplied with zinc. Zn-deficient soils can mainly be found alongside the NW-SE diagonal of the country (in the counties Békés and Fejér).

Science for Sustainability University of West Hungary International Scientific Conference for PhD Students March 19-20, 2013 – Győr
206
They are the most important maize producing areas in Hungary (Schmidt et al, 2009). On arable lands, where it is important to achieve high yields, we need to replace micro-elements in adequate quantities. If we talk about micro-element replacement we first of all think of foliar dressing. But there are two ways of micro-element replacement: foliar and soil fertilization. Different authors have different ideas about foliar applications. However the advantage of foliar application can be seen when the nutrients that are put on the leaf surface and get into the intercellular flights and are directly utilized by the crop. So we have the chance to interfere quickly if we see the symptoms of deficiency. If we apply soil fertilization nutrients may be bound or leached out, and as a result an unbalanced nutrient supply may occur (KÁDÁR 2008). In our soil fertilization experiments we aimed to test the improving effect of zinc – the most important element for maize – on yield and chemical components.
2. MATERIALS AND METHODS
In 2010 we launched small plot soil fertilization experiments with alkaline zinc-carbonate on brown forest soil of poor zinc supply on the fields of Farkas Kft. in Zimány. The test-crop was an NK Symba maize hybrid. Table 1 shows the results of soil analyses.
Table 1: Soil analysis results, Zimány pH AL-soluble EDTA-soluble
H2O KCl KA CaCO3 Humus P2O5 K2O Na Mg Zn Cu Mn % mg ⋅ kg-1
- 5.98 41 1.1 1.61 84 206 15 198 0.8 4.2 394
Small-plot experiments were launched in four replications and randomly arranged blocks. Application units were 10 m in length and 4.5 m in widths (as large as the working width of the harvester). Small plots were traditionally marked with marker poles and cords. The corner points of small plots were marked with a handheld computer operating with GPS signals of high accuracy – corrected by an RTK-base station. The alkaline zinc-carbonate solution was manually applied (with a watering can) on the surface of the properly prepared seed-bed. We applied zinc doses of 25; 50; 75 and 100 kg/ha. Maize cobs were manually harvested starting from the middle of the small plot in one direction and one row of 4metres. We measured the length of the cobs, the length of the non-fertilized cob part, the mass of the shelled kernels, and the thousand-grain mass. After the harvest we carried out rapid tests on oil-, protein-, and starch content with the use of a Perten NIR instrument. The comparative test of the micro-element content of the kernels was carried out in an accredited laboratory. Statistical evaluation of the experimental results (Kolmogorov-Smirnov test, Levene’s test, one-way ANOVA, Kruskal-Wallis test, Mann-Whitney test, Pearson’s Correlation) were carried out with the application of SPSS 12.0 for Windows program (SPSS Inc., Chicago, USA).
3. RESULTS AND DISCUSSION
Farkas Kft. runs the farm on 420ha in Zimány. The average quality of the arable land equals the Hungarian quality standard of 8 AK/ha – to 31 AK/ha. The average quality of the cultivated area equals the Hungarian quality standard of 19.39 AK/ha. About 300 out of the cultivated 420ha show zinc deficiency (70%). We can speak about Zn-deficiency in case of a quantity lower than 2.5 mg • kg-1 EDTA-soluble Zn-quantity.

Science for Sustainability University of West Hungary International Scientific Conference for PhD Students March 19-20, 2013 – Győr
207
Ear mass For the evaluation of the effect of Zn-treatments we measured the mass of maize ears. The
mass of the ears varied between 29 and 305.8 g. Studying the effects of the Zn-doses we can establish that due to the application of the Zn compound the mass of the ears increased. The tendency of the increase is almost regular; there is only a minor difference at the Zn-dose of 75 kg/ha. The lowest (control and 25 kg/ha Zn) and the highest (100 kg/ha Zn) values differ significantly from each other.
Mass of the shelled kernels A similar tendency can be established in the case of the shelled kernels. The mass of the
kernels increased parallel with the increasing Zn doses. We can measure the lowest kernel mass of the control at 25 kg/ha Zn dose. The increase of the mass of the shelled kernels is regular and in spite of the relatively high standard deviation values, it is significant at the control, the 25 kg/ha and the 100 kg/ha Zn dose respectively.
292.4 ha70%
127.6 ha30%
Zn-deficient
Sufficient Zn-supply
Figure 1. The proportion of areas with insufficient and sufficient Zn-supply at Farkas Agricultural Co.,
Zimány, SW Hungary
180.87b 182.71
b
197.55ab
195.54ab
204.35a
165,00
170,00
175,00
180,00
185,00
190,00
195,00
200,00
205,00
[g]
Control 25 50 75 100
Zn [kg/ha]
a, b: p<0.05
Figure 2. The effect of Zn-treatments on the ear mass

Science for Sustainability University of West Hungary International Scientific Conference for PhD Students March 19-20, 2013 – Győr
208
157.70a
160.51a
171.41ab 172.47
ab
178.05b
145,00
150,00
155,00
160,00
165,00
170,00
175,00
180,00
[g]
Control 25 50 75 100
Zn [kg/ha]
a, b: p<0.05
Figure 3. Changes in the mass of the shelled kernels due to Zn-treatments
Length of the cobs Zn plays a significant role both in the vegetative and generative development of maize.
Lengths of the cobs also responded positively to the application of the Zn compound. In the case of this parameter the standard deviation was also much smaller. The minimum and the maximum values varied between 110 and 214g. We could measure the lowest value of the control and the 0.1 kg/ha Zn. At the treatments higher than this, the length of the cobs differs significantly from the values measured at the two lowest doses.
176.58b
178.73b
184.76a 185.35
a
188.03a
170,00
172,00
174,00
176,00
178,00
180,00
182,00
184,00
186,00
188,00
190,00
[mm]
Control 25 50 75 100
Zn [kg/ha]
a, b: p<0.05
Figure 4. The relationship between cob length and Zn-treatments
Corn-cob ratio The corn-cob ratio was calculated in order to study how the treatments modified the
proportion of the generative and vegetative parts. We observed the same tendency as in the case of the other parameters, i.e. the lowest and the highest values differed significantly from each other. This is also supported by the fact that while the corn mass increased due to the treatments, there were no significant changes in the cob mass, therefore the ratio changed.

Science for Sustainability University of West Hungary International Scientific Conference for PhD Students March 19-20, 2013 – Győr
209
6.48b
6.48b
6.64ab
6.72ab
6.83a
6,30
6,40
6,50
6,60
6,70
6,80
6,90
[Cor
n/co
b]
Control 25 50 75 100
Zn [kg/ha]
a, b: p<0.05
Figure 5: Changes in the corn/cob ratio as a result of the Zn-treatments
Zn content of the leaves The Zn-content of the leaves also responded to the treatments positively. The Zn-content of
the sample leaves varied between 12 mg/kg and 22.9 mg/kg. The number of the analysed samples in this case was 4, according to the replicates of the experiment. We measured the lowest value in the case of the control and the highest one at the 0.25 kg/ha Zn treatment. The statistical analysis proved the same fact; the control and the 0.1kg/ha Zn treatment did not differ statistically. There was also no significant difference between the two treatments in the middle (0.15 and 0.2kg/ha Zn). The Zn-content of the control and the plants treated with 0.1 kg/ha Zn dose is 13.92 mg/kg and 15 mg/kg respectively and that of the plants collected form the plots treated with 0.25 kg/ha Zn is 19.6 mg/kg. The difference between the 0.25 kg/ha Zn and the 0.1 kg/ha Zn treatments is significant at 5% probability level, between the control and the 0.25 kg/ha Zn at 1% probability level.
13.93b 15.00
b16.60
ab 17.23ab
19.60a
0,00
2,00
4,00
6,00
8,00
10,00
12,00
14,00
16,00
18,00
20,00
[mg/
kg]
Control 25 50 75 100
Zn [kg/ha]
a, b: p<0.05
Figure 6: Zn-content of the maize leaves in the experiment
References BOCZ E. (1966): Szántóföldi növénytermesztés. Mezőgazda Kiadó, Budapest. KÁDÁR I. (2008): A levéltrágyázás jelentősége és szerepe a növénytáplálásban. Acta Agronomica Óváriensis,
Vol. 50. No. 1.: 19-27. p. MENYHÉRT Z. – CSÚRNÉ VARGA A. (2004): Adalékok a kukoricatermesztés agrotechnikai alapjaihoz. Gyakorlati
Agrofórum Extra, 15. (5): 3-11. p. SCHMIDT R. – MATUS L. – PÉNTEK A. (2008): Magyarország talajainak Zn-ellátottsága, a visszapótlás
lehetőségei. Agro Napló, 2009/3.: 44-45. p.

Science for Sustainability University of West Hungary International Scientific Conference for PhD Students March 19-20, 2013 – Győr
210
TERBE I. – SLEZÁK K. – KAPPEL N. (2001): A talajművelés és tápanyag-utánpótláshelyzete a szántóföldi zöldségtermesztő gazdaságokban. Gyakorlati Agrofórum, 12. (1): 2-6. p.
TÉRMEG J. (2004): Csemegekukorica tápanyag-utánpótlási technológia. Kemira Grow How, 4. (5): 2. p.

Science for Sustainability University of West Hungary International Scientific Conference for PhD Students March 19-20, 2013 – Győr
211
Section 3.2 New Technologies in The Precision Site Specific Plant Production
Precision Crop Production and Sustainability
NEMÉNYI Miklós
Head of “Precision Crop Production Methods” Doctoral School of Applied Plant Sciences University of West Hungary, Institute of Biosystems Engineering
Abstract – There are many different definitions of sustainability or sustainable development. The most common phrasing was published in the Brundtland Report (1987): “Humanity has the ability to make development sustainable to ensure that it meets the needs of the present without compromising the ability of future generations to meet their own needs.” This was the most important contribution to the thinking on sustainability. To the social, political, economic, ecological etc. aspects a totally new viewpoint has been added, namely the emotional constraint of ethic.
On the other hand, from the agrotechnological and social points of view the definition above should be supplemented with the expectation of maximum utilization of the fertility potential of arable lands. It is important to note that hunger kills more people every year than AIDS, malaria and TB together (FAO). At the same time the demand for naturally degradable raw materials for industry have also been increasing year by year.
The use of agrotechnologies means that we “produce ‘order’ where formerly was disorder.” (MOROWITZ 1968 in NEMÉNYI 2012). According to the 2nd law of thermodynamics nature tries to recapture its former territory by continuously forming new resistant micro-ecotypes. The other huge problem is the leaching of nitrogen compounds into the ground water.
Precision crop production is a good pattern to systems thinking. The presentation shows the basic element of language symbols and how to model different transfer processes (energy, mass and information) in agroecosystem. Research in precision crop production systems has three important goals concerning the aspects of sustainability: 1. Permanently improving the detection and monitoring technique aiming to recognize the attacks
of weeds, insects, microorganisms etc. on time, consequently the amount of applied chemicals can be drastically reduced;
2. Contributing to the improvement of accuracy of nitrogen dynamics models; 3. Adopting the different crop systems models (DSSAT, ProPlanta) to site specific precision
technologies. Concerning the latter two points, according to our experiences, the expansively used decision
support models (such as those mentioned above) are useful only for larger cultivated areas (larger than 10- 15 ha), however in gridded arable land, where the size of treatment units are less than 1 ha the accuracy of such models is not acceptable.
The presentation gives a comprehensive view on the research projects running at the Institute of Biosystems Engineering concerning the above analysed topics.
Key words: systems ecology / fertility potential / improve the accuracy of crop systems models
Science for Sustainability University of West Hungary International Scientific Conference for PhD Students March 19-20, 2013 – Győr
212
References NEMÉNYI M. (2012): Anthropogenic Impact on Nature with Special Regard to Agricultural Technology. The
Impact of Urbanization, Industrial, Agricultural and Forest Technologies on the Natural Environment. Nemzeti Tankönyvkiadó Zrt. ISBN 978-19-7352-5, p.13-24.
Perspectives of Radioanalytical Methods in Precision Plant Production Research
LESNY, Juraj
University of SS. Cyril and Methodius in Trnava, J. Herdu 2, Trnava, SK-917 01, Slovak Republic
E-mail: [email protected] Abstract – Radioanalytical methods represent a specific branch of analytical techniques utilizing nuclear radiation for identification and determination of an extraordinary broad scale of analyst, neutron activation analysis, radioreagent methods and a variety of isotope dilution procedures being the most effectual ones. Furthermore, a wide range of radioanalytical methods have been successfully applied for quantification of a series of other highly important data such as solubility characteristics, complexation constants, quantification of diffusion and sorption properties, etc. Related methods are in rising extent applied in plant production research as well. Assessment of isotope-exchangeable amounts of important soil constituents as a contribution to appraisal of their biological availability (e.g. 55Mn – 54Mn), quantification of foliar uptake by application of adequate fertilizers (e.g. utilizing 65Zn) and application of positron emitter (e.g. 18F half-life 1.83 h, 11C half-life 20.36 m) labelled chemical individuals, aimed at transport studies in plant tissues, are examples of such valuable measurements. While authoradiography (the old timey, nevertheless a powerful radiometric method) provides a static image of tracer location only, positron-emitting tracer imaging is applicable even for in vivo spatial and temporal resolution of tracer movement. The basic virtue of radioanalytical methods – in specific cases causing even their irretrievability – stem from exceedingly high energies of radioactive particles and/or photons reaching 0.01 - 10 MeV (∼10-15 - 10-12 J). The large kinetic energy of particular forms of nuclear radiation, as a rule, enables an uncommonly high effectivity of their measurement, which allows a fast and in general an inexpensive determination of fractions of femtomolar amounts (< 10-13 g) of substances. No doubt, the high energy of the emitted radiation - followed by versatile forms of interactions with both biotic and abiotic environment may have harmful consequences too, including the eventuality of external irradiation of humans. Application of radioactive emitters can potentially end in internal contamination of living organisms. It follows, that the utilization of radiometric methods in field experiments is realizable only with inherent restrictions. Radioactive laboratory wastes require specific treatment which assures its safe disposal. Evidently, application of radioanalytical methods encompasses a scale of distinct scientific viewpoints. Moreover, indirectly, it interferes with a number of global aspects of sustainable development including environmental, ethical and economical ones. To which range may Chernobyl and Fukushima Daiichi negatively affect the application of radiometric research techniques in general? In which directions and to which extent may we bank on radioanalytical methods in precision plant production research? The presentation intends to rationalize arguments and look for reasoned answers.
Keywords: radioanalytical methods / E-value / foliar uptake / substances transport visualization

Science for Sustainability University of West Hungary International Scientific Conference for PhD Students March 19-20, 2013 – Győr
213
Factors Influencing the Arable Weed Vegetation of Hungary with Special Attention to the Incidence of
Ambrosia artemisiifolia
PINKE Gyula Abstract – Weed communities in arable land are governed by several anthropogenic and environmental factors, and there is a recurring challenge for weed scientists to assess and rank the influences of such factors in the constantly changing cropping systems. Common ragweed (Ambrosia artemisiifolia L.), an annual alien plant of North American origin, is one of the most noxious invasive species in Europe, particular because it produces large quantities of allergenic pollen, which causes severe health problems. The main goal of this study was to identify management and environmental factors determining weed species composition and the abundance of A. artemisiifolia in arable fields.
In 2009, the abundance of late-summer weed flora and 25 environmental, management and site context factors were measured in 243 maize, sunflower and stubble fields representing the entire country. A similar weed survey was carried out in 2010, investigating 102 poppy fields. Weed vegetation was sampled in the fields in four randomly selected 50-m2 plots and percentage ground cover of plant species was estimated visually. Crop management information was obtained directly from the farmers. For each investigated field, a set of environmental variables was also compiled including (1) soil properties (2) climatic conditions and (3) the geographic latitude, longitude and altitude of the field as measured by a GPS receiver. Data were analysed by redundancy analysis (RDA) after backward variable selection, classification and regression tree models were also used.
Regarding summer annual weed vegetation, most variation in species composition was explained by plot location, which was followed by temperature, crop type, precipitation, soil texture, neighbouring habitat, altitude, soil pH, sodium and potassium content of the soil. In poppy fields sowing season was found to be the most important explanatory variable, showing a clear distinction between the weed flora of autumn-sown food poppy and spring-sown alkaloid poppy fields. The results indicate that the most important management variables associated with the variation in abundance of A. artemisiifolia were crop type and crop cover, while the most relevant environmental variables were soil texture, soil pH, soil Na, K and Mn content, May temperature, annual and April rainfall.
Our results suggest that even for intensified agriculture the effects of environmental factors are of greater importance than management factors on summer arable weed composition in a country-wide context. On the contrary, in poppy fields, only four environmental variables were significant, which can be attributed to the narrow ecological tolerance of poppy, resulting in short environmental gradients.
Science for Sustainability University of West Hungary International Scientific Conference for PhD Students March 19-20, 2013 – Győr
214
Evaluating the Effect of Acidity Generated Humidity Change on the Optical Characteristic of a Soil Sample
TOLNER Imrea – FENYVESI Lászlób – NEMÉNYI Miklós a aUniversity of West Hungary Faculty of Agricultural and Food Science, Mosonmagyaróvár, H-9200, Hungary;
bHungarian Institute of Agricultural Engineering, Gödöllő, H-2100 Hungary; E-mail: [email protected]
Abstract – The assessment of soil conditions are an important part of geo-informatics aided precision farming. The aim of the research project is to develop an optical based method for measuring physical and chemical properties of soils which is suitable for soil pH determination.
The measurements were made with ASD FieldSpec 3 Max spektroradiometer in the Hungarian Institute of Agricultural Engineering, Gödöllő (VM MGI).
The acidity affects the nutrition-management of the soil. Based on scientific references the direct assessment of soil pH is not possible with remote sensing. In our study we use an indirect approach of pH determination.
The pH also affects the soil’s water management. In the IR wavelength bands the water and so the soil moisture shows characteristic absorption features.
The ASD FieldSpec 3 Max is a portable spectroradiometer which is capable of measuring the spectral reflectance between 350-2500 nm in 349 different wavelengths. Measurements were carried out under precisely set laboratory conditions. After clarifying the correlations our long-term aim is to apply them on AISA DUAL airborne hyperspectral images.
We examined the reflectance spectra on calcareous sandy soils. We changed the soil pH or rather the calcium-carbonate content with various hydrochloric acid treatment and studied the absorption peaks of reflectance spectra in those wavelengths which refer to the water. As a result of treatments, wetting and drying in the range of 1900-2000 nm the peaks referring to the -OH group were dislocated in various scale. The phenomenon denotes to the presence of water forms bounded with different strength. This can be in relation with the change of the quantity of hygroscopic salt (calcium-chloride) which was formed as a result of the acid treatment.
Keywords: hyperspectral technology / soil acidity / humidity
1. INTRODUCTION
As the practice of precision agriculture spreads the development of examination methods based on remote sensing applications become more and more important. Soil features - physical processes, chemical and biological changes - affect the optical characteristic of soil surface. Changes can be effectively detected by means of remote sensing.
The airborne hyperspectral sensor system – AISA DUAL – and portable spectroradiometer –ASD FieldSpec®3 Max – operated by the Hungarian Institute of Agricultural Engineering make possible to gather information of large areas. The detected range of the ASD equipment covers the electromagnetic radiation between 350 to 2500 nm (SZALAY, 2011). In case of measuring the mineral composition of soils the higher region of this interval is the most informative (KARDEVÁN et al., 2000, KARDEVÁN, 2007).
Decisive part of Hungarian soils is acid. In order to preserve the soils and perform the appropriate melioration method assessment of the acidity level is important factor (VÁRALLYAY et al., 1980; VÁRALLYAY, 2006; HUSTI, 2006). During the examination obtainment of detailed information is desirable. Beyond the conventional labor tests (pHH2O, pHKCl, y1, BUZÁS, 1988) the

Science for Sustainability University of West Hungary International Scientific Conference for PhD Students March 19-20, 2013 – Győr
215
total acidity can be measured by titrating of soil suspension. The base of this method is that pH level of the suspension is kept at constant level during the titration (CZINKOTA et al., 2002; SIMON et al., 2006; VÁGÓ et al., 2010). The precise measurement of soil acidity is especially important to calculate the lime quantity (TOLNER et al., 2008; VÁGÓ et al., 2008).
The detection of the soil acidity is not easy because only the indirect effects of surface pH can be analyzed through reflected spectra. Also an important factor that must be considered that optical effects which were generated by the pH change can mix with the effects of the organic or clay content (CHANG et al. 2001). CHANG et al. (2005) examined the correlation based on 400 soil samples. Calibrations were based on partial least-squares regression (PLSR), using the first differentials of log (1/R) for the 1100 to 2500-nm spectral range. The results for the calibration set and validation set I indicated that NIRS-PLSR was able to predict many soil properties (total C, organic C, inorganic C, total N, CEC, % clay, and moisture) with reasonable accuracy for both the air-dried (R2 > 0.76) and moist (R2 > 0.74) soils. Experiments of SEILERA et al. (2007) has proved that the pH change is caused by the concentration change of OH group. This can be measured by the evaluation of the reflection spectrum. The quantity of the OH group is in relation with the quantity of acid groups in the soil.
In this and in our previous studies we don’t work on calibration models which can be gained by mathematical statistical methods but take up the question of clarifying the reasons of phenomena. Soils which contain CaCl2 - which is one characteristic of acid soils – we experienced decisive differences in absorption maximum in the wavelength range of 1900 to 2000 nm at variously dried soil samples (TOLNER et al., 2012).
During our former test in case of soil samples with various pH levels – which was set by different hydrochloric acid treatment - we experienced changes in hygroscopic feature of soil (TOLNER et al., 2012). The moisture content of soil affects decisively the reflection spectrum (NEMÉNYI, 2008, MILICS, 2004), thus special attention was paid to the drying process.
In this experiment we study the effect of moisture content, pH value and the calcium mineral to the NIR reflection spectra.
2. MATERIALS AND METHODS
Sandy soil samples from Fót, Hungary (Coords 47.617252N,19.189166E) were applied for the treatments. The main properties of the soil are the following: saturation percentage, KA=28.33, lime content, CaCO3 % = 8 %, pH(H2O) = 8.2, pH(KCl) = 7.2, humus content, H % = 1.4 %, AL-P2O5 = 95 ppm, AL-K2O = 120 ppm.
Treatments: 1. Control: Soil without any treatment 2. Acidification 25×1 Soil added HCl equivalent for 25% of CaCO3 content 3. Acidification 25×2 Soil added HCl equivalent for 50% of CaCO3 content 4. Acidification 25×3 Soil added HCl equivalent for 75% of CaCO3 content 5. Acidification 25×4 Soil added HCl equivalent for 100% of CaCO3 content
6. Acidification 25×4+25 Soil added HCl equivalent for 100% of CaCO3 content and added CaCl2 equivalent for 25% of CaCO3 content.
Treatments were set in two replications. The reflectance spectra of all samples were examined in absolute dry and air humidity
equivalent state. The absolute dry samples were made through a drying process on 105 °C. The air humidity equivalent samples were in balance with the laboratory’s air humidity. The dried samples reached this state in 24 hours. The spectra were collected with ASD FieldSpec®3 MAX spectroradiometer by using ContactProbe sensor-head in three positions. Each position was
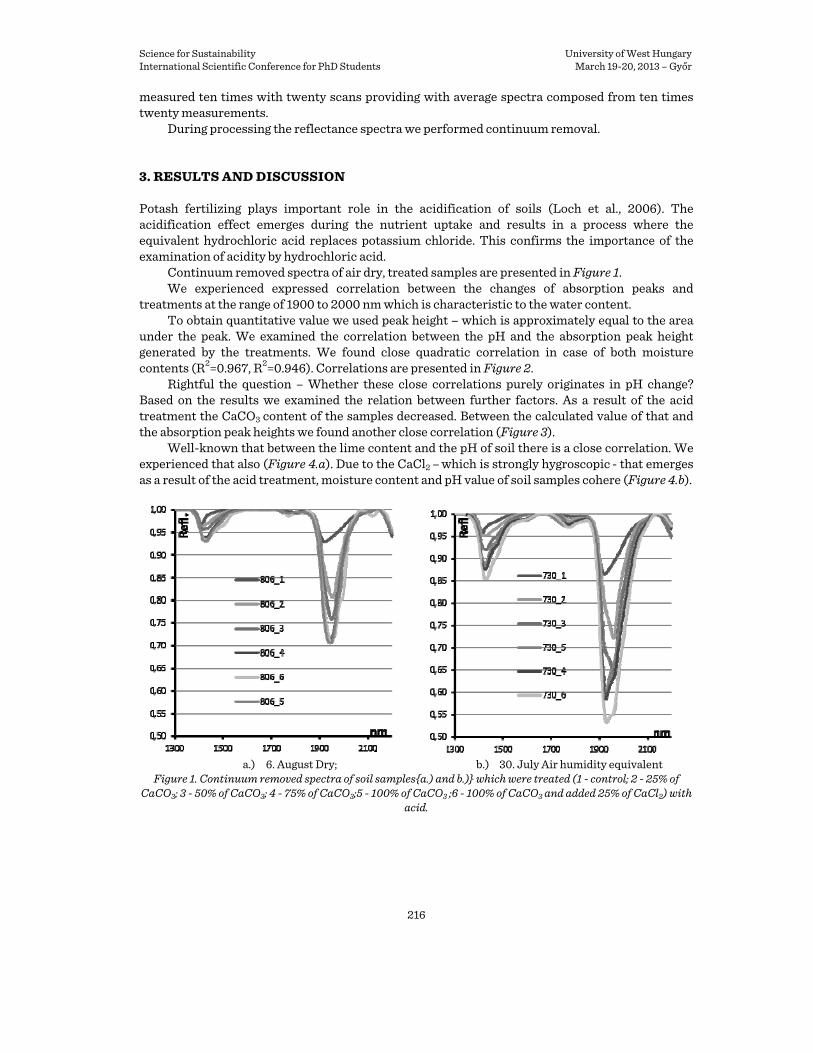
Science for Sustainability University of West Hungary International Scientific Conference for PhD Students March 19-20, 2013 – Győr
216
measured ten times with twenty scans providing with average spectra composed from ten times twenty measurements.
During processing the reflectance spectra we performed continuum removal.
3. RESULTS AND DISCUSSION
Potash fertilizing plays important role in the acidification of soils (Loch et al., 2006). The acidification effect emerges during the nutrient uptake and results in a process where the equivalent hydrochloric acid replaces potassium chloride. This confirms the importance of the examination of acidity by hydrochloric acid.
Continuum removed spectra of air dry, treated samples are presented in Figure 1. We experienced expressed correlation between the changes of absorption peaks and
treatments at the range of 1900 to 2000 nm which is characteristic to the water content. To obtain quantitative value we used peak height – which is approximately equal to the area
under the peak. We examined the correlation between the pH and the absorption peak height generated by the treatments. We found close quadratic correlation in case of both moisture contents (R2=0.967, R2=0.946). Correlations are presented in Figure 2.
Rightful the question – Whether these close correlations purely originates in pH change? Based on the results we examined the relation between further factors. As a result of the acid treatment the CaCO3 content of the samples decreased. Between the calculated value of that and the absorption peak heights we found another close correlation (Figure 3).
Well-known that between the lime content and the pH of soil there is a close correlation. We experienced that also (Figure 4.a). Due to the CaCl2 – which is strongly hygroscopic - that emerges as a result of the acid treatment, moisture content and pH value of soil samples cohere (Figure 4.b).
a.) 6. August Dry; b.) 30. July Air humidity equivalent
Figure 1. Continuum removed spectra of soil samples{a.) and b.)} which were treated (1 - control; 2 - 25% of CaCO3; 3 - 50% of CaCO3; 4 - 75% of CaCO3;5 - 100% of CaCO3 ;6 - 100% of CaCO3 and added 25% of CaCl2) with
acid.
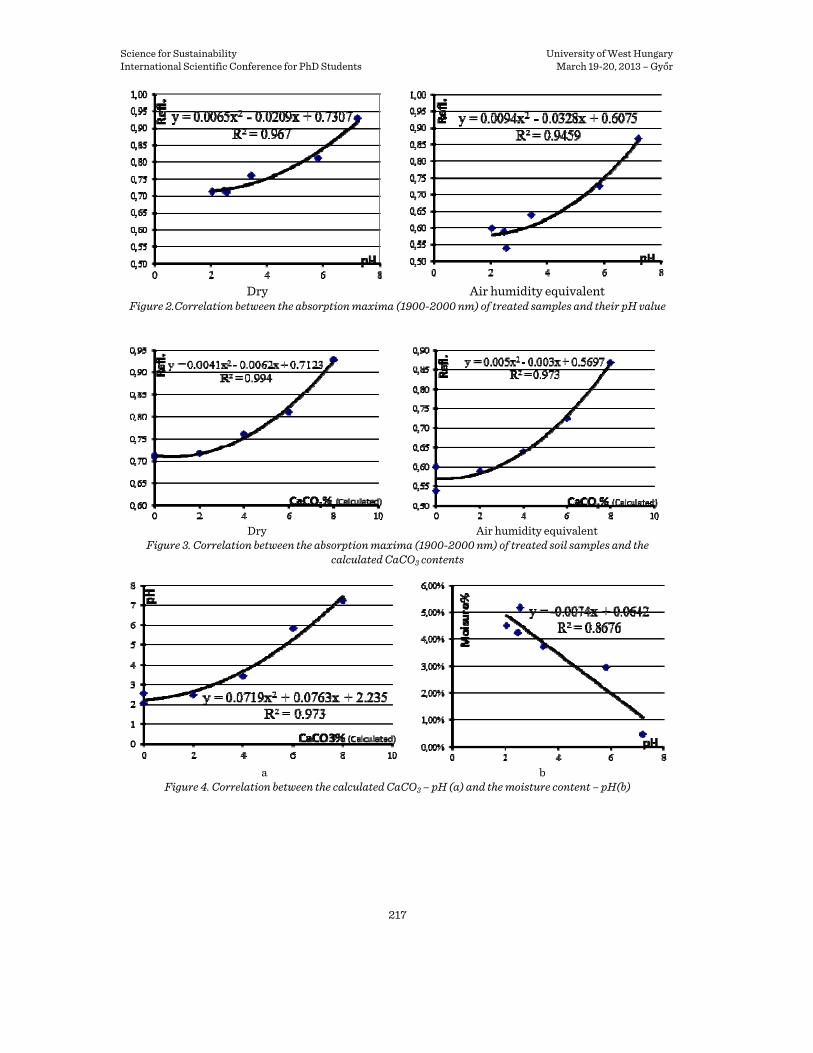
Science for Sustainability University of West Hungary International Scientific Conference for PhD Students March 19-20, 2013 – Győr
217
Dry Air humidity equivalent
Figure 2.Correlation between the absorption maxima (1900-2000 nm) of treated samples and their pH value
Dry Air humidity equivalent
Figure 3. Correlation between the absorption maxima (1900-2000 nm) of treated soil samples and the calculated CaCO3 contents
a b Figure 4. Correlation between the calculated CaCO3 – pH (a) and the moisture content – pH(b)

Science for Sustainability University of West Hungary International Scientific Conference for PhD Students March 19-20, 2013 – Győr
218
4. CONCLUSIONS
Correlation between the pH value of soil and the absorption peak in wavelength range of 1900 to 2000 nm is likely to be the result of more factors which are also in relation with pH value and NIR absorption.
Acknowledgements: Study was financed by the “Talentum Project” TÁMOP 4.2.2/B – 10/1 – 2010 -0018. Spectral measurements were carried out in the Hungarian Institute of Agricultural Engineering. Authors would like to thank for professional help of Gábor Milics, PhD Attila J. Kovács, PhD and Mihály Szűcs PhD.
References BUZÁS I. (1988): Talaj és agrokémiai vizsgálati módszerkönyv 2. Mezőgazdasági Kiadó, Budapest, 244 p. CHANG, C. W. – LAIRD, D. A. – MAUSBACH, M. J. – HURBURGH, C. R. (2001): Near-infrared reflectance
spectroscopy-principal components regression analyses of soil properties. Soil Sci. Soc. Am. J. 65, 480–490.
CHANG, G. W. – LAIRD, D. A. – HURBURGH, G. R. (2005): Influence of soil moisture on near-infrared reflectance spectroscopic measurement of soil properties. Soil Sci. 170, 244–255.
CZINKOTA I. – FILEP GY. – RÉKÁSI M. – CZANIK P. (2002): An Equipment and Software for Improved estimations of Soil Acidity. Agrokémia és Talajtan. 51: 63-73.
HUSTI I. (2006): The main elements of sustainable food chain management. Cereal Research Communications, 34: 793-797.
KARDEVÁN P. – RÓTH L. – VEKERDY Z. (2000): Terepi spektroradiométeres mérések a 2000. márciusi, bányászati tevékenység okozta tiszai nehézfém szennyeződések hatásának vizsgálatára. Földtani kutatás, 2000. IV.
KARDEVÁN P. (2007): Reflectance Spectroradiometry – A New Tool For Environmental Mapping, Carpth. J. of Earth and Environmental Sciences, 2: 29–38. www.ubm.ro/sites/CJEES/upload/2007_2/Kardevan.pdf
SZALAY D. K. (2011): A terepi és laboratóriumi spektroradiometria és szerepe a légi hiperspektrális technológiában. XVI Fiatal Műszakiak Tudományos Ülésszaka, Kolozsvár, Románia, 305-308 pp.
LOCH J. – TERBE I. – VÁGÓ I. (2006): Potassium fertilisation on field and in the horticulture. In Hungarian. International Potash Institute, Horgen. 1-75. pp
MILICS G. – NAGY V. – ŠTEKAUEROVÁ, V. (2004): GIS applications for groundwater and soil moisture data presentations. - 12. Posterový deň s medzinárodnou účasťou a Deň otvorených dverí na UH SAV. Transport vody, chemikálií a energie v systéme pôda-rastlina-atmosféra, 25. november 2004, Ústav hydrológie SAV, Račianska 75, Bratislava, Slovenská Republika, Konferenčné CD, ISBN 80-89139-05-1
NEMÉNYI M. – MILICS G. – MESTERHÁZI P. Á. (2008): The role of the frequency of soil parameter database collection with special regard to on-line soil compaction measurment. In: FORMATO, Andrea: Advence in Soil & Tillage Research. pp. 125-140. ISBN 978-81-7895-353-3
SEILERA, B. – KNEUBÜHLERA, M. – WOLFGRAMMB, B. – ITTENA, K. I. (2007): Quantitative Assessment Of Soil Parameters In Western Tajikistan Using A Soil Spectral Library Approach - 10th International Symposium on Physical Measurements and Signatures in Remote Sensing (ISPMSRS’07) Davos, Switzerland 12 – 14 March 2007
SIMON B. – TOLNER L. – RÉKÁSI M. – MICHELI E. (2006) : Soil acidity investigation by potentiometric titrations. Cereal Research Communications, 34: 283-286.
TOLNER I.T. – TOLNER L. – MILICS G. – DEÁKVÁRI J. – FENYVESI L. – NEMÉNYI M. (2012): Talaj Ph meghatározás hiperspektrális módszerekkel. Óvári Tudományos Napok, Mosonmagyaróvár, 2012.10.05.
TOLNER L. – VÁGO I. – CZINKOTA I. – RÉKÁSI M. – KOVÁCS Z. (2008): Field testing of new, more efficient liming method. Cereal Res. Commun. 36: 543 - 543.
VÁGÓ I. – CZINKOTA I. – RÉKÁSI M. – SIPOS M. – KOVÁCS A. – TOLNER L. (2010): Development of a new, more adequate method for the determination of soil acidity. Natural and artifical ecosystems in the Somes - Cris - Mures - Tisa river basin. International Conference, Arad, 2010.05.07-08. Studia Universitas "Vasile Goldis", Seria Sintele Vietii Vol. 20, issue 3, 2010, pp. 77-80.
VÁGÓ I. – TOLNER L. – EICHLER-LÖBERMANN B. – CZINKOTA I. – KOVÁCS B. (2008): Long-term effects of liming on the dry matter production and chemical composition of perennial ryegrass (Lolium perenne L.). Cereal Res. Commun. 36: 103 - 106.

Science for Sustainability University of West Hungary International Scientific Conference for PhD Students March 19-20, 2013 – Győr
219
VÁRALLYAY GY. (2006): Life quality - soil - food chain. Cereal Research Communications. 34: 335-339. VÁRALLYAY GY. – SZŐCS L. – MURÁNYI A. – RAJKAI K. – ZILAHY P. (1980): Map of soil factors determining the
agro-ecological potential of Hungary (1:100 000) II. (in Hungarian). Agrokémia és Talajtan. 29: 35-76.
Improvement of Decision Support Models in a Site-specific Precision Plant Production System
NYÉKI Anikó* – MILICS Gábor – KOVÁCS Attila József – NEMÉNYI Miklós
University of West Hungary, Faculty of Agricultural and Food Sciences, Institute of Biosystems Engineering, *E-mail: [email protected]; H-9200, Mosomagyaróvár, Vár 2.
Abstract – In this study we tested how the DSSAT and the ProPlanta decision support models can be used for creating the nutrient replenishment plans in a precision site-specific plant production system, with special regards to the site-specific yield prediction. We have investigated the available data from the last twelve years with the aim of inclusion further parameters in the models in order to improve their accuracy. The study summarizes the results of the latest research programs and the application of such results should improve the accuracy of the models.
Keywords: decision support models / soil electrical conductivity / nutrient replenishment / soil compaction / maize yield
1. INTRODUCTION
The general aim of the paper is to give a review of the research activities of Institute of Biosystems Engineering concerning the investigation of the impact of soil physical and chemical parameters on the site-specific crop production technologies. We stated that the differences between simulated and measured yields related and averaged to the whole research field (15.3 ha) was relatively good in 2010 (by DSSAT predicted-measured yield: 0.66 t ha-1 average difference, by ProPlanta -0.09 t ha-1 average), at the same time the differences between the measured and predicted yields were not acceptable in the practice in 2011 (by DSSAT predicted-measured yield: -1.8 t ha-1, by ProPlanta -2.44 t ha-1 difference).
Research projects started in 2001 aimed to investigate the connection between soil compaction and yield in the field level. The research field (University of West Hungary, Faculty of Agricultural and Food Sciences, K2XEW-8-08 MEPAR code) is divided into 63 treatment units (each unit is ~0.25 ha). The determination of the size of the treatment units is described by MESTERHÁZI (2003).
2. MATERIALS AND METHODS
2.1. Mapping yield, soil physical and chemical parameters
“Yield monitoring was conducted yearly from 2001 using an Agrocom ACT system installed in a Deutz Fahr M 35·80 combine harvester (NEMÉNYI and MESTERHÁZI 2006).”
The harvested plants were maize in 2001, 2002, 2005, 2006, 2008, 2010 and 2011.

Science for Sustainability University of West Hungary International Scientific Conference for PhD Students March 19-20, 2013 – Győr
220
Continuous soil tillage force measurement In 2003, 2005 and 2009 horizontal tillage draught force was measured by mechanical methods. “The tool was developed in order to obtain site-specific information on the compaction state and tillage energy demand of the field. The system is based on the electro-hydraulic system (EHS) of a Steyr 9078/A tractor. Load cells are installed in the EHS, which provide electric signals pro rata with the forces affecting the hydraulic system. The hydraulic system was loaded with different forces exerted by a hydraulic lever, which was fixed on a stand in horizontal position. The induced voltages of the internal load cells were measured using a data acquisition board and a portable computer. Simultaneously, the signal of a strain-gauged external load cell installed between the lever and the drawbar of the tractor was measured (NEMÉNYI and MESTERHÁZI 2006).”
Soil electrical conductivity measurements were carried out in 2009, 2011 and 2012 by Veris-3100 instrument (LUND et al).
“The soil nutrient supply properties of the studied upper 25 cm layer were mapped based on a 50 m by 50 m grid dividing the field into 63 treatment units. Each unit was described with a bulk sample obtained by the mixing of single samples. Samples were collected in every 5 m following the diagonals of the units (NEMÉNYI and MESTERHÁZI 2006).”
2.2. Investigated advisory models: ProPlanta and DSSAT
The ProPlanta advisory model (Fertilizer Advisory Model developed by the Research Institute for Soil Science and Agricultural Chemistry and the Research Institute for Agronomy of the Hungarian Academy of Sciences /RISSAC HAS and RIA HAS/) is based on forty years fertilizer replenishment and lime distribution field experiments in the Carpathian basin. The quantity of chemical fertilizer obtained by ProPlanta is based first of all on results of soil sampling (CSATHÓ et al. 1998, NEMÉNYI et al. 2003, NEMÉNYI and MILICS 2006). The current version of Decision Support System for Agrotechnology (DSSAT), ver. 4.5, the Ceres Maize model simulates the plant growth, biomass production, physiological processes, photosynthesis, respiration, leaf area index, root weight, … etc (HOOGENBOOM et al. 2003, 2010). The DSSAT model inputs contain daily meteorological, soil, experiment, management and phenological phase’s database, as well.
ProPlanta fertilizer advisory model require the following data (CSATHÓ et al. 1998, NEMÉNYI and MESTERHÁZI 2006, NEMÉNYI and MILICS 2006, NEMÉNYI et al., 2008):
The basic philosophy of the applied in the frame of the trials is as follows: efforts for economic level; the aim is “plant nutrition”; to achieve and sustain moderate soil PK supply; slow soil PK build-up; PK fertilisation of the rotation; PK fertilisation only at moderate or poor soil supply levels; lower limit values for soil nutrient supply categories; lower specific crop nutrient contents; specific crop nutrient contents dependent of the planned yield level (nutrient dilution-effect in crops); mineral soil N-content is taken into consideration only in the case of the most important crops.
The system takes into account the followings: plant type; planned yield (t/ha); the way of cultivation (mono-culture or rotation); soil type, date of soil sampling; soil properties: soil constraint (KA); Humus %; CaCO3%; pHKCl; AL-P2O5 mg/kg; AL-K2O5 mg/kg; Mg KCl; EDTA – Zn; EDTA – Cu; EDTA – Mn; B ; total salt %.
Modifying factors: manure (in 3-4 years); quality, quantity t/ha, effect (1-4 years); liquid quality, quantity m3/ha, effect (1-2 years); manure (in 2 years); perennial forecrop previous liming (in 6-10 years); leguminous (in 2 years); previous Zn fertilizing (in 4-6years); forecrop type; main yield of forecrop, t/ha; secondary yield of forecrop, t/ha; destiny of Secondary yield of forecrop (ploughed under or not); harvest date of forecrop (before or after 15th September). DSSAT model is using more or less similar parameters for yield prediction; moreover it requires precipitation data in a daily basis and also requires phenology characteristics.
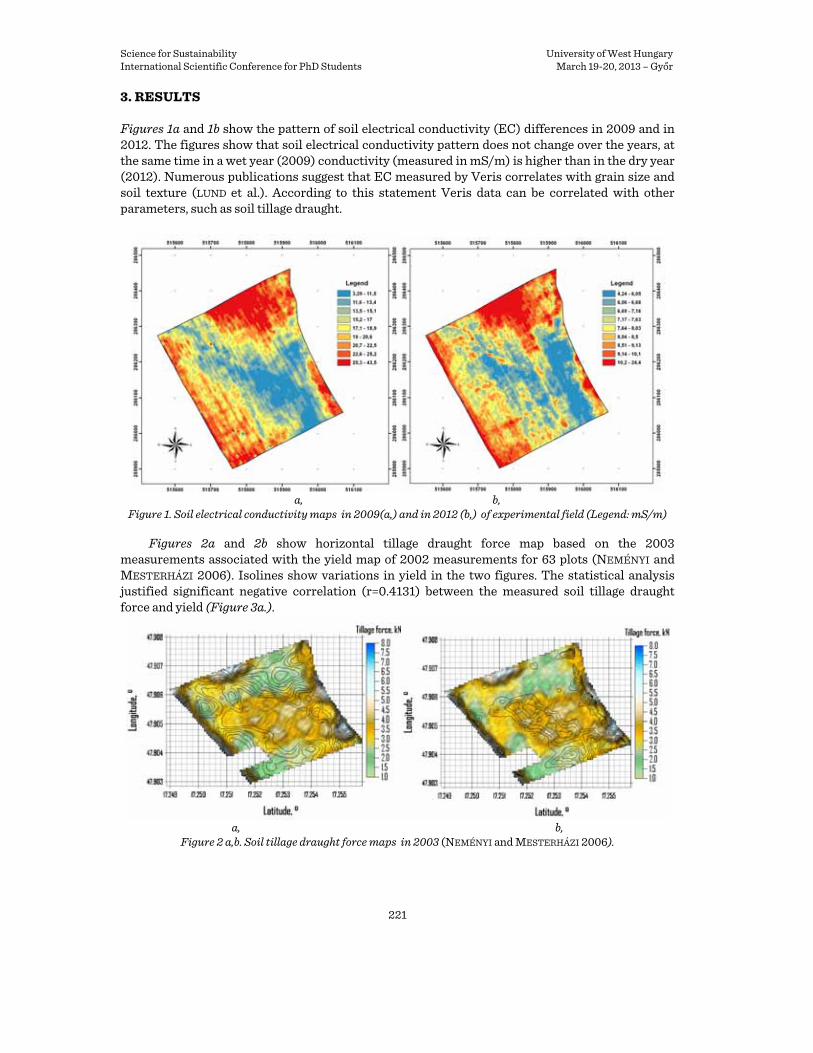
Science for Sustainability University of West Hungary International Scientific Conference for PhD Students March 19-20, 2013 – Győr
221
3. RESULTS
Figures 1a and 1b show the pattern of soil electrical conductivity (EC) differences in 2009 and in 2012. The figures show that soil electrical conductivity pattern does not change over the years, at the same time in a wet year (2009) conductivity (measured in mS/m) is higher than in the dry year (2012). Numerous publications suggest that EC measured by Veris correlates with grain size and soil texture (LUND et al.). According to this statement Veris data can be correlated with other parameters, such as soil tillage draught.
a, b,
Figure 1. Soil electrical conductivity maps in 2009(a,) and in 2012 (b,) of experimental field (Legend: mS/m)
Figures 2a and 2b show horizontal tillage draught force map based on the 2003 measurements associated with the yield map of 2002 measurements for 63 plots (NEMÉNYI and MESTERHÁZI 2006). Isolines show variations in yield in the two figures. The statistical analysis justified significant negative correlation (r=0.4131) between the measured soil tillage draught force and yield (Figure 3a.).
a, b,
Figure 2 a,b. Soil tillage draught force maps in 2003 (NEMÉNYI and MESTERHÁZI 2006).

Science for Sustainability University of West Hungary International Scientific Conference for PhD Students March 19-20, 2013 – Győr
222
The above conclusion stating that the soil physical properties basically do not change over the years is proved by Figure 3b too, where yield from 2002 and soil EC from 2009 is correlated.
y = -1,5496x + 10,747
R2 = 0,41310,00
2,00
4,00
6,00
8,00
10,00
1 2 3 4 5
kN
t ha
-1y = 2,4284x + 3,1403
R2 = 0,6652
0
10
20
30
40
2,00 4,00 6,00 8,00 10,00
t/ha
mS/
m
a, b,
Figure 3. a. Correlation between maize yield (2002) and horizontal tillage draught force (2003); b. Correlation between soil electrical conductivity (2009) and maize yield (2002)
a, b,
Figure 4a, b. Maize yield maps in 2001 (a,) and 2002 (b,) in the experimental field (t/ha).
a, b,
Figure 5. Maize yield maps in 2005 (a,) and 2011 (b,) in the experimental field (t/ha).

Science for Sustainability University of West Hungary International Scientific Conference for PhD Students March 19-20, 2013 – Győr
223
Figures 4 a and 4b illustrate that ProPlanta decision support model aimed to utilize the full potential of the soil taking environmental protection also into consideration. Later we changed our philosophy for trying to homogenize yield.
In 2005 similar pattern to the earlier tendencies appeared (Figure 5a), however by 2011 (Figure 5b) the agro-ecological system has changed for homogenous yield values.
4. CONCLUSIONS
We can conclude that decision support models used nowadays are not provide the necessary accuracy for the practice. Unfortunatelly this is also true for the modelling in a whole field scale. At the same time in the field level the accuracy is expected to improve in case we do not aim to homogenize the yield, but we pursue to the optimization of nutrient replenishment within the treatment units. On the other hand research shows that nutrient replenisment or soil treatment models have to be applied for homogenous or near homogenous units. We have to emphasize that based on the experiments, effect of soil compaction has to be further investigated. Acknowledgements: We wish to thank “TALENTUM PROJECT” TÁMOP 4. 2. 2. B – 10/1 – 2010 – 0018. This research was supported by the TÁMOP-4.2.1/B and 15346/100/42 and TÁMOP-4.2.2.A-11/1/KONV-2012-0013 EU projects. The authors also thank associate professor Zoltán Varga, PhD for providing the meteorological database of the Meteorological Station of the Faculty of Agricultural and Food Sciences, and they also thank Prof. Dr. László Fenyvesi and József Deákvári MSc (Hungarian Institute of Agricultural Engineering) for the collaboration on the measurement of soil electrical conductivity. References CSATHÓ, P. – ÁRENDÁS, T. – NÉMETH, T. (1998): New environmentally friendly fertilizer advisory system,
based on the data set of the Hungarian long-term field trials set-up between 1960 and 1995. Commun. Soil Sci. Plant Anal. 29 (11-14), 2161-2174.
HOOGENBOOM, G. – JONES, J. W. – PORTER, C. H. – WILKENS, P. W. – BOOTE, K. J. – BATCHELOR, W. D. – HUNT, L. A. – TSUJI, G. Y. (2003): Decision Support System for Agrotechnology Transfer (DSSAT) Version 4.0, volume 1. Overview. University of Hawaii, Honolulu.
HOOGENBOOM, G. – JONES, J. W. – PORTER, C. H. – WILKENS, P. W. – BOOTE, K. J. – HUNT, L. A. – TSUJI, G. Y. (2010): Decision Support System for Agrotechnology Tranfer (DSSAT) Version 4.5 (CD-ROM), volume 1. Overview. University of Hawaii, Honolulu.
LUND, E. D. – CHRISTY, C. D. – DRUMMOND, P. E.: Practical applications of soil electrical conductivity. Veris Technologies, 601 N. Broadway, Salina Kansas 67401, USA. http://www.veristech.com/pdf_files/ europe_1999.pdf
MESTERHÁZI, P. Á. 2003. Development of measurement technique for GPS-aided plant production. PhD Theses. Supervisor: Prof. Dr. Miklós Neményi. University of West Hungary, Mosonmagyaróvár.
NEMÉNYI, M. – MESTERHÁZI, P. Á. – PECZE, ZS. – STÉPÁN, ZS. (2003): The role of GIS and GPS in precision farming. Computers and Electronics in Agriculture. Vol. 40, 1-3. pp. 45-55.
NEMÉNYI, M. – MESTERHÁZI, P. Á. – MILICS, G. (2006): An Application of Tillage Force Mapping as a Cropping Management Tool. Biosystems Engineering. Vol. 94, 3, pp. 351-357.
NEMÉNYI, M. – MILICS, G. – MESTERHÁZI, P. Á. (2006): Precision – site specific crop production – possibilities on water regime control. In: Proceedings of 6th International Conference on Influence of Anthropogenic Activity of Water Regime of Lowland Territory, edited by J. Ivanko, D. Pavelková, M Gombos, A. Tall, Michalovce, Slovakia, Slovak Academy of Sciences, CD, ISBN 80-89139-09-4.
NEMÉNYI, M. – MILICS, G. – MESTERHÁZI, P. Á. (2008): The role of the frequency of soil parameter database collection with special regard to on-line soil compaction measurement. Advance in Soil and Tillage Research. In: FORMATO, A. (ed.) Advance in Soil & Tillage Research, Kerala: Transworld Research Network, pp. 125-140.

Science for Sustainability University of West Hungary International Scientific Conference for PhD Students March 19-20, 2013 – Győr
224
Investigation of Fusarium Ear Rot Symptoms on Maize (Zea Mays L.) Using a Spectroradiometer
VIRÁG István – MILICS Gábor – NEMÉNYI Miklós
Institute for Biosystem Engineering, Faculty of Agricultural and Food Sciences, University of West Hungary, 9200 Mosonmagyaróvár, Vár 2
Abstract – Ear samples of two maize genotypes (MV1 and MV2) with different levels of resistance to Fusarium ear rot were collected from artificially inoculated and non-infected plants. The spectral characteristics of the samples were analysed with an ASD Fieldspec 3 MAX™ spectroradiometer in the wavelength range of 350–2500 nm. The spectra of infected and non-infected samples could be clearly distinguished in the 880–910 nm wavelength range. Principal component analysis (PCA) was applied to detect correlations that could be used to select samples showing symptoms of infection. The principal components required for further analysis are now available and can also be used for classification Keywords: fuzarium ear rot / maize / spectroradiometer
1. INTRODUCTION
Among the pathogens attacking plants, filamentous fungus species belonging to the Fusarium genus cause particularly severe problems due to their excellent adaptability. They are to be found all over the world, and in a continental climate they are responsible for substantial quantitative and qualitative losses in cereals. Maize ears are damaged mainly by Fusarium graminearum, F. verticillioides and F. culmorum (DORN et al. 2011, GOERTZ et al. 2010), but other fungus species may also cause ear rot (SZÉCSi 1994). The control of this disease is one of the major challenges facing maize protection experts (MESTERHÁZY et al. 2012). The methods used to analyse fungal diseases on plants can be divided into two basic groups: destructive and non-destructive. Destructive methods are based on chemical analysis. Liquid and gas chromatography and spectrophotometry are exact, widely used techniques, but analysing large numbers of samples is extremely time-consuming (DRAGANOVA et al. 2010). Aspergillus flavus and other infectious fungal species have been found to have characteristic spectral traits in the infrared wavelength spectrum, which can be clearly distinguished from the spectral traits of healthy maize grains (GORDON et al. 1997). WILLIAMS et al. (2010) used principal component analysis to detect significant differences between healthy maize grains and those infected with Fusarium verticillioides. It was established by DOWELL et al. (2002) that analytical models based on reflectance spectra led to a more precise classification of maize grains infected with F. verticillioides, in terms of fumonisin content, than calculations based on transmittance spectra. A bench-top hyperspectral imaging system (VNIR-100E) was used by YAO et al. (2008) in a two-step experiment involving the selection and use of five fungal species for laboratory experiments: Penicillium chrysogenum, Fusarium moniliforme (syn.: F. verticillioides), Aspergillus parasiticus, Trichoderma viride and Aspergillus flavus. Colonies formed by the five fungi could be distinguished from each other with an accuracy of 97.7%.
2. MATHERIALS AND METHODS
A large number of maize genotypes were sown in a small-plot experiment in the pathological nursery of the Agricultural Institute (CAR-HAS) in 2011. The plants were artificially inoculated

Science for Sustainability University of West Hungary International Scientific Conference for PhD Students March 19-20, 2013 – Győr
225
with isolates of Fusarium verticillioides, F. culmorum and F. graminearum, using the toothpick method recommended by YOUNG (1943), on the 10th day after 50% silking. The main ears of the maize plants were inoculated with two replications. No artificial inoculation was performed on the control plots.
Samples were collected from non-infected and artificially inoculated plants of two maize hybrids with different levels of susceptibility to ear rot disease (MV1 and MV2). The maize ears were dried at 35°C for 24 h to achieve a moisture content of 14%. When the ears were removed from the dryer they were individually labelled and scored for ear rot severity, after which the length and weight were recorded.
In addition to these conventional measurements, the samples were also analysed at a wavelength of 350–2500 nm using an ASD Fieldspec 3 MAX™ hyperspectral device in a special light-isolated cabinet at the Agricultural Engineering Institute of the Ministry of Rural Development. The non-destructive analysis of maize ears and shelled kernels was carried out using a Plant Probe™ (ASD) sensor, which collects spectral data from an area equivalent to a circle 2 cm in diameter. The analysis of maize ears collected from the MV1 genotype will be detailed below. The three most severely infected ears were selected from each treatment on the basis of scoring results and these were used for analysis. Five measurements were first made on the point of infection and the surrounding area, followed by a further five random measurements on parts of the ear exhibiting no visible signs of infection. In the case of non-infected (control) ears, five measurements were made at randomly selected points. For each measurement point an integrated mean spectrum was recorded, based on the results of twenty readings. The white reference measurement was repeated before each sample was measured. The integration time was set at 17 ms.
3. RESULTS AND DISCUSSION
The data recorded for maize ears collected from the MV1 genotype in the course of the conventional evaluation are summarised in Table 1. It can be seen from the mean values that the weight of the ears decreased by 19.43% and the length by 7.46% after infection with the F. culmorum isolate, with a severity value of 24.58%. Inoculation with the F. verticillioides isolate resulted in low severity for this genotype. A severity of less than 5% (one or two kernels in the neighbourhood of the inoculation point) could not be unambiguously detected with the Plant Probe™ sensor, so these ears were regarded as symptomless ears in the analyses.
Table 1. Evaluation of maize ears collected from the MV1 genotype
Treatment Weight (g) Length (cm) Severity (%)
Control 99.46 16.08 0.00
F. culmorum 80.15 14.88 24.58
F. graminearum 86.42 16.30 20.00
F. verticillioides 97.10 15.50 2.00
As a first step, the raw data were converted into reflectance spectra in course of the evaluation of the hyperspectral measurements. The five measurements for each maize ear were averaged, after which the first derivatives of the mean spectra were compared.
This comparison revealed three narrow wavelength ranges (880–910, 950–980, 1130–1160 nm) where the spectra collected from the surface of samples exhibiting symptoms (dotted line) could be clearly distinguished from the mean spectra of symptomless samples (solid line). The

Science for Sustainability University of West Hungary International Scientific Conference for PhD Students March 19-20, 2013 – Győr
226
greatest difference was observed in the 880–910 nm range (Figure 1), so further analysis was performed using the reflectance values in this range.
Figure 1. The 880–910 nm wavelength range selected for the analysis
Principal component analysis was used to provide a statistical confirmation of the differences observed in the selected wavelength range, with the aim of detecting components that could be employed to distinguish between infected and non-infected lots. When entering the data required for the analysis, the mean spectra of every maize ear (comes from five measurements) within the given spectrum range were taken as a variable.
The values of the second principal component for the mean spectra are illustrated in Figure 2. The solid black dots represent data from ears exhibiting clearly visible symptoms of infection, while the open dots represent the mean spectrum data from control ears showing no signs of infection. The two types of dots clearly clustered above and below a value of –0.024 on the 2nd principal component axis.
The mean spectra of samples with or without symptoms of infection are plotted in Figure 3 in terms of the second and third principal components (p2 vs. p3). The open circles representing the mean spectra of symptomless samples can be seen to cluster together, forming a distinct group, while the mean spectra of samples exhibiting symptoms of infection are scattered over a wider area, at a distance from those of the symptomless samples.
Principal component analysis on the available data set thus revealed correlations that could be useful for distinguishing samples exhibiting symptoms of infection. It was found that the spectra collected from the surface of samples with and without symptoms of infection could be clearly distinguished in the 880–910 nm wavelength range, indicating that the measurement method described here was suitable for the separation of infected and healthy maize kernels. The principal components required for further analysis are now available and are suitable for the elaboration of further classification procedures.
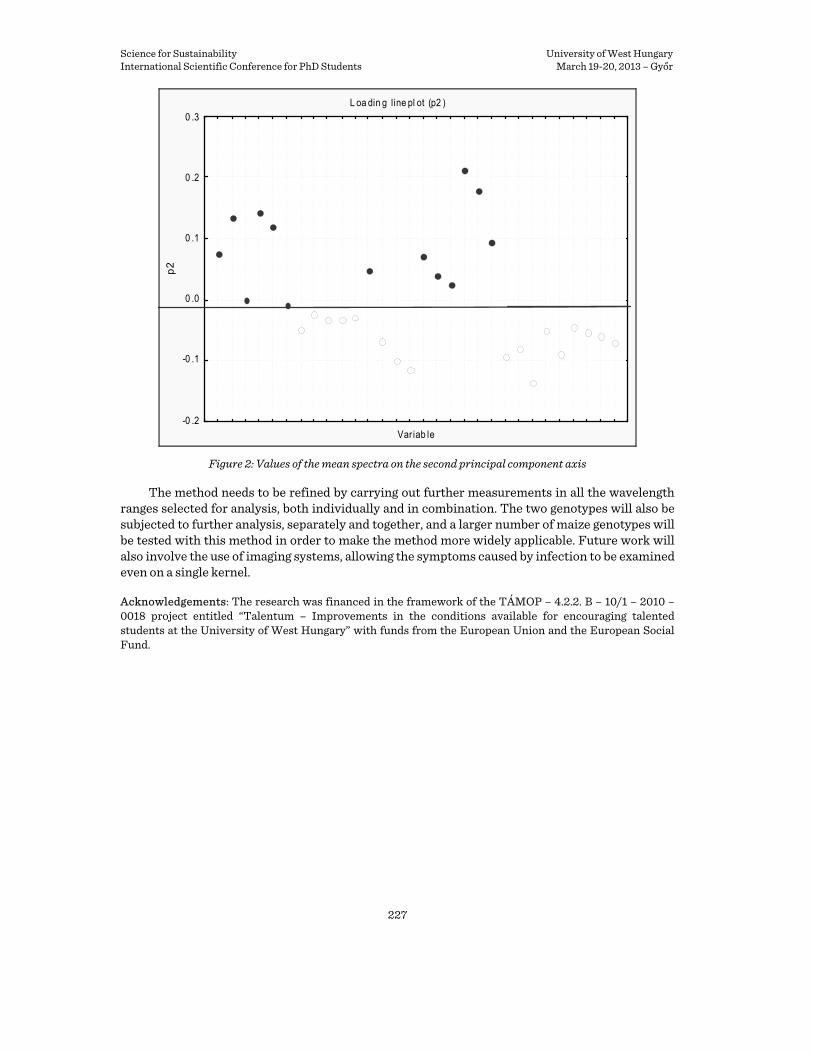
Science for Sustainability University of West Hungary International Scientific Conference for PhD Students March 19-20, 2013 – Győr
227
L oa din g line pl ot (p2 )
Var iab le-0 .2
-0 .1
0 .0
0 .1
0 .2
0 .3
p2
Figure 2: Values of the mean spectra on the second principal component axis
The method needs to be refined by carrying out further measurements in all the wavelength ranges selected for analysis, both individually and in combination. The two genotypes will also be subjected to further analysis, separately and together, and a larger number of maize genotypes will be tested with this method in order to make the method more widely applicable. Future work will also involve the use of imaging systems, allowing the symptoms caused by infection to be examined even on a single kernel. Acknowledgements: The research was financed in the framework of the TÁMOP – 4.2.2. B – 10/1 – 2010 – 0018 project entitled “Talentum – Improvements in the conditions available for encouraging talented students at the University of West Hungary” with funds from the European Union and the European Social Fund.

Science for Sustainability University of West Hungary International Scientific Conference for PhD Students March 19-20, 2013 – Győr
228
L oa din g sca tte rpl ot (p2 vs. p3 )
-0. 3 -0 .2 -0 .1 0 .0 0.1 0 .2 0 .3
p2
-0 .15
-0 .10
-0 .05
0 .00
0 .05
0 .10
0 .15
p3
Figure 3: Spectrum values on a 2nd vs. 3rd principal component plot
References DORN, B. – FORRER, H. R. – JENNY, E. – WETTSTEIN, F. E. – BUCHELI, T. D. – VOGELGSANG S. (2011): Fusarium
species complex and mycotoxins in grain maize from maize hybrid trials and from grower’s fields. J. Appl. Microbiol 111, 693–706.
DOWELL, F. E. – PEARSON, T. E. – MAGHIRANG, E. B. – XIE, F. – WICKLOW, D. T. (2002): Reflectance and transmittance spectroscopy applied to detecting fumonisin in single corn kernels infected with Fusarium verticillioides. Cereal Chem. 79, 222–226.
DRAGANOVA, T. – DASKALOV, P. – TSONEV, R. (2010): An approach for identifying of Fusarium infected maize grains by spectral analysis in the visible and near infrared region, SIMCA models, parametric and neural classifiers. Int. J. Bioautomat. 14, 119–128.
GOERTZ, A. – ZUEHLKE, S. – SPITELLER, M. – STEINER, U. – DEHNE, H. W. – WAALWIJK, C. – DE VRIES, I. – OERKE, E. (2010): Fusarium species and mycotoxin profiles on commercial maize hybrids in Germany. Eur. J. Plant Pathol. 128, 101–111.
GORDON, S. H. – SCHUDY, R. B. – WHEELER, B. C. – WICKLOW, D. T. – GREENE, R. V. (1997): Identification of Fourier transform infrared photoacoustic spectral features for detection of Aspergillus flavus infection in corn. Int. J. Food Microbiol. 35, 179–186.
MESTERHÁZY Á. – LEMMENS, M. – REID, L. M. (2012): Breeding for resistance to ear rots caused by Fusarium spp. in maize - a review. Plant Breeding 131, 1-19
SZÉCSI Á. (1994): A Liseola szekcióba tartozó fuzáriumok elõfordulása hazai kukoricakultúrákban 1991 és 1992. évben. [Occurrence of Fusarium species in the section Liseola isolated from Hungarial maize samples in 1991 and 1992.] Növényvédelem, 30, 313–318.
WILLIAMS , P. – MANLEY, M. – FOX, G. – GELADI P. (2010): Indirect detection of Fusarium verticillioides in maize (Zea mays L.) kernels by NIR hyperspectral imaging. J. Near Infrared Spec. 18, 49–58.
YAO, H. – HRUSKA, Z. – KINCAID, R. – BROWN, R. L. – CLEVELAND T. E. (2008): Differentiation of toxigenic fungi using hyperspectral imagery. Sens. & Instrumen. Food Qual. 2, 215–224.
YOUNG, H. C. (1943): The toothpick method of inoculating corn for ear and stalk rots. (Abstr.) Phytopath. 33, 16.

Science for Sustainability University of West Hungary International Scientific Conference for PhD Students March 19-20, 2013 – Győr
229
The Advantages and Disadvantages of Precision Farming
GÓR Arnold*8
1Department of Corporate Economics and Rural Development, University of Pannonica, Faculty of Georgikon, Keszthely, Hungary
Abstract – Great pressure is placed on the agriculture of the 21st century, because of two opposing principles. One is the growing demand for food in the world; the other is the protection of the environment with decreased production. A possible method to meet the requirements of both factions is precision farming. I attempt to analyze the complex economic side of precision farming, starting with the main attributes of this innovative, environmentally friendly, but expensive technology. During the research, the economic analysis of a specific precision farm was performed based on deep interviews that were carried out with qualified farmers and experts on the subject. The main objective of this paper is to summarize the advantages and disadvantages of precision farming from the managers’ point of view, in order to make the decision easier for those who intend to implement this approach.
Keywords: precision farming / investment / management
1. INTRODUCTION
My topic is the complex economic analysis of precision farming, where the central question is whether the application of a modern, innovative, environmentally-friendly, but expensive technology investment demands any requirements towards companies that wish to use it. The topic requires a complex analysis of precision technology as a complete system and a detailed analysis to present the related conditions (calls for proposals, grants, legislation, etc.). The person analyzing this topic may discover an array of problems. One is that in agriculture many actors imagine the technology in parallel with the traditional (conventional) farming, using the sub-elements of precision farming, integrated within a different shell. As a result of this process, the technology is cut into parts; its complexity is taken away, and the economic decision to invest is made only based on one sub-element (for example, savings in fertilizer, or specific use of pesticides), which takes away the main synergic advantage of the complex system. Unfortunately, literature is also divided on the concept.
The research database will be provided by the analysis of agriculture companies with specific years of experience and by deep interviews on the subject with farmers and experts. During the complex analysis of the subject, I will try to work out a unified system of criteria, in which all the advantages and disadvantages will be shown to later be economically evaluated. Ultimately, I'm searching for the answer, whether “ecological and economical” together can be viable and competitive. Unfortunately, the database is not yet ready, because it only contains 4 years of research, and in agriculture this is an extremely short period. Data is provided from previous years, too, but these were not measured by yield monitoring, and converted to yield maps. Since 2008 this data is also available.
As I presume, precision farming can contribute to a sustainable agriculture through better efficiency, even with the growing demands of the population, which means a decrease in cost and environmental effect and an increase in yield and food security together. Sustainability has an economic dimension, as it matters what kind of average yield we realize with the use of environmentally harmful and increasingly expensive agricultural inputs (pesticides, an-/organic
8 Corresponding author: [email protected]; H-8360, Department of Corporate Economics and Rural Development, Faculty of Georgikon, Keszthely, Deák Ferenc u. 16

Science for Sustainability University of West Hungary International Scientific Conference for PhD Students March 19-20, 2013 – Győr
230
fertilizer, fuel, etc.). The good master's care can now also cover workflows refined by precision technologies, which can reduce the environmental impacts (erosion, deflation) and improve the water management of the area, which contributes to the decrease of yield risks and survival of topsoil.
The domestic and international consumer trends and EU grant system also demands the reduction of negative environmental impacts of agriculture and therefore from the more conventional technologies, we have to turn to a more up-to-date, cost-effective and environmentally friendly system. Furthermore, it should also not be forgotten that in agriculture and specifically in arable crop production it is only partly possible to take the interests of consumers into account. Our agriculture is increasingly limited to the production of raw materials, and thus creates a low added value. Sector characteristics make the traceability of innovation difficult, which also influences the dependence of economic results generated by any increase or decrease in yield from the field of research and development. This could mean one of the main reasons why the majority of farmers' willingness to innovation is undetectable. We should add the lack of vision to this.
The primary objective of this paper is to summarize the main attributes of precision farming, because as I see it, some are misinterpreted, and higher evaluated than they should be, while some characteristics are not so brightly discussed in literature as they deserve.
2. PRECISION AGRICULTURE
Based on the literature of precision technologies it is a complex system approach, which, based on the latest innovations of technology and the theories applied to it, creates the optimal relationship between inputs, yield and quality with the site specific management adjustment. It is important to note that this complex approach should be realized on the level of management. There are basically different expense items and cost-levels are shown with the introduction of this technology. We should also differentiate between precision farming, agriculture and technology. While technology is a set of items based on the informational, computational, engineering and technical advancement, a set of technological innovation; the difference between the former two is visualized by AUERNHAMMER (2002) on Figure 1.
As we can see precision farming is a subcategory of precision agriculture, together with animal based branches. This categorization is created from an engineer’s point of view, but still summarizes the management aspect, too, by taking the issue of planning, organizing and leading into account.
According to Takács-György, who takes the meaning of numerous experts into consideration, precision farming is a holistic system, a technology that allows target oriented treatments, thus managing the spatial and temporal variability within an ecosystem, by applying spot treatment applications. (TAKÁCS-GYÖRGY, LENCSÉS, & TAKÁCS 2012) I doubt that precision farming is a technology; it is rather a set of innovative items, equipment and most importantly a methodology that can be formed together by the management to create a different, less polluting, more efficient technological plan. As we will see later, the innovative point of view of managers and their dedication towards this farming method is more important than the actual technology that is constantly in change.
After the short introduction to precision farming, we should elaborate on the topic of management attitudes of Hungarian farmers toward precision farming, to see what the factors are that hinder the application of this set of technology.
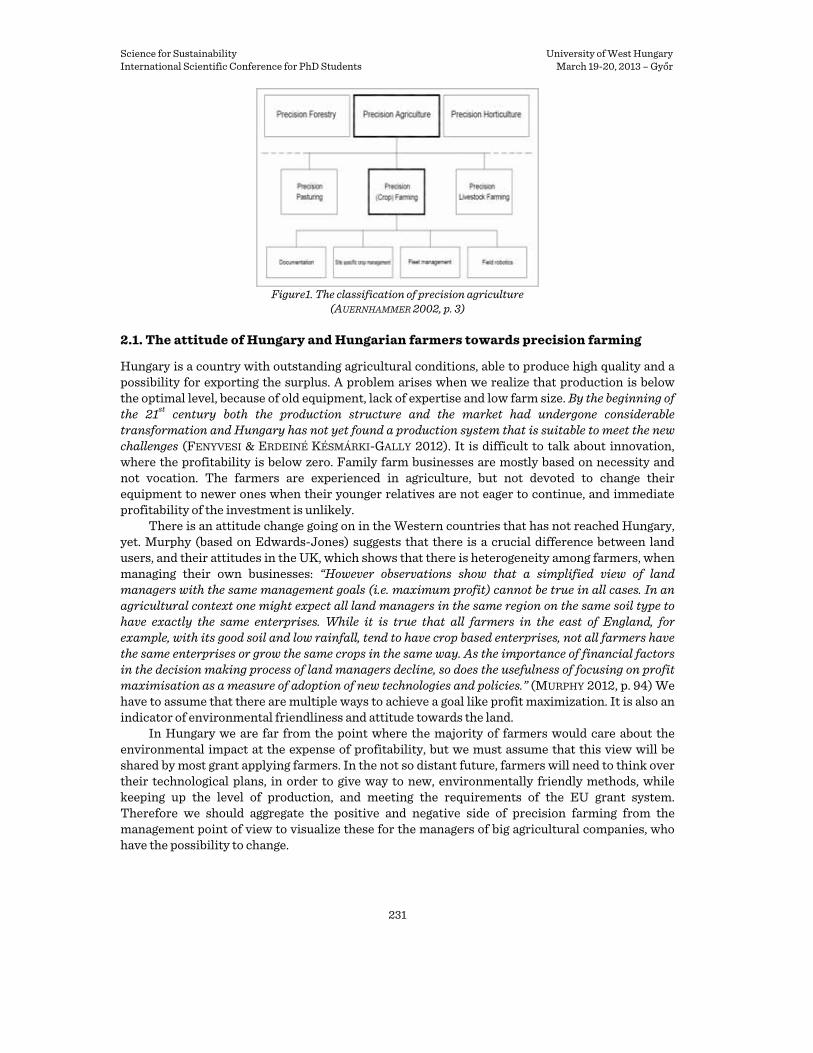
Science for Sustainability University of West Hungary International Scientific Conference for PhD Students March 19-20, 2013 – Győr
231
Figure1. The classification of precision agriculture
(AUERNHAMMER 2002, p. 3)
2.1. The attitude of Hungary and Hungarian farmers towards precision farming
Hungary is a country with outstanding agricultural conditions, able to produce high quality and a possibility for exporting the surplus. A problem arises when we realize that production is below the optimal level, because of old equipment, lack of expertise and low farm size. By the beginning of the 21st century both the production structure and the market had undergone considerable transformation and Hungary has not yet found a production system that is suitable to meet the new challenges (FENYVESI & ERDEINÉ KÉSMÁRKI-GALLY 2012). It is difficult to talk about innovation, where the profitability is below zero. Family farm businesses are mostly based on necessity and not vocation. The farmers are experienced in agriculture, but not devoted to change their equipment to newer ones when their younger relatives are not eager to continue, and immediate profitability of the investment is unlikely.
There is an attitude change going on in the Western countries that has not reached Hungary, yet. Murphy (based on Edwards-Jones) suggests that there is a crucial difference between land users, and their attitudes in the UK, which shows that there is heterogeneity among farmers, when managing their own businesses: “However observations show that a simplified view of land managers with the same management goals (i.e. maximum profit) cannot be true in all cases. In an agricultural context one might expect all land managers in the same region on the same soil type to have exactly the same enterprises. While it is true that all farmers in the east of England, for example, with its good soil and low rainfall, tend to have crop based enterprises, not all farmers have the same enterprises or grow the same crops in the same way. As the importance of financial factors in the decision making process of land managers decline, so does the usefulness of focusing on profit maximisation as a measure of adoption of new technologies and policies.” (MURPHY 2012, p. 94) We have to assume that there are multiple ways to achieve a goal like profit maximization. It is also an indicator of environmental friendliness and attitude towards the land.
In Hungary we are far from the point where the majority of farmers would care about the environmental impact at the expense of profitability, but we must assume that this view will be shared by most grant applying farmers. In the not so distant future, farmers will need to think over their technological plans, in order to give way to new, environmentally friendly methods, while keeping up the level of production, and meeting the requirements of the EU grant system. Therefore we should aggregate the positive and negative side of precision farming from the management point of view to visualize these for the managers of big agricultural companies, who have the possibility to change.

Science for Sustainability University of West Hungary International Scientific Conference for PhD Students March 19-20, 2013 – Győr
232
2.2. The advantages of precision farming
In this section we list all the possibilities from which the farmers can benefit, when turning to this technology. At first, let me refer to TAMÁS (2011, p. 6), where some of the advantages opposite to conventional farming are clearly identified, which I complement with my own ideas.
• Production site and not the field is an organizational unit, which means heterogeneity within can be defined and managed.
• Variable machine operation, which can decrease input usage, and trampling damage. • Unified crops, which leads to homogeneous blocks. This may lead to unnecessary
treatments, for example a weed-free block, where no pesticide treatment is needed. We should also not forget that with the use of precision technologies less time is required to
finish the work on the field, which, together with the automatized wheeling, optimizes the vehicle usage. This frees some human resource, which may be used elsewhere, not to mention the elimination of human mistakes. Most importantly from the management point of view, this technology provides information about the fields, yields (yield maps), which make the decision making more certain while decreasing risk. The paper has already mentioned the environmentally friendly nature of this technology, which will be important later on in the agriculture of the EU. The use of GPS technology will increase the quality of soil cultivation, giving a perfect basis for plant development. A farmer told me that he uses this technology “in order to give the plant everything it desires.” This means he eliminates every negative factor except for the weather, but as he mentioned “a plant given everything will be more tolerant to weather stress effects, too.” Precision farming and the management approach should appear at every level of production, from sowing to post-harvest control, which may support the next year’s planning. In the next chapter I try to list a few falsely interpreted characteristics of precision farming.
2.3. False assumptions about precision farming
We should take the false assumptions into consideration that are associated with precision farming. Takács analyzes the economic side of precision farming by stating that it could result in less agrochemical being distributed in the environment, and it also could be one of the basic pillars of efficient agriculture while large-scale production structure, investments, organizational structures and operational mechanisms remain. Earlier studies estimated 20-60 per cent pesticide savings owing to precision plant protection and 0-30 per cent savings in fertilizer use depending on the yield homogeneity. Also, for the producer this method of farming can be a tool for reducing the risks associated with production. (Takács-György, Lencsés, & Takács, 2012) Though, I highly agree with the notion of saving on input materials with the implementation of this approach, I assume that the primary objective is to give the plant everything while spending the same. I share the opinion of Reisinger on the issue who analyzes online and offline methods for fertilizer distribution: The farmers may choose from two types of solutions; they take leaf samples from different green plants and determine the N content in a laboratory and then the required dose. This is a long and expensive procedure. The other solution is to calibrate the sensor on the field and according to previous empirical values they determine the N dose to the different green shades. The point is that the aim is not to achieve N fertilizer savings, but a better allocation on the field. (REISINGER 2012, p. 7) It is therefore more common that the farmers decide what dose they use on the field, and let technology (according to NDVI index /green shade) allocate the input material of each plant. This can mean some cost savings, but more importantly the plant receives the required dose, the fertilizer reaches the target and nothing goes to waste. In Hungary, the NPK active ingredient value pro hectare is below 100 kg, so we already save on input materials. The problem is that we do it too recklessly.
The same is true for seeds. We mustn’t go under the minimal, or optimal number, otherwise we may face a big loss in yield. Thus, we can use the scarce inputs, and allocate them to reach

Science for Sustainability University of West Hungary International Scientific Conference for PhD Students March 19-20, 2013 – Győr
233
maximum yield instead, with the use of this technology. Where the soil is weak, we sow less, where we have better soil we use the surplus and plant more. This also leads to higher yields, with the same cost level; therefore a more efficient system is created.
The other is that precision agriculture can mean a huge decrease in pesticide input. The theory suggests that we can reach a maximum of 100% saving in pesticide, when not using, what otherwise was a bad habit. (For example in a big company, the management automatically sprays the fields without checking whether it is necessary, or not) In this case, it is not technology that may bring relief to the companies, but a throughout examination of actions in the technological plan, and a reevaluation of inefficient methods. Even in big organizations, the work of an otherwise inactive man, who goes out on the field and determines the parts, which require action, may result in a huge saving in pesticide use. The study of the weeds and the intervention can be obtained shortly, as a manager stated “it does not take to be a plant protection expert to recognize the 10 most commonly occurring weed types”. If the company is able to half the fields applied with pesticides, it is already a huge saving.
2.4. The negative side of precision farming
After the short summary of positive and partly positive effects, we must list the negative effects of precision farming. It is a very expensive investment, which returns slowly with low profitability rates of agriculture in Hungary. The high amortization rate and the maximal use of capacity require big farm size, which is specific only to agricultural companies in Hungary. The use of precision technology raises new cost types, which worsens the return on the investment index. These include the cost of the GPS signal, the price of a consultant, the regular (every 4 years) occurring soil analysis and maybe aerial footage of the field.
In Hungary, but even in other more developed countries (see REICHARDT - JÜRGENS 2009 for further information about the German situation) the innovation is not taught in schools, and even teachers are sceptical about it. In the beginning it was mentioned that agriculture can not take the interest of the consumers into account, therefore the products created at the end of the more environmentally friendly process are based on precision technology, though a higher added value has been created, it cannot be sold for a higher price. In Japan a branding process takes place (in horticulture) for the marketing processes of precision agriculture. Products with the logo of precision agriculture appear on the shelves for a higher price, which Shibusawa calls ’Farmarketing’. It seems that given the required information about the process, consumers are willing to pay more for the products in question (SHIBUSAWA 2004, p. 300). This could mean a huge boost for the implementation of this technology in Hungary.
3. SUMMARY
This paper attempted to summarize the advantages and disadvantages of precision farming with a special view on management. I think that precision farming is not a complex set of technological items, but rather a method to optimize performance, overcome heterogeneity. This not always means actual savings, like in fuel and time, but can also mean better allocation within field, which does not have an immediate effect on production. As I experienced during the interviews, farmers with a precision farming management approach think in advance, and do not expect an immediate profit from the investment, but rather relate to it as a way to fulfill their vision, which is absent in the majority of agricultural companies in Hungary.

Science for Sustainability University of West Hungary International Scientific Conference for PhD Students March 19-20, 2013 – Győr
234
References ADRIAN, A. M. – NORWOOD, S. H. – MASK, P. L. (2005): Producers' perceptions and attitudes toward precision
agriculture technologies. Computers and Electronics in Agriculture(48), 256-271. AUERNHAMMER, H. (2002): The Role of Mechatronics in Crop Product Traceability. Agricultural Engineering
International: the CIGR Journal of Scientific Research and Development., IV., pp. 1- 21. EDWARD-JONES, G. (2006): Modelling farmer decision making: concepts progress and challenges. Animal
Science, 82, pp. 783-790. FENYVESI L. – ERDEINÉ KÉSMÁRKI-GALLY S. (2012): Boosting the competitiveness of agricultural production in
Hungary through an innovation system. Studies in Agricultural Economics. KSH (2012): Magyarország mezőgazdasága 2010 Általános mezőgazdasági összeírás. Budapest. MURPHY, J. (2012): The contribution of facilitated group learning to supporting innovation amongst farmers.
Studies in Agricultural Economics, pp. 93-98. REICHARDT, M.-J. C. (2009): Adoption and future perspective of precision farming in Germany: results of
several surveys among different agricultural target groups. Precision agriculture, 73-94. REISINGER P. (2012): A precíziós növénytermesztés hazai helyzete, eddig elért fejlesztési eredmények és
perspektívák. Magyar Gyomkutatás és Technológia, XIII. volume(1.), 1-17. SHIBUSAWA, S. (2004): Paradigm of value-driven and community-based precision farming. Int. J. Agricultural
Resources, Governance and Ecology, III.(3-4), 299-309. TAKÁCS-GYÖRGY K. – LENCSÉS E. – TAKÁCS I. (2012): Economic benefits of precision weed control and why its
uptake is so low. Studies in Agricultural Economics. TAKÁCSNÉ K. G. (2011): A precíziós növénytermelés közgazdasági összefüggései. Budapest: Szaktudás Kiadó
Ház. TAMÁS J. (2011): Precision agriculture. Debrecen: Debreceni Egyetem. Agrár- és Gazdálkodástudományok
Centruma.
The Effect of Different Production Area and NPK Fertilizer on Ca and Mg Content of Winter Wheat
(Triticum aestivum L.) Grains
BURJÁN Zitaa* – GYŐRI Zoltánb aInstitute of Food Science, Quality Assurance and Microbiology Centre for Agricultural and
Applied Economic Sciences, University of Debrecen, Debrecen, Hungary bFaculty of Economic and Social Sciences, Institution of Regional Economics and Rural Development,
Szent István University, Gödöllő, Hungary Abstract – In this study the effect of different growing places and high NPK dose on the content of Ca and Mg were investigated in the grains of winter wheat. Samples were collected from five experimental stations of the Hungarian national long-term fertilization trials: Bicsérd, Iregszemcse, Karcag, Nagyhörcsök and Putnok. Tested samples were derived both from plots withouth fertilization and from plots which were treated with 250 kg/ha N, 200 kg/ha P and 200 kg/ha K. The elements content of samples were measured with inductively coupled plasma optical emission spectrometer (ICP-OES) following the digestion with HNO3-H2O2 solution. All data were subjected to ANOVA method, but after detection of significant differences (P<0.05) data were subjected to Duncan’s test to allow separation of means. The Ca and Mg content were mostly determined by the production areas. Ca and Mg content of the treated samples were found higher than the element content of the untreated grains.
Keywords: calcium / magnesium / cereal crops / fertiliser treatments
* Corresponding author: [email protected], H-4032, Debrecen, Böszörményi street 138.

Science for Sustainability University of West Hungary International Scientific Conference for PhD Students March 19-20, 2013 – Győr
235
1. INTRODUCTION
In this study the effect of different growing places and high NPK dose on the content of Ca and Mg were investigated in winter wheat grains. Calcium and magnesium are essential elements for human beings. Magnesium has been identified as cofactor in more than 300 enzymatic reactions related to the corporal metabolism (ARANDA – LLOPIS 1993). Calcium has mainly a structural function in bones and teeth. Calcium metabolism could have role in the control of blood pressure. Magnesium and calcium deficiency can also lead to different deficiency symptoms and diseases (JODRAL-SEGADO et al. 2003).
Cereal crops are important source of mineral elements for human beings (GUPTA et al. 1999). Winter wheat has a dominant role of Hungarian crop production. Its production area varies from 1.0 to 1.2 million hectares (PEPO 2007).
Nutrition and fertilization is one of the most important factors during the cultivation of winter wheat (PEPO 2004). In KÁDÁR's (2000b) study of winter barley on carbonated chernozem soil, Ca and Mg concentrations of plant tissues were higher in those samples which were partaken in high NP treatments. Grains contained 70% of the absorbed Mg and 29% of the absorbed Ca. In his maize experiment, the N-fertilizer increased the Mg content in the plant tissues. The Mg uptake of the grains was also stimulated by P fertiliser. Ca was accumulated mostly in the seeds (KÁDÁR 2000a). According to the results of KÁDÁR (2004) N fertilization enhanced the Ca incorporation into the plant organs of triticale. The increase of Ca and Mg content were correlated with P fertilization. The K fertilization however reduced the accumulation of Ca and Mg content through the cation antagonism, in three different crops (KÁDÁR 2000a, KÁDÁR 2000b, KÁDÁR 2004).
According to ŠKRBIĆ – ONJIA (2002) microelement content of winter wheat grains harvested from different regions showed significantly difference.
2. MATERIAL STUDIED
2.1. Area descriptions
The Hungarian national long-term fertilization trials were set up to study the effect of different NPK levels. The experiment has a split-split-plot design with 40 treatments in 4 replications. Samples of winter wheat variety Mv Csárdás were harvested and collected from Iregszemcse, Karcag, Nagyhörcsök and Putnok experimental stations. These fields had different soil types and climatic conditions. Tested samples are derived from the untreated control plots and those plots which were treated with 250 kg/ha N, 200 kg/ha P and 200 kg/ha K. Plant samples were harvested in 2004 when the weather conditions were humid and wet.
Bicsérd is a township located in Baranya Hills, in the South Transdanubian region of Hungary. The soil is chernozem brown forest soil formed on loamy loess soils which has slightly acidic pH. The humus layer is moderately thick. The topsoil is slightly leached. The cultivated layer has sandy loam mechanical composition with crumb structure and moderate soil moisture management. The characteristics of the cultivated layer is the following: pH (KCl): 5.45, CaCO3: 0%, humus: 1.93%, S-Value: 17.4 mekv/100 g, whereof Ca2+: 79.4%; Mg2+: 17.6%; Na+: 0.1%; K+: 2.9%.
Iregszemcse is located in Transdanubian Hills. The production area has typical chernozem soil formed on slightly having clay loess sediments. The soil has slightly alkaline pH and moderately thick humus layer. The cultivated layer has sandy loam mechanical composition. The soil has crumb structure and the moisture is balanced. The characteristics of the cultivated layer is the following: pH (KCl): 7.49, CaCO3: 10.69%, humus: 2.69%, S-Value: 13.3 me/100 g, whereof Ca2+: 94.8%; Mg2+: 4.7%; Na+: 0.04%; K+: 0.63%.

Science for Sustainability University of West Hungary International Scientific Conference for PhD Students March 19-20, 2013 – Győr
236
Karcag is located in the Tisza floodplain in the Great Hungarian Plain. The experimental field has non-carbonated meadow chernozem soil formed on infusion loess with acidic pH. The cultivated layer has clay loam mechanical composition and crumbly, grainy texture. Organic matter content is moderate but soil moisture is very favorable. The characteristics of the cultivated layer is the following: pH (KCl): 5.45, CaCO3: 0%, humus: 3.09%, S-Value: 20.4 me/100 g, where of Ca2+: 76.1%; Mg2+:20.9%; Na+:0.3%; K+:2.7%.
Nagyhörcsök is located in the Transdanubian region of Hungary. The experimental station has calcareous chernozem soil formed on loess. It has slightly alkaline pH and the humus layer is thick. The cultivated layer has loam mechanical composition. The soil structure is crumb with excellent soil moisture management. The characteristics of the cultivated layer is the following: pH (KCl): 7.3, CaCO3: 4.27%, humus: 3.45%, S-Value: 26.8 me/100 g, whereof Ca2+: 92.6%; Mg2+: 5.4%; Na+: 0.1%; K+: 1.9%.
Putnok is located in North Hungarian Mountains. The soil is non-podzolic forest infiltration clay soil with slightly acidic pH. The cultivated layer has clay loam mechanical composition and the soil has grainy, heavily clogged structure with heavy water retention and low drainage, permeability and available water resources. The characteristics of the cultivated layer is the following: pH (KCl): 5.00, CaCO3: 0%, humus: 2.29%, S-Value: 21.6 me/100 g, whereof Ca2+: 79.7%; Mg2+: 17.5%; Na+: 0.3%; K+: 2.5% (DEBRECZENI – NÉMETH 2009).
2.2. Methods, techniques
The elements content of samples were measured with inductively coupled plasma optical emission spectrometer (ICP-OES) following the digestion with HNO3-H2O2 solution. All results were subjected to ANOVA method, but after detection of significant differences (P<0.05) data were subjected to Duncan’s test to allow separation of means.
3. RESULT AND DISCUSSION
Our results proved that different production areas caused significant (P <0.05) difference in the Ca and Mg content of winter wheat grains. Table 1 shows the Ca content of wheat samples from different regions. Means (mg/kg) express the means of four replications of the untreated control plots where grains were harvested.
Samples, which were collected from Iregszemcse, have the highest Ca contents. Lowest Ca contents were measured in samples from Karcag. The measured values were higher in our study, than published ones, which were 300-450 mg kg-1 (GYŐRI – GYŐRINÉ 1998). The only exception was Karcag.
Table 1. Calcium content of winter wheat (Triticum aestivum L.) grains from different regions (untreated plots)
Production area Ca content Winter wheat Mean (mg/kg) SD Karcag 297.25 a Nagyhörcsök 492.02 b Bicsérd 505.75 b Putnok 590.23 c Iregszemcse 623.18 d
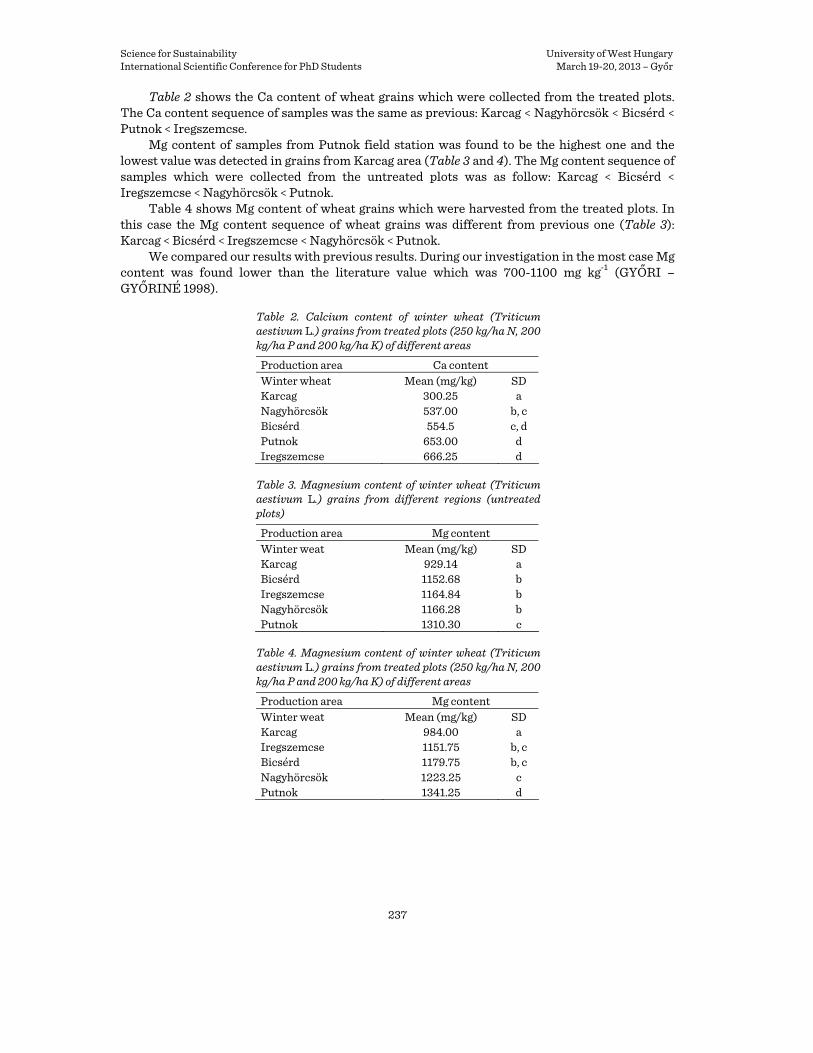
Science for Sustainability University of West Hungary International Scientific Conference for PhD Students March 19-20, 2013 – Győr
237
Table 2 shows the Ca content of wheat grains which were collected from the treated plots. The Ca content sequence of samples was the same as previous: Karcag < Nagyhörcsök < Bicsérd < Putnok < Iregszemcse.
Mg content of samples from Putnok field station was found to be the highest one and the lowest value was detected in grains from Karcag area (Table 3 and 4). The Mg content sequence of samples which were collected from the untreated plots was as follow: Karcag < Bicsérd < Iregszemcse < Nagyhörcsök < Putnok.
Table 4 shows Mg content of wheat grains which were harvested from the treated plots. In this case the Mg content sequence of wheat grains was different from previous one (Table 3): Karcag < Bicsérd < Iregszemcse < Nagyhörcsök < Putnok.
We compared our results with previous results. During our investigation in the most case Mg content was found lower than the literature value which was 700-1100 mg kg-1 (GYŐRI – GYŐRINÉ 1998).
Table 2. Calcium content of winter wheat (Triticum aestivum L.) grains from treated plots (250 kg/ha N, 200 kg/ha P and 200 kg/ha K) of different areas
Production area Ca content Winter wheat Mean (mg/kg) SD Karcag 300.25 a Nagyhörcsök 537.00 b, c Bicsérd 554.5 c, d Putnok 653.00 d Iregszemcse 666.25 d
Table 3. Magnesium content of winter wheat (Triticum aestivum L.) grains from different regions (untreated plots)
Production area Mg content Winter weat Mean (mg/kg) SD Karcag 929.14 a Bicsérd 1152.68 b Iregszemcse 1164.84 b Nagyhörcsök 1166.28 b Putnok 1310.30 c
Table 4. Magnesium content of winter wheat (Triticum aestivum L.) grains from treated plots (250 kg/ha N, 200 kg/ha P and 200 kg/ha K) of different areas
Production area Mg content Winter weat Mean (mg/kg) SD Karcag 984.00 a Iregszemcse 1151.75 b, c Bicsérd 1179.75 b, c Nagyhörcsök 1223.25 c Putnok 1341.25 d

Science for Sustainability University of West Hungary International Scientific Conference for PhD Students March 19-20, 2013 – Győr
238
4. CONCLUSION
During our investigations it was proved that different growing places having significant (P <0.01) difference in the Ca and Mg content of winter wheat samples. The Ca and Mg content were mostly determined by the production areas. The Ca content sequence of samples was the following: Karcag (297.25-300.25 mg/kg) < Nagyhörcsök (492.02-537.00 mg/kg) < Bicsérd (505.75-554.5 mg/kg) < Putnok (590.23-653.00) < Iregszemcse (623.18-666.25). The lowest Mg content was measured in samples from Karcag (929.14 mg/kg) and the highest results were determined in grains from Putnok (1341.25 mg/kg). Ca and Mg content of the treated samples were found higher than the element content of the untreated grains. Acknowledgements: We wish to thank TÁMOP-4.2.2/B-10/1-2010-0024 and TÁMOP-4.2.1./B-09/1/KONV-2010-0007 projects. The projects are also co-financed by the European Union and the European Social Fund. References ARANDA, P. – LLOPIS, J. (1993): Minerales. In: ARANDA, P. - LLOPIS, J. (eds.). Nutrición y dietética. Aspectos
sanitarios. Consejo General de Colegios Oficiales de Farmacéuticos, Madrid. 179-240. DEBRECZENI B.-NÉ – NÉMETH T. (2009): Az Országos Műtrágyázási Tartamkísérletek (OMTK) kutatási
eredményei (1967-2001). Akadémiai Kiadó, Budapest. 478 p GUPTA, P. K. – VARSHNEY, R. K. – SHARMA, P. C. RAMESH, B. (1999): Molecular markers and their
applications in wheat breeding. Plant Breeding 118: 369-390. GYŐRI Z. – GYŐRINÉ MILE I. (1998): A búza minősége és minősítése. Mezőgazdasági Szaktudás Kiadó,
Budapest. 83 p JODRAL-SEGADO, A. M. – NAVARRO-ALARCÓN, M. – LÓPEZ-G DE LA SERRANA, H. – LÓPEZ-
MARTÍNEZ, M. C. (2003): Magnesium and Calcium contents in foods from SE Spain: influencing factors and estimation of daily dietary intakes. The Science of the Total Environment 312: 47-58.
KÁDÁR I. (2000a): A műtrágyázás hatása a kukorica (Zea mays L.) elemfelvételére meszes csernozjom talajon. II. Növénytermelés 49 (1-2): 127-140.
KÁDÁR I. (2000b): Az őszi árpa (Hordeum vulgare L.) tápelemfelvétele karbonátos csernozjom talajon. Növénytermelés 49 (5): 547-559.
KÁDÁR I. (2004): A tritikálé elemfelvétele műtrágyázási kísérletben. Növénytermelés 53 (3): 273-284. PEPÓ P. (2004): Őszi búza fajtaspecifikus tápanyag-reakciójának vizsgálata tartamkísérletben.
Növénytermelés 53 (4): 329-337. PEPO P. (2007): The Role of Fertilization and Genotype in Sustainable Winter Wheat (Triticum aestivum L.)
Production. Cereal Research Communications 35 (2) 917-921. ŠKRBIĆ, B.-ONJIA, A. (2002): Multivariate analyses of microelement contents in wheat cultivated in Serbia.
Food Control 18: 338-345.

Science for Sustainability University of West Hungary International Scientific Conference for PhD Students March 19-20, 2013 – Győr
239
Gyula Roth Doctoral School of Forestry and Wildlife Management Sciences
Section 4.1 New Methods/Principles in Forest Management
New Methods in Forest Management
ZASADA, Michał
Warsaw University of Life Sciences - SGGW, Faculty of Forestry, Nowoursynowska 159, 02-776 Warsaw, Poland
Abstract – Forest management is one of the most important branches of forestry, devoted to the planning of sustainable use and development of forest resources. Important aspects of the forest management planning are particularly resource inventory and modeling methods. Forest resource inventory has a long history and well established methods. However, new challenges for forestry cause that the traditional approach to measuring forest and predict its development becomes insufficient. Foresters and society expect that the information about the forest will become more precise, more recent and collected as far as possible in an automated way. It is also expected that it will provide also precise and accurate answers on the state of the resources in the future. This situation calls for the constant development of new technologies and methods of data collection, processing, predicting, projection and presentation. The answer to such challenges has led to the emergence of new instruments for measuring trees, stands and forests and collecting data about these objects from various levels (terrestrial, airborne and space). The examples of such technologies include for example digital imagery and laser scanning. The new ways of data collection require also the application of contemporary statistical methods for obtaining the most complete results. The presentation will discuss the history and development of methods for forestry data collection and processing as well as present the most up-to-date approaches for forest resource inventory in the context of needs of the contemporary forest management.

Science for Sustainability University of West Hungary International Scientific Conference for PhD Students March 19-20, 2013 – Győr
240
Modelling Methods in Forestry
FACSKÓ Ferenca aUniversity of West Hungary, Sopron, Bajcsy-Zsilinszky út 4., 9400, Hungary
E-mail: [email protected] Abstract – Models are used for combining prior knowledge with new information, for systemizing thoughts, for calculating options and making predictions. The possibility of making predictions is of particular importance for forest management from different points of view: The life cycle of forest stands and, consequently, the period of capital turnover are especially long. The influence of an intervention can be seen only in the long run; sometimes so late that ongoing changes can not be affected, stopped or reversed. Forest managers should strive to balance expenses and incomes. At a given time, the amount of expenses and incomes depends, naturally, on the state of the forest, on its quantitative and qualitative characteristics. Forest managers can see their planted stands reach the state they were aiming at only at the end of their lives. Naturally, they want to foresee the results of their work. We can declare that long-run modelling is as essential for forest management as it is for the sustainable society caring for the Earth, mankind and sustainable living while integrating development and conservation. Aurelio PECCEI (1984) formulated this as follows: “The only possibility of accommodating in a fairly orderly way the six, seven or more billion who will soon have to share the Earth, and of doing this while maintaining in a passably good state the natural environment they and their successors will need for all the time to come, is to prepare in advance some kind of overall ‘master plan’ of global land occupancy.” (http://www.clubofrome.at/peccei/files/agenda.pdf) In my paper, I am not going into the questions of modelling the business activities in forest management units, I am only examining models dealing with forest stands as objects of forest management and as ecological units.
Keywords: forest models / modelling techniques
1. HISTORY OF FOREST MODELLING
The first examinations related to tree growth and the growth of forest stands were carried out by German foresters at the end of the 18th century. However VOUKILA (1965) mentions that there are documents from 17th century China describing temporal connections of the growth of forest stands. The first yield tables were made by FEISTMANTEL in the first half of the 1800s. Based on the work of HARTIG, regional yield tables were made in the course of the 19th century. These tables are at the same time forest stand models: FEISTMANTEL’s yield table depicts the classical normal forest.
The first forest stand models represented tables (Figure 1, First generation). Tables are easy to prepare and easy to use, but the tabulated form isn’t a right solution as regards modelling, because only discrete values can be used in the tables. According to KIRÁLY (1978), the magnitude of errors inherent in the tables (“… in 5% of the cases, an unpunctuality of over 30% can occur …”) is doubled due to interpolation and extrapolation not being performed. This problem was resolved when at the beginning of the 1960s, graphical yield tables were introduced and when starting in 1971, the nomograms developed by KIRÁLY (1966) were employed (Figure 1, Second generation). These models can be considered continuous.
Development of data processing devices and methods has changed the technique of data processing too. Manual processing of data was replaced by computer-aided data processing. The

Science for Sustainability University of West Hungary International Scientific Conference for PhD Students March 19-20, 2013 – Győr
241
first computerized yield tables were developed by ASSMAN and FRANZ for Bavarian spruce stands in 1963 (Figure 1, Third generation).
Figure 1. Modelling techniques
After the initial attempts, the modified version of Backman's function of growth proved
applicable to Hungarian circumstances (KIRÁLY 1978; GÁL 1979): tptppey
2321 lnln ++=
This modified Backman's function has been developed further by GÁL (1980, 1986); the problem of transition between yield classes has been resolved by integrating different parameters:
tptptptppey4
53
42
321 lnlnlnln ++++= The growth of computing power and storage capacity has allowed the development of
increasingly complex models that take into account many parameters. It can be also observed that the numerical data of models appear even in graphical form, i. e., in form of images. On experimental basis, a simulated forest has been “developed” which can be explored in a virtual way (FABRIKA – PRETZSH 2011).
2. MODELS IN FORESTRY
Natural sciences use the language of mathematics. This applies, of course, also to forestry as a science, even though mathematical modelling of ecological processes can only show a more modest success than in the case of exact natural sciences dealing with inanimate matter. In my opinion, there are at least three reasons for this: firstly, the test subject is extremely complex, secondly, experimenting and collecting field data involve a number of challenging problems, and thirdly, this discipline calls for the development of a lot of new mathematical methods.
The role of modelling in forestry science – like in other scientific disciplines – is the concise description of space-time processes and the detection of mechanisms underlying the patterns. However, compared to physical or chemical systems, these ecological systems are, in fact, much more complex. Individuals of a population differ in age, hereditary and acquired properties, furthermore abiotic environments are in most cases spatially and temporally highly
1800 2000
Yield tables Generation 1 Generation 2 Generation 3
Growth models
Stand models
Succession models
Process-based mod.
Morpholog. models
Biolog. models
Hybrid / integrated models
Dispersion models
1900

Science for Sustainability University of West Hungary International Scientific Conference for PhD Students March 19-20, 2013 – Győr
242
heterogeneous. The individuals interact with each other, and these relationships are typically nonlinear and stochastic. The object of study itself is extremely diverse and complex, its structure is essentially hierarchical. It follows that models describing the forest as system are very diverse and complex. Hardly any general conclusions can be drawn from these detailed and multivariate models with many parameters. Recognizing this problem, researchers follow two development directions. The first group aims to make widely applicable findings with the help of simple, so-called strategic models, capturing the essence of the process. Using so-called detailed models, the second group tries to describe a system’s functioning as accurately as possible. The first group deals rather with basic research, and the second group rather with applied research.
Theoretical classification of models: • according to the purpose:
o tactical models (for prediction); o strategic models (for demonstration);
• according to structure: o simulation models; o descriptive models;
• according to the space-time approach: o discrete models; o continuous models;
• according to the process approach: o deterministic; o stochastic.
We are talking about a tactical model if the purpose of the model is making predictions (well-founded prognosis, projections, forecasts) in a problem-solving context. Forest models that were created with a view to faciliting forest management planning belong to this class of models. These models represent only the values that influence the operating results (wood volume, some of the characteristics of wood quality: tree height, diameter).
Strategic models are designed for demonstration of a phenomenon in the context of scientific research, for appraisal reference of educational goals or for expounding a point of view. In this case, several properties are modelled.
The simulation model is a type of model capable of imitating behaviour similar to the behaviour of the studied phenomenon, i. e., when a clear link can be established between the behavioural components of the model and those of the real system. Hence, according to its name, the simulation model is simulating the system. Thanks to the proliferation of computers, digital modelling has become dominant. The graphical representation greatly facilitates understanding of the output. The advancement of sensors and displays makes it possible to represent the forest in its virtual reality (Figure 2).
Descriptive models express relationships in mathematical form. They only describe a phenomenon, but do not simulate it. For example, graphical yield tables and yield functions are descriptive models.
Discrete models function on a discrete scale, that is their spatial or temporal resolution doesn’t involve the set of real numbers, only natural numbers are defined. The first generation of yield tables (Figure 1) can be classified into this type, since output can be read only yearly (or for even longer intervals of five years or ten years).
The variables of the continuous model include the entire real number line. Graphical yield tables and yield functions are continuous models, because simulated data can be calculated with their help for any given date. (In the case of graphical models, it is only partially true, because the accuracy of the human eye is limited.) Since modern computer-based forest models work with functions, these models belong to the continuous models. It has to be noted that a computer model is not necessarily continuous. When the National Forest Inventory was

Science for Sustainability University of West Hungary International Scientific Conference for PhD Students March 19-20, 2013 – Győr
243
introduced, not yield functions were used for maintaining data, but yield tables were stored in a matrix form which allowed calculating the required growths.
Figure 2. Virtual forest at the Faculty of Forestry at Technical University in Zvolen, SK
Finally, it should be noted that forest models are stochastic models, so in these models, the output resulting from defined input data is not well defined: we don’t get specific (determined) numbers, only values with a specific probability of occurrence. This property can be explained by the large number of system components and their inter-relationships which are not exactly known. The response of trees to environmental stimuli is manifested in changing the structure and
functioning of trees and stands. Properties can be quantitative (diameter, height, basal area, volume, crown closure etc.) and qualitative (strength, health, shape of stem, crown ratio, size distribution, diversity, etc.) Some models deal only with quantitative properties or with some of them, while other models take into account also qualitative features, increasing this way the accuracy and applicability of the model.
In order to have the whole spectrum of models – ranging from classical yield tables to physiologically-based single-tree models – properly categorized, KURTH (1994) has proposed the triangle of plant models (Figure 3). On the top of the triangle, the empirical models can be found, which describe the entire plant population for statistical purposes. If we are modelling biological processes and the main attention is directed to functions, then we turn to process-based models (lower right angle). At the other “extreme” are the morphological models (lower left angle), which model the structure of the plants. All models are situated on the plane enclosed by the triangle. Moving from the base of the triangle towards the top, we reach the different levels of plants (plant components) and the levels of plant communities.
In today's world of fast, high-capacity storage devices, hardware device isn’t a bottleneck issue. Reviewing the software, we can see that models dealing with the forest and the components of forest cover a wide spectrum. Examining the programs, we discover that there are only a few of the “lone wolves”, i. e., the types of software which work alone, in isolation from they others: the either provide services to other programs, or make use of services of other programs.

Science for Sustainability University of West Hungary International Scientific Conference for PhD Students March 19-20, 2013 – Győr
244
Figure 3. Triangle of plant models
European countries continue to develop and refine these forest models and computer
programs, so they are more and more suited to forestry practices. These applications require the co-operation of a large number of “ancillary disciplines” and high computing power for the presentation of real-time three-dimensional models (virtual reality) (Figure 4) (FABRIKA 2012). Summary When reviewing forest models, we can see that they cover a wide spectrum and nowadays only digital simulations running on computer are justified. In today's world of fast, high-capacity storage devices, hardware device isn’t a bottleneck issue. The forest as a system is so complicated that it isn’t possible to describe the whole structure and all the processes using only one algorithm or a small number of algorithms. Each of the models can successfully simulate only a few properties. It follows that there are only a few of the “lone wolves”, i. e., the types of software which work alone, in isolation from they others: the either provide services to other programs, or make use of services of other programs. Acknowledgements: Publishing of this article was supported by the project TÁMOP 4.2.2.B-10/1-2010-0018. I thank my wife, Márta SÁNDOR for correcting and translating this paper.
Structural downscale
Functional downscale
Structural models Process-based models
Empirical models
km
m
mm

Science for Sustainability University of West Hungary International Scientific Conference for PhD Students March 19-20, 2013 – Győr
245
Figure 4. Computer-aided forest modelling MSFM = Sustainable Forest Management; AFM = Action Forest Management; PR = Public Relation
References FABRIKA, Marek – PRETZSH, Hans (2011): Analỳza a modelovanie lesnỳch ekosistémov. [Analysis of Models of
Forest Ecosystems.] Technická univerzita vo Zvolen, Zvolen. ISBN: 978-80-228-2181-0. pp. 599. FABRIKA, Marek (2012): Computer aided forest modeling in Slovak forestry education. In: NAGEL, J. (ed.)
Deutscher Verband Forstlicher Forschungsanstalten. Sektion Ertragskunde. Jahrestagung 21.-23. Mai 2012, Ottenstein. ISSN 1432-2609.
GÁL János (1979): Faállományok fejlődésének modellezési lehetőségei. [Possibilities for modelling forest stand development.] TDK dolgozat. Erdészeti és Faipari Egyetem, Sopron
GÁL János (1980): Fatermési függvények alkalmazása az üzemtervek számítógépes adatfeldolgozásában. [Application of yield functions in computer-based data processing for management plans.] Diplomaterv. Erdészeti és Faipari Egyetem, Sopron
GÁL János (1986): Új módszerek az erdők fatermésének meghatározására és előrejelzésére. [New methods of forest yield definition and prediction.] Kandidátusi értekezés. Budapest
KIRÁLY László (1966): Új fatermési nomogram. [A New Yield Nomogram.] Az Erdő. 15. 2: 367-369. p. KIRÁLY László (1978): Új eljárások a hosszú lejáratú üzemtervek készítésében. [New techniques in preparing
long-term management plans.] Kandidátusi értekezés
Science for Sustainability University of West Hungary International Scientific Conference for PhD Students March 19-20, 2013 – Győr
246
Cold Effect and Plant Reaction as Influential Factors in Population Density of the Gypsy Moth
(Lymantria dispar L.)
MARKÓNÉ NAGY Krisztinaa aInstitute of Sylviculture and Forest Protection University of West Hungary Faculty of Forestry, Sopron Hungary
[email protected]; H-8229 Csopak, Füredi út 47. Abstract – Factors influencing the gradation of gypsy moth might be among others, climatic factors and certain features of host plants. My aim was to examine the cold tolerance of gypsy moth egg masses in different phases of gradation and in different periods in the winter. Usually the longer was the cold effect in the middle period of wintering, the weaker was the intensity of larva hatching presumably causing high rate mortality of eggs. In the spring test, low temperature did not reduce viability of eggs. Larva hatching started earlier and was intensive when eggs were put into room temperature. In the second part of the present study the chemical change was measured after the peak of gradation in leaves of the Quercus cerris serving as a host plant of gypsy moth. As a plant reaction the change of the total phenol quantity in leaves was examined with modified method of Price and Buttler. The damage caused by the gypsy moth larvae proved the increase of total phenol level measured in the present study.
Keywords: gypsy moth / egg mortality / gradation / plant chemistry
1. INTRODUCTION
In Hungary one outstanding moth of the most important herbivore insects that cause damage in a large area is the gypsy moth (Lymantria dispar Linnaeus). Lymantria dispar is native to Eurasia, however it occasionally occurs in the north, spreading from Sweden and Finland to the north of Morocco, Algeria and Tunisia. Of course, the gypsy moth is also present on Mediterranean islands (MCMANUS – CSÓKA 2007). It is a polyphagous insect. Increase of populations shows cyclical feature. Factors influencing the gradation of gypsy moth are mainly climatic factors, natural enemies, hosts and their condition. In the period of 2003-2006, populations of the gypsy moth increased due to the long dry weather. Larvae caused damages not only in forests but in agricultural areas, in populated areas and even in parks in Hungary. Therefore it was important to see influential factors of population viability. Supposedly, extreme cold winters could cause mortality of eggs in egg masses. According to the experiences of University of Illinois (US), when the temperature decreased under -29 °C degrees no eggs survived. However in Hungary such cold temperature does not occur, the cold effect can reduce the number of wintering viable eggs. After female moths put down their eggs, larvae develop almost within one month and their metabolism activity reduces to the minimal level thus the diapause set in. Under this period cold effects can not influence their viability and they become resistant to cold weather (VARDOMSKIY 2006). For the sake of discovering behaviour of gypsy moth eggs in Hungary, my object was to analyse cold effects on the gypsy moth egg masses in laboratory. The question was that in different phase of gradation how egg masses of populations were able to resist to different temperature effect levels under different time periods.
On the other hand, the density and the health of gypsy moth populations depend on host plants. The quality, the age and the general condition of trees and their connection with forests influence insect fecundity and viability that can be resulted in weakening and ultimately the collapse of populations (ELKINTON – LIEBHOLD 1990). We supposed that feeding of the gypsy moth larvae can be influenced by induced chemical reaction in trees. The induced chemical reaction in trees is caused mainly by insect damage. It is the most important component of the plant defence.

Science for Sustainability University of West Hungary International Scientific Conference for PhD Students March 19-20, 2013 – Győr
247
Significant changes were observed in the rates and qualities of proteins and tannins in induced reactions (FELTON et al. 1992). Chemical reactions are the most important factors of plants defence mechanism (FAETH 1992). My objective was to compare the total phenol level in damaged and non-damaged Quercus cerris leaves in the same time and from the same forest location.
2. MATERIALS AND METHODS
The cold tolerance of eggs was analysed in 2004 on the peak of gradation of Lymantria dispar and in the spring of 2006, when the gradation collapsed. The aim was to determine the cold tolerance threshold of gypsy moth egg masses in the different phase of gradation. I tried to find the answer for the difference between condition of egg masses in the spring and in the winter. It was interesting to analyse cold effects before larva hatching in the spring when the populations were weak in 2006.
2.1. Winter test 2004
In the first test larvae hatching was analysed after cold effect. Time periods of treatments were 2, 5, 7, and 10 days. In December of 2004 egg masses were gathered in the Bakony Hills from 6 places (Table 1). From every place 8 egg masses were tested. Egg masses were placed in cold temperature and they were separated in Petri dishes. The treatment was done in fridges. The temperatures, which were -10 ˚C and -20 ˚C degrees, were checked regularly. The relative humidity was 70% in the fridges. The larva hatching was checked in the laboratory on 20-23 ˚C degrees. The relative humidity of the laboratory air was between 45-68%. After 2, 5, 7, and 10 days the Petri dishes were placed to a place of 6 ˚C degrees. Control egg masses were stored in the same place. The examination of larva hatching began at the end of December and egg masses were put at room temperature. Egg masses were observed from the hatch of the first larva then the hatched larvae were counted by time to time. The number of hatched larvae and intensity of hatching were determined.
2.2. Spring test 2006
Before larva hatching egg masses were treated in -15 ˚C degrees for 4 hours and in -6.7 ˚C degrees for 5 days in March of 2006. The number of controls were 2 in every place which were not treated (Table 2). After gathering eggs, they were stored in a cold room (7.5 ˚C degrees). Later egg masses were separated in Petri dishes. Control eggs were placed in a cold room (7.5 ˚C degrees) during treatments. When the treatments finished, the Petri dishes with control samples were taken to room temperature (20.5 ˚C degrees). Numbers of hatching larvae were counted on every second day.
2.3. Chemical analysis of host plant leaves
The induced reaction could be demonstrated by comparing total phenol levels in leaves. Samples were collected in August, 2005 in Veszprém county from the same Quercus cerris forest. 60-60 pieces of samples were collected from two places of the forest for the statistical evaluation. The chemical analysis was made by the University of Szeged. Before the total phenol measurement, leaves were dried at 60 °C degrees for 6 hours. The ratio of the wet and the dry weight was determined. After sample preparations the leaves were fractured. Liquid and tight mixture was dissolved with filtration. For the measurement of the total phenol level the modified Price – Buttler method was done with photometric measurement.

Science for Sustainability University of West Hungary International Scientific Conference for PhD Students March 19-20, 2013 – Győr
248
Table 1. Summary of the winter test
Sampled area Temperature (in Celsius)
Time period of treatments
2 days 5 days 7 days
Ajka -20
10 days 2 days 5 days 7 days
Bakonybél -10
10 days 2 days 5 days 7 days
Bakonyjákó -10
10 days Ugod control
Noszlop control Magyarpolány control
Table 2. Summary of the spring test
Sampled area Temperature (in Celsius)
Time period of treatments
Várpalota -15 4 hours Hétházpuszta -15 4 hours
Csetény -15 4 hours Várpalota control
Hétházpuszta control Csetény control
Bakonynána -6.7 5 days Bakonynána control
3. RESULTS AND DISCUSSION
3.1. Winter test 2004
Substantial difference was observed between examinations. Cold treatments were done in different times of the wintering period. In 2004 it happened in the middle of wintering. After treatments, larva hatching lagged behind control samples on the first 10 days when hatching larvae were counted on replicate average. Those samples which were treated at -10 ˚C degrees, hatching intensity of eggs from different sampled places was different. After the coldest effect (-20 ˚C degrees) hatching started slower than in other treatments. Differences were observed after 10 days in hatching between 2, 5, 7 and 10 days cold effect. Usually, the longer was the cold effect in this period of wintering, the weaker was the intensity of larva hatching. Every treatment that last 7 and 10 days, acted strongly on egg masses. Hatching intensity of them did not rise under 19 days and the numbers of hatched larvae were lower than control samples. There was presumable high rate mortality of eggs. The larva hatching was the weakest in case where egg masses were treated in -20 ˚C degrees for 2, 5, 7, and 10 days. Results showed P=1% significance between control and tested samples according to F-test. Strong cold effect did not cause egg mortality in 100 % and in some of the samples more or less viable larvae hatched from every egg mass (Figure 1).
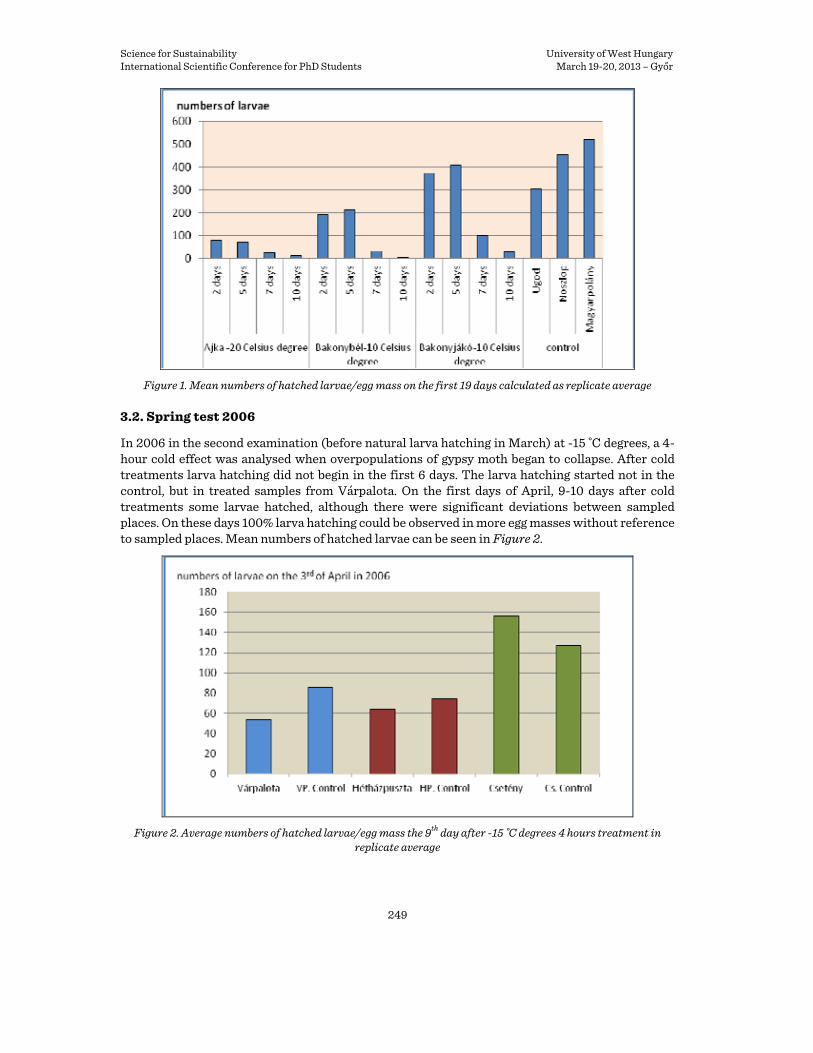
Science for Sustainability University of West Hungary International Scientific Conference for PhD Students March 19-20, 2013 – Győr
249
Figure 1. Mean numbers of hatched larvae/egg mass on the first 19 days calculated as replicate average
3.2. Spring test 2006
In 2006 in the second examination (before natural larva hatching in March) at -15 ˚C degrees, a 4-hour cold effect was analysed when overpopulations of gypsy moth began to collapse. After cold treatments larva hatching did not begin in the first 6 days. The larva hatching started not in the control, but in treated samples from Várpalota. On the first days of April, 9-10 days after cold treatments some larvae hatched, although there were significant deviations between sampled places. On these days 100% larva hatching could be observed in more egg masses without reference to sampled places. Mean numbers of hatched larvae can be seen in Figure 2.
Figure 2. Average numbers of hatched larvae/egg mass the 9th day after -15 ˚C degrees 4 hours treatment in
replicate average
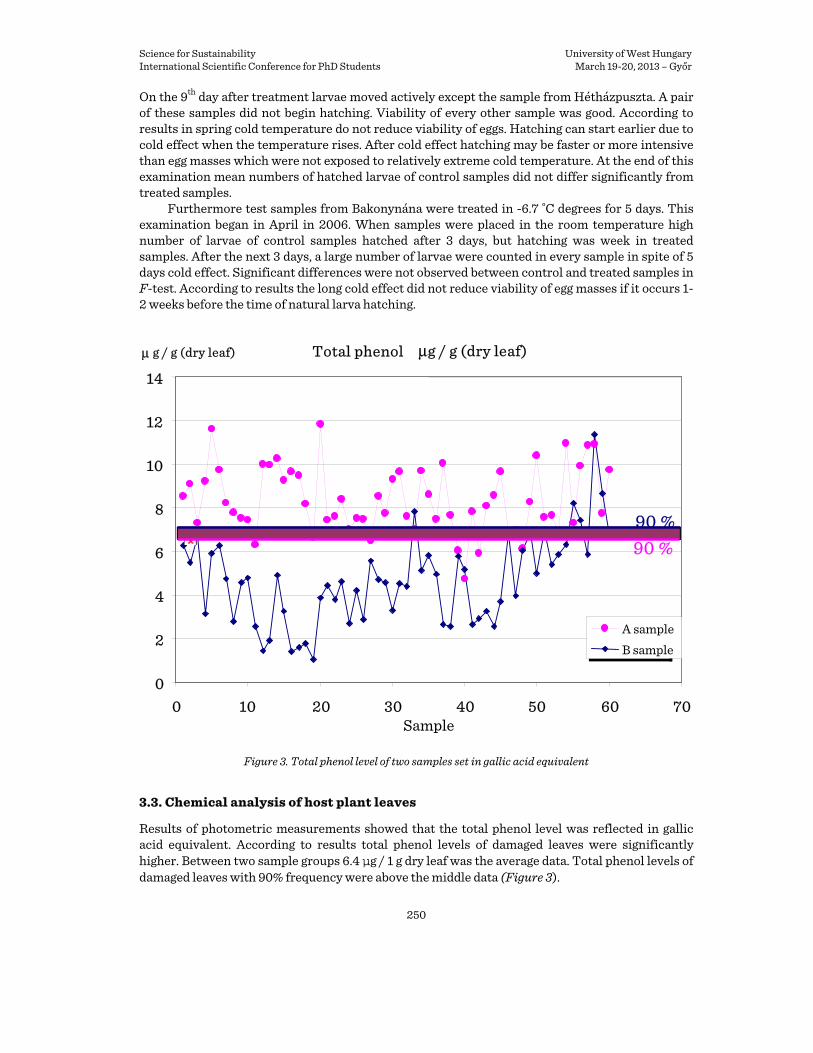
Science for Sustainability University of West Hungary International Scientific Conference for PhD Students March 19-20, 2013 – Győr
250
On the 9th day after treatment larvae moved actively except the sample from Hétházpuszta. A pair of these samples did not begin hatching. Viability of every other sample was good. According to results in spring cold temperature do not reduce viability of eggs. Hatching can start earlier due to cold effect when the temperature rises. After cold effect hatching may be faster or more intensive than egg masses which were not exposed to relatively extreme cold temperature. At the end of this examination mean numbers of hatched larvae of control samples did not differ significantly from treated samples.
Furthermore test samples from Bakonynána were treated in -6.7 ˚C degrees for 5 days. This examination began in April in 2006. When samples were placed in the room temperature high number of larvae of control samples hatched after 3 days, but hatching was week in treated samples. After the next 3 days, a large number of larvae were counted in every sample in spite of 5 days cold effect. Significant differences were not observed between control and treated samples in F-test. According to results the long cold effect did not reduce viability of egg masses if it occurs 1-2 weeks before the time of natural larva hatching.
Figure 3. Total phenol level of two samples set in gallic acid equivalent
3.3. Chemical analysis of host plant leaves
Results of photometric measurements showed that the total phenol level was reflected in gallic acid equivalent. According to results total phenol levels of damaged leaves were significantly higher. Between two sample groups 6.4 µg / 1 g dry leaf was the average data. Total phenol levels of damaged leaves with 90% frequency were above the middle data (Figure 3).
Total phenol μg / g (dry leaf)
0
2
4
6
8
10
12
14
0 10 20 30 40 50 60 70Sample
μ g / g (dry leaf)
A sampleB sample
90 %90 %

Science for Sustainability University of West Hungary International Scientific Conference for PhD Students March 19-20, 2013 – Győr
251
Results of the examination can be written for the account of monitoring that the gypsy moth do not feed on the same trees year by year in the gradation period. Generally, it could be the reason why larvae look for nutrition on another plants. Acknowledgements: I wish to thank to Dr. Béla VISKOLCZ, who made the chemical analysis at the University of Szeged. On the other hand I wish to thank the Ministry of Agricultural for financial support. References ELKINTON, J. S. – LIEBHOLD, A. M. (1990): Population dynamics of gypsy moth in North America. Annual
Review of Entomology (35): 571-596. FAETH, S. H. (1992): Do defoliation and subsequent phytochemical responses reduce future herbivory on oak
trees? Journal of Chemical Ecology. 18(6): 915-925. FELTON, G. W. – DONATO, K. K. – BROADWAY, R. M. – DUFFEY, S. S. (1992): Impact of oxidized plant phenolics
on the nutritional quality of dietary protein to a noctuid herbivore, Spodoptera exigua. Journal Insect Physiology. (38): 277-285.
MCMANUS, M. – CSÓKA, Gy. (2007): History and impact of gypsy moth in North America and comparison to recent outbreaks in Europe. Acta Silvatica and Lignaria Hungarica (3): 47-64.
UNIVERSITY of ILLINOIS Extension (2012): Northeastern Illinois Reporting Site about gypsy moth. http://urbanext.illinois.edu/gypsymoth/default.cfm
VARDOMSKIY, S. N. (2006): Ecologycal Impact of Gypsy Moth (Lymantria dispar). Biology Department, 2006, 10. p.
Mesostigmata Mites of Afforested Post-industrial Habitats on a Lignite Mine Spoil Heap in Bełchatów –
a Preliminary Study
PASTWIK, Elżbieta a – SKORUPSKI, Macieja – PIASTA, Andrzeja – JAGODZIŃSKI, Andrzej M.a,b
a Department of Game Management and Forest Protection, Faculty of Forestry, Poznań University of Life Sciences
Wojska Polskiego 71d, PL60625 Poznań, Poland, tel.: +48618487779, e-mail: [email protected]
b Institute of Dendrology, Polish Academy of Sciences, Parkowa 5, PL62035 Kórnik, Poland,
tel.: +48618170033, e-mail: [email protected] Abstract – The aim of this study was to characterize Mesostigmatid mite species composition on afforested post-industrial habitats on a lignite mine spoil heap in Bełchatów Forest District (Poland). The sites were afforested with variable forest tree species, i.e. silver birch, black alder, pedunculate oak, red oak, black locust, Scots pine and black pine. Mite communities were analyzed with respect to the dominant tree species and humus type. Within the Mt Kamieńsk spoil heap 144 soil samples were taken from 24 experimental plots. As a result, 1026 mite specimens of 45 species were found. Mite communities were at varying levels of successional development among stands of similar age. Deciduous tree species created better site conditions for mite development than coniferous species. The relatively large number of mite species recorded within the stands examined shows quite fast successional dynamics on these disturbed habitats.
Keyword: mites / Mesostigmata / post-industrial habitats / succession
Science for Sustainability University of West Hungary International Scientific Conference for PhD Students March 19-20, 2013 – Győr
252
1. INTRODUCTION
Poland has a growing coverage of urbanized areas, permanently transformed by industry or degraded by other human activity. Undoubtedly, post-mine heaps are an example of habitats where renaturalization would take much longer with no human intervention. One of the most frequently chosen directions of such land reclamation is afforestation. This type of renaturalization was also applied in the case of the lignite mine spoil heap in Bełchatów. However, the successional processes occurring on such areas are still not very well understood (SKORUPSKI et al. 2013).
One of the most important bioindication elements of the newly established ecosystems is soil mesofauna. The goal of this study was to examine species composition of soil mites (order Mesostigmata) on afforested post-industrial habitats of the lignite mine in Bełchatów. A second goal was preliminary analyses of how major tree species and types of humus affect species composition of Mesotigmatid mites.
2. STUDY AREA
Lignite opencast mining in Bełchatów (Central Poland; 51°12’N, 19°25’E) is one of the biggest suppliers of brown coal in Europe. The spoil heap forms a hill 200 m high (400 m a.s.l.) and covers 1500 ha of land. It is formed of various Quaternary and Tertiary overburden sediments (JAGODZIŃSKI - KAŁUCKA 2008). Forest reclamation of the lignite mine spoil heap started in the mid-1980s. The most common tree species planted within the area were silver birch, Scots pine, black and grey alder, black locust, oaks, poplars, willows and many others. The studies of the dump surface material showed that soil horizons have not yet formed under any of the young stands. The organic matter in spoil substrates is low. Within older stands (20-30 years old), a thin litter horizon has begun to form (JAGODZIŃSKI - KAŁUCKA 2010, ŚWITONIAK et al. 2011).
3. MATERIAL AND METHODS
Research material was collected in the fall of 2011 from experimental plots established by the Institute of Dendrology of the Polish Academy of Sciences in Kórnik, on the top (plateau) and western slope of Mt Kamieńsk. From each of 24 study plots, where pure stands of 7 tree species grow, we collected 6 soil samples from the uppermost soil layer (144 samples in total). Humus type formed within each plot was also defined, i.e. protomor, protomoder, moder and mull (Tab. 1). The samples were taken using a 20 cm2 sampler. They consisted of litter, humus and mineral soil to a depth of 5 cm. Samples were transported to the laboratory of the Department of Game Management and Forest Protection and placed in Tullgren funnels to extract mites. Organisms were preserved in 75% ethyl alcohol. Then, in order to select Mesostigmatid mites, the content with alcohol was poured into a petri dish and examined under a binocular microscope. Mites were picked out using a dissection needle, and placed on a glass slide in highly concentrated drops of lactic acid, and identified to order, genus, and when possible, to species. Statistical analyzes were based on the dominance index (D):
D=s/S*100% where: s – number of individuals of a given species (order), S – number of all individuals of a given cenotic unit (SZUJECKI 1983).
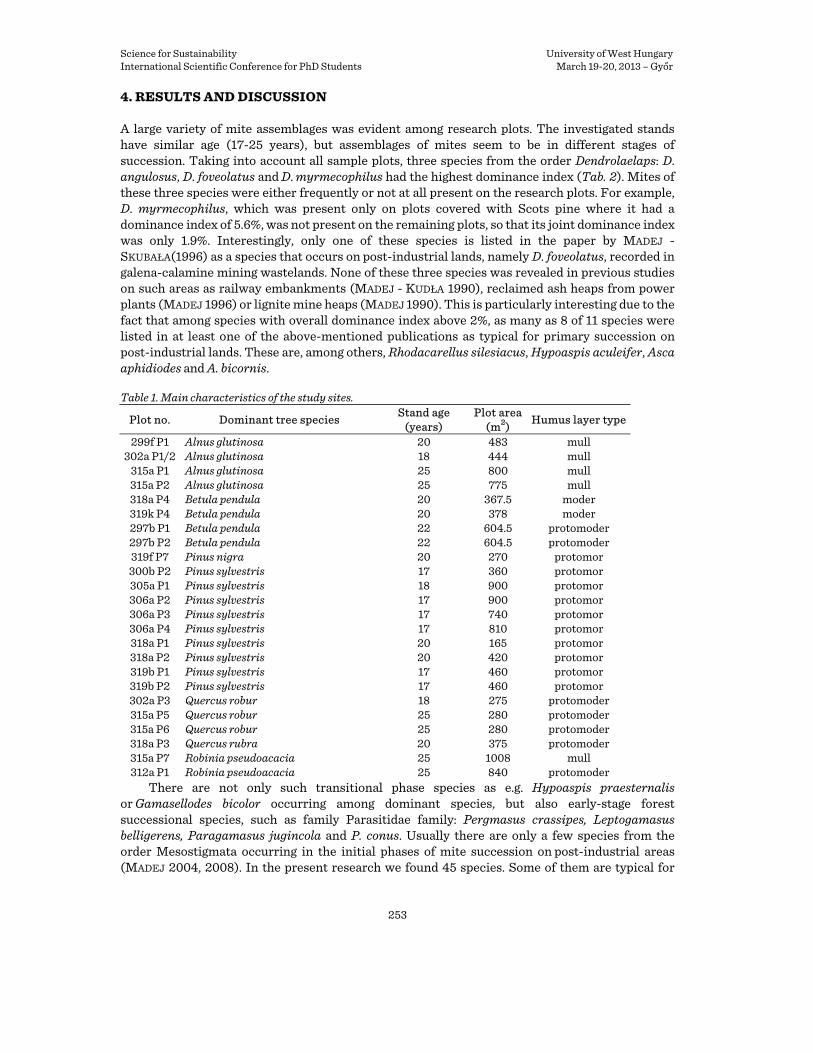
Science for Sustainability University of West Hungary International Scientific Conference for PhD Students March 19-20, 2013 – Győr
253
4. RESULTS AND DISCUSSION
A large variety of mite assemblages was evident among research plots. The investigated stands have similar age (17-25 years), but assemblages of mites seem to be in different stages of succession. Taking into account all sample plots, three species from the order Dendrolaelaps: D. angulosus, D. foveolatus and D. myrmecophilus had the highest dominance index (Tab. 2). Mites of these three species were either frequently or not at all present on the research plots. For example, D. myrmecophilus, which was present only on plots covered with Scots pine where it had a dominance index of 5.6%, was not present on the remaining plots, so that its joint dominance index was only 1.9%. Interestingly, only one of these species is listed in the paper by MADEJ - SKUBAŁA(1996) as a species that occurs on post-industrial lands, namely D. foveolatus, recorded in galena-calamine mining wastelands. None of these three species was revealed in previous studies on such areas as railway embankments (MADEJ - KUDŁA 1990), reclaimed ash heaps from power plants (MADEJ 1996) or lignite mine heaps (MADEJ 1990). This is particularly interesting due to the fact that among species with overall dominance index above 2%, as many as 8 of 11 species were listed in at least one of the above-mentioned publications as typical for primary succession on post-industrial lands. These are, among others, Rhodacarellus silesiacus, Hypoaspis aculeifer, Asca aphidiodes and A. bicornis. Table 1. Main characteristics of the study sites.
Plot no. Dominant tree species Stand age (years)
Plot area(m2) Humus layer type
299f P1 Alnus glutinosa 20 483 mull 302a P1/2 Alnus glutinosa 18 444 mull
315a P1 Alnus glutinosa 25 800 mull 315a P2 Alnus glutinosa 25 775 mull 318a P4 Betula pendula 20 367.5 moder 319k P4 Betula pendula 20 378 moder 297b P1 Betula pendula 22 604.5 protomoder 297b P2 Betula pendula 22 604.5 protomoder 319f P7 Pinus nigra 20 270 protomor
300b P2 Pinus sylvestris 17 360 protomor 305a P1 Pinus sylvestris 18 900 protomor 306a P2 Pinus sylvestris 17 900 protomor 306a P3 Pinus sylvestris 17 740 protomor 306a P4 Pinus sylvestris 17 810 protomor 318a P1 Pinus sylvestris 20 165 protomor 318a P2 Pinus sylvestris 20 420 protomor 319b P1 Pinus sylvestris 17 460 protomor 319b P2 Pinus sylvestris 17 460 protomor 302a P3 Quercus robur 18 275 protomoder 315a P5 Quercus robur 25 280 protomoder 315a P6 Quercus robur 25 280 protomoder 318a P3 Quercus rubra 20 375 protomoder 315a P7 Robinia pseudoacacia 25 1008 mull 312a P1 Robinia pseudoacacia 25 840 protomoder
There are not only such transitional phase species as e.g. Hypoaspis praesternalis or Gamasellodes bicolor occurring among dominant species, but also early-stage forest successional species, such as family Parasitidae family: Pergmasus crassipes, Leptogamasus belligerens, Paragamasus jugincola and P. conus. Usually there are only a few species from the order Mesostigmata occurring in the initial phases of mite succession on post-industrial areas (MADEJ 2004, 2008). In the present research we found 45 species. Some of them are typical for

Science for Sustainability University of West Hungary International Scientific Conference for PhD Students March 19-20, 2013 – Győr
254
forest conditions, e.g. Discourella modesta, Trachytes aegrota, Olodiscus minima or Pachylaelaps suecicus. This demonstrates the advanced stage of succession on some of the research plots.
Analysis of the plots covered with various tree species revealed that the process of succession is slower under coniferous species, and that species from orders Dendrolaelaps and Rhodacarellus dominate among Mesostigmatid mites (Tab. 2). At the same time, species compositions recorded on pedunculate oak, and primarily on black locust plots, indicate not only the dominance of the ‘forest species’, but also effective displacement of early successional species. The plots covered with black locust were characterized by the existence of just a few individuals of order Rhodacarellus and the absence of individuals of order Dendrolaelaps.
Table 2. Domination index of Mesostigmata order mites under canopy of different tree species. Abbreviations: AlGl - Alnus glutinosa, BePe - Betula pendula, PiNi - Pinus nigra, PiSy - Pinus sylvestris, RoPs - Robinia pseudoacacia, QuRo - Quercus robur, QuRu - Quercus rubra.
Dominance [%] Mite species
AlGl BePe PiNi PiSy RoPs QuRo QuRu Total Amblyseius sp. 1 - 0.4 - 1.2 - 5.1 - 1.4 Amblyseius sp. 2 0.7 - - 0.3 - 0.6 10.5 0.7 Amblyseius sp. 3 - 3.9 - 0.3 - - - 1.1 Amblyseius sp. 4 2.1 - - - - - - 0.3 Ameroseius corbiculus 1.4 - - - - - - 0.2 Antennoseius avius - 0.4 - - - - - 0.1 Arctoseius cetratus - - - 0.3 - - - 0.1 Arctoseius taeniolatus - 4.3 - 1.5 - 1.1 - 1.8 Asca aphidioides 2.1 - - 4.0 - 4.5 10.5 2.7 Asca bicornis - 0.8 - 9.0 - 1.1 - 3.2 Cheiroseius borealis 1.4 - - - - - - 0.2 Cheiroseius bryophilus - 0.4 - 0.6 1.4 - - 0.4 Dendrolaelaps angulosus 14.4 15.6 - 6.2 - 47.7 - 16.1 Dendrolaelaps foveolatus - 34.8 - 13.3 - 6.3 - 13.9 Dendrolaelaps myrmecophilus - - - 5.6 - - - 1.8 Dendrolaelaps rotundus - - - 1.9 - 0.6 - 0.7 Dendrolaelaps zwoelferi - 0.4 - - - - - 0.1 Dendroseius reticulatus 2.1 - - 3.4 - - - 1.4 Discourella modesta 0.7 2.3 - - 10.8 - - 1.5 Gamasellodes bicolor 10.3 - - - - 0.6 5.3 1.8 Gamasellodes sp.1 - - - 1.5 - - - 0.5 Hypoaspis aculeifer 6.2 7.0 - 12.1 8.1 12.5 - 9.2 Hypoaspis lasiomyrmecochilus - - - - - 2.3 - 0.4 Hypoaspis praesternalis 2.7 4.7 23.1 9.9 - 2.3 - 5.4 Hypoaspis vacua - 0.4 - 5.6 1.4 0.6 2.6 2.1 Iphidozercon corticalis - - - - - 0.6 - 0.1 Leioseius minusculus 0.7 - - - - - - 0.1 Leptogamasus belligerens - - - 0.3 28.4 - - 2.1 Minirhodacarellus minimus - - - - - 0.6 - 0.1 Olodiscus minima - - - 0.3 6.8 - - 0.6 Pachylaelaps suecicus - - - - 1.4 - - 0.1 Paragamasus conus 0.7 4.3 - 2.2 2.7 - 7.9 2.3 Paragamasus jugincola 7.5 - 15.4 0.9 4.1 - - 1.9 Paragamasus runcatellus - 3.5 15.4 - - - - 1.1 Pergamasus crassipes 2.7 2.3 - 4.6 6.8 2.8 2.6 3.5 Pergamasus septentrionalis 0.7 0.8 - - - 0.6 - 0.4 Rhodacarellus silesiacus 29.5 8.2 38.5 13.3 8.1 4.5 - 12.3 Rhodacarus reconditus - - - 0.6 - - 23.7 1.1 Rhodacarus roseus - - - - - - 13.2 0.5
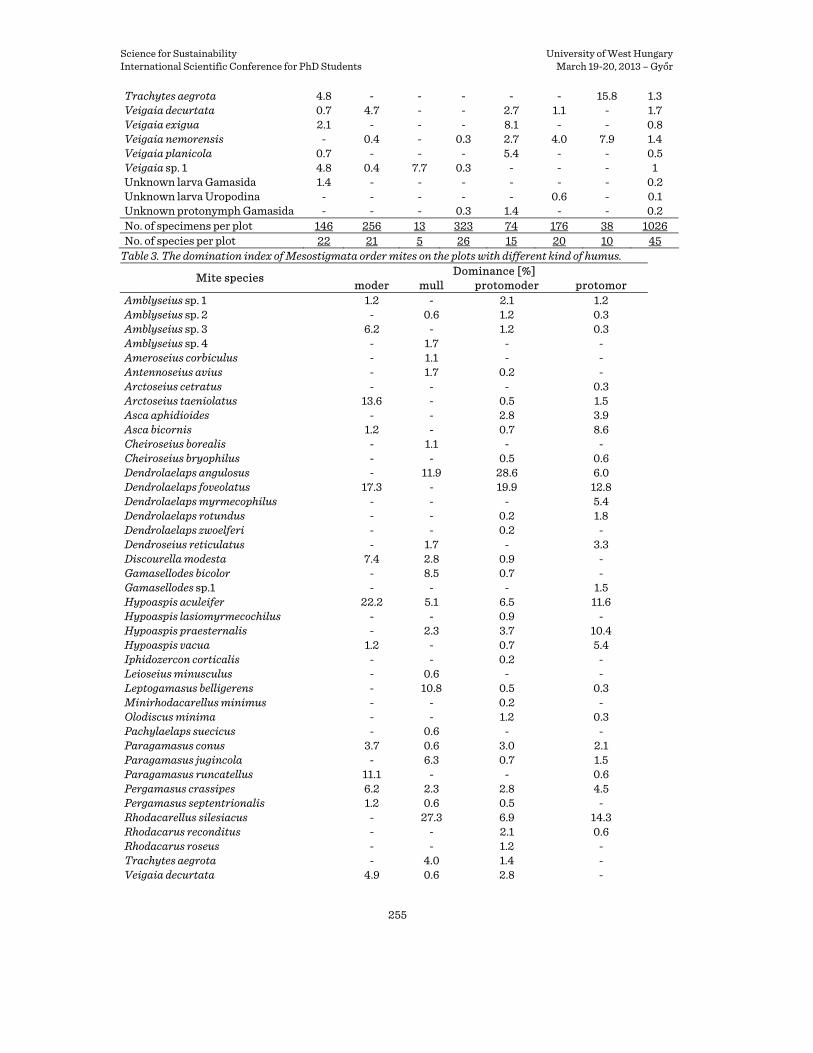
Science for Sustainability University of West Hungary International Scientific Conference for PhD Students March 19-20, 2013 – Győr
255
Trachytes aegrota 4.8 - - - - - 15.8 1.3 Veigaia decurtata 0.7 4.7 - - 2.7 1.1 - 1.7 Veigaia exigua 2.1 - - - 8.1 - - 0.8 Veigaia nemorensis - 0.4 - 0.3 2.7 4.0 7.9 1.4 Veigaia planicola 0.7 - - - 5.4 - - 0.5 Veigaia sp. 1 4.8 0.4 7.7 0.3 - - - 1 Unknown larva Gamasida 1.4 - - - - - - 0.2 Unknown larva Uropodina - - - - - 0.6 - 0.1 Unknown protonymph Gamasida - - - 0.3 1.4 - - 0.2 No. of specimens per plot 146 256 13 323 74 176 38 1026 No. of species per plot 22 21 5 26 15 20 10 45
Table 3. The domination index of Mesostigmata order mites on the plots with different kind of humus. Dominance [%] Mite species moder mull protomoder protomor
Amblyseius sp. 1 1.2 - 2.1 1.2 Amblyseius sp. 2 - 0.6 1.2 0.3 Amblyseius sp. 3 6.2 - 1.2 0.3 Amblyseius sp. 4 - 1.7 - - Ameroseius corbiculus - 1.1 - - Antennoseius avius - 1.7 0.2 - Arctoseius cetratus - - - 0.3 Arctoseius taeniolatus 13.6 - 0.5 1.5 Asca aphidioides - - 2.8 3.9 Asca bicornis 1.2 - 0.7 8.6 Cheiroseius borealis - 1.1 - - Cheiroseius bryophilus - - 0.5 0.6 Dendrolaelaps angulosus - 11.9 28.6 6.0 Dendrolaelaps foveolatus 17.3 - 19.9 12.8 Dendrolaelaps myrmecophilus - - - 5.4 Dendrolaelaps rotundus - - 0.2 1.8 Dendrolaelaps zwoelferi - - 0.2 - Dendroseius reticulatus - 1.7 - 3.3 Discourella modesta 7.4 2.8 0.9 - Gamasellodes bicolor - 8.5 0.7 - Gamasellodes sp.1 - - - 1.5 Hypoaspis aculeifer 22.2 5.1 6.5 11.6 Hypoaspis lasiomyrmecochilus - - 0.9 - Hypoaspis praesternalis - 2.3 3.7 10.4 Hypoaspis vacua 1.2 - 0.7 5.4 Iphidozercon corticalis - - 0.2 - Leioseius minusculus - 0.6 - - Leptogamasus belligerens - 10.8 0.5 0.3 Minirhodacarellus minimus - - 0.2 - Olodiscus minima - - 1.2 0.3 Pachylaelaps suecicus - 0.6 - - Paragamasus conus 3.7 0.6 3.0 2.1 Paragamasus jugincola - 6.3 0.7 1.5 Paragamasus runcatellus 11.1 - - 0.6 Pergamasus crassipes 6.2 2.3 2.8 4.5 Pergamasus septentrionalis 1.2 0.6 0.5 - Rhodacarellus silesiacus - 27.3 6.9 14.3 Rhodacarus reconditus - - 2.1 0.6 Rhodacarus roseus - - 1.2 - Trachytes aegrota - 4.0 1.4 - Veigaia decurtata 4.9 0.6 2.8 -

Science for Sustainability University of West Hungary International Scientific Conference for PhD Students March 19-20, 2013 – Győr
256
Veigaia exigua - 1.7 1.4 - Veigaia nemorensis 1.2 0.6 2.5 0.3 Veigaia planicola - 0.6 0.9 - Veigaia sp. 1 1.2 4.0 - 0.6 Unknown larva Gamasida - 1.1 - - Unknown larva Uropodina - - 0.2 - Unknown protonymph Gamasida - - 0.2 0.3 No. of specimens per plot 81 176 433 336 No. of species per plot 15 26 34 27
Mite assemblages were also compared among litter types created under canopies of different
tree species to determine whether the rate of the succession is influenced by litter type. The largest share of mites species typical for the first phases of succession was observed on plots with protomoder litter type (stands with silver birch, pedunculate oak, black locust and red oak). Also, a large share of these species was found on plots with protomor litter type (stands with Scots pine and black pine). However, on plots with moder type litter (stands with silver birch) and mull type litter (stands with black alder and black locust), a much higher share of dominant species typical for ‘forest’ phases of succession was observed (Tab. 3).
5. CONCLUSIONS
Despite similar stand age, the research plots investigated were in various stages of succession with respect to order Mesostigmata mites. Deciduous species, particularly pedunculate oak and black locust, created the best conditions for succession of mite species investigated. Succession of mites was the least advanced on plots covered with Scots pine. Succession of mites was more advanced on plots with mull and moder litter types than on plots with protomor and protomoder litter types. Results of this research revealed relatively large numbers of Mesostigmata order mites occurring on the reclaimed spoil heap, which confirms fast successional dynamics in this area. Introductory research has shown that succession in the study area has an insular nature due to the diversified migration paths of individual successional species. Acknowledgemebts: The study was financially supported by the General Directorate of State Forests in Warsaw, Poland (grant no. OR/2717/3/11). We kindly thank Mr. Paweł Horodecki (Institute of Dendrology, Polish Academy of Sciences, Kórnik) for valuable help during the field work in the experimental forest sites. References JAGODZIŃSKI A. M. – KAŁUCKA I. (2008): Age-related changes in leaf area index of young Scots pine stands.
Dendrobiology 59: 57-65. JAGODZIŃSKI A.M. – KAŁUCKA I. (2010): Fine roots biomass and morphology in a chronosequence of young
Pinus sylvestris stands growing on a reclaimed lignite mine spoil heap. Dendrobiology 64: 19-30. MADEJ G. (1990): Mesostigmata (Arachnida, Acari) zwałów kopalnictwa węglowego. Zeszyty Problemowe
Postępów Nauk Rolniczych 373: 115-135. MADEJ G. (1996): Mesostigmata mite community on the dump of the power plant. Acta Biologica Silesiana 28
(45): 130-138. MADEJ G. (2004): Rozwój zgrupowań roztoczy Mesostigmata (Arachnida, Acari) na nieużytkach
poprzemysłowych. Wydawnictwo Uniwersytetu Śląskiego. Pp. 208. MADEJ G. (2008): Ecological succession of mites (Acari) with particular reference to the predatory mites
Gamasina (Mesostigmata). In: Gwiazdowicz D.J. (ed.): Selected problems of acarological research in forests. Wydawnictwo Uniwersytetu Przyrodniczego w Poznaniu. Pp. 41-58.
Science for Sustainability University of West Hungary International Scientific Conference for PhD Students March 19-20, 2013 – Győr
257
MADEJ G. – KUDŁA M. (1990): Zgrupowania roztoczy rzędu Mesostigmata (Arachnida, Acari) wybranych nasypów kolejowych na terenie GOP-u. Acta Biologica Silesiana 16 (33): 9-22.
MADEJ G. – SKUBAŁA P. (1996): Communites of mites (Acari) on old galena-calamine mining wastelands at Galman, Poland. Pedobiologia 40: 311-327.
SKORUPSKI M. – HORODECKI P. – JAGODZIŃSKI A. M. (2013): Badania fauny roztoczy z rzędu Mesostigmata na terenach przemysłowych i poprzemysłowych w Polsce. Nauka Przyroda Technologie (in press)
ŚWITONIAK M. – HULISZ P. – KAŁUCKA I. – RÓŻAŃSKI S. (2011): Rola monokultur sosnowych w kształtowaniu zasobów węgla organicznego w glebach zwałowiska zewnętrznego KWB Bełchatów. Roczniki Gleboznawcze 62 (2): 395-405.
SZUJECKI A. (1983): Ekologia owadów leśnych. PWN, Warszawa, Wyd. II: 1-603. http://www.kwbbelchatow.pgegiek.pl/
Analysis of Wind Resistance of Stands Based on the Oleśnica Śląska Forest District
SUŁKOWSKI, Sławomira* –STRZELIŃSKI, Paweła –KONDRACKI, Kamila
a Department of Forest Management, University of Life Sciences, Poznań, Poland Abstract – Wind damage is a significant factor influencing the occurrence of losses in commercial forests. Literature sources report numerous factors affecting wind stand resistance. However, insight into this phenomenon requires an individual approach to each its case. This study was at attempt at finding causes for damage in the Ligota Polska forest district. For this purpose analyses were conducted on the relationships between occurring damage and individual factors or complexes of factors. Results of the analyses did not definitely identify a specific characteristic of the stand, which would be strongly correlated with the damage. Also an attempt at the construction of a multi-factorial model did not provide any expected result. Such a situation was most probably caused by a too high wind velocity found in the analyzed object.
Keywords: forestry / stand / damage / wind
1. INTRODUCTION
Wind, as an abiotic destructive factor, has always been affecting forests. The resulting damage does not bring losses to forests which have not been covered by forest management systems. In such a case wind is a factor which destroys some trees, but at the same time it provides other organisms an opportunity to develop (Gwiazdowicz 2006). Wind damage in forests has occurred since the implementation of forest management, particularly planned management starting from the 18th century (Broda 2000). Since then we have been trying to gain insight into factors influencing stand resistance to the action of wind.
Among numerous factors affecting wind stand resistance we need to mention: • Location in space (PUCHNIARSKI 2003 after ZAJĄCZKOWSKI 1991), • relief (DOMINIK 1977, PUCHALSKI-PRUSINKIEWICZ 1990), • species composition of the stand (DOMINIK 1977, UKLEJA 1986, ZACHARA 2006, JAWORSKI 1995
AFTER BAUEREM 1968),
* Corresponding author: [email protected], Uniwersytet Przyrodniczy w Poznaniu, ul. Wojska Polskiego 28, 60-637 Poznań

Science for Sustainability University of West Hungary International Scientific Conference for PhD Students March 19-20, 2013 – Győr
258
• root system structure and the substrate from which the tree is growing (BRÜNIG 1977, DOMINIK 1977, PUCHALSKI-PRUSINKIEWICZ 1990, ZACHARA 2006),
• stand height (BRÜNIG 1977, DOMINIK 1977), • crown dimensions (BRÜNIG 1977, DOMINIK 1977, PEŘINA ET AL. 1968), • slenderness (BRÜNIG 1977, RYMER-DUDZIŃSKA 1992), • closure and aerodynamic canopy roughness (BRÜNIG 1977, DOMINIK 1977, JAGODZIŃSKI-
OLEKSYN 2009 AFTER ZAJĄCZKOWSKI 1991). The above review presents the effect of a single factor on the modification of wind stand
resistance. It is practically impossible to identify a single factor when searching for causes of damage in an actual object. As a rule the resistance of a stand to the action of air masses is modified by a complex of factors occurring in a given time. Thus the best solution would be to search for a set of factors resulting in a weakening of the examined object rather than one single characteristic. Such an analysis was conducted in Germany in the area affected by the Lothar hurricane in December 1999. When searching for a causative factor logistics regression and conditional probability were applied (SCHINDLER et al. 2009).
2. MATERALS AND METHODS
2.1. Study area
The study area was located in south-western Poland and was found entirely within the administrative boundaries of the Dolnośląskie province. Location of the study area was determined by the previous occurrence of considerable wind damage in forested areas. These criteria were met by two neighboring forest divisions, i.e. Oleśnica Śląska and Syców. Both forest divisions in the affected areas are characterized by similar site conditions and the predominance of Scots pine (Pinus sylvestris L.) in the stands. For the purpose of this study the Ligota Polska forest district (the Oleśnica Śląska forest division) as the area, which will be used to construct a model forecasting wind damage. Two forest districts (Komorów and Wioska) located in the Syców forest division were selected as test areas.
2.2. Source of data
Data required for the analysis were collected from the Information System of the State Forests (SILP), gathered at the forest district level and from tables comprising areas affected by wind damage as a result of the hurricane of 30.05.2005. These data were made available to the Department of Forest Management within the framework of the project “Relationships between wood volume and quality and stability of pine stands” commissioned by the General Directorate of the State Forests.
The SILP data base exported to the *.mdb format contained information on the site and the stand. A list of affected areas in the *.xlsx format comprised forest compartments which were affected by the gale wind. These data, being incorporated in different tables within the data base and in a separate spreadsheet file, needed to be processed prior to further analyses. The aim was to retrieve such information as: a) damage – contains information on damage in the form of notation “yes” for the stand with
wind damage and “not” for the stand with no wind damage, b) TSL – forest site type, abbreviations in accordance with the Site Foundations of Silviculture
(2003), written in capital letters with no Polish letters used, c) Moisture content – moisture level site groups (dry, fresh, moist, marshy),

Science for Sustainability University of West Hungary International Scientific Conference for PhD Students March 19-20, 2013 – Győr
259
d) Trophic character – trophic groups of sites (coniferous forests, mixed coniferous forests, mixed deciduous forests, forests, flood plain forests),
e) Soil type – soil type written as abbreviation in accordance with the Site Foundations of Silviculture (2003),
f) area – information on the area of compartments in hectares, g) dominant species – species with the highest share in the stand, h) dominant species share – a symbol of dominant species with its share denoted as a number
from 1 to 10, i) age class – based on information contained in the column “age of the main trees species” age
class was specified, j) diameter at breast height of the main species – information on diameter at breast height of the
main species expressed in centimeters, k) height of the main species – the column contains information on height of the main species
expressed in meters, l) slenderness of the main species – value calculated based on the ratio of height of the main
species to the diameter at breast height of the main species, m) stand volume – total volume of the whole stand expressed in m3·ha-1, n) quality class – the column contains information concerning quality class of the main species, o) closure – information concerning stand closure (full crown closure, moderate closure, broken
crown closure, open canopy), p) stocking – the entry concerning stocking rate in a given compartment.
Based on data from the Ligota Polska forest distict the basic statistics were prepared and more detailed analyses were conducted. In turn, wind damage risk was estimated based on identical data for the Komorów and Wioska forest districts.
2.3. Methodology of calculations
Statistical analysis was divided into several stages, which aim was to successively characterize the Ligota Polska forest district as an area affected by wind damage and indicate one or several variables having a statistically significant effect on the observed damage. All statistical calculations were prepared in two programs, EXCEL – Microsoft Office and STATISTICA 8 – StatSoft. Theoretical foundations for the calculations were based on such sources as: • Introduction of statistics for naturalists. ŁOMNICKI A. (2007), • User-friendly course in statistics using STATISTICA PL based on problems in medicine.
Stanisz A. (1998), • And a series of articles published in a journal Medycyna Praktyczna:
http://www.mp.pl/artykuly/index.php?lid=356&all=1 The first calculated statistics concerned quality traits characterizing each forest
compartment. For this purpose for such traits as forest site type, fertility and moisture content site class, soil type, dominant species, age class, quality of the main species, stocking the following parameters were determined: • area of individual groups, • percentage of individual groups, • area of wind-damaged stands classified to individual groups, • percentages of wind-damaged areas in the total wind-damaged area, • percentages of wind-damaged areas within individual groups.
The above mentioned analyses indicated stands, which to a greater extent were affected by gale winds. Such statistics did not provide information whether there is a relationship between a given quality trait and the occurring damage. For this purpose it was necessary to construct contingency tables containing information on the numbers of compartments in the analyzed group

Science for Sustainability University of West Hungary International Scientific Conference for PhD Students March 19-20, 2013 – Győr
260
divided into areas with no wind damage and with wind damage. The value of the χ2 statistics was specified, indicating a significant effect of the analyzed trait on the occurrence of damage at p≤0.05 or a lack of a significant effect at p>0.05. Moreover, the Cramér coefficient (V) was calculated, indicating a lack of dependence between analyzed traits, when V=0 and strong correlation of the analyzed traits at V=1.
For each trait (diameter at breast height, height, slenderness, stand volume, stocking) the logistics regression analysis was conducted. Calculations were performed in the STATISTICA program, module Non-linear estimation option Rapid logistics regression. This analysis aimed at the determination whether a statistically independent variable has a significant effect on the dependent variable ’damage’. When a statistically significant effect was observed at p≤0.05, the logistics regression equation was introduced. In order to verify the goodness of fit of the model to analyzed data The table of observed and expected results and pseudo R2 coefficient were prepared. At a lack of a statistically significant effect of the independent variable on the occurrence of damage no further steps were performed.
The construction of the model was initiated by the selection of traits which may have a significant effect on the occurrence of damage. This selection was aided by the previously conducted analyses. This process was performed in the module of the STATISTICA package concerning Generalized linear and non-linear models. Selected traits were introduced to the model and next the program - using the method of the best subsets - constructed and evaluated all the potential combinations of models. Based on this list models composed of three and six independent variables were constructed.
In the next stage based on the selected combinations of variables the model of logistics regression was constructed. At this stage it was assessed whether all traits jointly have a statistically significant effect on the variable ’damage’. In case of a lack of a statistically significant effect at p>0.05 a given variable was eliminated and the model was constructed from the beginning. When all traits showed a statistically significant effect on the dependent variable the logistics regression equation was derived and the model was evaluated in terms of goodness of fit. The table of observed and expected results and the pseudo R2 coefficient were applied in the evaluation of goodness of fit.
The last stage consisted in testing of the model on the new data base. Testing was conducted using data from the Komorów and Wioska forest districts (the Syców forest division) prepared similarly as it was the case with the data from the Ligota Polska forest district. An additional action was connected with the introduction of codes for quality variables to those tables. These data were used to calculate the risk of damage in individual compartments. Calculations after the substitution of values to logistics regression equations yielded a series of numbers, which needed to be rounded to 1. This action led to the denotation in the form of a series of 0 and 1. The 0 value meant a lack of estimated damage in a given compartment, while 1 meant that a given stand was estimated to suffer no damage. In order to evaluate goodness of fit to the new data base a table of observed and expected results was prepared.
3. RESULTS
In the Ligota Polska forest district a total of 47.05% stand area out of the analyzed 1061.81 ha was damaged.
Analysis of quality traits showed that in the case of forest site type, fertility site class, moisture content site class and age class the greatest damage was observed in the stands, which area within one trait was the greatest. In the case of the other quality traits (soil type, main species, quality class, closure) there was no relationship between the greatest area of homogeneous stands in terms of one trait and the volume of damage in those stands.

Science for Sustainability University of West Hungary International Scientific Conference for PhD Students March 19-20, 2013 – Győr
261
Such a presentation of results does not indicate whether there is a dependence between observed damage and the analyzed trait. After the calculation of the Chi^2 coefficient it turned out that for all quality traits there is a dependence between suffered damage and the analyzed trait. Further analysis of these dependencies indicated a weak interdependence (moisture content site class, age class, quality class, stand closure) or moderate interdependence (forest site class, fertility site class, soil type, species) between analyzed traits.
In the case of quantitative traits such as stand volume and stocking no statistically significant relationship was found between damage and the analyzed trait. In the case of the other traits (diameter at breast height, height, slenderness) a statistically significant relationship was observed between occurring damage and the analyzed trait. However, the calculated pseudo R2 coefficient (the McFaden index) indicated a weak (diameter at breast height R2=0.04; slenderness R2=0.01) or low (height R2=0.10) correlation between the analyzed trait and occurring damage.
The logistics regression model should be characterized by the possibly greatest goodness of fit to data at the simultaneously maintained simplicity. Thus prior to the construction of the model using the best subset method it was necessary to select required independent variables. Initiating the analysis the following variables were selected: • dependent variable: stand damage • independent variables: forest site type, trophic character, moisture content, soil type, dominant
species, age of main species, diameter at breast height of the main species, height of the main species, slenderness of the main species, stand volume, quality class of the main species, closure, stocking.
As a result of the construction of the model with the use of the best subset method two models with different numbers of independent variables were selected. Based on these variables two models of logistics regression were constructed.
Analysis of logistics regression with six independent variables (forest site type, height of the main species, slenderness of the main species, quality class of the main species, closure, stocking) showed a lack of statistical significance (p>0.05) of two variables, i.e. slenderness of the main species and closure. Thus it was necessary to gradually eliminate one variable first. As a result of the elimination of the variable slenderness of the main species a model with a non-significant free term (p>0.05). This model is as follows:
This model is characterized by good goodness of fit to data (70.21% correctly predicted
values). In contrast, the pseudo R2=0.1890 shows a weak relationship between stand damage and analyzed traits.
Analysis of regression with three independent variables (forest site type, height of the main species, quality class of the main species) showed all these traits to be statistically significant (p≤0.05). This model is presented by the following equation:
This model is characterized by good goodness of fit to the analyzed data and in 71.95% cases it
correctly predicted an event. Despite good goodness of fit the correlation between damage and analyzed trait is weak (pseudo R2=0.2059).
Models of logistics regression constructed on the basis of data from the Ligota Polska forest district were tested on data collected from SILP for the Komorów and Wioska forest districts. These models are characterized by an inferior goodness of fit to analyzed data. The model composed of five independent variables correctly predicts the occurrence of damage in a new object in 47.19% and it is a decrease by 23.02% in comparison to the model based on original data.

Science for Sustainability University of West Hungary International Scientific Conference for PhD Students March 19-20, 2013 – Győr
262
In the case of the model based on three independent variables the model shows goodness of fit at 49.76% and it means a reduction by 22.19%. As it may be observed from the above data the model based on three variables - despite its simplicity - seems to be superior.
4. CONCLUDING REMARKS
The results presented above do not identify any one factor apart from wind, which would be highly significantly connected with the suffered damage. Thus further analysis of data was performed, aiming at the identification of a set of factors, which as a group are more strongly connected with the suffered damage in analyzed stands. However, even this approach did not provide expected results. Such a situation was most probably caused by high wind velocity having an impact on the analyzed stands. Boundary values are considered to be 89 km·h-1 in the Beaufort scale or 100 km·h-1 according to BRÜNIG (1977). It is assumed that no stand is an obstacle for a wind blowing with such a velocity. This hypothesis seems to be confirmed by information presented on a website discussing sudden weather phenomena (http://lowcyburz.pl), according to which the velocity of wind blowing on 30.05.2005 in the area of Oleśnica ranged from approx. 100 to 130 km·h-1. Also the results of these analyses may indicate that this velocity was crucial for the occurrence of damage. In the analyzed stands the greatest damage was as a rule connected with the greatest area share of the analyzed trait.
As it results from these considerations, stand resistance to the action of wind is a derivative of very many factors. Wind was the most significant factor, particularly its velocity. For this reason forest management may only to a limited extent modify stand resistance to the action of wind. References BRODA, J. (2000): Okres przedrozbiorowy [The period before 1792]. In: BRODA, J.: Historia leśnictwa w Polsce
[History of forestry in Poland]. Wydawnictwo Akademii Rolniczej im. Augusta Cieszkowskiego, Poznań (in Polish).
BRÜNIG, E.F. (1977): Produkcyjno-ekologiczne i hodowlane wnioski z katastrofy huraganowej w dniu 13 listopada 1972 r [Production, ecological and silvicultural conclusions from the hurricane disaster of 13 November 1972]. Sylwan 4: 15-30 (in Polish).
DOMINIK, J. (1977): Ochrona lasu przed ujemnym działaniem czynników natury nieożywionej [Forest proteciton against the negative effect of inanimate natural factors]. In W: Dominik, J. Ochrona lasu [Forest protection]. PWRiL, Warszawa (in Polish).
JAGODZIŃSKI, A.M. – OLEKSYN, J. (2009): Ekologiczne konsekwencje hodowli drzew w różnym zagęszczeniu [Ecological effects of tree culture at various stocking rates]. III. Stabilność drzewostanu, fitoklimat i różnorodność biologiczna [Stand stability, phytoclimate and biodiversity]. Sylwan 4: 219-230 (in Polish).
GWIAZDOWICZ, D.J. (2006): Ochrona lasu a ochrona przyrody [Forest protection and nature protection]. In W: GWIAZDOWICZ, D.J. (ed.): Gospodarka leśna a ochrona przyrody [Forest economy and nature protection]. PTL, Poznań (in Polish).
JAWORSKI, A. (1995): Skale wymagań ekologicznych oraz charakterystyka wybranych cech hodowlanych drzew i niektórych krzewów leśnych [Ecological requirement scales and characteristics of selected breeding traits of trees and selected froest shrubs]. In W: JAWORSKI, A. Charakterystyka hodowlana drzew leśnych [Breeding characteristics of forest trees]. Gutenberg, Kraków (in Polish).
Lasy PAŃSTWOWE (2003): Siedliskowe podstawy hodowli lasu [Site foundations of silviculture] (in Polish). ŁOMNICKI, A. (2007): Wprowadzenie do statystyki dla przyrodników [Introduction to statistics for
naturalists]. PWN, Warszawa (in Polish). NADLEŚNICTWO OLEŚNICA ŚLĄSKA (2010): Biuletyn Informacji Publicznej. Oleśnica Śląska, Poland. Online:
http://bip.lasy.gov.pl/pl/bip/dg/rdlp_wroclaw/nadl_olesnica_slaska NADLEŚNICTWO SYCÓW (2010): Strona internetowa Nadleśnictwa. Syców, Poland. Online:
http://sycow.poznan.lasy.gov.pl/index.html
Science for Sustainability University of West Hungary International Scientific Conference for PhD Students March 19-20, 2013 – Győr
263
PEŘINA, V. – CHROUST, L. – KADLUS, Z. (1968): Nowe doświadczenia nad zabezpieczeniem drzewostanów przed klęskami wiatro- i śniegołomów [New experiences in stand protection againt wind- and snowfall disasters]. Sylwan 6: 29-44 (in Polish).
PUCHALSKI, T. – PRUSINKIEWICZ, Z. (1990): Położenie, klimat i gleba jako części składowe siedliska determinujące jego właściwości [Location, climate and soil as site components determining its properties]. In W: Puchalski, T. - Prusinkiewicz, Z. Ekologiczne podstawy siedliskoznawstwa leśnego [Ecological foundations of silvics]. PWRiL, Warszawa (in Polish).
PUCHNIARSKI, T.H. (2003): Klęski żywiołowe w lasach [Natural disasters in forests]. PWRiL, Warszawa (in Polish).
POLSCY ŁOWCY BURZ (2010): Forum użytkowników. Poland. Online: http://lowcyburz.pl RYMER-DUDZIŃSKA, T. (1992): Smukłość drzew w drzewostanach sosnowych [Tree slenderness in pine
stands]. Sylwan 11: 35-44 (in Polish). SCHINDLER, D. – GREBHAN, K. – ALBRECHT, A. – SCHÖNBORN, J. (2009): Modelling the wind damage probability
in forest in Southwestern Germany for the 1999 winter storm 'Lothar'. Int. J. Biometeorol 53: 543-554. STANISZ, A. (1998): Przystępny kurs statystyki w oparciu o program STATISTICA PL na przykładach z
medycyny [User-friendly course in statistics using STATISTICA PL based on problems in medicine] . StatSoft, Kraków (in Polish).
STANISZ, A. (2000, 2001, 2002): Podstawy statystyki dla prowadzących badania naukowe [Foundations of statistics for researchers]. Medycyna Praktyczna. Kraków, Poland (in Polish). Online: http://www.mp.pl/artykuly/index.php?lid=356&all=1&s=1
UKLEJA, D. (1986): Postępowanie hodowlane a odporność drzewostanów na działanie wiatru [Breeding procedures and wind resistance of stands]. Sylwan 4: 7-14 (in Polish).
ZACHARA, T. (2006): Problem szkód w lasach powodowanych przez śnieg i wiatr oraz sposoby przeciwdziałaniu im [Snow and wind damage in forests and prevention methods]. Sylwan 10: 56-64 (in Polish).
Nutrient Supply in Short Rotation Coppice
SZABÓ Orsolya* –KOVÁCS Gábor –HEIL Bálint
Universitiy of West Hungary, Faculty of Forestry, The Institute of Environment and Earth Sciences, Sopron, Hungary * [email protected]; H-9400 Sopron, Ady E. út 5.
Abstract – The woody biomass is one of the most important renewable energy sources in Hungary. Nowadays, the claim for biomass energy is continuously growing - even if the technical modifications in power plants are complex and costly. In spring 2011 we’ve created a 5 ha experimental woody short rotation coppice in the Nursery of Dejtár, Forestry of East Cserhát. Our goal is to determine a practicable fertilization technology and to evaluate the effects on the yield and its implications for economic management. Among the tested clones had already occurred significant differences in the emergence rate and growth in the first year.
Keywords: energy / plantations / biomass / woodash
1. INTRODUCTION
Nowadays, the demand for energy production from biomass is constantly increasing, even if the technical solutions of the energy-plantations are complex and expensive.
The energy-plants are buying wood in increasing quantity, generate energy by burning it and that results gradually in rising growth area of the energy plantations (ERTI 2011).

Science for Sustainability University of West Hungary International Scientific Conference for PhD Students March 19-20, 2013 – Győr
264
In our country 3700 ha woody plantations has been realized so far for energetic purpose more or less successfully. A lot of research started in the last few years as we can adjudge this growing technical innovative from every aspect (LEIBHARD 2009).
1.1. Availability of literature
About the traditional forms of nutrient supply, such as organic fertilization and its effects, the domestic and international literature is available in large quantities. However, there is only a limited number of domestic resources, which describe the use of wood ash and the combination with organic fertilizers.
1.2. Research targets, possibilities for application
We examine the technological steps, reaction for soil and flora of nutrient supply with wood-ash. As wood-ash contains nitrogen just in a small compass, that’s why it must be combined with organic fertilizer in order to maintain proper element proportions. Our goal is to determine a practicable fertilization technology and to evaluate the effects on the yield and its implications for economic management. We make proposals for the energetically purpose short rotation coppice and its use in traditional forestry.
2. EXAMINATION METHOD
After the development of the experimental area, continuous soil and plant analysis, yield measurements and other ecological studies were performed, e.g. measures of diameter at ground level and at breast hight, rate of growth, estimation of leaf area index and yield. We examine the the growth and physiological characteristics of different poplar clones, as well as the useable technologies to maintenance and establishment of the plantation. The soil and plant analysis are done once a year, the growth and ecological studies are carried out on a timely basis. The three-fold repetition and the number of designed elements allow statistical analysis. We are looking for answers in the assessment of ecological factors (soil, hydrology, rainfall, humidity, etc), the growth of different clones, health status, and nutrient supply.
2.1. Materials and methods
As already outlined, the the practical implementation of our operational research program is carried out in an experimental field. We pressed into service 5 ha yield of the Nursery of Dejtár, Forestry of East Cserhát. Spring of 2011 the experimental plots were selected in Latin square arrangement with three-fold repetition.
2.1.1. Assessment of nutrient supply
In the initial phase of the research we analysed the elemental composition of wood-ash and organic fertilizer. We perform the addition assessment in the following year when we compare the efficiency of nutrient supply to the conditions of control plots.
2.1.2. Examination methods
Soil testing, site survey Before the establishment of the plantation we made a site survey to define the groundwater
level and the basic levels of nutrient supply to be used. Yield measurements

Science for Sustainability University of West Hungary International Scientific Conference for PhD Students March 19-20, 2013 – Győr
265
In the second week after planting we measured the growth of the cuttings. We set up four categories, and enumerated 2 lines of every parcel according to the mentioned factors and afterwards we evaluated them statistically. Nutrient supply
We took leaf samples from every single parcel of every single treatment form and than they were milled. We did nitrogen %, total phosphorus, element content analysis, potassium tests. Leaf area index Dendrometrical measurements
Continuous tree height, measures of diameter at ground level and at breast hight, in the interest of drawing long term inference.
Groundwater level measurements (Automatic soil water level measurements in a groundwater well, automatic TDR – measurements in 4 different depths) Economical evaluations
3. RESULTS
The soil type was a haplic Arenosol, dystric, petrogleyic, with a groundwater level within 2 meters to the surface, and a sandy texture. Conditions are proper for the aim of our research. The initial growth of the clones depend mainly on the weather conditions, e.g. the rainfall. In later stages, when the roots become more developed and they reach the groundwater, they can accelerate the growth. Significant differences in growth of the different clones have occurred already in the first year. Best performance was shown by the poplar clones AF2 and Monviso, growth was weaker by Pannonia, and the willow Dékány completely fell out. A much higher proportion of the big sized cuttings (2-3 m) survived after planting, then of the stem cuttings.
The nutrient supply with organic fertilizers has already shown some positive differencies in growth for the first year, but its rate is low. The leaf area index for the big sized cuttings (2-3 m) was also the best value. The stem cuttings showed an order of Monviso> AF2 > Pannonia, which means that the Italian clones also performed better in this aspect.
3.1. Survival rate of the cuttings
Our surveys have shown that, due to the extremely dry spring of the year 2012 and also that of 2011, replanting was much less successfull (overall survival rate 9%) than the cutting back of stems (overall survival rate 69%). For a clear reason the lack of rainfall and therewith parallel very hot spring weather took the responsibility. Differencies could be experienced between the different clones, namely in the case of cut-back AF-2 with 77%, Monviso with 69% and Pannonia Euramerican poplar with a 50% survival rate.
3.2. Height growth measurements
At the 6th of August 2012 – at an intermediate state – height and diameter at ground level measurements were performed.
Independently of the type of propagation material the height growth correlates with different treatments uniquivocally positivly. Thus the highest avarage height was measured in plots treated with woodash and in theorganic fertilized plots. The second highest growth was found in the manured plots which have exceeded the growth of the woodash treated plots by 6-12% for both of big sized cuttings (425 cm) and short cuttings (146 cm) respectively. If we compare only the plots established with short cuttings, we can see that the treatment with organic fertilizer exceeds the woodash treatment with about 10% in point of height growth.
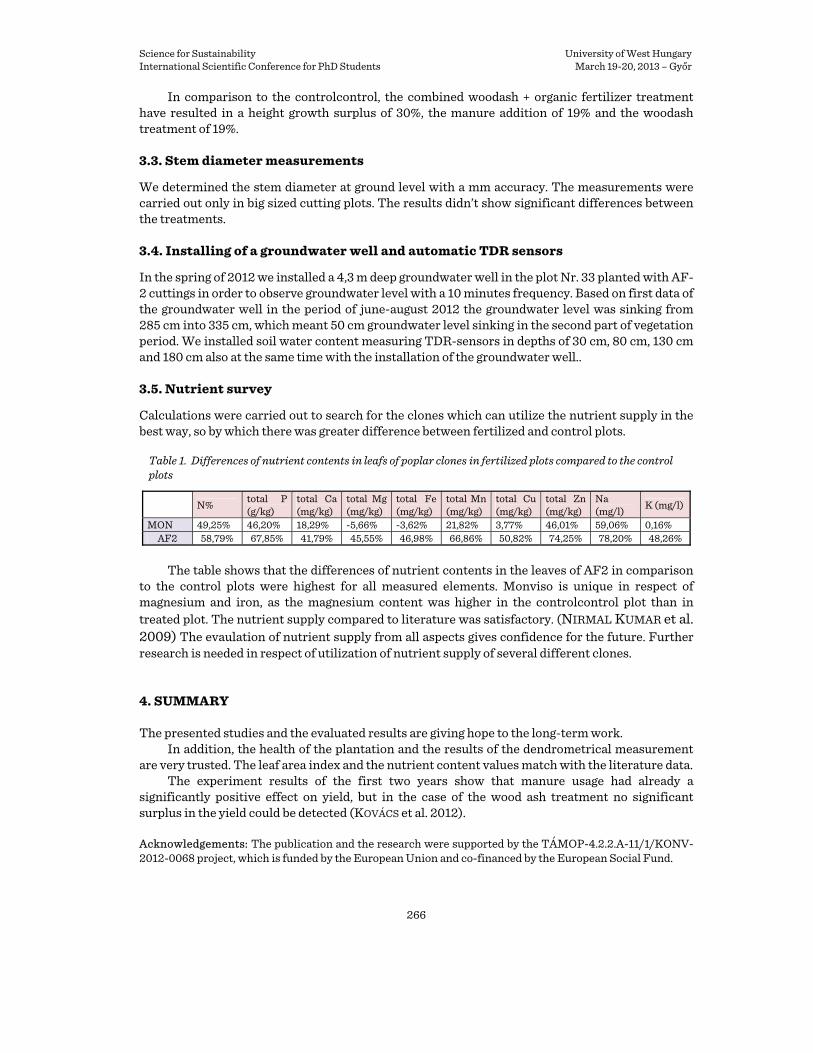
Science for Sustainability University of West Hungary International Scientific Conference for PhD Students March 19-20, 2013 – Győr
266
In comparison to the controlcontrol, the combined woodash + organic fertilizer treatment have resulted in a height growth surplus of 30%, the manure addition of 19% and the woodash treatment of 19%.
3.3. Stem diameter measurements
We determined the stem diameter at ground level with a mm accuracy. The measurements were carried out only in big sized cutting plots. The results didn’t show significant differences between the treatments.
3.4. Installing of a groundwater well and automatic TDR sensors
In the spring of 2012 we installed a 4,3 m deep groundwater well in the plot Nr. 33 planted with AF-2 cuttings in order to observe groundwater level with a 10 minutes frequency. Based on first data of the groundwater well in the period of june-august 2012 the groundwater level was sinking from 285 cm into 335 cm, which meant 50 cm groundwater level sinking in the second part of vegetation period. We installed soil water content measuring TDR-sensors in depths of 30 cm, 80 cm, 130 cm and 180 cm also at the same time with the installation of the groundwater well..
3.5. Nutrient survey
Calculations were carried out to search for the clones which can utilize the nutrient supply in the best way, so by which there was greater difference between fertilized and control plots.
Table 1. Differences of nutrient contents in leafs of poplar clones in fertilized plots compared to the control plots
The table shows that the differences of nutrient contents in the leaves of AF2 in comparison
to the control plots were highest for all measured elements. Monviso is unique in respect of magnesium and iron, as the magnesium content was higher in the controlcontrol plot than in treated plot. The nutrient supply compared to literature was satisfactory. (NIRMAL KUMAR et al. 2009) The evaulation of nutrient supply from all aspects gives confidence for the future. Further research is needed in respect of utilization of nutrient supply of several different clones.
4. SUMMARY
The presented studies and the evaluated results are giving hope to the long-term work. In addition, the health of the plantation and the results of the dendrometrical measurement
are very trusted. The leaf area index and the nutrient content values match with the literature data. The experiment results of the first two years show that manure usage had already a
significantly positive effect on yield, but in the case of the wood ash treatment no significant surplus in the yield could be detected (KOVÁCS et al. 2012).
Acknowledgements: The publication and the research were supported by the TÁMOP-4.2.2.A-11/1/KONV-2012-0068 project, which is funded by the European Union and co-financed by the European Social Fund.
N% total P (g/kg)
total Ca (mg/kg)
total Mg (mg/kg)
total Fe (mg/kg)
total Mn (mg/kg)
total Cu (mg/kg)
total Zn (mg/kg)
Na (mg/l) K (mg/l)
MON 49,25% 46,20% 18,29% -5,66% -3,62% 21,82% 3,77% 46,01% 59,06% 0,16% AF2 58,79% 67,85% 41,79% 45,55% 46,98% 66,86% 50,82% 74,25% 78,20% 48,26%

Science for Sustainability University of West Hungary International Scientific Conference for PhD Students March 19-20, 2013 – Győr
267
References ERTI (2011): Fás szárú energetikai faültetvények tápanyagforgalmának és tápanyagpótlásának vizsgálata.
[Nutrient cycling and supply investigations in woody energy plantations.] Online: http://erti.hu/fas-szaru-energetikai-faultetvenyek-tapanyagforgalmanak-es-tapanyagpotlasanak-vizsgalata.html. (in Hungarian)
KOVÁCS, Gábor - BALLA, Zoltán – KITH, Károly – CSATÁRI, Nádor – HEIL, Bálint (2012): Nutrient status examinations in short rotation coppice. 12th Alps-Adria Scientific Workshop
LIEBHARD, Peter (2009): Energetikai faültetvények. [Energy plantations.] Cser Kiadó, Budapest. 76-79. (in Hungarian)
NIRMAL KUMAR, J. I. – KUMAR, R. N. – KUMAR BHOI, R. – SAJISH, P. R. (2009): Quantification of nutrient content in the aboveground biomass of teak plantation in a tropical dry deciduous forest of Udaipur, India. Journal of Forest Science, 55, 2009 (6): 251–256.
Sustainable Forest Management in Latvian State-Owned Forests
ZALITE, Zintaa9 –AUZINA, Anitaa a Latvia University of Agriculture, Jelgava, Latvia
Abstract – Forest is a priceless natural treasure that provides economic, social and ecological benefits. This study is relevant and topical, because living conditions in present and future depend on sustainable forest management. To explore what kind of factors influences sustainable forest management authors have calculated socio-economic value of forests in Latvia. In this study, data from national forest inventory was used; it provides the most current and accurate information on the situation in Latvian forests, and the methodology of P. Zalitis was used to calculate the socio-economic value of state-owned forests. The socio-economic value of Latvian state forests is LVL 4.4 billion. Main conclusion of this study is - state-owned forests are managed sustainable. Forest sustainability depends mostly on the standing volume of the stand and its ecological value. The most sustainable managed forests are located in Eastern and North-eastern part of Latvia. Main problem in Latvian state-owned forests are overgrown forest stands, which interfere sustainable forest management. Keywords: socio-economic value / national forest inventory / forestry
1. INTRODUCTION
Latvia has no minerals, oil or mountains, but it has “green gold” - the forests, and sustainable forest management can insure maintenance of this priceless treasure. Also, forests play a very important role in the Latvian economy; therefore it is topical today to research their value, since forests are not only source of timber, but also a producer of oxygen and a constantly evolving ecosystem.
Forest provides economic, social and ecological benefits. Sustainable forest management includes evaluation of those basic values - social, ecological and economic. Forest owners need to evaluate all the functions of the forest and to understand their social, economic, and ecological significance (KLIMMINS 1997). The results of the analysis can be used in the development and improvement of normative acts and in the drafting of new acts (BETTINGER et al. 2009).
9 Corresponding author: [email protected]; Latvia University of Agriculture 2 Liela Street, Jelgava, LV-3001, Latvia

Science for Sustainability University of West Hungary International Scientific Conference for PhD Students March 19-20, 2013 – Győr
268
The structure and breakdown of forest property ownership in Latvia has been changing since the beginning of 20th century according to the political environment in the country. The most recent significant changes took place in 1999, when State to Joint Stock Company (JSC) “Latvia’s State Forests” delegated forest management functions. 50.3% of all Latvian forests are state-owned and the remaining 49.7% are under different ownership. With 3.8 million ha of forests (56.9 % of territory) Latvia is among the most wooded countries in Europe (Latvia’s State Forests..., 2011).
The aim of this study is to evaluate sustainable forest management of state-owned forests and to develop recommendations to increase it.
To achieve the aim following objectives are formulated: 1. To explore forest socio-economic value of state-owned forests in Latvia; 2. To evaluate which main factors affects forest sustainability; 3. To develop recommendations for increase of forest sustainable management of state
owned forests.
2. MATERIAL AND METHODS
National forest inventory (NFI) is a new way of obtaining information about forests in Latvia. One can obtain two types of information from it: first, statistical reports on state forest resources, and second, a large database for a more in-depth research on forest stand or tree level.
From 2004 to 2008, during the initial stage of NFI, a network of sample plots was created, and statistical information about forest resources in the country was also obtained. The next step of NFI is to re-measure the established ground plot network. The basis of NFI is a sample plot with a constant radius, an area of 500 m2, and a centre that is hidden in the surrounding environment and is fixed with geographical coordinates. The NFI data has a very high scientific value, as it provides in-depth information on Latvian forests (National Forest Inventory ..., 2009).
Dr. hab. silv. Peteris Zalitis has developed a methodology for calculating socio-economic value of the forest. To obtain information on the socio-economic value of state-owned forests in each district, the authors used the methodology of P. Zalitis, who is leading researcher of the Latvian State Forest Research Institute “Silava”.
The two most important components of forest ecosystem regarding forest socio-economic value are forest land and forest stand value: MV=ZV+KV, where MV– forest value, ZV – forest land value, KV – forest stand value. To calculate forest value, the following equation is used:
(Eq. 1) Where:
ZV – economic value of forest land; Kekol – ecological value of forest land; Ksoc – social value of forest land; Vfakt – the current stock volume; Vm – the target stock volume; R – the ratio of the values of wood-produced oxygen and timber products iv – correction coefficient (ZALITIS 2001). Latvia is divided in 109 territorial units - districts. The authors got results of forest socio-
economic value from 107 districts. State-owned forests are not located in two of all districts. 21 districts were analyzed in more detail way. The authors also carried out statistical analysis using descriptive statistics, correlation analysis to find out the statistical significance of factors which influence the socio-economic value.
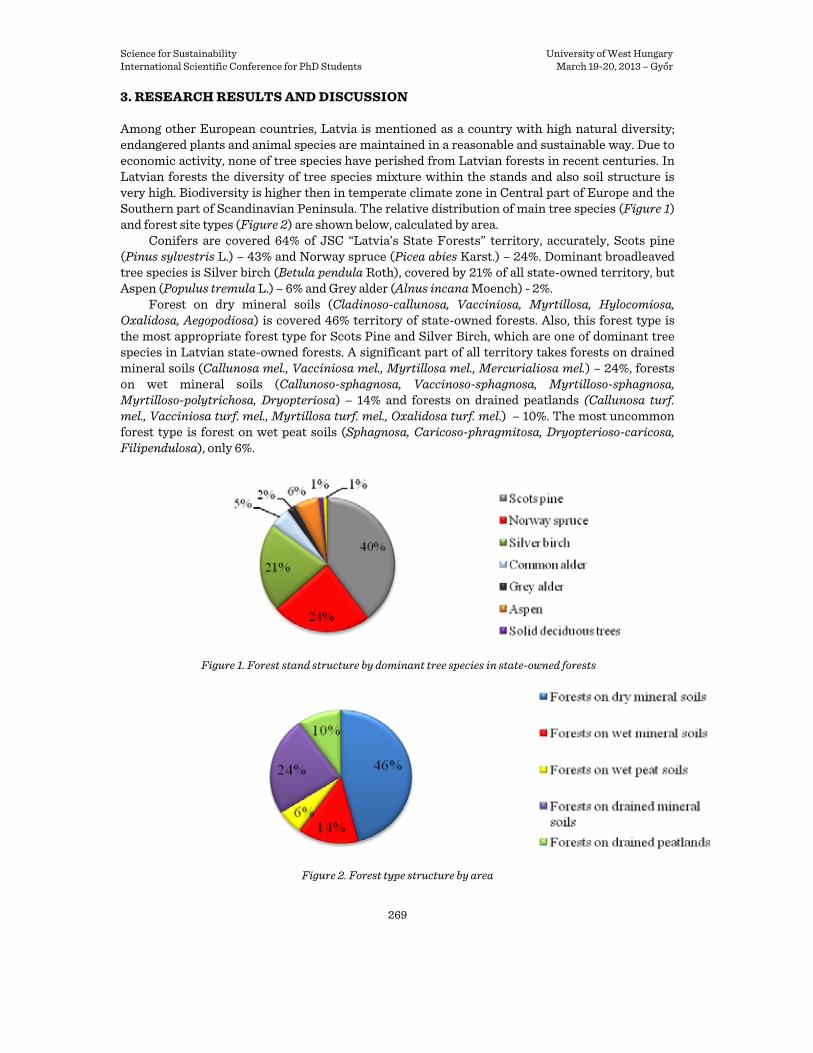
Science for Sustainability University of West Hungary International Scientific Conference for PhD Students March 19-20, 2013 – Győr
269
3. RESEARCH RESULTS AND DISCUSSION
Among other European countries, Latvia is mentioned as a country with high natural diversity; endangered plants and animal species are maintained in a reasonable and sustainable way. Due to economic activity, none of tree species have perished from Latvian forests in recent centuries. In Latvian forests the diversity of tree species mixture within the stands and also soil structure is very high. Biodiversity is higher then in temperate climate zone in Central part of Europe and the Southern part of Scandinavian Peninsula. The relative distribution of main tree species (Figure 1) and forest site types (Figure 2) are shown below, calculated by area.
Conifers are covered 64% of JSC “Latvia’s State Forests” territory, accurately, Scots pine (Pinus sylvestris L.) – 43% and Norway spruce (Picea abies Karst.) – 24%. Dominant broadleaved tree species is Silver birch (Betula pendula Roth), covered by 21% of all state-owned territory, but Aspen (Populus tremula L.) – 6% and Grey alder (Alnus incana Moench) - 2%.
Forest on dry mineral soils (Cladinoso-callunosa, Vacciniosa, Myrtillosa, Hylocomiosa, Oxalidosa, Aegopodiosa) is covered 46% territory of state-owned forests. Also, this forest type is the most appropriate forest type for Scots Pine and Silver Birch, which are one of dominant tree species in Latvian state-owned forests. A significant part of all territory takes forests on drained mineral soils (Callunosa mel., Vacciniosa mel., Myrtillosa mel., Mercurialiosa mel.) – 24%, forests on wet mineral soils (Callunoso-sphagnosa, Vaccinoso-sphagnosa, Myrtilloso-sphagnosa, Myrtilloso-polytrichosa, Dryopteriosa) – 14% and forests on drained peatlands (Callunosa turf. mel., Vacciniosa turf. mel., Myrtillosa turf. mel., Oxalidosa turf. mel.) – 10%. The most uncommon forest type is forest on wet peat soils (Sphagnosa, Caricoso-phragmitosa, Dryopterioso-caricosa, Filipendulosa), only 6%.
Figure 1. Forest stand structure by dominant tree species in state-owned forests
Figure 2. Forest type structure by area

Science for Sustainability University of West Hungary International Scientific Conference for PhD Students March 19-20, 2013 – Győr
270
JSC “Latvia’s State Forests” need to ensure sustainable forest management and maintain all tree species and forest types for future generations. Therefore it is so important to calculate not only the forest economic value, but also ecological and social value. According to calculations done by the authors, the socio-economic value of Latvian state-owned forests is LVL 4.4 billion.
The most valuable state-owned forest with a socio-economic value of LVL 294.21 million is situated in the Ventspils district (Figure 3). The Vidzeme region (North-Eastern part of Latvia), which is fragmented into numerous districts, shows examples how districts with large forest areas have forests with a higher socio-economic value than other districts.
In such districts as Gulbene, Madona, Aluksne and Valka, forest values range from LVL 185.12 million to LVL 96.68 million. In South - Eastern part of Latvia, only the Daugavpils district is among top ten highest values, with a forest value of LVL 119.41 million.
The popular assumption that forests must not be felled seems to be wrong, as forest stands lose their value when the stand becomes overgrown, and young and middle-aged forest stands produce more oxygen than overgrown ones. Therefore, harvesting of those forest stands and regeneration of felled areas would increase the social, economic and ecological value of the forest, and the community would benefit from this. People need to understand that forest felling is natural process if the main aim is a valuable forest now and in the future.
The authors carried out statistical analysis to find out the statistical significance of factors which influence socio-economic value. Correlation analysis confirms the assumption that forest stand age and dominant species affect socio-economic value, and that economically valuable trees should be planted as dominant species and species of no significant value should be replaced to get the highest economic benefit from the forest. Valuable species are common Silver birch (Betula pendula Roth), Scots pine (Pinus sylvestris L.), Common oak (Quercus robur L.), European ash (Fraxinus excelsior L.), Norway spruce (Picea abies Karst.), Common alder (Alnus glutinosa Gaerth) and Aspen (Populus tremula L.). By species of no significant value the authors mention species that cannot be sold for profit, for example, Goat willow (Salix caprea).
Figure 3. Ten districts with the highest socio-economic value of Latvian state forests, 2004 – 2008
Overgrown Aspen stands is a problem in state-owned forests. The oldest Aspen stand is 110
years old, but the rotation period for Aspen should normally be 41 years. These Aspen should be felled, which should be unhindered because there are no restrictions on economic activity in that area. The authors suggest growing Hybrid aspen in Latvia instead of common Aspen to harvest energy wood . Latvia has a high potential for growing fast growing Hybrid aspen stands to be used as fuel or high energy wood.
National forest inventory data shows that the oldest state-owned forest is situated in the Cesis district, where the average tree age is 103 years. The socio-economic value there is LVL 3.62 million, and the dominant species are Norway spruce (75%) and Scots pine (25%).

Science for Sustainability University of West Hungary International Scientific Conference for PhD Students March 19-20, 2013 – Győr
271
The youngest forest is located in the Aizkraukle district, its average age is 22 years. The socio-economic value of the forest stand is LVL 0.93 million, including the produced oxygen. Presently species of no significant value are dominant where, namely, Wych elm (Ulmus glabra Huds.) and Goat willow (Salix caprea). The authors recommend that these species should be replaced by valuable species such as Norway spruce and Silver birch.
The authors also recommend that a computer program should be developed for calculatingand forest value and for determining when it will be most profitable to fell forest stands. Based on pre-determined criteria, the program would predict the best time for harvesting of a forest stand. This would allow for the forest stand to be felled when it is most valuable, rather than forest owner having to wait for the end of the rotation period when forest loses value. Provisions on rotation periods stipulated in the Forest Law need to be amended.
Forest land value (Figure 4) and forest stand value (Figure 5) are two important components in the socio-economic value equation, therefore they will be analyzed separately.
Correlation analysis shows that there is a positive, but low correlation between socio-economic value and land value. The most valuable forest land is in the Ventspils district (LVL 28.40 million), the Gulbene district (LVL 13.68 million), and the Daugavpils district (10.56 LVL million. Analysis shows that three districts, Jelgava, Salacgriva and Tukums, have one of the highest forest land values, but not the highest socio-economic values. This means that a high forest land value does not always co-occur with a high socio-economic value.
Figure 4. Ten districts with the highest forest land values, 2004 – 2008
Correlation analysis also shows that the strongest correlation is between forest land value
and the ecological value of forest land: it is the ecological value that affects forest land value most significantly (r=0.885).
Figure 5. Ten districts with the highest forest stand value, 2004 – 2008
According to the data analysis, the most valuable forest stands are in the Ventspils district
(LVL 265.81 million), the Gulbene district (LVL 171.44 million), and the Aluksne district (LVL

Science for Sustainability University of West Hungary International Scientific Conference for PhD Students March 19-20, 2013 – Győr
272
129.11 million). The Gulbene district also has the most valuable overgrown forest stand (LVL 65.53 million). The overgrown stands should be felled and replaced with valuable tree species appropriate for the forest type. Most significantly forest stand value is influenced by standing volume. There is a strong positive correlation between forest stand value and current stock volume (r=0.911).
4. CONCLUSIONS
1. Main problem in Latvian state-owned forests are overgrown forest stands, which interfere sustainable forest management. Harvesting owergrown forest stands and regenerating these areas, socio-economic value will increase.
2. State-owned forest growing in the Ventspils district can be considered the most valuable forest among the forests in all the other Latvian districts, because it has the highest socio-economic valu, forest land value and forest stand value.
3. Out of all the constituent indicators, current stock volume correlates most with forest stand value. There is a strong positive correlation between forest stand value and current stock volume (r=0.911).
4. Out of all the constituent indicators, the ecological value of the forest affects forest land most. There is a strong positive correlation between the value of forest land and the ecological value of a stretch of forest land (r=0.885).
5. SUGGESTIONS
1. JSC “Latvia’s State Forests” should harvest overgrown forest stands and stands with insignificant tree species such as Goat willow (Salix caprea), Wych elm (Ulmus glabra Huds.), Aspen (Popolus tremula L.) and Grey alder (Alnus incana Moench), and regenerate these areas with economically more valuable tree species appropriate for the forest site type.
2. JSC “ Latvia’s State Forests” should develop a program for modeling and estimating when the socio-economic value of a forest stand will be at its highest and when it will be most profitable, based on certain indicators to be fed into the program, while taking into consideration ecological and social functions of the forest.
3. In collaboration with researchers from the Latvian State Forest Research Institute “Silava”, JSC “Latvia’s State Forests” should review the forest stand rotation periods provided for in the Forest Law, develop recommendations to change the provisions, so that harvesting of a forest stand would be allowed when its value is at its highest, rather than having to wait for the end of the rotation period, and submit the recommendations to the government for consideration.
Acknowledgements: Publication and dissemination of research results has been made due to the funding of the ERAF Project “Promotion of scientific activities of LLU”, Contract Nr. 2010/0198/2DP/2.1.1.2.0/10/ APIA/ VIAA/020 References BETTINGER, Pette – BOSTON, Kevin – SIRY, Jacek – GREBNER, Donald L. (2009): Forest Management and
Planning. Academic Press, pp. 29. KLIMMINS, James P. (1997): Forest ecology. A Foundation for Sustainable Management. Printed in the United
States, 1997. p 394.

Science for Sustainability University of West Hungary International Scientific Conference for PhD Students March 19-20, 2013 – Győr
273
“Latvia’s State Forest” Annual Report (2011): “Latvia’s State Forest”. http://www.lvm.lv Accessed: 19 August 2011.
National Forest Inventory report (2009): Salaspils, p 8 ZALATIS, Peteris (2001): The Economic, Ecological and Social Value of Latvia’s Forests as an Irreplaceable
Biosphere Constituent. Mezzinatne, Volume 11, Salaspils. pp. 125. – 151.

Science for Sustainability University of West Hungary International Scientific Conference for PhD Students March 19-20, 2013 – Győr
274
Section 4.2 Current matters of Wildlife Management and Nature Conservation
Natural Secondary Succession in Forest Ecosystems on the Example of Soil Mesofauna – Long Term Researches
SKORUPSKI, Maciej
Poznan University of Life Sciences Department of Game Management and Forest Protection
Wojska Polskiego 71D, PL60625 Poznan, Poland, [email protected] Abstract - Our incomplete knowledge of how tree species affect soils is due to the fact that plant species distribution patterns respond to landscape-scale soil variability arising from other state factors of soil formation (soil age, climate, relief and parent material), which confounds our ability to isolate the effect of plants on soil development. It seems that “common garden” experiments provide an opportunity to minimize most confounding effects. In these experiments, different species are planted in adjacent blocks so that climate, parent material, time, hydrology, topography and previous land use are held relatively constant. This allows direct comparison of the effect of species on soil given similar initial conditions.
This research are conducting on a long-term replicated “common garden” experiment with 14 temperate tree species, including both coniferous and deciduous trees, located at the Siemianice Experimental Forest in western Poland. Mesostigmata order mites were used as the proper indicators in the area. Predatory mites within the order Mesostigmata are small (100 μm to several mm) microarthropods, mostly dwelling in the air-filled pore space of soil and in the litter layer. They are voracious predators of other microarthropods, nematodes, enchytraeids, springtails, insect larvae and eggs.
Based on the investigations conducted during seven years, it may be stated that: • Mesostigmata mites migrated into the newly established areas primarily from the neighboring old
pine tree stands and the changes that followed were the result of secondary succession of the mites as they responded to progressively larger changes in the forest environment over time caused by individual tree species;
• deciduous and coniferous tree species create differing conditions on the forest floor for the development of soil mites from the order Mesostigmata that affect their species composition and the size of their populations;
• the response of particular mite species, even from the same genus, differed in response to particular tree species;
• the plots with deciduous tree species were characterised by higher diversity in mite species compared to the plots with coniferous species;
• among the plots with coniferous tree species, bigger differences were observed not only in the species composition of mites, but also in their population sizes;
• Common oak, Small-leafed lime, Sycamore and Silver birch were the tree species that created the best conditions for Mesostigmata mite species diversity;
• monocultures of Austrian pine, Douglas fir, Norway spruce (at less fertile forest site) and Common silver fir created the worst conditions for Mesostigmata mite species diversity.
This presentation is based on the research published by SKORUPSKI (2010).

Science for Sustainability University of West Hungary International Scientific Conference for PhD Students March 19-20, 2013 – Győr
275
The Application of GIS Technology in Game Management: a Case Study of Roe Deer (Capreolus capreolus) Management
OSMÓLSKA, Anna*
Faculty of Animal Science, University of Agriculture, Cracow, Poland Abstract – The papers present the opportunities of GIS technology application in wildlife management using the case study of roe deer management within Tuszyma Forest District in Southern Poland. GIS software was used in order to create thematic digital maps presenting such data as: spatial location of boundaries of state, forestry and hunting administration, estimated number of roe deer, district habitat quality, game feeding values, game damage to forests, number and structure of roe deer harvest. GIS technology proved to be a very useful supporting tool for hunters in making wildlife management decisions, which enables to conduct small and large scale spatial and time analyses and thus facilitate the more effective and sustainable game management. Keywords: GIS / hunting / forestry / sustainability
1. INTRODUCTION
GIS (Geographic Information System) is a computerized system that facilitates the phases of entry, analysis and presentation of georeferenced data (DE BY 2001). It is commonly applied in Polish state and forestry administration (KORPETTA et al. 2004) as well as for species conservation purposes (PERZANOWSKI et al. 2008) but it has not yet been used for game management on a large scale.
The responsibility for game management in Poland lies with Polish Hunting Association as well as State Forests administration (Law of Hunting 1995). The cooperation of units of forestry and hunting administration, especially with regard to creating long-term hunting plans, which they are legally obliged to do, is required in order to conduct effective game management. However, it is hindered due to the fact that the boundaries of particular units of these two administrations do not correspond.
Most activities and decisions regarding for hunting practice is undertaken within hunting districts which are the smallest hunting administration units. However, sustainable game management requires large scale spatial and time approach which makes GIS a perfect supporting tool, so far underestimated, as it enables to conduct analyses of georeferenced data in spatial and time aspects.
2. MATERIALS AND METHODS
2.1. Study area
Tuszyma Forest District is located in Southern Poland, in Podkarpackie Voivodeship. There are 8 hunting districts (former numbers: 1, 2, 12, 22, 23, 24, 25, 32) managed by five hunting circles within the area of this forest district. The area of Tuszyma Forest District is located within the perimeter of four counties and eight municipalities (Figure 1).
2.2. Data collection
The landscape data (forest habitat type, soil type) as well as the location of particular units boundaries were shared by forestry and local state administration. Data regarding for game

Science for Sustainability University of West Hungary International Scientific Conference for PhD Students March 19-20, 2013 – Győr
276
damage to forest were shared by Tuszyma Forest District administration. The hunting data, such as estimated number of roe deer, number and structure of roe deer harvested, game feeding values, district quality and species structure of big game harvest were collected from annual hunting plans shared by particular hunting circles.
Figure 1. Location of boundaries of state, forestry and hunting administration units within Tuszyma Forest
District
2.3. Software
Microsoft Office software (databases and spreadsheets) was used for storing and calculating data. Digital maps were created with MapInfo Professional 11.0. Databases were connected to the objects on the digital maps using SQL language.
3. RESULTS
3.1. Estimated number of roe deer
The annual hunting plans created for every hunting district include the information of the estimated number of individuals of every game species inhabiting the area of the district. GIS technology gives the opportunity of presenting numbers of animals in spatial (e. g. comparing numbers in adjoining districts) and time aspect, since the numbers from many years can be shown (Figure 2a). Such presentation may be supporting in investigating the landscape or season factors determining the roe deer number.
3.2. Hunting – ground management
Every hunting district in Poland has been estimated with regard to habitat quality on basis of game numbers, the occurrence of favourable and unfavourable environmental and anthropogenic conditions for game living. Thus, thematic map presenting estimated quality of districts may also be useful for hunting districts managers (Figure 2b).
GIS technology also allows to examine actions undertaken by hunting circles in order to improve the quality of hunting-ground and food supply available for animals so far. In order to
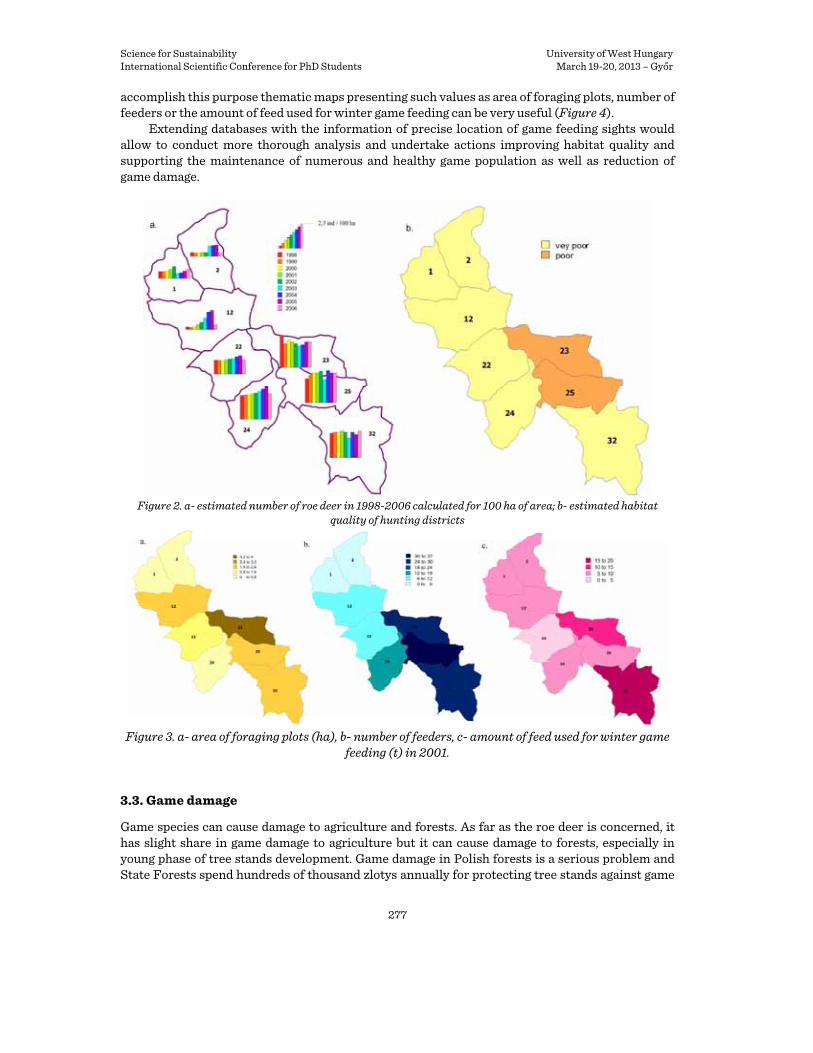
Science for Sustainability University of West Hungary International Scientific Conference for PhD Students March 19-20, 2013 – Győr
277
accomplish this purpose thematic maps presenting such values as area of foraging plots, number of feeders or the amount of feed used for winter game feeding can be very useful (Figure 4).
Extending databases with the information of precise location of game feeding sights would allow to conduct more thorough analysis and undertake actions improving habitat quality and supporting the maintenance of numerous and healthy game population as well as reduction of game damage.
Figure 2. a- estimated number of roe deer in 1998-2006 calculated for 100 ha of area; b- estimated habitat
quality of hunting districts
Figure 3. a- area of foraging plots (ha), b- number of feeders, c- amount of feed used for winter game
feeding (t) in 2001.
3.3. Game damage
Game species can cause damage to agriculture and forests. As far as the roe deer is concerned, it has slight share in game damage to agriculture but it can cause damage to forests, especially in young phase of tree stands development. Game damage in Polish forests is a serious problem and State Forests spend hundreds of thousand zlotys annually for protecting tree stands against game
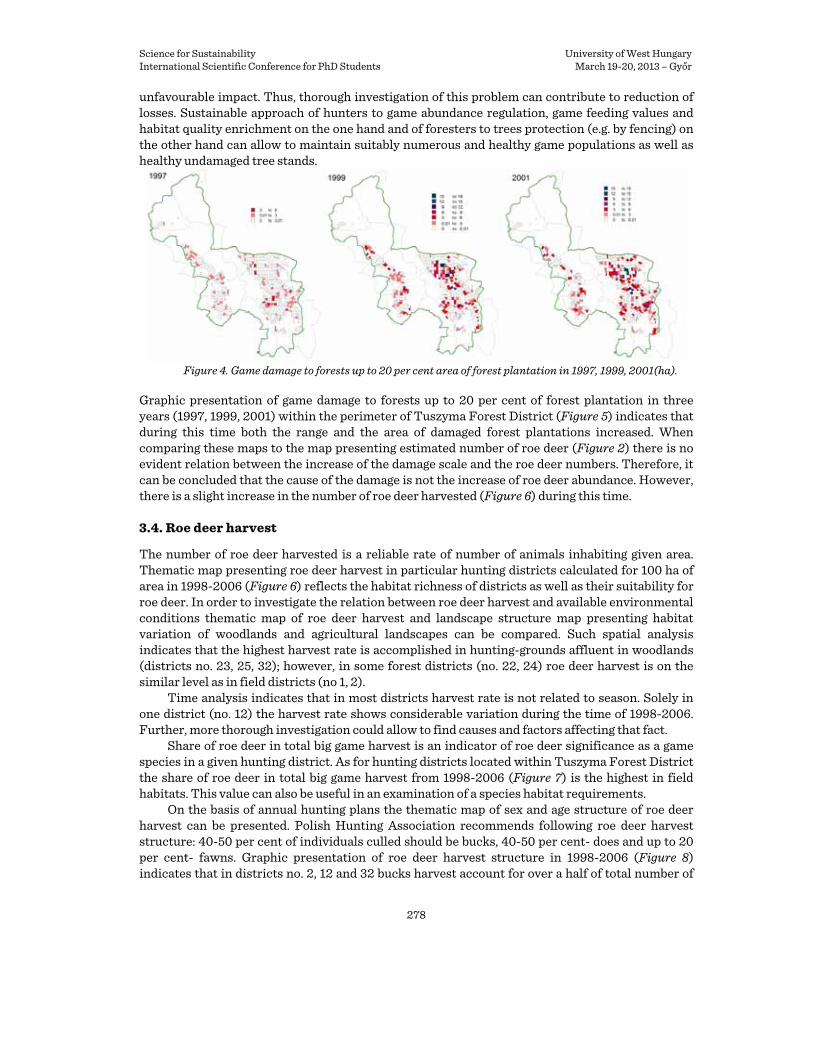
Science for Sustainability University of West Hungary International Scientific Conference for PhD Students March 19-20, 2013 – Győr
278
unfavourable impact. Thus, thorough investigation of this problem can contribute to reduction of losses. Sustainable approach of hunters to game abundance regulation, game feeding values and habitat quality enrichment on the one hand and of foresters to trees protection (e.g. by fencing) on the other hand can allow to maintain suitably numerous and healthy game populations as well as healthy undamaged tree stands.
Figure 4. Game damage to forests up to 20 per cent area of forest plantation in 1997, 1999, 2001(ha).
Graphic presentation of game damage to forests up to 20 per cent of forest plantation in three years (1997, 1999, 2001) within the perimeter of Tuszyma Forest District (Figure 5) indicates that during this time both the range and the area of damaged forest plantations increased. When comparing these maps to the map presenting estimated number of roe deer (Figure 2) there is no evident relation between the increase of the damage scale and the roe deer numbers. Therefore, it can be concluded that the cause of the damage is not the increase of roe deer abundance. However, there is a slight increase in the number of roe deer harvested (Figure 6) during this time.
3.4. Roe deer harvest
The number of roe deer harvested is a reliable rate of number of animals inhabiting given area. Thematic map presenting roe deer harvest in particular hunting districts calculated for 100 ha of area in 1998-2006 (Figure 6) reflects the habitat richness of districts as well as their suitability for roe deer. In order to investigate the relation between roe deer harvest and available environmental conditions thematic map of roe deer harvest and landscape structure map presenting habitat variation of woodlands and agricultural landscapes can be compared. Such spatial analysis indicates that the highest harvest rate is accomplished in hunting-grounds affluent in woodlands (districts no. 23, 25, 32); however, in some forest districts (no. 22, 24) roe deer harvest is on the similar level as in field districts (no 1, 2).
Time analysis indicates that in most districts harvest rate is not related to season. Solely in one district (no. 12) the harvest rate shows considerable variation during the time of 1998-2006. Further, more thorough investigation could allow to find causes and factors affecting that fact.
Share of roe deer in total big game harvest is an indicator of roe deer significance as a game species in a given hunting district. As for hunting districts located within Tuszyma Forest District the share of roe deer in total big game harvest from 1998-2006 (Figure 7) is the highest in field habitats. This value can also be useful in an examination of a species habitat requirements.
On the basis of annual hunting plans the thematic map of sex and age structure of roe deer harvest can be presented. Polish Hunting Association recommends following roe deer harvest structure: 40-50 per cent of individuals culled should be bucks, 40-50 per cent- does and up to 20 per cent- fawns. Graphic presentation of roe deer harvest structure in 1998-2006 (Figure 8) indicates that in districts no. 2, 12 and 32 bucks harvest account for over a half of total number of

Science for Sustainability University of West Hungary International Scientific Conference for PhD Students March 19-20, 2013 – Győr
279
individuals harvested. These values are not consistent with Polish Hunting Association recommendations and probably disturb regular population structure and influence its abundance and health in future.
Figure 5. Roe deer harvest calculated per 100 ha in 1998-2006 and landscape structure of Tuszyma Forest
District.
Figure 6. Share of roe deer in total big game harvest from 1998-2006
4. CONCLUCION
Paper presents the opportunities of GIS application in game management using a case study of roe deer management within the perimeter of Tuszyma Forest District. It was proved that GIS technology can be very useful tool for hunting and forestry administration in investigating the matters of roe deer number, environmental and seasonal factors shaping it, hunting-ground management, game feeding values, extent and causes of game damage to forests, number and

Science for Sustainability University of West Hungary International Scientific Conference for PhD Students March 19-20, 2013 – Győr
280
structure of roe deer harvested. Nowadays, when on the one hand the conservation and maintenance of valuable wildlife resources is so important and on the second hand when people occupy more and more space and clashes between people and wildlife are very frequent, managing game population sustainably is necessary. Thus, using every tool that can support it, as GIS technology, is highly recommended.
Figure 7. Sex and age structure of total roe deer harvest from 1998-2006.
References DE BY, R. A. (2001): A gentle introduction to GIS. In: DE BY, R.A. (ed). Principles of Geographic Information
Systems. ITC, Enschede. 41. KORPETTA, D. – OLENDEREK, H. – TRACZ, W. (2004): Geoinformation system in forestry. Annals of Geomatics
2 (1): 20-24. PERZANOWSKI, K. – JANUSZCZAK, M. (2010): A dispersal rate in a wisent population of Bieszczady Mountains.
European Bison Conservation Newsletter Vol 3: 45-51. Law of Hunting 1995. (ch.3). Journal of Law 02.42.372
The Role of Individual Problem – Solving Success in Social Status of House Sparrows (Passer domesticus)
PREISZNER Bálinta* – BÓKONY Veronikaa – LIKER Andrása,b a Department of Limnology, University of Pannonia, Veszprém, Hungary
bDepartment of Animal and Plant Sciences, University of Sheffield, Sheffield, UK * Corresponding author: [email protected] H-8200 Veszprém, Wartha Vince u. 1
Abstract - Behavioral flexibility such as the exploitation of novel food resources is crucial in adaptive responses to changing environment. Gregarious animals’ groups can benefit from an innovative group member by social learning or scrounging. Therefore it is hypothesized that individuals take the partner’s problem-solving abilities into account in social interactions, e.g. they are less aggressive towards innovators or prefer to forage near them. We tested whether individuals’ social status is related to their actual and apparent problem-solving success in 15 small flocks of captive House
Science for Sustainability University of West Hungary International Scientific Conference for PhD Students March 19-20, 2013 – Győr
281
Sparrows. First we measured the individuals’ actual problem-solving success in different food extracting situations in visually separated cages. Subsequently we manipulated the apparent problem-solving success of each individual (2 successful and 2 unsuccessful individuals in each group), while a new group member (focal individual) had the opportunity to witness the apparent performance of its new companions in repeated sessions. During these sessions, birds in the “successful” treatment group were allowed to feed whereas “unsuccessful” birds were not. Afterwards in group cages we monitored aggressive interactions mainly in foraging situations and the spatial associations of the focal individuals with their group-mates in non-aggressive situations. Using linear mixed-effects models, we analyzed whether actual and apparent problem-solving success influenced fighting success (a measure of dominance rank), the frequency and intensity of focal individual’s attacks against its group-mates, and the frequency of focal individual’s spatial associations with its group-mates. We found that neither actual nor apparent problem-solving success was related to fighting success and non-aggressive spatial associations, but focal individuals attacked better problem-solvers more frequently. Furthermore, better problem-solver focal individuals’ attacks were most intense against group-mates that had no feeder during the manipulation thus were “unsuccessful”, whereas poor problem-solver focal individuals’ attacks were most intense against group-mates that had an open feeder during the manipulations thus were “successful”. More aggressive and fatter birds had higher fighting success and were attacked more often by focal individuals. Moreover the intensity of these attacks was higher towards the more aggressive group-mates. These results do not outline a clear-cut effect of problem-solving performance on House Sparrows’ social interactions. Contrary to expectations, focal individuals attacked the more innovative group-mates more often, suggesting that the birds detected each other’s actual skills despite our manipulations and they used this information in attempts for aggressive scrounging. Our findings show that individual traits like aggressiveness and body condition are more important determinants of social status than the individuals’ actual propensity for innovations and their group-mates’ information on their apparent problem-solving success.
Keywords: behavioral flexibility / innovation / birds / aggressive behavior / social preference

Science for Sustainability University of West Hungary International Scientific Conference for PhD Students March 19-20, 2013 – Győr
283
István Széchenyi Doctoral School of Management and Organisation Sciences
Section 5.1 Business and Financing Strategies
Relevance of Environmental Performance (Sustainability) in Business Strategies
MAU, Markus
Faculty of Economics, University of West Hungary Abstract – Emissions of greenhouse gases are a major reason for the anthropogenic climate change. Therefore the public and legislative requirements are increasing to push enterprises to include environmental performance into operating procedures as well as in the overall business strategy.
Based on the EU-commitment to reduce the amount of CO2-emissions significantly, the pressure on companies is constantly growing as the voluntary improvements are behind the long-term goal. Large-scale polluters are included into the European Union Emission Trading System (EU ETS) for carbon emissions at the latest with the start of the third trading period (since January 2013). On the other hand especially small and medium-sized enterprises (SMEs) are avoiding pilot-projects, ignoring that in addition to the environmental effect a positive monetary outcome can be achieved.
Benefits of a consistent sustainability strategy have the potential for inclusion into Balanced Scorecards and accurate controlling that allows tracking of improvements and highlights weaknesses. Additionally there is the opportunity to elicit favorable investments in Sustainability: by showing the relation of investment to environmental improvement achieved by the investment etc.
The positive effects of integrating sustainability with all sub-dimensions into the business strategy are multidimensional. The direct cost saving aspect of an appropriate approach shows in the increased perception of environmental investments. The cost savings aspect usually results from the fact that environmental improvements result in reduced consumption of energy. Energy costs emerged as the most increasing costs in the worldwide competition over the last years. Thus the energy efficiency is of high importance for all producers. Any investment to save energy will reduce the continuous cost for production, transportation etc.
Another important reason to increase environmental performance is the growing awareness on sustainability of the public in general triggered by media, NGO and the impacts of global warming that can be seen in a growing number of effects throughout the world. Thus a significant number of end-consumers are buying sustainability in the value chain of the products. With that growing demand in the downstream market there is need to adjust the business strategies for the upstream market players if they don’t want to lose market share. This comes in addition to the increasing production and logistics costs due to energy inefficiency they might face.
Taking this changing environment for the overall competition of enterprises into account, it is of their deepest interest to include environmental performance in business strategies – even if they don’t see themselves as environmental leaders or sustainability as their core competence. The multi-

Science for Sustainability University of West Hungary International Scientific Conference for PhD Students March 19-20, 2013 – Győr
284
dimensional pressure for transparent and consistent action towards sustainable procurement, production, distribution and recycling/reuse must find expression in the business strategy.
Purchasing Strategies in the Praxis
HERCZEG Lászlóa* – HERCZEG Istvánb aIstván Széchenyi Doctoral School, University of West Hungary, Sopron, Hungary
bBusiness Consultancy International, University of Applied Sciences, Wiener Neustadt, Austria Abstract – The goal of my study is to find the most important elements and key success factors of the corporate purchasing strategy. Purchasing has a strategical importance for a company as it affects the cost structure, the efficiency and the flexibility. So it is necessary to use the strategic management tools also in this department with a special attention to the purchasing processes and decision specialties. The purchasing strategies should be built on the quality management, organization-development management and corporate strategic management base. With the help of some cases from the praxis general strategy directions and solutions will be introduced, which can be processed effectively. The purchasing strategy and targets should be integrated into the corporate strategy. The competitive efficiency level can only be realized by an integrated strategy. The main result is that the purchasing strategy should be based on the corporate strategy and the harmonization should be interactive and intensive between them.
Keywords: purchasing / strategic management / corporate strategy / supplier management
1. INTRODUCTION, CORPORATE STRATEGY
1.1. Corporate targets
Through corporate targets should be reached a higher level of competitiveness and optimalized processes. It means changes, decisions, planning and realization of actions. The corporate strategy can be based on the mission´s declaration. It can have generally three main parts, the vision, the mission and the company´s values. In the vision, the strategical goals of the company can be fixed, e.g. we should be the best or the biggest company in a defined industry, industry-segment and region. The main elements of the company´s mission can be the engagement and the customer-orientation. In the corporate strategy we should point on our strengths and oppurtinities regarding the future, they can be e.g. the innovative and integrated solutions, the traditions, the company culture or the organizational knowledge. Typical elements of the corporate´s mission are the goals of competitiveness and sustainability. Some targets in the mission can be the long-term cooperations, the new perspectives and advantages for the customers. In the mission can be the points of vision, general corporate strategy detailed. It contains the main components and activities of our strategy direction. The key factors of the corporate culture and values are the employees, the engaged management and the appointed worths of them. Their main elements can be the sustainability, the open-minded processing, the ethical and correct handling, the reliability. The corporate general values are connected with the company´s vision, and they are the integrators in the direction of organizational culture and knowledge. Further main points can be here the customer-orientation, the flexibility, the responsibility for innovation and quality or the
* Corresponding author: [email protected], H-9400 Sopron, Schármár K. u. 1.
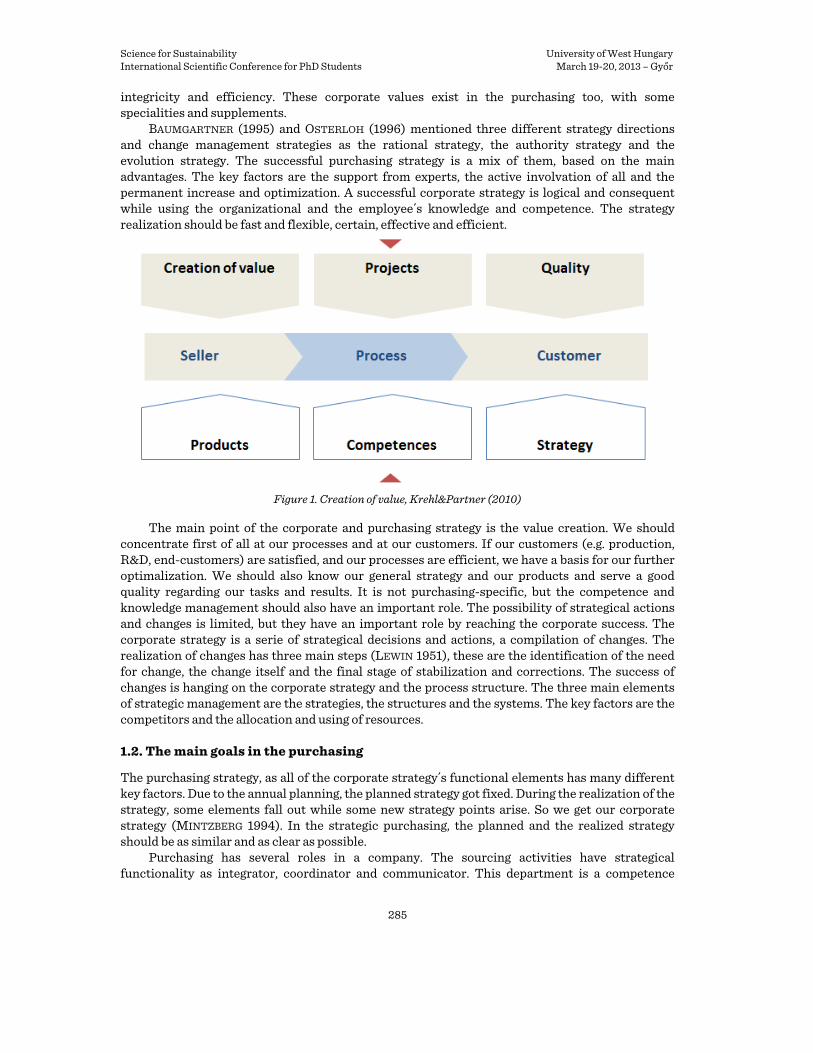
Science for Sustainability University of West Hungary International Scientific Conference for PhD Students March 19-20, 2013 – Győr
285
integricity and efficiency. These corporate values exist in the purchasing too, with some specialities and supplements.
BAUMGARTNER (1995) and OSTERLOH (1996) mentioned three different strategy directions and change management strategies as the rational strategy, the authority strategy and the evolution strategy. The successful purchasing strategy is a mix of them, based on the main advantages. The key factors are the support from experts, the active involvation of all and the permanent increase and optimization. A successful corporate strategy is logical and consequent while using the organizational and the employee´s knowledge and competence. The strategy realization should be fast and flexible, certain, effective and efficient.
Figure 1. Creation of value, Krehl&Partner (2010)
The main point of the corporate and purchasing strategy is the value creation. We should concentrate first of all at our processes and at our customers. If our customers (e.g. production, R&D, end-customers) are satisfied, and our processes are efficient, we have a basis for our further optimalization. We should also know our general strategy and our products and serve a good quality regarding our tasks and results. It is not purchasing-specific, but the competence and knowledge management should also have an important role. The possibility of strategical actions and changes is limited, but they have an important role by reaching the corporate success. The corporate strategy is a serie of strategical decisions and actions, a compilation of changes. The realization of changes has three main steps (LEWIN 1951), these are the identification of the need for change, the change itself and the final stage of stabilization and corrections. The success of changes is hanging on the corporate strategy and the process structure. The three main elements of strategic management are the strategies, the structures and the systems. The key factors are the competitors and the allocation and using of resources.
1.2. The main goals in the purchasing
The purchasing strategy, as all of the corporate strategy´s functional elements has many different key factors. Due to the annual planning, the planned strategy got fixed. During the realization of the strategy, some elements fall out while some new strategy points arise. So we get our corporate strategy (MINTZBERG 1994). In the strategic purchasing, the planned and the realized strategy should be as similar and as clear as possible.
Purchasing has several roles in a company. The sourcing activities have strategical functionality as integrator, coordinator and communicator. This department is a competence

Science for Sustainability University of West Hungary International Scientific Conference for PhD Students March 19-20, 2013 – Győr
286
centre and also a decision-oriented organizational unit. There are many connection points regarding to quality management, internal and external partners, suppliers and also to the customer relationship management. The innovation should be an important element of purchasing activities, too. The strategic purchasing staff and management can be an engine by creation of alternative, flexible and efficient solutions. The defined background is very important as well: the methods, tools, processes, responsibilities are the main success factors. It should be based on engagement and quality-orientation in an innovative, dynamic and flexible organization. Parts of the purchasing´s corporate integration are the efficient communication, the targeted risk management, based on the organization´s technological and legal competences. The contract preparation, negotiation and closing should be based on the permanent market monitoring and project purchasing. The cooperation should be very intensive in this field with the quality management and with the R&D department.
In my study, I try to summarize some key points from the existing analysises and from the praxis. Of course, there will be furthermore a primer research necessary, built on it. There are many successful target systems and methods, but a universal solution in the purchasing´s praxis does not exist. The two main directions and key factors are the strategical perception and the administrative background with the processes, tools and documentation. The basis of a successful corporate and purchasing strategy should be the harmonization of our company´s strengths and the customer´s expectations.
2. SUSTAINABILITY AND EFFICIENCY IN THE PURCHASING
2.1. Sustainability in the purchasing
The three main compounds of sustainability and sustainable development are the 3 P´s: people, planet, profit (MCEWEN 2007). People can have several meanings in this case. The people are the suppliers, the strategical partnerships, connections and cooperations; the employees, experts, the sustainable organization, processes and structures. The connection points and areas of purchasing should be highlighted: the project management, the R&D, the production, the MRP (material requirements planning), the sales, and also the knowledge- and process-management. The connected tools regarding purchasing´s sustainability are the purchasing portal or IT-interface, the competence and responsibility matrix, the competence development and monitoring. The cooperation within the organization and with external partners is very important, there are also supporting tools regarding it: best practise and lead-customer analyzises, workshops, benchmarks, training programs.
If we take the planet as sustainability dimension the simpliest way, it means the material- and energy-saving. Otherwise, it is a complex field, involving the racionalization of processes (e.g. efficient cross-facility purchasing teams, video- and telephone conferences), but the most important part is the purchasing of commodities and services (e.g. company cars, cleaning services, facility management, event management, telecommunication services). Connecting areas are the following too: transport and distribution logistic, investments (bulidings, production machines and instruments), first of all the energy-efficiency of them.
The profitability as sustainability factor is mainly the sustainable profit. There are several goals regarding it in the strategic purchasing, but the most important is the reduction and stabilization of prices and the payment terms. Connected tools are the market monitoring, the proactive purchasing strategies, the effective using of negotiation and optimization methods in the praxis. One of the methods by reaching a higher level of efficiency is the concentration, optimalization and diversification of purchasing volumen. TCO (total cost of ownership) philosophy has an important role by the planning and realization of a long-term profitable strategy.

Science for Sustainability University of West Hungary International Scientific Conference for PhD Students March 19-20, 2013 – Győr
287
Regarding the technological requierements of the purchased goods, the VE (value engineering) and VA (value analysis) methodology can be used by the optimalization.
The basements of the purchasing strategy are the material group management and the supplier management. The first one fixes the targets and strategy regarding each commodity group. It has to be decided, if we realize a general strategy or more different strategies, but the methods and processes should be in each case standardized. The material group management is the basis of supplier evaluation and supplier development. It is a main question, if we should decrease the quantity of suppliers or not. Generally, yes, but e.g. Mr. Dr. Buck, the purchasing director of Knorr-Bremse says, regarding suppliers in the indirect purchasing: not (BUCK 2012). If there are advantages by the elimination, or strategic targets are behind it (technological cooperation needed, etc.), we should go in this direction, working together with as less suppliers as possible. A successful purchasing strategy has other important components too, e.g. integrated lead-buyer function, the involvement of other departments in the processes, the effective using of the company´s quality and technological competences, etc.
2.2. Efficient organization and processes in the purchasing
The analization of the purchasing organization should be based on the specialities of horizontal and vertical organizations (LYSONS 2006). Generally, many successful corporate purchasing departments have a horizontal structure, but they also have some kind of vertical integration. The purchasing organization and processes should concentrate on the customer´s expectations and the long-term strategical targets. The most important organizational factors are not the functions, but the processes. The general purchasing organization of a bigger company has an international matrix structure. Main success factors are the exactly defined tasks, the involvement of the collegues, the integration of operative and strategic level. It means the operative control from the management while delegation strategical tasks on the lower level. There are some general key competences (communication and negotiation skills, legal and quality knowledges, Incoterms and IT knowledges, flexibility, stress-resistibility), but a specialization after commodity groups is also needed. The ways of communication and actions should be fast and direct, project- and process-oriented and also efficient.
A direct supplier-customer connection is needed, with operative, measurable goals and strategic targets. The motivation, the challenging tasks and premiums are also very important for a successful and future-oriented sourcing activity and strategy. In the middle-size and big companies, the optimal purchasing structure is a flat, horizontal organization with a flexible matrix structure. Nowadays, regarding purchasing there are more and more volatile and newer challenges. The companies have to reach a better quality, more flexibility and better prices in the global competition: the customers and the suppliers are global players, too. There are more threats and limits, while the customer´s expectations are continuously rising. A modern company should be as fast and flexible, as the smallest players in the market and as cheap and stable as the biggest ones. Purchasing should help to reduce the company´s warehouse stock too, working with smaller order quantities while reaching the best prices and order volumes. These effects are very concentrated in the purchasing department and we should analyse and optimalize them integrated.
There are many different purchasing organization forms in terms of integration and structure. The classical purchasing is centralized, but there are decentralized and hybrid solutions as well. A modern and competitive purchasing department has generally a hybrid structure. There are some special materials and services, which should be sourced locally, but the A-material procurement should be coordinated and processed central. There is a big difference between direct (production material) and indirect purchasing, and the department can be organized on several different ways: function-, process- or division-oriented. The most important point by

Science for Sustainability University of West Hungary International Scientific Conference for PhD Students March 19-20, 2013 – Győr
288
building up a new and successful purchasing structure is the process-oriented planning and the flexibility. The purchasing should follow the new developments, the increasing or decreasing of purchasing volumen and the organizational changes, too. We need a defined strategy and target, which should have been reached by a permanent optimalization and central coordination.
2.3. Summary
The main conclusion of my study is, that a universal purchasing strategy does not exist, but a high range of optimalization is available. The sourcing should be based on the corporate strategy. The key success factors are the efficiency and the flexibility. In the purchasing department the quality and the systems have a main role. The effectivity and realization of the strategy should be measurable. The most important connection points of the general corporate strategy and the integrated purchasing strategy are the purchasing controlling, the management information system and the quality targets. It cannot be easily realized but one key factor of success is the documentation background and the standardized processes. The key figures of the strategy creation and realization are the connection and diversification of indirect and direct, local and global purchasing. A monitoring system and a flexible assessment-proceed system are needed, which should be individually adjusted and customized to the corporate organization and corporate targets. The strategy should be built with good defined and communicated steps, causing a higher level of organizational knowledge and engagement. It is also an important point, that the supplier management and the material group management should be connected with the projects and process optimalization. As we are optimizing the processes and planning the strategic purchasing, we should concentrate on the quality and the organizational knowledge base. The corporate strategy and the project targets should be harmonized, with an integrated, permanent monitoring and risk management activity. The key success factors of the strategy are the competentful management members and employees, in the purchasing department, too. References BAUMGARTNER, I. – HÄFELE, W. – SCHWARZ, M. – SOHM, K. (1995): OE-Prozesse – Die Prinzipen systemischer
Organisationsentwicklung. 3. überarbeitete Auflage, Bern, 76. DAFT, R. L. (1983): Organisation Theory and Design. West Publishing THOMASON, J. L. (1990): Strategic Management. Chapman&Hall, 590 LEWIN K. (1951): Field Theory in Social Science. Harper&Row OSTERLOH, M. – FROST J. (1996): Prozessmanagement als Kernkompetenz. Wiesbaden MINTZBERG, HENRY (1994): Rise and Fall of Strategic Planning. Simon and Schuster MCEWEN, Cynthia A. – SCHMIDT, John D. (2007): Leadership and the corporate sustainability challenge:
Mindsets in action 1 BUCK, Tobias (2007): Einkauf in einer komplexen Organisationsstruktur, Stuttgart, 2012.09.25. LYSONS, K. – FARRINGTON, B. (2006): Purchasing and Supply Chain Management. Pearson Education JUTZI, P. – BLATTERT, P. – ENGELN, W. (2010): Grundlagen von Lean Development. Krehl & Partner Haag, 2010,
2

Science for Sustainability University of West Hungary International Scientific Conference for PhD Students March 19-20, 2013 – Győr
289
Modern Management Techniques and the Opportunities of Applying Balanced Scorecard in Health Care
KOVÁCS Andrea
PhD student, University of West Hungary, Faculty of Economics, István Széchenyi Doctoral School, Sopron, Hungary
Abstract – These days it is also indispensable that hospital managers should possess basic economic knowledge by means of which they can formulate strategic and operative plans as well as organisational and control processes.
They have to possess the managerial skills that have been long used in industry but it can also be stated that modern managerial skills are of vital importance even for junior management. However, in health care these well-known management techniques must be introduced and applied while taking the special features of this segment into consideration. Specific measures are necessary to ensure efficient operation, how well these management techniques are known by the decision-makers of hospitals and the Balanced Scorecard system of indicators can help in making decisions.
The method carries the risk of setting improper, unreal objectives and also the mistaken ones can be carried out professionally. It is prioritised by defining those responsible for certain objectives and levels of responsibility as well as interiorising organisational objectives.
Keywords: hospital / management functions / controlling / Balance Scorecard / SWOT-analysis
1. INTRODUCTION
Humans are in the centre of management as a scientific branch and its task is to position the target group so that they can perform efficiently together to meet the objectives. However, accomplishing the objectives of the organisation does not only depend on the abilities of its members and their talent but also the management of the given organisation.10 By making efficient use of the resources and coordinating them, managing the typically scarce capital available, materials (in this case the hospital) and workforce has become the centre of making observations. It is, however, practical to stress that in hospitals it is not only the patient-doctor relationship where modern managerial techniques must prevail but also in the service sector, in administration. The paper aims at directing attention to the hidden opportunities of the Balanced Scorecard technique as one of the modern managerial methods.
2. THE BASIC CONFLICT
As Wehkamp11 points out the health care staff and patients in hospitals are drawn into ethical-economic conflicts for which neither of them is prepared due to lack of the necessary know-how. Nevertheless, nowadays most doctors declare having to make all decisions beside the patients’ beds in hospital with the involvement of the hospital management by taking ethical aspects into
10 Peter F. Drucker, 2002. 11 Wehkamp, 2004.

Science for Sustainability University of West Hungary International Scientific Conference for PhD Students March 19-20, 2013 – Győr
290
consideration. While skimming through the Hippocratic Oath they do not even think of scarce resources or the necessity of prevailing economic considerations.
3. THE OPPORTUNITIES OF APPLYING BALANCED SCORECARD IN HEALTH CARE
One of the possible methods of measuring performance in health care is Balanced Scorecard – hereinafter referred to as BSC – that can be defined as the system of balanced strategic indicators. The authors12 of the method published their results in the 1992 issue of Harvard Business Review. The main point of their methodology is to harmonise objectives among the different strategic indicators. The application of BSC makes meeting corporate objectives and feedback possible. BSC defines both internal and external performance indicators and it is the task of the management to harmonise these indicators.
With the help of the method the following strategic objectives can be stated:
Setting the perspectives of vision and strategy, defining strategic objectives Fixing the paraphernalia of reaching strategic objectives and declaring the target With their help both the present state and the desirable one to achieve can be defined Stating the necessary action plan and measures The results achieved can be compared with the targets in feedback. Strategic objectives can be improved.
It is worth preparing a SWOT-analysis to survey the present state and which can also serve as the basis for setting objectives and tasks. Let us illustrate it with a concrete example.
4. THE INTRODUCTION AND RUNNING OF THE BALANCED SCORECARD METHOD
When applying BSC, it is not the economic and social development of the single countries, organisations or institutions that count for success; rather it is the way of implementation. In the case of a hospital it is not satisfactory to reach a more favourable market situation or possess the highest ratio of financing in the region. The experts set the minimum length of time necessary for the introduction of the BSC method in 5-6 months. Moreover, further time is needed for harmonising the structure. Agreement was born not only in health care but also in the for-profit sector about the most important indicators of the BSC indicators which are the following: Consumer satisfaction, employee satisfaction, productivity, growth indicators, cash-flow.
According to Stober13 almost 50% of the activities of the doctors in the senior management of hospitals are comprised by managerial tasks and this ratio is expected to rise in the future. In this way, it is inevitable that the specialists in the senior management in hospitals possess the necessary managerial skills and paraphernalia. In my opinion managers need so deep and special knowledge that can enable them to understand economy and the basic economic issues of the hospital-in this way safeguarding the basic running of the hospital in an efficient way.
12 Robert Kaplan and David Norton, 1997. 13 Stober, 1993.

Science for Sustainability University of West Hungary International Scientific Conference for PhD Students March 19-20, 2013 – Győr
291
Table 1. Defining medium-term objectives with the help of the method of Balanced Scorecard
Objectives Indicators Target Measures Decreasing the number of days in hospitals
The average number of days in hospitals
An annual decrease of 5 %
Improving the organisation of diagnostic examinations, improving the quality of treatments, improving the process of passing the patients between departments
Establishing a patient-and family-friendly hospice department
Increasing the satisfaction indicators of patients/family members
An annual increase of 10 %
Establishing a hospice department, continuously monitoring satisfaction, professional trainings
Establishing a care unit of high standard with supplementary hotel services for charges
Increasing the number of new private patients
An annual increase of 15 %
Establishing a new care unit, launching a marketing campaign
Source: Own compilation based on the indicators of Bugát Pál Hospital in Gyöngyös
Figure 1 presents the results of research carried out in Germany in 2008. Respondents defined the importance of single managerial functions on a four-level scale. (0–not important; 4-important)
We can conclude that on the basis of the replies of both managerial groups the single functions are nearly of the same importance in the case of both groups. A significant difference can only be observed in cost-benefit analysis, investment and book keeping. The same examination focussed on the evaluation of controlling by the doctors.
5. THE OPPORTUNITIES AND THREATS HIDDEN IN THE BALANCESCORECARD METHOD – C ONCLUSION
Health care cannot be examined as a unique, mystique separated area, rather, it has to be defined as part of the entire social-economic-political system and the organic part of the market.
At the same time, the instruments of the Balanced Scorecard have to be managed properly. The method carries the risk of setting improper, unreal objectives and also the mistaken ones can be carried out professionally. When applying this method, managers should take care of not setting a great number of objectives that cannot be accomplished as in this way failure is encoded. Another mistake is when managers concentrate only on certain areas and indicators and do not examine the processes of the entire organisation.
In the long run the organisation does not benefit either if reaching the target is overemphasised especially if resulting in some financial interest.
To sum it up we can conclude that the application of the Balanced Scorecard has become inevitable when drafting the strategic-operative plans of hospitals and also in everyday management. It is prioritised by defining those responsible for certain objectives and levels of responsibility as well as interiorising organisational objectives.

Science for Sustainability University of West Hungary International Scientific Conference for PhD Students March 19-20, 2013 – Győr
292
0
0,5
1
1,5
2
2,5
3
3,5
4
HR
Man
agem
ent
Reg
ulat
ions
on h
ealt
h
Law
Eco
nom
ics
Cos
t-be
nefi
tan
alys
is
Con
trol
ling
Mar
keti
ng
Proj
ekt
man
agem
ent
Inve
stm
ents
Boo
kkee
ping
Managers of servicing
Medical-professionalmanagers
Figure 1. The role of the single managerial functions according to the medical-professional and other
professional managers of hospitals Source: Research done by Hochschule Wismar in 2008.
Figure 2. Health economics and other disciplines relations
Source: Management in Gesundheitswesen – Eine Einführung in Gebiet und Buch

Science for Sustainability University of West Hungary International Scientific Conference for PhD Students March 19-20, 2013 – Győr
293
References Reinhard Busse, Jonas Schreyögg, Oliver Tiemann (2010): Management in Gesundheitswesen Springer
Verlag, Berlin Heidelberg, 453 p. Peter F. Drucker (2002): Was ist Management? Das Beste aus 50 Jahren Econ Verlag, München, 399 p. Egészségügyi Stratégiai Kutatóintézet (2010): A DRG finanszírozás jellemzői néhány ország példája alapján
ESKI füzetek, Budapest, 33 p. P. Horváth - N. Gamm – K. Möller – M. Kastner – B. Schmidt – B. Iserloh – G. Kliesch – R. Otte – M. Braun –
M. Matter – St. Pennig – J. Vogt – B. Köper (2009): Betriebliches Gesundheitsmanagement mit Hilfe der Balanced Scorecard, Bundesanstalt für Arbeitsschutz und Arbeitsmedizin, Dortmund, 244 p.
NEMFI 10/2012. (II. 28.) rendelet, a gyógyító-megelőző ellátás jogcímén az Egészségbiztosítási Alap terhére finanszírozható homogén betegségcsoportok kódolási és besorolási szabályairól, Budapest
Andreas Stiebler (2008): Brauchen Ärzte im Krankenhause Management Know-how? Hochschule Wismar University of Technology, Business and Design, Wismar, 100 p. Stober H-D, Bosert M. (1993): Management und Medizin: Konzepte effektiver Führungstätigkeit Blackwell-
Wissenschafts-Verlag, Berlin, 148 p. Karl-Heinz Wehkamp (2004): Brücke zwischen Qualität und Ökonomie, Deutsches Ärzteblatt, 36. Füzet
2374-2378 p. E. Weimann P. Weimann (2012): Strategie in Klinik und Praxis 2012/06. Die Balanced Scorecard in Praxis
und Krankenhause Finanzielle Kennzahlen sind nicht alles 289-294 p.
Impact of Capital Structure on Profitability: A Study on Listed Manufacturing Companies on Colombo Stock
Exchange in Sri Lanka
LINGESIYA, Yasotharalingam
Department of Financial Management, University of Jaffna, Jaffna, Sri Lanka *Corresponding Author: [email protected], Dept.of Financial Management, University of Jaffna, Sri Lanka.
Abstract – This paper empirically investigated the relationship between capital structure and the profitability of manufacturing companies in Sri Lanka, using panel data extracted from the financial statements of the companies listed on the Colombo Stock Exchange. Cross sectional design was adopted and the random sampling technique was used to collect data covering the five years period from 2006 to 2010. Firms’ profitability was measured by Return on Equity (ROE). These panel data were analyzed using Ordinary Least Squares (OLS) as a method of estimation. Results revealed that there was statistically significant negative relationship between long term debt and profitability. The relationship between total debt and the firm profitability were also found negatively related. Notwithstanding, results did not support any significant relationship between the short term debt and profitability. The effect of firm's age and size had considered as two control variables on the profitability scales. Firm size positively impacted on profitability and there was no clear evidence to impact the companies’ age on profitability. The outcomes of the study would guide entrepreneurs, loan- creditors and policy planners to formulate better policy decisions in respect of the mix of debt and equity capital and to exercise control over capital structure planning and thereby to control and reduce bankruptcy costs. The future research work based on this study is also suggested as identifying the optimum capital structure that leads to higher profitability in Sri Lanka.
Keywords: Short term debt/Long term debt/ Total assets/Return on equity

Science for Sustainability University of West Hungary International Scientific Conference for PhD Students March 19-20, 2013 – Győr
294
1. INTRODUCTION
Financial management is largely concerned with financing, dividend and investment decisions of the firm with some overall goal in mind (FREEMAN,1991). Corporate finance theory has developed around a goal of maximizing the market value of the firm to its shareholders. This is also known as shareholder wealth maximization (PANDY, 1978, ). Although various objectives or goals are possible in the field of finance, the most widely accepted objective for the firm is to maximize the value of the firm to its owners. Financing decisions deal with the firm’s optimal capital structure in terms of debt and equity. The structure-conduct-performance paradigm has played a very important role in studying the determinants of firms’ performance (BAIN, 1956).
Despite of substantial theoretical developments in the field of corporate finance over the past several decades (Ex: Portfolio Theory, Optimal Capital Structure, Efficient Market Theory: Option Pricing Theory, Agency Theory, Pecking Order Theory) , the rift between theory and practice still needs to be reconciled (AMJED,2007, GRAHAM - HARVEY, 2001 ; KERSYTE, 2011).The mix of debt and equity is known as the firm’s capital structure (PANDEY, 1978,2005). The financial manager must strive to obtain the best financing mix or the optimum capital structure for his or her firm. The firm’s capital structure is considered optimum when the market value of shares is maximized. In the absence of debt, the shareholders’ return is equal to the firm’s return. The use of debt affects the return and risk of shareholders; it may increase the return on equity funds, but it always increases risk as well. The change in the shareholders’ return caused by the change in the profits is called the financial leverage. A proper balance will have to be struck between return and risk. When shareholders’ return is maximized with given risk, the market value per share will be maximized and the firm’s capital structure would be considered optimum. Despite of the crucial nature of capital structure decisions the empirical studies have very little to say about the optimal level of debt financing. Therefore, logical parameters with empirical proves are still waited as the available literature is unable to evaporate the rift between practice and theory (AMJED, 2007).
This paper, using dynamic panel data techniques, investigated the relationship between capital structure and the profitability of the listed manufacturing companies of Sri Lanka. The outlook for Sri Lanka’s economy has improved with the ending of the conflict in May 2009, there re-integration of the Northern and Eastern Provinces with the rest of provinces, and renewed investor confidence following the favorable post conflict developments. The manufactures have taken timely measures to safeguard and promote the industry in the current global economic condition. Manufacturing, the largest sub-sector of the industry sector recorded a significant growth to economy (Central Bank Report, 2009). Therefore, in this study, specially manufacturing companies were taken into consideration those are playing very important role in the Sri Lankan economy in order to enhance the economic growth.
The investigation is kept limited to manufacturing industry since different industries have different financing requirements. Previous researchers, including BRADLEY et al. (1984) and ALMAZAN - MOLINA (2005), reported that firms in a given industry develop similar capital structures. Exogenous variables appear to force firms in the same industry in similar fashion, thus leading to the existence of an industry specific capital structure. According to ELI SCHWARTZ (1959) optimum capital structure varies for firms in different industries because the typical asset structure and earning stability which determine inherent risk vary for different types of production and thus the borrowing powers of the firm. MACKAY - PHILLIPS (2002 cited in AMJED,2007) provided evidence that industry factors help explain firm financial structure, the diversity of firms that populate industries, and the simultaneity of real and financial decision.
The rationale of this study is to provide insights into the relationship between capital structure and profitability of Sri Lankan’s manufacturing companies. The pioneer work on capital structure by MODIGLIANI - MILLER (1958) despite of the unrealistic assumptions has been source of inspirations for scholars (cited in AMJED, 2007). Their propositions state that the
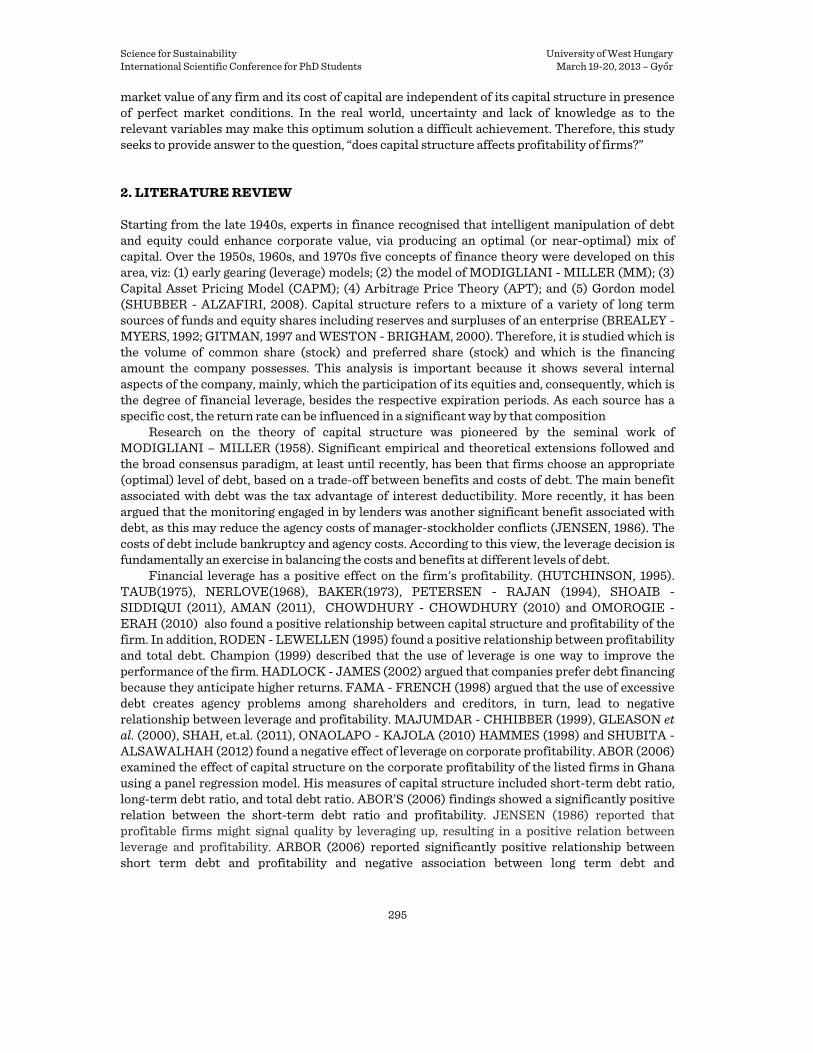
Science for Sustainability University of West Hungary International Scientific Conference for PhD Students March 19-20, 2013 – Győr
295
market value of any firm and its cost of capital are independent of its capital structure in presence of perfect market conditions. In the real world, uncertainty and lack of knowledge as to the relevant variables may make this optimum solution a difficult achievement. Therefore, this study seeks to provide answer to the question, “does capital structure affects profitability of firms?”
2. LITERATURE REVIEW
Starting from the late 1940s, experts in finance recognised that intelligent manipulation of debt and equity could enhance corporate value, via producing an optimal (or near-optimal) mix of capital. Over the 1950s, 1960s, and 1970s five concepts of finance theory were developed on this area, viz: (1) early gearing (leverage) models; (2) the model of MODIGLIANI - MILLER (MM); (3) Capital Asset Pricing Model (CAPM); (4) Arbitrage Price Theory (APT); and (5) Gordon model (SHUBBER - ALZAFIRI, 2008). Capital structure refers to a mixture of a variety of long term sources of funds and equity shares including reserves and surpluses of an enterprise (BREALEY - MYERS, 1992; GITMAN, 1997 and WESTON - BRIGHAM, 2000). Therefore, it is studied which is the volume of common share (stock) and preferred share (stock) and which is the financing amount the company possesses. This analysis is important because it shows several internal aspects of the company, mainly, which the participation of its equities and, consequently, which is the degree of financial leverage, besides the respective expiration periods. As each source has a specific cost, the return rate can be influenced in a significant way by that composition
Research on the theory of capital structure was pioneered by the seminal work of MODIGLIANI – MILLER (1958). Significant empirical and theoretical extensions followed and the broad consensus paradigm, at least until recently, has been that firms choose an appropriate (optimal) level of debt, based on a trade-off between benefits and costs of debt. The main benefit associated with debt was the tax advantage of interest deductibility. More recently, it has been argued that the monitoring engaged in by lenders was another significant benefit associated with debt, as this may reduce the agency costs of manager-stockholder conflicts (JENSEN, 1986). The costs of debt include bankruptcy and agency costs. According to this view, the leverage decision is fundamentally an exercise in balancing the costs and benefits at different levels of debt.
Financial leverage has a positive effect on the firm's profitability. (HUTCHINSON, 1995). TAUB(1975), NERLOVE(1968), BAKER(1973), PETERSEN - RAJAN (1994), SHOAIB - SIDDIQUI (2011), AMAN (2011), CHOWDHURY - CHOWDHURY (2010) and OMOROGIE - ERAH (2010) also found a positive relationship between capital structure and profitability of the firm. In addition, RODEN - LEWELLEN (1995) found a positive relationship between profitability and total debt. Champion (1999) described that the use of leverage is one way to improve the performance of the firm. HADLOCK - JAMES (2002) argued that companies prefer debt financing because they anticipate higher returns. FAMA - FRENCH (1998) argued that the use of excessive debt creates agency problems among shareholders and creditors, in turn, lead to negative relationship between leverage and profitability. MAJUMDAR - CHHIBBER (1999), GLEASON et al. (2000), SHAH, et.al. (2011), ONAOLAPO - KAJOLA (2010) HAMMES (1998) and SHUBITA - ALSAWALHAH (2012) found a negative effect of leverage on corporate profitability. ABOR (2006) examined the effect of capital structure on the corporate profitability of the listed firms in Ghana using a panel regression model. His measures of capital structure included short-term debt ratio, long-term debt ratio, and total debt ratio. ABOR’S (2006) findings showed a significantly positive relation between the short-term debt ratio and profitability. JENSEN (1986) reported that profitable firms might signal quality by leveraging up, resulting in a positive relation between leverage and profitability. ARBOR (2006) reported significantly positive relationship between short term debt and profitability and negative association between long term debt and

Science for Sustainability University of West Hungary International Scientific Conference for PhD Students March 19-20, 2013 – Győr
296
profitability. This implies that an increase in the long-term debt position is associated with a decrease in profitability.
As to the financing decision, the choice of the optimum capital structure will be settled, accordingly to BOOTH et al (2001), in conformity with three models: 1) the Static Trade-off Model affirms that the firm chooses a goal-structure based on tributary aliquots, types of investment, business’ risk, profitability and bankruptcy code; 2) the Agency Theoretic Framework suggests that potential conflicts of interests among internal and external investors determine the optimal structure that compensates agency costs with other financial costs and, 3) the Pecking-Order Hypothesis - based on the market imperfections, specifically shares’ costs and asymmetric information - affirms that the choice will be based on the possibility of generation of funds to the company, given the asymmetry of information (e.g.: if the company judges that its shares are sub-evaluated in the moment, it will opt for the use of debt. On the other hand, if the company feels that the shares are well valued, it will issue a new emission of shares).
GRAHAM (2000) estimated the magnitude of debt’s benefit. He pointed out to a taxes benefit of US$ 0.2 for each unit of profit before taxes, or the equivalent to 10% of the firm’s value, which are still below the potentially maximum benefit, according with his calculations. In the same work, another conclusion indicated that big and profitable companies present a low debt rate. According to GRAHAM (2000), several factors, not related to tributary subjects, explain the choice of the financing. The financial cost of a possible bankruptcy will inhibit the grant of loans. The opportunities of investment exerted some influence, as the shareholders can give up projects with positive net present values (NPVs), which result in larger benefits for the parts engaged. The low liquidity and the irregularity of the cash flow affect the financing decision, as they tend to elevate the cost of the loan. The attitudes of the administration often prod the company to conservatively employ debts, either because the administrators would not like to assume risks, or because they could increase their shareholding participation.
LUPER - ISAAC (2012) recently conducted a study to examine the impact of capital structure on performance of manufacturing companies in Nigeria. He reported in his conclusion that capital structure is not a major determinant of firm performance.
Based on the above literature, we can say that several studies have been done on this area, but a comprehensive study has not yet been conducted, especially in Sri Lankan manufacturing companies. Hence, further this paper was an attempt to evaluate the capital structure and its impact on financial performance of the listed manufacturing companies in Sri Lanka
3. DATA AND METHODOLOGY
Population of the study was listed manufacturing companies in Sri Lanka. From the listed manufacturing companies by using the random sampling method 25 companies were selected in order to carry out the research for the period of 2006-2010. Around 75% of the population had been selected as sample.Annual data extracted from the financial statements of these companies over five year’s period has been used for analysis. The entire set of variables used in this study is based on book values. MYERS (1984 cited in AMJED, 2007)) advocated that the book values are proxies for the values in place. Panel data analysis allows studying the dynamic nature of the capital structure decisions at the firm level of manufacturing companies.Secondary data for the study was drawn from audited accounts (i.e., income statement and balance sheet) of the concerned companies as fairly accurate and reliable. Therefore, these data might be considered reliable for the study. Necessary checking and cross checking were done while scanning information and data from the secondary sources. Sample of this study extracted from listed companies in Sri Lanka. Also Sri Lankan Colombo Stock Exchange is functioning under the government rules and regulations and adopting the international and Sri Lankan Accounting Standards. All these efforts

Science for Sustainability University of West Hungary International Scientific Conference for PhD Students March 19-20, 2013 – Győr
297
were made in order to generate validity data for the present study. Hence, researchers satisfied content validity.
3.1. Mode of Analysis
The following variables were used in the study: Debt Ratio (DR): The agency cost theory predicts that higher leverage is expected to lower agency costs, reduce inefficiency and thereby lead to improvement in firm’s performance. BERGER (2002) argued that increasing the leverage ratio should result in lower agency costs of outside equity and improve firm performance, all else held constant. From the above contributions, we expected an inverse relationship between leverage (DR) and firm performance.
Profitability was measured by commonly used ratio by many researchers i.e. Return on Equity (ROE). It was worked out by dividing the net profit before interest and taxes by the shareholders’ equity, expressing the result in percentage. Return on equity demonstrated the percentage earnings of the shareholders’ funds.
Leverage ratios included: Short term debt included all liabilities, which are required to be discharge within one year, alternatively, these cover those obligations whose liquidation is expected to be made out of current assets. They are usually incurred in the normal course of business and are required to be paid at fairly definite dates. Long term debt included all liabilities other than the short term debt and Shareholders’ equity. Total debt pertains to sum of total fixed liabilities and current liabilities except shareholder’s equity. Assets included all assets at their book value.
Firm size and age were also included as control variables. Natural logarithm of sales has been taken as proxy for size (SIZE). This measure was the most common proxy for size (TITMAN - WESSELS, 1988). The age of a firm may also have an impact on firm’s performance, STINCHCOMBE (1965) argued that older firms can achieve experience- based economies and can avoid the liabilities of newness.Natural logarithm of number of years since the date of incorporation of the company has been considered as age of companies. The following hypothesis was tested: H1: Short term debts have positive impact on profitability H2: Long term debts have a negative impact on its profitability H3: A firm’s capital structure should have a negative impact on its profitability H4: The size of company positively impact on profitability H5: The age of company positively impact on profitability
Linear regression model was used to investigate the nature of relationship between capital structure and profitability. The motive of studying short term, long term and total debt separately was to investigate the impact of different type of financing options minutely. Since the cost / benefits of short term debt and long term debt differed to a great extant. Therefore, separate analysis could better explain the relationship.
The following regression equations were used in the analysis. 1. ROEi;t = α + β STD_TAi,t + β SIZEi,t + β AGEi,t + e 2. ROEi;t = α + β LTD_TAi,t + β SIZEi,t + β AGEi,t + e 3. ROEi;t = α + β TD_TAi,t + β SIZEi,t + β AGEi,t + e Where: ROEi,t is EBIT divided by equity of firm i in time t; STD_TAi,t is short-term debt divided by the total assets of firm i in time t; LTD_TAi,t is long-term debt divided by the total assets of firm i in time t; TD_TAi,t is total debt divided by the total assets of firm i in time t; SIZEi,t is the log of sales for firm i in time t; AGEi,t is log of number of years since the date of incorporation of firm i in time t; and

Science for Sustainability University of West Hungary International Scientific Conference for PhD Students March 19-20, 2013 – Győr
298
e is the error term. The return on equity was kept dependent variable and the leverage ratios and control variables as the independent variables.
4. RESULTS AND DISCUSSION
Table 1. Descriptive statistics Mean SD Mini. Maxi. Profitability (ROE) 0.077 0.355 -1.668 1.710 Size of the company 8.524 1.613 0.000 10.859 Age of the company 1.406 0.197 0.778 1.7853 STD_TA 0.345 0.183 0.017 0.908 LTD_TA 0.153 0.192 0.000 0.929 TD_TA 0.498 0.228 0.019 1.002
Source: Survey Data
Average value of return on equity (ROE) over five year period was 7.7 % that demonstrate a not remarkable performance of the companies in the period under study. Average of short term debt to total assets is 35 % that depicts a noteworthy portion of assets was financed with the short term debt. This suggested that short-term debt tends to be easily available therefore companies used short term debt as their major source of financing. Long term debt to total assets as compared to the short term debt to assets was low i.e. 20%. The under developed nature of the long term debt market might be one of the possible reasons. Overall 50% assets were financed with the debt that depicts manufacturing companies was moderately leveraged industry. However, the debt ratio variation across the firms was large, ranging from a maximum debt ratio of 100% and a minimum of 1%.
4.1. Regression Statistics
Results of the Regression Equations used in the analysis were exhibited in this section. The results were discussed separately that enable us to make comparison of the different debt financing options. The separation of results also permitted us to observe inherited almost opposite characteristics of short term debt and the long term debt in association with control variable. Equation 1 In the first equation the relationship of short term debt with the profitability was studied keeping size and age controlling variables. It is found that the there was no significant relationship between short term debt and profitability exists. The negative value of coefficient of beta (-0.306081) was empirically not significant (p< 0.05). Therefore, no significant relationship could be found between short term debt and the profitability. The negative relationship was not significant (t- Stat -1.671314) enough to justify any proposition. ROEi;t = α + β STD_TAi,t + β SIZEi,t + β Agei,t + e
In order to test the hypothesis (H1), it was stated that Short term debts have positive impact on profitability. There was no evidence to prove this hypothesis. As a result hypothesis was rejected.

Science for Sustainability University of West Hungary International Scientific Conference for PhD Students March 19-20, 2013 – Győr
299
Table.2. Profitability Ordinary Least Squares
Variable Coefficient Std. Error t-Stats Prob. C -0.381 0.278 -1.368 0.173 STD_TA -0.306 0.183 -1.671 0.097 Size 0.073 0.019 3.672 0.000 Years -0.042 0.162 -0.262 0.793
Regression Statistics R2 0.106 F-statistic 4.813 Adj. R2 0.084 Prob. 0.003
Source: Survey Data Equation 2 The results given in the table below depicted that empirically significant negative relationship exists between the long term debt and the profitability. The results were consistent with the pecking order theory the negative value of beta (-0.8108) was significant at 99.91% confidence level further t value of (-5.52115) exhibited that the relationship was empirically reliable. It dictated that higher level of long term debt in the capital structure of the firm lower the profitability. The results tend to refute the trade-off theory rather support the pecking order theory. Profitable firms internal funds over the outside financing options. ROEi;t = α + β LTD_TAi,t + β SIZEi,t + β Agei,t + e
Regression Statistics R2 0.269 F-statistic 14.912 Adj. R2 0.251 Prob. 0.000
Source: Survey Data In order to test the hypothesis, considering the probability of t test of long term debt less than
5%. Hypothesis (H2) stated that long term debts have negative impact on profitability. It was accepted that long term debts had negative impact on profitability.
Equation 3 The results given in the table below depicted that empirically significant negative relationship exist between the total debt and the profitability. The results were consistent with the pecking order theory the negative value of beta (-0.80407) is significant at 99.91% confidence level further t value of (-6.500332) exhibit that the relationship was empirically reliable. It dictated that higher level of debt in the capital structure of the firm lower the profitability. In other words profitable firms prefer capitalization of earnings for their financing needs. The results tend to refute the trade-off theory rather support the pecking order theory. Profitable firms internal funds over the outside financing options.
Therefore the impact of total debt on profitability as a whole contains significant value as the short term debt has no significant relationship and long term debt has negative significant relationship therefore the net impact is negative. This result was consistent with the result of FAMA - FRENCH (1998), MAJUMDAR - CHHIBBER (1999) and HAMMES(1998). ROEi;t = α + β TD_TAi,t + β SIZEi,t + β Agei,t + e
Table 3. Profitability Ordinary Least SquaresVariable Coefficient Std. Error t-Statistic Prob. C -0.125 0.247 -0.508 0.612 LTD_TA -0.810 0.146 -5.521 0.000 Size 0.045 0.017 2.634 0.009 Age -0.044 0.140 -0.319 0.749

Science for Sustainability University of West Hungary International Scientific Conference for PhD Students March 19-20, 2013 – Győr
300
Table 4. Profitability Ordinary Least Squares
Variable Coefficient Std. Error t-Stas. Prob. C -0.390 0.237 -1.642 0.103 TD_TA -0.804 0.123 -6.500 0.000 Size 0.073 0.016 4.429 0.000 Age 0.172 0.142 1.214 0.226
Source: Survey Data
In order to test the hypothesis, considering the probability of t test of total debt less than 5%. Hypothesis (H3) stated that firm’s capital structure (total debt to total assets) have negative impact on profitability. It was accepted that capital structure had negative impact on profitability.
In order to test the hypothesis four (H4), it was stated that size of the company positively impact on profitability. With the evidence of Table 3 and 4 size of the company positively had impact on firm profitability (Table 2: β=.073, t=3.672, p=.000: Table 3: β=.045, t=2.634, p=.009: and Table 4: β=.073, t=4.429, p=.000). As a result H4 was accepted.
Hypothesis five (H5), it was stated that age of the company positively impact on profitability. Based on the result (Table 2: β=-0.042, t=-0.262, p=.793: Table 3: β=-0.044, t=-0.319, p= .749: and Table 4: β =0.172, t= 1.214, p=.226) there was no clear evidence to company’s age impacted on profitability. As a result H5 was rejected.
The values of Coefficient of Determination i.e. R Square and Adjusted R square were considerably low in all three equations. The ultimate cause was there were numerous factors that determine the profitability. In this study we are barely interested in studying the relationship of leverage and profitability therefore, values of individual variables’ statistics are relevant with propositions of the study. Results are significant enough to serve our purpose best. Overall the results are consistent with the existing research but with little variation of not enough evidence to prove relationship of short term debt with profitability. Based on the F statistics and their probability all there models are fit for the analysis.
5. CONCLUSION
This paper examined the impact of capital structure on firm’s profitability using 25 listed manufacturing companies in Sri Lanka between 2006 and 2010. The paper searched to fill the gap in the literature as a result of limited studies that have been conducted so far in this area using Sri Lankan data.
On the basis of findings, it was documented that short term debt had no significant relationship with the profitability. It was not enough to justify any proposition. Whereas long term debt had significant negative relationship with the profitability that envisage long-term debts were relatively more expensive due to certain direct and indirect costs, therefore employing high proportions of long term debt in financial structure results in low profitability. Size of the company positively impacted on performance and there was no evidence to age of company positively impacted on profitability.
Empirical results indicated that negative significant association between total debt and profitability .The underlying rationality was, Pecking order theory was true with this finding as key element of pecking –order theory is that firms prefer to use internal financing whenever possible and if a firm is very profitable, it might never need external financing; so it would end up
Regression Statistics R2 0.322 F-stas. 19.205 Adj. R2 0.305 Prob. 0.000

Science for Sustainability University of West Hungary International Scientific Conference for PhD Students March 19-20, 2013 – Győr
301
with little or no debt. Result of the study was not consistent with the static theory, which explains that these are the firms should use the most debt because there is little risk of bankruptcy and the value of the tax shield is substantial, therefore the positive direction between debt and profitability. Simply it is difficult if not impossible to think over, over all relevant factors with bounded rationality, at least in the current scenario. In-depth case study observations of individual firms’ financing decisions over time would be especially valuable in exploring this diversity. Regarding future line of research, this study can be improved upon if the number of firms and the profitability measures are increased. The use of market- based performance measures such as the original Tobin’s Q, price- earnings, market value to book value of equity, among others, will make the study more robust. Attention should also be shifted to the study of small and medium scale firms in the developing countries.
References ABOR, J. (2006): Debt policy and performance of SMEs: Evidence from Ghanaian and South African Firms.
Journal of Risk Finance, 8: 364 - 380. AMAN, S. (2011): Ownership structure and corporate performance: evidence from India, International
Journal of Humanities and Social Science, 1(1):23-29. AMJED, S. (2006): The impact of financial structure on profitability: study of Pakistan’s textile sector,
MIBES 2007:441-450 BAIN, J. S. (1956): Barriers to New Competition, Cambridge, M.A: Harvard University Press. BAKER, S. H. (1973): Risk, leverage and profitability: an industry analysis. Review of Economic State. 55: 503-
507. BERGER, A. N (2002): Capital structure and firm performance: a new approach to testing agency theory and
an application to the banking industry. Federal Reserve System and Wharton Financial Institutions Centre, pp 1- 37.
BOOTH, A. – DEMIRGUC-KUNT, A. – MAKSIMOVIC, V. (2001): Capital structure in developing countries. The Journal of Finance.
BREALEY, R. A. - MYERS, S. C. (1992): Princípios de Finanças Empresariais. Lisboa: Ed. CENTRAL BANK OF SRI LANKA (2009): Economic Progress of Independent Sri Lanka, Central Bank of Sri
Lanka, Colombo. CHAMPION, D. (1999): Finance: the joy of leverage. Harvard Business Review. 77: 19-22. CHOWDHURY, A. – CHOWDHURY, P. S. (2010): Impact of capital structure on firm’s value: evidence from
Bangladesh, Peer reviewed and open access journal, 3 (3): 111-115. ELI SCHWARTZ (1959): Theory of Capital structure of the firm. The Journal of Finance 14(1) FAMA, E. F. – FRENCH, K.R.(1998):Taxes, financing decisions, and firm value. Review of Economic State.
53: 819-843. GITMAN, L. J.(1997): Princípios de administração financeira. São Paulo: Ed. Harbra. GLEASON, K. C. – MATHUR, L. K. – MATHUR, I. (2000): The interrelationship between culture, capital
structure, and performance: evidence from European retailers. Journal of Business Research 50: 185-191.
GRAHAM, J. R. (2000): How big are the taxes benefits of debt? The Journal of Finance. GRAHAM, J. – HARVEY, C. (2001): ‘The theory and practice of corporate finance: evidence from the field’.
Journal of Financial Economics, 60( 2/3), pp. 187-243 HADLOCK, C.J. – JAMES, C.M.(2002): Do banks provide financial slack? Journal of Finance . 57: 1383-420. HAMMES, K.(1998): Various aspects of capital structure in Poland. Working Paper; Tallin Technical
University, Tallin . HUTCHINSON, R.W. (1995): The capital structure and investment decisions of the small owner-managed
firm: some explanatory issues. Small Business Economics. 7: 231-239. JENSEN, M. C. (1986): Agency costs of free cash flow, corporate finance, and takeovers. American
Economic Review, 76: 323-329. KERSYTE, A. (2011): ‘Capital budgeting process: Theoretical Aspects, Economics and Management, 16,
pp.1130-1134 LUPER, I. – ISAAC, K. M. (2012): Capital structure and firm performance: Evidence from manufacturing
companies in Nigeria, International Journal of Business and Management Tomorrow, 2(5),1-7

Science for Sustainability University of West Hungary International Scientific Conference for PhD Students March 19-20, 2013 – Győr
302
MAJUMDAR, S. K. – CHHIBBER, P. (1999): Capital structure and performance: evidence from a transition economy on an aspect of corporate governance. Public Choice. 98: 287-305.
MODIGLIANI, F. – MILLER, M. (1958): The cost of capital, corporation finance, and the theory of investment. American Economic Review. 48: 261–297.
NERLOVE, M. (1968): Factors affecting differences among rates of return on investments in Individual common stocks. Review of Economic State. 50: 312-31.
OMOROGIE, A. N. – ERAH, D. O. (2010): Capital structure and corporate performance in Nigeria: an empirical investigation, AAU Journal of Management Sciences, 1 (1), 43-52.
ONAOLAPO, A. A. – KAJOLA, S. O. (2010): Capital structure and firm performance: evidence from Nigeria, European Journal of Economics, Finance and Administrative Sciences, Issue 25, 70-77.
PANDY, I. M.(1978): Financial management. 9th edition.Vikas Publising House Pvt Ltd. PETERSEN, M. A. – RAJAN, R. G.(1994): The benefits of lending relationships: evidence from small business
data. Journal of Finance. 49: 3-37. RODEN, D. M. – LEWELLEN, W. G.(1995): Corporate capital structure decisions: evidence from Leveraged
buyouts. Finance Management. 24: 76- 87. SHAH, S. Z. – BUTT, S. A. – SAEED, M. M. (2011): Ownership structure and performance of firms: empirical
evidence from an emerging market, African Journal of Business Management, 5(2): 515-519. SHOAIB, A. – SIDDIQUI, M. A (2011): Measuring performance through capital structure: evidence from
banking sector of Pakistan, African Journal of Business Management, 5(5): 1871-1878. SHUBITA, M. F. – ALSAWALHAH, J. M. (2012): The relationship between capital structure and profitability,
International Journal of Business and Social Science,3( 16),pp:104-112 SHUBBER, K. – ALZAFIRI, E. (2008): Cost of capital of Islamic banking institutions: an empirical study of a
special case, International Journal of Islamic and Middle Eastern Finance and Management, 1(1): 10-19 STINCHCOMBE, A. L. (1965): Social structure and organizations, in March, J.G (ed) Handbook of
Organizations. Chicago, Rand McNally. TAUB, A. J. (1975): Determinants of the firm's capital structure. Review of Economic State 57: 410-416. TITMAN – WESSELS, (1988): The Determinants of Capital Structure Choice, Journal of Finance, 43.
Network Management in the Insurance Broker Industry – a Dual Agency Problem
BAKONYI Zoltán Abstract – In this paper the network of the insurance broker industry is analyzed. The insurance broker industry operates as a mediator between insurance companies and B2B segment firms. In the network the most significant actors during the value creation process are the salesmen of the insurance brokers. Because of this special role, broker companies must focus on the main achievement in the network which is the dual agency problem (based on informational and reputational asymmetry). The paper describes this problem in the view of the insurance broker companies and describes three solutions such as knowledge management; brand building; and alternative compensations.
Keywords: network management / dual agency problem / insurance broker industry
1. INTRODUCTION
This paper describes the most important elements of the network management of the insurance broker industry. In the first part the key aspects of the network are defined as follows the definition of insurance brokers; consumer demands; the most significant actors; and the value creation process of the network. In the second part a special network achievement is described

Science for Sustainability University of West Hungary International Scientific Conference for PhD Students March 19-20, 2013 – Győr
303
which can emerge in every service broker industry: the dual agency problem. After the analysis of this problem this paper introduces three ways of solutions for this achievement. This research is mostly based on the interviews with Hungarian industry specialists listed in the references.
2. THE NETWORK OF THE INSURANCE BROKER INDUSTRY
This paper examines the network management specificities of the insurance broker industry. Insurance brokers can be defined as “third-party” independent actors who search the adequate insurance products to customers (COFFIN – KALLMAN 2005). Therefore insurance brokers operate as an intermediate between insurance companies and consumers using “broker business model” concept (OSTERWALDER et al. 2005). In this industry two popular channels can be distinguished the e-commerce and the direct sales. The key elements of e-commerce solutions is the well-designed website and the supportive IT systems (LI-HOLACKOVA 2005), however most of the insurance products are too complex to be sold online. Direct sales channel is a slower but more adaptive solution and by this way it is able to sell complex products efficiently. Because the main focus of this paper is the B2B segment of the insurance industry only the direct sales channel is examined in the followings.
2.1 Consumer Demands
Understanding the consumer demands support to examine the industry network management. According to insurance broker industry specialists there are four main consumer demands such as risk identification; price; simple transactions; and rapid solutions.
• Risk identification. “A production manager is good at producing but is not good at insurance” (Interview with UZONYI 2010]. Insurances are complex products which require special industry expertise. Insurance brokers help the companies to choose the best products.
• Price. Generally the costs of insurances are clear but its benefits are ambiguous. Insurance brokers provide information about the product especially the terms of payment.
• Simple transactions. The most important value creation function of the insurance broker industry is the reduction of transaction costs. It helps the consumers to search between the offers of the insurance companies and after the final decision brokers minimize the costs of the documentation too.
• Rapid solutions. After the agreement (insurance policy) brokers inform their consumers about all of the possible changes (e.g. changes in the fee or in the conditions) (BELOUCIF et al. 2006). “The management of the claim adjustment is also the duty of the broker” (Interview with BRAVIK 2010).
2.2. Actors of the Network
To satisfy these consumer needs insurance broker industry cooperates with several players in the extended network (Figure 1).
The three main actors of this network are the consumer companies; the insurance companies who provide insurance products to the consumers; and the broker companies which are mediators between the first two actors. Insurance companies employ several contact persons who keep in touch with insurance brokers. The insurance broker companies are the intermediaries. Broker companies employ the salesmen who are personally contact with the consumer and the insurance companies. The consumer company needs insurance products to cover their risks during the operation. They employ a company administrator who keeps in touch with the salesmen of the insurance broker.

Science for Sustainability University of West Hungary International Scientific Conference for PhD Students March 19-20, 2013 – Győr
304
2.3. The Value Creation Process
Consider there is a company with such demands which were described before. First of all the consumer company administrator hires the salesman (agency agreement) of the broker company to handle this need. After the salesman examined the risks of the consumer company, he starts to find an adequate product between the several offers of the insurance companies.
After the evaluation of the offers the salesman suggests one or a few products to the company administrator. Then the salesman organizes all the administrative background of the insurance and finally the consumer company and the insurance company sign the contract of the insurance policy. The fee is paid to the insurance company who pays commission (brokerage) to the broker company. At the end broker company also pays brokerage to the salesman who managed the account.
Figure 1. The network of the insurance broker industry (own figure)
3. DUAL AGENCY PROBLEM
As it was described before, network management is extremely important during the value creation of insurance broker industry. What is more the most crucial nodes of this network are the salesmen of the broker companies. They are the mediators of the information between the insurance companies and the customers. Normally they should be the most reliable actors of the network because costumers believe in that, salesmen suggest them the best insurance. Because a salesman is an agent of the customer and the broker company, a dual agency problem can arise in the network.
Science for Sustainability University of West Hungary International Scientific Conference for PhD Students March 19-20, 2013 – Győr
305
3.1. Agency Theory
Agency theory analyses such situations when an individual has own preferences and interest but manages other people’s resources as an agent. In these cases the principal hires the agent to act in the best interests of the principal however the agent can be opportunistic. Conflict of interest can arise because of the informational asymmetry between the two actors (JENSEN 1994). This principal-agent problem can be identified in the case of large corporations where the management always knows better the company than the shareholders (JENSEN 1986). According to EISENHARDT (1989) there are several solutions for this problem such as the reduction of the informational asymmetry or the well-defined agreements and contracts.
Principal-agent problem may be appeared even in a network management context. In the case of insurance broker industry, a dual agency problem can be identified (Figure 2). On one hand salesmen are the agents of the customer companies who need the adequate insurance services. On the other hand salesmen are the agents of their broker company which hires them as an employee. In the view of the salesmen principal-agent problem is more serious because they have to deal with the interest of three different actors (broker company – salesman – customer company).
Figure 2. The nature of the dual agency problem (own figure)
3.2. Informational Asymmetry
Even asymmetry and opportunism can appear on both sides. Between the customer company and the salesman an informational asymmetry can emerge. “Specialized knowledge is required to choose between the complex insurance products. Generally the consumer does not possess this information, only the salesman” (Interview with VÁLYOGOS 2010). What is more the salesmen are still interested in the maximization of their brokerage (or commission).
Therefore there is a risk of such situation when the salesman suggests an insurance product to the customer company not because it is the best for the customer company but because it provides the highest brokerage for the salesman. Because insurance products are highly complex for the consumers, the exposure of this kind of moral hazard is extremely difficult (DUSKA 2005). Most of the salesmen and customers have to face this problem during the everyday business (CUPACH – CARSON 2002). “I think this problem can emerge in the 80% of the cases. It does not mean that the salesman “forces” an unnecessary product on the consumer. The only thing what

Science for Sustainability University of West Hungary International Scientific Conference for PhD Students March 19-20, 2013 – Győr
306
happens is that salesmen start to contact those insurance companies first which offer the highest commission” (Interview with DÖGE 2010).
3.3. Reputational Asymmetry
On the other side a reputational asymmetry can appear between the salesmen and the broker companies. “Insurance is always built on trust. Practically consumer trust in the salesman first and just after that she starts to trust in the broker company” (Interview with UZONYI 2010).
In B2B insurance segment the trust in the salesman is more stabile rather than in the broker company. “Personal contact is extremely important. For example if a salesman quits the company there is a great chance to bring most of the previous consumers to the new employer” (Interview with DÖGE 2010). In this case reputational asymmetry means salesmen may leave the original broker company and may bring their consumers to another broker company which provides higher brokerage. “Salesmen may go to another company or because there are low barriers to enter to this segment it is easy to establish an own company too” (Interview with BRAVIK 2010).
3.4. Solutions of Dual Agency Problem
As it was mentioned before network management is crucial during the value creation of insurance broker industry. This whole value creation process can be exposed to danger if the dual agency problem is not handled. There are several solution for this problem such as knowledge management; brand building; alternative compensations.
• Knowledge management. Even informational and reputational asymmetry can be reduced by an effective knowledge management system which records all of the information about the consumers and insurance products. Thereby the broker company becomes the information center and by this way the offers of the salesmen can be monitored. Hence the reputational asymmetry can be decreased too because the consumer may start to trust the broker company too.
• Brand building. Reputational asymmetry can be reduced by broker company brand building programs. If the broker company has a well-known brand, consumer loyalty may rise.
• Alternative compensation. The whole business model is based on the brokerage (commission) which is the main cause of the dual agency problem. If broker company increases the non-variable parts of the compensation of the salesmen, the moral hazard may be reduced. For example these alternative compensations can be fringe benefits or a quasi-fix wages based on the number of the accounts. These compensations can increase the barriers to exit from the company in the view of the salesmen.
4. SUMMARY
This paper analyzed the network of the insurance broker industry. In the first part the basic elements of the industry were described including the consumer demand; the main actors of the network; and the value creation process. Because the network management is in the centre of the value creation and the salesmen are the crucial dots of this network their management is a key success factor in the industry.
In the second part a dual agency problem was described. On the one hand there is an informational asymmetry between the salesmen and the consumers. By this way salesmen may not suggest the most adequate product to the consumers but that one which provides the highest brokerage (commission).
Science for Sustainability University of West Hungary International Scientific Conference for PhD Students March 19-20, 2013 – Győr
307
On the other hand a reputational asymmetry can be emerged between the salesmen and the broker company because consumers trust more on the salesmen than the company itself. Therefore the salesmen may quit the company and leave with their consumers to a competitor which provides a higher brokerage. At the end of the paper three ways of solutions were described such as knowledge management; brand building; and alternative compensations.
References BELOUCIF, A. – DONALDSON, B. – WADDELL, M. (2005): A systems view of relationship dissolution. Journal of
Financial Services Marketing, Vol. 11, No. 1, pp. 30-48. COFFIN, B. – KALLMAN, J. (2005): Buying Insurance: A Primer. Risk Management; Vol. 52, No. 1, pp. 24-29. CUPACH, W. R. – CARSON, J. M. (2002): The influence of compensation on product recommendations made by
insurance agent. Journal of Business Ethics, vol. 40. No. 2, pp. 167 – 176. DUSKA, R. F. (2005): The Autonomy of the Profession: Whose Agent Are You? Journal of Financial Service
Professionals, 59, 3, pp. 25-28. EISENHARDT, K. M. (1989): Agency Theory: An Assessment and Review. Academy of Management Review,
Vol. 14, No. 1, pp. 57-74. JENSEN, M. C. (1986): Agency Costs of Free Cash Flow, Corporate Finance, and Takeovers. American Economic
Review, Vol. 76, no. 2, pp. 323-329. JENSEN, M. C. (1994): The Nature of Man. Journal of Applied Corporate Finance, Vol. 7, No. 2, pp. 4-19. LI, S. – HOLECKOVA, K. (2005): Evaluation of UK insurance brokers’ web sites: some preliminary findings.
Marketing Intelligence & Planning, Vol. 23, No. 1, pp. 77- 88. OSTERWALDER, A. – PIGNEUR, Y. – TUCCI, C. L. (2005): Clarifying Business Models: Origins, Present, and Future
of the Concept. Communications of AIS, Vol. 15, pp. 1-43. List of the interviews: BRAVIK Attila (2010): Interview with Attila Bravik. Manager, CLB Független Biztosítási Alkusz Kft.
12/03/2010. DÖGE Ferenc (2010): Interview with Ferenc Döge. Division Leader, CLB Független Biztosítási Alkusz Kft.
12/03/2010. UZONYI Tamás (2010): Interview with Tamás Uzonyi. Insurance consultant, the former chairmen of Allianz
Hungária Biztosító (1990-1996), former CEO of Hungária Biztosító (1986-1990), former executive of Hungarian National Insurance Company (1975-1986). 16/03/2010.
VÁLYOGOS Győző (2010): Interview with Győző Vályogos. University lecturer, former marketing officer of OTP Garancia Biztosító (1994-2009). 03/03/2010.
Supply Chain Characteristics
BRÁNYI Tamás14
PhD research student, Doctoral School of Regional and Economic Sciences, Széchenyi István University, Győr, Hungary
Abstract - A general supply chain consists of at least three companies: supplier, producer and buyer. Partnership and competitiveness are all key elements of supply chains. In an optimal case the companies within a supply chain are well integrated, partnership rests on trust which results in common strategic decisions. Business practices show that the above mentioned are not always present between all links in the chain. The objective of the research
14 Brányi, Tamás: [email protected], 9026 Győr,Vidra u. 9.
Science for Sustainability University of West Hungary International Scientific Conference for PhD Students March 19-20, 2013 – Győr
308
is to measure how and what kind of relationship exists between chain members. Questionnaire was needed to collect data on the issues, SPSS was used for analysis. Companies within the supply chain have to coop with power structures while cooperating with each other. They tend to look for solutions to ease dependency. Using or misusing power has several factors; mainly they are inherited from the strongest link of the supply chain. This is usually a problem but the results of the statistical analysis show that still a win-win situation is needed for the companies in order to deepen the cooperation. To conclude this research the data shows that the goal is to be more competitive as a chain, not just as a company.
Keywords: partnership / cooperation / competitiveness / supply chain / SPSS analysis
1. INTRODUCTION
A general supply chain consists of at least three companies: supplier, producer and buyer. Partnership and competitiveness are all key elements of supply chains. In an optimal case the companies within a supply chain are well integrated, partnership rests on trust which results in common strategic decisions. Business practices show that the above mentioned are not always present between all links in the chain. The objective of the research is to measure how and what kind of relationship exists between chain members.
2. MATERIAL STUDIED
Supply chain and so supply chain management has several very exact definitions. In order to find the right one it is necessary to get familiar with the bits of the definitions and also an insight is needed in business environment. „The supply chain encompasses all activities associated with the flow and transformation of goods from the raw materials stage (extraction), through to the end-user, as well as associated information flows. Material and information flow both up and down the supply chain. Supply chain management is the integration of these activities through improved supply chain relationships to achieve sustainable competitive advantage.” (HANDFIELD-NICHOLS 1999)
„Supply chain management is the design, maintenance, and operation of supply chain processes for satisfaction of end-users.” (AYERS 2001).
Business Dictionary uses a more business-like definition and so the following can be read on their website: „Entire network of entities, directly or indirectly interlinked and interdependent in serving the same consumer or customer. It comprises of vendors that supply raw material, producers who convert the material into products, warehouses that store, distribution centres that deliver to the retailers, and retailers who bring the product to the ultimate user. Supply chains underlie value-chains because, without them, no producer has the ability to give customers what they want, when and where they want, at the price they want. Producers compete with each other only through their supply chains, and no degree of improvement at the producer's end can make up for the deficiencies in a supply chain which reduce the producer's ability to compete.” (BUSINESS DICTIONARY 2011).
The third definition comprises each and every segment of a supply chain that is relevant in business life. All three definitions highlight that supply chains include the whole vertical dimension of an industry. The complexity of supply chain lies in the factors and how they bring the companies closer to each other and how they manage the whole as one. In a supply chain the end customer receives a product or service; the elements are produced in different stages by different companies. Serious point is to get value created for the customer by the end of the chain. In the end it all stands together in favour of the market conditions and products and companies have one

Science for Sustainability University of West Hungary International Scientific Conference for PhD Students March 19-20, 2013 – Győr
309
appearance in the eye of consumer. Competitive edge of a supply chain is the vertical dimension of an industry or a market segment.
Supply chains link several companies both in the vendor and also in the customer sides. An equal distribution of power would be optimal; however it is common that one company in the chain has more influence. This can be an important supplier with a unique knowhow or invention but also – and it is more common – that the producer is able to demonstrate its will by its size. An example from the automotive industry could be any car producer firm that can determine almost everything and so the vendors will always adjust themselves to the stronger link. A system like this is not necessarily incorrect because in the optimal way each and every company in the chain can influence the other and with the common aim can move closer to the optimum in order to reach higher profit.
3. RESEARCH INDICATION AND HYPOTHESIS
Levels of partnership and competitiveness as important factors of supply chains’ strengthen the goals, aims of companies working together. This can be measured and statistically analysed. The mentioned factors can be derived from the company’s strategy. I set up a hypothesis to demonstrate the relationship of firms in a supply chain and their strategy.
Hypothesis: Formation of power position of a company in a given supply chain is a strict component of management’s strategy.
There are many aspects of cooperation within supply chains. The methodology of my analysis includes primary research of 221 companies that operate in supply chains. These are suppliers, producers or buyers, they can be seen in (Table 1). The questionnaire collects data of middle sized or big firms that operate in Hungary and have connections with other companies on daily basis.
Table 1. Statistical categories of companies in the questionnaire Frequency Percent
supplier 53 24.0 producer 91 41.2
buyer 77 34.8
Valid
Total 221 100.0 I use SPSS statistical analysis to prove that companies intend to have a deeper cooperation,
common strategy and this is valid for all three types of companies. According to the statistical tables the companies’ future goals are clear, the vertical cooperation should be intact but they want to work towards a horizontal cooperation. They interpret this move as a form of diversification.
4. ANALYSIS OF PARTNERSHIP
Partnerships within the supply chains can be grouped according to several factors. Close and distant relationships are one approach for characterising supply chains: ad hoc agreements, cooperation with commitment, cooperation based on trust and strategic alliances show how the partnership gets more and more important (SZEGEDI-PREZENSZKI 2003). The logical next step would be the joint venture or a merger and acquisition but these would lead to the break-up of supply chains.
An ad hoc order of products or services between companies or a contract that last for a shorter period of time does not comply with partnerships. These forms are only for a fast solution, a quick buyer-seller relationship where the parties would reach a fast transaction of money and

Science for Sustainability University of West Hungary International Scientific Conference for PhD Students March 19-20, 2013 – Győr
310
products or services. The conditions are strict, market prices are set for the business, and completion should be also very fast. There are no common strategies between seller and buyer, long run relationship is not the point. A very good bargain position is the key element of the parties involved.
Cooperation based on commitment and trust shows a direction towards a future partnership. Trust has to be highlighted. After the completion of a couple of businesses the partners reach a point where they know each other so they can develop with each other. The decisions are for long run, the approach is common, the aim is to move towards a joint business development and so the contracts are only frames the work together goes beyond it. “... trust is the basic condition of well functioning business relations. Network connections transform competition into cooperation, so competition will be moved to other fields or market boundaries are created according to it.” (MANDJÁK-PIRICZ-KŐVÁGÓ 2010).
Competition becomes cooperation with the help of contacts. Personal contact is essential before trust evolves furthermore trust is the basis of a long run cooperation with additional financial investments.
According to the questionnaire there were 1-5 scale questions about partnership and cooperation. Companies very much count on their vendors or buyers, very high scores were given in this sense. 5 mean that the statement is absolutely true.
For instance question 16 of the questionnaire was the following. The company has a long term strategy that counts on its partner companies. After having 221 answers Mean is 3,96. This indicates that if a company has a strategy then it includes its partner firms.
Another question (38) highlights the cooperation within the chain. The question is: Company realised the importance of cooperation within the supply chain. From 221 answers the mean is 3,83. Again a statement can be drawn from this so cooperation is essential for supply chain member companies.
Using the data gained from the questionnaire is necessary, however in a crostabulation problems might arise. The possible answers are 5 in each question so the table would have 25 cells. In order to get the main point of the research a data reduction is needed. SPSS offers a device to conclude so out of the 5 there are 2 new categories: true and false. False is the former 1, 2, 3 answers and so true means 4 and 5.
The crosstabulation below analyses the connection between the following variables. These are question 16 and 17 of my questionnaire. The company has such a long-term strategy, that includes its partner firms and the company positions itself in a deliberate way according to its partner firms. In other words could it be if a company has a strategy then it inculdes the relationship to its partner firms that can be either subordinate or the opposit of it. A deliberate positioning means a choosen or at least a coordinated characteristics with partner firms. The crosstabulation indicates the number of valid answers: N=221. For 122 companies (55,2%) both variables are valid and only for 34 companies (15,4%) is the opposite valid. Table 2 shows further infomration regarding this.
Chi-Square Test (Table 3) indicates the level of significance 0,000 so null hypothesis can be rejected. There is a significant connection between the two statements. Further information help according to the Directional Measures and Symmetric Measures (Table 4) tables. Cramer’s V and Kendall’s tau-b are obviously similar in the analysis with the value of 0,314. Gamma shows 0,622 that is a strong relationship. The correlation is also significant.
To sum up a correlation between the statements highlight, that more than half of the companies have long-term strategies with information about partner firms and with this information these companies are able to position itself.

Science for Sustainability University of West Hungary International Scientific Conference for PhD Students March 19-20, 2013 – Győr
311
Table 2. Crosstabulation
17. The company positions itself in a deliberate way according to its partner
firms.
false true Total
Count 34 42 76false % of Total 15,4% 19,0% 34,4%Count 23 122 145
16. The company has such a long-term strategy, that includes its partner firms.
true % of Total 10,4% 55,2% 65,6%
Count 57 164 221Total % of Total 25,8% 74,2% 100,0%
Table 3. Chi-Square Tests
Value df Asymp. Sig. (2-sided)
Exact Sig. (2-sided)
Exact Sig. (1-sided)
Pearson Chi-Square 21,722a 1 ,000 Continuity Correctionb
20,239 1 ,000
Likelihood Ratio 20,970 1 ,000 Fisher's Exact Test ,000 ,000Linear-by-Linear Association
21,623 1 ,000
N of Valid Cases 221 a. 0 cells (,0%) have expected count less than 5. The minimum expected count is 19,60. b. Computed only for a 2x2 table
Table 4. Symmetric Measures
Value Asymp. Std. Errora Approx. Tb Approx. Sig. Phi ,314 ,000Nominal by
Nominal Cramer's V ,314 ,000Kendall's tau-b ,314 ,068 4,385 ,000Kendall's tau-c ,261 ,059 4,385 ,000
Ordinal by Ordinal
Gamma ,622 ,099 4,385 ,000N of Valid Cases 221 a. Not assuming the null hypothesis. b. Using the asymptotic standard error assuming the null hypothesis.
Based on the analysis the hypothesis is proved to be true. Furthermore supply chain
members have strategies and mainly a form of strategic alliance is set up. It is a long run cooperation between two or more independent companies; goal is to gain profit together. (JOHNSON-SCHOLES 1997) Long run forces the companies to have direct contacts regularly. Such a strategic alliance happens in case of supply chains and clusters. It is important to stress here that a supply chain is a form of clusters however it is closed and works with strict rules. Management decisions analyse both interests, work is done together and companies interact on a daily basis.
5. COMPETITIVENESS AS PART OF CHARACTERISTICS
The following definition clarifies competitiveness and gives an understandable meaning. „Ability of a firm or a nation to offer products and services that meet the quality standards of the local and

Science for Sustainability University of West Hungary International Scientific Conference for PhD Students March 19-20, 2013 – Győr
312
world markets at prices that are competitive and provide adequate returns on the resources employed or consumed in producing them.” (BUSINESS DICTIONARY 2011).
A firm’s competitiveness relies on its performance and talent that result in selling its products or services in the market. If the market accepts and buys the offered goods then the product or service is competitive but only at a given time. Competitiveness of a supply chain cannot be simplified to the competitiveness of the end product. The chain consists of several companies with many dimensions and so the whole chain with all of its factors has to be competitive in the market. A continuous development of the processes that involve all the chain members allows the chain to draw energy and new ideas from the members in order to be competitive.
Supply chain members should think, plan and act together in favour of competitiveness in the market. Competitive advantage means something extra compared to several companies simply working together. Tacit and explicit knowledge, innovations, researches are all key elements that can point to a direction (BENCSIK 2009) where the whole chain gets unique. As the firms link each other, the different departments interact, the informal meetings happen, the information flow all slowly give place to a common experience where the companies start to think as chain members. Independent work, doing alone cannot exist anymore if the supply chain intends to gain competitive edge. The ideas generate new ideas and the companies start to believe in the common goals. Vision, company philosophy moves one step higher and will be valid for all members. Team work causes strength and business flows gain strength. The process creates higher interdependency; companies normally join forces in order to act more optimally. So the whole process, chain is optimal or the chain goes down and splits up.
Supply chain managers or supply chain teams do manage supply chains. Bringing the companies together, having brainstorming sessions, meetings are all essential for future innovations and so competitiveness in the end. The process is long, linking companies is not easy but understanding the need is also the start of moving towards lower costs. Customers, vendors, suppliers, producers in the same team talk first about problems. Problems can arise in each and every process of the materials flow. Eliminating the problems means having ideas how to do things better. The small step in the process involves several companies, many people in different departments but all serve for the competitiveness of the whole supply chain. This process keeps repeating itself.
There are five factors that determine the intensiveness of competition among enterprises and companies in a market segment. These are the hazard of competition in the segment, threat of new entries to competition, potential substitute products, strength of the bargain position of customers and suppliers (KOTLER-KELLER 2006). Some of these five factors can be related to supply chains. If the supply chain integrates the suppliers and customers, then the competition within the segment can be minimized. A strategy where all three links have interests but agree in order to reach higher profit then there is no need to get involved in harsh competition and bargaining position within the chain.
Supply chains save money by integrating companies into a system. They use same information technology software; they link departments so information flow speeds up. On operational level costs of additional work, packaging and transportation can be saved. Information flows are concentrated into a system; competition analysis does not need extra money because focus can be on the integration itself and its steps. The whole chain is “protected” from smaller market attacks due to the management that is able to look the whole chain as one entity.
Science for Sustainability University of West Hungary International Scientific Conference for PhD Students March 19-20, 2013 – Győr
313
6. CONCLUSION
Levels of partnership and competitiveness proved to be important factors that are able to connect the supply chains’ goals and aims with those of its members. There is always a firm with high level of power among companies with strategy; usually it works well for the supply chain, if it is in embedded in a partnership based on trust with strategic orientation. This company normally stresses a common goal for the whole supply chain that will lead to competitiveness. In order to work efficiently and reach supply chain excellence member companies use common language, have the same plans, strategies, goals and a communication model where each member participates.
References AYERS, J. (2001): Handbook of Supply Chain Management. St Lucie Press, Boca Raton. BENCSIK A. (2009): A tudásmenedzsment emberi oldala. [Human side of knowledge management.] Z-Press
Kiadó, Miskolc. (in Hungarian) HANDFIELD, R.B. – NICHOLS, E.L. (1999): Introduction to Supply Chain Management. Prentice Hall, Upper
Saddle River. JOHNSON, G. – SCHOLES, K. (1997): Exploring Corporate Strategy. Prentice Hall, Upper Saddle River. KOTLER, P. – KELLER, K. L. (2006): Marketingmenedzsment. [Marketingmanagement.] Akadémiai Kiadó,
Budapest. (in Hungarian) MANDJÁK T. – PIRICZ N. – KŐVÁGÓ GY. (2010): Üzleti kapcsolatok a magyarországi ellátási láncokban. [Business
relations in Hungarian supply chains.] Magyar Marketing Szövetség Marketing Oktatók Klubja, “Új marketing világrend” c. konferencia. [New marketing world order – Conference.] Budapest, 2010. augusztus 26-27.
SZEGEDI Z. – PREZENSZKI J. (2003): Logisztika-menedzsment. [Logistics-management.] Kossuth Kiadó, Budapest. (in Hungarian)
www.businessdictionary.com, downloaded: 2011.10.21.

Science for Sustainability University of West Hungary International Scientific Conference for PhD Students March 19-20, 2013 – Győr
314
Section 5.2 Responses of Economics and Social Sciences to the Present Challenges
Unappreciated but Unavoidable: The Role of Social Sciences in Addressing Global Challenges
KULCSAR, Laszlo J.
Kansas State University Abstract – Contemporary global challenges include a variety of issues ranging from sustainable development through climate change to shared economic prosperity. Scientific research and higher education are extremely important actors to address these challenges in order to provide decision makers both an accurate analysis of the current situation and valid scenarios for the future. While the role of natural sciences has been well established since the 1800s, social sciences often struggle to be accepted as meaningful contributors. The reasons for this include the inherently ambiguous nature of human behavior which makes it difficult to generalize research results and the more critical stand of social sciences toward policy objectives and political decisions. This in turn has led to funding challenges and ideological controversies surrounding social sciences, questioning its scientific capacity to offer solutions to today's problems. This is particularly problematic in an era with an increasing need for interdisciplinary research and education in which social sciences have a crucial role.
Sustainability is a complex issue and as such it should be addressed in a comprehensive way. The 19th and early 20 th century paradigm of science, focusing on broadly defined progress and development, was based on the organizing principles of natural sciences that sought to unravel the mysteries of the universe. Social sciences on the other hand were more interested in the human side of development, including inequalities, cultural differences, power and privileges, and often challenged the core of how progress, development and sustainability were defined. Since these are all concepts materialized via human decisions, it makes social sciences uniquely positioned to contribute to societal well being and prosperity.
This talk addresses the challenges and opportunities facing social sciences in the era of globalization, including the structural constraints, the types of issues social sciences are expected to tackle, the role of higher education, and the concept of public scholarship. The discussion is put in the general context of the recent paradigm shift in science from the traditional disciplinary inquiry to a more comprehensive, interdisciplinary work.

Science for Sustainability University of West Hungary International Scientific Conference for PhD Students March 19-20, 2013 – Győr
315
Crisis in Europe – in View of National Accounts
CSEH Tímea
PhD student, University of West Hungary, István Széchenyi Doctoral School of Management and Organizational Sciences, Sopron, Hungary
E-mail: [email protected] Abstract – The objective of this paper is to study the impact of the economic and financial crisis of 2008 based on data obtained from the national accounts in the EU countries.
The empirical analysis focuses on the impact of the crisis on the real economic flows and it does not contain a detailed analysis of the financial accounts. This paper does not deal with the history and routes of the financial-economic crisis. Data of Hungarian economy are analyzed in the European context.
Comparing the main national accounts data of the EU countries, the majority of indicators show no relevant changes in their tendency in the past few years. Decrease of the production and investments, as well as the consumption of the inventories are generally observed in 2008 and 2009. Although the tendency is going in the same general direction, the intensity of the impact factors is different in the European countries. The study describes the main consequences of the financial and economic crisis on the statistical methodology that encourages collaboration between statistical institutes.
Keywords: economic crisis / national accounts / statistical indicators
1. INTRODUCTION - MAIN AGGREGATES OF NATIONAL ACCOUNTS
National accounts give comprehensive, systematic and quantitative description of an economy in a country. The system provides quantitative information about the performance of the economy and provides useful data set analyzing effects of different theories, business cycle and for international comparison. Data such as on government finance, balance of payments, price or rates statistics are under spotlight as they are also used for planning and monitoring economic policies especially with respect to the crisis.
To begin with the most common indicator of economic statistics, the gross domestic product will be taken into consideration. However some experts recommend analyzing the impact of the recent economic crisis as a better way to see the changes in the consumption and in the unemployment rate than the changes in GDP. The reason for this is that the wider public is affected directly much more by the consumption and by work than by the output. (GROS et al., 2010)
According to the changes, the study compares the main national accounts data as output, gross domestic product, consumption, capital formation and capital stock of the EU economies. However not only data of the national accounts but the tendency of the housing and auto industry, the unemployment rate, the productivity and the inflation rate were affected significantly in the economic crisis. One major impact of the crisis on the user’s need is that stock data as well as sectoral data are more emphasized than before so we will see the most important changes in these data as well.
Science for Sustainability University of West Hungary International Scientific Conference for PhD Students March 19-20, 2013 – Győr
316
1.1. Impact of the crisis on main national accounts aggregates
A financial crisis usually ends in economic crisis. The problems in the financial market, the bubbles and the declining funds, lead to the decrease of the real economic output. This happened recently after the subprime mortgage crisis in the U.S. led to the global financial crisis and then to the economic downturn. The crisis affected most of industrialized, emerging and developing economies. It is said to be the worst financial crisis since the Great Depression of the 1930’s. However as we can see below, there are differences in the level of the crisis’ impact on national economics. As countries of EU have different routes, different history and also the natural, social and economic facilities are more or less different; they are on different levels of development. Therefore the starting points were different in the Member states which influence also the magnitude of the changes at the beginning of the crisis. The political answers were also different in the national economies which define the changes in data of the years after the bursting of the bubble (2008). The loss of output and the high unemployment rate are the most common signs of the crisis indicated by the national accounts of the EU countries.
1.1.1. Production
The crisis has a dramatic impact on the most commonly used economic indicator, the gross domestic product (GDP). Even though the repercussions on potential output are less clear (EUROPEAN COMMISSION 2009), some studies are dealing with the effect of the turmoil by analysing the impact of the crisis on the potential output. Former crises did not decrease the potential growth as permanently as it is seems to be by the recent crisis (HALMAI 2011).
As the crisis came to Europe the third quarter of 2008 was the first quarter when the EU-27 average growth declined compared to the previous year. The largest declines were observed in Estonia, Latvia and Lithuania, where the fall extended to 10% in 2009. However after the temporary downfall, in 2011 these countries growth more than 5%, exceeded the annual average of EU-27 (1.5%). GDP of 2011 shows a better picture of the economy. A negative growth occurred just in Portugal (-1.6%) and in Greece (-7.1%) out of the 27 EU countries. Poland is the only country among the 27 Member states where the GDP remained in every quarter higher than zero between 2008 and 2011.
1.1.2. Consumption, investment and inventories
Decreases of final consumption of households as well as of government were modest in most of the Member states as other items on use side of GDP. A common phenomenon in the EU was that investment and inventories fell down sharply after the crisis began. As investments decreased significantly in all Member states, as well as changes in inventories, (except Luxemburg and Romania where change in inventories is not a main item in the GDP) in 2009 the industrial output fell down to higher extent than the GDP. It is still an existing and very important problem in Hungary (as in Bulgaria, Cyprus, Ireland, Portugal and Slovenia) that the investments of business corporations decrease permanently since the crisis begun. The reason could be on the one hand that the uncertainty which could be seen in the poor growing outlook, both internal and international, and on the other hand the contraction of the corporate lending. The consumption of fixed capital (depreciation) in several cases exceeds the level of investment in the corporate sector which led to decreasing stock of fixed assets. The stock of the fixed assets decreased also because of the abandoned assets not used for production due to the bankruptcy of the company.
1.1.3. External trade of goods and services
Changes in data of external trade of goods and services highlight the global dimension of the economic crisis. The relative importance of imports and exports of goods and services varies significantly across countries, and the drop in imports was generally slightly more significant than
Science for Sustainability University of West Hungary International Scientific Conference for PhD Students March 19-20, 2013 – Győr
317
the drop experienced for exports in 2009 (EUROSTAT 2009). After the very low value of exports transactions in 2009 there were an increase in 2010. It continued also in 2011 when all of the Member states have growth (in different degree) in exports. The tendency is the same concerning the imports as well; however in 2011, Cyprus, Greece and Portugal still show negative evolution. Also Spain (-0.9%) and Ireland (-0.3%) have a moderate decrease while Italy (0.6%) and United Kingdom (0.5%) have a moderate increase in import value of goods and services compared to the previous year.
1.2. Sector accounts
There is a bigger need for sector data since the beginning of the crisis to understand better the main causes of the problems in a countries’ economy. Because of the limit of space, households and government sectors are highlighted here. The crisis has affected all the sectors to a different extent, such as corporation of course because of the limitation of credits which caused a downturn in production and in investments (see above 1.1.1 Production and 1.1.2 Consumption, investment and inventories).
1.2.1. Households
Households are seriously affected by the recession. The main contribution to households’ income is the compensation of employees. Mixed income (which accrues by self-employed households and home owners when operating surplus could not be separated from the compensation of employees) has also important contribution to households’ income. Of significance is that mixed income decreased in most of the EU countries during the recession. If households’ gross disposable income increases faster than their consumption, the household saving rate increases which may be used to finance investment in fixed assets, especially for housing in this sector. The level of saving rate increased significantly in most of the EU Member states (especially in Austria, Belgium, Spain and Sweden) compared to the investment rates which were falling from 2009. Gross fixed capital formation (GFCF) is relatively volatile in all sectors, and during the recession households recorded significant negative rates of change for this indicator (EUROSTAT 2009).
1.2.2. Government
Not only data of households but also data on public finance got greater attention since 2008. Government surplus/deficit measures whether government has to borrow to finance a deficit or has a surplus and can lend money to other institutional sectors in a year. Annual budgets (primary balances) contribute also to the changes of general government debt, however the main source of the high level of general government debt derives from the accumulated deficits of the past, and the interest expenses as a consequence of this.
In 2011 there are 14 Member states that have a larger debt than the threshold, and 13 Member states could fulfill the Maachsticht criteria regarding the government gross debt which could not exceed the 60% of the gross domestic product (Table 1). Except Sweden all of the countries have higher debt in 2011 than it was in 2008. Exceptional problem in such countries occurs if the high debt is coupled with high annual government deficit. The well-known example is Greece, but there are signs of the problem in Portugal also. However, Italy also has a higher debt but it has a much lower annual deficit. There are some countries such as Ireland, Spain and UK where the government debt rose in the three years but they have a lower annual deficit and/or they have a higher potential growth-rate. Unemployment As the economy shows weak performance, the unemployment rate is correlated with the decrease in production. With the exception of Luxemburg and Germany all of the Member states had a
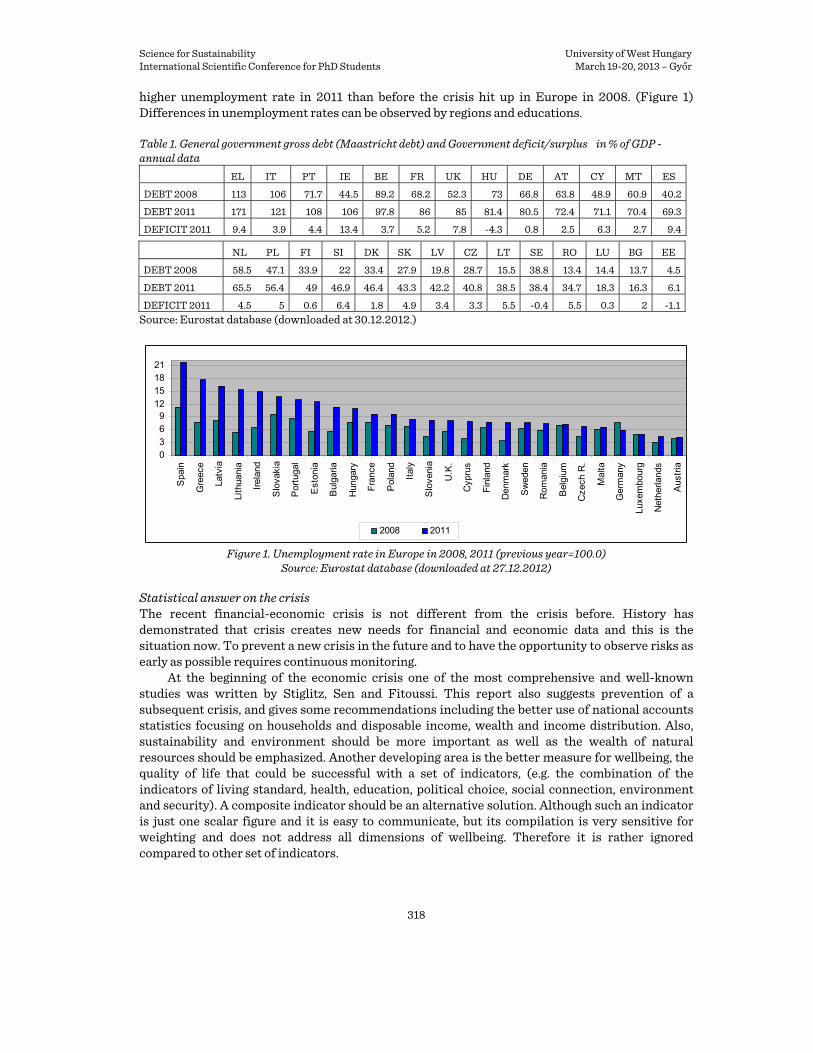
Science for Sustainability University of West Hungary International Scientific Conference for PhD Students March 19-20, 2013 – Győr
318
higher unemployment rate in 2011 than before the crisis hit up in Europe in 2008. (Figure 1) Differences in unemployment rates can be observed by regions and educations. Table 1. General government gross debt (Maastricht debt) and Government deficit/surplus in % of GDP - annual data
EL IT PT IE BE FR UK HU DE AT CY MT ES
DEBT 2008 113 106 71.7 44.5 89.2 68.2 52.3 73 66.8 63.8 48.9 60.9 40.2
DEBT 2011 171 121 108 106 97.8 86 85 81.4 80.5 72.4 71.1 70.4 69.3
DEFICIT 2011 9.4 3.9 4.4 13.4 3.7 5.2 7.8 -4.3 0.8 2.5 6.3 2.7 9.4
NL PL FI SI DK SK LV CZ LT SE RO LU BG EE
DEBT 2008 58.5 47.1 33.9 22 33.4 27.9 19.8 28.7 15.5 38.8 13.4 14.4 13.7 4.5
DEBT 2011 65.5 56.4 49 46.9 46.4 43.3 42.2 40.8 38.5 38.4 34.7 18.3 16.3 6.1
DEFICIT 2011 4.5 5 0.6 6.4 1.8 4.9 3.4 3.3 5.5 -0.4 5.5 0.3 2 -1.1Source: Eurostat database (downloaded at 30.12.2012.)
0369
12151821
Spa
in
Gre
ece
Latv
ia
Lith
uani
a
Irel
and
Slo
vaki
a
Por
tuga
l
Est
onia
Bul
garia
Hun
gary
Fra
nce
Pol
and
Ital
y
Slo
veni
a
U.K
.
Cyp
rus
Fin
land
Den
mar
k
Sw
eden
Rom
ania
Bel
gium
Cze
ch R
.
Mal
ta
Ger
man
y
Luxe
mbo
urg
Net
herla
nds
Aus
tria
2008 2011
Figure 1. Unemployment rate in Europe in 2008, 2011 (previous year=100.0) Source: Eurostat database (downloaded at 27.12.2012)
Statistical answer on the crisis The recent financial-economic crisis is not different from the crisis before. History has demonstrated that crisis creates new needs for financial and economic data and this is the situation now. To prevent a new crisis in the future and to have the opportunity to observe risks as early as possible requires continuous monitoring.
At the beginning of the economic crisis one of the most comprehensive and well-known studies was written by Stiglitz, Sen and Fitoussi. This report also suggests prevention of a subsequent crisis, and gives some recommendations including the better use of national accounts statistics focusing on households and disposable income, wealth and income distribution. Also, sustainability and environment should be more important as well as the wealth of natural resources should be emphasized. Another developing area is the better measure for wellbeing, the quality of life that could be successful with a set of indicators, (e.g. the combination of the indicators of living standard, health, education, political choice, social connection, environment and security). A composite indicator should be an alternative solution. Although such an indicator is just one scalar figure and it is easy to communicate, but its compilation is very sensitive for weighting and does not address all dimensions of wellbeing. Therefore it is rather ignored compared to other set of indicators.
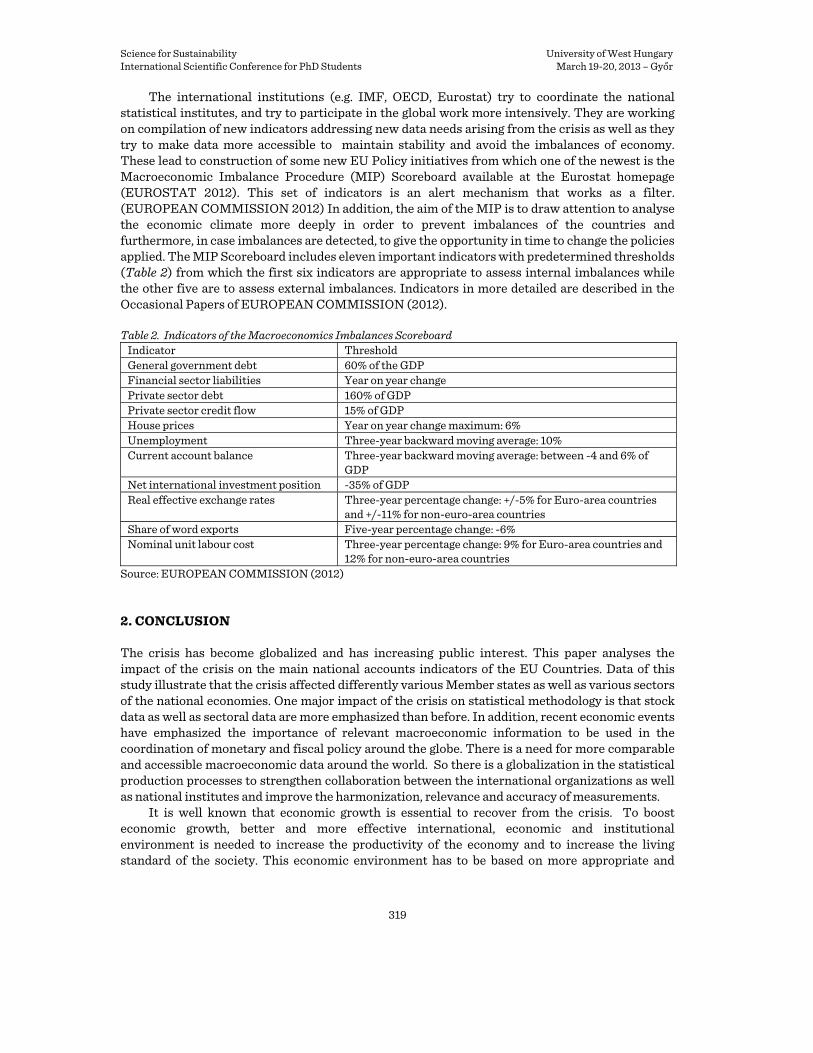
Science for Sustainability University of West Hungary International Scientific Conference for PhD Students March 19-20, 2013 – Győr
319
The international institutions (e.g. IMF, OECD, Eurostat) try to coordinate the national statistical institutes, and try to participate in the global work more intensively. They are working on compilation of new indicators addressing new data needs arising from the crisis as well as they try to make data more accessible to maintain stability and avoid the imbalances of economy. These lead to construction of some new EU Policy initiatives from which one of the newest is the Macroeconomic Imbalance Procedure (MIP) Scoreboard available at the Eurostat homepage (EUROSTAT 2012). This set of indicators is an alert mechanism that works as a filter. (EUROPEAN COMMISSION 2012) In addition, the aim of the MIP is to draw attention to analyse the economic climate more deeply in order to prevent imbalances of the countries and furthermore, in case imbalances are detected, to give the opportunity in time to change the policies applied. The MIP Scoreboard includes eleven important indicators with predetermined thresholds (Table 2) from which the first six indicators are appropriate to assess internal imbalances while the other five are to assess external imbalances. Indicators in more detailed are described in the Occasional Papers of EUROPEAN COMMISSION (2012).
Table 2. Indicators of the Macroeconomics Imbalances Scoreboard
Indicator Threshold General government debt 60% of the GDP Financial sector liabilities Year on year change Private sector debt 160% of GDP Private sector credit flow 15% of GDP House prices Year on year change maximum: 6% Unemployment Three-year backward moving average: 10% Current account balance Three-year backward moving average: between -4 and 6% of
GDP Net international investment position -35% of GDP Real effective exchange rates Three-year percentage change: +/-5% for Euro-area countries
and +/-11% for non-euro-area countries Share of word exports Five-year percentage change: -6% Nominal unit labour cost Three-year percentage change: 9% for Euro-area countries and
12% for non-euro-area countries Source: EUROPEAN COMMISSION (2012)
2. CONCLUSION
The crisis has become globalized and has increasing public interest. This paper analyses the impact of the crisis on the main national accounts indicators of the EU Countries. Data of this study illustrate that the crisis affected differently various Member states as well as various sectors of the national economies. One major impact of the crisis on statistical methodology is that stock data as well as sectoral data are more emphasized than before. In addition, recent economic events have emphasized the importance of relevant macroeconomic information to be used in the coordination of monetary and fiscal policy around the globe. There is a need for more comparable and accessible macroeconomic data around the world. So there is a globalization in the statistical production processes to strengthen collaboration between the international organizations as well as national institutes and improve the harmonization, relevance and accuracy of measurements.
It is well known that economic growth is essential to recover from the crisis. To boost economic growth, better and more effective international, economic and institutional environment is needed to increase the productivity of the economy and to increase the living standard of the society. This economic environment has to be based on more appropriate and

Science for Sustainability University of West Hungary International Scientific Conference for PhD Students March 19-20, 2013 – Győr
320
accurate statistical indicators which are consistent and make historical and territorial comparability for analytical purposes easier.
As the crisis is still an ongoing process, it should be analyzed also in the future both in global and in regional level. These analyses help to explore the cause of the crisis as well as to understand and analyze the answer of economic policies to the crisis. Based on these analyses policies can be improved and – probably – subsequent deep crisis could be prevented. References EUROPEAN COMMISSION (2009): Impact of the current economic and financial crisis on potential output.
European Economy – Occasional Papers 49. Directorate-General for Economic and Financial Affairs. Brussels. 87 pp.
EUROPEAN COMMISSION (2012): Scoreboard for the surveillance of macroeconomic imbalances. European Economy – Occasional Papers 92. Directorate-General for Economic and Financial Affairs. Brussels. 28 pp.
EUROSTAT (2009): Impact of the economic crisis on national accounts. Archiv. http://epp.eurostat.ec.europa.eu/statistics_explained/index.php/Archive:Impact_of_the_economic_crisis_on_national_accounts
EUROSTAT (2012): Macroeconomic Imbalance Procedure Scoreboard. http://epp.eurostat.ec.europa.eu/portal/page/portal/excessive_imbalance_procedure/imbalance_scoreboar
d EUROSTAT database: http://epp.eurostat.ec.europa.eu/portal/page/portal/statistics/search_database GROS, D. – ALCIDI, C. (2010): The Impact of the Financial Crisis on the Real Economy. In: Intereconomics.
Vol. 45. p. 4-20. HALMAI, P. (2011): Válság és a potenciális növekedés az Európai Unióban. [Crisis and potential growth in the
European Union] In: Közgazdasági szemle. Vol. LVIII. 1059-1081. (in Hungarian)
Forces and Organizaton Forms
MOLNÁR Imre*
PhD student, University of West Hungary, Sopron, Hungary * Address: [email protected], H-1119 Budapest, Rátz László u. 30.
Abstract – Successful organizations are those that have figured out the best way to integrate key internal and external elements. And they understand the importance of reviewing and redesigning their structures on an ongoing basis.
According to Henry Mintzberg, most of the things that happens in organizations can be described by the interaction of seven main forces. When an organization dominated by a strong force, it became coherent, founded alike. When not one force is dominant, most organizations should rather function as a balanced combination of various forces, including transition period of transformation from one to the other form.
To understand and develop these organizations, we need to know and identify these forces and their interactions. I wish to present in my lecture these forces and the possible forms of organizations, as well as why it is important to know our organization operating forces and their impact to the success of the organization.
Keywords: organization form / force / initiative

Science for Sustainability University of West Hungary International Scientific Conference for PhD Students March 19-20, 2013 – Győr
321
1. INTRODUCTION, GOALS
Many a time have I experienced, that to the question ‘what do you do?’ the majority of people response by giving the name of the company they work for. Some tell their professions or functions. However, very few say, for instance, that they sell computers, make calculations, raise children or run a household. We may come to the conclusion that the thing they do is unrecognisable that is they are not really aware of their functions. Or they feel ashamed about what they do.
None of these is a propitious sign. I wonder what if there was no discordancy between the individuals’ activities and their titles; would this phenomenon be experienced at all? I wonder if people carried out their actual activities in a prominent, well performing position; then, what would they answer?
As a practicing manager I have always been curiously interested in what may the secret of the permanently well-performing organisations be? What makes one more successful and what is more important are more pleasant a workplace than others? How the managers and the scale of values or attitudes represented by them, are manifested in their everyday work?
Since then I have experienced and learnt many things and, of course, I know that although immense is the influence of company culture on the entire organisation, scarce is the literature available on the forces principally affecting the company culture. What forces are principally needed in an organisation, to enable the company performing prominently even on the long run?
I was particularly interested in how the identification of organisation structure with an approach being different from the one specified by traditional schools may assist the interpretation of properly functioning organisations.
In particular, Henry Mintzberg’s book the “Managing”, published in Hungary in 2010, deals with the topic of my paper, but Ken Blanchard’s book, the “Leading at a Higher Level”, published in the same year in Hungary, also discusses in detail the criteria of High Performing Organisations (HPO). (BLANCHARD 2010)
My goal in this paper is to give a summary, relying on the examples taken from the available literature, of the correlations as per the latest approaches and to make this summary complete by exploiting my own experiences as well.
2. FORCES IN AN ORGANISATION
The forms of organisation taught by business schools, such as linear, functional, divisional or matrix organisations, describe the possible theoretical, clear structure of organisations properly as well as the career route functioning within that. Nevertheless they are far from presenting the entire vertical structure of an organisation existing in practice. Several organisations establish a specific combination of the main forms described that are apt for interpretation on the basis of the individual features of the organisation. Competition, the organisational culture and the characteristics of management have also dominant role in this.
According to Henry Mintzberg the most of the things happening in organisations can be described as interactions of seven principal forces. Of course, other forces, even those temporarily occurring, may also be revealed in organisations, nevertheless there are seven principal forces that are the most predominant (“the basic pulls”) in the lives companies.
These forces are the following: • Leading • Effectiveness • Competence • Focus

Science for Sustainability University of West Hungary International Scientific Conference for PhD Students March 19-20, 2013 – Győr
322
• Innovation • Cooperation • Competition The force of leading gives the knowledge to an organisational structure as an integrated
entity, where to head for. Without leadership or direction the different activities of the organisation would be impossible to be engaged easily for the achievement of a common target. (MINTZBERG 2010)
The force of effectiveness attempts to provide a sustainable ratio between the realised profits and the emerging expenditures or costs. Without focusing attention on effectiveness eventually the most protected organisations will get along vaguely. Effectiveness, in general includes standardisation and formalisation, however it is often restricted to economic efficiency. (MINTZBERG 2010)
Competence means the implementation of certain tasks with the utilisation of high standard knowledge and practical proficiency. Without competence the complicated work of organisations would be simply impossible to be accomplished. (MINTZBERG 2010)
The force of focus facilitates for individual units to concentrate their efforts on serving different markets. Without any such focus it would be impossible to lead a diversified organisation (MINTZBERG 2010).
The force of innovation is also indispensable, considering the fact, that although organisations need central administration and highly concentrated focus, effectiveness and competence, finding new solutions and things is also vital both for the consumers and for the organisation itself – for the purpose of adaptation and learning alike (MINTZBERG 2010).
There are two more forces that might even be considered as catalysts: cooperation and competition. One of them describes ideological cohesion, the other one the political divergence. Politics acts beyond the boundaries of legitimate power and the acknowledged competence and that is why it is prone to conflicts. Ideology means the vivid culture of ideologies, norms, beliefs and values, which integrate different groups of people in a harmonic and collaborating union. There exists no serious organisation, which has ever been entirely independent of politics or at least is holds some ideological remains (MINTZBERG 2010).
To understand the operation of organisation structures taking the foregoing forces as fundaments and considering their interactions as a key it may be established that in cases when a single force predominates in an organisational structure, the structure is a coherent and well-grounded form, and proceeds towards configuration. When it is not a single force to dominate, organisations are more rather to operate as a balanced combination of difference forces, including the periods of transformation from one form to another one (MINTZBERG 2010).
Theoretically every configuration of the forces is possible, but in practice, regularly only few types occur. When any of the forces appears as predominant in an organisational structure, the organisation develops a form most conforming to it. On the basis of the foregoing hereinafter seven basic forms will be distinguished.
Hitherto I have had the opportunity to work in nearly each of the combinations. Perhaps it is the enterprise functioning with the dominance of focus that I have never been in. Each of these forms had their own merits and weaknesses.
It happened that the failure to separate the traditional “owner-leader” role disabled effective management of the company. In cases when a leader did not manage to enforce his decisions in the organisation, he attempted again forcefully by the owner’s power behind his back, sweeping aside the benevolent effects of consensus and cooperation. At this company the force of innovation enhances the focus on the clients besides the force of competence, but at the same time the effectiveness of the company is impaired by the strong impact of leading and internal rivalry.

Science for Sustainability University of West Hungary International Scientific Conference for PhD Students March 19-20, 2013 – Győr
323
Figure 1. Seven main forces and their appearance in an organisational structure
Source: MINTBERG 2010
Table 1. Forms and Characteristics of Organisational Structures Characteristics Entrepreneurial organisation form
This is the form of the “typical” domestic SMEs. It occurs most frequently when the manager of the company and the force of the direction in his head dominate the organisation structure. The head of the company exercises personal control over the majority of business events. This typically happens at the stage when the enterprise is launched or when there is a turning point in the life of the enterprise, when the company is in great need of a powerful prospective provided from upwards, and it is also observable in the case of small enterprises led by the owner. In this form of organisational structure there are only few positions at middle managerial level and staff level, or they are relatively weak. Another consequence when any possible changes are to be concerned is the often coercive change management strategy. The company leader (owner) availing himself of his coercive powers and refusing any contradictions, the desired changes are forced all through the organisational structure.
Machine organisation form
This is the form of a company being engaged in the traditional mass production, or manufacturing. The force of effectiveness becomes the more powerful strength in such organisation structures.
Professional organisation form
This develops when professional competence becomes the main organising power in a business structure; this organisation form is typical to hospitals, accounting, advising, designing and engineering offices. Innovation is less important as a criterion, and instead of finding out knew knowledge the perfection of the existing one is what counts.
Adhocracy Only few companies really have this organisational form. It mostly occurs in the case of young business ventures specified in software development, or creative agencies. The

Science for Sustainability University of West Hungary International Scientific Conference for PhD Students March 19-20, 2013 – Győr
324
form of adhocracy is comes to existence as a response to highly innovative requirements within an organisation structure composed of qualified professionals, whereas an organisation like that is incorporated for the purpose of creating novelties. The experts’ efforts are to be united in multi-disciplinary project groups.
Diversified organisation form
This is another formal appearance of the classical “multinational companies”. This appears when the force of focus emerges from among the other forces. Such organisations first become diversified, then divisions are created. Each division is functioning relatively autonomously, subject to the performance control specified by a small central office. This diversified form of organisational structure is the most common in the world of large conglomerate companies.
Ideological organisational form
People cooperate for the sake of common profit. The members of the organisation become personally committed, and identify themselves with the requirements of the organisation. Ideology induces the members’ introversion; at the same time it may also assist the members of the organisation in managing contradictions and changes.
Political organisational form
It is a contradictory, highly regulated form of organisation still internal conflicts emerge, where the force of competition prevails. However this competition is focused in internal rivalry and is not directed to the external market, thus dissension inside the organisation structure becomes intensive. This is a form typical to abandoned organisations. On the side of a committed management continuous efforts are required to get people to cooperation.
Source: MINTZBERG 2010
Figure 2. Typical forces and organisational form of a Hungarian software development company
Source: Own composition of the author
In other organisations unreasoned over-regulation killed readiness for innovation, and exaggerated internal strain of administrative tasks were imposed on the employees, instead of focusing on clients. In organisations like that effectiveness and focus also dominate besides politics and internal rivalry.
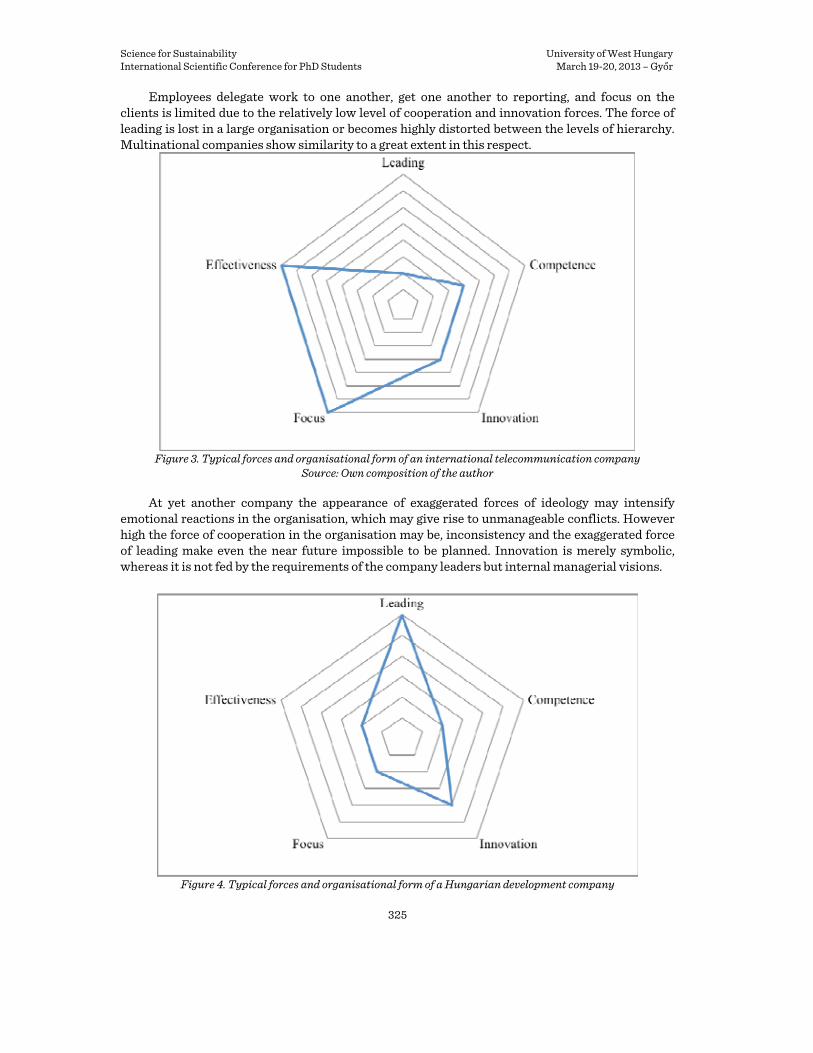
Science for Sustainability University of West Hungary International Scientific Conference for PhD Students March 19-20, 2013 – Győr
325
Employees delegate work to one another, get one another to reporting, and focus on the clients is limited due to the relatively low level of cooperation and innovation forces. The force of leading is lost in a large organisation or becomes highly distorted between the levels of hierarchy. Multinational companies show similarity to a great extent in this respect.
Figure 3. Typical forces and organisational form of an international telecommunication company
Source: Own composition of the author
At yet another company the appearance of exaggerated forces of ideology may intensify emotional reactions in the organisation, which may give rise to unmanageable conflicts. However high the force of cooperation in the organisation may be, inconsistency and the exaggerated force of leading make even the near future impossible to be planned. Innovation is merely symbolic, whereas it is not fed by the requirements of the company leaders but internal managerial visions.
Figure 4. Typical forces and organisational form of a Hungarian development company
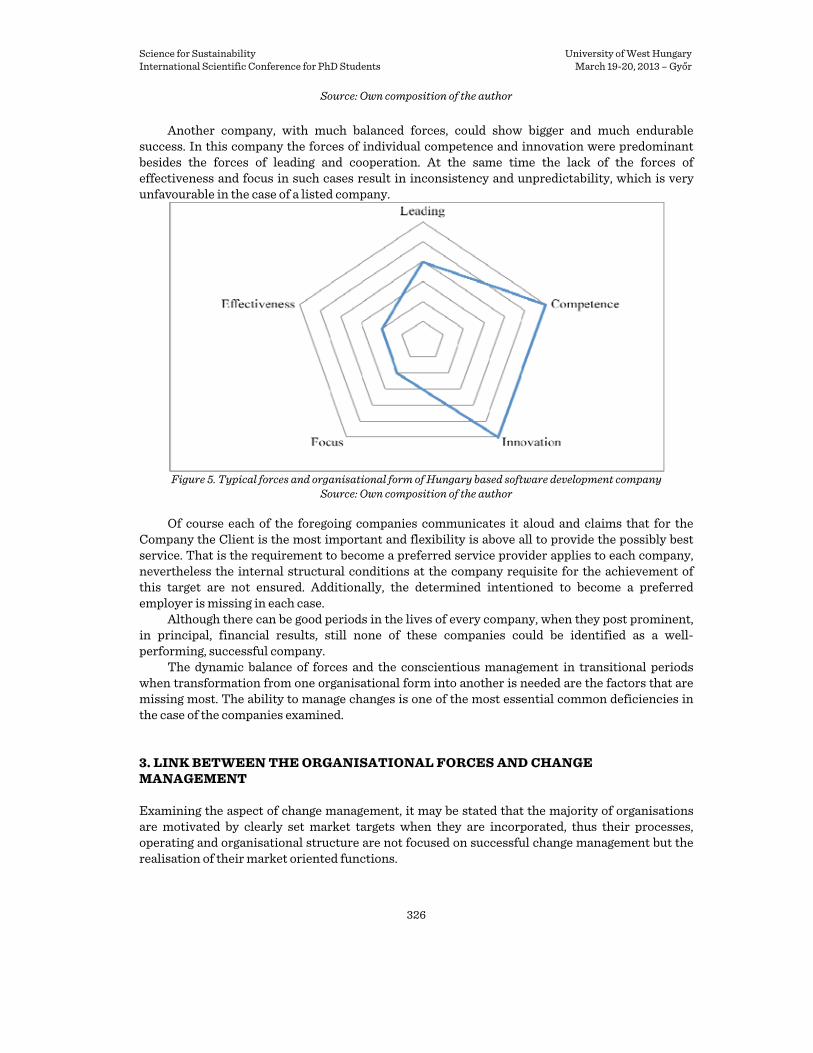
Science for Sustainability University of West Hungary International Scientific Conference for PhD Students March 19-20, 2013 – Győr
326
Source: Own composition of the author
Another company, with much balanced forces, could show bigger and much endurable success. In this company the forces of individual competence and innovation were predominant besides the forces of leading and cooperation. At the same time the lack of the forces of effectiveness and focus in such cases result in inconsistency and unpredictability, which is very unfavourable in the case of a listed company.
Figure 5. Typical forces and organisational form of Hungary based software development company
Source: Own composition of the author
Of course each of the foregoing companies communicates it aloud and claims that for the Company the Client is the most important and flexibility is above all to provide the possibly best service. That is the requirement to become a preferred service provider applies to each company, nevertheless the internal structural conditions at the company requisite for the achievement of this target are not ensured. Additionally, the determined intentioned to become a preferred employer is missing in each case.
Although there can be good periods in the lives of every company, when they post prominent, in principal, financial results, still none of these companies could be identified as a well-performing, successful company.
The dynamic balance of forces and the conscientious management in transitional periods when transformation from one organisational form into another is needed are the factors that are missing most. The ability to manage changes is one of the most essential common deficiencies in the case of the companies examined.
3. LINK BETWEEN THE ORGANISATIONAL FORCES AND CHANGE MANAGEMENT
Examining the aspect of change management, it may be stated that the majority of organisations are motivated by clearly set market targets when they are incorporated, thus their processes, operating and organisational structure are not focused on successful change management but the realisation of their market oriented functions.

Science for Sustainability University of West Hungary International Scientific Conference for PhD Students March 19-20, 2013 – Győr
327
The competences required for the change management are either improved within the organisation or they do their best to supplement it from outside.
The higher the force of effectiveness, and the control applied for the sake of efficiency are, the more intensive the opposition to the changes may be and proportionally the force of innovation may decline detrimental to effectiveness. The more organisational rules are introduced and the higher the rate of regulation is the less liberty the individuals have and consequently they become less inclined to innovation.
The force of leading should not be neglected either in the progress of implementing the targeted changes. At the same time it is important to distinguish between the intrepid desire to act, as Kotter denotes to it the: “eagerness to act” and the imitating thereof. John Kotter makes a sharp distinction between self-satisfied calmness, the pseudo desire to act and the real eagerness to make sacrifice (KOTTER 2008).
As one of the main reasons for the failure of corporate strategies, the failure of changes also roots in the pseudo commitment of the executive management. That is managers support the changes only seemingly, when their person or positions become jeopardised, they often refuse or even sabotage the implementation of changes (KOTTER 2008).
Real commitment in executive management feeds in principal on the forces of leading and innovation. The more these two factors are present in the organisation, the higher the chances are for the successful implementation of the contemplated changes.
4. CONCLUSIONS AND SUMMARY
However we endeavour we are unable to describe the complete and complex reality, but we tend to think in simplifications and models. Due to this the occurrence of organisational structures clearly in the foregoing forms in practice is also doubtful.
No organisation may be exclusively machine or bureaucratic. Still it is important to interpret the forces that act in organisations as well as the structures they form in an organisation. The model above may be useful for identifying and interpreting, to set up a diagnosis and for planning; provided that everything remains unchanged. Knowing the influencing power of the environment it may be surely claimed that every organisation will cease to be static sooner or later and it will also lose its effectiveness it is used to.
Really effective and successful organisations cannot exist in a purified form. What makes an organisation effective is not merely the predominance of a force, but also the restrictive power of all other forces, the correlation of forces and the synergy among them, as well as the temporary impact, and the exploitation of given, typical forces, in view of the entire structure of the organisation.
Well-performing, successful organisations are concurrently able to look and focus their forces inside and outside. This requires strong organisation, and focused leadership at the same time the commitment and devotion to innovation and competence (BLANCHARD 2010).
Nevertheless it is possible that the force of leading can be perceived only to a limited extent in the case of large companies, merely and also due to the size and the distortion of information.
To innovation a special and great significance is attributed when global competition becomes more intense among companies and success highly depends on the recruitment and keeping of prominently performing employees. Those ventures will become successful and will perform well, that are able to deploy and keep those with the most powerful business thinking and ideas.
According to Mintzberg’s model a company, which intends to become successful, will predominantly need all the forces (leading, competence, innovation, focus, effectiveness and cooperation) other than the political form that is the dominant force of competition.

Science for Sustainability University of West Hungary International Scientific Conference for PhD Students March 19-20, 2013 – Győr
328
It is extremely important when we intend to match the corporate strategy and the HR strategy. When a new candidate is employed as much as possible we must put emphasis on substituting or supplementing the missing and necessary forces. Persons with competences should be employed by the company that represent values for the entire organisation and support the target of becoming a successful venture. References BLANCHARD, K. (2010): Vezetés magasabb szinten. Budapest. HVG kiadó KOTTER, J. P. (1999): A változások irányítása. Kossuth Kiadó, Budapest KOTTER, J. P. (2008): A Sense of Urgency. Harvard Business Press MINTZBERG, H. (1991): The effective Organization: Forces and Forms Budapest: ASloan Management
Review, Vol. 32. 54-67. oldal MINTZBERG, H. (2010): A Menedzsment művészete Budapest: Alinea kiadó – Rajk László Szakkollégium MINDTOOLS (2010): Mintzberg Organizational Configurations
http://www.mindtools.com/pages/article/newSTR_54.htm
The Unsubstitutable Role of Trust in Ethical Approach to Management Innovation
SEREK, Radomira* aDepartment of Marketing and Management, Tomas Bata University in Zlin, Czech Republic
Abstract – The article is finding the reasons of economic crisis in lack of ethics and trust. The concept of trust is defined including explanation of trust’s general positive effects as increasing the speed and decreasing the costs of transactions. Then the article is continuing in clarifying the practical benefits of trust on macroeconomics, microeconomics and individual level which are supported by outcomes of various studies. In spite the benefits of trust are well known also to Czech managers there is still lack of effort to innovate the managerial work by ethical approaches. It seems that a trust is an essential substance so that this innovation process can be successful.
Keywords: trust / goodwill / strategy / synergy / subjective well-being
1. INTRODUCTION TO THE PROBLEMATICS
1.1. Contemporary Status
In the time of economic crisis and in the past socialistic regimes we see and face a lack of trust. Already in 1929 Tomas Bata (founder of Bata Shoes Company) was speaking about the economic crisis as crisis of trust. In 1932 he is adding that this crisis cannot be redeveloped by money but rather by returning to the values and moral statements (ZELENY 2011). During the survey of managerial ethics, which I was a co-author, 350 respondents (Czech managers of different rank and companies) inclined also to the statement that absence of ethics contributed to arise of economic crisis (Figure 1).
* Ing. Radomir Serek, [email protected], Na strani 632, 742 45 Fulnek, Czech Republic

Science for Sustainability University of West Hungary International Scientific Conference for PhD Students March 19-20, 2013 – Győr
329
Figure 1. Do you think that absence of ethics in business contributed to the current global crisis?
The signs of distrust could be found in buy-outs of company shares during economic crisis or in censorship and no freedom of speech in socialistic era. Unfortunately the lack of trust is commonly presented also in companies organizations nowadays and negatively influences its performance and competitiveness. There exist certain signs which are indicating this phenomenon. For instance the relationship between employeer and employee can be rather described as unfriendly, the tasks are omitted by subordinate when he is not watched or the tasks are performed as necessity without any pleasure (DYTRT 2011). Instead of team working we are working in the team. Instead of collaboration we rather fight with each other to show that I am the strongest. For interest there is very narrow line between those words in the Czech language: “Spolupráce” as collaboration and “Spolu prát se” as fighting with each other (ZELENY 2011). It is apparent that in such environment on working place the employee potential related to performance and creativity is not fully used. The way out seems to be in promoting the trust and ethical approaches beginning with that process on the working place. As COVEY (2012) insists trust is recalling reciprocity and incorporates multiplication effects capabilities.
1.2. Definition of Trust
Human-being acting is always related to the future and thus needs to be based on the things which are not sure. Some of the decisions can be secured but many have to be done relying on certain people, facts or things. In spite of that a man is taking decisions also with a risk of disappointment or misconduct. A trust is inevitable prerequisite of living in society (FUKUYAMA 1995). In the common situations it is practical to think about the trust as a part of calculated risk (MLCOCH 2006). This way a loan’s client bonity is evaluated or a risk of an investment. This risk is quantified by interest rate as a compensation for the investor’s risk. Contemplate the financial crisis when governments took the precautions to support a trust in financial markets including the reduction of interest rates. Generally a trust consists of: Objective signs – for example objective positive feedbacks (references) on human (company) acting leading to a Goodwill or “bad word of mouth”. Subjective signs – depends on subjective perception (for example a man of midle age with grey hairs and decent suit generates higher level of subjective trust or similarly a company with long history tends to be more trusted).
In simple form the generation of trust could be formulated as follows:
−+−+ −+−+= )()(01 SSOODD (Eq. 1)
1D ….. a new level of trust 0D ….. an original level of trust +O ….. positive objective signs −O ….. negative objective signs +S ….. positive subjective signs −S ….. negative subjective signs

Science for Sustainability University of West Hungary International Scientific Conference for PhD Students March 19-20, 2013 – Győr
330
1.3. Effects of Trust
As in personal relationships a trust has many positive benefits. Covey (2008) thinks that a trust is increasing the speed and decreasing the costs of mutual interactions. He is quantifying a trust as multiplying variable and stating the following formula:
(S x R) x T = O (Eq. 2) An Outcome (O) is depending on a Strategy (S) multiplied by a Realization (R) and a Trust
(T). I share a concern that in the stated formula are missing resources (human, financial, time) which are essential for any human-being action or a project. Perhaps Covey incorporated them in the variable Realization. My second concern is about strong multiplying effect of a trust. Covey (2012) is mentioning a study confirming that in case of trust the players (in terminology of game theory) tend to take a tit-for-tat strategy and thus confirming a repriprocity of trust. That means when one player showing a trust the other player tends to do the same and correspondingly in the case of distrust. In spite of those facts supporting Covey’s equitation (Eq. 2) I recommend to think about an additive approach (Eq. 3) and continue in the future studies of this problematic. The way to quantify the mentioned variables is in classification tables which assign a certain value to a certain quality level of a factor.
S + R + T = O (Eq. 3) An Outcome (O), eventually realization is depending on a Strategy (S), Resources (R) and a
Trust (T).
2. PRACTICAL BENEFITS OF TRUST
2.1. Benefits on Macroeconomics Level
On macroeconomics level we can speak about a trust in governments and their politics, a trust in financial markets and financial instruments, a trust in legislation and enforcement of law and so on. Edelman Trust Barometer 2012 Press Release is stating: “In seventeen of 25 countries surveyed, government is now trusted by less than half to do what is right.” To increase the trust the respondendts are requiring more regulation of the business and market. It seems this is a move from very liberal doctrenes of the free market which are commonly misinterpreting Adam Smith’s “invisible hand of market” or Milton Friedman’s saying “Business of business is doing business only”. In both cases they were not meant as a dogma. Adam Smith (a moral philosoph) presumed that when the individuals will follow their altruistic good intentions then whole society will profit. Milton Friedman did not justify every action leading to the profit. It seems that the classic governmental instruments of fiscal and monetary politics are failing or do not have an expected functioning. This is again connected with the phenomena of trust. The political representation in order to increase their legitimity and trust needs to be acting as ethical leaders, which is unfortunately not the case of nowadays in many Eastern countries. For example Czech voters showed their (dis)trust in politics in very low attendance (36.89 %) in region government elections in 2012. This lack of trust does not have only an impact on politics but the consequences are visible also in economics. GDP in the Czech Republic was -1.3 % in the 3rd quarter of 2012. There is a comprehensive study showing the relationship between Trust and GDP per capita (Figure 2). The authors Zak and Knack (2001) believe there is positive influence of trust on investments and GDP growth.

Science for Sustainability University of West Hungary International Scientific Conference for PhD Students March 19-20, 2013 – Győr
331
Figure 2. The relationship between trust and GDP per capita (ZAK – KNACK 2001)
2.2. Benefits on Microeconomics Level
As it was mentioned before the trust is increasing the speed. This role of trust is essential for innovation process which is characterised by the following signs: continuity, complexity, timeliness and consistency (DYTRT – STRITESKA 2010). It is apparent that a trust can positively influence a timeliness of innovation process. And not only this factor but in fact a trust can initiate and can be a catalyser for the successful innovation process. An igniter for value innovation is an entropy which is a contrary for a system ordination. If there is a need to innovate a system, an entropy has to be found or even artificially created (VLCEK 2011). A trust is a source of positive synergy. Therefore if an entropy or contradiction exists and provided there is a trust in place then the result of creativity and innovation can be multiplied (1 + 1 = 3). On the other hand when distrust is present then the differencies are not creating a positive synergy and are leading to completely different result (1 + 1 = 1,5 or even less). In summary when a trust exists then the differencies (entropy) is representing a benefit, when there is not a trust then differencies are acting disruptive (COVEY 2012). Every year Edelman Company is surveing the effects of trust on economics and business and the results are published in Edelman Trust Barometer. Their study presented in 2009 is coming to the following outcome: “Over a 12-month period, 91% of 25-to-64-year-olds said they had bought a product or service from a company they trusted, while 77% had refused to buy a product or service from a distrusted company.“ Other effects of trust on consumer’s behaviour can be seen on the following Figure 3.
During our complex analysis of managerial ethics in 2010 we came to the clear statement that Czech managers are aware of positive contributions of ethical behaviour on business performance (Figure 4).
Then a question can arise why business ethics principles are not more commonly used in the Czech Republic or other former Eastern block countries. There are several factors behind which we also analyzed during managerial ethics survey (Figure 5). Their common denominator can be named as lack of trust. And it seems that the lack of trust is so high that the Czech managers also expressed quite high scepticism in improving business ethics environment in the Czech Republic within the following three years (Figure 6).

Science for Sustainability University of West Hungary International Scientific Conference for PhD Students March 19-20, 2013 – Győr
332
Figure 3. Consumer’s behaviour influenced by trust (EDELMAN 2009)
Figure 4. What effect do you think ethical behavior has on business performance?
Figure 5. Which obstacles for larger business ethics application you see?
Figure 6. How do you think the level of ethics in business would change in the Czech Republic during next three
years?

Science for Sustainability University of West Hungary International Scientific Conference for PhD Students March 19-20, 2013 – Győr
333
2.3. Benefits on Individuals Level
Trust and ethical behaviour have a positive influence on subjective well-being which can be differently named as happiness. From managerial praxis it is known that the happy (self realized and acknowledged) employees are the most productive employees. HELLIWELL and HAIFANG (2008) in their study are stating that 10 % increase of trust within organization has a same influence on employee satisfaction as a 6 % increase of the salary. Harvey (2011) is studying the relationship between subjective well-being and ethical behaviour. He is aware that there have been many philosophers in last 2 millennia stating that ethics has a positive influence on happiness. Neverthelless there are very few empirical studies proving that. HARVEY (2011) concludes: “the implication of this study suggests that a consideration of the ethical norms of societies can improve our understanding of what contributes to the subjective well-being of people. While income, personal characteristics, and social values play a role in affecting happiness, so does the personal ethics of people.“.
3. CONCLUSION
In the last decades we have seen fast development of many areas of human doing. Not so in the area of management as a science discipline. Still we recall to the classics of management as were Taylor, Webber, Münsterberg or Mayo more than 100 years ago. It is clear that the internal organization’s conditions (corveé cancelled) and outer environment (globalization) completely changed. Therefore also management as a discipline needs an innovation which I see in ethical approaches to management decision making process. Some of the recalled innovations were already set to life as for example Corporate Social Responsibility. The necessary aspect I see in promoting a trust of managers and employees in ethics and its positive contributions on business, subjective well-being and corporate environment. Managers should realize that the work force is their tool which they are (the same way as a craftsman) using to accomplish a deed. They should work on developing the skills (hard and soft ones) of the workers, their knowledge and use their experience for the benefit of all (best practices sharing). In order to deliver the results in the most effective way they should at the same time create and support effective working environment based on trust and ethical values. This is seen as a best prevention of the future economic crisis. References AUTHOR’S COLLECTIVE (2009): Manazerska etika – inspirace 21. Stoleti. Hradec Kralove. 183 p. DYTRT, Zdenek et al. (2011): Managerial ethics in questions and answers. Zilina. 175 p. DYTRT, Zdenek – STRITESKA, Michaela (2010): Effective Innovations: Responsibility in Management.
Zilina. 125 p. COVEY, Stephen – MERRILL, Rebecca (2008): Duvera: jedina vec, ktera dokaze zmenit vse. Praha. 347 p. COVEY, Stephen (2012): Chytra duvera. Praha. 284 p. EDELMAN (2009): 2009 Edelman Trust Barometer. Edelman, USA. Online:
http://edelmaneditions.com/wp-content/uploads/2010/11/edelman-trust-barometer-full-report-2009.pdf
FUKUYAMA, Francis (1995): Trust: the social virtues and the creation of prosperity. London. 475 p. HARVEY, S. JAMES (2011): Is the Just Man a Happy Man? An Empirical Study of the Relationship between
Ethics and Subjective Well-Being. In: KYKLOS, (vol. 64) 193–212. HELLIWELL, John – HUANG, Haifang (2008): Well-Being and Trust in the Workplace. In Working Paper
14589, National Bureau of Economic Research. MLCOCH, Lubomir (2006): Ekonomie duvery a spolecenskeho dobra. Praha. 195 p. ZAK, Paul – KNACK, Stephen (2001): Trust and growth. In: Economic Journal (vol. 111). 295-321. ZELENY, Milan (2011): Hledani vlastni cesty: listy a reporty o modernim managementu: executive summary,
Brno. 319 p.

Science for Sustainability University of West Hungary International Scientific Conference for PhD Students March 19-20, 2013 – Győr
334
Financial Possibilities for the SME Sector in Hungary
VAJAY Zsuzsanna*
University of West Hungary Faculty of Economics, Sopron, Hungary Abstract - SME sector plays a significant role in the economy of Hungary. 97-99% of the companies takes part of this sector and has importance in the field of employment and production. In my study I analyse the external financing opportunities such as credits and tenders, which are available especially for SME sector. I analyse these data between 2007 and 2011. The range of credit possibilities for SME sector is expanding. There are more opportunities allowing companies to take loans not only from banks but from credit intermediaries. KA-VOSZ Zrt and the Magyar Vállalkozásfinanszírozási Zrt provide the most reliable information about the possibilities to the members of the market. The European Union also provides refundable support to start-up and working companies besides tenders mostly from JEREMIE program.
Keywords: entrepreneurship / tender / loan
1. INTRODUCTION
The SME sector plays a significant role in the economy of Hungary. 97-99% of the companies takes part of this sector, and has importance in the field of employment and production.
The Hungarian economy has gone through significant changes since the regime change in 1989. In this period the roles of micro-, small and medium-sized enterprises in the market have become more and more important. However the main focus was only awarded right before the European Union accession when it was possible to strengthen the enterprise sector with pre-accession applications.
During this period important developments took place which helped to encourage entrepreneurship and contributed to create new companies.
After joining the European Union the number of enterprises showed a fluctuating trend however the growths of operating and already developed companies were constant.
The years at the very beginning of the 21th century have greatly helped people who work in agriculture to start up new family businesses in production and service sectors.
1.1. Distribution of SME sector
Table 1. The number of the companies between 2004 and 2011 (piece) Number of capita 2004 2005 2006 2007 2008 2009 2010 2011*
1-4 702 221 693 050 679 214 672 674 696 002 681 220 694 434 05-9 41 265 41 869 42 486 41 229 40 946 38 251 39226 01-9 743 486 734 919 721 700 713 903 736 948 719 471 733 660 676 26410-19 18 902 19 240 19 612 18 906 19 343 17 693 18 612 20 57820-49 11 050 11 201 10 620 10 143 10 231 9 256 8 770 10 60610-49 29 952 30 441 30 232 29 049 29 574 26 949 27 382 31 18450-249 5 130 5 067 5 085 5 145 5 222 4 811 4 696 4 682250 and more 959 927 926 929 962 875 877 859all 779 527 771 354 757 943 749 026 772 706 752 106 766 615 712 989Source: Own compilation based on Central Statistical Office data *Estimate based on KSH data
* Corresponding author: [email protected], H-2855 Bokod, Fő utca 60.

Science for Sustainability University of West Hungary International Scientific Conference for PhD Students March 19-20, 2013 – Győr
335
In the pre-crisis period entrepreneurship has increasingly boosted shows the unified 770.000
number of enterprises in Table 1. There were a downturn around 2006 and 2007, but in 2008 it is rising to the original number. Since 2009 a drastic downturn has occured caused by micro-sized companies suffered loss. Mainly the number of these enterprises declined while the number of small and medium-sized ones remained the same.
In 2010 according to latest data it seems that the trend of last year turned the other way around and medium and bigger sized enterprises break off, while smaller ones continue to increase. Compared to 2009 micro-sized companies increased about 2% and small-sized ones grew 1,6%.
In 2011 decline occurred again, further businesses had been closed since crisis had had infiltrated all markets. For this period only estimated data can be obtained from the KSH surveys, therefore drawing reliable conclusions is not possible.
2. THE FINANCING STRUCTURE OF SME SECTOR
The most important factor for successful enterprises is to prepare the right financing structure. Considering more aspects helps to find the best financing rate for each company.
One of the conditions of a successful company is a good idea which is based on everyday operation. These ideas are not worth much by themselves if there are no available financial sources which not only mean cash but also previously acquired goods, equipment and means of production.
To create the best structure it is important to make various financial decisions which can be: 1. investment decisions 2. dividend decisions 3. financing decisions
2.1. Financing options
The enterprises have more and more possibilities to use external financing opportunities for their everyday work. The state and the government have always conduced to the improvement of this sector. More and more credit and support opportunities have been created for SME’s. That is the reason why more companies have a chance to develop.
The policy of support and development of small and medium-sized companies have been in the front line of the argues for a long time. Several tries to reduce the competitive disadvantage of SME sector have been carried out, but big differences between these companies and the large enterprises have still remained. Despite the fact SME’s are able to produce high value-added products, many factors have a strong influence on their development of, which are:
- low capitalization - under-funding - low efficiency and productivity - lack of entrepreneurship - strong dependence of the internal consumption - exposure of the black economy. SME’s that use mainly internal financing sources down to their size, may be prevented to use
international funds (bank loans, leasing, factoring) as well as to access to resources of foreign investments. Due to their small sizes they can rarely be beneficiaries of government incentives which help greater investments and job-creations. Many of them have difficulties to fulfill administrative obligations.

Science for Sustainability University of West Hungary International Scientific Conference for PhD Students March 19-20, 2013 – Győr
336
2.1.1. Credits
The range of credit possibilities for SME sector is expanding. There are more opportunities allowing companies to take loans not only from banks but from credit intermediaries. KA-VOSZ Zrt and the Magyar Vállalkozásfinanszírozási Zrt provide the most reliable information about the possibilities to the members of the market. The first three – perhaps the most popular – possibilities are Széchenyi Kártya, Új Magyarország Hitelgarancia and Garantiqa Hitelgarancia that have more favourable conditions than bank credits. The European Union also provides refundable support to start-up and working companies besides tenders mostly from JEREMIE program.
Disbursements of low loan applications are taken over by county enterprise development foundations from banks, through which the National Microcredit Program is available for investment and working capital loans. The Program also offers loans for new companies with preferential rates without additional costs. The conditions of the Program are flexible to the needs of micro-, small- and medium-sized enterprises.
The Új Magyarország Kis- és Középvállalkozói Hitel is based on a similar principle which also helps these companies to grow and invest. „The aim of this loan program is to develop micro and small enterprises with seat in Hungary that cannot be, or cannot sufficiently be financed with commercial banking methods, by improving their credit options. The program takes part of a government package to relieve the effect of the financial crisis.
The sources reach the final beneficiaries through those credit institutions which are direct partners of the MV Zrt and the MFB Zrt. The credit institutions which joined to the program can outsource an investment loan of 10-100 million forints with a maturity of maximum 10 years to the enterprises.” (Magyar Vállalkozásfinanszírozási Zrt. 2012).
2.1.2. Support options
Since the European Union accession more and more enterprises have intended to take advantage of this financing resort in order to get new sources for their investments. In some cases these opportunities not only contribute to development but also provide new tools for keeping the enterprises running. Benefiting in tenders has yielded great results not only for developing companies but also for the whole country. While NFÜ publishes the best projects regularly in order to encourage companies for further development and implementations.
Certain amount of the investment costs are paid as non-refundable grants assuming the tender is successful so as to realize economic policy objectives and strengthen competitiveness, job creation and reduce environmental burdens. Applying for these grants European Union funds can be used within the Operational Programs.
Nowadays the tenders of “Új Széchenyi Terv” give opportunities to investments. The methods of subsidized interests have similar policy objectives as non-repayable loans and give new possibilities for SME’s to contract for credits with refinancing institutions in a market-conform way.
The Economic Development Operational Programs also provide several funding opportunities for supporting business innovations in SME sector, research and development activities, promotes to become permanent suppliers and also contributes to their technological innovations as well as implements new information-, quality- and environmental management systems. JEREMIE is a specific program for micro-, small- and medium sized enterprises to promote financial arrangements which give a better access to have financial resources. The aim of the program is helping to eliminate limited access to the credit, equity and guarantee resources.
The European Union’s main support instruments are the Structural and Cohesion Funds which allocate the resources for the national strategy for the period 2007-2013. Between 2007 and 2010 it was called “Új Magyarország Fejlesztési Terv” and until 2011 it was “Új Széchenyi Terv”. In

Science for Sustainability University of West Hungary International Scientific Conference for PhD Students March 19-20, 2013 – Győr
337
the examined period our country is eligible for almost 22.4 billion euros, nearly 6,000 billion forints. The available resources are distributed between 8 sectorial and 7 regional operational programs.
Access to financing resources for SMEs is primarily connected to the Economic Development Operational Program where approximately 700 billion forints is provided. These applications are organized around 4 priorities:
1. R&D and innovation for competitiveness 2. Complex development of businesses, especially SMEs 3. Strengthening modern business environment 4. Measure of financial instruments (JEREMIE program) Besides the tenders of the Economic Development Operational Program there are many
regional or other operational programs which have tenders targeted at businesses and one of the most popular is the site development application.
Since 2011 EU co-financed project tenders are available for start-up companies combined with a favourable credit access. It was the first time in 2011 that start-up companies were eligible for funding in the scheme of Micro-enterprise development. From 2012 the tender was transformed in order to be available for more enterprises that have greater economic importance but still keep micro-sized status.
Small and larger sized companies have far more opportunities than micro-sized since they do not have to pay attention to locational restrictions; furthermore they have a greater choice of tenders available. The opportunities for acquiring instruments, tools and equipment are mainly available that may also be used for real estate and infrastructural improvements. Companies with over 10 employees can implement an investment anywhere no matter of the location size. In contrast micro-enterprises are restricted to a limited area with a minimum population of 5,000 capita as defined in the settlement list. According to Magyar Közlöny of 12th April 2012 a draft was proposed to the European Commission to abolish the restriction of the settlements.
The aim of the above measures is to decentralize enterprises and support the operation of small municipalities’ strengthening their survival chances compared to cities.
These tenders were available with strict conditions however in the last few years efforts have been taken to facilitate tendering methods regarding administration as well as procedure.
New constructions have been prepared for businesses not only in the field of investments but also for funding operations. Supporting job creation in SMEs is one of these tenders that can be used anywhere regardless of region while wages and social security contributions of employees are funded.
3. SUMMARY
In recent times developing domestic SME sector has a great emphasis, therefore there are more and more credit opportunities available for them as well as support possibilities due to EU accession. A significant proportion of businesses take advantage of these possibilities and as a result their operational problems can be resolved. In the first 3-year period outsourcing of loans were 100% said György Vadász the president of the Magyar Iparszövetség in an interview given by OKISZ. However we can say that only 1/3 of the businesses used these sources.
The number of small-, medium and large companies tendering is increasing. However companies tend to require and obtain these supports who can afford to implement the investments from their budget anyway. These companies have more courage to start the application and investment processes the rather than small enterprises who are struggling and cannot afford purchasing and renovations essential and indispensable for their survival.
Science for Sustainability University of West Hungary International Scientific Conference for PhD Students March 19-20, 2013 – Győr
338
References 1110/2012. (IV. 12.) Korm. határozat, Magyar Közlöny, No. 43, 8169. CSUBÁK, T. K. (2003.): Kis- és középvállalkozások finanszírozása Magyarországon, Nemzeti Fejlesztési
Ügynökség KSH (2011): A kis- és középvállalkozások helyzete a régiókban, Központi Statisztikai Hivatal, 2011.
szeptember, Budapest Magyar Vállalkozásfinanszírozási Zrt, Online: http://www.mvzrt.hu Országos Mikrohitel Program, Online: http://www.omhp.hu/gyik.php VAJAY, Zs. (2012.): A KKV szektor nem-banki hitellehetőségei, Gödöllő VAJAY, Zs. (2012.): A vállalkozások finanszírozási lehetőségeinek átalakulása, különös tekintettel a pályázati
lehetőségek változására, Sopron
The Cluster Ordering as Possibility in the Hungarian SMEs Sector
BÁCSI Judit15
Szent István University, Gödöllő
Abstract - In the article, I would like to show the potential of the cluster in the Hungarian SMEs sector. This is an organizational model which has been successfully applied in many countries, but it is less prevalent in our country. In my opinion the cooperation and networking of enterprises will be inevitable in long term, which means that cluster is a topical and important issue to analyse. In this study, following a brief description of the cluster system, I am focusing on the opportunities which can be available in the frame of this form of networking, and how it can contribute to the development and enhancement of competitiveness in SME sector. In the secondary research the conclusions of previously completed studies, results of other questionnaires are analyzed and compared. The cluster policy of some EU member countries will also be described. Through the evaluation of the results I am looking for the answer whether the cluster ordering is really providing as excellent facilities as it is considered, and if yes how the extension of clusters in SME sector could be promoted. Keywords - SME sector/ cluster/cooperation
1. INTRODUCTION
The role of the small and medium sized enterprises is determinant in all of the economies in the world – thus in the Hungarian economy. There are significant differences regarding the support and the growth of each country’s SME sector. While in the EU countries, the recovery of the SME sector is typical, in Hungary the permanent success is still waited for, the Hungarian enterprises need to face problems such as high taxes, unpredictable regulations, financial problems, difficult grant system and so on. Although there are initiatives but to close up to the rivals and to maintain the market positions are difficult tasks. It is important for the enterprises - beyond the innovation and R&D - to see the potentials in each other and to enforce their power together. Organizing themselves into clusters could be a good alternative but most of the businesses are averse to this. Due to this system, success has been reached in several foreign countries, but in our country, the acceptance of clusters as tool of the economic policy and its integration to the supporting systems first appeared in the scope of Széchenyi plan.
15 [email protected]; H-8228 Lovas, Balatoni u. 3.

Science for Sustainability University of West Hungary International Scientific Conference for PhD Students March 19-20, 2013 – Győr
339
The theory of the clusters was introduced by Michael E. Porter. Porter has found (during the research of the comparative advantages of the countries) that in the era of globalization, the comparative advantage theory is unsuitable for explaining the development of the permanent competitive advantages. (Porter, 1990, p11) The long-lasting competitive advantages are usually linked to certain spheres of activity, only a small part of the global market. Porter has systematized the factors that generate competitive advantage in his well-known diamond model.
In Western Europe usually the enterprises initiate the conglomerating into clusters, however in our country, the big multinational companies took leap forward. The most important thing is that the companies with the cooperating activities can take advantages such as localization advantages, they can obtain long-term competitiveness and as a result of working together they can also increase their competitiveness. They can earn benefits such as reduction of transport costs, exchange of technological and production experiences, common R&D, faster adjustment to market and wider segment of the market and so on.
An universally accepted definition for the clusters does not exist but according to the cluster definition of DG Enterprise and Industry, cluster means the following:
“Clusters are groups of independent companies and associated institutions that are: Collaborating and competing; Geographically concentrated in one or several regions, even though the cluster may have
global extensions; Specialised in a particular field, linked by common technologies and skills; Either science-based or traditional; Clusters can be either institutionalised (they have a proper cluster manager) or non-
institutionalised. The cluster has a positive influence on: Innovation and competitiveness; Skill formation and information; Growth and long-term business dynamics”(EUROPEAN COMMISSION 2007, p. 9)
2. HUNGARIAN CLUSTER INITIATIVES
The importance and the improvement of the cluster-oriented development policies have been highlighted all over the world in the past few years. Each cluster involves the relationship between the enterprises, which depends on the actual economic activity, the degree of the advancement, the traditions of undertaking and the governmental relations. A valid receipt for the birth of clusters does not exist. The most important condition for the formation of the clusters is the critical mass, a segment’s sufficient number of enterprises in a region. In extreme cases, there can be one determinant company (it may be a multinational company as well), which gives the various segments of the production process to subcontractors and generates the later participants of the cluster itself. (Buzas, 2000) Beyond the critical mass, the number of successful enterprises, the increasing of demand, the healthy balance of competition and cooperation, the advanced supplier background, the flexible organization and management, the continuous improvement of knowledge or the attraction of the sector for the talented people are all essentials (Grosz, 2005 p.64). These conditions are usually missing in Hungary. In our country, the improvement of the clusters is promoted by several cluster-development programmes.
According to the research of Netwin (2007), the first cluster-initiatives started in the beginning of the 2000s when cluster has appeared among the aims of the Széchenyi Plan. In 2001-2002, the grants have triggered great interest but the initial enthusiasm quickly took off. The system of the grants did not favour the clusters in the following few years, there was a stagnation to 2005, when due to the new grant resources, new clusters have been formed (NETWIN 2007).

Science for Sustainability University of West Hungary International Scientific Conference for PhD Students March 19-20, 2013 – Győr
340
In the scope of the New Hungary Development Plan, the Pólus Program was announced. The aim of this programme is to form the domestic clusters and to promote their appearance in the international market. The clusters are supported in four phases. Regarding the start-up and the developing clusters, the programme supported the forming and the operation of the clusters. As a result of the cluster development grants, in 2008 and 2011 (as a part of the New Széchenyi Plan) 100-100 start-up and developing clusters were supported (webpage of the National Development Agency), 75% of the clusters were newly formed in both era. On the third phase, the so called accredited clusters could get 100 million HUF from the grants, firstly for common research and development, and for innovation activity. The aim of the accreditation is to select the most competitive domestic clusters and to give them exclusive grant constructions. (Pólus Klaszter Kézikönyv 2009). Compared to the previous phases, the last, the pole innovation clusters’ phase prescribed more serious selection conditions, which would have required a different cooperation for the members: much more resources and active cooperation (KOCSIS 2012). The first domestic cluster involving multinational companies was formed in the car industry in 2000 with the aim to improve the Hungarian car industrial suppliers to international level through links evolved in the clusters. Since then that cluster has been discontinued, but in the last few years a number of new clusters was formed, including for example IT, electronics clusters (KOCSIS 2012). Perhaps one of the largest clusters is Mobility and Multimedia Cluster which was founded in 2007 and works in the IT sector. Beyond the nearly 50 SMEs, 5-6 multinational enterprises are also involved in the cluster. The cluster excellently uses the supplier featured relationships which are built around the dominant ancillary subsidiary and they work together with universities, research institutes and non-profit organizations as well (KOCSIS 2012). The subsidiary also provides the outlet for the SMEs, perhaps this is the only cluster organization like this in Hungary. The fact that they got 2 billion HUF grant in the scope of the Pólus Program, helped them to successful operation (KOCSIS 2012).
2.1. European outlook
The European Union member-states approach the cluster policy differently. In some countries such as France, the Netherlands, Portugal, the cluster policy is handled at national level, but in countries such as Austria, Germany, Belgium, the regional level is responsible for the development and implementation of the cluster policy (NETWIN 2007). The support of cluster organizations has an important role in Germany. The actions include aims such as cooperation of product development or common appearance on new markets (NETWIN 2007). In Denmark, the cluster policy develops at state level. „The policy mainly supports the competency clusters with special services and infrastructures as well as flow of knowledge supporting organizations and channels. They worked out special measures for each clusters, in which the communication between the politics and enterprises and between the central and regional level has a very important role. The Danish cluster policy has many experiences to be paid heed to in terms of domestic cluster policy (NETWIN 2007 pp. 82)”.
There is not official cluster policy in Poland and Slovakia but the current SME development policies have a significant role in supporting clustering. The international samples excellently show that clusters have an important role in the economic life of a country. Revival of this policy should be promoted in Hungary as well and all the support has to be given to the enterprises for the sake of the success.
Science for Sustainability University of West Hungary International Scientific Conference for PhD Students March 19-20, 2013 – Győr
341
3. REALIZATION OF CLUSTERS IN HUNGARIAN SME SECTOR
The clustering of SME incubation is one of the basic criteria for the EU member states. However, it is a principle that establishing of clusters can not be forced. The first steps have to be taken by the enterprises. In a market economy, the recognition of business interests and establishing committees can be urged before the formation of clusters, which can promote the cooperation of businesses. After this, the strengthening of the clusters can be supported and accelerated from outside with the governmental institutions and development agencies (Lengyel, 2002).
Researches also show that in Hungary there is also a demand for the cooperation in the clusters forming in SME sector but these can not be realized without support and incentives. Several study and article justify the fact that the situation of the Hungarian SME sector is almost hopeless. The high tax and social security costs, the expansion of the multinational companies, the unpredictable control and politics all contribute the SME sector to give up the fight. Although there are initiatives in order to boost the activity but their situation is still difficult. Most companies still think that the most critical point is the financing and unpredictable regulations. Though one of the advantages of the cluster is to reduce the expenses of the companies and to increase the profit as a result of the cooperation, but capital is needed to start a cluster in the initial phase. The state plays an important role from the beginning because without the grants it is almost impossible to organize a cluster in an economy, which is deficient in funds. Porter strongly attacks all forms of governmental intervention into the economy in his cluster-based economic development conception. According to him, the government’s only economic development task is to promote the competitiveness of the enterprises of the clusters with forming their business environment properly (Porter 1990, 1998).
The research of Netwin (study with questionnaire) has confirmed the importance of grants, the study has shown that three quarters of the companies asked by the research, started the cluster from grants, ¼ from founder capital, whilst others were created without resources. Thus the clusters mostly organized if they have the opportunity from external resources, otherwise the companies have no capacity for that. It is also important which tools the state uses to promote clustering process. After analyzing a number of studies and articles, it can be clearly stated that the aims composed by the cluster-programmes are too wide and arbitrary. Such programmes should be established which have been cleared, justified and are promising for the businesses but they expect a determined product from the clusters as exchange for the grants.
The Netwin carried out a full research regarding the Hungarian clusters in 2007. Among others, the research has revealed that the cooperation of nowadays so called domestic clusters seems to be rather process-organization than structure development. This means that the organization that operates the cluster is considered as cluster, not the cooperation between the different participants. Based on the results of the survey, the Hungarian clusters can be characterized as the following (NETWIN 2007):
Usually we can speak about the grouping of equal companies and organizations With the establishing of the clusters, the operation of SME sector and the increase of its
competitiveness wanted to be promoted. They expect new markets and business relationships. They think in joint R&D but it is rare as well as the extraction of spin-off companies.
Hungarian clusters stand of companies in contest with each other or vertically related firms. The educational and research institutions are missing.
They adjust the form and content of the cooperation to the call for tenders. They hope capital in this way too.
They are characterized by continuous financial problems The lack of the clusters as a legal person is a prominent problem according to the
respondent because they feel that they do not have any legal enforcement.

Science for Sustainability University of West Hungary International Scientific Conference for PhD Students March 19-20, 2013 – Győr
342
The tendering system is difficult, the allocation period is slow, the administration and classification is too complicated.
They typically do not carry out international relationships, the command of a language and the international market relationships are missing, which hinders the success and growth of the cluster in long term.
Participation in the clusters and the close cooperation are both have strong impact on the profitability as well (Grosz, 2005). Lengyel states that the profitability of the companies operating as clusters has improved by 2,4% and the survival rate of the SMEs is much higher than in case of isolated companies (Lengyel, 2003a, p.107).
The cluster ordering can not only take place among the SMEs, as the multinational corporations can also join to the cluster. In many cases, they can boost the cluster as they have adequate capital, the newest R&D technological expertise, appropriate human and machine sources, international markets, excellent organizational structure etc.
The major result of the grouping can be if the large company can also provide the buying market for the participant companies of the cluster. Kocsis (2012) carried out a research concerning what kind of role the affiliated company of the multinational large company could play in such a cluster. He published the following results:
Multinational companies compared to SMEs are lack of capital, technical and financial background, production capacity and in many cases human resources. This segment is more flexible than multi, can quickly respond to the change of the market so they can reciprocally help each other ordered in a cluster.
Multinational companies are mostly looking for new market opportunities in the domestic SME sector, and focusing on acquiring the ideas and knowledge of the SMEs. Those clusters are rare, where the large company provides the outlets for the SMEs (e.g. Mobility and Multimedia Cluster) however it could offer great opportunities as there are a lot of multinational companies on the Hungarian market.
An advantage could be for the small companies if they are informed about the global trends and direction lines of the particular industry through the multinational companies. In this way, they could become more prepared and they can work on developments which will be demanded on the market in the future.
Business and management knowledge is missing in the small companies, the multinational companies are excellent in these so it is important in the future for the SMEs to provide to acquire that knowledge to be more prepared for a successful future.
The cluster gives possibility not only for the SMEs but also for the large companies. What is more, as a result of the spread of the multinational companies, it can also promote the joining of the multinational companies to the group. This is the sector, which besides the public market’s capacity further increases market opportunities, not only domestically but also abroad several times. If the multinational companies provided the full buyer’s market for the SME sector, the Hungarian enterprises could boom significantly.
4. CONCLUSIONS
The latest economic crisis has demonstrated well that the companies alone are very weak but with organizing themselves into clusters, they can represent considerable strength. The cluster process also intends to promote this and the state has an important role to help it. Such policy is needed that treats clustering as criterion or it may be built in the SME policy. The cluster provides an excellent opportunity for businesses because with the help of this, the SME sector can strengthen. Its power can be that it can obtain the companies which enter, a wide service pallet, prominent
Science for Sustainability University of West Hungary International Scientific Conference for PhD Students March 19-20, 2013 – Győr
343
international connections, higher grant amounts, increasing productivity by the cooperation. However, there are also dangers. Such risks can be the followings (NETWIN, 2007):
unstable enterprises which only joined to the group to increase their lack of capital the Far Eastern products that push out the companies from the domestic market in
consequence of their cheapness the lack of long-term strategies and unstable grant system more groupings are formed only to collect the grants, these groupings hinder the clusters
that have serious aims limited opportunities for growth The cluster system in Hungary is in its beginning and beside some advantages, it has a danger
in store as well. Grants often poorly convey the importance of the cluster and the substance of the initial is dwarfed. Therefore it happens that the clusters change their activities due to the call for tenders. To avoid this, a change of view is needed. Such problems should be set up which are linked with other policies egg. the cluster supporting policies has to be harmonized with the cluster programmes and to manage them as a common aim. Monitoring system should be established to follow up the subsidies. The title on which enterprises take the grants should be followed and certain conditions should impose for them that encourage them to pull off the cluster system for long time. In the future, more emphasis should be placed on understanding the potential of the clusters and the scope of supports should be expanded.
Forming of such companies should be promoted that have appropriate expertise and are aware of the characteristics of domestic and the international markets. The trends on markets have to be realized in time and the target audience should be set due to these. Continuous training is necessary and also in terms of export, the knowledge of foreign language can not be ignored. There is a great potential in the cooperation with the multinational companies in case if it provides the buying up market for the cluster. With the help of the multinational companies, our foreign markets could also be strengthened. During the market expansion an important emphasis should be on quality and reliability. The success of a cluster lies not only in the grouping, but in the value added by all companies during creation of the product / service. However it should be remembered that in the boost of the companies and Hungarian economy, the customer plays an important role. All customers should be encouraged to buy Hungarian products if it is possible, which significantly contributes to domestic economic growth. Good Hungarian products, in good quality and in good price! References BUZÁS N. (2000): Klaszterek a régiók versengésében, JATEPress, Szeged, 58-66. EUROPEAN CLUSTER OBSERVATORY: http://www.clusterobservatory.eu/index.html (Letöltve: 2012.
november 4.) EUROPEAN COMMISSION (2007): Final Report of the Expert Group on Enterprise Clusters and Networks
9 p. http://www.dps.tesoro.it/cd_cooperazione_bilaterale/docs/6.Toolbox/13.Supporting_documents/1.Cluster_
methodologies_casoni/2.Additional_doc_2/3.EU_final_rep._ExpGroup_Clusters.pdf (letöltve: 2012. december 5.)
GROSZ A. (2005): Klaszteresedés és klaszterorientált politika Magyarországon- potenciális autóipari klaszter az észak- dunántúli térségben, Doktori értekezés, Győr-Pécs, 34-36.
KOCSIS A. (2012): A multinacionális vállalatok szerepe a hazai klaszterekben. Vezetéstudomány, 42. kötet, 2011. 2. sz. Különszám, 2012. február, 24-35.
LENGYEL I. (2003): Kis- és középvállalkozások együttműködése, JatePress, Szeged http://www.eco.u-szeged.hu/kutatas-tudomany/kis-kozepvallalkozasok/kis-kozepvallalkozasok-090813 (Letöltve: 2012. október 25.)
LENGYEL I. – RECHNITZER J. (2002a): A klaszterek alapvető jellemzői. A hazai építőipar versenyképességének javítása: klaszterek szerepe a gazdaságfejlesztésben, Régió Art, Győr, 99-124.
Science for Sustainability University of West Hungary International Scientific Conference for PhD Students March 19-20, 2013 – Győr
344
LENGYEL I. – RECHNITZER J. (2002): A hazai építőipar versenyképességének javítása: klaszterek szerepe a gazdaságfejlesztésben, Régió Art, Győr, 168-190.
LENGYEL I. (2002): A klaszterek fejlesztésének általános tapasztalatai, Régió Art, Győr, 170 p. NEMZETI FEJLESZTÉSI ÜGYNÖKSÉG honlapja: www.nfu.hu, (Letöltve: 2011. október 5.) NETWIN KFT. (2007): Klaszterek Magyarországon – fejlődési kilátásaik, szerepük a kkv-k fejlődésében, növelésében. NKTH, Budapest https://docs.google.com/viewer?a=v&q=cache:Htn-
0Ntb47oJ:www.pgk.hu/cgi-bin/itworx/itworx.cgi%3Fmodul%3Ddoctar/downloadfile%26task%3 Ddownloadfile%26vid%3D8%26dokid%3D303+&hl=hu&gl=hu&pid=bl&srcid=ADGEESiedeC6DciQ0pT7UFct55HKcy-UFdmoOzJ_EmdWMhHxlDHQsA1ov3J0OkuhTOLIiJRL4LS1HeSn_59rryrSyIHPlaxTzq N3BVpXombU0vPPybRpT6GPMsaZvxsKkUds0AT50IUW&sig=AHIEtbSdY4UtMRAM-E7PuJdUOgJsIqdQaQ (Letöltve: 2012. október 25.)
PÓLUS KLASZTER KÉZIKÖNYV (2009), BUDAPEST http://www.innova.eszakalfold.hu/upload/Polus_ klaszter_kezikonyv_2009_kiadvany.pdf (Letöltve: 2011. március 25.)
PORTER M. E. (1990): The Competitive Advantage of Nations. The Free Press, New York. PORTER M.E. (1998): On Competition, The Free Press, New York http://www.piacesprofit.hu/kkv_cegblog/sok_kicsi_tobbre_megy/
Principles of Slovak Public Administration in the Field of Small Trade Business
MALATINEC, Tomáš*
Department of law, Slovak university of agriculture, Nitra, 94976, Slovakia, [email protected] Abstract – Quality legislation, effective law enforcement capability, distribution of competence and responsibility, professionalism are considered for principles of a good administration. The aim of this paper is to rate their fulfilment in the performance of small trade business administration. We used questionnaire method and annual data analysis. The amendment of small trade business legislation has increased the efficiency of administration procedure as for the issuing of a business licence – it is currently 3 working days. The amendment also changed the stipulations in the part of small trade business control, where hitherto strictly worded provisions about the obligation for impose of penalty was replaced by provisions based on administration consideration and obligation for imposition of a penalty. Only 3,85% entrepreneurs underwent under inspections from total number (2011). 88,1% employees of small trade business offices (from 244) reported university education and 11,1% reported high school education. Entrepreneurs (4365) evaluated the quality of services of small trade business offices rather than high (41,53%) and the standards of professional competence of employees as high (55,90%).
Keywords – public administration / small trade business / principles of a good administration
1. INTRODUCTION
The purpose of the public administration is governance of the state in public interest (KLIMOVSKÝ 2008). Performance of the public administration is realized in a wide portfolio of relationships, including state administration, self-government and public corporations (other public administration). The legal principles and requirements for good governance constitute the legal ideas, on which is based. Administrative law governs the social relations in the field of public administration (MACHAJOVÁ 2007). Efficient and effective legislation regulating social relations in the field of public administration, that are based on stable pillars, has an important status from
Science for Sustainability University of West Hungary International Scientific Conference for PhD Students March 19-20, 2013 – Győr
345
the position of normative management of public authorities activities, acting by law (state administration) respectively within its limits (self-government). Since ,,the law is not perfect, but it relies on the nicety of consideration of a honorary man" (ULPIANUS), the fulfillment of the basic requirements and principles of good public administration, should lead to responsible fulfilling the purpose of the administration in different sections of public administration. This process should be in harmony with the law and respecting the rights and obligations of the concerned subjects (ADAMASCHEK 2000). In this paper, we focus on the performance of administration in the field of small trade business in the Slovak Republic, order to highlight the level of achievement and fulfillment of the fundamental principles and requirements given on modern public administration. The results contained in this paper allow to accept an opinion on the fulfillment of these requirements and principles and to set possible partial recommendations to ensure of public administration efficiency in the field of small trade business in the Slovak Republic in the future.
2. METHODS
The results presented in this paper were obtained by assessment of selected data on the performance of small trade business offices SR and evaluating of qualitative research among stakeholders in the small trade business administration in the Slovak Republic, which were entrepreneurs (4523), and small trade business offices employees (244). The survey was realized by Department of law of Faculty of European studies and regional development SUA in the year 2011, within the project VEGA 1/0514/11 – Efficiency of public administrative procedure of public authorities in the field of small trade business. Quantitative research was supported by the data acquisition based on the Act no. 211/2000 Coll. on the freedom of information, as amended. Qualitative research was based on evaluation of questionnaires and by the Likert scale intensities of responses, where 5 represents a high intensity, level 4 rather high, 3 medium, 2 low and 1 very low rating. In accordance with the thematic focus of this paper, we select only the relevant results of the whole extensive research. The results of these assessments were analyzed in relation to the fundamental requirements given on modern public administration.
3. RESULTS
The basic requirements of modern public administration include a quality legislation through which social relations in the field of public administration are regulated. Furthermore, it is the effective enforcement capability of the legal system, division of powers and responsibilities, as well as professional staff (MARIŠOVÁ, 2011). The normative framework of public administration is executed through administrative proceedings in which the rights and obligations of entities are applied and the procedure is completed by an administrative decision. This process is supported by principles of the Constitution of the Slovak Republic and also by the fundamental legal norm for administrative procedure - the Act no. 71/1967 Coll. on administrative procedure, as amended. The ensuring access to justice (two-instance procedure), legality, economy of procedure, written character, access to information, belong to the leading principles (ŠKULTÉTY 2008, ŠEVČÍK 2009).

Science for Sustainability University of West Hungary International Scientific Conference for PhD Students March 19-20, 2013 – Győr
346
Current legislative changes and requirement of quality legislation in accordance with the principle of legality of administrative proceedings and thus causal application of material administrative law, is an important point in the quality of administration in the field of small trade business.
The qualitative survey between small trade business employees - register offices of single contact points (SCP) shows that assessment of legislative changes is evaluated as rather than high (41.25% of respondents), evaluation by regions is indicated by Figure 1. Within relation of administration in the field of small trade business and its qualitative legislation, we choose the current issue of re-classification of issuance of the business license. It was turned from the category of administrative process completed by administrative decision, to the category of other act performed by small trade business office. It generates a question, what legal regime is applied to the process of trade licenses issuing. One of the leading principle of administrative decision making procedure is,
that authorities decide about the rights and obligations of entities in harmony with law. Is the principle of access to justice and legality followed this way? The Act no. 71/1967 Coll. on Administrative Procedure regulates administrative procedures, if other, in this case, The Small trade Act do not provides otherwise. However, if the issue of small trade business licenses is not classified as administrative process finished by decision, but as other administrative act, whereupon small trade business does make decision about the rights and duties of subjects? The Constitutional Court of the SR clearly stated that decision about the rights or obligations of the subjects must be regulated by a rule of law. Thus the requirement of uniformity and certainty of administrative procedure is ensured.
The Act no. 455/1991 Coll. on small trade business, as amended (Small trade business act) is the main legal act in the field of small trade business. This Act governs the small trade business registration and small trade business control. The Small trade business act has been amended several times. The last amendment (The Act no. 392/2011 Coll.) introduced changes that had influence on the period for issuing of small trade business license that has been shortened from 5 working days to 3 working days. This change contributes to improving the efficiency of administration in the field of small trade business and to quicker access to the small trade business license after fulfilling the conditions stipulated by law. The amendment also contributed to the higher efficiency of the whole administrative process. The amendment also introduced a change in imposing of fines for breach of duties of entrepreneurs. Thus the possibility of punishment of entrepreneurs that have been found breaching the Small trade act, instead of obligatory fine was introduced. Small trade business office was liable for imposition of fine before (in case of the breach of law). It generates a further question, how does this change improve the ability to enforce the obligations in the field of small trade business. The Figure 2 shows the percentage of inspected business subjects in the year 2011, in relation to the status when all entrepreneurs are checked in SR (so called perfect condition). Except for changes in imposition of fines and administrative consideration in administrative procedure, also the small number of controlled entrepreneurs contributed to disadvantage of enforcement capability of small trade business legal system. Only

Science for Sustainability University of West Hungary International Scientific Conference for PhD Students March 19-20, 2013 – Győr
347
3,85 % entrepreneurs from the total number of entrepreneurs in the SR in the year 2011 underwent inspection. Approximately 4950 entrepreneurs fell on one inspector. Each inspection requires 5-6 hours in average, together with procedural steps. On the base of assessment of these data, we can see that effective law enforcement capability in this field is very low. Increasing the proportion of controlled entrepreneurs and setting clear provisions of the Small trade business act with exclusion of discretion belong to the recommendations to improve the efficiency and quality of public administration in the field of small trade business. The challenge for the future is to improve the efficiency and performance of business controls and repressive functions of fines in
this area. Important issue by
performance of public administration is also professionalism of its personnel, which perform the administration. The small trade business segment is no exception. The survey among employees of small trade business offices and their Single contact points (next SCPs), that provide
guidance for clients, was aimed at their qualification. From the research sample of 244 employees, 88.1% obtained a university degree of
qualification and 11.1% secondary education. Evaluation of the professional competence of employees showed a professional standard of competence of SCPs employees (Figure 3 and part 1) - high (55.90% of respondents) and the quality of services provided by this employees (figure 3 and
part 2) also as high (41.53%). Evaluation within regions is shown in Figure 3. The result of assessment of the professional standards, and the quality of services provided by SCPs predict the fulfillment of requirements of professionalism in the performance of modern public administration at a high level. This fact reflects also the assessment of cooperation with small
trade business offices staff by providing the necessary data. The staff strictly respected the Act on freedom of information (the Act no. 211/2000 Coll.)
Last but not least, it is necessary to pay attention to the division of powers and responsibilities in the administration process in the field of small trade business. Small trade business offices in the Slovak Republic perform their powers within district offices (50). As noted
Science for Sustainability University of West Hungary International Scientific Conference for PhD Students March 19-20, 2013 – Győr
348
above, the small trade business authorities carry out their duties within the registration of business advices (SCPs) and controls. Division of powers and the restructuring of state administration in this area can be evaluated positively, because the Slovak Republic implements new public administration reform. Based on the Act no. 345/2012 Coll., in force since 01.01.2013, regional offices of specialized state administration were cancelled and their powers were transferred to district specialized offices. Changes have to bring financial and material savings and will contribute to the economy of the state administration (50 mil. EUR in 2013 and 300 mil. EUR in 2014) (HAMALOVÁ et al. 2012). However, the second-stage procedure is supposed to be managed by the appropriate district office in the seat of the county, it means the same district office with powers of the first-stage procedure. The Act no. 345/2012 Coll. raises the question of decision-making in the case and appeal .The district offices at the county (8), which is to say, under one roof "will decide in the first and second stage. New separate departments will be established within the district office, with competence for 2nd instance procedure. This structure does not load with the decisions in the 2nd stage the central state authorities, but will be the justice in these cases guaranteed?
4. CONCLUSION
The reason for attention to performance of public administration is the ability of modern, efficient and good governance since it influences the level of development of society and quality of life. Modern public administration should be built on the stable pillars of quality legislation, a clear division of responsibilities and competences, professionalism and effective law enforcing capacity. These requirements, which respect the basic principles of the administration procedure, have recommendatory character, but simultaneously are the ideas of the quality of public administration. The aim of this paper is to demonstrate the performance of the state administration in the field of small trade business in the Slovak Republic in the year 2011, in relation to these requirements and principles. We achieved results on the base of the qualitative and quantitative evaluation of small trade business performances, which clearly demonstrate the influence of legislation on the efficiency and quality of output of small trade business administration. On the base of the amendment to the Small trade business act of SR , the period for issuing small trade business licenses was shorten to 3 working days, it significantly contributes to the efficient performance of the small trade business administration in the Slovak Republic. On the other hand, reclassification of issuing of small trade business license from the category topped by administrative decision to the category of other administrative actions, raises controversy about this fact and its legal implications. The change of the Slovak small trade business legislation, which regulates the performance of small trade business control, is in our opinion, a negative change. Assessment of number checked entrepreneurs in Slovakia in the year 2011, allows accept critical opinion to the fulfillment of the requirement relating to law enforcement capacity in the field of small trade business. The proportion of controlled subjects is only 3.85% in the SR in the year 2011. Professionalism of staff was rated at a high level and thus in favor of the requirement of modern public administration. Also, the requirement of powers division and responsibilities in the administration of small trade business is fulfilled. Small trade business offices are pattern for new reform of state administration bodies in the Slovak Republic .The question of decision-making process in the first and second stage and the access to justice at the district offices at the county degree is controversial, since they have competences within the first and also the second stage.
We recommend to increase the quality and effectiveness of enforcement duties, compliance, control, review of punitive fines functions in the field of small trade business under the effective legislation, and by considering of arising contentious issues, we recommend also to continue in the

Science for Sustainability University of West Hungary International Scientific Conference for PhD Students March 19-20, 2013 – Győr
349
coherent reform trends in public administration in order to increase its efficiency and focus on its basic requirements and principles. Acknowledgements: This paper was processed within project of Department of Law – Faculty of European studies and regional development SUA in Nitra, under the grants VEGA 1/0514/11 and Ministry of Interior of Slovak Republic. References ADAMASCHEK, B. (2000): Efektivita vo verejnej správe, 2000, VBS, Bratislava, 2000, 103 p., ISBN 80-
968308-3-X HAMALOVÁ, M. et al. (2012): Výzvy pre ďalšiu etapu reformy verejnej správy v Slovenskej republike, 2012,
VŠEMVS, Bratislava, 2012, 515 p., ISBN 987-80-89600-07-6 KLIMOVSKÝ, D. (2008): Základy verejnej správy, 2008, KOŠICE, 2008, 269 p. ISBN 978-80-7097-713-2 MACHAJOVÁ, J. a kol. (2007): Všeobecné správne právo, 2007, PP s.r.o. Bratislava, 2007, 500 p., ISBN 978-
80-88931-71-3 MARIŠOVÁ, E. (2011): Správne právo hmotné a procesné, 2011, SPU, Nitra, 2011, 141 p., ISBN 978-80-552-
0541-0 ŠEVČÍK, M. (2009): Správne právo procesné, 2009, Eurounion, Bratislava, 2009, 415 p. ISBN 978-80-89374-
05-2 ŠKULTÉTY, P. (2008): Verejná správa a správne právo, 2008, VEDA, Bratislava, 2008, 204 p., ISBN 978-80-
224-1023-6 Legislation: The Act no. 345/2012 Coll. on changes in local state administration The Act no. 455/1991 Coll. on small trade business The Act no.. 71/1967 Coll. on administrative procedure
Challenges of the Ageing Society
MAROSNÉ KUNA Zsuzsanna16
PhD student, Szent István University, Faculty of Economics and Social Sciences, Doctoral School of Management and Business Administration, Gödöllő, Hungary-2100
Abstract – The objective of this paper is to prove that in ageing society17 education, health care and prevention have a significant role.
The determination and correlation coefficients and the trend equations show the connection between the employment of senior workers, their increasing number in society and their life-long learning data, furthermore the employment and health problem. All the examinations prove that older workers have special health care and education needs. If society does not invest into these important factors, the ageing, sick, unemployed citizens will cause a serious social and financial problem in the near future.
Key words: Ageing / prevention / health / education
16 Corresponding author: [email protected], Templom utca 1/C Veresegyhaz, Hungary-2112 17 Hablicsek, L.: Demográfiai forgatókönyvek 2000-2050, Hipotézisek, eredmények, IX. Kerületi Önkormányzat részére, Budapest, 2000., page 8

Science for Sustainability University of West Hungary International Scientific Conference for PhD Students March 19-20, 2013 – Győr
350
1. INTRODUCTION
The ageing of the population is a worldwide tendency. The projection for 2060 shows that the ratio of persons aged 65 and over will become much higher (30%) in EU 2718. It means that the countries affected by this kind of projection have to be prepared for the forthcoming challenge; otherwise they will be facing dramatic social and financial issues in the near future. The challenge is reflected in the employment rate of older workers, because unless they are involved in the labour market, the economy of the EU will loose a considerable value and have increasing social expenses year by year at the same time: early age pension and health care. In 1967, Thomas Holmes and Richard Rahe prepared a research involving 5,000 patients, in which they tried to prove that stressful events may cause illnesses. 43 life events were examined and the result showed that retirement is the 10th most stressful factor for any sickness.19 This means that early pensions result in more expenditure above the transfer. According to the qualitative20 research prepared in 2008 and 2009 by series of deep interviews with the organization which took part in the employment projects targeting the age group between 45 and 64, it turned out that the health status and the knowledge available are the most important factors in case of a possible employment.
I wanted to prove this statement by statistical methods as well, to draw attention to a proactive attitude in order to avoid dramatic consequences of the ageing society.
2. THE BACKGROUND AS THE HOTBED OF CHALLENGE
First of all I examined the age group (their ratio in the society) between 45 and 64, then their life-long learning data and finally their health status in Visegrád 4 (V 4) countries and Denmark. I have chosen these countries as the historical background of V 4 countries are very similar. I compared them to the relevant data of Denmark, my reference country, since its overall employment rate is high, not only among older people but among the whole of society. Comparing the mentioned countries this way, I had the opportunity to show the effect of a different attitude, way of life and the outcome of the essential services, such as education.
2.1. Demographic changes of older workers21
In the Czech Republic the ratio of population aged 45-64 increased by 3%, in Denmark by 6%, in Poland and Slovakia by 13% between 2003 and 2011, while in Hungary it decreased by 3%.
2.2. Life-long learning data of older workers22
Participation in education and trainings increased by 4.8% in the Czech Republic, by 8% in Denmark and by 0.5% in Poland among the population aged 45-64, during the period of 2003-2011. At the same time, in Hungary it decreased by 0.7% and in Slovakia by 0.3%.
18 EUROSTAT http://ec.europa.eu/economy_finance/publications/european_economy/2011/pdf/ee-2011-4_en.pdf 19 Holmes TH – Rahe RH (1967). "The Social Readjustment Rating Scale". 20 Marosne Kuna, Zs. (2009): The role of non-profit organizations in the fight against discrimination on the basis of age in the field of employment, results and possibilities 21 http://epp.eurostat.ec.europa.eu/portal/page/portal/population/data/database 22 http://epp.eurostat.ec.europa.eu/portal/page/portal/education/data/database

Science for Sustainability University of West Hungary International Scientific Conference for PhD Students March 19-20, 2013 – Győr
351
2.3. Health statistics of older workers23
The ratio of people between 45-64, who had longstanding sickness (during the period of 2005-2010) decreased by 2.3% in the Czech Republic, by 0.4% in Denmark, by 8.5% in Hungary, by 1.2% in Poland, while it increased by 2.8% in Slovakia.
2.4. Employment data of older workers24
The employment of the age group in question increased (during the period of 2003-2011) in Denmark (by 1%), Poland (by 3%) and Slovakia (by3 %), while it did not change in Hungary and Czech Republic.
Due to the tendency in the EU, the ratio of older workers should increase, but in Hungary this number decreased. In countries where the population in question increased, the employment rate should increase as well, but in the Czech Republic there is no change. In Hungary, besides the decreasing ratio of this generation the employment rate did not change. The employment rate is supported by good health and continuous education. The reported long-term illnesses decreased in Hungary. The participation rate in trainings and education decreased in Hungary and in Slovakia.
Most contradictions occur in Hungary: decreasing ratio of older people, decreasing training participation rate, decreasing reported long sicknesses and unchanged employment. This means that people do not visit the doctor in time because they are afraid of losing their job. They may even work in the black economy with serious symptoms. When receiving health care, the long-term illnesses with serious consequences have already developed. (The death rate for 100,000 people caused by malignant tumor is the highest in Hungary in the EU25). This is the reason why the ratio of the age group 45-64 is decreasing.
In Denmark the ratio of older people is increasing, training participation rate increases and employment rate is increasing as well, while the reported sicknesses decrease. It means that health care and education are effective.
In the Czech Republic the ratio of older people and training participation rate is increasing, employment rate remained unchanged while the number of reported sicknesses decreased. Health care and education should be examined because the employment rate should be higher if these factors are effective enough.
In Slovakia the ratio of older people is increasing, the training participation rate is decreasing, the employment rate is increasing, while reported sicknesses increase. Because of the increasing number of sicknesses and the increasing employment rate, the working conditions need to be examined.
In Poland the ratio of older people, training participation rate and employment rate are increasing, while the number of reported sicknesses is decreasing. It seems that Poland is on the right way, its health care and education system can be regarded as a good example, just as in the case of Denmark.
In the next part, I carried on the analysis with the determination and correlation coefficients and the trend equations which show the connection between the employment of senior workers and their increasing number in society. I also analyzed the employment and the life-long learning data, furthermore the employment and health problem.
23 http://epp.eurostat.ec.europa.eu/portal/page/portal/health/public_health/data_public_health/database 24 http://epp.eurostat.ec.europa.eu/portal/page/portal/employment_unemployment_lfs/data/database 25 http://epp.eurostat.ec.europa.eu/portal/page/portal/health/public_health/data_public_health/database
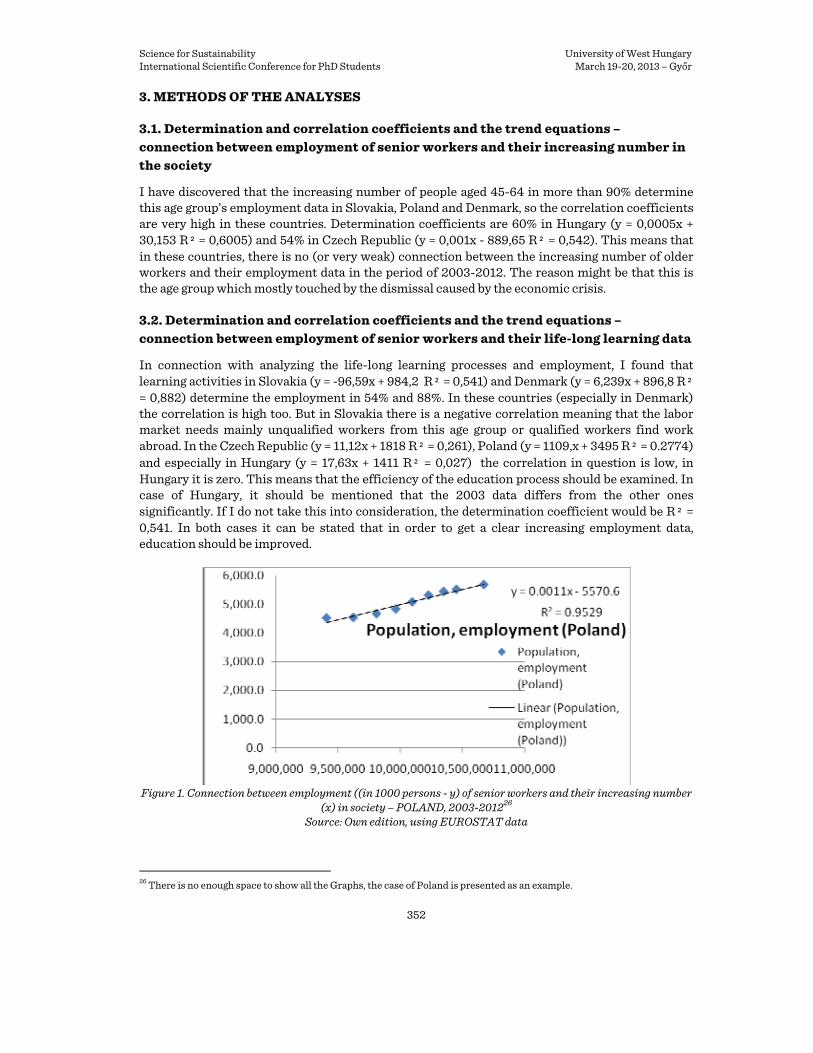
Science for Sustainability University of West Hungary International Scientific Conference for PhD Students March 19-20, 2013 – Győr
352
3. METHODS OF THE ANALYSES
3.1. Determination and correlation coefficients and the trend equations – connection between employment of senior workers and their increasing number in the society
I have discovered that the increasing number of people aged 45-64 in more than 90% determine this age group’s employment data in Slovakia, Poland and Denmark, so the correlation coefficients are very high in these countries. Determination coefficients are 60% in Hungary (y = 0,0005x + 30,153 R² = 0,6005) and 54% in Czech Republic (y = 0,001x - 889,65 R² = 0,542). This means that in these countries, there is no (or very weak) connection between the increasing number of older workers and their employment data in the period of 2003-2012. The reason might be that this is the age group which mostly touched by the dismissal caused by the economic crisis.
3.2. Determination and correlation coefficients and the trend equations – connection between employment of senior workers and their life-long learning data
In connection with analyzing the life-long learning processes and employment, I found that learning activities in Slovakia (y = -96,59x + 984,2 R² = 0,541) and Denmark (y = 6,239x + 896,8 R² = 0,882) determine the employment in 54% and 88%. In these countries (especially in Denmark) the correlation is high too. But in Slovakia there is a negative correlation meaning that the labor market needs mainly unqualified workers from this age group or qualified workers find work abroad. In the Czech Republic (y = 11,12x + 1818 R² = 0,261), Poland (y = 1109,x + 3495 R² = 0.2774) and especially in Hungary (y = 17,63x + 1411 R² = 0,027) the correlation in question is low, in Hungary it is zero. This means that the efficiency of the education process should be examined. In case of Hungary, it should be mentioned that the 2003 data differs from the other ones significantly. If I do not take this into consideration, the determination coefficient would be R² = 0,541. In both cases it can be stated that in order to get a clear increasing employment data, education should be improved.
Figure 1. Connection between employment ((in 1000 persons - y) of senior workers and their increasing number
(x) in society – POLAND, 2003-201226 Source: Own edition, using EUROSTAT data
26 There is no enough space to show all the Graphs, the case of Poland is presented as an example.

Science for Sustainability University of West Hungary International Scientific Conference for PhD Students March 19-20, 2013 – Győr
353
It is the basis of long term thinking that the state - as one of its most important responsibilities - has to provide opportunities to receive a qualification and also to validate and apply this knowledge in practice, in real life.
Figure 2. Connection between employment (in 1000 persons - y) of senior workers and their life-long learning
data (in % - x) – POLAND, 2003-201127 Source: Own edition, using EUROSTAT data
3.3. Determination and correlation coefficients and the trend equations – connection between employment of senior workers and their health data
The third important factor of employment is the health status (the connection between reported long sicknesses and employment). In Poland (y = -219.97x + 11914 R² = 0.3977), Czech Republic (y = -7.6906x + 2057.7 R² = 0.3078) and Denmark (y = -1.9584x + 1095.8 R² = 0.0785) the correlation coefficients are considerable, the correlations are between 30% and 60%. In the mentioned countries there is a negative correlation. In Hungary it is positive and weak 16% (y = 1.1713x + 1390.8 R² = 0.0267), it is also positive in Slovakia, 58% (y = 16.593x + 364.18 R² = 0, 0.3452), meaning that senior people work even if they are sick (risking further decline in their health).
4. RESULTS
The analyses show that there is a close connection between employment and the increasing number of older workers, their health situation and education.
More than 20 years after the regime change, in V 4 countries, the older workers who received their initial education in a different political and economic environment have to find their position in society. Governments have to deal with this issue proactively otherwise the related social cost will increase dramatically.
Besides, educated people are capable of creating a higher value, are healthier and produce income for the state instead of costs.
27 There is no enough space to show all the Graphs, the case of Poland is presented as an example.

Science for Sustainability University of West Hungary International Scientific Conference for PhD Students March 19-20, 2013 – Győr
354
From the employer’s point of view, long term thinking is always a better strategy. It results in more profit and success, if decent working conditions are provided for the workers, they will be grateful, more loyal to the company, their attitude will be more positive - manifesting in a higher quality.
Figure 3. Connection between employment ((in 1000 persons - y) of senior workers and their health data ((in % -
x) – Poland, 2005-201028 Own edition, using EUROSTAT data
5. CONCLUSION
The education of senior people should be more effective and practice-oriented. Besides professional knowledge, health protection and prevention should be included in the curriculum. The rudiments of finance should be taught as well to assist older people in having savings to cover their health and education related expenses. In Hungary, changing the general attitude would be very important too. In case of senior workers, the possibility of becoming exchange students should be considered seriously. Meeting other cultures may help them change their not too favorable attitude. Teachers who teach seniors should be prepared in a special way because this age group has special needs. Their employment and their good health status is essential for society, otherwise the related cost increases day by day resulting in high taxes and contributions, which might be followed by widespread social unrest. Acknowledgement: I wish to thank the Talentum Project TÁMOP 4.2.2 B-10/1-2010-2018 References D. Alinsky, A. (1999): A civil szervezkedés ábécéje, Bagolyvár Könyvkiadó, (in Hungarian) Ghosheh Jr. N. S. – Sangheon L., McCann D.(2000): Condition of work and employment for older workers in
industrialized countries: Understanding the issue, ILO, Geneva Hablicsek, L. (2000.): Demográfiai forgatókönyvek 2000-2050, Hipotézisek, eredmények, IX. Kerületi
Önkormányzat részére, Budapest, page 8 (in Hungarian) Holmes TH – Rahe RH (1967). "The Social Readjustment Rating Scale
28 There is no enough space to show all the Graphs, the case of Poland is presented as an example.

Science for Sustainability University of West Hungary International Scientific Conference for PhD Students March 19-20, 2013 – Győr
355
Marosné Kuna, Zs. (2009): The role of non-profit organizations in the fight against discrimination on the basis of age in the field of employment, results and possibilities
Szűcs, I. (2002) (ed): Alkalmazott statisztika, Agroinform Kiadó (in Hungarian) Internet sites EUROSTAT
http://ec.europa.eu/economy_finance/publications/european_economy/2011/pdf/ee-2011-4_en.pdf EUROSTAT http://epp.eurostat.ec.europa.eu/portal/page/portal/population/data/database EUROSTAT http://epp.eurostat.ec.europa.eu/portal/page/portal/education/data/database EUROSTAT
http://epp.eurostat.ec.europa.eu/portal/page/portal/health/public_health/data_public_health/database
EUROSTAT http://epp.eurostat.ec.europa.eu/portal/page/portal/employment_unemployment_lfs/data/database
EUROSTAT http://epp.eurostat.ec.europa.eu/portal/page/portal/health/public_health/data_public_health/database


Science for Sustainability University of West Hungary International Scientific Conference for PhD Students March 19-20, 2013 – Győr
357
Imre Ujhelyi Doctoral School of Animal Sciences
Section 6.1 Manufacturing Health Foods
Challenges and Hurdles for Health Foods – the Probiotic Case
KNEIFEL, Wolfgang
Department of Food Science and Technology BOKU – University of Natural Resources and Life Sciences Vienna
Muthgasse 18, A-1190 Vienna, Austria [email protected]
Abstract – From its very beginning, the so-called Health Claim Regulation (EG 1924/2006), which came into force in 2007, has gained considerable attention by the public as well as by science and industry. This legal barrier on the one hand has aimed at protecting consumers against scientifically baseless claims and sophisticated health-related advertisement in connection with food, on the other hand it intends to clearly discriminate between products providing profound scientific evidence about certain beneficial properties and those associated to the so-called copycat category.
In contrast to former practices having followed the so-called misuse principle (“everything is permitted except that which is prohibited”) the new regulation now has been modulated into the individual permission principle (“everything is prohibited unless it is explicitly allowed”). Hence, according to the regulation, food producers have to submit comprehensive applications and scientific dossiers to the European Commission, thereby following a defined, official pathway and procedure via the corresponding national Food Safety Agency. Ultimately, the European Commission officially publishes the results of an in-depth evaluation of each application related to a desired claim and its product performed by an independent expert panel established at the European Food Safety Authority (EFSA). Similar to the assessment of pharmaceutical drug applications, foods carrying on their labels a health- or disease-related wording need to possess proven scientific evidence.
Among the numerous applications (around 4.600) relating to different health beneficial properties and submitted as of 2007 until 2012, the sector of probiotics comprised about 310 official submissions coming from different countries. In conclusion, none of the probiotic applications was approved by EFSA for several reasons, like insufficient scientific description of microbial strains, improper textual descriptions and inconclusive data from human studies and lacking scientific evidence of facts provided. Even larger and long-term experienced food producing companies had to struggle and made considerable efforts to provide sufficient scientific evidence for their probiotic products. But in vain, even though the probiotic effects were, in principle, demonstrated based on officially accepted scientific publications in peer-reviewed journals, none of the applications were approved by the European authorities. This means that products with even well conducted studies and following the current Golden standard of a double-blind placebo-controlled study design did not pass the evaluation.
A more in depth consideration of this problem reveals some insight into the real reasons: despite the impartial aim of the Health Claim Regulation described above, a complicated barrier was
Science for Sustainability University of West Hungary International Scientific Conference for PhD Students March 19-20, 2013 – Győr
358
constructed that definitely would work with medical drugs but usually not sufficiently with foods. While the impact of drugs is easily measureable with patients suffering from health problems or defined diseases, the effect of food products such as probiotics on usually healthy persons cannot be assessed in the same way. Even preventive effects cannot be adequately described, as there are no clinically measurable endpoints for assessment. Biomarkers only would allow to some limited extent the interpretation of beneficial effects; e.g., for this purpose, those human subjects, which can be characterized as being allocated to the boundary region between healthy and ill are used in clinical studies. Hence the original approach used for drugs is not applicable for foods. However, the fact that a scientific search record to “probiotics” in the PubmedR database and covering the last twelve years meanwhile exceeds the number 7.000. This clearly demonstrates the high scientific potential inherent in probiotic research throughout the last years, but it may be concluded that the altered legal situation will result in a pronounced decline of research activities related to probiotics in a time where probiotics have finally managed to be well-accepted by the medical community. In this keynote lecture the general and historical role of probiotics in nutrition as well as different viewpoints (consumer, industry, research) related to the legal hurdle will be addressed and discussed.
Health-promoting Fermented Milks
VARGA László
Institute of Food Science, Faculty of Agricultural and Food Sciences, University of West Hungary, Mosonmagyaróvár, Hungary
Abstract – Approximately four hundred names are applied to home-made and commercially available fermented milks worldwide. Both historically and commercially, yogurt is the most popular product made with thermophilic cultures. However, the traditional yogurt starters, Streptococcus thermophilus and Lactobacillus (Lb.) delbrueckii subsp. bulgaricus, are not natural inhabitants of the intestine and cannot survive under the acidic conditions and bile concentrations usually encountered in the gastrointestinal tract. Probiotic cultured milks are manufactured with selected strains of lactobacilli and/or bifidobacteria species. These microorganisms are thought to confer health and nutritional benefits through their activity in the intestinal tract. The aim of the first part of the present work was to test the effect of bioactive natural substrates on the characteristic microbiota of conventional yogurts and probiotic fermented milks during fermentation and subsequent storage at 4°C. The growth rate, acid production, and viability of Lb. acidophilus and Bifidobacterium strains during manufacture and refrigerated storage of cultured milks were found to be beneficially influenced by the presence of oligofructose, inulin, honey, and dried Spirulina (S.) platensis. The objectives of the second part of this research were: (1) to test the influence of a S. platensis biomass on growth and acid production of various Lactococcus (Lc.) and Leuconostoc strains in milk, (2) to develop a Spirulina-containing commercial cultured milk fermented with the mesophilic lactic acid bacteria (LAB) strains selected, and (3) to run storage trials to determine the effect of the Spirulina biomass on viability of lactococci in the refrigerated product. Milk samples enriched with S. platensis at concentrations up to 0.8% were inoculated at the rate of 1% with the mesophilic LAB strains tested and then incubated at 30°C. The pH and LAB counts of samples were measured at regular intervals. As part of the product development process, sensory tests were performed to optimize the organoleptic properties of the final product, and then storage trials were carried out. Used at the rate of 0.3%, the Spirulina biomass significantly stimulated (P < 0.05) several of the mesophilic LAB strains screened. A technology for production of a Spirulina-enriched functional fermented milk has been developed. According to the results of ranking tests done by sensory panelists, optimum organoleptic properties were achieved in the product formulation prepared with the mixed culture of Lc. lactis subsp. lactis

Science for Sustainability University of West Hungary International Scientific Conference for PhD Students March 19-20, 2013 – Győr
359
NCAIM B.2128 and Lc. lactis subsp. cremoris ATCC 19257, and supplemented with sucrose at 10%, S. platensis biomass at 0.3%, and strawberry-kiwifruit flavor at 1.5%. During the first 2 weeks of refrigerated storage at 4°C, the S. platensis biomass significantly increased (P < 0.05) the viability percentages of lactococci in the functional fermented milk developed.
Keywords: Lactic acid bacteria / Bifidobacterium / Spirulina / fermented milk
Comparative Evaluation of Conventional Plating Methods for Selective Enumeration of Viable Lactic Acid Bacteria
and Bifidobacteria Cells
SÜLE Judit*
Institute of Food Science, Faculty of Agricultural and Food Sciences, University of West Hungary, Mosonmagyaróvár, Hungary
*E-mail: [email protected] 15-17 Lucsony Street 9200 Mosonmagyaróvár, Hungary Abstract: The aim of this research was to test the suitability of the recently developed selective Transgalactosylated oligosaccharides-mupirocin lithium salt (TOS-MUP) and MRS-clindamycin-ciprofloxacin (MRS-CC) agars, along with several other nonselective media, for enumerating bifidobacteria and lactic acid bacteria (LAB) species commonly used to produce fermented milks. Pure culture suspensions of a total of thirteen dairy bacteria strains, belonging to eight species and five genera, were tested for growth capability under various incubation conditions. TOS-MUP agar was found to be capable of selectively enumerating Bifidobacterium spp., and can therefore be used to determine the viable counts of bifidobacteria in food products containing mixed populations of this organism and various LAB species, including Streptococcus thermophilus, Lactobacillus delbrueckii subsp. bulgaricus, Lb. acidophilus, Lb. casei, Lactococcus lactis, and Leuconostoc mesenteroides subsp. dextranicum. Lactobacillus acidophilus could be selectively enumerated in MRS pH 5.4 agar incubated anaerobically at 45°C for 48 h. MRS-CC agar was also successfully employed for the same purpose unless Lb. casei was present at concentrations similar to or exceeding those of Lb. acidophilus. MRS pH 5.4 agar incubated at 37 °C for 72 h under anaerobiosis was selective for Lactobacillus spp. The viable cell counts of classic yogurt bacteria S. thermophilus and Lb. delbrueckii subsp. bulgaricus could be selectively determined by using M17 agar (37°C, 48 h, aerobiosis) and MRS agars (37°C, 72 h, anaerobiosis), respectively. For selective enumeration of starter organisms and probiotic bacteria in ABT-type fermented milks, use of the following culture media is recommended under the incubation conditions described in this study: MRS-CC agar or MRS pH 5.4 agar for Lb. acidophilus, TOS-MUP agar for bifidobacteria, and M17 agar (45°C, 24 h, aerobiosis) for S. thermophilus. It is strongly emphasized, however, that this work was carried out using pure culture suspensions of starter and probiotic bacteria. When real food samples are examined, culture medium selection should be carefully considered on a case to case basis. The choice of methodology for selective enumeration of LAB and bifidobacteria is supposed to be a function of the product matrix, the target species or strains, and the composition of the bacterial background flora in the specific food product tested.
Keywords: Mupirocin / Clindamycin / Ciprofloxacin / Bifidobacterium/ Lactobacillus acidophilus / enumeration
Acknowledgments: The author gratefully acknowledges research funding support from the European Union and the European Social Fund (Project No.: TÁMOP 4.2.2.B-10/1-2010-0018).
Science for Sustainability University of West Hungary International Scientific Conference for PhD Students March 19-20, 2013 – Győr
360
Comparison of Importance of the Anthocyanins from Dogwood and Cherry, as Health Benefits Compounds in
Human Diet
MECH-NOWAK, Aleksandra1 – ŚWIDERSKI, Adam1 – SKRZYŃSKI, Jan2
University of Agriculture in Krakow 1Departament of Biochemistry, Faculty of Horticulture,
2Departament of Pomology and Apiculture,31-425 Krakow, Poland e-mail:[email protected]
Abstract – Fruit of various species of horticulture plants rich in anthocyanins has started to be very interesting, since a few years ago, it turned out that some of the anthocyanins, in vitro, have strong anti-cancer effect against some types of cancers such as leukemia and colorectal cancer. It was proved that cyanidin-3-rutinoside and cyanidin-3 glucoside are mainly responsible for this effect. That's why in order to determine which fruit cultivated in Poland - sweet cherry, sour cherry or dogwood are potentially the most rich source of health benefit anthocyanins, a comparative study has been conducted.
For the analysis were selected cultivars and clones of sweet cherry, sour cherry and dogwood grown in the region of Malopolska. Freeze-dried pulp was prepared from harvested fruits for each of the tested cultivars. Extraction was carried out in two repeats in methanol with 1% HCl. The study of anthocyanins was conducted by spectrophotometric and chromatographic methods. Spectrophotometr Jasco V-530 and chromatograph Shimadzu LC-10AS with double channel detector UV-Vis were used. Applied column was LiChrospher RP-18 (5 μm) 250 mm from Merck, and separation was performed in gradient water-methanol, with the addition of orthophosphoric acid.
Among compared fruit the highest content of anthocyanins, as expected, was found in the fruit of sweet cherries. Slightly lower level of this compounds were found in sour cherry, the lowest in the fruits of dogwood. It was also discovered that main anthocyanins of chosen red sweet cherry fruits was a cyanidin-3-rutinoside and cyanidin-3-glucoside. Johanna and Schneider cultivars showed the highest, not only total anthocyanin content, but also cyanidin-3-rutinoside. In the sour cherry fruit dominant cyanin was cyanidin-3-glucoside, which was observed in most in 'Nefris' cultivar.
Comparison of content of anthocyanins provides data which make possible to use particular cultivars of horticultural fruit not only for consumption, but also as a source of especially rich in cyanidin-3-rutinoside and cyanidin-3-glucoside extracts which may be used as food supplementation. Another aspect is to know the composition of anthocyanins contained in the fruits of dogwood, because the characteristics of the composition of these compounds in that fruit is little known. It will also evaluate cultivars and clones of dogwood for breeding. The work was supported by a research grant of Polish National Science Centre no. N N310 143735.

Science for Sustainability University of West Hungary International Scientific Conference for PhD Students March 19-20, 2013 – Győr
361
Low-power Microwave Radiation Effect on
Fermentation of Grape Must
KAPCSÁNDI Viktória* – NEMÉNYI Miklós – LAKATOS Erika
University of West Hungary, Faculty of Agricultural and Food Sciences, Institute of Biosystems Engineering, *[email protected], H-9200 Mosonmagyaróvár, Vár 2.
Abstract – A method was developed for studying the effects of various treatments in the course of must fermentation. The raw material (must) was treated in different ways: (i) conductive; (ii) microwave treatment; (iii) inoculation with yeast and (iv) their combination. The results of the treatments were compared in the aspect of alcohol concentration, sugar content and acidity. The results suggest that the sugar content of the treated samples rapidly decreased compared to the control sample, and the fermentation time was shorter with 40% in the fastest case. These results are probably caused by the yeast inoculation and the microwave treatment.
Keywords: winemaking / Saccharomyces cerevisiae / microwave
1. INTRODUCTION
The main task of winemaking technology is to optimize of fermentation process in order to suitable production of wine (EPERJESI et al. 1998). Complex processes are take place during the source of must in line with each other, which could influence the process by positive or negative way. However, the controlled fermentation is well directed process with to application of appropriate parameters (CALADO et al. 2002; SABLAYROLLES 2009). During the fermentation the emphasis is mostly on to optimize the alcohol, sugar and acid content (PICKERING et al. 1998; BIACS et al. 2010).
2. MATERIALS AND METHODS
The experiments were performed with two series of measurements. In the first experimental set the fermentation of four samples were compared. In case of control sample there was not any treatment used. Yeast (Saccharomyces cerevisiae) was added to the second sample. The third sample was treated with microwave (50 W, 45 min, 32 °C). In case of the fourth sample a combined treatment (yeast and microwave)was applied.
In the second measurement series the fermentation were compared with six different treatments: (i) No treatment was applied on control samples; (ii) hot plate heated (32 °C); (iii) microwave-treated (50 W, 45 min, 32 °C); (iv) yeast supplementation (Saccharomyces cerevisiae) is received; (v) yeast inoculation under hot plate is heated (32 °C.); (vi) microwave treatment and yeast supplement. The must fermentation was carried out at 15-16 °C in these experiments.
During the experiments we determined the alcoholic content by Malligand-device, the sugar content of must with spectrophotometer, and acidity by titration (with NaOH). The measurements were performed with three repetitions.

Science for Sustainability University of West Hungary International Scientific Conference for PhD Students March 19-20, 2013 – Győr
362
3. RESULTS AND DISCUSSION
The difference between untreated and treated samples was visible after eight days of fermentation process. The sugar content of the control samples was decreased slower compared to the treated ones. Based on these results it can be stated that the fermentation is significantly influenced by the treatments.
Figure 1 shows that samples treated with microwave and yeast supplementation reaches the lowest value of sugar content on 16th day of fermentation. The sample having only yeast supplementation and only microwave-treatment reduced the sugar content faster. These samples reach the minimum value on 20th day of fermentation, while by the microwave treated sample occurs this phenomenon just on 24th day.
4
6
8
10
12
14
16
18
0 2 4 6 8 10 12 14 16 18 20 22 24 26 28 30
Time [day]
Su
gar
con
ten
t [g
/L]
Figure 1. Changes the sugar content of the must during the fermentation of the control(■),
the microwaves(■), the yeast (■) and the yeast and microwave treated (■) samples
4
5
6
7
8
9
10
11
12
13
14
0 2 4 6 8 10 12 14 16 18 20 22 24 26 28 30
Time [day]
Alc
ohol
con
ten
t [%
]
Figure 2. Changes of alcohol content of the must during the fermentation of the control(■),
the microwaves(■), the yeast (■) and the yeast and microwave treated (■) samples
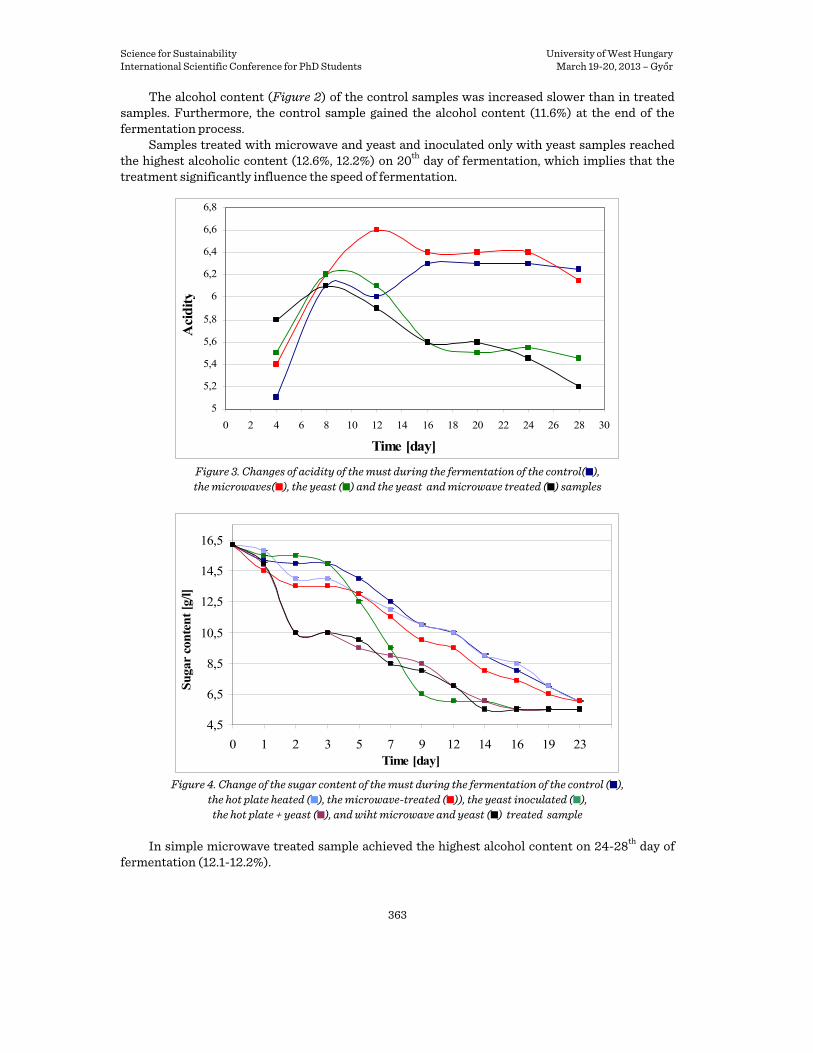
Science for Sustainability University of West Hungary International Scientific Conference for PhD Students March 19-20, 2013 – Győr
363
The alcohol content (Figure 2) of the control samples was increased slower than in treated samples. Furthermore, the control sample gained the alcohol content (11.6%) at the end of the fermentation process.
Samples treated with microwave and yeast and inoculated only with yeast samples reached the highest alcoholic content (12.6%, 12.2%) on 20th day of fermentation, which implies that the treatment significantly influence the speed of fermentation.
5
5,2
5,4
5,6
5,8
6
6,2
6,4
6,6
6,8
0 2 4 6 8 10 12 14 16 18 20 22 24 26 28 30
Time [day]
Aci
dit
y
Figure 3. Changes of acidity of the must during the fermentation of the control(■), the microwaves(■), the yeast (■) and the yeast and microwave treated (■) samples
4,5
6,5
8,5
10,5
12,5
14,5
16,5
0 1 2 3 5 7 9 12 14 16 19 23Time [day]
Su
gar
con
ten
t [g
/l]
Figure 4. Change of the sugar content of the must during the fermentation of the control (■),
the hot plate heated (■), the microwave-treated (■)), the yeast inoculated (■), the hot plate + yeast (■), and wiht microwave and yeast (■) treated sample
In simple microwave treated sample achieved the highest alcohol content on 24-28th day of fermentation (12.1-12.2%).

Science for Sustainability University of West Hungary International Scientific Conference for PhD Students March 19-20, 2013 – Győr
364
At the beginning of the fermentation acidity was increased for a while and then decreased, as it is written in other studies (KÁLLAY 2010). This can be clearly seen in our measurements (Figure 3).
01
23
45
67
89
1011
0 2 4 6 8 10 12 14 16 18 20 22 24Time [day]
Alc
ohol
con
ten
t [%
]
Figure 5. Change of the alcohol content of the must during the fermentation of the control (■),
the hot plate heated (■), the microwave-treated (■)), the yeast inoculated (■), the hot plate + yeast (■), and wiht microwave and yeast (■) treated sample
4
4,5
5
5,5
6
6,5
0 1 2 3 5 7 9 12 14 16 19 23Time [day]
Aci
dit
y
Figure 6. Change of acidity of the must during the fermentation of the control (■),
the hot plate heated (■), the microwave-treated (■)), the yeast inoculated (■), the hot plate + yeast (■), and wiht microwave and yeast (■) treated sample
In case of second measurement series were experienced similar results of the sugar content
as in the first measurement (Figure 4). It can be noted that samples of yeast treated on hot-plate and samples of yeast treated with
microwave reached the lowest sugar content on 14th day of fermentation (23 days total fermentation), while the remaining samples occurred at a later time.

Science for Sustainability University of West Hungary International Scientific Conference for PhD Students March 19-20, 2013 – Győr
365
Distinctly, the fermentation was started on the second day of the measurement. There was a significant difference between the alcohol content (Figure 5) of the control sample (0.4%) and the treated samples (1 to 3.1%).
The alcohol content of the combined treated samples reached the highest level (10.4% and 10.2%) on 14th day of fermentation. These treatments also influence the speed of the fermentation. The alcohol content of the must samples were treated only with yeast inoculation or hot plate reached the highest level on the 18th day of fermentation (10% and 9.8%).
Concerning acidity (Figure 6) it can be concluded that the complete treated samples have the largest acidity. The acidity change is not as uniform as the sugar and alcohol content change.
It can be stated that the average acidity difference between 0 days (must) and 23 days (wine) was 23.31%. And the difference was found between maximum and minimum acidity by 28.44%.
4. CONCLUSIONS
Both measurement series gave similar results. The sugar content of the treated samples rapidly decreased compared to the control sample and the fermentation time was shorter by 40% in the fastest case. These results were probably caused by the yeast inoculation and the microwave treatment.
The statistical analysis showed on the first attempt not significant difference between each sample. In this case the non-thermal effect of microwave is not prevail or has no effect on the results. The second series of measurements did not give significant difference between each sample as regards the alcohol content during the whole fermentation. In the first third of fermentation was verifiable different between the samples.
It was stated that a short-term heat treatment prior to fermentation until 32 oC influences the parameters of the fermentation in a positive way by using yeast. The fermentation time was reduced while the alcohol yield increased. Acknowledgements: We wish to thank to “TALENTUM PROJECT” TÁMOP 4. 2. 2. B-10/1-2010-0018 and TÁMOP-4.2.2.A-11/1/KONV-2012-0003. And we would like to thank Attila József KOVÁCS, PhD for the translation. References BIACS P. – SZABÓ G. – SZENDRŐ P. – VÉHA A. (2010): Élelmiszer-technológia mérnököknek. [Food-technology
for engineers.] Szegedi Tudományegyetem Mérnöki Kar, Szeged CALADO, C. R. C. – TAIPA, M.A. – CABRAL, J. M. S. – FONSECA, L.P. (2002): Optimisation of cultur conditions and
characterization of cutinose produced by recombinant Saccharomyces cerevisiae. Enzyme and Microbial Technology. Vol. 31. pp. 161-170.
EPERJESI I. – KÁLLAY M. – MAGYAR I. (1998): Borászat. [Winery.] Mezőgazda Kiadó, Budapest KÁLLAY M. (2010): Borászati kémia. [Oenological chemistry.] Mezőgazda Kiadó, Budapest. p. 94. PICKERING, G. J. – HEATHERBELL, D. A. – BARNES, M. F. (1998): Optimising glucose conversion in the production
of reduced alcohol wine using glucose oxidase. Food Research International, Vol. 31, Issue 10, pp. 685-692
SABLAYROLLES J. M. (2009): Control of alcoholic fermentation is winemaking: Current situation and prospect. Food Research International 42 pp. 418-424.

Science for Sustainability University of West Hungary International Scientific Conference for PhD Students March 19-20, 2013 – Győr
366
Postharvest Heat Treatment of Apples as Ecological Method of improving the Quality of Storage Fruits
GRABOWSKI, Mareka – SKRZYŃSKI, Jana – MACNAR, Katarzynaa*
Department of Pomology and Apiculture, University of Agriculture, Cracow, Poland Corresponding author: [email protected]; Poland, 31-425 Krakow, Al. 29 Listopada 54
Abstract – In the years 2010-2012 the experiments were carried out to determine an effect of post-harvest baths on the quality apples ‘Šampion’ in storage. The undamaged apples harvested at optimal maturity time were subject to thermotherapy in water at 45, 50, 52, 55°C for 60, 120, 180 and 240 seconds. Directly after the bath, after 16-week storage and during so called the simulated trade turnover the fruits were checked for health condition and the quality parameters. The research studies proved a favorable effect of hot baths on health condition of the ‘Šampion’ apples, sufficient within the temperature range of 45-52°C used in thermotherapy. After 16-week storage and so called the simulated trade turnover some minute statistical differences were recorded for the fruit flesh firmness. The was lower extract content in the juice in all analyses in washed apples compared to the control.
keywords: thermotherapy / storage diseases / firmness / acidity / extract
1. INTRODUCTION
The diet enriched in vegetables and fruit is of crucial importance in the human health context. In Poland about 70% of overall fruit production take apples being a valuable source of polyphenols belonging to strong antioxidants (PYRYT – WRZEŚNIAK 2011). Huge economic losses in apple production, especially in more and more popular ecological systems, result from infestation with pathogens that disclose only during prolonged storage. The post-harvest thermotherapy treatment can considerably reduce storage diseases and become an alternative to chemical protection means. In the years 2010-2012 experiments were carried out on an effect of hot baths on health and quality of ‘Šampion’ apples in storage.
2. MATERIAL AND METHODS
2.1. APPLES ‘ŠAMPION’
The test material was apples of Šampion cultivar from then Experimental Station of the Department of Pomology and Apiculture at the University of Agriculture in Kraków in Garlica Murowana. The apple-tree rows were arranged in the North-South layout, and every sixth tree was a pollinator of the cultivar of Idared. The trees were spaced at 4 × 1.2 m2, crowns were formed in the slender spindle system with bearings. The soil was maintained as a herbicide idle land with rows, with inter-row greens and no irrigation was used.
The apples of ‘Šampion’ cultivar that showed no mechanical damages or disease symptoms were taken in the optimal harvest maturity from various parts of the crown. Directly after harvesting the fruits were subject to heat treatment in water at 45, 50, 52, 55 °C for 60, 120, 180 and 240 s. (1 combination contained 60 apples). The control was apples not bathed. After treatment the apples were dried with air stream generated by fans, and then were placed in a typical cooler

Science for Sustainability University of West Hungary International Scientific Conference for PhD Students March 19-20, 2013 – Győr
367
(temperature of 3°C, humidity of 92%) and wrapped with a polyethylene film to reduce transpiration.
Po upływie 16 tygodni przechowywania oraz w czasie tzw. symulowanego obrotu handlowego badano owoce pod względem zdrowotności, jędrności miąższu, kwasowości oraz zawartości ekstraktu.
2.2. ANALYSIS OF FRUIT HEALT STATE
In both dates the number of apples infested with fungi was recorded and expressed in percentage of all fruits subjected to the same treatment. In addition, the perpetrator of diseases was indentified. By using available mycological keys (ELLIS – ELLIS 1985, MARCINKOWSKA 2003) the pathogenic fungi were determined based on disease symptoms they make and microscopic isolated cultured on solidified peptone glucose agar (PDA). Clean fungi cultures were obtained by cutting out fragments of 0.5 cm in diameter from infested apples, and then washed in distilled water (for 2 minutes), surface disinfected with 70% alcohol (for 4 minutes) and washed once again in distilled water (for 2 minutes). The fruit fragments dried on a filter paper were placed on solidified PDA agar previously poured into Petri dishes. After 10-12 day of storage at temperature about 21°C all the developed fungi cultures were split off in solidified PDA agar slants.
Table 1. Procentage infection of ‘Šampion’ apple with pathogens Number of infected apples [%]
1 year 2 year Treatment
after 16 weeks simulated trade turnover
after 16 weeks simulated trade turnover
control 45°/60s 45°/120s 45°/180s 45°/240s 50°/60s 50°/120s 50°/180s 50°/240s 52°/60s 52°/120s 52°/180s 52°/240s 55°/60s 55°/120s 55°/180s 55°/240s
9.09 5.45 7.27 0.00 3.64 5.45 1.82 0.00 0.00 5.45 0.00 1.82 0.00 0.00 0.00 0.00 0.00
6.67 0.00 0.00 4.00 0.00 0.00 0.00 0.00 0.00 0.00 0.00 0.00 2.00 0.00 0.00 0.00 0.00
7.27 7.27 3.64 3.64 0.00 7.27 3.64 0.00 0.00 0.00 0.00 0.00 3.64 0.00 0.00 0.00 0.00
4.35 0.00 0.00 4.17 4.00 4.35 0.00 4.00 8.00 0.00 0.00 0.00 0.00 4.00 0.00 0.00 0.00
2.3. DETERMINATION OF QUALITATIVE PARAMETERS
Directly after the bath and storage the such parameters enabling the fruit quality to be checked objectively as: apple flesh thickness, acidity and extract content, while the last ones were determined in juice.
The obtained results were subject to statistical computations with the variance analysis method by using the NIR Fisher test at the significance level α = 0.05. The calculations were made with the computer program STATISTICA 9.

Science for Sustainability University of West Hungary International Scientific Conference for PhD Students March 19-20, 2013 – Győr
368
3. RESULTS
3.1. APPLE ‘ŠAMPION’ HEALTH STATE
The after-harvest heat treatment had a crucial effect on health state of the fruits. In both experiment years the lowest water temperature used (45°C) allowed the reduction of infested apples compared to the control (Table 1). After water treatment at 55°C the null fruit infestation was achieved both in storage and simulated trade turnover. However, it was found that after 16 week storage the skin of the fruits treated with water at that temperature (regardless of exposition time) was clearly wrinkled compared to those of other combinations.
From apples showed rot symptoms dozens of fungi isolates were taken belonging to genera Alternaria, Botrytis, Gloeosporium, Fusarium, Monilinia. In storage and during simulated trade turnover the ‘Šampion’ apples were infected mainly by fungi of the genus Gloeosporium, causing bitter rot of pome fruits. These fungi were 54.7% of all obtained isolates. The large share in fruit infestation was also due to the pathogens Botrytis cinerea – 20.3% and Alternaria alternata – 14.1% of all isolates. The fungi Fusarium avenaceum (6.2%) and Monilinia fructigena (4.7%) were most rarely isolated.
3.2. QUALITY PARAMETERS
The average fruit parenchyma firmness just after the bath showed no statistical differences compared to that of the control and varied from 6.72 to 6.96 kg. After 16 –week storage and during so called simulated trade turnover, slight statistical differences were obtained for this parameter (Table 2). The highest values of this parameter were recorded in both cases for the treatments 55°/60s and 55°/120s. Table 2. Average parenchyma firmness of the ‘Šampion’ apples in the years 2010-2012
Firmness [kg*cm-2] Treatment harvest maturity after 16 weeks simulated trade turnover
control 45°/60s 45°/120s 45°/180s 45°/240s 50°/60s 50°/120s 50°/180s 50°/240s 52°/60s 52°/120s 52°/180s 52°/240s 55°/60s 55°/120s 55°/180s 55°/240s
6.96 a* 6.80 a 6.82 a 6.82 a 6.86 a 6.89 a 6.81 a 6.82 a 6.87 a 6.83 a 6.94 a 6.72 a 6.82 a 6.88 a 6.78 a 6.89 a 6.79 a
3.65 ac* 3.40 c 3.44 bc 3.43 bc 3.47 ac 3.61 ac 3.43 bc 3.52 ac 3.44 bc 3.55 ac 3.67 ac 3.40 c 3.76 ab 3.79 a 3.66 ac 3.75 ab 3.47 ac
3.36 ad* 3.21 af 2.86 fg 3.39 ac 3.54 a 3.37 ac 2.93 dg 2.91 eg 3.06 bg 2.70 g 3.34 ae 3.11 ag 3.13 ag 3.54 a 3.47 ab 3.01 cg 3.14 af
*means followed by the same letter do not differ at a significance α = 0.05
The total acidity converted to apple acid just after the bath was 0.44-0.48% depending on treatment. The statistically important differences were found for water treatment at 55°C (of lowest acidity). After storage this parameter was kept at the level of 0.35-0.44%. For the period of stimulated trade turnover for treatments at 52°C the values significantly higher than those of the control were obtained (Table 3).

Science for Sustainability University of West Hungary International Scientific Conference for PhD Students March 19-20, 2013 – Győr
369
The extract content in juice was lower in all analysis dates in washed apples compared to those of the control (Table 4).
Table 3. The mean total acidity of the ‘Šampion’ apple juice in the years 2010-2012 converted to apple acid Total acidity [%] Treatment
harvest maturity after 16 weeks simulated trade turnover Control 45°/60s 45°/120s 45°/180s 45°/240s 50°/60s 50°/120s 50°/180s 50°/240s 52°/60s 52°/120s 52°/180s 52°/240s 55°/60s 55°/120s 55°/180s 55°/240s
0.473 ab* 0.467 ae 0.470 ac 0.475 a
0.465 be 0.460 de 0.467 ae 0.458 ef 0.469 ad 0.465 be 0.464 be 0.466 ae 0.462 ce 0.448 g 0.443 g 0.451 fg 0.451 fg
0.426 bc* 0.377 ik 0.401 ef 0.440 a 0.365 kl 0.347 m 0.395 fh 0.372 jl
0.430 ab 0.407 de 0.414 cd 0.397 eg 0.383 hj 0.360 l
0.392 fh 0.402 ef 0.387 gi
0.385 de* 0.382 ef 0.353 hi 0.430 a 0.369 g 0.342 j 0.351 ij 0.369 g
0.394 bd 0.422 a
0.399 bc 0.403 b 0.373 fg 0.389 ce 0.389 ce 0.373 fg 0.363 gh
*means followed by the same letter do not differ at a significance α = 0.05
Table 4. The average extract contents of the ‘Šampion’ apple juice in the years 2010-2012 Extract contents [%] Treatment
harvest maturity after 16 weeks simulated trade turnover Control 45°/60s 45°/120s 45°/180s 45°/240s 50°/60s 50°/120s 50°/180s 50°/240s 52°/60s 52°/120s 52°/180s 52°/240s 55°/60s 55°/120s 55°/180s 55°/240s
12.10 a* 12.00 b 11.97 bc 12.13 a 11.60 fg 11.50 h
11.93 bc 11.80 d 11.17 i
11.93 bc 11.97 bc 11.50 h 11.90 c
11.53 gh 11.80 d 11.67 ef 11.70 e
13.70 a* 13.47 c 13.27 e 13.70 a 13.10 g 12.90 h 13.60 b 13.50 c 12.80 i 13.60 b 13.67 a 13.10 g 13.57 b 13.17 f 13.47 c 13.37 d 13.57 b
13.80 c* 13.60 e 13.70 d 13.20 h 13.30 g 13.10 i 14.10 b 14.20 a 13.70 d 14.10 b 14.20 a 13.70 d 13.50 f 13.20 h 13.80 c 14.20 a 14.10 b
*means followed by the same letter do not differ at a significance α = 0.05
4. DISCUSSION
The infestation of ‘Šampion’ apples with fungi was lower in all combinations used compared to that of the control. The effectiveness of thermotherapy as a method of fruit protection against rots during storage was confirmed also, among others, by FALLIK et al. (1996), TRIERWEILER et al. (2003) i AUINGER (2005). TAHIR (2006) showed that apple heat treatment changes the fruit wax

Science for Sustainability University of West Hungary International Scientific Conference for PhD Students March 19-20, 2013 – Győr
370
envelope that after dissolving can form a uniform structure. The wax envelope dissolved under heat can also drown fungi spores. SCHIRRA et al. (2000) state that the efficiency of thermotherapy is connected with germinated spores killed by high temperature, thus reducing the amount of active inoculum. The sensitivity of individual apple varieties to heat treatment is diversified (BOMPEIX – CHOLODOWSKI-FAIVRE 2006). GRABOWSKI et al. (2012) showed that the use of water at 55°C for the Topaz cultivar may wash out a part of protecting waxes and faster skin wrinkling compared to that of the control. Similar effect was observed also for ‘Šampion’ apples.
The thermotherapy treatment can affect the fruit qualitative features such as firmness, acidity, extract contents, taste and colour (FALLIK et al. 1996, LURIE 1998, TAHIR et al. 2009). In this study minor statistical differences in parenchyma firmness were found for ‘Šampion’ apples washed in hot baths compared to the control. SKRZYŃSKI (2007) demonstrated that the fruits of this cultivar treated for shorter time (10 and 20 s) maintained the higher statistically importance of firmness those of unwashed fruits. The total acidity converted to apple acid and the extract contents were different depending on the water temperature and exposition time used.
The studies showed an advantageous effect of hot baths on the health state of the ‘Šampion’ apples and the sufficient temperature range 45-52°C. References AUINGER, A. – TRIERWEILER, B. – LUECKE, F.K. – TAUSCHER, B. (2005): Influence of hot water treatment on
different quality parameters of apples during storage. Journal of Applied Botany and Food Quality 79 (3): 154-156.
BOMPEIX, G. – CHOLODOWSKI-FAIVRE D. (2006): Use of Thermotherapy and Natural Antifungal Compounds against Post Harvest Diseases on Apples, In: M. BOOS (ed.): Ecofruit - 10th International Conference on Cultivation Technique and Phytopathological Problems in Organic Fruit-Growing, Weinsberg, Germany 31st January to 2nd February: 55.
ELLIS, M. – ELLIS, J.P. (1985): Microfungi on Land Plants. An Identification Handbook, Macmillan. Publishing Company, New York. 818 p.
FALLIK, E. – GRINBERG, S. – GAMBOURG, M. – KLEIN, J.D. – LURIE S. (1996): Prestorage heat treatment reduces pathogenicity of Penicillium expansum in apple fruit. Plant Pathology 45 (1):92-97.
GRABOWSKI, M. – MACNAR K. – SKRZYŃSKI J. (2012): An example of post-harvest thermotherapy as a non-chemical method of pathogen control on apples of Topaz cultivar in storage. World Academy of Science, Engineering and Technology 69: 1000-1002.
LURIE, S. (1998): Postharvest heat treatments. Postharv. Biol. and Tech. 14: 257-269. MARCINKOWSKA, J. (2003): Oznaczanie Rodzajów Grzybów Ważnych w Patologii Roślin. [The determination
of fungi genera of importance in plant pathology.] Fundacja. Rozwój SGGW. 328 p (in Polish). PYRYT, B. – WRZEŚNIAK, M. (2011): Ocena jakości wybranych odmian jabłek deserowych dostępnych w
sprzedaży detalicznej. [Assessment of quality of selected varieties of dessert apples available on retail sale.] Bromat. Chem. Toksykol. XLIV (3): 934 – 938 (in Polish).
SCHIRRA, M. – D'HALLEWIN, G.D. – BEN-YEHOSHUA, S. – FALLIK, E. (2000): Host–pathogen interactions modulated by heat treatment. Postharvest Biol. and Technol. 21: 71–85.
SKRZYŃSKI, J. (2007): Prestorage heat treatment of apples. VCRB 67: 203-208. TAHIR, I. (2006): Control of pre- and postharvest factors to improve apple quality and storability. Doctoral
thesis no. 2006:35, Acta Universitatis Agriculturae Sueciae, Alnarp, 63 p. TAHIR, I. – JOHANSSON, E. – OLSSON, M.E. (2009): Improvement of apple quality and storability by a
combination of heat treatment and controlled atmosphere storage. HortScience 44 (6): 1648-1654. TRIERWEILER, B. – GRÄF, V. – SCHIRMER, H. – TAUSCHER, B. (2003): Thermo-Behandlung ökologisch
produzierter Äpfel zur Verbesser-ung der Lagerfähigkeit. [Thermal treatment of organically produced apples to improve the storage ability.] Frischelogistik 1 (2): 34-36 (in German).

Science for Sustainability University of West Hungary International Scientific Conference for PhD Students March 19-20, 2013 – Győr
371
MRI-Diagnostics of Epileptic Dogs
LŐRINCZ Borbálaa* – GARAMVÖLYI Ritaa – BAJZIK Gábora – SZÁNTÓ Andrása – NAGY Ferencb – LELOVICS Zsuzsannaa – REPA Imrea
aKaposvár University, Institute of Diagnostic Imaging and Radiation Oncology, Kaposvár, 7400, Hungary b “Moritz Kaposi” General Hospital, Kaposvár, 7400, Hungary
Abstract – Epilepsy is a quite common disease in dogs. It occurs in all breeds, sexes and ages. Etiological differentiation has to be made between the so called idiopathic (primary) and the acquired (secondary) form of epilepsy. In the idiopathic form there is no obvious sign of any alteration in the brain. In the secondary form some changes of the brain—tumor, encephalitis, etc.—are present. The gold standard method for confirming these changes in the brain is magnetic resonance imaging (MRI). According to the international literature, there are some breeds (for example Retrievers, Boxer, Cocker Spaniel, Beagle, Dachshund, etc.) and families, where the prevalence of idiopathic epilepsy is higher. In these breeds and relatives a genetic predisposition is supposed, which could make the breeding of these animals problematic. The aim of our study is to make a statistical analysis of the examined dogs showing epileptic symptoms.
Keywords: epilepsy / magnetic resonance imaging / dog
1. INTRODUCTION
Canine epilepsy is a field of the veterinary neurology in which the scientific information is limited. It’s a quite common disease in dogs, it occurs in a lot of breeds and age-groups. Relevantly to the whole dog population of the world the incidence of the disease is suspected between 0.5% and 5.7%. In some breeds this affected rate can be much higher.
Due to the internationally accepted nomenclature of epileptic disorders the term “epilepsy” is used in such cases, if the occurred seizures chronic, stereotypically, mostly showing similar clinical signs without any visible root cause (KISS 2008). In case of an abrupt, strong stimulus every dog can have an epileptic seizure (ictus), but the term epilepsy should technically only be used for idiopathic epilepsy in which chronic relapsing epileptic seizures occur without an identifiable underlying cause.
In the human medicine classification of the epileptic seizure is based on the clinical picture, aetiology, ictal and interictal EEG results. Due to these results the seizures can be localization-related (focal or partial), generalized and unclassifiable epileptic seizure. In veterinary field there is a problem of the correct classification, that the EEG results—especially the interictal ones—are often lacking.
Generally simple partial seizures do not influence consciousness. These seizures are usually motor disturbances, such as twitching of the facial muscles, the individual limbs or a turning of the neck or the head. More rarely purely autonomic or sensory focal disturbances can occur in dogs.
Complex partial seizures always involve changes in consciousness and can manifest as “absence”, unprovoked barking or screaming, oral automatisms (lip-licking, squelching, “fly catching”), fits of temper, wild circling (so-called running fit), aggression, anxiety, coyness or
* Corresponding author: [email protected], H-9024 Győr, Hunyadi u. 7/a

Science for Sustainability University of West Hungary International Scientific Conference for PhD Students March 19-20, 2013 – Győr
372
hypersexuality. These last types of events are difficult to differentiate from the behavioral or neuropschychiatric disorders without an EEG evaluation.
Generalized seizures are the most common—and mostly recognized—type of epileptic seizures in dogs. Both hemispheres of the brain are involved (primary generalisation), or as in a lot of cases the generalized seizure starts as focal one, and then generalise (secondary generalization). In case of losing consciousness during the seizure it is called “grand mal”, showing the typical tonico-clonic symptoms (JAGGY 2010).
According to the etiology epilepsy can be differentiated in two groups: primary/idiopathic epilepsy and secondary/symptomatic epilepsy.
Idiopathic epilepsy occurs without any recognizable cause, genetic definiteness is the main characteristic. Already in the 1980s the inheritance of idiopathic epilepsy was proved. Due to a Swiss scientific project its occurrence was the highest in Golden and Labrador Retrievers (although, these breeds pertain to the most common breeds in Switzerland), and it was rare in mongrols (JAGGY – BERNARDINI 1988). It’s inheritance was also proofed in Beagle, Dachshund, German Shephard, Tervueren, Boxer, Cocker Spaniel, Irish Setter, Mini Schnauzer, Poodle, St. Bernard and Siberian Husky (WIERSMA – AYLWARD 1995). Regarding to the Hungarian breeds Mudi and Hungarian Pointer are the most affected breeds. The symptoms can occur in all ages, but the first seizure comes between one-three years of age. In large breeds the runoff is more severe (JAGGY – BERNARDINI 1988, KATHMANN – JAGGY 2003).
The proper genetic localization of some types of epilepsy is already verificated in human beings. In case of temporal lobe epilepsies and progressive myoclonic epilepsies the failure of the mitochondrial DNA-polymerase and tRNA were recognized, resulting in a mitochondrial dysfunction (SHAHWAN et al. 2005). Secondary sclerosis of the Ammon horn leads to the epileptogenesis in the temporal lobe (KUDIN et al. 2009).
There are also some investigations for exact genetic mapping of diseases. There are altogether more than 400 canine illnesses with genetic origin. The exact genetic mapping of these diseases could be very helpful in the breeding. Compared with other diseases epilepsy has capital importance, especially in case of predisponated breeds (VAN HAGEN et al. 2004, OLSON 2007). The whole genome of Boxer has been already searched (OLSON et al. 2004), and the genetical mapping of other breeds are also under way.
The goal of future studies could be the exact genetic mapping of idiopathic epilepsy in the predisponated breeds and their crossings, such as by neuronal lipofuscinosis in English Setter (KATZ et al. 2005), and Border Collie (MELVILLE et al. 2005).
Secondary epilepsy can occur with an intracranial and extracranial instigating factor. Intracranial causes are: congenital disorders of the brain (hydrocephalus internus, arachnoidal cyst), contagious diseases, cerebral tumors, bleeding, storage diseases. MRI serves as gold standard imaging method to differentiate brain pathologies, intracranial causes. Extracranial causes are: toxicosis, disturbances of the homeostasis, uraemia, hypoglicaemia, hypoxia, lack of vitamins, etc. (SMITH et al. 2007).
Recognition, standardization and treatment of epilepsy in an early stage – in presence of the focal seizures – would be very important. The disease progrediates without proper treatment, and the brain laesions – caused by the returning seizures – lead to a circulus vitiosus. Due to the familiar nature of the disorder screening of carrier breeding lines would be very useful.
2. MATERIALS AND METHODS
Thirty adult dogs showing epileptic symptoms – 19 males and 11 females, ages between 1 and 12 years (average 5.2±2.7years) – underwent MRI at the Kaposvár University Institute of Diagnostic Imaging and Radiation Oncology in almost a two years period. The represented breeds were:

Science for Sustainability University of West Hungary International Scientific Conference for PhD Students March 19-20, 2013 – Győr
373
mongrol (5) French Bulldog (3), Bichon Bolognese (3), Labrador Retriever (3), Mops (2), Hungarian Pointer (2), Malthese (1), Tervueren (1), Pumi (1), Cavalier King Charles Spaniel (1), Beagle (1), Boxer (1), Bichon Havanese (1), English Cocker Spaniel (1), Dachshund (1), Spitz (1), Hungarian Greyhound (1), Caucasian Shephard (1). After referral of veterinary clinicians the MR examinations were performed in general anesthesia with the permission of the owner at 1.5T field strength Siemens Magnetom Avanto MR equipment. We calculated the mean (±SD), we calculated correlation where it was possible and performed Student’s t-test.
3. RESULTS
Twenty of the thirty dogs showed no evidence of any abnormalities of the brain with the MRI examinations. These dogs had idiopathic epilepsy. The effected dogs – concurrent to the international scientific literature – are mostly younger (or show the symptoms for a longer time), and males are more often affected. The affected breeds were: mongrol (3) French Bulldog (3), Bichon Bolognese (1), Labrador Retriever (2), Mops (1), Hungarian Pointer (2), Pumi (1), Beagle (1), Boxer (1), Bichon Havanese (1), English Cocker Spaniel (1), Dachshund (1), Spitz (1), Hungarian Greyhound (1).
The remaining 10 dogs had secondary, symptomatic epilepsy. They have certain pathological changes of the brain: brain tumor (4), hydrocephalus (2), hippocampal sclerosis (1), Chiari-like malformation (1), frontal lobe atrophy (1) and encephalitis (1). In our study epilepsy (p<0.05) and idiopathic incidence of it is independent of age, while symptomatic males show weak correlation (r=0.14, p<0.05), symptomatic females correlated moderately strongly (r=0.21, p<0.05).
4. DISCUSSION
In comparison to the international literature our findings are partially similar to them: In case of idiopathic epilepsy in the majority of the cases the dog’s first seizure occurs
between the ages of one to three years. Even if the diagnostic method (MRI) was performed later, the patients had the first symptoms at the previous mentioned age range. This fact could be the reason, that we found no correlation between the age of the animals and the incidence of idiopathic epilepsy.
In 40% of Labrador and Golden Retrievers the dogs are older than 3 years old when they have their first seizure. In the present study with our two cases (Labrador Retrievers) we didn’t realize this statistical statement.
In the majority of our cases the breeds are among the more often affected breeds like Cocker Spaniel and Dachshund, or even a genetic basis has been determined like at Labrador Retriever, Hungarian Pointer (Vizsla), Beagle and Boxer.
In our results we found a higher incidence of idiopathic epilepsy (67%) than in the literature (50%) (JAGGY 2010).
There are no data in the literature according to the correlation between the age and sex of patients having secondary epilepsy. In general—mainly in case of tumors—there is a higher incidence of symptomatic epilepsy in elderly—over 5 years—dogs. Our statistical results about correlation with sex and age of affected dogs could be a coincidence because of the few number of dogs taking part in the study.

Science for Sustainability University of West Hungary International Scientific Conference for PhD Students March 19-20, 2013 – Győr
374
5. CONCLUSION
To explore the etiology of the epileptic symptoms—whether epilepsy is idiopathic/primary or symptomatic/secondary—is very important. On the one hand it is essential regarding the therapy and the follow up, on the other hand idiopathic epilepsy is an interesting ethical question concerning the breeding of the affected dogs. In making the correct diagnosis the only and gold standard method is MRI.
References JAGGY, A. – BERNARDINI, M. (1988): Idiopathic epilepsy in 125 dogs: a long-term study. Clinical and
electro-encephalic findings. Journal of Small Animal Practice 39(1): 23-29. JAGGY, A. – PLATT, S. R (2010): Small Animal Neurology. Schlütersche, Hannover. 446-453. KATHMANN, I. – JAGGY, A. (2003): Idiopathische oder symptomatische Epilepsie? Der praktische Tierarzt
84(8): 588-593. KATZ, L. M. – KHAN, S. – AWANO, T. – SHAHID, A. S. – SIAKOTOS, N. A. – JOHNSON, S. G. (2005): A
mutation in the CLN8 gene in English Setter dogs with neuronal ceroid-lipofuscinosis. Biochemical and Biophysical Research Communications 327(2): 541-547.
KISS, G. (2008): Kutyák epilepsziáiról mindenkinek. Lélekben Otthon, Budapest. 176. KUDIN, P. A. – ZSURKA, G. – ELGER, E. C. – KUNZ, S. W. (2009): Mi tochondrial involvement in temporal
lobe epilepsy. Experimental Neurology 218(2): 326-332. MELVILLE, A. S. – WILSON, L. C. – CHIANG, S. C. – STUDDERT, P. V. – LINGAAS, F. – WILTON, N. A.
(2005): A mutation in canine CLN5 causes neuronal ceroid lipofuscinosis in Border collie dogs. Genomics 86(3): 287-294.
OLSON, P. N. (2007): Using the canine genome to cure cancer and other diseases. Theriogenology 68(3): 378-381.
OLSON, P. N. – HALL, M. F. – PETERSON, K. J. – JOHNSON, S. G. (2004): Using genetic technologies for promoting canine health and temperament. Animal Reproduction Science 82-83: 225-230.
SHAHWAN, A. – FARREL, M. – DELANTY, N. (2005): Progressive myoclonic epilepsies: a review of genetic and therapeutic aspects. Lancet Neurology 4(4): 239-248.
SMITH, P. M. – TALBOT, C. E. – JEFFERY, N. D. (2008): Findings on low-field cranial MR image sin epileptic dogs that lack interictal neurological deficits. The Veterinary Journal 176(3): 320-325.
van HAGEN, E. A. M. – JANSS, G. L. L. – BROEK, van den J. – KNOL, W. B. (2004): The use of a genetic-counselling prgram by Dutch breeders for four hereditary health problems in boxer dogs. Preventive Veterinary Medicine 63(1-2): 39-50.
WIERSMA-AYLWARD, A. (1995): Canine Epilepsy. URL: http://www.k9web.com/dog-faqs/medical/epilepsy.html Download: 20.03.2010.
Vocalization and Welfare
PETRYNKA, Monika – KLOCEK, Czesław
University of Agriculture, Department of Swine and Small Ruminant Breeding, Krakow, Poland Abstract - Different emotional states and moods of animals might be accompanied by specific behaviors. One of the ways of communication and to expressing emotions may be vocalization. It is the active generation of sound from special organs, which is an expression of animal’s inner state and can occur spontaneously or can be associate witch certain event (Grandin, 1998). Vocalization in animals’ life play an important role in the communication process and it evolved as a signal use to indicate some types of “need”.
Sounds made by animals are produced on the basis of a-priori knowledge (that develop during ontogeny and may or may not be changed under the influence of experience). Similarly, the receiver

Science for Sustainability University of West Hungary International Scientific Conference for PhD Students March 19-20, 2013 – Győr
375
(mainly an animal of the same species) is thought to have an innate knowledge of whether and how to react on various signals. Vocalization in livestock did not change much during the process of domestication, although some of the signals might have disappeared. Still occurrence of vocalization is associated with appearance of strong, important to communicate factor, such as fear, pain, hunger or sexual drive. In addition, the sounds are sent with at high speed and almost completely resistant to the obstacles encountered on the way. Therefore they are ideal carriers for signals that are sent in order to alarm distance receivers, keep in contact with the group or attract the attention of conspecifics over large distance (Dawkins, 1998).
The analysis of farm animal vocalization has gained increasing interest in recent years. More and more precise techniques of annimals’ sound analysis enable a deeper understandings of their meaning and might provide us with clues about animal’s well-being and thus allow us to use vocalization to assess the level of welfare. Morton (1997) observed that high-pitch sounds occur in situations associated with fear, while the low and sharp are assigned to more aggressive emotions. Although there are evidence to support this assertion (Seyfarth and Cheney, 2003) there is still a need to conduct thorough research, which could provide us the appropriate tools for the farm animals’ welfare assessment.
Keywords: welfare / livestock / vocalization
For animals, stress is a routine part of life and occurs in the context of social dynamics (feeding, mating, aggressive interactions) and coping with the environment (heat, cold and novel environmental situations).Moreover the development of large-scale animal production systems has stimulated debate concerning its impact on animal/human health, environmental effects and concerns for the ethical care of animals. Safeguarding animal welfare and health is good for animals but also for meat producers and the animal-conscious public. In a very tangible way, the future of animal production depends on effectively addressing the public’s concerns regarding the health and welfare of the animals under our care. A good place to start is by improving our understanding of the biology behind animal behavior and welfare and facilitate the tools for the farm animals’ welfare assessment (KITTAWORNART and ZIMMERMAN 2011).
Different emotional states and moods of animals might be accompanied by specific behaviors. One of the ways of communication and to expressing emotions may be vocalization. It is the active generation of sound from special organs, which is an expression of animal’s inner state and can occur spontaneously or can be associate witch certain event (GRANDIN 1998). Vocalization in animals’ life play an important role in the communication process and it evolved as a signal use to indicate some types of “need” (WHITTEMORE 1993). Certain sounds have clearly determined functions for example the sow’s grunting that occurs during milk letdown (WHITTEMORE 1993), and other forms of communication between piglets and their dams (HUTSON et al. 1992; WEARY et al., 1996). Sounds made by animals are produced on the basis of a-priori knowledge (that develop during ontogeny and may or may not be changed under the influence of experience). Similarly, the receiver (mainly an animal of the same species) is thought to have an innate knowledge of whether and how to react on various signals. Vocalization in livestock did not change much during the process of domestication, although some of the signals might have disappeared. Still occurrence of vocalization is associated with appearance of strong, important to communicate factor, such as fear, pain, hunger or sexual drive. In addition, the sounds are sent with at high speed and almost completely resistant to the obstacles encountered on the way. Therefore they are ideal carriers for signals that are sent in order to alarm distance receivers, keep in contact with the group or attract the attention of conspecifics over large distance (DAWKINS 1998).
Vocal communication between members of a species is widespread among animals and numerous species of vertebrates and invertebrates use vocalizations for seeking mates (SEBEOK 1977). The common technique for studying intraspecies communication is to playback natural sounds to an animal to determine its unconditioned response to those sounds. This technique has been used with farm animals by making use of the vocal interactions between mothers and their
Science for Sustainability University of West Hungary International Scientific Conference for PhD Students March 19-20, 2013 – Győr
376
offspring. These studies have demonstrated that sows respond more vigorously to the vocalizations of piglets that are hungry (because such piglets themselves vocalize more vigorously) that female sheep respond differentially to the bleats of their own newborn lambs, and that calves, piglets and chicks respond differentially to their own mothers’ vocalizations (BARFIELD et al. 1994; KENT 1987; WALSER 1986; WEARY et al. 1996). Also auditory signals are very important type of communication between animals because for example sows will crush models of piglets that provide only visual and tactile cues but do not squeal like a real piglet (HUTSON et al. 1991).
In farm animals various vocalizations may supply us with hints on their well-being in an easy way, given that the meanings of the respective utterances and their relations to well-being or impaired welfare are well-established. We will be able, then, to judge current needs and impaired welfare of the animals by non-invasive, possibly even automatized monitoring in farm-housing. For these reasons, the analysis of farm animal vocalization has gained increasing interest in recent years. Hence, a variety of attempts have been made to elucidate the information which farm animals give us when vocalizing (MANTEUFFEL et al. 2004). For example research has indicated that pain-related call types in piglets can be identified. Screaming, a call type that differs significantly from two other characteristic call types of piglets increases when the piglet is suffering pain. Parameters of energy emission, frequency and call duration are particularly appropriate to characterise call types (MARX et al. 2003). Emotions and mood do not only actively initialize sound production but are sometimes also modulated by sound perception. In susliks and reindeer itwas demonstrated that species vocalizations are able to modify the heart rate, especially if further visual information was lacking (MOVCHAN 1996). In the degu (Octodon degu) maternal vocalization lead to significant metabolic increases in emotionally relevant brain areas, such as the anterior cingulate cortex (BRAUN and POEGGEL 2001). These results demonstrate that communicated vocalizations are, in principle, able to modulate emotions of the receivers. It will be important to pay attention to this aspect as well, because welfare may also be affected in animals hearing conspecific distress calls, e.g., in an abattoir. It is obvious that calls uttered in stressful situations may be significant for indicating negative states of welfare. Consequently, the majority of the bioacoustical studies in animals, for example pigs has tried to find characteristic calls or call features consistently associated with such situations. Especially several management and handling procedures were used to identify intrinsic welfare risks. Social isolation (WEARY et al., 1997), various stages of the castration procedure of male piglets (SCHÖN et al. 2001; TAYLOR et al., 2001) and weaning (WEARY et al., 1999) caused high call rates each with high frequency (>1 kHz), duration and amplitude. Aspectrographic study of XIN et al. (1989) demonstrated that in a production environment several types of pig vocalizations can be distinguished. There, eight situations were examined that resulted in different types of grunting and screaming. According to an analysis including evaluations of duration, fundamental and resonance frequencies, and tonal spectral profile it was suggested that vocalizations with longer duration and higher frequency contents were indicative of more severe stress, but this was not validated physiologically.
With increasing interest in measures of welfare “from the animal’s point of view” the study of vocalizations of cattle is still in the focus of interest. WATTS and STOOKEY (2000) have suggested that the vocal behaviour of cattle is a potentially useful indicator of their physiological and psychological functioning. But it should be noted that many aspects of the communicative function as well as the endogenous and exogenous causes of the vocal behaviour are rather poorly understood (WATTS and STOOKEY 2000) and that a considerable individual variability in vocal response may complicate a clear evaluation concerning welfare (WATTS et al. 2001). Brief periods of social isolation in unfamiliar surroundings seem to be stressful to cows as both are accompanied by an increased incidence of high-frequency vocalization and paralleled by activation of the hypothalamic–pituitary–adrenocortical axis (RUSHEN et al. 1999). THOMAS et al. (2001) demonstrated that some variations in the vocal response of calves to weaning and separation (e.g., an increase of incidence and fundamental frequency) were also correlated to milk deprivation.

Science for Sustainability University of West Hungary International Scientific Conference for PhD Students March 19-20, 2013 – Győr
377
This indicates that vocal utterances of calves can include information on general needs like feed and less distressing housing.
As well as their role in communication between animals, vocalizations can aid our understanding of their arousal state and cognitive abilities (MANTEUFFEL et al. 2004). The analysis of farm animal vocalization has gained increasing interest in recent years. More and more precise techniques of annimals’ sound analysis enable a deeper understandings of their meaning and might provide us with clues about animal’s well-being and thus allow us to use vocalization to assess the level of welfare. The best way to unravel the meaning of various animal utterances will be to find their specific physiological and perceptual causations. Hence, in order to go towards a deeper understanding of the inner causes of vocalization we should look for their neurobiological and perceptual sources (MANTEUFFEL et al. 2004). MORTON (1997) observed that high-pitch sounds occur in situations associated with fear, while the low and sharp are assigned to more aggressive emotions. Although there are evidence to support this assertion (SEYFARTH and CHENEY, 2003) there is still a need to conduct thorough research, which could provide us the appropriate tools for the farm animals’ welfare assessment. The development of an automatic classification of call types would be useful as a tool to compare stress situations for animals by an objective measurement. This could contribute to objective animal welfare assessment. References: BARFIELD, C. H. – TANG-MARTINEZ, Z. – TRAINER, J. M. (1994): Domestic calves (Bos taurus) recognize their
own mothers by auditory cues. Ethology 97, 257–264. BRAUN, K. – POEGGEL, G. (2001): Recognition of mother’s voice evokes metabolic activation in the medial
prefrontal cortex and lateral thalamus of Octodon degus pups. Neuroscience 103, 861–864. DAWKINS, M. S. (1998): Evolution and animal welfare. Q. Rev. Biol. 73, 305–328. GRANDIN, T. (1998): The feasibility of using vocalization scoring as an indicator of poor welfare during cattle
slaughter. Appl. Anim. Behav. Sci. 56, 121–128. HUTSON, G. D. – DICKENSON, L. G. – LUXFORD, B. G. (1991): The response of lactating sows to tactile, visual and
auditory stimuli associated with a model piglet. Applied Animal Behaviour Science 32, 129-137. HUTSON, G. D. (1992) A comparison of operant responding by farrowing sows for food and nest-building
materials. Applied Animal Behaviour Science 34, 221-230. KENT, J. P., (1987): Experiments on the relationship between the hen and chick Gallus gallus: the role of the
auditory mode in recognition and the effects of maternal separation. Behaviour 102, 1–14. KITTAWORNART, A. – ZIMMERMAN, J. (2011): Toward a better understanding of pig behavior and pig welfare.
Anim Health Res Rev. 12(1):25-32. MANTEUFFEL, G. – PUPPE, B. – SCHÖN, P. C. (2004): Vocalization of farm animals as a measure of welfare.
Applied Animal Behaviour Science 88, 163-182 MARX, G. – HORN, T. – THIELEBEIN, J. – KNUBEL, B. – VON BORELL, E. (2003): Analysis of pain-related
vocalization in young pigs; Journal of Sound and Vibration 266: 687–698. MORTON, E. S. (1977): On the occurrence and significance of motivation-structural rules in some birds and
mammals sound. Am. Nat. 111, 855–869. MOVCHAN, V. N., 1996. Influence of various types of species-specific acoustic signals on the heart rate of
mammals. Neurosci. Behav. Physiol. 26, 295–300. RUSHEN, J. – BOISSY, A. – TERLOUW, E. M. C. – DE PASSILLÉ, A. M. B. (1999): Opioid peptides and behavioural and
physiological responses of dairy cows to social isolation in unfamiliar surroundings. J. Anim. Sci. 77, 2918– 2924.
SCHÖN, P. C. – PUPPE, B. – MANTEUFFEL, G. (2001): Linear prediction coding analysis and self-organizing feature map as tools to classify stress calls of domestic pigs (Sus scrofa). J. Acoust. Soc. Am. 110, 1425–1431.
SEBEOK, T. A. (1977): How Animals Communicate. Indiana Univ. Press, Bloomington, IN. SEYFARTH, R. M. – CHENEY, D. L. (2003): Signalers and receivers in animal communication. Annu. Rev.
Psychol. 54, 145–173. TAYLOR, A. A. – WEARY, D. M. – LESSARD, M. – BRAITHWAITE, L. (2001): Behavioural responses of piglets to
castration: the effect of piglets age. Appl. Anim. Behav. Sci. 73, 35–43.

Science for Sustainability University of West Hungary International Scientific Conference for PhD Students March 19-20, 2013 – Győr
378
THOMAS, T. J. – WEARY, D. M. – APPLEBY, M. C. (2001): Newborn and 5-week-old calves vocalize in response to milk deprivation. Appl. Anim. Behav. Sci. 74, 165–173.
WALSER, E. E. S. (1986): Recognition of the sow’s voice by neonatal piglets. Behaviour 99, 177–188. WATTS, J. M. – STOOKEY, J. M. (2000): Vocal behaviour in cattle: the animal’s commentary on its biological
processes and welfare. Appl. Anim. Behav. Sci. 67, 15–33. WATTS, J. M. – STOOKEY, J. M. – SCHMUTZ, S. M. – WALTZ, C. S. (2001): Variability in vocal and behavioural
responses to visual isolation between full-sibling families of beef calves. Appl. Anim. Behav. Sci. 70, 255–273.
WEARY, D. M. – LAWSON, G. L. – THOMPSON, B. K. (1996): Sows show stronger responses to isolation calls of piglets associated with greater levels of piglet need. Animal Behaviour 52, 1247-1253
WEARY, D. M. – ROSS, S. – FRASER, D. (1997): Vocalizations by isolated piglets: a reliable indicator of piglet need directed towards the sow. Appl. Anim. Behav. Sci. 53, 249–257.
WEARRY, D. M. – APPLEBY, M. C. – FRASER, D. (1999): Responses of piglets to early separation from the sow. Appl. Animl. Behav. Sci. 63, 289–300.
WHITTEMORE, C. (1993): The Science and Practice of Pig Production, Harlow, UK: Longman XIN, H. – DESHAZER, J. A. – LEGER, D.W. (1989): Pig vocalizations under selected husbandry practices. Trans.
ASAE 32, 2181–2184.
Effect of Various Additives on Fermentation Quality, Microbiological Composition and Aerobic
Stability of Corn Silages
PYŚ, Jan B.a – SZAŁATA, Arkadiusz a* – KARPOWICZ, Agataa – GRZYB, Jacek b
aDepartment of Animal Nutrition and Feed Management, bDepartment of Microbiology, University of Agriculture in Krakow, Poland
* Corresponding author: [email protected], Al. Mickiewicza 24/28, 30-059 Kraków Abstract - The experiment was carried out to determine effect of addition of rape seed meal, bacterial or bacterial-chemical inoculants or chemical preservative on fermentation quality, aerobic stability and microbiological composition of whole-plant maize silages. Silages with additives resulted in lower (P <0.05) amount of N-NH3, ethanol and lactic acid, in comparison to control variant. Silages with additives was also absent in butyric acid. Silages shown aerobic stability for a period from 33 hours (control variant) to 131 hours. No molds were observed after opening the containers with silages with additives. The smallest number of Clostridium bacteria, yeasts and fungi (after opening the containers and after exposure to oxygen) was present in silage with Lactobacillus buchneri and potassium sorbate addition. Corn silage with rapeseed meal addition, in composition with bacteria Lactobacillus buchneri and potassium sorbate, allowed to obtain the best quality of silage fermentation, the longest aerobic stability and the smallest number of Clostridium bacteria, yeasts and molds.
Keywords: maize / lactic acid bacteria / rapeseed meal / Lactobacillus buchneri / propionic acid.
1. INTRODUCTION
Maize is a fundamental feed used in the feeding of dairy cattle. The quality of maize silage has a direct impact on the health and performance of animals, for example rates reproduction of and milk production efficiency. Corn is a raw material relatively easy to ensiling but silage is susceptible to aerobic fermentation after opening the silo. The reason is contamination of corn plants by yeast and molds during the growing season and the high content of lactic acid and

Science for Sustainability University of West Hungary International Scientific Conference for PhD Students March 19-20, 2013 – Győr
379
carbohydrates in silage (CLARKE 1998). Increase of aerobic stability in corn silage can be obtained by ensiling forage with heterofermentative lactic acid bacteria (with or without organic acid salts), organic acids and their salts and rapeseed meal (DRIEHUS et al. 1999).
2. MATERIAL AND METHODS
Corn (variety PR39F58, FAO 260, dry matter 315.5 g·kg-1, particles 10-15 mm) was ensiled without any addition - K0 and with the addition: rapeseed meal (SPR) 50 g·kg-1 forage - K1; SPR and Lactobacillus buchneri (1.5 x 10⁵ cfu·g-1 of mixture) - K2, SPR and L. buchneri (1.5 x 10⁵ cfu·g-1 mixture), and potassium sorbate (5 g·kg-1 mixture ) - K3, SPR and chemical additive (formic acid - 59%, propionic acid - 20%, ammonium formate - 4.3% potassium sorbate - 2.5% dose - 5 ml·kg-1 of mixture) - K4 . Silage was stored in 120 l tanks at 15±2°C for 60 days. The pH of the silage and the content of N-NH 3, ethanol, acids - lactic (LA), acetic acid (AA), propionic (PA), butyric acid (BA) was determined (AOAC 2000). Aerobic stability of silages was estimated during 7.day test at 20±1°C (HONIG 1985, 1990). After opening the containers and after exposure to oxygen, the number of lactic and acetic acid bacteria, Clostridium, yeasts and molds was determined: number of lactic acid bacteria was determined in silages - after 48 hours of incubation in temperature 28oC on broth agar with lactose and chinese blue medium (Biolacta Texel-CRhodia). Number of acetic acid bacteria was determined after 48 hours of incubation in temperature 28oC on Henneberg`s medium, Clostridium - after 48 hours of incubation in anaerobic conditions, in temperature 28oC on selective medium Clostridium pasteurianum and total yeast and mould fungi number - after 72 hours of incubation on Czapek-Dox medium (Fluka) (ATLAS - PARKS 1997). The results of microbiological analyzes were statistically evaluated using one-way analysis of variance and Tukey `s test, with computer program SAS version 8.2 (SAS 2001).
3. RESULTS AND DISCUSSION
Fermentation parameters and aerobic stability of maize silages are shown in Table 1. The silage K1, K2, K3 and K4 resulted in lower (P<0.05) amount of N-NH 3, ethanol and LA, in comparison to K0. The silage K1, K2, K3 and K4 was absent in BA which is probably caused by bactericidal activity of chemical preparations (KLEINSCHMIT et al. 2006). Silages shown aerobic stability for a period of: K0-33, K1-69, K2-85, K3-131 and K4-81 hours - high aerobic stability of silage K3 was probably caused by presence of potassium sorbate and other active compounds produced by Lactobacillus buchneri bacteria (RANJIT - KUNG 2000, HOLZER et al. 2003, FILYA et al. 2006). Silage K3 contained the greatest AA and PA due to the presence of this acid in additive. No molds were observed after opening the containers with silage K1, K2, K3 and K4. Such effect may be the result of presence lactic acid, acetic acid and other active compounds produced by bacteria from inoculants which strongly reduce growth and development of undesirable microorganisms (RANJIT et al. 2002). Microbiological composition (log CFU⋅g-1 fresh matter) of maize silages are shown in table 2. The smallest number of Clostridium bacteria, yeasts and fungi (after opening the containers and after exposure to oxygen) was present in silage K3, which is probably caused by the presence of potassium sorbate, which is characterized by strong antifungal properties (KLEINSCHMIT et al. 2005). The greatest number of lactic acid bacteria (after opening the silo and after exposure to oxygen) was observed in silage K0 where - according to cited authors - high values of pH allowed growth of undesirable microorganisms; such silage is dangerous to animals because of the possibility of poisoning caused by harmful fungal mycotoxins (CLARKE 1998).
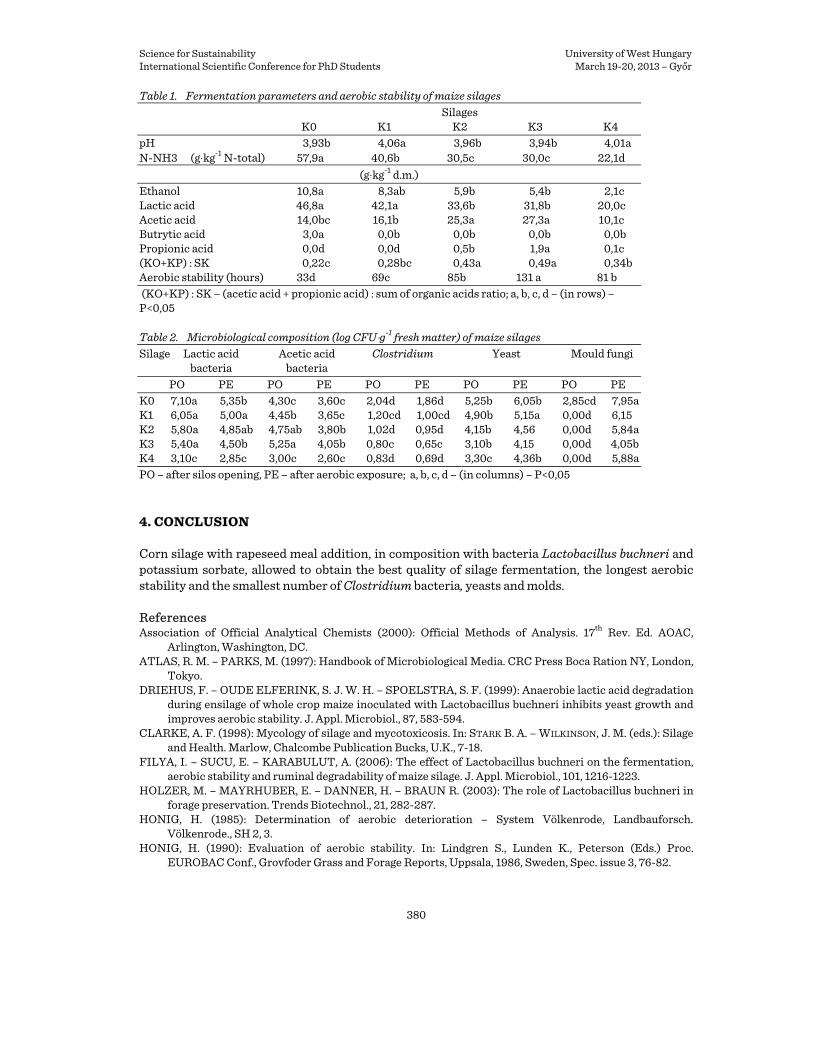
Science for Sustainability University of West Hungary International Scientific Conference for PhD Students March 19-20, 2013 – Győr
380
Table 1. Fermentation parameters and aerobic stability of maize silages Silages K0 K1 K2 K3 K4 pH 3,93b 4,06a 3,96b 3,94b 4,01a N-NH3 (g⋅kg-1 N-total) 57,9a 40,6b 30,5c 30,0c 22,1d
(g⋅kg-1 d.m.) Ethanol 10,8a 8,3ab 5,9b 5,4b 2,1c Lactic acid 46,8a 42,1a 33,6b 31,8b 20,0c Acetic acid 14,0bc 16,1b 25,3a 27,3a 10,1c Butrytic acid 3,0a 0,0b 0,0b 0,0b 0,0b Propionic acid 0,0d 0,0d 0,5b 1,9a 0,1c (KO+KP) : SK 0,22c 0,28bc 0,43a 0,49a 0,34b Aerobic stability (hours) 33d 69c 85b 131 a 81 b (KO+KP) : SK – (acetic acid + propionic acid) : sum of organic acids ratio; a, b, c, d – (in rows) – P<0,05 Table 2. Microbiological composition (log CFU⋅g-1 fresh matter) of maize silages Silage Lactic acid Acetic acid Clostridium Yeast Mould fungi bacteria bacteria PO PE PO PE PO PE PO PE PO PE K0 7,10a 5,35b 4,30c 3,60c 2,04d 1,86d 5,25b 6,05b 2,85cd 7,95a K1 6,05a 5,00a 4,45b 3,65c 1,20cd 1,00cd 4,90b 5,15a 0,00d 6,15 K2 5,80a 4,85ab 4,75ab 3,80b 1,02d 0,95d 4,15b 4,56 0,00d 5,84a K3 5,40a 4,50b 5,25a 4,05b 0,80c 0,65c 3,10b 4,15 0,00d 4,05b K4 3,10c 2,85c 3,00c 2,60c 0,83d 0,69d 3,30c 4,36b 0,00d 5,88a PO – after silos opening, PE – after aerobic exposure; a, b, c, d – (in columns) – P<0,05
4. CONCLUSION
Corn silage with rapeseed meal addition, in composition with bacteria Lactobacillus buchneri and potassium sorbate, allowed to obtain the best quality of silage fermentation, the longest aerobic stability and the smallest number of Clostridium bacteria, yeasts and molds. References Association of Official Analytical Chemists (2000): Official Methods of Analysis. 17th Rev. Ed. AOAC,
Arlington, Washington, DC. ATLAS, R. M. – PARKS, M. (1997): Handbook of Microbiological Media. CRC Press Boca Ration NY, London,
Tokyo. DRIEHUS, F. – OUDE ELFERINK, S. J. W. H. – SPOELSTRA, S. F. (1999): Anaerobie lactic acid degradation
during ensilage of whole crop maize inoculated with Lactobacillus buchneri inhibits yeast growth and improves aerobic stability. J. Appl. Microbiol., 87, 583-594.
CLARKE, A. F. (1998): Mycology of silage and mycotoxicosis. In: STARK B. A. – WILKINSON, J. M. (eds.): Silage and Health. Marlow, Chalcombe Publication Bucks, U.K., 7-18.
FILYA, I. – SUCU, E. – KARABULUT, A. (2006): The effect of Lactobacillus buchneri on the fermentation, aerobic stability and ruminal degradability of maize silage. J. Appl. Microbiol., 101, 1216-1223.
HOLZER, M. – MAYRHUBER, E. – DANNER, H. – BRAUN R. (2003): The role of Lactobacillus buchneri in forage preservation. Trends Biotechnol., 21, 282-287.
HONIG, H. (1985): Determination of aerobic deterioration – System Völkenrode, Landbauforsch. Völkenrode., SH 2, 3.
HONIG, H. (1990): Evaluation of aerobic stability. In: Lindgren S., Lunden K., Peterson (Eds.) Proc. EUROBAC Conf., Grovfoder Grass and Forage Reports, Uppsala, 1986, Sweden, Spec. issue 3, 76-82.

Science for Sustainability University of West Hungary International Scientific Conference for PhD Students March 19-20, 2013 – Győr
381
KLEINSCHMIT, D. H. – KUNG L. Jr. (2006): The effects of Lactobacillus buchneri 40788 and Pediococcus pentosaceus R1094 on the fermentation of corn silage. J. Dairy Sci., 89, 3999-4004.
KLEINSCHMIT, D. H. – SCHMIDT, R. J. – KUNG, L. Jr. (2005): The effects of various antifungal additives on the fermentation and aerobic stability of corn silage. J. Dairy Sci., 88, 2120-2139.
RANJIT, N. K. – KUNG, L. Jr. (2000): The effect of Lactobacillus buchneri, Lactobacillus plantarum or a chemical preservative on the fermentation and aerobic stability of corn silage. J. Dairy Sci., 83, 526-535.
RANJIT, N. K. – TAYLOR C. C. – KUNG, L. Jr. (2002): Effect of Lactobacillus buchneri 40788 on the fermentation, aerobic stability and nutritive value of maize silage. Grass Forage Sci., 57, 73-81.
SAS (2001): SAS/STAT Users Guide (Release 8.2). SAS Inst. Inc. Cary, NC.
The Fauna of Thrips (Thysanoptera) Occurring in Carrot Cultivation
GABORSKA, Małgorzata29 – ŁUCZAK, Irena
Department of Plant Protection, University of Agriculture, Krakow, Poland Abstract – The research works determining the species composition of thrips and their number in relation to the new hybrid varieties of carrots were carried out in 2010–2011. The seeds of 10 carrot varieties were sown in triplicate. Experiments included microscopic analysis of plants collected from plots and collection of thrips using entomological sweep-net. The most numerous Thysanoptera species were: predatory Aeolothrips intermedius Bagnall and phytophagous Thrips tabaci Lindemann. The varieties that were most numerous settled by thrips were: Deep Purple F1 cv. and Kongo F1 cv.
Keywords: thrips / carrot / Thysanoptera / varieties
1. INTRODUCTION
The thrips (Thysanoptera) are insects often noticed in horticultural cultivations. Available literature concerns the existence of this group of arthropods in cultivations such as leek (KUCHARCZYK – LEGUTOWSKA 2001), onion (Richter et al., 1999), cabbage (SHELTON et al., 1988, LEGUTOWSKA 1997), pea (POBOŻNIAK 2009, POBOŻNIAK – GABORSKA 2010). So far, there are no research, discussing the occurrence of thrips on carrot. The aim of this study was to determine the species composition of Thysanoptera occurring in the cultivation of carrots and their numbers in relation to the new hybrid varieties of this vegetables.
2. MATERIALS AND METHODS
The research works were conducted during the period 2010–2011 in the Experimental Station of the University of Agriculture in Krakow, located in Mydlniki near Krakow. The study included 10 new hybrid varieties of carrot. The varieties were originated from three seeding company. These were cultivars: Rumba F1 and Samba F1 from the company “Krakowska Hodowla i Nasiennictwo Ogrodnicze Polan sp. z o.o.”, cultivars: Kongo F1 and Afro F1 from the company “PlantiCo Hodowla i Nasiennictwo Ogrodnicze Gołębiew sp. z o.o.” and cultivars: Kazan F1, Napa F1, Nipomo F1, Deep 29 Corresponding author: [email protected], 31-425 Krakow Al 29 Listopada 54

Science for Sustainability University of West Hungary International Scientific Conference for PhD Students March 19-20, 2013 – Győr
382
Purple F1, Yellowstone F1 and White Satin F1 from company Bejo Zaden Poland sp z o.o. The carrot seeds were sown in 3rd week of April into the 6-row plots of 10 m2 area (4 x 2,5 m). Each cultivar were planted in three repetition. The first analysis was made at the end of May and they were cunducted periodically to the September.
Thrips were collected by two methods. The first method was based on counting and thrips present on ten plants were randomly collected from each plot and analyzed under a stereoscopic microscope. Such analyzes were performed at weekly intervals. The second method consisted of trapping thrips using entomological sweep-net. In each plot were made 25 catching movements. The material was preserved in alcohol. Then in laboratory the microscopic preparations were performed according to the method described by ZAWIRSKA (1994). The preparations were examined by microscope. The individuals were classified to species using the keys of ZAWIRSKA (1994) and STRASSEN (2003). To determine species domination was used the scale proposed by KASPRZAK and NIEDBAŁA (1981) according to the formula:
D = N/n × 100% where: N – number of specimens of each single thrips species n – number of all collected thrips
3. RESULTS
During all the analysis were collected 1166 individuals of thrips including 1076 adults and 90 larvae. During the analysis of carrot plants from plots 94 speciments of thrips were collected, and 1072 individuals were trapped in sweep-net analysis (Table 1). Table 1. Number of thrips collected from carrot in 2010-2011
Species Sweep-net analysis
Sample analysis
Total Class of domination*
Aeolothrips intermedium Bagnall 394 3 397 D5 Anaphothrips obscurus Müller 61 0 61 D3 Chirothrips manicatus Haliday 17 1 18 D2 Frankliniella intonsa Trybom 71 0 71 D3 Haplothrips aculeatus Fabricius 15 2 17 D2 Limothrips denticornis Haliday 51 0 51 D2 Neohydatothrips abnormis Karny 2 0 2 D1 Odontothrips loti Haliday 5 0 5 D1 Thrips atratus Haliday 30 0 30 D2 Thrips flavus Schrank 1 0 1 D1 Thrips fuscipennis Haliday 118 3 121 D4 Thrips major Uzel 1 0 1 D1 Thrips physapus Linnaeus 1 0 1 D1 Thrips tabaci Lindemann 224 73 297 D5 Thrips validus Uzel 1 0 1 D1 Stenothrips graminium Uzel 2 0 2 D1 Larvae 78 12 90 Total 1072 94 1166
*D5 – > 20% (eudominants), D4 – 10,1-20% (dominants), D3 – 5,1-10% (subdominants), D2 – 1,1-5% (recedents), D1 – < 1,0% (subrecedents) (KASPRZAK – NIEDBAŁA 1981)
The collected thrips were classified to 16 species. Of all the caught species were the most numerous represented was predatory Aeolothrips intermedius Bagnall. The most abundant herbivorous species (and also the second largest number) was Thrips tabaci Lindemann. However, among thrips collected from the tested plant T. tabaci was definitely dominated. Both of these

Science for Sustainability University of West Hungary International Scientific Conference for PhD Students March 19-20, 2013 – Győr
383
species was classified as eudominants. The high number was also of Thrips fuscipennis Haliday, classified as dominant. Quite frequently occured floricolous species Frankliniella intonsa Trybom and related to grasses Anaphotrips obscurus Müller – these two species have been identified as subdominants. Other species belong to the class subrecedents or recedents, which means that their participation does not exceed 5% of the total number of adult thrips (Table 1).
The most often inhabited by thrips was cultivar Deep Purple F1. This variety has a purple tinge of root and dark-green leaves discolorated to violet leaves. During all analysis from the Deep Purple F1 cv. caught a 164 individuals of thrips (imago and larvae). Slightly less of thrips were collected from plants of Kongo F1 cv. – the variety having classic color of roots. Quite numerous thrips were also trapped from the Napa F1 cv. Also noteworthy are two varieties: Yellowstone F1 and White Satin F1, from which the least number of thrips were found - respectively 64 and 73 individuals. These varieties are characterized by bright tinge of foliage and yellow (Yellowstone F1 cv.) and white (White Satin F1 cv.) roots. The number of thrips collected from remained cultivars achieved similar, the average level (Figure 1).
Figure 1. Number of thrips collected from carrot cultivars
4. DISCUSSION
SZWEJDA (2002) concluded that insects of the order Thysanoptera are pests whose populations are numerous in vegetable cultivations. KUCHARCZYK et al. (2006) indicates that this insects are particularly harmful for crops of vegetables due to transmission of viral diseases. However, in the available literature, no specific data concerning the research on occurrence of thrips in carrot cultivation was given. In most of the papers discussing the presence of this group of insects on the various cultivated plants, carrots is only mentioned as a host plant for thrips.
The occurrence of Thrips tabaci on carrot was recorded by SAKIMURA (1938). ZAWIRSKA (1994) mentioned carrots as one of the host plants for the onion thrips (T. tabaci). KUCHARCZYK – LEGUTOWSKA (2001) conducted a research on leek cultivated in interrcropping with two other species of plants, including the carrot. The aim of their study was to reduce the number of T. tabaci

Science for Sustainability University of West Hungary International Scientific Conference for PhD Students March 19-20, 2013 – Győr
384
in the leek cultivation. The authors concluded that that the cultivation a leek intercropping with carrot can reduce the size of the onion thrips population. However, in our study Thrips tabaci was the most abundant species of phytophagous thrips, which may indicate that carrots cultivated in monoculture is an attractive host plant for this insect.
Attention should be paid to the very numerous occurrence of predatory species Aeolothrips intermedius. ZAWIRSKA (1994) states that both adults and larvae of this species are predators of other thrips, aphids and eggs of another small insects. TRDAN et al. (2005) and the other authors cited by them conducted A. intemedius as a predator of T. tabaci. Therefore, it can be concluded that the high abundance of prey species is related to the abundance of the predatory species. In addition, the authors cited above also mentioned A. intermedius as a predator of aphids, which occur in large populations on carrot cultivation (SZWEJDA – WRZODAK 2007, ŁUCZAK 2007, ŁUCZAK – GABORSKA 2012). TRDAN et al. (2005) emphasized out that there is still not enough evidence to clearly determine whether is possibility of using of A. intermedius in biological pest control. However, the large number of this species in carrot cultivation, allows hope that in the future it will be possible.
For carrot breeders, it seems to be important information about the uneven settling of different varieties of this vegetable by thrips. In the future, this will allow them to select the cultivars less attractive to these harmful insects.
5. CONCLUSIONS
1. The Thysanoptera settled all tested cultivars of carrot, however, to varying degrees. 2. The most numerous species of thrips were: the predatory Aeolothrips intermedius and
phytophagous Thrips tabaci. 3. The most widely populated by Thrips were two varieties of carrots: Deep Purple F1 with
purple roots and dark, discolorated to violet leaves and the Kongo F1 cv. with classic color of roots
4. The least number of thrips occurred on this cultivars of carrot, which characterized by bright tinge of foliage and light color of roots (Yellowstone F1, White Satin F1)
References KASPRZAK, K. – NIEDBAŁA, W. (1981): Wskaźniki biocenotyczne stosowane przy porządkowaniu i analizie
danych w badaniach ilościowych. In: GÓRNY, M – GRÜM, L. (eds.): Metody stosowane w zoologii gleby.[Biocenotic indicators used in organizing and analyzing the data in quantitative research. In: Methods used in soil zoology.] PWN, Warszawa. 379-416 (in Polish).
KUCHARCZYK, H. – LEGUTOWSKA H. (2001): Thrips tabaci as a pest of leek cultivation in different conditions. In: Thrips and tospoviruses: Proceedings of the 7th International Symposium on Thysanoptera. Italy. July 2001. 211-213.
KUCHARCZYK, H. – SETNIEWSKA, M. – LEGUTOWSKA, H. (2006): Zróżnicowanie fauny wciornastków (Thysanoptera) na roślinach zielarskich w rejonie warszawskim. [Differentiation of thrips (Thysanoptera) fauna on herbal plants in Warsaw Region.] Prog. Plant Protection/Post.Ochr Roślin 46 (2): 429-432 (in Polish with English abstract).
LEGUTOWSKA, H. (1997): Thrips on cabbage crops in Poland. Biuletyn Warzywniczy XLVII: 55-62. ŁUCZAK, I. (2007): Występowanie mszyc (Aphidoidea) na różnych odmianach marchwi i pietruszki.
[Occurrence of aphids (Aphidoidea) on different varieties of carrots and parsley.] In: Proceedings of the Conference „Postęp w Technologii Uprawy Warzyw Korzeniowych”. Poland. November 2007. 52-53.
ŁUCZAK, I. – GABORSKA, M. (2012): Występowanie i szkodliwość mszycy burakowej (Aphis fabae Scop.) w uprawie marchwi. [Occurence and harmfulness of black bean aphid (Aphis fabae Scop.) in carrot crops.] Prog. Plant Protection/Post.Ochr Roślin 52 (2): 235-239 (in Polish with English abstract).
Science for Sustainability University of West Hungary International Scientific Conference for PhD Students March 19-20, 2013 – Győr
385
POBOŻNIAK, M. (2009): Wstępne badania nad podatnością odmian grochu na zasiedlenie i żerowanie wciornastków. [Preliminary estimation of sesceptibility of various pea cultivars (Pisum sativum L.) to thrips (Thysanoptera) infestation and feeding.] Prog. Plant Protection/Post.Ochr Roślin 49 (3): 1215-1219 (in Polish with English abstract).
POBOŻNIAK, M – GABORSKA, M. (2010): Wstępna analiza gatunków wciornastków zasiedlających groch. [Preliminary analysis of thrips species on pea.] Prog. Plant Protection/Post.Ochr Roślin 50 (4): 1729-1732 (in Polish with English abstract).
RICHTER, E. – HOMMES, M. – KRAUTHAUSEN, J.H. (1999): Investigations on the supervised control of Thrips tabaci in leek and onion crops. IOBC Bulletin 22: 61-72.
SAKIMURA, K. (1938): Thysanoptera of Kauai with notes of the incidence of yellow spot on wild host plants. Proceedings of the Hawaiian Entomological Society 10 (1): 167-173.
SHELTON, A.M. – HOY, C.W. – DICKSON, M.H. – BARNARD, J. (1988): Analysis of resistance in cabbage varieties to damage by Lepidoptera and Thysanoptera. J. Econ. Entomol. 81 (2): 634-640.
STRASSEN, R. (2003): Die terebranten Thysanopteren Europas und des Mittelmer-Gebiets. Series: Die Tierwelt Deutschlands. [The Thrips of Europe and the Mediterranean region. Series: The animal world of Germany] Verlag Goecke & Evers, Keltern. 277 p. (in German).
SZWEJDA, J. (2002): Nowe zagrożenia roślin warzywnych stwarzane przez entomofaunę fitofagiczną i metody ich ochrony. [The new threats of vegetable caused by phytophagous entomofauna and the methods of vegetable protect.] Zesz. Nauk. AR im H. Kołłątaja w Krakowie. 387: 271-275 (in Polish).
Szwejda, J. – Wrzodak, R. (2007): Phytophagous entomofauna occurring on carrot and plant protection methods. Veg. Crops Res. Bull. 76: 95-102.
TRDAN, S. – ANDJUS, L. – RASPUDIČ, E – KAČ, M. (2005): Distribution of Aeolothrips intermedius Bagnall (Thysanoptera: Aeolothripidae) and its potential prey Thysanoptera species on different cultivated host plants. J. Pest Sci. 78 (4): 217-226.
ZAWIRSKA, I. (1994): Wciornastki (Thysanoptera). In: KOZŁOWSKI, M.W. – BOCZEK, J. (eds.): Diagnostyka szkodników roślin i ich wrogów naturalnych. [Thrips (Thysanoptera). In: Diagnosis of plant pests and their natural enemies.] Wydawnictwo SGGW, Warszawa: 145-174 (in Polish).

Science for Sustainability University of West Hungary International Scientific Conference for PhD Students March 19-20, 2013 – Győr
386
Section 6.2 Sustainable Rural Development and Agriculture
Sustainable Rural Development and Income Diversification in New European Union Countries
KADLEČÍKOVÁ, Mária
Slovak University of Agriculture, Nitra, Slovak Republic
Abstract – In the European Union countries food and agricultural systems are undergoing through the significant changes. Despite of the meaningful decline in the economic importance of agriculture this sector continues to be a major part of the local economy in rural areas. The rural areas of EU countries cover of 91 % of its territory with 56 % of inhabitants and actively cultivating the 41.5% of the agricultural land. However in the rural areas of the EU-10 is persisting high unemployment, continues the outflow of inhabitants to the cities or to the abroad and more rural population falls into the poverty. The main objective of this paper is to analyze and introduce the positive experiences and good practices from the most developed EU countries in diversification of the rural incomes. In the paper are also outlined the main elements of rural development such as improvements of the rural infrastructure and the provision of local services with objective to strengthen the sustainability in rural areas. In connection to the vibrant rural development is important to take into consideration three factors: a. the agriculture alone will not anymore guarantee the sustainability of rural areas, but it is important to maintain it; b. within the rural areas is existing significant diversity; c. the important role to the development of rural entrepreneurial activities have to play women and young people.
The one of the conclusions indicates that the rural areas are fragile towards of the socio-economic and environmental crisis. This is mainly caused by the absence of the effective and active social nets and continuous restrictive financial policy of some governments. With aim to minimize the public expenditures, the governments in less EU developed countries are abolishing such an important public services as represent schools, health care, public transport or other public administrations. With continuous restrictions no development can be achieved in any area of economic life. The active rural development policy has to cover farm investments, competitiveness of the agri-food industry, environmental management, animal welfare as well as the food quality and safety. In the most developed countries of EU-27 is dominating the economic diversification with tendency to introduce additional activities which are stemming out of the agricultural production as processing of agricultural production, production of handicrafts or development of rural tourisms. In frame of the conclusions are listed the factors and measures which have significant impact on the diversification of incomes in the rural areas.
Keywords: agriculture / rural areas / income diversification / rural development / rural infrastructure / competitiveness

Science for Sustainability University of West Hungary International Scientific Conference for PhD Students March 19-20, 2013 – Győr
387
Strategic Management in Rural Development
TELL Imre
Department of Economics, Faculty of Agricultural and Food Sciences, University of West Hungary; H-9200 Mosonmagyaróvár, Vár 2. E-mail: [email protected]
Abstract – Several examples demonstrate that the origin of existing (and successful) rural development strategies can be traced back into the past. Everywhere in the world, people have always tried to mould the way of rural areas’ development through thinking, planning/programming and managing strategically. As the majority of global population lives in developing countries (accordindg to the forecast of the UN, by the year 2025, more than 7 billion people will be living there), the strategies of world organizations are focusing on „Reaching the Rural Poor” through: - fostering (first of all) „returns to labour and land” - reaffirming their commitment to agriculture – considering it as the main engine of rural econoimic
growth, and - recognizing the importance of non-farm economic activities, as well.
Approaching the issue comprehensively, the following questions are waiting for an answer: Why is strategic thinking so important? What do we actually take for a rural development strategy? What is the product of the strategic planning process? How is the strategic management system in rural development working? What are the main aspects of the future?
Consequently, this paper aims to explore the main reasons for undertaking strategic planning, to identify the basic categories concerning programmes and activities influencing the development of rural areas, to analyse the system of how the strategic programming is going (on) - following the process of planning. Also included is an overview of the most important aspects of monitoring/evaluation and an outlook for the future environment. Presenting and outlining how the different dimensions and levels of rural development strategies become apparent, the „COMMUNITY LED LOCAL DEVELOPMENT” (CLLD) and the „LEADER” approach have certainly got a special importance.
Summarizing the main points of conclusion, strategy has undoubtedly proved to be an effective and efficient way as well as a widely-used method at all levels (international/national/governmental, local and community) of rural development. It is functioning as the basic tool of programming and managing the implementation of goals/objectives. Instead of short-term actions, application of integrated programs (fulfilled successively and interdependently) is simply indispensable in managing the very complex issues of rural areas and communities. Strategic thinking, planning/programming and management is the only way that can lead an area and/or community to come out of the socio-economic isolation. As for the (rural development) strategic planning process and plans of different levels, it was found that a very diverse and complex political and institutional system is existing and functioning in the background.
According to the imminent new programming period, the system’s operation is going to be changed considerably - strengthening integrated approach for creating multi-sectoral area-based and multi-fund local development strategies.
Consequently, there are new challenges providing free scope for further research works, as well.
Keywords: localism / challenges / strategies / programmes / integration / networking
Science for Sustainability University of West Hungary International Scientific Conference for PhD Students March 19-20, 2013 – Győr
388
Sustainability in the Hungarian Agriculture with RES
D. NÉMETH, Zsuzsanna
Department of Economics, Szent István University, Gödöllő, Hungary E-mail: [email protected]
Abstract – The aim of the study is to present the increase of usage of renewable energy sources (RES) in Hungary by the support of the required, judged and paid out amounts in the KEOP schemes. By the realised investments the sustainable development is attainable where the society defines viable and executable conception for itself with this ends in view of the economical, social and environmental aspects of the human activities.
Hereby the main objectives and targets of the Kyoto Protocol can be realising, to limit climate change and its costs as well as negative effects to society and the environment. It can be achieved by reducing GHG emissions and initiate renewable energy sources to all walks of life.
The study presents the types of renewable energy as well as their distribution and change in the whole energy consumption in Hungary. The paper contains also the share of the electricity supply derived from the renewable energy sources according to the National Energy Strategy in the future.
In the increase of the renewable energy sources consumption a cost efficiency supporting system for renewable can be determination and qualification.
Keywords: renewable energy sources, sustainability, agriculture, GHG emission
1. INTRODUCTION
In the last decades the averages temperature of the word is getting higher and higher. The main reason of the global worming is the increasing of the concentration of the greenhouse gasses (carbon-dioxide, methane). The reasons of the global warming are since the industrial revolution the human activities and combustion of fossil fuels. During the human activities energy demand is higher and higher which have harmful effects for the environment, flora and fauna.
In order to minimize environmental damage relative to the benefits of energy consumption, a sustainable, environmental energy system is necessary.
Government programs want to reduce the negative environmental impacts of fossil fuel consumption by supporting systems and schemes. The new energy technologies increase efficiency, mitigate pollution, and substitute for fossil energy. To achieve these aims, policy mechanisms include environmental standards, fuel and emission taxes, subsidies for renewable energy production, and emission permit-trading schemes.
1.1. Kyoto Agreement
Renewable energy sources contribute to conform the goals of the Kyoto Protocol as well as disposable CO2 saving can occur.
The main objectives and targets of the Kyoto Protocol are, to limit climate change and its costs as well as negative effects to society and the environment. It can be achieved by reducing greenhouse gas emissions, and initiate renewable energy sources – fuel wood, biomass, biofuel, biogas, geothermal energy, water energy, wind energy, solar energy, disintegrate biology part of communal waste - to all walks of life, as the most part of the emissions of CO2 caused by usage the traditional energy sources.

Science for Sustainability University of West Hungary International Scientific Conference for PhD Students March 19-20, 2013 – Győr
389
Advantages of renewable energy sources are locals; ensure the access to energy; increase the security by the diversification of energy demand; decrease the import dependency; create place of employment and ensure alternative income in the rural areas; environmental friendly, contribute the increase of pollution emission; decrease the risks derives from change in prices in the case of traditional energies; increase the welfare in macro-level, as well as the micro-level’s competitiveness in the long run. Beside these some disadvantages of renewable energy sources can be realizable. Firstly, because of the high demand on capital and long rate of return renewable energy sources are not competitive against fossil energy sources. In short distance they increase costs and they can decrease the competitiveness. Secondly, come into general use possible only with active state support (FARKASNÉ FEKETE, 2011).
1.2. National Strategy
The Hungarian government’s strategy on the increased use of renewable energy sources (2007-2020 Energy Policy sets a target of 186.4 PJ from renewable energy by 2020, compared to 55 PJ in 2006. The target is broken down by sector: 79.7 PJ (9470 GWh)) in electricity production, 87.1 PJ in heat production and 19.6 PJ from biofuel within fuel consumption (Renewable Energy Policy Country Profiles, 2011).
In 2010 renewable energy sources had ensured 6.2% of the gross electric power consumption. Among the EU member states only Hungary and Germany had fulfil the aim of renewable
electric power value to 2010 – 3.6% in the case of Hungary – according to the 2001/77/EK Directive. In the case of renewable electric power subsidy is assigned by low-profile aims and application cost efficiency subsidy systems for renewable energy sources. Therefore the proportion of the renewable energy is continuously increasing inside the gross electric power consumption. Nevertheless Hungary had initiated all the essential directive such as 2001/77/EK and 2009/28/EK.
While the National Energy Strategy 2030 (NES, 2012b) predicts a moderate increase of the share of renewable electric power (to 10.9% to 2020 from the 6.2% in 2010) on the other hand the Strategy emphasize to the nuclear energy and new Coal-Fired Power Plants.
2. RESULTS
Not only the geographical position but also the natural circumstances are favourable to use renewable energy sources, mainly in the case of the biomass or biogas, geothermal - and solar energy in Hungary. These renewable energy sources could be determinant role to solve the safe energy supply in Hungary.
The measure and share of the renewable energy sources such as fuel wood, other biomass, biofuel, biogas, geothermal energy, water energy, wind energy, solar energy, disintegrate biology part of communal waste is getting higher and higher and more and more determine in all walls of life.
For electric power generation the following forecasts are made in the NCsT: According to the NCsT, direct financial supporting schemes are provided to help realise
renewable projects. The subsidies provide through the operative programmes assistance upfront during the
project development, investment and construction phase. The support system has been in place for years now with slightly shifting emphasis according
to the actual energy policy priorities. In line with the forming Energy Strategy priorities and the objectives of the NCsT, the subsidies in 2011 focus more on heating and cooling based on renewables.

Science for Sustainability University of West Hungary International Scientific Conference for PhD Students March 19-20, 2013 – Győr
390
Direct financial support for renewable projects - Development of building energy systems in combination with renewable energy utilization; Renewable based power or CHP generation, bio-methane production; Supplying local heat and power demands from renewable energy sources; Renewable energy based regional development; Increasing utilisation of renewable energies in Central Hungary; Support for the preparation and development of geothermal heat and power projects - and Support for planting energy crops and forests are the same determinant in the case of the Hungarian sustainable agriculture (HU Biennal Report, 2011).
Table 1. Projected installed capacities of the various RES technologies according to the NCsT
To achieve the targets set in the NCsT the above mentioned support system is subsidized
considerably.
Figure 1. Distribution of supported renewable projects by the type of energy Source: HU Biennal Report, 2011
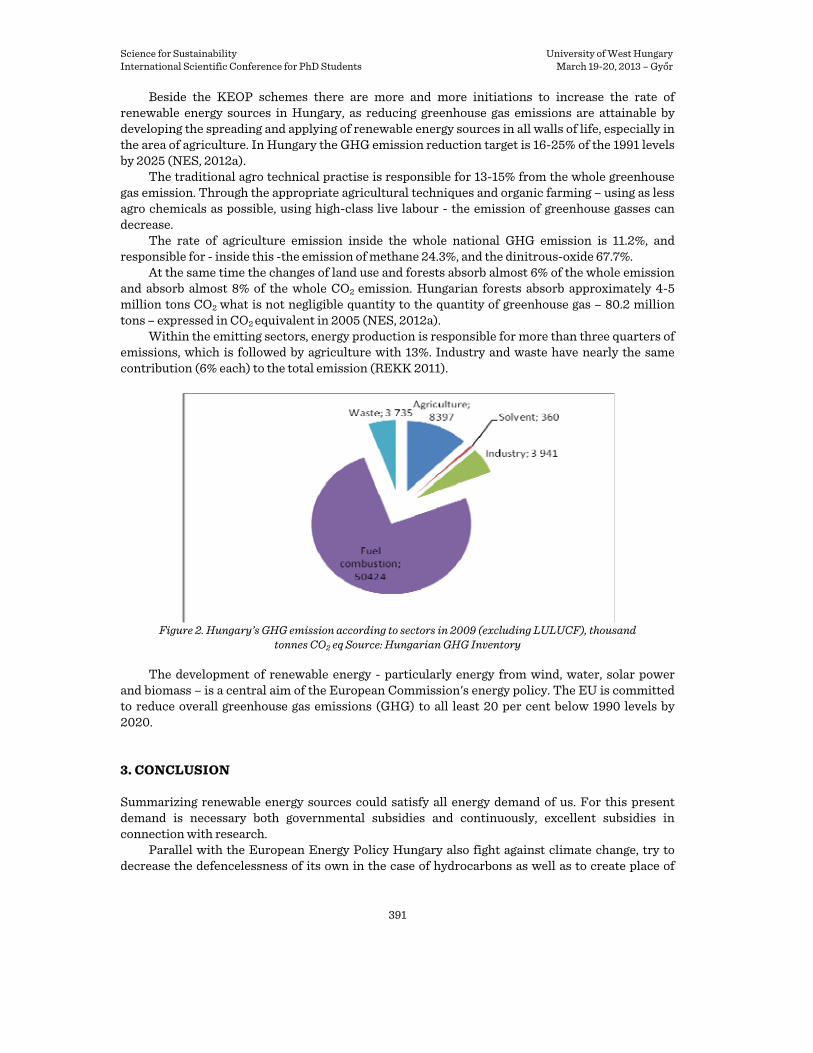
Science for Sustainability University of West Hungary International Scientific Conference for PhD Students March 19-20, 2013 – Győr
391
Beside the KEOP schemes there are more and more initiations to increase the rate of renewable energy sources in Hungary, as reducing greenhouse gas emissions are attainable by developing the spreading and applying of renewable energy sources in all walls of life, especially in the area of agriculture. In Hungary the GHG emission reduction target is 16-25% of the 1991 levels by 2025 (NES, 2012a).
The traditional agro technical practise is responsible for 13-15% from the whole greenhouse gas emission. Through the appropriate agricultural techniques and organic farming – using as less agro chemicals as possible, using high-class live labour - the emission of greenhouse gasses can decrease.
The rate of agriculture emission inside the whole national GHG emission is 11.2%, and responsible for - inside this -the emission of methane 24.3%, and the dinitrous-oxide 67.7%.
At the same time the changes of land use and forests absorb almost 6% of the whole emission and absorb almost 8% of the whole CO2 emission. Hungarian forests absorb approximately 4-5 million tons CO2 what is not negligible quantity to the quantity of greenhouse gas – 80.2 million tons – expressed in CO2 equivalent in 2005 (NES, 2012a).
Within the emitting sectors, energy production is responsible for more than three quarters of emissions, which is followed by agriculture with 13%. Industry and waste have nearly the same contribution (6% each) to the total emission (REKK 2011).
Figure 2. Hungary’s GHG emission according to sectors in 2009 (excluding LULUCF), thousand
tonnes CO2 eq Source: Hungarian GHG Inventory
The development of renewable energy - particularly energy from wind, water, solar power and biomass – is a central aim of the European Commission's energy policy. The EU is committed to reduce overall greenhouse gas emissions (GHG) to all least 20 per cent below 1990 levels by 2020.
3. CONCLUSION
Summarizing renewable energy sources could satisfy all energy demand of us. For this present demand is necessary both governmental subsidies and continuously, excellent subsidies in connection with research.
Parallel with the European Energy Policy Hungary also fight against climate change, try to decrease the defencelessness of its own in the case of hydrocarbons as well as to create place of

Science for Sustainability University of West Hungary International Scientific Conference for PhD Students March 19-20, 2013 – Győr
392
employment and to motivate the economic growth. The mentioned aims have to realise beside safety energy supply with attainable price.
EU is committed to combat climate change to increase security on its energy supply. In this combat bioenergy originated from both agriculture and both forestry has a key role. Therefore not only the geographical position but also the natural circumstances are favourable to use renewable energy sources, mainly in the case of the biomass or biogas, geothermal- and solar energy in Hungary. Acknowledgement: We wish to thank “TALENTUM PROJECT” TÁMOP 4. 2. 2. B – 10/1 – 2010 – 0018. References FARKASNÉ FEKETE, M. (2011): A napenergia versenyképessége-gazdaságosság és jóléti hatások. In: „Az
alternatív energiaforrások hasznosításának gazdasági kérdései Tudományos konferencia Sopron, 2006. nov. 8-9. Konferencia cikkek CD kiadvány. p. 29. (in Hungarian)
HU BIENNAL REPORT (2011): Biennial in accordance with article 3.2 under Council Decision No 280/2004/EC on a Mechanism for Monitoring Community Greenhouse Gas Emissions and for Implementing the Kyoto Protocol, 2011, Source: http://klima.kvvm.hu/documents/138/HU_biennial_report_2011.pdf
NES (2012a): National Climate Change Strategy (Nemzeti Éghajlatváltozási Stratégia NÉS) 2008-2025. pp. 114. Source: www.kvvm.hu/cimg/documents/nes080214.pdf (in Hungarian)
NES (2012b): National Energy Strategy 2030, Ministry of National Development. Source: http://www.kormany.hu/en/ministry-of-national-development/news/national-energy-strategy-2030-published
REKK (2011): Impact assessment of increasing the 20% Greenhouse gas reduction target of the EU for Hungary (executive summary). Műhelytanulmány (working paper). Regional Centre for Energy Policy Research. Source: http://www.rekk.eu
RENEWABLE ENERGY POLICY COUNTRY PROFILES (2011): Source: http://www.reshaping-res-policy.eu/downloads/ RE-SHAPING%20Renewable%20Energy%20Policy%20Country%20profiles%202009.pdf.
2001/77/EK DIRECTIVE: DIRECTIVE 2001/77/EC OF THE EUROPEAN PARLIAMENT AND OF THE COUNCIL of 27 September 2001 on the promotion of electricity produced from renewable energy sources in the internal electricity market (OJ L 283, 27.10.2001, p. 33)
2009/28/EK DIRECTIVE: DIRECTIVE 2009/28/EC OF THE EUROPEAN PARLIAMENT AND OF THE COUNCIL of 23 April 2009 on the promotion of the use of energy from renewable sources and amending and subsequently repealing Directives 2001/77/EC and 2003/30/EC
Green Infrastructure Planning for Sustainable Rural Development
TÓTH, Attila*
MSc in Landscape Architecture, Department of Garden and Landscape Architecture, Faculty of Horticulture and Landscape Engineering, Slovak University of Agriculture, Nitra, Slovakia
Abstract – This paper focuses on the potential of green infrastructure (GI) planning to support a sustainable development of rural regions. Analysing, planning and designing of GI are applied on a case study of the micro-region Cergát-Váh and the selected reference settlement Tvrdošovce (Tardoskedd) situated in the rural agricultural countryside of south-western Slovakia, in the Danube Lowland. The case study consists of a complex landscape
* Corresponding author: [email protected], Tulipanova 7, SK-949 76 Nitra, Slovakia
Science for Sustainability University of West Hungary International Scientific Conference for PhD Students March 19-20, 2013 – Győr
393
planning and design concept at three different planning levels and scales: micro-regional; cadastral and built-up area. The first level is represented by a GI concept for the micro-region which consists of linear and spatial elements of the green network. The second level is represented by a more detailed GI concept elaborated for the cadastral area of the village which sets target to raise and support the visual and functional linkage between built-up area and open land. At the third level we elaborated a landscape architectural concept for the central part of the village.
Keywords: agricultural countryside / greenways / landscape structures / vegetation structures
1. INTRODUCTION
Rural landscapes, their planning and design hold an important position in the profession of landscape architecture. The development of Slovak countryside in the last century brought about a lot of noticeable changes which left behind modified rural landscapes with a visible footprint on their urban and landscape structures. The aesthetic values and perceptual quality of rural landscapes have been significantly changed. The most common problems in open land can be particularly defined as an inheritance of the agricultural collectivization. It brought about significant draining of the landscape, elimination of forests, woods, non-forest woody vegetation (groves, accompanying vegetation of roads and watercourses, shelterbelts), meadows or field baulks. All these negative interventions contributed to an ecological destabilization of the landscape which is now waiting for a change for the better.
We attribute a great importance to solve the reconstruction of rural landscapes in context of micro-regional development. Rural settlements have to be linked to each other and create a functional whole with a common infrastructure including transport, ecological, urban, landscape, social and economic layers. Rural landscapes represent thereby an important linkage medium between settlements within a micro-region. As TÓTH and FERIANCOVÁ (2011, pp.227-233) state, “rural settlements and landscapes should become coherent in terms of functional and visual properties of open land and built-up area”. To fulfil these requirements the GI has to be strengthened and supported by tools of landscape planning and landscape architecture. These planning tools in form of greenways, green nets and ecological networks are described in Theorie der grünen Netze (TÓTH 2011, pp.3-6). Contemporary approaches and results in planning and design of local and regional green structures are summarized among others in works of (AHERN 2004, BENEDICT and MCMAHON 2006, FÁBOS - RYAN 2004, HELLMUND – SMITH 2006, JONGMAN 2004, MURPHY - MOUREK 2010).
This paper focuses on GI in form of complex vegetation structures in rural landscapes. Our results are described on a case study of the rural settlement Tvrdošovce situated in the Danube Lowland. We summarize the main functions of GI into four main service groups represented by social, ecological, urban (spatial) and production functions according to FERIANCOVÁ and TÓTH (2012, p.46). Our aim is to propose an optimal model of a complex green space system with emphasis on functional categorization and in accordance with contemporary trends in spatial development of settlements which are elaborated by SUPUKA and FERIANCOVÁ (2008, pp.101-142). We apply landscape planning strategies (greenways, ecological and green networks) to design a sustainable system of rural open spaces and landscape structures.
2. MATERIALS AND METHODS
Our planning process bases on a detailed analysis of historic landscape and settlement structures and spatial development of the rural settlement Tvrdošovce. We used visual interpretation and GIS analyses of historic maps from 18th, 19th and 20th century as well as visual interpretation of historic
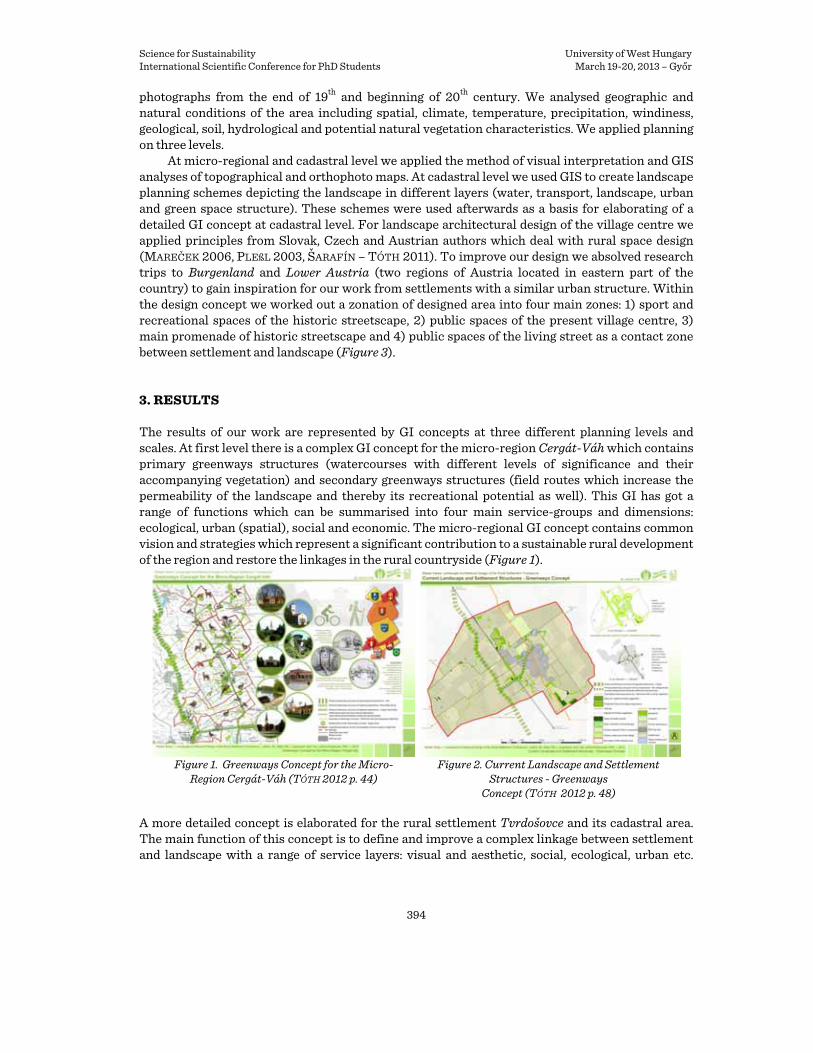
Science for Sustainability University of West Hungary International Scientific Conference for PhD Students March 19-20, 2013 – Győr
394
photographs from the end of 19th and beginning of 20th century. We analysed geographic and natural conditions of the area including spatial, climate, temperature, precipitation, windiness, geological, soil, hydrological and potential natural vegetation characteristics. We applied planning on three levels.
At micro-regional and cadastral level we applied the method of visual interpretation and GIS analyses of topographical and orthophoto maps. At cadastral level we used GIS to create landscape planning schemes depicting the landscape in different layers (water, transport, landscape, urban and green space structure). These schemes were used afterwards as a basis for elaborating of a detailed GI concept at cadastral level. For landscape architectural design of the village centre we applied principles from Slovak, Czech and Austrian authors which deal with rural space design (MAREČEK 2006, PLEßL 2003, ŠARAFÍN – TÓTH 2011). To improve our design we absolved research trips to Burgenland and Lower Austria (two regions of Austria located in eastern part of the country) to gain inspiration for our work from settlements with a similar urban structure. Within the design concept we worked out a zonation of designed area into four main zones: 1) sport and recreational spaces of the historic streetscape, 2) public spaces of the present village centre, 3) main promenade of historic streetscape and 4) public spaces of the living street as a contact zone between settlement and landscape (Figure 3).
3. RESULTS
The results of our work are represented by GI concepts at three different planning levels and scales. At first level there is a complex GI concept for the micro-region Cergát-Váh which contains primary greenways structures (watercourses with different levels of significance and their accompanying vegetation) and secondary greenways structures (field routes which increase the permeability of the landscape and thereby its recreational potential as well). This GI has got a range of functions which can be summarised into four main service-groups and dimensions: ecological, urban (spatial), social and economic. The micro-regional GI concept contains common vision and strategies which represent a significant contribution to a sustainable rural development of the region and restore the linkages in the rural countryside (Figure 1).
Figure 1. Greenways Concept for the Micro- Figure 2. Current Landscape and Settlement Region Cergát-Váh (TÓTH 2012 p. 44) Structures - Greenways Concept (TÓTH 2012 p. 48) A more detailed concept is elaborated for the rural settlement Tvrdošovce and its cadastral area. The main function of this concept is to define and improve a complex linkage between settlement and landscape with a range of service layers: visual and aesthetic, social, ecological, urban etc.

Science for Sustainability University of West Hungary International Scientific Conference for PhD Students March 19-20, 2013 – Győr
395
(Figure 2). Within this concept a complex landscape architectural design is elaborated for the local brook and the historic linear open space / wide central streetscape (Figures 3 and 4).
4. DISCUSSION
Our GI concept provides a better integration of Tvrdošovce to the micro-region Cergát-Váh and brings onto the scene of rural landscapes planning and design new progressive trends. The micro-regional GI concept has the potential to intensify the cooperation between settlements which currently stagnates. The GI concept at cadastral level has to be understood as a thematic and content extension of Territorial System of Ecological Stability (TSES) elaborated within master plan of the village. This suggestion we substantiate by results of a long-time scientific and research activity of AHERN (2004) who among others arrived at statement, that "greenways represent an effective method to protect nature and landscape as we occupy a relatively small area for several functions at the same time". Therefore greenways represent an effective and proved landscape planning tool which should be applied within the process of rural landscapes planning and design. We argue for suitability of greenways and green networks for Slovak countryside with historic context since we arrived by interpretation of historic maps at conclusion that the amount of linkages in the rural countryside of 18th and 19th century was significantly higher and more complex than nowadays. Our design responds to deficiencies of the project Revitalisation of the central zone of village Tvrdošovce from 2010/2011 which focused only on transport concept and neglected a complex urban and landscape architectural solution and the connection of the design with cultural and historical heritage of the village centre. This is a quite common deficiency nowadays described also by ŠTĚPÁNKOVÁ and KRISTIÁNOVÁ (2012, p. 180) who state that, “in most cases the use of streetscapes is reduced only to the transportation function and there is an absence of public spaces”. Our results are in accordance with solution established by MAREČEK (2006) as the most suitable (use of solitaries and groups of high-stem deciduous trees and maintaining of a continuous central open space in form of open grass surfaces).
Figure 3. Landscape Architectural Concept for the Figure 4. Landscape Architectural Design of the Central Part of Village Tvrdosovce (TÓTH 2012, p. 49) Village Centre of Tvrdosovce (TÓTH 2012, pp. 50-62)
5. CONCLUSION
The GI concept at micro-regional level represents a significant contribution to a sustainable development of the micro-region as a coherent whole. This concept is a tool to strengthen the

Science for Sustainability University of West Hungary International Scientific Conference for PhD Students March 19-20, 2013 – Győr
396
ecological stability and to serve as an improvement of TSES concepts. The GI concept at cadastral level supports creation of a unified and harmonic image of settlement and landscape. It represents a relevant thematic and content improvement of the master plan. By improvement of secondary greenways structure the historical heritage of linkages in the landscape will be renewed and the accessibility of landscape will arise. At settlement level our design unifies the historic streetscape and the central space of the village by landscape architectural and urban design tools. The elaborated landscape architectural design stands for an important methodical basis for self-government of the municipality to be able to develop a new compositional arrangement of the village centre which will respond to the cultural and historical legacy and at the same time to current needs of inhabitants.
We propose to elaborate detailed GI concepts for the other municipalities of the micro-region as well. These should base on thorough analysis of settlement and landscape structures. Within the cadastral area of village Tvrdošovce we suggest to improve the GI concept by working out of partial landscape planning and design projects for selected landscape areas with a recreational potential. Within built-up area of the village we propose to improve the GI by elaborating of public space design projects for selected public green spaces.
Acknowledgements: We wish to thank to "Talentum Project" of TÁMOP 4.2.1.B-09/1/KONV-2010-0006. This paper is supported by research projects VEGA No. 1/0769/12 and KEGA No. 019SPU-4/2011 of the Ministry of Education of the Slovak Republic. References AHERN, Jack (2004): Greenways in the USA: theory, trends and prospects. In: JONGMAN, R. (eds.): Ecological
networks and greenways – concept, design, implementation. Cambridge University Press. Cambridge. ISBN 0-521-53502-6, pp. 34-53.
BENEDICT, Mark A. – MCMAHON, Edward T. (2006): Green infrastructure – linking landscapes and communities. Island Press. Washington. ISBN 1-559-63558-4.0, 299 p.
FÁBOS, Julius Gy. – RYAN, Robert L. (2004): International greenway planning: an introduction. In: FÁBOS, J. Gy. - RYAN, R. L. (eds.): Landscape and Urban Planning: An International Journal of Landscape Ecology, Landscape Planning, and Landscape Design. Elsevier B.V. 68 (2-3). pp. 43-146.
FERIANCOVÁ, Ľubica – TÓTH, Attila (2012): Green infrastructure and its importance for village restoration and rural development in Central Europe. In: Ignatieva, M. (eds.): Green Infrastructure: from global to local: International conference proceedings. State Polytechnic University Publishing House. Saint-Petersburg. ISBN 978-5-7422-3540-8, pp. 45-47.
HELLMUND, Paul Cawood – SMITH, Daniel Somers (2006): Designing greenways – sustainable landscapes for nature and people. Island Press. Washington. ISBN 1-55963-325-5, 270 p.
JONGMAN, Rob (2004): Ecological networks and greenways – concept, design, implementation. Cambridge University Press. Cambridge. ISBN 0-521-53502-6, 345 p.
MAREČEK, Jiří (2006): Hodnoty vesnických návsí [Values of village squares]. In: Zahrada – Park – Krajina: Zeleň na vesnicích [Garden – Park – Landscape: Village greenery]. Společnost pro zahradní a krajinářskou tvorbu. Praha. 16 (5). ISSN 1211-1678, pp. 4-9. (in Czech)
MURPHY, David – MOUREK, Daniel (2010): Central European Greenways – Designing International Corridors of Sustainable Development. In: FÁBOS, J. Gy. et al. (eds.): Proceedings of Fábos Conference on Landscape and Greenway Planning. Corvinus University. Budapest. ISBN 978-963-503-409-3, pp. 63-70.
PLEßL, Ernst (2003): Flur- und Ortsform des Angerdorfes [Spatial and urban form of a village with central green space]. In: WILFINGER, Ch. 2003. Nutzung und Gestaltung des Dorfangers in Lackendorf [Use and design of central green space of the village Lackendorf]. MSc. University of Natural Resources and Life Sciences. Vienna. pp. 26-29 (in German)
SUPUKA, Ján – FERIANCOVÁ, Ľubica (2008): Koncepčné prístupy v plánovaní vegetačných štruktúr, štandardy a regulatívy [Conceptual approaches in planning of vegetation structures, standards and regulations]. In: SUPUKA, J. – FERIANCOVÁ, Ľ. (eds.): Vegetačné štruktúry v sídlach: Parky a záhrady [Vegetation

Science for Sustainability University of West Hungary International Scientific Conference for PhD Students March 19-20, 2013 – Győr
397
structures in settlements: Parks and Gardens]. Slovak University of Agriculture. Nitra. ISBN 978-80-552-0067-5, pp.101-142. 504 p. (in Slovak)
ŠARAFÍN, Michal – TÓTH, Attila (2011): Ako by mala vyzerať dedinská ulica [How should a village street look like]. In: Obecné noviny – Týždenník miest a obcí [Municipal Journal – The weekly journal of Slovak cities and villages.] Inprost spol s r.o. Bratislava. 21 (42). ISSN 1335-650X. p. 17. (in Slovak)
ŠTĚPÁNKOVÁ, Roberta – KRISTIÁNOVÁ, Katarína (2012): Verejné priestory v urbanistickej štruktúre vidieckych rezidenčných suburbií Bratislavy [Public spaces in urban structure of rural residential suburbs of Bratislava]. In: Člověk, stavba a územní plánování [Man, building and spatial planning.] Fakulta stavební ČVUT, Katedra urbanismu a územního plánování. Prague. ISBN 978-80-01-05025-5. pp. 178 – 182. (in Slovak)
TÓTH, Attila (2011): Theorie der Grünen Netze [Theory of Green Networks.] In: DAMYANOVIC, D. (eds.): Nachhaltige Stadtplanung und –entwicklung am Beispiel der Stadt Salzburg : Projekt [Sustainable urban planning and development on example of Salzburg City : project]. University of Natural Resources and Life Sciences. Vienna. pp. VII_3-6, 205 p. (in German)
TÓTH, Attila (2012): Krajinárske úpravy vidieckeho sídla Tvrdošovce [Landscape architectural design of the rural settlement Tvrdošovce.] MSc. Slovak University of Agriculture. Nitra. 67 p. (in Slovak with English abstract)
TÓTH, Attila - FERIANCOVÁ, Ľubica (2011): Vidiecke sídlo – súčasť kultúrnej krajiny [Rural village as part of the cultural landscape]. In: ŠTĚPÁNKOVÁ, R. (eds.): Zborník príspevkov zo študentskej vedeckej konferencie FZKI [Student scientific conference proceedings]. Slovak University of Agriculture. Nitra. ISBN 978-80-552-0676-9, pp. 227-233. (in Slovak with English abstract)
Thermal Tourism as one of the Breakout Potentials of the Subregion
KERN Ágnes30
Institute of Economic Sciences, University of West Hungary Faculty of Agricultural and Food Science, Mosonmagyaróvár, Hungary
Abstract – Both the Flexum Thermal and Spa Bath and the Lipót Thermal and Adventure Bath play an important part in the life of the subregion Mosonmagyaróvár. By the development both thermal baths have reached national and regional importance by today, their number of guests is on increase, and the demands of the visitors require the continuous raise of the standard of services. Our country is flourishing in respect of thermal and spa baths nowadays, more and more facilities are opened for people who long for refreshment and recovery. In the first part of my own research I have compared basic data about the two thermal baths. Then I have expounded which investments were realised and the total volume of investments. In Lipót they won money in the course of the Széchenyi Plan and the Operative Programme Western Transdanubia, whereas Mosonmagyaróvár realised the development from its own resources. I have examined the tourist traffic of Mosonmagyaróvár and Lipót separately, or the yearly distribution respectively.With full knowledge of the data and other information I could establish, that the thermal and spa baths mean the most dynamic development branch in the subregion of Mosonmagyaróvár.
Keywords: sustainability / rural development / farm holidays
30 [email protected]; H-9200 Mosonmagyaróvár, Akác u. 19.

Science for Sustainability University of West Hungary International Scientific Conference for PhD Students March 19-20, 2013 – Győr
398
1. INTRODUCTION
In my research I examined the thermal waters of the subregion Mosonmagyaróvár and its utilization including the support improvements based on thermal waters, as well as their role in the rural development. The subregion has very favorable properties both geographically and touristically. The greatest natural treasure is the spa and thermal waters, which with rational use would ensure long-term jobs for local residents and play a proactive role in economic recovery. The region has two baths (thermal and fun bath) in Lipót and Mosonmagyaróvár. These baths not only satisfy the needs of the locals, but also the needs of the tourists coming to relax from the neighbouring countries. Because of the proximity of the border the guests arrive especially from Austria and Slovakia, but Germans are also coming for a longer stay. Continuous improvements are essential because of the increasing number of spa visitors and their growing needs. This is important in order to maintain competitiveness too. Spa tourism is now one of the major attractions in our country, the number of spas of national importance is around 20, on the local and regional level close to 100.
2. REVIEW OF THE LITERATURE
Today, travel is among the particularly preferred types of relaxing by the population including its short and long-term forms. In the newspapers, news we can often see that tourism is now one of the world's most important economic activities. Our country is extremely rich in natural resources, our historic towns and attractions attract more tourists to Hungary every year. The most popular travel destinations are of course Budapest, Lake Balaton and Western-Transdanubia. The number of foreigners coming to Hungary for leisure and health tourism is also high. Statistics show that the number of international tourist arrivals is expected to increase further. All this is explained by the increase of the disposable income of residents as well as free time in the main sending countries. It can be stated that trends of tourism are encouraging. Of course, there are negative effects too, but experts say the biggest problem is still seasonality “which appears on both the supply and the demand side “(ÁKOSHEGYI – NÉMETH 2006). The natural attractions are highly dependent on the weather. Most people can only travel during a given period, families usually only in the summer during school breaks. As a result of this health tourism independent of seasonality has reinforced. „It is characteristic that while the saturation of domestic hotels is extremely low in January and February, the spa hotels’ turnover is relatively high at this time of the year too.” (BUDAI 2001) Today, the presence of Hungary in the international market is not strong enough, the opportunities are still largely unexploited. An important objective is “that the favourable effect of the baths established in larger settlements could be felt as well as enjoyed by the surrounding countryside.” (CSETE – LÁNG 2009) The improvements have already begun, but it can be said that there is a lack of coordination in this field. The offer of health tourism services supplying the guests is yet available. “We have highly trained Hungarian professionals thus the opportunities are given to Hungary to use the available thermal water logically “ (ÁKOSHEGYI – NÉMETH 2006).
2.1. Flexum Thermal and Spa Bath (Mosonmagyaróvár)
Mosonmagyaróvár tourism has gradually been evolving in recent years, which the available thermal water greatly contributes to, coming to the surface from a 2000 m deep well since 1966. A year later it was qualified as medicinal water. Today it belongs to the 5th best efficiency waters of Europe. The bath which is open all the year round has seven pools and two saunas, (finnish sauna
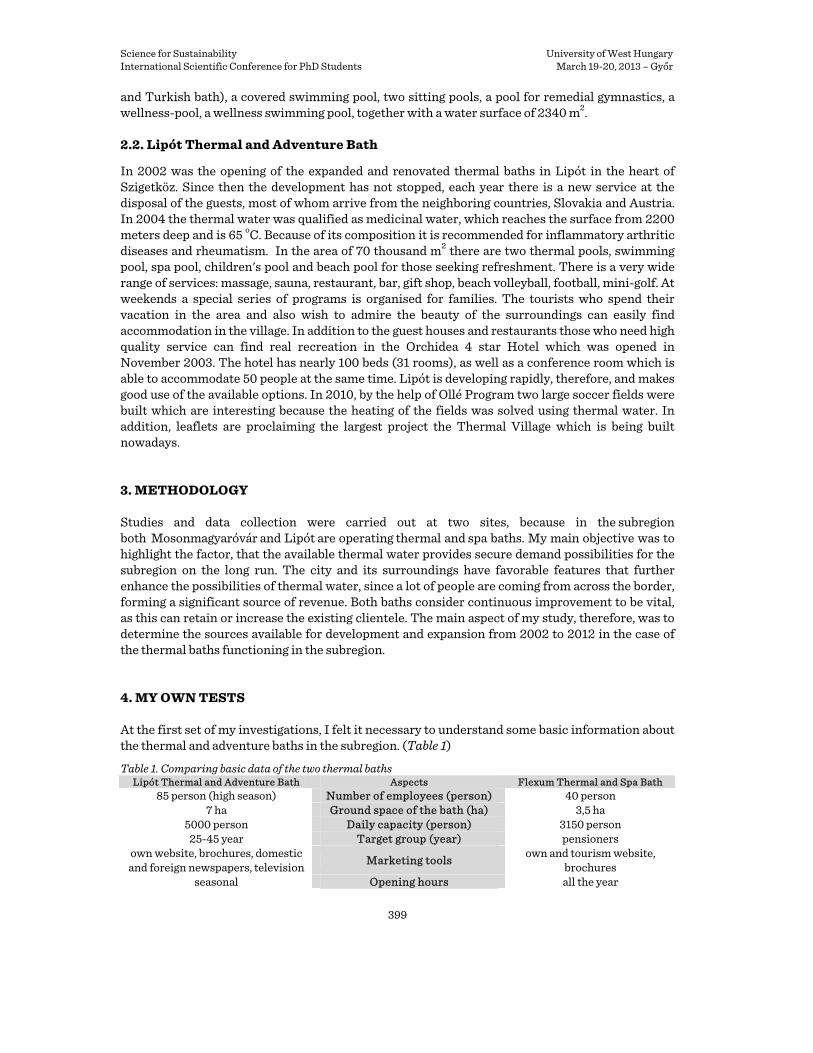
Science for Sustainability University of West Hungary International Scientific Conference for PhD Students March 19-20, 2013 – Győr
399
and Turkish bath), a covered swimming pool, two sitting pools, a pool for remedial gymnastics, a wellness-pool, a wellness swimming pool, together with a water surface of 2340 m2.
2.2. Lipót Thermal and Adventure Bath
In 2002 was the opening of the expanded and renovated thermal baths in Lipót in the heart of Szigetköz. Since then the development has not stopped, each year there is a new service at the disposal of the guests, most of whom arrive from the neighboring countries, Slovakia and Austria. In 2004 the thermal water was qualified as medicinal water, which reaches the surface from 2200 meters deep and is 65 oC. Because of its composition it is recommended for inflammatory arthritic diseases and rheumatism. In the area of 70 thousand m2 there are two thermal pools, swimming pool, spa pool, children's pool and beach pool for those seeking refreshment. There is a very wide range of services: massage, sauna, restaurant, bar, gift shop, beach volleyball, football, mini-golf. At weekends a special series of programs is organised for families. The tourists who spend their vacation in the area and also wish to admire the beauty of the surroundings can easily find accommodation in the village. In addition to the guest houses and restaurants those who need high quality service can find real recreation in the Orchidea 4 star Hotel which was opened in November 2003. The hotel has nearly 100 beds (31 rooms), as well as a conference room which is able to accommodate 50 people at the same time. Lipót is developing rapidly, therefore, and makes good use of the available options. In 2010, by the help of Ollé Program two large soccer fields were built which are interesting because the heating of the fields was solved using thermal water. In addition, leaflets are proclaiming the largest project the Thermal Village which is being built nowadays.
3. METHODOLOGY
Studies and data collection were carried out at two sites, because in the subregion both Mosonmagyaróvár and Lipót are operating thermal and spa baths. My main objective was to highlight the factor, that the available thermal water provides secure demand possibilities for the subregion on the long run. The city and its surroundings have favorable features that further enhance the possibilities of thermal water, since a lot of people are coming from across the border, forming a significant source of revenue. Both baths consider continuous improvement to be vital, as this can retain or increase the existing clientele. The main aspect of my study, therefore, was to determine the sources available for development and expansion from 2002 to 2012 in the case of the thermal baths functioning in the subregion.
4. MY OWN TESTS
At the first set of my investigations, I felt it necessary to understand some basic information about the thermal and adventure baths in the subregion. (Table 1)
Table 1. Comparing basic data of the two thermal baths Lipót Thermal and Adventure Bath Aspects Flexum Thermal and Spa Bath
85 person (high season) Number of employees (person) 40 person 7 ha Ground space of the bath (ha) 3,5 ha
5000 person Daily capacity (person) 3150 person 25-45 year Target group (year) pensioners
own website, brochures, domestic and foreign newspapers, television Marketing tools own and tourism website,
brochures seasonal Opening hours all the year

Science for Sustainability University of West Hungary International Scientific Conference for PhD Students March 19-20, 2013 – Győr
400
Table 2. Data of the implemented developments
Investor Year Source Sum Developments Lipót Thermal and
Adventure Bath 2002 Széchenyi Plan 25.000.000 Ft renewal of the pools, infrastructural development
Lipót Thermal and Adventure Bath 2004 self-financed several million Ft*
experience pool (600 m2): waterfalls, massage bench,
water mushroom Lipót Thermal and
Adventure Bath 2005 self-financed several million Ft* development of the buildings
Flexum Thermal and Spa Bath
2007-2008 self-financed 2 billion Ft
new adventure baths with space for relaxation, renewal of the
restaurant
Lipót Thermal and Adventure Bath 2009
Operative Programme
Western Transdanubia
220.000.000 Ft (support:
62.894.615 Ft)
beach pool ( 1200 m2 ), mini water park
Lipót Thermal and Adventure Bath 2012 New Széchenyi
Plan
132.707.080 Ft (support:
33.176.770 Ft) camp site
* The exact figures cannot be made public. The figures on the Table 1 clearly show that Lipót has twice the size of the available ground space compared to Mosonmagyaróvár and consequently has a higher daily capacity as well. The larger space also means more work, during the high season 85 employees are employed, which in a small village gives a lot of jobs for locals. The target groups are clearly determined by the image of the baths. The Table 2 shows the details of the developments carried out at the two baths. The Flexum Thermal and Spa Bath developed three new self-financed pools with spa area, which is associated with an esthetic relaxation area. The restaurant was renovated the range of services was expanded. As a result, the number of visitors has increased year - by year, reaching 240.000 people annually up to now. Construction of new changing rooms in the basement and transformation and renewal of the buildings is under way. Since 2002 the Lipót Thermal and Adventure Bath has been waiting for its guests with new attractions almost every year. As a result, tourist traffic reaching 50.528 people in 2002 has increased to nearly 140.000 up to now. The implementation of monetary developments in the spa was awarded through tenders in many cases. In 2012, the camp site was inaugurated at the opening of the season and its construction works began in the autumn of 2010. On the area of the camp site 13 fully equipped mobile homes are waiting for the tourists who want to spend a longer time relaxing.
5. CONCLUSIONS AND RECOMMENDATIONS
By the end of my study, it became clear for me that the two thermal baths play an important role in the touristic life of the subregion. For such a small town and its surroundings it is not easy to row tourist attractions, even if it is surrounded by a unique natural environment, such as Szigetköz. The focus is on the development, because in its absence, there would not be any interest experienced from the other side of the border and the two thermal baths would begin to merge in the long and monotonous line of Hungary’s spas. That is why I think that making use of the existing conditions the city and its environs could be made more attractive for tourist. In my opinion, the subregion would need complex "packages", which would be the solution to this problem. I mean, essentially, that alongside relaxation provided by the thermal water visitors would be offered active programs:

Science for Sustainability University of West Hungary International Scientific Conference for PhD Students March 19-20, 2013 – Győr
401
• water and horse –riding tours organised in Szigetköz, • showing folk customs and preparation of local dishes to the visitors, • multi-day festivals also offering cultural programs to the guests visiting the bath. The essence of the programs would be to encourage the visitors of the bath to stay several
days in the area. This would boost rural tourism as well.
References ÁKOSHEGYI GY. – NÉMETH I. (2006): A fürdők kézikönyve, Magyar Fürdőszövetség, Budapest 601-636. p BUDAI Z. (2001): A Széchenyi Terv keretében megvalósuló egészségturisztikai fejlesztések első félévének
eredményei, Turizmus Bulletin V. évfolyam 3. szám, Budapest CSETE L. – LÁNG I. (2009): A vidék fenntartható fejlesztése, MTA Történettudományi Intézet – MTA
Társadalomkutató Központ, Budapest 113-115. p.
Indicating and Assessing the Impacts of Road Traffic on Agricultural Areas in Hungary
MARTIN Gizella a * – MAKAI Krisztinaa aUniversity of Pannonia, Georgikon Faculty, Department of Meteorology and
Water Management, Keszthely, Hungary
Abstract – Road traffic is one of the major contributors of environmental pollution. Many negative effects of road and traffic have been identified, such as air pollution, fragmentation of habitats, heavy metal pollution, noise and artificial lighting. Negative effects of traffic are in the scope of researches as environmental issues in agriculture have become especially important both on political and social levels. Despite environmental friendly and green innovations in automotive industry, the increase in the number of vehicles and the dynamic growth of road traffic cause a significant and increasing pressure on biotic and abiotic factors of the environment. The objective of this study is to interpret these multidimensional effects by generating a road density indicator of agricultural areas. CORINE Land Cover 2006 and digital road maps of Hungary provided the basic data set. The year of analysis was 2006. The geographical coverage of the study was the 19 counties of Hungary (capital of Hungary is excluded). ArcGIS software was used to analyse data and create maps for visualize results. The investigated six agricultural land cover categories (non-irrigated arable land, vineyards, fruit trees and berry plantations, pastures, complex cultivation patterns, land principally occupied by agriculture with significant areas of natural vegetation) cover 67 % of the country’s area. The mean density of state roads in investigated area is 29,86 100km2/km. According to county level the mean road density is from 20,67 100km2/km to 45,12 100km2/km. The Hungarian road infrastructure is recently undergoing major road network reconstruction to improve its integration into the European network. We estimate that negative effects of traffic and road system on agricultural lands are more likely to rise in the near future.
Keywords: agriculture / traffic / density / pollution
1. INTRODUCTION
The negative effects of road traffic are very diverse. Primary, secondary and synergic effects of pollution originated from operating and maintaining vehicles are in the centre of researches. Several researches indicated heavy metal pollution and distribution in roadside soils, groundwater and in aerosols (HJORTENKRANS et al, 2006-ABECHI et al, 2010). These toxic elements are potential * Corresponding author: [email protected]; H-8360 Keszthely, Festetics u. 17.

Science for Sustainability University of West Hungary International Scientific Conference for PhD Students March 19-20, 2013 – Győr
402
risk to livestock fed on polluted crops and finally to human population according to bioaccumulation (KISS – VIDOVENYEC 2008). The noise- and light pollution caused by automobiles are also proved. These effects caused decline in the number of various species of birds (REIJNEN et al, 1996) and behavioural changes of frogs (PARRIS et al, 2009) within the populations. Recent studies provided quantitative evidence of ecological effects of road network. FORMAN (2000) estimated the land area directly affected ecologically by the system of public roads in the United States.
In our study we assess the complex effects of the expanding road network and road traffic on biotic and abiotic systems of agricultural areas by suggesting a road density indicator on agricultural lands.
2. METHODS
2.1. Indicator process
Constructing the indicator we set up criterions to which the suggested measurement had to meet. These criterions determined the examined year, type of roads and type of investigated agricultural area (Table 1). The road network includes only national roads in the county excluding municipal roads. Road density is the ratio of the length of the county's road network to the county's agricultural land area (km of road per 100 km2 of agricultural land).
In order to fully interpret the suggested road density indicator we chose five variables to put road density indicator in a more precise context. These were as follows: number of vehicles; rate of gas oil and petrol powered vehicles (including passenger cars and lorries); rate of petrol and gas oil-other fuel powered vehicles (including passenger cars and lorries); annual average daily traffic (AADT) and average age of vehicles. To see changes of additional variables we chose 2006 as the basic year of comparison and values of the year 2010. Data obtained was normalized and then were displayed in the form of polygon. As a result we had the opportunity to compare changes among all NUTS3 regions and analyse the changes from 2006 to 2010.
2.2.Data source
We used Corine Land Cover 2006 (CLC2006) and digital road maps of Hungary as basic data set to define agricultural areas affected by traffic. For data processing we used ArcGIS 9.1 and Excel software.
3. RESULTS
The total road network of the 19 counties (Table 2) was 30 936,14km and the total land area was 92 485,94km2. (The road system and area of Budapest was excluded.) The average road density on 100km2 area was 33,45km road. Among NUTS3 regions this value ranged from 23,51 (County of Jász-Nagykun-Szolnok) to 45,45 (County of Vas). The Corine Land Cover categories we examined covered 62 013, 37km2, 67,05% of the country’s total land area. The total length of the road network on agricultural land was 18 518,61km, 59,86% of total road network. The average road density on agricultural land was 29,86km2/km. The highest road density on agricultural land was in the County of Zala (45,12km2/km) and the lowest in the County of Jász-Nagykun-Szolnok (20,67km2/km). In average, 59,86% of the total road network runs along agricultural land ranging form 74,56% in the County of Csongrád to 48,89% in the County of Pest.

Science for Sustainability University of West Hungary International Scientific Conference for PhD Students March 19-20, 2013 – Győr
403
The five additional variables we analysed show the degree and direction of changes of traffic characteristics (Table 3) between 2006 and 2010. Increasing rate shows negative direction of changes while declining rate indicates positive changes from the year 2006. There is a declining trend of AADT in average, although the rate of change is from -3,41 in the County of Fejér to 6,5 in the County of Nógrád. The reduction of ADDT is detected in 13 counties. According to the other four variables the direction of changes shows negative trends in different rates.
Table 1. Criterions of indicator selection, examined year, type of Corine Land Cover 2006 categories and public road types
Criterions, examined year, land cover categories and road typesCriterions for choosing the indicator
cost-effectivenesstime-effectivenesscomprehensible interpretationrepeatabilitycan be applied to different geographical scale
Examined year2006
CLC2006 areasnon-irrigated arable landvineyardsfruit trees and berry plantationspasturescomplex cultivation patternsland principally occupied by agriculture with significant areas of natural vegetation
Road typesmotorwaysmotor roadsprimery main roadssecundary main roadsthrough roadsapproach roads
4. CONCLUSIONS
Our aim was to indicate and assess the multidimensional effects of road traffic on agricultural land in Hungary. We suggested a road density indicator of agricultural lands to understand how and what extent the road traffic and road network could negatively affect not only human populations, but populations of agricultural areas.
In order to recognise geographical differences we defined the basic spatial unit of our research on a county/NUTS3 region. Budapest was excluded of the observation. Criterions of constructing the indicators defined that the basic year of our research was 2006. Corinne Land Cover 2006 database was not prepared after 2006 but an updated database is likely to be accessible at the beginning of 2013. The new Corinne database would make it possible to analyse changes according to the road density indicator values. Additional road traffic variables were analysed to estimate the impacts of road traffic on agricultural lands. We detected negative changes in four of the traffic features and only the annual average daily traffic values showed positive change. The results show that the negative effects originated from road traffic and road network are likely to influence agricultural lands and agricultural systems in the near future.

Science for Sustainability University of West Hungary International Scientific Conference for PhD Students March 19-20, 2013 – Győr
404
Table 2. Road density and length of public road network on agricultural areas defined by Corine Land Cover 2006 categories in 2006
NUTS3 regions
Average road density of
region
(100km2/km)
Total road network along examined
Corine categories(km)
Road density of Corine categories
(100km2/km)
Rate of public roads along Corine
categories (%)
Rate of total region area and area of
Corine categories (%)
Bács-Kiskun 26,76 1 549,69 26,25 68,59 69,91 Baranya 36,65 1 028,03 35,04 63,32 66,23 Békés 26,00 1 073,20 22,00 73,32 86,66 Borsod-Abaúj-Zemplén 35,03 1 496,50 35,59 58,95 58,02 Csongrád 33,20 1 055,05 30,20 74,56 81,97 Fejér 33,96 865,97 26,25 58,52 75,70 Győr-Moson-Sopron 41,23 1 013,14 35,67 58,40 67,50 Hajdú-Bihar 26,81 1 090,45 24,80 65,51 70,82 Heves 34,69 697,93 30,88 55,32 62,14 Jász-Nagykun-Szolnok 23,51 954,05 20,67 72,71 82,69 Komárom-Esztergom 39,11 493,24 36,54 55,69 59,61 Nógrád 36,87 484,44 38,27 51,64 49,75 Pest 40,83 1 277,99 34,05 48,98 58,73 Somogy 28,59 903,86 26,47 52,38 56,58 Szabolcs-Szatmár-Bereg 36,03 1 178,54 27,36 55,13 72,61 Tolna 29,08 694,14 25,34 64,46 73,97 Vas 45,45 870,17 41,80 57,40 62,40 Veszprém 36,01 871,37 38,98 53,87 49,77 Zala 44,29 920,86 45,12 54,96 53,94 Total*/Average 33,45 18 518,61* 29,86 59,86 67,05
Table 3. The degree and direction of changes of additional variables to describe changes of road traffic between 2006 and 2010
NUTS3 regionNumber of
Vehicles at the end of the year
Rate of gas oil and petrol
powerd vehicles
Rate of petrol and gas oil-other fuel powered vehicles
Annual average
daily traffic
Average age of vehicles at the end of the year
Bács 3,38 22,14 0,18 -3,19 10,00Baranya 3,13 23,91 0,12 -5,99 8,71Békés 1,60 17,72 -0,03 5,63 9,71Borsod-Abaúj-Zemplém 2,56 18,51 0,06 2,70 10,65Csongrád 3,71 20,45 0,20 0,63 9,92Fejér 2,88 19,45 0,00 -13,24 10,66Győr-Moson-Sopron 6,92 29,16 0,00 -1,98 11,02Hajdú-Bihar 2,94 19,22 -0,01 -3,51 12,75Heves -0,01 16,45 0,12 -4,54 13,03Jász-Nagykun-Szolnok 2,18 17,30 -0,01 4,15 11,79Komárom-Esztergom 3,11 17,65 0,00 2,54 10,93Nógrád 1,08 17,92 -0,05 6,05 12,82Pest 7,00 24,37 -0,10 -7,17 10,79Somogy 4,07 19,72 0,15 -12,51 11,38Szabolcs-Szatmár-Bereg 0,15 16,45 0,00 -10,25 14,03Tolna 4,64 21,53 0,04 -8,66 9,63Vas 6,02 18,13 0,07 -3,27 10,97Veszprém 3,93 23,88 0,09 -0,42 11,23Zala 4,75 23,20 0,04 -1,16 10,92Average 3,37 20,38 0,04 -2,85 11,10
Acknowledgements: We wish to thank for TÁMOP-4.2.2/B-10/1-2010-0025. This project is supported by the European Union and co-financed by the European Social Fund.

Science for Sustainability University of West Hungary International Scientific Conference for PhD Students March 19-20, 2013 – Győr
405
References ABE CHI, E. S. – OKUNOLA, O. J. S. – ZUBAIRU, M. J. – USMAN, A. A. – APENE, E. (2010): Journal of Environmental
Chemistry and Ecotoxicology Vol. 2(6), pp. 98-102, August 2010 FORMAN, Richard T. T. (2000): Estimate of the Area Affected Ecologycally by the road System in the United
States. Conservation Biology, 14: 31-35. doi: 10.1046/j.1523-1739.2000.99299.x HJORTENKRANS, DST. – BERGBÄCK, BG. – HÄGGERUD, AV. (2006): New Metal Emission Patterns in Road
Traffic Environments. Environmental Monitoring and Assessment, 117(1-3): 85-98 KISS T. – VIDOVENYECZ V. (2008): Szeged környezeti terhelésének vizsgálata a fák évgyűrűiben és a levélen
mért ülepedő por nehézfémtartalma alapján. In: CSORBA P. – FAZEKAS I. (ed.): Tájkutatás–Tájökológia. Debrecen: Meridián Alapítvány pp. 423-431
PARRIS, K. M. – VELIK-LORD, M. – NORTH, M. A. (2009): Frogs call at higher pitch in traffic noise. Ecology and Society 14(1):25
REIJNEN, R. – FOPPEN, R. – MEEUWSEN, H. (1996): The effects of road traffic on the density of breeding birds in Dutch agricultural grasslands, Biological Conservation 75 (1996) 255-260
Competitive Marketing Strategies in the Poultry Housing Equipment Market
BENKE Hedvig
Galgóczi E. str. 8/E, 9012 Győr, Hungary E-mail: [email protected]
Abstract - The objective of the presentation is to show the different marketing strategies of two Hungarian broiler fodder supply equipment distributors. During the analysis we have found differences in their marketing activities. The applied marketing costs are not the same in value but are determinative for the profitability of the companies, as they have a stronger than medium impact on both the revenue and earnings. In the area of marketing communication substantive differences were found, however both companies considered „personal sales” as the most important marketing communication tool.
On the other hand, the decision of the investing broiler farmers depends on the availability of governmental subsidies but the technical parameters of the product have the greatest influence on the decision making, followed by „personal sales” and „price”.
All in all we can conclude that the competitive marketing strategy mainly depends on the distributor’s partnership with the other market players; the emphasis put on marketing, (marketing costs), the applied marketing communications tools.
Keywords – broiler fodder supply equipment / marketing strategy / personal sales / marketing costs
1. INTRODUCTION
A basic element of the poultry housing equipment is the broiler fodder supply equipment. Modern technology increases the efficiency of the equipment, which is having a direct impact on the performance of production. The selection of automatic broiler fodder supply equipment (feeding and drinking systems) mainly depends on the offer of the market broiler farmers (users) may choose from. Their choice is highly influenced by various aspects (price, technical parameters, services offered, warranty, etc.). The so called competitive marketing strategy is primary important for the ones offering the product but providing a better offer as a result of that (price decrease, higher technical level, flexible distribution, etc.) is advantageous for the users.

Science for Sustainability University of West Hungary International Scientific Conference for PhD Students March 19-20, 2013 – Győr
406
Analyzing the broiler sector in depth there are several weaknesses to be recognized that are having a disadvantageous impact on its competitiveness.
KESZI et al. (2003) as well as FÖLDI (2012) consider the lack of capital and the out of date barns, equipment as the biggest problems.
Another problem is that the stables currently in use were not built based on the needs of the given species. According to literature it would be inevitable to modernize at least 50% of the barns in order to increase competitiveness.
FÖLDI (2012) draws the attention to another weakness of the sector, namely the decreasing profitability that is also reducing competitiveness as such. This can be explained by the ever increasing fodder prices.
POPP (2007) considers the lower competitiveness of the sector by the lower overall and natural performance indicators in comparison with international figures.
Further automatization of the broiler farms as well as modernization of the equipment used would improve the performance indicators and profitability of the farms and at the same time would create sales potential for the broiler fodder supply equipment distributors.
The broiler fodder supply equipment distributors have an own, unique marketing strategy. To keep one’s position and to expand in a continuously more competitive market is only possible by having a successful marketing strategy. The basis of one’s good performance and competitiveness is the applied competitive marketing strategy.
Success in the market is achieved by understanding and satisfying the needs of the consumer (user).Thus marketing strategy is the most important tool to improve competitiveness. (PARRAGH 2011).
Key to success is to offer a product to the market that satisfies the market needs to the greatest extent while creating maximum customer satisfaction as well. (KOTLER 2006)
In the literature, the specialists consider the gaining and keeping of a competitive advantage towards the competitors as the most important task of a marketing strategy. Instead of comparative advantages, PORTER (1993) highlights the role of competitive advantages.
Current study deals with two broiler fodder supply equipment distributors (company „A” and „B”) and shows the aspects influencing their marketing strategies. It also gives insight into the ranking of the factors of having the greatest influence on decision making during the sales of fodder supply equipment based on both the distributors’ as well as the users’ (eight broiler farmers) assessment.
The main aim of this study is to answer the hypotheses phrased before starting the examinations.
One part of the examinations aimed at the verification of the hypothesis stating that: marketing and the related expenses spent on the activities of the national distributors involved in the sales of fodder supply equipment differ at the companies but their impact on the profitability of the companies is significant.
Another part of the examinations done in connection with the analysis of the marketing activities, marketing strategies of the two broiler fodder supply equipment distributors aimed at the assessment of the main aspects of the marketing strategies, assuming that: there are differences in the use of marketing communication tools at the examined companies but both of them consider personal sales as one of the most important one.
Further examinations were done to see what factors play an important role in the decision making of broiler farmers when purchasing fodder supply equipment supposing that: broiler farmers consider price as the most crucial one whereas distributors believe that the expertise and persuasion of the sales person have the greatest influence on the buyer’s decision making.
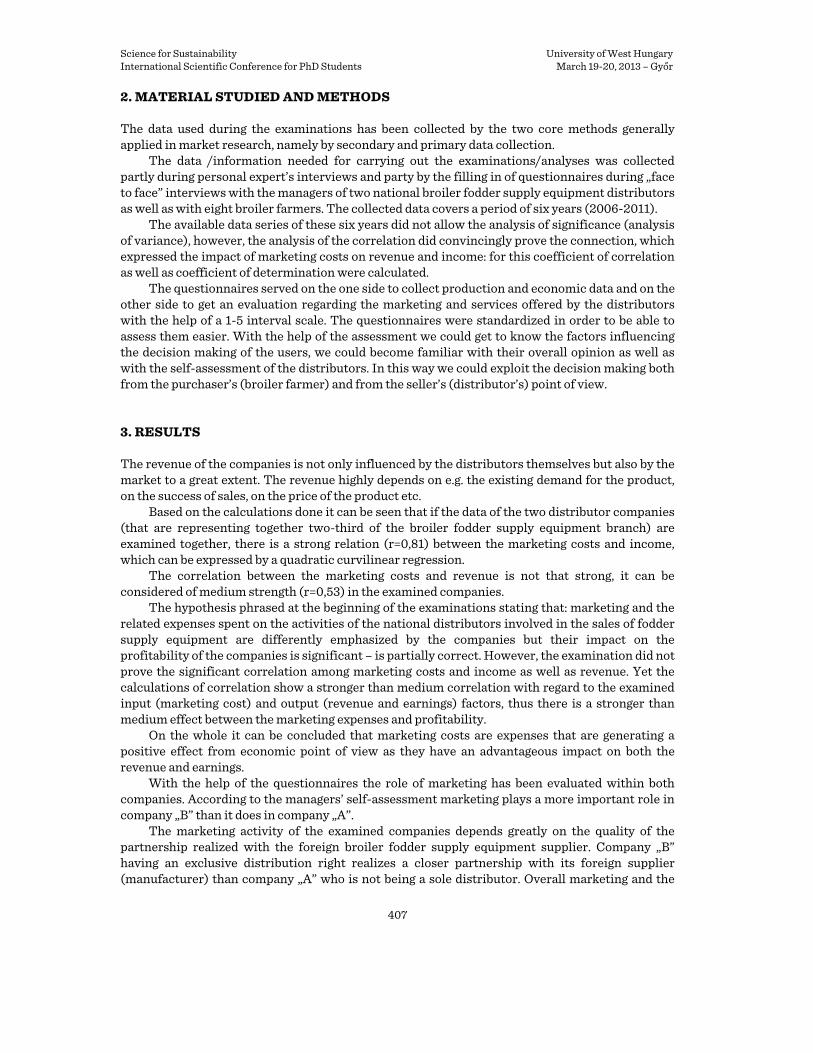
Science for Sustainability University of West Hungary International Scientific Conference for PhD Students March 19-20, 2013 – Győr
407
2. MATERIAL STUDIED AND METHODS
The data used during the examinations has been collected by the two core methods generally applied in market research, namely by secondary and primary data collection.
The data /information needed for carrying out the examinations/analyses was collected partly during personal expert’s interviews and party by the filling in of questionnaires during „face to face” interviews with the managers of two national broiler fodder supply equipment distributors as well as with eight broiler farmers. The collected data covers a period of six years (2006-2011).
The available data series of these six years did not allow the analysis of significance (analysis of variance), however, the analysis of the correlation did convincingly prove the connection, which expressed the impact of marketing costs on revenue and income: for this coefficient of correlation as well as coefficient of determination were calculated.
The questionnaires served on the one side to collect production and economic data and on the other side to get an evaluation regarding the marketing and services offered by the distributors with the help of a 1-5 interval scale. The questionnaires were standardized in order to be able to assess them easier. With the help of the assessment we could get to know the factors influencing the decision making of the users, we could become familiar with their overall opinion as well as with the self-assessment of the distributors. In this way we could exploit the decision making both from the purchaser’s (broiler farmer) and from the seller’s (distributor’s) point of view.
3. RESULTS
The revenue of the companies is not only influenced by the distributors themselves but also by the market to a great extent. The revenue highly depends on e.g. the existing demand for the product, on the success of sales, on the price of the product etc.
Based on the calculations done it can be seen that if the data of the two distributor companies (that are representing together two-third of the broiler fodder supply equipment branch) are examined together, there is a strong relation (r=0,81) between the marketing costs and income, which can be expressed by a quadratic curvilinear regression.
The correlation between the marketing costs and revenue is not that strong, it can be considered of medium strength (r=0,53) in the examined companies.
The hypothesis phrased at the beginning of the examinations stating that: marketing and the related expenses spent on the activities of the national distributors involved in the sales of fodder supply equipment are differently emphasized by the companies but their impact on the profitability of the companies is significant – is partially correct. However, the examination did not prove the significant correlation among marketing costs and income as well as revenue. Yet the calculations of correlation show a stronger than medium correlation with regard to the examined input (marketing cost) and output (revenue and earnings) factors, thus there is a stronger than medium effect between the marketing expenses and profitability.
On the whole it can be concluded that marketing costs are expenses that are generating a positive effect from economic point of view as they have an advantageous impact on both the revenue and earnings.
With the help of the questionnaires the role of marketing has been evaluated within both companies. According to the managers’ self-assessment marketing plays a more important role in company „B” than it does in company „A”.
The marketing activity of the examined companies depends greatly on the quality of the partnership realized with the foreign broiler fodder supply equipment supplier. Company „B” having an exclusive distribution right realizes a closer partnership with its foreign supplier (manufacturer) than company „A” who is not being a sole distributor. Overall marketing and the

Science for Sustainability University of West Hungary International Scientific Conference for PhD Students March 19-20, 2013 – Győr
408
applied marketing strategy gets a bigger emphasis in case of company „B” that can also be explained by the closer business relation (e.g. defining their marketing strategy together). Company „B” gave a lower score for the innovation activity of its supplier than company „A” did, which suggests that the core strategy of the two foreign manufacturers differs: the supplier of company „A” is a manufacturer putting the emphasis on product development and innovation whereas the supplier of company „B” is a company that focuses on the marketing of its products.
The examinations also aimed at the marketing communication strategy of the two companies: From Figure 1 it can be seen that personal sales and reference farms are the most important
for both companies. During the expert’s interviews done with the managers of the companies it was confirmed that the reliability of the sales person and personal relation with the partners is key to success. The business relation does not stop by the realization of sales but also includes continuous follow-up, consultancy and providing professional information. Company „B” puts an especially great emphasis on the education of its partners by the professional assistance given during the sales activity, by publishing expert articles, by sending DM letters about the newest technologies/developments, by giving online consultancy, by publishing guides and useful information on its website, etc.
Company „A” uses limited marketing communication tools. It organizes „partner days” where the invited foreign suppliers (manufacturers) and the representatives of the national distributor give presentations to the invited partners on the latest innovations. Another advantage of this professional event is that the invited ones can interact with one another, may exchange their experiences, may gather information from other farmers and so can compare their own performance with those (benchmarking). The use of own leaflets is more important at company „A”, the reason for this is that being the representative of six foreign suppliers, company „A” is present in the market under its own name (offering the products of six companies) with an own leaflet whereas company „B” being an exclusive distributor it uses the translated leaflet of the represented only supplier. Besides personal sales both companies ranked the role of reference farms high during their assessment. The reason for this is that reference farms give the opportunity for potential buyers to see the wished technology during operation and to discuss the experiences of the operator and hear its objective opinion.
Figure 1: The applied marketing communication tools and their importance in the two companies

Science for Sustainability University of West Hungary International Scientific Conference for PhD Students March 19-20, 2013 – Győr
409
Figure 2: Factors influencing the decision making of investors with their ranking
Based on the results the hypothesis stating that: there are differences in the use of marketing
communication tools at the examined companies but both of them consider personal sales as one of the most important one – is correct.
The other main area of the primary research dealt with the users (broiler farmers) where the decision making process, the preparation of the decision, the aspects influencing the decision were exploited. From the interviews and questionnaires it turned out that the realization investments aiming at the automatization and modernization of broiler farms depends mainly on the availability of government subsidies. If there is chance to obtain a government subsidy the investor (broiler farmer) decides to go on with the realization, if there is no available subsidy the investment is being postponed to a later stage. The subsidy is in close relation with the price as it has a significant impact on the investment costs.
Based on the above the government subsidy was not included among the factors influencing the decision making as it is a factors standing „above” all other factors.
From Figure 2 it can be seen that seven factors (excluding government subsidy) were identified that have an especially great influence on the investments aiming the purchase of broiler fodder supply equipment. During the selection of the technology the most important criterion is the technical performance of the product that includes the feeding and drinking space of the product, the possibility of minimizing fodder spillage (waste), the anti-stick property of the inner cone of the feed bin, etc. The second most important factor in the ranking is personal sales based on the answers of the broiler farmers. The quality of the business relation between the distributor and the client, especially the trust towards the sales person (concerning its expertise and creditability) and often previous business experience play a crucial role in the purchase process. The price of the product as an influencing factor got almost the same % value as personal sales so it is as determinative as personal sales during the technology purchase. Price includes elements like the price-value rate of the product or the payment conditions offered by the distributor. According to the analysis the fourth factor in the ranking is quality that was evaluated separately from the technical parameters by the participants of the survey. In this meaning quality represents aspects like the reliability of the product, durability, change of re-purchase of the equipment.
Science for Sustainability University of West Hungary International Scientific Conference for PhD Students March 19-20, 2013 – Győr
410
The remaining three factors are far behind the previous four elements. It is surprising that the service back-up/guarantees related to the product, the offered services as well as the importance of reference places were ranked much lower by the broiler farmers.
The reason for this could be that as we are speaking about products with a very high technical content and of high quality, the occurrence of any defaults, damages is less likely and so the significance of warranties and available 24 hour service background is more moderate.
On the basis of the above presented results the hypothesis stating that: broiler farmers consider price as the most crucial one whereas distributors believe that the expertise and persuasion of the sales person have the greatest influence on the buyer’s decision making - is not correct regarding the opinion of the broiler farmers but is correct concerning the distributors’ judgment. In case of the investors (broiler farmers) the decision is made based on (primary the availability of government subsidies) the technical parameters of the product. This also confirms the expectation of the distributors who ranked personal sales as the most decisive factor. Given the fact that we are dealing with the sales of equipment with technical solutions (technologies) it is understandable that the technical parameters dominate in the decision making of broiler farmers during the purchase of new equipment.
4. CONCLUSION
The fact that the core strategy of the two examined companies is rather different does not prevent them from being market leaders in the national broiler fodder supply equipment market. In company “A” it is of product development whereas in company “B” it is differentiation. Not only their core strategies differ but their marketing strategies are also different, which can primary be seen in the priority ranking of the strategic elements (factors). The amount of money spent on marketing and the time variation is also different. Marketing activities are considered of high importance at both companies and the companies are ready to allocate financial means for the improvement of the marketing activities as much as possible.
The surveys of the six years (2006-2011) and the mathematical-statistical analyses done confirm that in both companies there is a stronger than medium correlation between marketing costs and sales revenue as well as the earnings.
Comparing the results of the examinations done regarding the decision making of the broiler farmers and the assessment of the distributors the followings can be concluded: - the distributors consider personal sales as the most important one among the marketing
communication tools (influencing the decision of the investor); - the investors (broiler farmers) consider the technical parameters of the product and personal
sales as the two most important factors in decision making so it can be stated that the distributors and the broiler farmers have the same opinion in this regard;
- price is also considered an important influential factor (almost the same as personal sales) by the investors but it is not the most important one when making a decision. Based on the results of the assessment the marketing strategy of company “A” is to build a
private brand, which is done by emphasizing the importance of the own services offered but at the same time using limited marketing communication tools. Company “B” being a representative with an exclusive distribution right, making good use of the marketing support provided by the foreign supplier opts for the use of a much wider range of marketing communication tools. The special importance of the technical parameters of the product and of personal sales has been given a high ranking by both companies.
With the help of the results of the examinations we could identify the points where the distributors and users think in a similar way; in these fields we can consider the marketing strategy of the distributors successful. Those areas where there are differences between the way of
Science for Sustainability University of West Hungary International Scientific Conference for PhD Students March 19-20, 2013 – Győr
411
thinking of the distributors and broiler farmers are the ones where further improvement of the marketing activity is inevitable in order to satisfy customer needs to the maximum extent and so become as competitive as possible. References FÖLDI P. (2012): Az egyetlen talpon lévő állattenyésztési ágazat, a baromfiágazat jelenlegi helyzete és
kilátásai. [The only animal husbandry sector keeping its position , the current situation and perspectives of the poultry sector.] Prezentációs anyag, 1-18- dia. (in Hungarian)
KESZI A. – CSORBAI A. – JANKOVICS P. – KALMÁR S. (2003): Az integrált brojlerhús előállítás pénzügyi problémái Magyarországon. [The financial problems of the integrated broiler meat production in Hungary.] Agrárgazdaság, vidékfejlesztés és agrárinformatika az évezred küszöbén, AVA konferencia 2003. április 1-2., 1-11. pp. (in Hungarian)
KOTLER, PH. – KELLER, K. L. (2006): Marketingmenedzsment. [Marketing Management.] Akadémiai Kiadó, Budapest, 2006, 75-153. pp, 290-321. pp, 487-519. pp, 694-733. pp (in Hungarian)
PARRAGH B. (2011): Marketingstratégia vállalati versenyképességhez való hozzájárulása, Marketingstratégiai javaslatok szekunder és primer piackutatás alapján [The contribution of marketing to the corporate competitiveness, marketing strategic recommendations based on primary and secondary market research.] University of Óbuda, Faculty of Keleti Károly, Institute of Enterprise management (in Hungarian)
POPP J. (2007): A baromfiágazat jelenlegi helyzete és jövőbeni kilátásai. [The current situation and future perspectives of the poultry sector.] In: Ágazatspecifikus innováción alapuló projektek generálása a baromfiágazatban – Konferencia, Debrecen, 2007. 04. 26. (in Hungarian)
PORTER, M.E. (1993): Versenystratégia. [Competitive strategy.] Budapest, Akadémiai Kiadó (in Hungarian)
Stress Intensity in Young Hucul Horses During Grooming and Training
OLCZAK, Katarzynaa*– TISCHNER, Marekb
aDepartment of Swine and Small Ruminant Breeding, Univeristy of Agriculture in Krakow, Krakow, Poland bDepartment of Animal Reproduction and Anatomy, Univeristy of Agriculture in Krakow, Krakow, Poland;
Abstract – The paper reports on stress intensity of horses during grooming, training and habituation to novelty using heart rate reserve as an indicator. The experiment was conducted on six of three-year old hucul colts. Training was based on natural horsemanship techniques. Habituation to a rustling nylon bag was the most stressful task to which horses showed a significant habituation after 10 weeks of training. On the contrary, inspection of the nose, mouth, ears calmed nervous horses often causing negative heart rate reserve value. Yielding form pressure did not cause significant changes in heart rate variability, only small changes were observed probably caused by movement. The existence of long term memory was also proved.
Keywords: horse / stress / horsemanship / habituation / heart rate
* Corresponding author: [email protected], ul.Repecka 94, 42-612 Tarnowskie Góry, Poland

Science for Sustainability University of West Hungary International Scientific Conference for PhD Students March 19-20, 2013 – Győr
412
1. INTRODUCTION
1.1. Horse’s behaviour
Stanley E. CURTIS and Katherine A. HOUPT (1983) emphasize the importance of ethology. Growing knowledge about animals’ behaviour improves the living conditions of the animals, known as welfare. Furtheremore, the animals’ physical and psychological comfort increase economic benefits. What is more, horses become an integral part of humans life: sport, recreation, ranch work, hippotherapy, art etc. Moreover, horses have very sensitive nervous system. Equine fear reactions may be very dangerous for both: human and an animal. Robert MILLER, a veterinarian, one of the pioneers of imprinting, noticed that proper working with foals facilitate subsequent cooperation with adult individuals (MILLER 2003). Monty Roberts, famous natural horsemanship trainer, developed methods of communication based on horses natural behaviour. He uses this technique to gain equine confidence (ROBERTS 1997). Scientists have different opinions on the best training horses techniques. It is important to find appropriate methods to assess the effectiveness of different methods.
1.2. Anatomical and physiological basis of behaviour
If the situation is recognized as dangerous, there are three biological responses: behavioural, autonomic and neuroendocrine. Classification of the stimulus may vary between individuals depending on their temperament and past life experiences (CHRISTENSEN 2006).
The limbic system has three tasks: 1. Analysing of the situation in terms of danger 2. Choosing the proper tactics 3. Running effective behavioural responses (SADOWSKI 2006). Physiological responses to stressful situations have commonly been used to provide
quantitative and objective measures that provide further evidence of an animal’s mental state. Measures of sympathetic activation such as heart rate variability and hypothalamicpituitary- adrenal activation have been used to assess the physiological response of the horse to potentially stressful situations such as transport (HALL et al. 2012), (TISCHNER, NIEZGODA 2000). What is more, heart rate measurements is used for assesing the equine temperament. This will allow to choose proper horses for different tasks (VISSER et al. 2002).
The aim of the study was to determine difference in stress reactions to different tasks with assessing the effect of habituation and long term memory.
2. MATERIALS AND METHODS
Six three year old hucul colts from Nielepice Hucul Horses Stud in Poland were used in this study. Horses were maintained on pastures during all year. Prior to the study, all horses were accustomed to people and leading with the leadline.
During ten weeks horses were trained using natural horsemanship techniques. To determine the existence of long term memory in horses, training was repeated after a three-month break. Horses were trained 3 minutes for each task. Heart rate was measured with a heart rate monitor: Polar Horse Trainer S810i. To avoid the influence of temperature or other factors on the resting heart rate the stress intensity was assessed using heart rate reserve as an indicator. Behavioural response was also observed.
Each horse performed three different tasks that may facilitate subsequent work with them: • Habituation to rustling nylon bag (exposure to a novel stimulus) • Yielding from pressure

Science for Sustainability University of West Hungary International Scientific Conference for PhD Students March 19-20, 2013 – Győr
413
• Inspection of the nose, mouth and ears (grooming) For statistical analysis program STATISTICA was used. The average heart rate reserve of all
individuals was taken. Heart rate data influenced by external factors were removed. Each task was analyzed separately using Wilcoxon matched pair test. Week 1 with 10, and 10 with 25 were compared to assess the effect of habituation and long term memory.
3. RESULTS
Habituation to rustling nylon bag (Figure1) was the most stressful task for horses. The average heart rate reserve value was 52 and the highest value for an individual reached 91. Horses showed a significant habituation after 10 weeks of training (Z=2.023, p=0.04) as also remembered the task after a three month break (Z=0.674, p=0.5). Behavioural response was very impulsive during first training sessions and after ten weeks horses stood calm.
Inspection of the nose, mouth and ears (Figure1) did not cause stress response. At thirst training the average heart rate reserve value was 5. After three weeks the negative heart reserve was observed. The lowest value for an individual horse reached -13 during stormy weather. Those results suggest that grooming may calm nervous horses. There were no significant differences between weeks 1-10 (Z=1.214, p=0.22), and 10-25 (Z=0.405, p=0.68) for this task, however, the trainer observed changes in colts behavior.
Yielding form pressure (Figure1) did not cause significant changes in heart rate variability; only small changes were observed probably caused by movement. This suggests that it is not stressful for young horses. There were no significant differences in heart rate reserves between trainings: week 1-10 (Z=0.405, p=0.68), 10-25 (Z=0.674, p=0.50) On the other hand, horses’ reaction had changed a lot.
As mentioned above the results confirmed existence of long-term memory in horses. It was proved by statistical analysis as well as the behavioural observations.
Figure 1. Stress intensity of young hucul horses for three different tasks. Error bars indicate standard
deviation. – Fifth week - results probably were affected by the weather (strong wind, rain and low temperature).
4. DISCUSSION
In that paper the stress response to different elements of training of young hucul horses was illustrated. Understanding of horses’ reaction is very important to improve animal welfare and increase economic benefits. Proper handling and training may enhance breeding and sport results.
Gentle handling reduces the physiological stress response and makes the horses calmer and ready (willing) to cooperate (WARING 2003; MILLS 2010). In this study it was shown that grooming causes a decrease in heart rate. The same results are observed during intraspecific mutual care

Science for Sustainability University of West Hungary International Scientific Conference for PhD Students March 19-20, 2013 – Győr
414
(MILLS 2010). This suggests that the bond between man and horse can be enhanced by cleaning the animals. What is more, inspection of the nose, mouth and ears facilitates the work of the vet. Young horses habituation to veterinary care may reduce stress and risk of injury during treatment (MILLER 2003).
Habituation to rustling nylon bag increase confidence in the coach. As the horse’s confidence increases, self-preservation decreases, making work safer. Furthermore, during training horses reaction was remodeled from sudden “flight or fight” reaction to standing calm. This effect has been described by SKORUPSKI (2006). In this study strong habituation to rustling nylon bag was observed. Similar observations were reported by CHRISTENSEN (2010) and POHJOLA (2011).
Yielding from pressure was a task to improve human-horse communication and increase horses’ willing submission. That task is very popular in natural horsemanship techniques and improves future work under the saddle. The results show that yielding from pressure is not stressful for animals. In addition, it was observed that horses with each training session reacted to more subtle signals.
In accordance with the results of Gibel and Dixon, these results also indicate the existence of long term memory in horses. The results suggest that horses remember what they learned before for at least few months (WARING 2003). In this study after three-month break horses remebered the tasks and the stress reaction was not observed. What is more, some horses remebered the sequence of the tasks.
Appropriate handling and early habituation of young horses greatly facilitate subsequent work with them and improve safety of workers and untrained handlers by reducing the risk of sudden fear reaction of the horse.
References CHRISTENSEN, J. W. (2010): Object Habituation. 44th Congress of the International Society for Applied
Ethology, Wageningen Academic Publishers, Uppsala: 19 CURTIS, S. – HOUPT K. (1983): Animal Ethology: Its emergence in animal science. In: Journal of animal
science, vol. 57 HALL, C. – HUWS, N. – WHITE, C. – TAYLOR, E. – OWEN, H. – MCGREEVY, P. (2012): Journal of
Veterinary Behavior. Assessment of ridden horse behavior. http://www.journalvetbehavior.com/article/S1558-7878%2812%2900077-9/abstract
MILLER, R. (2003): Sekrety końskiego umysłu. Galaktyka, Łódź: 11-15 MILLS, D. S. (2010): The Encyclopedia of Applied Animal Behaviour and Welfare. CABI, Publishing
Wallingford POHJOLA, J. (2011): The effects of positive reinforcement training on horse’s loading behaviour. In: Applied
Animal Behaviour, 22.04.11 ROBERTS, M. (1997): The Man Who Listens to Horses. Alfred A Knopf, Canada: 231 SADOWSKI, B. (2006): Biologiczne mechanizmy zachowania się ludzi i zwierząt. PWN, Warszawa: 21-28,
380, 432-433, 466-467, 470-472, SKORUPSKI, K. (2006): Psychologia treningu koni. PWRiL, Warszawa: 31-39, 115-125 TISCHNER, M. Jr. – NIEZGODA, J. (2000): Effect of transport on the intensity of stress reactions in mares
and foals. J Reprod Fertil, vol.56: 725-730 VISSER, E. K. – van REENEN, C. G. – van der WERF, J. T. N. – SCHILDERC, M. B. H. – KNAAP, J. H. –
BARNEVELD, A. – BLOKHUIS H. J. (2002): Heart rate and heart rate variability during a novel object test and a handling test in young horses. Physiology & Behavior vol. 76: 289– 296
WARING ,G. (2003): Horse Behaviour. William andrew publishing, New York: 96-113, 346-350