Measuring capability for sustainability
32
1 Measuring sustainability capability: Built Environment Sustainability Tool Jeremy Gibberd 1, 2, 3 1 Department of Architecture, University of Pretoria, Pretoria, South Africa. 2 Council for Scientific and Industrial Research (CSIR),Pretoria, South Africa. 3 Gauge, Pretoria, South Africa. E-mail: [email protected]
-
Upload
independent -
Category
Documents
-
view
0 -
download
0
Transcript of Measuring capability for sustainability

1
Measuring sustainability capability:
Built Environment Sustainability Tool
Jeremy Gibberd1, 2, 3
1 Department of Architecture, University of Pretoria, Pretoria, South Africa.
2 Council for Scientific and Industrial Research (CSIR),Pretoria, South Africa.
3 Gauge, Pretoria, South Africa.
E-mail: [email protected]

2
Abstract
An alternative approach to conceptualising and measuring the built environment
is developed which forms the basis of a new assessment tool. The role of
buildings is reframed to consider what capabilities for sustainability a building
can provide to the inhabitants and local community. This capability to support
sustainability is defined as the ability to improve the local quality of life (Human
Development Index) whilst remaining below the environmental carrying capacity
(Environmental Footprint). This approach has clear implications about the role of
buildings in enabling residents and users to achieve these targets and outcomes.
This shifts the focus of net-positive development toward the configurations and
characteristics of the built environment that are appropriate for a particular
context. A Built Environment Sustainability Tool (BEST) is presented which
defines and assesses these configurations and characteristics. Assessments can be
conducted by measuring the extent to which required configurations and
characteristics exist (i.e. ‘the capability of the built environment to support
sustainability’). BEST is compared with other green building rating tool
approaches in order to critically review the methodology and evaluate this as a
means of improving built environment sustainability performance.
Keywords: building assessment systems, built environment, neighbourhood, net-positive,
sustainability, sustainable buildings, sustainability criteria, sustainability indicators
3
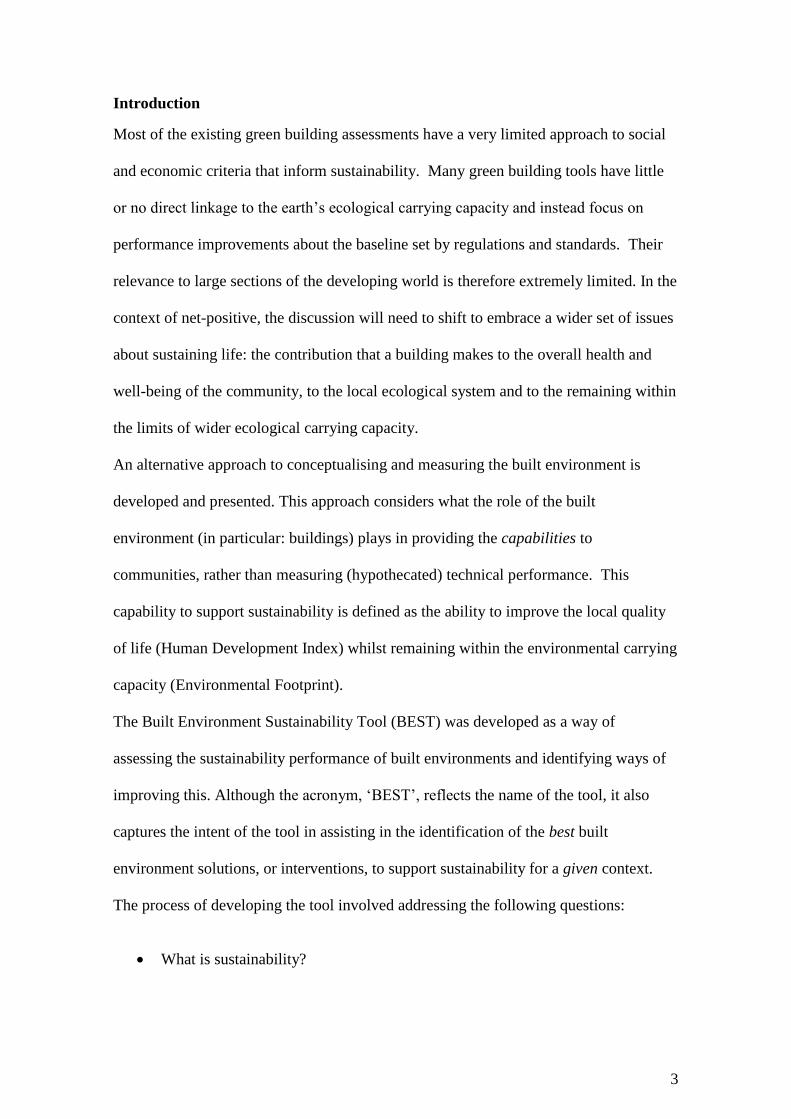
Introduction
Most of the existing green building assessments have a very limited approach to social
and economic criteria that inform sustainability. Many green building tools have little
or no direct linkage to the earth’s ecological carrying capacity and instead focus on
performance improvements about the baseline set by regulations and standards. Their
relevance to large sections of the developing world is therefore extremely limited. In the
context of net-positive, the discussion will need to shift to embrace a wider set of issues
about sustaining life: the contribution that a building makes to the overall health and
well-being of the community, to the local ecological system and to the remaining within
the limits of wider ecological carrying capacity.
An alternative approach to conceptualising and measuring the built environment is
developed and presented. This approach considers what the role of the built
environment (in particular: buildings) plays in providing the capabilities to
communities, rather than measuring (hypothecated) technical performance. This
capability to support sustainability is defined as the ability to improve the local quality
of life (Human Development Index) whilst remaining within the environmental carrying
capacity (Environmental Footprint).
The Built Environment Sustainability Tool (BEST) was developed as a way of
assessing the sustainability performance of built environments and identifying ways of
improving this. Although the acronym, ‘BEST’, reflects the name of the tool, it also
captures the intent of the tool in assisting in the identification of the best built
environment solutions, or interventions, to support sustainability for a given context.
The process of developing the tool involved addressing the following questions:
What is sustainability?

4
What configuration and characteristics are required in built environments to
support the achievement of sustainability?
How can these built environment configurations and characteristics be assessed?
Can the process of assessing the sustainability of built environments be used to
diagnose areas of weaker, and stronger, performance?
Can the process of diagnoses inform the development of interventions and
options which address areas of weak performance?
Can proposed interventions and options be tested and evaluated within the
existing context to identify the best solutions and interventions for a particular
context?
Where resources are limited, is it possible to support the development of
sustainability strategies and plans where interventions to support sustainability
can be sequenced and implemented over time, in order to achieve full
sustainability capability in a structured and efficient way?
The first part of the paper describes how these questions were addressed in order to
develop the Built Environment Sustainability Tool. The second part of the paper
discusses the BEST in relation to conventional green building rating approaches and the
concept of net positive design.
Defining sustainability
A wide range of definitions exists for sustainability and sustainable development. One
of the most widely used definitions refers to ensuring that needs of current populations
are met without negatively affecting future populations:

5
“…development that meets the needs of current generations without compromising the
ability of future generations to meet their needs and aspirations” (World Commission on
the Environment and Development, 1987).
Translating this definition into action is difficult. ‘Needs’ and ‘aspirations’ are
subjective and interpretations vary on what this means. Explicit reference is also not
made to environmental limitations which determine whether current and future
generations are able to meet their needs (Button, 2002).
A more recent definition of sustainability addresses these limitations by referring to
specific quality of life targets and environmental limits that must be achieved.
Sustainability, in this definition, is described as the simultaneous achievement of above
0.8 on the Human Development Index (HDI) and an Ecological Footprint (EF) of below
1.8 global hectares per person (World Wild Life Fund, 2006; Moran, Wackernagel,
Kitzes, Goldfinger & Boutaud, 2008).
Human Development Index
The Human Development Index (HDI) is a quality of life measure developed by the
United Nations. It is based on following health, knowledge and income aspects (United
Nations Development Programme, 2007):
A long healthy life, measured by life expectancy at birth
Knowledge, measured by the adult literacy rate and combined primary,
secondary, and tertiary gross enrolment ratio
A decent standard of living, as measure by the GDP per capital in purchasing
power parity (PPP) in terms of US dollars.
The HDI is the average of three measures and is calculated in the following way:

6
HDI = 1/3 (life expectancy index) + 1/3 (education index) + 1/3 (GDP index)
The HDI is used as international measure of development and national figures are
published annually by the United Nations. A HDI of 0.8 or above is recognised as
evidence that minimum acceptable standards of quality of life have been achieved
(Moran et al 2008).
Ecological Footprint
An Ecological Footprint (EF) is a measure of the amount of biologically productive land
and sea required to provide the resources required by a human population and to absorb
the corresponding waste. The types of resources required and waste generated by
populations are classified in the following way:
Food, measured in type and amount of food consumed
Shelter, measured in size, utilization and energy consumption
Mobility, measured in type of transport used and distances travelled
Goods, measured in type and quantity consumed
Services, measured in type and quantity consumed
Waste, measured in type and quantity produced
The area of land and sea required for this consumption and pollution is calculated in
global hectares (gha) and the sum of these areas provides the Ecological Footprint
(Wackernagel & Yount, 2000). Given that the earth’s surface is finite, a maximum
equitable share can be determined. At current population numbers this is about 1.8
global hectares (gha) per person (Moran et al 2008).

7
Implications for the built environment
The above definition of sustainability has direct implications for planning, design,
construction and management of built environments. It implies that in order to achieve
sustainability, built environments must enable and encourage their users, or occupant
populations, achieve an HDI of over 0.8 and an EF of under 1.8 gha.
The criteria in the Built Environment Sustainability Tool have therefore been developed
by analysing the elements that constitute the HDI and EF in order to identify the built
environment configurations and characteristics required to achieve target performance.
These configurations and characteristics are translated into BEST criteria and
assessment scales developed (Gibberd, 2013a). The tool refers to these required
configurations and characteristics as ‘built environment sustainability capability’. Built
environment sustainability capability requirements in relation to EF and HDI criteria are
listed in Tables 1 and 2.

8
Assessing capability for sustainability
Three key factors were considered in developing the methodology for assessing
sustainability capability in built environments. The first is that sustainability
performance of the built environment is a combination of (1) the inherent configuration

9
and characteristics of the built environments and (2) how built environments are used
and managed. Sustainability performance is governed by both of these factors and
cannot be related to just one or the other. Built environments must therefore be planned,
designed and managed to have the right inherent qualities. They must also enable and
encourage occupant to use these qualities appropriately to achieve sustainability targets.
The ‘enabling and encouraging’ aspect of the built environment is taken into account in
the BEST methodology by integrating standards, capacity, physical access and
affordability as considerations in assessments.
The second factor is that if the built environment is to support the achievement of HDI
and EF targets, required configuration and characteristics must be part of everyday
living and working environments of users. This means that these configurations and
characteristics must be integrated effectively into these environments and be physically
present in a way that influences user behaviour appropriately. This is taken into account
in the BEST by requiring built environment configurations and characteristics to be
either physically integrated into working or living built environments, or to be
accessible locally. Local access is defined as being within the local neighbourhood or
not over 2 km from the environment being assessed.
The third factor is that as specific EF and HDI targets have to be achieved for
sustainability, it is important to ensure that all of required built environment
configurations and characteristics are in place to allow this to happen. The tool therefore
defines optimal arrangements for targets to be achieved and refers to this as ‘full
capability’. Assessments then rate built environments from ‘no capability’, which score
‘0’, to ‘full capability’ which score ‘5’ in terms of the extent to which the required
configuration or characteristics exist to support sustainability. Scoring scales for each
BEST criteria are defined in a manual. BEST criteria areas are derived directly from the

10
sub criteria of the Human Development Index and Ecological Footprint and are listed
below:
Shelter
Food
Mobility
Goods
Waste
Biocapacity
Products
Services
Education
Health
Employment
The tool assesses capability in these areas for existing built environments or for
proposed built environment designs, within a neighbourhood context. The tackling of
sustainable development is a complex undertaking, entailing a detailed understanding of
local systems is needed before proposals are made (Van Pelt, 1993; Lowton, 1997;
Meadows, 2008). Assessments of the existing situation and the identification of areas
with weak or strong sustainability capability are used to provide a framework for
developing and refining designs. The suitability these designs is then evaluated by
measuring the extent to which built environment sustainability capability is improved.
Therefore to achieve high performance, buildings or built environment interventions,
must respond directly to the local situation and improve sustainability capability where
this does not exist, or is weak.

11
Assessments are performed by evaluating buildings and the neighbourhood against the
sub criteria listed in the tool. These are shown as ‘BEST criteria’ in Figure 1. Scoring of
these criteria is on a 6-point scale that ranges from ‘0’ (no capability) to ‘5’ (full
capability). A score of ‘5’ indicates that all built environment characteristics and
configuration are in place to support the achievement of HDI and EF targets. A score of
‘0’ indicates that none of this in place. Scores for existing neighbourhoods and
buildings and designs are assessed in the ‘Existing’ column shown in Figure 1.
On completion of an ‘Existing’ assessment, performance can be understood by
reviewing the BEST report at the bottom of the tool, as shown in Figure 1. This is also
shown in Figure 3. This report can be used to diagnose the areas of good and poor
performance. The report can be used to identify and develop options for improvement
that are based on the diagnosed areas of poor performance. Once identified, options for
12
improvement can be evaluated by inserting as many as 6 different options in the
columns to the right of the tool, as indicated in Figure 1. These options are scored in
their columns in relation to the BEST criteria in the tool in accordance with the scales
defined in the manual. On completion of the scoring, the impact of the option can be
evaluated by reviewing the ‘Proposed’ scores relative to ‘Existing’ scores, as shown in
Figure 1. The differences between these scores provide an indication of the nature and
extent of the impact of the option. Thus, the extent to which the score increases in the
‘Proposed’ environment relative to the ‘Existing’ indicates the level of improved
sustainability capability. The tool also includes indicators labelled ‘Resilience’ and
‘Congruence’ as shown in Figure 1. The ‘Resilience’ measure provides an indication of
improved resilience resulting from additional systems or capacity resulting from
implementing the option(s). For example, the addition of a rainwater harvesting system,
which provides an additional supply of water to a municipal supply, would be reflected
as improved resilience within the tool. ‘Congruence’ measures the fit between proposed
options and gap in capability performance. Therefore options that effectively improved
capability in areas of poor performance would be reflect higher values compared to
options that were less successful at addressing these gaps. Different options can be
switched ‘on and off’ in the tool in order to ascertain individual and combined impact.
The BEST report includes spider diagrams, development trajectory chart points and
tables to enable the impact of the option(s) to be readily understood as is shown Figure
3. This can be used to ensure proposed options are responsive to the existing situation
and are tested, evaluated and refined before being selected.
Using BEST: Atteridgeville example
The application of the BEST can be illustrated through a case study. The area selected is
an informal settlement on the outskirts of Atteridgeville in Pretoria, South Africa

13
(latitude -25.7733, longitude 28.0713). Hereafter, it is simply referred to as the
‘Atteridgeville example’.
The area assessed is a neighbourhood indicated in the Figure 2 below. The area is
characterised by informal self-built housing arranged in a loose grid. Services are
limited and there are no schools or clinics within the neighbourhood. Housing does not
have electrical, water or sewage connections. Small shops and stalls sell a limited
selection of food and basic groceries. There is no established and scheduled public
transport. Private vehicles are available to transport people and goods, but costs are
relatively high.
The first step in a BEST assessment is the identification of the building or building type
that will be assessed. For instance, this may be of a residential dwelling. The second
step is demarcation of the neighbourhood. Accessibility is indicated through marking
concentric rings indicating the distance from the building. Facilities within a maximum
of 2 km are deemed to be accessible. Figure 2 indicates 1km diameter rings emanating
from the building. The final demarcation of the neighbourhood is then derived using
these maximum accessibility distances and geographical features such as walls and
rivers that may influence access and movement.

14
The third step is the assessment of sustainability capability of the built environment and
neighbourhood within which it is located. This is either conducted through a physical
survey (if an existing building and neighbourhood) or through a desk-based analysis of
design documentation such as plans and specifications (if it is a design proposal).
These steps have been followed for Atteridgeville; an informal dwelling and
neighbourhood were selected and assessed. The initial assessment provides ‘Existing’
capability scores. These scores are captured in tables and graphs as indicated in the
BEST report in Figure 3.

15
An analysis of the ‘Existing’ spider graph in the BEST report in Figure 3 reveals that
the informal dwelling and neighbourhood has weak capability in the areas of
‘Employment’, ‘Shelter’, ‘Goods’, ‘Services’, ‘Biocapacity’, ‘Health’ and ‘Knowledge’
and that slightly stronger capability exists the areas of ‘Waste’ and ‘Food’.
The BEST ‘Existing’ report provides an explicit basis for developing actions to improve
sustainability capability. For instance, it may be decided that addressing areas of weak
capability may the priority and therefore options that addressed this directly should be
targeted. Alternatively, as illustrated in the example below, it may be decided that the
options resulting in the highest overall improvement in capability should be prioritised
and therefore that options that achieved this should be targeted.
In the Atteridgeville example, options investigated include solar water heater
installations (Option A), building envelope upgrades (Option B), the establishment of
community food gardens (Option C), the development of a local school with out-of-
hours community access to computer and learning facilities (Option D) and undertaking
all of these interventions together (Option F).
Testing these options against ‘Existing’ performance within the tool reveals that the
community food gardens (capability improvement of 0.70) and the school with shared
access to ICT (capability improvement of 0.80) have a greater overall impact
(improvement in capability) than the solar water heater installation (capability
improvement of 0.14) and building envelope upgrades (capability improvement of
0.25), as shown in Table 3 below.

16
The higher impact (more substantial increases in sustainability capability of the built
environment) of options C and D suggest that these options should be prioritised and
implemented first. Option F indicates the cumulative impact of undertaking all of the
interventions. This results in substantial improvements in capability, with overall
capability improving from 1.40 to 3.14, as shown in column F in Table 3. The spider
graph in Figure 3 also shows that Option F results in improvements in all areas
(compare the blue line with the red line).
An analysis of the BEST report in Figure 3 provides an insight into the next set of
options that may be used to address of areas of weak capability in the ‘Proposed’
situation (the blue line) and suggests that this should address low performance in the
areas of ‘Shelter’, Mobility’, ‘Goods’, ‘Services’ and ‘Health’. Options that may be
explored to address this include renewable energy sources, improved pedestrian routes
linked to public transport, a local market for goods and services and facilities that
support health. In this way assessments of the existing situation, combined with a
process of testing and implementing proposed interventions, can be used to improve the
sustainability capability of an area over time in a structured way.

17
BEST applications
BEST may be applied in a range of ways to support built environment improvements in
sustainability. These applications are described below.
Architectural and urban design evaluation: BEST can be used to evaluate
architectural and urban design proposals by assessing these in terms of HDI and
EF capability. The process of assessing proposals can be used to ascertain the
highest performing proposals. Through an iterative process, it may also be
possible to improve design proposals. This can lead to the development of
integrated design and management solutions which improve local sustainability
capability improvements in an efficient manner. An example of this is the
Neighbourhood Facilities for Sustainability concept (Gibberd, 2013b).
Community involvement: A BEST assessment of a neighbourhood by a
community can be used to ascertain local sustainability capability performance
and support the development of sustainability plans in order to address gaps and
areas of weaknesses. Through this process, it is possible to develop local plans
which integrate and coordinate local initiatives in a structured way. The broad,
positive focus of the BEST, which aims to improve local quality of life and
reduce environmental impact, can be used to involve diverse stakeholders and
build consensus.
Municipal urban planning processes: Municipal urban planning processes
such as the development of Integrated Development Plans (IDPs) and Spatial
Development Frameworks (SDFs) aim to support local sustainable development.
However these plans may not be based on sustainability assessments and
therefore may not respond to local priorities. The BEST can be included in IDP
and SDF processes in order to ensure that these responded directly to gaps in

18
local sustainability capability. This process would help ensure that local
government planning processes responded to area-specific issues and supported
sustainable development (Cohen, 2006; Gibberd, 2013c; Theaker & Cole, 2001).
Discussion
The approach in the BEST tool is significantly different from green building rating tool
approaches and it is therefore worth comparing and contrasting the two approaches.
‘Green building rating approaches’ in this paper refers to processes used for building
environmental assessments and ratings using tools such as Leadership in Energy and
Environmental Design (LEED). ‘BEST approaches’ refers to processes used with the
Built Environment Sustainability Tool.
Assessment focus
The way society defines and measures progress is key factor in advancing sustainability
(Dahl, 2012; Hall, 2012; Meadows, 1998; Pintér, Hardi, Martinuzzi, Hjorth & Bagheri,
2006). Pintér et al (2012, p. 22) argue that assessments of sustainable development
progress must consider:
“the underlying social, economic and environmental system as a whole and the
interactions among its components, including issues related to governance
dynamics and interactions between current trends and drivers of change
risks, uncertainties, and activities that can have an impact across boundaries
implications for decision making, including trade-offs and synergies.”
Improvements in sustainability performance therefore requires planning based on a
detailed understanding of existing systems and appropriate progress indicators (Ness,
Urbel Piirsalu, Anderberg, Olsson, 2007; Singh, Murty, Gupta, Dikshit, 2012).

19
Green building rating tool criteria focus on environmental issues and therefore only
provide a partial measure of sustainability performance (Cole, 2005; Cooper, 1999; Liu
et al, 2010; Zuo & Zhao 2014). Some aspects of occupant health such as indoor air
quality, views and lighting are included in green building rating tools. However, other
social and economic aspects such as food, education and employment, cited as key
requirements for sustainable development by the World Commission on Environment
and Development (WCED), are not included (World Commission on Environment and
Development, 1987; Zuo & Zhao, 2014).
City-scale approaches, such as the Cities for Climate Protection (CCP) initiative,
similarly include a focus on environmental issues related to energy, housing,
commercial buildings, transport, waste and water. However, while this approach does
not include aspects such as health, education and food, it envisages and values
beneficial social and economic impacts related to environmental actions, such as
increased employment (International Council for Environmental Initiatives 2009).
London’s Quality of Life Reports, a city sustainability indicator system, adopt a broader
approach and give equal prominence to social, environmental and economic criteria.
These include indicators for income equality, business survival, employment, life
expectancy, childcare and Ecological Footprints. The chosen indicators aim to measure
the key factors required for establishing a sustainable city and enhancing the quality of
life within it (London Sustainable Development Commission 2012).
World Commission on Environment and Development, Our Common Future (Oxford University
The approach taken in BEST has some similarities with London’s Quality of Life
Report. It aims to measure the performance of key built environment factors required
for sustainability, namely the capability for achieving HDI and EF targets. Built
environment capability is determined by assessing criteria relating to the achievement of
HDI and EF targets and includes education, health, mobility and food. BEST criteria

20
therefore cover economic, social and economic aspects and include sustainability
requirements referred to by the WCED.
In developing countries, and in developed countries experiencing prolonged economic
downturns, social and economic issues such as poor health, education levels and
unemployment are a major concern (Zuo & Zhao, 2014). The size of populations
experiencing these issues and living in underserviced urban areas is substantial (Cooper,
1999). For instance in Africa, an estimated 72% of the urban population live in slums,
in Asia this is 43%, and Latin America this is 32% (United Nations Human Settlements
Programme, 2003; United Nations Human Settlements Programme, 2004). In these
contexts, the inclusion of social and economic aspects in assessments makes sense, as it
enables these issues to be addressed simultaneously with environment aspects (Singh et
al, 2012). By including, and assessing, a broader range of social, economic and
environmental aspects, the BEST approach favours more integrated and multi-impact
solutions.
As shown in the Atteridgeville example, the wider remit of BEST also enables
unconventional solutions (e.g. shared access schools and food gardens) to be considered
and assessed. In this particular context, these solutions prove to be particularly effective
and efficient at improving local sustainability capability as multiple impacts are
achieved which improve both HDI and EF performance. For example, food gardens
reduce EF by providing locally grown fresh vegetables and fruit. HDI performance is
simultaneously enhaned by improving local standards of living through the additional
income generated from selling produce and improving health through better nutrition.
Responsiveness and prioritisation

21
Green building tool ratings rely on the accumulation of sufficient points in order to be
eligible for a rating (Cole, 2005). While these tools may make the achievement of a
number of criteria such as those related to carbon emissions and biodiversity,
mandatory, little guidance is offered on on which performance aspects should be
prioritised. This may lead to the inclusion of attributes and technologies that are cheap
or easy to implement Such a strategy fails to incorporate aspects that may be more
applicable but are more expensive or difficult to implement, or do not generate green
points (Cole, 2005; Lee, 2012; Liu, Li, Yao, 2010).
Some regional differences, such as local climate, are taken into account in green
building rating approaches. However, other significant variations are not acknowledged
(Zuo & Zhao 2014). For instance, local differences in water, energy, renewable energy,
sewage service availability and reliability, and access to education and health facilities
are not captured or reflected in their assessments. Such an approach therefore may not
particularly promote solutions that are highly responsive to local situations. When
generic framework is applied that uses a points-based scoring system, it may result in
opportunities to address local problems and utilise local resources being lost. This can
be illustrated through an example.
An urban area (such as Atteridgeville) has no mains water, sewage or power and limited
social infrastructure. A large new building being developed for this area could chose to
respond to this situation by working with local infrastructure to improve access to
renewable energy, water and social infrastructure for the area as a whole. Alternatively,
it could choose to ignore the local situation and focus internally to maximise energy,
water and sewage performance of the building itself. A green building rating system
would rate these buildings similarly or may even assign a higher rating to the second

22
internally-focussed building. Thus, the very substantial value of the first approach for
wider-scale sustainability would not be recognised or valued.
In the example provided above, the first building that responded to the local situation
would be scored significantly higher using the BEST than the second internally-
focussed building. The value of the wider impact, is therefore assessed and valued. The
BEST approach includes the extent to which the built environment contributes to
improving HDI and EF capability within the area as a whole.
Where resources and timeframes are limited, a framework that informs the prioritisation
of measures to support sustainability is valuable. This can be used to ensure that
buildings and interventions identify and address weaknesses in local sustainability
performance as a priority. A framework for the overall sustainability performance of an
area can be enhanced over time.
The value of this approach can be illustrated through the previous Atteridgeville
example. An analysis of the case study area using the BEST revealed the urgent need to
improve local provision in areas such as education, health, employment, mobility in
order for overall sustainability of the area to be improved. The explicit inclusion of an
analysis stage early in the process makes it likely that new buildings and interventions
proposed for the area will address local issues and improve sustainability performance
of the area as a whole (Ding, 2005).
The requirement to respond to the local context also magnifies the potential role of
buildings and built environments as means of stimulating change and creating wider-
scale beneficial impacts. For instance, a BEST assessment may indicate poor education
capability in an existing neighbourhood (Existing). A new building in the
neighbourhood could help address this by including education facilities that can be
accessed by occupants of the neighbourhood. If implemented, use of this capability will

23
lead to improved education and HDI levels. In this way, the BEST approach
encourages the development of new buildings and built environment interventions
which respond to local situations.
However the tool could also be used to exacerbate sustainability differences between
neighbourhoods. This would occur where private developers used BEST to identify
high performing neighbourhoods and chose to develop within these rather than in
poorly performing neighbourhoods, accentuating sustainability capability differences.
This could be countered through incentives, planning regulations and targeted
government programmes.
Internal and external impact
As previously mentioned, the green building rating approaches focus on building-
specific assessments and optimising internal performance. Their focus is on the
environmental aspects of the building i.e. minimising the negative environmental
impacts whilst creating the internal conditions for comfort and productivity. However,
they do not focus on the sustainability requirements of the area or neighbourhood. This
focus may limit the potential role that building can have in creating beneficial external
impacts (Cole, 2005).
Buildings and construction processes can create a wide range of beneficial external
impacts. A construction process with intensive labour can create increased local
employment (Gibberd, 2008). Procuring local products and materials can be used to
support the development of the local economy and small businesses (Gibberd, 2008).
Similarly, design features and management can ensure that amenities provided in a
building or on a site (e.g. gardens, sports facilities, banking, crèches and learning
facilities) are made available for public use. In poorly serviced areas, this type of

24
provision and access can provide substantial local benefit for local communities who
may not be able to access these amenities or would have to travel long distances for this
(Gibberd, 2008).
This concept can extended through designed synergies in which built environment
characteristics are deliberately included in buildings to support small businesses and
local employment. Examples include the provision of small units within larger buildings
which can be used by retail, catering, design and reprographic businesses to provide
services to the larger main occupant organisation, as well as to the local neighbourhood.
This creates both improved ‘internal’ impacts such as services and products which can
be accessed more efficiently and improved ‘external’ impacts such as increased local
access to services and products and small business support (Gibberd, 2007).
These positive, external impacts, if included in buildings, are recognised and captured
by BEST. However, BEST provides very limited assessment capacity for the ‘internal’
performance of building and a much lower level of detail compared to green building
tools. In particular, the type of criteria and granularity of the scales used to measure
criteria in the BEST is very coarse relative to some of the methodologies used in green
building tools.
The limited timeframes and resources available to mitigate and adapt to climate change
and achieve improvements in education, employment and health mean it is becoming
increasingly important to pursue integrated, multiple impact solutions. Buildings and
built environments, it could be argued, must maximise their potential to make a positive
impact wherever they can. Accordingly, assessment frameworks should be careful not
to restrict these impacts by only measuring a limited set of internally-focussed
environment outcomes (Cooper, 1999).

25
Innovative solutions
Addressing climate change effectively will not be achieved without challenging current
design norms and the scale of change required mean that radically different solutions
are now needed (Cole, Robinson, Brown, O’Shea, 2008; Cooper, 1999). Tools that aim
to address climate change should therefore encourage and recognise innovative high
performance solutions.
Performance in green building rating tools is measured in terms of highly structured
specific and prescribed criteria. Standardised detailed measurement protocols are
provided which must be complied with in order to demonstrate compliance required for
points. The detailed requirements of green building rating submissions mean that
extensive preparation work in the form of reports, calculations and modelling is
required (Cole, 2005). While this level of structure and detail is useful for ratings and
comparisons, it may also discourage innovation (Cole, 2005).
Conventional solutions in green building rating systems are supported through ‘tried
and tested’ documentation that design teams have developed through previous rating
submissions or in the form of templates supplied by rating agencies. Unconventional
solutions do not have this type of support and need to be ‘proven’ to the rating agency
through documentation which may include supporting statements from third party
experts.
Novel and non-standard solutions that do not readily match the existing parameters in
rating tools require additional effort from the design team. This additional work is
needed to convince the green building rating assessors of the validity of the proposed
approach. Design teams under pressure to complete design and rating submission
documentation understandably may choose to avoid innovations that are ‘untested’ or
26
those entailing substantial additional effort to document and achieve approval by the
rating agency.
Although the BEST approach does not lend itself to detailed ratings of performance, it
has a number of characteristics that may encourage greater experimentation and
innovation. The simplicity of the criteria and assessment process mean that options can
be evaluated quickly. This encourages users to identify a range of options to evaluate
rather than limiting this to one or two. The tool also has a facility to input as many as 6
different options. These options can be switched ‘off and on’ in the tool to assess the
impacts of these jointly or separately. This deliberately encourages comparisons, and
the critical evaluation of options, as illustrated in in Table 3.
Stakeholders and users
Sustainability indicator systems were initially developed for use at a national level and
aim to influence the development of policy by governments. However, Dahl (2012)
makes a strong argument that the national-level approach is insufficient and that
sustainability indicators are needed at local government, community and individual
level. Dahl suggests that sustainable development indicator systems for individuals,
families and villages should be developed that are sufficiently sensitive to provide
positive feedback for even relatively minor efforts, in order to encourage further actions
(Dahl, 2012). Green building rating tools acknowledge the role of individuals through
the inclusion of criteria that recognise the importance of localised environmental control
and the provision of building user guides. Although building owners or developers are
advised to draw on independent professional advisers, green building approaches do not
specifically advocate the involvement of building users in the design and development
processes (Zuo & Zhao 2014).

27
The technical nature of green building assessment and documentation also limit the
involvement of building users and non-technical participants in determining and
developing building design and management solutions. It can be argued that the
involvement of built environment users will become more important as the
unpredictable and locally differentiated impacts of climate change occur. The
development of responsive local solutions and improvisation rely on local knowledge,
capabilities and participation (Cole et al, 2008).
Increasing an understanding of built environments and related systems within local
communities and users would allow local communities to adapt and use these
environments appropriately to cope with change. For example, increasing the awareness
of climate change impacts (e.g. flooding) within a community would enable them to
develop and use mechanisms such as early warning systems and flood defences or
relocate away from areas of risk to reduce negative consequences.
Involving building users and local communities enhances capability in another way. An
improved understanding of existing local sustainability performance can be used to
identify areas of weaknesses and potential solutions. This process can be formalised in a
‘sustainability brief’ which can be used as an input to design processes. This enables
users and the local community to be involved from the beginning of the project and
influence this (Pintér et al, 2012). As users and the local community will have to live
with the results of the development, it is likely this influence will be positive. Solutions
exhibiting both positive ‘internal’ and ‘external’ (neighbourhood-wide) impacts will be
identified and supported (Stiglitz, 2009).
An advantage of involving users and the community in sustainability assessments early
in the process is that it enables a detailed understanding of local issues and potential
solutions to be developed before professional design processes start. This ensures that

28
‘more informed’ stakeholders contribute direction and feedback to built environment
professionals. ‘More informed’ stakeholders are likely to be more articulate and more
assertive in ensuring that buildings are responsive to local conditions and user
requirements (Pintér et al, 2012). This could help structure and inform public
participation processes and reduce the potential for popular sentiment (i.e. without
technical knowledge) to influence decisions inappropriately.
Conclusions and recommendations
A new approach to thinking about the sustainability of the built environment is its
capability to support the achievement of HDI and EF targets by occupant populations.
The combination of human development and ecological carrying capacity is vital to
defining and measuring this capability. As this capability can be accessed in a building
or within easy walking distance of this, assessments entail buildings within their
neighbourhoods and combined performance. This means that buildings located in
neighbourhoods with poor capability have to work much harder to compensate for this
in order for high performance to be achieved.
BEST offers a facility to evaluate options that can be considered for improving the
sustainability capability of building – neighbourhood combinations. This encourages a
responsive approach in which solutions are developed and evaluated in order to improve
or ‘make better’ the combined capability of the building and neighbourhood.
BEST provides an alternative to other green building rating tool approaches. Those
approaches have a strong focus on the performance of the building itself and a reduction
in negative environmental impacts (doing less harm).
The BEST approach contributes to the debate on net-positive design and the role of
buildings in relation to sustainability. Net-positive design describes the ability of a
building to make a positive contribution to its context. Although net-positive can be

29
framed terms of water or energy (i.e. supplying an excess amount of water or energy to
other neighbouring buildings), the BEST approach extends this to include net-positive
social and economic impacts. This widened scope considers the capabilities that a
building can offer to its neighbourhood. As well as catering for its occupants, a
building can provide benefits to the surrounding community. This concept begins to
capture the sustainability capability role of built environments and the potential of
buildings to make wider and more substantial contributions to achieving sustainability
than is currently envisaged in green building rating tool approaches.
BEST can be used in a variety of ways to understand and improve sustainability
capability of built environments. The tool can be used to assess design proposals in
conjunction with their sites in order to establish a measure of local sustainability
capability. By enabling responsive design approaches, the tool supports solutions that
not only achieve good ‘internal’ performance but also accomplish beneficial ‘external
impacts’. This is valuable in developing countries where resources and buildings have
to be used efficiently to achieve a wide range of beneficial impacts.
The tool can also be used by communities to understand the sustainability capability of
their neighbourhoods and identify areas of weak performance. This can form the basis
of structured sustainability plans which coordinate resources to improve local
conditions in an efficient way over time. Local municipalities can use the tool to
measure and compare the sustainability capability of neighbourhoods in order to
prioritise interventions and develop responsive solutions. By undertaking assessments
with local communities, municipalities can support shared and structured development
decision making which pool capacity and resources to improve sustainability capability
efficiently.

30
Although the tool is innovative and shows potential as a means of measuring and
improving sustainability capability of the built environment, it could be improved in a
number of ways. Further research is needed on the relationship between built
environment characteristics / configuration and local Ecological Footprint / Human
Development Index performance. This should be reflected in the tool as more refined
criteria and also provide for a more detailed assessment scales.
The tool can be improved through wide scale adoption in developed and developing
countries, as well as within varied urban and rural contexts. Feedback from the tool’s
application will be vital for its further development.
References
Button, K. (2002). City management and urban environmental indicators. Ecological
Economics, 40(2), 217–233.
Cohen, B. (2006). Urbanization in developing countries: Current trends, future
projections, and key challenges for sustainability. Technology in Society, 28(1-
2), 63–80.
Cole, R. J., Robinson, J., Brown, Z., & O’shea, M. (2008). Re-contextualizing the
notion of comfort. Building Research & Information, 36(4), 323–336.
Cole, R. J. (2005). Building environmental assessment methods: redefining intentions
and roles. Building Research & Information, 33(5), 455–467.
Cooper, I. (1999). Which focus for building assessment methods – environmental
performance or sustainability? Building Research & Information, 27(4-5), 321–
331.
Dahl, A. L. (2012). Achievements and gaps in indicators for sustainability. Ecological
Indicators, 17, 14–19.
Ding, G. K. C. (2005). Developing a multicriteria approach for the measurement of
sustainable performance. Building Research & Information, 33(1), 3–16.
Gibberd, J. (2007). Sidestepping Poor Infrastructure; Enabling Environments in
Developing Countries. In CIB world building congress; construction for
development (pp. 1761-1771). CIB: Cape Town.

31
Gibberd, J. (2008). The Sustainable Building Assessment Tool: Integrating
Sustainability into Current Design and Building Processes. In Foliente, G.,
Luetzkendorf, T., Newton, P. and Paevere, P. (Eds.), World Sustainable Building
Conference (pp. 945–950). CIB: Melbourne.
Gibberd, J. (2013a) Sustainable African Built Environments, African Journal of Science,
Technology, Innovation and Development, 2013.
Gibberd, J. (2013b). Neighbourhood Facilities for Sustainability. WIT Transactions on
Ecology and The Environment, Vol 179, 225-234.
Gibberd, J. (2013c). Local Climate Solutions for Africa, Dar es Salaam, Tanzania.
Retrieved from http://
http://builtenvironmentsustainabilitytool.blogspot.com/2013/11/local-climate-
solutions-for-africa-dar.html
Hjorth, P. & Bagheri, A. (2006). Navigating towards sustainable development: a system
dynamics approach. Futures 38 (1), 74–92
International Council for Local Environmental Initiatives (2009). Sustainable Energy
Urban Planning, ICLEI
Lee, W. L. (2012). Benchmarking energy use of building environmental assessment
schemes. Energy and Buildings, 45, 326–334.
London Sustainable Development Commission (2012). London’s Quality of Life
Indicators 2012 Report, Greater London Authority, London.
Liu, M., Li, B., & Yao, R. (2010). A generic model of Exergy Assessment for the
Environmental Impact of Building Lifecycle. Energy and Buildings, 42(9),
1482–1490.
Lowton, R.M. (1997). Construction and the Natural Environment. Oxford: Butterworth-
Heinemann.
Meadows, D. H. (1998). Indicators and information systems for sustainable
development. Hartland: Sustainability Institute.
Moran, D. D., Wackernagel, M., Kitzes, J. A., Goldfinger, S. H., & Boutaud, A. (2008).
Measuring sustainable development—Nation by nation. Ecological
Economics, 64(3), 470-474.
Ness, B., Urbel Piirsalu, E., Anderberg, S., Olsson, L., (2007). Categorising tools for
sustainability assessment. Ecological Economics 60, 498–508.
Pintér, L., Hardi, P., Martinuzzi, A., & Hall, J. (2012). Bellagio STAMP: Principles for
sustainability assessment and measurement. Ecological Indicators, 17, 20–28.

32
Prüss-Üstün, A., and Corvalán, C., (2013). Preventing disease through healthy
environments. Towards an estimate of the environmental burden of disease.
World Health Organization. Retrieved from
www.who.int/quantifying_ehimpacts/publications/preventingdisease.pdf?ua=1
Singh, R. K., Murty, H. R., Gupta, S. K., & Dikshit, a. K. (2012). An overview of
sustainability assessment methodologies. Ecological Indicators, 15(1), 281–299.
Stiglitz, J. E., Sen, A., & Fitoussi, J. P. (2009). Report by the Commission on the
measurement of economic performance and social progress. Paris.
Thorbecke, E. (2000), The Use of Social Accounting Matrix in Modelling. 26th
General Conference of The International Association for Research in Income
and Wealth. Cracow, Poland.
Theaker, I. G. & Cole, R. J. (2001). The role of local governments in fostering “green”
buildings: a case study. Building Research & Information, 29(5), 394–408.
United Nations Development Programme (2007), Human Development Report
2007/2008. New York: United Nations Development Programme,
United Nations Human Settlements Programme. (2003). The challenge of slums: global
report on human settlements 2003. London: Earthscan
United Nations Human Settlements Programme (2004). The state of the world’s cities
2004/2005: globalization and urban culture. Nairobi/London: UN-
HABITAT/Earthscan.
Van Pelt, M.J.F. (1993) Ecological Sustainability and Project Appraisal, Avebury:
Aldershot.
Wackernagel, M., & Yount, J. D. (2000). Footprints for sustainability: the next steps.
Environment, Development and Sustainability, 2(1), 23-44.
World Commission on Environment and Development (1987). Our Common Future
(The Brundtland Report), Oxford University Press, Oxford.
World Wild Life Fund (2006). The Living Planet Report. Retrieved from http://
http://awsassets.panda.org/downloads/living_planet_report.pdf
Zuo, J., & Zhao, Z.-Y. (2014). Green building research–current status and future
agenda: A review. Renewable and Sustainable Energy Reviews, 30, 271–281.