MEASURING SUSTAINABILITY PERFORMANCE OF SMEs IN ...
464
1 MEASURING SUSTAINABILITY PERFORMANCE OF SMEs IN A DEVELOPING COUNTRY: A STUDY IN THE SOUTH OF VIETNAM HUY QUOC PHAN A thesis submitted in partial fulfilment of the requirements of the University of the West of England, Bristol for the degree of Doctor of Philosophy Bristol Business School, University of the West of England, Bristol. May 2022
-
Upload
khangminh22 -
Category
Documents
-
view
0 -
download
0
Transcript of MEASURING SUSTAINABILITY PERFORMANCE OF SMEs IN ...
1
MEASURING SUSTAINABILITY PERFORMANCE OF SMEs IN
A DEVELOPING COUNTRY: A STUDY IN THE SOUTH OF
VIETNAM
HUY QUOC PHAN
A thesis submitted in partial fulfilment of the requirements of the
University of the West of England, Bristol
for the degree of Doctor of Philosophy
Bristol Business School, University of the West of England, Bristol.
May 2022
2
Acknowledgement
I would like to thank, first and foremost, my directors of studies, Professor Mohammed Saad, and
Professor Vikas Kumar, who have guided and encouraged me throughout the research. Their
support, constructive feedbacks and patience have proven invaluable in the completion of this
thesis.
Deepest thanks to Dr. Svetlana Cicmil, Director of Doctoral Research in Business and Law, for
her words of advice and encouragement. I would like to express my deepest gratitude to Graduate
School, especially Dr. Helen Frisby and Samantha Watts. My doctoral journey would not have
been possible without their tireless support. Thank you.
I would also like to thank Dr. Quang Vinh David Evansluong for our informal but inspiring
research chats in the early stage. Thank you for your insightful and challenging questions. I am
truly grateful to have Dr. Anh Nghiem, Dr. Linh Duong, Quynh Tran, Loan Chau, Phuong Tran,
Hoang Thanh Nguyen, Kate & Minh Nguyen and their son Minh Khoi, for encouraging and
helping me to relax.
I am also indebted to practitioners in the SME setting, who gave me their invaluable opinions in
the interviews. And I will be forever grateful to all 579 respondents who completed the final
questionnaire. Their patience and generosity have meant that I am able to present this work. Thank
you.
Finally, the completion of my study would not have been possible without full support from my
wonderful mother, my younger sister and her family for helping me through a very difficult time
of this study.
Bristol, United Kingdom, May 2022 Huy Quoc Phan

3
Dedication
To
Mom, Dad, my younger sister and her family.

4
Abstract
Given that sustainability performance measurement has gained a lot of momentum in recent years,
there has been a shortcoming of sustainability metrics developed from SMEs perspective. This
thesis investigated the most appropriate metrics for SMEs in Vietnam, and the key enablers and
inhibitors to better help these SMEs measure their sustainability performance.
This study drew on the realistic paradigm, with a positivist perspective in the initial phase and a
phenomenological perspective in the latter stage. The application of a realistic paradigm resulted
in the utilisation of a sequential explanatory mixed methods design. Also conducted was a three-
stage research design encompassing quantitative and qualitative methods and a combination of the
two methods in a conclusion.
In the initial quantitative approach, structural equation modelling (SEM) was used to test the
theoretical model and hypotheses, based on a sample of 579 respondents from 327 SMEs. This
results in 12 sustainability metrics, comprising 4 economic metrics, 3 social metrics and 5
environment metrics. Six hypotheses relating to factors influencing the adoption of sustainability
metrics were also confirmed and moderating effects on each hypothesis were highlighted.
Following this, the qualitative approach employed semi-structured interviews of 43 participants
from 20 SMEs and business customers. Finally, the qualitative data were analysed using a thematic
coding technique to further explain the initial quantitative results.
This study used the triple bottom line sustainability concept, employing three theoretical lenses,
including stakeholder theory, contingency theory and institutional theory, along with resource-

5
based viewed, knowledge-based viewed theories to explain how sustainability performance can be
adopted as a performance measurement system in the SME setting.
Overall, the results have added theoretical, methodological, and practical contributions to the
literature of sustainability performance measurement and managerial implications for SMEs.
6
Table of Contents
CHAPTER 1 INTRODUCTION ............................................................................................... 17
1.1 Introduction ......................................................................................................................... 17
1.2 Research Background .......................................................................................................... 18
1.3 Research Context ................................................................................................................. 20
1.4 Research Aim, Objectives, and Question ............................................................................ 22
1.5 Contribution and Significance of the Research ................................................................... 25
1.6 Thesis Structure ................................................................................................................... 26
CHAPTER 2 THE THEORIES UNDERPINNING MEASURING THE PERFORMANCE
OF SUSTAINABILITY .............................................................................................................. 31
2.1 Introduction ......................................................................................................................... 31
2.2 An Overview of Sustainability Performance Measurement and Its Purposes .................... 32
2.3 The Triple Bottom Line Concept ........................................................................................ 35
2.3.1 Economic Performance ................................................................................................. 39
2.3.2 Environmental Performance ......................................................................................... 42
2.3.3 Social Performance ....................................................................................................... 46
2.4 Main Theories that Underpin the adoption of SPMS adoption ........................................... 55
2.4.1 Stakeholder Theory ....................................................................................................... 56
2.4.2 Contingency Theory ..................................................................................................... 63
2.4.3 Institutional Theory ...................................................................................................... 68
2.5 Concluding Remarks ........................................................................................................... 71
CHAPTER 3 SMALL AND MEDIUM-SIZED ENTERPRISES (SMEs) AND THEIR
ADOPTION OF A SUSTAINABILITY PERFORMANCE MEASUREMENT SYSTEM
(SPMS) ......................................................................................................................................... 73

7
3.1 Introduction ......................................................................................................................... 73
3.2 Main internal Factors that Influence the Adoption of SPMS by SMEs .............................. 75
3.2.1 The motivation for Sustainability Engagement among SMEs ..................................... 75
3.2.2 Key Inhibitors and Enablers that can affect the Adoption of SPMS in the SME setting
............................................................................................................................................... 79
3.3 Main External Factors that Influences the Adoption of SPMS in SMEs .......................... 104
3.4 Chapter Summary .............................................................................................................. 105
CHAPTER 4 IDENTIFICATION OF SUSTAINABILITY METRICS FOR SMEs ......... 108
4.1 Introduction ....................................................................................................................... 108
4.2 Main Characteristics and Desirable Requirements of Sustainability Metrics that Relate to
the SME Setting ...................................................................................................................... 109
4.3 Approaches and the Methodologies Used for Identifying and Defining Metrics ............. 118
4.4 The Proposing a Preliminary Set of Sustainability Metrics for SMEs .............................. 122
4.5 Theoretical Framework Development for the Current Study ............................................ 131
4.6 Concluding Remarks ......................................................................................................... 137
CHAPTER 5 RESEARCH METHODOLOGY ..................................................................... 138
5.1 Introduction ....................................................................................................................... 138
5.2 Research Paradigms, Components, and Choice of Methodology ..................................... 139
5.2.1 Critical Elements of Research Paradigms .................................................................. 139
5.2.2 The Positivist/Phenomenological Paradigmatic Framework ...................................... 142
5.3 Choice of Paradigm for the Current Study ........................................................................ 153
5.4 Research Design ................................................................................................................ 155
5.5 Concluding Remarks ......................................................................................................... 163
CHAPTER 6 QUANTITATIVE RESEARCH METHODOLOGY .................................... 164

8
6.1 Introduction ....................................................................................................................... 164
6.2 Quantitative Data Collection Method ............................................................................... 164
6.3 The Development of Measurement Models ...................................................................... 165
6.3.1 Measuring Items ......................................................................................................... 165
6.4 Measurement Scale ........................................................................................................... 173
6.5 The Questionnaire Format ................................................................................................. 174
6.6 Questionnaire Translation ................................................................................................. 175
6.7 The Sample Selection for the Quantitative Study ............................................................. 177
6.7.1 Target Population and Respondent Selection ............................................................. 177
6.7.2 Estimation of the Required Sample Size and Response Rate for the Quantitative Study
............................................................................................................................................. 183
6.7.3 The Sample Design and Data Collection .................................................................... 184
6.8 Unit of Analysis ................................................................................................................ 187
6.9 Data Analysis Techniques ................................................................................................. 187
6.10 Data Processing ............................................................................................................... 190
6.10.1 Missing Data Treatment and Imputation Method ..................................................... 192
6.10.2 Outliers and Multivariate Normality ........................................................................ 192
6.11 Estimation Technique ...................................................................................................... 193
6.12 Fit Indices ........................................................................................................................ 194
6.13 Full Statistical Research Model before Modification ..................................................... 196
6.14 The Higher-Order (Second Order) Confirmatory Factor Analysis of Sustainability Metrics
................................................................................................................................................. 197
6.15 Conclusion ....................................................................................................................... 205
CHAPTER 7 QUANTITATIVE RESEARCH RESULTS AND DISCUSSION ................ 206
9
7.1 Introduction ....................................................................................................................... 206
7.2 Sample Characteristics ...................................................................................................... 207
7.3 Descriptive Statistics of Sustainability Metrics ................................................................ 211
7.3.1 Descriptive Statistics of Economic Metrics ................................................................ 211
7.3.2 Descriptive Statistics of Social Metrics (SOM) ......................................................... 212
7.3.3 Descriptive Statistics of Environment Metrics ........................................................... 213
7.4 Common Methods Bias and Factor Analysis .................................................................... 214
7.4.1 Assessing Collinearity, Multi-collinearity, Validity and Reliability .......................... 214
7.4.2 Confirmatory Factor Analysis Test ............................................................................ 219
7.5 Hypothesis Testing Results ............................................................................................... 224
7.5.1 Results for the Baseline Model ................................................................................... 224
7.5.2 The Effect of Control Variables ................................................................................. 227
7.6 Key Findings and Discussion ............................................................................................ 249
7.6.1 Sustainability Metrics that can be Applicable for SMEs in Vietnam ......................... 249
7.6.2 Factors Influenced the Adoption of SPMS ................................................................. 250
7.6.3 The Effect of Moderating Variables ........................................................................... 255
7.7 Conclusion ......................................................................................................................... 261
CHAPTER 8 QUALITATIVE STUDY DESIGN AND DATA COLLECTION METHODS . 263
8.1 Introduction ....................................................................................................................... 263
8.2 Procedure for Qualitative Data Collection ........................................................................ 263
8.2.1 Interview Techniques ................................................................................................. 263
8.2.2 Qualitative Sampling Technique ................................................................................ 267

10
8.2.3 Qualitative Study Participants .................................................................................... 267
8.2.4 Pilot Interviews ........................................................................................................... 274
8.2.5 Interview Protocol ...................................................................................................... 275
8.2.6 Establishing Ethical Guidelines for both Quantitative and Qualitative Studies ......... 277
8.2.7 The Procedure of Conducting Semi-structured Interviews and the Treatment of
Recording ............................................................................................................................. 278
8.3 Thematic Analysis ............................................................................................................. 281
8.4 Conclusion ......................................................................................................................... 289
CHAPTER 9 ANALYSIS AND DISCUSSION OF QUALITATIVE FINDINGS ............ 290
9.1 Introduction ....................................................................................................................... 290
9.2 Description of Cases .......................................................................................................... 290
9.3 The thematic template ....................................................................................................... 294
• Knowledge management that enables the SPMS adoption .......................................... 295
• Organisational Supports ............................................................................................... 295
• Social-economic environment ...................................................................................... 296
• External barriers ........................................................................................................... 296
o Limited sustainability information providing .............................................................. 296
• Institutional Voids ........................................................................................................ 296
9.4 Key Findings ..................................................................................................................... 296
9.4.1 Theme 1: Motivations that drive SPMS adoption ...................................................... 296
Sub-theme: Mindset of top managers .................................................................................. 297
Sub-theme: SPMS adoption provides support for better decision-making ......................... 300
Sub-theme: SPMS adoption provides resource efficiencies ................................................ 301

11
Sub-theme: SPMS adoption enables cost reductions .......................................................... 302
Sub-theme: SPMS adoption enables customer responsiveness ........................................... 302
9.4.2 Theme 2: Internal factors that influence SPMS adoption ........................................... 306
Sub-theme: Organisational considerations .......................................................................... 307
o Sub-theme: Knowledge management that enables SPMS adoption ............................ 318
o Sub-theme: Organisational support .............................................................................. 324
9.4.3 Theme 3: External factors that influence SPMS adoption ......................................... 334
o Sub-theme: Social-economic environment .................................................................. 334
o Sub-theme: External barriers ........................................................................................ 339
o Provision of limited sustainability information ............................................................ 339
9.5 Further discussion of managerial capacities in SPMS adoption ....................................... 345
9.6 Conclusion ......................................................................................................................... 348
CHAPTER 10 CONCLUSION AND RECOMMENDATIONS .......................................... 351
10.1 Introduction ..................................................................................................................... 351
10.2 Overall discussion of the integrative result of quantitative and qualitative phases ........ 351
10.2.1 Sustainability Metrics Identified for SMEs in Vietnam ........................................... 351
10.2.2 The integrated results of motivation that drive SPMS adoption .............................. 353
10.2.3 The integrated results of inhibitors that hinder SPMS adoption .............................. 356
10.2.4 The integrated results of enablers that facilitate SPMS adoption ............................. 358
10.2.5 The integrated results of external barriers that hinder SPMS adoption .................... 361
10.3 Summary of objectives and conclusions ......................................................................... 362
12
10.4 Contributions of the current study ................................................................................... 367
10.5 Limitation of this study and suggestions for future research .......................................... 372
10.6 Towards and SPMS adoption model in the SME setting ................................................ 373
REFERENCE………………………………………………………………………………..375
APPENDIX…………………………………………………………………………………..433
List of Table
Table 1.1 Objectives of Chapter 1 ................................................................................................ 17
Table 2.1 Objectives of Chapter 2 ................................................................................................ 31
Table 3.1 Objectives of Chapter 3 ................................................................................................ 74
Table 3.2 Internal Motivations to Engage with Sustainability Initiatives .................................... 77
Table 3.3 External Drivers to Engage with Sustainability Initiatives ........................................... 78
Table 3.4 Key inhibitors that hinder SMEs from adopting SPMS ............................................. 102
Table 3.5 Key enablers that facilitate SMEs to adopt SPMS ..................................................... 103
Table 4.1 Objectives of Chapter 4 .............................................................................................. 108
Table 4.2 Summary of 10 scientific articles on the identification of sustainability
indicators/metrics for SMEs ....................................................................................................... 124
Table 4.3 Main indicators obtained from a review of 10 scientific articles and 1 internationally
recognised sustainability index ................................................................................................... 127
Table 4.4 The preliminary list of sustainability metrics identified from the literature focusing on
SMEs ........................................................................................................................................... 130
Table 5.1: Objectives of Chapter 5 ............................................................................................. 138
Table 5.2: Assumptions Underpinning the Paradigms ............................................................... 151
13
Table 5.3: Realist Paradigm and Assumptions for the Current Study ........................................ 154
Table 5.4 Visual Framework for Sequential Explanatory Mixed Methods Procedures for the
Current Study .............................................................................................................................. 162
Table 6.1: Summary of the Chosen Fit Indices and Their Cut-off Values ................................. 195
Table 6.2: The Regression Path Coefficient and its Significance ............................................... 203
Table 6.3: CFA Results for ECM, SOM and ENM .................................................................... 204
Table 7.1 Objectives of Chapter 7 .............................................................................................. 206
Table 7.2 Firms Classified according to their Business Sectors ................................................. 207
Table 7.3 Firms classified according to Firm Size and Firm Age .............................................. 208
Table 7.4 Respondents Classified according to their Business Sectors ...................................... 209
Table 7.5: Profile Summary of Respondents .............................................................................. 210
Table 7.6 Descriptive Statistics of Economic Metrics ................................................................ 211
Table 7.7 Descriptive Statistics of Social Metrics ...................................................................... 212
Table 7.8 Descriptive Statistics of Environment Metrics ........................................................... 213
Table 7.9: Factor Loading Results .............................................................................................. 215
Table 7.10 Chosen Items for Statistical Model ........................................................................... 217
Table 7.11: Validity Check ......................................................................................................... 220
Table 7.12: CFA Results for All Constructs ............................................................................... 222
Table 7.13: The Regression Path Coefficient and its Significance ............................................. 226
Table 7.14 Scale Chi-square difference test (Global Test) for Levels of Managerial Hierarchy 229
Table 7.15 Multigroup Analysis of Levels of Managerial Hierarchy ......................................... 230
Table 7.16 Scale Chi-square difference test (Global Test) for Participant Age ......................... 231
Table 7.17 Multigroup Analysis of Age of Participant ............................................................... 232

14
Table 7.18 Scale Chi-square difference test (Global Test) for Gender ....................................... 233
Table 7.19 Multigroup Analysis of Gender (Male and Female) ................................................. 234
Table 7.20 Scale Chi-square difference test (Global Test) for Working Experience ................. 235
Table 7.21 Multigroup analysis of Working Experience ............................................................ 236
Table 7.22 Scale Chi-square difference test (Global Test) for Business Sectors ....................... 237
Table 7.23 Multigroup Analysis of Business Sector .................................................................. 238
Table 7.24 Scale Chi-square difference test (Global Test) for Firms’ Sustainability Experience
..................................................................................................................................................... 239
Table 7.25 Multigroup analysis of Sustainability Experience of Businesses ............................. 240
Table 7.26 Scale Chi-square difference test (Global Test) for Firm Size ................................... 241
Table 7.27 Multigroup analysis of Firm Size ............................................................................. 243
Table 7.28 Scale Chi-square difference test (Global Test) for Firm Age ................................... 245
Table 7.29 Multigroup analysis of Firm Age .............................................................................. 246
Table 7.30 Summary of Hypothesises Testing and Multigroup Analysis Results ..................... 248
Table 8.1 Characteristics of Interview Types ............................................................................. 265
Table 8.2 Overall information of interviewees and studied SMEs ............................................. 273
Table 9.1 Non-state SMEs participating in the study ................................................................. 291
Table 9.2 Key Informant Information ......................................................................................... 292
Table 9.3 Thematic Template ..................................................................................................... 295
Table 9.4 Desirable general requirements of sustainability metrics discussed in interviews (not
including the perspective of shareholders and business customers) ........................................... 310
Table 10.1 Sustainability Metrics Identified for SMEs in Vietnam ........................................... 352
Table 10.2 The integrated results of motivation that drive SPMS adoption ............................... 354
15
Table 10.3 The integrated results of inhibitors that hinder SPMS adoption ............................... 357
Table 10.4 The integrated results of enablers that facilitate SPMS adoption ............................. 359
Table 10.5 The integrated results of external barriers that hinder SPMS adoption .................... 361
List of Figure
Figure 1.1 Thesis Structure ........................................................................................................... 30
Figure 2.1 The Triple Bottom Line ............................................................................................... 36
Figure 2.2: Key aspects of economic performance ....................................................................... 40
Figure 2.3 Key aspects of environmental performance ................................................................ 44
Figure 2.4: Key aspects of social performance ............................................................................. 50
Figure 4.1. Theoretical Framework of the Current Study ........................................................... 136
Figure 5.1: Sequential Explanatory Mixed Methods Design of the Current Study .................... 161
Figure 6.1: Six-Stage Process for SEM ...................................................................................... 190
Figure 6.2. The Four-Step Process for Identifying and Applying Remedies .............................. 191
Figure 6.3: Full Statistical Research Model ................................................................................ 197
Figure 6.4: Estimating the Factor Loading for all of the Sustainability Metrics Constructs ...... 199
Figure 6.5: Estimating the Factor Loading for the Remaining Sustainability Metrics Constructs
(to be continuously modified) ..................................................................................................... 200
Figure 6.6: Estimating the Factor Loading for the Sustainability Metrics Constructs (final
selection) ..................................................................................................................................... 202
Figure 7.1 Final Measurement Model ......................................................................................... 219
Figure 7.2: Structural Equation Modelling without Multi-group Analysis ................................ 224
Figure 8.1 A screenshot from the control panel of Express Scribe Transcription Software Pro 283

16
Figure 8.2 An example of organising the initial codes into a parent-child relationship (screenshot
from NVivo 12) ........................................................................................................................... 286
Figure 10.1 Proposed SPMS Adoption model in the SME setting ............................................. 374

17
CHAPTER 1 INTRODUCTION
1.1 Introduction
This chapter will first present the research background, research problems and research context.
The chapter will then state the aim, objectives and questions addressed in the research and these
will underpin the structure of the thesis. The objectives of each section of this chapter are outlined
in Table 1.1.
Table 1.1 Objectives of Chapter 1
The following section presents research background of the current study.
Objectives Section
1 - To present the research background 1.2
2 - To describe the research context 1.3
3 - To state the research aim, objectives, and questions 1.4
4 - To emphasise the contributions and significance of the research 1.5
5 - To present the research structure 1.6

18
1.2 Research Background
In a publication released in 1987 entitled "Our Common Future" the World Commission on
Economic Development (WCED) defines sustainable development as "the development that meets
the needs of the present without compromising the ability of future generations to meet their own
needs" (WCED, 1987, p. 43). The WCED publication highlights the importance of harmonising
humanity’s current consumption with the needs of future generations. The publication strongly
advocates securing global equity for future generations by directing resources towards less
developed countries, thus encouraging economic growth (Du Pisani, 2006).
It is widely acknowledged that companies have a profound effect on the natural environment,
society and the global economy, and that effect is only amplified by the acceleration of climate
change; this, in turn, compounds social inequality, social discontent and economic depression
(Svensson et al., 2016). However, companies can contribute to the protection of the natural
environment and a better quality of life for communities, in both local and global contexts (Roxas
and Chadee, 2012). It is now understood that society will never achieve sustainable development
without the support of businesses, as they represent an economy's productive resources (Hahn and
Figge, 2011).
It can be deduced from the previous research that businesses are increasingly under pressure from
their stakeholders to fulfil their responsibilities with regard to promoting sustainability activities
to raise trustworthiness, reinforce relationships with said stakeholders and to demonstrate their
commitment to environmental, social and economic performances (De Giovanni, 2012; Govindan,
Khodaverdi, and Jafarian, 2013; Antolín-López, Delgado-Ceballos, and Montiel, 2016; Font,
Garay, and Jones, 2016; Tran, Deng, and Ong, 2018; Küçükbay and Sürücü, 2019). Accordingly,
19
measuring sustainability performance has become a prominent distinguishing factor among
businesses (Searcy, 2012; Kloviene and Speziale, 2015; Maas, Schaltegger, and Crutzen, 2016;
Malesios et al., 2020). The measurement is believed that can help companies to effectively
measure and obtain better sustainability performance (Gianni, Gotzamani and Tsiotras, 2017;
Hogevold et al., 2015).
It is worth mentioning that with the significant proportion of small and medium-sized enterprises
(SMEs) dominating the world's economy it is estimated that they are responsible for about 70 per
cent of global industrial waste pollution (Caldera, Desha and Dawes, 2019a; Hsu, Chang and Luo,
2017). Their high failure rates still represent a significant challenge in the current global economy
(Cardoni et al., 2020). Comparing to larger counterparts, SMEs are often described as having
insufficient resources and lacking awareness of sustainability standards (Sommer, 2017),
consequently resulting in the inability to effectively handle sustainability performance-related
issues (Clarke‐Sather et al., 2011; Tremblay and Badri, 2018).
While previous research on sustainability performance measurement has been conducted primarily
in large corporations, with limited attention and research applied within the SME sector (Choi,
Kim, and Yang, 2018). Although the focus of research has indeed shifted in recent times to
concentrate on SMEs. Empirical studies (Feil, de Quevedo, and Schreiber, 2015; Mengistu and
Panizzolo, 2021) indicate that selected and developed sustainability metrics/indicators for SMEs
are mainly based upon the perspective of external stakeholders such as experts and researchers
and, according to Trianni et al. (2019), this reflects a shortcoming of sustainability
metrics/indicators developed from the perspective of SMEs. It therefore remains unclear which
20
types of dynamic capabilities are crucial to SMEs to effectively adopt sustainability performance
(Eikelenboom and de Jong, 2019).
Looking at this concept from another perspective, extant literature reveals that current research on
corporate sustainability is biased towards developed countries, such as the USA, the UK, Europe
and Japan (Ahmad et al., 2021; Laskar and Maji, 2016; McMurray et al., 2014). Despite the fact
that research on sustainability in developing countries is gaining popularity, the adoption of
sustainability activities by corporations has not yet reached a satisfactory level (Dissanayake et al.,
2020). Scholars (Singh, Olugu, and Musa, 2016; Fatimah and Aman, 2018) have called for
research that establishes appropriate sustainability metrics that will help SMEs, particularly in
developing countries, to measure and monitor their sustainability performance. This situation
reveals a gap in sustainability performance measurement research that is based on regional focus.
1.3 Research Context
Today, most managers have accepted corporate sustainability as a precondition for conducting
their business (Rocha-lona et al., 2015). Notably, in an emerging market, such as the country of
Vietnam which is moving towards greater international economic integration, the compliance with
social and environmental standards has been suggested as a precondition for global business
engagement (Nguyen et al., 2018). Vietnam has shown remarkable progress in poverty reduction
and economic development over the past thirty years; in 1990, Vietnam was one of the world's
poorest countries, with a gross domestic product per capita of less than USD 100. By 2013, the
country achieved a gross domestic product per capita of more than USD 1,700 (Altenburg and
Lütkenhorst, 2015), thereby becoming a lower-middle-income country according to the World
Bank's classification (UNIDO, 2012, p. 17).

21
The economic context and institutional transition make Vietnam a good research setting from
which more can be learned about corporate sustainability in SMEs. Vietnam's rapid development
through the success of private enterprises can be traced back to 1986, when the country’s
restoration reform policies known as Doi Moi, were launched. From a planned economy with a
dominance of state-owned enterprises, the country shifted towards a "market-oriented socialist
economy under state guidance" (Beresford, 2008, p. 221) in which most private business
enterprises were SMEs. In Vietnam today, SMEs account for more than 97% of operating
businesses, they make up 40% of the GDP and provide 60% of gainful employment nationally
(Bach, Le, and Bui, 2020).
Despite political and military tensions with Cambodia and China, and being at war with the USA
until the mid-seventies, Vietnam has progressed over the last two decades to overcome the
hardships incurred during the socialist post-reunification era, and has become an emerging
economy in South East Asia.
In 1986, Vietnam was listed among the world's poorest countries with a per capita GDP of $203
(Voeten and Naudé, 2013). That same year, Doi Moi, the Reform Policy, was introduced. Since
then, Vietnam has accelerated changes to ensure a sustainable economy that focuses on the private
sector. Vietnam now considers its private sector to be an essential means to achieving economic
growth, poverty reduction and social development. The Government has introduced the Enterprise
Law and related policies that promote SME performance (Government of Vietnam 2009, 2014b)
and in addition, Vietnam's Agenda 21, introduced in 2004, is a strategic program that identifies
economic, environmental and social objectives to achieve sustainable development. Regulations
22
on social welfare and environmental protection have also been introduced to ensure the
sustainability of Vietnamese firms (Government of Vietnam 2014c, 2014d, 2014e).
Recognising the importance that the business sector plays within economic development, the
Vietnamese Government is paying special attention to promoting and supporting sustainable
development. To this end, the Vietnam Business Council for Sustainable Development (VBCSD)
was established by the Vietnam Chamber of Commerce and Industry under the Government's
approval on 8th September 2010. The VBCSD is a business-led organisation with a mandate that
promotes and strongly advocates the active role that the business community has with regard to
implementing the Strategic Orientation for Sustainable Development in Vietnam. The VBCSD
facilitates and encourages the sharing of experiences, solutions and good practices within the
context of sustainable development, and strengthens dialogues and close coordination within the
business community, Government and civil organisations.
The factors mentioned in this section – with reference to Vietnam – make SME’s suitable for this
current study.
1.4 Research Aim, Objectives, and Question
Sustainability research is not a new concept. However, this current thesis proposes to address a
gap in the literature. Few studies have measured sustainability performance and identified key
metrics in SMEs, let alone in the context of developing countries. More specifically, this study
aims to fill this gap by addressing the identification of sustainability metrics from the perspective
of SMEs, which is an underdeveloped area of research, with the specific focus on the country of
Vietnam.
23
By focusing on a different empirical context (Vietnam), this study provides significant
contributions to the literature on SME sustainability performance measurement, whilst considering
the specific conditions of SMEs in Vietnam.
To clarify the formulation of the research objectives, the primary purpose of this thesis is to
investigate the most appropriate metrics for SMEs in Vietnam and the key enablers and inhibitors
to better help these SMEs measure their sustainability performance. Therefore, this research is
organised and developed around the following main research question:
How should the sustainability performance of SMEs in Vietnam be measured?
To investigate this central research question, a concurrent mixed methods research approach
incorporating both quantitative and qualitative elements is adopted. Structural equation modelling
(SEM) is used to analyse the quantitative data, and thematic analysis is employed to analyse the
qualitative data. Therefore, the specific research questions addressed in each part of this thesis are
as follows:
Research questions for the quantitative study:
RQ1. What are the most appropriate sustainability metrics (sustainability performance
measuring systems) that can be applied in order that SME’s can measure and better
manage their sustainability performance?
RQ2. What is the motivation that drives SMEs to adopt sustainability performance
measurement systems (SPMS)?
24
RQ3. What are key internal and external factors that influence whether SPMS is adopted?
RQ4. What are the relationships between these factors (RQ2 and RQ3) and SPMS
adoption?
RQ5. How strong are the relationships in RQ4?
RQ6: How do the characteristics of the business (size, age, business sector, sustainability
experience), and key characteristics of participants in SMEs (gender, age, work
experience, managerial position) influence the different relationships between factors and
SPMS adoption?
Research questions for the qualitative study:
RQ7. How is the motivation driving the SPMS adoption within SMEs?
RQ8. How are inhibitors and enablers influencing the SPMS adoption within SMEs?
RQ9. How do SMEs overcome their resource constraints in order to adopt SPMS?
From the main research question and sub-research questions, the following research objectives are
identified:
1. To review the key aspects and significance of sustainability performance in the SME
setting.
2. To identify key theories underpinning SPMS adoption.

25
3. To investigate key motivation that drives SMEs to adopt SPMS.
4. To explore the key characteristics of SMEs and the internal and external factors that
influence SPMS adoption.
5. To identify, from the existing literature, the most appropriate sustainability metrics that can
be applied to Vietnamese SMEs in order that they can measure and better manage their
sustainability performance.
6. To investigate the characteristics of the business (size, age, business sector, sustainability
experience), and the key characteristics of participants in SMEs (gender, age, work
experience, managerial position) influence the different relationships between factors and
SPMS adoption.
7. To suggest critical strategies that will enable both SMEs’ owner-managers and
policymakers to facilitate the SPMS adoption in the context of Vietnamese SMEs.
1.5 Contribution and Significance of the Research
The study contributes to the existing body of knowledge in four significant ways.
First, in contrast to several studies that have investigated SME sustainability performance
measurement, this study focuses on identifying sustainability metrics, from the perspective of
SMEs, in one of the fastest growing emerging markets; Vietnam. This current study is the first to
investigate sustainability metrics for SMEs in a Vietnamese context.
Secondly, this study contributes to the existing literature by promoting a better understanding of
the motivations for adoption of sustainability metrics, and the factors acting as inhibitors and
26
enablers that influence SMEs adoption of the sustainability metrics proposed in the literature, with
a particular focus on the emerging country of Vietnam. These factors could be different from those
commonly observed in developed countries.
Thirdly, this study enriches the empirical literature on how SMEs, because of their resource
constraints, can simultaneously address all three aspects of sustainability performance in an
integrated manner; these aspects are economic, social and environmental. This topic is not
extensively addressed in the literature (Dissanayake et al., 2020; Eikelenboom and de Jong, 2019;
Goyannes et al., 2018; Siegel et al., 2019a) and the literature gap is filled by this research.
Fourth, this study is significant because it provides empirical evidence that facilitates a better
understanding and identification of appropriate sustainability metrics that have both direct and
indirect influence on SMEs growth. It helps potential and existing entrepreneurs, policymakers,
regulators and investors to better understand the context of SMEs in Vietnam regarding the
adoption of sustainability performance measurement.
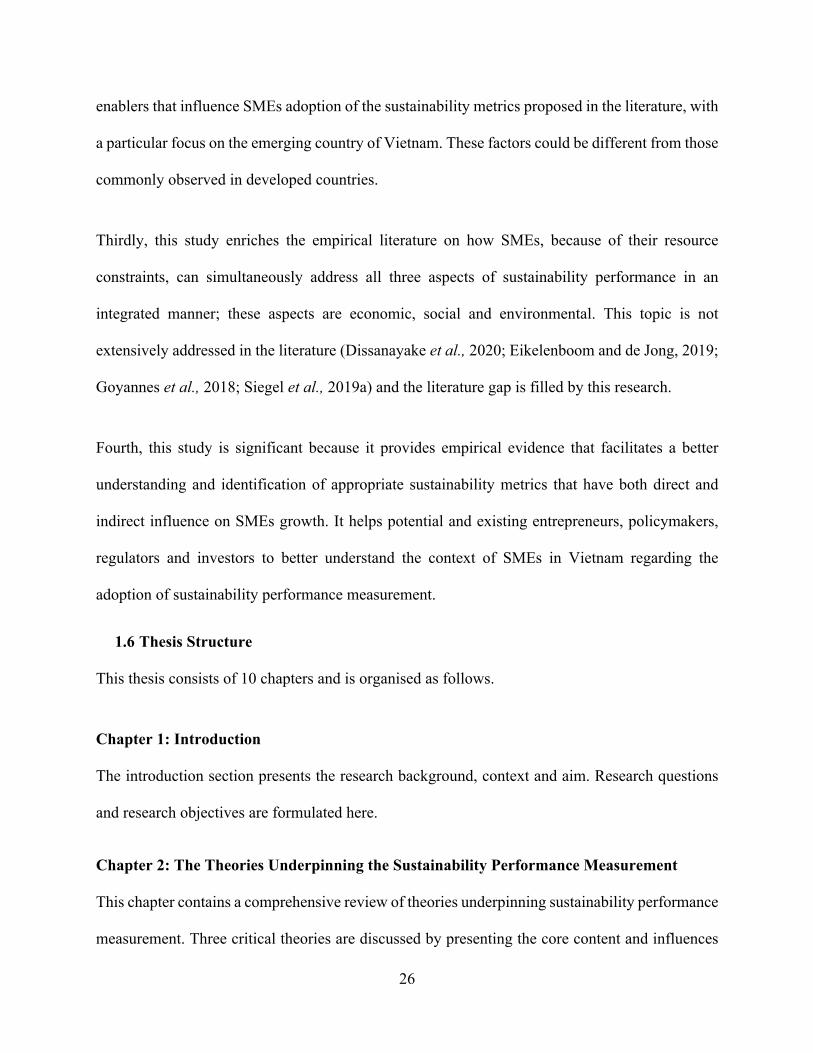
1.6 Thesis Structure
This thesis consists of 10 chapters and is organised as follows.
Chapter 1: Introduction
The introduction section presents the research background, context and aim. Research questions
and research objectives are formulated here.
Chapter 2: The Theories Underpinning the Sustainability Performance Measurement
This chapter contains a comprehensive review of theories underpinning sustainability performance
measurement. Three critical theories are discussed by presenting the core content and influences

27
that will shed light on sustainability performance measurement. These include stakeholder theory,
institutional theory and contingency theory. Thereafter follows a general overview of the triple
bottom line concept with the goal of presenting an overall sustainability performance measurement
system. These are relevant theoretical frameworks for investigating sustainability performance
measurement in Vietnamese SMEs while offering different perspectives on the phenomenon.
Chapter 3: SMEs and Their Adoption of Sustainability Performance Measurement
This chapter provides a critical analysis of the literature that relates to adoption of sustainability
performance measurement in SMEs. In this chapter, factors that act as motivators, inhibitors and
enablers are identified and discussed; all of these have an influence on SMEs sustainability
performance measurement adoption. The research hypotheses are subsequently developed and
formulated for testing.
Chapter 4: Identification of Sustainability Metrics for SMEs
This chapter further provides a critical analysis of the literature relating to identifying sustainability
metrics that are applicable to SMEs. It also aims to review the pillars of the triple bottom line
concept in more detail: economic, environmental and social aspects. A review of previous studies
relating to the research topic will follow, with a preliminary list of proposed sustainability metrics.
Finally, this chapter concludes with the theoretical framework for the empirical research.
Chapter 5: Overall Review of Research Methodology
This section provides insight into the main paradigms found in business research. After explaining
the importance of research credibility, the primary methodologies are discussed in detail. Next,
this chapter defines the research strategy and setting, and also explains why a concurrent mixed
methods approach is deemed most suitable for the study.
28
Chapter 6: Quantitative Research Methodology
This chapter explains the methods and procedures used to conduct the quantitative research that
will test the previous chapter's hypotheses. The main objective of the quantitative research is to
investigate the most appropriate sustainability metrics, key motivation, and internal and external
factors that influence SPMS adoption, in addition to examining the relationships between these
factors and SPMS adoption and the moderating effect on the relationship.
This chapter covers all main aspects, including quantitative research design, development of
measurement models and quantitative sampling. Chapter 6 also includes data analysis, data
processing, and estimation techniques used in the statistical model before modification. This
section also presents a confirmatory factor analysis of motivation, inhibitors, and enablers
influencing the adoption of sustainability performance measurement. In addition, confirmatory
factor analysis of sustainability metrics and fit indices are also presented. This chapter then
concludes with the description of the complete statistical research model before modification and
the higher-order confirmation factor analysis of sustainability metrics.
Chapter 7: Quantitative Research Results and Discussion
This chapter presents the results of hypothesis testing and analysis of those results. The chapter
then continues with a discussion of the quantitative results.
Chapter 8: Qualitative Study Design and Data Collection Methods
The main research objective of qualitative investigation is to further explain the initial quantitative
result, found in chapter 7, and further explore the motivation and the internal and external factors
that influence the SPMS adoption. Another key objective is to explain how SMEs overcome their
resource constraints to adopt SPMS.
29
The primary purpose of this chapter is to describe and explain the qualitative component of the
research. This chapter also presents the procedure for qualitative data collection and outlines the
process used for data analysis.
Chapter 9: Qualitative Findings, Analysis and Discussion
This chapter presents findings and analysis from the interview data. In this chapter, the discussion
of quantitative results is included.
Chapter 10: Conclusions and Recommendations
This section presents the conclusions with a summary of the empirical results, and combines and
compares the survey and interview data. Based on hypothesis testing and the data analysis, the
results, conclusions and recommendations are used to construct a sustainability performance
measurement system which is appropriate for adoption by Vietnamese SMEs. Finally, the section
concludes with a summary of the results, a view of the limitations of the study and suggestions for
further research.
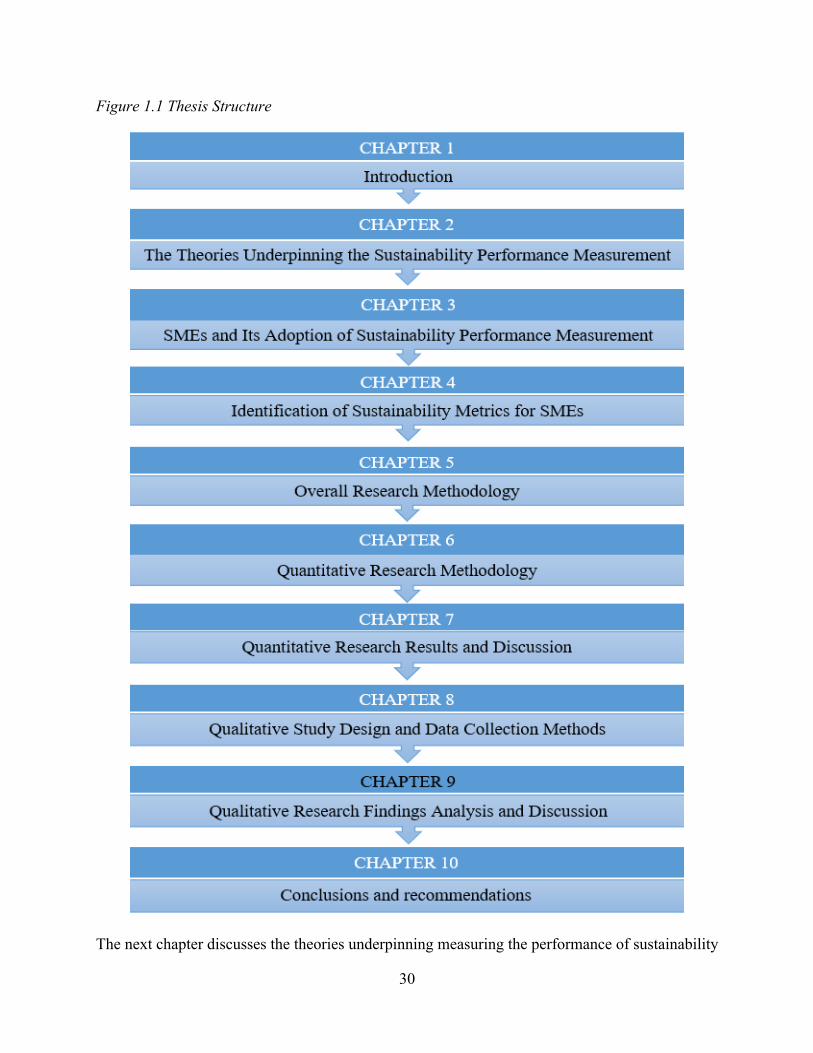
The structure of the thesis is summarised in Figure 1.1
30
Figure 1.1 Thesis Structure
The next chapter discusses the theories underpinning measuring the performance of sustainability
31
CHAPTER 2 THE THEORIES UNDERPINNING MEASURING THE
PERFORMANCE OF SUSTAINABILITY
2.1 Introduction
This chapter presents the key theories that underpin the adoption of sustainability performance
measurement. For each theory, the discussion focuses on two aspects; what the theory is about and
how it contributes to shaping the adoption of sustainability performance measurement. This
chapter also presents an overview of the triple bottom line concept (TBL), which has been
employed as the main framework of sustainability performance. The chapter's objectives and the
sections of the chapter that deal with each objective are outlined in Table 2.1.
Table 2.1 Objectives of Chapter 2
This chapter now proceeds with an overview of sustainability performance measurement and its
purposes.
Objectives Section
1 - To present an overview of sustainability performance measurement and
its purpose
2.2
2 - To gain a better understanding of the issues and challenges of the Triple
Bottom Line concept (TBL)
2.3
1 To present key theories that underpin the adoption of SPMS
- to discuss the stakeholder theory as a theoretical lens to explore
motivation driving SPMS adoption
- to discuss contingency theory as a theoretical lens to view contextual
factors of organisations that influence SPMS adoption
- to discuss institutional theory as a theoretical lens to examine the
enablers and barriers for SPMS adoption
2.4
2.4.1
2.4.2
2.4.3
32
2.2 An Overview of Sustainability Performance Measurement and Its Purposes
According to Neely, Gregory and Platts (1995, p. 81) a performance measurement is ‘the set of
metrics used to quantify both the efficiency and effectiveness of actions.’ The author clarify that
‘performance measurement’ is best understood as the process, while ‘a performance measure’
refers to a metric employed to quantify the efficiency and effectiveness of action (Neely, Gregory
and Platts, 1995). This metric may, however, vary from one situation to another, and from one
company to another.
Searcy (2011) considers a sustainability performance measurement system (SPMS) as being
similar to all performance measurement systems in terms of the ability to measure performance
aimed at business improvement. However, sustainability performance measurement systems are
viewed as a nascent subset of performance measurement systems (Neri et al., 2021; Pryshlakivsky
and Searcy, 2015). Searcy (2012, p. 240) defines a SPMS as: ‘a system of indicators that provides
a corporation with the information needed to help in the short and long-term management,
controlling, planning, and performance of the economic, environmental, and social activities
undertaken by the corporation.’
Searcy’s definition of SPMS concentrates on two pivotal aspects: having a long-term focus and
addressing three pillars of the triple bottom line (TBL), these being economic, social and
environment. Citing an early study conducted by Bititci et al. (2005, p.336) on measuring and
managing performance, Searcy (2011, p.45) proposes vital characteristics of a SPMS that should
“be balanced, be integrated, inform strategy, deploy strategy, focus on business processes that
deliver value, be specific to business units, include competencies, and include stakeholder
contribution”. Having defined such characteristics, Searcy (2011) indicates key elements in areas

33
relating to the design of a SPMS. As such, Searcy’s definition is particularly relevant to the current
study, as it directly addresses the notion of the TBL. More specifically, this chosen definition
presents a view of sustainability metrics/indicators as something that could vary across contexts;
this is also the perspective adopted in the current study. Finally, this chosen definition is simple
and comprehensive, which makes it ideally suited to guiding the process of identifying and
developing appropriate sustainability metrics for SMEs in Vietnam.
It is crucial to recognise that performance measurement and metrics are two components that are
tightly interlinked, and they cannot be isolated singularly. Current research appears to validate the
view that metrics facilitate the fundamental activities of measurement (Melnyk, Stewart and
Swink, 2004; Neri et al., 2021; Sukkar, 2017). The merit of a sustainability metric/indicator is to
help simplify, analyse, summarise and communicate complex and complicated sustainability
information (Singh et al., 2012; Tan et al., 2015; Warhurst, 2002). In other words, it provides
critical information about sustainability issues, identifying trends or cause-and-effect
relationships; as such, it goes beyond simple data (Fan, Carrell and Zhang, 2010; Van Passel et al.,
2007; Veleva and Ellenbecker, 2001).
The effective use of sustainability information requires a detailed analysis of the link between the
indicator and the issues, which needs to be as direct and straightforward as possible (Chee Tahir
and Darton, 2010). In this respect, sustainability metrics and indicators can help decision-makers
comprehensively examine and evaluate corporate sustainability performance. Moreover, it
provides accurate information that helps planning future actions (Delai and Takahashi, 2011;
Faulkner and Badurdeen, 2014; Van Passel et al., 2007).

34
Simultaneously, sustainability indicators can provide stakeholders with precise material that
enables them to understand sustainability information without confusion (Kurka and Blackwood,
2013). A typical and advantageous characteristic of a sustainability metrics/indicator lies in its
ability to transmit complex sustainability information as concisely as possible (Azapagic, 2004;
Singh et al., 2012). A good sustainability indicator, according to Veleva and Ellenbecker (2001),
should have the following three objectives:
1. To raise awareness and understanding.
2. To provide informed decision-making.
3. To measure progress towards established goals.
Similarly, Morioka and Carvalho (2016) claim that an SPMS is useful in enabling the decision-
makers within the SMEs to effectively make plans related to sustainability issues, promoting
organisational learning and encouraging stakeholder engagement. For this purpose, measuring
sustainability performance becomes vital in every organisation and is the primary purpose of a
performance measurement system. According to Gunasekaran and Kobu (2007, p. 2820), such a
system includes eight critical points:
1. Identifying success.
2. Identifying whether stakeholder needs are met.
3. Better understanding of the processes.
4. Identifying bottlenecks, waste, problems and improvement opportunities.
5. Providing accurate decisions.
6. Enabling progress.
7. Tracking progress.

35
8. Facilitating more open and transparent communication and co-operation.
According to Searcy (2012), an SPMS can be deemed robust if it can support decision-makers in
navigating the challenges of corporate sustainability by providing them with a better understanding
of their current situation, as well as their desired end state. However, Searcy (2009) contends that
there is no defined end state for corporate sustainability. The author further explained that an SPMS
cannot directly reflect how sustainable any particular firm is because it simply measures their
progress towards clearly defined goals, objectives and targets (Searcy, 2009).
It is important to recognise that SMEs are often described as having unplanned, informal (Sengupta
and Chattopadhyay, 2006) and unstructured decision-making processes (Saad, Kumar and
Bradford, 2017). Considering all above discussions, it can be argued that through the SPMS
adoption, SMEs decision-makers can be equipped with a more effective tool to make productive
decisions regarding sustainability activities. This is an interesting but challenging issue for the
current study that will generate further our understanding of the phenomenon.
The following section discusses the triple bottom line concept.
2.3 The Triple Bottom Line Concept
In business, sustainability is often viewed as the Triple bottom Line (TBL) sustainability (Delai
and Takahashi, 2011; Sartori, Latrônico, and Campos, 2011; Padin et al., 2016). The term TBL
was initially coined in 1994 by Elkington, who defines it as a balance of economic, environmental,
and social sustainability dimensions (Elkington, 1994; Seuring and Müller, 2008). The concept is
illustrated in Figure 2.1.

36
Figure 2.1 The Triple Bottom Line
(Source: Azapagic, 2003, p. 304)
In essence, the TBL approach differs remarkably from a limited economic perspective and includes
two more dimensions: social and environmental (Slaper and Hall, 2011). It is believed that
businesses adopting the TBL approach can capture a whole set of values, issues and processes to
maximise the positive impact of their sustainability-related activities (Elkington, 1997).
Companies, however, need address all three pillars of TBL in an integrated manner to attain
sustainable development (Khurana, Haleem and Mannan, 2019; Slaper and Hall, 2011). This is
because, tackling any one of the dimensions in isolation might result in unintended consequences
in another dimension (Rachuri, Sriram, and Sarkar, 2009). This practice perhaps reflects why TBL
approach is considered a unified sustainability conception of business activity performance
(Elkington, 2001; Slaper and Hall, 2011).
The prominence of TBL adoption as a framework to measure sustainability performance is widely
cited in the existing literature. This can be due to the TBL approach can establish clear basic
37
principles for developing sustainability performance measurement systems (Hubbard, 2009;
Searcy, 2016), enabling businesses to give closer attention to the impact of their operations
(Ekwueme, Egbunike, and Onyali, 2013). As such, it provides a holistic framework and metrics
that add value to businesses existing management systems (Gianni, Gotzamani, and Tsiotras,
2017). The engagement with TBL, as such, can support businesses in responding to stakeholders’
concerns regarding sustainability issues (Norman and Macdonald, 2004).
Following the above trend, academics and researchers in the field have increasingly employed the
TBL framework to investigate sustainability performance-related issues. Due to specific research
purposes, some scholars have focused solely on environmental performance (Rao et al., 2009;
Sundin, Nässlander, and Lelah, 2015), while others (e.g. Hasan, 2016) primarily concentrate on
social performance. What is missing in the studies mentioned here is the consideration of balancing
all three dimensions of sustainability and their interactions. This gap is also confirmed in recent
works (Goyannes et al., 2018; Siegel et al., 2019; Dissanayake et al., 2020), implying that research
is needed to further our understanding of how economic, environmental, and social performances
are integrated and balanced in the context of SMEs business practices.
Considering the above, the current study fills the existing research gap by systematically
examining a SPMS in an integrated manner, including all three sustainability performances:
economic, social, and environment. The purpose is to better understand the factors, inhibitors, and
enablers that affect the adoption and use of sustainability metrics in Vietnamese SMEs.
A primary challenge is recognised, caused by inherent pitfalls of the TBL concept. In essence, the
TBL approach embraces multifaceted aspects that cover a wide range of economic, social, and
environmental issues (Bodini, 2012; Hassini, Surti, and Searcy, 2012; Ahi and Searcy, 2013;
38
Sridhar and Jones, 2013; Antolín-López, Delgado-Ceballos, and Montiel, 2016; Omri, Courrent,
and Chasse, 2018). Moreover, each aspect is further complicated by the fact that each has a wide
range of measurement scope and options, with no consensus on a standard, or a commonly agreed-
upon reporting framework (Hubbard, 2009; Searcy, 2016). Such complexities mentioned here
might explain why TBL does not consider these three pillars to be equal factors.
Taking into account the above information, the development of sustainability metrics for SMEs is
closely linked to the need of a careful consideration with regard to optimising the sustainability
efforts of the SME, whilst also paying attention to exploring the best way of integrating these
metrics into their business model (Aragón-Correa et al., 2008; Shields, Welsh and Shelleman,
2018). As such, the current study employs a systematic, structured and holistic approach that
properly considers corporate sustainability related-issues in the context of SMEs (Bourlakis et al.,
2014; Searcy, 2016; Sheehan, Garavan and Carbery, 2014). This means that variables, interactions
and controversies need to undergo a thorough examination (Bodini, 2012). The purpose of these
aims to define and identify most appropriate metrics that can be applicable for SMEs, which help
them to measure and better manage their sustainability performance.
Before examining each pillar of the TBL and its critical aspects related to the context of SMEs, it
is worth mentioning that corporate sustainability (CS) and corporate social responsibility (CSR)1
are interchangeably used in the existing literature. However, a significant difference between the
terms was noted by van Marrewijk (2003), who pointed out that CS focuses on value creation,
environmental management, environmentally friendly production systems and human capital
1 “Corporate Social Responsibility is a concept whereby companies integrate social and environmental concerns into their business operations and in their interaction with their stakeholders on a voluntary basis”. (European Commission, 2002, 347 final, p. 3)
39
management, while CSR relates to stakeholder dialogue transparency and sustainability reporting.
Both concepts, CS and CSR share the same vision regarding balancing economic responsibilities
with social and environmental responsibilities (van Marrewijk, 2003; Teck Hui, 2008). This
clarification is probably beneficial for research being undertaken on the sustainability of SME in
the context of developing countries, where businesses do engage in CSR activities but usually do
not disclose these activities under the title of CS (Das and Rangarajan, 2017). The approaches of
CS and CSR can be integrated as long as the two constructs are appropriately considered different
or equivalent (Lo and Sheu, 2007; Montiel, 2008). And no less importantly, this enables more
relevant articles to be identified and irrelevant ones to be eliminated, which greatly assist in finding
the answer to the research question of the current study (Soilemezi and Linceviciute, 2018).
This section has described an overview of the TBL concept. It should note that throughout this
current study, terms such as “sustainable development”, “sustainability”, “corporate
sustainability”, and “triple bottom line” are interchangeably used. This is because although each
term might be the best fit for a specific circumstance in a business context, they are all broadly in
line with the WCED's definition of sustainable development. Whichever term is used refers to the
balance that exists between the three pillars: environmental, economic, and social (Sartori,
Latrônico, and Campos, 2011; Svensson et al., 2016). The current study now turns to a discussion
of each pillar of the TBL.
The following section discusses economic performance of the TBL.
2.3.1 Economic Performance
Economic performance pertains to enhancement and value creation with reference to the financial
performance of a business. (Bansal, 2005; Kim et al., 2015). Generally, it is viewed as the most

40
accurately understood and has received the most attention among the TBL pillars (Kim et al.,
2015). It is recognised that the main risk for the SME is that they will fail to survive (Jenkins,
2004; Nwobu, Faboyede and Onwuelingo, 2015; Tan et al., 2015; Feil et al., 2015; Joung et al.,
2013). As such, it comes as no surprise that financial performance has become the SMEs most
significant consideration. In fact, the efforts of businesses towards sustainability are not based
solely on altruistic reasons but on maintaining and increasing profit (Svensson and Wagner, 2015).
From a broad view, economic performance reflects a company’s ability to make enough profit to
survive and benefits the economic systems at both local and national levels. In SMEs, this
performance typically focuses on two main aspects; profitability and investment (Feil et al., 2015;
Tan et al., 2015; Joung et al., 2013). These two aspects are crucial because they are related to an
organisation’s long-term sustainability (Delai and Takahashi, 2011), which are illustrated in Figure
2.2.
Figure 2.2: Key aspects of economic performance
(Source: author's drawing)
41
2.3.1.1 Profitability related measures
Profitability should not be viewed as a dominant motivation in the short term, but as an indicator
of how businesses can survive and grow in the long term. Some typical profitability indicators that
can be applied to businesses of all sizes include sales, gross profits, net profit, operating profit,
operating expenses and tax payments (Borga et al., 2009; Feil, de Quevedo and Schreiber, 2015;
Global Reporting Initiative, 2015; Tan et al., 2015).
2.3.1.2 Investment-related measures
Investments are critical aspects of economic growth. Investment indicators are commonly used to
compute the impacts of a company overall and eco-friendly investments, which collectively
measure financial health (Joung et al., 2013). Specifically, Delai and Takahashi (2011) note that
an investment metric provides an overview of the number of financial resources that are used to
increase, replace or renew assets to guarantee long-term profitability. Kucharčíková, Mičiak and
Hitka (2018) view it as an indicative metric and highlighted certain limitations; for instance, they
expressed concern that the calculation of these metrics is probably affected by the accounting
methods used in a company profit and loss statement that might not consider inflation and changes
in the exchange rate (Kucharčíková, Mičiak and Hitka, 2018). Thus, although investment-related
metrics can be crucial to SMEs economic performance (Hsu, Chang and Luo, 2017; Neri et al.,
2021), they need to be treated with caution as an accurate form of benchmarking when comparing
businesses.
The following section discusses environmental performance of the TBL.

42
2.3.2 Environmental Performance
Environmental sustainability is considered a strategic construct within a business and is a reflection
of how well a company monitors, controls and decreases the impact of its activities on the natural
environment (Baumgartner and Ebner, 2010; Chow and Chen, 2012; Elkington, 1997; Govindan
et al., 2013; Roxas and Chadee, 2012). This pillar of TBL sustainability, in the business context,
refers to the process through which a company utilises and deals with energy and other resources
and also the ecological footprint which they leave behind from their operations (Gimenez, Sierra,
and Rodon, 2012). However, such a process is complicated because businesses have to deal with
waste reduction, pollution reduction, energy efficiency, emissions reduction and reduction of the
consumption of hazardous/harmful/toxic materials (Baumgartner and Ebner, 2010; Gimenez et al.,
2012).
Rao et al. (2009) emphasise the importance of environmental protection, positing that it is no
longer optional but a necessity. Zorpas (2010) pointed to tightening legislation and environmental
protection guided by administrative and legal regulations.
To achieve environmental sustainability, some companies adopt internationally recognised,
industry-certified environmental management systems (EMS) such as ISO 14001 (Büyüközkan
and Ifi, 2012; Lee, 2009; Singh et al., 2014, 2015). Others use technologies and pursue a green
business strategy to minimise harm to the environment (Leonidou et al., 2017). By engaging in
environmental sustainability, businesses can generate cost savings and meet the demands of
stakeholders who want better environmental performance (Lucato, Costa and de Oliveira Neto,
2017). As a result of providing environmental sustainability, companies will obtain a competitive
advantage leading to improved operational performance (Lewis, Cassells and Roxas, 2015).
43
However, a highly formalised environmental management system might not suit the informal
management systems of the SME (Klewitz and Hansen, 2014). Indeed, many SMEs cannot afford
the consultancy costs, auditing and training involved in environmental management programmes
(Chan, 2011; Rao et al., 2009; Purba Rao et al., 2006). For instance, an empirical study conducted
by Jeppesen et al. (2012), that surveyed a sample of SMEs in South Africa and Vietnam,
highlighted this phenomenon by providing evidence that only a minor percentage of their sample
implemented formal environmental certification such as ISO 14001. The authors found that SMEs
are likely to use other appropriate tools or different approaches to measuring and better managing
their environmental performance.
The measurement of environmental performance depends on how well a corporation manages the
environmental aspects of its activities, products, and services. Businesses traditionally view water,
energy and waste as minor factors in their organisation's cost equation (Bi et al., 2015). However,
changes are now taking place. In this regard, Cohen et al. (2014) state that the costs of water, raw
materials and energy are forming an increasingly important part of the cost calculations for modern
corporations. Gudmundsson et al. (2016) claim that creating waste residuals can have negative
environmental and economic consequences. Consequently, improvements in environmental
performance have been implemented that not only reduce pollution, water waste, solid waste and
the use of hazardous materials but that also support the reuse of materials and this positively affects
cost reductions (Lozano, 2015; Saeed et al., 2018). It can be argued that measuring environmental
performance is crucial in enabling SMEs to indirectly improve their financial performance.
For this reason, waste minimisation and cost reduction should be the fundamental principles and
driving forces for any business activity. SMEs should keep and maintain their waste levels as low

44
as possible while increasing the benefits of significant resources (energy, waters, and materials)
(Singh et al., 2016). The measures considered for the environmental aspect of sustainability are
material, energy, water consumption and waste (Krajnc and Glavic, 2003), as illustrated in Figure
2.3.
Figure 2.3 Key aspects of environmental performance
(Source: author's drawing)
2.3.2.1 Material usage related measures
It is indisputably the case that achieving sustainable resource use, and ensuring that flows of
materials are managed efficiently, is becoming crucial (OECD, 2008). From the standpoint of
SMEs owner/managers and other stakeholders interested in the company’s financial state, material
consumption relates directly to overall operational costs (Schwarz et al., 2002; Krajnc and Glavic,
2003). Recycling helps reduce costs through the more efficient use of materials and other
consumables (Montabon et al., 2007). Using ready-to-use raw materials is another option for
reducing waste and freshwater usage in the production process (Wattanapinyo and Mol, 2013).
Tracking material consumption can facilitate the monitoring of material efficiency and the cost of
material flows (Global Reporting Initiative, 2015). Therefore, material consumption, virgin
45
material consumption, recycled material consumption, and reused materials are often seen as
subcategories of material consumption measures.
2.3.2.2 Energy consumption related measures
The increase in primary energy consumption and greenhouse gas emissions from fossil fuels has
drawn public policymakers' attention to industrial energy efficiency (Global Reporting Initiative,
2015). Energy consumption directly (or indirectly) impacts the environment (Mansi, 2015).
Therefore, implementing cost-effective energy efficiency measures has become fundamentally
important for the competitiveness of companies (International Energy Agency, 2017). Energy
consumption directly affects operational costs and can increase exposure to fluctuations in energy
supply and prices (Global Reporting Initiative, 2015). For some organisations, electricity is the
only significant energy that they use, while others may use energy sources such as fuel and coal.
Identifying and thoroughly evaluating the energy inefficiencies associated with the entire operation
may be difficult for SMEs as they sometimes lack the necessary skills (Trianni and Cagno, 2012).
Ergo, with regard to the SME, the measures suggested can be more effective in calculating ratios
of energy cost, energy consumption and renewable energy (Rao et al., 2006; Tan et al., 2015;
Singh et al., 2016).
2.3.2.3 Water consumption related measures
Unsurprisingly, water consumption is now included in a large number of both international and
national environmental indicator sets (OECD, 2008). In regions where water sources are highly
restricted, the patterns of water consumption within an organisation can also influence other
stakeholder pressure (Global Reporting Initiative, 2015). When used widely as a measure, water
consumption can reflect the efficiency of the operation (Krajnc and Glavic, 2003). From a macro
46
perspective, it is believed that reducing water consumption over time, through reusing and
recycling, is likely to contribute to local, national or regional goals for managing water supplies
(Global Reporting Initiative, 2015).
2.3.2.4 Waste-related measures
Companies can achieve sustainability through waste elimination, which reduces extraction from
nature, eliminates waste, improves economic efficiency and makes more resources available to all
(Krajnc and Glavic, 2003). While some SMEs hold the view that sustainable green practices are
costly in terms of conducting business (Yacob, Wong and Khor, 2019), other SMEs consider that
the reduction of waste contributes directly to their goal of cost reduction (Dey et al., 2019; Yadav
et al., 2018). It is also argued that reduction in waste can contribute to the SMEs customer
satisfaction, better public relations and competitive advantage (Gadenne, Kennedy and McKeiver,
2009). Therefore, waste-related measures can be important for SMEs. Previous studies identify
specific waste measures, including total waste, recycling of waste, hazardous waste, and waste
disposal (Mengistu and Panizzolo, 2021; Neri et al., 2021; Singh, Olugu and Fallahpour, 2014).
The following section presents social performance of the TBL.
2.3.3 Social Performance
Social sustainability refers to how organisations provide equitable opportunities, encourage
diversity, promote connectedness within and outside the community, ensure quality of life and
provide democratic processes and accountable governance (Elkington, 1997; Pullman et al., 2009;
Gimenez et al., 2012). It should be noted that social sustainability is the least well defined and
most complex aspect of the TBL pillars (Anisul Huq et al., 2014; Carter and Rogers, 2008;
Lawrence et al., 2006; Sarkis et al., 2010; Slaper and Hall, 2011). The reason for this is that this
47
pillar encompasses a multitude of social interactions, behavioural patterns and values that vary
between people (Roberts and Tribe, 2008; Cronin, 2017). These interactions take place in both
internal and external communities (Pullman et al., 2009). The complexity is driven by the levels
of variability within these interactions (Wiengarten et al., 2017).
A general agreement exists that businesses have social responsibilities; to give example, they have
a responsibility not to detract from the well-being of others. In other words, they need to care
about the well-being of their employees and that of their embedded communities (Pullman et al.,
2009). Hence, in a business context, social sustainability implies that companies should take on
broader responsibilities towards community stakeholders in order to meet their needs and improve
their level of commitment (Baumgartner and Ebner, 2010; Roxas and Chadee, 2012). However,
due to a lack of resources and time constraints, SMEs often lack a commitment to social
compliance (Larrán Jorge et al., 2015). They view social performance as a cost-intensive burden
(Dey et al., 2019) that reduces their profitability objectives (Nawi et al., 2020). For instance, Hsu
and Cheng (2012) have found that the cost of social compliance is perceived as a hindrance to
implementing CSR in some Taiwanese SMEs.
Nevertheless, existing research on SMEs has reported that they often unknowingly adopt social
responsibility or pursue a silent version of CSR. These SMEs have a strong relationship with key
stakeholders who are willing to forgo some of their profits to serve a greater goal (Azmat, 2010;
Jenkins, 2006). For example, Choongo (2017) has identified that, over time, a a positive
relationship developed between social responsibility engagement and employee commitment
within Zambian SMEs. The level of social performance engagement thus depends upon decisions

48
made by senior managers within the SME (Agle and Mitchell, 2016) based upon their
understanding of cost-benefits (Larrán Jorge et al., 2015).
According to Azapagic and Perdan (2000), social sustainability comprises three aspects: 1) social
welfare, particularly education and providing a healthy and safe working and living setting; 2)
equal opportunities for the community (non-discrimination); and 3) ethical concerns through the
observance of human rights (non-exploitation of young or immigrant workers). Such a
classification is considered broad and may not accurately capture a company’s social impact
(Azapagic, 2003). However, this categorisation provides a better understanding of the key
constructs of social sustainability performance.
The difficulty of quantifying social performance, compared to economic and environmental
performance, highlights it as the most neglected pillar of the TBL (Elkington, 1997; Norman and
Macdonald, 2004). Social impacts appear difficult to assess quantitatively because they are often
expressed in qualitative terms (Adisa Azapagic, 2004; Veleva and Ellenbecker, 2001). Supporting
this view, Azapagic and Perdan (2000) contend that multiple social domain variables, such as
protecting cultural values or equity, are scarcely quantifiable and cannot be defined.
A critical question raised by Slaper and Hall (2011) is that if economic aspects can be measured
in monetary units, then social and environmental impacts can be measured in the same way.
Therefore, identifying standard criteria to measure sustainability performance in a meaningful,
consistent and comparable way among the three pillars of the TBL is relevant but remains
challenging.
49
Social performance can be measured by evaluating the impact that the organisation's decisions and
activities have upon the society in which the organisation operates; the organisation should ideally
contribute towards sustainable development by upholding the health and welfare of the
community, meeting stakeholders’ expectations, complying with applicable laws and striving for
integration throughout the organisation (Global Reporting Initiative, 2015). As stated previously,
although social performance involves several complex issues, the previous studies undertaken on
the SMEs social sustainability measurements have been conducted in a more focused way,
especially in terms of priorities. Earlier studies undertaken (e.g. Singh et al., 2014; Tan et al.,
2015), that centred upon the SMEs social performance, encompassed an holistic focus on the
employee, customer and community well-being. However, these studies might have different
priorities when developing social metrics for SMEs; Singh et al. (2014) have focused primarily on
the SMEs main characteristics to develop social indicators for companies, while Tan et al. (2015)
have focused on the main concerns in the domestic context of Singapore-based SMEs. These
studies demonstrate that both internal and external environments must be considered when
developing sustainability performance measurements for SMEs.
Drawing upon the existing literature, social performance measures will include three main aspects:
employee well-being, customer well-being and community well-being, as illustrated in Figure 2.4.

50
Figure 2.4: Key aspects of social performance
(Source: author's drawing)
2.3.3.1 Employee well-being related measures
Employee well-being concerns the company's attitude towards the treatment of employees. Due to
limited resources, SMEs often exhibit less devotion to human resource management (Jafari-
Sadeghi et al., 2020; Koirala, 2019; Sardi et al., 2020). To give example of this, Ates and Bititci
(2011) point out that SMEs focus mainly on the hard aspects (operational) and less on managing
the soft aspects (organisational and people). It is important to note that a better understanding of
employee well-being is crucial for SMEs (Lee, Herold and Yu, 2016) because it could help them
increase the efficient allocation of resources and capabilities (Lee, Rocco and Shuck, 2020).
It is maintained that employee well-being and empowerment are important in order to engage
employees (Anitha, 2014; Eldor and Vigoda-Gadot, 2017). In their recent study, Govender and
Bussin (2020) have provided empirical evidence of this, suggesting that if employees are not
empowered to raise questions, it will cause them to be demotivated, which will then in turn lead
to a lack of improvement not only within themselves, but also to the organisation within which
they are employed. As such, employee empowerment through coaching, mentoring and
recognition are crucial (Govender and Bussin, 2020). As further suggested by Kwahk, Yang and
Ahn (2020), power sharing, participative decision-making, conflict/risk tolerance, cross-functional
51
communication, support/collaboration and learning/development culture are all crucial elements
needed in order to engage employees in implementing a new business project and to gain business
sustainability. It is believed that the presence of higher levels of employee engagement means
better productivity, financial returns and sales (Young et al., 2018) and that it will significantly
reduce turnover intentions (Reio and Ghosh, 2009). For these purposes, it means that
owners/managers of SMEs have to be more open and accepting of these changes in order to better
engage their employees.
Employee well-being refers to issues such as employees' overall health and safety, professional
development and employee satisfaction (Murray, 2010). Within the SME, employee satisfaction
and commitment is often considered a priority (Kadiresan et al., 2016). At an organisational level,
employee satisfaction is indicative of the overall organisational climate (Wesarat, Sharif and Abdul
Majid, 2017) that reflects the level of social sustainability of a business in relation to its employees.
Progress can be measured in many ways, such as working conditions and fair salary (Mengistu
and Panizzolo, 2021). Studies have shown that an improvement in employee satisfaction leads to
a higher level of the employees’ job commitment and work ethic; this can be achieved by the
organisation properly valuing their employees’ contributions as well as supporting their needs
(Chavez et al., 2020; O’Driscoll and Randall, 1999).
It is the owners/managers of the business, who have the strongest role in determining appropriate
ways implement these measures within the whole organisation. It should be noted that whichever
method is used, it needs to match the organisational context and unique culture (Raziq and
Wiesner, 2016) in order that core competencies, strengths and employee relations can be used as
52
a foundation upon which the employees will prosper from strength to strength (Simpson, Padmore
and Newman, 2012).
Employee turnover measures the number of employees who leave the organisation for reasons
such as dismissal, retirement or death in service. This metric is important because it indicates
uncertainty and dissatisfaction among employees or signals a fundamental change in the
organisation's core operational structure, which could help senior management realise that they
need to foster better employee-wellbeing and ensure that more effective decisions are made.
Although it is a surrogate measure and may not always reflect actual conditions due to other
mitigating factors, it is an objective metric for measuring working conditions (Sarkis and Dhavale,
2015).
Employee job satisfaction is a strong indicator of how a company manages the satisfaction and
retention of their human capital, which is often measured by the percentage of employees who are
satisfied with their jobs (Global Reporting Initiative, 2015). On this basis, this metric is crucial
because it demonstrates an employees’ dissatisfaction or satisfaction with their work (Cumberland
et al., 2018). Extant literature reveals several positive consequences of employee job satisfaction.
For example, Fairlie (2011) has found meaningful work characteristics have a positive correlation
with job satisfaction and work engagement organisational commitment. Other research also
highlights that a high level of job satisfaction leads to better productivity and better company
performance (Delai and Takahashi, 2011) while resulting in a lower level of absenteeism and
turnover (Salanova, Agut and Peiró, 2005; Schaufeli, Bakker and Salanova, 2006). As such, job
satisfaction contributes to long-term corporate sustainability (Boley and Uysal, 2013; Global
Reporting Initiative, 2015). As Schaufeli (2013) claim, job satisfaction can be deemed as
53
employees who are willing to go beyond what is in their job description with regard to their
business engagements.
To achieve a high level of employee job satisfaction, owners/managers have to reward the
employees’ serving behaviour, behave ethically and help subordinates grow and succeed (Brohi et
al., 2018); this can be achieved through the managers’ leadership styles that should have a strong
influence on employee satisfaction (Cumberland et al., 2018; Franco and Matos, 2015).
It is observed that although SMEs have been gradually engaging with sustainability initiatives
(Alkhoraif, Rashid and McLaughlin, 2019; Ngaochay and Walsh, 2017) there is still a general
reluctance to push forward (Bai, Yuan and Pan, 2017). Possible explanations are that there could
be insufficient financial resources, or that SMEs cannot afford the level of formal education and
training required for employees (Mahmood et al., 2019; Piyathanavong et al., 2019; Siegel et al.,
2019). Urban and Naidoo (2012) contend that a low level of education and training is a prominent
reason for poor business efficiencies among SMEs. This explains why the employee training and
development is a critical contribution to motivating improvement at both personal and
organisational levels (Global Reporting Initiative, 2015). Employee training and development can
be measured by the average hours of training per employee (Tan et al., 2015).
Employee health and safety are also critical in the context of a businesses duty of care and are
regulated by law (Murray, 2010). This metric reflects whether health and safety management
practices result in fewer occupational health and safety incidents (Delai and Takahashi, 2011).
Low injury and absentee rates are generally linked to positive staff morale and productivity (Global
Reporting Initiative, 2015). Health and safety can also be assessed by looking at and measuring
the average of missed workdays due to accidents per employee. Given the importance of employee

54
training and development and employee health and safety, these two aspects are critical social cost
aspects for SMEs (Laurinkeviciute and Stasiskiene, 2011).
2.3.3.2 Customer-wellbeing related measures
In general, SMEs are characterised as operating in limited markets and relying on a few main
customers with whom they conduct their business (Herr and Nettekoven, 2018; Parker, Redmond
and Simpson, 2009). It is recognised that, as suppliers, SMEs often rely on customer knowledge
and appreciation to gain a market advantage over their less knowledgeable competitors (de Moura
and Saroli, 2020). Measurements of customer well-being have, therefore, become crucial. Such
measures can also provide insights into how well a firm is delivering core products and services
in a manner that considers the needs of the customer (Delai and Takahashi, 2011). These measures
could help SMEs reduce costs and improve the quality of their product and services to their
customers (Dey et al., 2019).
Most scholarly works have placed great emphasis on customer well-being being a dominant factor
in the existence of an organisation (Dissanayake and Divakara, 2019; Joung et al., 2013; Tan et
al., 2015). Customer well-being is also a crucial measurement outcome for corporate sustainability
(Suriyankietkaew, 2016).
A consensus exists that a better understanding of customer satisfaction leads to a better approach
with reference to the enhancement and strengthening of relationships with customers (Shashi et
al., 2018). Customer well-being is usually assessed by indicators such as measuring the ratio of
customers that are satisfied against the total number of customers (Tan et al., 2015) and also by
measuring the number of complaints compared to the total number of customers (Delai and
Takahashi, 2011).
55
2.3.3.3 Community-wellbeing related measures
Community well-being refers to how companies contribute to improvements in society (Gallo and
Christensen, 2011; Olaru et al., 2010). It is believed that those companies that are interested in
improving their operations should also find suitable opportunities to support the general good of
the community (Arend, 2014; Olaru et al., 2010). Such a viewpoint is relevant to SMEs, which
often operate in limited markets (Johnson, 2015). They usually have a better awareness of local
issues than their larger counterparts (Fakhrudtdinov, 2012) and strive to improve communities and
their locality (Lopez-Perez, Melero and Javier Sese, 2017). The local community's involvement
could reinforce the SMEs organisational culture and form a routine part of their identity (Svensson
and Wagner, 2015).
Murray (2010) has posited that community well-being measures could enhance a healthy
relationship between businesses and the community through corporate philanthropy, community
involvement or charitable donations.
The following section reviews main theories that underpin the SPMS adoption.
2.4 Main Theories that Underpin the adoption of SPMS adoption
According to Shibin et al. (2018), good research is grounded in relevant theories. There are a
multitude of theories which are relevant to the current study, such as institutional theory, resource-
based view, natural resource-based view, contingency theory, organisational theory,
contractual/agency theory, evolutionary theory, transaction cost, resource dependence theory,
stakeholder theory, strategic choice theory and social network theory (Gianni, Gotzamani and
Tsiotras, 2017; Küçükbay and Sürücü, 2019; Lozano, 2015; Montiel and Delgado-Ceballos, 2014;
Parisi, 2013a; Searcy, 2011; Yu and Ramanathan, 2016). However, the present study focused on
56
institutional, stakeholder and contingency theories. This choice is motivated by three main reasons.
First, stakeholder theory can illuminate the dynamics between stakeholders and the roles they play
in SPMS adoption (Arena, Azzone and Bengo, 2015; Saeed et al., 2018). Second, contingency
theory was employed to explore the influence of contingency factors on SPMS adoption (Searcy,
2011). Third, institutional theory was applied to further investigate how institutional factors and
pressures influence the propagation of SPMS adoption in the context of Vietnamese SMEs (Tran,
Deng and Ong, 2019). These three theories are found to be useful for understanding sustainability
performance measurement in Vietnamese SMEs, offering differing perspectives of the
phenomenon.
In this section, the three critical theories are discussed by presenting the core content and influences
that each brings to sustainability performance measurement. Following this, these views are
combined to clarify the phenomena.
2.4.1 Stakeholder Theory
As previously mentioned, company stakeholders are placing increasing pressure on SMEs, to
improve their sustainability performance. Scholars have argued that researchers should use the
lens of stakeholder theory to investigate sustainability issues through the motivations of businesses
(Wiesner, Chadee and Best, 2017; Zhang et al., 2019). There is also pressure from the stakeholders
for business sustainability issues to be closely examined (Elkington, 1997; Cordano, Marshall, and
Silverman, 2010; Shevchenko, Lévesque, and Pagell, 2016; Wiengarten et al., 2017). Drawing on
these arguments, this section of the current study highlights the businesses motivation to adopt
SPMS as a response to the needs, concerns (Siew, 2015), requirements, expectations and
57
preferences of relevant stakeholders (Yu and Ramanathan, 2015) through the review of the
literature relating to this theory.
For many years, companies believed they only needed to focus on producing goods and delivering
services as efficiently as possible (Jamali, 2006). Companies strove to concentrate on optimising
key factors, such as cost, price, quality and flexibility, to achieve positive economic performance
or financial bottom line (Norman and Macdonald, 2004; Atu, 2013; Govindan, Khodaverdi, and
Jafarian, 2013). The critical business goal was to pursue profit maximisation, and socially
responsible activities were not their priority, but fell within the remit of governments (van
Marrewijk, 2003). Such views seem to be consistent with the main ideas of shareholder theory,
proposed by Friedman (1970), who opines that businesses do not have any moral obligations or
social responsibilities other than to maximise their profits. From this school of thought,
corporations are mainly built around shareholder benefits, and shareholder return is primarily used
to measure overall business performance (Hubbard, 2009; van Marrewijk, 2003).
In contrast to the above viewpoint, stakeholder theory, initially developed by Freeman (1984),
implies that businesses do have social responsibilities in as much as they should not detract from
the well-being of others, and perhaps may even be obligated to charitably promote the well-being
of others (Freeman, 1984). Creating value for stakeholders by creating economic success through
voluntary corporate environmental or social activities is inspired by stakeholder theory and
sustainability management. Sustainability management requires creating value for the firm or its
shareholders and other stakeholders (Hörisch, Freeman and Schaltegger, 2014). In this light,
sustainability-based value creation for stakeholders directly relates to stakeholder theory, which

58
argues that creating value for stakeholders and linking these benefits to different stakeholders is of
central importance (Freeman et al., 2010; Bellantuono, Pontrandolfo, and Scozzi, 2016).
It has been recognised that internal forces for change toward corporate sustainability are facilitated
by internal stakeholders' ethical goals (shareholders, managers and employees) associated with
production, processes, or supply and by the goal of maximising financial savings through waste
management and improved energy efficiency (Hörisch, Freeman, and Schaltegger, 2014). External
forces for change in corporate sustainability are a response to the concerns of stakeholders:
regulators, customers, supply chain partners, the public, media and community groups, all of
whom call for greater corporate accountability towards the natural environment and society as a
whole (Markley and Davis, 2007; Singh, Olugu, and Musa, 2016; Mabhungu and Van Der Poll,
2017). The two primary sources of change mentioned here might also explain why stakeholders
are often divided into two groups: internal and external (Hörisch, Freeman and Schaltegger, 2014;
De La Torre and Agabriel, 2017; Lozano, 2015).
Given the above clarification, it is crucial to recognise that stakeholders are diverse and varied
(Harding, 2006; Jamali and Mirshak, 2007), they may have different expectations (Polonsky,
1995) and their interests may be conflicting (Adams and Frost, 2008; Dobers and Halme, 2009).
Under this circumstance, businesses are faced with varied stakeholder demands, continually
shifting priorities (Searcy, 2012), and a multitude of alternatives to address their sustainability
challenges (Sarkis, Gonzalez-Torre, and Adenso-Diaz, 2010; Clifton and Amran, 2011; Searcy,
2012; Seuring, 2013; Anisul Huq, Stevenson, and Zorzini, 2014).
In a wider sense, the term ‘stakeholder’ is defined as "any group or individual who can affect or is
affected by the achievement of the organisation's objectives" (Freeman, 1984, p. 46). However, in

59
a narrower perspective, Garvare and Johansson (2010) propose a definition of stakeholders as
being actors that provide essential means of support required by a firm and are able to withdraw
their consent if their wants or expectations are not being met, causing the firm to fail or inflicting
unacceptable levels of damage. The implication is that stakeholders can be divided into those who
support and those who do not, which helps to manage stakeholder-oriented relationships (Garvare
and Johansson, 2010). As further noted by Garvare and Johansson (2010), this framework can also
be used to explain organisational behaviours and sustainability. Stubblefield Loucks, Martens and
Cho (2010) share a similar viewpoint and extend that the ultimate objective of an organisation is
to achieve the ability to maintain equilibrium among the conflicting demands and needs of its
stakeholders.
Although stakeholder theory has been broadly received, and has increasing relevance in business
and academia, the theory has also attracted some criticism. Interestingly, nearly two decades after
the theory was initially developed, Freeman has collaborated with other scholars to refine and
defend the theory because they have asserted that the theory seems to be used as an excuse for
management opportunism (Phillips, Freeman and Wicks, 2003).
Sundaram and Inkpen (2004) revisited the theory and posited that stakeholder theory makes the
corporate governance more complicated and strongly hinders entrepreneurial risk taking.
Looking at this from a different viewpoint, Kaler (2006) has pointed out a limitation of the theory
by identifying conflicting interests between stakeholders. Given the criticism mentioned here, it is
undeniable that the theory provides a more informed understanding of the phenomenon being
investigated, especially when one needs to capture a range of different perspectives (Imbrogiano,
60
2020). Also, it is within a micro-framework, which can help identify relevant stakeholders who
are interested in firm sustainability activities (Cormier, Gordon and Magnan, 2004).
In line with the above discussion, Lozano (2005) emphasises that defining a relevant stakeholder
does not mean limiting an actor, but the interpretation and understanding of this relationship is
more important. This means that businesses should change their approach to links with the relevant
stakeholders, moving from managing relationships to building relationships.
Such a relationship, according to Lozano (2005), should be approached as an opportunity to learn
about interests and conflicts in order to gain a deeper understanding of one's place within the
relationship. By adopting such a proactive approach, businesses are able to respond to the needs,
concerns, requirements, expectations and preferences of their relevant stakeholders far more
effectively, rather than focusing on a wider range of stakeholders. As already mentioned,
stakeholders are not equally relevant; thus, it is necessary to prioritise them. To do so, businesses
can distinguish stakeholders as follows: primary (e.g, customers, suppliers and regulators) and
secondary (e.g, the media, non-governmental organisations). The former are more essential for the
survival of a company than the latter (Gualandris and Kalchschmidt, 2014; Rebs et al., 2018).
Businesses might also characterise stakeholders according to their importance, or salience, relying
on three drivers, namely: urgency, power and legitimacy (Agle and Mitchell, 2016; Bellantuono,
Pontrandolfo and Scozzi, 2016; Mitchell, Wood and Agle, 1997).
Although it is sometimes assumed that stakeholder theory is only associated with large
corporations, and SMEs are favoured by shareholder theory (Jenkins, 2006; Russo and Perrini,
2010), Azmat (2010) argued that corporations of all sizes hold their stakeholder interests as a high
priority. Previous studies on SMEs sustainability issues, grounded in stakeholder theory, can be

61
found in the literature. For instance, Nejati, Amran, and Hazlina Ahmad (2014) have used the lens
of stakeholder perspective to explain why, among the primary stakeholders, only employees and
customers significantly influenced the SMEs environmental performance. In addition,
Hoogendoorn, Guerra, and van der Zwan (2015) have employed stakeholder theory as a
meaningful perspective to explore what drives SMEs to engage in environmental practices.
Massa, Farneti, and Scappini (2015) have found that managers (internal stakeholders) play a vital
role in developing sustainability reports within SMEs. The evidence mentioned here indicates that
SMEs are now accountable to shareholders and other stakeholders (Heng et al., 2012). Such a shift
from maximising shareholder profits to maximising stakeholder value implies very different goals
with a broader set of beneficiaries (Padin et al., 2016).
Scholars have employed the stakeholder theory as an instrumental lens to investigate different
aspects of sustainability engagement. For example, Searcy (2009) has observed that many
companies have developed sustainability performance measurement systems so that progress
towards their sustainability goals, objectives and targets can be measured. The author suggested
that a primary task at the beginning stage is to focus on relevant stakeholders, communicate with
them, and work with them to gain a comprehensive understanding of their claims and requirements
(Searcy, 2009), while Jamali (2006) has proposed a framework that links corporate sustainability
and organisational learning and employed the lens of stakeholder theory to explore how this link
would be facilitated.
Jamali (2006) has highlighted the importance of maintaining close and regular interactions with
relevant stakeholders by creating a forum for learning and by building interactive teams to foster
an effective learning environment. The author emphasised that in a continuous learning process
62
and interaction, stakeholders could identify common problems and explore higher-order solutions.
This proposal not only helps organisations move in a desirable direction, it also helps to ensure
that they react in a way that satisfies all concerned stakeholders (Jamali, 2006).
Generally, it is agreed that stakeholder theory is still an option, but this is being challenged by
alternative concepts (Mitchell, Wood, and Agle, 1997; Lozano, 2005; Clifton and Amran, 2011).
Stakeholder theory has mainly investigated fundamental questions such as "who (or what) are the
stakeholders of the firm?” “to whom (or what) do managers pay attention?" (Mitchell, Wood, and
Agle, 1997, p.853), and "who benefits?" (Stubblefield Loucks, Martens and Cho, 2010, p.180).
Considering the development of stakeholder theory in comparison with the original concept
proposed by Freeman (1984), the theory could now accommodate the exploration of stakeholders'
attitudes, interactions and motivations to engage in sustainability. This reflects why stakeholder
theory is a crucial organisational theory which underpins corporate sustainability research (Fraser
et al., 2006; Hubbard, 2009; Freeman et al., 2010; Hörisch, Freeman and Schaltegger, 2014;
Montiel and Delgado-Ceballos, 2014; Bellantuono, Pontrandolfo, and Scozzi, 2016; Küçükbay
and Sürücü, 2019).
Considering the above discussion, stakeholder theory is employed in this current study to explore
the motivation driving SMEs to adopt SPMS (sustainability performance measurement system).
The motivation usually stems from the relationships with relevant stakeholders. It should be noted
that CSR is a contextual and culture specific concept (Ahmad et al., 2021), influenced by context-
specific organisational actions (Aguinis and Glavas, 2012) and as such, the adoption of SPMS in
the SME setting cannot be understood by employing only the lens of stakeholder theory.
Accordingly, the next section discusses contingency theory.
63
2.4.2 Contingency Theory
This section presents the definitions and development of the concept and approach known as
contingency theory. The core principle of this theory is that no universally appropriate framework
applies equally to all organisations and all contextual conditions (Cardoni et al., 2020; Medne and
Lapina, 2019). Instead, contingency theory primarily depends upon many specific organisational
and contextual factors (Wadongo and Abdel-Kader, 2014; Williams, Ashill, and Naumann, 2017).
Considering performance measurement, the theory implies that there is no standard performance
measurement suitable for all organisations and all circumstances; meaning that performance
measurement is primarily dependent on contextual organisational factors (Cardoni et al., 2020;
Heng et al., 2012).
It is recognised that contingency theory has become the primary theoretical lens for many studies
on performance measurement. Indeed, there is a constantly growing literature of theoretical and
empirical works that employ contingency theory to characterise the contingencies affecting
choices of measures and controls as broad dichotomies (Garengo and Bititci, 2007; Searcy, 2011;
Parisi, 2013; Wadongo and Abdel-Kader, 2014; Cardoni et al., 2018).
For instance, in Franco and Bourne's (2003) research, through a framework with a focus on
organisational context, the authors found nine functional factors that had a significant impact on
the way organisations manage through measures: (i) organisational culture (ii) management
leadership and commitment (iii) compensation linked to the strategic performance measurement
system (iv) education and understanding (v) communication and reporting (vi) review and
updating of the system (vii) data processing and information technology support (viii) business
and industry and (ix) the performance measurement system framework. Their findings indicate
64
that designing performance measures depends on functional factors that require an organisation to
put adequate mechanisms in place to increase the system's success (Franco and Bourne, 2003).
In the context of SMEs, a study by Garengo and Bititci (2007) operationalised the lens of
contingency theory and developed a research framework. Four potential contingent factors were
confirmed that would likely influence the adoption and use of performance measurement: (i)
corporate governance structure (ii) management information systems (iii) the business model and
(iv) organisational culture and managerial style. This framework provides knowledge helpful to
SMEs as they define a methodology and managerial tool for measuring performance. The authors
admitted that, in their proposed framework, these four contingency factors should be addressed in
a concurrent manner to make them more integrated, rather than studied independently (Garengo
and Bititci, 2007). Given this, their findings provide a helpful guide for SMEs and suggest that
organisational changes need to be well prepared for; a favourable context should be in place before
introducing performance measurement (Garengo and Bititci, 2007).
A contingent approach also needs to take into consideration the importance of aligning the search
for performance metrics and business strategy. Prior studies have demonstrated a strong linkage
between strategic alignment and performance measurement (Simpson, Padmore, and Newman,
2012; Klovienė and Speziale, 2015). The existing literature in sustainability suggests that
businesses need to align their performance measurement systems with their strategic goals to
promote sustainability performance measurement (Nigri and Baldo, 2018); in other words, to
obtain an effective adoption of SPMS, companies need to match their structure and processes to
the environment in which they operate (Yu, Ramanathan and Nath, 2017, p.161).
65
As argued by Garengo, Biazzo, and Bititci (2005), such a linkage is crucial for SMEs because
these companies commonly lack formalised strategies. Implementing a performance measurement
system could support the formalisation of a business strategy. Hudson, Smart, and Bourne (2001)
supported this view by emphasising that a structured approach to performance measurement is
needed to help SMEs improve their strategic control. Nigri (2018) further maintained there is still
a need to integrate sustainability indicators and strategic performance measurement systems.
McAdam, Miller, and McSorley (2019) employ a contingency theory perspective with which they
attempted to shape strategic alignment between the SMEs performance measurement and their
environments. The authors proposed an integrated framework that considers flexibility in
performance measurement systems when businesses such as fast-growing SMEs face dynamic
shifts from mechanical to more organic structures in increasingly complex business environments.
The results indicated that the shaping process occurred in ways unique to each SME and their
respective environment rather than in an overarching best practice manner (McAdam, Miller, and
McSorley, 2019). This approach seems to be somewhat neglected in the literature (Yu,
Ramanathan and Nath, 2017), making the case for further exploration to develop a contingency
approach in the SME sustainability performance measurement adoption literature.
Another proposal for studying the moderating effect of sustainability performance is found in a
recent study by Cardoni et al. (2020). The authors considered how businesses managed knowledge
and the contingency theory of performance measurement systems. They tested the impact of two
alternative knowledge management approaches (exploitation and exploration) upon SMEs
economic sustainability. The findings indicate that a specific knowledge management approach
supports SMEs economic sustainability performance.

66
Some researchers have integrated the research on absorptive capacity and organisational learning
to determine the role of organisational learning in successfully implementing new sustainability
initiatives. For example, Goddard et al. (2016) proposed that absorptive capacity focuses on how
SMEs sustainability knowledge is interpreted, used and implemented in organisational processes.
Organisation learning drives and facilitates this process, increasing the capacity for implementing
new sustainability standards. It should be noted here that in previous studies (Wadongo and Abdel-
Kader, 2014; Sodhi and Tang, 2018; Abbas et al., 2019), organisational learning capacity has been
considered to be a contingency factor that influences the measurement and management of
organisational performance.
In a recent study, Imbrogiano (2020) has revisited contingency theory with a strong focus on
factors that enable sustainability performance in businesses. The author emphasised the need to
understand different internal determinants occurring in businesses related to sustainability
performance. The internal determinants considered were how stakeholders, especially key actors,
understood sustainability performance in companies and under what conditions of the
organisational environment the companies adopted appropriate sustainability performance
measures (Imbrogiano, 2020). Furthermore, considering issues related to research methodology
employed during the study of sustainability performance in businesses, the author suggests that
whenever possible, using a mixed method is a better choice than concentrating on a single method.
A mixed-method approach in which quantitative and qualitative methods are combined to utilise
the strengths and mitigate the limitations of each would be better for studying the contingency
factors associated with sustainability performance in businesses (Imbrogiano, 2020). The mixed-
method approach should push the field forward toward a better understanding of sustainability
performance (Imbrogiano, 2020).
67
Contingency theory has been further developed with the aim of understanding the aspects of
organisations’ internal and external environments that have influence on the adoption of
sustainability initiatives. Some researchers have focused on exploring one aspect of these
contextual factors while others have taken a more holistic approach; categorising contextual
factors, determining how different types are linked together, and proposing new types. In addition,
existing literature reveals that organisational context can be divided into internal and external
contextual categories (Lopes de Sousa Jabbour, Ndubisi, and Roman Pais Seles, 2020). This
categorisation provides a convenient way to organise contextual factors (Gualandris, Golini, and
Kalchschmidt, 2014). The discussion thus implies by far that contingency theory has become a
critical theoretical lens for studying a wide range of contextual organisational factors (Fallis,
2013). These factors can either enable or constrain the adoption of performance measures within
an organisation (Garengo and Bititci, 2007).
Although contingency theory provides researchers with advantages when exploring factors
influencing performance measurement, the approach also has some limitations; first, Olarewaju
and George (2014) contend that dealing with a wide range of factors can be very challenging for
managers who are always short of time and have to consider many factors before making a decision
using contingency theory. In addition, Salzmann, Ionescu-Somers and Steger (2005) have stated
that situational and organisational aspects are difficult to separate. Secondly, contingency theory
is commonly viewed as lacking theoretical clarity and failing to specify the forms of interaction
among the variables (Husted, 2000). Thirdly and finally, if the research model is not rigorously
specified, measurement error might lead to conflicting findings (Ferreira and Otley, 2009). Husted
(2000) wrote the more that hidden assumptions of contingency theories are made explicit, the more
amenable to statistical testing it is.

68
Considering all the above discussion, the contingency theory is employed as the central theoretical
lens in this study, considering the previous warnings and learnings of earlier researchers’
experience. Using the contingency theory, this current study can specify and construct a testable
theory of sustainability performance measurement. Accordingly, this current study will take into
consideration the most appropriate characteristics of SMEs and the Vietnamese context in which
they are operating. To do so, the institutional theory as a means to understand and take into
consideration the context in which SMEs are operating is also employed.
The following section discusses the institutional theory.
2.4.3 Institutional Theory
Institutional theory was initially developed to address the influence that external institutional
factors have on implementing organisational practices. Hirsch (1975) posits that organisations
operate in a social environment encompassing several institutional elements (Scott, 2008; Gianni,
Gotzamani, and Tsiotras, 2017). The institutional framework contains formal rules and laws put
in place by the government, while the market and many informal rules, norms, beliefs, cultures
and expectations arise from various organisational interactions with the business environments
(DiMaggio and Powell, 1983; Scott, 2008). Thus, according to institutional theory, external
influences shape and drive organisational actions (DiMaggio and Powell, 1983).
Mizruchi and Fein (1999) revisit institutional theory by examining 26 articles in which researchers
operationalised the institutional perspective. The authors proposed that external institutions likely
influence an organisation's performance and outcomes (Mizruchi and Fein, 1999). A later study
by Scott (2008) reviews the development of institutional theory relating to organisations and the
author concluded that companies operating in a particular field or sharing the same environment
69
tend to implement similar practices and develop similar structures by way of responding to the
external environment through legitimate motives (Scott, 2008). The same author claimed that
companies could adopt different response strategies ranging from conformance to reshaping these
pressures, with the goal of responding to both changes in and pressures from their environment
(Scott, 2008).
For institutional theory, DiMaggio and Powell (1983) suggest three fundamental mechanisms:
coercive, mimetic and normative, through which isomorphic institutional change occurs. In this
light, the theory has been employed in prior studies on corporate sustainability and these studies
indicate that three mechanisms of isomorphism drive sustainability and business operations'
alignments (Wahga, Blundel, and Schaefer, 2017; Zhang et al., 2019).
Sridhar and Jones (2013) confirm that businesses adopt triple bottom line sustainability (TBL)
which includes three pillars: economic, social, and environmental, as their reporting framework.
The three pillars are influenced by coercive, normative, and mimetic isomorphism, respectively.
From this perspective, the institutional theory demonstrates that the notion of sustainability to be
located in the central and controlled Vietnamese system context which is advocating a socialist
market economy with considerable influence from the state (Edwards and Phan, 2013; Nguyen,
Bensemann and Kelly, 2018). From the standpoint of the institutional approach, this current study
can obtain a rich insight into the adoption of SPMS in the Vietnamese SME setting, which is
influenced by the system’s surrounding SMEs that shape their social and organisation behaviour
(Verma, Sharma and Kumar, 2017).
Theoretically, coercive isomorphism is driven by pressures from influential stakeholders such as
government authorities and customers that push the company to engage in sustainability initiatives

70
(Abdalla and Siti-Nabiha, 2015; Zhang et al., 2019), while normative isomorphism is typically
based on voluntary diffusion of norms (Escobar and Vredenburg, 2011). This form involves
pressures influencing companies to be more aware of sustainability, understand new social rules
and new thinking, and to adopt sustainability initiatives (Caldera, Desha, and Dawes, 2019). In
comparison, mimetic isomorphism occurs when companies perform in a specific manner by
imitating other businesses in the same field that have successfully addressed sustainability issues
(Abdalla and Siti-Nabiha, 2015; Escobar and Vredenburg, 2011; Peña-Vinces and Delgado-
Márquez, 2013). This review reflects the three isomorphic mechanisms of institutional theory are
helpful in capturing how businesses conform to institutional pressures from influential
stakeholders.
Prior studies have demonstrated a strong linkage between institutional factors and organisational
performance. For example, Zulu-Chisanga, Chabala and Mandawa-Bray (2020) proposed an
integrated framework that considers government support, inter-firm collaboration, and managerial
connection. The findings indicate that SMEs depend on external relationships to improve
performance and have firm-specific skills and resources available to transform external resources
into superior performance. However, this study failed to confirm a significant relationship between
government support and company performance (Zulu-Chisanga, Chabala, and Mandawa-Bray,
2020).
Existing literature reveals that researchers tend to choose institutional theory as one of the
theoretical lenses through which to conduct studies on the adoption of sustainability initiatives in
the context of developing countries (Jamali, Lund-Thomsen, and Khara, 2017; Soundararajan,
Jamali, and Spence, 2018; Tran, Deng, and Ong, 2018). For example, Tran, Deng, and Ong (2018)
71
investigated the decision of a Vietnamese firm to adopt social sustainability practices. The author
developed a framework focusing on three aspects: institutional pressures, managerial climate, and
organisational characteristics. Considering all discussions, the current study employs the lens of
the institutional theory to explore whether the institutional-level interactions can be mediated to
facilitate SPMS adoption in SMEs in the context of emerging economies like Vietnam.
In summary, the association and coordination of three theories; institutional, stakeholder and
contingency, as theoretical lenses provide a better comprehension of SPMS adoption. In this
manner, the present study provides diverse insights into the identification of appropriate
sustainability metrics in the context of Vietnamese SMEs, while simultaneously considering
factors that influence its adoption.
2.5 Concluding Remarks
This section has presented an overview of sustainability performance measurement systems, its
key characteristics and main purposes. The review has achieved an understanding about two key
elements of an SPMS, including ‘performance measurement’ and ‘a performance measure’, and
has employed the definition of a SPMS for this current study.
The overall understanding of SPMS had led to the review of the TBL concept, which has given a
better understanding of the issues and challenges of the concept. Despite the complexities resulting
from the innumerable sustainability indicators that have been increasingly proposed, the TBL
provides a holistic view, which is chosen as the main framework guiding the identification of
appropriate sustainability metrics for SMEs.

72
This chapter has discussed three key theories that guided this current study, including stakeholder,
institutional and contingency theories. These three theories have been employed as key theoretical
lenses and each has provided specific insights into the SPMS adoption as summarised as below:
• The lens of the stakeholder theory has been useful in exploring the motivation of companies
that drive SPMS adoption, and their responsiveness to the needs, concerns requirements,
expectations, and preferences of relevant stakeholders.
• The lens of contingency theory has been helpful in viewing contextual factors of
organisations that influence SPMS adoption.
• The lens of institutional theory has been useful in examining factors from the external
environment, that influence SPMS adoption
While the current literature recognises some of the links and overlaps among these three theories,
the application of the theoretical lenses, together with a more mixed-method approach, is a novel
and original theoretical approach.
The next chapter discusses SMEs and their adoption of SPMS.

73
CHAPTER 3 SMALL AND MEDIUM-SIZED ENTERPRISES (SMEs)
AND THEIR ADOPTION OF A SUSTAINABILITY PERFORMANCE
MEASUREMENT SYSTEM (SPMS)
3.1 Introduction
The primary purpose of this second chapter of the literature review is to examine factors
influencing the sustainability performance measures that are undertaken within SMEs. This
includes a discussion of the theoretical underpinnings of sustainability performance measurement.
Following this, the theoretical framework and development of hypotheses for the current study
will be presented. The chapter also proposes a protocol for identifying sustainability metrics that
can be applied within the SME. The objectives of the chapter are outlined in Table 3.1, along with
the sections that address each objective.
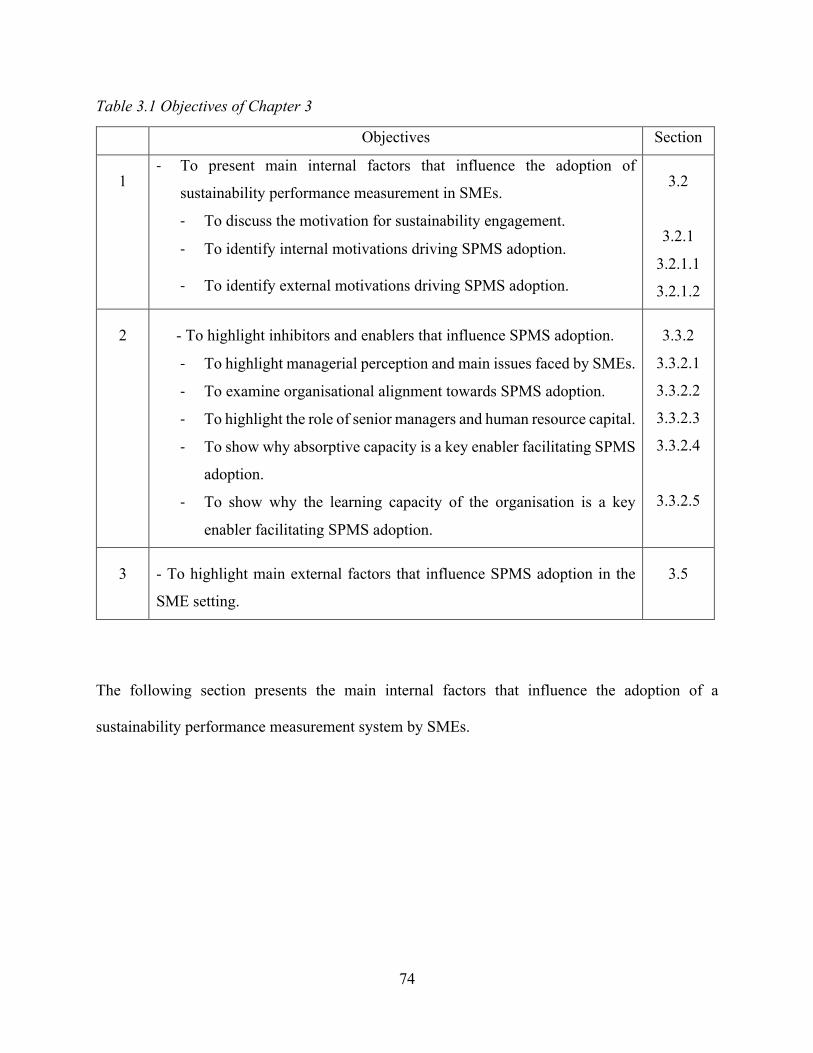
74
Table 3.1 Objectives of Chapter 3
The following section presents the main internal factors that influence the adoption of a
sustainability performance measurement system by SMEs.
Objectives Section
1 - To present main internal factors that influence the adoption of
sustainability performance measurement in SMEs.
- To discuss the motivation for sustainability engagement.
- To identify internal motivations driving SPMS adoption.
- To identify external motivations driving SPMS adoption.
3.2
3.2.1
3.2.1.1
3.2.1.2
2 - To highlight inhibitors and enablers that influence SPMS adoption.
- To highlight managerial perception and main issues faced by SMEs.
- To examine organisational alignment towards SPMS adoption.
- To highlight the role of senior managers and human resource capital.
- To show why absorptive capacity is a key enabler facilitating SPMS
adoption.
- To show why the learning capacity of the organisation is a key
enabler facilitating SPMS adoption.
3.3.2
3.3.2.1
3.3.2.2
3.3.2.3
3.3.2.4
3.3.2.5
3 - To highlight main external factors that influence SPMS adoption in the
SME setting.
3.5

75
3.2 Main internal Factors that Influence the Adoption of SPMS by SMEs
It is essential to recognise that measuring corporate sustainability is a complex problem that
requires the input of a significant amount of time and effort. For this reason, Searcy (2009b)
suggests that it is crucial to survey both the internal and external environments in which the
corporation operates when an SPMS is in the very early stages of creation.
Searcy usefully provides situational, goal, and implementation diagnostic questions. This can
assist the decision-makers and academic researchers in both making and building upon the
structure of thinking and discussions that need to be around the key issues that should be addressed
(see Searcy, 2009b).
Following Searcy's (2009b) instructions, this section discusses the prominent internal factors that
influence the adoption of SPMS by SMEs. The first sub-section presents the motivation for
sustainability engagement among SMEs.
3.2.1 The motivation for Sustainability Engagement among SMEs
It can be deduced from the previous research, as above, that companies are increasingly addressing
sustainability activities through operational practices (Font, Garay, and Jones, 2016; Anlesinya
and Susomrith, 2020) and strategies (Stubblefield Loucks, Martens, and Cho, 2010; Nayak et al.,
2019). This means they have been looking beyond the traditional focus of immediate profit and
have begun to shift their focus to concentrating on sustainability performance management and
measurement (Husgafvel et al., 2014). Still further, both practitioners and academic researchers of
corporate sustainability have recognised the benefits that can be derived from the sustainability
performance of the SME (Lo and Sheu, 2007; Bourlakis et al., 2014; Sajan et al., 2017; Nigri,
2018; Caldera, Desha and Dawes, 2019; Prashar and Sunder, 2020).

76
It has been observed through prior research that SMEs have increasingly been implementing
sustainability initiatives which are driven by certain motivations and these can often be categorised
into two types: internal motivations and external motivations (Bianchi, 1998; Masurel, 2007;
Lozano, 2015; Meath, Linnenluecke and Griffiths, 2016). In a recent study by De Steur et al.
(2020) it was highlighted that SMEs tend to consider that internal motivations are more important
than external ones. Both motivations, however, are important drivers that motivate the SME to
integrate sustainability metrics into daily decision-making (Nigri and Baldo, 2018).
The following sub-section discusses the main internal motivations for sustainability engagement
among SMEs.
3.2.1.1 Internal Motivations
Internal motivations refer to the activities and processes inside an organisation (Lozano, 2015) that
will drive businesses toward sustainability engagement. Several benefits and drivers have been
widely cited in the existing literature: cost and resource efficiency, corporate image and reputation
enhancement, potential customer attraction, employee retention and loyalty, improvements in
working conditions, waste and discharge reduction, differentiation and competitive advantage.
These are summarised in Table 3.2.
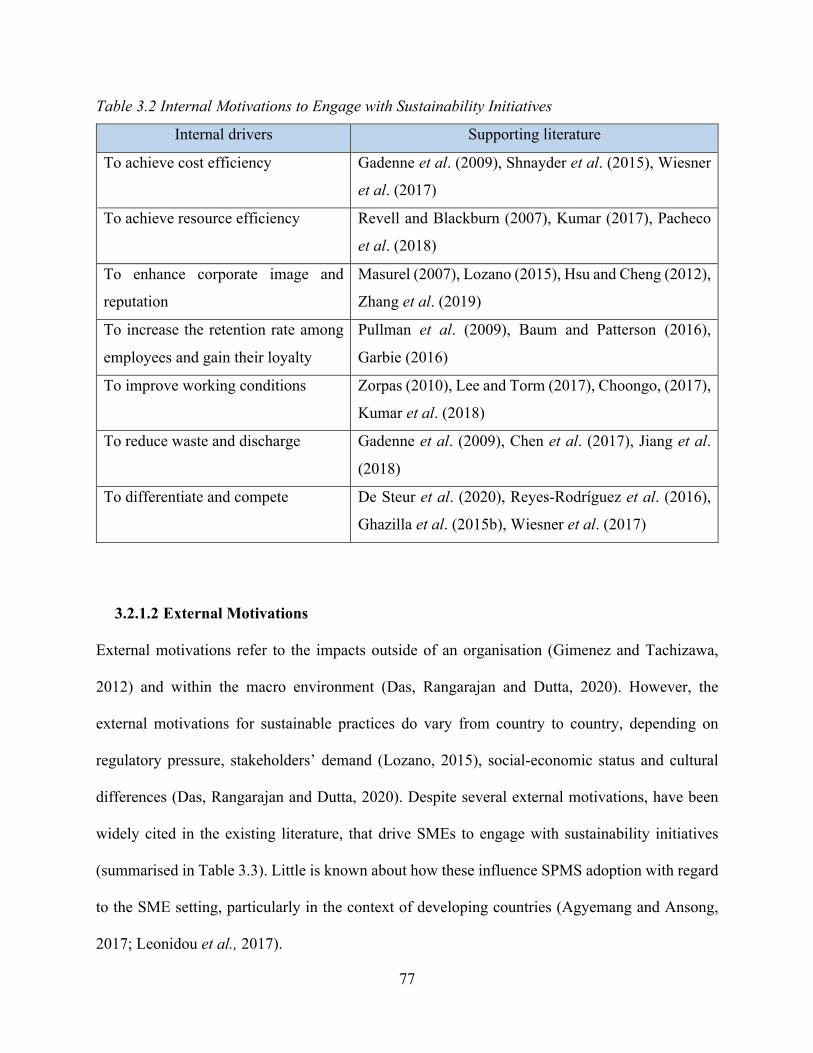
77
Table 3.2 Internal Motivations to Engage with Sustainability Initiatives
Internal drivers Supporting literature
To achieve cost efficiency Gadenne et al. (2009), Shnayder et al. (2015), Wiesner
et al. (2017)
To achieve resource efficiency Revell and Blackburn (2007), Kumar (2017), Pacheco
et al. (2018)
To enhance corporate image and
reputation
Masurel (2007), Lozano (2015), Hsu and Cheng (2012),
Zhang et al. (2019)
To increase the retention rate among
employees and gain their loyalty
Pullman et al. (2009), Baum and Patterson (2016),
Garbie (2016)
To improve working conditions Zorpas (2010), Lee and Torm (2017), Choongo, (2017),
Kumar et al. (2018)
To reduce waste and discharge Gadenne et al. (2009), Chen et al. (2017), Jiang et al.
(2018)
To differentiate and compete
De Steur et al. (2020), Reyes-Rodríguez et al. (2016),
Ghazilla et al. (2015b), Wiesner et al. (2017)
3.2.1.2 External Motivations
External motivations refer to the impacts outside of an organisation (Gimenez and Tachizawa,
2012) and within the macro environment (Das, Rangarajan and Dutta, 2020). However, the
external motivations for sustainable practices do vary from country to country, depending on
regulatory pressure, stakeholders’ demand (Lozano, 2015), social-economic status and cultural
differences (Das, Rangarajan and Dutta, 2020). Despite several external motivations, have been
widely cited in the existing literature, that drive SMEs to engage with sustainability initiatives
(summarised in Table 3.3). Little is known about how these influence SPMS adoption with regard
to the SME setting, particularly in the context of developing countries (Agyemang and Ansong,
2017; Leonidou et al., 2017).
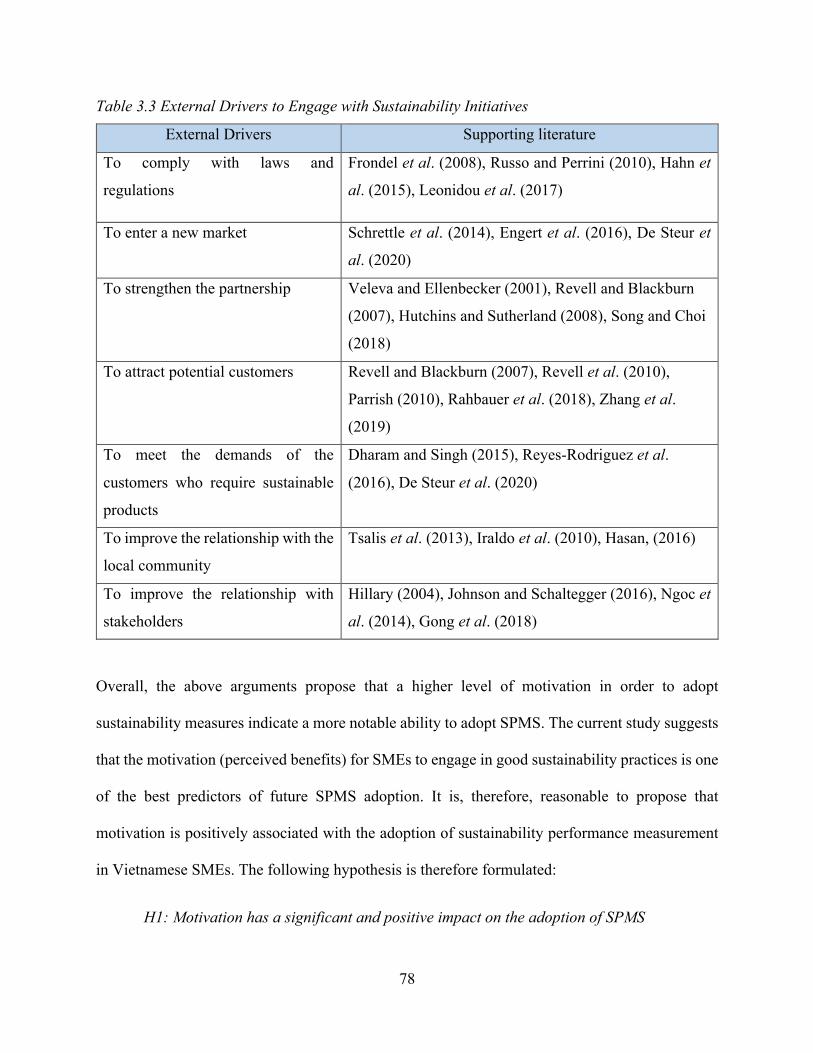
78
Table 3.3 External Drivers to Engage with Sustainability Initiatives
External Drivers Supporting literature
To comply with laws and
regulations
Frondel et al. (2008), Russo and Perrini (2010), Hahn et
al. (2015), Leonidou et al. (2017)
To enter a new market Schrettle et al. (2014), Engert et al. (2016), De Steur et
al. (2020)
To strengthen the partnership Veleva and Ellenbecker (2001), Revell and Blackburn
(2007), Hutchins and Sutherland (2008), Song and Choi
(2018)
To attract potential customers Revell and Blackburn (2007), Revell et al. (2010),
Parrish (2010), Rahbauer et al. (2018), Zhang et al.
(2019)
To meet the demands of the
customers who require sustainable
products
Dharam and Singh (2015), Reyes-Rodriguez et al.
(2016), De Steur et al. (2020)
To improve the relationship with the
local community
Tsalis et al. (2013), Iraldo et al. (2010), Hasan, (2016)
To improve the relationship with
stakeholders
Hillary (2004), Johnson and Schaltegger (2016), Ngoc et
al. (2014), Gong et al. (2018)
Overall, the above arguments propose that a higher level of motivation in order to adopt
sustainability measures indicate a more notable ability to adopt SPMS. The current study suggests
that the motivation (perceived benefits) for SMEs to engage in good sustainability practices is one
of the best predictors of future SPMS adoption. It is, therefore, reasonable to propose that
motivation is positively associated with the adoption of sustainability performance measurement
in Vietnamese SMEs. The following hypothesis is therefore formulated:
H1: Motivation has a significant and positive impact on the adoption of SPMS
79
3.2.2 Key Inhibitors and Enablers that can affect the Adoption of SPMS in the SME
setting
It is important to reiterate that measuring sustainability performance is becoming crucial for
companies of all sizes (Searcy, 2016), in order that they may address their sustainability activities
and maintain their status and competitiveness within a business environment. (Bourlakis et al.,
2014; Trianni et al., 2019). Although benefits can clearly be derived from employing good
sustainability practices, reluctance and resistance remain in the context of SMEs.
A key point of fact must be to remember that SMEs are not a “scaled-down” version of larger
corporations. SMEs have unique characteristics that significantly affect the way in which they are
managed (Hill, Nancarrow and Wright, 2002; Jenkins, 2006; Masurel, 2007; Bos-brouwers, 2009;
Preuss and Perschke, 2010; Darcy et al., 2014; Tran and Jeppesen, 2016; Saad, Kumar and
Bradford, 2017).
From the perspective of the resource-based view (RBV) it is important to acknowledge that each
SME has a distinctive set of resources and capabilities (Yu and Ramanathan, 2016; Zhang et al.,
2019; Al-kalouti et al., 2020) that enable them to be able to effectively manage and create more
capabilities that will enable them to adopt SPMS (Suh and Lee, 2018). A potential challenge that
the SME will come up against in the decision-making process that will be used to implement SPMS
is how to balance priorities, particularly costs, and how to effectively manage short-and long-term
trade-offs (Roehrich, Grosvold and Hoejmose, 2014). As Eikelenboom et al. (2019) claim, little is
known about firstly, whether, and secondly, how the SMEs, because of resource constraints,
would be able to utilise organisational capabilities that would simultaneously address economic,
social, and environmental sustainability performances. Drawing on these arguments, the remainder
80
of this section will examine key inhibitors and enablers that influence the adoption of SPMS within
the setting of the SME.
The following sub-section discusses managerial perception and challenge towards the adoption of
SPMS.
3.2.2.1 Managerial Perception and Main Challenges faced by SMEs towards the
Adoption of SPMS
Extant literature reveals that in most SMEs, the owner controls and manages the business , which
means the ownership and control are the responsibility of the same person (Wickert, 2014; Raziq
and Wiesner, 2016). This common form allows them to significantly control over the resource
allocation for the business to grow and engage with sustainability initiatives (Darcy et al., 2014;
Eikelenboom and de Jong, 2019). Notwithstanding, the lack of awareness about sustainability
issues (Dissanayake et al., 2020), and the absence of perceived benefits from implementing
sustainability management tools (Johnson and Schaltegger, 2016) can be barriers preventing
SPMS adoption in the SME setting.
As previously stated, in SMEs, the SPMS adoption is primarily influenced by managerial mind-
set of the owners. Despite it might differ from one to another, it is important to recognise that
SMEs’ managerial perceptions towards SPMS adoption can be subjective (Aragón-Correa et al.,
2008). Often, managers tend to avoid adopting sustainability initiatives if they believe their
organisations do not have capabilities to afford them. In fact, understanding about relevant
capabilities to effectively adopt SMPM is not always an easy thing. As Yu and Ramanathan (2016)
claim, there has been a shortcoming of guidance on how to create and develop relevant capabilities,
which help companies to effectively implement a sustainability initiative.
81
Managerial mind-set can be viewed as two main typologies, namely a growth mind-set or a
fixed/traditional mind-set of business operation (Nguyen, 2019; Tumpa et al., 2019; Zhang and
Morse, 2014). It is generally agreed that managers with a growth mind-set tend to drive companies
to engage in sustainability management and foster SPMS adoption within their organisation
(Eikelenboom and de Jong, 2019). It is believed that having positive influences throughout an
organisation because it creates resilience and tenacity, it enhances collaboration, communication
and engagement, and also facilitates motivation for learning and development (Nguyen, 2019).
On the opposite side, a fixed mind-set is considered profit-driven above all other goals, rather than
using the approach of profit-sacrificing sustainability (Hasan, 2016; Kumar et al., 2018; Lee,
Herold and Yu, 2016; Pham, Yong and Truong, 2019). While the decision regarding the adoption
of SPMS does mean that SMEs have to accept potential trade-offs. In this case, a business will be
willing to accept less profit when initially setting up adoption of SPMS. Ergo, it appears that a
growth mind-set will drive a company to adopt SPMS, while a fixed mind-set probably
demotivates it. In this current study the term ‘mind-set’ refers to that of all management levels and
employees within the SME setting.
Extant literature reveal that SMEs often focus on a range of short-term goals (Preuss and Perschke,
2010; Sommer, 2017). And at the same time, they have different problems to deal with (Sousa and
Aspinwall, 2010), and often have an informal approach to the sustainability engagement (Darcy et
al., 2014; Jenkins, 2006; Russo and Tencati, 2009). SMEs are frequently characterised by growth
through internal financing (Moore and Manring, 2009; Sommer, 2017). SME are also found that
fear of accrual debt if a new business idea implemented is successful, particularly SMEs in the
context of Vietnam (Phan et al., 2015; Rand and Tarp, 2020). As such, the opinions on cost
82
efficiency associated with SPMS adoption, to a large extent, might not always be favourable to
SMEs. This is because most SMEs probably expect immediate outcomes from their investment
(Jahanshahi, Brem and Bhattacharjee, 2017; Jia et al., 2018; Khurana, Haleem and Mannan, 2019).
This explains why SMEs rarely set or make no formal allocation of a separate sustainability budget
(Shields and Shelleman, 2015; Caldera, Desha and Dawes, 2019). Therefore, these issues
mentioned here can be significant barriers of SMEs that may impede their ability to adopt SPMS.
Assuming that the owner of a SME has a growth mind-set, and he or she perceives penitential
benefits that their company can reap from SPMS adoption. It is, however, vital to recognise that
businesses engaging in sustainability initiatives require sufficient resources, this is inevitable
(Jenkins, 2006; Palmer, Russell and McIntosh, 2012; Chen et al., 2014; Leonidou et al., 2017;
Ayuso, 2018; Ye and Kulathunga, 2019). It has been found that SMEs can resist investing in
sustainability initiatives if they perceive that it requires more human resources and thereby incur
more financial cost (Revell and Blackburn, 2007; 2010; Lourenco et al., 2012; Kallmuenzer et al.,
2017). Previous studies have shown that due to limited resources, in terms of finance, human and
time, SMEs often lack effort with regard to developing SPMS (Singh, Olugu and Musa, 2016;
Trianni et al., 2019). Therefore, resource constraints can be significant inhibitors hindering SPMS
adoption.
Another significant challenge can be faced by SMEs is the impact of organisational alignment on
the effective adoption of SPMS (Parisi, 2013; Morioka and de Carvalho, 2016; Ghadge,
Kaklamanou and Bourlakis, 2017). Empirical evidence has supported this viewpoint; Caldera,
Desha and Dawes (2019, p. 583) have found that “most SMEs are used to engaging in traditional
practices… it was challenging to move from ‘business as usual’ to new ways of doing business.”
83
Similarly, Shi et al. (2008) note that SMEs’ senior managers often worry that changing current
operational processes will be risky.
The above discussion is in line with the extensive research, which have attempted to develop a
SPMS that can be applied to the SMEs, connecting with their existing integrated performance
measurement systems. For example, in their work, Hsu, Chang and Luo (2017) points out that, in
practice, it is extremely difficult for SMEs to simultaneously implement all the performance
measures. A possible explanation is that existing integrated performance measurement systems,
such as the balanced scorecard, have often been poorly understood and incorrectly applied by
SMEs (Garengo, Biazzo and Bititci, 2005; Pešalj, Pavlov and Micheli, 2018). As Azapagic (2004)
claim, the application of an advance performance measurement is quite complex, expensive and
time-consuming. Technically, this is a challenging task that is difficult to align intricate
complexities related to organisational aspects such as internal networks, processes (Alagaraja and
Shuck, 2015). There are other characteristics of SMEs which can impede their ability to effectively
implement an advance performance measurement. SMEs are often described as having simple
organisational structures (Cordano, Marshall and Silverman, 2010), informal rules, routine and
process (Cassells and Lewis, 2011; Saad, Kumar and Bradford, 2017; Wickert, 2014).
Additionally, SMEs are found to have limited knowledge and expertise to effectively implement
sustainability initiatives (Singh, Olugu and Musa, 2016; Caldera, Desha and Dawes, 2019; Trianni
et al., 2019; Cardoni et al., 2020). Such foreseeable difficulties, SMEs can be reluctant to take on
a challenge (Sirsly and Sur, 2014), or fear of dealing with change (Sroufe et al., 2010) towards
adopt a new sustainability initiative likes SPMS.
84
It is inevitable the developmental process, or adoption of SPMS, is likely to be a complicated task,
which requires continuous monitoring and adjustments over time (Buller and McEvoy, 2012) and
might be financially costly (Abbasi and Nilsson, 2012). This reflects why managers of SMEs often
complain about the adverse effects of implementing sustainability initiatives in terms of increased
costs and complexities (Danso et al., 2019), which also explain why initial sustainability
investment and hidden costs are very often significant obstacles for SMEs (Ghadge et al., 2020;
Hwang, Shan and Lye, 2018; Trianni, Cagno and Farné, 2016). It is highlighted that uncomfortable
experiences with a previous sustainability initiative implementation can hinder the adoption
another in the future (Chan, 2011).
Considering the above discussion, it is reasonable to propose that a lack of managerial perception
and internal shortcomings will demotivate SMEs from adopting SPMS. Therefore, this thesis
proposes that:
H2a: A lack of managerial perception has a significant and negative impact on the
adoption of SPMS.
H2b: Internal shortcomings have a significant and negative impact on the adoption of
SPMS.
3.2.2.2 Organisational Alignment towards SPMS Adoption
As previously stated, the adoption of SPMS necessitates SMEs to accept potential trade-offs. At
the organisational level, it depends on entrepreneurial sustainability orientation (Danso et al.,
2019; DiVito and Bohnsack, 2017). It is about the integration of entrepreneurial orientation and
the TBL sustainability (Criado-Gomis, Cervera-Taulet and Iniesta-Bonillo, 2017). In other words,
85
it is viewed as a strategic resource that enables a company to integrate sustainability goals into
their organisational mindset (Filser et al., 2019).
Inevitably, trade-offs can be varied from one situation to another and also from one company to
another; for example, a business is willing to accept less profit when initially setting up adoption
of SPMS, or trade-offs between selecting economic, environmental, and social metrics. As Hahn
et al. (2010) state, trade-offs can occur between available and desirable sustainability performance
metrics. To this end, it is important to acknowledge that there seems to be trade-offs throughout
the developmental process of SPMS (Govindan et al., 2015; Hák, Moldan and Dahl, 2007) and
actions taken to improve one dimension might either depress, or indeed have no effect at all on
performance (Murphy, Trailer and Hill, 1996; Simpson, Padmore and Newman, 2012).
A relative strength of the SME is often described as lying within the owner’s entrepreneurial mind-
set, which in turn enables businesses to be flexible, adaptive (Branicki, Sullivan-Taylor and
Livschitz, 2018). This strength can help SMEs to effectively manage their trade-offs to create and
develop relevant capabilities in terms of SPMS adoption. It is, however, influenced by SMEs’
entrepreneurial resilience and their perception about importance for sustainability issues (Ates and
Bititci, 2011; Moore and Manring, 2009); it can be related to extreme events, such as the global
crisis of the COVID-19 pandemic (Susanto, 2021). Successful SPMS adoption can be linked with
the need of SMEs to build resilient organisations in order to integrate perspective of TBL concept,
focus on addressing the needs of key stakeholders and adopt a long-term perspective (Ahi and
Searcy, 2013).
To understand the SPMS adoption within the SME setting, it is important to uncover the
mechanisms that underly the decision-making trade-offs which are signalled through the
86
entrepreneurial sustainability orientation (DiVito and Bohnsack, 2017); this relies on the
contextual condition of entrepreneurial businesses (Mahmud, Soetanto and Jack, 2021). To the
best knowledge of the researcher of this current study, this issue has not been studied very
rigorously.
With respect to support SMEs with the challenge of organisational alignment, a practical approach
is to align SPMS with organisational short-term and long-term strategic goals (Parisi, 2013;
Pryshlakivsky and Searcy, 2015; Morioka and de Carvalho, 2016). From this starting point, it is
critical to recognise that an effective SPMS adoption is the coordination with relevant stakeholders
(Garengo, Biazzo and Bititci, 2005; Harding, 2006; Jamali and Mirshak, 2007; Cory Searcy, 2009).
As for SMEs, they often act as suppliers for large companies (Bos-brouwers, 2009; Granly and
Welo, 2014). For this reason, SMEs’ objectives of SPMS adoption need to align with their key
stakeholders’ expectations. In this way, SMEs can engage with them and create a basis for rich
communications about their sustainability performance (Melnyk, Stewart and Swink, 2004; Perrini
and Tencati, 2006; Searcy, 2012). As a consequence, SMEs can better evaluate their measurement
system, develop recommendations (Pádua and Jabbour, 2015), and then develop an appropriate
strategy for SPMS adoption (Searcy, 2011).
In the same line with the above reasoning, SMEs can respond to requirements, expectations and
preferences of the relevant stakeholders’ interests (Yu and Ramanathan, 2015). From that point,
they can also open up win-win opportunities (Dey et al., 2019; Shaw, Grant and Mangan, 2021;
Yu, Ramanathan and Nath, 2017). Notwithstanding, it is important to recognise that in the real
world, win–win opportunities often go unnoticed, and sustainability issues are complex, with
varied trade-offs and different conflicts. Hence, a practical strategy is to follow the rule rather than

87
the exception to avoid being overly optimistic (Hahn et al., 2010). This approach necessitates the
SME to be flexible (Ates et al., 2013) to effectively manage trade-offs in order to transform
opportunities into win–win outcomes (Cubas-Díaz and Martínez Sedano, 2017).
Needless to say, sustainability is complex and challenging as it covers several aspects. In this case,
it requires a certain level of resources and capabilities that SMEs may not have (Ghadge et al.,
2020; Wu et al., 2019). This clearly necessitates SMEs to utilise flexibility (Grigorescu et al.,
2020; Nguyen, 2019) whenever necessary in order to select appropriate metrics on condition that
best suited to their available resources and business model (Aragón-Correa et al., 2008; Shields,
Welsh and Shelleman, 2018). To this end, SMEs can deal with conflicts between priorities
(Martins et al., 2007), emerging issues, uncertainties and unavoidable iterations (Searcy, 2009).
For the most part, a practical and straightforward approach for a SME in effective implementing
SPMS is to focus on the relevant capabilities that they have or can create and develop; and
simultaneously avoid complexities that cannot afford (Yu and Ramanathan, 2016).
For some SMEs, the organisational alignment and SPMS adoption can utilise and consolidate
existing sustainability management tools in administrative processes like Kaizen and ISO 14001
(Caldera, Desha and Dawes, 2019). This implies that they need to review existing processes and
identify overlapping areas of existing sustainability tools and SPMS, which can be interdependent
and synergistic. From another perspective, many SMEs have been presented having difficulties in
developing effective mission, vision, and values (Ates et al., 2013); it turns out that SPMS adoption
can be an opportunity to formalise their strategies (Garengo, Biazzo and Bititci, 2005). If so, an
awareness of these cumulative benefits is crucial, which can guide SMEs to generate the most
effective impact under resource constraints.
88
In this section, it has been explained that the importance of organisational alignment towards the
effective adoption of SPMS. The following section discusses the role of top managers and human
resource capital with regard to adopting SPMS adoption within the SMEs setting.
3.2.2.3 The Role of Top Manager and Human Resource Capital towards SPMS
Adoption
Most of the literature has placed a greater emphasis on the positive relationship between human
capital resources and the sustainability performance of the SME (Masood, Soomro and Ali, 2018;
Küçükbay and Sürücü, 2019). Human capital refers to “the skills, knowledge, business
management experience and formal educational training of owners/managers of businesses….
[this] is considered intangible capital which can be leveraged to a firm’s competitive advantage”
(Roxas and Chadee, 2017, p.2). It is regarded as the most important intangible asset that drives
SMEs’ survival and development (Tiep, Huan and Hong, 2021; Zulu-Chisanga, Chabala and
Mandawa-Bray, 2020).
Human resource support is a crucial enabler facilitating SPMS adoption (Siegel et al., 2019), as
well as obtaining positive sustainability performance outcomes (Raziq and Wiesner, 2016; Nguyen
and Tran, 2020). In contrast, lack of adequate human resources might prevent SMEs effectively
implementing sustainability initiatives (Johnson and Schaltegger, 2016; Caldera, Desha and
Dawes, 2019). Within the SME, top managers are responsible for choosing and accepting effective
sustainability metrics (Taylor and Taylor, 2014 AlNuaimi, Al Mazrouei and Jabeen, 2020). Given
this, it is beneficial to have employee involvement, because if an employees are involved, this can
limit the amount of resistance to change (Franco and Bourne, 2003) and enhance the employees’
89
engagement /interest, as well as promoting responsibility-sharing (de Villiers, Rouse and Kerr,
2016).
Moreover, employee involvement can also help top managers to avoid subjectivity and bias
(Franco and Bourne, 2003); to give one example, when making decisions on employee-related
metrics. As explained by stakeholder theory in chapter 2, stakeholders often have different
demands and conflicting interests. With this practical approach, SMEs can meet both the needs
and expectations of employees, a primary internal stakeholder group. As highlighted in the existing
literature, this group has influence over implementation of select SPMS decisions (Adams and
Frost, 2008; Papert, Rimpler and Pflaum, 2016; Searcy, 2016), sustainability performance
outcomes (Das, Rangarajan and Dutta, 2020; Nguyen and Tran, 2020) and the way that businesses
operate (Nejati, Amran and Hazlina Ahmad, 2014).
Studies on SMEs have shown that low employee engagement can deleverage the adoption of a
sustainability initiative. (AlNuaimi, Al Mazrouei and Jabeen, 2020; Pham, Yong and Truong,
2019). Wiesner, Chadee and Best (2017) have attempted to explain the phenomenon by
investigating how SMEs managed the change towards environmental sustainability. The authors
have used the following comment from an SME owner to shed light on this phenomenon: “There
was a lot of resistance because they couldn’t see why we were doing this” (Wiesner, Chadee and
Best, 2017, p.18).
One essential point that is linked with the responsibility of top managers is that a shared vision to
all company staff should be implemented (Dzhengiz and Niesten, 2020; Saratun, 2016; Xin et al.,
2020). This implies that it is simply not enough for employees to know their managers’ objectives,
rather, it entails a shared feeling that the objectives of the company are crucial and that all

90
employees may contribute to defining them (Aragón-Correa et al., 2008). This can develop
employee capabilities in terms of accumulated skills (Yu and Ramanathan, 2016), leadership and
key internal stakeholder management, which is necessary for implementation of SPMS adoption.
Its success or effectiveness, however, likely depends on the communication skills of each top
manager.
It would be appropriate to indicate that in the early stages of the developmental process of SPMS,
it is not wise to punish or blame individuals. It is far more appropriate to provide clear and concise
information in a straightforward way to all employees throughout the organisation (Tarí and
Molina‐Azorín, 2010) that will help the organisation to take the appropriate actions with the
ultimate goal of adopting SPMS. SMEs have notable strengths, including small company-sizes
that can easily communicate and discuss metrics (Ingwersen et al., 2014), there is often an informal
culture (Graafland, Van de Ven and Stoffele, 2003), less bureaucracy and a direct and informal
communication system that can facilitate exchange of information (Fuller and Lewis, 2002). SMEs
can consider developing a roadmap that will navigate the developmental process of SPMS
adoption, which can be long and complex. The level of detail is closely linked to the objectives of
each SME. The discussion here reflects that effective communication is a significant enabler
facilitating SPMS adoption.
Even when the identification of sustainability metrics is complete, the implementation of SPMS is
not always a straightforward task. Prior research undertaken on SMEs has highlighted that
employee involvement is crucial to the success of integration of a sustainability initiative, such as
the EMS (environmental management system) (Curkovic, Sroufe and Melnyk, 2005; Zorpas,
2010). Literature reveals that the alignment of SPMS with organisational strategy, as previously
91
discussed, can be achieved if a company has a robust system that enables employee involvement
and support (Parisi, 2013; Ghadge, Kaklamanou and Bourlakis, 2017; Siegel et al., 2019). This
necessitates that top managers ensure that their employees are empowered to take part in the
decision-making processes that are relevant to issues of SPMS adoption, which is viewed as an
effective tool to intrinsically motivate people (Busse et al., 2016). Yusoff et al. (2016) support this
viewpoint by providing empirical evidence indicating that employee empowerment has a positive
association with social, environmental, and economic performance of Malaysian manufacturing
SMEs. As Sousa and Aspinwall (2010) claim, a lack of employee empowerment may result in
exceeding initial cost estimates whilst implementing performance measurement among SMEs.
However, it is vital to acknowledge that the true benefit of empowerment can only be realised if
employees experience empowerment in the real sense, and this demands a key role of authentic
leadership (Govender and Bussin, 2020); lack of strong leadership may result in a fake
involvement with top management demanding more and acquiescing less (Smith, 2018). This can
be important within the SME, where leadership and management styles typically follow a top-
down hierarchical approach (Wrana, Xuan and Nguyen, 2019) in which operational personnel
must gain permission from top management (Busse et al., 2016). This necessitates that a top
manager is flexible with regard to promoting employee empowerment. Also, managers should
deliver, throughout the process of SPMS adoption, an appropriate attitude (Burke and Gaughran,
2007), openness and proactive behaviour (Nguyen and Tran, 2020).
The influences of top management have been highlighted in the existing literature, stating that they
can help facilitate sustainability-oriented engagement (Jahanshahi and Brem, 2017) and enhance
the training provided to employees (Khurana, Haleem and Mannan, 2019). They can also
92
encourage middle managers to take on sustainability responsibility (Bao, Wang and Sun, 2019;
Nguyen and Tran, 2020). It is crucial to recognise that within the SME, middle managers play a
critical intermediary role between the ‘top’ and ‘bottom’ of the organisation, interpreting and
communicating data, information and knowledge emanating from different organisational actors
(Camuffo and Comacchio, 2005). Although they may not have the skills to implement change
(Smith, 2018), they will sometimes play the role of "change-agent" for the self-revolution of the
organisation (Nonaka, 1994).
In line with the above reasoning, it is crucial to note that within the SME, employees are typically
absorbed by their daily operational tasks, leaving no room for activities that are not directly related
to the day-to-day business (Johnson and Schaltegger, 2016; Sommer, 2017) and top managers also
have little time for tasks beyond managing the core business of the company (European
Commission, 2002; Cassells and Lewis, 2011; Granly and Welo, 2014; Sommer, 2017). Under
this circumstance, it necessitates that top management to be flexible and effectively manage trade-
offs that give empowerment through proactive negotiations with employees about mutual benefits
(Tuan and Rowley, 2015). Accordingly, fair accountability and responsibility toward the adoption
of SPMS need be applied to both individuals and teams, and clear instruction needs to be in place
and clearly communicated to enhance employees’ trust and motivation and promote their self-
performance management (Sardi et al., 2020).
As discussed in chapter 2, employee empowerment has a positive influence upon job satisfaction,
employee retention and also corporate culture (Srisathan, Ketkaew and Naruetharadhol, 2020).
Employee empowerment can help SMEs mitigate the problem of successfully retaining qualified
staff who can support the adoption of SPMS (Rao et al., 2006; Raderbauer, 2011; Tran, Deng and
93
Ong, 2018; Siegel et al., 2019). This shows that employee empowerment is a crucial enabler
facilitating SPMS adoption.
Most of the literature has placed a great emphasis on managerial capabilities as a key determinant
for the success of implementing a sustainability initiative (Khurana, Haleem and Mannan, 2019;
Roxas, 2021). A dynamic managerial capability refers to “the capacity of managers to create,
extend or modify the knowledge resource base of an organization” (Volberda, Foss and Lyles,
2010, p.940). Existing literature highlights that managerial skills may be lacking within SMEs
(Rachidi and El Mohajir, 2021; Sardi et al., 2020; Shi et al., 2008; Tien, Anh and Ngoc, 2020) and
that this is a common issue (Sardi et al., 2020), particularly in developing countries such as
Vietnam, where both top management and employees have been tasked to build upon the
fundamental managerial skills of planning, organising, communication, coordinating, decision-
making, team-building and leadership (Bruwer and Smith, 2018; Chandra, Paul and Chavan, 2020;
Etuk, Etuk and Michael, 2014; Quan, 2015; Tran and Pham, 2020; Tran, Deng and Ong, 2018;
Urban and Naidoo, 2012). It can be argued that even both top managers and employees are
involved both personally and interactively during the developmental process of SPMS and if they
lack necessary managerial skills, their decision-making ability can be limited. This indicates that
there is a need for SMEs to be flexible and for trade-offs to be effectively managed in order that
entrepreneurial managerial capabilities will move forward and foster organisational resources
(Roxas, 2021). It is within the managers role to encourage, motivate and offer opportunities for
employees to develop new skills and competencies that will support the SPMS adoption (Siegel et
al., 2019). Ergo, managerial capabilities are crucial enablers.
94
Considering the above discussion, it seems clear that within SMEs, the top managers have a strong
influence within the context of the organisational environment, and this helps to create the
necessary organisational changes towards the adoption of SPMS. They play a central role in
identifying, developing and allocating relevant resources for the adoption of SPMS. It is crucial
that they are flexible, and that trade-offs are effectively managed whenever necessary in order to
develop and build the relevant internal capabilities; their key role can be also viewed as a vital
intangible capability. This explains why most literature has placed a great emphasis that top
management support is vital and significantly influences the effective implementation of SPMS
(Parisi, 2013; Johnson, 2015; Aboelmaged, 2018).
Top management support refers to the degree to which top managers consider the activities of a
new project an essential priority and this support is critical to a company’s effectiveness (Jarvenpaa
and Ives, 1991). It is imperative to recognise that SPMS adoption involves an organisational
change through which new behaviours, habits, attitudes, and values are generated and developed
within organisational structure and processes (Goddard et al., 2016). Such phenomena typically
occurs at both corporate and individual levels (Sroufe et al., 2010; Shevchenko, Lévesque and
Pagell, 2016). Importantly, in SMEs, top managers need to be well prepared to commit from the
very outset of the project (Siegel et al., 2019). But predominantly, their support need to be signalled
through active involvement, encouragement and supervision to introduce appropriate changes
conducive to commitment, engagement and motivation to SPMS adoption in the organisation
(Dora, Kumar and Gellynck, 2016; Tran, Deng and Ong, 2018). Evidence from extensive literature
has also indicated that top management support has a positive relationship with sustainability
performance implementation and its outcomes (Parisi, 2013; Nguyen, 2019; Nguyen and Tran,
2020). In the same vein, prior studies have highlighted that it has a positive impact on not just as

95
the adopting sustainability management tools (Johnson, 2015), but also on the implementing
performance measurement (Taylor and Taylor, 2014). Therefore, the current study considers top
management support a critical enabler facilitating the implementation of SPMS in SMEs. Thus,
the third hypothesis is as follows:
H3: Top management support has a significant and positive impact on the adoption of
SPMS
3.2.2.4 Absorptive Capacity and SPMS Adoption
It should be highlighted that the adoption of SPMS require an SME to have a certain amount of
prior knowledge (Ahi and Searcy, 2013a; Høgevold et al., 2015; Simpson, Padmore and Newman,
2012) which primarily depends on a firm’s absorptive capacity to address its needs more
effectively (Ahi and Searcy, 2013a; Cohen and Levinthal, 1990; Høgevold et al., 2015; Shahzad
et al., 2020). An early study by Cohen and Levinthal (1990), who initially proposed the concept
of ‘absorptive capacity’, suggests that an organisation's capacity for innovation is determined by
absorptive capacity or prior knowledge; prior knowledge is defined as “an ability to recognise the
value of new information, assimilate it, and apply it to commercial ends” (Cohen and Levinthal,
1990, p.128.). An analogous notion of absorptive capacity also exists for individuals, hence,
organisation's absorptive capacity depends on the absorptive capacity of individuals in the
organisation (Francalanci and Morabito, 2008). As Riikkinen, Kauppi and Salmi (2017) pointed
out, absorptive capacities are crucial in defining and identifying sustainability metrics.
On the basis, absorptive capacity incorporates a set of four critical processes: knowledge
acquisition, assimilation, transformation, and exploitation (Cohen and Levinthal, 1990). In most
cases, absorptive capacity can be divided into two types: potential, and realised absorptive
96
capacities (Zahra and George, 2002). The former focuses on knowledge acquisition and
assimilation while the latter centres on knowledge transformation and exploitation (Albort-Morant
et al., 2018; Muathe and Muithya, 2020).
From an absorptive capacity perspective, SMEs can acquire external knowledge and integrate it
with existing internal knowledge (Cohen and Levinthal, 1990; Csillag et al., 2019). Often, the
external knowledge can inflow from collaboration with external stakeholders; these include
customers, suppliers, trade associations, local authorities, competitors and consultants (Johnson,
2017; Mishra, 2019; Seo et al., 2016). In this point, SMEs have novel strengths that can support
this process: motivation, a good network, greater proximity to market (Ngah and Jusoff, 2009),
dynamic behaviour and close proximity to customers and suppliers (Meixell and Gargeya, 2005).
Alternatively, the knowledge acquisition and assimilation of SMEs can be supported by internal
capabilities in two ways (Isensee et al., 2020; Johnson, 2017) ; firstly, SMEs can utilise previous
related knowledge and experience that has been gained from sustainability-related programmes
such as ISO. Secondly, they can seek assistance from employees who have educational
qualifications and expertise (Johnson, 2017).
In a recent study by Csillag et al. (2019), the evidence shows that within SMEs, the owner-
managers are responsible for bringing external knowledge into the organisation. Here, it needs to
be clarified that external collaborations and strengths mentioned above do not ensure that SMEs
can effectively acquire external knowledge and transfer this to their own experiences. Its success,
however, depends on proactive behaviours in acquiring such knowledge (Liao et al., 2003).
Notably, such proactive behaviours subsequently lead to the development of their networking
capability (Koirala, 2019; Roxas et al., 2017). In effect, it enables SMEs to exchange both

97
knowledge and experience, which can be crucial for the developmental process of SPMS
(Eikelenboom and de Jong, 2019; Horisch, Johnson and Schaltegger, 2015). Notwithstanding, it is
important to recognise that SMEs have weaknesses that can impede them in the quest to acquire
external knowledge; to give example, limited resources and time (Liao et al., 2003; Johnson, 2017).
This serves to heighten the importance of SMEs being flexible and effectively managing their
trade-offs in order to devote more resources to developing external knowledge acquisition
capability. This not only helps SMEs to facilitate the development of SPMS, but also helps them
contribute to their sustainable strategic management (Engert, Rauter and Baumgartner, 2016) as
well as creating and sustaining corporate competitive advantage (Liao et al., 2017; Song and Choi,
2018).
In essence, the absorptive capacity is often developed and accumulated over time through initial
investment (Cohen and Levinthal, 1990). This necessitates that SMEs can utilise their strengths,
small company-size, and flexibility (Saad, Kumar and Bradford, 2017), as well as effectively
manage trade-offs to provide initial necessary knowledge and skills necessary related to SPMS
adoption. This is vitally important because it can build each employees' ability to recognise and
acquire new, external knowledge at a personal level (Tilleman, 2012; Johnson, 2017). It is
important to recognise that new knowledge, such as SPMS adoption, imparted within the setting
of the SME needs to be practical and useful, rather than delivered in a conceptual form (Saad,
Kumar and Bradford, 2017). This can be beneficial for SMEs in the mitigation of varied
perceptions and different levels of awareness of SPMS adoption across the organisational structure
(Caldera, Desha and Dawes, 2018).
98
Inspired by the early work of Cohen and Levinthal (1990), several studies (e.g. Jahanshahi and
Brem, 2017; Aboelmaged and Hashem, 2019) have placed a significant emphasis on the positive
links between knowledge absorptive capacity and the sustainability performance in the context of
SMEs. Prior studies have also identified a positive relationship between absorptive capacity and
SMEs’ sustainability integration. For example, Johnson (2017) contends that sustainability
knowledge is an essential enabler facilitating the implementation of sustainability management by
SMEs. In a similar fashion, Aboelmaged and Hashem (2019) suggest that absorptive capacity as a
strong predictor of sustainable capabilities and demonstrate its positive effects upon SMEs’
adoption of green innovations. Therefore, it is a reasonable view that the better the development
of absorptive capacity, the better the implementation of sustainability initiatives. Based on this line
of argument, the current study considers absorptive capacities to be one of the determinants that
influence the adoption of SPMS in SMEs. This thesis proposes that:
H4: Absorptive capacity has a significant and positive impact on the adoption of SPMS
3.2.2.5 Organisational Learning Capacity and SPMS Adoption
In relation to the above discussion, it is important to note that absorptive capacity exists within
both tacit and explicit knowledge (Cegarra Navarro, Eldridge and Wandosell, 2016). In an
organisation, tacit knowledge is more difficult to formally transmit or transfer than explicit
knowledge, which is often presented in written form and can be easily searched for by using
manuals and databases, and it can be easily shared among individuals and groups (Shahzad et al.,
2020). This is because tacit knowledge is deeply rooted in experience, skills and know-how
(Bierly, Damanpour and Santoro, 2009). It is often described as being personally bounded, non-
verbalisable and context specific (Meier, 2011).
99
Literature highlights a strong link between absorptive capacity and organisational learning
(Dzhengiz and Niesten, 2020; Goddard et al., 2016; Saad, Kumar and Bradford, 2017; Zahra and
George, 2002). Organisational learning refers to knowledge-sharing systems comprising explicit
and tacit knowledge (Dibella, Nevis and Gould, 1996; Nonaka, 1994). On this basis, organisational
learning is constructed by organisational individuals and groups involved in interactions and the
sharing of experiences and knowledge (Curado, 2006; Tsang, 1997). It is generally agreed that
within SMEs, tacit knowledge is a valuable and potential resource (Bierly, Damanpour and
Santoro, 2009; Ngah and Jusoff, 2009) which is often harnessed and stored in the minds of the
owner-manager and/or key staff members (Jiang, Ritchie and Verreynne, 2021; Saad, Kumar and
Bradford, 2017). As such, if these actors act in isolation, it subsequently deleverages the density
of knowledge sharing as well as decreasing the benefits of organisational learning. Such situations,
therefore, can be crucial inhibitors that can impede or delay the SPMS adoption.
In essence, organisational learning is social interaction working at a corporate level and implies a
degree of learning over time (Curado, 2006; Goddard et al., 2016). As Zahra and George (2002)
claim, both absorptive capacity and organisational learning capacity often involve a set of
organisational routines. As such, this necessitates a knowledge-sharing process that should be
aligned with existing working habits and routines, and company goals and values (Wang and Noe,
2009). In this regard, SMEs have novel strengths that can support this process, including their
small size, their flat, organisational structure (Das, Rangarajan and Dutta, 2020a) and informal
climate (Massa, Farneti and Scappini, 2015). Nevertheless, it is important to note that SPMS
adoption can be long, demanding and costly. Thus, SMEs need to be flexible and effectively
manage trade-offs to develop more formal structures, procedures and processes to motivate
employees to transfer their individual learning into the organisational learning (Csillag et al., 2019;

100
Curado, 2006; Saad, Kumar and Bradford, 2017). Additionally, an effective information system is
considered necessary to facilitate knowledge sharing across the organisation (Jamali, 2006b;
Sroufe, 2017). These issues mentioned are central with regard to developing organisational
learning capacity.
The knowledge sharing process is influenced by corporate culture (Arsawan et al., 2020; Lam et
al., 2021; Wang and Noe, 2009), including internal factors such as attitudes, beliefs, value
formation and ethics/norms (Isensee et al., 2020). It is noted that a positive corporate culture often
relies on relationships which are built on trust and mutual understanding and they develop as a
result of a long-term collaboration (Chee Tahir and Darton, 2010; Kucharčíková, Mičiak and
Hitka, 2018; Kucharska and Kowalczyk, 2016). Laforet (2016) supports this viewpoint and points
out that a positive corporate culture often encourages knowledge sharing. Therefore, it is
imperative that SMEs review corporate culture, incentive and reward systems in order to ensure
both employees and groups are encouraged to use and share their knowledge, information and
skills with others the organisation (Bari, Ghaffar and Ahmad, 2020; Gianni, Gotzamani and
Tsiotras, 2017; José Tarí and Molina‐Azorín, 2010; Mabhungu and Van Der Poll, 2017).
Horisch, Johnson and Schaltegger (2015) employ the knowledge-based view (KBV) as an
extension of the RBV, and they argue that SMEs, despite their inherited limited resources, can
establish learning processes throughout the organisation that will leverage the level of
implementation of sustainability management tools. Eikelenboom et al. (2019) support this
viewpoint by highlighting that through establishing a process of continuous adaptive learning,
SMEs can better manage their knowledge resource capabilities, leading to lower costs, costs that
are of vital importance pertaining to sustainability issues. Among other capabilities, this current

101
study focuses primarily on absorptive capability and organisation learning capacity as key enablers
facilitating SPMS adoption in the SME setting.
From a strategic perspective, organisational learning capability also plays a central role in respect
of development of organisational capability (Ghasemzadeh et al., 2019), supporting organisational
improvement (Taylor and Taylor, 2014), and contributing to sustainable strategic management
(Engert, Rauter and Baumgartner, 2016).
Drawing upon all the above arguments, the current study proposes that organisation learning
capacity is an important enabler facilitating SPMS adoption. Thus, the fifth hypothesis is as
follows:
H5: Organisational learning capacity has a significant and positive impact on the
adoption of SPMS
In summary, inhibitors and enablers that have been identified from the literature that can influence
SMEs to adopt SPMS are presented in Table 3.4. and Table 3.5 below.
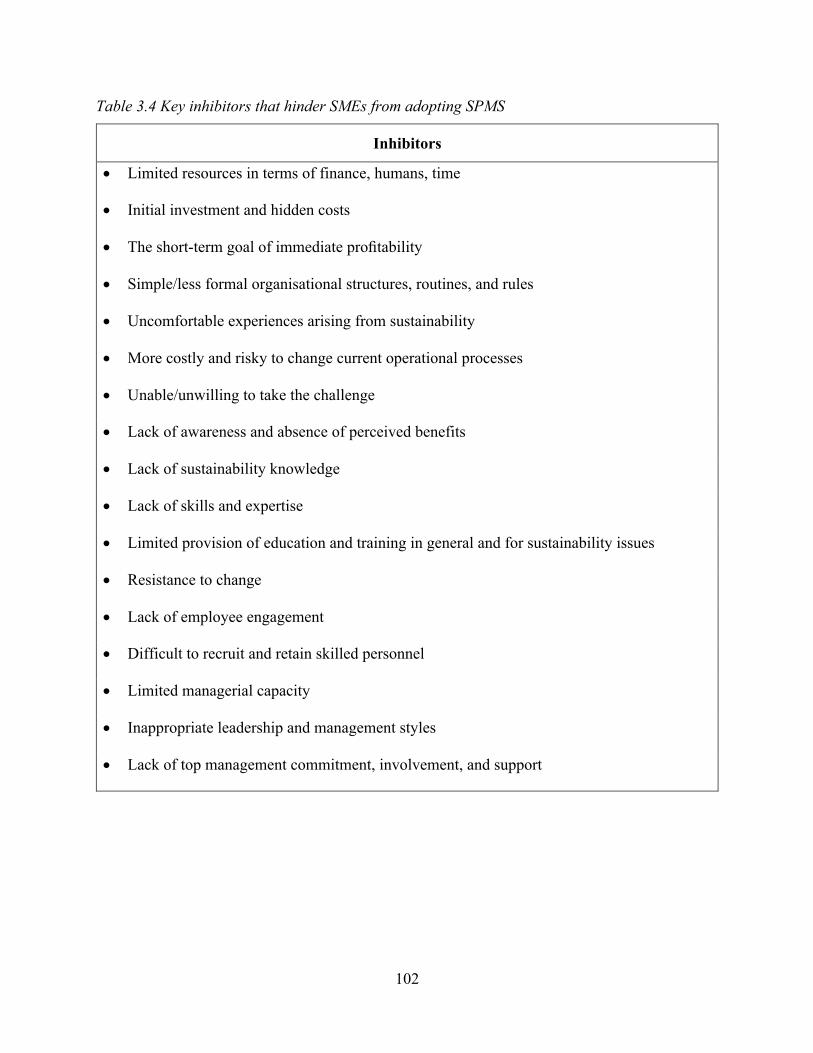
102
Table 3.4 Key inhibitors that hinder SMEs from adopting SPMS
Inhibitors
• Limited resources in terms of finance, humans, time
• Initial investment and hidden costs
• The short-term goal of immediate profitability
• Simple/less formal organisational structures, routines, and rules
• Uncomfortable experiences arising from sustainability
• More costly and risky to change current operational processes
• Unable/unwilling to take the challenge
• Lack of awareness and absence of perceived benefits
• Lack of sustainability knowledge
• Lack of skills and expertise
• Limited provision of education and training in general and for sustainability issues
• Resistance to change
• Lack of employee engagement
• Difficult to recruit and retain skilled personnel
• Limited managerial capacity
• Inappropriate leadership and management styles
• Lack of top management commitment, involvement, and support

103
Table 3.5 Key enablers that facilitate SMEs to adopt SPMS
Enablers
• Top management commitment, involvement, and support
• Appropriate leadership and management styles
• Employee empowerment
• Acquiring better managerial skills
• Effective information system
• Fair accountability and responsibility for measures applied to individuals and teams
• Providing education and training regarding sustainability
• Absorptive capacity development
• Facilitating knowledge-sharing
• More formal systems, procedures, rules, and routines
• Organisational learning promotion
• Fast decision-making processes
• Strong informal climates, flat organisational structures
• Flexibility and adaptability, less bureaucracy, quicker communication lines
• Smaller firms tend to be more involved
• Positive corporate culture
• Incentives and rewards
104
3.3 Main External Factors that Influences the Adoption of SPMS in SMEs
The characteristics of SMEs can vary; to give example, in geographical and socio-economic
differences (Bala and Feng, 2019; Ghazilla et al., 2015b; Kumar et al., 2018; Malesios, 2018).
Vietnamese cultural values and social beliefs are influenced by the introduction of Buddhism from
India, Confucianism, and Taoism from China (Kane et al., 2021). The fundamental virtues of
Vietnamese traditions are embedded within the four-syllable expression Tam cuong, Ngu thuong
(Three Bonds, Five Principles) in which the three bonds or relationships are Vua-Toi (king-
subject), Cha-Con (parent-child) and Chong-Vo (husband-wife), while the five principles includes
Nhan (benevolent love), Nghia (righteousness), Le (propriety), Tri (wisdom) and Tin (faithfulness)
(Nguyen, Bensemann and Kelly, 2018; p.3).
It is believed that individuals are strongly influenced by social and cultural forces and
environments around them (DiMaggio and Powell, 1983). Previous studies have shown that SME
sustainability engagement is influenced by the owners’ values, and religious beliefs (Hasan, 2016;
Lee, Herold and Yu, 2016; Mukherjee, 2019; Paterson, Specht and Duchon, 2013; Uygur, 2009).
Also, it is affected by their perceptions of duty, obligations and correct behaviour (Marrewijk and
Werre, 2002), ethical beliefs (Alniacik, Moumen and Alniacik, 2020; Shrestha, 2017) and
entrepreneurial orientations (Mukherjee, 2019). In some cases, employees’ attitudes, beliefs and
their relationships with the owner influence the business practices and CSR engagement of SMEs
(Chou, Chang and Han, 2016). This is an interesting issue and further research will help us
understand about how they affect the SPMS adoption in the Vietnamese SME setting.
From an institutional perspective, it is indicated that government support would be important for
motivating sustainability engagement among businesses. In the context of emerging economies
105
such as Vietnam, however, SMEs mostly experience barriers, such as a lack of economic
incentives and training programmes, and positive support from the government regarding
sustainability engagement (Pham, Yong and Truong, 2019). Prior studies have been conducted in
the context of Vietnam, highlighting institutional voids that include inefficient and bureaucratic
systems (Ha, Nam and Thanh, 2021; Quan, 2015), lack of clarity surrounding laws and regulations
and vague guidelines, all of which make it confusing and difficult for businesses to both apply and
comply (Nguyen and Pham, 2020). These external barriers can demotivate SMEs towards SPMS
adoption. Therefore, this thesis proposed that:
H6: External barriers have a significant and negative impact on the adoption of SPMS
3.4 Chapter Summary
This section has highlighted factors that influence SPMS adoption in the context of SMEs. The
literature review has highlighted consistent themes concerning the unique characteristics of SMEs.
This creates further knowledge as to which factors are enablers, or inhibitors, that influence
sustainability performance measurement among SMEs. The review of the literature thus leads to
three major conclusions;
1. The SPMS adoption in SMEs is a complex and challenging task, which frequently requires
an SME to effectively manage trade-offs in order to develop relevant capabilities that are
closely linked to specific motivations, conditions, organisational contexts and objectives
of each SME.
2. The implementation or adoption of sustainability measurement in SMEs needs to be
considered alongside critical factors such as inhibitors and enablers, relevant stakeholder
106
expectation and requirement in order that identification of appropriate sustainability
metrics can be introduced. At the organisational level, certain conditions must be presented
in terms of developing more formal structures, processes, procedures and information
systems for a successful SPMS adoption.
3. Organisational support in terms of top management commitment, involvement, and support
are the main priorities. However, other forms of support such as leadership, human
resource capital, knowledge acquisition and assimilation, knowledge-sharing and
organisational learning are also required for effective implementation.
4. Social-cultural environments, barriers, the institutional environment are all main external
factors that can influence SPMS adoption in the SME setting.
After having identified and discussed the main factors that influence the implementation of
sustainability performance of SMEs, the next chapter identifies appropriate sustainability metrics,
from the literature, that can be applicable for SMEs.

107

108
CHAPTER 4 IDENTIFICATION OF SUSTAINABILITY METRICS FOR
SMEs
4.1 Introduction
As stated in Chapter 1, the main purpose of this chapter is to examine sustainability performance
measurement issues with regard to the identification of sustainability metrics that SMEs could
employ to measure their sustainability performance. The objectives of the chapter are outlined in
Table 4.1, along with the sections of the chapter that will deal with each objective.
Table 4.1 Objectives of Chapter 4
Objective Section
1 - To highlight main characteristics and desirable requirements of
sustainability metrics
4.2
2 - To highlight approaches and methodologies used for identifying and
defining sustainability metrics
4.3
3 - To propose a preliminary set of sustainability metrics 4.4
4 - To propose the theoretical research framework 4.5
The following section presents an overview of sustainability performance measurement.

109
4.2 Main Characteristics and Desirable Requirements of Sustainability Metrics that
Relate to the SME Setting
It has been priorly highlighted that developing sustainability performance measurement for SMEs
is an important but challenging task (Rosen and Kishawy, 2012). Considering the unique
characteristics of SMEs, scholars have suggested that a straightforward structure of sustainability
metrics/indicators would be suitable (Feil, de Quevedo and Schreiber, 2015; Nigri and Baldo,
2018; Sousa and Aspinwall, 2010).
There has been little discussion about key characteristics of sustainability metrics and indicators
in the context of SMEs (Fatimah and Aman, 2018; Hsu, Chang and Luo, 2017). This section,
therefore, will discuss the main characteristics of sustainability metrics in relation to the SME
setting and will aim to achieve a comprehensive understanding of the subject matter in order to
select identifying appropriate key characteristics and indicators for them.
In relation to the discussion in section 2.2, as to the benefits of a metrics, it is important to
acknowledge that the term ‘metric’ is interchangeably used with ‘indicator’ within discussions and
research surrounding sustainability performance measurement. Both terms refer to the assessment
of the progress made by a company endeavouring to promote sustainable development, both
internally and externally, over a given period of time (Székely and Knirsch, 2005; Brandi, Daroda
and Olinto, 2014; Cohen et al., 2014; Ahi and Searcy, 2015; Gustafson et al., 2016).
In line with the above reasoning, such an interchangeable use, if not clearly clarified, might lead
to confusion within the SME, as these organisations often have a limited knowledge of
sustainability performance measurement (Aragón-Correa et al., 2008; Mengistu and Panizzolo,
110
2021). This might result in ineffectiveness when trying to obtain a clear and concise picture of
their sustainability performance. Technically, a ‘metric’ and an ‘indicator’ are different; an
indicator is a parameter that provides information about a state while a metric is a measurable
quantity that is used to track an indicator (Ahmad, Wong and Rajoo, 2019). An indicator can be
used more broadly, encompassing quantitative measurements and critical aspects that need to be
managed, whilst a metric is almost always used solely to refer to quantitative or semi-quantitative
measures, or indices (Tanzil and Beloff, 2006).
Considering this, it is important that the terms ‘metric’ and ‘indicator’ are used together due to
each of their critical functions; they can respectively complement each other (Brandi, Daroda and
Olinto, 2014) and taking this approach can be both more practical and favourable for SMEs. More
specifically, the critical function of a ‘metric’ enables SMEs to navigate and pinpoint their
objectives of measuring sustainability performance, which is closely linked to their short-term and
long-term strategies. SMEs then can utilise flexibility, one of their key strengths, to select
appropriate indicators, or even to efficiently adapt to apply a new indicator whenever necessary.
It benefits the SME to effectively manage trade-offs in a more integrated way, considering each
one’s individual condition and contextual factors that may unexpectedly arise from both internal
and external environments, or from the expectations or requirements of relevant stakeholders. Such
situations, as already discussed, are varied from one to another and differ from one company to
the next.
The above gives explanation of why the term ‘metric’ and ‘indicator’ are interchangeably used
throughout the current study in order to help define appropriate sustainability metrics for SMEs.

111
It is of vital importance to highlight that sustainability metrics can be categorised into two classes:
leading and lagging metrics. Leading metrics track the activities that occur before the impact, and
they affect future performance, while lagging metrics only reflect outputs (including those which
are recent) and are reported after an impact occurs (Tanzil and Beloff, 2006). It appears that a
combination of these metrics can be more effective than relying solely on lagging or leading
metrics, because lagging metrics without leading metrics would not indicate the output (Székely
and Knirsch, 2005). In other words, a leading metric can inform top managers of how they might
achieve the desired outcomes of sustainability performance, while a lagging metric measures the
current sustainability performance.
Despite leading metrics and lagging metrics being opposed, from a managerial perspective each
can complement the other; a leading metric can be dynamic but hard to measure, a lagging
indicator is easy to measure but difficult to change. Perhaps, the adoption of SPMS can be a long
and complex process and from this viewpoint, the use of leading metrics (past results and future-
oriented) can help SMEs to mitigate some their significant weaknesses. They includes, for
instance, firefighting management style (Ates and Bititci, 2011) and short term orientation (Li and
Rees, 2020). And no less importantly, lagging metrics provide ‘current’ results, which likely
support SMEs in effectively managing their trade-offs and using resources in a much more
efficient and effective manner (Horisch, Johnson and Schaltegger, 2015). Accordingly, a
combination of leading and lagging metrics can benefit SMEs in terms of formulating corporate
strategy and planning (discussed section 3.2.2.2).
A metric can also be classified differently according to how an item is defined and measured. For
example, a positive or a negative metric, or sometimes a combination of both, is used to measure
112
a single item (Schwarz et al., 2002; Antolín-López et al., 2016); the Global Reporting Initiative
(GRI) denotes the item “energy” as “total energy consumption”, a negative metric; and “reduction
of energy consumption”, a positive metric (Global Reporting Initiative, 2015). This reflects the
fact that a negative metric follows the rule that “lower is better”, while a positive metric indicates
that “higher is better” (Schwarz et al., 2002). However, a set of metrics that cover both positive
and negative values might be driven by the differing concerns of stakeholder groups (Antolín-
López et al., 2016) resulting in difficulties and confusion (Delmas and Blass, 2010; Minor and
Morgan, 2011) and thus exacerbating the difficulties faced by SMEs with regard to their resource
constraints, insufficient knowledge and a lack of skills with which to operationalise such a metric
(Arena and Azzone, 2012). As discussed, SMEs often have what is termed as ‘simple’
stakeholders, normally comprising employees and key customers. Thus, a metric with either a
positive or a negative value can be more effective than using a combination in a metric, which
likely creates more confusion for SMEs.
With respect to the verifiable measure of a metric, research indicates that it can be stated in either
qualitative or quantitative forms, when compared to a reference point (Azapagic and Perdan, 2000;
Melnyk, Stewart and Swink, 2004). A quantitative metric illustrates values in a numerical form,
while a qualitative metric captures outputs in a nominal form (Melnyk, Stewart and Swink, 2004).
Quantitative metrics are mainly used to measure economic and environmental impacts, which are
well suited to a positivist approach. Hence, the effects of these two components are potentially
quantifiable (Ahi and Searcy, 2015; Sridhar and Jones, 2013). By comparison, a relatively high
number of qualitative metrics are employed to measure social impacts through a TBL perspective,
and this requires a more interpretivist approach. As Norman and Macdonald (2004) claim, a social
metric can be quantified into a single number using various formulae for any company. Despite
113
the fact that it can be treated as either qualitative or quantitative (Garbie, 2016), the latter is
believed to more practical and favourable (Lundin, 2002). It appears that a metric in quantitative
form is more likely to be beneficial in terms of quantifying sustainablity outcomes.
Most metrics can be categorised as either absolute or relative. An absolute metric “expresses
operational performance in terms of what overall levels of performance are in specific areas of
interest (e.g., water use) for an organization as a whole” (McElroy and van Engelen, 2012, p. 62).
By comparison, a relative metric expresses “operational performance in terms of how performance
in one area (e.g., water use) correlates to performance in another area (e.g. revenue or total
production)” (McElroy and van Engelen, 2012, p. 63). Compared to a relative metric, an absolute
metric might be not more favourable since they are limited in providing meaningful measurements
that help a company to make changes in an enhanced scientific manner. It is important to note that
absolute metrics are often “result-oriented measures, and ratio indicators are more suitable for
internal decision-making” (Delai and Takahashi, 2013; p.438). Therefore, relative metrics
comprising comparative data can be much easier for SMEs to read and understand than absolute
metrics using absolute data (Garengo, Biazzo and Bititci, 2005).
Research in this area also generally focuses on unique characteristics; for example, the limited
resources and capacities of SMEs to develop sustainability metrics. The research has placed great
emphasis on the issues of needing to be less expensive, needing to be more efficient in terms of
sustainability performance measurement, the importance of quick implementation and its
simplicity and ease of use (Arena and Azzone, 2012; Borga et al., 2009; Feil, de Quevedo and
Schreiber, 2015; Mengistu and Panizzolo, 2021; Neri et al., 2021). It needs be a set of metrics that
114
SMEs can manage in order to capture their essential needs, rather than addressing a wide range of
issues (Arena and Azzone, 2012; Van Passel et al., 2007).
A large and rich set of metrics can cover several aspects of sustainability (Melnyk, Stewart and
Swink, 2004), but it likely raises the operating costs of the SME and threatens their economic
viability (McIntyre, 2001), which consequently limit their applicability (Martins et al., 2007).
Another example of a large, impractical set of metric is that it can make it nearly impossible for
the SME to collect and process a large amount of data (Garengo, Biazzo and Bititci, 2005).
Therefore, a balanced set of metrics needs to be developed for SMEs that is both systematic and
straightforward (Sousa and Aspinwall, 2010) and will also ensure that the correct issues are
measured that the proper outcomes may be obtained. (Lenzen et al., 2004; Morioka and de
Carvalho, 2016; Searcy, 2016). It can be further argued that the measures should be grouped in a
fashion that makes them more comfortable to use, interpret and understand (Singh, Olugu and
Fallahpour, 2014). In doing this, confidence within the SMEs can be increased, as they are often
described as lacking sustainability knowledge and skills needed to fully understand and effectively
measure their sustainability performance.
Some scholars, rather than proposing a sustainability management tool for SMEs, prefer to provide
valuable criteria for developing such a tool. For example, Johnson and Schaltegger (2016) have
reviewed various publications on sustainability management tools over the past two decades. They
have analysed both the internal shortcomings and external deficiencies of SMEs to understand why
such tools seemingly have less value and are therefore not implemented within SMEs (Johnson
and Schaltegger, 2016). Johnson and Schaltegger (2016) have provided six criteria that any
sustainability management tool should fulfil in order to increase their widespread acceptance and
115
application within SMEs. These six criteria, proposed by Johnson and Schaltegger (2016) can be
useful in guiding the identification of appropriate sustainability metrics for SMEs and they are as
follows:
1. Simplicity/User-friendliness: The SMEs organisational structure, process and routine is
quite simple and informal. This could motivate top managers to accept metrics into their
organisation and employees can be encouraged to use it with less resistance.
2. Practicality/Cost-effectiveness: this makes it more affordable for SMEs, who have finite
financial resources, to adopt metrics and also helps the SME to avoid the threat to their
economic viability.
3. Adaptability/Flexibility: this enables SMEs to utilise their flexibility to be both select and
well prepared to change to a new indicator whenever necessary.
4. Company-tailored: this is crucial because it likely increases the applicability among SMEs
and makes it less likely that their operating costs will rise.
5. Locally focused: this is vital, because SMEs often operate locally (Schlierer et al., 2012)
and become embedded in the very fabric of their local community (Choi, Kim and Yang,
2018). This can help them instil better communications and effective interaction with local
communities. Knowledge and information accumulated throughout can support SMEs in
order that they will make more accurate decisions, thus increasing their legitimacy, and
helping them to gain and maintain approval from local stakeholders (Perrini and Tencati,
2006). This, in turn, will aid the SME to develop their stakeholder management capability.
6. Group and network-oriented: this can benefit the SME that they may develop absorptive
capability, organisational learning capabilities and networking capability.
116
The above discussion has led to the following information, supported by Joung et al. (2013), whose
work has helped with regard to avoiding a certain degree of overlap that characterises most of the
reviewed literature. The general desirable requirements of sustainability metrics that can facilitate
SPMS adoption within the SME setting are proposed below:
1. Measurable: a metric can be measured in quantitative or qualitative means; whichever
mean is proposed, it needs to be, firstly, simple so as to measure within a given timeframe
and, secondly, convenient for data collection and evaluation purposes.
2. Relevant: a metric needs to be meaningful, purposeful and directly relevant to the
sustainability goal objectives of the SME, from which they have an opportunity to
formalise their strategy, as well as mitigate potential challenges of organisational
alignment.
3. Understandable: It is crucial that a metric can be easily understood and consistently
interpreted by relevant stakeholders. Within the organisation, this can contribute to the
SMEs employee engagement enhancement, the effective information/knowledge sharing
process and organisation learning capability development, all of which subsequently
facilitate the SPMS adoption.
4. Reliable/usable: It is vital that a metric must contain reliable, trusted and accurate
information for the purposes of management, who must communicate these requirements,
expectations or needs of relevant stakeholders. This can lead to company image and
reputation enhancement, which consequently creates and develops marketing capabilities.

117
5. Data accessible: an indicator must be based on data and information that can be easily
accessed and acquired within the organisational process, which aims at avoiding placing
more pressure upon the SMEs limited resources in terms of human resources and time.
6. Timely manner: data and information collection, calculation and evaluation for an indicator
must be conducted promptly for informed decision-making. This is an important tool with
which to encourage the top managers within SMEs to adopt SPMS within their
organisation.
7. Long term-oriented: It is beneficial that an indicator must ensure its future use,
development, and adoption, which enable SMEs to link with a formulation of a more formal
long-term sustainability perspective.
Furthermore, in order to ensure that a sustainability metric/indicator to be a rigorously applied in
the SME setting and to promote better understanding of the adoption of SPMS. This necessitate a
need that it is closely linked with the following attributes.
1. Identification (ID): the unique alphanumeric identifier of an indicator.
2. Name: the word(s) for an indicator's distinctive designation.
3. Definition: a statement expressing the essential characteristics and function of an indicator
4. Measurement type: the type of indicator (quantitative or qualitative), how an indicator is
calculated, whether to use the total amount or per unit of product other factors to normalise
the performance
5. Unit of measure: the metric used to illustrate an indicator (kilograms, kilowatts, tons,
monetary units, times, ratio, days, etc.).
118
6. References: citable documents of existing indicator set(s) or specific indicator(s) based on
whether an indicator is adopted from existing set(s) or is newly developed.
7. Application level: the hierarchical level of the organisation at which the indicator is
applied. Based on this information, decision-makers can set up their sustainability metrics
that are closely linked to business strategies.
8. Period of measurement: the suitable use of duration and metrics (fiscal year, six months,
quarter, month, etc.) for tracking and calculating.
Holistically, the above discussion highlights the importance of a comprehensive understanding
about the main characteristics of a sustainability metric/indicator that significantly contributes to
defining appropriate metrics for SMEs in order that they may measure and better manage their
sustainability performance. To this end, it can be argued that if the above established desirable
requirements of sustainably metrics/indicators are met it can help SMEs mitigate their weaknesses
regarding unplanned, informal processes, policy, rule, routine, procedure and structure, all of
which have been previously discussed. Hence, it is expected that these can contribute to motivating
SMEs towards SPMS adoption.
The following section discusses approaches and methodologies used for identifying and defining
metrics.
4.3 Approaches and the Methodologies Used for Identifying and Defining Metrics
Drawing upon an early book written by Noss and Cooperrider (1994) on protecting and restoring
biodiversity, Virginia and Suzanne (2001, p. 5) cites that “if wrong indicators were chosen… [this]
results in the wrong variables being measured, in the wrong place, at the wrong time, or with poor
119
precision or reliability.” This section therefore discusses approaches and methodologies used in
identifying and defining sustainability metrics in the context of SMEs.
Existing literature reveals that due to disparate research purposes, many researchers have had a
different focus when developing sustainability metrics/indicators for SMEs. For example, some
have concentrated on all three pillars of the TBL (Borga et al., 2009; Neri et al., 2021), while
others (e.g. Arena and Azzone, 2012) have looked at specific aspects of the development, such as
social and environmental.
In terms of business sectors, Tan et al. (2015) address Singaporean manufacturing SMEs, while
Feil, de Quevedo and Schreiber (2015) address Brazilian SMEs in furniture segments. Having
focused their research at an industry-level, some scholars (e.g. Arena and Azzone, 2012; Mengistu
and Panizzolo, 2021) have agreed that the development of sustainability indicators needs to link
to the currently available knowledge regarding sustainability performance measurement of that
specific industry; this enables SMEs to take advantage of a significant body of validated
knowledge without spending precious time and resources.
In terms of geographic areas, existing literature has highlighted that research has been conducted
in both developed countries such as Italy (e.g. Arena and Azzone, 2012), Singapore (e.g. Tan et
al., 2015) and developing countries such as India (e.g. Singh, Olugu and Fallahpour, 2014).
Despite this, there is a call for more research that will identify appropriate sustainability metrics
in order to support SMEs in the context of developing nations, as mentioned in section 1.2.
It is clear from previous research undertaken that different sources of referencing and methods
have been employed to develop sustainability metrics/indicators for SMEs. Many (e.g.

120
Kocmanova and Docekalova, 2011; Li et al., 2012) have derived sustainability indicators from
internationally recognised indexes such as the Global Reporting Initiative (GRI). Others (e.g. Feil,
de Quevedo and Schreiber, 2015; Hsu, Chang and Luo, 2017) have relied mainly on existing
scientific articles, while some (e.g. Singh, Olugu and Fallahpour, 2014) have used both
internationally recognised indexes and previous scientific articles. At the time of writing this (May
2021), a work had just been published in which Mengistu and Panizzolo (2021) initially carried
out a content analysis and obtained a list of the 1013 indicators that are the most consistent and
frequently used within the literature. Mengistu and Panizzolo (2021) applied the fuzzy Delphi
method to analyse these indicators and eventually obtained a set of 24 sustainability indicators that
could be utilised for Italian footwear SMEs. This reflects why there have been no universally
accepted specific standards/guidelines, or objective weighting methods for assigning sustainability
metrics or indicators (Brandi, Daroda and Olinto, 2014; Laskar and Maji, 2016; Shuaib et al.,
2014).
The literature on sustainability measurement offers two broad methodological paradigms that can
be used to identify and define sustainability indicators; the top-down and bottom-up approaches
(Bell and Morse, 2001). The top-down approach is also called ‘expert-led’. With this approach,
experts or researchers have strong control with regard to developing frameworks and selecting a
set of sustainability metrics based on literature reviews (Miller, 2001; Chee Tahir and Darton,
2010). Experts mainly rely on their knowledge and experience to define sustainability metrics.
This approach, however, might trigger a selection bias since end-users do not define sustainability
metrics (Lundin, 2002). It is generally agreed that a good understanding of the local context
regarding sustainability priorities is essential in order that sustainability metrics to fit a local
situation may be applied. (Warhurst, 2002; Reed et al., 2006; Lundin, 2002; Turcu, 2013; Lähtinen

121
et al., 2014). Prior studies employing this approach to identify sustainability metrics/indicators for
SMEs can be found in the existing literature (e.g. Feil, de Quevedo and Schreiber, 2015; Hsu,
Chang and Luo, 2017).
In contrast to the top-down approach is the bottom-up approach, or community-based approach.
By using this approach, sustainability metrics are identified by local stakeholders who understand,
and have the ability to communicate common interests or conflicts about a specific issue related
to sustainability, within the local context (Chee Tahir and Darton, 2010). This method has been
described as having less consistent structure and deems that it gives researchers less control over
defining sustainability metrics. As such it often requires a vital facilitation skill to capture multiple
views (Kurka and Blackwood, 2013; Turcu, 2013) to achieve a reliable, comprehensive picture of
a phenomenon (Reed et al., 2006; Mitchell, 1996; Lundin, 2002; Schmidt et al., 2006; Roberts,
2011). It has also been criticised for being time consuming and costly (Lundin, 2002) and despite
the fact that multiple local views on sustainability can be obtained, the bottom-up approach may
not ensure that critical global issues are captured (Reed et al., 2006).
Theoretically, each top-down and bottom-up as mentioned above, has both different vulnerabilities
and different strengths. Therefore, a combination has been considered a major advantage in order
to obtain a complementary (Khadka and Vacik, 2012; Turcu, 2013). For this purpose, the use of
top-down and bottom-up approaches in a mixed manner to define sustainability metrics/indicators
have been suggested by a number of scholars (Feil, de Quevedo and Schreiber, 2015; Neri et al.,
2021).
Considering the above discussion, a mixed approach is best suited for use within the current study
in order to obtain the research objectives that are set out in section 1.5. This means that the process

122
is guided by a top-down approach that identify sustainability metrics from the literature, followed
by a bottom-up approach to verify those metrics obtained from the literature by practitioners within
SMEs.
The following section discusses the proposing a preliminary set of sustainability metrics for SMEs.
4.4 The Proposing a Preliminary Set of Sustainability Metrics for SMEs
In relation to the discussion in the previous section, as initially guided by the top-down approach,
the current study begins with identifying and defining sustainability metrics from the literature. It
is vital to acknowledge that each set of sustainability indicators contains hidden subjective
assumptions and simplifications (Van Passel et al., 2007), reflecting different theoretical
understandings (Schneider and Meins, 2012) and demonstrating the varying concerns regarding
sustainability issues (Wilson et al., 2007). As such, there is no one-size-fits-all set of sustainability
metrics (Virginia and Suzanne, 2001; Montiel et al., 2014) since none can "tackle all sustainability
issues, and in fact, there is no consensus around what should be measured and how" (Delai and
Takahashi, 2013, p. 467).
The existing literature reveals that sustainability metrics and indicators are vastly numerous
(Martins et al., 2007; Mengistu and Panizzolo, 2021), making it difficult and challenging to define
and select an appropriate set of metrics. A practical approach for the current study is to base on
prior studies and the work of international organisations, in which sustainability metrics/indicators
that can be applicable for SMEs have been filtered. In this way, the current study can obtain a
preliminary set of metrics for SMEs; they need not `reinvent the wheel' when such solutions are
made available (Tan et al., 2015).
123
Drawing on the all the discussions so far, this leads to the selection and identification of SMEs for
the current study. Regarding scientific articles, the current study is based on ten works, which have
focused on developing sustainability metrics for SMEs. In terms of number, it is relatively higher
than some previous studies; for example, the work of Singh et al. (2015), who based their studies
upon six scientific articles regarding the development of sustainability metrics for Indian
manufacturing SMEs. The ten scientific articles employed by the current study are the works of
Kocmanova and Docekalova (2011); Li et al. (2012); Singh, Olugu and Fallahpour (2014); Feil,
de Quevedo and Schreiber (2015); Tan et al. (2015); Arena and Azzone (2012); Borga et al.
(2009); Hsu, Chang and Luo (2017); Neri et al. (2021); and Mengistu and Panizzolo (2021). These
articles are summarised in Table 4.2 below.
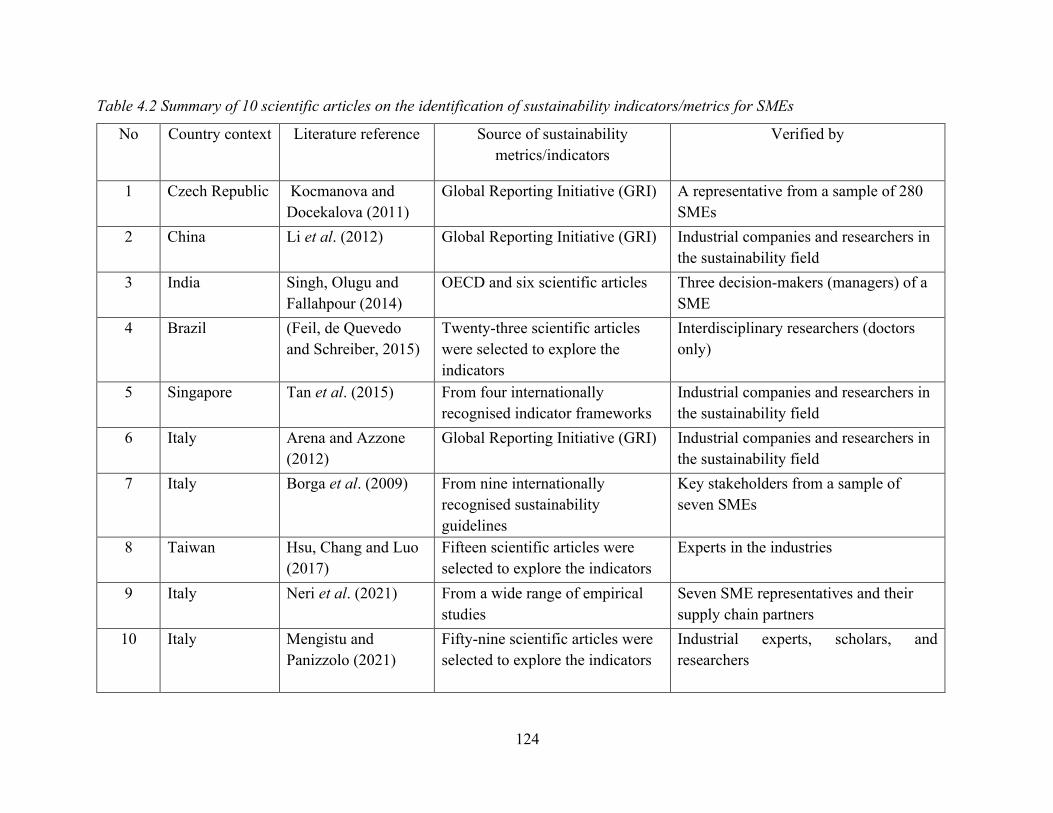
124
Table 4.2 Summary of 10 scientific articles on the identification of sustainability indicators/metrics for SMEs
No Country context Literature reference Source of sustainability metrics/indicators
Verified by
1 Czech Republic Kocmanova and Docekalova (2011)
Global Reporting Initiative (GRI) A representative from a sample of 280 SMEs
2 China Li et al. (2012) Global Reporting Initiative (GRI) Industrial companies and researchers in the sustainability field
3 India Singh, Olugu and Fallahpour (2014)
OECD and six scientific articles Three decision-makers (managers) of a SME
4 Brazil (Feil, de Quevedo and Schreiber, 2015)
Twenty-three scientific articles were selected to explore the indicators
Interdisciplinary researchers (doctors only)
5 Singapore Tan et al. (2015) From four internationally recognised indicator frameworks
Industrial companies and researchers in the sustainability field
6 Italy Arena and Azzone (2012)
Global Reporting Initiative (GRI) Industrial companies and researchers in the sustainability field
7 Italy Borga et al. (2009) From nine internationally recognised sustainability guidelines
Key stakeholders from a sample of seven SMEs
8 Taiwan Hsu, Chang and Luo (2017)
Fifteen scientific articles were selected to explore the indicators
Experts in the industries
9 Italy Neri et al. (2021) From a wide range of empirical studies
Seven SME representatives and their supply chain partners
10 Italy Mengistu and Panizzolo (2021)
Fifty-nine scientific articles were selected to explore the indicators
Industrial experts, scholars, and researchers
125
It is worth mentioning that among the popular sustainability indexes, the Global Reporting
Initiative (GRI) is employed in the current study; this can serve as a benchmark within the selected
scientific articles that define sustainability indicators for SMEs. It is employed because the GRI
framework has been widely used globally (Manning, Braam and Reimsbach, 2019) in both
developed and developing countries (Laskar and Maji, 2016; Nguyen et al., 2020). It is sponsored
by the United Nations (Gates and Germain, 2010) for the purpose of developing a most
comprehensive framework with reference to sustainability reporting. The GRI provides a list of
over 90 measures of company sustainability indicators which cover all three pillars of the TBL,
including economic, social, and environmental aspects (Ahi and Searcy, 2015; Fatimah and Aman,
2018; Global Reporting Initiative, 2015).
Despite the GRI guidelines often being viewed as more suitable for large corporations (Azapagic,
2004; Steinhofel et al., 2019), they can be applied to corporations of different sizes and locations
(Sridhar and Jones, 2013). They have proved to be an useful framework that SMEs can utilise both
as a starting point that they may produce a preliminary set of key sustainability indicators (Arena
and Azzone, 2012) and also as a tool to enable them to effectively align their objectives concerning
sustainability issues (Massa, Farneti and Scappini, 2015). Previous studies have shown that in
developing countries such as Sri Lanka, the GRI framework can promote clarity, accuracy,
usefulness and comparability with respect to sustainability reporting within the country’s SMEs
(e.g. Dissanayake, Tilt and Xydias-Lobo, 2016). This is also closely linked to the research context
of the current study, Vietnam, where, in 2017, the Vietnam Chamber of Commerce and Industry
(VCCI) and the GRI organisation launched the Vietnamese version of the GRI guidelines in order
to encourage Vietnamese firms to use this reporting framework to both strengthen their credibility
and contribute to promoting the green capital market (vietnamnews.vn; 2017). Taken together, the

126
main sources of identification of sustainability metrics for SMEs include ten scientific articles and
the GRI framework, which are presented in Table4.3.
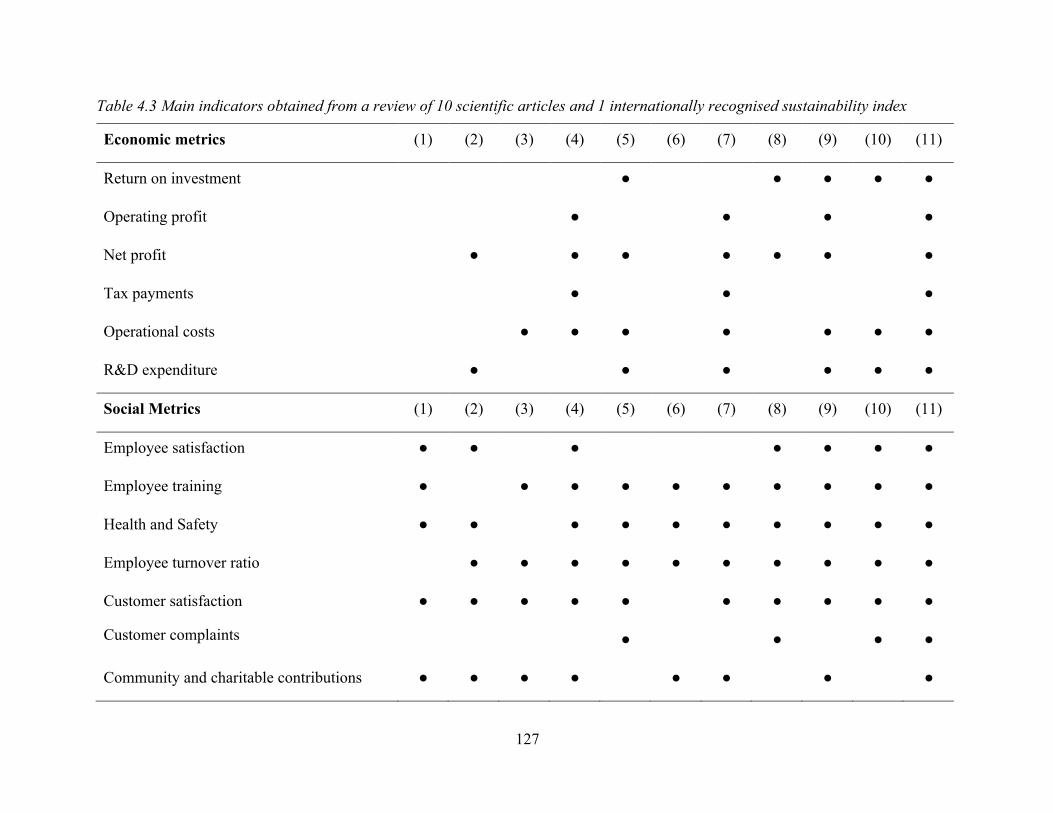
127
Table 4.3 Main indicators obtained from a review of 10 scientific articles and 1 internationally recognised sustainability index
Economic metrics (1) (2) (3) (4) (5) (6) (7) (8) (9) (10) (11)
Return on investment ● ● ● ● ●
Operating profit ● ● ● ●
Net profit ● ● ● ● ● ● ●
Tax payments ● ● ●
Operational costs ● ● ● ● ● ● ●
R&D expenditure ● ● ● ● ● ●
Social Metrics (1) (2) (3) (4) (5) (6) (7) (8) (9) (10) (11)
Employee satisfaction ● ● ● ● ● ● ●
Employee training ● ● ● ● ● ● ● ● ● ●
Health and Safety ● ● ● ● ● ● ● ● ● ●
Employee turnover ratio ● ● ● ● ● ● ● ● ● ●
Customer satisfaction ● ● ● ● ● ● ● ● ● ●
Customer complaints ● ● ● ●
Community and charitable contributions ● ● ● ● ● ● ● ●
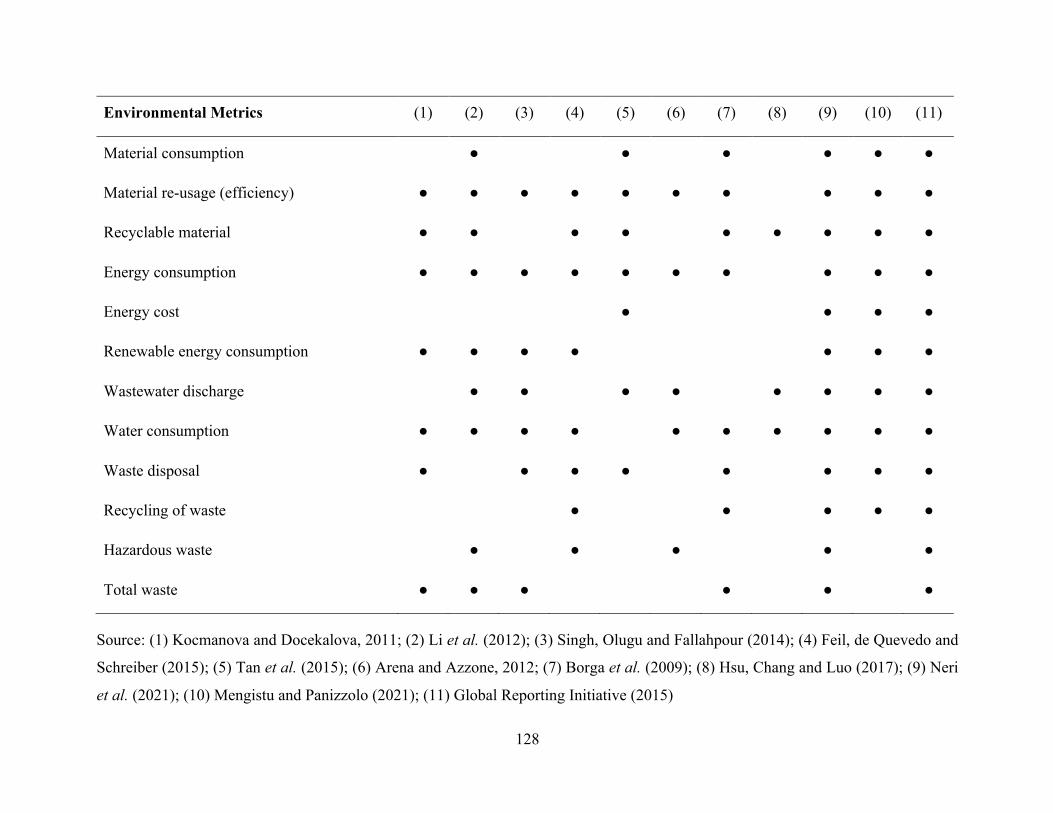
128
Environmental Metrics (1) (2) (3) (4) (5) (6) (7) (8) (9) (10) (11)
Material consumption ● ● ● ● ● ●
Material re-usage (efficiency) ● ● ● ● ● ● ● ● ● ●
Recyclable material ● ● ● ● ● ● ● ● ●
Energy consumption ● ● ● ● ● ● ● ● ● ●
Energy cost ● ● ● ●
Renewable energy consumption ● ● ● ● ● ● ●
Wastewater discharge ● ● ● ● ● ● ● ●
Water consumption ● ● ● ● ● ● ● ● ● ●
Waste disposal ● ● ● ● ● ● ● ●
Recycling of waste ● ● ● ● ●
Hazardous waste ● ● ● ● ●
Total waste ● ● ● ● ● ●
Source: (1) Kocmanova and Docekalova, 2011; (2) Li et al. (2012); (3) Singh, Olugu and Fallahpour (2014); (4) Feil, de Quevedo and
Schreiber (2015); (5) Tan et al. (2015); (6) Arena and Azzone, 2012; (7) Borga et al. (2009); (8) Hsu, Chang and Luo (2017); (9) Neri
et al. (2021); (10) Mengistu and Panizzolo (2021); (11) Global Reporting Initiative (2015)
129
As mentioned during previous sections, there has been neither a universally accepted specific
standard/guideline, nor has there been an objective for selecting sustainability metrics, while the
scope of the measuring of sustainability performance has been widened, as discussed in section
2.3. Such a challenge can give rise to potential subjectivity and bias during the process of defining
sustainability metrics and this consequently leads to results that are both unreliable and misleading.
To address this problem, a practical approach is to narrow down the scope of each pillar of the
TBL, while simultaneously ensuring that essential components of each, which have been discussed
in section 2.3, are covered. Following this approach, the sources of sustainability metrics are
narrowed down as illustrated in Table 4.3. Accordingly, the current study identifies a set of 26
potential sustainability metrics/indicators (6 for economic, 12 for environmental, and 8 for social
dimensions), which can be applicable to the SME. These cover key aspects of economy;
(profitability, investment); social (employee, customer, and community well-being); and
environmental domains (material, energy, water, waste), as presented in Table 4.4.
The current study identifies from the literature a set of 26 potential sustainability metrics/indicators
(6 for economic, 12 for environmental, and 8 for social dimensions) that can be applicable to the
SME. Such a number is closely linked to the recommendation of Garengo, Biazzo and Bititci
(2005), who suggest that a set of metrics for SMEs should not be any larger than 25 in total, in
order that they are suitable for managers to apply; managers often lack time and managerial skills
in this regard. Other studies (e.g. Trianni et al., 2019; Neri et al., 2021) propose a relatively
flexible, wider range of 20 to 40 sustainability metrics/indicators. As discussed throughout the
current study, this can be associated both with a need for SMEs to be flexible, which is one of their
strengths, and also with the preparation needed in order that they might change their metrics

130
whenever necessary; this enables the SPMS adoption to happen efficiently and effectively
(Queiroz et al., 2020). 317
Table 4.4 The preliminary list of sustainability metrics identified from the literature focusing on
SMEs
Economic Indicators
Profitability Return on investment
Operating profit
Net profit
Tax payments
Operational costs
Investment R&D expenditure
Social Indicators
Employee wellbeing Employee turnover rate
Employee job satisfaction rate
Employee training
Health and safety in the workplace
Customer wellbeing Customer satisfaction
Customer complaints
Community wellbeing Charities and donations
Community involvement
Environment Indicators
Material Material consumption
Raw material efficiency
Recyclable raw materials
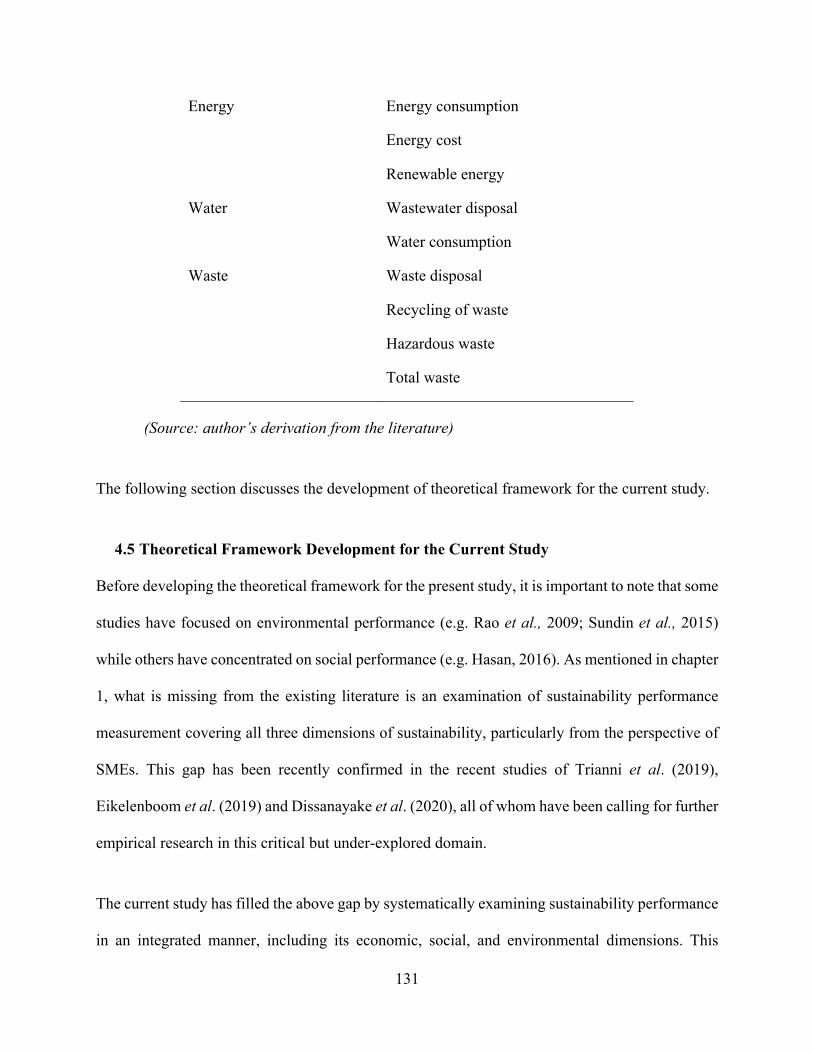
131
Energy Energy consumption
Energy cost
Renewable energy
Water Wastewater disposal
Water consumption
Waste Waste disposal
Recycling of waste
Hazardous waste
Total waste
(Source: author’s derivation from the literature)
The following section discusses the development of theoretical framework for the current study.
4.5 Theoretical Framework Development for the Current Study
Before developing the theoretical framework for the present study, it is important to note that some
studies have focused on environmental performance (e.g. Rao et al., 2009; Sundin et al., 2015)
while others have concentrated on social performance (e.g. Hasan, 2016). As mentioned in chapter
1, what is missing from the existing literature is an examination of sustainability performance
measurement covering all three dimensions of sustainability, particularly from the perspective of
SMEs. This gap has been recently confirmed in the recent studies of Trianni et al. (2019),
Eikelenboom et al. (2019) and Dissanayake et al. (2020), all of whom have been calling for further
empirical research in this critical but under-explored domain.
The current study has filled the above gap by systematically examining sustainability performance
in an integrated manner, including its economic, social, and environmental dimensions. This
132
approach was imperative for obtaining a finer understanding of how the three sustainability
performances can be integrated and balanced in business practice. Therefore, in the current study,
the level of SPMS adoption was measured by the perceived sustainability metrics (PSE). Identified
from the literature and presented in Tables 4.3 and 4.4, these metrics were valued and scored by
the Vietnamese SMEs.
The current study focuses on inhibitors (INH), comprising ‘low managerial perception’ and
‘internal shortcomings’, as main barriers, and this has been widely cited in the existing literature,
and hinders the SMEs implementation of sustainability initiatives. While external barriers (EXB)
are focused, particularly in the context of developing countries, because these can demotivate
SMEs to adopt SPMS.
Motivation (MOT) is focused, as it is one of the best predictors of driving the SPMS adoption,
and, with the support of top management (TOP) it is recognised as vital for the successful adoption
of SPMS. Moreover, the current study focuses on absorptive capacity (ACA) and organisation
learning capacity (OLC), among others, because prior studies have considered these as two key
capabilities within a company. More importantly, these two capacities enable SMEs to improve
their sustainability-related knowledge at a low cost (Eikelenboom and de Jong, 2019; Johnson,
2017) and this is crucial for SMEs to mitigate their inherited resource constraints in order to
effectively adopt SPMS.
Based on the discussion thus far, the current study developed a theoretical framework that
examined the relationships between factors that influence SPMS adoption in Vietnamese SMEs.
In the theoretical framework that was quantitatively tested, six factors were employed as
independent variables: Motivation (MOT), Inhibitors (INH), Top Management Support (TOP),
133
Absorptive Capacity (ACA), Organisation Learning Capacity (OLC), and External Barriers
(EXB), while Perceived Sustainability Metrics (PSE) was the dependent variable.
Individual and firm characteristics as moderators
Most of the literature places a strong emphasis on the influence of both individual and firm
characteristics in the engagement of sustainability initiatives (Ayuso and Navarrete-Báez, 2018;
Tur-Porcar, Roig-Tierno and Mestre, 2018; Yu and Ramanathan, 2016; Yu et al., 2018). For
example, prior studies (e.g., Nguyen and Tran, 2020; Tran and Pham, 2020) have investigated
demographic factors such as gender, age, experience, and managerial position to ascertain whether
these have a considerable impact on the sustainability performance of Vietnamese SMEs. Other
researchers (e.g., Johnson, 2017; Panwar et al., 2016) have studied the effects of firm
characteristics, such as firm size, firm age, business sector type, and firm sustainability experience
on sustainability engagement in SMEs. The literature reveals that in quantitative studies, individual
and firm characteristics can be added as either control variables (CVs) or moderating variables
(MVs) in theoretical models. This enhances the ability of researchers to explain and draw
conclusions about the relationships between independent variables (IVs) and dependent variables
(DVs) (Jablin and Putnam, 2001).
However, the functions of CVs and DVs have often been confused (Baron and Kenny, 1986); thus,
an understanding of their significant differences is crucial for attaining research objectives and
ensuring the reliability of findings. A distinguishing feature of CVs is that they are considered
extraneous variables: they are not part of the hypotheses and theories being tested (Mullen, Budeva
and Doney, 2009; Spector and Brannick, 2011) but still have theoretical importance (Kucharska
and Kowalczyk, 2019; Nielsen and Raswant, 2018). The role of CVs, as such, is assumed: “to be
134
confounding, that is, producing distortions in observed relationships. When using CVs means that
“researchers clearly delineate some variables as being merely controls or variables of no particular
theoretical interest that need to be somehow removed in their effects on the study” (Spector and
Brannick, 2011, p. 288). Accordingly, the effect of CVs will not be present when a researcher is
analysing the relationship between IVs and DVs. Conversely, MVs are those variables that act as
a catalyst in a regression relationship, where they interact with the IVs either to diminish or
enhance the relationship between the IVs and DVs (Baron and Kenny, 1986). In other words, the
presence of a moderator may change the original relationship between DVs and IVs (Sekaran and
Bougie, 2016).
Previous studies have employed certain individuals and firm characteristics as CVs to control their
effects on the hypotheses being tested. For example, when studying the factors influencing SMEs’
social and environmental performance, Arend (2014) controlled common firm characteristics such
as age, size, resources, and industry effects. In their study of sustainability in SMEs, Jahanshahi,
Brem and Bhattacharjee (2017) controlled 12 variables at an individual level (e.g., respondent’s
age, gender, education, previous management, marketing and technology experience) and firm
level (e.g., firm size, firm age). Although it has been argued that adding CVs can ensure the
robustness of the results, the studies reviewed here provide little discussion as to why the CVs
were included and how this would lead to more accurate conclusions.
From a different perspective, other researchers have added individual and firm characteristics as
MVs in theoretical models to examine their potential moderating effects on the hypotheses being
tested. For example, Tran and Pham (2020) analysed a sample of 810 Vietnamese SMEs, and
found that between male and female CEOs (chief executive officers), only female CEOs have a
135
positive moderating effect on corporate environmental performance. Regarding firm size, its
potential moderating effect was confirmed when Russo and Tencati (2009) reported that small and
medium-sized firms have different approaches towards adopting sustainability practices. These
authors further explain that small firms have limited financial resources and less time, and also
tend to be less systematic, structured, and formalised: they subsequently seek simple practices that
are inexpensive and easily applicable. In a recent study by Aboelmaged and Hashem (2019), the
authors did not control for the moderating effects on the relationship between absorptive capacity
and green innovation adoption in SMEs due to sample size constraints and the harmonised nature
of SMEs. Thus, they emphasised that forthcoming studies need to examine the impact of potential
moderating effects (e.g., firm size) to enrich their findings.
In line with the above discussion, it was important in the current study to match formulated
hypotheses precisely to both the choice of variables (CVs or MVs) and the choice of analyses.
Given the research objectives, the current study aimed to enrich the findings by examining the
potential moderating effects of both individual characteristics (respondent’s age, gender, work
experience, managerial position) and firm characteristics (firm size, firm age, business sector type,
firm sustainability experience). The theoretical framework, including all posited hypotheses and
potential moderators, developed to guide the current study is presented in Figure 4.1.
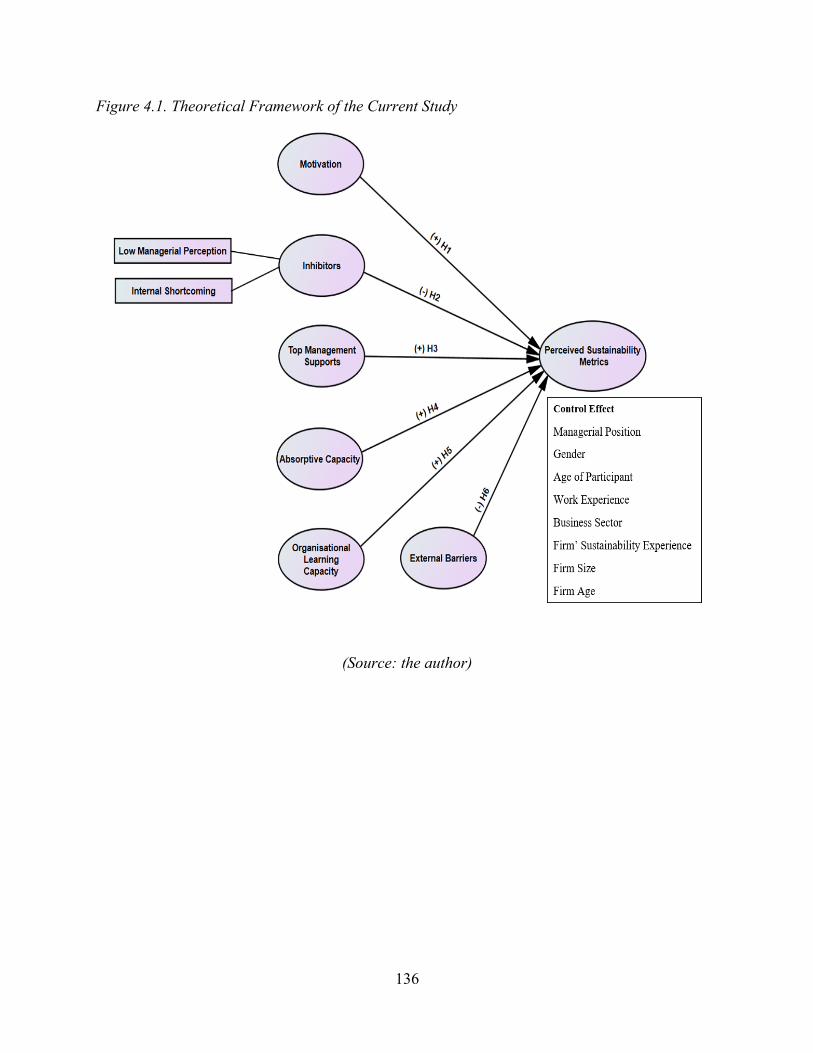
136
Figure 4.1. Theoretical Framework of the Current Study
(Source: the author)
137
4.6 Concluding Remarks
This chapter has discussed the identification of sustainability metrics within the SME setting
and the following conclusions can be drawn.
Indeed, the development of appropriate sustainability metrics for SMEs to measure
sustainability performance is a complicated and challenging task, since there is no universally
standard accepted method regarding the importance of the weights of sustainability
metrics/indicators.
The review of the main characteristics of metrics has enhanced the understanding of how to
establish a desirable requirement of sustainability metrics that can increase the adaptability of
SPMS in the SME setting. The review has also added to the understanding of the approaches
and methodologies used to identify and define sustainability metrics. Accordingly, a mix of
top-down and bottom-up approaches have been established, with the initial stage being guided
by the top-down approach, based on a review of the literature, has proposed a preliminary set
of metrics. This has set down a foundation by which the bottom-up approach can be used to
verify this proposed set of metrics from the perspectives of practitioners in SMEs. This will be
presented in following chapters.
The review so far has contributed to the understanding of issues that influence the adoption of
SPMS, which has led to the theoretical framework of the current study has been established.
The following chapter presents the overall research methodology of the PhD work.
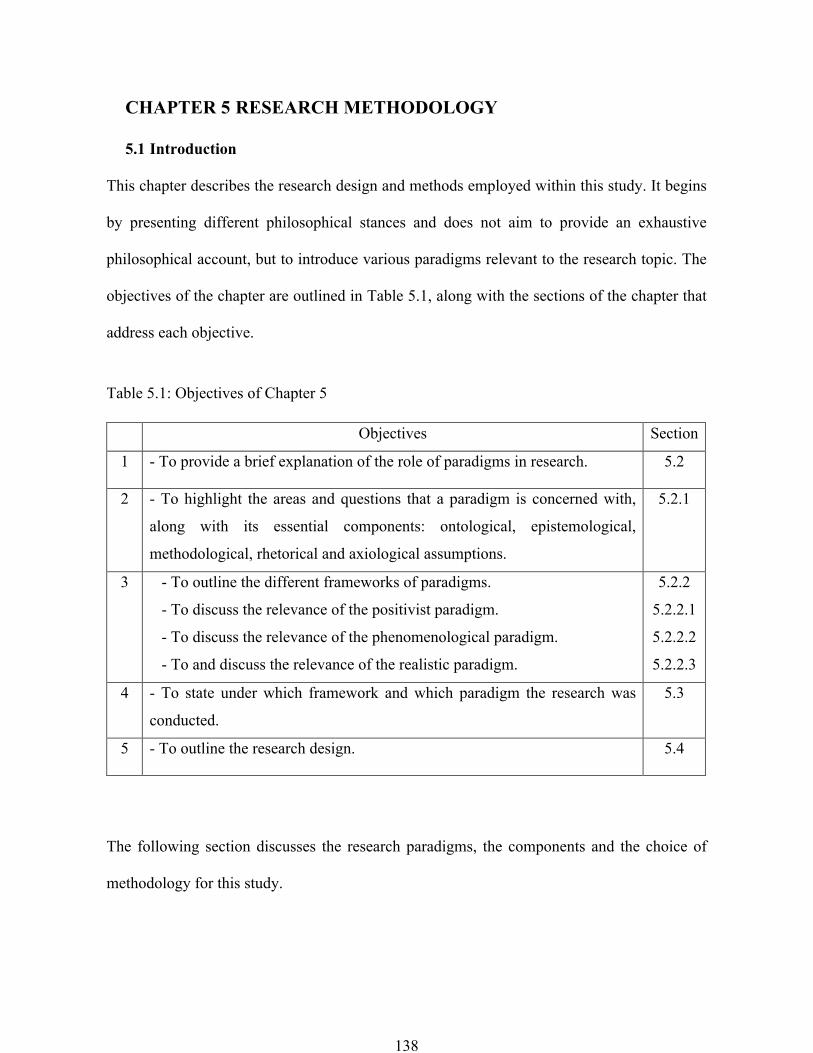
138
CHAPTER 5 RESEARCH METHODOLOGY
5.1 Introduction
This chapter describes the research design and methods employed within this study. It begins
by presenting different philosophical stances and does not aim to provide an exhaustive
philosophical account, but to introduce various paradigms relevant to the research topic. The
objectives of the chapter are outlined in Table 5.1, along with the sections of the chapter that
address each objective.
Table 5.1: Objectives of Chapter 5
The following section discusses the research paradigms, the components and the choice of
methodology for this study.
Objectives Section
1 - To provide a brief explanation of the role of paradigms in research. 5.2
2 - To highlight the areas and questions that a paradigm is concerned with,
along with its essential components: ontological, epistemological,
methodological, rhetorical and axiological assumptions.
5.2.1
3 - To outline the different frameworks of paradigms.
- To discuss the relevance of the positivist paradigm.
- To discuss the relevance of the phenomenological paradigm.
- To and discuss the relevance of the realistic paradigm.
5.2.2
5.2.2.1
5.2.2.2
5.2.2.3
4 - To state under which framework and which paradigm the research was
conducted.
5.3
5 - To outline the research design. 5.4
139
5.2 Research Paradigms, Components, and Choice of Methodology
When developing a research methodology, it is essential to consider the paradigm (philosophy)
of research upon which this is based. A paradigm refers to the “basic belief system or world
view that guides the investigation” (Guba and Lincoln, 1994, p. 105). It is used to represent
“people’s value judgements, norms, standards, frames of reference, perspectives, ideologies,
myths, theories and approved procedures that govern their thinking and actions” (Kuhn, cited
in Mangan et al., 2004: 566). Krauss and Putra (2005) emphasis that the importance of a
research paradigm lies in the fact that it provides the underlying basis for constructing a
scientific investigation. Easterby-Smith et al. (2015) endorse this view and highlighted at least
three significant advantages of a research paradigm; firstly, it can help to clarify research
designs and secondly, it enables the researcher to recognise the right path (methodology and
methods) to follow to conduct the research. Thirdly, it allows the researcher to formulate a
specific research design. Creswell (1994) views a research paradigm as a mental window
through which the researcher seeks to understand a phenomenon and advance his/her
assumptions about the social world. Therefore, a profound understanding of the research
paradigm is essential for any researcher (Crossnan, 2003).
The critical components of a paradigm will now be studied in greater depth.
5.2.1 Critical Elements of Research Paradigms
This section introduces key terms relating to research paradigms. Although paradigms share
several components, they differ in their approach (Creswell and Clark, 2011) with regard to the
nature of reality (ontology); how the researcher acquires knowledge of what they know
(epistemology); the process of research (methodology); the role of values in a study
(axiological); the language employed (rhetorical) (Lincoln and Guba, 2000; Creswell and
Clark, 2011; Denzin and Lincoln, 2018).

140
The ontological assumption is concerned with the nature of reality and its existence (Easterby-
Smith et al., 2015, p. 18). Reality is constructed by those involved in the research, which differs
from one person to another. Thus, multiple realities exist: the facts generated by the researchers,
the individuals being investigated, or the reader and audience who might interpret research
findings from their own point of view. Bell et al. (2018) stated that ontological assumptions
are concerned with whether social entities should be considered objective entities external to
actors, or constructions built from the perceptions and actions of social actors.
The second philosophical assumption, epistemology, is concerned with “the nature of
knowledge” (Crotty, 1998, p. 8). It addresses the following questions: “What is the relationship
between the researcher and the researched? How do we know what we know? What counts as
knowledge?” (Krauss and Putra, 2005, p. 759).
In essence, epistemological assumptions are concerned with how knowledge can be created,
acquired and communicated (Scotland, 2012). Collis and Hussey (2014) further emphasis that
epistemology pertains to what is regarded as acceptable knowledge. Thus, the approach to
studying the social world can be viewed by some as similar to the approach adopted to explore
the natural world.
In terms of methodology, Wahyuni (2012, p. 70) describes this as “a model for undertaking a
research process in the context of particular paradigm”. It combines ontological and
epistemological assumptions into the practicalities of conducting the research. Methodological
assumptions are concerned with the techniques and tools involved in the process of research,
which can be either inductive or deductive (Gale et al., 2013).
141
It is important to note that the terms “methodology” and “method” are sometimes used
interchangeably in the literature; nevertheless, a clear distinction has been made. According to
Jonker and Pennink (2009), a methodology can be viewed as a domain or a map, whereas a
method is considered a set of steps to be taken between two places on a map. Bryman (2008)
concurs and clarified that a methodology ecompasses the entire research process that
incorporates various methods, whereas methods refer to the tools and techniques used to
conduct the research, such as questionnaires, interviews, observation or statistical techniques.
The chosen methodology is expected to reflect the assumptions underpinning the research
paradigm and should outline the specific role of each method in achieving the objectives of the
study. For this purpose, it must clearly explain how the results and data will be analysed and
also how any potential sources of error may be reduced. Ergo, an in-depth understanding of
methodology and methods ensures greater clarity and produces a more holistic and
comprehensive understanding of various aspects of the study (Collis and Hussey, 2014).
The rhetorical assumption pertains to the question, “What is the language employed in the
research?” (Collis and Hussey, 2014). Jonsen, Fendt and Point (2018, p. 42) view rhetoric as
“the expertise of discourse, the capability to inform, persuade, and engage one’s audience”.
Rhetoric thus relates to how the researcher persuades the reader that the researcher’s findings
are valid.
Regarding the axiological assumption, researchers acknowledge that research is value-laden
and contains biases and they ask questions such as, “What is the role of value?” (Collis and
Hussey, 2014; Denzin and Lincoln, 2018). In essence, values are considered the guiding force
of all human action (Heron and Reason, 1997). Heron and Reason (1997, p. 277) emphasis that
“the axiological question asks what is intrinsically valuable in human life, in particular, what
sort of knowledge, if any, is intrinsically valuable.” They further argued that researchers

142
demonstrate axiological skill by being able to articulate their values as a basis for making
judgements about the research they are conducting. In this respect, Saunders, Lewis and
Thornhill (2019) concur with Heron and Reason (1997) that the researcher should demonstrate
their values at all stages in the research process.
For a research project to be robust, the relationships between ontology, epistemology,
methodology, language and personal values must be consistent. They need to both relate to,
and reflect the views and beliefs of the particular paradigms chosen. Any discrepancy could
lead to a weakness in the research, invalidate the results and thus leave the study open to
criticism.
Within social science, there are two main paradigms, or key “schools of thought”; positivism
and phenomenology (Proctor, 1998; Denzin and Lincoln, 2018). Each offers a specific research
perspective on how to conduct a study (Krauss and Putra, 2005; Bryman and Bell, 2011) and
they differ in terms of their ontology, epistemology, methodology, methods, values and
language. According to Collis and Hussey (2014), there is no “right” or “wrong” paradigm.
Instead, it is up to researchers to justify and adopt a particular approach based upon their own
assumptions about the nature of the research problem. Similarly, Kock (2013) stated that the
choice of a paradigm reflects the researcher’s views of the social world.
The following section explains the positivist/phenomenological frameworks in detail and
discusses their appropriateness for this study.
5.2.2 The Positivist/Phenomenological Paradigmatic Framework
It is generally agreed that before adopting any philosophical approach, the researcher should
explore the relevant literature to understand how it fits with their own perceptions and the
proposed project. Scholars have developed and highlighted several different paradigms

143
employed in business and management research, such as post-positivism, positivism,
phenomenological, realism, participatory and pragmatism (Creswell and Clark, 2011; Collis
and Hussey, 2014; Saunders, Lewis and Thornhill, 2019). Of these, positivism,
phenomenological and realism are regarded as the main research paradigms (Wass and Wells,
1994; Collis and Hussey, 2014) and are discussed in relation to the current study.
It is important to note that there are two contrasting views on the nature of paradigms, often
referred to as polarised views (Proctor, 1998; Crossnan, 2003). One is positivism, also
described as quantitative, scientific, objective, foundationalism and traditionalist. The other is
phenomenological, described as qualitative, subjectivist, hermeneutics, naturalist,
interpretivism and symbolic interactionism (Hudson and Ozanne, 1988). This signifies that
each view holds different, basic underlying assumptions that ultimately guide the research
methodology and choices of method. The two paradigms thus seem antithetical (Hoepfl, 1997).
Researchers, however, have questioned whether the two paradigms can be seen as mutually
exclusive and have argued that they do, in fact, complement one another (Deshpande, 1983).
This implies that positivism and phenomenological research paradigms can be combined to
form a realistic research paradigm, occupying “the middle ground” of the two extremes
(Proctor, 1998, p. 76).
Such a combination also means that critical aspects of the two extremes, including ontological,
epistemological, and methodological assumptions, can be merged. However, not all aspects of
the paradigms can be easily combined, with some researchers highlighting the incompatibility
and incommensurability between different assumptions of the positivist and phenomenological
paradigms (Denzin, 2012; Tashakkori et al., 2015).
144
In the following sub-sections, positivist and phenomenological paradigms are discussed in
detail. This is then followed by an in-depth consideration of the realist paradigm.
5.2.2.1 The Positivist Paradigm
Positivism refers to a particular set of assumptions about the world and the ways in which it
can be studied (Crotty, 1998; Scotland, 2012). Positivism is the dominant paradigm for
generating knowledge from the 1950s to the mid-1970s (Denscombe, 2008). Kock (2013)
explains that the positivist paradigm is derived from the natural sciences and can be used to
study social reality. This suggestion gives rise to the idea that social scientists and natural
scientists share the same research goals and that they employ similar methods of investigation
(Mangan, Lalwani and Gardner, 2004; Saunders, Lewis and Thornhill, 2009). It is, however,
essential to note that positivism is not synonymous with science, or being scientific. At this
point, natural scientists and social scientists differ sharply in the way in which they define
scientific practice (Bell et al., 2018; Mertens and Hesse-Biber, 2012).
Ontologically, positivist researchers share the standard view that social reality is singular,
external and objective (Hudson and Ozanne, 1988; Collis and Hussey, 2014). This indicates
that the research “object” (social reality) is independent (external) to the researchers and that
researchers are capable of studying the objects without influencing them or being influenced
by them; they strive to be emotionally neutral and to clearly distinguish between reason and
feeling, and between science and personal experience. Guba and Lincoln (1994, p. 110)
describe this approach as one where “inquiry takes place as through a one-way mirror.”
From an epistemological viewpoint, the belief that the world would exist independently,
without our knowledge, has enabled positivist researchers to be both dualists and objectivists,
which is regarded as a fundamental aspect of any competent inquiry (Creswell, 2009).
Positivists only view observable and measurable phenomena as legitimate areas for scientific

145
research. The merit of this scientific approach, as noted by Kerlinger (in Hudson and Ozanne,
1988, p. 513), “is the controlled experiment". Hence, the positivist advocates using a scientific
approach to generate numerical measures and produce adequate knowledge (Wahyuni, 2012).
The ontological and epistemological assumptions of the chosen paradigm are reflected in its
methodology. Here, the process of research needs to be scrutinised. For positivists, the
researchers view social phenomena as measurable. Therefore, the methodological assumptions
of the positivist paradigm have been most commonly linked with quantitative data collection
and analysis (Saunders et al., 2009; Kock, 2013; Collis and Hussey, 2014). The logic of this
methodology follows the theory-based approach by which insight is gained into the nature of
the social world (Denzin and Lincoln, 2018). Typically, this approach operationalises concepts;
it first concerns itself with the theory that the researcher wishes to study and then applies that
theory to a specific case, thus enabling the facts to be measured quantitatively (Easterby-Smith
et al., 2015; Collis and Hussey, 2014). This forms part of the research process, with positivist
research following a deductive process (Saunders et al., 2009). Fundamentally, it aims to test
an existing theory; with this approach, the researcher knows what issues need to be investigated
throughout the research, as well as the questions and hypotheses that need to be addressed.
Data are collected, analysed and compared in order to test the original hypothesis and verify or
reject the theory (Easterby-Smith et al., 2015).
Positivists rely on facts and hold that research should be value-free. In such a paradigm, the
results are considered reliable if another researcher can replicate the results following the same
research process. Reliability assumes that causal relationships can be established and that the
results can be generalised to a community outside of the original sample (Collis and Hussey,
2014). Threats to validity are controlled through preventive procedures.

146
Because this paradigm views the research as independent from the researched, the methodology
should reflect all stages of a positivist research process. Under this criterion, positivist
researchers remain detached from the researched by maintaining a distance that will minimise
their influence. It is also vital in such research to seek objectivity and to consistently employ
rational and logical approaches (Hudson and Ozanne, 1988). This reflects why the positivist
emphasises the importance of distinguishing between fact and value judgement.
Statistical and mathematical techniques play a crucial role in positivist research because they
adhere to precisely structured rules that are commensurate with a single and objective reality,
leaving little room for the subjective views of the researcher. Data analysis is also undertaken
objectively. It is essential that the language used in positivist research is impersonal and
objective (Collis and Hussey, 2014). The values of the researcher can be described as objective,
and it is this objectivity that characterises all aspects of the positivist paradigm. This also
explains why the terms ‘objective paradigm’ and ‘positivist paradigm’ are sometimes used
interchangeably.
It is important to note that the vast majority of corporate sustainability-related research follows
this dominant paradigm. The existing literature reveals a heavy bias towards positivistic studies
using quantitative methods. In their recent study, Filser et al. (2019) report that among the
newest research contributions, there were a high number of quantitative studies; for instance,
7 out of 10 studies published in 2018 were quantitative. Mahmood et al. (2019) support this
viewpoint by urging future researchers to consider using qualitative research methods within
the sustainability field. The studies reviewed here reflect a shortage in the use of qualitative
approach to explore sustainability practices in SMEs, which is viewed as a best suited method
to capture respondents' perceptions of various sustainability-related issues in order to generate
rich explanations of these phenomena (Filser et al., 2019; Mahmood et al., 2019). Such an

147
approach forms part of the phenomenological approach, which is discussed in the following
section.
5.2.2.2 The Phenomenological Paradigm
As discussed previously, the positivist paradigm is based on the belief that the social world can
be studied much like the natural world. The phenomenological paradigm, by contrast, implies
that reality is a mental representation of what is perceived; people create devices such as
theories and categories to help them make sense of their worlds (Burrell and Morgan, 1979).
In a phenomenological paradigm, the ontological assumptions are that reality is subjective and
multiple because it is derived from the differing perspectives of individuals and groups. Reality
is therefore socially constructed in that "all human knowledge is developed, transmitted, and
maintained in social situations" (Berger and Luckman 1967, p.3). Given that social actors
construct realities, phenomenology can only be understood by examining the views of said
human actors (Collis and Hussey, 2014). Phenomenologists believe that the social world is
complex, but these complexities cannot be reduced to simple, measurable variables that apply
throughout the social world, or a subset of that world. Therefore, phenomenologists reject
objectivism and the single truth proposed by positivism (Wahyuni, 2012).
In terms of epistemological assumptions, phenomenologists adhere to a subjectivist view by
which subjective meanings and interpretations have great importance. Crotty (1998, p. 79)
opines that the object “cannot be adequately described apart from the subject, nor can the
subject be adequately described apart from the object”. In a phenomenological paradigm, the
epistemological assumptions hold that a researcher interacts with what is researched. The
distance between the researcher and the researched should not cause detachment; interaction is
always required. Instead of predicting causal relationships and making generalisations based
on these, phenomenological researchers aim to understand and interpret the meanings of

148
interactions in the social world (Hudson and Ozanne, 1988; Denzin and Lincoln, 2018). This
means that human perspectives and experiences are viewed as essentially subjective, and that
social reality may change (Wahyuni, 2012). As such, meanings and interpretations become
challenging to measure in a precise and scientific manner, and the phenomenologist prefers to
use qualitative methods and personal involvement to acquire rich descriptions of social
constructs (Wahyuni, 2012).
As noted previously, a methodology refers to a framework for conducting a study under a
particular paradigm. It encompasses a prime set of beliefs that drives a researcher to select one
set of research methods over another. Given that methodologies are more common in research
practice than philosophical concepts, researchers often state that they are conducting
“qualitative” rather than “phenomenological” research (Wahyuni, 2012).
The phenomenological approach is frequently associated with an inductive research process
(Saunders, Lewis and Thornhill, 2019). In contrast to a deductive process that often identifies
essential variables before the research begins, an inductive research process allows for a more
flexible structure that permits changes in research emphasis as the investigation progresses
(Saunders, Lewis and Thornhill, 2019). Induction seeks to explain a specific phenomenon
instead of testing how useful a particular theory is (Proctor, 1998). Sekaran and Bougie (2016)
note that an inductive approach is commonly used for theory building and Thomas (2003)
further highlights that the primary purpose of the inductive approach is to allow research
findings to emerge from the frequent, dominant, or significant themes inherent in raw data
without the restraints imposed by structured methodologies.
While positivists rely on statistical and mathematical techniques to understand the social world
from a distance, phenomenologists favour interaction and dialogue with their participants. The

149
methods commonly employed in phenomenological research are interviews and questionnaires
(face-to-face interviews with open-ended questions, telephone and electronic mail interviews
and focus group discussions), observations (participant and non-participant) and the analysis
of documents (Creswell, 2008). The choice of language in phenomenological research is also
more flexible than in positivist research.
Thus far, this framework has produced two opposite paradigms. The next section will delve
deeper to unearth another paradigm within this framework.
5.2.2.3 The Realistic Paradigm
The previous discussion provided a brief account of two dichotomous paradigms at the extreme
ends of a continuum, namely the positivist and phenomenological paradigms. Although
combining these paradigms appears to be difficult, some scholars view them as complementary
(Molina-Azorín and Cameron, 2010). To give example, Wass and Well (1994, p. 3) note the
value of “combining methodologies which, it is argued, can generate complementary data
about the phenomenon under investigation”. More specifically, Burrell and Morgan (2017) and
Crotty (1998) believe there could be another paradigm, the constructionist or realistic paradigm
that occupies the middle ground between the two dichotomies.
According to Saunders, Lewis and Thornhill (2019, p.24), “the essence of realism is that what
the senses show us as reality is the truth: that objects have an existence independent of the
human mind”. Realists believe that the nature of reality is such that it is influenced by external
structures and internal subjective beliefs (Proctor, 1998). In taking this position, realists accept
positivistic beliefs about objective measurements while simultaneously respecting the
phenomenological view that subjective opinions play a key role in the social world. To this
end, it is argued that realism “provides a balance between subjectivity and objectivity, between
150
cause and effect, and between value-free and value-laden theory” (Proctor, 1998, p. 79).
Therefore, both views should be acknowledged and accommodated (Maxwell and Mittapalli,
2010).
In epistemological terms, the researcher working from within a realistic paradigm believes that
concepts, variables and hypotheses may be chosen before the study commences, as is the case
with positivist assumptions. However, they also submit that these may change and emerge
throughout the course of the research, as is the case with phenomenological assumptions.
In terms of methodological assumptions, realism has important implications for both
qualitative and quantitative researchers as it is considered a productive stance for mixed
methods research. Maxwell and Mittapalli (2010, p. 147) assert that realism provides “a
philosophical stance that is compatible with the essential methodological characteristics of both
quantitative and qualitative research, and it can facilitate communication between the two”.
According to Saunders, Lewis and Thornhill (2019), realistic research is frequently associated
with an abductive research process that involves a mixture of previously outlined theories and
the collection of data in order to identify patterns supporting the future development of current
or new theories.
The language employed in realistic research is both formal and informal. The paradigms
discussed in each of the three subsections are summarised in Table 5.2.

151
Table 5.2: Assumptions Underpinning the Paradigms
Assumption Question Positivistic Paradigm Realistic Paradigm Phenomenological Paradigm
Ontology What is the nature of reality?”
Reality is objective and singular, separate from the researcher.
Real-world exists independently from subjective beliefs but is experienced through internal subjective beliefs.
Reality is subjective and multiple, as perceived by actors in a study.
Epistemology What is the relationship between the researcher and the researched?
The researcher is independent from the researched.
Not consciously clear and attempts to take a middle path.
The researcher interacts with the researched.
Methodology What is the process of research?
-Deductive approach; context-free; the researcher studies cause and effect, and employs a static design where categories are identified in advance; generalisations lead to prediction, explanation, and understanding; results are statistically accurate, reliable, and valid
- Abductive approach; interactive cycle between observation and theory; pluralistic approach, triangulation of methods, methods determined by the subject of research.
Inductive approach; context-bound. The researcher studies the topic within its context and employs an emerging design where categories are identified during the process; patterns and/or theories are developed; findings are judged accurate and reliable through verification.
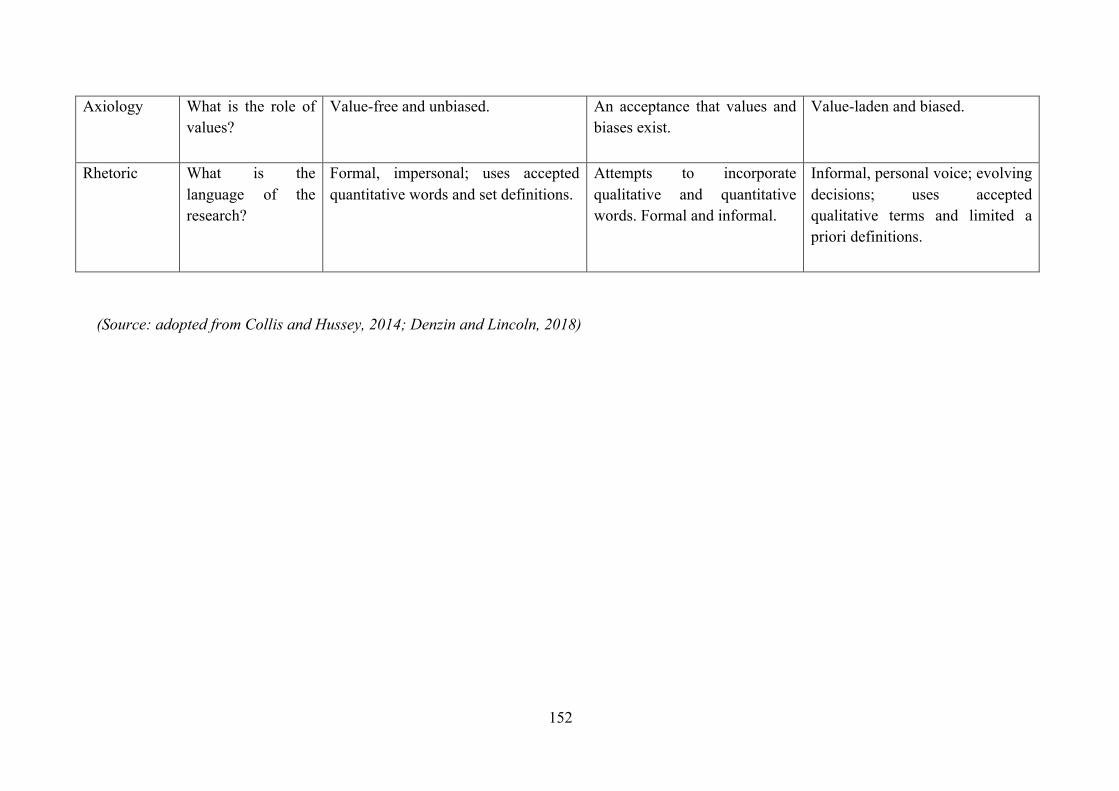
152
Axiology What is the role of values?
Value-free and unbiased. An acceptance that values and biases exist.
Value-laden and biased.
Rhetoric What is the language of the research?
Formal, impersonal; uses accepted quantitative words and set definitions.
Attempts to incorporate qualitative and quantitative words. Formal and informal.
Informal, personal voice; evolving decisions; uses accepted qualitative terms and limited a priori definitions.
(Source: adopted from Collis and Hussey, 2014; Denzin and Lincoln, 2018)
153
5.3 Choice of Paradigm for the Current Study
The selection of an appropriate paradigm depends on how researchers conduct and report their
inquiries, and this will be influenced by their different views on the components of the
paradigm (Collis and Hussey, 2014). This implies that the choice of a paradigm needs to be
consistent with the nature of the research problem itself (Denscombe, 2008). Having discussed
the three main research paradigms, this section explains how an appropriate paradigm for the
current study is selected.
This current study focuses on identifying the most appropriate metrics for SMEs in Vietnam
and the key enablers and inhibitors to better help these SMEs measure their sustainability
performance. There has been sufficient literature available on sustainability performance
measurement and sustainability metrics, which may necessitate the positivist paradigm or
quantitative research approach. The issues to be raised in this initial part of the study attempt
to test some “known variables”. Hence the data collection is to be gathered through a
questionnaire survey. However, the research pertaining to the understanding of sustainability
performance measurement adoption from the perspective of SMEs, particularly in Vietnam, is
not sufficient. As discussed in previous chapters, the SPMS adoption is highly contextual
dependent, where the perception of motivations, inhibitors, enablers might vary from one
company to another, and the defining an appropriate sustainability metric might differ from
one situation to another. These practices can be associated with a need to employ the
phenomenological/interpretivist paradigm, or qualitative research approach. Taken together, it
entails a combination of positivist and phenomenological paradigms; a realistic perspective.
In short, the current study adopts a positivist perspective in the initial phase and a
phenomenological position in the latter stage. Table 5.3 illustrates the critical elements of the
realistic paradigm adopted in this study.

154
Table 5.3: Realist Paradigm and Assumptions for the Current Study
Realist Paradigm and Assumptions
Ontological assumption The sustainability performance measurement exists
independently of subjective consciousness, but the
experience of reality is gained through subjective
consciousness.
Epistemological assumption Valid knowledge relating to sustainability performance
measurement issues are tangible and can be measurable;
human action is open to various interpretations; the
relationship between researcher and the researched differs,
with the method chosen according to best practice for that
particular method.
Axiological assumption Acceptance that values and biases relating to sustainability
performance adoption exist. Bias during interviews and
analysis is acknowledged although an attempt will be made
to reduce bias at all stages of research.
Rhetorical assumption Attempts to combine quantitative and qualitative language
(formal and flexible).
Methodological assumption - Abductive approach, triangulation of methods, methods
determined by the subject of the research.
- Methods: quantitative survey on sustainability performance
measurement adoption, followed by interviews on issues of
sustainability metrics, motivations, inhibitors and enablers
with owners/managers of SMEs in the southern part of
Vietnam, and their relevant stakeholders (employees,
shareholders, business customers).
- Type of data: quantitative data and qualitative.
(Source: author’s drawing)
155
Having selected a relevant research paradigm and identified its crucial elements, the following
section discusses the research design employed for this study.
5.4 Research Design
The previous discussion highlighted the transparent debate between different paradigms at a
philosophical level. However, concerning the choice of specific research methods, the
distinction breaks down (Burrell and Morgan, 2017; Molina-Azorin et al., 2017). A strong
research design is crucial in providing a sensible framework for collecting and analysing data
(Bell et al., 2018). Each methodological paradigm is associated with a particular research
method.
The significant distinction between quantitative and qualitative research is as follows; in the
former, researchers are more detached from respondents in order to maintain validity. This
method is based on reasonable, empirical and rational logic. The researcher adopts “top-down”
logic to deductively test particular hypotheses or theories through the application of statistical
measurements (Johnson and Onwuegbuzie, 2004). Data collection using quantitative methods
is relatively quick, compared with qualitative methods (Johnson and Onwuegbuzie, 2004).
Additionally, the quantitative method enables a large amount of numerical data can be collected
from various people, mainly through surveys and databases, across a wide geographical area
(Sekaran and Bougie, 2016; Saunders, Lewis and Thornhill, 2019). This serves the purpose of
hypothesis testing (Creswell and Clark, 2011) and the subsequent objective generalising
findings about a phenomenon (Bryman, 2009; Collis and Hussey, 2014). In many cases, the
quantitative approach often has a low tolerance of the uncertainty and ambiguity that can be
expressed in some qualitative methods. Notwithstanding, the knowledge produced by the
quantitative approach may be too abstract and general for direct application to specific local
situations, contexts, and individuals (Johnson and Onwuegbuzie, 2004). At this point,

156
quantitative methods do not explicitly investigate social experiences (Sekaran and Bougie,
2016; Saunders, Lewis and Thornhill, 2019).
By contrast, qualitative research employs logical inductions to understand multiple realities
(Brannen, 2005; Sale, Lohfeld and Brazil, 2002) that usually involve a small number of cases
(Jonker and Pennink, 2009). Unlike quantitative researchers, qualitative researchers become
insiders who immerse themselves in the lives of respondents who are striving to make sense of
their worlds. In a qualitative study, the researchers employ theory for inductive purposes or
develop a theory based on a specific observed phenomenon (Meissner et al., 2011; Sekaran
and Bougie, 2016). The value of qualitative research lies in its capacity to investigate a
phenomenon that is not well known in the context in which it occurs (Manuj and Mentzer,
2008; Paterson et al., 2013). However, qualitative research is sometimes viewed as inferior and
merely supplementary to quantitative methods (Easterby-Smith et al., 2015). Nevertheless,
qualitative researchers aim to gather extremely rich information and they will often employ
data collection techniques such as semi-structured interviews, in-depth interviews, focus
groups, participant observations and documentation such as texts and images through the
traditional use of a case study (Yin, 2018; Bell et al., 2018). The nature of such data collection
means it is difficult to predict its progress. It also requires more time, resources and the
interpretation of qualitative data is highly dependent on the skills and experience of the
researcher.
The research outcomes can be subjective as they primarily rely on the unsystematic opinions
of researchers as to what is deemed significant (Bell et al., 2018). Researchers conducting
qualitative studies often draw on a relatively small sample of data in a particular locality (Collis
and Hussey, 2014; Yin, 2018) and this makes it difficult to generalise findings to other settings.
This might result in a low credibility rating among those policymakers or sponsors who favour
157
a positivistic management agenda (Johnson and Onwuegbuzie, 2004; Easterby-Smith et al.,
2015).
In line with the above discussion, it is clear that the use of either a qualitative or quantitative
approach in a single study has strengths and weaknesses (Creswell and Creswell, 2018).
Although the former (qualitative) is believed to provide more meaning and in-depth
understanding, it cannot present data in numerical form or ensure generalisability, unlike the
latter approach (quantitative) (Saunders, Lewis and Thornhill, 2019). It is generally agreed that
qualitative data tends to be subjective and less accurate, which contrasts with quantitative data
that appears to be objective and precise and are based on standardised collection methods that
can be replicated and analysed using statistical procedures (Creswell and Creswell, 2018; Bell
et al., 2018).
In the contemporary research world, complex and dynamic issues have triggered a demand for
workable solutions to address complicated research problems. As a result, researchers often
utilise a combination of quantitative and qualitative methods in a single study (Creswell, 2013;
Denzin, 2010; Molina-Azorin, 2016). This combination is known as mixed-method research
(MMR), the third research movement following quantitative and qualitative research
approaches (Johnson and Onwuegbuzie, 2004; Greene, 2005; Cresswell and Tashakkori,
2007). MMR is thus defined as “the class of research where the researcher mixes or combines
quantitative and qualitative research techniques, methods, approaches, concepts or language
into a single study” (Johnson and Onwuegbuzie, 2004; p. 17).
It is important to restate that sustainability issues are multiple and complex in nature (Simonette
et al., 2008). This might cause ambiguity and confusion for SMEs in characterising, defining,
and identifying appropriate metrics for adoption in practice to measure sustainability
158
performance (Ageron, Gunasekaran and Spalanzani, 2012; Ahi and Searcy, 2013b). In
addition, the involvement of multiple actors such as customers, suppliers, and employees with
a diversity of perspectives and relationships is likely to be complex and challenging (Qorri,
Mujkić and Kraslawski, 2018). Indeed, implementing stakeholder concerns about sustainability
can be an ambiguous requirement for SME owners/managers (Eikelenboom and de Jong,
2019). Consequently, handling such sustainability issues is likely to be a difficult endeavour
for SMEs (Klewitz, Zeyen and Hansen, 2012).
As discussed above, the use of a MMR approach, combining qualitative and quantitative forms
of research, is often described as the most appropriate method for capturing the complexity of
investigations on sustainability issues as well as minimising research bias (Imbrogiano, 2020;
Karell and Kirsi, 2020; Kundurpi et al., 2021; Muñoz-Pascual, Curado and Galende, 2019;
Santiago-Brown et al., 2015). As discussed in section 5.3, the realistic paradigm was employed
as the worldview of the current study. The MMR research (Almalki, 2016; Creswell, 2013;
Maxwell and Mittapalli, 2010; Proctor, 1998) enables researchers to develop and obtain deeper
levels of understanding of the research issue by investigating multiple outlooks (Creswell,
2013; Halcomb and Hickman, 2015). Therefore, the MMR approach was best suited for
investigating factors influencing SPMS adoption in Vietnamese SMEs.
The utilisation of the MMR approach enabled the researcher to investigate such factors using
both quantitative and qualitative methods, whereby the weaknesses of one method can be
compensated by the strengths of the other (Durst and Gueldenberg, 2010; Johnson and
Onwuegbuzie, 2004; Proctor, 1998; Turner, Cardinal and Burton, 2017). Another key
advantage of employing the MMR approach is the triangulation benefits it brings as each

159
method can contribute to different aspects of the research (Greene, Caracelli and Graham,
1989; Turner, Cardinal and Burton, 2017; Venkatesh, Brown and Sullivan, 2016).
The purpose of triangulation, specifically, is an imaginative way of maximising the amount of
data collected from multiple sources (Jick, 1979). The aim is to check the consistency and
accuracy of data and reduce the risk of missing important information, thus enhancing the
richness of data obtained (Saunders, Lewis and Thornhill, 2019; Creswell, 2013). In doing this,
the current study exploited three advantages of the MMR approach: convergence and
corroboration of findings (Johnson and Onwuegbuzie, 2004); reducing other possible
interpretations when drawing conclusions (O’Cathain, Murphy and Nicholl, 2007); and
clarifying different aspects of the phenomenon under investigation (Bowen et al., 2013; Turner,
Cardinal and Burton, 2017). Hence, the use of MMR and triangulation approaches served to
enhance the validity and reliability of the research findings (Dewasiri, Weerakoon and Azeez,
2018; Proctor, 1998; Wahyuni, 2012).
To fully implement the MMR approach, the present study employed a sequential explanatory
mix-methods design comprising two distinct interactive phases (Ferguson, Kerrigan and
Hovey, 2020; McKim, 2017). In this design, the researcher initially gathered and analysed
quantitative data, and then did the same for qualitative data to help explain or build on the
initial quantitative results (Byrne and Humble, 2007; Ivankova, Creswell and Stick, 2006). The
decision to employ a sequential explanatory design is consistent with the literature reviewed in
the scoping review (Ferguson, Kerrigan and Hovey, 2020); and is also informed by the research
questions and objectives already set out in Chapter 1. Further, this research design offered
favourable conditions for the single researcher of the current study to conduct two methods in
160
separate phases and collect only one type of data at a time (McKim, 2017; Molina-Azorin,
2012).
Specifically, the quantitative study was initially used to examine the relationships between six
independent variables (MOT, INH, TOP, ACA, OLC, EXB) and the dependent variable (PSE).
Also, the moderating effects of both individual and firm characteristics on these relationships
were examined, as set out in section 4.5 Chapter 4. In this quantitative phase, a large sample
size was targeted to meet the requirements for statistical analysis, as well as to generalise the
research findings to the wider population of SMEs in Vietnam (Creswell, 2013; Garengo and
Sharma, 2014; Kock, 2013).
In the following phase, the qualitative study was employed to gain further insights into the
initial quantitative findings on factors influencing SPMS adoption. The aim here was to obtain
rich data by interviewing participants about the worlds inside and outside of the organisation;
and how these influence SPMS adoption in the SME setting. The rationale for this choice was
also driven by the need to further explore the relevance of the quantitative findings with
experienced managers. To achieve this, participants were asked about their role in the firm
(e.g., owners/managers, staffs, shareholders, customers) and its relationship to business
activities, which ensured appropriate data-rich information was obtained. In doing so, this
qualitative study was able to further capture and explore subtler issues or unexplainable
findings which might not have been revealed and explained in the initial quantitative phase
(Clark, 2007; Creswell, 2013; Harrison and Reilly, 2011).
It is important to note that in this sequential explanatory design, both quantitative and
qualitative parts were given equal priority, meaning the current study employed both
quantitative and qualitative approaches equally to better understand the factors that influence

161
SPMS adoption in Vietnamese SMEs. Figure 5.1 illustrates the procedure for the sequential
explanatory MMR design of the present study.
Figure 5.1: Sequential Explanatory Mixed Methods Design of the Current Study
(Source: adopted from Creswell and Clark, 2011, p. 69)
To obtain a reliable and valid measurement, an independent level of interaction occurred
between quantitative and qualitative strands, whereby quantitative and qualitative research
questions, data collection and data analysis are kept separate. The two strands were mixed when
drawing conclusions during the overall interpretation at the end of the study. This was the only
point in the research process where mixing occurred. By comparing and synthesising the results
in a discussion, inferences are drawn that reflected all that is learnt from combining these
results. In short, this study utilises a three-stage research design that encompassed quantitative
and qualitative methods. Table 5.4 presents a visual framework for sequential explanatory
mixed-methods procedures that aligns with the research objectives stated in Section 1.4,
Chapter 1.
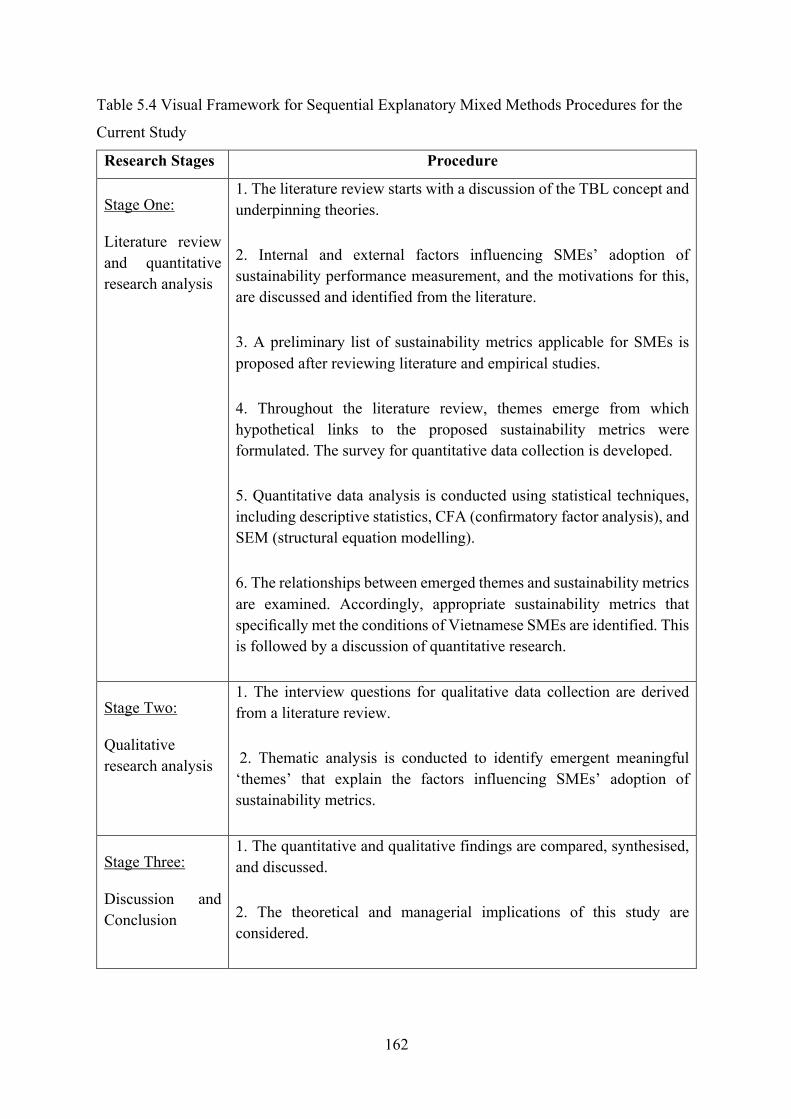
162
Table 5.4 Visual Framework for Sequential Explanatory Mixed Methods Procedures for the
Current Study
Research Stages Procedure
Stage One:
Literature review and quantitative research analysis
1. The literature review starts with a discussion of the TBL concept and underpinning theories.
2. Internal and external factors influencing SMEs’ adoption of sustainability performance measurement, and the motivations for this, are discussed and identified from the literature.
3. A preliminary list of sustainability metrics applicable for SMEs is proposed after reviewing literature and empirical studies.
4. Throughout the literature review, themes emerge from which hypothetical links to the proposed sustainability metrics were formulated. The survey for quantitative data collection is developed.
5. Quantitative data analysis is conducted using statistical techniques, including descriptive statistics, CFA (confirmatory factor analysis), and SEM (structural equation modelling).
6. The relationships between emerged themes and sustainability metrics are examined. Accordingly, appropriate sustainability metrics that specifically met the conditions of Vietnamese SMEs are identified. This is followed by a discussion of quantitative research.
Stage Two:
Qualitative research analysis
1. The interview questions for qualitative data collection are derived from a literature review.
2. Thematic analysis is conducted to identify emergent meaningful ‘themes’ that explain the factors influencing SMEs’ adoption of sustainability metrics.
Stage Three:
Discussion and Conclusion
1. The quantitative and qualitative findings are compared, synthesised, and discussed.
2. The theoretical and managerial implications of this study are considered.
163
5.5 Concluding Remarks
This chapter has discussed the overall research methodology, reviewed the relevant research
paradigms and methodological strategies. While conflicting views exist regarding the choice
and applicability of different research paradigms, this study drew on the realistic paradigm,
with a positivist perspective in the initial phase and a phenomenological perspective in the
latter stage. The application of a realistic paradigm results in the utilisation of both quantitative
and qualitative methods as part of a mixed-method approach that is best suited to this study. It
not only explains how and why the researcher adopt these approaches to address the research
questions and identify problems relating to application of the most appropriate metrics for
SMEs in Vietnam, it also determines the key enablers and inhibitors that will more accurately
help these SMEs measure their sustainability performance.
The following chapter discusses the quantitative research methodology employed in more
detail.

164
CHAPTER 6 QUANTITATIVE RESEARCH METHODOLOGY
6.1 Introduction
This chapter presents the methods and procedures used to conduct quantitative research and
test the hypotheses presented in the previous chapter. This chapter is divided into fourteen
sections discussing quantitative data collection methods, the development of measurement
models, measurement scale, questionnaire format, translation of the quantitative questionnaire,
quantitative sampling, units of analysis, respondent selection, data analysis and processing
techniques, estimation technique, the statistical model before modification, the confirmatory
factor analysis of dynamic capabilities, the confirmatory factor analysis of competitive
advantage, and fit indices. Each of these sections details the logic underlying the research
decisions made in this study.
6.2 Quantitative Data Collection Method
Having employed a sequential explanatory mixed-method approach, this study used a
quantitative method to test the hypotheses, followed by a qualitative method to explain the
quantitative findings. This section presents in detail the quantitative method employed, which
involved formulating and testing an integrated model containing relationships between the
construct of factors influencing the adoption of SPMS in SMEs.
The literature on business research methods indicates different methods of collecting
quantitative data, such as using surveys (questionnaires), experiments or observation (Anguera
et al., 2018). This study used questionnaires to gather quantitative data because this method
allows researchers to easily reach a large number of respondents (Roxas and Chadee, 2012). It
is widely utilised in research to develop measurement instruments (Saunder et al., 2018). Self-
completed questionnaires were administered to allow respondents to complete them
independently at their convenience (Sekaran and Bougie, 2016), giving their preferences as
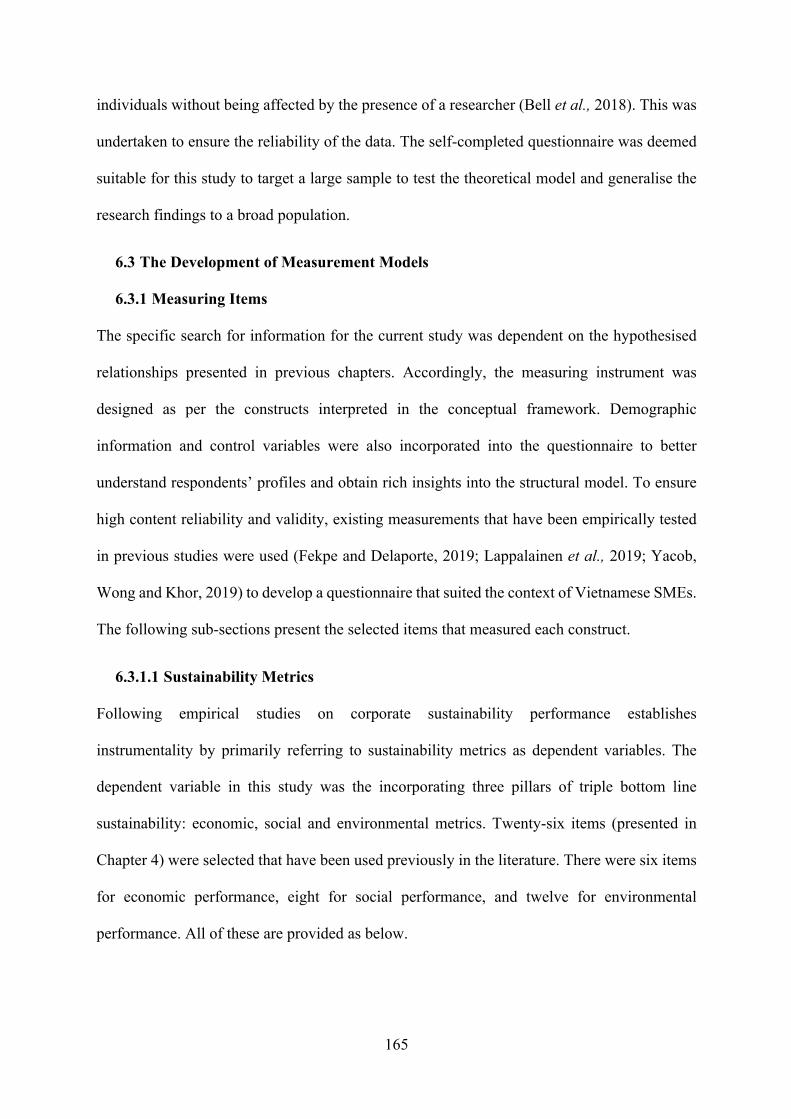
165
individuals without being affected by the presence of a researcher (Bell et al., 2018). This was
undertaken to ensure the reliability of the data. The self-completed questionnaire was deemed
suitable for this study to target a large sample to test the theoretical model and generalise the
research findings to a broad population.
6.3 The Development of Measurement Models
6.3.1 Measuring Items
The specific search for information for the current study was dependent on the hypothesised
relationships presented in previous chapters. Accordingly, the measuring instrument was
designed as per the constructs interpreted in the conceptual framework. Demographic
information and control variables were also incorporated into the questionnaire to better
understand respondents’ profiles and obtain rich insights into the structural model. To ensure
high content reliability and validity, existing measurements that have been empirically tested
in previous studies were used (Fekpe and Delaporte, 2019; Lappalainen et al., 2019; Yacob,
Wong and Khor, 2019) to develop a questionnaire that suited the context of Vietnamese SMEs.
The following sub-sections present the selected items that measured each construct.
6.3.1.1 Sustainability Metrics
Following empirical studies on corporate sustainability performance establishes
instrumentality by primarily referring to sustainability metrics as dependent variables. The
dependent variable in this study was the incorporating three pillars of triple bottom line
sustainability: economic, social and environmental metrics. Twenty-six items (presented in
Chapter 4) were selected that have been used previously in the literature. There were six items
for economic performance, eight for social performance, and twelve for environmental
performance. All of these are provided as below.

166
Economic Metrics (ECM)
ECM1 Return on Investment (ROI)
ECM2 Operating profit
ECM3 Net profit
ECM4 Tax payments
ECM5 Operational costs
ECM6 R&D expenditure
Social Metrics (SOM)
SOM1 Employee turnover
SOM 2 Employee job satisfaction
SOM 3 Employee training and development
SOM 4 Health and safety in the workplace
SOM 5 Customer satisfaction
SOM 6 Customer complaints
SOM 7 Charitable donation
SOM 8 Community involvement
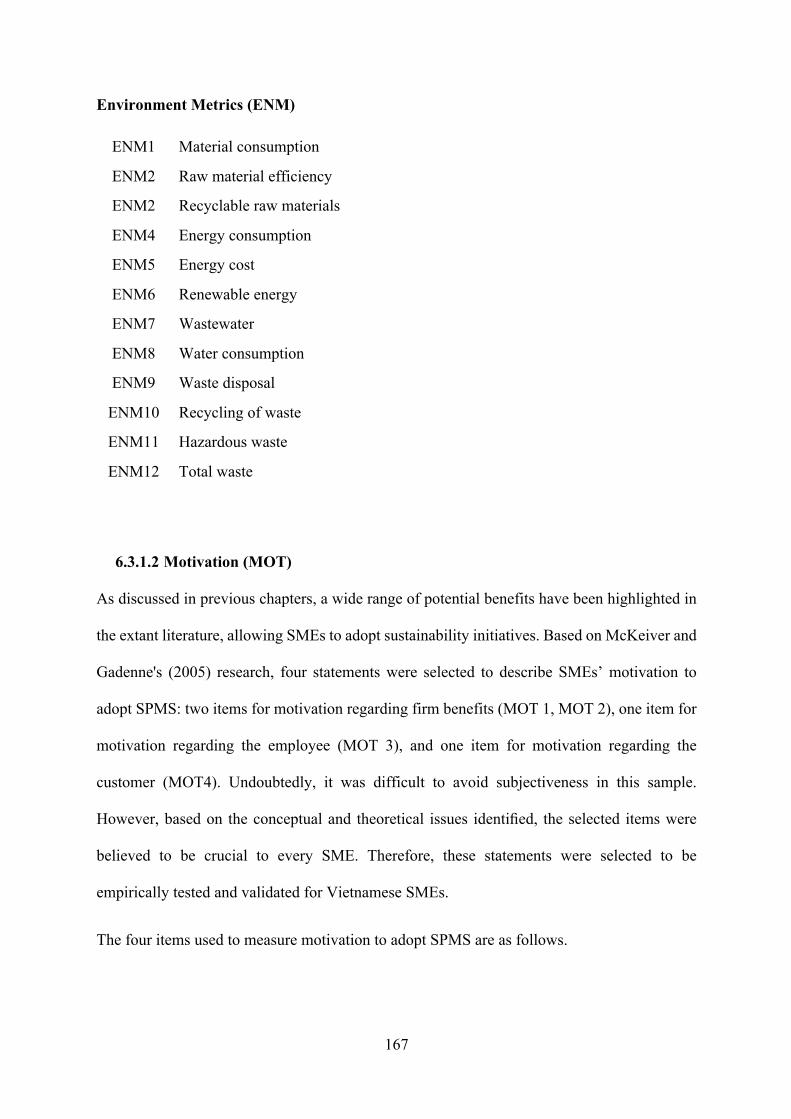
167
Environment Metrics (ENM)
ENM1 Material consumption
ENM2 Raw material efficiency
ENM2 Recyclable raw materials
ENM4 Energy consumption
ENM5 Energy cost
ENM6 Renewable energy
ENM7 Wastewater
ENM8 Water consumption
ENM9 Waste disposal
ENM10 Recycling of waste
ENM11 Hazardous waste
ENM12 Total waste
6.3.1.2 Motivation (MOT)
As discussed in previous chapters, a wide range of potential benefits have been highlighted in
the extant literature, allowing SMEs to adopt sustainability initiatives. Based on McKeiver and
Gadenne's (2005) research, four statements were selected to describe SMEs’ motivation to
adopt SPMS: two items for motivation regarding firm benefits (MOT 1, MOT 2), one item for
motivation regarding the employee (MOT 3), and one item for motivation regarding the
customer (MOT4). Undoubtedly, it was difficult to avoid subjectiveness in this sample.
However, based on the conceptual and theoretical issues identified, the selected items were
believed to be crucial to every SME. Therefore, these statements were selected to be
empirically tested and validated for Vietnamese SMEs.
The four items used to measure motivation to adopt SPMS are as follows.
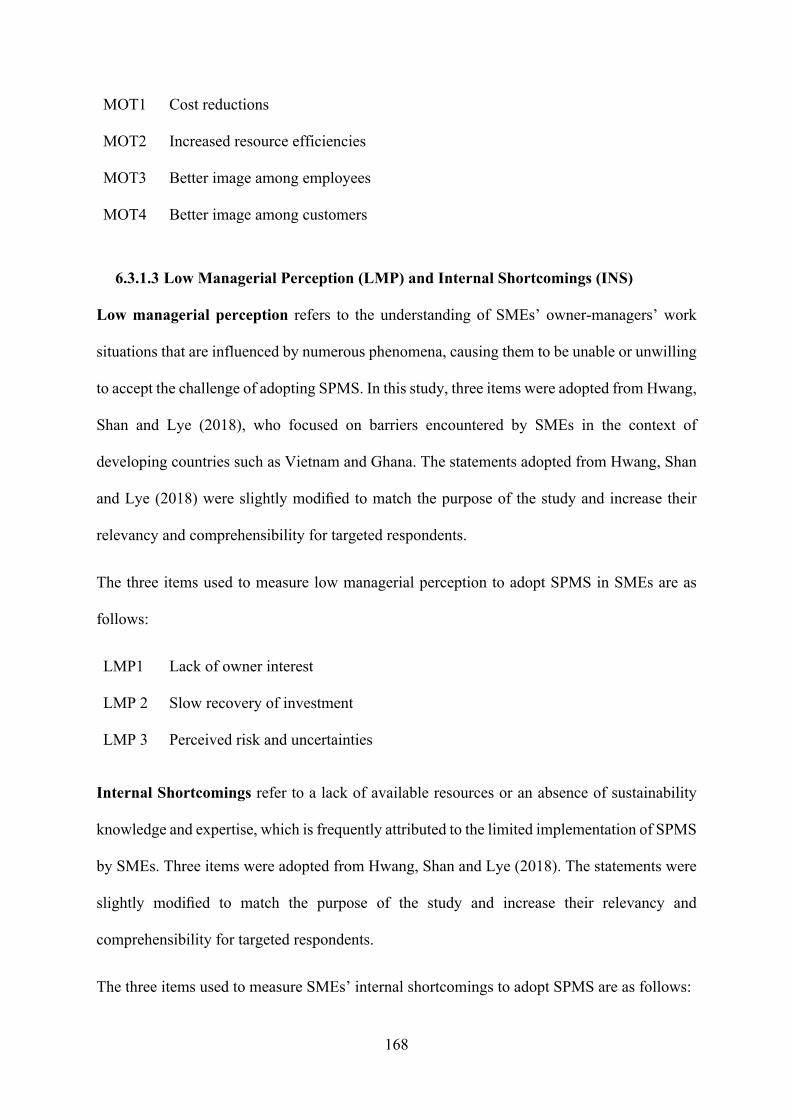
168
MOT1 Cost reductions
MOT2 Increased resource efficiencies
MOT3 Better image among employees
MOT4 Better image among customers
6.3.1.3 Low Managerial Perception (LMP) and Internal Shortcomings (INS)
Low managerial perception refers to the understanding of SMEs’ owner-managers’ work
situations that are influenced by numerous phenomena, causing them to be unable or unwilling
to accept the challenge of adopting SPMS. In this study, three items were adopted from Hwang,
Shan and Lye (2018), who focused on barriers encountered by SMEs in the context of
developing countries such as Vietnam and Ghana. The statements adopted from Hwang, Shan
and Lye (2018) were slightly modified to match the purpose of the study and increase their
relevancy and comprehensibility for targeted respondents.
The three items used to measure low managerial perception to adopt SPMS in SMEs are as
follows:
LMP1 Lack of owner interest
LMP 2 Slow recovery of investment
LMP 3 Perceived risk and uncertainties
Internal Shortcomings refer to a lack of available resources or an absence of sustainability
knowledge and expertise, which is frequently attributed to the limited implementation of SPMS
by SMEs. Three items were adopted from Hwang, Shan and Lye (2018). The statements were
slightly modified to match the purpose of the study and increase their relevancy and
comprehensibility for targeted respondents.
The three items used to measure SMEs’ internal shortcomings to adopt SPMS are as follows:

169
INS1 Extra investment required (additional cost involved: implementing, monitoring, labour cost)
INS2 Limited sustainability knowledge and expertise for an SPMS
INS3 Lack of sustainability measurement tool/framework
6.3.1.4 Top Management Support (TOP)
Top management support refers to consistent support of top managers in terms of finance,
human and time resources, their encouragement, active involvement, and supervision for the
adoption of SPMS. Top management support consisted of three items and was adopted from
prior studies. One item (TOP1) was adopted from Eikelenboom et al. (2019), another two items
(TOP2, TOP3) from Nguyen and Tran (2020). The statements were slightly modified to match
the purpose of the study and increase their relevancy and comprehensibility for targeted
respondents.
Therefore, the three items used to measure top management support are as follows:
TOP1 Top management team communicates a clear and positive vision of SPMS
TOP2 Top management team is committed, involved and fully supports the implementation of SPMS
TOP3 Top management team can provide adequate resources to support the implementation of SPMS
6.3.1.5 Absorptive Capacity (ACA)
Absorptive capacity refers to a firm’s ability to recognise the value of external knowledge,
assimilate it, and use it for commercial ends. In this study, the measurement of absorptive
capacity included three items adopted from prior studies. One item (ACA1) was adopted from
Aboelmaged and Hashem (2019), another (ACA2) from Kim and Lee (2018) and a final item
(ACA3) from Johnson (2017). The statements were slightly modified to match the purpose of

170
the study and increase their relevancy and comprehensibility for targeted respondents. The
three items used to measure external barriers are as follows:
ACA1 Our company provides formal education and training so employees may obtain novel knowledge
ACA2 Our company establishes reward and recognition systems which encourage employees to obtain working skills and experience
ACA3 Our company has experience with ISO and/or has obtained sustainability certificates/programmes which have some advantages for knowledge acquisition and assimilation to support SPMS
6.3.1.6 Organisational Learning Capacity (OLC)
Organisational learning capacity refers to knowledge-sharing systems comprised of explicit
and tacit knowledge constructed by individuals and groups involved in interacting and sharing
experiences and expertise. In this study, the measurement of organisational learning capacity
included three items, adopted from Lara and Salas-Vallina (2017). The items were modified
slightly to increase their relevancy for the domestic context and prevent misreading and
ambiguities.
The three items used to measure external barriers are as follows:
OLC1 In our company, people are encouraged to present new ideas and contribute opinions
OLC2 In our company, people feel involved in company decisions
OLC3 In our company, free and open communication is encouraged
6.3.1.7 External Barriers (EXB)
The items for external barriers were adopted from Hwang, Shan and Lye (2018) and Pham,
Yong and Truong (2019) to measure the extent to which external barriers influence the
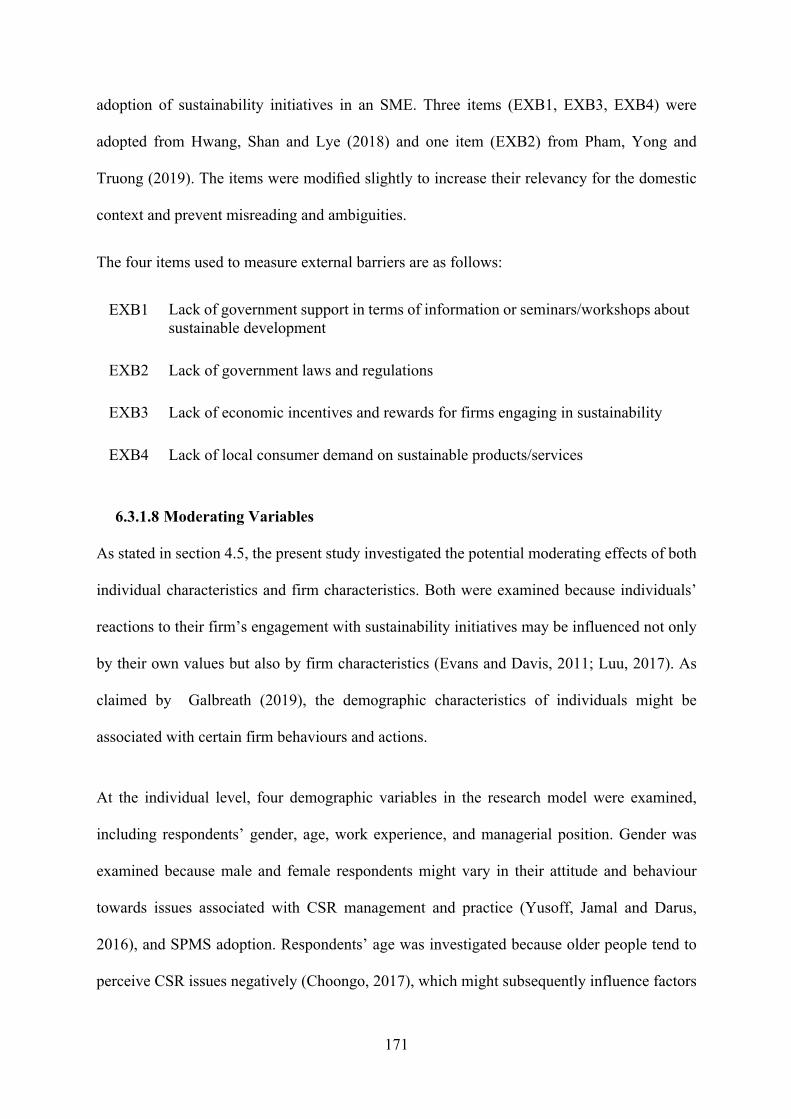
171
adoption of sustainability initiatives in an SME. Three items (EXB1, EXB3, EXB4) were
adopted from Hwang, Shan and Lye (2018) and one item (EXB2) from Pham, Yong and
Truong (2019). The items were modified slightly to increase their relevancy for the domestic
context and prevent misreading and ambiguities.
The four items used to measure external barriers are as follows:
EXB1 Lack of government support in terms of information or seminars/workshops about sustainable development
EXB2 Lack of government laws and regulations
EXB3 Lack of economic incentives and rewards for firms engaging in sustainability
EXB4 Lack of local consumer demand on sustainable products/services
6.3.1.8 Moderating Variables
As stated in section 4.5, the present study investigated the potential moderating effects of both
individual characteristics and firm characteristics. Both were examined because individuals’
reactions to their firm’s engagement with sustainability initiatives may be influenced not only
by their own values but also by firm characteristics (Evans and Davis, 2011; Luu, 2017). As
claimed by Galbreath (2019), the demographic characteristics of individuals might be
associated with certain firm behaviours and actions.
At the individual level, four demographic variables in the research model were examined,
including respondents’ gender, age, work experience, and managerial position. Gender was
examined because male and female respondents might vary in their attitude and behaviour
towards issues associated with CSR management and practice (Yusoff, Jamal and Darus,
2016), and SPMS adoption. Respondents’ age was investigated because older people tend to
perceive CSR issues negatively (Choongo, 2017), which might subsequently influence factors

172
relating to SPMS adoption. Work experience was measured in terms of the number of years
the respondent has been working in the SME sector (Hosseininia and Ramezani, 2016): its
potential moderating effect on SPMS adoption was examined because the experience levels of
respondents have been found to influence their sustainability orientation (Kor, 2003; Kuckertz
and Wagner, 2010). Managerial position was measured by level of management (Lee, 2021),
which was examined because different levels of management might have different perceptions
of the influence of different factors on SPMS adoption (Parisi, 2013a).
At the organisational level, the current study examined the potential moderating effects of four
moderators in the research model: firm size, firm age, business sector, and company
sustainability experience. Firm size was measured by the number of employees, and firm age
was evaluated by the number of years since the firm was established (Pham and Kim, 2019).
Firm size and age were examined in the analyses because larger and older firms might have
greater resources for adopting SPMS (Lopez-Perez, Melero and Javier Sese, 2017; Yu and
Ramanathan, 2016). Business sectors were studied because SMEs operating in different
business sectors, such as the manufacturing and service sectors, often encounter different types
of challenges with respect to engagement with sustainability initiatives (Hatak, Floh and
Zauner, 2015; Kumar, Singh and Dwivedi, 2020). The firm’s sustainability experience was
evaluated by certifications according to standards of social responsibility or sustainability or
any other government certifications (Hasan, 2016). This is because SMEs with experience in
quality certifications (such as ISO 9001, ISO14001) are likely to adopt sustainability initiatives
(Caldera, Desha and Dawes, 2019a; Singh, Brueckner and Padhy, 2014).

173
6.4 Measurement Scale
Before drafting the questionnaire, it was crucial to determine appropriate scales to measure the
variables in the theoretical framework and choose an appropriate scale to reflect the levels of
precision at which a variable may be accessed (Collis and Hussey, 2014; Bell et al., 2018).
Therefore, most of the data used in this study are on an interval scale in which any two adjacent
points are equal (Sekaran, 2003). This scale format is considered one of the best scales for most
scientific work (Nardo et al., 2005) and allows statements on all of the items to be presented
concisely (Sekaran, 2003). Accordingly, respondents may easily compare values and select that
which they agree with (Collis and Hussey, 2014). Additionally, it is beneficial in providing
measures of central tendency, including the arithmetic mean, dispersion (comprised of the
range), standard deviation and variance (Sekaran, 2003). Finally, the interval scale is also
beneficial for transferring data coding onto a spreadsheet, which is simple and straightforward
for statistical software (Sekaran, 2003).
The decision to choose either a 5-point or 7-point Likert scale is based on two crucial points.
The greater the number of scale categories, the finer the discrimination among the measurement
items. According to Hair et al. (2019), the higher the number of scale categories, the larger the
size of the correlation coefficient. However, respondents can find it difficult to comprehend the
complexity of a 7-point scale, compared with a 5-point. A 5-point scale is clearer since 1 =
strongly disagree, 2 = disagree, 3 = neutral, 4 = agree and 5 = strongly agree. When using a 7-
point scale, the respondent must determine the level of their agreement or disagreement
between points 2 and 3 or 5 and 6. Therefore, the questionnaire’s measurement scale chosen
for this study uses a 5-point Likert scale, which has also been adopted by numerous other
studies.

174
In addition to the 5-point scale, a nominal scale is employed to enable this study to categorise
subjects (e.g., respondent gender, company sector, level of education) into specific groups. For
example, respondent gender could be grouped into two groups (male or female), which could
be converted into numerical scales by assigning codes 1 and 2.
6.5 The Questionnaire Format
At this stage, some issues are identified and considered critical to the questionnaire survey
design and development process. Paramount among them is the nature of the research questions
and objectives. The questionnaire survey needs to be well designed to ensure that these were
adequately addressed. Therefore, an introduction is included in the opening section to indicate
the research interests and population and to provide assurances regarding confidentiality. This
helps to encourage cooperation and extract valuable responses.
The self-completed questionnaire includes nine questions and was divided into four sections
(see Appendix A1).
Section A investigates the respondents’ background information. Question one enquired about
the respondent’s gender, age, work experience (years), level of education and professional
position. Question two covers issues relating to their current company, including their
operations, the company’s age and the number of full-time employees at the company. In this
section, questions are simple, collecting general information to build respondent confidence
and encourage their involvement in the study.
Section B contains questions regarding the constructs of the sustainability metrics. The closed-
ended questions covered ECM (question 3), SOM (question 4), and ENM (question 5).
175
Section C investigates the internal factors influencing sustainability performance. The closed-
ended questions were regarding aspects such as motivation (question 6), inhibitors (question
7), and enablers (question 8).
Section D includes questions investigating the external factors influencing sustainability
performance. The closed-ended questions cover issues such as external barriers (question 9).
After the questionnaire had been developed and formatted, it is revived and commented by two
professors on the supervisory team who are familiar with the topic of sustainable development,
and SMEs. This review offers the researcher an opportunity to obtain their valuable comments
and feedback on issues relevant to the questionnaire, such as its content, structure, and
suitability (Saunders, Lewis and Thornhill, 2019). Some minor but necessary amendments are
made to the questionnaire’s structure. The review also enables this study to secure the content
validity of the survey items (Sekaran, 2003).
6.6 Questionnaire Translation
The questionnaire format is initially prepared in English. However, due to the cross-cultural
nature of this study, the instrument was then translated into Vietnamese (the official language
of the country in which this study was conducted) before a pilot study and final run are
conducted for data collection. As such, instruments are appropriately translated to ensure
validity (Cha, Kim and Erlen, 2007; Sperber et al., 2014) and that they carry the same meaning
for all respondents.
There are some translation techniques, such as direct, back, and parallel translation, may be
used in cross-cultural studies for instrument validation. Among these, back translation is the
most popular and widely used method (Cha, Kim and Erlen, 2007). For this reason, back
translation is employed in this current study, which means that the questionnaire in the original

176
language is initially blindly translated by a bilingual translator into the target language
(Mcgorry, 2000). A second independent translator then takes the first translation and
independently translates the questionnaire back into the original language. Following that, the
two versions of the questionnaire are compared to identify any inconsistencies. And if any
mistranslation is found in the back-translated version, a third independent translator retranslates
the item (Cha, Kim and Erlen, 2007). This technique is beneficial in identifying most of the
problems present (Saunders, Lewis and Thornhill, 2019), and checking for language
consistency and ensure semantic equivalence between the original and translated versions
(Cha, Kim and Erlen, 2007; Cui, Liang and Lu, 2015).
The process commences with two bilingual Vietnamese qualified translators who are asked to
translate the survey instrument independently. The first independent translator translates the
English version into Vietnamese. The second independent translator translated the Vietnamese
translation back into English (Cha et al., 2007). The comparison of the two versions reveals
some inconsistencies. When translated back into English, terms such as ‘metrics’ ‘inhibitors’,
‘enablers’, ‘sustainability performance’ and ‘stakeholders’ had obtained additional or divergent
meanings; this requires modification. Some English words, when translated into Vietnamese,
required more specific and longer words. For example, ‘sustainability’ when translated into
Vietnamese requires four words: ‘phát triển bền vững’. This indicates why some of the
Vietnamese statements are too lengthy. Similarly, the term ‘stakeholders’ requires a more
precise clarification in Vietnamese (‘stakeholders (customers, employees, governments,
NGO)’) to avoid misunderstandings. Such a careful explanation is crucial in order to ensure
that the terms could be appropriately understood by the respondents.
Towards the end of the process, the researcher consults with one Vietnamese lecturer in
management at a UK university. Following a discussion of the translation issues, revisions and

177
modifications are completed to produce the final Vietnamese version that is less technical and
more comprehensible for Vietnamese respondents (whose educational and cultural
backgrounds may vary), which is ready for conducting a pilot study.
6.7 The Sample Selection for the Quantitative Study
This section presents the target population and respondent selection, sampling frame, sample
size, and sampling methods for the quantitative phase of this study.
6.7.1 Target Population and Respondent Selection
The primary purpose of this research was to study the sustainability performance of SMEs in
Vietnam. However, there is no single definition of SMEs that is universally accepted (Cong
and Thu, 2020; Jenkins, 2006; Muenjohn et al., 2020). The existing literature indicates that the
proposed definitions of SMEs vary between institutions (Ali et al., 2017), countries (Muenjohn
et al., 2020; Sommer, 2017), and industrial sectors (Nwobu, Faboyede and Onwuelingo, 2015;
Simpson, Padmore and Newman, 2012). SMEs are often defined based on thresholds such as
the number of employees, annual revenue, and total asset value (Hossain and Kauranen, 2016;
Perera and Chand, 2015; Puppim de Oliveira and Jabbour, 2017) or a combination of these
criteria (Kumar et al., 2018). This poses a significant challenge to the study of SMEs (Cong
and Thu, 2020) and can lead to varied interpretations of research findings, making it difficult
to compare studies (Jenkins, 2006).
Thus, it has been suggested that studies on SMEs employ country-specific definitions that are
broadly accepted (Muenjohn et al., 2020; Perera and Chand, 2015). This study employed the
official definition of SMEs provided by the Vietnamese government. Specifically, SMEs were
classified into three major groups: micro, small and medium-sized firms (based on their number
of employees). A micro, small and medium-sized enterprise is categorised as having between

178
1 and 10, 11 and 50, and 51 and 300 employees, respectively (Government Decree No.
90/2001/CP-ND on “Supporting for Development of Small and Medium Enterprises”).
It is essential to note that studies on SMEs’ sustainability initiatives that specifically focus on
different sectors, for instance, production or service sectors, may yield different results (Hatak,
Floh and Zauner, 2015). Therefore, prior empirical studies on identifying sustainability
indicators for SMEs have tended to focus on specific business sectors (e.g. Singh, Olugu and
Fallahpour, 2014; Mengistu and Panizzolo, 2021). This approach enables researchers to
identify particular features of SMEs’ sustainability performance in specific industries and
sectors in greater detail (Malesios et al., 2018). For example, in Garengo and Sharma's 2014
study on contingent factors influencing manufacturing SMEs’ adoption of performance
measurement systems, the author excluded service firms, stating that manufacturing and
services sectors often have different approaches to adopting and using performance
measurement systems (Garengo and Sharma, 2014). Considering the views mentioned here,
focusing on a specific business sector or industry is challenging and unrealistic for the current
study as most SMEs in Vietnam operate as part of the unorganised sector (Trifković, 2017).
Therefore, mixed business sectors were best targeted to reflect the informality, which is a
feature of SMEs in Vietnam, and provide more representative findings.
Thus, it was necessary to define both the characteristics of the population from which the
research sample was drawn and the boundaries of the generalisability of the findings (Saunder
et al., 2018). The target population and representative sample of this study shared the three
following criteria:
179
1. The firm was established in Vietnam and was a non-state enterprise (non-state
enterprises include officially registered households, private firms, cooperatives, limited
liability companies and joint-stock enterprises)
2. The firm had between 10 and 300 full-time employees (SME’s definition by the
Vietnamese government, by Decree 56/2009/ND-CP)
3. The company had obtained or was pursuing at least one ISO certificate/programme. This
criterion resulted from reviewing the existing literature, which indicates that respondents
from developing Asian countries are more likely to depend on internationally recognised
certification, such as ISO 14001, to validate their sustainability credentials (Wu, Roan
and Santoso, 2017). Additionally, it is important to note that the issues and challenges
associated with adopting corporate sustainability development in SMEs are often
reflected through their adoption of ISO 14001 (Bansal, 2002; Ferenhof et al., 2014).
Therefore, the ISO and/or other related sustainability certificates/programmes was a
crucial criterion in the selection of Vietnamese SMEs.
The information used to verify whether SMEs satisfied the three above criteria was obtained
from company annual reports, company websites, internal and external organisations, and
government reports/documents.
This study used a country-based research setting, mainly focusing on SMEs operating in
Southern Vietnam. As stated previously, sustainable development in developing countries is in
its infancy concerning both government policies and company strategies (Azmat, 2010;
Agyemang and Ansong, 2017; Jamali et al., 2017). For this reason, the study was conducted in
large cities with a high density of enterprises which were complying with current laws and
assumed to be among the pioneers responding to the call for sustainability initiatives.

180
Ho Chi Minh City, located in Southern Vietnam, was chosen as the context for this study. This
was for two important reasons. Firstly, Ho Chi Minh City, formerly Saigon, is known as the
economic centre of the country and is the largest and the most dynamic city in Vietnam,
accounting for the highest number of SMEs. However, there remains a lack of research on
SMEs in this context which are contributing towards sustainable development by sustainably
conducting business and thus contributing to the national sustainability goals outlined by the
Vietnamese government. Secondly, Ho Chi Minh City is the hometown of the author of this
study and where they were based at the time of conducting the study, which was a significant
advantage concerning both convenience and the recruitment of participants within his
established social networks. It was hoped that the research purpose could be shared with the
researcher’s Vietnamese fellows, enabling sufficient data to be collected to address the research
questions.
The participants of the current study were SMEs’ owner-managers, who are commonly
considered as key informants (Akhtar et al., 2015; Cassells and Lewis, 2011; Yacob, Wong
and Khor, 2019), and decision-makers regarding firm sustainability engagement (Jenkins,
2006; Fassin, 2008; Wiesner et al., 2017). However, as discussed in Chapter 4, SME owner-
managers often have limited time available as they are occupied with the daily operations of
the business (Revell and Blackburn, 2007). Thus, they are less likely to participate in a survey
for data collection, which can be a serious challenge to obtaining the desired sample (in this
case, at least 315 respondents, as outlined in Section 6.8.1).
Thus, an extant approach was required to integrate multiple informants and increase the
response rate. Instead of taking a monadic view of SME owner-managers, it was better to
integrate the lens of the different relevant actors involved, considering interests and perceptual
and cognitive differences regarding sustainability performance measurement (Baumgartner,

181
2014; Kaufmann and Saw, 2014; Newman, 2006). Doing so provided a more complete picture
of the complex phenomena of sustainability in SMEs (Kaufmann and Saw, 2014; Prashar and
Sunder, 2020). As such, key employees willing to communicate this knowledge with the
researcher were selected (Marshall, 1996).
There is a consensus among researchers that data obtained from multiple informants within a
firm is useful in minimising the potential impact of common method bias (Sarkis et al., 2010;
Font et al., 2016). As Aguinis and Glavas (2012) claim, individuals within an organisation are
likely to be more similar regarding certain variables due to a common organisational culture,
work norms and processes; accordingly, an organisational-level variable may covary with
relevant individual-level variables. Given this, the researcher initially examined whether the
responses from multiple respondents from the same organisation were similar to each other’s
response or conflicting. In the case of any significant conflicting responses from the same
organisation, the researcher would contact that respondent for further clarification. In an
extreme case or the respondent is unable to contact, the researcher would decide to remove
such a conflicting response to ensure that multiple respondents from the same organisation
would not yield different results. Accordingly, this process is the most appropriate way for this
quantitative study to treat responses for a single company as a single response, and to minimise
the potential impact of common method bias. The results did not indicate any significant
conflicting responses from multiple respondents from the same organisation.
In line with the above discussion, at least one to three key respondents within firms were
targeted in this study, depending on the size of the firms (Bourlakis et al., 2014). However, this
was not strict as many SMEs are rather small; in such cases, one key informant was considered
sufficient. A key informant was selected based on the following criteria:
182
1. An employer or employee at an SME in Ho Chi Minh City, Vietnam.
2. A person with an awareness of sustainable development in general and of the
sustainability activities within their current firm.
A pilot study was conducted with 18 participants selected from 10 SMEs in the study area.
These participants were invited to participate in the survey and provide feedback on the
questionnaire in terms of overall content, comprehensibility, style, structure and length
(Tolstoy, 2019). The pilot study was also used to identify any misleading questions or
ambiguities that required modification (Saunders, Lewis and Thornhill, 2019) and determine
potential participant interest (Amrina and Yusof, 2011). All pilot tests were conducted in the
same manner as the surveys administered to the target population: online via an electronic
survey administered through Qualtrics. The pilot tests also confirmed that the survey was
accessible via the hyperlink in the email and could be completed and submitted without error.
Feedback from pilot participants helped to enhance the questionnaire’s validity by rephrasing
some questions and altering the layout and sequence to appear more attractive. These
amendments improved the flow and ease of completion for respondents and ensured that
participants could complete the questionnaire within 20 minutes. Final revisions were
completed and, when there were no further suggestions to improve the questionnaire’s phrasing
or structure, the instrument was considered valid for a final run. The estimation of the required
sample size and acceptable response rate for the questionnaire survey are presented in the
following section.
183
6.7.2 Estimation of the Required Sample Size and Response Rate for the Quantitative
Study
This study employed factor analysis and structural equation modelling (SEM) (presented in
Section 6.9) to analyse the quantitative data. However, these techniques typically require a
relatively large sample size (Tabachnick and Fidell, 2014). Therefore, determining a sufficient
sample size to perform factor analysis and SEM in this study was crucial. Two methods are
suggested in the extant literature to identify the required sample size: using the absolute number
of cases (N) or the cases-to-variables ratio (p) (Tabachnick and Fidell, 2014; Hair et al., 2019).
However, there is currently no consensus among researchers regarding the sufficient sample
size for conducting a factor analysis and SEM. For example, Nunnally (1978) suggested a
sample size that is at least 10 times the number of variables. However, Kline (2005) proposed
100 cases or observations per group. Others have asserted that a sample size of 100-200 is
adequate for performing SEM (Kline, 2005; Tabachnick and Fidell, 20013). For studies with
large numbers of constructs, Hair et al. (2019) suggested that a minimum sample size of 500
cases is adequate to perform SEM. Such wide-ranging suggestions indicate that deciding on an
appropriate sample size is a complex task.
To ensure identification of the proposed statistical model, this study followed the cases-to-
items ratio from 5 to 20 suggested by Hair et al. (2019), where at least 5 to 20 cases are required
for each item. In this study, there were 63 variables; thus, a sufficient sample (N) ranging from
315 to 1,260 was acceptable for performing factor analysis and SEM. A study by Baruch and
Holtom (2008, p.1149) analysing 1,607 studies with 4,000,000 respondents from 2000 to 2005
indicated that the average response rate (r) at an organisational level is 35%, with a standard
deviation of 18.2, which results in a response rate ranging from 16.8-53.2% in organisational
research studies. Accordingly, the following formula was applied to identify the number of
184
distributed questionnaires (Q) to give an acceptable estimated response rate and thus determine
the sufficient sample size required for analysis:
where:
Q: the number of questionnaires that must be distributed
N: the estimated sample required (in this case, N = {315; 1260})
r: the response rate (in this case, r = {16.8; 53.2})
Replacing N and r accordingly, the round-up result indicated that Q was within the range of
1,875 to 2,369.
In summary, the estimated sufficient sample size for this study (315 to 1,260) was adequate for
performing factor analysis and SEM. This estimation was useful in providing first-hand
information to prepare for the data collection process. The actual number of distributed
questionnaires and the actual response rate are given in subsequent sections.
6.7.3 The Sample Design and Data Collection
Two main sampling methods are used in business management research: probability and non-
probability sampling (Collis and Hussey, 2014; Saunders, Lewis and Thornhill, 2019; Bell et
al., 2018). Probability sampling often involves random, stratified, cluster and systematic
sampling. Non-probability sampling often relies on subjective judgments (Saunders, Lewis and
Thornhill, 2019), employing techniques such as quota, convenience, and purposive sampling
(Sekaran and Bougie, 2016).
185
In quantitative inquiry, the dominant sampling strategy is probability sampling, which depends
on selecting a random and representative sample (Hoepfl, 1997) – an unbiased sub-set from a
larger population where each member has an equal chance of being selected (Collis and
Hussey, 2014). The merit of using this approach is its usefulness in generalising research
findings to broad populations (Collis and Hussey, 2014; Saunders, Lewis and Thornhill, 2019;
Bell et al., 2018). Thus, a stratified sampling technique was employed in this study. It is
important to acknowledge that there is no reliable sampling frame available for probability
sampling methods (Singh and Srivastava, 2018). Additionally, difficulties have been reported
regarding the sampling of SMEs in Vietnam (Tran and Jeppesen, 2016b; Trifković, 2017).
Snowball sampling was also used as this technique has often been employed in previous
sustainability studies conducted in Vietnam (Luu, 2016; Nguyen et al., 2020). Therefore, a
combination of stratified and snowball sampling was utilised to collect data during the
quantitative phase in this study. Data collection was conducted in two stages.
The first stage utilised stratified sampling using both probability sampling and purposeful
sampling techniques (Teddlie and Yu, 2007). The targeted population initially generated two
strata, including the service and manufacturing sectors. Drawing on these two strata, samples
for the administration of the questionnaire were randomly self-identified by the researcher from
the Yellow Pages database. This business directory has been suggested as one of the most
valuable sources providing general information on firms, such as company size (number of
employees), business sector, names of owner-mangers, addresses and contact details. This
process resulted in a set of 2,621 email addresses for SMEs in Ho Chi Minh City, Vietnam, in
which the service sector accounted for 1,367 firms; 1,254 firms represented the manufacturing
sector. The obtained set of 2,621 email addresses was then validated for accuracy using
Qualtrics software.
186
In early July 2019, the questionnaire was administered via an email containing a link to the
Qualtrics survey. The email included an invitation, explained the purpose of the study, and
instructed participants on how to complete the survey themselves and how to refer it to an
appropriate person for the same purpose. The researcher also acknowledged their involvement
and hope to advance their knowledge of sustainable development within Vietnamese SMEs
and ultimately identify appropriate metrics to help firms better manage their sustainability
performance, considering their micro and macro conditions. The survey’s launch was
completed in a staggered manner on the mornings of Tuesday and Wednesday as these
weekdays have been suggested as optimal for professional audiences (Sue and Ritter, 2012).
The respondents were given 30 days to complete and return the survey. A reminder was sent
to the same mailing list 10 days after the initial email survey link had been sent in an attempt
to improve response rates. Slightly over 300 email recipients were unreachable for various
reasons (e.g., bounced emails).
It was crucial to obtain a high response rate to reduce the risk of non-response bias and ensure
that the study sample was representative (Saunders, Lewis and Thornhill, 2019). During the
stratified sampling stage, the response rate was low. It was decided to initiate the second stage
in combination with the first stratified sampling stage. Snowball sampling was conducted by
the researcher who obtained professional contacts (SMEs in Ho Chi Minh City) and
recommended his colleagues, friends, and relatives whom they also knew personally. The
researcher requested additional contacts from the initial contacts. A printed questionnaire was
used unless participants requested an online version for their convenience, in which case they
were sent the same version through Qualtrics software. This ensured that the questionnaire was
delivered to the correct respondents so that the researcher could control the number of
questionnaires distributed and calculate the response rate.

187
Of approximately 2,300 valid invitations (emails) sent, only 186 responses were received,
representing a response rate of 8% for the online survey. Of the 700 printed versions that were
distributed, 415 responses were received, representing a response rate of 59.3%. Collectively,
601 responses from approximately 3,000 questionnaires equalled a response rate of
approximately 20%. However, the final usable response rate was not determined until the
completion of data screening. The results for the usable response rate are presented in section
6.10.
6.8 Unit of Analysis
The unit of analysis of the subject refers to ‘the who’ or ‘the what’ of the study (Bell et al.,
2018). The unit of analysis for this study was SMEs registered in Ho Chi Minh City, Vietnam.
The target informants for the survey included SME owner-managers and key employees. These
informants were selected as they have first-hand knowledge and information regarding internal
and external factors that influence the adoption of sustainability metrics within their
organisations.
6.9 Data Analysis Techniques
To achieve the research aims and objectives, this quantitative study employed Structural
Equation Modelling (SEM) methodology using AMOS Graphics (Arbuckle, 2016;
Eikelenboom et al., 2019) to evaluate the relationships between the theoretical constructs
depicted in the research model presented in Figure 4.1 (Chapter 4). Data analysis was
conducted using IBM SPSS AMOS version 26 (IBM Statistical Package for Social Science)
since it is considered one of the most powerful data analysis software programmes for
quantitative data analysis in business research (Sekaran and Bougie, 2016).
188
The main purpose for using SEM is that it has advantages over older methods of multivariate
analysis. First, SEM is an approach to statistical modelling that has the capacity to handle a
vast set of exogenous and endogenous variables, enabling it to describe all the relationships
presented in the research model (Hair et al., 2019; Singh, Chauhan and Tejyan, 2017). In
addition, SEM enabled the current study to deal with both observed and unobserved (i.e., latent)
variables, whereas other multivariate techniques support an analysis of data based solely on
observed measures (Byrne, 2016). Second, the relationships among variables examined by
SEM are free of errors as these can be estimated and eradicated, meaning that only common
variance remains. Removing measurement errors, particularly if they are large, can
substantially increase the accuracy of research (Byrne, 2016). It was therefore possible for this
quantitative study to explicitly address reliability within the analysis (Byrne, 2016;
Tabachnick and Fidell, 2014; Hair et al., 2019).
As presented in section 6.7.2, and in Figure 7.3, SEM was the most suitable multivariate
method for assessing the multidimensional and complex relationships within this quantitative
study, as it consists of multiple regression analysis, factor analysis, and path model analysis
(Singh and Sharma, 2016; Hair et al., 2019), thereby facilitating an all-encompassing and
concurrent test of every relationship (Tabachnick and Fidell, 2014; Rao et al., 2006; Punzo et
al., 2019). The fitted SEM models for the purposes of the current study were tested using
AMOS Version 26 software (Dey et al., 2020; Malesios, 2018). Therefore, SEM was deemed
appropriate for this quantitative study to evaluate the fitness of the research model and test the
hypotheses (H1, H2a, H2b, H3, H4, H5 and H6).

189
Furthermore, this quantitative current study employed a multi‐group analysis AMOS Plug‐in
(Gaskin and Lim, 2018) to assess the potential effects of moderators on the hypotheses of the
research model presented in section 4.5, Chapter 4. The use of multi-group analysis, a helpful
tool in SEM, allowed the researcher to compare two or more groups that were randomly divided
from the study sample (Byrne, 2016). Multi-group analyses were conducted for eight tests:
managerial levels (high-level, low-level), gender (male, female), age of the participant
(young adult, middle-aged), work experience (≤ 5 years, > 5 years), firm size (small, medium),
firm age (≤ 10 years, > 10 years), the business sector (service, manufacturing) and firm’s
sustainability experience (inexperienced, experienced). The primary purpose of conducting
these multi-group analyses was to determine potential differences between the sub-groups in
SMEs’ adoption of SPMS.
To conduct SEM, the researcher followed the six steps (see Figure 6.1) suggested by Hair et
al. (2019): (1) defining individual constructs, (2) developing the overall measurement model,
(3) designing a study to produce empirical results, (4) assessing the validity of the measurement
model, (5) specifying the structural model and (6) assessing the validity of the structural model.
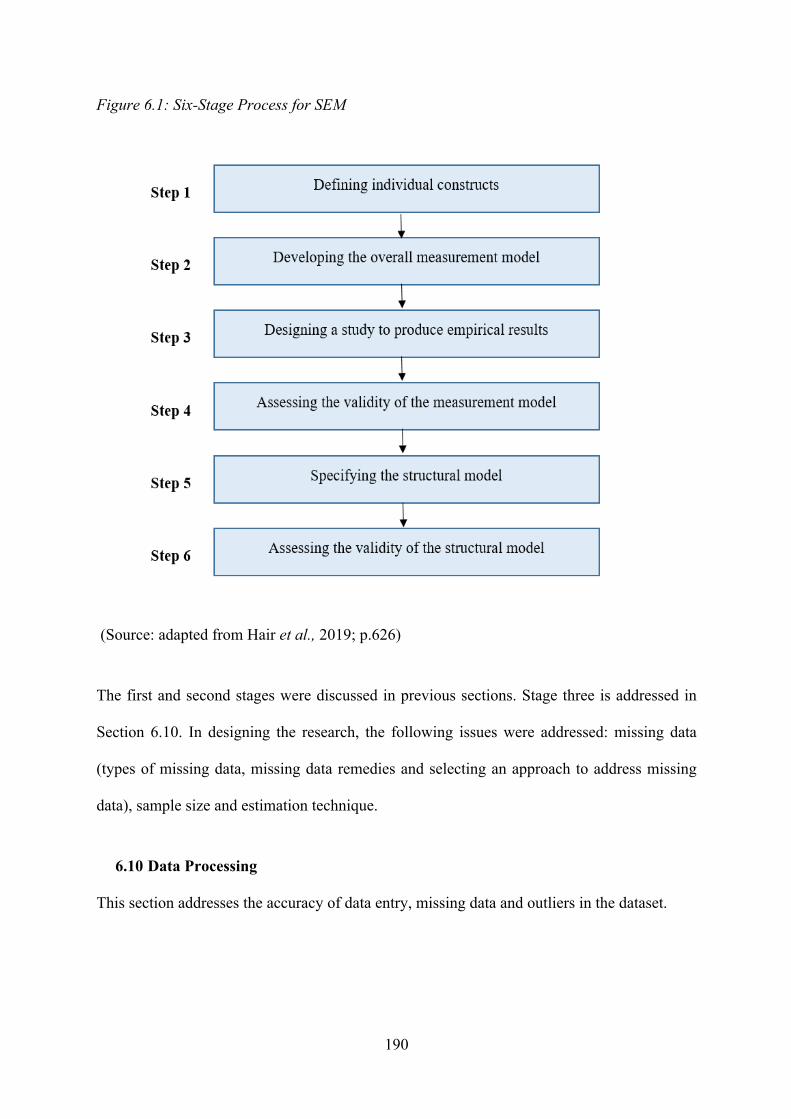
190
Figure 6.1: Six-Stage Process for SEM
(Source: adapted from Hair et al., 2019; p.626)
The first and second stages were discussed in previous sections. Stage three is addressed in
Section 6.10. In designing the research, the following issues were addressed: missing data
(types of missing data, missing data remedies and selecting an approach to address missing
data), sample size and estimation technique.
6.10 Data Processing
This section addresses the accuracy of data entry, missing data and outliers in the dataset.
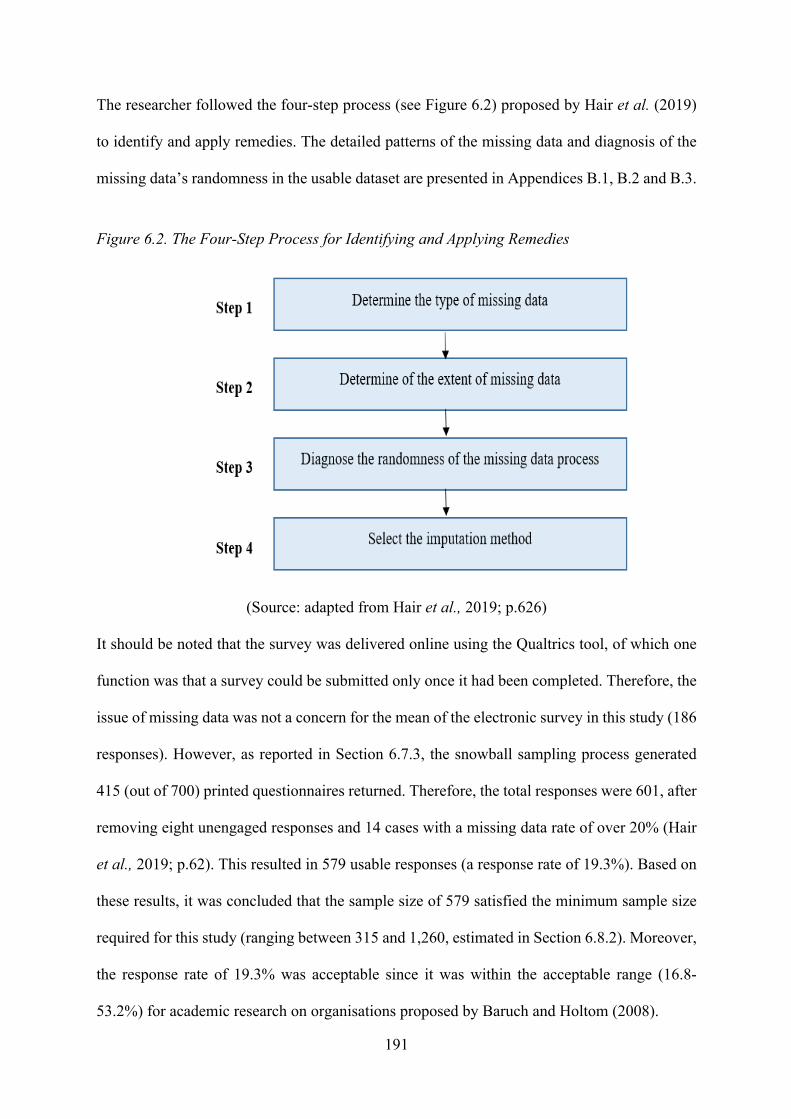
191
The researcher followed the four-step process (see Figure 6.2) proposed by Hair et al. (2019)
to identify and apply remedies. The detailed patterns of the missing data and diagnosis of the
missing data’s randomness in the usable dataset are presented in Appendices B.1, B.2 and B.3.
Figure 6.2. The Four-Step Process for Identifying and Applying Remedies
(Source: adapted from Hair et al., 2019; p.626)
It should be noted that the survey was delivered online using the Qualtrics tool, of which one
function was that a survey could be submitted only once it had been completed. Therefore, the
issue of missing data was not a concern for the mean of the electronic survey in this study (186
responses). However, as reported in Section 6.7.3, the snowball sampling process generated
415 (out of 700) printed questionnaires returned. Therefore, the total responses were 601, after
removing eight unengaged responses and 14 cases with a missing data rate of over 20% (Hair
et al., 2019; p.62). This resulted in 579 usable responses (a response rate of 19.3%). Based on
these results, it was concluded that the sample size of 579 satisfied the minimum sample size
required for this study (ranging between 315 and 1,260, estimated in Section 6.8.2). Moreover,
the response rate of 19.3% was acceptable since it was within the acceptable range (16.8-
53.2%) for academic research on organisations proposed by Baruch and Holtom (2008).
192
6.10.1 Missing Data Treatment and Imputation Method
The survey was delivered online using the Qualtrics tool whereby a survey could be submitted
only once completed. Therefore, the issue of missing data was not a concern for the mean of
the electronic survey in this study (186 responses). However, as reported in Section 6.7.3,
snowball sampling was used to distribute 700 printed questionnaires (427 were returned).
These 427 returned versions were manually checked for possible errors or omissions. Twenty-
two cases with a missing data rate of over 20% were removed (Hair et al., 2019; p.62), resulting
in 405 usable responses and a response rate of 57.9%. The Qualtrics tool was used to input all
of the usable responses to avoid human error.
After checking for missing data, the 579 responses from the questionnaire survey were
downloaded from the Qualtrics platform by exporting them into an SPSS file. Data coding was
then conducted which involved defining and labelling each of the variables and assigning
numbers to each case (response). Specifically, data were transferred relating each variable to
groups, which were considered categories of the variable in question. Numbers were then
assigned to each category to allow the information to be processed by the computer software
(SPSS). Finally, another check was conducted to ensure that there were no typographical errors,
after which the data file was considered ready for statistical analysis.
6.10.2 Outliers and Multivariate Normality
The presence of outliers can affect interpretations of research findings. There are two types of
outliers: univariate or multivariate. According to Tabachnick and Fidell (2014), a univariate
outlier is an extreme value regarding a single variable while multivariate outliers are data points
with extreme values on two or more variables. As stated in Section 6.4, this study used a Likert
scale, which resulted in no univariate outliers of concern as the items are measured based on a
193
predefined scale. Although there can be extreme points of scale, any unexpected errors from
data entry, it can be easily traced back and corrected.
The researcher conducted the Mahalanobis !!statistical test using AMOS software to detect
multivariate outliers across the set of variables. Kline (2011) suggests that a threshold value
with a level of significance of p <0.001 can be considered as a potential outlier. Given that the
remove of outliers is necessary to improve multivariate analysis, Hair et al. (2019) argue that
caution should be taken to avoid harming generalisability. Moreover, Tabachnick and Fidell
(2014, p.110) articulates a concern that “some multivariate outliers hide behind other
multivariate outliers…when the first few cases identified as outliers are deleted, the data set
becomes more consistent and then other cases become extreme.” Thus, the researcher opts not
to remove outliers as has been suggested as the presence of a few outliers in a large sample is
not a significant concern (Kline, 2011).
After screening the data for missing values, normality tests are performed, which is essential
before conducting SEM (Singh and Srivastava, 2018). Screening and scanning the raw data for
any possible errors, omissions or inconsistencies within the data set and checking for any
potential violations of the statistical assumptions are conducted through proper testing to
confirm that basic data assumptions are satisfied for statistical conclusion validity (Narkhede,
2017). The consideration and resolution of these issues allow the researcher to obtain an honest
analysis of data before running the main analysis (Tabachnick and Fidell, 2014; Hair et al.,
2019).
6.11 Estimation Technique
The maximum likelihood estimation (MLE) incorporated into AMOS 26 is applied in this
research. Complete data without any missing values need to be entered to generate results with
194
modification indices. An imputed dataset was therefore produced by running the expectation-
maximisation (EM) imputation on SPSS 26 (IBM, n.d.). This MLE technique is effective as
the missing data are not extensive and are largely random (Hair et al., 2019). EM is a two-stage
iterative technique in which the E stage generates the best estimates with respect to missing
data. Assuming the missing data are replaced, the parameters (means, standard deviations, or
correlations) are estimated in the M stage. This procedure continues until the estimated values
no longer change, which indicates that the missing data has indeed been replaced. Ordinarily,
less than 5% missing data is required to apply EM but, as the next section demonstrates, this
may not be possible for highly skewed data. The official dataset analysed in this current study
is the imputed dataset generated from EM in SPSS.
6.12 Fit Indices
“After the model has been specified and then estimated, the major question is, ‘Is it a good
model?’ One component of a ‘good’ model is the fit between the sample covariance matrix and
the estimated population covariance matrix” (Tabachnick and Fidell, 2014, p.770). As stated
by Hair et al. (2019), the validity of a measurement model depends on two conditions:
acceptable goodness-of-fit levels and proof of construct validity. Considering that many fit
indices are available in the extant literature, there have been inconsistent viewpoints regarding
which indices are the most appropriate to use and the cut-off values for a given fit index. This
study adopted the key indices and cut-off values (see Table 6.2) recommended by Tabachnick
and Fidell (2014) and Hair et al. (2019) to ensure measurement model validity

195
Table 6.1: Summary of the Chosen Fit Indices and Their Cut-off Values
Type of fit Fit index Description Acceptable Fit
Absolute fit Chi-Squared (χ2) Testing of a null hypothesis where the observed sample and SEM estimated covariance are equal, indicating that the model fits perfectly.
Non-significant with a p-value of at least 0.05 (p-value > 0.05), indicating no statistical significance between the two matrices, supporting the idea that the proposed study fits reality.
Normed Fit Chi-Squared (χ2 /df)
Measuring the ratio of χ2 to the degrees of freedom for a model.
2:1 (Tabachnick and Fidell, 2014, p.770) indicates a good-fitting model. 3:1 (Hair et al., 2019, p.638) or less indicates a better-fitting model.
Root Mean Square Error of Approximation (RMSEA)
Representing how well a model fits a population. One advantage is that a confidence interval can be constructed; the range of RMSEA gives a level of confidence. RMSEA is highly recommended for a competing model with a larger sample (> 500 respondents).
Values between 0.03 and 0.08 indicate an adequate fit (Hair et al., 2019, p.637). Values of 0.06 or less indicate a good-fitting model (Tabachnick and Fidell, 2014, p.772).
Incremental fit
CFI (Comparative Fit Index)
Comparative index between proposed null models adjusted for degrees of freedom. Normed, 0-1 range. Highly recommended as the index choice.
Values from 0.92 depending on the number of observed variables and sample size (Hair et al., 2019, p. 642). Values greater than 0.95 indicate a good-fitting model.
Source: Tabachnick and Fidell (2014); Hair et al. (2019)
196
It is important to note that a consistent guideline enables researchers to select an index that
provides “the best fit evidence in one specific analysis and a different index in another analysis
(Hair et al., 2019, pp.639-640). Hair et al. (2019) suggested that researchers employ at least
one incremental index, one absolute index, one χ2 value and one associated degree of freedom,
as the combination of these four indices often provides sufficient information to prove a
model’s fit. Furthermore, although there is a lack of single cut-off values for goodness-of-fit
indices, one way to determine an appropriate cut-off value for a specific index is based on
model characteristics, such as sample size or model complexity (Tabachnick and Fidell, 2014;
Hair et al., 2019). It is important to note that more complicated models and larger samples often
require more relaxed criteria for evaluation with multiple fit indices. Less complex models and
smaller samples usually demand stricter evaluations (Hair et al., 2019). Therefore, reporting
the χ2 value and degrees of freedom, the CFI, and RMSEA were sufficient to evaluate the
goodness-of-fit.
6.13 Full Statistical Research Model before Modification
Figure 6.3 illustrates the full statistical research model before any modification. As shown, the
suggested model constitutes eight latent constructs in which relationships among the constructs
are proposed. For example, one endogenous variable is perceived sustainability metrics (PSM).
The remaining are exogenous variables: motivation (MOT), low managerial perception (LMP),
internal shortcoming (INS), top management supports (TOP), absorptive capacity (ACA),
organisation learning capacity (OLC) and external barriers (EXB).

197
Figure 6.3: Full Statistical Research Model
6.14 The Higher-Order (Second Order) Confirmatory Factor Analysis of
Sustainability Metrics
The higher-order CFA is a theory-driven procedure that can be used to test a second-order
factor structure that contains two layers of latent constructs (Hair et al., 2019). The TBL
concept, discussed in Section 2.3, includes three aspects: economic, social and environment
performances. It should restate that the primary purpose of this study was to identify
appropriate sustainability metrics for SMEs in Vietnam, systematically examining all three
sustainability performances (economic, social and environment) in an integrated manner.
Therefore, using a higher-order (second-order) factor model was more appropriate than a first-
order model. The higher-order model of PSM provided insights into how the three first-order

198
factors, ENM, SOM and ENM, contributed to the overall PSM. The initial CFA of the PSM
construct is presented in Figure 6.4.

199
Figure 6.4: Estimating the Factor Loading for all of the Sustainability Metrics Constructs
(χ2 = 2027.407; degree of freedom = 298; p = .000; χ2/degree of freedom = 6.803; CFI = .765;
TLI = .743; RMSEA = .100)

200
The measurement model for SM was refined by removing any item with factor loadings lower
than .6 (Hair et al., 2019). The items were removed one by one, starting with the lowest loading
value items. Therefore, both ECM4 (.57) and ECM6 (.57) were removed from the ECM
construct. Regarding the SOM construct, four items were frequently removed, including SOM1
(.46), SOM7 (.50), SOM3 (0.58) and SOM8 (0.58). Regarding the ENM construct, five items
were frequently removed, including ENM1 (.53), ENM4 (.53), ENM2 (.54), ENM5 (.55) and
ENM3 (.58). After frequently removing these five items, the loading value of ENM6 was
reduced to .59 and was subsequently removed. The items lower than .6 were removed (Hair et
al., 2019) to give the modified CFA of the PSM construct, presented in Figure 6.5.
Figure 6.5: Estimating the Factor Loading for the Remaining Sustainability Metrics Constructs
(to be continuously modified)
201
(χ2 =327.173; degree of freedom = 76; p = .000; χ2/degree of freedom = 4.305; CFI = .937;
TLI = .925; RMSEA = .076)
The fit indexes achieved a slightly lower level than that required. All variables had good factor
loadings above .6 for the two constructs of SOM and ENM. However, the variable of SOM4
obtained the lowest loading value (0.62) compared with other factors in the construct of SOM.
Therefore, to ensure the discriminant validity of the construct, SOM4 was removed.
In the construct of ENM, the variable of ENM7 obtained a loading value of 0.65, which was
far lower than other factors in the construct. A possible explanation for this is that this variable
was related to the ratio of wastewater, which may not be relevant to respondents who believed
that their firms did not generate an excess of wastewater during operations. To ensure the
discriminant validity of the construct, therefore, ENM7 (0.65) was removed. Furthermore, EN8
(water consumption) and EN9 (waste disposal) residuals also co-varied highly with each other
(M.I. = 49.109). It was surprising that respondents did not notice the differences between the
two. Therefore, an additional path between EN8 and EN9 error terms was added to the
measurement model as the items were within the same construct and next to each other in the
survey (Byrne, 2013). The final PSM construct with the factor loadings and CFA indices are
presented in Figure 6.6.
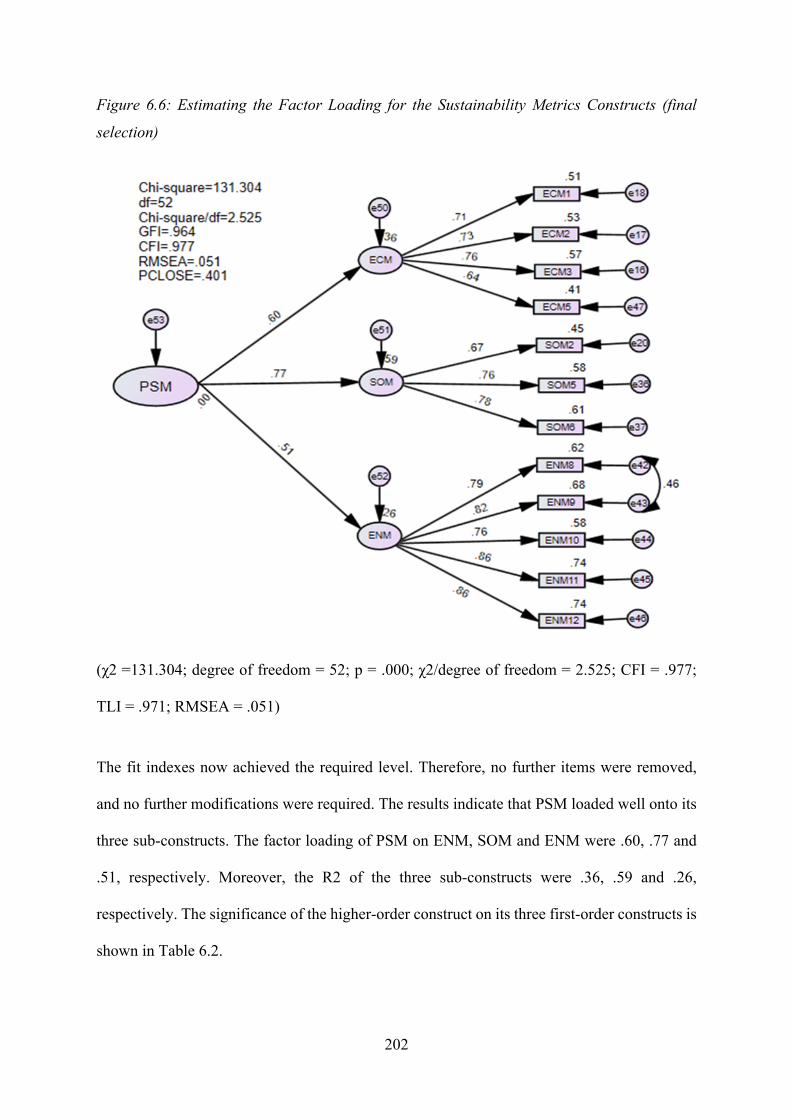
202
Figure 6.6: Estimating the Factor Loading for the Sustainability Metrics Constructs (final
selection)
(χ2 =131.304; degree of freedom = 52; p = .000; χ2/degree of freedom = 2.525; CFI = .977;
TLI = .971; RMSEA = .051)
The fit indexes now achieved the required level. Therefore, no further items were removed,
and no further modifications were required. The results indicate that PSM loaded well onto its
three sub-constructs. The factor loading of PSM on ENM, SOM and ENM were .60, .77 and
.51, respectively. Moreover, the R2 of the three sub-constructs were .36, .59 and .26,
respectively. The significance of the higher-order construct on its three first-order constructs is
shown in Table 6.2.
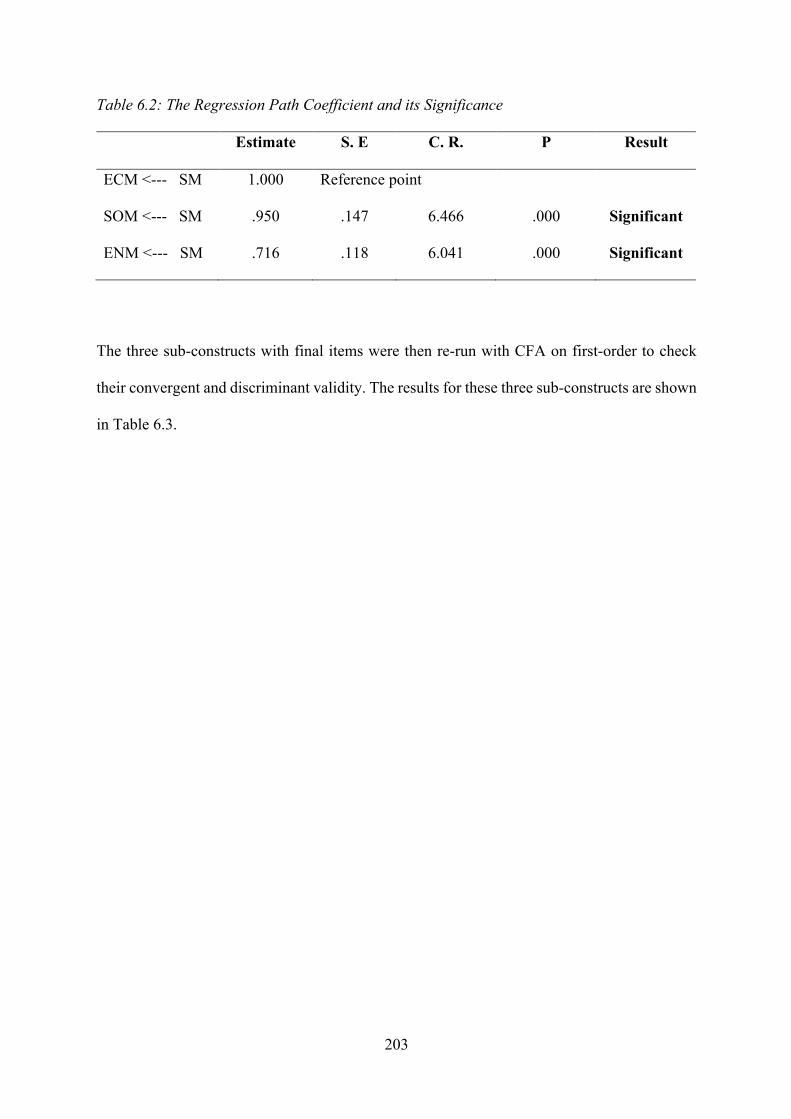
203
Table 6.2: The Regression Path Coefficient and its Significance
Estimate S. E C. R. P Result
ECM <--- SM 1.000 Reference point
SOM <--- SM .950 .147 6.466 .000 Significant
ENM <--- SM .716 .118 6.041 .000 Significant
The three sub-constructs with final items were then re-run with CFA on first-order to check
their convergent and discriminant validity. The results for these three sub-constructs are shown
in Table 6.3.

204
Table 6.3: CFA Results for ECM, SOM and ENM
Construct Items Factor
Loading
Average
Variance
Extracted
(AVE)
Composite
Reliability
Maximum
Shared
Variance
ECM ECM1 .733 .514 .808 .222
ECM2 .729
ECM3 .753
ECM5 .647
SOM SOM2 .652 .539 .777 .222
SOM5 .764
SOM6 .781
ENM
ENM8 .855 .690 .917 .123
ENM9 .882
ENM10 .750
ENM11 .826
ENM12 .835
As presented in Table 6.3, each item significantly loaded onto its corresponding construct (p <
0.001) and ranged between .647 and .882. The composite reliability of each construct ranged
between .777 and .917 and was higher than the benchmark of .70 suggested by Hair et al.
(2019), resulting in no validity concern. The convergent validity was acceptable as the AVE
for each dimension was more significant than the 0.5 thresholds (Hair et al., 2019).
Furthermore, the square root of AVE was greater than the inter-construct correlations (Fornell
and Larcker, 1981) and the maximum-shared variance (MSV) was less than the AVE,
confirming that the discriminant validity was satisfied.

205
Thus, the final construct of PSM with four ECM variables, three SOM variables and five ENM
variables was used in the pooled CFA and SEM higher-order to analyse the internal and
external factors and outcomes of the sustainability metrics. Therefore, further modification of
the construct would be based on the actual fitness of the pooled CFA models.
6.15 Conclusion
This chapter has presented the methods and procedures used to conduct quantitative research
and test the hypotheses presented in the previous chapter. This chapter has discussed fourteen
sections, covering quantitative data collection methods, the development of measurement
models, measurement scale, questionnaire format, translation of the quantitative questionnaire,
quantitative sampling, units of analysis, respondent selection, data analysis and processing
techniques, estimation technique, the statistical model before modification, the confirmatory
factor analysis of dynamic capabilities, the confirmatory factor analysis of competitive
advantage, and fit indices. Each section of this chapter has provided details the logic underlying
the research decisions made. The final construct of PSM with four ECM variables, three SOM
variables and five ENM variables have been used in the pooled CFA and SEM higher-order to
analyse the internal and external factors and outcomes of the sustainability metrics.
The following chapter presents the quantitative research results and discussion.
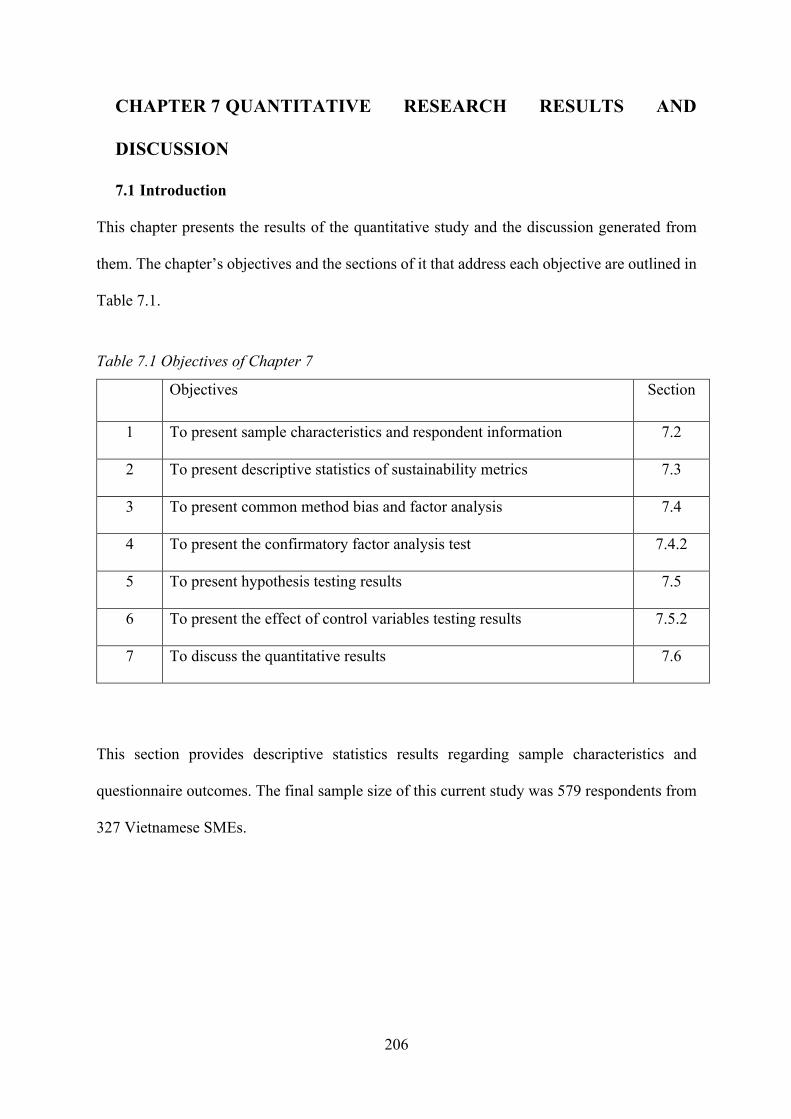
206
CHAPTER 7 QUANTITATIVE RESEARCH RESULTS AND
DISCUSSION
7.1 Introduction
This chapter presents the results of the quantitative study and the discussion generated from
them. The chapter’s objectives and the sections of it that address each objective are outlined in
Table 7.1.
Table 7.1 Objectives of Chapter 7
Objectives Section
1 To present sample characteristics and respondent information 7.2
2 To present descriptive statistics of sustainability metrics 7.3
3 To present common method bias and factor analysis 7.4
4 To present the confirmatory factor analysis test 7.4.2
5 To present hypothesis testing results 7.5
6 To present the effect of control variables testing results 7.5.2
7 To discuss the quantitative results 7.6
This section provides descriptive statistics results regarding sample characteristics and
questionnaire outcomes. The final sample size of this current study was 579 respondents from
327 Vietnamese SMEs.

207
7.2 Sample Characteristics
The sample that is classified according to SMEs’ sectors is depicted in Table 7.4. It is evident
that studied firms in service sector and manufacturing sector accounted for 30.3% and 28.4%,
respectively; which comprised two sectors that obtained the highest proportion among the
sample. The others share the remaining with the lowest (3.7%), is recorded for the sector of
Agriculture, Forestry and Fishing.
Table 7.2 Firms Classified according to their Business Sectors
Sector Frequency Percentage (%)
Service 99 30.3
Manufacturing 93 28.4
Wholesale and Retail Trading 51 15.6
Construction 39 11.9
Accommodation and Food Services 17 5.2
Rental, Hiring and Real Estate 16 4.8
Agriculture, Forestry and Fishing 12 3.7
Total 327 100.0
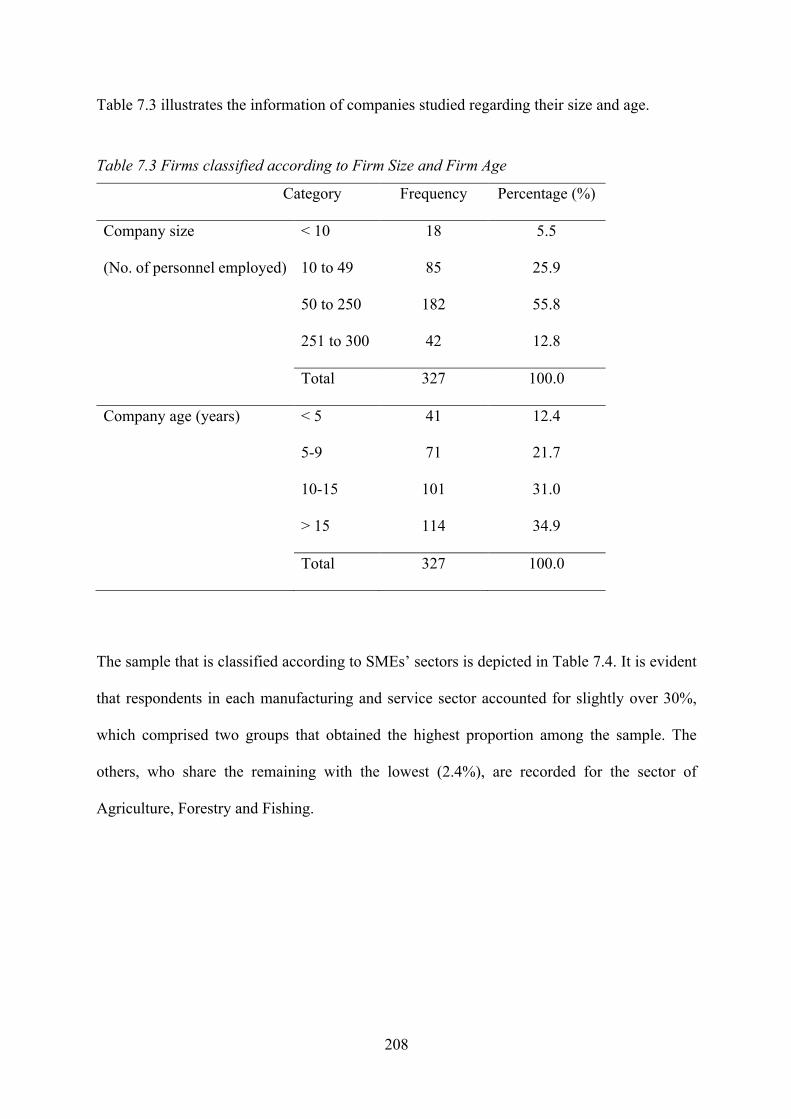
208
Table 7.3 illustrates the information of companies studied regarding their size and age.
Table 7.3 Firms classified according to Firm Size and Firm Age
Category Frequency Percentage (%)
Company size
(No. of personnel employed)
< 10 18 5.5
10 to 49 85 25.9
50 to 250 182 55.8
251 to 300 42 12.8
Total 327 100.0
Company age (years) < 5 41 12.4
5-9 71 21.7
10-15 101 31.0
> 15 114 34.9
Total 327 100.0
The sample that is classified according to SMEs’ sectors is depicted in Table 7.4. It is evident
that respondents in each manufacturing and service sector accounted for slightly over 30%,
which comprised two groups that obtained the highest proportion among the sample. The
others, who share the remaining with the lowest (2.4%), are recorded for the sector of
Agriculture, Forestry and Fishing.

209
Table 7.4 Respondents Classified according to their Business Sectors
Sector Frequency Percentage (%)
Service 191 33.0
Manufacturing 183 31.6
Wholesale and Retail Trading 82 14.2
Construction 52 9.0
Accommodation and Food Services 29 5.0
Rental, Hiring and Real Estate 28 4.8
Agriculture, Forestry and Fishing 14 2.4
Total 579 100.0
Table 7.5 presents respondents’ characteristics regarding gender, age, managerial positions,
level of education and experience. As illustrated, respondents with incomplete high school
(0.2%) and just high school qualifications (6.6%), accounted for 6.8% of the sample. This result
agrees well with the recent findings of Tran and Pham (2020) who found that education level
of the CEO of the SMEs in Vietnam is relatively low; and confirmed there is a positive
association between CEO education and the possibility of corporate environment performance.
The result from this quantitative study corroborates with the finding of Giang et al. (2018)
highlighting these has been a low educational level of employees in Vietnamese firms.
Accordingly, the educational level of owners/managers and employees may indicate the SMEs’
capacity to learn and adopt new sustainability initiatives like SPMS (Liu and Anbumozhi,
2009).

210
Table 7.5: Profile Summary of Respondents
Category Frequency Percentage (%)
Gender Male 306 52.8
Female 273 47.2
579 100.0
Age 18-25 62 10.7
26-34 259 44.7
35-40 145 25.0
41-45 52 9.0
46-50 33 5.7
<50 28 4.8
579 100.0
Position
Owner 30 5.2
Owner-Manager 38 6.6
Director 49 8.5
Sr. Manager 104 18.0
Jr. Manager 180 31.1
Staff 178 30.7
579 100.0
Level of
education
Incomplete high school 1 0.2
Complete high school 38 6.6
Undergraduate degree 409 70.6
Master’s degree and above 131 22.6
579 100.0
Working
experience (years)
1-5 176 30.4
6-10 226 39.0
11-15 97 16.8
<15 80 13.8
Total 579 100.0

211
7.3 Descriptive Statistics of Sustainability Metrics
This section provides descriptive statistics of the preliminary sustainability metrics, including
those that were removed for the Higher-Order (Second Order) already included in Section 6.14.
7.3.1 Descriptive Statistics of Economic Metrics
As indicated in Table 7.6, all the economic metrics have mean scores greater than 4, ranging
from 4.074 to 4.421 and standard deviation in the range of 0.667 to 0.739. The overall mean
scores indicate that all economic metrics received a highly positive reaction from participants.
The table also illustrates that net profit (ECM3) obtained the highest mean score (M= 4.421),
with the lowest standard deviation (SD= 0.667), and R&D expenditure (ECM6) received the
lowest mean score (M= 4.074), whereas the second-highest standard deviation was (SD=
0.734). This finding indicates that SMEs, owing to resource constraints, considered net profit
as the most important metric while expenditure on R&D was view as less important metrics.
While the metric of tax payment (M= 4.150) obtained the second-lowest mean score which can
be explained by the fact that every firm is required by the regulations to comply with this.
Table 7.6 Descriptive Statistics of Economic Metrics
No Items Description Mean SD
1 ECM1 Return on investment 4.240 0.730
2 ECM2 Operating profit 4.370 0.690
3 ECM3 Net profit 4.421 0.667
4 ECM4 Tax payments 4.150 0.739
5 ECM5 Operational costs 4.299 0.703
6 ECM6 R&D expenditure 4.074 0.734

212
7.3.2 Descriptive Statistics of Social Metrics (SOM)
As depicted in Table 7.7, all of the social metrics have mean scores greater than 4, ranging
from 3.936 to 4.484; and standard deviation (SD) in the range of 0.571 to 0.897. The overall
mean scores generally imply that all social metrics receive a relatively high positive reaction
from participants. The result from these findings appears to indicate that participants from
SMEs place their highest priorities on three metrics for customer satisfaction (M= 4.484),
customer complaints (M= 4.416), and employee job satisfaction (M=4.375). This result can be
explained by the discussion in the literature that SMEs often rely on key customers to conduct
business and to survive, and that employees are an important asset to a company. Among the
social metrics, employee turnover (SOM1) achieved the lowest mean score (M= 3.936) with
the highest standard deviation (SD= 0.897). This might be because ‘employee turnover’ is a
negative metric, possibly relatively sensitive to participants from all managerial positions in
SMEs.
Table 7.7 Descriptive Statistics of Social Metrics
No Items Description Mean SD
1 SOM1 Employee turnover 3.936 0.897
2 SOM2 Employee job satisfaction 4.375 0.597
3 SOM3 Employee training and development 4.285 0.620
4 SOM4 Health and safety in the workplace 4.434 0.658
5 SOM5 Customer satisfaction 4.484 0.571
5 SOM6 Customer complaints 4.416 0.601
7 SOM7 Charitable donation 4.047 0.691
8 SOM8 Community involvement 4.103 0.672
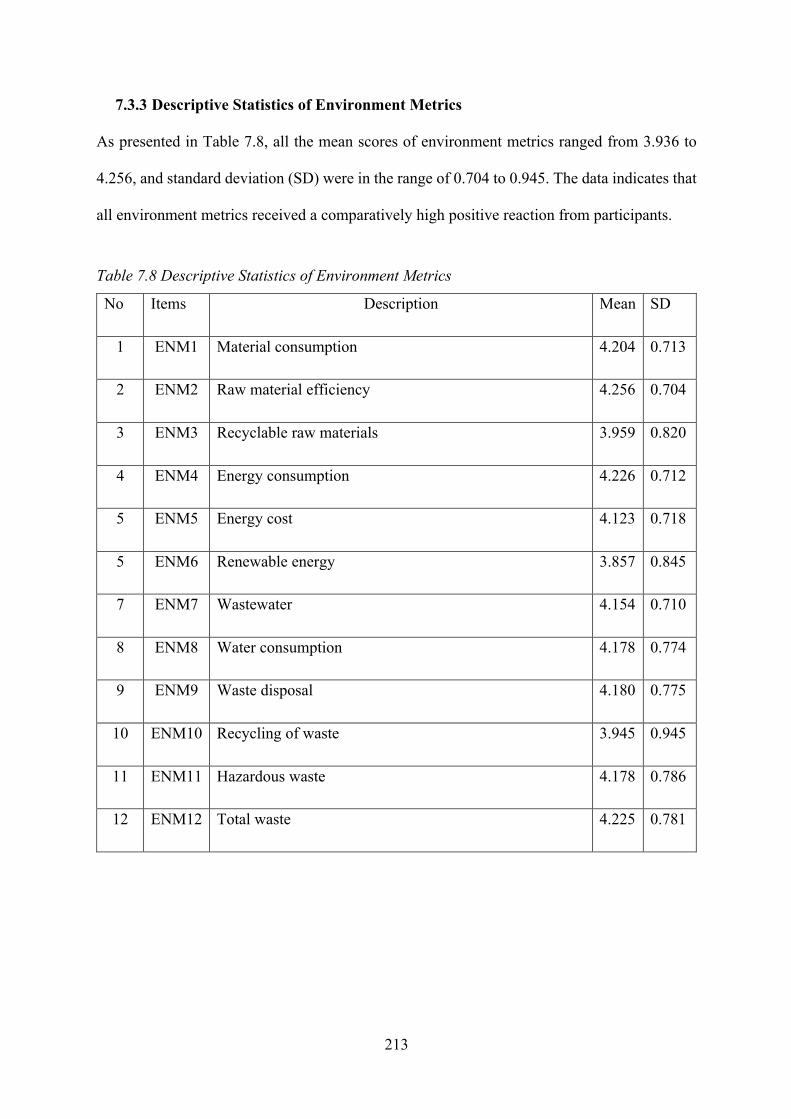
213
7.3.3 Descriptive Statistics of Environment Metrics
As presented in Table 7.8, all the mean scores of environment metrics ranged from 3.936 to
4.256, and standard deviation (SD) were in the range of 0.704 to 0.945. The data indicates that
all environment metrics received a comparatively high positive reaction from participants.
Table 7.8 Descriptive Statistics of Environment Metrics
No Items Description Mean SD
1 ENM1 Material consumption 4.204 0.713
2 ENM2 Raw material efficiency 4.256 0.704
3 ENM3 Recyclable raw materials 3.959 0.820
4 ENM4 Energy consumption 4.226 0.712
5 ENM5 Energy cost 4.123 0.718
5 ENM6 Renewable energy 3.857 0.845
7 ENM7 Wastewater 4.154 0.710
8 ENM8 Water consumption 4.178 0.774
9 ENM9 Waste disposal 4.180 0.775
10 ENM10 Recycling of waste 3.945 0.945
11 ENM11 Hazardous waste 4.178 0.786
12 ENM12 Total waste 4.225 0.781

214
7.4 Common Methods Bias and Factor Analysis
7.4.1 Assessing Collinearity, Multi-collinearity, Validity and Reliability
Tolerance and VIF check
Before the structural model is assessed, the potential problems of collinearity between the
constructs of the model should be examined (Tabachnick and Fidell, 2014; Hair et al., 2019).
There are two methods of identifying multi-collinearity: evaluating the values of tolerance, and
variance inflation factors (VIF) (Hair et al., 2019).
Drawing on the cut-off threshold, Hair et al. (2019, p.316) suggested that the tolerance value
is 0.1, which corresponds to a value of 10 and is acceptable for any structural model. The result
revealed that the tolerance values ranged from 0.76 to 0.88, and were larger than the threshold
of 0.1; this indicates that multi-collinearity is not a problem, whereas VIF values were in the
range of 1.14 to 1.30 and were all well below the rule-of-thumb cut-off of 10. The findings
enabled the researcher to ensure a small degree of correlation among the independent variables,
subsequently confirming that multi-collinearity was not a problem in this study (Hair et al.,
2019).
In order to assess the validity and reliability of the measurement model, a confirmatory factor
analysis (CFA) was used in which each item was restricted to load only onto its specified factor,
and all items were allowed to correlate with one another. Promax rotation was chosen because
the dataset is reasonably large (n = 579), and it can account for the correlated factors (Singh,
Chauhan and Tejyan, 2017). The model was defined by removing indicators with factor
loadings below 0.6. Full details of factor loadings and of which items were eliminated and
which were retained are presented in Table 7.9.

215
Table 7.9: Factor Loading Results
Constructs Items Code Factor
loadings
Economic Metrics
Return on investment (ROI) ECM1 .733 Operating profit ECM2 .730
Net profit ECM3 .752 Operational costs ECM5 .648
Social Metrics Employee job satisfaction SOM 2 .655
Customer satisfaction SOM5 .760 Customer complaints SOM6 .782
Environment Metrics
Water consumption ENM8 .856
Waste disposal ENM9 .882 Recycling of waste ENM10 .749 Hazardous waste ENM11 .824
Total waste ENM12 .836 Motivation Cost reductions MOT1 .710
Increased efficiencies MOT2 .734
Better image among employees MOT3 .710 Better image among customers MOT4 .753
Low Managerial Perception
Lack of owner interest LMP1 .597
Slow recovery of investment LMP2 .720 Perceived risk and uncertainties LMP3 .766
Internal Shortcomings
Extra investment required (additional cost involved: implementing, monitoring, labour cost)
INS1
.743
Limited sustainability knowledge and expertise for an SPMS
INS2 .808
Lack of sustainability measurement tool/framework INS3 .810 Top Management Support
Top management team communicates a clear and positive vision of SPMS.
TOP1
0.729
Top management team is committed, involved and fully supports the implementation of SPMS.
TOP2
0.787

216
Top management team can provide adequate resources to support the implementation of SPMS.
TOP3 .650
Absorptive Capacity
Our company provides formal education and training so that employees may obtain novel knowledge.
ACA1
.701
Our company establishes reward and recognition systems which encourage employees to obtain working skills and experience.
ACA2
.760
Our company has experience with ISO and/or has obtained sustainability certificates/programmes which have some advantages for knowledge acquisition and assimilation to support SPMS.
ACA3 .722
Organisational Learning Capacity
In our company, people are encouraged to present new ideas and contribute their opinions.
OLC1 .650
In our company, people feel involved in company decisions.
OLC2 .732
In our company, free and open communication is encouraged.
OLC3
.767
External Barriers
Lack of government support in terms of information or seminars/workshops about sustainable development.
EXB1
.810
Lack of government laws and regulations. EXB2 .618 Lack of economic incentives and rewards for firms engaging in sustainability.
EXB3 .723
Lack of local consumer demand on sustainable products/services.
EXB4 .603
As presented in Table 7.9, the items in bold code are the final measurement items for the
statistical model. For the construct of external barriers, all items are loaded on one factor,
except for one (EB4), which needed to be removed in order to obtain a good internal
consistency of alpha > 0.70 (Moons and De Pelsmacker, 2015).
Therefore, the chosen items for the statistical model are depicted in Table 7.10 below.
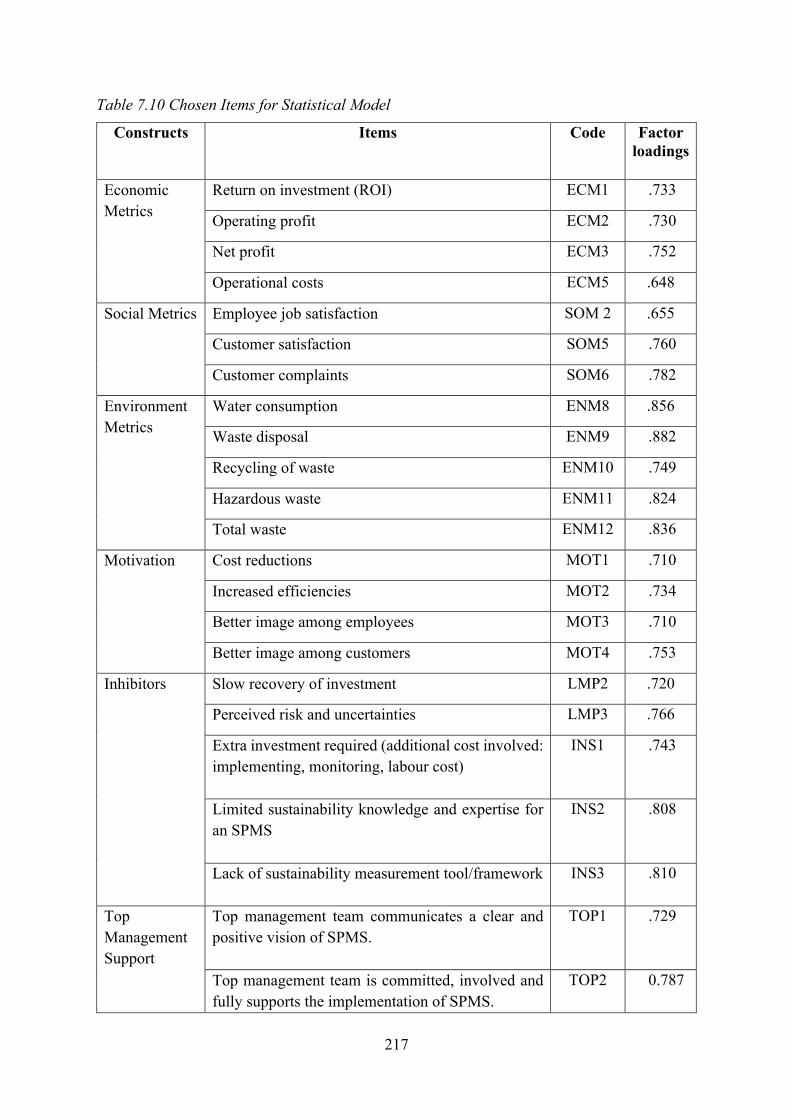
217
Table 7.10 Chosen Items for Statistical Model
Constructs Items Code Factor
loadings
Economic Metrics
Return on investment (ROI) ECM1 .733
Operating profit ECM2 .730
Net profit ECM3 .752
Operational costs ECM5 .648
Social Metrics Employee job satisfaction SOM 2 .655
Customer satisfaction SOM5 .760
Customer complaints SOM6 .782
Environment Metrics
Water consumption ENM8 .856
Waste disposal ENM9 .882
Recycling of waste ENM10 .749
Hazardous waste ENM11 .824
Total waste ENM12 .836
Motivation Cost reductions MOT1 .710
Increased efficiencies MOT2 .734
Better image among employees MOT3 .710
Better image among customers MOT4 .753
Inhibitors Slow recovery of investment LMP2 .720
Perceived risk and uncertainties LMP3 .766
Extra investment required (additional cost involved: implementing, monitoring, labour cost)
INS1 .743
Limited sustainability knowledge and expertise for an SPMS
INS2 .808
Lack of sustainability measurement tool/framework
INS3 .810
Top Management Support
Top management team communicates a clear and positive vision of SPMS.
TOP1 .729
Top management team is committed, involved and fully supports the implementation of SPMS.
TOP2 0.787
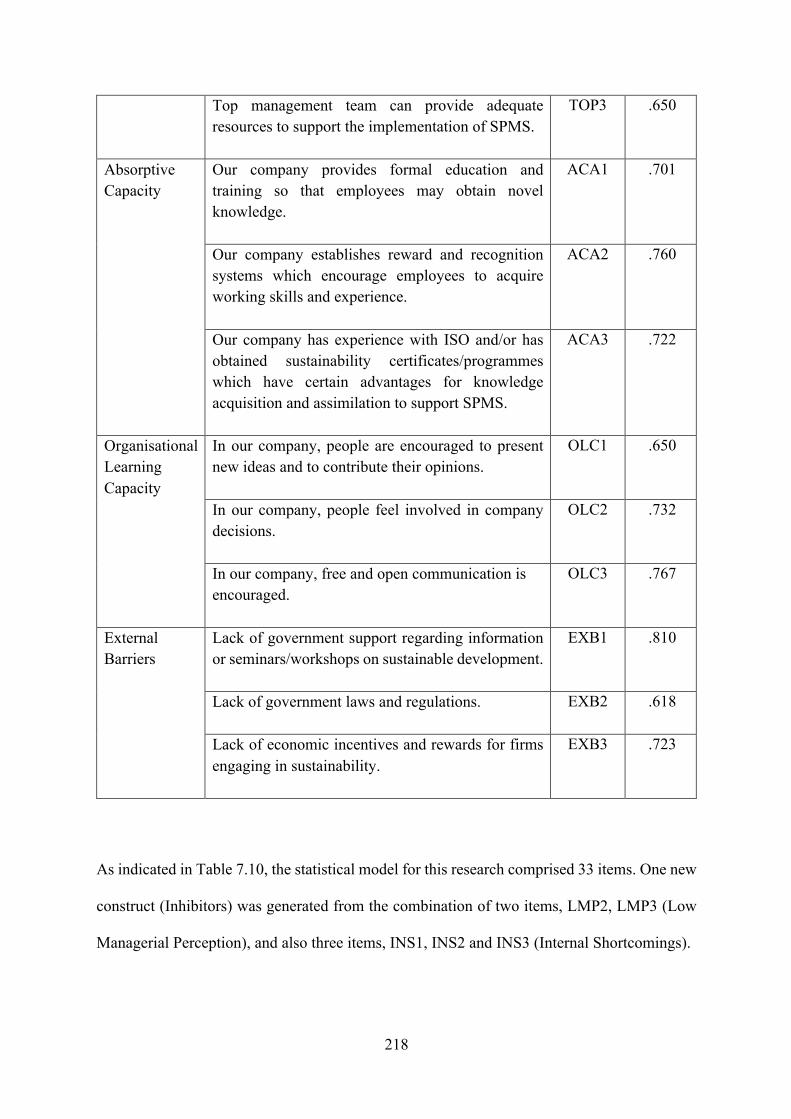
218
Top management team can provide adequate resources to support the implementation of SPMS.
TOP3 .650
Absorptive Capacity
Our company provides formal education and training so that employees may obtain novel knowledge.
ACA1 .701
Our company establishes reward and recognition systems which encourage employees to acquire working skills and experience.
ACA2 .760
Our company has experience with ISO and/or has obtained sustainability certificates/programmes which have certain advantages for knowledge acquisition and assimilation to support SPMS.
ACA3 .722
Organisational Learning Capacity
In our company, people are encouraged to present new ideas and to contribute their opinions.
OLC1 .650
In our company, people feel involved in company decisions.
OLC2 .732
In our company, free and open communication is encouraged.
OLC3 .767
External Barriers
Lack of government support regarding information or seminars/workshops on sustainable development.
EXB1 .810
Lack of government laws and regulations.
EXB2 .618
Lack of economic incentives and rewards for firms engaging in sustainability.
EXB3 .723
As indicated in Table 7.10, the statistical model for this research comprised 33 items. One new
construct (Inhibitors) was generated from the combination of two items, LMP2, LMP3 (Low
Managerial Perception), and also three items, INS1, INS2 and INS3 (Internal Shortcomings).

219
7.4.2 Confirmatory Factor Analysis Test
7.4.2.1 Final Measurement Model
The overall fit indices suggest a good fit for the measurement model.
Figure 7.1 Final Measurement Model
(χ2 = 926.794; df = 472; p = .000; χ2/df = 2.130; CFI = .945; TLI = .928; RMSEA = .041).
The Chi-squared statistics (χ2/df = 1.964 < 3), RMSEA (< 0.07), the CFI = .945; the TLI =
.939 indicate a good fit for the model with the number of observed variables (m) higher than
30 (m = 33), and the number of observations (N) in excess of 500 (N = 579) (Hair et al., 2019,
p.642).
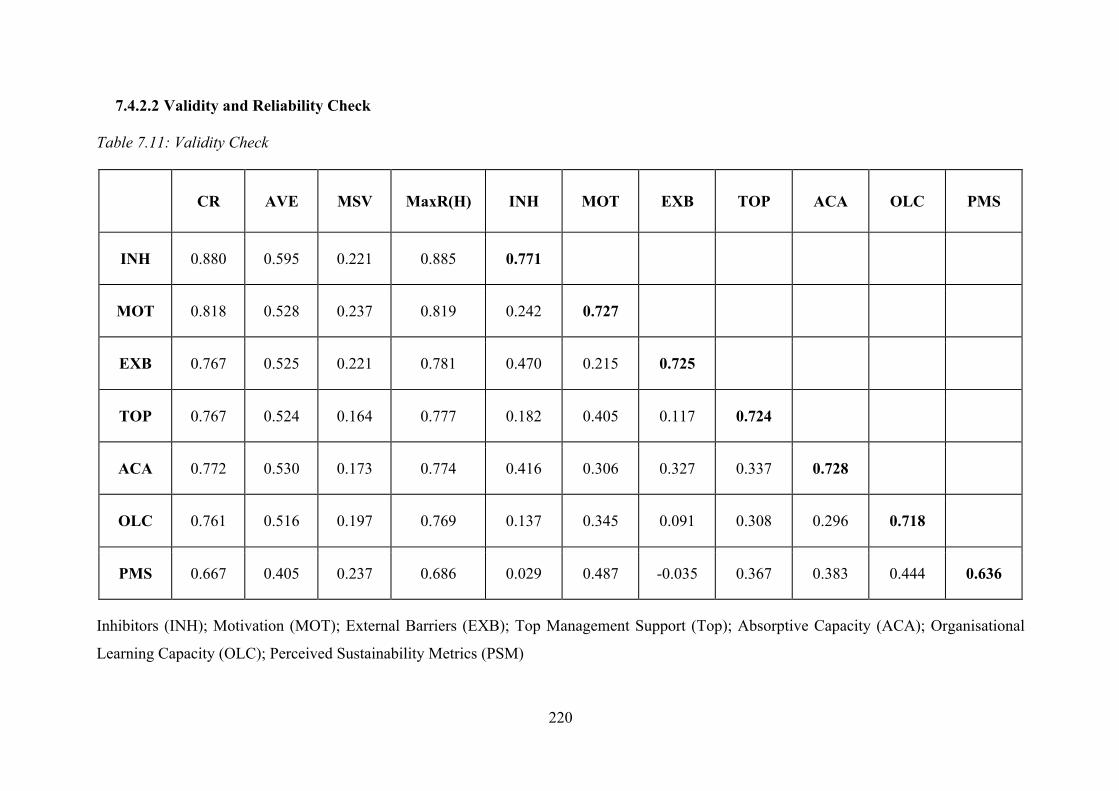
220
7.4.2.2 Validity and Reliability Check
Table 7.11: Validity Check
CR AVE MSV MaxR(H) INH MOT EXB TOP ACA OLC PMS
INH 0.880 0.595 0.221 0.885 0.771
MOT 0.818 0.528 0.237 0.819 0.242 0.727
EXB 0.767 0.525 0.221 0.781 0.470 0.215 0.725
TOP 0.767 0.524 0.164 0.777 0.182 0.405 0.117 0.724
ACA 0.772 0.530 0.173 0.774 0.416 0.306 0.327 0.337 0.728
OLC 0.761 0.516 0.197 0.769 0.137 0.345 0.091 0.308 0.296 0.718
PMS 0.667 0.405 0.237 0.686 0.029 0.487 -0.035 0.367 0.383 0.444 0.636
Inhibitors (INH); Motivation (MOT); External Barriers (EXB); Top Management Support (Top); Absorptive Capacity (ACA); Organisational
Learning Capacity (OLC); Perceived Sustainability Metrics (PSM)

221
AVE: Average Variance Extract
CR: Composite Reliability
MSV: Maximum Shared Variance
It is evident from Table 7.11 that the results indicate that the composite reliability (CR) of the
majority of the variables, except the PSM measure (Perceived Sustainability Metrics), are
above 0.7 threshold (Hair et al. (2019), resulting in no validity concern. Convergent validity is
acceptable as the average variance extract (AVE) for each dimension which exceeded the 0.5
threshold (Hair et al., 2019). Furthermore, the square root of AVE is greater than the inter-
construct correlations (Fornell and Larcker, 1981), and the maximum-shared variance (MSV)
is less than AVE, thereby confirming that discriminant validity is satisfied.
With regard to the measure of PSM (Perceived Sustainability Metrics), Table 7.10 indicates
that the composite reliability (CR) was 0.667 which falls slightly below the 0.70 level, and the
average variance extracted (AVE) is 0.405, which is below the recommended level of 0.5. In
consideration of this, Fornell and Larcker (1981) stated that if AVE is below 0.5, but the
composite reliability is greater than 0.6, the convergent validity of the construct remains
adequate. However, according to Fornell and Larcker (1981, p.46), the average variance
extracted may be a more conservative estimate of the validity of the measurement model, and
“on the basis of Pn (composite reliability) alone, the researcher may conclude that the
convergent validity of the construct is adequate, even though more than 50% of the variance is
due to error.” As the composite reliability of the three constructs (ECM, SOM, ENM) are well
above the recommended level (already presented in Section 6.15), the internal reliability of the
measurement items is acceptable.
Table 7.12 indicates CFA results for all constructs.

222
Table 7.12: CFA Results for All Constructs
Constructs Items Factor loading AVE CR MSV
Perceived Sustainability
Metrics (PSM)
ECM1 .731 0.405 0.667 0.237
ECM2 .721
ECM3 .724
ECM5 .641
SOM2 .663
SOM5 .779
SOM6 .791
ENM8 .789
ENM9 .821
ENM10 .758
ENM11 .860
ENM12 .862
Motivation (MOT) MOT1 .710 .528 .818 .237
MOT2 .735
MOT3 .709
MOT4 .753
Inhibitors (INH)
INS1 .748 .595 .880 .221
INS2 .816
INS3 .825
LMP2 .705
LMP3 .757
Top Management Support
(TOP)
TOP1 .730 .524 .767 .164
TOP2 .787
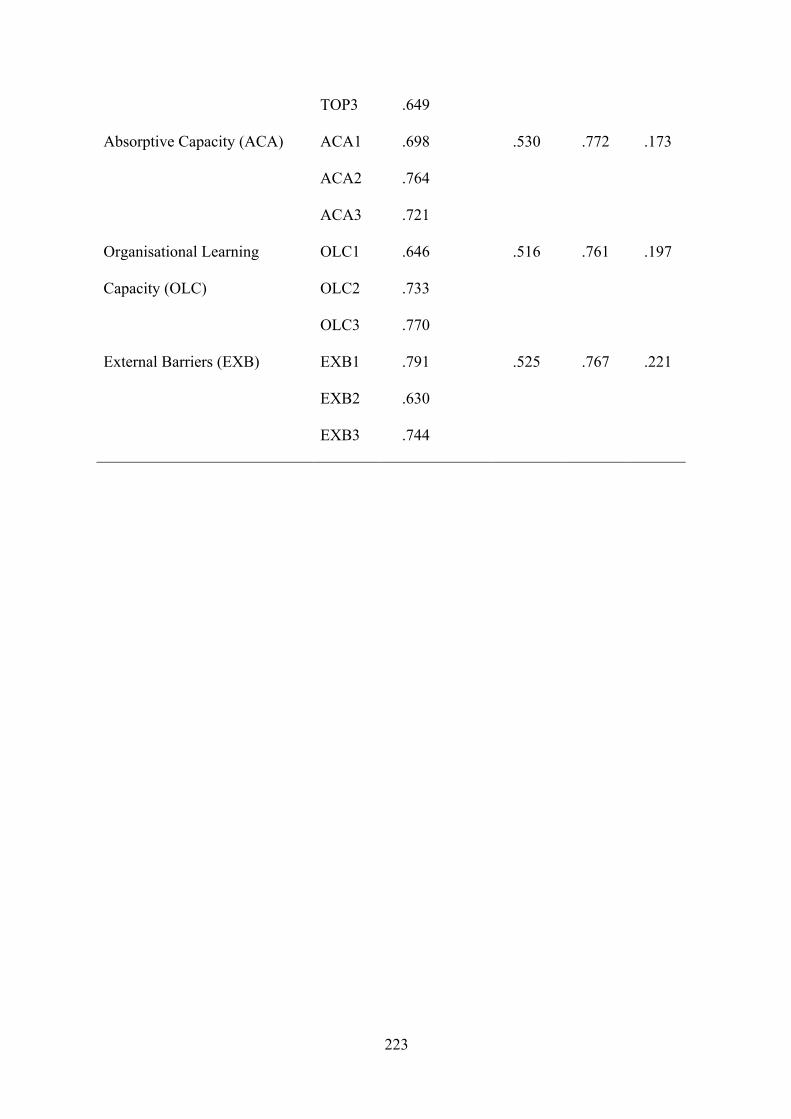
223
TOP3 .649
Absorptive Capacity (ACA) ACA1 .698 .530 .772 .173
ACA2 .764
ACA3 .721
Organisational Learning
Capacity (OLC)
OLC1 .646 .516 .761 .197
OLC2 .733
OLC3 .770
External Barriers (EXB) EXB1 .791 .525 .767 .221
EXB2 .630
EXB3 .744

224
7.5 Hypothesis Testing Results
7.5.1 Results for the Baseline Model
Figure 7.2: Structural Equation Modelling without Multi-group Analysis
Fit indices
(χ2 = 1348.682; df = 487; p = .000; χ2/df = 2.769; CFI = .896; TLI = .887; RMSEA = .055)
The Chi-square statistics (χ2/df = 2.769 < 3) and RMSEA (< 0.07) indicate a good fit. In view
of this, an investigation of the modification indexes exhibited significant covariances between
error terms for two items LMP2 and LMP3 (M.I. = 29.113). In view of the fact that the items
are within the same construct and that they are next to each other in the survey, Byrne (2013)
suggests allowing these error terms to co-vary in the measurement model.
225
The CFI and TLI are slightly below the guideline for assessing fit indices, as suggested by Hair
et al. (2019, p.642) who stated that a CFI should be at least 0.92 for research with N > 250 and
numbers of observed variables (m) > = 30. Therefore, Hair et al. (2019) advised that all model
specifications ought to be designed to the best approximation of the theory to be tested, rather
than increasing the model fit. Furthermore, Byrne (2010b, p.88) emphasised that fit indexes do
not reflect the plausibility of a model and that judgements depend on the researchers.
Hypotheses Testing
Figure 7.2 and Table 7.13 indicate that within the model, the positive impact of motivation (!
= .618; p = .002 < 0.05), top management support (! = .216; p = .000), absorptive capacity (!
= .480; p = .000), and organisational learning capacity (! = .465; p = .000) were statistically
supported. Therefore, H1, H3, H4 and H5 are confirmed. Regarding the antecedents that
influence perceived sustainability metrics, motivation has the most substantial influence (! =
0.618), followed by absorptive capacity (! = .0480) and organisational learning capacity (! =
0.465), then top management support (! = 0.216).
The empirical results also provide statistical support for the negative impact of inhibitors (! =
- .0245; p = .000), external barriers (! = - 0.255; p = 0.000) on perceived sustainability Metrics.
Therefore, H2 and H6 are confirmed. Concerning the antecedents that negatively influence
perceived sustainability metrics, inhibitors have the most substantial influence (! = - 0.245),
followed by external barriers (! = - 0.255).
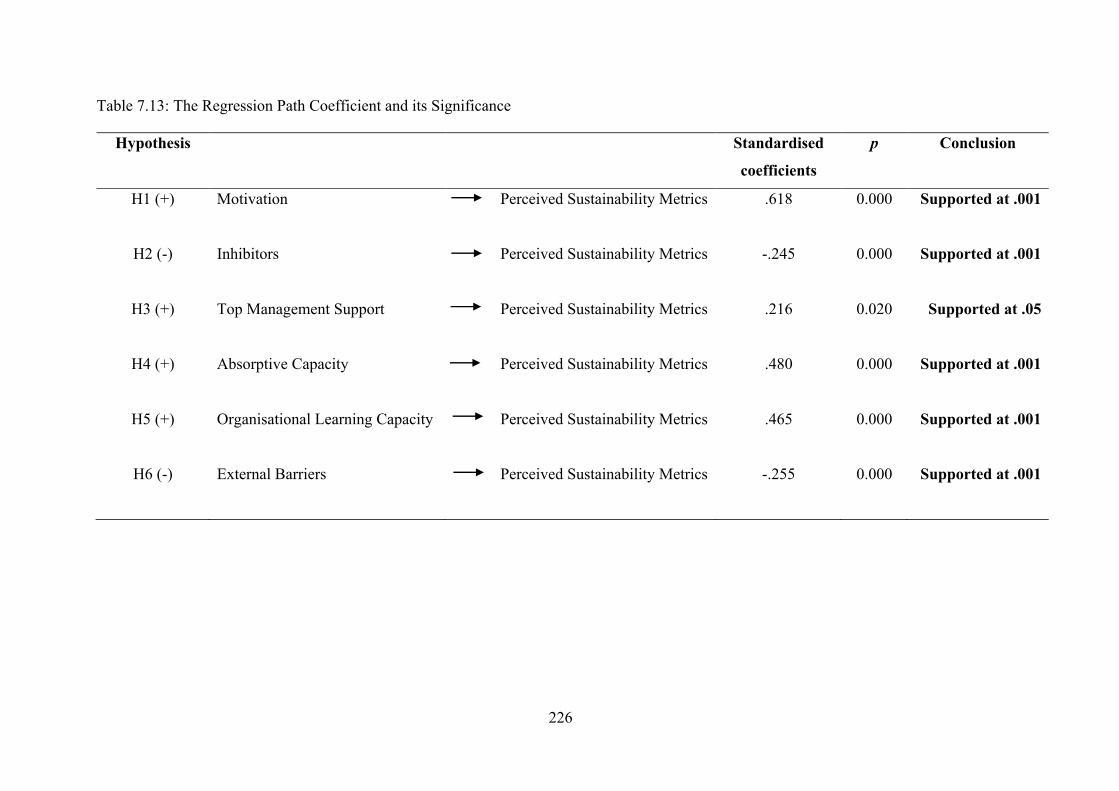
226
Table 7.13: The Regression Path Coefficient and its Significance
Hypothesis Standardised coefficients
p Conclusion
H1 (+) Motivation Perceived Sustainability Metrics .618 0.000 Supported at .001
H2 (-) Inhibitors Perceived Sustainability Metrics -.245 0.000 Supported at .001
H3 (+) Top Management Support Perceived Sustainability Metrics .216 0.020 Supported at .05
H4 (+) Absorptive Capacity Perceived Sustainability Metrics .480 0.000 Supported at .001
H5 (+) Organisational Learning Capacity Perceived Sustainability Metrics .465 0.000 Supported at .001
H6 (-) External Barriers Perceived Sustainability Metrics -.255 0.000 Supported at .001

227
7.5.2 The Effect of Control Variables
Structural equation modelling (SEM) with a multi-group analysis is useful for testing any
number or type of differences in the research model estimated for different groups because it
enables the estimation of a series of separate but interdependent multiple regression equations
run simultaneously (Byrne 2016; Haddad, Karkoulian and Nehme, 2019).
Prior to comparing the key structural relationships among the constructs in the proposed
research model, a general framework was established to compare the measurement model, and
subsequently the structural one across groups (Gaskin and Lim, 2018; Hair et al., 2019). The
primary task of testing measurement weights is to ensure that factor loadings are equivalent
representations across groups (Byrne, 2016; Han, 2017). The process of conducting the
structural weights was to confirm that factor loadings, intercepts in the equations and the
regression weights for predicting variables were constant across groups (Blunch, 2008).
In multi-group invariance testing, the initial step was to predefine a relative unconstrained
model in which each parameter was run freely, without constraint (Hair et al., 2019). Therefore,
the unconstrained model served as a baseline for comparison with a series of nested ones. This
placed more stringent constraints on the model in a hierarchical fashion by specifying the
parameters of interest to be constrained across the groups in order to examine invariance in the
specific paths across them (Han, 2017).
This means that, in the multi-group analysis, all the paths in a model are fixed, except the one
to be tested as being different between the groups (Byrne, 2016; Price et al., 2019). The
unconstrained model has no parameter constraints, whereas the structural invariance is the
structural weights model with all parameters constrained. The Chi-square difference test was
conducted in order to examine whether the models were invariance across the groups according
228
to value orientation (the moderator) (Keerthika and Alagarsamy, 2018; Xu et al., 2021). The
moderation is significant when the difference in Chi-square value between the constrained and
unconstrained is below 0.05 (Byrne, 2016; Han, 2017). The moderation effect is calculated
according to the difference in β values of the regression paths (Gaskin and Lim, 2018; Alniacik,
Moumen and Alniacik, 2020).
To test the statistical significance of the differences in the path coefficients between the groups,
this current study compares the differences in Chi-square of each path. Specifically, the plug-
in of multigroup analysis of AMOS is applied (Gaskin and Lim, 2018). The reason plug-in of
multigroup analysis of AMOS has certainly been used in some recent studies (Xu et al., 2021;
Upadhye et al., 2021; Zarrinabadi, Rezazadeh and Chehrazi, 2021; Riaz and Sherani, 2021).
This has proven to save a considerable amount of time and to avoid the possibility of a user
error (Gaskin and Lim, 2018).
In the following sub-sections, eight multigroup analyses are presented. These tests were run in
order to examine potential differences across groups, including level of management, age of
participant, gender, working experience, business sectors, firm’s sustainability experience, firm
size, firm age. These tests were crucial because they provided additional insights regarding the
moderating effects on the links between Motivation, Inhibitors, Top Management Supports,
Absorptive Capacity, Organizational Learning Capacity, and External Barriers to the Perceived
Sustainability metrics in Vietnamese SMEs.

229
7.5.2.1 Multi-group Moderation of Managerial Levels
Multi-group analyses were conducted to examine the effect of managerial levels on the causal
relationships in the structural models. The sample was divided into two groups for the level of
management hierarchy. Group 1 (high level) includes owner-managers, senior managers (n =
221); Group 2 (low level) comprises junior managers and key employees (n =358). The Scaled
Chi-square difference test is presented in Table 7.14.
Table 7.14 Scale Chi-square difference test (Global Test) for Levels of Managerial Hierarchy
χ2 DF
Unconstrained 2487.760 974
Constrained 2487.760 974
Difference 0.000
P-value 1.000
The Scaled Chi-square difference test between the constrained and unconstrained constructs in
the two model reveal no significant (P > .05) differences (see Table 7.14); hence, the P-value
of the Chi-square difference test is insignificant, but local tests should be interpreted with
caution (Table 15).
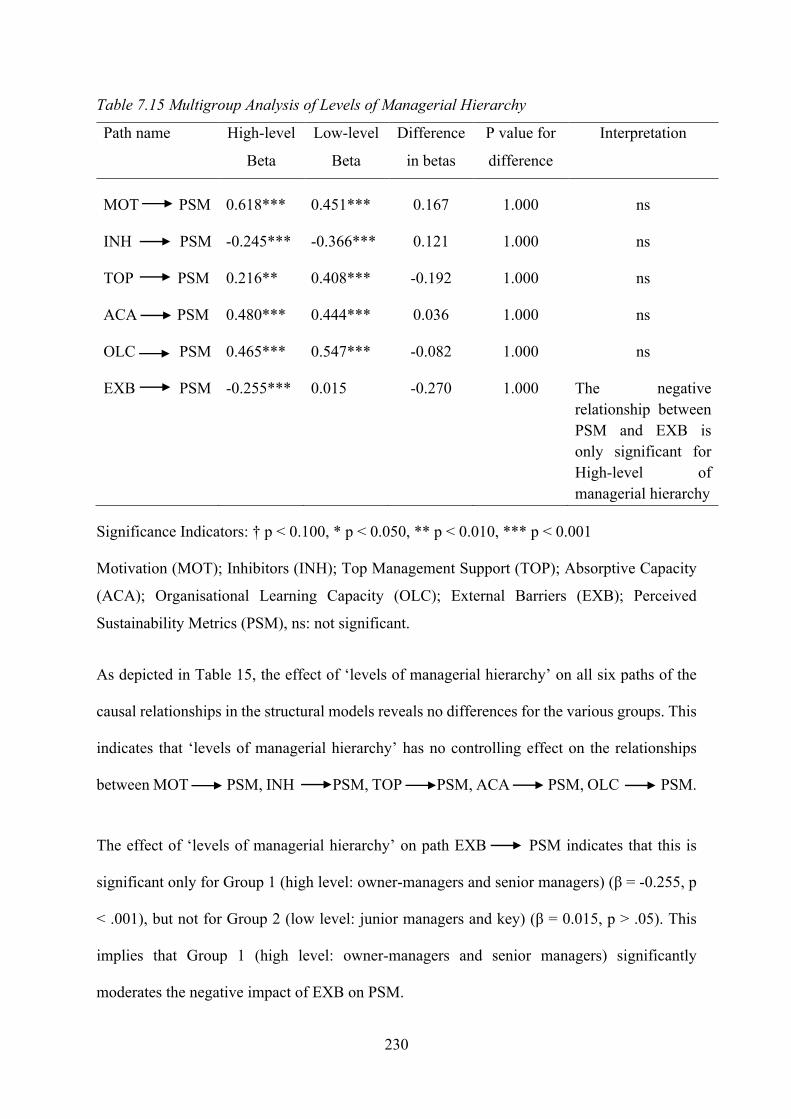
230
Table 7.15 Multigroup Analysis of Levels of Managerial Hierarchy
Path name High-level
Beta
Low-level
Beta
Difference
in betas
P value for
difference
Interpretation
MOT PSM 0.618*** 0.451*** 0.167 1.000 ns
INH PSM -0.245*** -0.366*** 0.121 1.000 ns
TOP PSM 0.216** 0.408*** -0.192 1.000 ns
ACA PSM 0.480*** 0.444*** 0.036 1.000 ns
OLC PSM 0.465*** 0.547*** -0.082 1.000 ns
EXB PSM -0.255*** 0.015 -0.270 1.000 The negative relationship between PSM and EXB is only significant for High-level of managerial hierarchy
Significance Indicators: † p < 0.100, * p < 0.050, ** p < 0.010, *** p < 0.001
Motivation (MOT); Inhibitors (INH); Top Management Support (TOP); Absorptive Capacity
(ACA); Organisational Learning Capacity (OLC); External Barriers (EXB); Perceived
Sustainability Metrics (PSM), ns: not significant.
As depicted in Table 15, the effect of ‘levels of managerial hierarchy’ on all six paths of the
causal relationships in the structural models reveals no differences for the various groups. This
indicates that ‘levels of managerial hierarchy’ has no controlling effect on the relationships
between MOT PSM, INH PSM, TOP PSM, ACA PSM, OLC PSM.
The effect of ‘levels of managerial hierarchy’ on path EXB PSM indicates that this is
significant only for Group 1 (high level: owner-managers and senior managers) (β = -0.255, p
< .001), but not for Group 2 (low level: junior managers and key) (β = 0.015, p > .05). This
implies that Group 1 (high level: owner-managers and senior managers) significantly
moderates the negative impact of EXB on PSM.
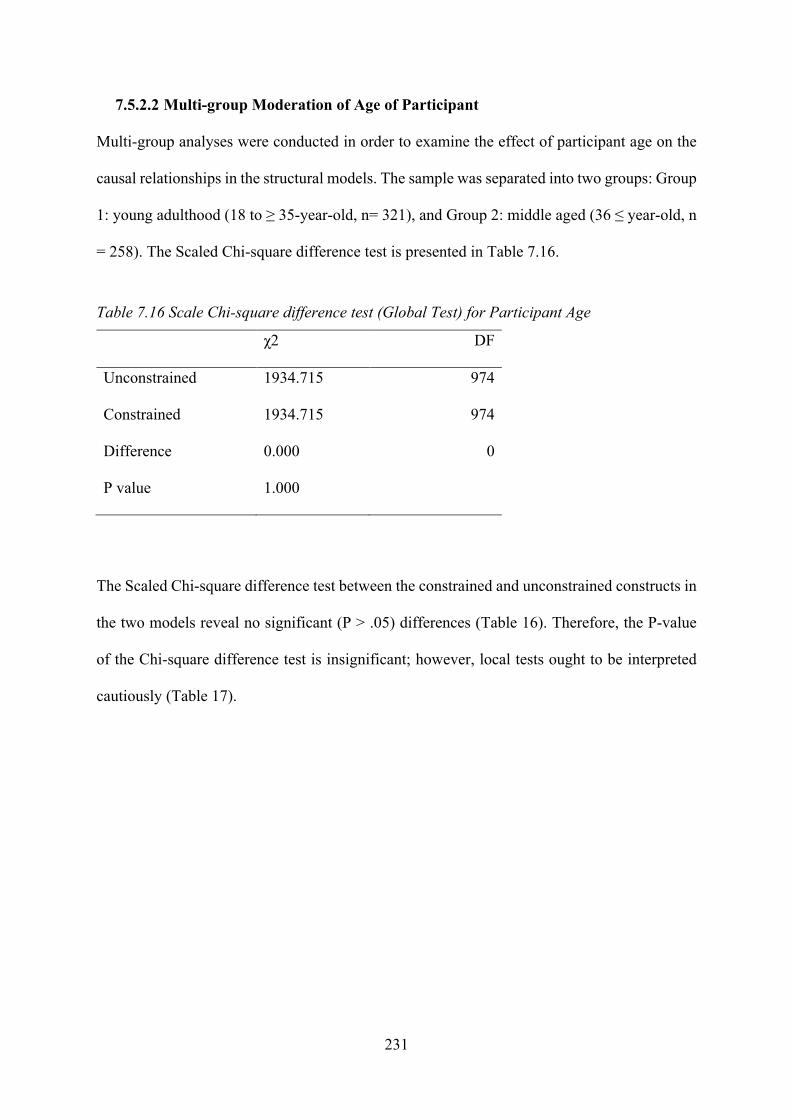
231
7.5.2.2 Multi-group Moderation of Age of Participant
Multi-group analyses were conducted in order to examine the effect of participant age on the
causal relationships in the structural models. The sample was separated into two groups: Group
1: young adulthood (18 to ≥ 35-year-old, n= 321), and Group 2: middle aged (36 ≤ year-old, n
= 258). The Scaled Chi-square difference test is presented in Table 7.16.
Table 7.16 Scale Chi-square difference test (Global Test) for Participant Age
χ2 DF
Unconstrained 1934.715 974
Constrained 1934.715 974
Difference 0.000 0
P value 1.000
The Scaled Chi-square difference test between the constrained and unconstrained constructs in
the two models reveal no significant (P > .05) differences (Table 16). Therefore, the P-value
of the Chi-square difference test is insignificant; however, local tests ought to be interpreted
cautiously (Table 17).

232
Table 7.17 Multigroup Analysis of Age of Participant
Path name Young adulthood
Beta
Middle age Beta
Difference in betas
P value for difference
Interpretation
MOT PSM 0.593*** 0.660*** -0.067 1.000 ns
INH PSM -0.256** -0.200† -0.055 1.000 ns
TOP PSM 0.069 0.381** -0.312 1.000 The positive
relationship between
PSM and TOP is only
significant for
Middle Age
ACA PSM 0.626*** 0.217† 0.409 1.000 ns
OLC PSM 0.358*** 0.523*** -0.165 1.000 ns
EXB PSM -0.242** -0.244* 0.002 1.000 ns
Significance Indicators: † p < 0.100, * p < 0.050, ** p < 0.010, *** p < 0.001
Motivation (MOT); Inhibitors (INH); Top Management Support (TOP); Absorptive Capacity
(ACA); Organisational Learning Capacity (OLC); External Barriers (EXB); Perceived
Sustainability Metrics (PSM), ns: not significant.
As presented in Table 7.17, the effect of ‘age of participants’ on all six paths of the causal
relationships in the structural models reveals no differences between the groups. Therefore,
this indicates that the ‘age of participants’ had no controlling influence on the relationships
between MOT PSM, INH PSM, ACA PSM, OLC PSM, EXB PSM.
The impact of ‘age of participant’ on path TOP PSM indicates that this is significant only
for Group 2 (middle aged, 36 ≤ year old) (β = 0.381, p < .01), but not for Group 1
(young adulthood, 18 to ≥ 35-year-old) (β = 0.069, p > .05). This result implies that Group 2
(middle aged, 36 ≤ year old) significantly moderates the positive effect of TOP on PSM.
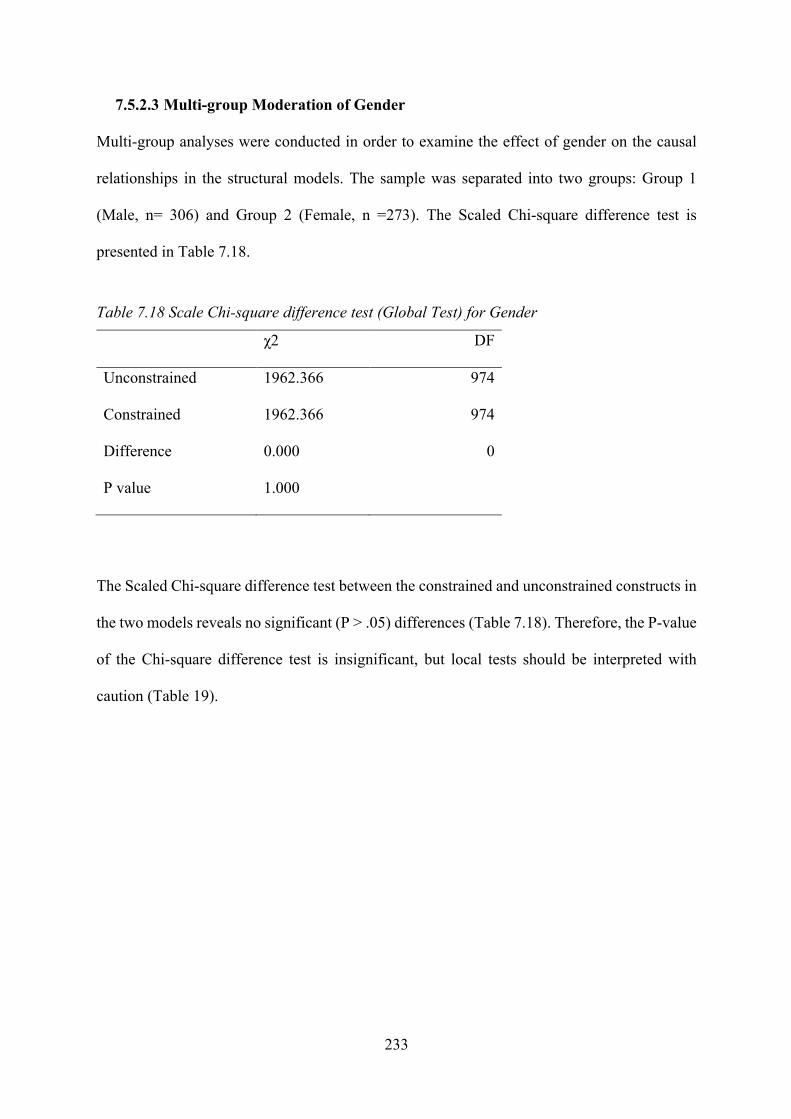
233
7.5.2.3 Multi-group Moderation of Gender
Multi-group analyses were conducted in order to examine the effect of gender on the causal
relationships in the structural models. The sample was separated into two groups: Group 1
(Male, n= 306) and Group 2 (Female, n =273). The Scaled Chi-square difference test is
presented in Table 7.18.
Table 7.18 Scale Chi-square difference test (Global Test) for Gender
χ2 DF
Unconstrained 1962.366 974
Constrained 1962.366 974
Difference 0.000 0
P value 1.000
The Scaled Chi-square difference test between the constrained and unconstrained constructs in
the two models reveals no significant (P > .05) differences (Table 7.18). Therefore, the P-value
of the Chi-square difference test is insignificant, but local tests should be interpreted with
caution (Table 19).
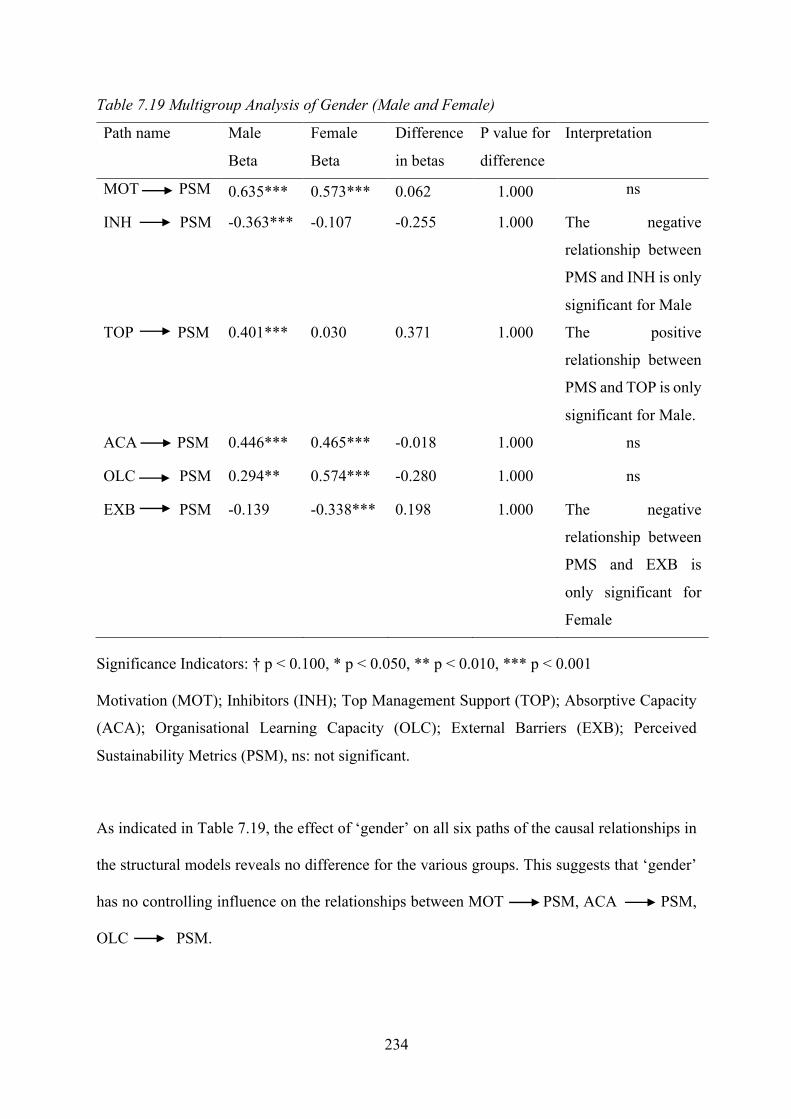
234
Table 7.19 Multigroup Analysis of Gender (Male and Female)
Path name Male
Beta
Female
Beta
Difference
in betas
P value for
difference
Interpretation
MOT PSM 0.635*** 0.573*** 0.062 1.000 ns
INH PSM -0.363*** -0.107 -0.255 1.000 The negative
relationship between
PMS and INH is only
significant for Male
TOP PSM 0.401*** 0.030 0.371 1.000 The positive
relationship between
PMS and TOP is only
significant for Male.
ACA PSM 0.446*** 0.465*** -0.018 1.000 ns
OLC PSM 0.294** 0.574*** -0.280 1.000 ns
EXB PSM -0.139 -0.338*** 0.198 1.000 The negative
relationship between
PMS and EXB is
only significant for
Female
Significance Indicators: † p < 0.100, * p < 0.050, ** p < 0.010, *** p < 0.001
Motivation (MOT); Inhibitors (INH); Top Management Support (TOP); Absorptive Capacity
(ACA); Organisational Learning Capacity (OLC); External Barriers (EXB); Perceived
Sustainability Metrics (PSM), ns: not significant.
As indicated in Table 7.19, the effect of ‘gender’ on all six paths of the causal relationships in
the structural models reveals no difference for the various groups. This suggests that ‘gender’
has no controlling influence on the relationships between MOT PSM, ACA PSM,
OLC PSM.
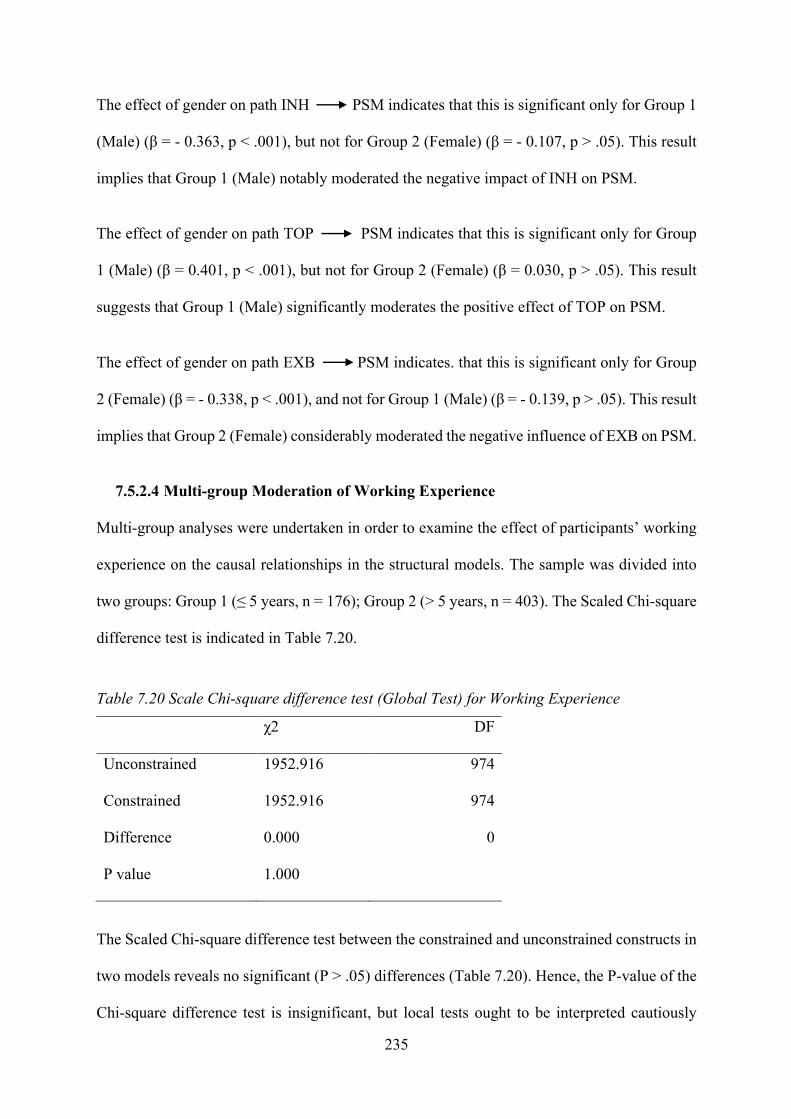
235
The effect of gender on path INH PSM indicates that this is significant only for Group 1
(Male) (β = - 0.363, p < .001), but not for Group 2 (Female) (β = - 0.107, p > .05). This result
implies that Group 1 (Male) notably moderated the negative impact of INH on PSM.
The effect of gender on path TOP PSM indicates that this is significant only for Group
1 (Male) (β = 0.401, p < .001), but not for Group 2 (Female) (β = 0.030, p > .05). This result
suggests that Group 1 (Male) significantly moderates the positive effect of TOP on PSM.
The effect of gender on path EXB PSM indicates. that this is significant only for Group
2 (Female) (β = - 0.338, p < .001), and not for Group 1 (Male) (β = - 0.139, p > .05). This result
implies that Group 2 (Female) considerably moderated the negative influence of EXB on PSM.
7.5.2.4 Multi-group Moderation of Working Experience
Multi-group analyses were undertaken in order to examine the effect of participants’ working
experience on the causal relationships in the structural models. The sample was divided into
two groups: Group 1 (≤ 5 years, n = 176); Group 2 (> 5 years, n = 403). The Scaled Chi-square
difference test is indicated in Table 7.20.
Table 7.20 Scale Chi-square difference test (Global Test) for Working Experience
χ2 DF
Unconstrained 1952.916 974
Constrained 1952.916 974
Difference 0.000 0
P value 1.000
The Scaled Chi-square difference test between the constrained and unconstrained constructs in
two models reveals no significant (P > .05) differences (Table 7.20). Hence, the P-value of the
Chi-square difference test is insignificant, but local tests ought to be interpreted cautiously
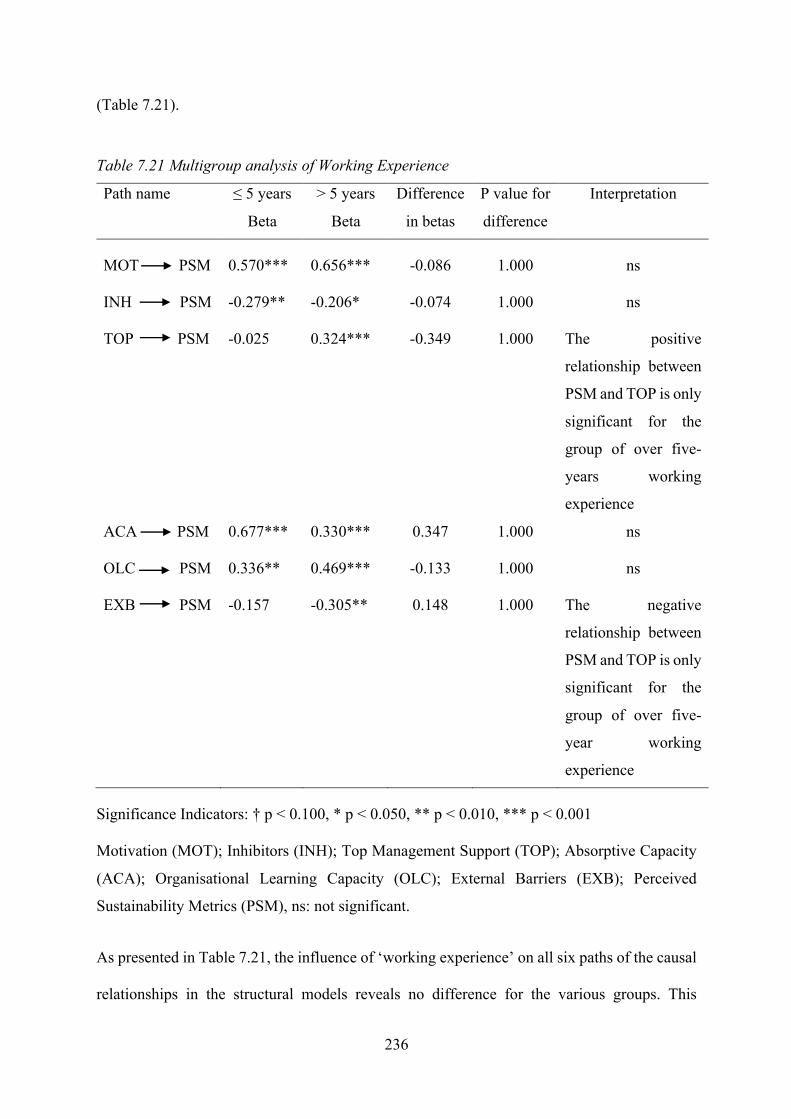
236
(Table 7.21).
Table 7.21 Multigroup analysis of Working Experience
Path name ≤ 5 years
Beta
> 5 years
Beta
Difference
in betas
P value for
difference
Interpretation
MOT PSM 0.570*** 0.656*** -0.086 1.000 ns
INH PSM -0.279** -0.206* -0.074 1.000 ns
TOP PSM -0.025 0.324*** -0.349 1.000 The positive
relationship between
PSM and TOP is only
significant for the
group of over five-
years working
experience
ACA PSM 0.677*** 0.330*** 0.347 1.000 ns
OLC PSM 0.336** 0.469*** -0.133 1.000 ns
EXB PSM -0.157 -0.305** 0.148 1.000 The negative
relationship between
PSM and TOP is only
significant for the
group of over five-
year working
experience
Significance Indicators: † p < 0.100, * p < 0.050, ** p < 0.010, *** p < 0.001
Motivation (MOT); Inhibitors (INH); Top Management Support (TOP); Absorptive Capacity
(ACA); Organisational Learning Capacity (OLC); External Barriers (EXB); Perceived
Sustainability Metrics (PSM), ns: not significant.
As presented in Table 7.21, the influence of ‘working experience’ on all six paths of the causal
relationships in the structural models reveals no difference for the various groups. This

237
indicates that ‘working experience’ had no controlling influence over the relationships between
MOT PSM, INH PSM, ACA PSM, OLC PSM.
The effect of working experience on path TOP PSM suggests that this is significant only
for Group 2 (> 5 years) (β = 0.324, p < .001), but not for Group 1 (≤ 5 years) (β = - 0.025, p >
.05). Furthermore, this result means that Group 2 (> 5 years) considerably moderated the
positive effect of TOP on PSM.
The impact of working experience on path EXB PSM indicates that this is significant
only for Group 2 (> 5 years) (β = - 0.305, p < .01), and not for Group 1 (≤ 5 years) (β = - 0.157,
p > .05). This result implies that Group 2 (> 5 years) significantly moderates the negative effect
of EXB on PSM.
7.5.2.5 Multi-group Moderation of Business Sector
Multi-group analyses were conducted in order to examine the impact of business sectors on the
causal relationships in the structural models. Accordingly, the sample was separated into two
groups for business sectors. Group 1 (manufacturing, n = 249) comprises SMEs operating in
manufacturing sectors and related sectors such as constructions, agriculture and fishing. Group
2 (service, n = 330) consists of SMEs operating in the service sector, and associated sectors
such as trading, whole and retails; accommodation and food services; and rental, hiring and
real estate. The Scaled Chi-square difference test is depicted in Table 7.22.
Table 7.22 Scale Chi-square difference test (Global Test) for Business Sectors
χ2 DF
Unconstrained 1862.579 974 Constrained 1862.579 974
Difference 0
P value 1.000

238
The Scaled Chi-square difference test between the constrained and unconstrained constructs in
two model reveals no significant (P > .001) differences (Table 22). Therefore, the P-value of
the Chi-square difference test is insignificant, but the interpretation of local tests should be
applied cautiously (Table 7.23).
Table 7.23 Multigroup Analysis of Business Sector
Path name Manufacturing
beta
Services
beta
Difference
in betas
P value for
difference
Interpretation
MOT PSM 0.598*** 0.624*** -0.026 1.000 ns
INH PSM -0.114 -0.154 0.040 1.000 ns
TOP PSM 0.002 0.353*** -0.351 1.000 The positive
relationship
between PSM
and TOP is
only significant
for Services
ACA PSM 0.611*** 0.322** 0.289 1.000 ns
OLC PSM 0.207† 0.571*** -0.365 1.000 ns
EXB PSM -0.462*** -0.178† -0.284 1.000 ns
Significance Indicators: † p < 0.100, * p < 0.050, ** p < 0.010, *** p < 0.001
Motivation (MOT); Inhibitors (INH); Top Management Support (TOP); Absorptive Capacity
(ACA); Organisational Learning Capacity (OLC); External Barriers (EXB); Perceived
Sustainability Metrics (PSM), ns: not significant.
Table 23 illustrates the impact of ‘business sector’ on all six paths of the causal relationships
in the structural models, revealing no difference between the groups. This means that the
‘business sector’ has no controlling influence on the relationships between MOT PSM,
INH PSM, ACA PSM, OLC PSM, EXB PSM.

239
The impact of business sector on path TOP PSM indicates that this is significant only for
Group 2 (service SMEs) (β = 0.353, p < .001), but not for Group 1 (manufacturing SMEs) (β
= 0.002, p > .05). This result suggests that Group 2 (service SMEs) notably moderates the
positive influence of TOP on PSM.
7.5.2.6 Multi-group Moderation of Sustainability Experience of Businesses
Multi-group analyses were conducted to examine the effect of a firm’s sustainability
experience on the causal relationships in the structural models. Accordingly, the sample was
divided into two groups. Group 1 (Beginner, n =302) comprises SMEs which are aiming to
obtain at least one sustainability certificate or/and sustainability programme. Group 2
(Matured, n = 277) consists of SMEs which have already obtained at least one sustainability
certificate/programme. The Scaled Chi-square difference test is presented in Table 7.24.
Table 7.24 Scale Chi-square difference test (Global Test) for Firms’ Sustainability Experience
χ2 DF
Unconstrained 2066.456 974
Constrained 2066.456 974
Difference 0.000 0
P value 1.000
The Scaled Chi-square difference test between the constrained and unconstrained constructs in
two model indicates no significant (P > .05) differences (Table 24). Hence, the P-value of the
Chi-square difference test is insignificant, but local tests should be interpreted with caution
(Table 25).

240
Table 7.25 Multigroup analysis of Sustainability Experience of Businesses
Path name Beginners
Beta
Matured
Beta
Difference
in betas
P value for
difference
Interpretation
MOT PSM 0.486*** 0.616*** -0.130 1.000 ns
INH PSM -0.039 -0.335*** 0.296 1.000 The negative
relationship between
PSM and INH is only
significant for
Matured.
TOP PSM 0.289** 0.055 0.233 1.000 The positive
relationship between
PSM and TOP is only
significant for
Beginners.
ACA PSM 0.353*** 0.634*** -0.281 1.000 ns
OLC PSM 0.695*** 0.136 0.559 1.000 The positive
relationship between
PSM and OLC is
only significant for
Beginners.
EXB PSM -0.267** -0.292** 0.025 1.000 ns
Significance Indicators: † p < 0.100, * p < 0.050, ** p < 0.010, *** p < 0.001
Motivation (MOT); Inhibitors (INH); Top Management Support (TOP); Absorptive Capacity
(ACA); Organisational Learning Capacity (OLC); External Barriers (EXB); Perceived
Sustainability Metrics (PSM), ns: not significant.
As depicted in Table 7.25, the impact of ‘sustainability experience of businesses’ on all six
paths of the causal relationships in the structural models indicates no difference between the
various groups. Therefore, this demonstrates that ‘sustainability experience of businesses’ has
no controlling impact on the relationships between MOT PSM, ACA PSM, and
EXB PSM.

241
The effect of ‘sustainability experience of businesses’ on path INH PSM suggests that
this is significant only for Group 2 (Matured) (β = - 0.335, p < .001), but not for Group 1
(Beginners) (β = - 0.039, p > .05). This result means that Group 2 (Matured) significantly
moderated the negative impact of INH on PSM.
The effect of ‘sustainability experience of businesses’ on path TOP PSM reveals that this
is significant only for Group 1 (Beginners) (β = 0.289, p < .01), and not for Group 2 (Matured)
(β = 0.055, p > .05). This result implies that Group 1 (Beginners) notably moderated the
positive influence of TOP on PSM.
The impact of ‘sustainability experience of businesses’ on path OLC PSM indicates that
this is significant only for Group 1 (Beginners) (β = 0.695, p < .001), but not for Group 2
(Matured) (β = 0.136, p > .05). This result means that Group 1 (Beginners) significantly
moderated the positive effect of OLC on PSM.
7.5.2.7 Multi-group Moderation of Company Size
Multi-group analyses were conducted in order to examine the impact of company size on the
causal relationships in the structural models. The sample was divided into two groups of firm
size, including Group 1: Small Size (10 ≤ 50 employees, n = 182) and Group 2: Medium Size
(< 50 ≤ 300, n = 397). The Scaled Chi-square difference test is indicated in Table 26.
Table 7.26 Scale Chi-square difference test (Global Test) for Firm Size
χ2 DF
Unconstrained 2055.357 974
Constrained 2055.357 974
Difference 0.000 0
P value 1.000
242
The Scaled Chi-square difference test between the constrained and unconstrained constructs in
two models reveals no significant (P > .05) differences (Table 26). Therefore, the P-value of
the Chi-square difference test is insignificant, but caution should be exercised when
interpreting local tests (Table 27).
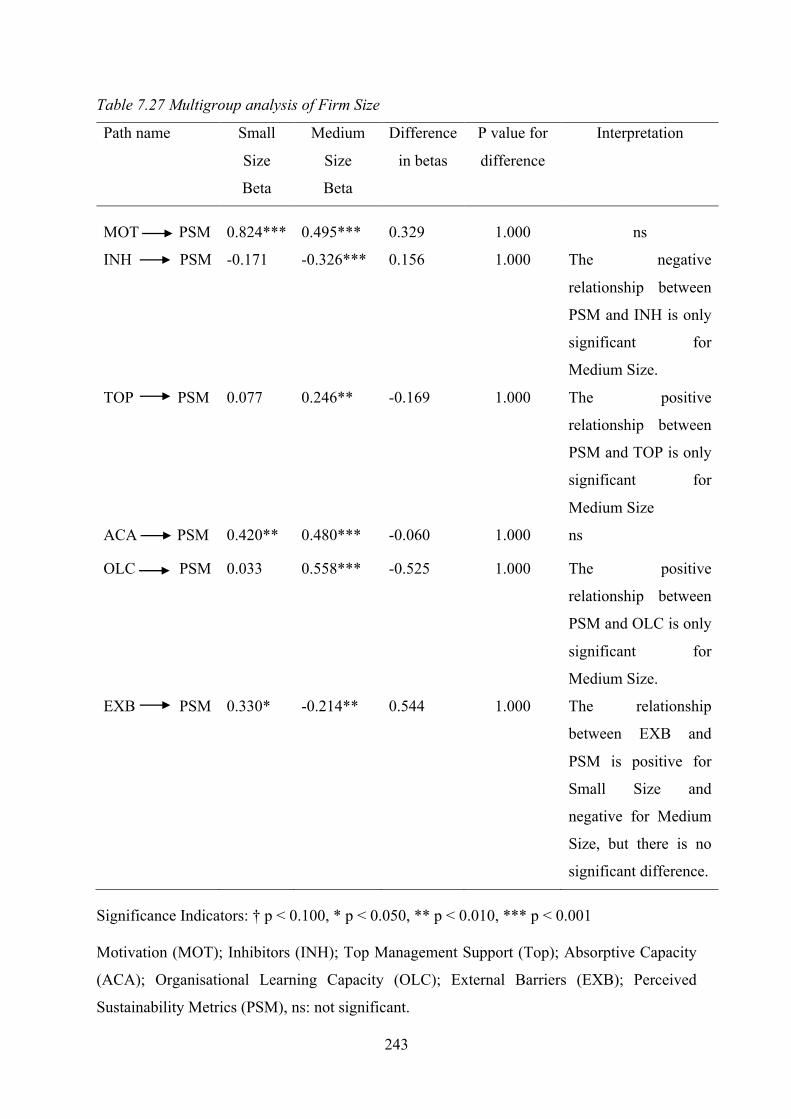
243
Table 7.27 Multigroup analysis of Firm Size
Path name Small
Size
Beta
Medium
Size
Beta
Difference
in betas
P value for
difference
Interpretation
MOT PSM 0.824*** 0.495*** 0.329 1.000 ns
INH PSM -0.171 -0.326*** 0.156 1.000 The negative
relationship between
PSM and INH is only
significant for
Medium Size.
TOP PSM 0.077 0.246** -0.169 1.000 The positive
relationship between
PSM and TOP is only
significant for
Medium Size
ACA PSM 0.420** 0.480*** -0.060 1.000 ns
OLC PSM 0.033 0.558*** -0.525 1.000 The positive
relationship between
PSM and OLC is only
significant for
Medium Size.
EXB PSM 0.330* -0.214** 0.544 1.000 The relationship
between EXB and
PSM is positive for
Small Size and
negative for Medium
Size, but there is no
significant difference.
Significance Indicators: † p < 0.100, * p < 0.050, ** p < 0.010, *** p < 0.001
Motivation (MOT); Inhibitors (INH); Top Management Support (Top); Absorptive Capacity
(ACA); Organisational Learning Capacity (OLC); External Barriers (EXB); Perceived
Sustainability Metrics (PSM), ns: not significant.

244
Table 27 depicts the impact of company size on all six paths of the causal relationships in the
structural models, indicating no difference between the various groups. This reveals that
company size had no controlling influence over the relationships between MOT PSM
and ACA PSM.
The effect of company size on path INH PSM suggests that this is significant only for
Group 2 (medium-size firms) (β = - 0.326, p < .001), but not for Group 1 (small-sized firms)
(β = - 0.171, p > .05). This result implies that Group 2 (medium-sized firms) significantly
moderates the negative effect of INH on PSM.
The impact of firm size on path TOP PSM indicates that this is significant only for Group
2 (medium-sized firms) (β = 0.246, p < .01), but not for Group 1 (small-sized firms) (β = 0.077,
p > .05). This result implies that Group 2 (medium-sized firms) notably moderated the positive
influence of TOP on PSM.
The impact of company size on path OLC PSM reveals that this is significant only for
Group 2 (medium-sized firms) (β = 0.558, p < .001), and not for Group 1 (small-sized
company) (β = 0.033, p > .05). This result suggests that Group 2 (medium-sized companies)
significantly moderates the positive effect of OLC on PSM.
The impact of firm size on path EXB PSM indicates negative for Group 2 (medium-sized
companies) (β = -0.214, p < .01), but positive for Group 1 (small-sized companies) (β = 0.330,
p < .05). These outcomes suggest that Group 2 (medium-sized firms) significantly moderates
the negative impact of EXB on PSM. Contrastingly, Group 1 (small-sized firms) significantly
moderates the positive effect of EXB on PSM.
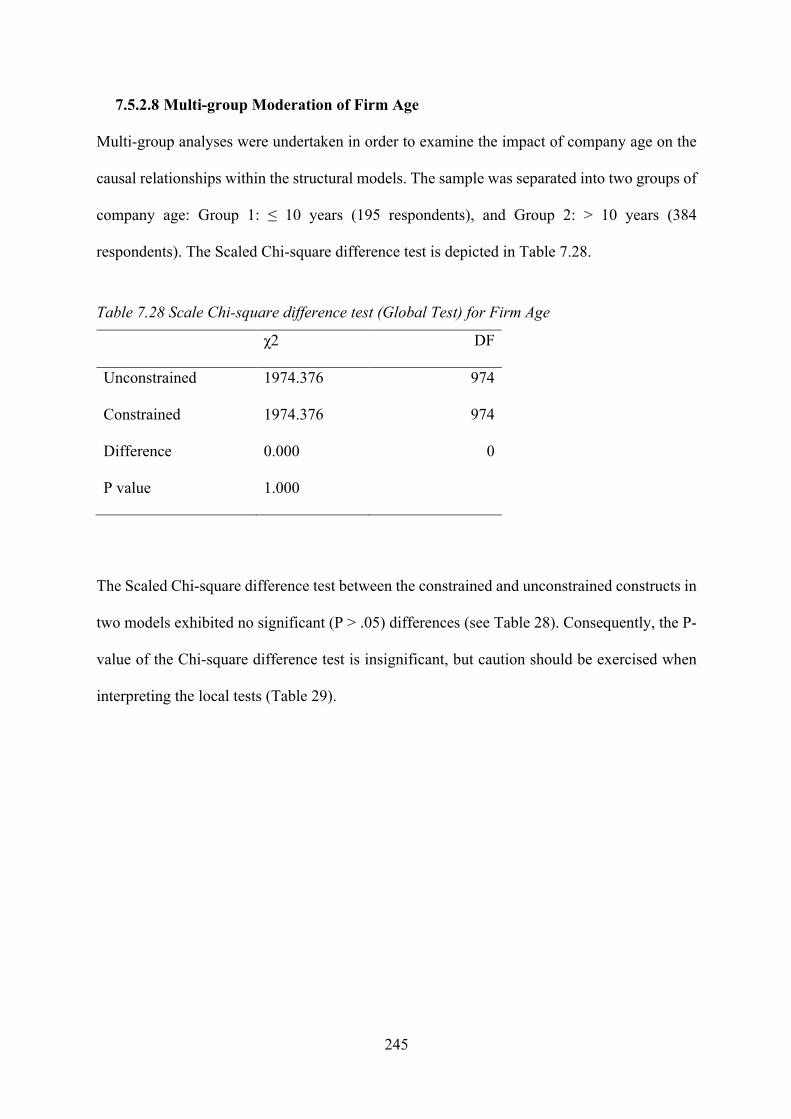
245
7.5.2.8 Multi-group Moderation of Firm Age
Multi-group analyses were undertaken in order to examine the impact of company age on the
causal relationships within the structural models. The sample was separated into two groups of
company age: Group 1: ≤ 10 years (195 respondents), and Group 2: > 10 years (384
respondents). The Scaled Chi-square difference test is depicted in Table 7.28.
Table 7.28 Scale Chi-square difference test (Global Test) for Firm Age
χ2 DF
Unconstrained 1974.376 974
Constrained 1974.376 974
Difference 0.000 0
P value 1.000
The Scaled Chi-square difference test between the constrained and unconstrained constructs in
two models exhibited no significant (P > .05) differences (see Table 28). Consequently, the P-
value of the Chi-square difference test is insignificant, but caution should be exercised when
interpreting the local tests (Table 29).
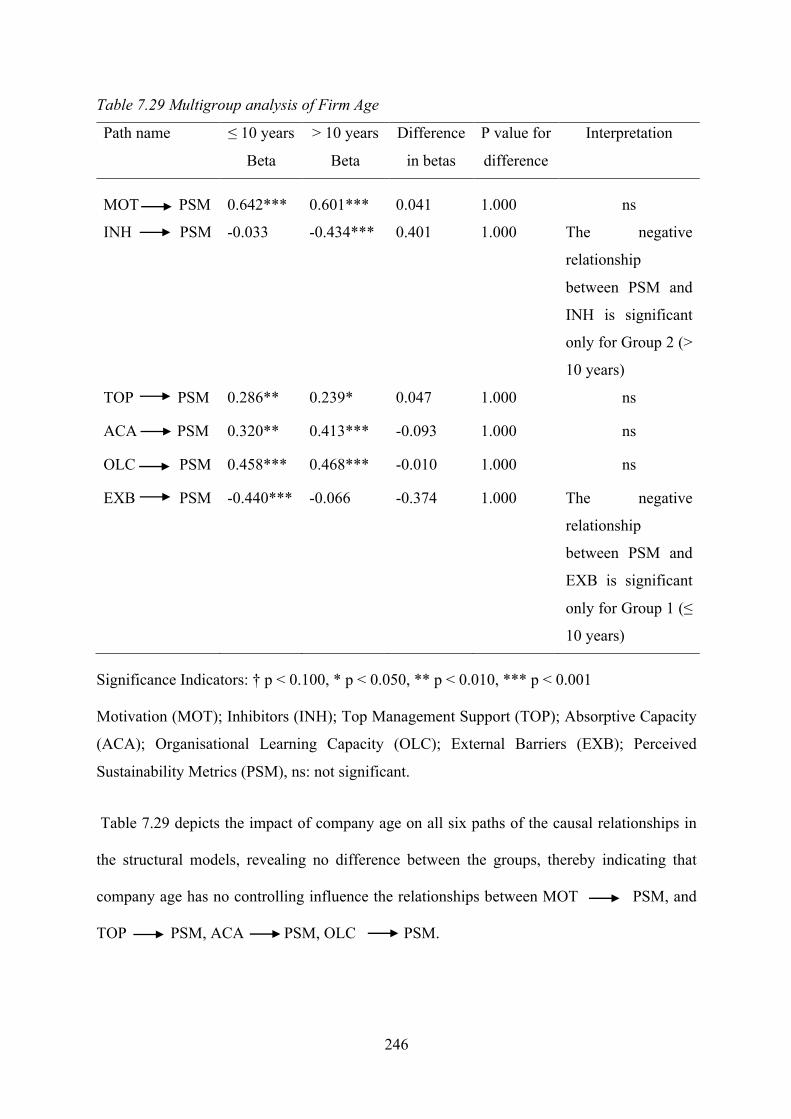
246
Table 7.29 Multigroup analysis of Firm Age
Path name ≤ 10 years
Beta
> 10 years
Beta
Difference
in betas
P value for
difference
Interpretation
MOT PSM 0.642*** 0.601*** 0.041 1.000 ns
INH PSM -0.033 -0.434*** 0.401 1.000 The negative
relationship
between PSM and
INH is significant
only for Group 2 (>
10 years)
TOP PSM 0.286** 0.239* 0.047 1.000 ns
ACA PSM 0.320** 0.413*** -0.093 1.000 ns
OLC PSM 0.458*** 0.468*** -0.010 1.000 ns
EXB PSM -0.440*** -0.066 -0.374 1.000 The negative
relationship
between PSM and
EXB is significant
only for Group 1 (≤
10 years)
Significance Indicators: † p < 0.100, * p < 0.050, ** p < 0.010, *** p < 0.001
Motivation (MOT); Inhibitors (INH); Top Management Support (TOP); Absorptive Capacity
(ACA); Organisational Learning Capacity (OLC); External Barriers (EXB); Perceived
Sustainability Metrics (PSM), ns: not significant.
Table 7.29 depicts the impact of company age on all six paths of the causal relationships in
the structural models, revealing no difference between the groups, thereby indicating that
company age has no controlling influence the relationships between MOT PSM, and
TOP PSM, ACA PSM, OLC PSM.

247
The effect of firm age on path INH PSM reveals this to be significant only for Group 2
(> 10 years) (β = - 0.434, p < .001), but not for Group 1 (≤ 10 years) (β = - 0.033, p > .05). This
result suggests that Group 2 (> 10 years) significantly moderates the negative impact of INH
on PSM.
The effect of company age on path EXB PSM indicates that this is significant only for
Group 1 (≤ 10 years) (β = - 0.440, p < .001), and not for Group 2 (> 10 years) (β = - 0.066, p >
.05). This result implies that Group 2 (> 10 years) significantly moderates the adverse effect of
EXB on PSM.
7.5.2.9 Summary of Hypotheses Testing and Multigroup Analysis Results
Table 7.30 depicts the summary of the multigroup analysis results.
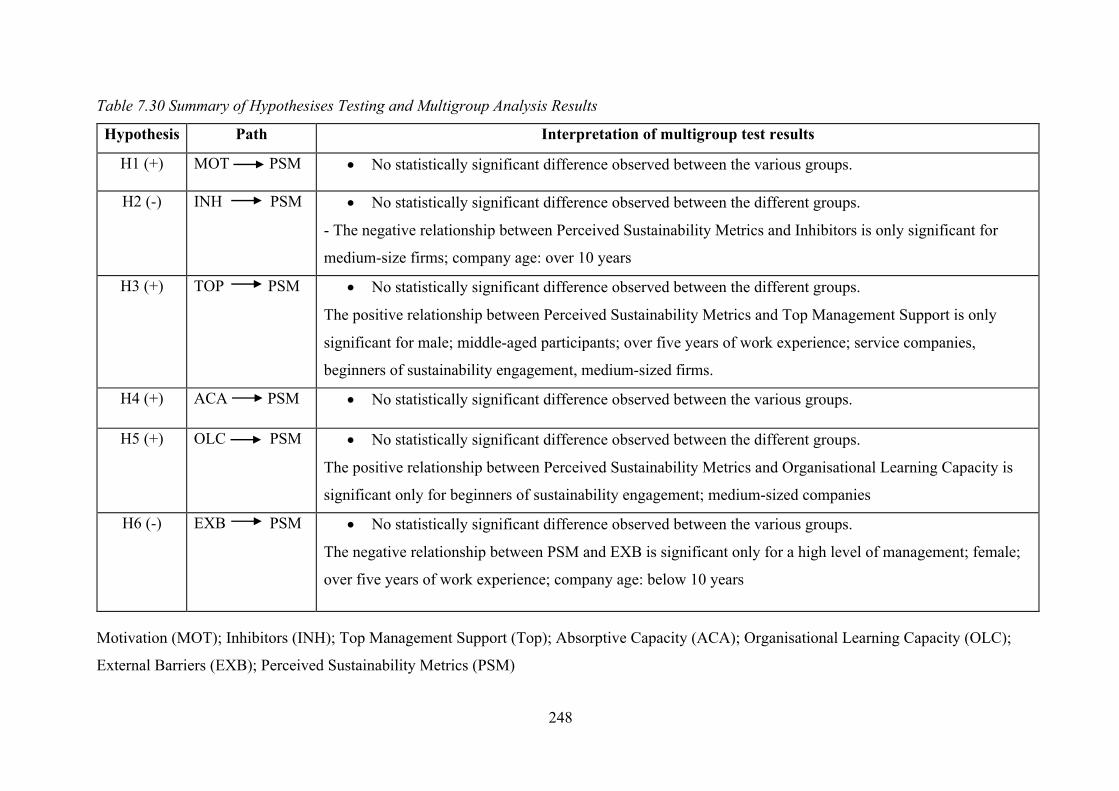
248
Table 7.30 Summary of Hypothesises Testing and Multigroup Analysis Results
Hypothesis Path Interpretation of multigroup test results
H1 (+) MOT PSM • No statistically significant difference observed between the various groups.
H2 (-) INH PSM • No statistically significant difference observed between the different groups.
- The negative relationship between Perceived Sustainability Metrics and Inhibitors is only significant for
medium-size firms; company age: over 10 years
H3 (+) TOP PSM • No statistically significant difference observed between the different groups.
The positive relationship between Perceived Sustainability Metrics and Top Management Support is only
significant for male; middle-aged participants; over five years of work experience; service companies,
beginners of sustainability engagement, medium-sized firms.
H4 (+) ACA PSM • No statistically significant difference observed between the various groups.
H5 (+) OLC PSM • No statistically significant difference observed between the different groups.
The positive relationship between Perceived Sustainability Metrics and Organisational Learning Capacity is
significant only for beginners of sustainability engagement; medium-sized companies
H6 (-) EXB PSM • No statistically significant difference observed between the various groups.
The negative relationship between PSM and EXB is significant only for a high level of management; female;
over five years of work experience; company age: below 10 years
Motivation (MOT); Inhibitors (INH); Top Management Support (Top); Absorptive Capacity (ACA); Organisational Learning Capacity (OLC);
External Barriers (EXB); Perceived Sustainability Metrics (PSM)

249
7.6 Key Findings and Discussion
7.6.1 Sustainability Metrics that can be Applicable for SMEs in Vietnam
The primary purpose of this quantitative study is to identify appropriate sustainability metrics
for SMEs in Vietnam. Drawing on 10 scientific articles and the Global Reporting Initiative
(2015), the study developed a preliminary list of 26 metrics applicable to measure sustainability
performance in the SMEs setting. Twelve of these were empirically selected according to a
sample of 579 respondents from Vietnamese SMEs. However, the unselected metrics were not
considered to be irrelevant, but represented the empirical findings obtained when testing and
validating the higher-order construct of Perceived Sustainability Metrics. The quantitative
outcome of sustainability metrics for Vietnamese SMEs comprises four for economic
performance, three for social performance and five for environment performance, as listed
below:
1. Return on Investment (ROI)
2. Operating profit
3. Net profit
4. Operational costs
5. Employee job satisfaction
6. Customer satisfaction
7. Customer complaints
8. Water consumption
9. Waste disposal
10. Recycling of waste
11. Hazardous waste
12. Total waste

250
Overall, this quantitative analysis provides empirical evidence in response to the call by
numerous scholars for more research to be conducted (Goyannes et al., 2018; Siegel et al.,
2019; Dissanayake et al., 2020) on the integration and balancing of all three pillars of the TBL
in the context of SMEs, particularly in developing countries.
7.6.2 Factors Influenced the Adoption of SPMS
The quantitative study aimed to emphasise the connection between the factors which influence
the SMEs’ adoption of SPMS. The hypotheses tested in this quantitative study provided full
empirical support. The results revealed that the adoption of SPMS in the SME setting is
influenced mainly by Motivation, Low Managerial Perception, Internal Shortcomings, Top
management Supports, Absorptive Capacity, Organisational Learning Capacity, and External
Barriers.
Firstly, this chapter provides empirical evidence on the positive impact of Motivation
(perceived benefits) on SMEs’ adoption of SPMS (perceived sustainability metrics). A higher
level of motivation in adopting sustainability engagement would lead to a more extraordinary
ability to adopt SPMS. This is why SMEs, particularly in developing countries, have been
described as lacking sustainability awareness (Mahmood et al., 2019; Das, Rangarajan and
Dutta, 2020), and absence of perceived benefits are barrier hindering the implementation of
sustainability management tools (Johnson and Schaltegger, 2016). This quantitative study
demonstrates that motivation is an antecedent, playing a crucial role in persuading Vietnamese
SMEs to adopt SPMS. This implies that respondents are aware of the benefits that can be
obtained from adopting SPMS. The result is consistent with previous studies that revealed the
potential benefits of sustainability engagement, including cost reductions (Shnayder, Van
Rijnsoever and Hekkert, 2015; Wiesner, Chadee and Best, 2017), increased efficiency
(Pacheco et al., 2018; Revell and Blackburn, 2007; Verma, Sharma and Kumar, 2017) and a

251
better image among employees and customers (Hsu and Cheng, 2012; Lozano, 2015; Masurel,
2007; McKeiver and Gadenne, 2005; Zhang et al., 2019b).
Secondly, although benefits from the measurement of sustainability performance can be
perceived, there could still be reluctance and resistance which can engender a low level of
SPMS adoption. This is because SMEs typically suffer from resource constraints, as widely
indicated in the existing literature. Based on these premises, this study provides empirical
evidence revealing that the Low Managerial Perception and Internal Shortcomings are key
inhibitors which hinder the level of SPMS adoption. Moreover, this result can be explained by
the effective adoption of SPMS which is dependent on how SMEs’ top management can change
their conventional mindset of operating business, which is mainly profit-driven, rather than
adopting a profit-sacrificing sustainability approach (Hasan, 2016; Kumar et al., 2018; Lee,
Herold and Yu, 2016; Pham, Yong and Truong, 2019). Furthermore, it is still a challenging
question to ask how SMEs can overcome their internal shortcomings such as resource
constraints, limited sustainability knowledge and expertise to engage proactively with
sustainability initiatives (Eikelenboom and de Jong, 2019). It is fair to comment that such issues
are not always easy to manage, particularly for SMEs in Vietnam (Tien, 2019). Subsequently,
this could lead to the fact that they would be either unable or unwilling to accept the challenge
to adopt SPMS (Kumar et al., 2018; Malesios, 2018; Cardoni et al., 2020). The result is in
accordance with scholarly discussions in previous studies, highlighting several obstacles
encountered by SMEs in pursuing their sustainability goals (Arena and Azzone, 2012; Caldera,
Desha and Dawes, 2019b; Hwang, Shan and Lye, 2018; Mengistu and Panizzolo, 2021; Neri
et al., 2021; Pham, Yong and Truong, 2019; Singh, Olugu and Fallahpour, 2014). In relation
to the previous discussion on the motivation (perceived benefits) towards SPMS adoption, this
finding supports the existence of the so-called ‘value-action’ gap as proposed by Revell, Stokes
and Chen (2010, p.276). This is in the sense that although positive attitudes towards the
252
measurement of sustainability performance exist, extensive internal barriers and shortcomings
experienced by SMEs can engender obstacles which could prevent them adopting SPMS.
Thirdly, this quantitative study confirms that top management who give support are key
enablers who also facilitate the adoption of SPMS. These can be among the most exciting
findings of this chapter , since they agree with most literature in emphasising that, in SMEs,
owner-managers hold primary responsibility to control and manage the company (Jenkins,
2009; Jenkins, 2006; Raziq and Wiesner, 2016). This common form provides them with
significant control over the allocation of resources. (Hoogendoorn, Guerra and van der Zwan,
2015). This inclusion means that if SME owners prioritise sustainable issues, their firms will
probably repeat the same action (Darcy et al., 2014; Jenkins, 2006; Spence, Schmidpeter and
Habisch, 2003). The quantitative result obtained from this study supports the idea of Searcy
(2009), who has emphasised the critical role of top management supports at the beginning of
the process of developing an SPMS. This is partially associated with the research conducted
by Nguyen and Tran (2020) who found that top management significantly supports the
implementation of the environmental performance of Vietnamese SMEs. This result is
comparable with the work of Parisi (2013) who found that top management was committed to
sustainability which has a direct influence over organisational alignment and the effectiveness
of SPMS adoption as well as an indirect effect on firms’ social and environmental performance.
The finding from this chapter also raises a managerial issue that if top managers are not on
board, SPMS cannot be effectively adopted as a successful implementation of sustainability
initiatives which necessitates the engagement of all employees (Arevalo and Aravind, 2011;
Lee, 2021). From a managerial perspective, it is reasonable to assume that top SME managers
should certainly provide strong supports in order to facilitate the adoption of SPMS in their
organisation.

253
This quantitative study confirms that absorptive capacity significantly influences SPMS
adoption. This implies that Vietnamese SMEs are aware of the importance of Absorptive
Capacity towards the effective adoption of SPMS in their organisations. More interestingly, as
the sample of this study comprises respondents from different positions in SMEs, this indicates
that, at an individual level, participants are aware of the importance of absorptive capacity.
Therefore, the unleashing of pertinent knowledge throughout the firm operating process
(Cardoni et al., 2020), and the acquiring external knowledge (Hossain and Kauranen, 2016;
Saad, Kumar and Bradford, 2017) can be promising catalysts of SPMS adoption. The
quantitative finding is partially comparable to one of the first studies conducted by Cardoni et
al. (2020), which found significant positive relationships between knowledge management,
performance measurement systems and economic sustainability within the SME setting.
Therefore, this chapter provides empirical evidence proving that absorptive capacity is a key
enabler that motivates SMEs to adopt sustsinability performance measurement. This
simultaneously integrates all three pillars of the triple bottom line, namely: economic, social
and environment performances.
The literature review indicates that absorptive capacity at the individual level largely depends
on individuals’ knowledge structures (Cohen and Levinthal, 1990). However, it is also
considered as a multi-level learning process in which its dimensions are associated with
learning at the level of individuals and organisations (Dzhengiz and Niesten, 2020; Goddard et
al., 2016; Saad, Kumar and Bradford, 2017; Zahra and George, 2002). Based on this argument,
a hypothesis is formulated, and subsequently confirmed by this study, which indicates that
adoption of SPMS is influenced by Organisational Learning Capacity. This suggests that, at
the organisational level, Vietnamese SMEs have recognised that organisational learning
capacity can be an essential enabler which facilitates the effective adoption of SPMS.
Consequently, this finding conforms to suggestions by previous studies that organisational
254
learning capacity can affect the success of the implementation of sustainability initiatives in
SMEs (Goddard et al., 2016; Johnson, 2017). Furthermore, it supports the ideas of
Eikelenboom et al. (2019), in the sense that SMEs can promote and utilise their learning
process, both at individual and organisational levels in order to improve their sustainability-
related knowledge at a low cost.
Finally, following the indication in previous studies that barriers from the external
environment, particularly in developing countries, often hinder the engagement of SMEs’
sustainability. This quantitative study has proved that External Barriers have a significant
impact on SPMS adoption. The interpretation is that a higher level of obstacles from the
external environment would probably lead to a lower-level adoption of SPMS in SMEs.
Therefore, this finding agrees with previous research, indicating that lack of government
support regarding information, seminars, workshops, economic incentives and rewards which
are key barriers hampering SMEs and which engage with sustainability initiatives
(Dissanayake and Divakara, 2019; Hasan, 2016; Hwang, Shan and Lye, 2018; Malesios et al.,
2020b; Pham, Yong and Truong, 2019). Moreover, Nguyen and Pham (2020) report that the
laws and regulations lack clarity, and that vague guidelines result in confusion and difficulty
for Vietnamese firms to apply and comply. This empirical study further highlights that these
are key barriers which impede the Vietnamese in adopting SPMS. Concerning the previous
discussions of the motivation (perceived benefits) and inhibitors influencing the adoption of
SPMS, this finding supports the existence of the so called ‘value-action’ gap proposed by
Revell, Stokes and Chen (2010, p.276). This is in the sense that despite positive attitudes
towards the measurement of sustainability performance, extensive external barriers perceived
by SMEs can demotivate them to adopt SPMS.
255
7.6.3 The Effect of Moderating Variables
As mentioned in Section 6.3.8.1, this quantitative study used managerial levels, gender,
participant age, work experience, company size, firm age, business sector and firm’s
sustainability experience as control variables. Moderating effects were tested by multigroup
analysis, where each control variable was split into two groups based on the analysis profile of
respondents and firms in Section 7.2.1. Regrettably, the result of multigroup analyses indicates
no statistically significant difference in the research model estimated for different groups. In
other words, it highlights that the motivation towards the adoption of SPMS in the SME setting
does not differ with regard to managerial levels, gender, participant age, work experience,
company size and age, business sector, and firm’ sustainability experience. Nevertheless, the
result of this chapter provides empirical evidence, emphasising the levels of statistical
significance for group-specific path coefficient as presented in Section 7.4.2, which are
discussed in more detail below.
With respect to managerial levels (high-level and low-level), the multi-group analysis
indicated that a negative impact of EXB on SPMS adoption was significant only for the high-
level group comprising owner-managers and senior managers. This implies that for this group,
the higher the level of perceived external barriers, the lower the level of SPMS adoption. This
finding can be explained by the fact that in SMEs, top management is primarily responsible for
complying with government regulation requirements (Ndiaye et al., 2018) as well as dealing
with market pressures (Boso et al., 2017) on corporate sustainability issues. As Bao, Wang and
Sun (2019) argued, top management’s perceptions of external barriers faced by SMEs probably
lowers their confidence in the potential success of their proactive behaviour towards the
adoption of sustainability initiatives. As such, the finding from this quantitative study provides
a better and more subtle understanding of how SPMS adoption in the context of SMEs is
affected by top management’s perceptions of external barriers.
256
Regarding gender, males and females have been found to differ in attitude and behaviour
regarding management styles (Hoque and Awang, 2019), particularly on issues associated with
CSR management and practice (Yusoff, Jamal and Darus, 2016). Although the multi-group
analysis identified no significant differences between male and female groups, it did indicate
that a positive effect of TOP on SPMS adoption was moderated only by the male group. This
implies that male respondents believed that the more appropriate the level of top management
support, the higher the level of SPMS adoption. From another perspective, the multi-group
analysis suggested that a negative impact of EXB on SPMS adoption was significant only for
female respondents. This finding implies that for the female group, the higher the level of
external barriers, the lower the level of SPMS adoption. This can be explained by the fact that
females are often less willing to take risks than males (Powell and Ansic, 1997). From a
managerial perspective, the findings from this quantitative study provide valuable insights for
SME managers that will enable them to better understand the requirements of males for top
management support, and the perceptions of females of the external barriers that influence
SPMS adoption.
With regard to the age of participants (young adulthood, middle-aged), the multi-group
analysis revealed a positive effect of TOP on SPMS adoption, but this was only significant for
the middle-aged group. This means that this group believed that the higher the level of top
management support, the higher the level of SPMS adoption. Conversely, a low level of top
management support would result in a low level of SPMS adoption. Literature on
organisational change reveals mature employees are those most resistant to change (Garcia-
Sabater and Marin-Garcia, 2011; Nguyen, 2019). It has also been noted that resistance which
takes place during the process of implementing performance measurement systems is often
hard to observe as those resisting take care to conceal their actions (Bourne et al., 2000).
Moreover, mature employees are often less likely to seek sustainability information than
257
younger employees (Obeng, 2019), and tend to perceive CSR negatively (Choongo, 2017).
From a practical perspective, the findings from this quantitative study provide useful insights
for SME managers that will enable them to understand the requirements of the middle-age
group for top management support as a necessity facilitating SPMS adoption.
Regarding work experience (≤ 5 years, > 5 years), the multi-group analysis indicated that the
impacts of TOP and EXB on SPMS adoption were moderated only by participants having more
than five years of working experience. These findings appear to be compatible with the
expectations of this research, and are partially consistent with previous studies (e.g.,
Stubblefield, Loucks, Martens and Cho, 2010) which suggest that work experience has a
significant impact on SMEs’ sustainable performance. These findings, however, require further
investigation as they are contrary to the findings of a previous study by Nguyen et al. (2017)
highlighting that in Vietnam, working experience in the industry can be an obstacle hindering
sustainability engagement. This comparison, however, needs to be treated with caution as this
study was conducted at a time when sustainability development was introduced as a relatively
new concept in Vietnam, and so people had not had much sustainability experience. The
findings from this quantitative study provide empirical insights into how experienced people
perceive top management support and external barriers influencing SPMS adoption. This can
potentially support the decision-making process undertaken by managers in SME settings,
where employees are willing and inclined to share work experiences and knowledge if they are
motivated to do so (Eze et al., 2013).
In terms of firm size (small-sized firms, medium-sized firms), the multi-group analysis
elucidated the effects of INH, TOP, and OLC on SPMS adoption, which were moderated only
by the group of medium-sized firms. As observed by Johnson (2015), larger SMEs are more
likely to implement sustainability management tools than smaller counterparts. This is because
258
medium-sized firms often have more resources than small-sized firms to support sustainability
engagement (Lopez-Perez, Melero and Javier Sese, 2017). However, one of the findings of the
current quantitative study revealed that when inhibitors are perceived as a source of
ineffectiveness, medium-sized firms might be less likely to adopt SPMS. This is perhaps
because this firm size group often have a more complex organisational structure than smaller
counterparts (Shevchenko, Lévesque and Pagell, 2016; Trianni, Cagno and Farné, 2016),
creating a level of complexity that hinders them from adopting SPMS. Also found in relation
to medium-sized firms, this quantitative study indicates that the higher the level of top
management support and organisational learning capacity, the higher the level of SPMS
adoption. Therefore, in this quantitative study, inhibitors, top management support, and
organisational learning capacity were demonstrated to provide useful insights and managerial
implications for medium-sized firms to effectively adopt SPMS.
With respect to firm age (≤ 10 years, > 10 years), the multi-group analysis indicated that the
effect of INH and EXB on SPMS was significant only for younger SMEs established for less
than 10 years. This finding implies that for younger SMEs, the higher the level of inhibitors
and external barriers, the lower the level of SPMS adoption. These findings partly conflict with
those of Roxas (2021), which suggested younger Vietnamese SMEs appear to be more dynamic
than older and more established counterparts in adopting newer approaches that place
environmental sustainability at the core of doing business.
These findings can be partially explained by the fact that in their initial stages, Vietnamese
SMEs often find it difficult to access credit due to informational disparities (Phan et al., 2015;
Vu et al., 2019). They tend to rely on informal loans and grants from family and friends as well
as on their own resources or those of informal institutions (Phan et al., 2015; Vu et al., 2019).
For this reason, younger SMEs might be unwilling to invest in new business projects, such as

259
SPMS adoption, which might not generate a quick profit or where the returns from such an
investment are highly unpredictable (Canh et al., 2019). Additionally, in their early years of
operation, the primary goal of SMEs is to focus on factors contributing to their survival such
as financing, rather than setting and achieving sustainability goals (Isaga, Masurel and Van
Montfort, 2015; O’Regan, Sims and Ghobadian, 2005; Sommer, 2017).
Moreover, their perception of a high level of external barriers also means younger SMEs are
less likely to adopt SPMS. This finding, however, needs to be investigated further as it is partly
inconsistent with Vu et al.'s (2019) finding that Vietnamese younger firms tend to be dynamic
and easily adapt to changes in the law and business environment. As such, this finding agrees
with the argument presented by Pham, Yong and Truong (2019) in the sense that the level of
engagement with the sustainability initiatives of SMEs, especially younger firms, depends
heavily on how fast Vietnamese governments can improve regulations and enforcement.
Thus, the findings from this quantitative study provide valuable insights into the views of
younger SMEs on inhibitors and external barriers associated with SPMS adoption. However,
there is an important caveat to be taken into account when drawing conclusions from this
quantitative study, primarily regarding potential biases. For instance, the researcher divided
‘firm age’ into two groups, which was aimed at obtaining a relatively balanced number for each
specific group for the purpose of conducting a multi-group analysis.
In terms of business sectors (manufacturing sector, service sector), the multi-group analysis
revealed that service sector SMEs was the only group which exerted a significant moderating
effect on the relationship between TOP and SPMS adoption. This finding implies that in this
business sector, the higher the level of top management support, the higher the level of SPMS
adoption. Although there might be other contributing factors, this finding can be explained by
260
the fact that Vietnamese firms from the service sector often lack the capacity to effectively
adopt and implement sustainability practices into their business operations compared to those
from the manufacturing sector (Kane et al., 2021). Hence, the findings from this quantitative
study contribute to the literature on issues SMEs operating in the services sector encounter
when engaging with sustainability initiatives, which remains an underexplored area (Sajan et
al., 2017). Also, it offers useful insight and direction for managers of SMEs in the service
sector by revealing that top management support is of central importance for facilitating SPMS
adoption.
Finally, with regard to the firm’s sustainability experience (beginner and mature groups), the
effect of TOP and OLC on SPMS was significant only for the beginner group. This implies
that for SMEs beginning to engage with quality certifications (such as ISO 9001, ISO14001),
their SPMS adoption cannot be effective if top management support and organisational
learning capacity do not reach an appropriate level. This finding is reasonable as the mature
group of SMEs, having accepted international standards and certifications (such as ISO 9001,
ISO14001), will be more effective in fostering the adoption of sustainability initiatives than the
beginner group (Ali et al., 2020; Caldera, Desha and Dawes, 2019a; Lopes et al., 2017; Singh,
Brueckner and Padhy, 2014). Additionally, firms with limited sustainability experience might
encounter certain difficulties in coordinating and performing the tasks necessary to effectively
implement sustainability initiatives at the organisational operations level (Johnson, 2017; Lee,
2009). Therefore, the findings from this quantitative study provide valuable insights and
guidelines pertaining to the views of the beginner group on top management support and
organisational learning capacity as areas of focus for facilitating SPMS adoption. For example,
owner/managers need to be better equipped and dedicated to transforming their management
style and introduce appropriate changes conducive to commitment, engagement, and
motivation to learn, and to sharing learning (Saad, Kumar and Bradford, 2017). In doing so,
261
the beginner needs to allocate necessary resources (Bhanot, Rao and Deshmukh, 2017) as well
as review and enhance more formal organisational routines, procedures, and structures
(Abdullahi et al., 2019; Trianni, Cagno and Farné, 2016), which provide crucial support for
SPMS adoption.
7.7 Conclusion
This quantitative study analysis confirms sustainability metrics that were identified from the
literature, and which can be applied for SMEs of mixed business sectors. Empirical support
was found for twelve sustainability metrics of three pillars of the triple bottom line: economic
performance (four metrics), social performance (three metrics), and environmental
performance (five metrics). All these sustainability metrics are unique because they are
specially selected from the perspective of SMEs in the context of Vietnam.
Secondly, quantitative study analysis confirms that Motivation, Top Management Supports,
Absorptive Capacity and Organizational Learning Capacity as key enablers, while Inhibitors
and External Barriers were verified as obstacles. All six factors emerged as reliable predictors
of the level of adoption of sustainability performance measurement systems in the Vietnamese
SMEs’ setting.
Thirdly, further multigroup analysis exhibits no significant differences for eight control
variables concerning both the individual level (managerial level, gender, age of participant,
year of working experience) and the firm level (firm age, firm size, business sectors, firm’
sustainability experience). However, the results are noteworthy since this is one of the first
studies that provides empirical evidence highlighting specific groups moderating specific paths
in the research model. Therefore, managers and government policymakers should seek to

262
facilitate the level of adoption of sustainability metrics in the SME setting. The results from
this chapter will be checked and complemented by the qualitative investigation.
The next chapter presents the qualitative study design and data collection methods.
263
CHAPTER 8 QUALITATIVE STUDY DESIGN AND DATA
COLLECTION METHODS
8.1 Introduction
The preceding chapter presented the quantitative part of the study, the empirical results of
which indicated a moderate fit for the model, as well as differences in the impact level between
factors on the adoption of SPMS. Qualitative research is used to provide a more comprehensive
explanation of how various factors could influence the adoption of SPMS in the Vietnamese
SME setting. This would involve the perspective, thinking and experience of key stakeholders,
comprising owner-managers, senior managers, key employees, shareholders and business
customers.
Therefore, the principal objective of Chapter 8 is to describe and explain the qualitative
component of the research. This will be achieved by presenting the procedure for qualitative
data collection, and subsequently outlining the process for data analysis.
8.2 Procedure for Qualitative Data Collection
Literature includes various approaches and tools for qualitative data collection, allowing the
researcher to gain deeper insights into a specific social science topic (Easterby-Smith et al.,
2015; Silverman, 2013). However, according to Bell et al. (2018), research interviews are the
most frequently used primary methods in qualitative research. Consequently, the following
section presents interviews as the primary data techniques for the qualitative phase of this
study.
8.2.1 Interview Techniques
According to Saunders, Lewis and Thornhill (2019, p.338), the expression ‘research interview’
is often considered to be a general term, and its techniques are useful and practical tools ‘to
264
gather information from interviewees who are treated as witnesses to a reality that exists
independently of them’. Furthermore, it is considered to be adequate for encouraging
respondents to disclose their thoughts and feelings on a particular phenomenon, thus helping
researchers to gain a deeper understanding of it. Therefore, interview techniques are most
appropriate for this study in complementing and explaining the initial quantitative results
obtained in Chapter 7. It is also helpful to explore participants’ opinions on how motivation
inhibitors, enablers and external factors influence the adoption of SPMS in the SME setting.
Generally, the researcher can use three main types of interview techniques in order to gather
qualitative data: structured, semi-structured and unstructured interviews (Collis and Hussey,
2014; Saunders, Lewis and Thornhill, 2019; Bell et al., 2018). Technically, these methods are
classified according to their nature, structure and level of formality (Collis and Hussey, 2014),
with each being frequently considered suitable for a specific research purpose (Saunders, Lewis
and Thornhill, 2019). From this perspective, the choice of any interview technique must be
carefully considered as to whether it is consistent with the research purposes, questions, aims
and objectives which are already decided for this study (Saunders, Lewis and Thornhill, 2019;
Bell et al., 2018). The characteristics of the three above interview types are presented in Table
8.1.

265
Table 8.1 Characteristics of Interview Types
Structured interview Semi-structured interview Unstructured interview
Appropriate for collecting
quantitative data
Mainly suitable for
qualitative data collection
Mainly suitable for
qualitative data collection
Captures data rapidly Slow and time-consuming in
capturing and analysing data
Slow and time-consuming in
capturing and analysing data
Uses of random sampling Uses of purposive and
snowball sampling
Uses of purposive and
snowball sampling
Interviewer-led Sometimes interviewer-led
Sometimes interviewee-led
Non-directive interviewing
Follows strict interview
format
Interview format is flexible Interview format is flexible
Easy to analyse Sometimes difficult to
analyse
Often difficult to analyse
Tendency to positivist view
of knowledge
Mixture of positivist and
non-positivist
Non-positivist view of
knowledge
Source: Adapted from Gray (2014, p.387)
An identical set of questions is often prepared for a structured interview in order to gather
quantifiable data (Saunders, Lewis and Thornhill, 2019) which, in essence, is a reasonably
standardised technique. All interviews are conducted in the same context of questioning, with
the use of closed-ended questions whose purpose is to obtain many pre-coded answers to
generalise conclusions (Easterby-Smith et al., 2015; Collis and Hussey, 2014). One advantage
of using a structured interview, as indicated in previous empirical studies on sustainability
(Govindan et al., 2014), is that it can help to minimise potential bias by the interviewer. It was
also believed that this technique could save time and analyse the obtained data quickly (Gray,
2014). Considering its merits, it is claimed that the structured interview technique tends
towards a positivist view of knowledge (Gray, 2014). It is probably inappropriate for this study
to capture a comprehensive account of participant perceptions and experiences because it aims

266
to generate profound and rich information that deepens the understanding of factors that
influence the SPMS adoption in the SME setting.
On the other hand, it is suggested that an unstructured interview is conducted in an informal,
relaxed manner. Interviewees are encouraged to talk freely with occasional interruption or
intervention from the interviewer (Easterby-Smith et al., 2015; Saunders, Lewis and Thornhill,
2019). This enables the researcher to gain an in-depth understanding of the interviewee’s
perspective (Saunders, Lewis and Thornhill, 2019; Bell et al., 2018). However, in a non-
directive interview it can be difficult to capture the precise issues that respondents express
because they would be more likely to follow their own direction. Consequently, their answers
could be highly inconsistent and obtained data can be poor and also difficult to interpret
(Easterby-Smith et al., 2015) which subsequently limits the possibility of cross-case
comparability (Bell et al., 2018). Therefore, this interview technique is possibly not suitable
for this study in addressing the research questions and achieving the research purpose.
Considering the two aforementioned interview techniques, this study selected face-to-face
semi-structured interviews in order to collect data. This interview technique is reasonable
flexible, in which participants have scope to discuss their subjective feelings and experiences
while the researcher actively manages and controls the interview process (Saunders, Lewis and
Thornhill, 2019). Prior to the interviews, the researcher will have prepared a list of open-ended
questions relating to the research topic to be covered (Bell et al., 2018) (Appendix B.1 and
B.2), the objective of which was to retain the flow of the conversation in following exciting
lines of inquiry and also facilitating an unbroken discussion (Easterby-Smith et al., 2015).
Having used this approach, the researcher did not need to follow the order of the questions
exactly, but depending on the flow of the conversation (Saunders, Lewis and Thornhill, 2019;
Bell et al., 2018), he would choose whether a line of questioning needs to be explored further

267
or discarded (Easterby-Smith et al., 2015). Therefore, it was possible to obtain appropriate
data, as well as rich and comprehensive information in terms of SPMS adoption in the SME
setting.
8.2.2 Qualitative Sampling Technique
As previously discussed in Section 6.8, probability sampling is often linked to the quantitative
approach, whereas non-probability sampling is associated with the qualitative approach
(Saunders, Lewis and Thornhill, 2019), as discussed in Section 6.8. There are five general types
of non-probability sampling: (i) quota, (ii) purposive, (iii) snowball, (iv) self-selection and (v)
and convenience (Saunders, Lewis and Thornhill, 2019; Bell et al., 2018). As stated by
Saunders et al. (2019), the researcher is required to decide which type of non-probability
sampling is most appropriate, from which the sample is drawn to address and answer the
research question. In considering these, purposive sampling and snowball sampling techniques
were jointly and primarily used in this study, and are presented in the following sections.
8.2.3 Qualitative Study Participants
8.2.3.1 Targeted Participant
As stated previously, the qualitative phase is conducted for the purpose of explaining in greater
detail the initial quantitative results and to explore more motivation, enablers and inhibitors
influencing SPMS adoption in the SME setting. Thus, the selection of SMEs for this qualitative
phase follows the standards established in the initial quantitative phase which are already
presented in Section 6.7.1.
It was essential to recognise the selection of appropriate participants who contribute
significantly to the reliable outcomes of any research (Saunders, Lewis and Thornhill, 2019).
Therefore, the sample choice ought to be informative participants who will probably provide
268
the insightful information necessary to address the research question and achieve the research
purposes (Saunders, Lewis and Thornhill, 2019). One common criterion of selecting suitable
participants is their status and function within an organisation. Previous studies have
emphasised that owner-managers are the critical strategic decision-makers in adopting
sustainability initiatives in SMEs (Moore and Manring, 2009; Yacob et al., 2019). Based on
these, this study targeted owner-managers and key employees as crucial participants,
potentially providing a rich understanding of the subject under investigation. Therefore, at least
one or two participants from each studied firm can be recruited.
Moreover, as argued in the literature review, shareholders and key customers can influence the
adoption of SPMs in the SME setting. Accordingly, their perspectives of the research issues
are crucial; therefore, they were targeted as potential interviewees by this current study.
It was anticipated that gaining permission to access SMEs is a challenging task in qualitative
research (Spence and Schimdpeter, 2003). It primarily depends on participants’ willingness
and interest in participating in the study. Hence, this study did not begin with a target sample
size; instead, purposeful sampling and snowball sampling continued until theoretical saturation
was reached (Dhanesh, 2015; Sroufe, 2017).
The following section describes the process of identifying the participants for this qualitative
phase.
8.2.3.2 Process of Identifying Targeted Participants
As the representative sample of the initial quantitative phase, the investigations of this study
were conducted in Ho Chi Minh City, Vietnam (presented in Chapter 6). Therefore, the same
research context was selected which followed the qualitative phase in order to collect sufficient
data to address the research questions and achieve the research objectives.

269
Initially, the researcher attempted to use the Vietnam Chamber of Commerce and Industry’s
(VCCI) SMEs’ database. This is often considered to be the most reliable in Vietnam; however,
lists on SMEs appeared to be outdated. It was found that numerous companies in the database
either no longer exist or have changed their address; furthermore, rare information regarding
SMEs’ sustainability activities has been provided in such a database. Similar to other
developing countries, SMEs’ owners/managers in Vietnam can be sceptical about the relevance
of academic research (Nguyen and Bryant, 2004). It was anticipated that most of them would
probably participate in a study only if they knew the researcher or were aware of the benefits
they would obtain from the study and how the information that they shared would be used.
Moreover, it is important to note that, in Vietnam, proper connections to local government
officials, local business communities, and business networks with SMEs have been considered
as the primary method of approaching SMEs and gaining access to their views on research
issues (Tran and Jeppesen, 2016). In this situation, it was recognised that relying on the
purposive sampling process, by using personal relationships and contacts, is the most feasible
method. This can help the researcher to gain access to SMEs and to gather rich comprehensive
data on how entrepreneurs of SMEs perceive and interpret the experiences of their
entrepreneurial activities concerning the adoption of SPMS in their organisation.
Following this strategy, the researcher contacted two close friends, who are owner-managers
of SMEs and active members of BNI networks (Business Network International) in Ho Chi
Minh City. BNI is the world’s leading business referral organisation with more than 280,000
members in over 10,000 BNI Chapters worldwide (bni.com/about, 2019). Each ‘chapter’ of the
BNI refers to a small group of business owners. The friends are helpful in connecting the
researcher with the chapter monitors of BNI networks in order to obtain their formal approval
to visit their chapters. The BIN chapter presidents issued four invitations, all of which were

270
accepted by the researcher to be a guest at their weekly chapter meetings held in Ho Chi Minh
City centre. These meetings occurred from 6 to 14 July 2018. In each panel, the researcher was
offered five minutes to introduce the topic and purpose to about 30 entrepreneurs who were
present at the event. In his speech, the researcher invited the entrepreneurs of SMEs to
participate in the research project. This would enable them to share their insightful information
and experiences in identifying and developing appropriate metrics that will help SMEs in
Vietnam to measure sustainability performance more efficiently. Subsequently, during each tea
break, the researcher took the opportunity of greeting people and exchanging name cards. Many
responded excitedly to the research project as sustainability is currently a key topic of
discussion in Vietnam. However, these entrepreneurs also expressed concerns about how the
research topic can benefit their firms and SME business communities. The researcher took the
opportunity of explaining and sharing the practical applications that the research could bring
to SMEs. Moreover, the researcher was able to ask them if he could contact them. Some of
them kindly welcomed a later telephone contact to schedule a day for an interview at their
company office. The events offered the researcher good opportunities to create a network of
potential entrepreneurs whom he could recruit as participants in his study.
Based on the researcher’s contact at these events, it took him a few days to identify potential
SMEs which have been engaged in sustainability activities. It proved to be challenging to
identify the types and level of sustainability activities in which they are engaged. After careful
consideration, 34 entrepreneurs, whom the researcher met at the BNI’s events, were contacted
to ascertain whether they wished to participate in this research project. Securing their
participation was somewhat time-consuming and more challenging than the researcher had
anticipated, even with direct and indirect support from the researcher’s personal contact
network. The process resulted in 12 participants, who are owner-manager of SMEs, confirming
their interest in participating.
271
Together with the purposive sampling, a snowball sampling technique was jointly used in
which each interviewee was asked to refer other suitable companies. This was because owner-
managers of SMEs generally rely on their informal networks within their industry and business
sectors to undertake their business (Cordano, Marshall and Silverman, 2010; Russo and Perrini,
2010). Consequently, they will probably know which firms are primarily satisfied with all the
criteria outlined by this study from their standpoints. Therefore, the researcher can save time
in recruiting participants (Nguyen and Ngoc, 2020).
It is important to note that during the process of recruiting participants, one company (C06)
was satisfied that all of the established criteria were provided by this study regarding size,
business performance, industry activities, and mainly their obtained sustainability certifications
(ISO 9001, 14001, Kaizen, 5S). More interestingly, the owner-manager of this SME offered
the researcher an opportunity to access their business to conduct interviews with their staff who
have experience and awareness of the company’s sustainability activities. This situation was
certainly unanticipated and was not the initial design of this study. It was recognised that the
unit of analysis in this research is ‘organisation’; therefore, multiple respondents from a single
SME are not allowed (Muenjohn et al., 2020). However, considering a different perspective of
this research purpose, it can provide more crucial insights into the behaviour and thinking of
the adoption of SPMS. It can also introduce organisational change, from the multiple
respondents ranging from a single SME and from the lower management position to the top
management level. The researcher can effectively explore the phenomenon under study in
greater detail which subsequently contributes to the overall purpose of this research study.
Considering the advantages and disadvantages, the researcher finally accepted the offer when
the owner-manager consented that information shared by their staff would be kept confidential.
This means the information would not be shared with him or anyone else by any method, except
for the academic purpose of this study. Furthermore, the researcher suggested that the owner-

272
manager should implement a schedule to conduct interviews which should be most convenient
for the company and its staff who are willing to participate in this study. Seventeen participants
were recruited from this company, involving the owner-manager, middle-managers, and key
staff.
Finally, the sampling process resulted in a total of 43 participants who were potential
interviewees. The sample size was considered acceptable for the analysis as well as being
comparable with the sample size from recent research on SMEs’ sustainability initiatives. For
example, the study on SMEs’ environmental sustainability conducted by Wiesner et al. (2017)
revealed that data saturation occurred around the eleventh interview with the same themes
emerging within each interview data set. Caldera et al. (2019), in their recent study on
identifying the enablers and barriers for successful implementation of sustainable business in
SMEs, maintain that saturation can be achieved as the state of data satisfaction. This is a case
where no new information was obtained from further data. With regard to these premises, this
study did not use sample size as the exclusive determinant, but also carefully considered the
depth of the data in order to obtain strong evidence of data saturation. Therefore, a sample of
43 interviews was adequate to investigate the factors influencing the adoption of SPMS in
Vietnamese SMEs. Furthermore, this sample was not too large to challenge the extraction of
thick and rich data while not too small to challenge the acquisition of data saturation (Gray,
2014). Details of the participants and their organisations are presented in Table 8.2.

273
Table 8.2 Overall information of interviewees and studied SMEs
General information Number Percentage (%)
Firm Size Medium (< 50 ≤ 300 employees) 15 65
Small (< 10 ≤ 50 employees) 5 35
Micro (≤ 10 employees) 1 5
Firm’ sustainability experience
Matured 13 65
Beginner 7 35
Interviewee’s position Owner-manager 16 37.21 Senior manager 4 9.30
Middle-manager 7 16.28
Key staff 9 20.93
Shareholder 3 6.98
Business customer 4 9.30
Gender Male 30 70 Female 13 30
Interviewee’s age (years) < 45 ≤ 55 6 14 < 35 ≤ 45 18 42 < 25 ≤ 35 19 44
Work experience (years) > 20 8 19 <10 ≤ 20 14 33
<5 ≤ 10 19 44
< 5 2 5
As can be seen from Table 8.2, the sample comprises 20 SMEs, of which 75% are medium-
sized firms, followed by small and micro-size companies, each representing 35% and 5%,
respectively. Regarding the firm’s sustainability experience, SMEs which obtained

274
sustainability certifications/programmes (matured) such as ISO 9001, 14001, accounted for
65%, while the remaining 35% were beginners, implying that SMEs have been engaging with
sustainability initiatives. However, they have not yet obtained a sustainability certification.
In terms of their managerial positions, the interviewees comprised owner-managers (37.21%),
senior managers (9.30%), middle managers (16.28%), and staff (20.93%), shareholders
(6.98%), and business customers (9.30%). Most interviewees had working experience ranging
from over 20 years (19%), 10 to 20 years (33%), and 5 to 10 years (44%), and only 5% had
less than five years of working experience. Regarding interviewees’ age, nearly a half of them
were between 25 to 35 years of age, 42 % were aged 35-45, and 14% were aged 45-55.
Furthermore, the number of male interviewees exceeded the number of female ones (70 % and
30 %, respectively).
Finally, it was anticipated that many interviewees who participated in the qualitative phase
might become respondents who also completed the quantitative survey. In this situation, it was
possible that one form of data might present a bias which could confuse the results obtained
from the other form of data from the same participants (Creswell and Plano Clark, 2011). To
minimise potential bias, this study employed a data collection strategy; following the
completion of the interviews, the questionnaire was distributed in order to obtain a large
quantitative sample size. This enabled the study to avoid the possibility of the information
provided in the quantitative questionnaire influencing interviewees’ answers to the qualitative
questions (Creswell and Plano Clark, 2011).
8.2.4 Pilot Interviews
Two pilot interviews were conducted in this study, the first of which was on 15 July 2018, and
the second on 20 July of the same year. Both of the interviewees who took part in this study
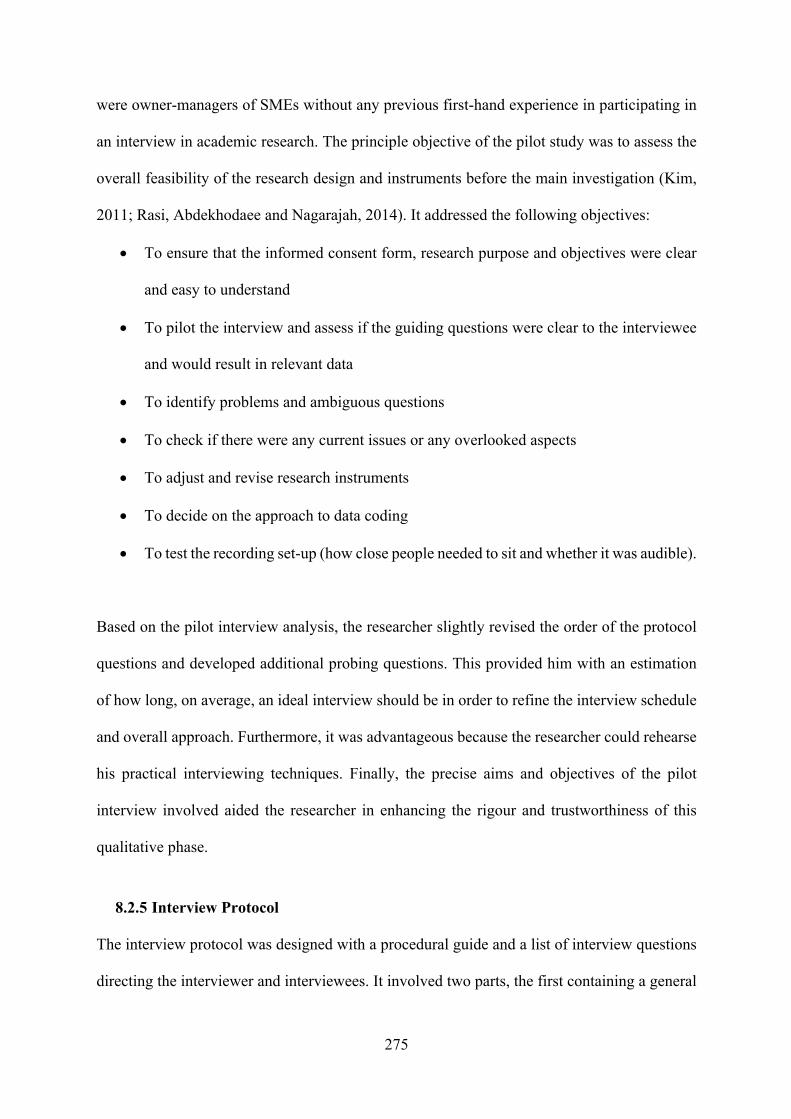
275
were owner-managers of SMEs without any previous first-hand experience in participating in
an interview in academic research. The principle objective of the pilot study was to assess the
overall feasibility of the research design and instruments before the main investigation (Kim,
2011; Rasi, Abdekhodaee and Nagarajah, 2014). It addressed the following objectives:
• To ensure that the informed consent form, research purpose and objectives were clear
and easy to understand
• To pilot the interview and assess if the guiding questions were clear to the interviewee
and would result in relevant data
• To identify problems and ambiguous questions
• To check if there were any current issues or any overlooked aspects
• To adjust and revise research instruments
• To decide on the approach to data coding
• To test the recording set-up (how close people needed to sit and whether it was audible).
Based on the pilot interview analysis, the researcher slightly revised the order of the protocol
questions and developed additional probing questions. This provided him with an estimation
of how long, on average, an ideal interview should be in order to refine the interview schedule
and overall approach. Furthermore, it was advantageous because the researcher could rehearse
his practical interviewing techniques. Finally, the precise aims and objectives of the pilot
interview involved aided the researcher in enhancing the rigour and trustworthiness of this
qualitative phase.
8.2.5 Interview Protocol
The interview protocol was designed with a procedural guide and a list of interview questions
directing the interviewer and interviewees. It involved two parts, the first containing a general

276
question about the interviewee’ personal information such as background, position, experience
and overview of their current business).
The second part included key questions related to the measurement of sustainability
performance in SMEs. This focused on motivation, enablers, inhibitors, sustainability metrics
development, stakeholder interests, external barriers and drivers which influence the adoption
of sustainability performance measurement in SMEs. The same questions were used to
interview key customers, but specifically modified to capture their opinions, from the outside,
on the adoption of SPMS in SMEs.
Apart from the protocol at the beginning of the interview, each interviewee was provided with
the same list of sustainability metrics which were identified from the literature as presented in
Chapter 4. Consequently, this ensured that all the participants had an overview and
comprehensive understanding of sustainability metrics which the researcher would mention
during the interview. This enabled the researcher to confirm that the information gathered was
objective, precise, and comparable across all the interviews.
The guiding questions are reviewed and commented by four Vietnamese PhD candidates, in
the UK universities, who specialise in business management, in order to obtain validity with
regard to content and structure. Subsequently, it is translated into Vietnamese and reviewed by
a Vietnamese researcher for ease and convenience of collecting data from Vietnamese-
speaking interviewees. The researcher planned to conduct interviews in Vietnamese or English
to gain the most insightful information depending on the interviewee’s language. Data collected
is transcribed and translated into English.
After agreeing to participate in this study, the interviewees are contacted by telephone to
arrange appointments which proved challenging because of the limited time available to the

277
researcher to complete the fieldwork. He applied practical tips to increase the acceptance and
willingness of interviewees to participate. Notably, an official letter, including research
information and consent form to conduct the study, was initially sent to the participating SMEs.
The most challenging stage of this process was scheduling the interviews because the
participants were busy; moreover, some unexpected issues might have arisen that led them to
forget, delay or even cancel the appointment.
Therefore, it was deemed best to contact people at short notice, and within a week, to schedule
a successful appointment. Due to the busy working schedules of interviewees, the interviews
were conducted when participants were available. In all cases, interviewees were encouraged
to suggest and determine the time and venue most convenient for them, and flexibility was
allowed to enable them to express their opinions and experiences freely.
8.2.6 Establishing Ethical Guidelines for both Quantitative and Qualitative Studies
Before collecting the data, the researcher obtained ethical approval from the Faculty Research
Ethics Committee of the University of the West of England. This ensured that ethical principles
were considered when the research was conducted (Gray, 2014; Saunders, Lewis and Thornhill,
2019; Bell et al., 2018). The participants had the right to withdraw at any time during the
research, even though they had signed the consent form. If they wished to withdraw from the
investigation after data had been collected, they would have been asked if they agreed that the
data collected could be retained and included in the study. If they did not agree, these data
would be destroyed and not included in the study. However, it would not be possible for them
to withdraw their data from the study when the analysis had begun or was complete.
The researcher acknowledged that the participants, when provided with information, might be
concerned that it might damage the image or reputation of their business. Therefore,
278
interviewees were informed of how their identity would be coded, and anonymity was assured.
Sensitive information – in particular that provided during the interviews such as people’s
names, places, businesses, educational background, and occupation – was anonymised in the
transcripts. Importantly, the researcher assigned pseudonyms to people’s names (including key
stakeholders) to the participants involved in the interviews. The same strategy was applied to
places and businesses. Detailed information of any participant discussed in the interviews was
not revealed to other participants. The participants were assured that no one, except for the
researcher, would have access to their personal information.
8.2.7 The Procedure of Conducting Semi-structured Interviews and the Treatment of
Recording
The interviews were conducted between 20 July and 5 September 2018 in Ho Chi Minh City,
Vietnam. At the first stage of the formal interview each interviewee is provided with a hard
copy of the research information, interview protocol, and questions. The interviewees are
welcome to ask any question related to the research purposes and interview questions if they
believed further clarification is required. After they understood this and are ready to be
interviewed, they are asked to sign a consent form. The formal interview commences with a
short personal introduction during which the researcher explains the purpose of his study. Next,
each interviewee is asked some initial straightforward questions about the nature of the
business, their background, and their involvement in the business. This enables the researcher
to collect the demographic information and to familiarise himself with the company. The
primary purpose of these initial tasks is to ‘warm up’ the interview atmosphere and to make
the interviewees feel comfortable in expressing their viewpoints openly, sharing experiences
and stories, and providing rich, descriptive data (Boyce and Neale, 2006). The participants are
then asked the established guiding questions.

279
It is planned to conduct the interviews in Vietnamese or English, depending on the
interviewee's language. However, all the interviewees found it difficult to express their views
in English, but felt more comfortable communicating in Vietnamese. Therefore, the researcher
conducts the interviews in Vietnamese in order to obtain rich information and maintain the
high quality of the interview (Boyce and Neale, 2006). Subsequently, the researcher transcribes
the audio recordings into the original language – Vietnamese.
The interviews are audio-recorded with the consent of the participants. However, some
interviewees are reluctant to be recorded, but they are assured that their information is
confidential and used solely for academic research. Furthermore, the tapes would be destroyed
after the transcribing is completed. It is surprising that none of the interviewees requested the
transcription of their interview.
Each interview lasts on average approximately 30 minutes, but they range from 23 to 82
minutes. This variation in length is because some interviewees requested that their information
should not be recorded when referring to political issues that are a sensitive topic in Vietnam.
Others who provide short answers are reluctant to provide detailed information about their
business operations which are often commercially sensitive. They are only willing to answer
questions quite briefly and without divulging too many details. However, the key points that
emerges from their answers are captured and noted by the researcher.
Throughout the interviews, the researcher strives to adhere to the requisite procedures and
ethical guidelines. This includes building a strong rapport with interviewees to gain their trust
and ensure each interview is successful. To facilitate this, the guidelines proposed by Easterby-
Smith et al. (2015) and Silverman (2013) are followed. These include, being patient and non-
judgemental understanding interviewees and identifying with their experiences and thoughts,
280
demonstrating sensitivity, making sure each interview flows, and maintaining a clear focus on
topics and issues pertinent to the research.
While conducting the interviews, the researcher follows the interview guidelines quite flexibly
with open-ended questions. He anticipates that the interviewing process would often produce
new ideas or significant issues that could usefully be discussed with other interviewees. Many
new or exciting facets can be emerged from the interviews. These might include organisational
sustainability orientation, organisational culture and change, socioeconomics in Vietnam, and
the community where their businesses are located. The researcher then adjusts the questions
and responds by posing follow-up questions to such new dimensions, and asks additional
questions such as: ‘Why do you think that?’; ‘In such a situation, please could you tell me what
you think you should do?’ and ‘Could you give a typical example about that please’. The
follow-up questions are also used when answers are short or do not provide sufficient detail
which helps the interviewees to express their ideas more comprehensively. By asking questions
in this manner, the researcher allows the interviewees to expand their answers from which he
could capture unanticipated facets at the beginning of the interview.
After each interview, the researcher reviewed and modified the protocol in order to satisfy the
requirement of gaining richer and deeper information. Furthermore, he writes contextual
interview notes and enters factual content information from the interview into the database; for
example, key people, dates and events.
The qualitative reliability undertaken for the current study is followed by the data triangulation
strategy outlined by Denzin (1989). Notably, with regard to time triangulation, data are
gathered on the same phenomenon over a period, but in space triangulation, data are collected
from the venue/site of each firm. Moreover, in person triangulation, data are gathered from

281
different key stakeholders including owners/managers, employees, shareholders and
customers. The following sections present the process of analysing data using thematic
analysis.
8.3 Thematic Analysis
In this study, thematic analysis is employed to analyse the interviews. It has been suggested
that this is an appropriate method of identifying, analysing and reporting patterns (themes)
(Clarke and Braun, 2013; Nowell et al., 2017). It is also a way of presenting a level of patterned
meaning within the set of data (Gray, 2014). Braun and Clarke (2006; p.97) emphasise that ‘a
rigorous thematic approach can produce an insightful analysis which answers particular
research questions.’
It is important to highlight two main strategies in order to identify a potential theme which can
initially emerge inductively from the drawn data or generated deductively from previous
literature or a specific research question (Braun and Clarke, 2006; Brunosson, 2020; Creswell,
2013; Nowell et al., 2017). Both of these methods are utilised in the current study. Initially, the
researcher specifically uses a template to develop priori codes as well as broad themes inspired
by the research questions and the literature, but remained open-minded to themes that
subsequently emerge from the raw data during the coding process.
Template analysis (TA) is used to identify and analyse patterns in the qualitative interview data
because it is considerably matched with the abductive approach (Clarke and Braun, 2013).
Specifically, the hierarchical coding is applied in order to examine the interview transcript at
varying levels of specificity from broad higher-order themes to obtain an overview, then
moving on to more detailed, lower-order themes (Nowell et al., 2017). The hierarchical coding
process commences with four general priori themes relating to motivation, inhibitors, enablers

282
and external influences before moving to narrower themes. These initial broad themes are
inspired by the research questions and theoretical framework which indicate factors influencing
measuring sustainability performance (Braun and Clarke, 2006; Nowell et al., 2017). Although
the application of template analysis begin with a relatively deductive approach, the researcher
is exposed to the possibilities of new themes which emerge during the data analysis (Tran,
Deng and Ong, 2018).
Having employed thematic analysis as the qualitative data technique, the researcher follows
the outline guides proposed by Braun and Clarke (2006, p.87) comprising six phases: 1)
familiarisation with data; 2) generating initial codes; 3) searching themes; 4) reviewing themes;
5) defining and renaming themes; and 6) producing the report. The first five stages are
presented in this chapter, and the final one (producing the report) is presented in the next
chapter as part of the findings.
The qualitative data analysis process is supported by the use of Nvivo software (version 12),
which would help in sorting and organising the large data set more effectively (Jugder, 2016;
Nowell et al., 2017). Although this software cannot replace the iterative process of creating
codes, it can help the researcher to facilitate efficient management of the analysis process more
conveniently after using manual paper-based approaches to families with the data. This means
the data analysis process can be more rigorous, comprehensive and practical. Another benefit
is that the use of Nvivo software is suitable to conduct thematic content analysis since it allows
the researcher to improve the reliability of the qualitative data analysis (Chandra, Paul and
Chavan, 2020).
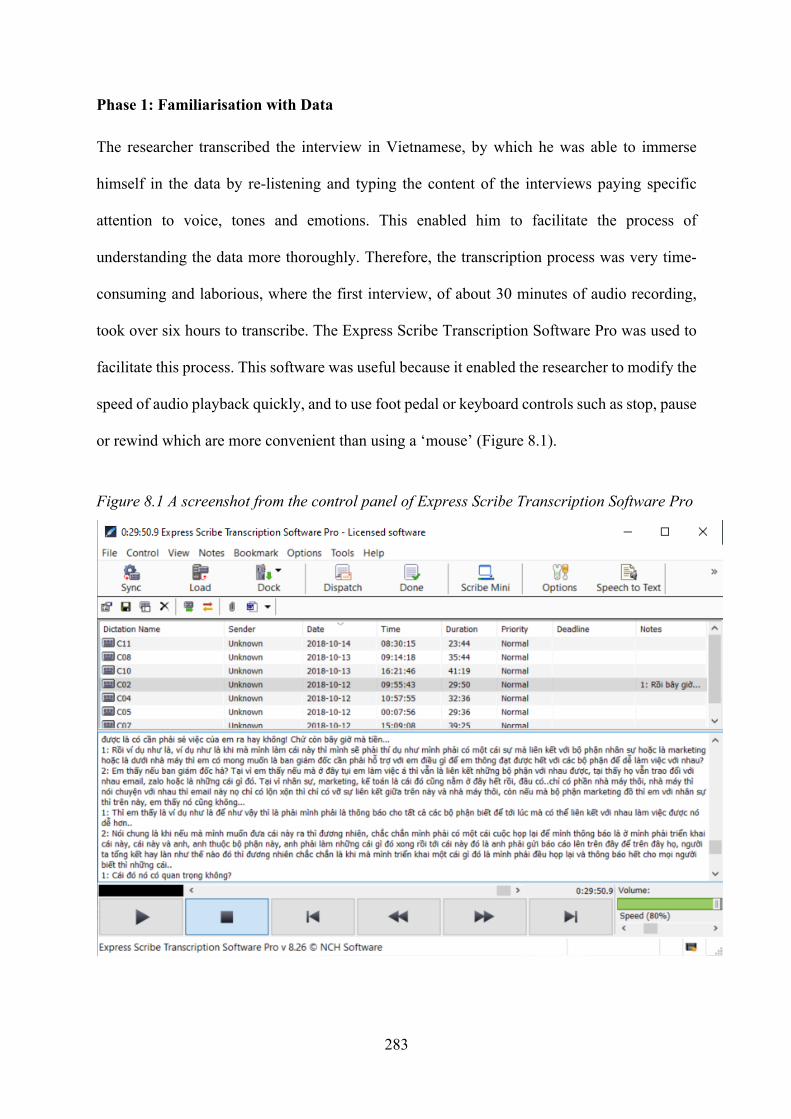
283
Phase 1: Familiarisation with Data
The researcher transcribed the interview in Vietnamese, by which he was able to immerse
himself in the data by re-listening and typing the content of the interviews paying specific
attention to voice, tones and emotions. This enabled him to facilitate the process of
understanding the data more thoroughly. Therefore, the transcription process was very time-
consuming and laborious, where the first interview, of about 30 minutes of audio recording,
took over six hours to transcribe. The Express Scribe Transcription Software Pro was used to
facilitate this process. This software was useful because it enabled the researcher to modify the
speed of audio playback quickly, and to use foot pedal or keyboard controls such as stop, pause
or rewind which are more convenient than using a ‘mouse’ (Figure 8.1).
Figure 8.1 A screenshot from the control panel of Express Scribe Transcription Software Pro

284
During the transcription process, the researcher noted initial ideas, interesting remarks (Gray,
2014) or potential patterns. Before the coding process, the researcher read through the
transcripts a number of times until he felt comfortable with the content. This task was also
valuable for checking the transcript for obvious mistakes made during transcription to ensure
the reliability of the study throughout the data analysis. At this step, nine interviews (C02, C05,
C06, C08, C09, C10, C11, C15, C17) out of 43 were selected as representative of the entire
data set to develop the initial template. The researcher used field notes to enhance the
understanding of the transcripts. These nine representative interviews were selected because
they were particularly informative and comprehensive, covering a range of issues and
knowledge mentioned in the dataset.
Phase 2: Coding Data
It has been maintained that coding is a critical starting point for any qualitative data analysis
(Bell et al., 2018). This phase involves the production of initial codes which emerged from the
data with specific attention to striking features that would be relevant to answering the research
question. At this stage, the Nvivo software was utilised to assist the process of data coding. All
the 43 Word files of interview transcripts were imported into this software. Each interview
transcript was allocated a code (or a node) to be easily viewed on the computer screen. At this
step, four priori themes, developed in Phase 1, were created and represented as parent nodes
(main themes) which helps to organise the meaningful data groups (Nowell et al., 2017). It was
acknowledged that the researcher maintained a consistent definition of the code throughout the
process in order to ensure the study’s reliability in the data analysis.
The researcher codes each transcript separately and systematically through the entire data set,
in which each data item receives full and equal attention (Braun and Clarke, 2006). The data
items are coded using units of text, sometimes a word, phrases, sentences or even a paragraph

285
as a text segment (Gioia et al., 2013; Paterson et al., 2013; Williams and Shepherd, 2017). If a
data item is identified as being related to a theme or issue, and appropriate labels were
immediately attached (Nowell et al., 2017). This enables the researcher to simplify and identify
the data’s critical features relevant to the research question. During the coding process, the
researcher utilises ‘memo’ in Nvivo to note and save interesting ideas or emerged impressions
that might form the basis of potential themes and patterns across the data set (Nowell et al.,
2017). The researcher was also flexible and kept an open mind in identifying the manifest and
latent meanings within the data set (Connelly and Peltzer, 2016). At the conclusion of this
phase, the coding process resulted in a long list of codes. The researcher began to organise
initial codes into a parent-child relationship, as illustrated in Figure 8.2.

286
Figure 8.2 An example of organising the initial codes into a parent-child relationship
(screenshot from NVivo 12)
287
Step 3. Searching for Themes
Theme development is considered to be a crucial part of most analytic processes in a study
(Connelly and Peltzer, 2016). A theme is defined as ‘an abstract entity that brings meaning and
identity to a recurrent experience and variant manifestations. As such, a theme captures and
unifies the nature or basis of the experience in a meaningful whole’ (DeSantis and Ugarriza,
2000; p.362). The researcher began searching for themes by reviewing and comparing all the
codes and relevant data extracts (Braun and Clarke, 2006; Nowell et al., 2017) identified in the
previous phase. Subsequently, he combined codes that conceptually overlapped by grouping
them into appropriate categories (Woods, 2011), aiming to recognise the themes that emerged
from them (Paterson et al., 2013).
Phase 4: Reviewing Themes
In this phase, themes were reviewed and refined by being split, combined, or discarded (Braun
and Clarke, 2006). The researcher initially checked whether the candidate themes accurately
conveyed a story of the whole data set. He then reviews data extracts to confirm that the themes
consciously cohered together with a precise and identifiable distinction between them (Braun
and Clarke, 2006). This process was repeated until he is confident that there are no other new
themes remained to be identified. Notwithstanding this, one key challenge for the researcher
was to determine the ‘level’ of the themes, in which he intentionally combined the main theme
‘motivation’ as a sub-theme of the theme ‘enablers’. He also reviews the coded data extracts
for these themes and found that the latter were sufficiently specific and broad to capture the set
of ideas. This resulted in there being a meaningful coherent pattern among them after the
refinement which can help reduce data into a more manageable set of significant themes that
summarise the text precisely and concisely (Attride-Stirling, 2001). Therefore, the researcher
288
finally decided to keep ‘motivation’ as one main theme because it comprises several sub-
themes, and it would be better to present them separately with the main theme ‘enabler’.
Step 5. Defining and Naming Themes
This phase involved choosing an informative name for each theme. Initially, the researcher
writes a detailed analysis for each one. Subsequently, he focused on the scope of each theme
to identify interesting features in order to determine a meaningful story for each (Nowell et al.,
2017). In defining and naming a theme, he regarded it important that it should be ‘punchy’,
which aimed to give the readers an immediate sense of what the theme conveys (Braun and
Clarke, 2006). Finally, he re-examines the story of each theme to consider how all they all
coordinate in relating the overall story of how factors influence the adoption of SPMS in
Vietnamese SMEs (Nowell et al., 2017). The researcher then modified and refined the theme
definitions until the established themes are reached, after which the report could be written
(Braun and Clarke, 2006).
Similar to the initial quantitative phrase (Chapter 6), validity issues are addressed for this
qualitative phrase (Collis and Hussey, 2014). Validity in qualitative studies is mainly a matter
of the researcher employing specific procedures to guarantee the credibility and accuracy of
the findings (Creswell, 2013). Although the researcher was not a member of the Vietnamese
SMEs community, two of his close friends are participants; therefore, this poses a threat in the
form of researcher bias. Thus, “member checking” technique mainly addresses reliability
because it had been suggested as a crucial for establishing accuracy and credibility in a study
(Kim, 2011; Magolda, 2000; Nowell et al., 2017). The feedback confirms that the final template
is clear and comprehensive, and corresponded to their experience in the empirical context.
Therefore, the researcher ensured the accuracy of the data (Mertens and Hesse-Biber, 2012;
Torrance, 2012).

289
Although the researcher conducted this study alone, he consults the supervisory team to verify
whether the established themes needed to be refined. This peer-debriefing process was
advantageous in strengthening the validity and creditability of the research findings (Nowell et
al., 2017). The supervisors’ feedback suggests that the researcher should use matrices and
visualise established themes, which is presented in the next chapter as part of the findings.
8.4 Conclusion
This chapter has discussed, described, and explained the qualitative components of the study.
This chapter has chosen purposive and snowball as sampling techniques; and semi-structure as
the interview technique. Moreover, thematic analysis has been selected as the primary
technique for quantitative data analysis. In this chapter, pilot interview, interview protocol,
ethical guideline, procedure of conducting interview and the treatment of recording have been
established. Moreover, participants and sample size of the qualitative study have been targeted
in this chapter.
The following chapter presents the qualitative research findings and analysis of the PhD work.
290
CHAPTER 9 ANALYSIS AND DISCUSSION OF QUALITATIVE
FINDINGS
9.1 Introduction
This chapter presents the findings from the 43 interviews with owner-managers, senior
managers, key employees, shareholders, and key customers of Vietnamese SMEs. It comprises
four main parts. The first part (9.2) provides a description of the cases. The second part (9.3)
presents the thematic template. The third part (9.4) presents the key themes that emerged from
the analysis describes the development of the thematic template.
9.2 Description of Cases
In total, 43 interviews were conducted with participants in 20 studied SMEs from a variety of
backgrounds and holding various managerial positions including owner-managers, general
directors, deputy general directors, middle-managers and key employees, shareholders. Four
interviewees were business customers.
The studied SMEs comprised of firms from different business sectors. The common feature of
these studied firms is that they do not operate solely in one sector such as manufacturing or
service but engage in numerous other integrated and combined activities related to other sectors
such trading and manufacturing, or manufacturing and service.
The size of the organisations was measured according to the official definition of SMEs
provided by the Vietnamese government. Specifically, SMEs were classified into three major
groups: micro, small and medium-sized firms (based on their number of employees). A micro,
small and medium-sized enterprise is categorised as having between 1 and 10, 11 and 50, and
51 and 300 employees, respectively (Government Decree No. 90/2001/CP-ND on “Supporting
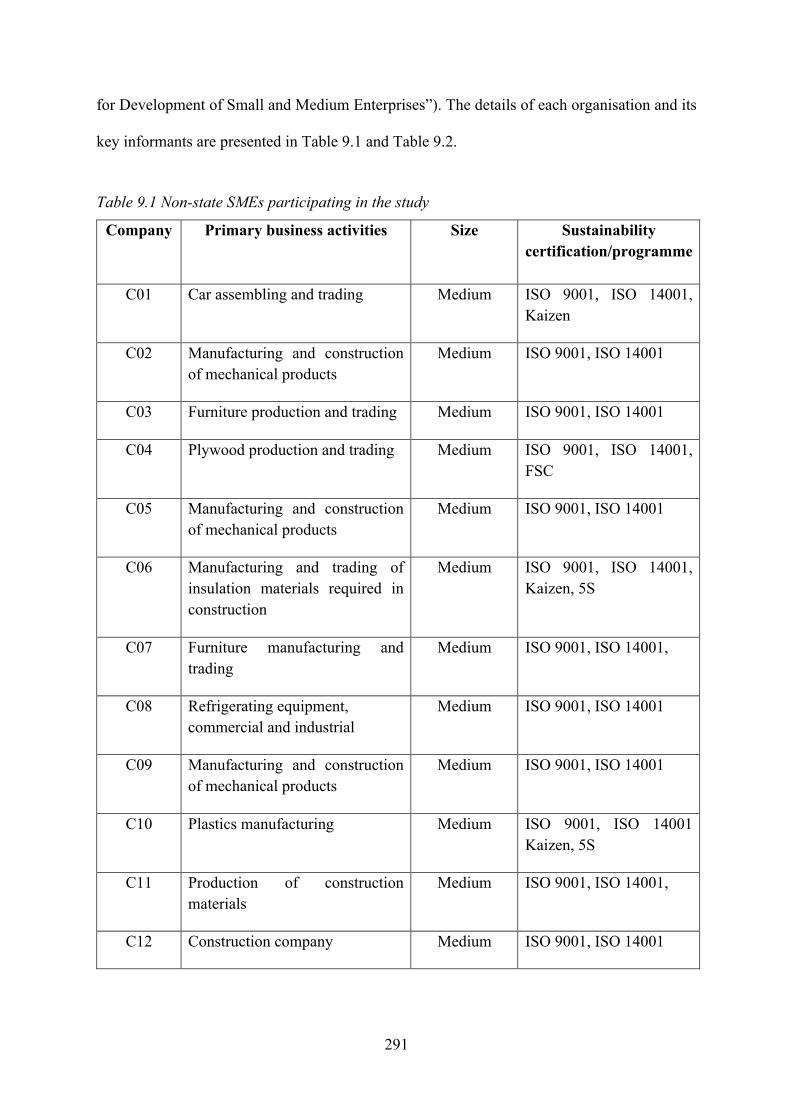
291
for Development of Small and Medium Enterprises”). The details of each organisation and its
key informants are presented in Table 9.1 and Table 9.2.
Table 9.1 Non-state SMEs participating in the study
Company Primary business activities Size
Sustainability certification/programme
C01 Car assembling and trading Medium ISO 9001, ISO 14001,
Kaizen
C02 Manufacturing and construction of mechanical products
Medium ISO 9001, ISO 14001
C03 Furniture production and trading Medium ISO 9001, ISO 14001
C04 Plywood production and trading Medium ISO 9001, ISO 14001, FSC
C05 Manufacturing and construction of mechanical products
Medium ISO 9001, ISO 14001
C06 Manufacturing and trading of insulation materials required in construction
Medium ISO 9001, ISO 14001, Kaizen, 5S
C07 Furniture manufacturing and trading
Medium ISO 9001, ISO 14001,
C08 Refrigerating equipment, commercial and industrial
Medium ISO 9001, ISO 14001
C09 Manufacturing and construction of mechanical products
Medium ISO 9001, ISO 14001
C10 Plastics manufacturing Medium ISO 9001, ISO 14001 Kaizen, 5S
C11 Production of construction materials
Medium ISO 9001, ISO 14001,
C12 Construction company Medium ISO 9001, ISO 14001

292
C13 Labels and textile auxiliaries manufacturing
Medium N/A
C14 Furniture manufacturing Medium N/A
C15 Plastics manufacturing Small ISO 9001, ISO 14001, Kaizen
C16 Agricultural products manufacturing and trading
Small N/A
C17 Furniture manufacturing and trading
Small N/A
C18 Air ticket trading and providing travel
Small N/A
C19 Trading of mechanical products and accessories
Small N/A
C20 Trading and installation of 3D printers
Micro N/A
Table 9.2 Key Informant Information
No Company Position of the interviewee Experience (years)
Age Gender
1 C01 Owner-manager > 20 < 45 ≤ 55 M
2 C02 Owner-manager > 20 < 45 ≤ 55 M
3 C03 Owner-manager <5 ≤ 10 < 35 ≤ 45 M
4 C04 Owner-manager <5 ≤ 10 < 25 ≤ 35 M
5 C05 Deputy General Director <5 ≤ 10 < 25 ≤ 35 M
6 C06 Owner-manager > 20 < 35 ≤ 45 M
7 C07 Owner-manager <10 ≤ 20 < 35 ≤ 45 M
8 C08 Owner-manager <10 ≤ 20 < 35 ≤ 45 M
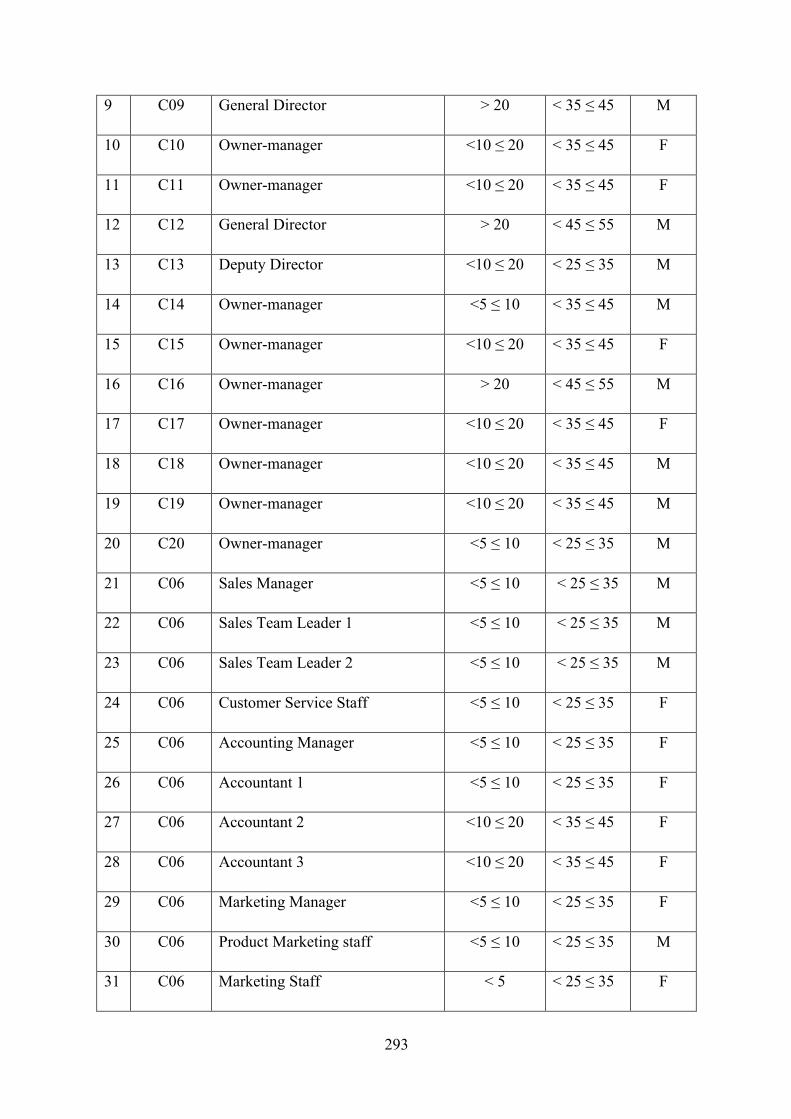
293
9 C09 General Director > 20 < 35 ≤ 45 M
10 C10 Owner-manager <10 ≤ 20 < 35 ≤ 45 F
11 C11 Owner-manager <10 ≤ 20 < 35 ≤ 45 F
12 C12 General Director > 20 < 45 ≤ 55 M
13 C13 Deputy Director <10 ≤ 20 < 25 ≤ 35 M
14 C14 Owner-manager <5 ≤ 10 < 35 ≤ 45 M
15 C15 Owner-manager <10 ≤ 20 < 35 ≤ 45 F
16 C16 Owner-manager > 20 < 45 ≤ 55 M
17 C17 Owner-manager <10 ≤ 20 < 35 ≤ 45 F
18 C18 Owner-manager <10 ≤ 20 < 35 ≤ 45 M
19 C19 Owner-manager <10 ≤ 20 < 35 ≤ 45 M
20 C20 Owner-manager <5 ≤ 10 < 25 ≤ 35 M
21 C06 Sales Manager <5 ≤ 10 < 25 ≤ 35 M
22 C06 Sales Team Leader 1 <5 ≤ 10 < 25 ≤ 35 M
23 C06 Sales Team Leader 2 <5 ≤ 10 < 25 ≤ 35 M
24 C06 Customer Service Staff <5 ≤ 10 < 25 ≤ 35 F
25 C06 Accounting Manager <5 ≤ 10 < 25 ≤ 35 F
26 C06 Accountant 1 <5 ≤ 10 < 25 ≤ 35 F
27 C06 Accountant 2 <10 ≤ 20 < 35 ≤ 45 F
28 C06 Accountant 3 <10 ≤ 20 < 35 ≤ 45 F
29 C06 Marketing Manager <5 ≤ 10 < 25 ≤ 35 F
30 C06 Product Marketing staff <5 ≤ 10 < 25 ≤ 35 M
31 C06 Marketing Staff < 5 < 25 ≤ 35 F

294
32 C06 Office Administrator <5 ≤ 10 < 25 ≤ 35 F
33 C06 Human resource staff < 5 < 25 ≤ 35 F
34 C06 Production Manager <10 ≤ 20 < 35 ≤ 45 M
35 C06 Technical Team Leader <10 ≤ 20 < 35 ≤ 45 M
36 C06 IT staff <5 ≤ 10 < 25 ≤ 35 M
37 C08 Shareholder 1 > 20 < 45 ≤ 55 M
38 C13 Shareholder 2 > 20 < 45 ≤ 55 M
39 C03 Shareholder 3 <5 ≤ 10 < 35 ≤ 45 M
40 External Business customer 1 <5 ≤ 10 < 25 ≤ 35 M
41 External Business customer 2 <5 ≤ 10 < 25 ≤ 35 M
42 External Business customer 3 <5 ≤ 10 < 25 ≤ 35 M
43 External Business customer 4 <10 ≤ 20 < 35 ≤ 45 M
9.3 The thematic template
The coding process finalised with the final template in Table 9.3 focuses on the three main
themes of ‘motivations that drive the SPMS adoption’, ‘internal factors that influence SPMS
adoption’ and ‘external factors that influence SPMS adoption’.
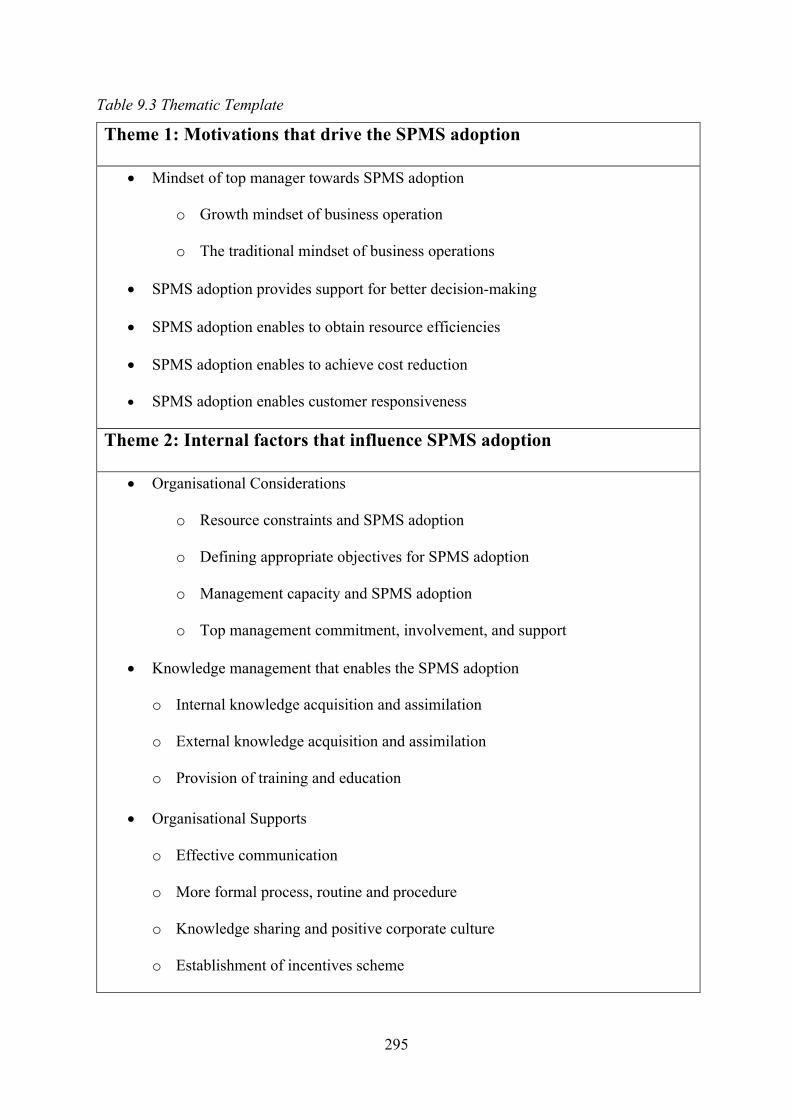
295
Table 9.3 Thematic Template
Theme 1: Motivations that drive the SPMS adoption
• Mindset of top manager towards SPMS adoption
o Growth mindset of business operation
o The traditional mindset of business operations
• SPMS adoption provides support for better decision-making
• SPMS adoption enables to obtain resource efficiencies
• SPMS adoption enables to achieve cost reduction
• SPMS adoption enables customer responsiveness
Theme 2: Internal factors that influence SPMS adoption
• Organisational Considerations
o Resource constraints and SPMS adoption
o Defining appropriate objectives for SPMS adoption
o Management capacity and SPMS adoption
o Top management commitment, involvement, and support
• Knowledge management that enables the SPMS adoption
o Internal knowledge acquisition and assimilation
o External knowledge acquisition and assimilation
o Provision of training and education
• Organisational Supports
o Effective communication
o More formal process, routine and procedure
o Knowledge sharing and positive corporate culture
o Establishment of incentives scheme
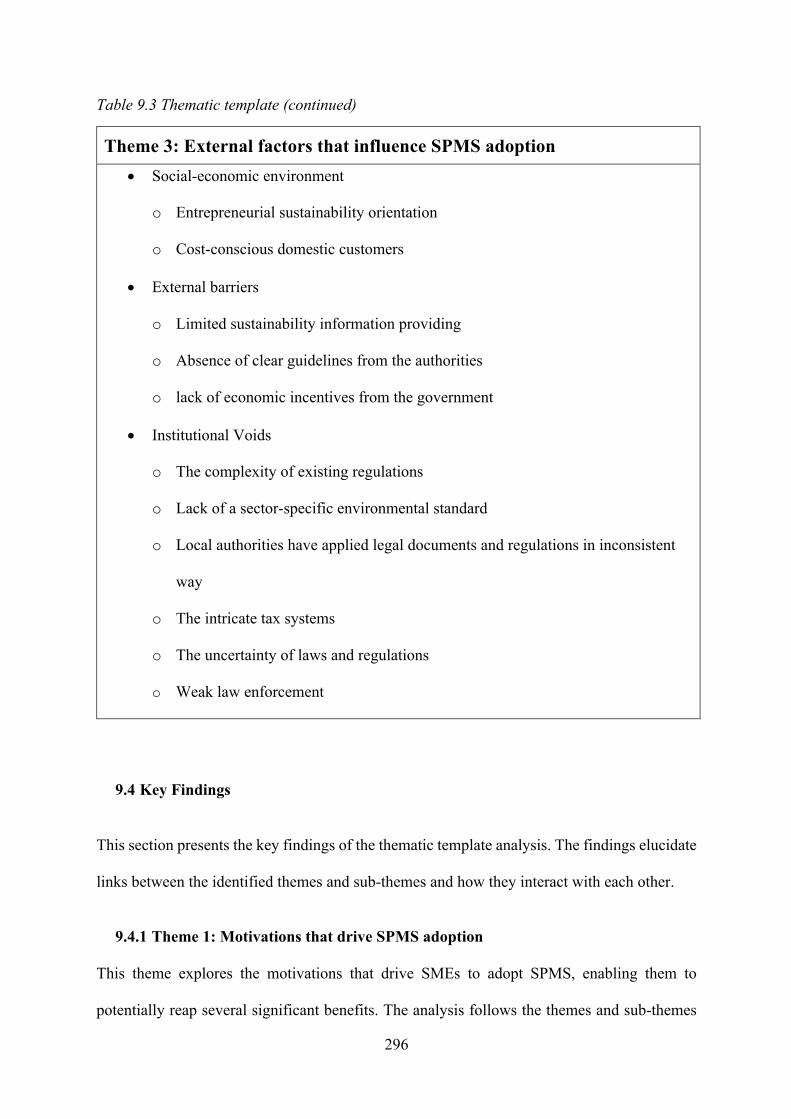
296
Table 9.3 Thematic template (continued)
Theme 3: External factors that influence SPMS adoption • Social-economic environment
o Entrepreneurial sustainability orientation
o Cost-conscious domestic customers
• External barriers
o Limited sustainability information providing
o Absence of clear guidelines from the authorities
o lack of economic incentives from the government
• Institutional Voids
o The complexity of existing regulations
o Lack of a sector-specific environmental standard
o Local authorities have applied legal documents and regulations in inconsistent
way
o The intricate tax systems
o The uncertainty of laws and regulations
o Weak law enforcement
9.4 Key Findings
This section presents the key findings of the thematic template analysis. The findings elucidate
links between the identified themes and sub-themes and how they interact with each other.
9.4.1 Theme 1: Motivations that drive SPMS adoption
This theme explores the motivations that drive SMEs to adopt SPMS, enabling them to
potentially reap several significant benefits. The analysis follows the themes and sub-themes
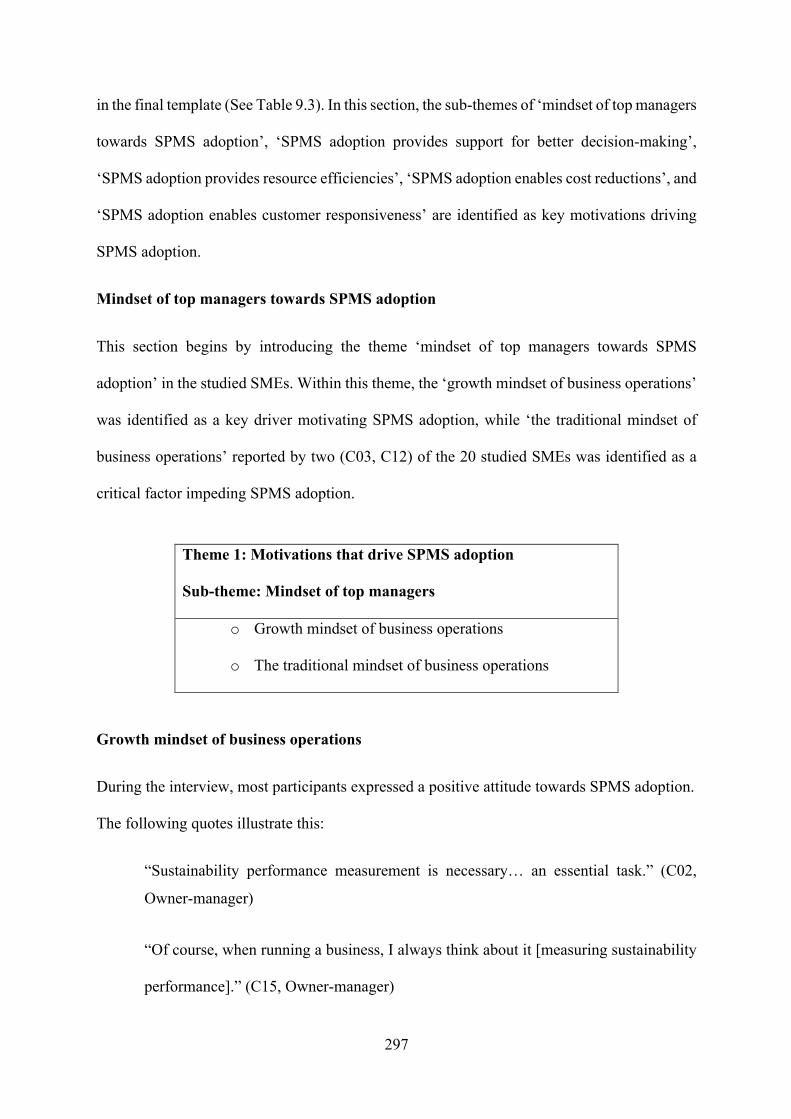
297
in the final template (See Table 9.3). In this section, the sub-themes of ‘mindset of top managers
towards SPMS adoption’, ‘SPMS adoption provides support for better decision-making’,
‘SPMS adoption provides resource efficiencies’, ‘SPMS adoption enables cost reductions’, and
‘SPMS adoption enables customer responsiveness’ are identified as key motivations driving
SPMS adoption.
Mindset of top managers towards SPMS adoption
This section begins by introducing the theme ‘mindset of top managers towards SPMS
adoption’ in the studied SMEs. Within this theme, the ‘growth mindset of business operations’
was identified as a key driver motivating SPMS adoption, while ‘the traditional mindset of
business operations’ reported by two (C03, C12) of the 20 studied SMEs was identified as a
critical factor impeding SPMS adoption.
Theme 1: Motivations that drive SPMS adoption
Sub-theme: Mindset of top managers
o Growth mindset of business operations
o The traditional mindset of business operations
Growth mindset of business operations
During the interview, most participants expressed a positive attitude towards SPMS adoption.
The following quotes illustrate this:
“Sustainability performance measurement is necessary… an essential task.” (C02,
Owner-manager)
“Of course, when running a business, I always think about it [measuring sustainability
performance].” (C15, Owner-manager)
298
“Business sustainability and how to measure it is still quite new in Vietnam. If we take
the opportunity to implement it fast, it will help us develop a sustainable competitive
advantage.” (C04, Owner-manager)
“I believe sustainability will be a trend that Vietnamese firms must follow.” (C08,
Owner-manager)
The development of positive attitudes towards SPMS adoption by top managers was considered
essential and necessary (C02, C15). They believed that sustainability would be a trend
Vietnamese companies cannot ignore (C08) and that the first-mover would enjoy a sustainable
competitive advantage (C04). The qualitative findings closely agree with those of Nguyen
(2019), who recently provided empirical evidence indicating that a growth mindset is a crucial
driver motivating owner-managers of Vietnamese SMEs to adopt sustainability management
tools such as Kizen, ISO 14001. Moreover, the finding agrees with literature highlighting that
top managers with growth mindsets are likely to drive their companies to engage in
sustainability management and foster the implementation of sustainability performance
measures in their organisation (Ghazilla, Sakundarini, Abdul-Rashid, Ayub, Olugu, Musa, et
al., 2015; Eikelenboom et al., 2019). Therefore, top managers with a growth mindset motivate
their company to adopt SPMS.
The traditional mindset of business operations
The literature review indicated that if SME owner-managers are uncertain about or lack interest
in sustainability, this would result in a low rate of engagement with sustainability initiatives
(Battisti and Perry, 2011; Pham, Yong and Truong, 2019). This was exemplified by two of the
top managers out of the 20 SMEs studied (C03, C12). The following quote illustrates this
viewpoint:

299
“To be honest with you, we never talk about these issues; neither do we get time for
such things. We just ensure that we comply with legal requirements. As a small firm
we just deal with necessary things to survive, stay competitive, and make a profit. That
is all. We have not had strategic planning for such things with a long-term view.” (C12,
General Director)
At the same time, most respondents expressed their frustration regarding the old-fashion
business operation mindset of owner-managers in Vietnamese SMEs. The following quotes
illustrate this:
“I think that the most challenging is their old-fashioned mindset. They might be
sceptical about the notion of sustainability. They might think of measuring
sustainability performance, but for what! They don’t have a vision for it, they just care
about measuring expenses and profit, that is enough. Changing their mindset is
extremely difficult.” (C06, Owner-manager)
“Personally, I think in Vietnam, many SME owners have a very limited perception
about sustainability issues or measuring it. They are doing business with the thought
that: I invest money to do business, so profit is my top priority.” (C05, Deputy General
Director)
These quotes demonstrate that short-term orientation sustainability (C12) and a profit-driven
(C06, C05) approach are critical barriers impeding SPMS adoption. This finding can be
explained by the fact that in Vietnam, SME owner-managers apparently operate their business
in a self‐interested manner to prioritise the acquisition of a quick profit (Nguyen and Pham,
2020; Tien, Anh and Ngoc, 2020) rather than adopt a profit-sacrificing sustainability approach
(Pham, Yong and Truong, 2019). Another possible explanation may be an inherent assumption
that sustainability initiatives have currently materialised in Western countries and there is less
interest in Vietnam (Nguyen, Kelly and Bensemann, 2017). Against this background, it can be
argued that if owner-managers do not change their traditional mindset, then the low level of
300
SPMS adoption among SMEs will continue. However, changing such a mindset to one that
engages in sustainability engagement is not always an easy task. As Hasan (2016) claim,
sustainability benefits do not often match the primary concern of maximising profit. The
finding aligns with the principle of shareholder theory. In this school of thought, businesses do
not have any moral obligations or social responsibilities other than to maximise their profits
(Friedman, 1970; Hubbard, 2009; van Marrewijk, 2003).
SPMS adoption provides support for better decision-making
Theme: Motivations that drive SPMS adoption
Sub-theme: SPMS adoption provides support for better decision-making
One of the primary motivations established in the literature is that the adoption of a robust
SPMS would support better decision-making, resulting in a better understanding of a
company’s current situation and their desired end state (Searcy, 2012). Owner-managers of
SMEs often or at least partly rely more on their intuitive assessment (Csillag et al., 2019;
O’Regan, Sims and Ghobadian, 2005) than an efficient selection of more suitable options
regarding sustainability activities (Rodríguez-Gutiérrez et al., 2021). This is corroborated by
the qualitative findings, as illustrated by the following quote:
“To me, measuring sustainability performance could help businesses like us to avoid
the spontaneity, intuitiveness, and subjectivity in our current measurement method,
which seems no longer suitable for our development. We need appropriate
sustainability metrics to be used as a back-bond for us to sustain and develop.” (C08,
Owner-manager)

301
The above quote (C08) demonstrates that the adoption of SPMS can be seen as an effective
tool that supports better decision-making among owner-managers of SMEs and is therefore a
critical driver.
SPMS adoption provides resource efficiencies
Theme 1: Motivations that drive SPMS adoption
Sub-theme: SPMS adoption provides resource efficiencies
During the data analysis, obtaining resource efficiencies is frequently highlighted by the
majority of studied SMEs as one of the most significant drivers motivating them to adopt
SPMS. The following are the shared viewpoints of most interviewees.
“From a management perspective, I think that the results from measuring sustainability
are very helpful. Based on these, we can adjust the way we allocate resources so that
they are more suitable. On the other hand, if there is anything that is lacking, it should
be adjusted to be more appropriate.” (C01, Owner-manager)
“Sustainability performance measurement should be constantly considered. It is like a
mirror. When we look into it, it reflects what we really are. If we do not look good, we
can adjust it so that we are suitable for development.” (C02, Owner-manager)
The above quote implies that SPMS adoption can help companies better allocate their resources
(C01), track progress effectively, and engage in continuous development (C02), which is in
line the work of Gunasekaran and Kobu (2007), who highlight these factors as the primary
purpose of implementing a performance measurement system.
302
SPMS adoption enables cost reductions
Theme 1: Motivations that drive SPMS adoption
Sub-theme: SPMS adoption enables cost reductions
During the interview, “cost reduction” was frequently highlighted by most participants as a
critical motivation likely to drive their companies towards SPMS adoption.
“Because it relates to business cost reduction, every waste is a cost. Now I have just
begun measuring it, based on the sets of indicators that I had from the implementation
of ISO 14001 program.” (C15, Owner-manager)
“Personally, I think that to reduce production costs, we need to pay attention to
sustainability performance measurement. It helps to measure, for example, energy
consumption, energy-saving, water usage, etc. You [indicating the researcher] know
that if we don’t manage this well, the production costs will surely increase, which
means our product price is likely to go up; and you know, it would be hard to sell it.”
(C14, Owner-manager)
The above opinion (C15, C14) highlights several key aspects of environmental performance,
such as energy consumption, energy-saving, and water usage, that need to be measured and
properly managed to help the company reduce costs. This finding partially reinforces Nath and
Ramanathan's (2016) argument that the motivation for meeting environmental targets is
primarily driven by economics.
SPMS adoption enables customer responsiveness
Theme 1: Motivations that drive SPMS adoption
Sub-theme: SPMS adoption enables customer responsiveness
303
The literature review revealed that businesses are increasingly under pressure from
stakeholders to fulfil their responsibilities with regard to promoting sustainability activities in
order to increase trustworthiness, reinforce relationships with said stakeholders, and
demonstrate their commitment to enhancing environmental, social and economic performance.
This observation is supported by this qualitative study, as confirmed in the following quotes
by business customers:
“For example, if 5 or 10 firms are selling a similar type of product, the ones who show
a high value for sustainability, we are pretty sure that they stand out from the crowd as
out potential long-term suppliers.” (Business Customer 3)
“When we decide to cooperate with suppliers (SMEs), we come to audit whether they
meet our requirements regarding social and environmental issues. This is important and
compulsory as we resell to our foreign customers who have strict demands regarding
sustainability issues. Once a supplier meets the requirement, we want to establish a
long-term relationship with them.” (Business Customer 1)
The above opinions (Business Customers 1 and 3) demonstrate that pressure has been exerted
on Vietnamese SMEs to enhance their sustainability performance outcomes. This qualitative
finding can be explained by the work of Sommer (2017), who reported that most international
buyers demand that their suppliers, particularly SMEs from developing countries, comply with
sustainability standards and offer large, longer-term contracts. It has also been reported that the
reputation of SMEs, in terms of sustainability performance outcomes, has been considered by
large corporations as a strong criterion for selecting potential suppliers (Govindan et al., 2015).
Through such a strategic collaboration. SMEs are able to manage their reputational risks (Ahi
and Searcy, 2013a).
On the same topic, the literature review in Section 3.2.2.2 gave a strong indication that
coordination with relevant stakeholders is a critical starting point for the adoption of SPMS in
304
the SME setting (Garengo, Biazzo and Bititci, 2005; Harding, 2006; Jamali and Mirshak, 2007;
Cory Searcy, 2009). This can help SMEs properly align their objectives with large companies
– their relevant stakeholders – for whom SMEs often act as suppliers (Bos-brouwers, 2009;
Granly and Welo, 2014). This assumption is fully corroborated by this qualitative study, as the
following quotes illustrate:
“To be honest with you [indicating the researcher], sustainability performance outcome
is the key thing that we are confident in welcoming customers [international buyers] to
our company to audit.” (C15 – Owner-manager)
“Currently in Vietnam, not many domestic business customers consider sustainability
activities; but foreign customers, they always require partners like us to meet strict
requirements about environmental requirements prior to discussing signing a contract.”
(C08, Owner-manager)
“International customers come to our firms to audit; they carefully consider working
environments, whether workers are treated well and fairly or not because they are afraid
of reputational risks. If we don’t meet their requirements, they will not buy our products
even if we offer lower prices.” (C14, Owner-manager)
The above opinions (C15, C08, C14) demonstrate a strength of SMEs, often described in the
existing literature, that they acquire customer knowledge (Saad, Kumar and Bradford, 2017)
as a result of establishing close relationships with their clients (Perrini and Tencati, 2006),
which is essential as they are heavily dependent on customers for their survival (Fuller and
Lewis, 2002). In this respect, the qualitative findings provide empirical evidence that sheds
more light on normative isomorphic drivers, such as pressure from large international buyers,
as those in powerful positions with high expectations for sustainability expect SMEs to address
these issues (DiMaggio and Powell, 1983; Caldera, Desha and Dawes, 2019).
305
During the interviews, it was notable that almost half of the owner-managers expressed views
about customer-oriented sustainability. It seemed that they had not been fully pushed or simply
had no choice but to employ proactive behaviours to create win-win opportunities through the
adoption of SPMS. The following quotes illustrate this:
“We can use it as useful documents to support contract bidding, to share with existing
and potential customers our efforts.” (C08, Owner-manager)
“The sustainability measurement system could be a PR [public relations] tool for the
enterprise, the measurement of which leads to better improvement so the company will
get more respect from the customers, and the company image will be better. The
customers will also take part in the business when they feel more comfortable and
happier; they trust the company more.” (C14, Owner-manager)
“With positive sustainability performance outcomes, we are more confident in
introducing our products to foreign markets where firms’ sustainability efforts are
highly appreciated.” (C06, Owner-manager)
The opinion of one owner-manager (C08) demonstrates a ‘willing[ness] to share with existing
and potential customers’ their efforts towards sustainability performance through the adoption
of SPMS. This is in line with the literature in the sense that it helps SMEs create a basis for
rich communications with relevant stakeholders regarding their sustainability performance
(Melnyk, Stewart and Swink, 2004; Perrini and Tencati, 2006; Searcy, 2012). Accordingly,
this helps SMEs evaluate their measurement system, develop recommendations (Pádua and
Jabbour, 2015), and devise a strategy for SPMS adoption (Searcy, 2011). This qualitative
finding indicates that in order to mitigate a critical challenge in adopting SPMS (discussed in
Section 3.2.2.2), a practical approach is to proactively respond to the requirements,
expectations, and preferences of relevant stakeholders (Yu and Ramanathan, 2015) and open
up win-win opportunities (Dey et al., 2019; Shaw, Grant and Mangan, 2021; Yu, Ramanathan

306
and Nath, 2017). Therefore, customer responsiveness is a crucial enabler facilitating SMEs to
adopt SPMS.
Moreover, the qualitative finding confirms the potential benefits, mentioned in Section 3.2.1,
that can be derived from the adoption of SPMS, including support for entering new foreign
markets (C06), contract bidding (C08), partnership strengthening, potential customer
attraction, and enhancement of company image (C14). These are therefore reliable predictors
driving SMEs to adopt SPMS.
Overall, customer pressure is a subsection of pressure from a wide range of stakeholders, which
raises the question as to why this qualitative study did not investigate other forms of stakeholder
pressure on SPMS adoption in the Vietnamese SME setting. Hence, the qualitative findings are
in line with those found in the literature, where the principle of stakeholder theory highlights
the way in which firms integrate sustainability initiatives to fulfil their responsibilities
regarding the varied requirements, expectations, and preferences of stakeholders who might
have conflicting interests (Freeman, 1984; Ramanathan, Poomkaew and Nath, 2014; Yu and
Ramanathan, 2015; Mahmood et al., 2019; Malesios et al., 2020).
9.4.2 Theme 2: Internal factors that influence SPMS adoption
Internal factors refer to inhibitors and enablers within organisations that influence SPMS
adoption. In this section, the sub-themes of ‘organisational considerations’, ‘knowledge
management that enables the SPMS adoption’, and ‘organisational support’ are identified as
key factors influencing SPMS adoption.
Organisational Considerations
307
In this study, organisational considerations refer to crucial aspects that influence SPMS
adoption. During the data analysis, ‘resource constraints’ and ‘management capacity’ emerged
as crucial inhibitors hampering SPMS adoption, while ‘defining appropriate objectives for
SPMS adoption’ and ‘top management commitment, involvement, and support’ were vital
enablers.
Theme 2: Internal factors that influence SPMS adoption
Sub-theme: Organisational considerations o Resource constraints and SPMS adoption
o Defining appropriate objectives for SPMS adoption
o Management capacity and SPMS adoption
o Top management commitment, involvement, and support
Resource constraints and SPMS adoption
Throughout the analysis of the qualitative data, it became evident that almost every point made
by participants about SPMS adoption was qualified by commenting that it had to be weighed
against cost, as exemplified by C10:
“Implementing SPMS definitely imposes a cost burden on firms. It is problematic.
…we have to organise a team to run it. Current staff have to take on more tasks, and
the recruitment of new staff for these jobs would increase operating expenses
substantially… If it is not successful, it might negatively affect other activities as well.”
(C10, Owner-manager)
Similarly, the literature review indicated that initial investment and hidden costs are often
significant obstacles for SMEs (Ghadge et al., 2020; Hwang, Shan and Lye, 2018; Trianni,
Cagno and Farné, 2016). This factor is supported by this study, as the following quotes
illustrate:
308
“The costs can be beyond our thoughts and imagination.” (C01, Owner-manager)
“Investments for SPMS may be costly. If a firm does not have a stable financial and
human resource, they may not invest in it.” (C12 - General Director)
“The source of finance at start-up for this firm was through personal savings and family
support without any external resource of funding…. new business ideas do not feel safe;
we do not take them.” (C14, Owner-manager)
The qualitative analysis indicated that limited financial and human resources can prevent SMEs
from adopting SPMS. This barrier refers to the fact that the money comes directly from the
owner-manager. If the SPMS adoption is unsuccessful, it can create financial difficulties As
reported by Phan et al. (2015), owner-managers of Vietnamese SMEs often fear the accrual of
debt.
Apart from resource constraints, limited of time was frequently cited as a barrier. The following
quotes represent most of the viewpoints expressed.
“As the firm owner, I am very busy coping with daily business pressures. To be honest
with you [indicating the researcher], I do not have time to investigate things like
sustainability performance measurement. I am not sure I have time for it.” (C08,
Owner-manager)
“Doing so [SPMS adoption] means extra work for staff… everyone will see more work.
They are not willing to do it. Everyone currently works 8 hours or more daily, it's very
difficult, it takes a lot of time.” (C10, Owner-manager)
“The difficulty of SMEs is that one person must carry a lot of work… Employees may
be reluctant to take on additional work.” (C18, Owner-manager)
The above opinions of owner-managers (C10, C18) imply that a lack of employee engagement
is a barrier hindering the adoption of SPMS. However, it appears that this is not because

309
employees lack enthusiasm for SPMS adoption but that the working conditions, particularly
excessive workload and job pressure, might not allow them to do so (Johnson and Schaltegger,
2016; Sommer, 2017).
Overall, the above finding is in line with most of the literature on the development of
sustainability metrics/indicators for SMEs, which indicate that resource constraints in terms of
finance, humans, and time are significant inhibitors hindering companies from adopting SPMS
(Hsu, Chang and Luo, 2017; Neri et al., 2021; Singh, Olugu and Musa, 2016; Trianni et al.,
2019).
The above backdrop was anticipated as the literature review revealed that the development of
sustainability metrics means SMEs must consider their inherited resource constraints in terms
of finance, humans, time, sustainability knowledge, and skills (Arena and Azzone, 2012;
Johnson and Schaltegger, 2016; Mengistu and Panizzolo, 2021). The findings from the
qualitative study make it clear that the desirable general requirements of sustainability metrics,
established in Section 4.2, can facilitate SPMS adoption among SMEs. The following quotes
illustrate this aspect:
“Yes, it needs to be a managerial tool, it must be quantifiable, it can ‘talk’ to managers.”
(C01, Owner-manager)
“Not expensive and can be quickly implemented, easy to collect data.” (C10, Owner-
manager)
“It must be suitable for the company’s purposes and objectives…it must comply with
the current legal requirements.” (C05, Deputy General Director)
“Simple, practical and easy for everyone to understand and use.” (C06, Sale Manager)
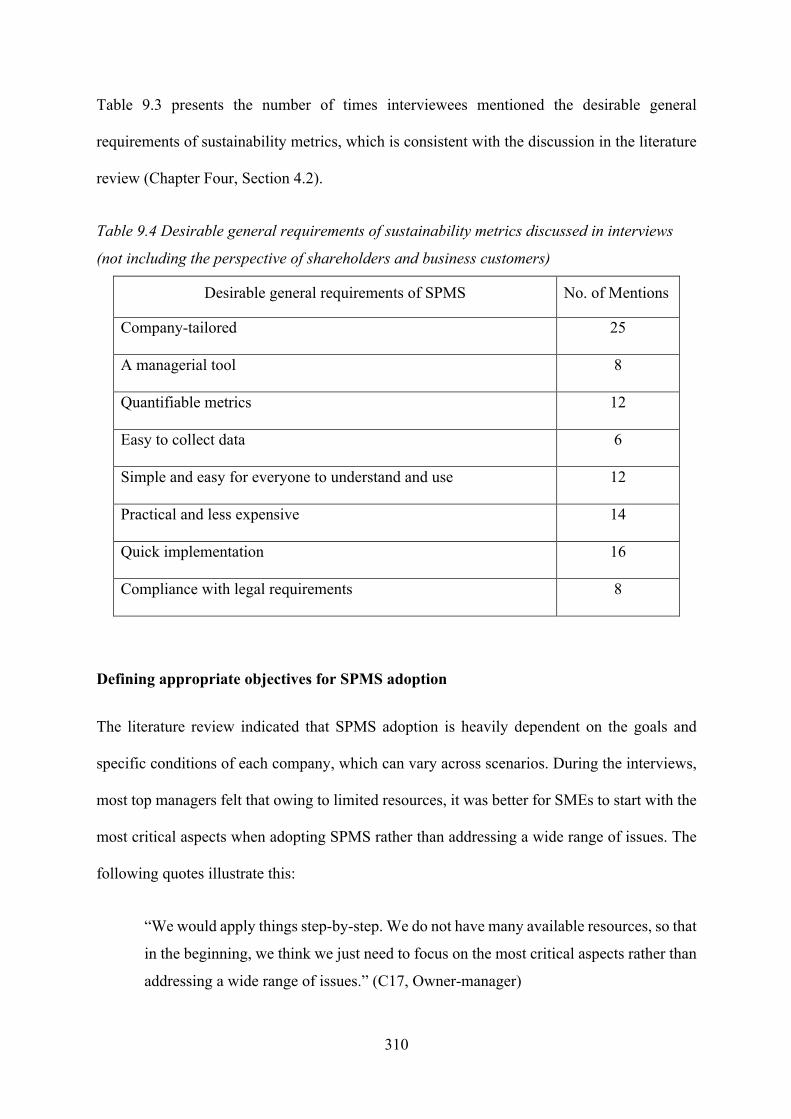
310
Table 9.3 presents the number of times interviewees mentioned the desirable general
requirements of sustainability metrics, which is consistent with the discussion in the literature
review (Chapter Four, Section 4.2).
Table 9.4 Desirable general requirements of sustainability metrics discussed in interviews
(not including the perspective of shareholders and business customers)
Desirable general requirements of SPMS No. of Mentions
Company-tailored 25
A managerial tool 8
Quantifiable metrics 12
Easy to collect data 6
Simple and easy for everyone to understand and use 12
Practical and less expensive 14
Quick implementation 16
Compliance with legal requirements 8
Defining appropriate objectives for SPMS adoption
The literature review indicated that SPMS adoption is heavily dependent on the goals and
specific conditions of each company, which can vary across scenarios. During the interviews,
most top managers felt that owing to limited resources, it was better for SMEs to start with the
most critical aspects when adopting SPMS rather than addressing a wide range of issues. The
following quotes illustrate this:
“We would apply things step-by-step. We do not have many available resources, so that
in the beginning, we think we just need to focus on the most critical aspects rather than
addressing a wide range of issues.” (C17, Owner-manager)
311
“In my opinion, I think it should start with the most crucial and important aspects to the
firms; if not, SMEs would likely ignore it. It clearly depends on the specific conditions
of each company.” (C15, Owner-manager)
Based on the list provided by the researcher prior to each interview, it seemed that many top
managers utilise the strengths of SMEs in terms of small firm-size, flexibility, and adaptability
(Bourlakis et al., 2014) to quickly and easily identify and define appropriate sustainability
metrics for their company. The following quotes illustrate this:
“I think economic metrics are vital for every firm, I already have these. As a service
firm, I just focus on two more social metrics relating to customer and employee
satisfaction. I don’t mean social contribution and community involvement is not
important, I have done it for many years. It is dependent on unusual situations or
occasions. I don’t think I need to measure it. For environment metrics, energy and water
consumption, I can easily check by the operational expenses every single month. That
is all, what do you [indicating the researcher] think?” (C18, Owner-manager)
“To me, one of the biggest advantages of SMEs in adopting sustainability performance
measurement is that they are very flexible due to their smaller size.” (C05, Deputy
General Director)
Notably, one owner-manager recognised the adoption of SPMS as beneficial in formulating
corporate strategy as it facilitates a comparison of sustainability performance outcomes over
the years, as expressed in the following quote:
“From my perspective, a set of sustainability metrics should enable a company to
compare their level of sustainability over the years, which is really useful in formulating
corporate strategy.” (C02, Owner-manager)
The above finding demonstrates that the successful adoption of SPMS among SMEs primarily
depends on defining appropriate metrics that are aligned with the strategic objectives of the
312
company. The results closely agree with existing studies on the need to adopt metrics that
SMEs can manage and use to capture their essential needs, rather than addressing a wide range
of issues (Arena and Azzone, 2012; Van Passel et al., 2007). It can therefore be suggested that
priority should be given to the most important objectives rather than tackling all of them at
once, or that goals can be sorted according to whether they are easier or harder to accomplish
(Sousa and Aspinwall, 2010). Whichever approach is employed, the selected sustainability
metrics must always be tailored to a company’s objectives (Bourne, Kennerley and Franco-
Santos, 2005) and suitable for integration into their business model (Aragón-Correa et al.,
2008; Shields, Welsh and Shelleman, 2018). It also requires SMEs to initially scan their
available resources and identify relevant capabilities crucial for the adoption of SPMS.
As highlighted in the existing literature, SMEs often lack a formalised business strategy
(Augusto et al., 2019) due to difficulties in developing an effective mission, vision, and values
(Ates et al., 2013). The adoption of SPMS, therefore, is a potential opportunity for SMEs to
formalise their company strategy (Garengo, Biazzo and Bititci, 2005; Russo and Perrini, 2010).
Management capacity and SPMS adoption
As discussed in the literature review (Section 3.3.2), the adoption of SPMS involves an
organisational change through which new behaviours, habits, attitudes, and values emerge and
develop within organisational structure and processes (Goddard et al., 2016). During the
interviews, most owner-managers expressed concerns that employees might not be open-
minded to a new business idea such as SPMS adoption. The following quotes illustrate this:
“Employees who are experienced, especially the mature ones, are often resistant to
change.” (C10, Owner-manager)
313
“Some of our experienced and mature engineers, who are always of the mindset that:
‘If I'm satisfied, I do. If I cannot work for you, I'll go to another tomorrow.’ Honestly,
they do not want to contribute.” (C01, Owner-manager)
The above opinions (C10, C01) demonstrate that employee resistance to change is an inhibitor
hindering SPMS adoption. The close agreement of the above qualitative finding with the
literature (Furst and Cable, 2008; Nguyen, 2019) indicates that mature workers and
experienced employees often demonstrate strong resistance to change.
Prior studies have found that the primary cause of resistance to change for sustainability
engagement is because employees lack a comprehensive understanding of why they must do
this (Wiesner, Chadee and Best, 2018), and a limited awareness and absence of perceived
benefits regarding the integration of a sustainability initiative (Johnson and Schaltegger, 2016).
These findings are corroborated by this study, as exemplified by one owner-manager:
“People, I mean both staff and middle managers, may lack awareness and do not know
about the benefits of sustainability performance measurement, so they can be reluctant
to accept this idea. This is a challenge.” (C02, Owner-manager)
Reviewing the above qualitative findings, one significant observation is that lower-level staff
and middle managers are confirmed as demonstrating resistance to change for SPMS adoption
(C02). It is important to note that the operational conditions of lower-level staff can be
influenced by the decisions of middle managers (Nonaka, 1994), whose attitudes and
behaviours tend to reflect those of top managers (Engert, Rauter and Baumgartner, 2016). In
this light, the findings warn owner-managers of the crucial role played by middle managers in
SPMS adoption. In SMEs, middle managers play a critical intermediary role between the ‘top’
and ‘bottom’ of the organisation, interpreting and communicating data, information, and
knowledge emanating from different organisational actors (Camuffo and Comacchio, 2005).
314
Although they might not have the skills to implement change (Smith, 2018), they sometimes
play the role of "change-agent" to support the self-revolution of the organisation (Nonaka,
1994).
During the interviews, some owner-managers expressed concerns about their limited
communication and skills, which they believed made it difficult for them to motivate
employees to adopt SPMS. The following quote illustrates this:
“Frankly, my weakness is communication skills; I am afraid that I am not able to highly
motivate employees to engage with a new idea such as sustainability performance
measurement.” (C10, Owner-manager)
Moreover, four owner-managers (C3, C13, C14, C20) felt that their low level of education
(high school diploma) and lack of necessary managerial skills were limitations demotivating
them from adopting SPMS in their organisation. All four owner-managers confessed that
before running their own firms, they used to be blue-collar workers. The following quote
illustrates this:
“I firstly started as a blue-collar worker for a couple of years, and then opened my own
business. I do not have the necessary managerial skills. This is really my limitation. To
be honest with you [indicating the researcher]; my educational background is just a high
school diploma.” (C3 – Owner-manager)
The findings agree well with existing studies, indicating that a lack of the necessary managerial
skills among SMEs’ owner-managers is a barrier hindering the implementation of
sustainability initiatives (Hoang Tien, 2019; Rachidi and El Mohajir, 2021; Shi et al., 2008);
and preventing the integration of performance measurement (Sardi et al., 2020). The findings
are also consistent with the recent work of Nguyen and Pham (2020), who found that low-
quality entrepreneurship education is one of the weak characteristics of Vietnamese
315
entrepreneurs. They are also in line with the work of van Song et al. (2020), who provided
empirical evidence for insufficient problem-solving, leadership, and communication skills
among Vietnamese SMEs. In view of these findings, this study confirms that a lack of
necessary managerial skills is a significant inhibitor. Another intriguing finding is that the low
level of education of owner-managers is another inhibitor impeding SPMS adoption.
Therefore, to effectively adopt SPMS, top managers of Vietnamese SMEs need to develop the
capacity to manage and acquire the necessary managerial and leadership skills.
Top management commitment, involvement, and support
As found in previous studies, top management support regarding sustainability engagement is
often signalled by their active involvement (Lee, 2009; Tran, Deng and Ong, 2018),
encouragement, and supervision (Dora, Kumar and Gellynck, 2016). These findings are
supported by this qualitative study as most top managers recognised their key role in the
adoption of SPMS. The following quotes illustrate this aspect:
“Surely, top managers need to be involved, and to instruct and supervise; if not, staff
don’t understand how to do things and what not to do. We need to encourage them and
provide support. The role of top managers is very important. That is my opinion.” (C06,
Owner-manager)
“The senior manager of the enterprise needs to evolve and do well first, and then the
sustainability metrics can be identified. Sustainability performance measurement
primarily depends on the vision of the top manager.” (C02, Owner-manager)
The above finding (C06, C02) is in line with the work of Parisi (2013), who found that top
management support is a significant enabler facilitating SPMS adoption. Similarly, employees
shared the same view regarding the vital role of top managers in leading the adoption of SPMS.
The following quotes illustrate this aspect:

316
“The role of the director is very important, we follow him. If he does well, so do we. If
he does not instruct us throughout the process of implementing the measurement, the
project could fail.” (C06, Accountant 2)
“It depends on the owner whether they see it (sustainability performance measurement)
as worth implementing in the organisation, and then staff like me have to follow.” (C06,
Accounting Manager)
A strong factor established in the literature is that the effective implementation of a
sustainability initiative can be achieved with strong employee involvement and support (Parisi,
2013; Ghadge, Kaklamanou and Bourlakis, 2017; Siegel et al., 2019). As discussed in Section
3.2.2.3, this requires top managers to promote employee empowerment relating to SPMS. This
argument is corroborated by this qualitative study, as illustrated in the following quotes:
“I am the owner of the firm, so sustainability performance measurement is necessary,
therefore I ask our staff to implement and operate it, no problem.” (C01, Owner-
manager)
“It is really good if we have standard sustainability metrics for better management. We
will assign staff to do this task.” (C07, Owner-manager)
The above perceptions (C01, C07) demonstrate that employee empowerment is an enabler
facilitating SPMS adoption. Several landmark studies observed that providing employee
empowerment is as an effective tool for intrinsically motivating people (Busse et al., 2016). It
prevents initial cost estimates from being exceeded when implementing performance
measurement (Sousa and Aspinwall, 2010) and is positively associated with social,
environmental, and economic performance (Yusoff et al., 2016).
As the findings highlight, the role of top managers is to promote such positive associations and
influence the behaviours of subordinates. This point is crucial for Vietnamese top managers,

317
whose leadership and management styles typically follow a top-down hierarchical approach
(Wrana, Xuan and Nguyen, 2019). These styles are normally viewed as those of an autocratic
leadership, which often prevents top managers from applying their emotional intelligence
(Govender and Bussin, 2020). Therefore, they hamper the adoption of SPMS.
Overall, the analysis suggests that from the very outset, top managers need to be well prepared
to be committed and involved; and to have an appropriate attitude (Burke and Gaughran,
2007b; Dora, Kumar and Gellynck, 2016), express openness, and engage in proactive
behaviour (Nguyen and Tran, 2020). The finding also implies that top managers should convey
a shared vision to all firm members (Dzhengiz and Niesten, 2020; Saratun, 2016; Xin et al.,
2020). This is vital in terms of encouraging staff at all levels to take on responsibilities (Nguyen
and Tran, 2020). It also provides an impetus to foster and cultivate a growth mindset as well as
gradually redirect and change a fixed mindset among all management levels and employees,
which is a significant enabler facilitating SPMS adoption.
Knowledge management that enables SPMS adoption
In this study, knowledge management refers to the firms’ ability to acquire external knowledge
and integrate it with existing internal knowledge (Cohen and Levinthal, 1990; Csillag et al.,
2019; He et al., 2019). During the data analysis, ‘internal knowledge acquisition and
assimilation’, ‘external knowledge acquisition and assimilation’, ‘training and education’
emerged as enablers facilitating SPMS adoption.

318
Theme 2: Internal factors that influence SPMS adoption
o Sub-theme: Knowledge management that enables SPMS adoption
o Internal knowledge acquisition and assimilation
o External knowledge acquisition and assimilation
o Provision of training and education
Internal knowledge acquisition and assimilation
One of the primary concerns established in the literature is that the adoption of SPMS might
engender various complexities for a SME. Thus, a certain amount of prior knowledge is
required for success (Ahi and Searcy, 2013b; Høgevold et al., 2015). During the interviews.
seven companies (C01, C02, C06, C08, C09, C10, C15) demonstrated their engagement in
acquiring and assimilating internal knowledge by hiring qualified and experienced internal staff
or gaining assistance from the expertise of employees. This encourages the adoption of new
sustainability initiatives such as CSR or ISO 14001, as reflected in the following quotes:
“Fortunately, we recruited a professional manager, who is qualified and experienced
with ISO 14001 standards on the environment; he successfully trained our current
employees to be more professional and skilful.” (C15, Owner-manager)
“I hired a deputy director; he has knowledge and good experience in the area of
corporate social responsibility; and another deputy director is my son, he used to study
and graduated in business management from an American university. Both are running
what you [indicating the researcher] just mentioned about, sustainability.” (C01,
Owner-manager)
The above finding (C01) is echoed by Johnson (2017), who suggests that SMEs can acquire
sustainability knowledge with assistance from employees who have the requisite educational
qualifications and expertise. The findings in the case of Company C15 are supported by those
319
of Kumar and Antony (2008), who highlighted the creativity of SMEs in that the primary
source of knowledge sharing and transfer in Six Sigma and ISO certified firms was through in-
house training of employees, rather than seeking the external help of consultants at a much
higher cost. Such an approach can uniquely suit SMEs striving to integrate sustainability
initiatives, primarily due to their small size and flexibility (Bourlakis et al., 2014; Caldera,
Desha and Dawes, 2019; Koirala, 2019).
However, the process of internal knowledge acquisition and assimilation is not always fruitful
or valuable. One owner-manager confessed that it was extremely challenging and time-
consuming due to the need to use existing human resources, clearly stating:
The difficulty is that I use existing human resources and it really takes time to train.
You [indicating the researcher] know that it took us about a year for our employees to
begin to comprehend the process to effectively run ISO 14001.” (C15, Owner-manager)
Another owner-manager described her negative experiences when a key employee, with an
abundance of formal training and skills for IS0 14001, left the firm for a better career in a larger
corporation with a higher salary. She explained this as follows:
“To apply the ISO 14001, we sent a staff member for formal training courses to be in
charge of this programme. Right after successfully completing these courses, we
promoted him to a managerial position. However, just a couple of months later, he left
us to work for another firm with better benefits. I was quite upset. This issue is really a
dilemma for us.” (C10, Owner-manager)
As indicated in the literature, prior knowledge and experience are often harnessed and stored
in the minds of the owner-manager and/or key staff members (Jiang, Ritchie and Verreynne,
2021; Saad, Kumar and Bradford, 2017). In the case of Company C10, the key staff member
left the firm just a couple of months after he received the formal training and skills for IS0
320
14001. The consequences of this should not only be viewed as a cost the company incurs but
also as a loss of tacit knowledge, which subsequently leads to a decrease in organisational
learning (Cardoni et al., 2018). In this regard, the findings agree well with existing studies
which found that SMEs usually face difficulties in retaining qualified staff (Perez-Sanchez,
Barton and Bower, 2003; Pedersen, 2009; Othman and Mahmood, 2019).
External knowledge acquisition and assimilation
During the interviews, several owner-managers and senior managers of the studied SMEs
talked about how they consciously acquired and collected sustainability-related knowledge
from the external environment, and then informally assimilated this into their organisation. The
following quotes highlight this aspect:
“Normally, knowledge in our industry I learn from suppliers. A few months ago, I came
to the U.S for a short course relating to sustainability issues in my industry. The course
was offered by one of our key suppliers.” (C08, Owner-manager)
“I work with international customers; I have learned a lot from them and applied this to
my company from the very beginning.” (C15, Owner-manager)
“I knew about the CSR concept from my friends, they shared this kind of knowledge
with me; then I searched the internet, and I attempted to apply some ideas to my
company a few years ago.” (C06, Owner-manager)
“I visited companies in Japan and I am really impressed. I would like to build my
company like them. After that, I investigated Kaizen and 5S, and then applied this to
my company.” (C10, Owner-manager)
The above opinions demonstrate that sustainability-related knowledge regularly flows in
different forms and from different sources, including short courses offered by their suppliers
(C08), information-sharing with international buyers (C15), informal networks and the internet
321
(C06), and visiting and learning from firms in other countries (C10). The qualitative findings
agree with Liao et al. (2003) in that individuals exhibiting proactive behaviour can effectively
acquire external knowledge and transfer this to their own experiences.
As reported in Csillag et al. (2019), top managers – the developers of organisational learning
and learning opportunities – play key roles in motivating employee to engage in the process.
This finding is supported by the current study, as exemplified by the following employee:
“Surely, the board of directors should do more research about the subject and explain
it to the employees. They are decision-makers while the employees are not in the right
position to investigate and learn about the subject.” (C06, Sale Leader Team 2)
These findings are in line with those in the literature, where SMEs were found to acquire
external knowledge through relationships with their partners (Saad, Kumar and Bradford,
2017), informal networks (Spence and Schimdpeter, 2003), and the internet (García-Sánchez,
García-Morales and Martín-Rojas, 2018). Moreover, these findings also agree with the results
reported by Csillag et al. (2019), who found that owners of SMEs are the persons generally
responsible for bringing in knowledge from the external environment into the firms. These
findings are also in line with those of Volberda, Foss and Lyles (2010) who found that prior
knowledge of absorptive capacity is accumulated, updated, and developed through effective
relations with an external network. In this study, one important mechanism for encouraging
mimetic isomorphism was learning about the practices of successful organisations who have
demonstrated leadership in sustainability initiatives, which also accords with the literature
(Abdalla and Siti-Nabiha, 2015; DiMaggio and Powell, 1983; Ditlev-Simonsen and Midttun,
2011). Overall, top management can use learning orientation to organise knowledge based
upon what and how their organisations learn about SPMS adoption, which subsequently
322
increases knowledge sharing and the trust culture among employees (Dibella, Nevis and Gould,
1996; Spicer, 2004).
Provision of training and education
During the interviews, most top managers of the studied SMEs reported that they have annually
provided their employees with several workshop and training programmes to improve their
skills, but these are not usually related to the topic of sustainability development. While most
respondents expressed an insightful perception and understanding of the purpose and benefits
of SPMS adoption, they confessed that they faced several challenges in translating such
perceptions into practical action for themselves and their companies. The reasons for this
seemed to be because SPMS adoption is a new project for the company, for which they
probably have limited sustainability knowledge, expertise, and skills (Johnson and Schaltegger,
2016; Caldera, Desha and Dawes, 2019), and a lack of know-how (Gandhi, Thanki and
Thakkar, 2018). The qualitative findings clearly indicated that these are inhibitors hindering
SPMS adoption, as illustrated in the following quotes:
“I don’t have the knowledge and expertise or skills to do it. I have no ideas as to how
to measure sustainability performance.” (C20, Owner-manager)
“As for sustainability activities, I can only do what I think could help sustain my firm.
I am not sure about this. Actually, I do not have formal sustainability knowledge.” (C10,
Owner-manager)
“Honestly, we have no idea how to do that. If necessary, we may seek support from the
outside, such as external organisations.” (C02, Owner-manager)
The above opinion of the owner-manager of Company C02 demonstrates that SMEs can be
flexible in managing their trade-offs, for example in relation to time or a certain cost, to seek
external support. Therefore, making appropriate use of external support in terms of
323
sustainability knowledge and skills relating to SPMS adoption is an enabler. Its success,
however, depends on how proactive they are in effectively acquiring external knowledge and
transferring this to their own experiences (Liao et al., 2003).
During the interviews, provision of training and education relating to SPMS adoption
frequently emerged as a significant enabler. The following quotes illustrate this aspect:
“Training is really a good opportunity to increase awareness about the objectives, the
benefits of the measurement of sustainability performance. Personally, I think that the
simpler, the better. You [indicating the researcher] know that people have other jobs to
be in charge of, not just this.” (C09, General Director)
“Before that, training and education should be provided to increase the benefits of the
operations later on; it must be simple and easy to understand and people must know
how to do it and evolve, step-by-step.” (C06, Human Resource Staff)
The above qualitative findings closely agree (C09, C06) with Saad, Kumar and Bradford (2017)
in the sense that new knowledge imparted within the setting of the SME needs to be practical
and useful, rather than delivered in a conceptual form. The findings also make it clear that
provision of training and education is crucial to enable SPMS adoption, which is also in line
with literature that reports such training is likely to improve employees’ abilities to recognise
and acquire new knowledge (Caloghirou, Kastelli and Tsakanikas, 2004; Cohen and Levinthal,
1990; Johnson, 2017; Kwahk, Yang and Ahn, 2020; Muathe and Muithya, 2020; Tilleman,
2012). It is important to recognise that the provision of training and education is also a valuable
opportunity for employees to share ideas, raise concerns, and make suggestions (Langwell and
Heaton, 2016), which subsequently supports top managers in initiating more focused and
effective actions towards SPMS adoption.
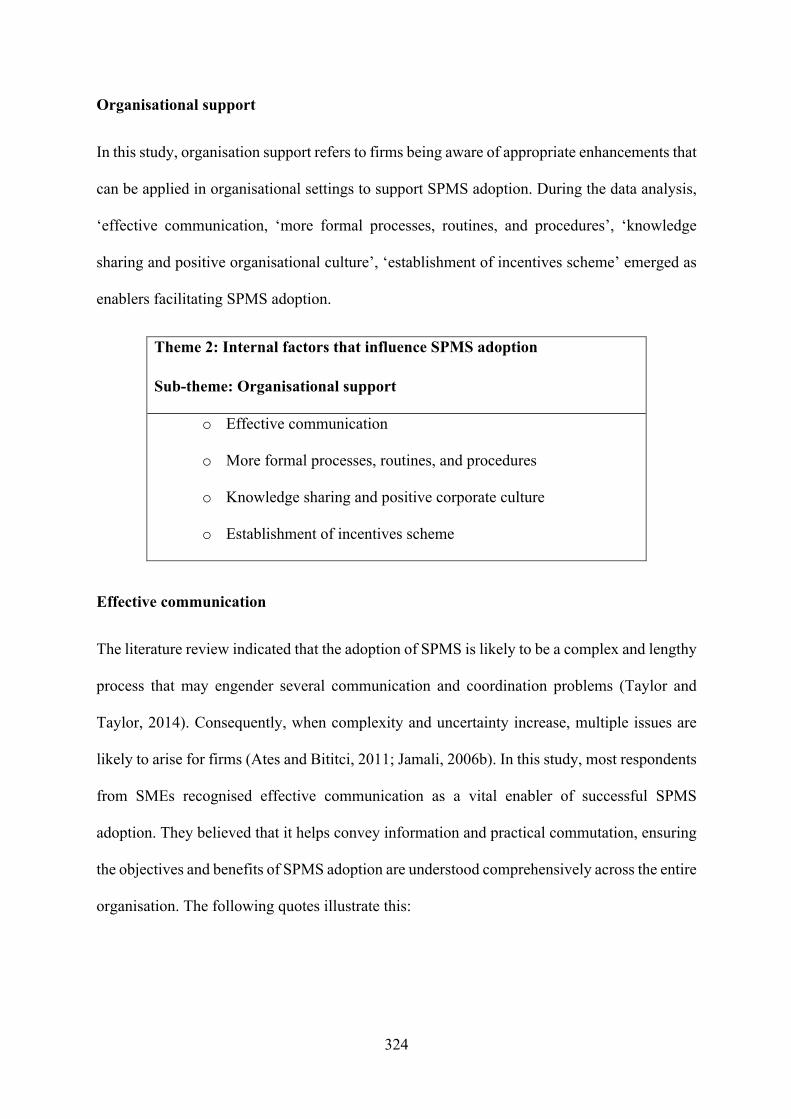
324
Organisational support
In this study, organisation support refers to firms being aware of appropriate enhancements that
can be applied in organisational settings to support SPMS adoption. During the data analysis,
‘effective communication, ‘more formal processes, routines, and procedures’, ‘knowledge
sharing and positive organisational culture’, ‘establishment of incentives scheme’ emerged as
enablers facilitating SPMS adoption.
Theme 2: Internal factors that influence SPMS adoption
o Sub-theme: Organisational support
o Effective communication
o More formal processes, routines, and procedures
o Knowledge sharing and positive corporate culture
o Establishment of incentives scheme
Effective communication
The literature review indicated that the adoption of SPMS is likely to be a complex and lengthy
process that may engender several communication and coordination problems (Taylor and
Taylor, 2014). Consequently, when complexity and uncertainty increase, multiple issues are
likely to arise for firms (Ates and Bititci, 2011; Jamali, 2006b). In this study, most respondents
from SMEs recognised effective communication as a vital enabler of successful SPMS
adoption. They believed that it helps convey information and practical commutation, ensuring
the objectives and benefits of SPMS adoption are understood comprehensively across the entire
organisation. The following quotes illustrate this:

325
“I think that effective communication forms the foundation of SPMS adoption. It is
useful to explain the objectives and help employees make sense of the entire process of
measurement.” (C02, Owner-manager)
“Obviously, effective communication is vital. It helps to improve the flow of effective
communication in the workplace; it could be in written or oral form. Through it, people
in the company not only understand the objectives and benefits of measuring
sustainability performance but also know how to contribute to achieving that goal.”
(C06, Marketing Manager)
These findings are in line with Perez-Valls, Cespedes-Lorente, and Moreno-Garcia (2016) who
asserted that enhanced coordination and shared objective setting are crucial when integrating
green practices, as are mechanisms that ensure the internal flow of information. The research
findings are also in close agreement with the recent work of Dzhengiz and Niesten (2020), who
argued that effective and timely top-down information flows improve the implementation of
environmental practices. In view of the findings, it is primarily the top managers’ responsibility
to communicate the ideas, objectives, benefits, and procedures of SPMS adoption so that
employees perceive them as motivating, thereby enhancing the effort and support of the entire
organisation.
At the same time, effective communication is potentially useful in preventing coordination
problems that might arise during the process of developing SPMS due to weak characteristics
such as informal structures and loose control systems (Fassin, 2008). The use of written or oral
forms of communication can improve vertical and horizontal communication flows, which may
help firms foster the transit of information to the places where it is needed. These forms of
communication facilitate knowledge sharing (Cesário and Chambel, 2017; Wang and Noe,
2009) which in turn facilitates SPMS adoption. Finally, the close agreement of the results with
the literature suggests that effective information systems serve as a catalyst for facilitating

326
absorptive capacity (Peng, 2021) and organisational learning (Sroufe, 2017). This frequently
encourages individuals to share their knowledge and information with others in the
organisation (Bari, Ghaffar and Ahmad, 2020). Therefore, effective communication is a
significant enabler facilitating SPMS adoption.
More formal processes, routines, and procedures
The literature also indicates that the adoption of SPMS is likely to trigger organisational change
in terms of structure, processes, procedures, routines, and rules (Goddard et al., 2016). Notably,
several respondents from the studied SMEs were aware of this. The reasons for this largely
seemed to be that they thought it would be difficult for their firms to adopt SPMS due to weak
characteristics such as simple organisational structures, a lack of documented procedures
(Cordano, Marshall and Silverman, 2010), and informal rules (Cassells and Lewis, 2011).
Hence, developing more formal routines and processes are crucial enablers. The following
quotes illustrate this:
“Small firms normally have quite simple processes and routines and a lack of formality;
I think these need to be upgraded if we want to apply the measurement effectively.”
(C11, Owner-manager)
“Surely, there must be a clear and detailed process so people know what to do, and it
makes it easier to check.” (C15, Owner-manager)
On this issue, one staff member seemed to imply that a more formal procedure can facilitate
the adoption of SPMS, stating:
“We (staff) need to understand what exactly sustainability performance measurement
is, and how to use it to produce accurate results.” (C06, Sale Manager)

327
From a different angle, another staff member expressed her concern as to whether workloads
are reasonably assigned to each staff member to minimise potential resistance and conflict.
This raises a managerial issue as SMEs typically have a less formal approach to sustainability
initiatives (Darcy et al., 2014; Jenkins, 2006; Russo and Tencati, 2009), which might render
the adoption of SPMS less feasible. This means that a more formal approach is an important
enabler. In particular, proper accountabilities and responsibilities for measures applied to
individuals and teams should be put in place, with their roles and goals clearly communicated
(Darcy et al., 2014; Lee, Rocco and Shuck, 2020; Weideman, 2018). This point is entirely
supported by this study, as exemplified by one staff member:
“Implementing sustainability performance measurement means more jobs for staff.
Thus, it is important to make sure that the workload is divided fairly and clearly to
reduce resistance and conflict among staff.” (C06, Human Resource Staff)
Overall, the findings exhibit a range of values comparable with the literature, highlighting
several key weaknesses of SMEs’ unique characteristics in terms of their organisational system.
This suggests a need to develop more formal processes, procedures, and routines that can be
straightforwardly communicated to all employees throughout the organisation (Tarí and
Molina‐Azorín, 2010). It is important to note that the developmental process or adoption of
SPMS is likely to be a complicated task, which probably requires an SME to devote
considerable effort with respect to finance, human resources, knowledge, expertise, and time
(Singh, Olugu and Musa, 2016; Caldera, Desha and Dawes, 2019; Trianni et al., 2019; Cardoni
et al., 2020).
As suggested by Saad, Kumar and Bradford (2017), developing more formal systems,
procedures, rules, and routines can help SMEs mitigate their weaknesses and foster the
motivation and interest needed to collaborate within the organisation. For this purpose, the
328
benefits will initially be specific to the creation of a roadmap to support the process of SPMS
adoption (Darcy et al., 2014). The level of detail, however, depends on each organisational
context and resource, which differs from one company to another. This is an effective way to
maintain employees’ trust and motivation and promote self-performance management (Sardi
et al., 2020) while simultaneously helping to minimise potential resistance and conflict among
employees. In doing so, Vietnamese SMEs can be well prepared for organisational change
through proactive, formal planning approaches and strategic controls (Ates and Bititci, 2011;
Shahedul Quader, Kamal and Hassan, 2016). These, among other factors, facilitate the
successful adoption of SPMS.
Knowledge sharing and organisational culture
Several respondents in the studied SMEs recognised the unique characteristics of their
companies as strengths in supporting SPMS adoption. The following quotes illustrate this.
“Clearly, SMEs have some advantages compared to large corporations due to having a
flat organisational structure with a small number of employees, so that information is
shared very quickly.” (C05, Deputy General Director)
“I think that the small size of SMEs is one of the advantages when implementing
sustainability performance measurement. Due to its small size, people tend to work
closely and cooperate effectively. People can share and exchange ideas much more
easily compared with a large corporation with a thousand employees.” (C18, Owner-
manager)
“In a small firm, people and each department work very closely together in an informal
climate. People know each other very well… everybody knows every event that
happens in the organisation…. The exchange of information, ideas between each other,
between each department is very quick and easy.” (C06, Marketing Manager)
329
The above opinions (C05, C18, C06) demonstrate that SMEs are in a better position than large
corporations in terms of allowing the quick and easy exchange of information and ideas across
the organisation as a result of their small size, flat organisational structure (C05), and informal
climate (C06). These are therefore strengths of SMEs that facilitate knowledge sharing which,
in turn, facilitates SPMS adoption.
Nevertheless, a sentiment expressed in one interview by a senior manager concerned an
uncomfortable experience relating to internal trading that took place in his company, as a result
of which he seemed to be unwilling to adopt SPMS as it would require employee involvement.
According to the literature, this effect could be explained by SME owner-managers being quite
sensitive about business information and often unwilling to share this with employees (Beaver,
2007). Hence, this is a barrier to SPMS adoption. The following quote elucidates this view:
“To be honest with you [indicating the researcher], doing business in Vietnam, there
are aspects that we should not let employees know. It is not good to let them know
everything. We experienced one case where a staff member, who managed our
customer relationship, referred our customers to our competitors. This staff member
cooperated with our competitors for his interests.” (C13 - Deputy Director)
During the interview, some owner-managers (C02, C06, C11) specifically emphasised the
immense importance of organisational culture in supporting SPMS adoption, as illustrated in
the following quotes:
“Basically, if we all think about the organisational goals, we will overcome our ego. It
is the organisational culture, we can create an environment where team spirit is central,
encouraging collaboration in the workplace. Surely, collaboration is the very essence
of culture. People can support each other, which is useful for measuring sustainability
performance and other activities as well.” (C02, Owner-manager)
330
“In our firm, I always build an open relationship with employees through honest
communication, as believe this is the best way to gain their trust in the management
board”. (C11, Owner-manager)
The above opinion of the owner-manager (C02) demonstrates that a corporate culture centrally
built on team spirit, which could encourage collaboration in the organisation, is a significant
enabler facilitating not only SPMS adoption but also the attainment of other organisational
activities and goals. Furthermore, the other owner-manager (C11) views an open relationship
with employees through honest communication as an essential aspect of the corporate culture.
Notwithstanding this, from the perspective of a top manager, the owner-manager of the
Company C11 further expressed her feeling that:
“As you [indicating the researcher] may know, the Vietnamese, they will not share what
exactly they think or feel as they are scared that firms’ owners/managers or colleagues
might not be happy. It is a feeling that ‘a bad compromise is better than a good
lawsuit’.” (C11, Owner-manager)
On the same issue, one employee clearly expressed her view that:
“I think in Vietnamese firms, top managers might not feel comfortable when they hear
negative but true comments and constructive ideas from their employees. This is the
culture, I think you [indicating the researcher] know that. For me, I am reluctant to
express my viewpoint.” (C06, Customer Service Staff)
As noted by Ngah and Jusoff (2009), the strength of SMEs lies in motivation and tacit
knowledge of unique skills. However, the above opinions (C11, C06) suggest that employees
are unwilling to share their thinking and ideas, which is a crucial barrier. Moreover, it is
worth emphasising that in Vietnam, leadership and management styles typically follow a top-
down hierarchical approach (Wrana, Xuan and Nguyen, 2019) in which operational personnel
must gain permission from top management (Busse et al., 2016). Taken together, a direct

331
consequence of this practice is that it has a negative influence on knowledge sharing which will
transform it into a barrier, thus indicating that knowledge sharing is a driver of SMS adoption.
Overall, the findings are in line with those in the literature indicating that a flat organisational
structure and an informal climate are strengths of SMEs in terms of supporting the knowledge
sharing process as they provide quicker lines of communication (Conway, 2014) and faster
decision-making processes regarding the implementation of new initiatives (Yusof and
Aspinwall, 2000). Further, the study highlights that such strengths allow SMEs to build better
communication and strong personal relationships in the organisation, which is an antecedent
of knowledge sharing.
The results exhibit a range of values comparable with the literature in that a positive corporate
culture is dependent on relationships built on trust and mutual understanding, which results in
a long-term collaboration (Chee Tahir and Darton, 2010; Kucharčíková, Mičiak and Hitka,
2018; Kucharska and Kowalczyk, 2016). In this light, this study reinforces the suggestion of
Wang and Noe (2009) that a positive culture alone may be insufficient to facilitate the open
communication needed to promote an organisational culture that supports knowledge sharing.
Moreover, the findings are echoed more recently in work by Ketprapakorn and Kantabutra
(2019) who found that the development of a culture focusing on collaboration among
employees is crucial for SMEs to engage with sustainability. This study demonstrates that a
team spirit incorporating organisational goals inspired by the motivational behaviours of
leaders is an essential enabler. Adopting SPMS involves an organisational change which
requires asking managers and employees to adopt new behaviours, habits, attitudes, and values
(Goddard et al., 2016) relating to knowledge sharing (Wang and Noe, 2009). It also requires
managers to encourage employees to express ideas, try new methods (Ghasemzadeh et al.,
2019), and share their knowledge and information with others (Bari, Ghaffar and Ahmad,

332
2020). Management support for knowledge sharing can, for instance, be demonstrated by
emphasising the importance of sharing “lessons learned” instead of “mistakes made” (Teo,
2005). Therefore, it is the top manager who plays a key role in developing a trust culture among
employees to avoid the exhibition of knowledge-hiding behaviours and increase knowledge
sharing which, in turn, facilitates SPMS adoption.
Establishment of incentives scheme
The literature review indicated that the knowledge sharing process and the success of SPMS
adoption are affected by organisational incentives and reward systems that drive employees’
behaviour (Truong and Barraket, 2018; Zhu et al., 2008; Zorpas, 2010). This suggestion is fully
corroborated by this study, as exemplified by one owner-manager:
“I have no doubt that rewards and recognitions are necessary to motivate and encourage
people to achieve that performance goal.” (C15, Owner-manager)
Similarly, another owner-manager implied that rewards and tolerance rather than blame are
more suitable for the initial stage of SPMS adoption, as he notably commented:
“For the beginning, I think ‘carrot’ is better than ‘stick’.” (C08, Owner-manager)
The above finding (C15, C08) is in line with literature emphasising that the tolerance of
ambiguity, uncertainty, and errors facilitates organisational learning (Aboelmaged and
Hashem, 2019a; Curado, Muñoz-Pascual and Galende, 2018) which, in turn, facilitates SPMS
adoption.
On the same topic, most staff confessed that rewards and recognition would motivate them to
support SPMS adoption whereas few owner-managers mentioned these issues. It is pertinent
to note that offering rewards incurs costs, increasing the barrier of the cost of SMEs’ initial

333
investment in SPMS adoption (Meager et al., 2020). Nevertheless, when the researcher asked
participants why SPMS adoption is highly regarded, one staff member responded that:
“Over the long run, the company will save costs, generate more revenue and profit. So
our salary is higher. This is better for everyone, don’t you [the researcher] think?” (C06
- Human Resource Staff)
On the same issue, another staff commented on the notion of rewards:
“Once the target of sustainability measurement is met, there should be rewards and
recognition in both tangible and intangible ways, so we feel more motivated.” (C06
Accountant 3)
Moreover, one owner-manager expressed that he is in favour of setting rewards based on
performance. He seemingly utilised the flexibility and adaptability of SMEs, which are unique
strengths (Burke and Gaughran, 2007b), in proposing an incentives scheme that can be
applicable for SPMS adoption, as illustrated in the following quote:
“We have this policy for achieving a sales target. I apply this to the measurement of
sustainability performance.” (C07, Owner-manager)
These findings are in accordance with Tuan (2016), who suggested that incentives or rewards
should be offered in parallel to employee performance as this will encourage staff to transform
their efforts into high performance. Several forms of rewards can be applied, including
recognition and promotion programmes, profit-sharing, and an increase in pay (Azapagic,
2003; Li and Sandino, 2018); however, this depends on the specific conditions and
circumstances of each company. In the context of Vietnamese SMEs, limited amounts of
compensation and personal development opportunities are being offered to employees,
resulting in a high turnover rate (Ehambaranathan, Samie and Murugasu, 2015; Zhu, Kara and
Zhu, 2019). Therefore, establishing an appropriate incentives scheme is a significant enabler
334
that is associated with the need for Vietnamese SMEs to review their policies to facilitate the
adoption of SPMS.
9.4.3 Theme 3: External factors that influence SPMS adoption
The data analysis revealed that external factors refer to external barriers from external
organisations that demotivate SMEs from adopting SPMS. In this section, the sub-themes of
‘social-economic environment’, ‘external barrier’, and ‘institutional voids’ are identified as key
barriers hindering SPMS adoption.
Social-economic environment
Theme 3: External factors that influence SPMS adoption
o Sub-theme: Social-economic environment
o Entrepreneurial sustainability orientation
o Cost-conscious domestic customers
Entrepreneurial sustainability orientation
During the interviews, many top managers of the studied SMEs implied that sustainability
principles are driven by their attitudes, values, and ethical and religious beliefs (Hasan, 2016;
Lee, Herold and Yu, 2016; Mukherjee, 2019; Paterson, Specht and Duchon, 2013; Uygur,
2009). Moreover, evidence of trade-offs emerged, showing that studied SMEs are willing to
sacrifice short-term economic benefits to pursue long-term sustainability. The following quotes
illustrate this aspect:
“We intend to buy another health insurance option, which far exceeds the required one,
from the government…This would motivate the employees, as the insurance could

335
cover their family members as well, then they would prefer to stay with the company
for longer.” (C8, Owner-manager)
“When workers have a small child, we make the exception that they may leave 15 to
30 minutes earlier to pick their children up after school.... This might be a loss for the
company, but I see it as a bonus for the employee; instead of giving them some money,
the company adjusts their schedule to strengthen their employees’ attachment to the
company.” (C17, Owner-manager)
“I am Buddhist. I believe in the Buddhist concept of karma. Our firm often donates to
many orphan children, to pagoda or charities, but we do not want to show off; we just
silently do it, that is our way. As you may know, in Vietnam, if we do good things and
show it off, you may suffer from the social prejudice that ‘empty vessels make the most
noise.’ Sometimes negative words hurt so much. So, we just need our employees, key
customers to know that what we do for the community is enough.” (C02, Owner-
manager)
As indicated in the literature, social responsibilities are a duty, obligation, and the correct
behaviour for firms (Marrewijk and Werre, 2002). SMEs often operate locally (Schlierer et al.,
2012) and embed themselves in local communities (Choi, Kim and Yang, 2018). Thus,
community involvement and development can increase their legitimacy and elicit more
approval from local stakeholders (Perrini and Tencati, 2006). The following quote expresses a
viewpoint shared by most interviewees:
“In doing business, we always think about our duty to develop the community. For
example, we often buy raw materials in the Northern provinces, so we support local
infrastructure projects to help local people live better. This provides a mutual benefit
between the local community and our firm.” (C04, Owner-manager)
The findings indicate that Vietnamese SMEs conduct a cost-benefit analysis (Larrán Jorge et
al., 2015) to make complicated entrepreneurial and sustainability decision trade-offs. Also,
Vietnamese SMEs tend to follow DiVito and Bohnsack's (2017) idea of pursuing a dual
336
orientation; specifically, entrepreneurial growth on one side and sustainable development on
the other. In this respect, the findings shed light on how SMEs, often suffering from limited
resources, have fashioned their entrepreneurial sustainability orientation, contributing to the
underexplored area of inquiry raised by Jahanshahi and Brem (2017).
The qualitative findings reveal a positive managerial attitude towards sustainability activities
linked to business performance and success, which is corroborated by the literature (Cardoni
et al., 2018; De La Torre and Agabriel, 2017; Moyeen and West, 2014). As stated by
Kantabutra (2014), long-term value for multiple stakeholders also means ensuring long-term
sustainable success. Thus, meeting key stakeholder needs is a driving force in facilitating
Vietnamese SMEs to engage in socially responsible activities. The following quotes further
illustrate this proposition.
“So far, the local community have appreciated and recognised what we have done and
how we have contributed to help the poor people.” (C07, Owner-manager)
“I often ask my staff to generate ideas as to whom and where we should do charitable
donations. What I want is to engage my staff in the charitable work of the company.”
(C11, Owner-manager)
“As an employee, I must say that I am so proud to work for a company responsible for
the community and the society. I feel safe working for such a firm.” (C06, IT staff)
“I strongly admire firms that are doing business and sharing their benefits with the
community and society. This shows that they are ethical enterprises.” (Shareholder 1)
“Firms are well known for supporting community well-being, always receiving greater
respect not only from the business community but also from the wider society. I can
assure you of that.” (Business Customer 3)
337
Overall, the qualitative findings demonstrate the sustainability of the social-economic
environments in which Vietnamese SMEs operate. As DiMaggio and Powell (1983) claim,
individuals are strongly influenced by social and cultural forces and their surrounding
environments. These findings can be explained by the national culture of Vietnam which
inherits a deep-rooted set of religious beliefs from Buddhism (Le and Kieu, 2019) that
encourages kindness. In this context, domestic companies often provide charity for the poor,
which is donated to local religious events (Nguyen, Kelly and Bensemann, 2017).
The above qualitative findings support the work of Jenkins (2006) and Azmat (2010) in the
sense that in developing countries, SMEs tend to pursue a silent version of sustainability and
are willing to forgo some of their profits in order to serve a greater goal. The findings also
reinforce those of Tien et al. (2020) who identified a positive association between
entrepreneurial orientation towards sustainability and business performance/success among
Vietnamese SMEs. However, this does not precisely specify whether their entrepreneurial
sustainability orientation would result in the adoption of SPMS. Nevertheless, prior studies
indicate that sustainable entrepreneurial orientation has a positive impact on a company’s
financial and sustainability performance (De et al., 2020; Jahanshahi and Brem, 2017b), which
is likely to lead to the implementation of sustainability initiatives (Aboelmaged and Hashem,
2019b). In this light, this study further highlights the fact that entrepreneurial sustainability
orientation is a reliable predictor of SPMS adoption in SME settings.
Cost-conscious domestic customers
In contrast to international buyers, as discussed previously, most participants during the
interviews expressed the view that domestic customers are less interested in the sustainability
value of products or services and more in how to get the lowest price. The following quote
illustrates this aspect:
338
“Domestic customers, they are always concerned with lowering the price of products I
can offer them. They differ from foreign customers who strongly demand sustainable
characteristics from our products. So, I serve both. To be honest with you [indicating
the researcher], I have two factories, one for products with cheaper prices, another for
products following sustainability standards, relying on ISO.” (C17, Owner-manager)
The above finding (C17) sheds light on how SMEs adopt organisational resilience to integrate
the concept of TBL and focus on addressing the needs of stakeholders (Ahi and Searcy, 2013).
The opinion of one owner-manager (Company C17) demonstrates that if domestic customers
still search for lower product prices rather than encourage sustainability value, SMEs are likely
to respond with the same strategy. A direct consequence of this practice is that SMEs will be
less likely to engage with sustainability which, in turn, demotivates SPMS adoption.
The close agreement of the findings with the literature suggests that in developing countries,
less customer pressure on sustainability issues results in less sustainability engagement from
SMEs (Hasan, 2016; Jamali, Lund-Thomsen and Khara, 2017). These findings also align with
previous research indicating that SMEs are also influenced by normative isomorphism drivers
involving pressure from powerful bodies, including other organisational entities the SMEs are
dependent upon (DiMaggio and Powell, 1983; Caldera, Desha and Dawes, 2019).
This qualitative study has identified a critical mechanism for encouraging normative
isomorphism to respond to international business customers’ demand for sustainability value.
This is consistent with the findings of Wahga, Blundel and Schaefer (2017), who investigated
Pakistan SMEs in the leather industry and found that international business customers are the
ones most likely drive SMEs to think about sustainability value. As such, it is these key
stakeholders, not cost-conscious domestic customers, who are motivating Vietnamese SMEs
to adopt SPMS.
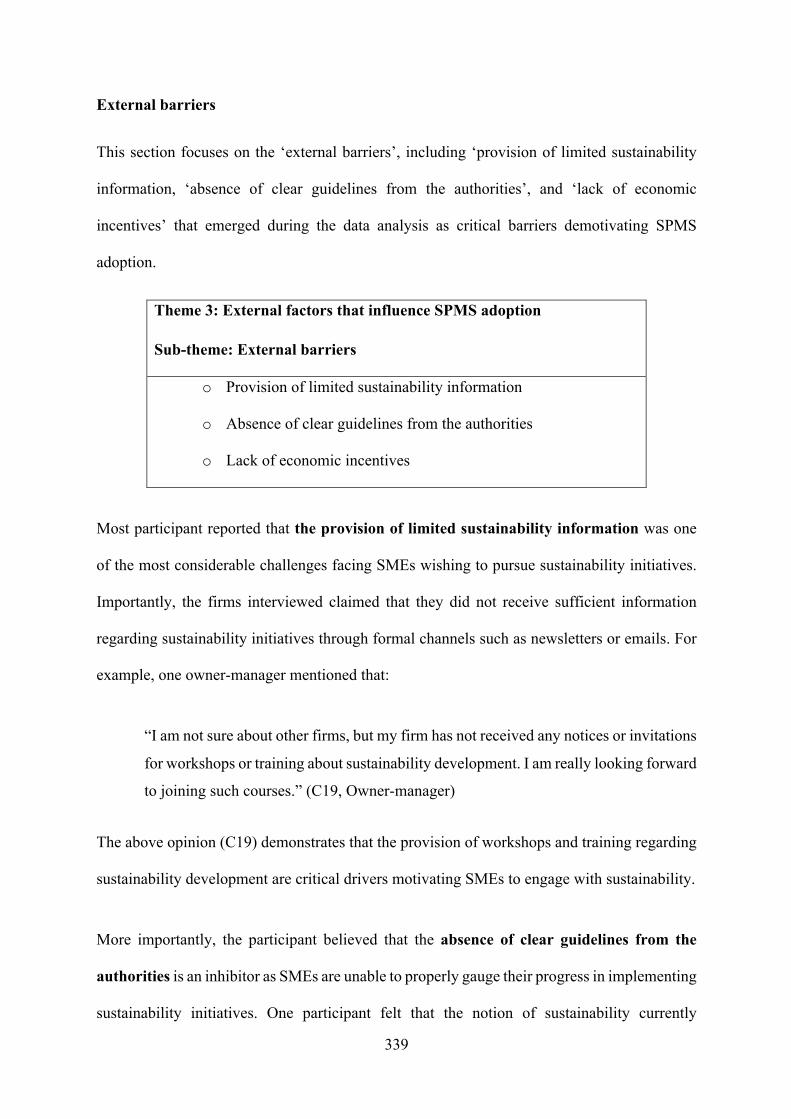
339
External barriers
This section focuses on the ‘external barriers’, including ‘provision of limited sustainability
information, ‘absence of clear guidelines from the authorities’, and ‘lack of economic
incentives’ that emerged during the data analysis as critical barriers demotivating SPMS
adoption.
Theme 3: External factors that influence SPMS adoption
o Sub-theme: External barriers
o Provision of limited sustainability information
o Absence of clear guidelines from the authorities
o Lack of economic incentives
Most participant reported that the provision of limited sustainability information was one
of the most considerable challenges facing SMEs wishing to pursue sustainability initiatives.
Importantly, the firms interviewed claimed that they did not receive sufficient information
regarding sustainability initiatives through formal channels such as newsletters or emails. For
example, one owner-manager mentioned that:
“I am not sure about other firms, but my firm has not received any notices or invitations
for workshops or training about sustainability development. I am really looking forward
to joining such courses.” (C19, Owner-manager)
The above opinion (C19) demonstrates that the provision of workshops and training regarding
sustainability development are critical drivers motivating SMEs to engage with sustainability.
More importantly, the participant believed that the absence of clear guidelines from the
authorities is an inhibitor as SMEs are unable to properly gauge their progress in implementing
sustainability initiatives. One participant felt that the notion of sustainability currently
340
promoted by the Vietnamese government appears to be no more than a slogan, as the following
quote indicates.
“Honestly, I have recently learned about the concept of sustainability because it is
ubiquitous in the media. But no clear guide or detailed information has been delivered
to show us how to properly implement sustainability. It is still a slogan!” (C14, Owner-
manager)
Most literature indicates that a lack of economic incentives also impede SME sustainability
efforts (Dissanayake and Divakara, 2019; Hasan, 2016; Malesios et al., 2020b; Pham, Yong
and Truong, 2019). This finding is supported by this qualitative study, as illustrated in the
following quote:
“It is better to have a kind of sustainability reward to encourage firms doing well. This
would mean upgrading a firm’s level with a sustainability reward, recognition, or
economic incentives. It is fair, isn’t it?” (C08, Owner-manager)
These findings are in line with those in the literature, where a lack of support from government
and insufficient economic incentives are the main barriers preventing firms from engaging with
sustainability (Degong et al., 2018; Do, 2020; Pham, Yong and Truong, 2019; Zhang, Bi and
Liu, 2009). By contrast, sustainability reward, recognition, or economic incentives are critical
drivers (C08).
Institutional Voids
This section reports the ‘institutional voids’, including ‘complexity of existing regulations’,
‘lack of a sector-specific environmental standard’, ‘local authorities have applied legal
documents and regulations in inconsistent ways’, ‘intricate tax systems’, ‘uncertainty of laws

341
and regulations’, and ‘weak law enforcement’, that emerged during the data analysis as critical
barriers demotivating SPMS adoption.
Theme 3: External factors that influence SPMS adoption
Sub-theme: Institutional voids
o The complexity of existing regulations
o Lack of a sector-specific environmental standard
o Local authorities have applied legal documents and regulations
in inconsistent ways
o The intricate tax systems
o The uncertainty of laws and regulations
Weak law enforcement
Most respondents expressed their disappointment at the complexity of existing regulations.
They admitted there had been national social and environmental laws and policies, but these
were pretty general and lack standardisation, which has impeded corporate sustainability in
Vietnam. It can thus be argued that such complexities make it difficult for SMEs to know how
to comply with sustainability initiatives, or with what they should be complying, as
demonstrated in the following quote by one owner-manager:
“In Vietnam, we still do not see a standard requirement regarding environmental issues.
For example, there are no clear regulations and detailed guidelines for us to follow.”
(C08, Owner-manager)
On the same issue, owners-managers of manufacturing firms frequently highlighted the lack
of a sector-specific environmental standard. There is thus a risk that firms might lose
confidence in expanding profitable business opportunities. As a typical example, one deputy
director of a construction firms commented on a lack of precise environmental requirements
342
and guidelines for paints. Under these circumstances, they are operating under the risk of being
fined or losing their license if they do not adopt environmental regulations. Yet the
environmental regulations remain vague. The following quote reflects this view:
“In our construction industry, there is no clear environmental requirements in terms of
the type of paints that can be used. If we use a particular paint for a construction, and
later the authority claimed that the type of paints we used have had negative impacts on
the environment, who will be blamed? It is a risk of being fined or losing the license!
We don’t want to take this risk.” (C05, Deputy General Director)
During the interviews, several owner-managers expressed their unhappiness at the fact that
local authorities have applied legal documents and regulations in inconsistent ways, with
many weak and vague points. Such a phenomenon was described by most owner-managers as
extremely typical in the business environment, which has advocated for firms to expand their
business market nationwide. It can be argued that such unfavourable external conditions create
obstacles impeding firms’ growth (Ha, Nam and Thanh, 2021; Quan, 2015). For example, one
owner-manager said that:
“Taking the decree on the good label as a typical example. For the same product, we
met the good label requirements in Ho Chi Minh City market, but when we sold it to
other cities, such as Hanoi, we were fined for inappropriate details about the good label,
which is quite difficult to understand. It is so funny. Thus, we do not dare to expand
our market share, as it is quite risky. In Vietnam, there is a lack of clarity and
transparency, I must say.” (C06, Owner-manager)
Furthermore, the intricate tax systems were also categorised under this theme as a key
hindrance by owner-managers. Slow procedures and a lack of clarity and consistency among
tax officials in how to accurately implement current tax legislation led to SMEs developing

343
negative perceptions of government administrative practices. As one SME owner-manager
explained:
“The legal documents often lack clarity and guidance which makes it very difficult for
us to apply them in practice. When we have an inquiry, they (the officials) seemingly
do not reply by written documents but by oral responses. Even if they reply by written
documents, it often takes at least two or three months to respond. The official who is
directly in charge during the tax finalisation period explained our prior inquiry quite
differently, compared with the explanation they gave in a written response. Clearly
these officials do not understand legislative documents in consistent ways.” (C11,
Owner-manager)
Most respondents identified the uncertainty of laws and regulations as a primary barrier. A
relatively quick change of regulatory requirements was reported as being very difficult to
predict. Some owner-managers also reported that they were unaware of all the local
environmental and other social responsibility related laws. Moreover, they were not effectively
informed and updated when any change in regulations took place. This reveals that both the
government and the media are ineffective in disseminating the relevant information to local
SMEs. As suggested by the following quotes, this issue may create a regulative risk for firms.
“In Vietnam, the laws are violated and change very quickly. You [indicating the
researcher] know that it is very difficult for SMEs like us to comply with it.” (C11,
Owner-manager)
“You [indicating the researcher] know that for some published legislative documents,
we do not know about their existence or have no information about it until we get a
fine! We need a better communication channel to ensure that such any new change in
laws is effectively disseminated to firms, so we are able to comply with it.” (C14,
Owner-manager)

344
Weak law enforcement was highlighted by almost all respondents as a crucial barrier for firms
wishing to engage with sustainability activities. This issue is serious because when enforcement
is weak, firm tends to ignore regulations to save money and are unwilling to implement
sustainability initiatives in their business operations. Such a phenomenon is believed to be
unfair to SMEs that genuinely invest to augment sustainability and are discouraged from doing
so. Moreover, during the interviews, corruption was reported as the biggest barrier to
environmental protection in Vietnam. Most owners-managers had experienced dealing with
highly corrupt regulatory authorities and government officials. Even if firms are doing well
with respect to environmental management, the owner-managers viewed their activities as part
of the corruption cycle. As Nguyen et al. (2017) reported, over 30% of registered firms in
Vietnam have had to make unofficial payments and approximately 40% expressed the view
that their businesses would be poorly treated without bribery. The above views are illustrated
by the following quotes.
“Regarding the regulatory environment, there is still weak enforcement which some
SMEs rely on to earn a profit. Others are paying bribes instead of investing in
environmental management. Why is that? This is because, in Vietnam, paying bribes is
cheaper and ‘more convenient’ than genuinely doing anything about environmental
management. That is all.” (C04, Owner-manager)
“Our business activities generate very little wastewater to the environment. However,
for every inspection we must pay bribes. If not, we might be put ‘in trouble’ somehow,
you just do not know. Our factory is located in the industrial zone; I do know that some
firms carrying out leather tanning generate an unacceptable amount of liquid waste, but
they are still ‘alive’. In Vietnam, there is no fairness for firms that are complying with
legislation and doing well in terms of environmental management.” (C09, General
Director)
345
The above findings agree with previous literature on the Vietnamese context, which indicates
that poor and weak institutions and highly inefficient and bureaucratic systems are common
(Ha, Nam and Thanh, 2021; Quan, 2015). The problems facing SMEs in emerging economies
are similar to those facing SMEs in Vietnam, particularly the laws governing private enterprise
which, in terms of taxation systems, are overly complex and difficult to understand (Benzin et
al., 2005; Nguyen et al., 2015). In addition, the laws and regulations lack clarity, and vague
guidelines often result in confusion, making it difficult for firms to apply and comply with them
(Nguyen and Pham, 2020). These observations also agree with the results reported by Silvestre
(2015), who analysed institutional voids and sustainability trajectories in Brazil and concluded
that the complexities of bureaucracy, corruption, and intricate tax systems are critical barriers
hindering implementing sustainability initiatives for businesses (Silvestre, 2015). The findings
revealed a range of opinions comparable with the findings of Wahga, Blundel and Schaefer
(2017), who found that a lack of coercive isomorphic pressure (DiMaggio and Powell, 1983)
prevented Pakistan SMEs in the leather industry from complying with regulations as local and
national regulatory authorities could not adequately generate them due to their internal capacity
constraints. Like Vietnam, such a situation may remain unchanged without upgraded
regulations. Essentially, it depends on how quickly the Vietnamese government can improve
regulations and enforcement (Pham, Yong and Truong, 2019).
9.5 Further discussion of managerial capacities in SPMS adoption
The importance of managerial capabilities in organisations was emphasised in the qualitative
data analysis chapter. Managerial capabilities play an essential role in SPMS adoption, as
observed by a large body of literature (Darcy et al., 2014; Wiesner et al., 2017; Williams and
Schaefer, 2013). For instance, a strategic mindset in SMEs determines what activities serve the
firm’s needs and how to undertake them. The vision, experience, and managerial perceptions
of the top managers of SMEs (Aragón-Correa et al., 2008; Caldera, Desha and Dawes, 2018)
346
determine the scope and level of SPMS adoption. Therefore, top managers occupy a
predominant position in adopting SPMS. In this sense, the managers 'mindset', which was
mentioned by interviewees, is closely linked to the use of the term by Nguyen (2019), who
refers to the ‘mindset’ of all management levels and employees in implementing the sustainable
performance of SMEs in Vietnam.
The qualitative results agree with most of the existing studies that human resource support is
one of the factors determining the successful implementation of sustainability initiatives
(Siegel et al., 2019), which can positively influence sustainability performance outcomes
(Raziq and Wiesner, 2016; Nguyen and Tran, 2020). Therefore, the role of top managers is to
convey a shared vision to all the firm’s employees (Dzhengiz and Niesten, 2020; Saratun, 2016;
Xin et al., 2020). However, this task does not simply mean that employees know their
managers’ objectives (Aragón-Correa et al., 2008). Rather, it needs to entail a shared feeling
that the firm’s objectives are crucial and appropriate and that the rest of the employees may
contribute to defining them (Aragón-Correa et al., 2008).
It is important to reiterate that SPMS adoption is likely to be a complex and lengthy process,
which may engender several communication and coordination problems (Taylor and Taylor,
2014). In such circumstances, limited leadership managerial skills are likely to create
challenges (Shi et al., 2008; Tien, Anh and Ngoc, 2020). Thus, enhancing these skills is critical
in enabling Vietnamese SMEs to face increasingly complex processes during SPMS adoption.
As Khurana, Haleem and Mannan (2019) claim, leadership and managerial skills are crucial
determinants of the successful integration of sustainability initiatives within SMEs.
The evidence from the qualitative data shows that top managers who take a proactive stance
towards the adoption of sustainability initiatives will create a high level of potential absorptive
347
capacity at the level of both individuals and organisations. Moreover, the qualitative findings
identify a range of values comparable with theoretical developments highlighting a stronger
link between absorptive capacity and organisational learning (Dzhengiz and Niesten, 2020;
Goddard et al., 2016; Saad, Kumar and Bradford, 2017; Zahra and George, 2002).
Nevertheless, the close agreement of the qualitative findings with the literature suggest that
organisational learning is a hard-won goal, which depends heavily on formal training, effective
communication (Jamali, 2006b), a learning climate (Spicer, 2004), and a positive corporate
culture (Bari, Ghaffar and Ahmad, 2020; Isensee et al., 2020; Laforet, 2016).
Eikelenboom et al. (2019) suggest that transformational leadership is suitable for SMEs’
owner-managers because it has a significant impact on organisational learning and the effective
implementation of sustainability performance. More specifically, transformational leadership
is appropriate for engaging employees in the workplace (Milhem, Muda and Ahmed, 2019;
Taylor and Taylor, 2014) as it is beneficial in enabling a leader to move their team beyond
immediate self-interest by appealing to their values, emotions, attitudes, and beliefs (Bass,
1999). It is argued that employees with a growth mindset are open to transformational
leadership (Caniëls, Semeijn and Renders, 2018), which can influence their self-concordance
(Bono and Judge, 2003). Further, transformational leadership is also geared towards the
personal development of employees (Caniëls, Semeijn and Renders, 2018).
The discussion here is important and useful for SMEs in Vietnam, where leadership and
management styles typically follow a top-down hierarchical approach (Wrana, Xuan and
Nguyen, 2019) in which operational personnel must gain permission from top management
(Busse et al., 2016). This can demotivate organisational learning and impede SPMS efforts.
Therefore, top managers with an appropriate leadership style should facilitate the adoption of
SPMS.

348
It should be noted that extrinsic measurement and reward systems link employee behaviour to
sustainability outcomes, which are likely to reinforce employees’ intrinsic commitment to
sustainability (Gold, Hahn and Seuring, 2013). It is also advantageous for employees’ full
potential to be realised at individual, team-based, and organisational levels (Tarí and Molina‐
Azorín, 2010). This can also create tacit knowledge, often deeply rooted in experience, skills,
and know-how (Bierly, Damanpour and Santoro, 2009), which can be transferred through
relational ties and knowledge sharing (Ngah and Jusoff, 2009). Hence, these are crucial
enablers facilitating SPMS adoption.
9.6 Conclusion
The semi-structured interviews were analysed with respect to three main themes: motivations
driving the adoption of SPMS; internal factors that influence the adoption of SPMS; and
external factors that influence the adoption of SPMS.
Based on the qualitative findings, the motivations to adopt SPMS were mapped along with the
benefits SMEs can bring. The studied SMEs view the adoption of SPMS as an effective
sustainability management tool that provides support for better decision-making. This will
enable SMEs to achieve the goal of cost reduction while responding to the varied requirements,
expectations, and preferences of stakeholders who might have conflicting interests. Regarding
the scope of SPMS adoption, the findings provide answers to fundamental questions relating
to stakeholder theory such as “who (or what) are the stakeholders of the firm?”, “to whom (or
what) do managers pay attention?” (Mitchell, Wood and Agle, 1997, p. 853), and “who
benefits?”.
The findings also indicate that SMEs are influenced by normative isomorphism drivers
involving pressure from international business customers on whom the SMEs are dependent
for business and their survival. The results also suggest that one important mechanism for

349
encouraging mimetic isomorphism learning about the practices of successful organisations who
have demonstrated leadership in sustainability initiatives. Conversely, a lack of coercive
isomorphic pressure appears to demotivate SMEs from adopting SPMS.
Based on the interview data, this study found evidence of absorptive capacity, particularly
knowledge acquisition and assimilation from both internal and external contexts, which the
studied SMEs profoundly understood as prior knowledge and experience supporting SPMS
adoption. The findings also indicate that the key strengths of SMEs, which were recognised
and mapped along with the positive corporate culture, in which knowledge sharing process are
encouraged to support the effective adoption of SPMS. At the same time, the findings also
highlight the importance of more formal organisational process, routines, and rules; the
provision of essential education and training; effective communication; improved managerial
leadership; and top management support as crucial enablers facilitating SPMS adoption in the
SME setting.
In summary, the findings from this study are valuable and useful in that they constitute the first
informative investigation of the inhibitors and enablers, and external factors, influencing SMEs
seeking to adopt SPMS. They also highlight the key inhibitors and crucial enablers SMEs
should pay special attention to. The findings provide policymakers with a list of external
barriers confronting SMEs to which they may refer in the future development of policy aimed
at promoting SPMS adoption in the SME setting. Hence, the findings are in line with the
concept of contingency theory which argues that optimal courses of action are contingent upon
the internal and external circumstances surrounding SMEs.
Chapter 9 has discussed the relationships between, and the influences of, different forms of
motivations and internal and external factors on the adoption of SPMS. The next and final

350
chapter of this thesis presents integrative conclusions and recommendations for future research
on SPMS adoption in the SME setting.
351
CHAPTER 10 CONCLUSION AND RECOMMENDATIONS
10.1 Introduction
This chapter presents a summary of findings, the contribution to knowledge and the
conclusions and recommendations of the study.
The chapter will commence with a cross analysis that checks and compares the quantitative
and qualitative results. Following this there will be a review of the research process and a
summary of the principal objectives and conclusions of each chapter. The chapter then provides
recommendations for improvements in terms of future research, practice, and policy. Finally,
the SPMS adoption model in the SME setting is proposed.
10.2 Overall discussion of the integrative result of quantitative and qualitative phases
The literature has informed the current mixed methods study about TBL sustainability that
comprises a wide range of economic, social, and environmental issues; and each element has
been increasingly complicated and widened. In the literature review, the current study
concentrated on key sustainability aspects of SMEs to narrow down both the measurement
scope and the options of identifying sustainability metrics. Along with that, a mixed approach
was employed. It compromised an initial top-down approach, that enabled the researcher to
develop sustainability metrics from the literature, which followed by a bottom-up approach to
verify these metrics from the perspective of SMEs in the context of Vietnam.
These results are reported in detail in the integrated results section below.
10.2.1 Sustainability Metrics Identified for SMEs in Vietnam
From among twenty-six sustainability metrics identified within the literature, the initial
quantitative analysis verified twelve, using a sample of 579 owner-managers and employees in

352
various Vietnamese SMEs. The set of sustainability metrics identified by the current study for
Vietnamese SMEs is listed in Table 10.1 below:
Table 10.1 Sustainability Metrics Identified for SMEs in Vietnam
Performance Metrics
Economic 1. Return on Investment (ROI)
2. Operating profit
3. Net profit
4. Operational costs
Social 1. Employee job satisfaction
2. Customer satisfaction
3. Customer complaints
Environment 1. Water consumption
2. Waste disposal
3. Recycling of waste
4. Hazardous waste
5. Total waste
It is of vital importance, when using the suggested metrics, to identify the relevant measures
within each of the metric sets; to give example, ‘employee job satisfaction’, various indicators
such as ‘average salary’, ‘bonuses’, and ‘training and development’. The decision to select
appropriate indicators for each metric depends on each company's specific objectives and
conditions, which will differ from one company to another. In the interviews, Vietnamese
SMEs have proved that they can be flexible to change to a new sustainability metric or indicator
whenever necessary.
353
It should be noted that among the twenty-six metrics identified from the literature, fourteen
metrics are not confirmed in the quantitative analysis; this does not mean that they are
irrelevant, or that they are not critical since the average mean value of these metrics is above
the medium value of 3. This means that a higher than the average number of respondents agreed
with its relevance. As previously stated, the removal of these metrics is to obtain an acceptable
and fitting measurement model of the complex higher-order structure of the current research
hypotheses, constituting a typical SEM application. From this perspective, the quantitative
results do not offer us many clues about how or why this variation of SPMS adoption happened.
In line with the theoretical discussion, the empirical finding of the current mixed method further
sheds light on key factors have influenced on SPMS adoption in the SME setting, discussed in
the following sections.
10.2.2 The integrated results of motivation that drive SPMS adoption
The current study has greatly emphasised that motivation (perceived benefits) is one of the
best predictors of future SPMS adoption. The integrated quantitative and qualitative results
shed light on what motivation drives SMEs toward SPMS adoption, listed in Table 10.2.
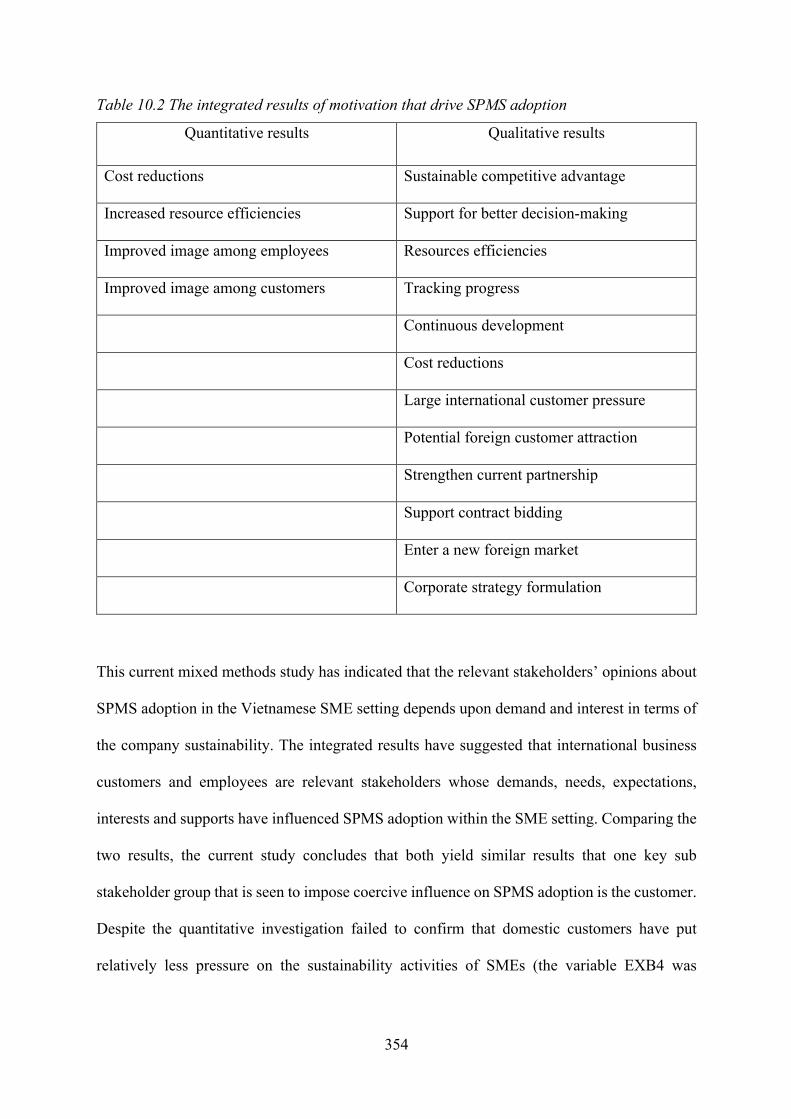
354
Table 10.2 The integrated results of motivation that drive SPMS adoption
Quantitative results Qualitative results
Cost reductions Sustainable competitive advantage
Increased resource efficiencies Support for better decision-making
Improved image among employees Resources efficiencies
Improved image among customers Tracking progress
Continuous development
Cost reductions
Large international customer pressure
Potential foreign customer attraction
Strengthen current partnership
Support contract bidding
Enter a new foreign market
Corporate strategy formulation
This current mixed methods study has indicated that the relevant stakeholders’ opinions about
SPMS adoption in the Vietnamese SME setting depends upon demand and interest in terms of
the company sustainability. The integrated results have suggested that international business
customers and employees are relevant stakeholders whose demands, needs, expectations,
interests and supports have influenced SPMS adoption within the SME setting. Comparing the
two results, the current study concludes that both yield similar results that one key sub
stakeholder group that is seen to impose coercive influence on SPMS adoption is the customer.
Despite the quantitative investigation failed to confirm that domestic customers have put
relatively less pressure on the sustainability activities of SMEs (the variable EXB4 was

355
removed from SEM model), evidence from qualitative investigation proved it is a significant
hinderance demotivating SMEs adopt SPMS.
In line with our theoretical discussion, the current study has expected to explore personal value
of owners and senior managers that are relevant to their mindset of SPMS adoption, While the
extent of quantitative data obtained by the current may be limited, the qualitative evidence
indeed provided a greater understanding about owner’s business philosophy motivated by
Kamma in Buddhism; perceptions of duty, obligations and correct behaviour (Marrewijk and
Werre, 2002), ethical beliefs (Alniacik, Moumen and Alniacik, 2020; Shrestha, 2017). As a
consequence, the empirical findings suggest that for most SMEs, the adoption of SPMS is
influenced and driven by personal value of owners and senior managers.
As shown in Table 10.2, Vietnamese SMEs have realised both the importance and the benefit
of SPMS adoption. The integrated results shed more light on how sustainability metrics can be
better selected in order to address all three pillars of TBL in an integrated manner with regard
to attaining sustainable development (Khurana, Haleem and Mannan, 2019; Slaper and Hall,
2011). The merged data analysis of the current study suggests that to tackle any one of the
dimensions in isolation might result in unintended consequences within another dimension
(Rachuri, Sriram and Sarkar, 2009). In the current mixed method study, the qualitative findings
have further explained how sustainability metrics selected in the initial quantitative result have
been obtained (see Table 10.1). Therefore, the integrated empirical finding has displayed a
trend that could be encouraged is an integration of all three performances of the TBL to define
and identify most appropriate sustainability metrics.
356
10.2.3 The integrated results of inhibitors that hinder SPMS adoption
The integrative findings have provided us with a comprehensive understanding of several
inhibitors that are faced by SMEs in Vietnam with regards to adopting SPMS. It is clear that
Vietnamese SMEs have recognised internal challenges that need to be overcome to adopt
SPMS effectively; for example, it has been recognised that top managers might be less keen
on SPMS adoption if they believe their company cannot implement it and in some cases,
managerial perception of SPMS adoption seems to be relatively subjective (Aragón-Correa et
al., 2008); this might result from the assumption that sustainability is not suitable for businesses
in Vietnam.
A comparison of the two results reveals that qualitative findings serve to further our
understanding that the SPMS adoption is constructed by social interaction within organisations,
encompassing several implicit and explicit complex and complicated issues. During the
interviews, company matters relating to the employees, such as resistance, less engagement,
their mind-set, attitude and behaviour have emerged as significant challenges that are very
demanding to manage effectively. As Branicki, Sullivan-Taylor and Livschitz (2018) claim,
entrepreneurial resilience traverses individual resilience and organisational resilience without
falling neatly into either category.
The integrative findings of inhibitors hindering Vietnamese SMEs toward SPMS adoption are
summarised in Table 10.3. The findings from the current study therefore can be valuable and
useful in sense of being the first informative investigation of inhibitors that hindering SPMS
adoption; as such, they can serve as good references for Vietnamese SMEs to customise
suitable solutions to address the identified inhibitors.

357
Table 10.3 The integrated results of inhibitors that hinder SPMS adoption
Quantitative results Qualitative results
Slow recovery of investment Traditional mindset of business operation
Perceived risk and uncertainties Profit-driven above other goals
Additional cost involved: implementing, monitoring, labour cost)
Short-term orientation sustainability
Limited sustainability knowledge and expertise for an SPMS
Unwilling to share business information
Lack of sustainability measurement tool/framework
Limited resources (finance, human, time)
Initial investment; hidden cost; Fear accrual of debt
Limited essential managerial and leadership skills
Limited educational background (owner-manager and blue-worker)
Less employee engagement
Resistance to change (matured workers, experienced employees, middle managers)
Lack of knowledge, skills, know-how of SPMS adoption
Absence of perceived benefits (reluctance)
Lack of standard sustainability metrics
Varied level of awareness across the organisational structure
Informal process, policies,
Lack of top management commitment, supports, involvement
A challenge is presented in order that qualified employees are retained (losing tacit knowledge)
Employees unwilling to share their thinking and ideas
358
10.2.4 The integrated results of enablers that facilitate SPMS adoption
The current study has focused on the vital role that top management plays regarding the success
of SPMS adoption due to the fact that within most SMEs, the owner controls and manages the
business; ownership and control are therefore the responsibility of the same person (Wickert,
2014; Raziq and Wiesner, 2016). Their control over the allocation of resources allows the
business to prosper and adopt SPMS. The merged analysis has suggested that if the owner-
manager commits, displays proactive behaviour, and supports and shares their positive view of
SPMS adoption, then the employee will follow their example. Indeed, the conclusion that is
reached from the current study suggests that the behaviour of the top managers’ regarding
SPMS adoption does shape the perceptions of the employee.
The integrative findings of enablers facilitating Vietnamese SMEs toward SPMS adoption are
summarised in Table 10.4.
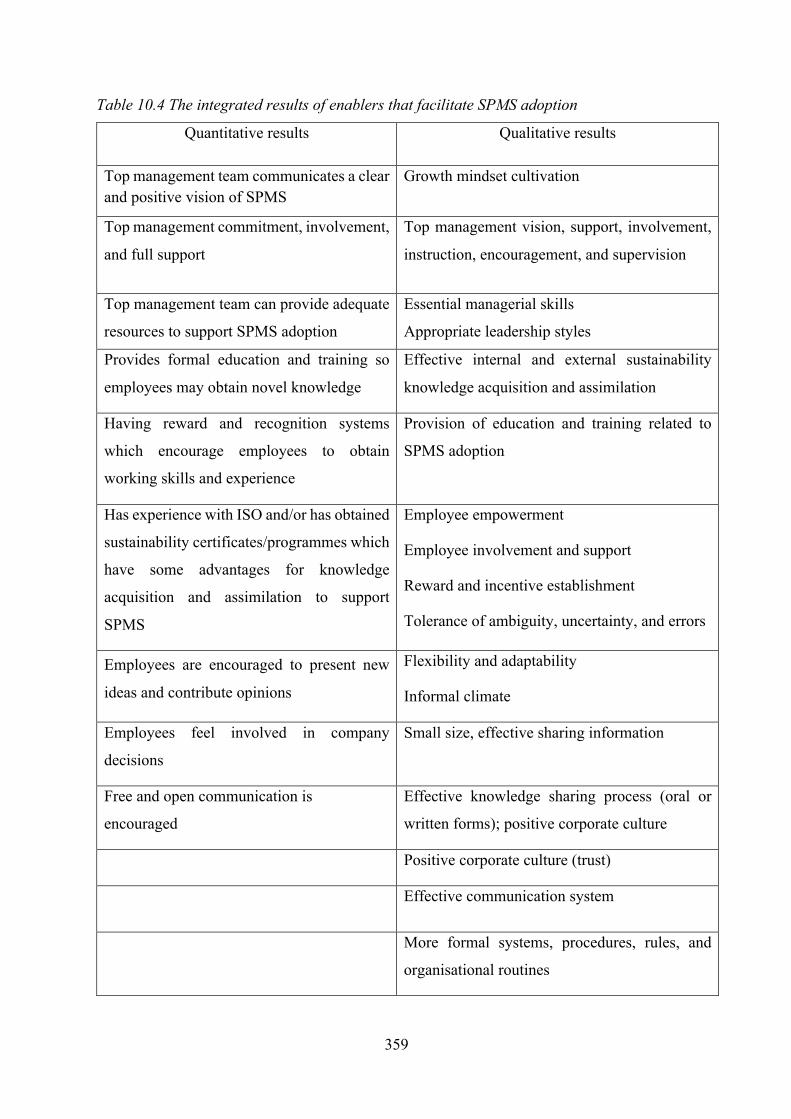
359
Table 10.4 The integrated results of enablers that facilitate SPMS adoption
Quantitative results Qualitative results
Top management team communicates a clear and positive vision of SPMS
Growth mindset cultivation
Top management commitment, involvement,
and full support
Top management vision, support, involvement,
instruction, encouragement, and supervision
Top management team can provide adequate
resources to support SPMS adoption
Essential managerial skills
Appropriate leadership styles
Provides formal education and training so
employees may obtain novel knowledge
Effective internal and external sustainability
knowledge acquisition and assimilation
Having reward and recognition systems
which encourage employees to obtain
working skills and experience
Provision of education and training related to
SPMS adoption
Has experience with ISO and/or has obtained
sustainability certificates/programmes which
have some advantages for knowledge
acquisition and assimilation to support
SPMS
Employee empowerment
Employee involvement and support
Reward and incentive establishment
Tolerance of ambiguity, uncertainty, and errors
Employees are encouraged to present new
ideas and contribute opinions
Flexibility and adaptability
Informal climate
Employees feel involved in company
decisions
Small size, effective sharing information
Free and open communication is
encouraged
Effective knowledge sharing process (oral or
written forms); positive corporate culture
Positive corporate culture (trust)
Effective communication system
More formal systems, procedures, rules, and
organisational routines
360
As can be seen in Table 10.4, the integrative findings have offered us a closed look at enablers
that can support Vietnamese SMEs throughout the developmental process of SPMS. A
comparison of quantitative and qualitative results reveals that both supports that absorptive
capacity and organisational learning capacity are crucial enablers facilitating SPMS adoption
among Vietnamese SMEs. The integrated finding of the current study suggests that Vietnamese
SMEs, owing to resource constraints, can utilise in order to develop their knowledge
management and adopt SPMS with a lower financial cost (Eikelenboom and de Jong, 2019;
Horisch, Johnson and Schaltegger, 2015). The current study, therefore provides a response to
the call for more research to be conducted by Cardoni et al. (2020) on the critical role of
absorptive capacity in adopting SPMS. The qualitative investigation better our knowledge of
SMEs, with regard to them having novel strengths such as flexibility, small firm-size, and an
informal climate; all of which can facilitate the exchange of information, knowledge sharing
and organisational learning.
Given the above, the current study suggests that identified enablers seem to be not often
available and well-prepared in many Vietnamese SMEs to adopt SPMS effectively. For
example, employee empowerment, education and training, positive corporate culture, or formal
organisational process and structure are enablers, which necessitate SMEs be review and
develop further if necessary. This implies that SMEs should be flexible to effectively manage
their trade-offs to develop relevant capabilities. They should also proactively co-ordinate these
capabilities create new ones in order that the adoption of SPMS can be facilitated and
supported. However, this can be challenging as it requires time, resources, efforts and
commitment for the development and adaption of innovative managerial and leadership
approaches.

361
10.2.5 The integrated results of external barriers that hinder SPMS adoption
The integrative results helped us further understand significant external barriers that demotivate
SMEs to adopt SPMS. The qualitative results helped us further explore institutional voids and
the difficulties that have consumed both time and resources of SMEs. Under such
circumstances, the SPMS adoption is likely to be embedded, or delayed. The integrative results
of the current study regarding external barriers are summarised in Table. 10.5.
Table 10.5 The integrated results of external barriers that hinder SPMS adoption
Quantitative results Qualitative results
Lack of government support in terms of information and seminars/workshops about sustainable development
Limited sustainability information provided
Lack of government laws and regulations Absence of clear guidelines from the authorities
Lack of economic incentives and rewards for firms engaging in sustainability
Lack of economic incentives
The complexity of existing regulations
Lack of a sector-specific environmental standard
Local authorities have applied legal documents and regulations in an inconsistent way
The intricate tax systems
The uncertainty of laws and regulations
Weak law enforcement
From the data in Table 10.5, the integrated result has offered us a greater understanding of the
key external barriers demotivating Vietnamese SMEs towards SPMS adoption, which can
362
inform policymakers to upgrade policies aimed at better supporting and assisting SME in
adoption of SPMS. This is important and crucial as previously stated in Chapter 1 of this thesis,
SMEs are considered as the drivers of any economy.
To make a long story short, from an internal perspective, the findings from the current study
has informed us that Vietnamese SMEs appear not yet ready to implement SPMS. Although
the suggested metrics from the current study are recommended for SMEs, many SMEs might
not know how to balance priorities. This statement is particularly pertinent with regard to cost
and management of short-and long-term trade-offs whilst the SME endeavours to implement
SPMS effectively.
10.3 Summary of objectives and conclusions
Following a thorough review of the literature and exploration of the issues with practitioners
through a questionnaire survey and semi-structured interviews, this section will outline the
processes undertaken to address the objective and present a summary of the conclusions drawn.
Objective One: To examine the key aspects and significance of sustainability performance
in organisations
The first objective of the study was to examine the literature available on key aspects of
sustainability performance measurement. The research process commenced with the initial
literature review in Chapter 2. This aimed to establish all three pillars of the TBL concept;
economic, social and environment. We also aimed to establish a holistic understanding of the
crucial aspects of the dimensions that were important for the current study; this raised the issue
of needing to implement cross analysis (Chapter 10) and provided a useful foundation for
identifying sustainability metrics appropriate for SMEs, the primary purpose of the current
study.
363
Objective Two: To identify theories underpinning the measurement of sustainability
performance
Objective two of the study was to identify theories underpinning the measurement of
sustainability performance. To achieve this, stakeholder, institutional and contingency theories
were reviewed in Chapter 2. In relation to the TBL concept, these theories provided internal
and external oriented underpinnings that served as a theoretical lens through which elements
that influenced SPMS adoption, within the setting of the SME, could be applied.
Objective Three: To investigate the unique characteristics and key internal and external
factors that influence the adoption of sustainability metrics (sustainability performance
measurement systems) within the SME setting.
Objective three was to explore the extent to which the unique characteristics of SMEs were
considered to either be strengths or weaknesses influencing SPMS adoption. Consideration was
also given to primary internal influences, including key motivations, inhibitors and enablers,
as well as the main external factors that impacted SPMS adoption. To achieve this objective, a
literature review (Chapter 3) was conducted which was further supported by a questionnaire
survey (Chapters 6 and 7) undertaken by owner-mangers and key employees. This was
followed by semi-structured interviews (Chapters 8 and 9) with practitioners to expand on the
initial qualitative findings (Chapter 7) and to explore other factors impacting SPMS adoption
within the SME setting in Vietnam (Chapter 9). Finally, the discussion of integrated finding is
presented in the final section of this thesis (Chapter 10).
Objective Four: To identify, from the existing literature, sustainability metrics that are
appropriate for use by SMEs to measure sustainability performance
364
Objective four explored and identified sustainability metrics that are appropriate for use by
SMEs in order that they may measure sustainability performance. To address this objective,
the overall research methodology and research design was set out and presented in Chapter 5.
The process began with the review of key aspects of sustainability performance and factors that
influence the SPMS adoption (Chapter 2 & 3). Based on this foundation, the preliminary list
of sustainability metrics obtained from the literature was presented in chapter 4. Finally, the
twelve most appropriate metrics for Vietnamese SMEs when they were considering their
critical internal and external factors (Chapter 7) were checked and supported by a quantitative
analysis of data collected from 579 valid questionnaires completed by SMEs (Chapter 6 & 7).
The process was then further checked through undertaking 43 semi-structured interviews with
owner-managers, key employees, shareholders, and business customers. The main aim was to
further explain the initial quantitative findings and explore more potential factors that
influenced SPMS adoption (Chapter 8 and 9), and then to establish the extent to which the
practitioners’ evaluation and perception of the sustainability performance measurement went
towards the SPMS adoption in the future. The research findings clearly reveal that the level of
SPMS adoption would mainly depend on specific motivations, conditions and organisational
contexts of each SME, meaning that the SPMS adoption differs from one company to another.
Objective Five: To investigate factors moderating the adoption of sustainability metrics
in the context of Vietnamese SMEs
Objective seven explored moderating factors influencing the SPMS adoption, in the context of
Vietnamese SMEs, from both an individual and organisational level. These were based on key
characteristics of respondents (gender, age, management position and working experience), the
company (firm age, firm size, business sector and company sustainability experience). These
365
moderating factors were informed by the review of literature (Chapter 3), which was then set
out for quantitatively testing (Chapter 6). To achieve this objective, a series of eight multigroup
analysis testing was carried out with SEM. The main aim was to figure out specific moderating
effects on each relationship between six factors and SPMS adoption within the research
framework of this study. The findings, presented in Chapter 7, reflected the effect of specific
groups on six factors, which will provide SMEs top managers with managerial approaches to
support the SPMS adoption.
Objective Six: To identify critical strategies enabling both practitioners in the SME
setting and policymakers to facilitate the implementation of sustainability performance
measurement in the context of Vietnamese SMEs
Recommendations for SMEs’ owner-managers
• First, to deliver positive sustainability outcomes for themselves and other stakeholders.
practitioners should take a long-term and holistic view of the overall benefits of
adopting SPMS and not simply focus on the short-term profits and risks typically
associated with the initial and hidden costs. This will enable them to achieve cost
reductions and to use resources more efficiently and also to support other organisational
goals. They are advised to initially scan their available resources and organisational
capacities to comprehensively understand their optimal sustainability efforts. Based on
this information, they can define appropriate objectives and establish escalating goals
that are feasible for the adoption of SPMS.
• Practitioners should endeavour to acquire necessary managerial skills, particularly
motivation and communication skills. And, no less importantly, they should deliver
trust and empowering leadership styles with an appropriate attitude and open and
366
proactive behaviours, since all of these will aid effective communication and enhance
employees’ trust and motivation. This, in turn, promotes employee self-performance
management, which will then lead to successful facilitation of the SPMS adoption.
Additionally, owner-managers should consider giving empowerment to employees
through proactive negotiations to discuss mutual benefits. Owner-managers should also
review and enhance their multi-task and time management skills in order to properly
involve, supervise and support employees throughout the process of SPMS adoption.
• Practitioners are advised to take a proactive approach to acquire external knowledge
and integrate it with existing internal knowledge. For this purpose, they should
endeavour to regular attend sustainability seminars, workshops and other sustainability
training programmes, and derive sustainability knowledge from the internet. Above all,
they need to promote strong motivation and commitment to learning through the
establishment of long-term and trusted relationships with their partners. This helps the
company to develop knowledge-based resources with less expenses and thereby to
effectively respond to expectations and needs of their key stakeholders with regards to
SPMS adoption.
• Overall, practitioners should review and make good effort to address the six factors and
their moderating effects (verified in quantitative phase of this study) because all of them
significantly influence the level of SPMS adoption. Equally important, they need to
review and enhance organisational processes, structures, information sharing, corporate
culture, and incentives scheme, as well as providing education and training in order to
ensure there is a strong motivation and commitment to learn through the encouragement
of the knowledge sharing process. These are crucial to facilitate the effective SPMS
adoption within the organisation.
367
Recommendations for Vietnamese policymakers
• Policymakers and regulatory bodies should put in place sustainability training
programmes to enable SMEs to enhance their sustainability knowledge and acquire
skills that will equip them to deal with the notion of sustainability development in order
to effectively adopt SPMS.
• Policymakers and regulatory bodies should put in place appropriate education and
training, seminars and workshops in order to enhance the SMEs understanding of the
notion of sustainability development when adopting SPMS. This will also help to
change the mind-sets and attitudes of owner-managers, as well as reducing any
misunderstandings of, and resistance to, SPMS adoption. Policymakers, together with
other sustainable regeneration regulatory agencies, should produce guidelines to lead
the practitioners within the SME.
• Adequate funding/financial support, along with incentives and reward schemes, should
be established to encourage SMEs to prioritise the adoption and implementation of
SPMS.
• Legislation should be introduced to motivate practitioners towards adopting SPMS.
Enforcing compliance to such legislation will ensure that fairness is fundamental when
encouraging SMEs to adopt SPMS.
10.4 Contributions of the current study
This section presents the theoretical, methodological and practical contributions of this study.
Theoretical contribution

368
The primary aim of this research is to identify appropriate sustainability metrics for SMEs in
order that they may be able to measure and better manage sustainability performance from a
new perspective. Thus far, most studies on selecting and developing sustainability
metrics/indicators for SMEs are mainly based upon the perspective of external stakeholders
such as experts and researchers. In this study, the focus has shifted to the perspective of SMEs.
This thesis thus constitutes the first study conducted with regard to identifying sustainability
metrics for SMEs in the context of Vietnam.
In line with the theoretical discussion, this research contributes to the identification of metrics
that will assess the sustainability performance of SMEs, as well as those main characteristics
of SMEs that can influence this performance. More specifically, SMEs are often described as
having insufficient resources and of lacking awareness of sustainability standards (Sommer,
2017). To this end, this study has extended the extant literature on how, owing to their resource
constraints, SMEs could utilise organisational capabilities to simultaneously address economic,
social, and environmental sustainability performances (Dissanayake et al., 2020; Eikelenboom
and de Jong, 2019; Trianni et al., 2019).
The combined findings taken from both quantitative and qualitative studies showed that both
key internal stakeholders (top management and employees) and external stakeholders will
influence the adoption of SPMS within the SME setting, but in different ways because of their
different demands and conflicting interests. The current study examined contingent factors
influencing the adoption of SPMS. Therefore, it enriches scholarly knowledge by highlighting
the unique conditions in Vietnam and the distinct circumstances of SMEs. In this light, it helps
to broaden the understanding of enablers and inhibitors and external barriers towards the
adoption of SPMS in the SME setting. From this perspective, it enriches the theory of
contingency. The current study highlighted that normative isomorphism and mimetic

369
isomorphism pressures simultaneously drive Vietnamese SMEs to adopt SPMS, while lacked
coercive isomorphic pressure demotivate their efforts. Moreover, international business
customers, employees were found as key stakeholder groups by the current study. Therefore,
this thesis enriches the literature on sustainability performance measurement as well as
stakeholder and institutional theories.
From the integrated finding of the current study, a novel framework (Figure 10.1) enabling
understanding of how SMEs could overcome their resource constraints to adopt SPMS into
their organisations was proposed. The framework shows the factors that have influence both at
an organisational level (resources, organisational change, capabilities and role of managerial
leadership) and at an external environment level (external organisations, policies and
regulations). The framework shows the integration consideration of those elements and
suggests further avenues of research on different manifestations of SPMS adoption within the
SME setting.
Methodological contribution
Researchers have consistently called for greater methodological rigour in the field of SPMS.
Trends in the field reveal quantitative methods to be the dominant data collection method, with
qualitative methods employed less often. This study adopted a mixed methods approach
combining quantitative and qualitative techniques for data gathering. This comprised surveys
(579 respondents) generating quantitative data, and semi-structured interviews (43
interviewees) which generated qualitative data. The participants comprised owner-managers,
key employees, shareholders, and business customers for twenty studied SMEs. The study drew
a balanced perspective between the contrasting positivist and phenomenological paradigms and
perspectives (Chapter 5). This is a realist perspective, making a major contribution to mixed
methods research (Maxwell and Mittapalli, 2010). Such a balanced approach to data gathering
370
enabled the researcher to view research on SPMS adoption within the SME setting from
different angles and perspectives.
This study employs a subsequential mixed-method design, where the quantitative and
qualitative data strands yield results that complement one another (Bickman et al., 2014;
Bryman, 2006; Molina-Azorin, 2016). To this end, the integrated approach of quantitative and
qualitative results is far more meaningful when combined than when they stand alone, and this
has helped us generate several ideas about adoption of SPMS within the SME setting. The
current study confirms the benefits of conducting pilot studies that have resulted in meaningful
information and issues raised within the local context. This has helped the finalisation of both
the survey questionnaire (quantitative phase) and the formulated interview questions
(qualitative phase).
The initial quantitative analysis used a sample of 579 owner-managers and employees within
Vietnamese SMEs. The results support the identification of six crucial factors that influence
SPMS adoption. They include motivation (MOT), inhibitors (INH), top management support
(TOP), absorptive capacity (ACA), organisation learning capacity (OLC) and external barriers
(EXB). In addition, the initial quantitative results support the examination of the moderating
effect of eight control variables on each relationship. The four moderating variables at the
individual level are (1) managerial position, (2) gender (3) age of the participant and (4) work
experience. The other four moderating variables at the business level include (1) business size
(number of employees), (2) firm age (number of years since the firm’s founding), (3) the
business sector and (4) the company’s sustainability experience. The following qualitative
phase takes into consideration cultural, social and even political factors in order to ensure
greater methodological rigour, validity and reliability of the overall results.

371
The current study also indicates that interviews provide more detailed and in-depth information
about the relevant stakeholders’ perceptions, opinions, and knowledge on SPMS adoption
under investigation than does the survey.
In the qualitative phase, 43 semi-structured interviews were conducted with 43 participants
from 20 SMEs, and also business customers. The qualitative results offer us a greater
understanding by providing detailed assessments of the initial quantitative response patterns.
The combination of quantitative and qualitative approaches therefore represents a significant
contribution to research on SPMS (Imbrogiano, 2020).
Practical contribution
This study began by reflecting the concerns expressed in the literature that SMEs, owing to
their resource constraints, have made insufficient efforts to develop and adopt sustainability
metrics in order to measure and better manage their sustainability performance. Yet, a
challenge remains in that understanding relevant capabilities is not always an easy thing, and
clear guidance is also not always possible and relevant to companies in various contexts (Yu
and Ramanathan, 2016). The study therefore made several practical contributions through its
investigation of factors influencing SPMS in the SME setting. The practical contributions were
two-fold.
First, the study highlights the benefits and why the need to adopt SPMS by SMEs. The results
generate appropriate sustainability metrics, which are valuable to would-be entrepreneurs who
need to implement these to better measure and manage sustainability performance within their
organisations.
372
Secondly, the findings will help owner-managers of Vietnamese SMEs to understand the
inhibitors, enablers, and external barriers to SPMS adoption and, most importantly, innovative
ways to overcome these inhibitors.
10.5 Limitation of this study and suggestions for future research
This section addresses the limitations of this current study and ends with suggestions for future
research.
The first limitation is the constrained generalisability of the findings to fixed business-sectors,
although they could be generalised to service and manufacturing sectors. However, the extent
to which each individual industry is similar to, or different from others, requires further
investigation.
Secondly, to explore the topic further, different models can be experimented with when running
the SEM test, such as separately testing the influence of top management support with regard
to absorptive capacity, or organisational learning capacity.
Thirdly, a potential bias of this current study is splitting groups to explore moderating factors
influencing the SPMS adoption. For example, the company age groups into two ((≤ 10 years,
> 10 years), the purpose of this is so that a relatively balanced number for each group among
the sample of this study is obtained. This could be a limitation of this study. Future works
would be interesting in order to undertake further analyses or validation.
Finally, this study was limited to SMEs in the south of Vietnam. While the findings have major
implications for research focusing on the adoption of SPMS, influenced by SMEs inhibitors
and enablers, there is no guarantee that similar findings would be observed in other regions of
Vietnam. For the findings to be generalised, future studies would need to be expanded to cover

373
the scope of the research to include SMEs in other regions. Beyond this, it is also important to
assess whether the findings can be applied to other emerging countries.
10.6 Towards and SPMS adoption model in the SME setting
This section presents a proposed SPMS adoption model. This model draws on the limited
resources of the SME, and is based on empirical findings relating to both the survey and the
interviews. The model allows for the adoption of SPMS in the SME setting. This model is
summarised in Figure 10.1.
The model summarises the major findings and implications of the current study. The findings
call for an understanding of SPMS adoption based on the inherent resource constraints of
SMEs, which are crucial barriers that SMEs need to overcome in order to successfully adopt
SPMS. The results also show that SMEs do not necessarily require the assistance of external
supports, but a proactive approach towards SPMS adoption is needed. The research model is
intended to foster new debates about the interpretation of SPMS adoption and relevant
capacities within the SME setting, particularly in the context of developing countries. Future
studies undertaken would expand upon or validate the model.

374
Figure 10.1 Proposed SPMS Adoption model in the SME setting

375
REFERENCE
Abbas, J. Raza, S. Nurunnabi, M. Minai, M.S. and Bano, S.Abbas, J. et al. (2019) The impact of entrepreneurial business networks on firms’ performance through a mediating role of dynamic capabilities. Sustainability (Switzerland). 11 (11).
Abbasi, M. and Nilsson, F. (2012) Themes and challenges in making supply chains environmentally sustainable. Supply Chain Management: An International Journal. 17 (5), pp.517–530.
Abdalla, Y.A. and Siti-Nabiha (2015) Pressures for sustainability practices in an oil and gas company: evidence from Sudan. Qualitative Research in Accounting & Management. 12 (3), pp.256–286.
Abdullahi, Y. et al. (2019) Technovation What speci fi c modes of internationalization in fl uence SME innovation in Sub-Saharan least developed countries ( LDCs )? Technovation. 79 (May 2016), Elsevier Ltd, pp.56–70.
Aboelmaged, M. (2018) The drivers of sustainable manufacturing practices in Egyptian SMEs and their impact on competitive capabilities: A PLS-SEM model. Journal of Cleaner Production. 175, Elsevier Ltd, pp.207–221.
Aboelmaged, M. and Hashem, G. (2019) Absorptive capacity and green innovation adoption in SMEs : The mediating effects of sustainable organisational capabilities. Journal of Cleaner Production. 220, Elsevier Ltd, pp.853–863.
Adams, C.A. and Frost, G.R. (2008) Integrating sustainability reporting into management practices. Accounting Forum. 32 (4), pp.288–302.
Ageron, B., Gunasekaran, A. and Spalanzani, A. (2012) Sustainable supply management: An empirical study. International Journal of Production Economics. 140 (1), Elsevier, pp.168–182.
Agle, B.R. and Mitchell, R.K. (2016) Who Matters to CEOs ? An Investigation of Stakeholder Attributes and Salience , Corporate Performance , and CEO Values. 42 (5), pp.507–525.
Aguinis, H. and Glavas, A. (2012) What We Know and Don’t Know About Corporate Social Responsibility: A Review and Research Agenda. Journal of Management. 38 (4), pp.932–968.
Agyemang, O.S. and Ansong, A. (2017) Corporate social responsibility and firm performance of Ghanaian SMEs. Journal of Global Responsibility. 8 (1), pp.47–62.
Ahi, P. and Searcy, C. (2013a) A comparative literature analysis of definitions for green and sustainable supply chain management. Journal of Cleaner Production. 52, pp.329–341.
Ahi, P. and Searcy, C. (2015) An analysis of metrics used to measure performance in green and sustainable supply chains. Journal of Cleaner Production. 86, pp.360–377.
Ahi, P. and Searcy, C. (2013) Assessing sustainability in the supply chain: A triple bottom line approach. Applied Mathematical Modelling. 39 (10–11), Elsevier Inc., pp.2882–2896.
Ahmad, N. et al. (2021) Sustainability as a “new normal” for modern businesses: Are smes of
376
pakistan ready to adopt it? Sustainability (Switzerland). 13 (4), pp.1–17.
Ahmad, S., Wong, K.Y. and Rajoo, S. (2019) Sustainability indicators for manufacturing sectors: A literature survey and maturity analysis from the triple-bottom line perspective. Journal of Manufacturing Technology Management. 30 (2), pp.312–334.
Akhtar, C.S. et al. (2015) Can Intellectual Capital of SMEs Help in Their Sustainability Efforts. Journal of Management Research. 7 (2), p.82.
Altenburg, T. and Lütkenhorst, W., 2015. Industrial policy in developing countries: Failing markets, weak states. Edward Elgar Publishing.
Al-kalouti, J. et al. (2020) Investigating innovation capability and organizational performance in service firms. Strategic Change. 29 (1), pp.103–113.
Alagaraja, M. and Shuck, B. (2015) Exploring Organizational Alignment-Employee Engagement Linkages and Impact on Individual Performance: A Conceptual Model. Human Resource Development Review. 14 (1), pp.17–37.
Albort-Morant, G. et al. (2018) Potential and realized absorptive capacity as complementary drivers of green product and process innovation performance. Sustainability (Switzerland). 10 (2).
Ali, M.M. et al. (2017) Comparative positioning of Small and Medium Enterprises in Bangladesh, Thailand and the Philippines. Economy of Region. 13 (2), pp.381–395.
Ali, Y. et al. (2020) Impact of Lean, Six Sigma and environmental sustainability on the performance of SMEs. International Journal of Productivity and Performance Management.
Alkhoraif, A., Rashid, H. and McLaughlin, P. (2019) Lean implementation in small and medium enterprises: Literature review. Operations Research Perspectives. 6 (December 2018), Elsevier, p.100089.
Almalki, S. (2016) Integrating Quantitative and Qualitative Data in Mixed Methods Research—Challenges and Benefits. Journal of Education and Learning. 5 (3), p.288.
Alniacik, E., Moumen, C. and Alniacik, U. (2020) The moderating role of personal value orientation on the links between perceived corporate social performance and purchase intentions. Corporate Social Responsibility and Environmental Management. 27 (6), pp.2724–2734.
AlNuaimi, B.K., Al Mazrouei, M. and Jabeen, F. (2020) Enablers of green business process management in the oil and gas sector. International Journal of Productivity and Performance Management. 69 (8), pp.1671–1694.
Amrina, E. and Yusof, S.M.M. (2011) Key performance indicators for sustainable manufacturing evaluation in automotive companies. Industrial Engineering and Engineering Management (IEEM), 2011 IEEE International Conference on. pp.1093–1097.
Anguera, M.T. et al. (2018) Revisiting the difference between mixed methods and multimethods: Is it all in the name? Quality and Quantity. 52 (6), pp.2757–2770.
377
Anisul Huq, F., Stevenson, M. and Zorzini, M. (2014) Social sustainability in developing country suppliers. Helen Walker, Professor Stefan Seur, P. (ed.) International Journal of Operations & Production Management. 34 (5), pp.610–638.
Anitha, J. (2014) Determinants of employee engagement and their impact on employee performance. International Journal of Productivity and Performance Management. 63 (3), pp.308–323.
Anlesinya, A. and Susomrith, P. (2020) Sustainable human resource management: a systematic review of a developing field. Journal of Global Responsibility. 11 (3), pp.295–324.
Antolín-López, R., Delgado-Ceballos, J. and Montiel, I. (2016) Deconstructing corporate sustainability: a comparison of different stakeholder metrics. Journal of Cleaner Production. 136, Elsevier Ltd, pp.5–17.
Aragón-Correa, J.A. et al. (2008) Environmental strategy and performance in small firms: A resource-based perspective. Journal of Environmental Management. 86 (1), pp.88–103.
Arbuckle, J. L. (2016). IBM SPSS Amos 24 user’s guide. IBM.
Arena, M. and Azzone, G. (2012) A process‐based operational framework for sustainability reporting in SMEs. Journal of Small Business and Enterprise Development. 19 (4), pp.669–686.
Arena, M., Azzone, G. and Bengo, I. (2015) Performance Measurement for Social Enterprises. Voluntas. 26 (2), pp.649–672.
Arend, R.J. (2014) Social and Environmental Performance at SMEs: Considering Motivations, Capabilities, and Instrumentalism. Journal of Business Ethics. 125 (4), pp.541–561.
Arevalo, J.A. and Aravind, D. (2011) Corporate social responsibility practices in India: approach, drivers, and barriers. Corporate Governance: The international journal of business in society. 11 (4), pp.399–414.
Arsawan, I.W.E. et al. (2020) Leveraging knowledge sharing and innovation culture into SMEs sustainable competitive advantage. International Journal of Productivity and Performance Management.
Ates, A. et al. (2013) The development of SME managerial practice for effective performance management. Journal of Small Business and Enterprise Development. 20 (1), pp.28–54.
Ates, A. and Bititci, U. (2011) Change process: A key enabler for building resilient SMEs. International Journal of Production Research. 49 (18), pp.5601–5618.
Attride-Stirling, J. (2001) Thematic networks: an analytic tool for qualitative research. Qualitative Research. 1 (3), pp.385–405.
Atu, O.-E.O.K. (2013) Triple bottom line accounting: A conceptual expose. IOSR Journal of Business and Management. 13 (4), pp.30–36.
Augusto, D. et al. (2019) Overcoming barriers towards Sustainable Product-Service Systems in Small and Medium-sized enterprises : State of the art and a novel Decision Matrix. Journal
378
of Cleaner Production. 222, Elsevier Ltd, pp.903–921.
Ayuso, S. and Navarrete-Báez, F.E. (2018) How Does Entrepreneurial and International Orientation Influence SMEs’ Commitment to Sustainable Development? Empirical Evidence from Spain and Mexico. Corporate Social Responsibility and Environmental Management. 25 (1), pp.80–94.
Azapagic, A. (2004) Developing a framework for sustainable development indicators for the mining and minerals industry. Journal of Cleaner Production. 12 (6), pp.639–662.
Azapagic, A. (2003) Systems Approach to Corporate Sustainability: A General Management Framework. Process Safety and Environmental Protection. 81 (5), pp.303–316.
Azapagic, A. and Perdan, S. (2000) Indicators of Sustainable Development for Industry. Process Safety and Environmental Protection. 78 (4), pp.243–261.
Azmat, F. (2010) Exploring social responsibility of immigrant entrepreneurs: Do home country contextual factors play a role? European Management Journal. 28 (5), Elsevier Ltd, pp.377–386.
Bach, T., Le, T. and Bui, Y. (2020) Informal Short-term Borrowings and Small and Medium Enterprises’ Performance in a Credit Crunch: Evidence from Vietnam. Journal of Development Studies. 00 (00), Routledge, pp.1–15.
Bai, Y., Yuan, J. and Pan, J. (2017) Why SMEs in emerging economies are reluctant to provide employee training: Evidence from China. International Small Business Journal:Researching Entrepreneurship.Researching Entrepreneurship. 35 (6), pp.751–766.
Bala, H. and Feng, X. (2019) Success of Small and Medium Enterprises in Myanmar: Role of Technological, Organizational, and Environmental Factors. Journal of Global Information Technology Management. 22 (2), Routledge, pp.100–119.
Bansal, P. (2005) Evolving sustainably: A longitudinal study of corporate sustainable development. Strategic Management Journal. 26 (3), pp.197–218.
Bansal, P. (2002) The corporate challenges of sustainable development. Academy of Management Executive. 16 (2), pp.122–131.
Bao, H., Wang, H. and Sun, C. (2019) How and when environmental regulation induces middle managers’ proactive behavior. Career Development International. 24 (5), pp.438–452.
Bari, M.W., Ghaffar, M. and Ahmad, B. (2020) Knowledge-hiding behaviors and employees’ silence: mediating role of psychological contract breach. Journal of Knowledge Management. 24 (9), pp.2171–2194.
Baron, R.M. and Kenny, D.A. (1986) The Moderator-Mediator Variable Distinction in Social Psychological Research. Conceptual, Strategic, and Statistical Considerations. Journal of Personality and Social Psychology. 51 (6), pp.1173–1182.
Baruch, Y. and Holtom, B.C. (2008) Survey response rate levels and trends in organizational research. Human Relations. 61 (8), pp.1139–1160.
379
Bass, B.M. (1999) Two Decades of Research and Development in Transformational Leadership. European Journal of Work and Organizational Psychology. 8 (1), pp.9–32.
Battisti, M. and Perry, M. (2011) Walking the talk? Environmental responsibility from the perspective of small-business owners. Corporate Social Responsibility and Environmental Management. 18 (3), pp.172–185.
Baum, T. et al. (2016) Sustainability and the tourism and hospitality workforce: A thematic analysis. Sustainability (Switzerland). 8 (8).
Baumgartner, R.J. (2014) Managing Corporate Sustainability and CSR: A Conceptual Framework Combining Values, Strategies and Instruments Contributing to Sustainable Development. 271 (November 2013), pp.258–271.
Baumgartner, R.J. and Ebner, D. (2010) Corporate Sustainability Strategies: Sustainability Profi les and Maturity Levels. Sustainable Development Sust. Dev. 18 (February), pp.76–89.
Beaver, G. (2007) The strategy payoff for smaller enterprises. Journal of Business Strategy. 28 (1), pp.11–17.
Bell, E., Bryman, A., Harley, B. & Bryman, A. (2018) Business research methods, Fifth edn, Oxford University Press, Oxford.
Bellantuono, N., Pontrandolfo, P. and Scozzi, B. (2016) Capturing the stakeholders’ view in sustainability reporting: A novel approach. Sustainability (Switzerland). 8 (4).
Benzin, C., Chu, M.H. and Callanan, G. (2005) A Regional Comparision of the Motivation and Problems of Vietnamese Entrepreneurs. World Scientific. 10 (1), pp.2–27.
Beresford, Melanie. 2008. “Doi Moi in Review: The Challenges of Building Market Socialism in Vietnam.” Journal of Contemporary Asia 38 (2): 221–243.
Bhanot, N., Rao, P.V. and Deshmukh, S.G. (2017) An integrated approach for analysing the enablers and barriers of sustainable manufacturing. Journal of Cleaner Production. 142, Elsevier Ltd, pp.4412–4439.
Bi, Z.M.M. et al. (2015) Reusing industrial robots to achieve sustainability in small and medium-sized enterprises (SMEs). Industrial Robot: An International Journal. 42 (3), pp.264–273.
Bianchi, R. (1998) “ Greening ” SMEs ’ Competitiveness. pp.269–281.
Bickman, L. et al. (2014) Integrating Qualitative and Quantitative Approaches to Research The SAGE Handbook of Applied Social Research Methods.
Bierly, P.E., Damanpour, F. and Santoro, M.D. (2009) The application of external knowledge: Organizational conditions for exploration and exploitation. Journal of Management Studies. 46 (3), pp.481–509.
Bititci, U.S. et al. (2005) Measuring and managing performance in extended enterprises.
380
International Journal of Operations & Production Management. 25 (4), pp.333–353.
Blunch, N. (2008) Introduction to Structural Equation Modelling Using SPSS and AMOS 1 Oliver’s Yard, 55 City Road, London England EC1Y 1SP United Kingdom, SAGE Publications, Ltd.
Bodini, A. (2012) Building a systemic environmental monitoring and indicators for sustainability: What has the ecological network approach to offer? Ecological Indicators. 15 (1), Elsevier Ltd, pp.140–148.
Boley, B.B. and Uysal, M. (2013) Competitive synergy through practicing triple bottom line sustainability: Evidence from three hospitality case studies. Tourism and Hospitality Research. 13 (4), pp.226–238.
Bono, J.E. and Judge, T.A. (2003) Self-concordance at word: Toward understanding the motivational effects of transformational leaders. Academy of Management Journal. 46 (5), pp.554–571.
Borga, F. et al. (2006) Sustainability report in small enterprises: Case studies in Italian furniture companies. Business Strategy and the Environment. 18 (3), pp.162–176.
Bos-brouwers, H.E.J. (2009) Corporate sustainability and innovation in SMEs: Evidence of themes and activities in practice. Business Strategy and the Environment. 19 (June 2009), pp.417–435.
Boso, N., Danso, A., Leonidou, C., Uddin, M., Adeola, O. and Hultman, M., (2017) Does financial resource slack drive sustainability expenditure in developing economy small and medium-sized enterprises? Journal of Business Research. 80 (April), pp.247–256.
Bourlakis, M. et al. (2014) Firm size and sustainable performance in food supply chains: Insights from Greek SMEs. International Journal of Production Economics. 152, Elsevier, pp.112–130.
Bourne, M., Mills, J., Wilcox, M., Neely, A. and Platts, K., (2000) Designing, implementing and updating performance measurement systems. International Journal of Operations & Production Management. 20 (7), pp.754–771.
Bourne, M., Kennerley, M. and Franco-Santos, M. (2005) Managing through measures: a study of impact on performance. Journal of Manufacturing Technology Management. 16 (4), pp.373–395.
Bowen, P., Edwards, P., Simbayi, L. and Cattell, K., (2013) HIV/AIDS interventions by construction firms in the Western Cape, South Africa: A thematic analysis of qualitative survey data. International Journal of Construction Management. 13 (4), pp.11–33.
Boyce, C. and Neale, P. (2006) Conducting in-depth interviews: A Guide for designing and conducting in-depth interviews. Evaluation. 2 (May), pp.1–16.
Brandi, H.S., Daroda, R.J. and Olinto, A.C. (2014) The use of the Canberra metrics to aggregate metrics to sustainability. Clean Technologies and Environmental Policy. 16 (5), pp.911–920.
Branicki, L.J., Sullivan-Taylor, B. and Livschitz, S.R. (2018) How entrepreneurial resilience
381
generates resilient SMEs. International Journal of Entrepreneurial Behaviour and Research. 24 (7), pp.1244–1263.
Brannen, J. (2005) Mixing methods: The entry of qualitative and quantitative approaches into the research process. International Journal of Social Research Methodology: Theory and Practice. 8 (3), pp.173–184.
Braun, V. and Clarke, V. (2006) Using thematic analysis in psychology Using thematic analysis in psychology. Qualitative Research in Psychology. 3 (2), pp.77–101.
Brohi, N.A., Jantan, A.H., Qureshi, M.A., Bin Jaffar, A.R., Bin Ali, J. and Bin Ab Hamid, K., (2018) The impact of servant leadership on employees attitudinal and behavioural outcomes. Cogent Business and Management. 5 (1), Cogent, pp.1–17.
Brunosson, M. (2020) Master thesis How socially responsible are SMEs in Vietnam ?
Burrell, G. and Morgan, G., (2017). Sociological paradigms and organisational analysis: Elements of the sociology of corporate life. Routledge.
Bruwer, J. and Smith, J. (2018) The Role of Basic Business Skills Development and Their Influence on South African Small, Medium and Micro Enterprise Sustainability. Journal of Economics and Behavioral Studies. 10 (2), p.48.
Bryman, A. (2006) Integrating quantitative and qualitative research: How is it done? Qualitative Research. 6 (1), pp.97–113.
Bryman, A. (2008) Of methods and methodology. Qualitative Research in Organizations and Management: An International Journal. 3 (2), pp.159–168.
Buller, P.F. and McEvoy, G.M. (2012) Strategy, human resource management and performance: Sharpening line of sight. Human Resource Management Review. 22 (1), Elsevier Inc., pp.43–56.
Burke, S. and Gaughran, W.F. (2007) Developing a framework for sustainability management in engineering SMEs. Robotics and Computer-Integrated Manufacturing. 23 (6), pp.696–703.
Busse, C., Schleper, M.C., Niu, M. and Wagner, S.M., (2016) Supplier development for sustainability: contextual barriers in global supply chains. International Journal of Physical Distribution and Logistics Management. 46 (5), pp.442–468.
Büyüközkan, G. and Ifi, G. (2012) A novel hybrid MCDM approach based on fuzzy DEMATEL, fuzzy ANP and fuzzy TOPSIS to evaluate green suppliers. Expert Systems with Applications. 39 (3), pp.3000–3011.
Byrne, B. M. (2016). Structural Equation Modeling with AMOS: Basic Concepts, Applications, and Programming, 3rd ed. New York: Routledge.
Byrne, J. and Humble, Á.M. (2007) An Introduction to Mixed Method Research. Atlantic Research Centre fo familu-work issues. December, pp.1–4.
Caldera, H.T.S., Desha, C. and Dawes, L. (2019) Evaluating the enablers and barriers for successful implementation of sustainable business practice in ‘lean’ SMEs. Journal of Cleaner

382
Production. 218, Elsevier Ltd, pp.575–590.
Caldera, H.T.S., Desha, C. and Dawes, L. (2018) Exploring the characteristics of sustainable business practice in small and medium-sized enterprises: Experiences from the Australian manufacturing industry. Journal of Cleaner Production. 177, Elsevier Ltd, pp.338–349.
Caloghirou, Y., Kastelli, I. and Tsakanikas, A. (2004) Internal capabilities and external knowledge sources: Complements or substitutes for innovative performance? Technovation. 24 (1), pp.29–39.
Camuffo, A. and Comacchio, A. (2005) Linking intellectual capital and competitive advantage: A cross-firm competence model for north-east italian smes in the manufacturing industry. Human Resource Development International. 8 (3), pp.361–377.
Canh, N.T., Liem, N.T., Thu, P.A. and Khuong, N.V., (2019) The impact of innovation on the firm performance and corporate social responsibility of Vietnamese manufacturing firms. Sustainability (Switzerland). 11 (13).
Caniëls, M.C.J., Semeijn, J.H. and Renders, I.H.M. (2018) Mind the mindset! The interaction of proactive personality, transformational leadership and growth mindset for engagement at work. Career Development International. 23 (1), pp.48–66.
Cardoni, A., Zanin, F., Corazza, G. and Paradisi, A., (2020) Knowledge management and performance measurement systems for SMEs’ economic sustainability. Sustainability (Switzerland). 12 (7).
Cardoni, A. et al. (2018) The role of contingency factors on the relationship between sustainability practices and organizational performance. Business Strategy and the Environment. 27 (3), Elsevier Ltd, pp.423–433.
Carter, C.R. and Rogers, D.S. (2008) A framework of sustainable supply chain management: moving toward new theory. International Journal of Physical Distribution & Logistics Management. 38 (5), pp.360–387.
Cassells, S. and Lewis, K. (2011) SMEs and environmental responsibility: Do actions reflect attitudes? Corporate Social Responsibility and Environmental Management. 18 (3), pp.186–199.
Cegarra Navarro, J.G., Eldridge, S. and Wandosell, G. (2016) International organizational performance: The influence of congenital learning and realized absorptive capacity. Journal of Small Business and Enterprise Development. 23 (2), pp.453–473.
Cesário, F. and Chambel, M.J. (2017) Linking Organizational Commitment and Work Engagement to Employee Performance. Knowledge and Process Management. 24 (2), pp.152–158.
Cha, E.S., Kim, K.H. and Erlen, J.A. (2007) Translation of scales in cross-cultural research: Issues and techniques. Journal of Advanced Nursing. 58 (4), pp.386–395.
Chan, E.S.W. (2011) Implementing Environmental Management Systems in Small- and Medium-Sized Hotels: Obstacles. Journal of Hospitality & Tourism Research. 35 (1), pp.3–23.

383
Chandra, A.A., Paul, J. and Chavan, M. (2020) Internationalization challenges for SMEs: evidence and theoretical extension. European Business Review. 33 (2), pp.316–344.
Chavez, R. et al. (2020) The relationship between internal lean practices and sustainable performance: exploring the mediating role of social performance. Production Planning and Control. 0 (0), Taylor & Francis, pp.1–18.
Chee Tahir, A. and Darton, R.C. (2010) The Process Analysis Method of selecting indicators to quantify the sustainability performance of a business operation. Journal of Cleaner Production. 18 (16–17), Elsevier Ltd, pp.1598–1607.
Chen, D. et al. (2014) A holistic and rapid sustainability assessment tool for manufacturing SMEs. CIRP Annals - Manufacturing Technology. 63 (1), CIRP, pp.437–440.
Chen, L., Xu, J. and Zhou, Y. (2017) Regulating the environmental behavior of manufacturing SMEs: Interfirm alliance as a facilitator. Journal of Cleaner Production. 165, Elsevier Ltd, pp.393–404.
Choi, J.H., Kim, S. and Yang, D.H. (2018) Small and medium enterprises and the relation between social performance and financial performance: Empirical evidence from Korea. Sustainability (Switzerland). 10 (6), pp.15–19.
Choongo, P. (2017) A Longitudinal Study of the Impact of Corporate Social Responsibility on Firm Performance in SMEs in Zambia. Sustainability. 9 (8), p.1300.
Chou, S.Y., Chang, T. and Han, B. (2016) A Buddhist application of corporate social responsibility: qualitative evidence from a case study of a small Thai family business. Small Enterprise Research. 23 (2), Taylor & Francis, pp.116–134.
Chow, W.S. and Chen, Y. (2012) Corporate Sustainable Development: Testing a New Scale Based on the Mainland Chinese Context. Journal of Business Ethics. 105 (4), pp.519–533.
Clark, P. (2007) Exploring the Nature of Research Questions in Mixed Methods Research. Journal of Mixed Methods Research. pp.207–211.
Clarke‐Sather, A.R. et al. (2011) Development of social, environmental, and economic indicators for a small/medium enterprise. Balachandran, K. (ed.) International Journal of Accounting & Information Management. 19 (3), pp.247–266.
Clarke, V. and Braun, V. (2013) Teaching thematic analysis : Overcoming challenges and developing strategies for effective learning Associate Professor in Sexuality Studies Department of Psychology Faculty of Health and Life Sciences University of the West of England Coldharbour Lane Br. The Psychologist. 26 (2013), pp.120–123.
Clifton, D. and Amran, A. (2011) The Stakeholder Approach: A Sustainability Perspective. Journal of Business Ethics. 98 (1), pp.121–136.
Cohen, S. et al. (2014) The Growth of Sustainability Metrics. (May), pp.1–16.
Cohen, W.M. and Levinthal, D.A. (1990) Absorptive Capacity: A New Perspective on Learning and Innovation. 8/Administrative Science Quarterly,. 35 (1), pp.128–152.

384
Collis, J. & Hussey, R. (2014). Business research: a practical guide for undergraduate & postgraduate students, Fourth edn, Palgrave Macmillan, Basingstoke, Hampshire.
Cong, L.C. and Thu, D.A. (2020) The competitiveness of small and medium enterprises (SMEs) in the tourism sector: the role of leadership competencies. Journal of Economics and Development. ahead-of-p (ahead-of-print).
Connelly, L.M. and Peltzer, J.N. (2016) Underdeveloped themes in qualitative research: Relationship with interviews and analysis. Clinical Nurse Specialist. 30 (1), pp.51–57.
Conway, E. (2014) Assessing sustainability support to small and medium sized enterprises (SMEs). International Journal of Performance Engineering. 10 (4), pp.377–386.
Cordano, M., Marshall, R.S. and Silverman, M. (2010) How do small and medium enterprises Go ‘Green’? A study of environmental management programs in the U.S. wine industry. Journal of Business Ethics. 92 (3), pp.463–478.
Cormier, D., Gordon, I.M. and Magnan, M. (2004) Corporate environmental disclosure: Contrasting management’s perception with reality. Journal of Business Ethics. 49, pp.143–165.
Courrent, J.M., Chassé, S. and Omri, W. (2018) Do Entrepreneurial SMEs Perform Better Because They are More Responsible? Journal of Business Ethics. 153 (2), pp.317–336.
Creswell, J. (1994). Research Design, Qualitative and Quantitative Approaches. Thousand Oaks, CA: Sage.
Creswell, J.W. and Creswell, D. (2018). Research design: qualitative, quantitative & mixed methods approaches, 5th, international student edn, SAGE, Los Angeles, CA; London.
Creswell, J. W. and Plano Clark, V. L. (2011) Designing and conducting mixed methods research, Thousand Oaks, California, Sage Publicaitons.
Cresswell, J. W and Tashakkori, A. (2007) Differing perspectives on mixed research methods. Journal of Mixed Research Methods. vol 1 ((4),), pp.303–308.
Creswell, J., W. (2009) Mapping the Field of Mixed Methods Research. Journal of Mixed Methods Research. 3 (2), pp.95–108.
Creswell, J.W., Shope, R., Plano Clark, V.L. and Green, D.O., (2006) How interpretive qualitative research extends mixed methods research. Research in the Schools. 13 (1), pp.1–11.
Creswell, J.W. (2013) The Selection of a Research Approach. Research design: Qualitative, quantitative, and mixed methods approaches. pp.3–23.
Criado-Gomis, A., Cervera-Taulet, A. and Iniesta-Bonillo, M.A. (2017) Sustainable entrepreneurial orientation: A business strategic approach for sustainable development. Sustainability (Switzerland). 9 (9), pp.1–20.
Cronin, M.J. (2017) Managing for Social Impact
Crossnan, F. (2003) Research philosophy: towards an undertsanding. Nurse Researcher. 11
385
(1), pp.46–55.
Crotty, M. (1998). The foundation of social research: Meaning and perspective in the research process. Thousand Oaks, CA: Sage.
Csillag, S. et al. (2019) What makes small beautiful? Learning and development in small firms. Human Resource Development International. 22 (5), Routledge, pp.453–476.
Cubas-Díaz, M. and Martínez Sedano, M.Á. (2017) Measures for Sustainable Investment Decisions and Business Strategy - A Triple Bottom Line Approach. Business Strategy and the Environment.
Cui, Z., Liang, X. and Lu, X. (2015) Prize or price? Corporate social responsibility commitment and sales performance in the Chinese private sector. Management and Organization Review. 11 (1), pp.25–44.
Cumberland, D.M. et al. (2018) An emergent understanding of influences on managers’ voices in SMEs. Leadership and Organization Development Journal. 39 (2), pp.234–247.
Curado, C. (2006) Organisational learning and organisational design. Learning Organization. 13 (1), pp.25–48.
Curado, C., Muñoz-Pascual, L. and Galende, J. (2018) Antecedents to innovation performance in SMEs: A mixed methods approach. Journal of Business Research. 89 (January), Elsevier, pp.206–215.
Curkovic, S., Sroufe, R. and Melnyk, S. (2005) Identifying the factors which affect the decision to attain ISO 14000. Energy. 30 (8 SPEC. ISS.), pp.1387–1407.
Danso, A. et al. (2019) Environmental sustainability orientation, competitive strategy and financial performance. Business Strategy and the Environment. 28 (5), pp.885–895.
Darcy, C. et al. (2014) A consideration of organisational sustainability in the SME context. Ronan Carbery, Prof. Thomas N. Gara, D. (ed.) European Journal of Training and Development. 38 (5), pp.398–414.
Das, M. and Rangarajan, K. (2017) Corporate Sustainability as a Business Strategy in SMEs -. pp.505–511.
Das, M., Rangarajan, K. and Dutta, G. (2020) Corporate sustainability in SMEs: an Asian perspective Journal of Asia Business Studies. 14 (1), 109–138.
De, D. et al. (2020) Impact of Lean and Sustainability Oriented Innovation on Sustainability Performance of Small and Medium Sized Enterprises: A Data Envelopment Analysis-based framework. International Journal of Production Economics. 219 (June 2018), Elsevier B.V., pp.416–430.
Denzin, N.K. & Lincoln, Y.S. (2018). The SAGE handbook of qualitative research, Fifth edn, SAGE, Los Angeles.
Denzin, N.K. (1989). The research act: A theoretical introduction to sociological method (3rd ed.). New York: McGraw-Hill.
386
Degong, M. et al. (2018) Do international capabilities and resources configure firm’s sustainable competitive performance? Research within Pakistani SMEs. Sustainability (Switzerland). 10 (11).
Delai, I. and Takahashi, S. (2013) Corporate sustainability in emerging markets: Insights from the practices reported by the Brazilian retailers. Journal of Cleaner Production. 47, Elsevier Ltd, pp.211–221.
Delai, I. and Takahashi, S. (2011) Sustainability measurement system: a reference model proposal. Social Responsibility Journal. 7 (3), pp.438–471.
Delmas, M. and Blass, V.D. (2010) Measuring Corporate Environmental Performance: The Trade-Offs of Sustainability Ratings. Business Strategy and the Environment. 19 (4), pp.245–260.
Denscombe, M. (2008) Communities of Practice. Journal of Mixed Methods Research. 2 (3), pp.270–283.
Denzin, N.K. (2010) Moments, Mixed Methods, and Paradigm Dialogs. Qualitative Inquiry. 16 (6), pp.419–427.
Denzin, N.K. (2012) Triangulation 2.0*. Journal of Mixed Methods Research. 6 (2), pp.80–88.
DeSantis, L. and Ugarriza, D.N. (2000) The concept of theme as used in qualitative nursing research. Western Journal of Nursing Research. 22 (3), pp.351–372.
Deshpande, R. (1983) ‘Paradigms Lost’: On Theory and Method in Research in Marketing. Journal of Marketing. 47 (4), p.101.
Dewasiri, N.J., Weerakoon, Y.K.B. and Azeez, A.A. (2018) Mixed Methods in Finance Research: The Rationale and Research Designs. International Journal of Qualitative Methods. 17 (1), pp.1–13.
Dey, P.K. et al. (2019) Could lean practices and process innovation enhance supply chain sustainability of small and medium-sized enterprises? Business Strategy and the Environment. 28 (4), pp.582–598.
Dey, P.K., Malesios, C., De, D., Chowdhury, S. and Abdelaziz, F.B., (2020) The Impact of Lean Management Practices and Sustainably-Oriented Innovation on Sustainability Performance of Small and Medium-Sized Enterprises: Empirical Evidence from the UK. British Journal of Management. 31 (1), pp.141–161.
Dhanesh, G.S. (2015) Corporate social responsibility (CSR) in India: A dialectical analysis of the communicative construction of the meanings and boundaries of CSR in India. Public Relations Inquiry. 4 (3), pp.287–303.
Dharam, H. and Singh, B. (2015) Achieving Environmental Sustainability of Small and Medium Enterprises Through Selective Supplier Development Programs. International Journal of Advanced Research in Management and Social Sciences. 4 (2), pp.35–50.
Dibella, A.J., Nevis, E.C. and Gould, J.M. (1996) Understanding Organizational Learning Capability. Journal of Management Studies. 33 (3), pp.361–379.
387
DiMaggio, P.J. and Powell, W.W. (1983) The Iron Cage Revisited : Institutional Isomorphism and Collective Rationality in Organizational Fields Author ( s ): Paul J . DiMaggio and Walter W . Powell Published by : American Sociological Association Stable URL : http://www.jstor.org/stable/2095101. American Sociological Review. 48 (2), pp.147–160.
Dissanayake, D. et al. (2020) Barriers for sustainability reporting: evidence from Indo-Pacific region. Meditari Accountancy Research.
Dissanayake, D., Tilt, C. and Xydias-Lobo, M. (2016) Sustainability reporting by publicly listed companies in Sri Lanka. Journal of Cleaner Production. 129, Elsevier Ltd, pp.169–182.
Dissanayake, S. and Divakara, S. (2019) a Literature Review on Intrapreneurial Constraints in the Development of Small and Medium Scale Enterprises Research Article a Literature Review on Intrapreneurial Constraints in the Development of. International Journal of Current Research. 11 (11), pp.8540–8547.
Ditlev-Simonsen, C.D. and Midttun, A. (2011) What motivates managers to pursue corporate responsibility? a survey among key stakeholders. Corporate Social Responsibility and Environmental Management. 18 (1), pp.25–38.
DiVito, L. and Bohnsack, R. (2017) Entrepreneurial orientation and its effect on sustainability decision tradeoffs: The case of sustainable fashion firms. Journal of Business Venturing. 32 (5), Elsevier Inc., pp.569–587.
Do, Q.C. (2020) Social and Economic Upgrading in the Garment Supply Chain in Vietnam (137).
Dobers, P. and Halme, M. (2009) Corporate social responsibility and developing countries. Corporate Social Responsibility and Environmental Management. 16 (5), pp.237–249.
Dora, M., Kumar, M. and Gellynck, X. (2016) Determinants and barriers to lean implementation in food-processing SMEs - A multiple case analysis. Production Planning and Control. 27 (1), Taylor & Francis, pp.1–23.
Durst, S. and Gueldenberg, S. (2010) What makes SMEs attractive to external successors? VINE: The journal of information and knowledge management systems. 40 (2), pp.108–135.
DWYER, L. (2005) Relevance of Triple Bottom Line Reporting To Achievement of Sustainable Tourism: a Scoping Study. Tourism Review International. 9 (1), pp.79–938.
Dzhengiz, T. and Niesten, E. (2020) Competences for Environmental Sustainability: A Systematic Review on the Impact of Absorptive Capacity and Capabilities. Journal of Business Ethics. 162 (4), Springer Netherlands, pp.881–906.
Easterby-Smith, M., Thorpe, R. & Jackson, P.R. 2015, Management and business research, Fifth edn, SAGE, London.
Edwards, V. and Phan, A. (2013) Managers and management in Vietnam: 25 years of economic renovation (doi moi) Managers and Management in Vietnam: 25 Years of Economic Renovation (Doi Moi).
Ehambaranathan, E., Samie, A. and Murugasu, S. (2015) The Recent Challenges of
388
Globalization and the Role of Employee Engagement – The Case of Vietnam. International Journal of Human Resource Studies. 5 (1), p.69.
Eikelenboom, M. and de Jong, G. (2019) The impact of dynamic capabilities on the sustainability performance of SMEs. Journal of Cleaner Production. 235, pp.1360–1370.
Ekwueme, C.M., Egbunike, C.F. and Onyali, C.I. (2013) Benefits of Triple Bottom Line Disclosures on Corporate Performance: An Exploratory Study of Corporate Stakeholders. Journal of Management and Sustainability. 3 (2), pp.79–91.
Eldor, L. and Vigoda-Gadot, E. (2017) The nature of employee engagement: rethinking the employee–organization relationship. International Journal of Human Resource Management. 28 (3), Routledge, pp.526–552.
Elkington, J. (2001) Enter the Triple Bottom Line. The Triple Bottom Line: Does it all Add Up? 1 (1986), pp.1–16.
Elkington, J. (1997) Partnerships from Cannibals with Forks : The Triple Bottom line of 21 st Century Business. Environmental Quality Management. Autumn 199, pp.37–51.
Engert, S., Rauter, R. and Baumgartner, R.J. (2016) Exploring the integration of corporate sustainability into strategic management: A literature review. Journal of Cleaner Production. 112, Elsevier Ltd, pp.2833–2850.
Esben Rahbek Pedersen (2009) The many and the few: rounding up the SMEs that manage CSR in the supply chain. Supply Chain Management: An International Journal. 14 (2), pp.109–116.
Escobar, L.F. and Vredenburg, H. (2011) Multinational Oil Companies and the Adoption of Sustainable Development: A Resource-Based and Institutional Theory Interpretation of Adoption Heterogeneity. Journal of Business Ethics. 98 (1), pp.39–65.
Etuk, R.U., Etuk, G.R. and Michael, B. (2014) Small and medium scale enterprises (SMEs) and Nigeria’s economic development. Mediterranean Journal of Social Sciences. 5 (7), pp.656–662.
European Commission (2002a) Communication from the Commission concerning Corporate Social Responsibility: A Business Contribution to Sustainable Development. (July), pp.1–24.
European Commission (2002b) Observatory of European SMEs European SMEs and Social and Environmental Responsibility
Evans, W.R. and Davis, W.D. (2011) An examination of perceived corporate citizenship, job applicant attraction, and CSR work role definition. Business and Society. 50 (3), pp.456–480.
Eze, U.C., Goh, G.G.G., Goh, C.Y. and Tan, T.L., (2013) Perspectives of SMEs on knowledge sharing. VINE: The journal of information and knowledge management system. 43 (2), pp.210–236.
Fairlie, P. (2011) Meaningful work, employee engagement, and other key employee outcomes: Implications for human resource development. Advances in Developing Human Resources. 13 (4), pp.508–525.

389
Fakhrudtdinov, A. (2012) Corporate Social Responsibility in Regional and International Entrepreneurship. Australasian Journal of Regional Studies. 18 (3), pp.82–85.
Fallis, A.. (2013) Leadership Qualities and Management Competencies. European Academy of Business in Society. 53 (9), pp.1689–1699.
Fan, C., Carrell, J. and Zhang, H. (2010) An investigation of indicators for measuring sustainable manufacturing. Proceedings of the 2010 IEEE.
Fassin, Y. (2008) SMEs and the fallacy of formalising CSR. Business Ethics: A European Review. 17 (4), pp.364–378.
Fatimah, Y.A. and Aman, M. (2018) Remanufacturing sustainability indicators: An Indonesian small and medium enterprise case study. IOP Conference Series: Materials Science and Engineering. 403 (1).
Faulkner, W. and Badurdeen, F. (2014) Sustainable Value Stream Mapping (Sus-VSM): Methodology to visualize and assess manufacturing sustainability performance. Journal of Cleaner Production. 85, Elsevier Ltd, pp.8–18.
Feil, A.A., de Quevedo, D.M. and Schreiber, D. (2015) Selection and identification of the indicators for quickly measuring sustainability in micro and small furniture industries. Sustainable Production and Consumption. 3 (June), Elsevier B.V., pp.34–44.
Fekpe, E. and Delaporte, Y. (2019) Sustainability integration and supply chain performance of manufacturing small and medium size enterprises. African Journal of Economic and Management Studies. 10 (2), pp.130–147.
Ferenhof, H.A. et al. (2014) Environmental management systems in small and medium-sized enterprises : an analysis and systematic review. Journal of Cleaner Production. 74, Elsevier Ltd, pp.44–53.
Ferguson, S.L., Kerrigan, M.R. and Hovey, K.A. (2020) Leveraging the opportunities of mixed methods in research synthesis: Key decisions in systematic mixed studies review methodology. Research Synthesis Methods. 11 (5), pp.580–593.
Ferreira, A. and Otley, D. (2009) The design and use of performance management systems: An extended framework for analysis. Management Accounting Research. 20 (4), pp.263–282.
Filser, M. et al. (2019) Entrepreneurship as catalyst for sustainable development: Opening the black box. Sustainability (Switzerland). 11 (16).
Font, X., Garay, L. and Jones, S. (2016) Sustainability motivations and practices in small tourism enterprises in European protected areas. Journal of Cleaner Production. 137, Elsevier Ltd, pp.1439–1448.
Fornell, C. and Larcker, D.F. (1981) Evaluating Structural Equation Models with Unobservable Variables and Measurement Error. Journal of Marketing Research. 3 (1), pp.134–135.
Francalanci, C. and Morabito, V. (2008) IS integration and business performance: The mediation effect of organizational absorptive capacity in SMEs. Journal of Information Technology. 23 (4), pp.297–312.

390
Franco, M. and Bourne, M. (2003) Factors that play a role in “managing through measures”. Management Decision. 41 (8), pp.698–710.
Franco, M. and Matos, P.G. (2015) Leadership styles in SMEs: a mixed-method approach. International Entrepreneurship and Management Journal. 11 (2), pp.425–451.
Fraser, E.D.G. et al. (2006) Bottom up and top down: Analysis of participatory processes for sustainability indicator identification as a pathway to community empowerment and sustainable environmental management. Journal of Environmental Management. 78 (2), Academic Press, pp.114–127.
Freeman, R.E. et al. (2010) Stakeholder Theory: The State Of The Art Journal of Chemical Information and Modeling. 53 (9).
Friedman, M. (1970) The Social Responsibility of Business Is to Increase Its Profits. Corporate Ethics and Corporate Governance. pp.173–178.
Frondel, M., Horbach, J. and Rennings, K. (2008) What triggers environmental management and innovation? Empirical evidence for Germany. Ecological Economics. 66 (1), pp.153–160.
Fuller, T. and Lewis, J. (2002) ‘Relationships mean everything’ A typology of small-business relationship strategies in a reflexive context. British Journal of Management. 13 (4), pp.317–336.
Furst, S.A. and Cable, D.M. (2008) Employee Resistance to Organizational Change: Managerial Influence Tactics and Leader-Member Exchange. Journal of Applied Psychology. 93 (2), pp.453–462.
Gadenne, D.L., Kennedy, J. and McKeiver, C. (2009) An empirical study of environmental awareness and practices in SMEs. Journal of Business Ethics. 84 (1), pp.45–63.
Galbreath, J. (2019) Drivers of Green Innovations: The Impact of Export Intensity, Women Leaders, and Absorptive Capacity. Journal of Business Ethics. 158 (1), Springer Netherlands, pp.47–61.
Gale, N.K. et al. (2013) Using the framework method for the analysis of qualitative data in multi-disciplinary health research. BMC Medical Research Methodology. 13 (1), pp.1–11.
Gallo, P.J. and Christensen, L.J. (2011) Firm Size Matters: An Empirical Investigation of Organizational Size and Ownership on Sustainability-Related Behaviors. Business & Society. 50 (2), pp.315–349.
Gandhi, N.S., Thanki, S.J. and Thakkar, J.J. (2018) Ranking of drivers for integrated lean-green manufacturing for Indian manufacturing SMEs. Journal of Cleaner Production. 171 (June 2008), Elsevier Ltd, pp.675–689.
Garbie, I. (2016) Sustainability in small and medium-sized manufacturing enterprises: An empirical study. Journal of Engineering Research. 13 (1), pp.42–57.
Garcia-Sabater, J.J. and Marin-Garcia, J.A. (2011) Can we still talk about continuous improvement? Rethinking enablers and inhibitors for successful implementation. International Journal of Technology Management. 55 (1), pp.28–42.

391
García-Sánchez, E., García-Morales, V.J. and Martín-Rojas, R. (2018) Influence of technological assets on organizational performance through absorptive capacity, organizational innovation and internal labour flexibility. Sustainability (Switzerland). 10 (3).
Garengo, P., Biazzo, S. and Bititci, U. (2005) Performance measurement systems in SMEs: A review for a research agenda. International Journal of Management Reviews. 7 (1), pp.25–47.
Garengo, P. and Bititci, U. (2007) Towards a contingency approach to performance measurement: An empirical study in Scottish SMEs. International Journal of Operations and Production Management. 27 (8), pp.802–825.
Garengo, P. and Sharma, M.K. (2014) Performance measurement system contingency factors: A cross analysis of Italian and Indian SMEs. Production Planning and Control. 25 (3), pp.220–240.
Garvare R. and Johansson P. (2010) Management for sustainability – A stakeholder theory. Total Quality Management & Business Excellence. 21 (7), pp.737–744.
Gaskin, J., & Lim, J. (2018). Multigroup analysis, AMOS Plugin. Gaskination’s StatWiki.
Gates, S. and Germain, C. (2010) Integrating sustainability measures into strategic performance measurement systems: An empirical study. Management Accounting Quarterly. 11 ((3)), pp.1–7.
Ghadge, A. et al. (2017) Implementing environmental practices within the Greek dairy supply chain Drivers and barriers for SMEs. Industrial Management and Data Systems. 117 (9), pp.1995–2014.
Ghadge, A. et al. (2020) Sustainability implementation challenges in food supply chains: a case of UK artisan cheese producers. Production Planning and Control. 0 (0), Taylor & Francis, pp.1–16.
Ghasemzadeh, P. et al. (2019) Moderating role of innovation culture in the relationship between organizational learning and innovation performance. Learning Organization. 26 (3), pp.289–303.
Ghazilla, R.A.R. et al. (2015a) Drivers and barriers analysis for green manufacturing practices in Malaysian smes: A preliminary findings. Procedia CIRP. 26, Elsevier B.V., pp.658–663.
Ghazilla, R.A.R. et al. (2015b) Drivers and barriers analysis for green manufacturing practices in Malaysian smes: A preliminary findings. Procedia CIRP. 26, Elsevier B.V., pp.658–663.
Ghazilla, R.A.R. et al. (2015c) Drivers and barriers analysis for green manufacturing practices in Malaysian smes: A preliminary findings. Procedia CIRP. 26, Elsevier B.V., pp.658–663.
Giang, M.H. et al. (2018) Impact of investment climate on total factor productivity of manufacturing firms in Vietnam. Sustainability (Switzerland). 10 (12), pp.1–18.
Gianni, M., Gotzamani, K. and Tsiotras, G. (2017) Multiple perspectives on integrated management systems and corporate sustainability performance. Journal of Cleaner Production. 168, Elsevier Ltd, pp.1297–1311.
392
Gimenez, C., Sierra, V. and Rodon, J. (2012a) Sustainable operations: Their impact on the triple bottom line. D. Huaccho Huatuco, Jairo Rafael Mo, L. (ed.) International Journal of Production Economics. 140 (1), Elsevier, pp.149–159.
Gimenez, C., Sierra, V. and Rodon, J. (2012b) Sustainable operations: Their impact on the triple bottom line. D. Huaccho Huatuco, Jairo Rafael Mo, L. (ed.) International Journal of Production Economics. 140 (1), Elsevier Ltd, pp.149–159.
Gimenez, C. and Tachizawa, E.M. (2012) Extending sustainability to suppliers: a systematic literature review. Supply Chain Management: An International Journal. 17 (5), pp.531–543.
Gioia, D.A., Corley, K.G. and Hamilton, A.L. (2013) Seeking Qualitative Rigor in Inductive Research: Notes on the Gioia Methodology. Organizational Research Methods. 16 (1), pp.15–31.
De Giovanni, P. (2012) Do internal and external environmental management contribute to the triple bottom line? International Journal of Operations & Production Management. 32 (3), pp.265–290.
Global Reporting Initiative (2015) Reporting Principles and Standard Disclosures Interpretations on the G4 Guidelines, issued by the Global Sustainability Standards Board, are located at the end of this document, and are to be considered by all users.
Goddard, J.U. et al. (2016) Implementing sustainability in small and medium-sized construction firms the role of absorptive capacity. Engineering, Construction and Architectural Management. 23 (4), pp.407–427.
Gold, S., Hahn, R. and Seuring, S. (2013) Sustainable supply chain management in ‘Base of the Pyramid’ food projects-A path to triple bottom line approaches for multinationals? International Business Review. 22 (5), pp.784–799.
Gong, M. et al. (2018) Inside out: The interrelationships of sustainable performance metrics and its effect on business decision making: Theory and practice. Resources, Conservation and Recycling. 128, Elsevier B.V., pp.155–166.
Govender, M. and Bussin, M.H.R. (2020) Performance management and employee engagement: A South African perspective. SA Journal of Human Resource Management. 18, pp.1–9.
Government of Vietnam 2001, Decree Number 90/2001/ND-CP issued 23 November 2001 on SME development support, Vietnamese Government, Hanoi.
Government of Vietnam 2009, Decree 56/2009/ND-CP issued 30 June 2009 on supports to SME development, Vietnamese Government.
Government of Vietnam 2014b, Enterprise Law 68/2014/QH13 issued 26 November 2014, Vietnamese Parliament, Hanoi.
Government of Vietnam 2014c, Environmental protection Law 55/2014/QH13 issued 23 June 2014, Vietnamese Parliament, Hanoi.
Government of Vietnam 2014d, Medical insurance Law 46/2014/QH13 issued 13 June 2014,
393
Vietnamese Parliament, Hanoi.
Government of Vietnam 2014e, Social insurance Law 58/2014/QH13 24 November 2014, Vietnamese Parliament, Hanoi.
Govindan, K. et al. (2014) Impact of supply chain management practices on sustainability. Journal of Cleaner Production. 85, Elsevier Ltd, pp.212–225.
Govindan, K. et al. (2015) Multi criteria decision making approaches for green supplier evaluation and selection: A literature review. Journal of Cleaner Production. 98, Elsevier Ltd, pp.66–83.
Govindan, K., Khodaverdi, R. and Jafarian, A. (2013) A fuzzy multi criteria approach for measuring sustainability performance of a supplier based on triple bottom line approach. Journal of Cleaner Production. 47, Elsevier Ltd, pp.345–354.
Goyannes, R. et al. (2018) Measurement of sustainability performance in Brazilian organizations. International Journal of Sustainable Development & World Ecology. 25 (4), Taylor & Francis, pp.312–326.
Graafland, J., Van de Ven, B. and Stoffele, N. (2003) Strategies and Instruments for Organising CSR by Small and Large Businesses in the Netherlands. Journal of Business Ethics. 47 (1), pp.45–60.
Granly, B.M. and Welo, T. (2014) EMS and sustainability: Experiences with ISO 14001 and Eco-Lighthouse in Norwegian metal processing SMEs. Journal of Cleaner Production. 64, Elsevier Ltd, pp.194–204.
Gray, D.E. (2014). Doing research in the real world, Third edn, SAGE Publications, London.
Greene, J.C. (2005) The generative potential of mixed methods inquiry. International Journal of Research and Method in Education. 28 (2), pp.207–211.
Greene, J.C., Caracelli, V.J. and Graham, W.F. (1989) Toward a Conceptual Framework for Mixed-Method Evaluation Designs. Educational Evaluation and Policy Analysis. 11 (3), pp.255–274.
Grigorescu, A. et al. (2020) Key drivers and skills needed for innovative companies focused on sustainability. Sustainability (Switzerland). 12 (1).
Gualandris, J., Golini, R. and Kalchschmidt, M. (2014) Do supply management and global sourcing matter for firm sustainability performance? Supply Chain Management: An International Journal. 19 (3), pp.258–274.
Gualandris, J. and Kalchschmidt, M. (2014) Customer pressure and innovativeness: Their role in sustainable supply chain management. Journal of Purchasing and Supply Management. 20 (2), pp.92–103.
Guba, E.G. and Lincoln, Y.S., 1994. Competing paradigms in qualitative research. Handbook of qualitative research, 2(163-194), p.105.
Gunasekaran, A. and Kobu, B. (2007) Performance measures and metrics in logistics and
394
supply chain management: A review of recent literature (1995-2004) for research and applications. International Journal of Production Research. 45 (12), pp.2819–2840.
Gustafson, D. et al. (2016) Seven food system metrics of sustainable nutrition security. Sustainability (Switzerland). 8 (3), pp.1–17.
Ha, L.T., Nam, P.X. and Thanh, T.T. (2021) Effects of Bribery on Firms’ Environmental Innovation Adoption in Vietnam: Mediating Roles of Firms’ Bargaining Power and Credit and Institutional Constraints. Ecological Economics. 185 (July 2020), Elsevier B.V., p.107042.
El Haddad, R., Karkoulian, S. and Nehme, R. (2019) The impact of 360 feedback appraisal system on organizational justice and sustainability: The mediating roles of gender and managerial levels. International Journal of Organizational Analysis. 27 (3), pp.712–728.
Hahn, T. et al. (2015) Advancing Research on Corporate Sustainability: Off to Pastures New or Back to the Roots? Business & Society. pp.1–31.
Hahn, T. et al. (2010) Trade offs in corporate sustainability: you can’t have your cake and eat it. Business Strategy and the Environment. 19 (4), pp.217–229.
Hahn, T. and Figge, F. (2011) Beyond the Bounded Instrumentality in Current Corporate Sustainability Research: Toward an Inclusive Notion of Profitability. Journal of Business Ethics. 104 (3), pp.325–345.
Hair, J.F., Black, W.C., Babin, B.J. & Anderson, R.E. (2019). Multivariate data analysis, Eighth edn, Cengage, Australia.
Hák, T., Moldan, B. and Dahl, A.L. (2007) Sustainablity Indicators. (April).
Halcomb, E.J. and Hickman, L. (2015) Mixed methods research. Nursing Standard: promoting excellence in nursing care. Nursing Standard: promoting excellence in nursing care. 29 (32), pp.41–47.
Han, Y. (2017) Predicting Intentions to Purchase Sustainable Apparel in China: A Structural Equation Modeling Approach. International Journal of Psychological Studies. 9 (2), p.53.
Harding, R. (2006) Ecologically sustainable development: Origins, implementation and challenges. Desalination. 187 (1–3), pp.229–239.
Harrison, R.L. and Reilly, T.M. (2011) Mixed methods designs in marketing research. Qualitative Market Research: An International Journal. 14 (1), pp.7–26.
Hasan, M.N. (2016) Measuring and understanding the engagement of Bangladeshi SMEs with sustainable and socially responsible business practices: An ISO 26000 perspective. Social Responsibility Journal. 12 (3), pp.584–610.
Hassini, E., Surti, C. and Searcy, C. (2012) A literature review and a case study of sustainable supply chains with a focus on metrics. International Journal of Production Economics. 140 (1), pp.69–82.
Hatak, I., Floh, A. and Zauner, A. (2015) Working on a dream: sustainable organisational change in SMEs using the example of the Austrian wine industry. Review of Managerial

395
Science. 9 (2), pp.285–315.
He, Q., Gallear, D., Ghobadian, A. and Ramanathan, R., (2019) Managing knowledge in supply chains: a catalyst to triple bottom line sustainability. Production Planning and Control. 30 (5–6), Taylor & Francis, pp.448–463.
Heng, T.B., Lee, C.L., Foong, Y.P. and San, O.T., (2012) A framework of a sustainable performance measurements (SPMs) model for the Malaysian electronic and electrical Industry. World Applied Sciences Journal. 20 (1), pp.107–119.
Heron, J. and Reason, P. (1997) Inquiry Paradigm. Qualitative Inquiry. 3 (3), pp.274–294.
Herr, H. and Nettekoven, Z.M. (2018) The role of small and medium-sized enterprises in development: What can be learned from the German experience? Global Labour University Working Paper. (53), p.32.
Hill, J., Nancarrow, C. and Tiu Wright, L. (2002) Lifecycles and crisis points in SMEs: a case approach. Marketing Intelligence & Planning. 20 (6), pp.361–369.
Hillary, R. (2004) Environmental management systems and the smaller enterprise. Journal of Cleaner Production. 12 (6), pp.561–569.
Hoang Tien, N. (2019) Conditions for the development of Vietnamese business and entrepreneurship in Poland. Science & Technology Development Journal - Economics - Law and Management. 3 (1), pp.37–45.
Hoepfl, M.C. (1997) Choosing Qualitative Research: A Primer for Technology Education Researchers. Journal of Technology Education. 9 (1), pp.47–63.
Hogevold, N.M. et al. (2015) A triple bottom line construct and reasons for implementing sustainable business practices in companies and their business networks. Corporate Governance. 15 (4), pp.427–443.
Høgevold, N.M. et al. (2015) A triple bottom line construct and reasons for implementing sustainable business practices in companies and their business networks. Corporate Governance. 15 (4), pp.427–443.
Hoogendoorn, B., Guerra, D. and van der Zwan, P. (2015) What drives environmental practices of SMEs? Small Business Economics. 44 (4), pp.759–781.
Hoque, A.S.M.M. and Awang, Z. Bin (2019) Does gender difference play moderating role in the relationship between entrepreneurial marketing and bangladeshi SME performance? Accounting. 5 (1), pp.35–52.
Hörisch, J., Freeman, R.E. and Schaltegger, S. (2014) Applying Stakeholder Theory in Sustainability Management. Organization & Environment. 27 (4), pp.328–346.
Horisch, J., Johnson, M.P. and Schaltegger, S. (2015) Implementation of Sustainability Management and Company Size: A Knowledge-Based View. Business Strategy and the Environment. 24 (8), pp.765–779.
Hossain, M. and Kauranen, I. (2016) Open innovation in SMEs: a systematic literature review.

396
Journal of Strategy and Management. 9 (1), pp.58–73.
Hosseininia, G. and Ramezani, A. (2016) Factors Influencing Sustainable Entrepreneurship in Small and Medium-Sized Enterprises in Iran: A Case Study of Food Industry. Sustainability. 8 (10), p.1010.
Hsu, C.H., Chang, A.Y. and Luo, W. (2017) Identifying key performance factors for sustainability development of SMEs – integrating QFD and fuzzy MADM methods. Journal of Cleaner Production. 161, Elsevier Ltd, pp.629–645.
Hsu, J.-L. and Cheng, M.-C. (2012) What Prompts Small and Medium Enterprises to Engage in Corporate Social Responsibility? A Study from Taiwan. Corporate Social Responsibility and Environmental Management. 19 (5), pp.288–305.
Hubbard, G. (2009) Measuring organizational performance: Beyond the triple bottom line. Business Strategy and the Environment. 18 (December 2006), pp.177–191.
Hudson, L.A. and Ozanne, J.L. (1988) Alternative Ways of Seeking Knowledge in Consumer Research. Journal of Consumer Research. 14 (4), pp.508–521.
Hudson, M., Smart, A. and Bourne, M. (2001) Theory and practice in SME performance measurement systems. International Journal of Operations & Production Management. 21 (8), pp.1096–1115.
Husgafvel, R. et al. (2014) Social metrics in the process industry: background, theory and development work. International Journal of Sustainable Engineering. 7 (2), pp.171–182.
Husted, B.W. (2000) A Contingency Theory of Corporate Social Performance. Business & Society. 39 (1), pp.24–48.
Hutchins, M.J. and Sutherland, J.W. (2008) An exploration of measures of social sustainability and their application to supply chain decisions. Journal of Cleaner Production. 16 (15), pp.1688–1698.
Hwang, B.G., Shan, M. and Lye, J.M. (2018) Adoption of sustainable construction for small contractors: major barriers and best solutions. Clean Technologies and Environmental Policy. 20 (10), Springer Berlin Heidelberg, pp.2223–2237.
Imbrogiano, J.P. (2020) Contingency in Business Sustainability Research and in the Sustainability Service Industry: A Problematization and Research Agenda. Organization and Environment.
Ingwersen, W. et al. (2014) Integrated metrics for improving the life cycle approach to assessing product system sustainability. Sustainability (Switzerland). 6 (3), pp.1386–1413.
International Energy Agency (2017) Key World Energy statistics.
Iraldo, F., Testa, F. and Frey, M. (2010) Environmental Management System and SMEs: EU Experience, Barriers and Perspectives Environmental Management. (June 2014).
Isaga, N., Masurel, E. and Van Montfort, K. (2015) Owner-manager motives and the growth of SMEs in developing countries. Journal of Entrepreneurship in Emerging Economies. 7 (3),

397
pp.190–211.
Isensee, C. et al. (2020) The relationship between organizational culture, sustainability, and digitalization in SMEs: A systematic review. Journal of Cleaner Production. 275, Elsevier Ltd, p.122944.
Ivankova, N. V., Creswell, J.W. and Stick, S.L. (2006a) Using Mixed-Methods Sequential Explanatory Design: From Theory to Practice. Field Methods. 18 (4), pp.1–8.
Ivankova, N. V, Creswell, J.W. and Stick, S.L. (2006b) Using mixed methods sequential explanatory design: From theory to practice. Field Methods. 18 (1), pp.3–20.
Jablin, F. and Putnam, L. (2001) The New Handbook of Organizational Communication 2455 Teller Road, Thousand Oaks California 91320 United States of America, SAGE Publications, Inc.
Jafari-Sadeghi, V. et al. (2020) Internationalisation business processes in an under-supported policy contexts: evidence from Italian SMEs. Business Process Management Journal. 26 (5), pp.1055–1074.
Jahanshahi, A.A., Brem, A. and Bhattacharjee, A. (2017) Who takes more sustainability-oriented entrepreneurial actions? The role of entrepreneurs’ values, beliefs and orientations. Sustainability (Switzerland). 9 (10).
Jamali, D. (2006) Insights into triple bottom line integration from a learning organization perspective. Business Process Management Journal. 12 (6), pp.809–821.
Jamali, D., Lund-Thomsen, P. and Jeppesen, S. (2017) SMEs and CSR in Developing Countries. Business & Society. 56 (1), pp.11–22.
Jamali, D., Lund-Thomsen, P. and Khara, N. (2017) CSR Institutionalized Myths in Developing Countries: An Imminent Threat of Selective Decoupling Business and Society. 56 (3).
Jamali, D. and Mirshak, R. (2007) Corporate Social Responsibility (CSR): Theory and practice in a developing country context. Journal of Business Ethics. 72 (3), pp.243–262.
Jarvenpaa, S.L. and Ives, B. (1991) Executive involvement and participation in the management of information technology. MIS Quarterly: Management Information Systems. 15 (2), pp.205–223.
Jenkins, H. (2009) A ‘business opportunity’ model of corporate social responsibility for small- and medium-sized enterprises. Business Ethics-a European Review. 18 (1), pp.21–36.
Jenkins, H. (2004) A Critique of Conventional CSR Theory: An SME Perspective. Journal of General Management. 29 (4), pp.37–57.
Jenkins, H. (2006) Small business champions for corporate social responsibility. Journal of Business Ethics. 67 (3), pp.241–256.
Jeppesen, S. et al. (2012) Corporate Social Responsibility and Competitiveness for SMEs in Developing Countries : South Africa and Vietnam to the Final report ) Submitted by with Soeren Jeppesen ( Copenhagen Business School ), Bas Kothuis ( Global Corporate Consultancy
398
) and Angie.
Jia, F. et al. (2018) Sustainable supply chain management in developing countries : An analysis of the literature. Journal of Cleaner Production. 189, Elsevier Ltd, pp.263–278.
Jiang, Q. et al. (2018) A principal component analysis based three-dimensional sustainability assessment model to evaluate corporate sustainable performance. Journal of Cleaner Production. 187, Elsevier Ltd, pp.625–637.
Jiang, Y., Ritchie, B.W. and Verreynne, M.L. (2021) Building dynamic capabilities in tourism organisations for disaster management: enablers and barriers. Journal of Sustainable Tourism. 0 (0), Routledge, pp.1–26.
Jick, T.D. (1979) Mixing Qualitative and Quantitative Methods : Triangulation in Action. Administrative Science Quarterly. 24 (4), pp.602–611.
Johnson, M.P. (2017) Knowledge acquisition and development in sustainability-oriented small and medium-sized enterprises: Exploring the practices, capabilities and cooperation. Journal of Cleaner Production. 142, Elsevier Ltd, pp.3769–3781.
Johnson, M.P. (2015) Sustainability Management and Small and Medium-Sized Enterprises: Managers’ Awareness and Implementation of Innovative Tools. Corporate Social Responsibility and Environmental Management. 22 (5), pp.271–285.
Johnson, M.P. and Schaltegger, S. (2016) Two Decades of Sustainability Management Tools for SMEs: How Far Have We Come? Journal of Small Business Management. 54 (2), pp.481–505.
Johnson, R. and Onwuegbuzie, A. (2004) Mixed methods research: A research paradigm whose time has come. Educational Researcher. 33 (7), pp.14–26.
Jonker, J. and Pennink, B.W. (2009) The essence of research methodology: A concise guide for master and PhD students in management science The Essence of Research Methodology: A Concise Guide for Master and PhD Students in Management Science. Berlin, Heidelberg, Springer Berlin Heidelberg.
Jonsen, K., Fendt, J. and Point, S. (2018) Convincing Qualitative Research: What Constitutes Persuasive Writing? Organizational Research Methods. 21 (1), pp.30–67.
José Tarí, J. and Molina‐Azorín, J.F. (2010) Integration of quality management and environmental management systems. Karapetrovic, S. (ed.) The TQM Journal. 22 (6), pp.687–701.
Joung, C.B. et al. (2013) Categorization of indicators for sustainable manufacturing. Ecological Indicators. 24, Elsevier Ltd, pp.148–157.
Jugder, N. (2016) The thematic analysis of interview data: an approach used to examine the influence of the market on curricular provision in Mongolian higher education institutions. Hillary Place Papers. 3rd Editio (Jan 2016).
Kadiresan, V. et al. (2016) HR Practices and organizational commitment among SME employees which leads to retentionIn: Proceedings of the International Conference on
399
Industrial Engineering and Operations Management. 8-10 March, 2472–2479.
Kaler, J. (2006) Evaluating stakeholder theory. Journal of Business Ethics. 69 (3), pp.249–268.
Kallmuenzer, A. et al. (2017) Trade-offs between dimensions of sustainability: exploratory evidence from family firms in rural tourism regions. Journal of Sustainable Tourism. 9582 (November), Taylor & Francis, pp.1–18.
Kane, L.V. et al. (2021) Corporate social responsibility in Vietnam: views from corporate and NGO executives. Social Responsibility Journal.
Kantabutra, S. (2014) Measuring corporate sustainability: A thai approach. Measuring Business Excellence. 18 (2), pp.73–88.
Karell, E. and Kirsi, N. (2020) A Mixed-Method Study of Design Practices and Designers ’ Roles in Sustainable-Minded Clothing Companies.
Kaufmann, L. and Saw, A.A. (2014) Using a multiple-informant approach in SCM research. International Journal of Physical Distribution and Logistics Management. 44 (6), pp.511–527.
Keerthika, D. and Alagarsamy, S. (2018) A Multiple Measure of Organizational Performances and its Effect on Distinctive Marketing Competencies : An Empirical Study of India and the Maldives. Journal of Management and Marketing Review. 3 (3), pp.129–142.
Ketprapakorn, N. and Kantabutra, S. (2019) Culture development for sustainable SMEs: Toward a behavioral theory. Sustainability (Switzerland). 11 (9).
Khadka, C. and Vacik, H. (2012) Comparing a top-down and bottom-up approach in the identification of criteria and indicators for sustainable community forest management in Nepal. Forestry. 85 (1), pp.145–158.
Khurana, S., Haleem, A. and Mannan, B. (2019) Determinants for integration of sustainability with innovation for Indian manufacturing enterprises: Empirical evidence in MSMEs. Journal of Cleaner Production. 229, Elsevier Ltd, pp.374–386.
Kim, C. and Lee, J. (2018) The effect of network structure on performance in South Korea SMEs: The moderating effects of absorptive capacity. Sustainability (Switzerland). 10 (9).
Kim, J. et al. (2015) Measures of perceived sustainability. Journal of Global Scholars of Marketing Science. 25 (2), pp.182–193.
Kim, Y. (2011) The Pilot Study in Qualitative Inquiry: Identifying Issues and Learning Lessons for Culturally Competent Research. Qualitative Social Work. 10 (2), pp.190–206.
Kline, R.B., (2011). Principles and Practice of Structural Equation Modeling. Guilford Press, NY.
Klewitz, J. and Hansen, E.G. (2014) Sustainability-oriented innovation of SMEs: A systematic review. Journal of Cleaner Production. 65, Elsevier Ltd, pp.57–75.
Klewitz, J., Zeyen, A. and Hansen, E.G. (2012) Intermediaries driving eco-innovation in SMEs: A qualitative investigation. European Journal of Innovation Management. 15 (4),
400
pp.442–467.
Kloviene, L. and Speziale, M.-T. (2015) Is Performance Measurement System Going Towards Sustainability in SMEs? Procedia - Social and Behavioral Sciences. 213, pp.328–333.
Klovienė, L. and Speziale, M.T. (2015) Sustainability Reporting as a Challenge for Performance Measurement: Literature Review. Economics and Business. 26, p.44.
Kock, M. De (2013) Ontology and a Mixed Methods Epistemology in Applied Research. pp.170–177.
Kocmanova, A. and Docekalova, M. (2011) Corporate Sustainability : Environmental, Social, Economic, and Corporate Performance. LIX (7), pp.203–208.
Koirala, S. (2019) SMEs: Key Drivers of Green and Inclusive Growth. OECD Green Growth Papers. (March), pp.1–55.
Kor, Y.Y. (2003) Experience-Based Top Management Team Competence and Sustained Growth. Organization Science. 14 (6), pp.707–719.
Krajnc, D. and Glavic, P. (2003) Indicators of sustainable production. Clean Technologies and Environmental Policy. 5 (3–4), pp.279–288.
Krauss, S.E. and Putra, U. (2005) Research Paradigms and Meaning Making : A Primer. The Qualitative Report. 10 (4), pp.758–770.
Kucharčíková, A., Mičiak, M. and Hitka, M. (2018) Evaluating the effectiveness of investment in human capital in e-business enterprise in the context of sustainability. Sustainability (Switzerland). 10 (9).
Kucharska, W. and Kowalczyk, R. (2019) How to achieve sustainability?—Employee’s point of view on company’s culture and CSR practice. Corporate Social Responsibility and Environmental Management. 26 (2), pp.453–467.
Kucharska, W. and Kowalczyk, R. (2016) Trust, collaborative culture and tacit knowledge sharing in project management: A relationship model. In: Proceedings of the 13th International Conference on Intellectual Capital, Knowledge Management & Organizational Learning. 2016, pp.159–166.
Kuckertz, A. and Wagner, M. (2010) The influence of sustainability orientation on entrepreneurial intentions - Investigating the role of business experience. Journal of Business Venturing. 25 (5), Elsevier Inc., pp.524–539.
Küçükbay, F. and Sürücü, E. (2019) Corporate sustainability performance measurement based on a new multicriteria sorting method. Corporate Social Responsibility and Environmental Management. 26 (3), pp.664–680.
Kumar, M. and Antony, J. (2008) Comparing the quality management practices in UK SMEs. Industrial Management & Data Systems. 108 (9), pp.1153–1166.
Kumar, P. et al. (2018) Environmental management and corporate social responsibility practices of small and medium-sized enterprises. Journal of Cleaner Production. 195, Elsevier

401
Ltd, pp.687–702.
Kumar, R., Singh, R.K. and Dwivedi, Y.K. (2020) Application of industry 4.0 technologies in SMEs for ethical and sustainable operations: Analysis of challenges. Journal of Cleaner Production. 275, Elsevier Ltd, p.124063.
Kundurpi, A. et al. (2021) Navigating between adaptation and transformation: How intermediaries support businesses in sustainability transitions. Journal of Cleaner Production. 283, Elsevier Ltd, p.125366.
Kurka, T. and Blackwood, D. (2013) Participatory selection of sustainability criteria and indicators for bioenergy developments. Renewable and Sustainable Energy Reviews. 24, Elsevier, pp.92–102.
Kwahk, K.Y., Yang, S.B. and Ahn, H. (2020) How organizational citizenship behavior affects ERP usage performance: The mediating effect of absorptive capacity. Sustainability (Switzerland). 12 (11), pp.1–20.
De La Torre, A. and Agabriel, J. (2017) Prendre en compte l’efficience alimentaire des vaches allaitantes dans les recommandations alimentaires à travers la quantification de leurs dépenses non productives. Productions Animales. 30 (2), pp.153–164.
Laforet, S. (2016) Effects of organisational culture on organisational innovation performance in family firms. Journal of Small Business and Enterprise Development. 23 (2), pp.379–407.
Lähtinen, K. et al. (2014) A systematic literature review on indicators to assess local sustainability of forest energy production. Renewable and Sustainable Energy Reviews. 40, Elsevier, pp.1202–1216.
Lam, L. et al. (2021) The relation among organizational culture, knowledge management, and innovation capability: Its implication for open innovation. Journal of Open Innovation: Technology, Market, and Complexity. 7 (1), pp.1–16.
Langwell, C. and Heaton, D. (2016) Using human resource activities to implement sustainability in SMEs. Journal of Small Business and Enterprise Development. 23 (3), pp.652–670.
Lappalainen, P. et al. (2019) Managing performance through employee attributes: implications for employee engagement. International Journal of Productivity and Performance Management. 69 (9), pp.2119–2137.
Lara, F.J. and Salas-Vallina, A. (2017) Managerial competencies, innovation and engagement in SMEs: The mediating role of organisational learning. Journal of Business Research. 79 (February), Elsevier, pp.152–160.
Larrán Jorge, M. et al. (2015) Competitiveness and environmental performance in Spanish small and medium enterprises: is there a direct link? Journal of Cleaner Production. 101, pp.26–37.
Laskar, N. and Maji, S.G. (2016) Corporate sustainability reporting practices in India: myth or reality? Social Responsibility Journal. 12 (4), pp.625–641.
402
Laurinkeviciute, A. and Stasiskiene, Z. (2011) SMS for decision making of SMEs. Clean Technologies and Environmental Policy. 13 (6), pp.797–807.
Lawrence, S.R. et al. (2006) Sustainability practices of SMEs: The case of NZ. Business Strategy and the Environment. 15 (4), pp.242–257.
Le, T.D. and Kieu, T.A. (2019) Ethically minded consumer behaviour in Vietnam: An analysis of cultural values, personal values, attitudinal factors and demographics. Asia Pacific Journal of Marketing and Logistics. 31 (3), pp.609–626.
Lee, J.Y., Rocco, T.S. and Shuck, B. (2020) What Is a Resource: Toward a Taxonomy of Resources for Employee Engagement. Human Resource Development Review. 19 (1), pp.5–38.
Lee, K. (2009) Why and how to adopt green management into business organizations? Dwyer, R. (ed.) Management Decision. 47 (7), pp.1101–1121.
Lee, K.H., Herold, D.M. and Yu, A.L. (2016) Small and Medium Enterprises and Corporate Social Responsibility Practice: A Swedish Perspective. Corporate Social Responsibility and Environmental Management. 23 (2), pp.88–99.
Lee, S. and Torm, N. (2017) Social security and firm performance: The case of Vietnamese SMEs. International Labour Review. 156 (2), pp.185–212.
Lee, Y. (2021) Linking internal CSR with the positive communicative behaviors of employees: the role of social exchange relationships and employee engagement. Social Responsibility Journal. (December).
Lenzen, M., Dey, C.J. and Murray, S.A. (2004) Historical accountability and cumulative impacts: The treatment of time in corporate sustainability reporting. Ecological Economics. 51 (3–4), pp.237–250.
Leonidou, L.C. et al. (2017) Internal Drivers and Performance Consequences of Small Firm Green Business Strategy: The Moderating Role of External Forces. Journal of Business Ethics. 140 (3), Springer Netherlands, pp.585–606.
Lewis, K. V., Cassells, S. and Roxas, H. (2015) SMEs and the Potential for A Collaborative Path to Environmental Responsibility. Business Strategy and the Environment. 24 (8), pp.750–764.
Li, S. and Rees, C.J. (2020) Determinants of the formalization of human resource management practices: An empirical study in SMEs in eastern and western China. Journal of Small Business Management. 00 (00), Routledge, pp.1–21.
Li, S.X. and Sandino, T. (2018) Effects of an Information Sharing System on Employee Creativity, Engagement, and Performance. Journal of Accounting Research. 56 (2), pp.713–747.
Li, T. et al. (2012) A PCA-based method for construction of composite sustainability indicators. International Journal of Life Cycle Assessment. 17 (5), pp.593–603.
Liao, S.H., Chen, C.C., Hu, D.C., Chung, Y.C. and Yang, M.J., (2017) Developing a

403
sustainable competitive advantage: absorptive capacity, knowledge transfer and organizational learning. Journal of Technology Transfer. 42 (6), Springer US, pp.1431–1450.
Liao, J., Welsch, H. and Stoica, M., (2003). Organizational absorptive capacity and responsiveness: An empirical investigation of growth–oriented SMEs. Entrepreneurship Theory and practice, 28(1), pp.63-86.
Liu, X. and Anbumozhi, V. (2009) Determinant factors of corporate environmental information disclosure: an empirical study of Chinese listed companies. Journal of Cleaner Production. 17 (6), Elsevier Ltd, pp.593–600.
Lopes, C.M., Scavarda, A., Hofmeister, L.F., Thomé, A.M.T. and Vaccaro, G.L.R., (2017) An analysis of the interplay between organizational sustainability, knowledge management, and open innovation. Journal of Cleaner Production. 142, pp.476–488.
Lopez-Perez, M.E., Melero, I. and Javier Sese, F. (2017) Management for Sustainable Development and Its Impact on Firm Value in the SME Context: Does Size Matter? Business Strategy and the Environment. 26 (7), pp.985–999.
Lozano, R. (2015) A Holistic Perspective on Corporate Sustainability Drivers: A holistic perspective on corporate sustainability drivers. Corporate Social Responsibility and Environmental Management. 22 (1), pp.32–44.
Luu, T.T. (2017) CSR and organizational citizenship behavior for the environment in hotel industry: The moderating roles of corporate entrepreneurship and employee attachment style. International Journal of Contemporary Hospitality Management. 29 (11), pp.2867–2900.
Malesios, C. (2018) Supply chain sustainability performance measurement of small and medium sized enterprises using structural equation modeling. Annals of Operations Research. Springer US.
Mangan, J., Lalwani, C. and Gardner, B. (2004) Combining quantitative and qualitative methodologies in logistics research. International Journal of Physical Distribution & Logistics Management. 34 (7), pp.565–578.
Maxwell, J.A. and Mittapalli, K. (2010) Realism as a Stance for Mixed Methods Research final. SAGE Handbook of Mixed Methods in Social and Behavioural Research. pp.145–167.
McKim, C.A. (2017) The Value of Mixed Methods Research: A Mixed Methods Study. Journal of Mixed Methods Research. 11 (2), pp.202–222.
Meissner, H. (2011) Best Practices for Mixed Methods Research in the Health Sciences. Methods. 29, pp.1–39.
Mertens, D.M. and Hesse-Biber, S. (2012) Triangulation and Mixed Methods Research: Provocative Positions. Journal of Mixed Methods Research. 6 (2), pp.75–79.
Molina-Azorin, J.F. (2012) Mixed methods research in strategic management: Impact and applications. Organizational Research Methods. 15 (1), pp.33–56.
Montiel, I. and Delgado-Ceballos, J. (2014) Defining and Measuring Corporate Sustainability: Are We There Yet? Organization & Environment. 27 (2), pp.113–139.
404
Mullen, M.R., Budeva, D.G. and Doney, P.M. (2009) A Critical Review with Recommendations. Journal of Small Business Management. 47 (823), pp.287–307.
Muñoz-Pascual, L., Curado, C. and Galende, J. (2019) The triple bottom line on sustainable product innovation performance in SMEs: A mixed methods approach. Sustainability (Switzerland). 11 (6).
Nguyen, H.D., Nguyen, L.D., Chih, Y.Y. and Le-Hoai, L., (2017) Influence of Participants’ Characteristics on Sustainable Building Practices in Emerging Economies: Empirical Case Study. Journal of Construction Engineering and Management. 143 (8), p.05017014.
Nguyen, P. V. and Tran, K.T. (2020) Explicating energy saving intention from the prospect of small medium enterprises. Entrepreneurship and Sustainability Issues. 8 (2), pp.716–734.
Nguyen, T.L. (2019) STEAM-ME: A Novel Model for Successful Kaizen Implementation and Sustainable Performance of SMEs in Vietnam. Complexity. 2019.
Nielsen, B.B. and Raswant, A. (2018) The selection , use , and reporting of control variables in international business research : A review and recommendations. Journal of World Business. 53 (6), Elsevier, pp.958–968.
O’Cathain, A., Murphy, E. and Nicholl, J. (2007) Why, and how, mixed methods research is undertaken in health services research in England: A mixed methods study. BMC Health Services Research. 7, pp.1–11.
O’Regan, N., Sims, M. and Ghobadian, A. (2005) High performance: ownership and decision‐making in SMEs. Management Decision. 43 (3), pp.382–396.
Obeng, B.A. (2019) Strategic networking and small firm growth in an emerging economy. Journal of Small Business and Enterprise Development. 26 (1), pp.43–66.
Panwar, R., Nybakk, E., Hansen, E. and Pinkse, J., (2016) The effect of small firms’ competitive strategies on their community and environmental engagement. Journal of Cleaner Production. 129, Elsevier Ltd, pp.578–585.
Parisi, C. (2013) The impact of organisational alignment on the effectiveness of firms’ sustainability strategic performance measurement systems: An empirical analysis. Journal of Management and Governance. 17 (1), pp.71–97.
Pham, H. and Kim, S. (2019) The effects of sustainable practices and managers ’ leadership competences on sustainability performance of construction firms. Sustainable Production and Consumption. 20, Elsevier B.V., pp.1–14.
Pham, H., Yong, S. and Truong, K. (2019) Managerial perceptions on barriers to sustainable construction in developing countries : Vietnam case. Environment, Development and Sustainability. (0123456789), Springer Netherlands.
Phan, U.H., Nguyen, P.V., Mai, K.T. and Le, T.P., (2015) Key Determinants of SMEs in Vietnam. Combining Quantitative and Qualitative Studies. Review of European Studies. 7 (11), pp.359–375.
Powell, M. and Ansic, D. (1997) Gender differences in risk behaviour in financial decision-
405
making: An experimental analysis. Journal of Economic Psychology. 18 (6), pp.605–628.
Proctor, S. (1998) Linking philosophy and method in the research process: the case for realism. Nurse Researcher. 5 (4), pp.73–90.
Punzo, G., Panarello, D., Pagliuca, M.M., Castellano, R. and Aprile, M.C., (2019) Assessing the role of perceived values and felt responsibility on pro-environmental behaviours: A comparison across four EU countries. Environmental Science & Policy. 101 (September), Elsevier, pp.311–322.
Qorri, A., Mujkić, Z. and Kraslawski, A. (2018) A conceptual framework for measuring sustainability performance of supply chains. Journal of Cleaner Production. 189, pp.570–584.
Rao, P., la O'Castillo, O., Intal Jr, P.S. and Sajid, A., (2006) Environmental indicators for small and medium enterprises in the Philippines: An empirical research. Journal of Cleaner Production. 14 (5), pp.505–515.
Roxas, B. (2021) Environmental sustainability engagement of firms: The roles of social capital, resources, and managerial entrepreneurial orientation of small and medium enterprises in Vietnam. Business Strategy and the Environment. (January), pp.2194–2208.
Roxas, B. and Chadee, D. (2012) Environmental sustainability orientation and financial resources of small manufacturing firms in the Philippines. Social Responsibility Journal. 8 (2), pp.208–226.
Russo, A. and Tencati, A. (2009) Formal vs. informal CSR strategies: Evidence from italian micro, small, medium-sized, and large firms. Journal of Business Ethics. 85 (SUPPL. 2), pp.339–353.
Saad, M., Kumar, V. and Bradford, J. (2017) An investigation into the development of the absorptive capacity of manufacturing SMEs. International Journal of Production Research. 55 (23), Taylor & Francis, pp.6916–6931.
Saeed, A. et al. (2018) Institutional pressures, green supply chain management practices on environmental and economic performance: A two theory view. Sustainability (Switzerland). 10 (5), pp.1–24.
Sajan, M.P. et al. (2017) Lean manufacturing practices in Indian manufacturing SMEs and their effect on sustainability performance. Journal of Manufacturing Technology Management. 28 (6), pp.772–793.
Santiago-Brown, I. et al. (2015) What Does Sustainability Mean? Knowledge Gleaned From Applying Mixed Methods Research to Wine Grape Growing. Journal of Mixed Methods Research. 9 (3), pp.232–251.
Saunders, M.N.K., Lewis, P. & Thornhill, A. (2019). Research methods for business students, Eighth edn, Pearson, Boston.
Scotland, J. (2012) Exploring the philosophical underpinnings of research: Relating ontology and epistemology to the methodology and methods of the scientific, interpretive, and critical research paradigms. English Language Teaching. 5 (9), pp.9–16.
406
Searcy, C. (2011) Updating corporate sustainability performance measurement systems. Measuring Business Excellence. 15 (2), pp.44–56.
Shevchenko, A., Lévesque, M. and Pagell, M. (2016) Why Firms Delay Reaching True Sustainability. Journal of Management Studies. 53 (5), pp.911–935.
Simonette, M.J. et al. (2008) Efetividade Do Processo De Comunicação Com Base Na Teoria Do Comportamento Informacional: O Caso De Um Organismo Internacional Da Área Da Saúde Pública Sediado No Brasil. Systems Research and Behavioral Science. 8 (3), pp.27–42.
Singh, M., Brueckner, M. and Padhy, P.K. (2014) Insights into the state of ISO14001 certification in both small and medium enterprises and industry best companies in India: The case of Delhi and Noida. Journal of Cleaner Production. 69, Elsevier Ltd, pp.225–236.
Singh, V., Chauhan, S.C. and Tejyan, S. (2017) Greenhouse gas emission reduction potentials in air transport: a structural equation modelling-based multi-group analysis. Technology Analysis and Strategic Management. 29 (4), Taylor & Francis, pp.442–461.
Singh, V. and Sharma, S.K. (2016) Analyzing the moderating effects of respondent type and experience on the fuel efficiency improvement in air transport using structural equation modeling. European Transport Research Review. 8 (2), European Transport Research Review.
Sommer, C. (2017) Drivers and Constraints for Adopting Sustainability Standards in Small and Medium-sized Enterprises (SMEs). German Development Institute. p.73.
Spector, P.E. and Brannick, M.T. (2011) Methodological urban legends: The misuse of statistical control variables. Organizational Research Methods. 14 (2), pp.287–305.
Stubblefield Loucks, E., Martens, M.L. and Cho, C.H. (2010) Engaging small‐ and medium‐sized businesses in sustainability. Dillard, J. (ed.) Sustainability Accounting, Management and Policy Journal. 1 (2), pp.178–200.
Tran, N.M. and Pham, B.N.T. (2020) The influence of CEO characteristics on corporate environmental performance of SMEs: Evidence from Vietnamese SMEs. Management Science Letters. 10 (8), pp.1671–1682.
Tran, T., Deng, H. and Ong, C.E. (2019) Critical Factors for the Adoption of Social Sustainability Practices in Vietnamese Handicraft OrganizationsIn: 2018 IEEE Conference on e-Learning, e-Management and e-Services, IC3e 2018. 122–127.
Trianni, A., Cagno, E. and Farné, S. (2016) Barriers, drivers and decision-making process for industrial energy efficiency: A broad study among manufacturing small and medium-sized enterprises. Applied Energy. 162, Elsevier Ltd, pp.1537–1551.
Tur-Porcar, A., Roig-Tierno, N. and Mestre, A.L. (2018) Factors affecting entrepreneurship and business sustainability. Sustainability (Switzerland). 10 (2), pp.1–12.
Turner, S.F., Cardinal, L.B. and Burton, R.M. (2017) Research Design for Mixed Methods: A Triangulation-based Framework and Roadmap. Organizational Research Methods. 20 (2), pp.243–267.
Venkatesh, V., Brown, S.A. and Sullivan, Y.W. (2016) Guidelines for conducting mixed-
407
methods research: An extension and illustration. Journal of the Association of Information Systems. 17 (7), pp.435–495.
Vu, T.H., Nguyen, V.D., Ho, M.T. and Vuong, Q.H., (2019) Determinants of Vietnamese Listed Firm Performance: Competition, Wage, CEO, Firm Size, Age, and International Trade. Journal of Risk and Financial Management. 12 (2), p.62.
Wahyuni, D. (2012) The research design maze: Understanding paradigms, cases, methods and methodologies. Journal of applied management accounting research. 10 (1), pp.69–80.
Woods, M. (2011) Interviewing for research and analysing qualitative data : An overview. School of Humanities and Social Sciences, Massey University. pp.1–8.
Yu, W. et al. (2018) Operations capability, productivity and business performance the moderating effect of environmental dynamism. Industrial Management and Data Systems. 118 (1), pp.126–143.
Yu, W. and Ramanathan, R. (2016) Environmental management practices and environmental performance the roles of operations and marketing capabilities. Industrial Management and Data Systems. 116 (6), pp.1201–1222.
Yusoff, H., Jamal, A.D.A. and Darus, F. (2016) Corporate governance and corporate social responsibility disclosure: An Emphasis on the CSR key dimensions. Journal of Accounting and Auditing: Research & Practice. 2016 (1), pp.1–14.
Lincoln, Y. S., & Guba, E. G. (2000). Paradigmatic controversies, contradictions, and emerging confluences. In Edited by: N. K. Denzin & Y. S. Lincoln (Eds.), Handbook of qualitative research (5th ed). Thousand Oaks, CA: Sage.
Liu, X. and Anbumozhi, V. (2009) Determinant factors of corporate environmental information disclosure: an empirical study of Chinese listed companies. Journal of Cleaner Production. 17 (6), Elsevier Ltd, pp.593–600.
Lo, S. and Sheu, H. (2007) Is Corporate Sustainability a Value-Increasing Strategy for Business ? Is Corporate Sustainability a Value- Increasing Strategy for Business ? Corporate Governance An International Review. 15 (February), pp.345–358.
Lopes, C.M. et al. (2017) An analysis of the interplay between organizational sustainability, knowledge management, and open innovation. Journal of Cleaner Production. 142, pp.476–488.
Lopes de Sousa Jabbour, A.B., Ndubisi, N.O. and Roman Pais Seles, B.M. (2020) Sustainable development in Asian manufacturing SMEs: Progress and directions. International Journal of Production Economics. 225 (November 2019), Elsevier B.V., p.107567.
Lopez-Perez, M.E., Melero, I. and Javier Sese, F. (2017) Management for Sustainable Development and Its Impact on Firm Value in the SME Context: Does Size Matter? Business Strategy and the Environment. 26 (7), pp.985–999.
Lourenco, I.C. et al. (2012) How Does the Market Value Corporate Sustainability Performance? Journal of Business Ethics. 108 (4), pp.417–428.
408
Lozano, J.M. (2005) Towards the relational corporation: from managing stakeholder relationships to building stakeholder relationships (waiting for Copernicus). Corporate Governance. 5 (2), pp.60–77.
Lozano, R. (2015) A Holistic Perspective on Corporate Sustainability Drivers: A holistic perspective on corporate sustainability drivers. Corporate Social Responsibility and Environmental Management. 22 (1), pp.32–44.
Lucato, W.C., Costa, E.M. and de Oliveira Neto, G.C. (2017) The environmental performance of SMEs in the Brazilian textile industry and the relationship with their financial performance. Journal of Environmental Management. 203, Elsevier Ltd, pp.550–556.
Lundin, M. (2002) Indicators for measuring the sustainability of urban water: A life cycle approach. pp.27–37.
Luu, T.T. (2017) CSR and organizational citizenship behavior for the environment in hotel industry: The moderating roles of corporate entrepreneurship and employee attachment style. International Journal of Contemporary Hospitality Management. 29 (11), pp.2867–2900.
Luu, T.T. (2016) The chain effect from human resource-based clinical governance through emotional intelligence and CSR to knowledge sharing. Knowledge Management Research and Practice. 14 (1), pp.126–143.
Maas, K., Schaltegger, S. and Crutzen, N. (2016) Advancing the integration of corporate sustainability measurement, management and reporting. Journal of Cleaner Production. 133, Elsevier Ltd, pp.859–862.
Mabhungu, I. and Van Der Poll, B. (2017) A Review of Critical Success Factors Which Drives the Performance of Micro, Small and Medium Enterprises. International Journal of Business and Management. 12 (6), p.151.
Magolda, P. (2000) Being at the wrong place, wrong time. Theory into practice. 39 (July 2015), pp.138–145.
Mahmood, Z. et al. (2019) Drivers and Barriers of Sustainability Practices in Emerging and Developing Economies. Journal of Business and Social Review in Emerging Economies. 5 (1), pp.213–222.
Mahmud, M., Soetanto, D. and Jack, S. (2021) A contingency theory perspective of environmental management:Empirical evidence from entrepreneurial firms. Journal of General Management.
Malesios, C. (2018) Supply chain sustainability performance measurement of small and medium sized enterprises using structural equation modeling. Annals of Operations Research. Springer US.
Malesios, C. et al. (2020a) Sustainability performance analysis of small and medium sized enterprises: Criteria, methods and framework. Socio-Economic Planning Sciences. 75 (October 2020), Elsevier Ltd, p.100993.
Malesios, C. et al. (2020b) Sustainability performance analysis of small and medium sized enterprises: Criteria, methods and framework. Socio-Economic Planning Sciences. 75
409
(November 2020), Elsevier Ltd, p.100993.
Malesios, C. et al. (2018) The impact of SME sustainability practices and performance on economic growth from a managerial perspective: Some modeling considerations and empirical analysis results. Business Strategy and the Environment. 27 (7), pp.960–972.
Mangan, J., Lalwani, C. and Gardner, B. (2004) Combining quantitative and qualitative methodologies in logistics research. International Journal of Physical Distribution & Logistics Management. 34 (7), pp.565–578.
Manning, B., Braam, G. and Reimsbach, D. (2019) Corporate governance and sustainable business conduct—Effects of board monitoring effectiveness and stakeholder engagement on corporate sustainability performance and disclosure choices. Corporate Social Responsibility and Environmental Management. 26 (2), pp.351–366.
Mansi, M. (2015) Sustainable procurement disclosure practices in central public sector enterprises: Evidence from India. Journal of Purchasing and Supply Management. 21 (2), Elsevier, pp.125–137.
Manuj, I. and Mentzer, J.T. (2008) Global supply chain risk management strategies. International Journal of Physical Distribution and Logistics Management. 38 (3), pp.192–223.
Markley, M.J. and Davis, L. (2007) Exploring future competitive advantage through sustainable supply chains. International Journal of Physical Distribution & Logistics Management. 37 (9), pp.763–774.
van Marrewijk, M. (2003) Concepts and definitions of CSR and corporate sustainability: Between agency and communion. Journal of Business Ethics. 44 (2), pp.95–105.
Marrewijk, M. Van and Werre, M. (2002) Multiple levels of corporate sustainability. Journal of Business Ethics. (Out), pp.1–12.
Marshall, M. (1996) The key informant technique. Family Practice. 13 (1), pp.92–97.
Martins, A.A. et al. (2007) Framework for sustainability metrics. Industrial and Engineering Chemistry Research. 46 (10), pp.2962–2973.
Masood, F., Soomro, S. and Ali, A. (2018) State of Growth Barriers of SMEs in Pakistan: A Review based on Empirical and Theoretical Models. NICE Research Journal. pp.158–182.
Massa, L., Farneti, F. and Scappini, B. (2015) Developing a sustainability report in a small to medium enterprise: process and consequences. Meditari Accountancy Research. 23 (1), pp.62–91.
Masurel, E. (2007) Why SMEs invest in environmental measures: Sustainability evidence from small and medium-sized printing firms. Business Strategy and the Environment. 16 (3), pp.190–201.
Maxwell, J.A. and Mittapalli, K. (2010) Realism as a Stance for Mixed Methods Research final. SAGE Handbook of Mixed Methods in Social and Behavioural Research. pp.145–167.
McAdam, R., Miller, K. and McSorley, C. (2019) Towards a contingency theory perspective

410
of quality management in enabling strategic alignment. International Journal of Production Economics. 207, Elsevier B.V., pp.195–209.
Mcgorry, S.Y. (2000) Measurement in a cross-cultural environment: Survey translation issues. Qualitative Market Research: An International Journal. 3 (2), pp.74–81.
McIntyre, R. (2001) The Role of Small and Medium Enterprises in Transition: Growth and Entrepreneurship World Institute for Development Economics Research. (49).
McKeiver, C. and Gadenne, D. (2005) Environmental management systems in small and medium businesses. International Small Business Journal. 23 (5), pp.513–537.
McKim, C.A. (2017) The Value of Mixed Methods Research: A Mixed Methods Study. Journal of Mixed Methods Research. 11 (2), pp.202–222.
McMurray, A.J. et al. (2014) Sustainable procurement in Malaysian organizations: Practices, barriers and opportunities. Journal of Purchasing and Supply Management. 20 (3), Elsevier, pp.195–207.
Meager, S. et al. (2020) Exploring the drivers and barriers to green supply chain management implementation: A study of independent UK restaurants. Procedia Manufacturing. 51 (2020), Elsevier B.V., pp.1642–1649.
Meath, C., Linnenluecke, M. and Griffiths, A. (2016) Barriers and motivators to the adoption of energy savings measures for small- and medium-sized enterprises (SMEs): The case of the ClimateSmart Business Cluster program. Journal of Cleaner Production. 112, pp.3597–3604.
Medne, A. and Lapina, I. (2019) Sustainability and continuous improvement of organization: Review of process-oriented performance indicators. Journal of Open Innovation: Technology, Market, and Complexity. 5 (3).
Meier, M. (2011) Knowledge Management in Strategic Alliances: A Review of Empirical Evidence. International Journal of Management Reviews. 13 (1), pp.1–23.
Meissner, H. et al. (2011) Best Practices for Mixed Methods Research in the Health Sciences. Methods. 29, pp.1–39.
Meixell, M.J. and Gargeya, V.B. (2005) Global supply chain design: A literature review and critique. Transportation Research Part E: Logistics and Transportation Review. 41 (6 SPEC. ISS.), pp.531–550.
Melnyk, S.A., Stewart, D.M. and Swink, M. (2004) Metrics and performance measurement in operations management: Dealing with the metrics maze. Journal of Operations Management. 22 (3), pp.209–217.
Mengistu, A.T. and Panizzolo, R. (2021) Indicators and framework for measuring industrial sustainability in italian footwear small and medium enterprises. Sustainability (Switzerland). 13 (10).
Mertens, D.M. and Hesse-Biber, S. (2012) Triangulation and Mixed Methods Research: Provocative Positions. Journal of Mixed Methods Research. 6 (2), pp.75–79.

411
Milhem, M., Muda, H. and Ahmed, K. (2019) The Effect of Perceived Transformational Leadership Style on Employee Engagement: The Mediating Effect of Leader’s Emotional Intelligence. Foundations of Management. 11 (1), pp.33–42.
Miller, G. (2001) The development of indicators for sustainable tourism: results of a Delphi survey of tourism researchers. Tourism Management. 22 (4), pp.351–362.
Minor, D. and Morgan, J. (2011) CSR as Reputation Insurance: Primum Non Nocere. California Management Review. 53 (3), pp.40–59.
Mishra, N. (2019) Knowledge management practice for effective operations in SMEs. Production Planning and Control. 30 (10–12), pp.795–798.
Mitchell, G. (1996) Problems and fundamentals of sustainable development indicators. Sustainable Development. 4, pp.1–11.
Mitchell, R.K., Wood, D.J. and Agle, B. (1997) Toward a Theory of Stakeholder Identification and Salience : Defining the Principle of Who and What Really Counts. Academy of Management Review. 22 (4), pp.853–886.
Mizruchi, M.S. and Fein, L.C. (1999) The social construction of organizational knowledge: A study of the uses of coercive, mimetic, and normative isomorphism. Administrative Science Quarterly. 44 (4), pp.653–683.
Molina-Azorín, J. and Cameron, R. (2010) The Application of Mixed Methods in Organisational Research: A Literature Review. The Electronic Journal of Business Research Methods. 8 (2), pp.95–105.
Molina-Azorin, J.F. et al. (2017) Mixed Methods in the Organizational Sciences: Taking Stock and Moving Forward. Organizational Research Methods. 20 (2), pp.179–192.
Molina-Azorin, J.F. (2016) Mixed methods research: An opportunity to improve our studies and our research skills. European Journal of Management and Business Economics. 25 (2), AEDEM, pp.37–38.
Molina-Azorin, J.F. (2012) Mixed methods research in strategic management: Impact and applications. Organizational Research Methods. 15 (1), pp.33–56.
Montabon, F., Sroufe, R. and Narasimhan, R. (2007) An examination of corporate reporting, environmental management practices and firm performance. Journal of Operations Management. 25 (5), pp.998–1014.
Montiel, I. (2008) Corporate social responsibility and corporate sustainability: separate pasts, common futures. Organization & Environment. 21 (3), pp.245–269.
Montiel, I. and Delgado-Ceballos, J. (2014) Defining and Measuring Corporate Sustainability: Are We There Yet? Organization & Environment. 27 (2), pp.113–139.
Moons, I. and De Pelsmacker, P. (2015) An extended decomposed theory of planned behaviour to predict the usage intention of the electric car: A multi-group comparison. Sustainability (Switzerland). 7 (5), pp.6212–6245.
412
Moore, S.B. and Manring, S.L. (2009) Strategy development in small and medium sized enterprises for sustainability and increased value creation. Journal of Cleaner Production. 17 (2), Elsevier Ltd, pp.276–282.
Morioka, S.N. and Carvalho, M.M. (2016) Measuring sustainability in practice: exploring the inclusion of sustainability into corporate performance systems in Brazilian case studies. Journal of Cleaner Production. 136, Elsevier Ltd, pp.123–133.
Morioka, S.N. and de Carvalho, M.M. (2016) A systematic literature review towards a conceptual framework for integrating sustainability performance into business. Journal of Cleaner Production. 136, Elsevier Ltd, pp.134–146.
de Moura, G.B. and Saroli, L.G. (2020) Sustainable value chain management based on dynamic capabilities in small and medium-sized enterprises (SMEs). International Journal of Logistics Management. 32 (1), pp.168–189.
Moyeen, A. and West, B. (2014) Promoting CSR to foster sustainable development: Attitudes and perceptions of managers in a developing country. Asia-Pacific Journal of Business Administration. 6 (2), pp.97–115.
Muathe, S. and Muithya, V. (2020) Dynamic Capabilities and Performance in the Context of Microfinance Institutions in Kenya : An Exploratory Study. International Journal of Business, Economics and Management Works. 7 (8), pp.15–29.
Muenjohn, N. et al. (2020) Comparing perceptions of leadership, innovation and performance in Asian SMEs. Asia Pacific Business Review. 00 (00), Routledge, pp.1–15.
Mukherjee, K. (2019) Analysis of Sustainable Procurement in SMEs in Developing Countries Analysis of Sustainable Procurement in SMEs in Developing Countries. (93277).
Mullen, M.R., Budeva, D.G. and Doney, P.M. (2009) A Critical Review with Recommendations. Journal of Small Business Management. 47 (823), pp.287–307.
Muñoz-Pascual, L., Curado, C. and Galende, J. (2019) The triple bottom line on sustainable product innovation performance in SMEs: A mixed methods approach. Sustainability (Switzerland). 11 (6).
Murphy, G.B., Trailer, J.W. and Hill, R.C. (1996) Measuring performance in entrepreneurship research. Journal of Business Research. 36 (1), pp.15–23.
Murray, A. (2010) Do Markets Value Companies ’ Social and Environmental Activity ? An Inquiry into Associations among Social Disclosure , Social Performance and Financial Performance Alan Murray Submitted in fulfilment of the requirements for the Degree of PhD Department o. DisClosure. p.300.
Nardo, M. et al. (2005) Handbook on constructing composite indicators OECD Statistics Working Papers. (03).
Narkhede, B.E. (2017) Advance manufacturing strategy and firm performance: An empirical study in a developing environment of small- and medium-sized firms. Benchmarking. 24 (1), pp.62–101.
413
Nath, P. and Ramanathan, R. (2016) Environmental management practices, environmental technology portfolio, and environmental commitment: A content analytic approach for UK manufacturing firms. International Journal of Production Economics. 171, Elsevier, pp.427–437.
Nawi, N.C. et al. (2020) Strategic orientations and absorptive capacity on economic and environmental sustainability: A study among the batik small and medium enterprises in Malaysia. Sustainability (Switzerland). 12 (21), pp.1–16.
Nayak, R. et al. (2019) The Challenges for Sustainability Marketing Approach: An Empirical Study in Vietnamese Fashion SMEs. International Journal of Trade, Economics and Finance. 10 (4), pp.104–107.
Neely, A., Gregory, M. and Platts, K. (1995) Performance measurement system design - A literature review and research agenda. International Journal of Operations & Production Management. 15 (4), pp.80–116.
Nejati, M., Amran, A. and Hazlina Ahmad, N. (2014) Examining stakeholders’ influence on environmental responsibility of micro, small and medium-sized enterprises and its outcomes. Management Decision. 52 (10), pp.2021–2043.
Neri, A. et al. (2021) A triple bottom line balanced set of key performance indicators to measure the sustainability performance of industrial supply chains. Sustainable Production and Consumption. 26, Elsevier B.V., pp.648–691.
Newman, L. (2006) Change, uncertainty, and futures of sustainable development. Futures. 38 (5), pp.633–637.
Ngah, R. and Jusoff, K. (2009) Tacit Knowledge Sharing and SMEs’ Organizational Performance. International Journal of Economics and Finance. 1 (1).
Ngaochay, T. and Walsh, J. (2017) Upgrading Employees Skills in Thai SMEs Sustainably. Pacific Business Review International. 9 (9), pp.129–136.
Nguyen, A.K.T. and Ngoc, K.M. (2020) Building a Conceptual Framework of Corporate Social Responsibility: An Experience of Qualitative Approach in Vietnam. Journal of Asia-Pacific Business. 21 (1), Routledge, pp.39–56.
Nguyen, H.D. et al. (2017) Influence of Participants’ Characteristics on Sustainable Building Practices in Emerging Economies: Empirical Case Study. Journal of Construction Engineering and Management. 143 (8), p.05017014.
Nguyen, H.T.T. and Pham, H.S.T. (2020) An exploration of Vietnamese entrepreneurs. Research Handbook on Entrepreneurship in Emerging Economies. (May), pp.266–285.
Nguyen, M., Bensemann, J. and Kelly, S. (2018) Corporate social responsibility (CSR) in Vietnam: a conceptual framework. International Journal of Corporate Social Responsibility. 3 (1), International Journal of Corporate Social Responsibility, p.9.
Nguyen, M., Kelly, S. and Bensemann, J. (2017) Contextual factors affecting Corporate Social Responsibility in an emerging country : A Conceptual Framework on the nature of the CSR concept in Vietnam. ResearchGate. Available online: http://www. researchgate.

414
net/publication/317579309/(accessed on 20 July 2018).
Nguyen, P. V. and Tran, K.T. (2020) Explicating energy saving intention from the prospect of small medium enterprises. Entrepreneurship and Sustainability Issues. 8 (2), pp.716–734.
Nguyen, P.M. et al. (2020) Corporate social responsibilities of food processing companies in vietnam from consumer perspective. Sustainability (Switzerland). 12 (1), pp.1–18.
Nguyen, Q.A., Sullivan Mort, G. and D’Souza, C. (2015) Vietnam in transition: SMEs and the necessitating environment for entrepreneurship development. Entrepreneurship and Regional Development. 27 (3–4), pp.154–180.
Nguyen, T. V. and Bryant, S.E. (2004) A study of the formality of human resource management practices in small and medium-size enterprises in Vietnam. International Small Business Journal. 22 (6), pp.595–618.
Nguyen, T.L. (2019) STEAM-ME: A Novel Model for Successful Kaizen Implementation and Sustainable Performance of SMEs in Vietnam. Complexity. 2019.
Nielsen, B.B. and Raswant, A. (2018) The selection , use , and reporting of control variables in international business research : A review and recommendations. Journal of World Business. 53 (6), Elsevier, pp.958–968.
Nigri, G. and Baldo, M. Del (2018) Sustainability reporting and performance measurement systems: How do small- and medium- sized benefit corporations manage integration? Sustainability (Switzerland). 10 (12).
Nonaka, I. (1994) A Dynamic Theory of Organizational Knowledge Creation. Organization Science. 5 (1), pp.14–37.
Norman, W. and Macdonald, C. (2004) GETTING TO THE BOTTOM OF ‘TRIPLE BOTTOM LINE’ Wayne Norman and Chris MacDonald. Business Ethics Quarterly. 14 (2), pp.243–262.
Nowell, L.S. et al. (2017) Thematic Analysis: Striving to Meet the Trustworthiness Criteria. International Journal of Qualitative Methods. 16 (1), pp.1–13.
Nwobu, O., Faboyede, S. and Onwuelingo, A.T. (2015) The role of accounting services in small and medium scale businesses in Nigeria. Journal of Accounting – Business & Management. 22 (1), pp.55–63.
O’Cathain, A., Murphy, E. and Nicholl, J. (2007) Why, and how, mixed methods research is undertaken in health services research in England: A mixed methods study. BMC Health Services Research. 7, pp.1–11.
O’Driscoll, M.P. and Randall, D.M. (1999) Perceived organisational support, satisfaction with rewards, and employee job involvement and organisational commitment. Applied Psychology. 48 (2), pp.197–209.
O’Regan, N., Sims, M. and Ghobadian, A. (2005) High performance: ownership and decision‐making in SMEs. Management Decision. 43 (3), pp.382–396.
415
Obeng, B.A. (2019) Strategic networking and small firm growth in an emerging economy. Journal of Small Business and Enterprise Development. 26 (1), pp.43–66.
OECD (2008) Measuring Material Flows and Resource Productivity. Volume 1. III, pp.1–164.
Olarewaju, A.D. and George, O.J. (2014) Mamagement theories and its application in organisations: the Nigerian experience. BAM2014 Conference Procedings. p.18.
Olaru, M. et al. (2010) Responsible Commercial Activity of SMEs and Specific Values of Sustainable Development in Terms of the European Excellence Model. Amfiteatru Economic. 12 (27), pp.10–26.
Othman, S.A. and Mahmood, N.H.N. (2019) Linking employee engagement towards individual work performance through human resource management practice: from high potential employee’s perspectives. Management Science Letters. 9 (7), pp.1083–1092.
Pacheco, D.A. de J. et al. (2018) Eco-innovation determinants in manufacturing SMEs from emerging markets: Systematic literature review and challenges. Journal of Engineering and Technology Management - JET-M. 48 (February), Elsevier, pp.44–63.
Pacheco, D.F., Dean, T.J. and Payne, D.S. (2010) Escaping the green prison: Entrepreneurship and the creation of opportunities for sustainable development. Journal of Business Venturing. 25 (5), Elsevier Inc., pp.464–480.
Padin, C. et al. (2016) Validating a triple bottom line construct and reasons for implementing sustainable business practices in companies and their business networks. Corporate Governance: The international journal of business in society. 16 (5), pp.849–865.
Pádua, S.I.D. and Jabbour, C.J.C. (2015) Promotion and evolution of sustainability performance measurement systems from a perspective of business process management. Business Process Management Journal. 21 (2), pp.403–418.
Palmer, J., Russell, S. and McIntosh, M. (2012) Organizational change for sustainability: An agenda for cultural research. Anzam 2012. pp.1–14.
Panwar, R. et al. (2016) The effect of small firms’ competitive strategies on their community and environmental engagement. Journal of Cleaner Production. 129, Elsevier Ltd, pp.578–585.
Papert, M., Rimpler, P. and Pflaum, A. (2016) International Journal of Physical Distribution & Logistics Management Article information :
Parisi, C. (2013a) The impact of organisational alignment on the effectiveness of firms’ sustainability strategic performance measurement systems: An empirical analysis. Journal of Management and Governance. 17 (1), pp.71–97.
Parisi, C. (2013b) The impact of organisational alignment on the effectiveness of firms’ sustainability strategic performance measurement systems: An empirical analysis. Journal of Management and Governance. 17 (1), pp.71–97.
Parker, C.M., Redmond, J. and Simpson, M. (2009) A review of interventions to encourage SMEs to make environmental improvements. Environment and Planning C: Government and
416
Policy. 27 (2), pp.279–301.
Parrish, B.D. (2010) Sustainability-driven entrepreneurship: Principles of organization design. Journal of Business Venturing. 25 (5), Elsevier Inc., pp.510–523.
Van Passel, S. et al. (2007) Measuring farm sustainability and explaining differences in sustainable efficiency. Ecological Economics. 62 (1), pp.149–161.
Paterson, T.A., Specht, D. and Duchon, D. (2013) Exploring costs and consequences of religious expression in family businesses. Journal of Management, Spirituality and Religion. 10 (2), pp.138–158.
Peña-Vinces, J.C. and Delgado-Márquez, B.L. (2013) Are entrepreneurial foreign activities of Peruvian SMNEs influenced by international certifications, corporate social responsibility and green management? International Entrepreneurship and Management Journal. 9 (4), pp.603–618.
Peng, M.Y.P. (2021) The roles of dual networks and ties on absorptive capacity in SMEs: the complementary perspective. Total Quality Management and Business Excellence. 0 (0), Taylor & Francis, pp.1–24.
Perera, D. and Chand, P. (2015) Issues in the adoption of international financial reporting standards (IFRS) for small and medium-sized enterprises (SMES). Advances in Accounting. 31 (1), Elsevier Ltd, pp.165–178.
Perez-Sanchez, D., Barton, J.R. and Bower, D. (2003) Implementing environmental management in SMEs. Corporate Social Responsibility and Environmental Management. 10 (2), pp.67–77.
Perez-Valls, M., Cespedes-Lorente, J. and Moreno-Garcia, J. (2016) Green Practices and Organizational Design as Sources of Strategic Flexibility and Performance. Business Strategy and the Environment. 25 (8), pp.529–544.
Perrini, F. and Tencati, A. (2006) Sustainability and stakeholder management: The need for new corporate performance evaluation and reporting systems. Business Strategy and the Environment. 15 (5), pp.296–308.
Pešalj, B., Pavlov, A. and Micheli, P. (2018) The use of management control and performance measurement systems in SMEs: A levers of control perspective. International Journal of Operations and Production Management. 38 (11), pp.2169–2191.
Pham, H. and Kim, S. (2019) The effects of sustainable practices and managers ’ leadership competences on sustainability performance of construction firms. Sustainable Production and Consumption. 20, Elsevier B.V., pp.1–14.
Pham, H., Yong, S. and Truong, K. (2019) Managerial perceptions on barriers to sustainable construction in developing countries : Vietnam case. Environment, Development and Sustainability. (0123456789), Springer Netherlands.
Phan, U.H.P. et al. (2015) Key Determinants of SMEs in Vietnam. Combining Quantitative and Qualitative Studies. Review of European Studies. 7 (11), pp.359–375.
417
Phillips, R., Freeman, R.E. and Wicks, A.C. (2003) WHAT STAKEHOLDER THEORY IS NOT Robert Phillips, R. Edward Freeman, and Andrew C. Wicks. Business Ethics Quaterly. 13 (4), pp.479–502.
Du Pisani, J.A. (2006) Sustainable development – historical roots of the concept. Environmental Sciences. 3 (2), pp.83–96.
Piyathanavong, V. et al. (2019) The adoption of operational environmental sustainability approaches in the Thai manufacturing sector. Journal of Cleaner Production. 220, pp.507–528.
Polonsky, M.J. (1995) A stakeholder theory approach to designing environmental marketing strategy. Journal of Business & Industrial Marketing. 10 (3), pp.29–46.
Powell, M. and Ansic, D. (1997) Gender differences in risk behaviour in financial decision-making: An experimental analysis. Journal of Economic Psychology. 18 (6), pp.605–628.
Prashar, A. and Sunder M, V. (2020) A bibliometric and content analysis of sustainable development in small and medium-sized enterprises. Journal of Cleaner Production. 245, Elsevier Ltd, p.118665.
Preuss, L. and Perschke, J. (2010) Slipstreaming the larger boats: Social responsibility in medium-sized businesses. Journal of Business Ethics. 92 (4), pp.531–551.
Price, M. et al. (2019) Teacher Relationships and Adolescents Experiencing Identity-Based Victimization: What Matters for Whom Among Stigmatized Adolescents. School Mental Health. 11 (4), Springer US, pp.790–806.
Proctor, S. (1998) Linking philosophy and method in the research process: the case for realism. Nurse Researcher. 5 (4), pp.73–90.
Pryshlakivsky, J. and Searcy, C. (2015) A Heuristic Model for Establishing Trade-Offs in Corporate Sustainability Performance Measurement Systems. Journal of Business Ethics. 144 (2), Springer Netherlands, pp.323–342.
Pullman, M.E., Maloni, M.J. and Carter, C.R. (2009) Food for thought: Social versus environmental sustainability practices and performance outcomes. Journal of Supply Chain Management. 45 (4), pp.38–54.
Punzo, G. et al. (2019) Assessing the role of perceived values and felt responsibility on pro-environmental behaviours: A comparison across four EU countries. Environmental Science & Policy. 101 (September), Elsevier, pp.311–322.
Puppim de Oliveira, J.A. and Jabbour, C.J.C. (2017) Environmental Management, Climate Change, CSR, and Governance in Clusters of Small Firms in Developing Countries. Business & Society. 56 (1), pp.130–151.
Qorri, A., Mujkić, Z. and Kraslawski, A. (2018) A conceptual framework for measuring sustainability performance of supply chains. Journal of Cleaner Production. 189, pp.570–584.
Quan, L. (2015) Perceptions of leadership competencies and the acquisition of them by CEOs in vietnamese small enterprises. Asian Social Science. 11 (4), pp.17–25.
418
Queiroz, S.A.B. et al. (2020) Servitization and performance: impacts on small and medium enterprises. Journal of Business and Industrial Marketing. 35 (7), pp.1237–1249.
Rachidi, H. and El Mohajir, M. (2021) Improving SMEs’ performance using innovative knowledge and financial system designed from the Moroccan business environment. African Journal of Science, Technology, Innovation and Development. 13 (1), Taylor & Francis, pp.15–30.
Rachuri, S., Sriram, R.D. and Sarkar, P. (2009) Metrics, standards and industry best practices for sustainable manufacturing systems. 2009 IEEE International Conference on Automation Science and Engineering. pp.472–477.
Raderbauer, M. (2011) The Importance of Sustainable Business Practices in the Viennese Accommodation Industry Submitted by. (September).
Rahbauer, S. et al. (2018) Determinants for the adoption of green electricity by German SMEs – An empirical examination. Energy Policy. 123 (September), Elsevier Ltd, pp.533–543.
Ramanathan, R., Poomkaew, B. and Nath, P. (2014) The impact of organizational pressures on environmental performance of firms. Business Ethics. 23 (2), pp.169–182.
Rand, J. and Tarp, F. (2020) Micro, Small, and Medium Enterprises in VietnamIn: Oxford University Press. Oxford University Press.
Rao, P. et al. (2009) A metric for corporate environmental indicators ... for small and medium enterprises in the Philippines. Business Strategy and the Environment. 18 (1), pp.14–31.
Rao, P. et al. (2006) Environmental indicators for small and medium enterprises in the Philippines: An empirical research. Journal of Cleaner Production. 14 (5), pp.505–515.
Rasi, R.Z.R.M., Abdekhodaee, A. and Nagarajah, R. (2014) Stakeholders’ involvements in the implementation of proactive environmental practices: Linking environmental practices and environmental performances in SMEs. Management of Environmental Quality: An International Journal. 25 (2), pp.132–149.
Raziq, A. and Wiesner, R. (2016) High Performance Management Practices and Sustainability of SMEs. Evidence from Manufacturing and Services-based Industries in Pakistan. Journal of Management Sciences. 3 (2), pp.83–107.
Rebs, T. et al. (2018) Stakeholder influences and risks in sustainable supply chain management: a comparison of qualitative and quantitative studies. Business Research. 11 (2), Springer International Publishing, pp.197–237.
Reed, M.S., Fraser, E.D.G. and Dougill, A.J. (2006) An adaptive learning process for developing and applying sustainability indicators with local communities. Ecological Economics. 59 (4), pp.406–418.
Reio, T. and Ghosh, R. (2009) Antecedents and Outcomes of Workplace Incivility. Computational Complexity. 2 (1), pp.1–9.
Revell, A. and Blackburn, R. (2007) The business case for sustainability? An examination of small firms in the UK’s construction and restaurant sectors. Business Strategy and the

419
Environment. 16 (6), pp.404–420.
Revell, A., Stokes, D. and Chen, H. (2010) Small businesses and the environment: Turning over a new leaf ? Business Strategy and the Environment. 19 (5), pp.273–288.
Reyes-Rodriguez, J.F., Ulhoi, J.P. and Madsen, H. (2016) Corporate Environmental Sustainability in Danish SMEs: A Longitudinal Study of Motivators, Initiatives, and Strategic Effects. Corporate Social Responsibility and Environmental Management. 23 (4), pp.193–212.
Riaz, M. and Sherani (2021) Investigation of information sharing via multiple social media platforms: a comparison of Facebook and WeChat adoption. Quality and Quantity. (5888), Springer Netherlands.
Riikkinen, R., Kauppi, K. and Salmi, A. (2017) Learning Sustainability? Absorptive capacities as drivers of sustainability in MNCs’ purchasing. International Business Review. 26 (6), Elsevier, pp.1075–1087.
Roberts, S. (2011) An exploratory analysis of factors mediating community participation outcomes in tourism. Community Development. 42 (3), pp.377–391.
Roberts, S. and Tribe, J. (2008) Sustainability indicators for small tourism enterprises – An exploratory perspective. Journal of Sustainable Tourism. 16 (5), pp.575–594.
Rocha-lona, L. et al. (2015) Corporate Sustainability and Business Excellence. International Conference on Industrial Engineering and Operations Management. pp.1–7.
Rodríguez-Gutiérrez, P. et al. (2021) An approach to using the best-worst method for supporting sustainability reporting decision-making in SMEs. Journal of Environmental Planning and Management. 0 (0), Routledge, pp.1–24.
Roehrich, K.J., Grosvold, J. and Hoejmose, U.S. (2014) Reputational risks and sustainable supply chain management. Helen Walker, Professor Stefan Seur, P. (ed.) International Journal of Operations & Production Management. 34 (5), pp.695–719.
Rosen, M.A. and Kishawy, H.A. (2012) Sustainable manufacturing and design: Concepts, practices and needs. Sustainability. 4 (2), pp.154–174.
Roxas, B. (2021) Environmental sustainability engagement of firms: The roles of social capital, resources, and managerial entrepreneurial orientation of small and medium enterprises in Vietnam. Business Strategy and the Environment. (January), pp.2194–2208.
Roxas, B. et al. (2017) Human and social capital and environmental management in small firms: a developing country perspective. Asian Journal of Business Ethics. 6 (1), Asian Journal of Business Ethics, pp.1–20.
Roxas, B. and Chadee, D. (2012) Environmental sustainability orientation and financial resources of small manufacturing firms in the Philippines. Social Responsibility Journal. 8 (2), pp.208–226.
Russo, A. and Perrini, F. (2010) Investigating stakeholder theory and social capital: CSR in large firms and SMEs. Journal of Business Ethics. 91 (2), pp.207–221.

420
Russo, A. and Tencati, A. (2009) Formal vs. informal CSR strategies: Evidence from italian micro, small, medium-sized, and large firms. Journal of Business Ethics. 85 (SUPPL. 2), pp.339–353.
Saad, M., Kumar, V. and Bradford, J. (2017) An investigation into the development of the absorptive capacity of manufacturing SMEs. International Journal of Production Research. 55 (23), Taylor & Francis, pp.6916–6931.
Saeed, A. et al. (2018) Institutional pressures, green supply chain management practices on environmental and economic performance: A two theory view. Sustainability (Switzerland). 10 (5), pp.1–24.
Sajan, M.P. et al. (2017) Lean manufacturing practices in Indian manufacturing SMEs and their effect on sustainability performance. Journal of Manufacturing Technology Management. 28 (6), pp.772–793.
Salanova, M., Agut, S. and Peiró, J.M. (2005) Linking organizational resources and work engagement to employee performance and customer loyalty: The mediation of service climate. Journal of Applied Psychology. 90 (6), pp.1217–1227.
Sale, J.E.M., Lohfeld, L.H. and Brazil, K. (2002) Revisiting the Quantitative-Qualitative Debate: Implications for Mixed-Methods Research. Quality and quantity. 36 (1), pp.43–53.
Salzmann, O., Ionescu-Somers, A.M. and Steger, U. (2005) The business case for corporate sustainability: Literature review and research options. European Management Journal. 23 (1), pp.27–36.
Santiago-Brown, I. et al. (2015) What Does Sustainability Mean? Knowledge Gleaned From Applying Mixed Methods Research to Wine Grape Growing. Journal of Mixed Methods Research. 9 (3), pp.232–251.
Saratun, M. (2016) Performance management to enhance employee engagement for corporate sustainability. Asia-Pacific Journal of Business Administration. 8 (1), pp.84–102.
Sardi, A. et al. (2020) The role of HRM in the innovation of performance measurement and management systems: a multiple case study in SMEs. Employee Relations: The International Journal.
Sarkis, J. and Dhavale, D.G. (2015) Supplier selection for sustainable operations: A triple-bottom-line approach using a Bayesian framework. International Journal of Production Economics. 166, Elsevier, pp.177–191.
Sarkis, J., Gonzalez-Torre, P. and Adenso-Diaz, B. (2010) Stakeholder pressure and the adoption of environmental practices: The mediating effect of training. Journal of Operations Management. 28 (2), Elsevier B.V., pp.163–176.
Sartori, S., Latrônico, F. and Campos, L.M.S. (2011) Sustainability and sustainable development: a taxonomy in the field of literature. Ambiente & Sociedade. 17 (1), pp.01–22.
Saunders, M.N.K., Lewis, P. & Thornhill, A. (2019) Research methods for business students, Eighth edn, Pearson, Boston

421
Schaufeli, W.B., Bakker, A.B. and Salanova, M. (2006) The measurement of work engagement with a short questionnaire: A cross-national study. Educational and Psychological Measurement. 66 (4), pp.701–716.
Schlierer, H.J. et al. (2012) How Do European SME Owner-Managers Make Sense of ‘Stakeholder Management’?: Insights from a Cross-National Study. Journal of Business Ethics. 109 (1), pp.39–51.
Schmidt, L., Nave, J.G. and Guerra, J. (2006) Who’s afraid of Local Agenda 21? Top-down and bottom-up perspectives on local sustainability. International Journal of Environment and Sustainable Development. 5 (2), pp.181–198.
Schneider, A. and Meins, E. (2012) Two Dimensions of Corporate Sustainability Assessment: Towards a Comprehensive Framework. Business Strategy and the Environment. 21 (4), pp.211–222.
Schrettle, S. et al. (2014) Turning sustainability into action: Explaining firms’ sustainability efforts and their impact on firm performance. International Journal of Production Economics. 147 (PART A), pp.73–84.
Schwarz, J., Beloff, B. and Beaver, E. (2002) Use sustainability metrics to guide decision-making Chemical Engineering Progress. 98 (7), 58–63.
Scotland, J. (2012) Exploring the philosophical underpinnings of research: Relating ontology and epistemology to the methodology and methods of the scientific, interpretive, and critical research paradigms. English Language Teaching. 5 (9), pp.9–16.
Scott, W.R. (2008) Approaching adulthood: The maturing of institutional theory. Theory and Society. 37 (5), pp.427–442.
Searcy, C. (2009a) Corporate sustainability performance measurement: Lessons from system of systems engineering. Conference Proceedings - IEEE International Conference on Systems, Man and Cybernetics. (October), pp.1057–1060.
Searcy, C. (2012) Corporate Sustainability Performance Measurement Systems: A Review and Research Agenda. Journal of Business Ethics. 107 (3), pp.239–253.
Searcy, C. (2016) Measuring Enterprise Sustainability. Business Strategy and the Environment. 25 (2), pp.120–133.
Searcy, C. (2009b) Setting a course in corporate sustainability performance measurement. Measuring Business Excellence. 13 (3), pp.49–57.
Searcy, C. (2011) Updating corporate sustainability performance measurement systems. Measuring Business Excellence. 15 (2), pp.44–56.
Sekaran, U. & Bougie, R.J. (2016). Research methods for business: a skill building approach, 7th edn, John Wiley & Sons, Chichester.
Sengupta, K. and Chattopadhyay, A. (2006) Importance of appropriate marketing strategies for sustainability of small businesses in a developing country. Shukla, P. (ed.) Asia Pacific Journal of Marketing and Logistics. 18 (4), pp.328–341.
422
Seo, H.G. et al. (2016) SME’s appropriability regime for sustainable development-the role of absorptive capacity and inventive capacity. Sustainability (Switzerland). 8 (7), pp.1–16.
Seuring, S. (2013) A review of modeling approaches for sustainable supply chain management. Decision Support Systems. 54 (4), pp.1513–1520.
Seuring, S. and Müller, M. (2008) From a literature review to a conceptual framework for sustainable supply chain management. Journal of Cleaner Production. 16 (15), pp.1699–1710.
Shahedul Quader, M., Kamal, M.M. and Hassan, A.B.M.E. (2016) Sustainability of positive relationship between environmental performance and profitability of SMEs: A case study in the UK. Journal of Enterprising Communities. 10 (2), pp.138–163.
Shahzad, M. et al. (2020) Impact of knowledge absorptive capacity on corporate sustainability with mediating role of CSR: analysis from the Asian context. Journal of Environmental Planning and Management. 63 (2), Routledge, pp.148–174.
Shashi et al. (2018) Sustainability orientation, supply chain integration, and SMEs performance: a causal analysis. Benchmarking. 25 (9), pp.3679–3701.
Shaw, S., Grant, D.B. and Mangan, J. (2021) A supply chain practice-based view of enablers, inhibitors and benefits for environmental supply chain performance measurement. Production Planning and Control. 32 (5), Taylor & Francis, pp.382–396.
Sheehan, M., Garavan, N.T. and Carbery, R. (2014) Sustainability, corporate social responsibility and HRD. Ronan Carbery, Prof. Thomas N. Gara, D. (ed.) European Journal of Training and Development. 38 (5), pp.370–386.
Shevchenko, A., Lévesque, M. and Pagell, M. (2016) Why Firms Delay Reaching True Sustainability. Journal of Management Studies. 53 (5), pp.911–935.
Shi, H. et al. (2008) Barriers to the implementation of cleaner production in Chinese SMEs: government, industry and expert stakeholders’ perspectives. Journal of Cleaner Production. 16 (7), pp.842–852.
Shibin, K.T. et al. (2018) The Management of Operations Frugal innovation for supply chain sustainability in SMEs : multi-method research design research design. Production Planning & Control. 29 (11), Taylor & Francis, pp.908–927.
Shields, J. and Shelleman, J.M. (2015) Integrating sustainability into SME strategy. Journal of Small Business Strategy. 25 (2), pp.59–76.
Shields, J.F., Welsh, D.H.B. and Shelleman, J.M. (2018) Sustainability reporting and its implications for family firms. Journal of Small Business Strategy. 28 (1), pp.66–71.
Shnayder, L., Van Rijnsoever, F.J. and Hekkert, M.P. (2015) Putting your money where your mouth is: Why sustainability reporting based on the triple bottom line can be misleading. PLoS ONE. 10 (3), pp.1–23.
Shrestha, B.K. (2017) Religious Ethics and Socially Responsible Behaviors of Small Firms in Nepal. Journal of Religion and Business Ethics. 3 (2), p.5.
423
Shuaib, M. et al. (2014) Product sustainability index (ProdSI): A metrics-based framework to evaluate the total life cycle sustainability of manufactured products shuaib et al. prodsi framework to evaluate product sustainability. Journal of Industrial Ecology. 18 (4), pp.491–507.
Siegel, R. et al. (2019a) Integrated green lean approach and sustainability for SMEs: From literature review to a conceptual framework. Journal of Cleaner Production. 240.
Siegel, R. et al. (2019b) Integrated green lean approach and sustainability for SMEs: From literature review to a conceptual framework. Journal of Cleaner Production. 240.
Siew, R.Y.J. (2015) A review of corporate sustainability reporting tools (SRTs). Journal of Environmental Management. 164, Elsevier Ltd, pp.180–195.
Silverman, D. (2013). Doing qualitative research, Fourth edn, SAGE, Los Angeles.
Silvestre, B.S. (2015) Sustainable supply chain management in emerging economies: Environmental turbulence, institutional voids and sustainability trajectories. International Journal of Production Economics. 167, Elsevier, pp.156–169.
Simonette, M.J. et al. (2008) Efetividade Do Processo De Comunicação Com Base Na Teoria Do Comportamento Informacional: O Caso De Um Organismo Internacional Da Área Da Saúde Pública Sediado No Brasil. Systems Research and Behavioral Science. 8 (3), pp.27–42.
Simpson, M., Padmore, J. and Newman, N. (2012) Towards a new model of success and performance in SMEs. International Journal of Entrepreneurial Behavior & Research. 18 (3), pp.264–285.
Singh, M., Brueckner, M. and Padhy, P.K. (2015) Environmental management system ISO 14001: Effective waste minimisation in small and medium enterprises in India. Journal of Cleaner Production. 102, Elsevier Ltd, pp.285–301.
Singh, M., Brueckner, M. and Padhy, P.K. (2014) Insights into the state of ISO14001 certification in both small and medium enterprises and industry best companies in India: The case of Delhi and Noida. Journal of Cleaner Production. 69, Elsevier Ltd, pp.225–236.
Singh, R.K. et al. (2012) An overview of sustainability assessment methodologies. Ecological Indicators. 15 (1), Elsevier Ltd, pp.281–299.
Singh, S. et al. (2015) Fuzzy-based sustainability evaluation method for manufacturing SMEs using balanced scorecard framework. Journal of Intelligent Manufacturing. Springer US, pp.1–18.
Singh, S., Olugu, E.U. and Fallahpour, A. (2014) Fuzzy-based sustainable manufacturing assessment model for SMEs. Clean Technologies and Environmental Policy. 16 (5), pp.847–860.
Singh, S., Olugu, E.U. and Musa, S.N. (2016) Development of Sustainable Manufacturing Performance Evaluation Expert System for Small and Medium Enterprises. Procedia CIRP. 40, Elsevier B.V., pp.609–614.
Singh, S. and Srivastava, S. (2018) Moderating effect of product type on online shopping
424
behaviour and purchase intention: An Indian perspective. Cogent Arts and Humanities. 5 (1), Cogent, pp.1–27.
Singh, V., Chauhan, S.C. and Tejyan, S. (2017) Greenhouse gas emission reduction potentials in air transport: a structural equation modelling-based multi-group analysis. Technology Analysis and Strategic Management. 29 (4), Taylor & Francis, pp.442–461.
Singh, V. and Sharma, S.K. (2016) Analyzing the moderating effects of respondent type and experience on the fuel efficiency improvement in air transport using structural equation modeling. European Transport Research Review. 8 (2), European Transport Research Review.
Sirsly, C.T. and Sur, S. (2014) Strategies for sustainability initiatives : why ownership matters.
Slaper, T.F. and Hall, T.J. (2011) The Triple Bottom Line: What Is It and How Does It Work? Indiana Business Review. 86 (1), pp.4–8.
Smith, M.K. (2018) High-involvement innovation: views from frontline service workers and managers. Employee Relations. 40 (2), pp.208–226.
Sodhi, M.S.M.S. and Tang, C.S. (2018) Corporate social sustainability in supply chains: a thematic analysis of the literature. International Journal of Production Research. 56 (1–2), pp.882–901.
Soilemezi, D. and Linceviciute, S. (2018) Synthesizing Qualitative Research: Reflections and Lessons Learnt by Two New Reviewers. International Journal of Qualitative Methods. 17 (1), pp.1–14.
Sommer, C. (2017) Drivers and Constraints for Adopting Sustainability Standards in Small and Medium-sized Enterprises (SMEs). German Development Institute. p.73.
Song, B. and Choi, D. (2018) Dynamic capability of the firm as driver of green supply chain management implementation. Sustainability (Switzerland). 10 (7).
Soundararajan, V., Jamali, D. and Spence, L.J. (2018) Small Business Social Responsibility: A Critical Multilevel Review, Synthesis and Research Agenda. International Journal of Management Reviews. 20 (4), pp.934–956.
Sousa, S. and Aspinwall, E. (2010) Development of a performance measurement framework for SMEs. 21 (5), Routledge , pp.475–501.
Spector, P.E. and Brannick, M.T. (2011) Methodological urban legends: The misuse of statistical control variables. Organizational Research Methods. 14 (2), pp.287–305.
Spence, L.J. and Schimdpeter, R. (2003) SMEs, Social Capital and the Common Good on JSTOR. Journal of business ethics. p.16.
Spence, L.J., Schmidpeter, R. and Habisch, A. (2003) Assessing Social Capital : Small and Medium Sized Enterprises in Germany and the U . K . pp.17–29.
Sperber, A.D. et al. (2014) Conducting multinational, cross-cultural research in the functional gastrointestinal disorders: Issues and recommendations. A Rome Foundation working team report. Alimentary Pharmacology and Therapeutics. 40 (9), pp.1094–1102.

425
Spicer, D.P. (2004) Organisational Learning and Performance SMEs (04).
Sridhar, K. and Jones, G. (2013) The three fundamental criticisms of the Triple Bottom Line approach: An empirical study to link sustainability reports in companies based in the Asia-Pacific region and TBL shortcomings. Asian Journal of Business Ethics. 2 (1), pp.91–111.
Srisathan, W.A., Ketkaew, C. and Naruetharadhol, P. (2020) The intervention of organizational sustainability in the effect of organizational culture on open innovation performance: A case of thai and chinese SMEs. Cogent Business and Management. 7 (1), Cogent.
Sroufe, R. et al. (2010) Are You a Leader or a Laggard? HR’s Role in Creating a Sustainability Culture. People & Strategy. 33 (1), pp.34–42.
Sroufe, R. (2017) Integration and organizational change towards sustainability. Journal of Cleaner Production. 162, Elsevier Ltd, pp.315–329.
Steinhofel, E. et al. (2019) Sustainability reporting in German manufacturing SMEsIn: Procedia Manufacturing. 33, Elsevier B.V., 610–617.
De Steur, H. et al. (2020) Drivers, adoption, and evaluation of sustainability practices in Italian wine SMEs. Business Strategy and the Environment. 29 (2), pp.744–762.
Stubblefield Loucks, E., Martens, M.L. and Cho, C.H. (2010) Engaging small‐ and medium‐sized businesses in sustainability. Dillard, J. (ed.) Sustainability Accounting, Management and Policy Journal. 1 (2), pp.178–200.
Suh, C.J. and Lee, I.T. (2018) An empirical study on the manufacturing firm’s strategic choice for sustainability in SMEs. Sustainability (Switzerland). 10 (2).
Sukkar, A.E. (2017) Sustainability : Its factors and its performance evaluation. Journal of Commerce & Educational Thoughts. 1 (1), pp.14–30.
Sundaram, A.K. and Inkpen, A.C. (2004) The corporate objective revisited. Organization Science. 15 (3).
Sundin, E., Nässlander, E. and Lelah, A. (2015) Sustainability indicators for small and medium-sized enterprises (SMEs) in the transition to provide Product-Service Systems (PSS). Procedia CIRP. 30, pp.149–154.
Suriyankietkaew, S. (2016) Effects of sustainable leadership on customer satisfaction: Evidence from Thailand. Asia-Pacific Journal of Business Administration. 8 (3), pp.245–259.
Susanto, A.& P. (2021) Strengthen the Resilience of Small and Medium Enterprises ( SMEs ) in Covid-19 Pandemic Through the Strengthening Entrepreneurial Orientation and Religiosity ( A Conceptual Framework ). PSYCHOLOGY AND EDUCATION. 58 (3), pp.615–625.
Svensson, G. et al. (2016) A Triple Bottom Line Dominant Logic for Business Sustainability: Framework and Empirical Findings. Journal of Business-to-Business Marketing. 23 (2), pp.153–188.
Svensson, G. and Wagner, B. (2015) Implementing and managing economic, social and environmental efforts of business sustainability. Management of Environmental Quality: An
426
International Journal. 26 (2), pp.195–213.
Székely, F. and Knirsch, M. (2005) Responsible leadership and corporate social responsibility: Metrics for sustainable performance. European Management Journal. 23 (6), pp.628–647.
Tabachnick, B.G. & Fidell, L.S. (2014). Using multivariate statistics, International; Sixth; edn, Pearson, Harlow, Essex.
Tan, H.X. et al. (2015) A sustainability indicator framework for Singapore small and medium-sized manufacturing enterprises. Procedia CIRP. 29, Elsevier B.V., pp.132–137.
Tanzil, D. and Beloff, B.R. (2006) Assessing impacts: Overview on sustainability indicators and metrics. Environmental Quality Management. 15 (4), pp.41–56.
Tashakkori, A. et al. (2015) Overview of Contemporary Issues in Mixed Methods Research SAGE Handbook of Mixed Methods in Social & Behavioral Research.
Taylor, A. and Taylor, M. (2014) Factors influencing effective implementation of performance measurement systems in small and medium-sized enterprises and large firms: A perspective from Contingency Theory. International Journal of Production Research. 52 (3), pp.847–866.
Teck Hui, L. (2008) Combining faith and CSR: a paradigm of corporate sustainability. International Journal of Social Economics. 35 (6), pp.449–465.
Teddlie, C. and Yu, F. (2007) Mixed Methods Sampling: A typology with examples. Journal of Mixed Methods Research. 1 (1), pp.77–100.
Teo, T.S.H. (2005) Meeting the challenges of knowledge management at the Housing and Development Board. Decision Support Systems. 41 (1), pp.147–159.
Thomas, D.R. (2003) A general inductive approach for qualitative data analysis.
Tien, N.H. et al. (2020) Small family business in Vietnam succession and sustainable development. International Journal of Entrepreneurship. 24 (1).
Tien, N.H., Anh, D.B.H. and Ngoc, N.M. (2020) Corporate financial performance due to sustainable development in Vietnam. Corporate Social Responsibility and Environmental Management. 27 (2), pp.694–705.
Tiep, L.T., Huan, N.Q. and Hong, T.T.T. (2021) Determinants for competitiveness in the context of international integration pressure: Case of small and medium enterprises in emerging economy–Vietnam. Liu, G. (ed.) Cogent Business & Management. 8 (1), Cogent, p.1893246.
Tilleman, S. (2012) Is Employee Organizational Commitment Related to Firm Environmental Sustainability? Journal of Small Business & Entrepreneurship. 25 (4), pp.417–431.
Tolstoy, D. (2019) The Proactive Initiation of SMEs’ Foreign Business Relationships. European Management Review. 16 (4), pp.1159–1173.
Torrance, H. (2012) Triangulation, Respondent Validation, and Democratic Participation in Mixed Methods Research. Journal of Mixed Methods Research. 6 (2), pp.111–123.
427
Tran, A.N. and Jeppesen, S. (2016a) SMEs in their Own Right: The Views of Managers and Workers in Vietnamese Textiles, Garment, and Footwear Companies. Journal of Business Ethics. 137 (3), Springer Netherlands, pp.589–608.
Tran, A.N. and Jeppesen, S. (2016b) SMEs in their Own Right: The Views of Managers and Workers in Vietnamese Textiles, Garment, and Footwear Companies. Journal of Business Ethics. 137 (3), Springer Netherlands, pp.589–608.
Tran, N.M. and Pham, B.N.T. (2020) The influence of CEO characteristics on corporate environmental performance of SMEs: Evidence from Vietnamese SMEs. Management Science Letters. 10 (8), pp.1671–1682.
Tran, T., Deng, H. and Ong, C.E. (2018) Critical Factors for the Adoption of Social Sustainability Practices in Vietnamese Handicraft Organizations. 2018 IEEE Conference on e-Learning, e-Management and e-Services (IC3e). IEEE, pp.122–127.
Tran, T., Deng, H. and Ong, C.E. (2019) Critical Factors for the Adoption of Social Sustainability Practices in Vietnamese Handicraft OrganizationsIn: 2018 IEEE Conference on e-Learning, e-Management and e-Services, IC3e 2018. 122–127.
Trang, H. and Yekini, L. (2014) Investigating the link between CSR and Financial performance-Evidence from Vietnamese listed companies. British Journal of Arts and Social Sciences. 17 (1), pp.85–101.
Tremblay, A. and Badri, A. (2018) A novel tool for evaluating occupational health and safety performance in small and medium-sized enterprises: The case of the Quebec forestry/pulp and paper industry. Safety Science. 101 (May 2017), Elsevier, pp.282–294.
Trianni, A. et al. (2019) Measuring industrial sustainability performance: Empirical evidence from Italian and German manufacturing small and medium enterprises. Journal of Cleaner Production. 229, Elsevier Ltd, pp.1355–1376.
Trianni, A. and Cagno, E. (2012) Dealing with barriers to energy efficiency and SMEs: Some empirical evidences. Energy. 37 (1), Elsevier Ltd, pp.494–504.
Trianni, A., Cagno, E. and Farné, S. (2016) Barriers, drivers and decision-making process for industrial energy efficiency: A broad study among manufacturing small and medium-sized enterprises. Applied Energy. 162, Elsevier Ltd, pp.1537–1551.
Trifković, N. (2017) Spillover Effects of International Standards: Working Conditions in the Vietnamese SMEs. World Development. 97 (October 2016), pp.79–101.
Truong, A. and Barraket, J. (2018) Engaging workers in resource-poor environments : the case of social enterprise in Vietnam. The International Journal of Human Resource Management. 5192, Routledge, pp.1–22.
Tsalis, T. a. et al. (2013) A framework development to evaluate the needs of SMEs in order to adopt a sustainability-balanced scorecard. Journal of Integrative Environmental Sciences. 10 (February 2015), pp.179–197.
Tsang, E.W.K. (1997) Organizational learning and the learning organization: A dichotomy between descriptive and prescriptive research. Human Relations. 50 (1), pp.73–89.

428
Tuan, L.T. and Rowley, C. (2015) From value-based human resource practices to i-deals: Software companies in vietnam. Personnel Review. 44 (1), pp.39–68.
Tumpa, T.J. et al. (2019) Barriers to green supply chain management: An emerging economy context. Journal of Cleaner Production. 236.
Tur-Porcar, A., Roig-Tierno, N. and Mestre, A.L. (2018) Factors affecting entrepreneurship and business sustainability. Sustainability (Switzerland). 10 (2), pp.1–12.
Turcu, C. (2013) Re-thinking sustainability indicators: Local perspectives of urban sustainability. Journal of Environmental Planning and Management. 56 (5), pp.695–719.
Turner, S.F., Cardinal, L.B. and Burton, R.M. (2017) Research Design for Mixed Methods: A Triangulation-based Framework and Roadmap. Organizational Research Methods. 20 (2), pp.243–267.
UNIDO (1992). Handbook of Industrial Statistics. New York: United Nations.
Upadhye, B. et al. (2021) Can planning prompt be a boon for impulsive customers? Moderating roles of product category and decisional procrastination. Psychology and Marketing. (January).
Urban, B. and Naidoo, R. (2012) Business sustainability: empirical evidence on operational skills in SMEs in South Africa. Journal of Small Business and Enterprise Development. 19 (1), pp.146–163.
Uygur, S. (2009) The Islamic Work Ethic and the Emergence of Turkish SME Owner-Managers. Journal of Business Ethics. 88 (1), pp.211–225.
Veleva, V. and Ellenbecker, M. (2001) Indicators of sustainable production: framework and methodology Journal of Cleaner Production. 9 (6).
Venkatesh, V., Brown, S.A. and Sullivan, Y.W. (2016) Guidelines for conducting mixed-methods research: An extension and illustration. Journal of the Association of Information Systems. 17 (7), pp.435–495.
Verma, P., Sharma, R.R.K. and Kumar, V. (2017) The sustainability issues of diversified firms in emerging economies context: A theoretical model and propositions International Journal of Process Management and Benchmarking. 7 (2), 224–248.
de Villiers, C., Rouse, P. and Kerr, J. (2016) A new conceptual model of influences driving sustainability based on case evidence of the integration of corporate sustainability management control and reporting. Journal of Cleaner Production. 136, Elsevier Ltd, pp.78–85.
Virginia, D. and Suzanne, B. (2001) Challenges in the development and use of ecological indicators. Ecological Indicators. 1, pp.3–10.
Voeten, J. and Tilburg University (2013) Internal Regulation of Innovation Externalities for Development: Lessons from Vietnam. International Workshop on ‘New Models of Innovation for Development’ at the University of Manchester. (July), pp.1–18.
Volberda, H.W., Foss, N.J. and Lyles, M.A. (2010) Absorbing the concept of absorptive capacity: How to realize its potential in the organization field. Organization Science. 21 (4),
429
pp.931–951.
Vu et al. (2019) Determinants of Vietnamese Listed Firm Performance: Competition, Wage, CEO, Firm Size, Age, and International Trade. Journal of Risk and Financial Management. 12 (2), p.62.
Wadongo, B. and Abdel-Kader, M. (2014) Contingency theory, performance management and organisational effectiveness in the third sector: A theoretical framework. International Journal of Productivity and Performance Management. 63 (6), pp.680–703.
Wahga, A.I., Blundel, R. and Schaefer, A. (2018) Understanding the drivers of sustainable entrepreneurial practices in Pakistan’s leather industry: A multi-level approach. International Journal of Entrepreneurial Behaviour and Research. 24 (2), pp.382–407.
Wahyuni, D. (2012) The research design maze: Understanding paradigms, cases, methods and methodologies. Journal of applied management accounting research. 10 (1), pp.69–80.
Wang, S. and Noe, R.A. (2009) Knowledge sharing: A review and directions for future research.
Warhurst, A. (2002) Sustainability Indicators and Sustainability Performance Management. World Business Council for Sustainable Development. 43 (43), p.129.
Wass, V. J., & Wells, P. E. (Eds.). (1994). Principles and practice in business and management research. Dartmouth.
Wattanapinyo, A. and Mol, A.P.J. (2013) Ecological modernization and environmental policy reform in thailand: The case of food processing SMEs. Sustainable Development. 21 (5), pp.309–323.
Weideman, M. (2018) The Influence of Flexible Work Arrangements on Employee Engagement: An Explorative Study. Gordon Institute of Business Science. (1), p.133.
Wesarat, P., Sharif, M.Y. and Abdul Majid, A.H. (2017) Role of Organizational Ethics in Sustainable Development: A Conceptual Framework. International Journal of Sustainable Future for Human Security. 5 (1), pp.67–76.
Wickert, C. (2014) “Political” Corporate Social Responsibility in Small- and Medium-Sized Enterprises: A Conceptual Framework. Business & Society. pp.1–33.
Wiengarten, F. et al. (2017) Complexity and the triple bottom line: an information-processing perspective. International Journal of Operations & Production Management. 37 (9), pp.1142–1163.
Wiesner, R., Chadee, D. and Best, P. (2017) Managing Change Toward Environmental Sustainability: A Conceptual Model in Small and Medium Enterprises. Organization & Environment. p.108602661668929.
Wiesner, R., Chadee, D. and Best, P. (2018) Managing Change Toward Environmental Sustainability: A Conceptual Model in Small and Medium Enterprises. Organization and Environment. 31 (2), pp.152–177.
430
Williams, P., Ashill, N. and Naumann, E. (2017) Toward a contingency theory of CRM adoption. Journal of Strategic Marketing. 25 (5–6), Routledge, pp.454–474.
Williams, T.A. and Shepherd, D.A. (2017) Mixed Method Social Network Analysis: Combining Inductive Concept Development, Content Analysis, and Secondary Data for Quantitative Analysis. Organizational Research Methods. 20 (2), pp.268–298.
Wilson, J., Tyedmers, P. and Pelot, R. (2007) Contrasting and comparing sustainable development indicator metrics. Ecological Indicators. 7 (2), pp.299–314.
Woods, M. (2011) Interviewing for research and analysing qualitative data : An overview. School of Humanities and Social Sciences, Massey University. pp.1–8.
World Commission on Economic Development (1987). Our common future. Oxford: Oxford University Press.
Wrana, J., Xuan, T. and Nguyen, T. (2019) ‘ Strategic coupling ’ and regional development in a transition economy : what can we learn from Vietnam ? ‘ Strategic coupling ’ and regional development in a Vietnam ? Area Development and Policy. 0 (0), Routledge, pp.1–12.
Wu, J.Z., Roan, J. and Santoso, C.H. (2017) Key factors for truly sustainable supply chain management: An investigation of the coal industry in Indonesia. International Journal of Logistics Management. 28 (4), pp.1196–1217.
Wu, K.J. et al. (2019) Sustainable development performance for small and medium enterprises using a fuzzy synthetic method-DEMATEL. Sustainability (Switzerland). 11 (15).
Xin, L. et al. (2020) Social capital and sustainable innovation in small businesses: Investigating the role of absorptive capacity, marketing capability and organizational learning. Sustainability (Switzerland). 12 (9).
Xu, X.Y. et al. (2021) The Migration of Viewers in Gaming Streaming: The Perspective of a Push-Pull-Mooring Model. International Journal of Human-Computer Interaction. 00 (00), Taylor & Francis, pp.1–17.
Yacob, P., Wong, L.S. and Khor, S.C. (2019) An empirical investigation of green initiatives and environmental sustainability for manufacturing SMEs. Journal of Manufacturing Technology Management. 30 (1), pp.2–25.
Yadav, N. et al. (2018) Drivers of Sustainability Practices and SMEs: A Systematic Literature Review. European Journal of Sustainable Development. 7 (4), pp.531–544.
Ye, J. and Kulathunga, K.M.M.C.B. (2019) How does financial literacy promote sustainability in SMEs? A developing country perspective. Sustainability (Switzerland). 11 (10), pp.1–21.
Yin, R.K., (2018). Case study research and applications. Sage.
Young, H.R. et al. (2018) Who are the most engaged at work? A meta-analysis of personality and employee engagement. Journal of Organizational Behavior. 39 (10), pp.1330–1346.
Yu, W. et al. (2018) Operations capability, productivity and business performance the moderating effect of environmental dynamism. Industrial Management and Data Systems. 118

431
(1), pp.126–143.
Yu, W. and Ramanathan, R. (2015) An empirical examination of stakeholder pressures, green operations practices and environmental performance. International Journal of Production Research. 53 (21), Taylor & Francis, pp.6390–6407.
Yu, W. and Ramanathan, R. (2016) Environmental management practices and environmental performance the roles of operations and marketing capabilities. Industrial Management and Data Systems. 116 (6), pp.1201–1222.
Yu, W., Ramanathan, R. and Nath, P. (2017) Environmental pressures and performance: An analysis of the roles of environmental innovation strategy and marketing capability. Technological Forecasting and Social Change. 117, Elsevier Inc., pp.160–169.
Yusof, S.M. and Aspinwall, E. (2000) Total quality management implementation frameworks: Comparison and review. Total Quality Management. 11 (3), pp.281–294.
Yusoff, H., Jamal, A.D.A. and Darus, F. (2016) Corporate governance and corporate social responsibility disclosure: An Emphasis on the CSR key dimensions. Journal of Accounting and Auditing: Research & Practice. 2016 (1), pp.1–14.
Yusoff, R.B.M. et al. (2016) Investigating the relationship of employee empowerment and sustainable manufacturing performance. International Review of Management and Marketing. 6 (4), pp.284–290.
Zahra, S.A. and George, G. (2002) Absorptive capacity: A review, reconceptualization, and extension. Academy of Management Review. 27 (2), pp.185–203.
Zarrinabadi, N., Rezazadeh, M. and Chehrazi, A. (2021) The links between grammar learning strategies and language mindsets among L2 and L3 learners: examining the role of and gender. International Journal of Multilingualism. 0 (0), Taylor & Francis, pp.1–18.
Zhang, A. et al. (2019a) Barriers to smart waste management for a circular economy in China. Journal of Cleaner Production. Elsevier Ltd, p.118198.
Zhang, B., Bi, J. and Liu, B. (2009) Drivers and barriers to engage enterprises in environmental management initiatives in Suzhou Industrial Park, China. Frontiers of Environmental Science and Engineering in China. 3 (2), pp.210–220.
Zhang, D. and Morse, S. (2014) Evolving corporate social responsibility in China. Sustainability. 6 (11), pp.7646–7665.
Zhang, Q. et al. (2019b) Drivers , motivations , and barriers to the implementation of corporate social responsibility practices by construction enterprises : A review. Journal of Cleaner Production. 210, Elsevier Ltd, pp.563–584.
Zhu, L., Kara, O. and Zhu, X. (2019) A comparative study of women entrepreneurship in transitional economies: The case of China and Vietnam. Journal of Entrepreneurship in Emerging Economies. 11 (1), pp.66–80.
Zhu, Q. et al. (2008) Firm-level correlates of emergent green supply chain management practices in the Chinese context. Omega. 36 (4), pp.577–591.
432
Zorpas, A. (2010) Environmental management systems as sustainable tools in the way of life for the SMEs and VSMEs. Bioresource Technology. 101 (6), Elsevier Ltd, pp.1544–1557.
Zulu-Chisanga, S., Chabala, M. and Mandawa-Bray, B. (2020) The differential effects of government support, inter-firm collaboration and firm resources on SME performance in a developing economy. Journal of Entrepreneurship in Emerging Economies. 13 (2), pp.175–195.
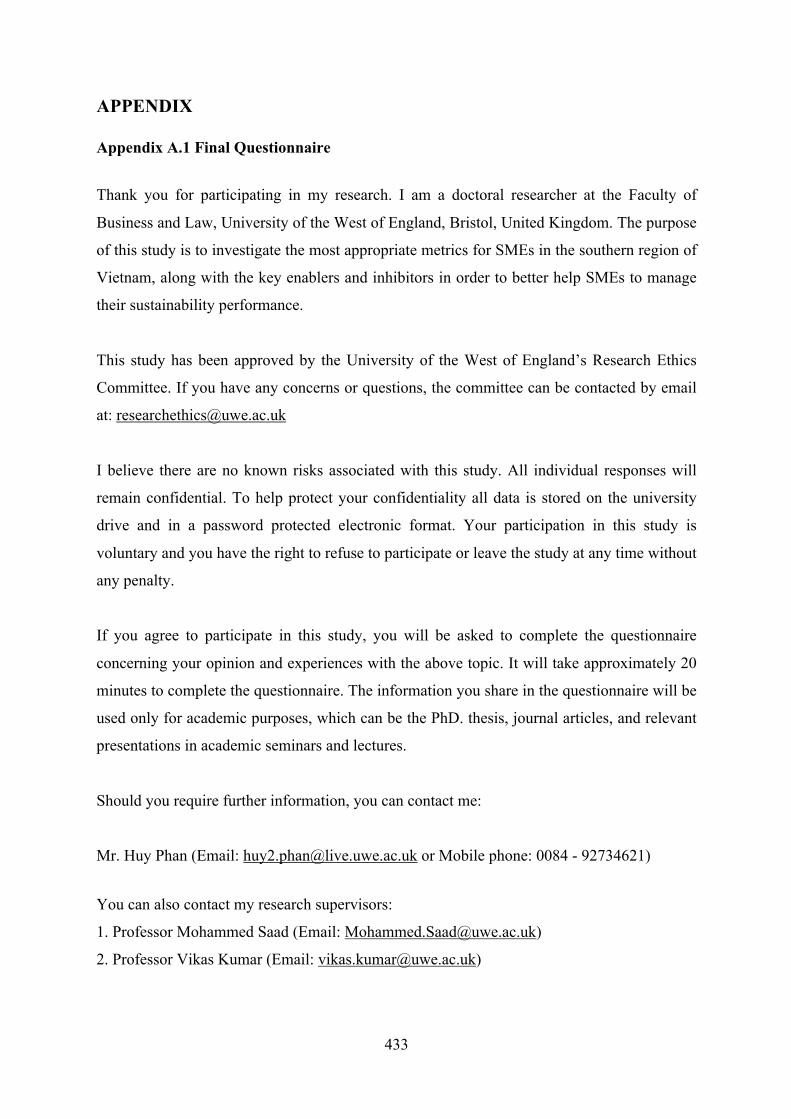
433
APPENDIX
Appendix A.1 Final Questionnaire
Thank you for participating in my research. I am a doctoral researcher at the Faculty of
Business and Law, University of the West of England, Bristol, United Kingdom. The purpose
of this study is to investigate the most appropriate metrics for SMEs in the southern region of
Vietnam, along with the key enablers and inhibitors in order to better help SMEs to manage
their sustainability performance.
This study has been approved by the University of the West of England’s Research Ethics
Committee. If you have any concerns or questions, the committee can be contacted by email
I believe there are no known risks associated with this study. All individual responses will
remain confidential. To help protect your confidentiality all data is stored on the university
drive and in a password protected electronic format. Your participation in this study is
voluntary and you have the right to refuse to participate or leave the study at any time without
any penalty.
If you agree to participate in this study, you will be asked to complete the questionnaire
concerning your opinion and experiences with the above topic. It will take approximately 20
minutes to complete the questionnaire. The information you share in the questionnaire will be
used only for academic purposes, which can be the PhD. thesis, journal articles, and relevant
presentations in academic seminars and lectures.
Should you require further information, you can contact me:
Mr. Huy Phan (Email: [email protected] or Mobile phone: 0084 - 92734621)
You can also contact my research supervisors:
1. Professor Mohammed Saad (Email: [email protected])
2. Professor Vikas Kumar (Email: [email protected])

434
If you would like to have a copy of the research findings, please provide your email address in
the last section of this questionnaire.
Thank you.
Electronic Consent
Thank you for taking part, your help is greatly appreciated.
Before we begin, please read the following points:
• I have had the opportunity to read the information on the previous page
• I am over the age of 18.
• I understand that:
o My participation is voluntary.
o I am free to withdraw at any time without giving a reason.
o I will never be personally identified in any report or write up those stems from
this research.
o All information I provide will be treated as confidential and used for research
purposes only.
o The data collected will be held and processed by the researcher for the purposes
of research.
Please click the button below to begin
Clicking “I agree” button means you understand and agree with the above points.
I agree, begin the study
I disagree, I do not wish to participate
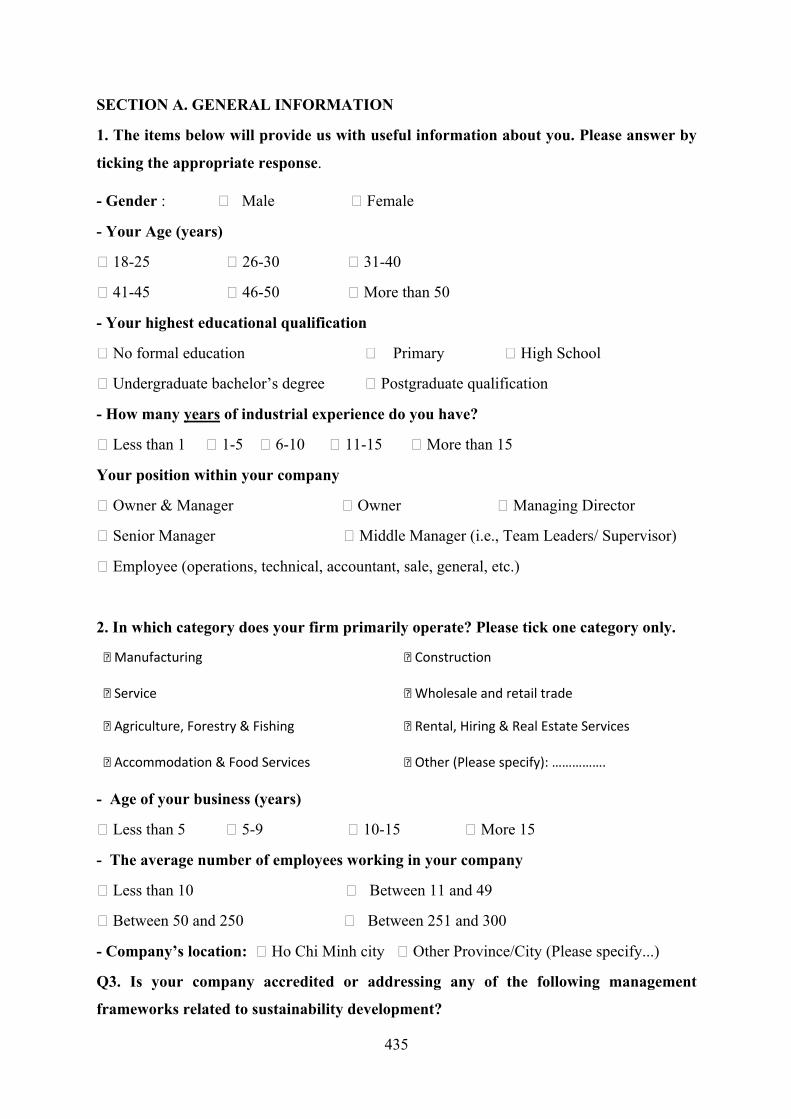
435
SECTION A. GENERAL INFORMATION
1. The items below will provide us with useful information about you. Please answer by
ticking the appropriate response.
- Gender : � Male � Female
- Your Age (years)
� 18-25 � 26-30 � 31-40
� 41-45 � 46-50 � More than 50
- Your highest educational qualification
� No formal education � Primary � High School
� Undergraduate bachelor’s degree � Postgraduate qualification
- How many years of industrial experience do you have?
� Less than 1 � 1-5 � 6-10 � 11-15 � More than 15
Your position within your company
� Owner & Manager � Owner � Managing Director
� Senior Manager � Middle Manager (i.e., Team Leaders/ Supervisor)
� Employee (operations, technical, accountant, sale, general, etc.)
2. In which category does your firm primarily operate? Please tick one category only.
� Manufacturing � Construction
� Service � Wholesale and retail trade
� Agriculture, Forestry & Fishing
� Rental, Hiring & Real Estate Services
� Accommodation & Food Services
� Other (Please specify): …………….
- Age of your business (years)
� Less than 5 � 5-9 � 10-15 � More 15
- The average number of employees working in your company
� Less than 10 � Between 11 and 49
� Between 50 and 250 � Between 251 and 300
- Company’s location: � Ho Chi Minh city � Other Province/City (Please specify...)
Q3. Is your company accredited or addressing any of the following management
frameworks related to sustainability development?

436
Accredited:
� ISO14001 � ISO 9001 � EMAS � 5S; Kaizen � None
Others (please specify):
Addressing:
� ISO14001 � ISO 9001 � EMAS � 5S; Kaizen � None
Others (please specify):
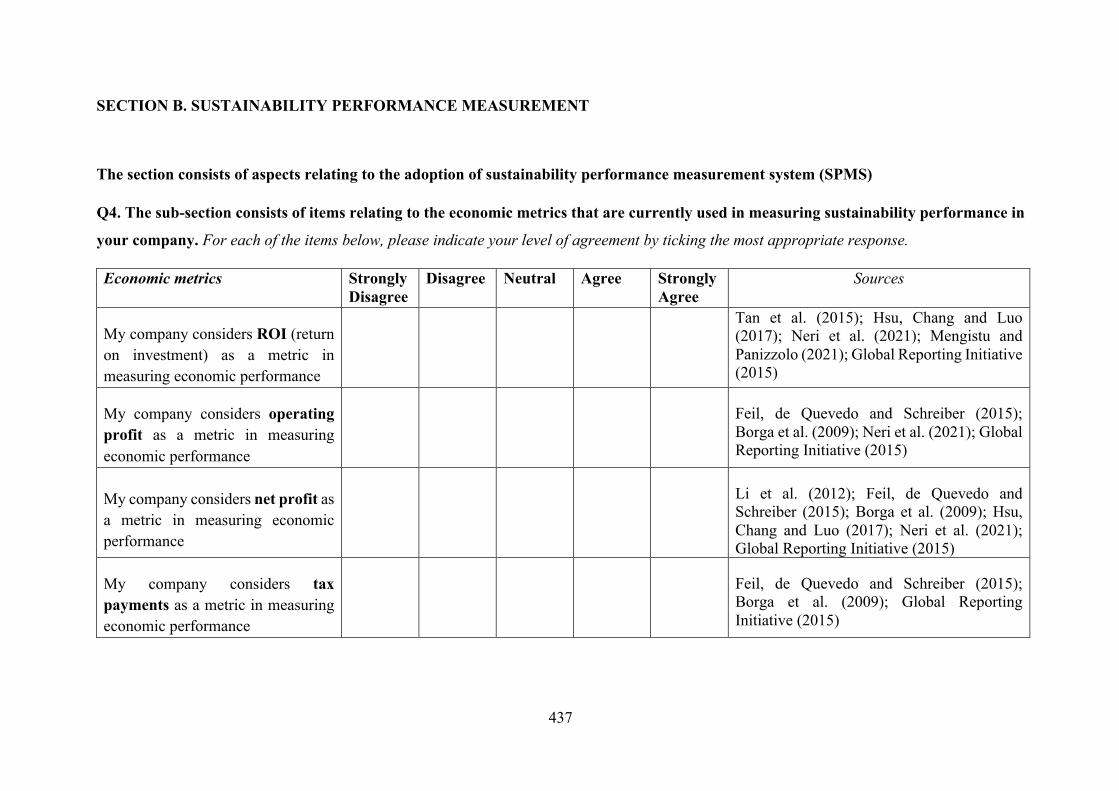
437
SECTION B. SUSTAINABILITY PERFORMANCE MEASUREMENT
The section consists of aspects relating to the adoption of sustainability performance measurement system (SPMS)
Q4. The sub-section consists of items relating to the economic metrics that are currently used in measuring sustainability performance in
your company. For each of the items below, please indicate your level of agreement by ticking the most appropriate response.
Economic metrics Strongly Disagree
Disagree Neutral Agree Strongly Agree
Sources
My company considers ROI (return on investment) as a metric in measuring economic performance
Tan et al. (2015); Hsu, Chang and Luo (2017); Neri et al. (2021); Mengistu and Panizzolo (2021); Global Reporting Initiative (2015)
My company considers operating profit as a metric in measuring economic performance
Feil, de Quevedo and Schreiber (2015); Borga et al. (2009); Neri et al. (2021); Global Reporting Initiative (2015)
My company considers net profit as a metric in measuring economic performance
Li et al. (2012); Feil, de Quevedo and Schreiber (2015); Borga et al. (2009); Hsu, Chang and Luo (2017); Neri et al. (2021); Global Reporting Initiative (2015)
My company considers tax payments as a metric in measuring economic performance
Feil, de Quevedo and Schreiber (2015); Borga et al. (2009); Global Reporting Initiative (2015)

438
My company considers operational costs as a metric in measuring economic performance
Singh, Olugu and Fallahpour (2014); Feil, de Quevedo and Schreiber (2015); Tan et al. (2015);Borga et al. (2009); Neri et al. (2021); Mengistu and Panizzolo (2021); Global Reporting Initiative (2015)
My company considers R&D expenditure as a metric in measuring economic performance
Li et al. (2012); Tan et al. (2015); Borga et al. (2009); Hsu, Chang and Luo (2017); Neri et al. (2021); Global Reporting Initiative (2015)
Q5. This sub-section consists of items relating to the social metrics that are currently used in measuring sustainability performance in
your company. For each of the items below, please indicate your level of agreement by ticking the most appropriate response.
Social metrics Strongly Disagree Disagree Neutral Agree Strongly
Agree Sources
My company considers employee job satisfaction as a metric in measuring social performance
Kocmanova and Docekalova (2011); Li et al. (2012); Feil, de Quevedo and Schreiber (2015); Hsu, Chang and Luo (2017); Neri et al. (2021); Mengistu and Panizzolo (2021); Global Reporting Initiative (2015)
My company considers employee training as a metric in measuring social performance
Kocmanova and Docekalova, 2011; Singh, Olugu and Fallahpour (2014); Feil, de Quevedo and Schreiber (2015); Tan et al. (2015); Arena and Azzone, 2012; Borga et al. (2009); Hsu, Chang and Luo (2017); Neri et al. (2021); Mengistu and Panizzolo (2021); Global Reporting Initiative (2015)
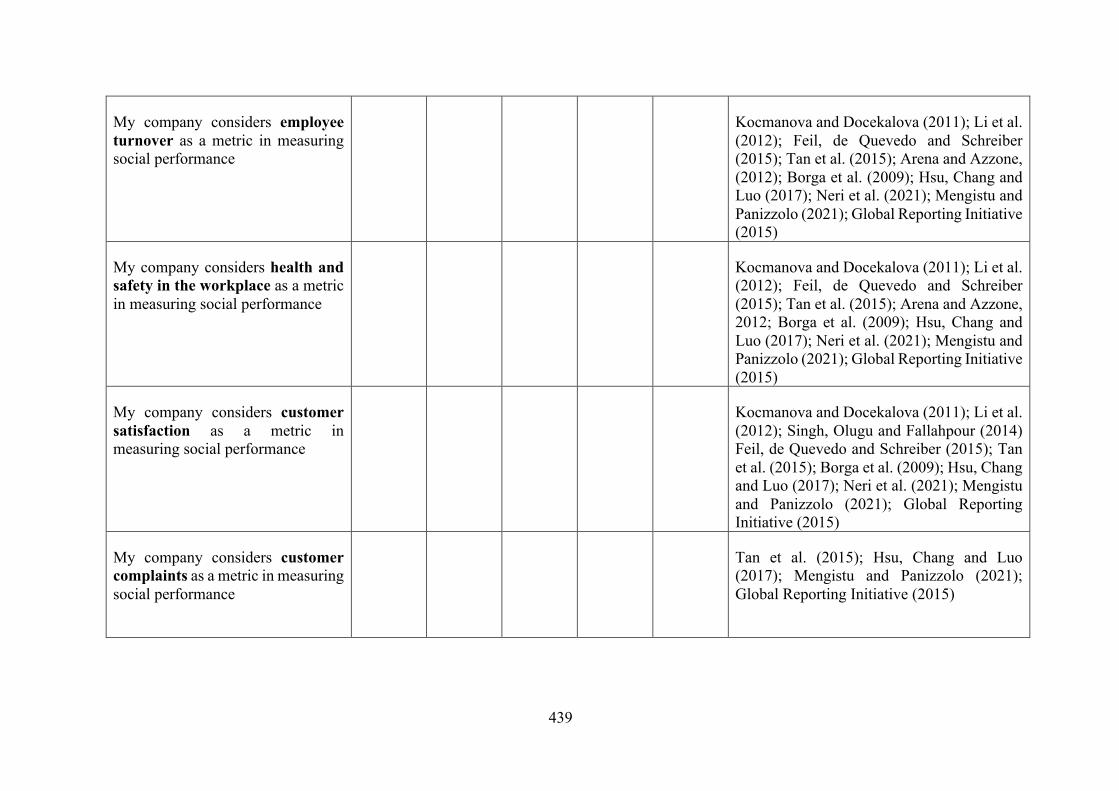
439
My company considers employee turnover as a metric in measuring social performance
Kocmanova and Docekalova (2011); Li et al. (2012); Feil, de Quevedo and Schreiber (2015); Tan et al. (2015); Arena and Azzone, (2012); Borga et al. (2009); Hsu, Chang and Luo (2017); Neri et al. (2021); Mengistu and Panizzolo (2021); Global Reporting Initiative (2015)
My company considers health and safety in the workplace as a metric in measuring social performance
Kocmanova and Docekalova (2011); Li et al. (2012); Feil, de Quevedo and Schreiber (2015); Tan et al. (2015); Arena and Azzone, 2012; Borga et al. (2009); Hsu, Chang and Luo (2017); Neri et al. (2021); Mengistu and Panizzolo (2021); Global Reporting Initiative (2015)
My company considers customer satisfaction as a metric in measuring social performance
Kocmanova and Docekalova (2011); Li et al. (2012); Singh, Olugu and Fallahpour (2014) Feil, de Quevedo and Schreiber (2015); Tan et al. (2015); Borga et al. (2009); Hsu, Chang and Luo (2017); Neri et al. (2021); Mengistu and Panizzolo (2021); Global Reporting Initiative (2015)
My company considers customer complaints as a metric in measuring social performance
Tan et al. (2015); Hsu, Chang and Luo (2017); Mengistu and Panizzolo (2021); Global Reporting Initiative (2015)
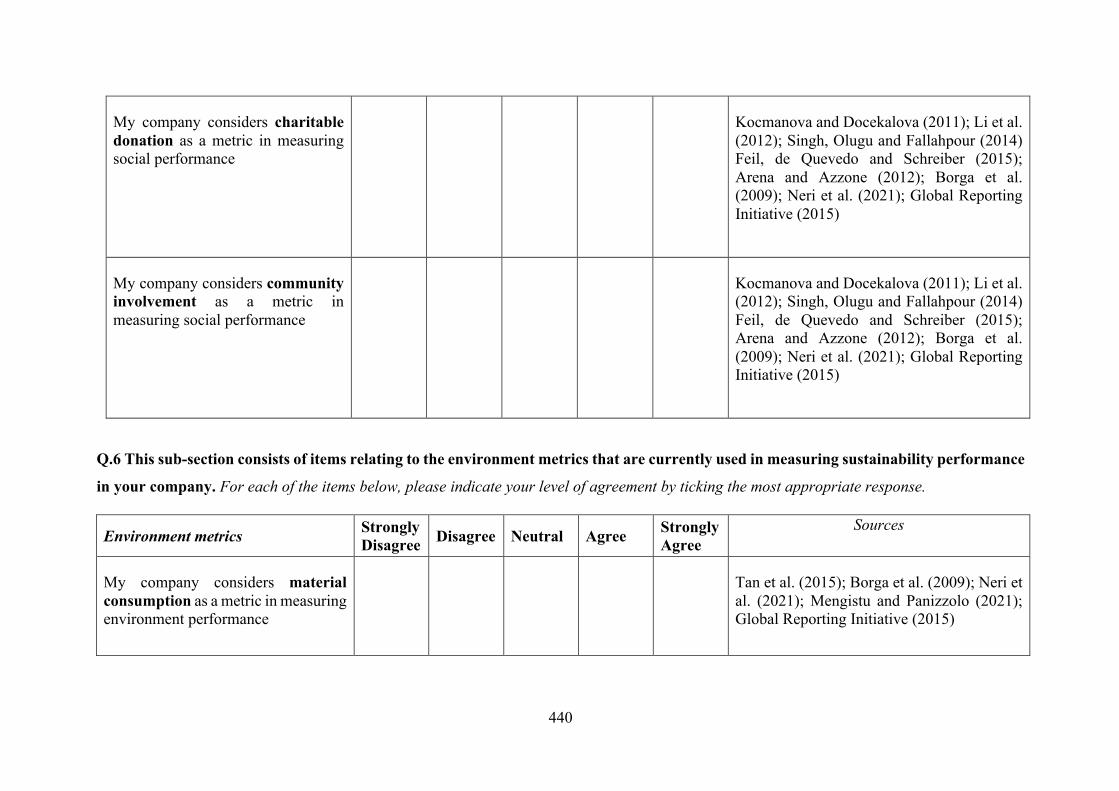
440
My company considers charitable donation as a metric in measuring social performance
Kocmanova and Docekalova (2011); Li et al. (2012); Singh, Olugu and Fallahpour (2014) Feil, de Quevedo and Schreiber (2015); Arena and Azzone (2012); Borga et al. (2009); Neri et al. (2021); Global Reporting Initiative (2015)
My company considers community involvement as a metric in measuring social performance
Kocmanova and Docekalova (2011); Li et al. (2012); Singh, Olugu and Fallahpour (2014) Feil, de Quevedo and Schreiber (2015); Arena and Azzone (2012); Borga et al. (2009); Neri et al. (2021); Global Reporting Initiative (2015)
Q.6 This sub-section consists of items relating to the environment metrics that are currently used in measuring sustainability performance
in your company. For each of the items below, please indicate your level of agreement by ticking the most appropriate response.
Environment metrics Strongly Disagree Disagree Neutral Agree Strongly
Agree Sources
My company considers material consumption as a metric in measuring environment performance
Tan et al. (2015); Borga et al. (2009); Neri et al. (2021); Mengistu and Panizzolo (2021); Global Reporting Initiative (2015)

441
My company considers raw material efficiency as a metric in measuring environment performance
Kocmanova and Docekalova (2011); Li et al. (2012); Singh, Olugu and Fallahpour (2014); Feil, de Quevedo and Schreiber (2015); Tan et al. (2015); Arena and Azzone, 2012; Borga et al. (2009); Neri et al. (2021); Mengistu and Panizzolo (2021); Global Reporting Initiative (2015)
My company considers recyclable raw materials as a metric in measuring environment performance
Kocmanova and Docekalova (2011); Li et al. (2012); Feil, de Quevedo and Schreiber (2015); Tan et al. (2015); Borga et al. (2009); Hsu, Chang and Luo (2017); Neri et al. (2021); Mengistu and Panizzolo (2021); Global Reporting Initiative (2015)
My company considers energy consumption as a metric in measuring environment performance
Kocmanova and Docekalova, 2011; Li et al. (2012); Singh, Olugu and Fallahpour (2014); Feil, de Quevedo and Schreiber (2015); Tan et al. (2015); Arena and Azzone, 2012; Borga et al. (2009); Neri et al. (2021); Mengistu and Panizzolo (2021); Global Reporting Initiative (2015)
My company considers energy cost as a metric in measuring environment performance
Tan et al. (2015); Neri et al. (2021); Mengistu and Panizzolo (2021); Global Reporting Initiative (2015)
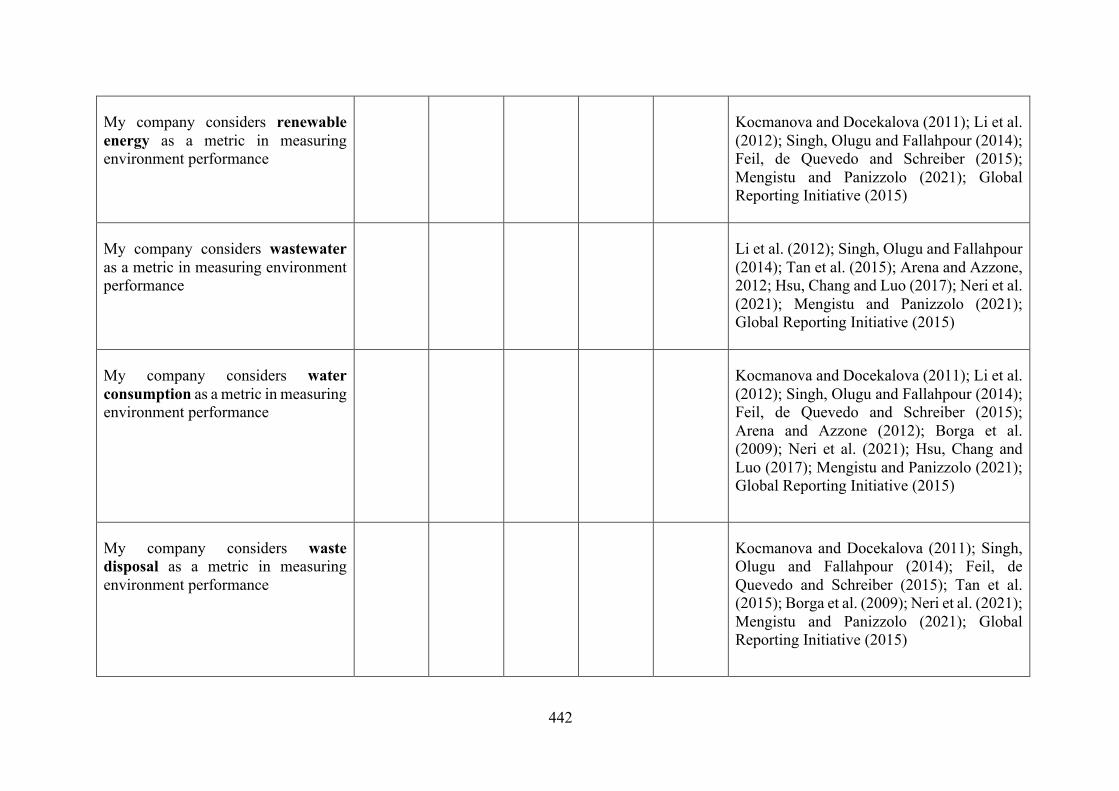
442
My company considers renewable energy as a metric in measuring environment performance
Kocmanova and Docekalova (2011); Li et al. (2012); Singh, Olugu and Fallahpour (2014); Feil, de Quevedo and Schreiber (2015); Mengistu and Panizzolo (2021); Global Reporting Initiative (2015)
My company considers wastewater as a metric in measuring environment performance
Li et al. (2012); Singh, Olugu and Fallahpour (2014); Tan et al. (2015); Arena and Azzone, 2012; Hsu, Chang and Luo (2017); Neri et al. (2021); Mengistu and Panizzolo (2021); Global Reporting Initiative (2015)
My company considers water consumption as a metric in measuring environment performance
Kocmanova and Docekalova (2011); Li et al. (2012); Singh, Olugu and Fallahpour (2014); Feil, de Quevedo and Schreiber (2015); Arena and Azzone (2012); Borga et al. (2009); Neri et al. (2021); Hsu, Chang and Luo (2017); Mengistu and Panizzolo (2021); Global Reporting Initiative (2015)
My company considers waste disposal as a metric in measuring environment performance
Kocmanova and Docekalova (2011); Singh, Olugu and Fallahpour (2014); Feil, de Quevedo and Schreiber (2015); Tan et al. (2015); Borga et al. (2009); Neri et al. (2021); Mengistu and Panizzolo (2021); Global Reporting Initiative (2015)
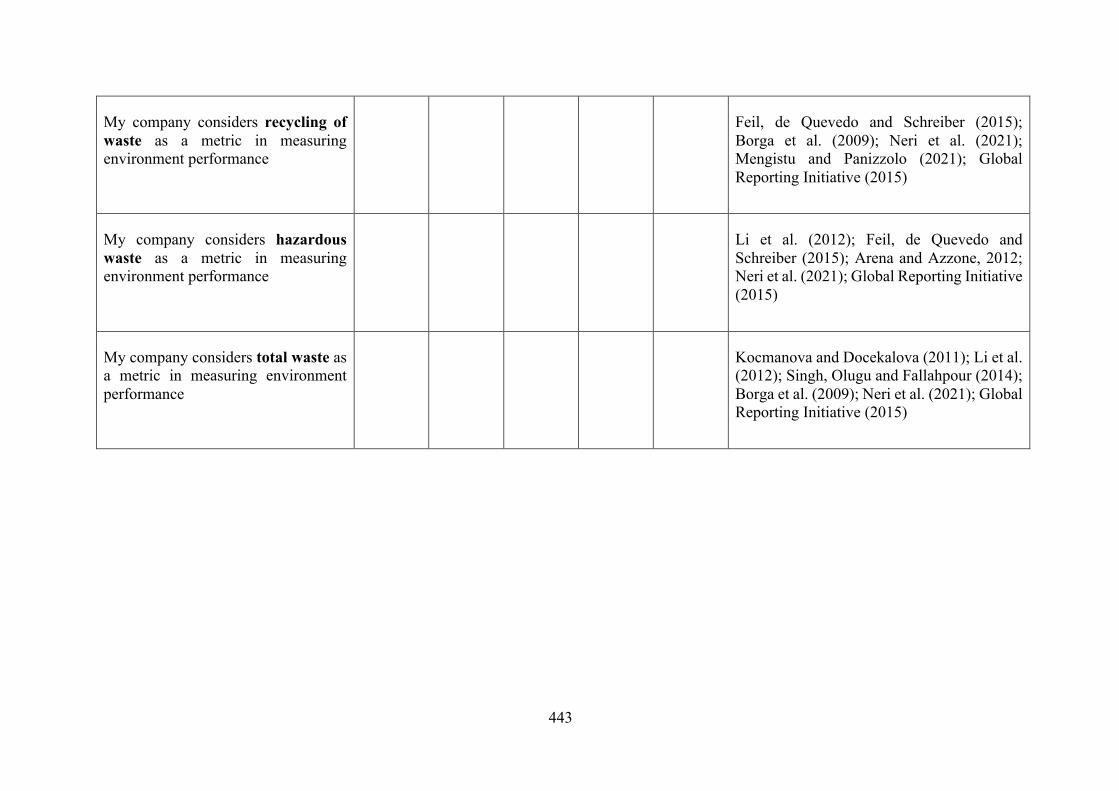
443
My company considers recycling of waste as a metric in measuring environment performance
Feil, de Quevedo and Schreiber (2015); Borga et al. (2009); Neri et al. (2021); Mengistu and Panizzolo (2021); Global Reporting Initiative (2015)
My company considers hazardous waste as a metric in measuring environment performance
Li et al. (2012); Feil, de Quevedo and Schreiber (2015); Arena and Azzone, 2012; Neri et al. (2021); Global Reporting Initiative (2015)
My company considers total waste as a metric in measuring environment performance
Kocmanova and Docekalova (2011); Li et al. (2012); Singh, Olugu and Fallahpour (2014); Borga et al. (2009); Neri et al. (2021); Global Reporting Initiative (2015)
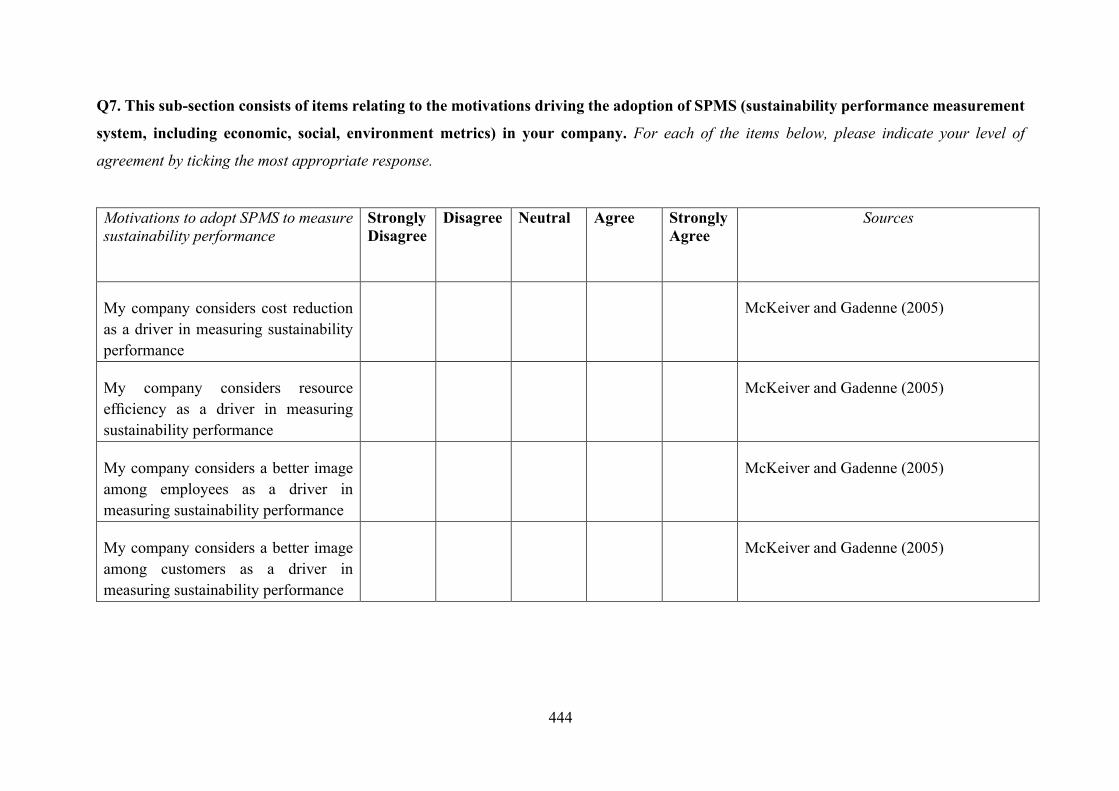
444
Q7. This sub-section consists of items relating to the motivations driving the adoption of SPMS (sustainability performance measurement
system, including economic, social, environment metrics) in your company. For each of the items below, please indicate your level of
agreement by ticking the most appropriate response.
Motivations to adopt SPMS to measure sustainability performance
Strongly Disagree
Disagree Neutral Agree Strongly Agree
Sources
My company considers cost reduction as a driver in measuring sustainability performance
McKeiver and Gadenne (2005)
My company considers resource efficiency as a driver in measuring sustainability performance
McKeiver and Gadenne (2005)
My company considers a better image among employees as a driver in measuring sustainability performance
McKeiver and Gadenne (2005)
My company considers a better image among customers as a driver in measuring sustainability performance
McKeiver and Gadenne (2005)
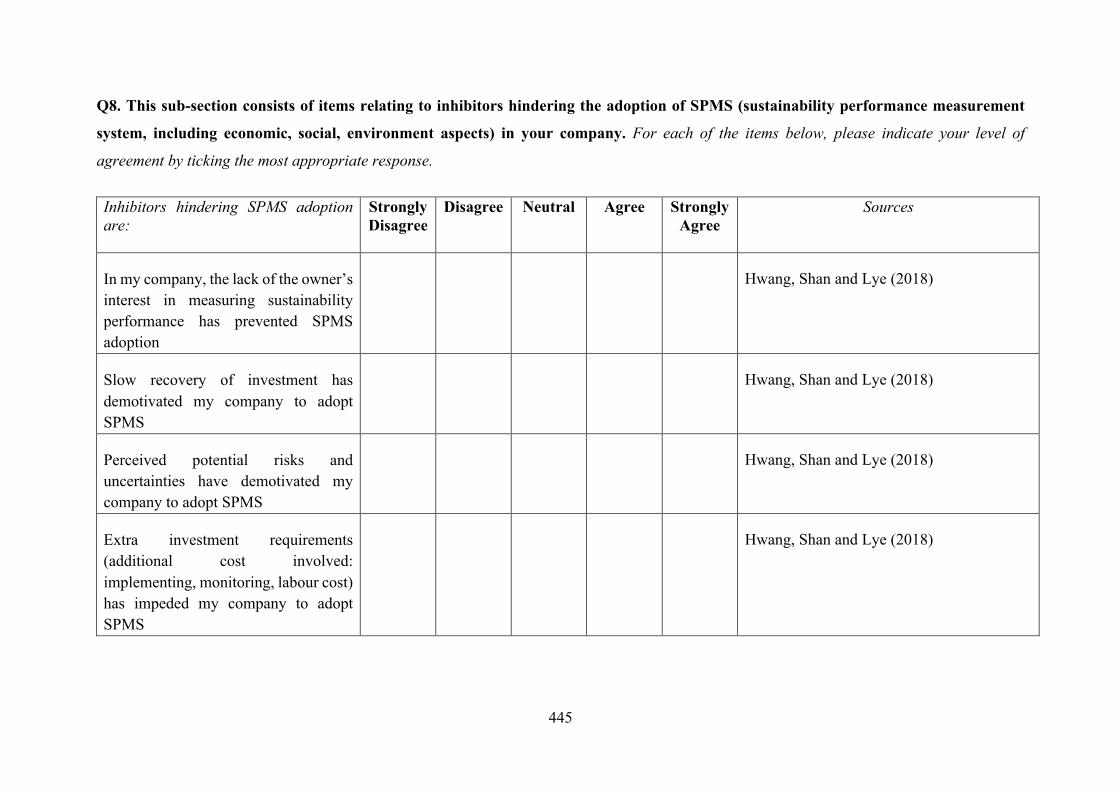
445
Q8. This sub-section consists of items relating to inhibitors hindering the adoption of SPMS (sustainability performance measurement
system, including economic, social, environment aspects) in your company. For each of the items below, please indicate your level of
agreement by ticking the most appropriate response.
Inhibitors hindering SPMS adoption are:
Strongly Disagree
Disagree Neutral Agree Strongly Agree
Sources
In my company, the lack of the owner’s interest in measuring sustainability performance has prevented SPMS adoption
Hwang, Shan and Lye (2018)
Slow recovery of investment has demotivated my company to adopt SPMS
Hwang, Shan and Lye (2018)
Perceived potential risks and uncertainties have demotivated my company to adopt SPMS
Hwang, Shan and Lye (2018)
Extra investment requirements (additional cost involved: implementing, monitoring, labour cost) has impeded my company to adopt SPMS
Hwang, Shan and Lye (2018)

446
Limited sustainability knowledge and expertise has impeded my company to adopt SPMS
Hwang, Shan and Lye (2018)
Lack of sustainability measurement tool/framework can delay or hinder my company to adopt SPMS
Hwang, Shan and Lye (2018)
Q9. This sub-section consists of items relating to enablers facilitating the adoption of SPMS (sustainability performance measurement
system, including economic, social, environment aspects) in your firm. For each of the items below, please indicate your level of agreement
by ticking the most appropriate response.
Enablers facilitating SPMS adoption are:
Strongly Disagree
Disagree Neutral Agree Strongly Agree
Sources
In my company, top management team should communicate a clear and positive vision of measuring sustainability performance
Eikelenboom and de Jong (2019)
In my company, top management team needs to be actively committed and involved during the process of SPMS adoption
Nguyen and Tran (2020)
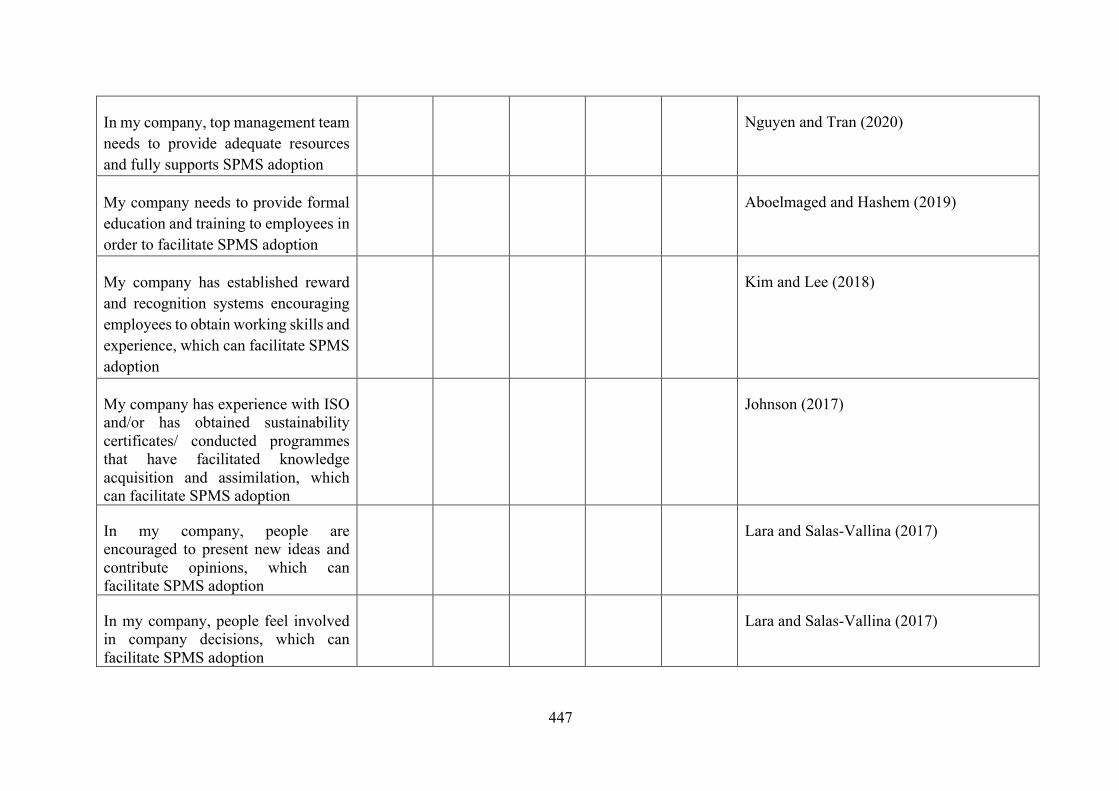
447
In my company, top management team needs to provide adequate resources and fully supports SPMS adoption
Nguyen and Tran (2020)
My company needs to provide formal education and training to employees in order to facilitate SPMS adoption
Aboelmaged and Hashem (2019)
My company has established reward and recognition systems encouraging employees to obtain working skills and experience, which can facilitate SPMS adoption
Kim and Lee (2018)
My company has experience with ISO and/or has obtained sustainability certificates/ conducted programmes that have facilitated knowledge acquisition and assimilation, which can facilitate SPMS adoption
Johnson (2017)
In my company, people are encouraged to present new ideas and contribute opinions, which can facilitate SPMS adoption
Lara and Salas-Vallina (2017)
In my company, people feel involved in company decisions, which can facilitate SPMS adoption
Lara and Salas-Vallina (2017)
448
In my company, free and open communication is encouraged, which can facilitate SPMS adoption
Lara and Salas-Vallina (2017)
SECTION 4. EXTERNAL FACTORS INFLUENCING THE ADOPTION OF SUSTAINABILITY PERFORMANCE MEASUREMENT
The section consists of external factors influencing the adoption of SPMS (sustainability performance measurement system)
10. The sub-section consists of items relating to external barriers preventing the adoption of SPMS (sustainability performance
measurement system, including economic, social, environment metrics) in your company. For each of the items below, please indicate your
level of agreement by ticking the most appropriate response.
Particulars Strongly
Disagree Disagree Neutral Agree Strongly
Agree Sources
Lack of government support in terms of information or seminars/workshops related to sustainable development has demotivated my company to adopt SPMS
Hwang, Shan and Lye (2018)
Lack of government laws and regulations sustainable development has prevented my company to adopt SPMS
Pham, Yong and Truong (2019)
449
Lack of economic incentives and rewards from the government for corporate sustainability engagement have demotivated my company to adopt SPMS
Hwang, Shan and Lye (2018)
Lack of local consumer demand for sustainable products/services has demotivated my company to adopt SPMS.
Hwang, Shan and Lye (2018)
Thank you very much for answering this questionnaire.

450
Appendix A.2 Measurement Model (SEM)
Regression Weights: (Group number 1 - Default model)
Estimate S.E. C.R. P Label PSM <--- TOP .111 .036 3.064 .002 par_26 PSM <--- ACA .196 .030 6.521 *** par_27 PSM <--- OLC .234 .037 6.251 *** par_28 PSM <--- EXB -.080 .022 -3.597 *** par_29 PSM <--- INH -.085 .023 -3.680 *** par_30 PSM <--- MOT .285 .034 8.402 *** par_31 SOM <--- PSM 1.000 ENM <--- PSM 1.000 ECM <--- PSM 1.000 ENM9 <--- ENM 1.000 ENM8 <--- ENM .961 .033 29.134 *** par_1 ENM11 <--- ENM 1.055 .045 23.695 *** par_2 ENM12 <--- ENM 1.058 .044 23.930 *** par_3 ENM10 <--- ENM 1.131 .056 20.223 *** par_4 LMP3 <--- INH 1.000 INS3 <--- INH 1.396 .075 18.596 *** par_5 INS2 <--- INH 1.280 .070 18.273 *** par_6 LMP2 <--- INH 1.090 .062 17.675 *** par_7 INS1 <--- INH 1.105 .067 16.537 *** par_8 MOT4 <--- MOT 1.000 MOT2 <--- MOT .993 .064 15.597 *** par_9 MOT1 <--- MOT 1.051 .068 15.458 *** par_10 MOT3 <--- MOT .964 .064 14.960 *** par_11 ECM3 <--- ECM 1.000 ECM2 <--- ECM 1.036 .070 14.702 *** par_12 ECM1 <--- ECM 1.090 .074 14.640 *** par_13 ECM5 <--- ECM .922 .071 13.061 *** par_14 EXB1 <--- EXB 1.000 EXB3 <--- EXB 1.008 .078 12.921 *** par_15 EXB2 <--- EXB .824 .067 12.368 *** par_16 SOM5 <--- SOM 1.000 SOM6 <--- SOM 1.057 .069 15.314 *** par_17 SOM2 <--- SOM .868 .062 13.966 *** par_18 TOP2 <--- TOP 1.000 TOP1 <--- TOP .911 .071 12.801 *** par_19 TOP3 <--- TOP .845 .068 12.444 *** par_20 ACA2 <--- ACA 1.000 ACA3 <--- ACA .917 .068 13.492 *** par_21 ACA1 <--- ACA .835 .064 12.963 *** par_22 OLC2 <--- OLC 1.000
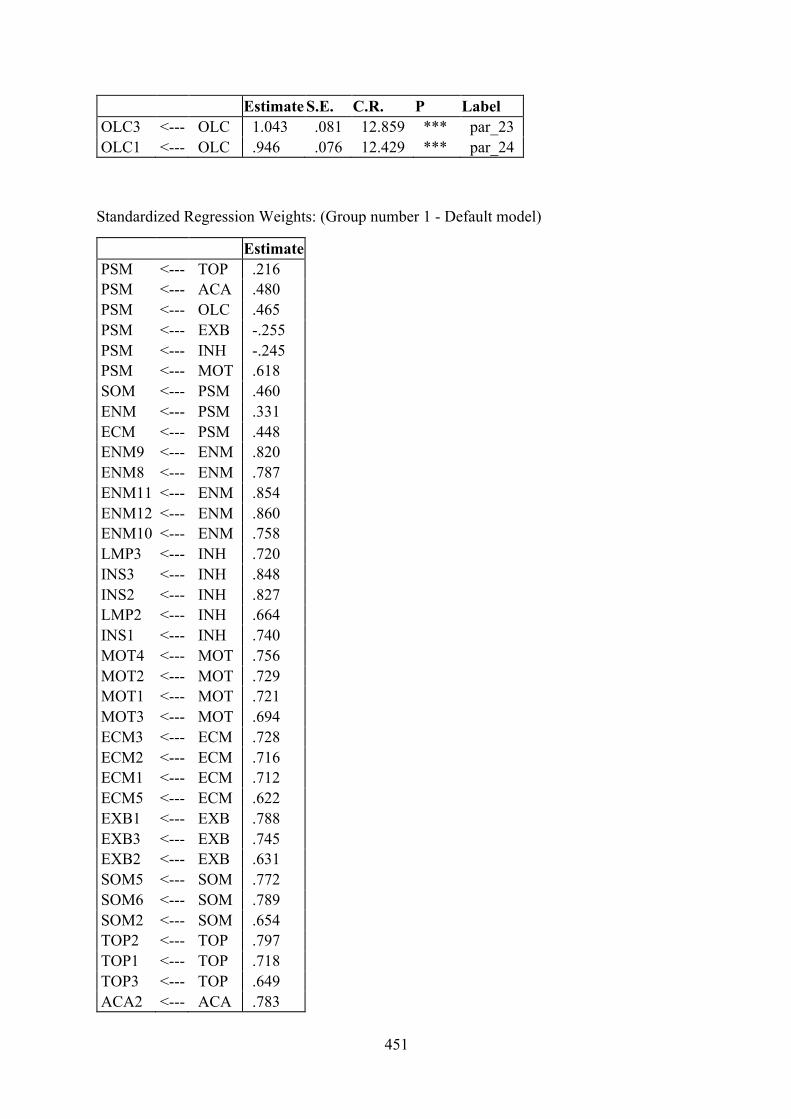
451
Estimate S.E. C.R. P Label OLC3 <--- OLC 1.043 .081 12.859 *** par_23 OLC1 <--- OLC .946 .076 12.429 *** par_24
Standardized Regression Weights: (Group number 1 - Default model)
Estimate PSM <--- TOP .216 PSM <--- ACA .480 PSM <--- OLC .465 PSM <--- EXB -.255 PSM <--- INH -.245 PSM <--- MOT .618 SOM <--- PSM .460 ENM <--- PSM .331 ECM <--- PSM .448 ENM9 <--- ENM .820 ENM8 <--- ENM .787 ENM11 <--- ENM .854 ENM12 <--- ENM .860 ENM10 <--- ENM .758 LMP3 <--- INH .720 INS3 <--- INH .848 INS2 <--- INH .827 LMP2 <--- INH .664 INS1 <--- INH .740 MOT4 <--- MOT .756 MOT2 <--- MOT .729 MOT1 <--- MOT .721 MOT3 <--- MOT .694 ECM3 <--- ECM .728 ECM2 <--- ECM .716 ECM1 <--- ECM .712 ECM5 <--- ECM .622 EXB1 <--- EXB .788 EXB3 <--- EXB .745 EXB2 <--- EXB .631 SOM5 <--- SOM .772 SOM6 <--- SOM .789 SOM2 <--- SOM .654 TOP2 <--- TOP .797 TOP1 <--- TOP .718 TOP3 <--- TOP .649 ACA2 <--- ACA .783

452
Estimate ACA3 <--- ACA .737 ACA1 <--- ACA .656 OLC2 <--- OLC .742 OLC3 <--- OLC .752 OLC1 <--- OLC .649
Parsimony-Adjusted Measures
Model PRATIO PNFI PCFI Default model .922 .781 .826 Saturated model .000 .000 .000 Independence model 1.000 .000 .000
Appendix A.3 Structural Equation Modelling
Regression Weights: (Group number 1 - Default model)
Estimate S.E. C.R. P Label SOM <--- PMS 1.000 ECM <--- PMS 1.000 ENM <--- PMS 1.000 ENM9 <--- ENM 1.000 ENM8 <--- ENM .961 .033 29.554 *** par_1 ENM11 <--- ENM 1.064 .044 24.396 *** par_2 ENM12 <--- ENM 1.060 .043 24.460 *** par_3 ENM10 <--- ENM 1.128 .055 20.479 *** par_4 LMP3 <--- INH 1.000 INS3 <--- INH 1.292 .065 19.803 *** par_5 INS2 <--- INH 1.200 .061 19.579 *** par_6 LMP2 <--- INH 1.100 .066 16.739 *** par_7 INS1 <--- INH 1.062 .059 17.855 *** par_8 MOT4 <--- MOT 1.000 MOT2 <--- MOT 1.006 .063 15.908 *** par_9 MOT1 <--- MOT 1.040 .067 15.441 *** par_10 MOT3 <--- MOT .991 .064 15.426 *** par_11 ECM3 <--- ECM 1.000 ECM2 <--- ECM 1.050 .068 15.537 *** par_12 ECM1 <--- ECM 1.126 .072 15.710 *** par_13 ECM5 <--- ECM .953 .068 13.935 *** par_14 EXB1 <--- EXB 1.000 EXB3 <--- EXB 1.002 .070 14.222 *** par_15
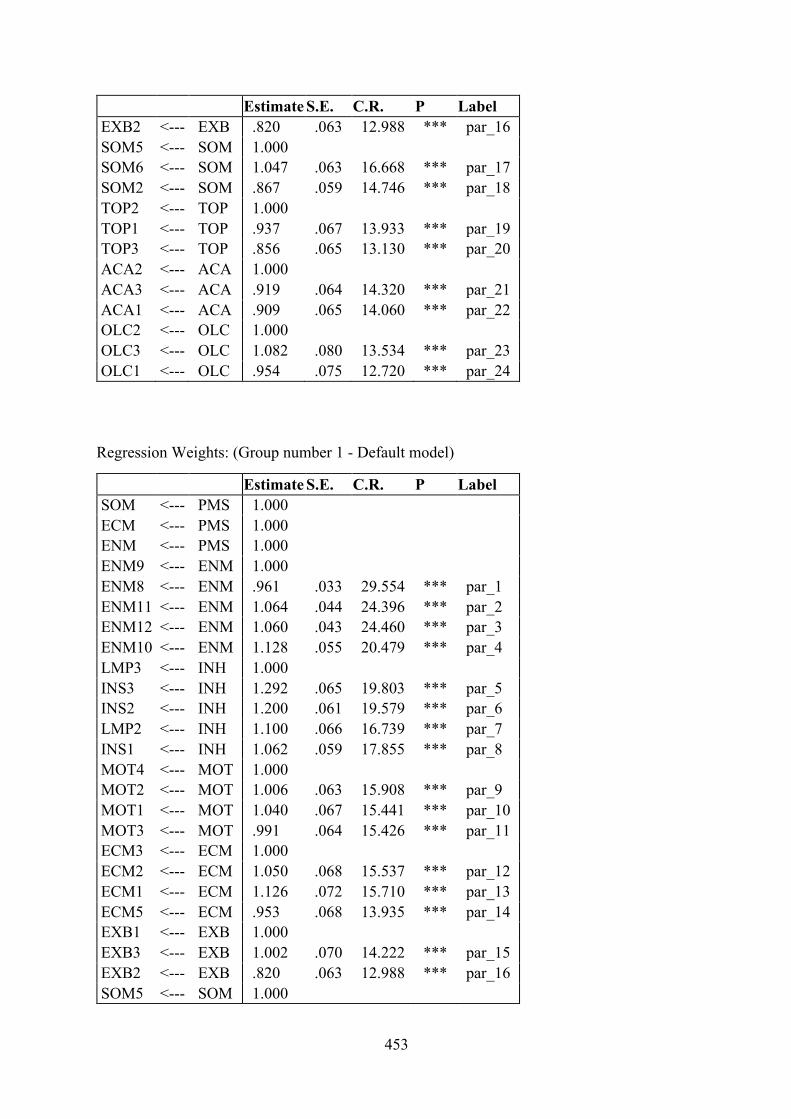
453
Estimate S.E. C.R. P Label EXB2 <--- EXB .820 .063 12.988 *** par_16 SOM5 <--- SOM 1.000 SOM6 <--- SOM 1.047 .063 16.668 *** par_17 SOM2 <--- SOM .867 .059 14.746 *** par_18 TOP2 <--- TOP 1.000 TOP1 <--- TOP .937 .067 13.933 *** par_19 TOP3 <--- TOP .856 .065 13.130 *** par_20 ACA2 <--- ACA 1.000 ACA3 <--- ACA .919 .064 14.320 *** par_21 ACA1 <--- ACA .909 .065 14.060 *** par_22 OLC2 <--- OLC 1.000 OLC3 <--- OLC 1.082 .080 13.534 *** par_23 OLC1 <--- OLC .954 .075 12.720 *** par_24
Regression Weights: (Group number 1 - Default model)
Estimate S.E. C.R. P Label SOM <--- PMS 1.000 ECM <--- PMS 1.000 ENM <--- PMS 1.000 ENM9 <--- ENM 1.000 ENM8 <--- ENM .961 .033 29.554 *** par_1 ENM11 <--- ENM 1.064 .044 24.396 *** par_2 ENM12 <--- ENM 1.060 .043 24.460 *** par_3 ENM10 <--- ENM 1.128 .055 20.479 *** par_4 LMP3 <--- INH 1.000 INS3 <--- INH 1.292 .065 19.803 *** par_5 INS2 <--- INH 1.200 .061 19.579 *** par_6 LMP2 <--- INH 1.100 .066 16.739 *** par_7 INS1 <--- INH 1.062 .059 17.855 *** par_8 MOT4 <--- MOT 1.000 MOT2 <--- MOT 1.006 .063 15.908 *** par_9 MOT1 <--- MOT 1.040 .067 15.441 *** par_10 MOT3 <--- MOT .991 .064 15.426 *** par_11 ECM3 <--- ECM 1.000 ECM2 <--- ECM 1.050 .068 15.537 *** par_12 ECM1 <--- ECM 1.126 .072 15.710 *** par_13 ECM5 <--- ECM .953 .068 13.935 *** par_14 EXB1 <--- EXB 1.000 EXB3 <--- EXB 1.002 .070 14.222 *** par_15 EXB2 <--- EXB .820 .063 12.988 *** par_16 SOM5 <--- SOM 1.000

454
Estimate S.E. C.R. P Label SOM6 <--- SOM 1.047 .063 16.668 *** par_17 SOM2 <--- SOM .867 .059 14.746 *** par_18 TOP2 <--- TOP 1.000 TOP1 <--- TOP .937 .067 13.933 *** par_19 TOP3 <--- TOP .856 .065 13.130 *** par_20 ACA2 <--- ACA 1.000 ACA3 <--- ACA .919 .064 14.320 *** par_21 ACA1 <--- ACA .909 .065 14.060 *** par_22 OLC2 <--- OLC 1.000 OLC3 <--- OLC 1.082 .080 13.534 *** par_23 OLC1 <--- OLC .954 .075 12.720 *** par_24
Model Fit Summary
CMIN
Model NPAR CMIN DF P CMIN/DF Default model 122 926.794 472 .000 1.964 Saturated model 594 .000 0 Independence model 66 8811.857 528 .000 16.689
Baseline Comparisons
Model NFI Delta1
RFI rho1
IFI Delta2
TLI rho2 CFI
Default model .895 .882 .945 .939 .945 Saturated model 1.000 1.000 1.000 Independence model .000 .000 .000 .000 .000
Parsimony-Adjusted Measures
Model PRATIO PNFI PCFI Default model .894 .800 .845 Saturated model .000 .000 .000 Independence model 1.000 .000 .000
NCP
Model NCP LO 90 HI 90 Default model 454.794 372.191 545.180 Saturated model .000 .000 .000 Independence model 8283.857 7982.923 8591.201
FMIN
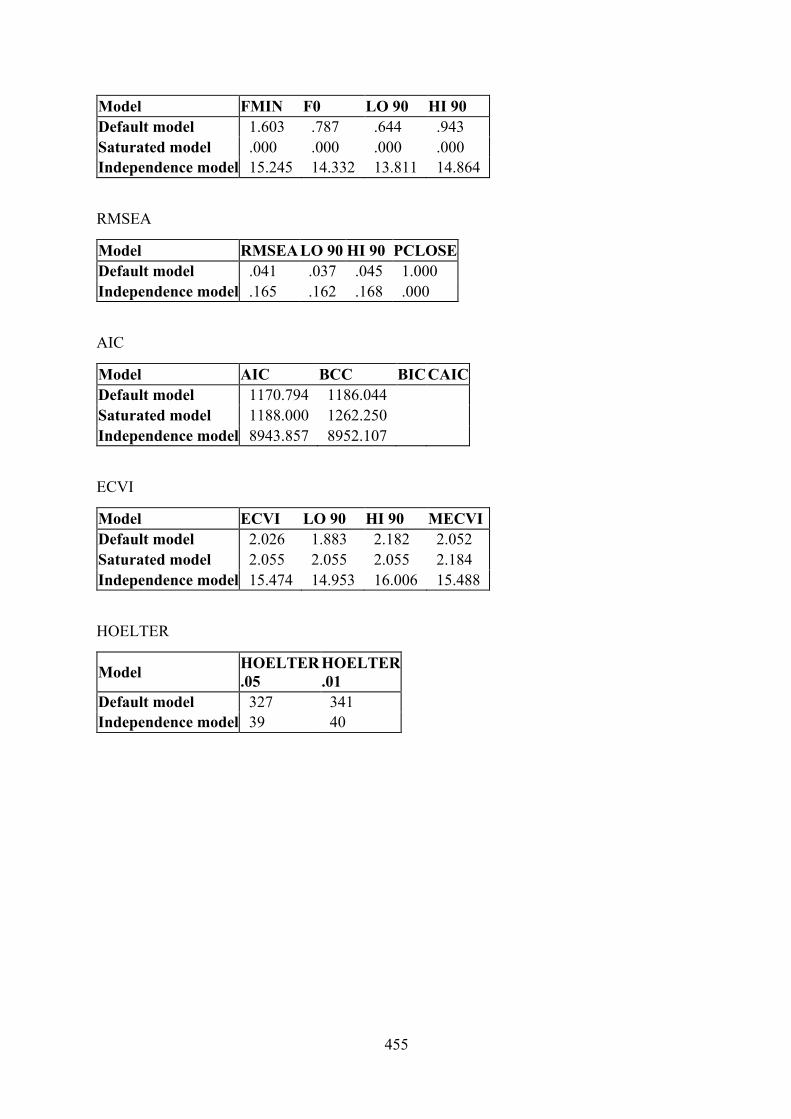
455
Model FMIN F0 LO 90 HI 90 Default model 1.603 .787 .644 .943 Saturated model .000 .000 .000 .000 Independence model 15.245 14.332 13.811 14.864
RMSEA
Model RMSEA LO 90 HI 90 PCLOSE Default model .041 .037 .045 1.000 Independence model .165 .162 .168 .000
AIC
Model AIC BCC BIC CAIC Default model 1170.794 1186.044 Saturated model 1188.000 1262.250 Independence model 8943.857 8952.107
ECVI
Model ECVI LO 90 HI 90 MECVI Default model 2.026 1.883 2.182 2.052 Saturated model 2.055 2.055 2.055 2.184 Independence model 15.474 14.953 16.006 15.488
HOELTER
Model HOELTER .05
HOELTER .01
Default model 327 341 Independence model 39 40
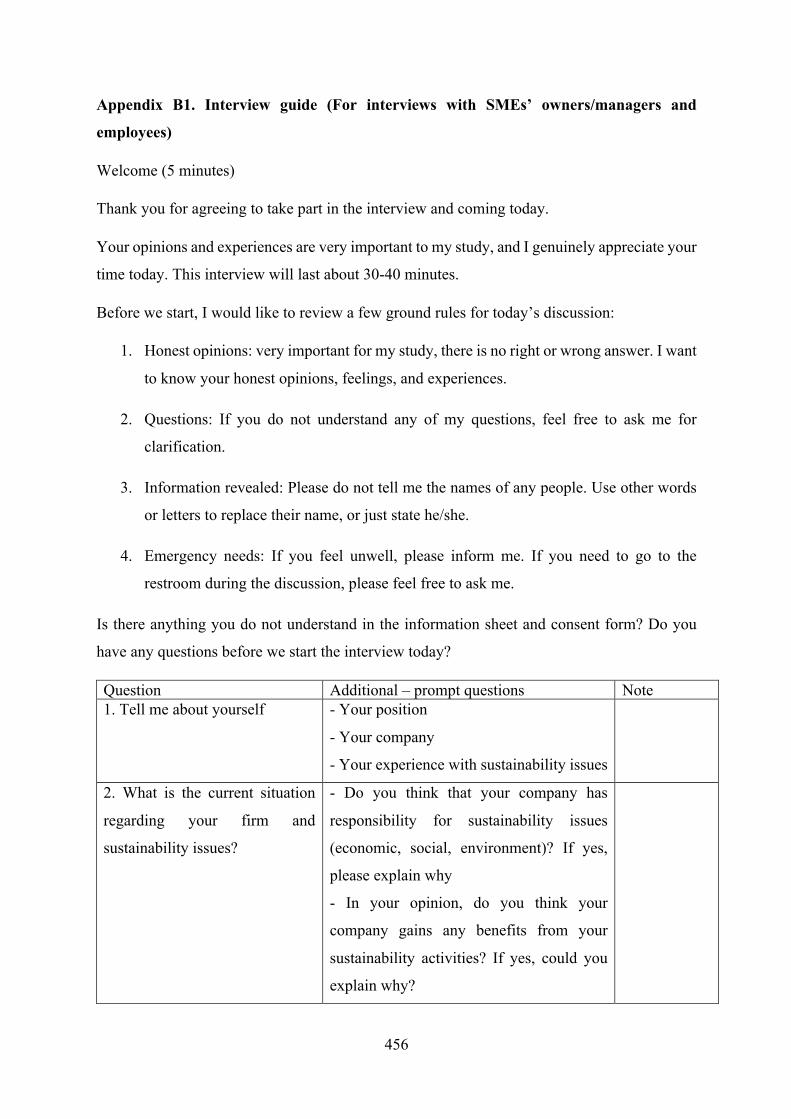
456
Appendix B1. Interview guide (For interviews with SMEs’ owners/managers and
employees)
Welcome (5 minutes)
Thank you for agreeing to take part in the interview and coming today.
Your opinions and experiences are very important to my study, and I genuinely appreciate your
time today. This interview will last about 30-40 minutes.
Before we start, I would like to review a few ground rules for today’s discussion:
1. Honest opinions: very important for my study, there is no right or wrong answer. I want
to know your honest opinions, feelings, and experiences.
2. Questions: If you do not understand any of my questions, feel free to ask me for
clarification.
3. Information revealed: Please do not tell me the names of any people. Use other words
or letters to replace their name, or just state he/she.
4. Emergency needs: If you feel unwell, please inform me. If you need to go to the
restroom during the discussion, please feel free to ask me.
Is there anything you do not understand in the information sheet and consent form? Do you
have any questions before we start the interview today?
Question Additional – prompt questions Note 1. Tell me about yourself - Your position
- Your company
- Your experience with sustainability issues
2. What is the current situation
regarding your firm and
sustainability issues?
- Do you think that your company has
responsibility for sustainability issues
(economic, social, environment)? If yes,
please explain why
- In your opinion, do you think your
company gains any benefits from your
sustainability activities? If yes, could you
explain why?
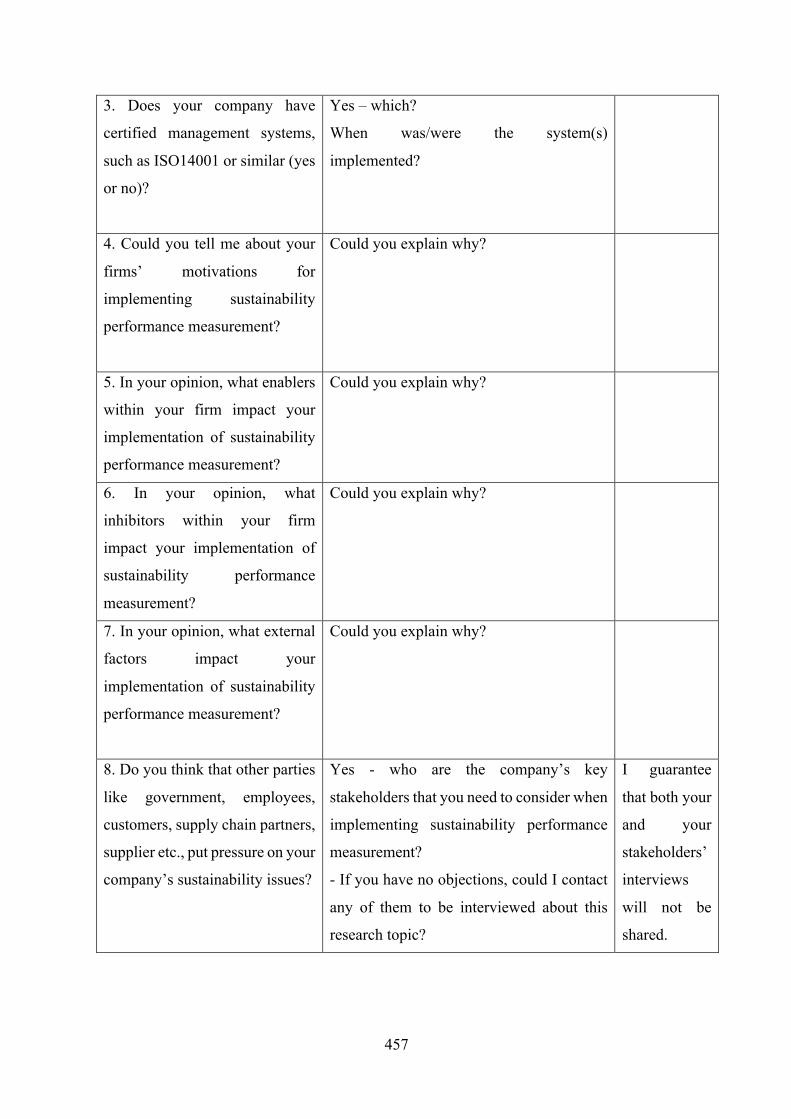
457
3. Does your company have
certified management systems,
such as ISO14001 or similar (yes
or no)?
Yes – which?
When was/were the system(s)
implemented?
4. Could you tell me about your
firms’ motivations for
implementing sustainability
performance measurement?
Could you explain why?
5. In your opinion, what enablers
within your firm impact your
implementation of sustainability
performance measurement?
Could you explain why?
6. In your opinion, what
inhibitors within your firm
impact your implementation of
sustainability performance
measurement?
Could you explain why?
7. In your opinion, what external
factors impact your
implementation of sustainability
performance measurement?
Could you explain why?
8. Do you think that other parties
like government, employees,
customers, supply chain partners,
supplier etc., put pressure on your
company’s sustainability issues?
Yes - who are the company’s key
stakeholders that you need to consider when
implementing sustainability performance
measurement?
- If you have no objections, could I contact
any of them to be interviewed about this
research topic?
I guarantee
that both your
and your
stakeholders’
interviews
will not be
shared.
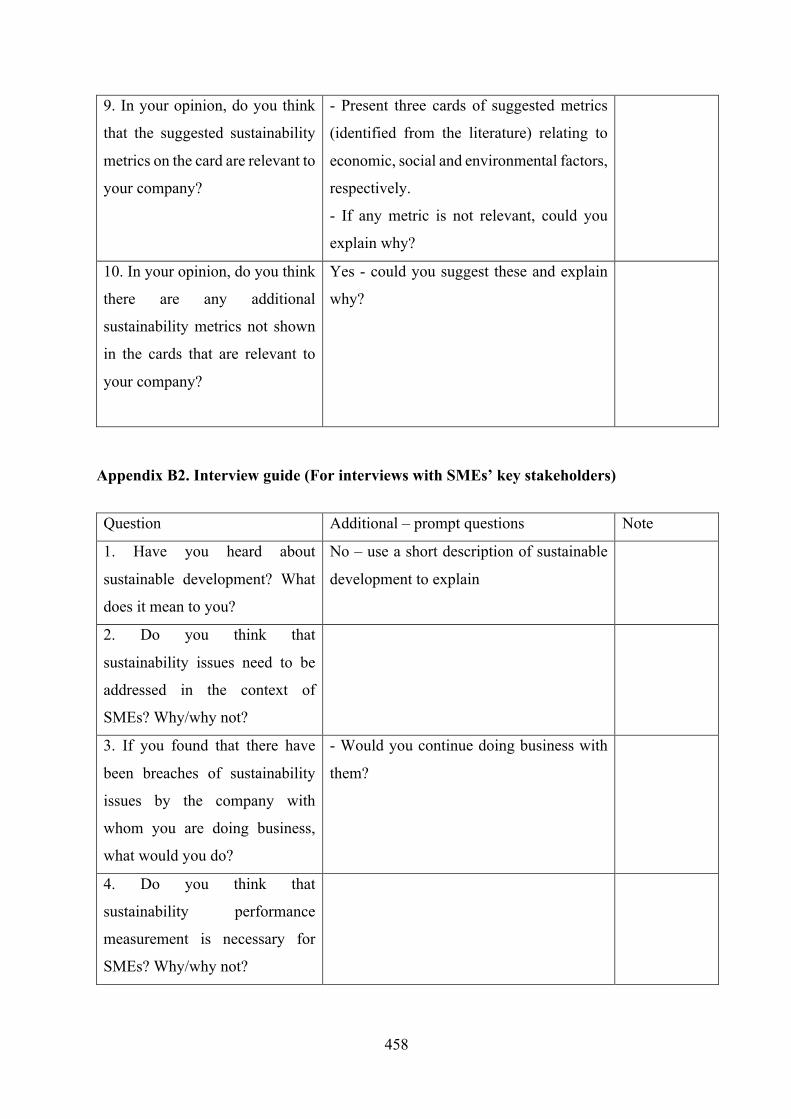
458
9. In your opinion, do you think
that the suggested sustainability
metrics on the card are relevant to
your company?
- Present three cards of suggested metrics
(identified from the literature) relating to
economic, social and environmental factors,
respectively.
- If any metric is not relevant, could you
explain why?
10. In your opinion, do you think
there are any additional
sustainability metrics not shown
in the cards that are relevant to
your company?
Yes - could you suggest these and explain
why?
Appendix B2. Interview guide (For interviews with SMEs’ key stakeholders)
Question Additional – prompt questions Note
1. Have you heard about
sustainable development? What
does it mean to you?
No – use a short description of sustainable
development to explain
2. Do you think that
sustainability issues need to be
addressed in the context of
SMEs? Why/why not?
3. If you found that there have
been breaches of sustainability
issues by the company with
whom you are doing business,
what would you do?
- Would you continue doing business with
them?
4. Do you think that
sustainability performance
measurement is necessary for
SMEs? Why/why not?
459
5. In your opinion, do you think
the suggested sustainability
metrics on the card for SMEs are
relevant to your concerns?
- Present three cards of suggested metrics
(identified from the literature) relating to
economic, social and environmental factors,
respectively. If any metric is not relevant,
could you explain why?
6. In your opinion, do you feel
there are any additional
sustainability metrics SMEs
should have?
- Could you explain why?
Thank you very much for participating in this study.
Appendix B3. INTERVIEW SAMPLE (C15, Owner-manager)
1. Interviewer: Please provide some general information about your company
C15: My company was founded 6 years ago. It currently has around less than 50 employees,
and we produce plastic packaging. Our target market is business customers, and we are their
supplier. We follow a make to order model.
2. Interviewer: Have you heard of the concept ‘sustainable development’ in business?
What does this concept mean to you?
C15: I have heard of it before. I began as a family business and built it up slowly with a starting
capital of 200 million (VND). At first, we only had one set of production machinery and sold
exclusively to one big customer. For me, to develop sustainably it would have to be from the
ground up, identifying potential customers, expertise, and techniques. This concept is still
vague, and I only understand that my company should produce good and durable products.
3. Interviewer: In your business activities, do you think that businesses must be
responsible for aspects of the economy, society, and environment?
460
C15: Yes, I do. From the beginning when I started as a family business, I didn't consider those
aspects. At that time, the most important thing was revenue and how to exist. When the business
had become stable and profitable, I started to think about employees’ benefits and how to build
a methodical production line. At first, I only did as best as I could. But when the company
entered the industrial zone, it had to fully comply with the regulations of the country and social
insurance. As for the customer side, when we began to do business with foreign companies,
the production process was their main focus. Talking about the SME business, I am only a
miniature version of a foreign manufacturing company and I follow the same methodical
process. I work with international customers; I have learned a lot from them and applied this
to my company from the very beginning. Like the ISO process for instance, large companies
need strong finance to recruit talent to work for them. Fortunately, we recruited a professional
manager, who is qualified and experienced with ISO 14001 standards on the environment; he
successfully trained our current employees to be more professional and skilful. Each
department has a person who presides over that process, so they want to stay with the company.
Our finance is not as plentiful so I am not sure they would be willing to work in my small
company, so I make use of the readily available team. Therefore, when foreign business
partners come to audit, the company does not lack anything.
Once the employees have learnt how to operate well, they do not quit to work
elsewhere; this is because of my kind manner and ethical behaviours. Personal feelings and
work are separate, but when employees have difficulties, I still support them in a personal
capacity. For example, when employees need to buy a house, we can still support them by
letting them pay in instalments and assist them with rent. The company was situated in Saigon.
Now that it has moved to an industrial zone in Binh Duong, I provide accommodation if they
agree to move with the company. And that's how I treat my employees in general. People who
have worked for my company and then quit to work elsewhere could not adapt and came back.
Whether employees stick with the company or not depends on how owners treat them. Just like
you have to have business ethics when doing business. We not only do it to make a profit but
also to help the workers. I have an employee who did not have a vehicle with which to commute
and also did not have a decent place to live, but after working for me some time, they now have
those things, and their life is a little more comfortable.
Those activities, which were initially just my ideas, are now company policies. Economic,
social, and environmental activities in general are very important. I had also done them, but do
not have the method and have only just started doing them. For the moment it only concerns

461
production in the company with customers, the environmental issues are not yet addressed. Of
course, when I do it, I also have to take into consideration those elements because they are
related to the expenditure as you have to pay for all waste produced. Nowadays I have started
to measure them.
4. Interviewer: What are your motivations for adopting SPMS in your company?
C15: Of course, when running a business, I always think about it. As an SME; firstly, we do it
to help the company thrive and survive before considering society. I recycle all my own
products in order to help reduce costs. “Because it relates to business cost reduction, every
waste is a cost. Now I have just begun measuring it, based on the sets of indicators that I had
from the implementation of ISO 14001 program.
5. Interviewer: What are stakeholders’ evaluations of sustainable development
activities?
C15: There are customers who want a cheap alternative, so I use cheap materials. To be honest,
in order to be affordable, we have to use recyclable materials. The staff also agree with this
because it feels good to be more efficient. The company is aiming to save costs. Damaged
products must be recalibrated and recycled, so being recyclable makes it easier. Also, there is
also no waste. As for clean water, I use circulating water, running in and out. This industry is
an environmentally conscious industry.
6. Interviewer: In your opinion, what are the inhibitors hindering SPMS adoption?
C15-FO: The difficulty lies in human problems. Foreign enterprises use talented people
to start the process. My difficulty is that I have to make do with existing resources and it takes
time to train people. The difficulty is that I use existing human resources and it really takes
time to train. You [indicating the researcher] know that it took us about a year for our
employees to begin to comprehend the process to effectively run ISO 14001. At first, it was
very difficult, just like a revolution. Employees who were persistent until the end, they became
very good, whereas those who couldn't follow it were eliminated and fired. There were people
who often thought there was no benefit to the added work and decided to quit themselves.
Those who stayed became better at their jobs as they grasped the process but that's only in
theory. They came here, took time to learn our product and started to find out how to produce

462
them. However, the veteran employees already know this by heart, but they lack the theoretical
understanding. Surely, there must be a clear and detailed process, so people know what to do,
and it makes it easier to check.
Once employees understand the process, they feel more satisfied. For example, in the
past, I did not assign any responsibility to any individual or department. When a product is
wrong, the fault may lie in the sales department or a planning team before going to production.
But now, after implementing the system, I can pinpoint the mistakes. This has made it easy for
me, so if the employees do something wrong then all issues will be transparent. We have quality
reports weekly and monthly. I have no doubt that rewards and recognitions are necessary to
motivate and encourage people to achieve that performance goal.
When the company do well, both staff and customers are happy. I also get feedback
from customers to make a report, but I have not done this with banks.
Measuring sustainable development is very useful. With the company’s current ability,
I can now confidently say that I am equal to the companies established 30-40 years ago in terms
of our ability to make products. Companies that originated from family businesses still follow
traditions, but we chose a different approach. I followed the model of a foreign company
closely because I often went abroad to visit factories to learn from them and implement this in
my own company. For big companies, they have plentiful finance, but I don't have enough. If
I have a good quality management system. To be honest with you, sustainability performance
outcome is the key thing that we are confident in welcoming customers, international buyers,
to our company to audit.
Standard working procedures were my passion when I first started. With the current results, I
consider this a worthwhile investment. When I first founded the company, I had wanted to do
it properly but both human and financial resources were insufficient. In the past, one person
had to do like 10 things, we could not easily identify errors or blame anyone, now it is much
easier to control.
All the clients that I am currently selling to are also selling to big companies. I am very
excited about introducing our products to them. I can prove that I can do as much as the big
companies. The thing is that the market share people give me is not large. The reason for this
is my business has not made much of a name for itself in the market. But people still buy from
both, it’s just that I am the second or third supplier. Customers who have been with me from
the very beginning are still with me after a very long time. This is because before I started, I
463
was a sub-supplier. If I did well, there would be companies buying from her, at least I became
a supplier. If there is an opportunity, I will increase production. Customers who buy from a
small company such as mine buy at a fair price accompanied by good service. While big
companies might have a lot of customers, their services might not be as good as mine.
7. Interviewer: From your point of view, what enablers do SMEs have when adopt
SPMS?
C15: When I carried out the process, it didn’t cost me much, just took time. Before when I had
worked for big companies, I grasped the procedures. And I started small. Practical experience,
knowledge, and leadership played an important role. If I had not grasped those concepts, I
would not have had ideas to implement so I would not be able to judge whether employees
were doing things right or not. Very few SMEs from my time were able to survive, only about
10-20%; the rest went bankrupt. My company might be small, but I have a lot of big customers,
despite not having sold much. If I can sell to big customers, I can confidently sell to other
customers.
8. Interviewer: In your opinion, how do you think factors outside the business affect
sustainable development?
C15: In general, the law in Vietnam is lax. SMEs are also easily overlooked. For instance, in
the old days, if the fire department visited, all I needed to do was bribe them. What matters is
your conscience. Small and medium-sized enterprises have not experienced what policies on
sustainable development can bring them. In my case, when I sell products, all records on
revenue and expenses are very transparent. I complete your tax obligations fully and I have
invoices for sales. For many other companies, they don't issue invoices during sales, so they
have no revenue. That means the actual revenue is there, but not for the tax. Therefore, it is
difficult for them to approach the bank. To prove to the bank their request is genuine, they need
exact numbers. Well, there are people who do it for real and there are people who don't. There
are also people who follow the revenue to shape their company's image but those numbers are
not real. For businesses, big sales matters. For production, a turnover of 1 billion is more
profitable than a trading company.
9. Interviewer: could you tell me about external factors that influence SPMS adoption
such as government supports, barriers?
464
C15: SMEs such as mine are not entitled to any support policies, but foreign companies are
exempt from corporate taxation by a lot. They have more preferential policies and pay less tax.
They are given all kinds of incentives; we have to self-advocate. If I take loans from banks, I
also have to deposit our assets. Most of it comes from real estate.
10. Interviewer: Do you have any comments about the list of metrics?
C15: It depends on how simple and easy it is for employees to understand for you and to collect
data better, and some metrics, we don’t actually need. Collecting data too frequently could be
too burdensome, making it difficult to evaluate. A year is a bit long so measurements should
be taken every 6 months. This might not be enough to collect data but the repetition counts.
We repeat so we can carry out evaluations at the end of the year. This might be forgotten if left
until the end.
Interviewer: Thank you very much taking time participating in this interview. And thank you
very for your opinion.
C15: It’s ok.