DISPLACEMENT MEASURING
146
DISPLACEMENT MEASURING USING THE NEW XYZ ACCELEROMETER SENSOR EUROPEAN PROJECT SEMESTER AUTUMN 2010 | INGENIØRHØJSKOLEN I KØBENHAVN Group 6 Student Name Student Number Jorge Pascual Martínez Andrés 101030 Liyue Shen 100931 Lukasz Koczwara 100824 Raquel Abad Carro 100911 Supervisor: Emil Piper
-
Upload
khangminh22 -
Category
Documents
-
view
1 -
download
0
Transcript of DISPLACEMENT MEASURING
DISPLACEMENT MEASURING USING THE NEW XYZ ACCELEROMETER SENSOR
EUROPEAN PROJECT SEMESTER AUTUMN 2010 | INGENIØRHØJSKOLEN I KØBENHAVN
Group 6
Student Name Student Number
Jorge Pascual Martínez Andrés 101030
Liyue Shen 100931
Lukasz Koczwara 100824
Raquel Abad Carro 100911
Supervisor: Emil Piper

Abstract
GROUP 6 DISPLACEMENT MEASURING USING XYZ ACCELEROMETER SENSOR
Abstract
This project outlines the development of a displacement measuring system for
walls displacement. It can be also easily adapt to deal with wide range of other types of
measurements. The goal of this project is to build a working prototype of a measuring
device. The heart of the project is the three-dimensional accelerometer sensor,
supported by evaluation board with microcontroller and the LCD display. In general, the
system includes physical sensor, signal processing unit and a display. It might also be
extended by data acquisition circuit, additional sensors and PC interface with the
dedicated software. The system will be built from commercially available components. In
this paper the matters of constructing the embedded system, designed to perform
presented above function is described. The paper discusses issues of hardware and
software layers and project itself, as well as schedule for possible next steps. In the
"project status" paragraph actual work which has already been done is presented. This
report is written to give the reader an overview over project, as well as, a clear project
status and future plans.

Table of Contents ii
GROUP 6 DISPLACEMENT MEASURING USING XYZ ACCELEROMETER SENSOR
Table of Contents
Abstract .................................................................... ii
Table of Contents ..................................................... iii
Table of Images ....................................................... vii
List of Tables ............................................................ ix
Chapter 1
Introduction .............................................................. 1
Chapter 2
Background of the Project ......................................... 3
2.1 Project Requirements ............................................................ 4
2.2 Operating Parameters ............................................................ 4
2.3 Theorical Basis ....................................................................... 5
2.4 Acceleration ........................................................................... 6
2.5 Gravity ................................................................................... 7
2.5 Coordinate System ................................................................. 7
2.6 Accelerometer Sensor ............................................................ 9
2.7 Analog-to-digital Conversion ............................................... 10
Chapter 3
Field of Use ............................................................. 12
3.1 Seismic Activity .................................................................... 13
3.2 Protection of Hardware ....................................................... 14
3.3 Inertial Navigator System ..................................................... 14
3.4 IPhone Applications ............................................................. 14
3.5 Airbags ................................................................................ 16
3.6 Medical Applications ........................................................... 16
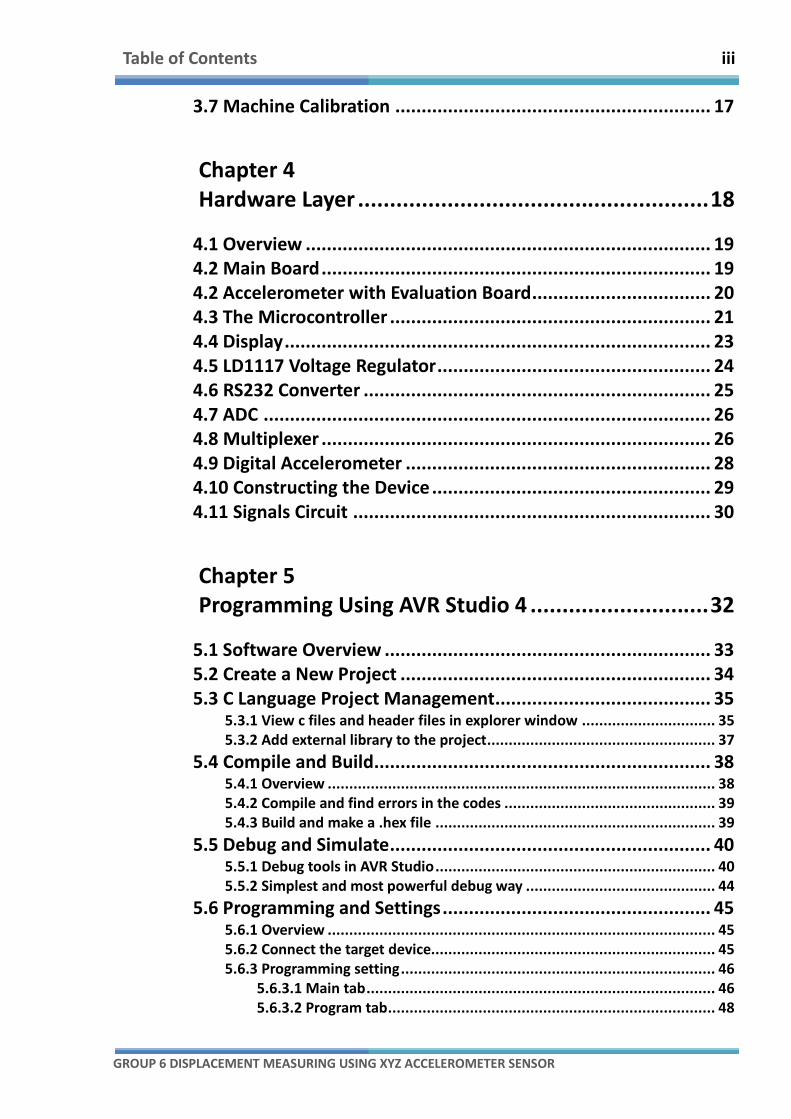
Table of Contents iii
GROUP 6 DISPLACEMENT MEASURING USING XYZ ACCELEROMETER SENSOR
3.7 Machine Calibration ............................................................ 17
Chapter 4
Hardware Layer ....................................................... 18
4.1 Overview ............................................................................. 19
4.2 Main Board .......................................................................... 19
4.2 Accelerometer with Evaluation Board .................................. 20
4.3 The Microcontroller ............................................................. 21
4.4 Display ................................................................................. 23
4.5 LD1117 Voltage Regulator .................................................... 24
4.6 RS232 Converter .................................................................. 25
4.7 ADC ..................................................................................... 26
4.8 Multiplexer .......................................................................... 26
4.9 Digital Accelerometer .......................................................... 28
4.10 Constructing the Device ..................................................... 29
4.11 Signals Circuit .................................................................... 30
Chapter 5
Programming Using AVR Studio 4 ............................ 32
5.1 Software Overview .............................................................. 33
5.2 Create a New Project ........................................................... 34
5.3 C Language Project Management ......................................... 35
5.3.1 View c files and header files in explorer window ............................... 35
5.3.2 Add external library to the project ..................................................... 37
5.4 Compile and Build ................................................................ 38
5.4.1 Overview .......................................................................................... 38
5.4.2 Compile and find errors in the codes ................................................. 39
5.4.3 Build and make a .hex file ................................................................. 39
5.5 Debug and Simulate ............................................................. 40
5.5.1 Debug tools in AVR Studio ................................................................. 40
5.5.2 Simplest and most powerful debug way ............................................ 44
5.6 Programming and Settings ................................................... 45
5.6.1 Overview .......................................................................................... 45
5.6.2 Connect the target device.................................................................. 45
5.6.3 Programming setting ......................................................................... 46
5.6.3.1 Main tab ................................................................................. 46
5.6.3.2 Program tab ............................................................................ 48
Table of Contents iv
GROUP 6 DISPLACEMENT MEASURING USING XYZ ACCELEROMETER SENSOR
5.6.3.3 Fuses tab ................................................................................ 49
Chapter 6
Design and Implementation of Embedded Software 51
6.1 On-chip Software Overview ................................................. 52
6.2 Functions of Current Version .............................................. 52
6.3 Implementation of Current Version .................................... 53
6.3.1 Overview .......................................................................................... 53
6.3.2 Receive Data from Accelerometer Sensor .......................................... 53
6.3.3 Analog-to-digital Conversion (ADC) ................................................... 54
6.3.3.1 Introduction of ADC ................................................................ 54
6.3.3.2 Reason to do ADC ................................................................... 55
6.3.3.3 ADC method and settings ........................................................ 60
6.3.3.4 ADC rule and result format ...................................................... 63
6.3.4 Get Acceleration from Digital Numbers (ADC Results) ........................ 63
6.3.4.1 Overview and problems to solve ............................................. 63
6.3.4.2 ADC result collection and calibration ....................................... 64
6.3.4.3 Sampling ................................................................................ 65
6.3.4.4 Get acceleration from ADC result ............................................ 66
6.3.4.5 Remove gravity factor from acceleration ................................. 67
6.3.4.6 Algorithms gathering and optimize ......................................... 68
6.3.5 Calculate Displacement from Acceleration and Time .......................... 70
6.3.5.1 Overview and formula introduction ........................................ 70
6.3.5.2 Mathematical algorithm ......................................................... 71
6.3.5.3 Program algorithm .................................................................. 72
6.3.6 Use LCD as a Display Component ....................................................... 74
6.3.6.1 Reason to choose LCD ............................................................. 74
6.3.6.2 LCD using method and output result ....................................... 74
6.3.7 Communicate with PC Through Serial Port ......................................... 76
6.3.7.1 Overview ................................................................................ 76
6.3.7.2 UASRT register usage and setting ............................................ 76
6.3.7.3 Data transfer protocol ............................................................. 81
6.3.8 CPU Clock Frequency Setting ............................................................. 82
6.3.8.1 Overview ................................................................................ 82
6.3.8.2 Clock setting ........................................................................... 82
6.3.9 Using the TIMER0 to Get Time ........................................................... 83
6.3.9.1 Overview ................................................................................ 83
6.3.9.2 TIMER0 operating theory ........................................................ 83
6.3.9.3 Get time from the TIMER0 ...................................................... 85
6.3.10 Precision Statement and Error Reducing .......................................... 87
6.3.10.1 Algorithm precision statement .............................................. 87
6.3.10.2 Error reducing ....................................................................... 88
Table of Contents v
GROUP 6 DISPLACEMENT MEASURING USING XYZ ACCELEROMETER SENSOR
Chapter 7
Design and Implementation of the PC Display
Software ......................................................................... 90
7.1 PC Display Software Overview ............................................. 91
7.2 Functions of PC Display Software and User Guide ................ 91
7.3 Implementation of Current Version .................................... 94
Chapter 8
Structure and Management of the Project ............... 97
8.1 Overview ............................................................................. 98
8.2 Managing the Project. ......................................................... 98
8.2.1 Work Breakdown Structure (WBS) ..................................................... 98
8.2.1.1 WBS overview ........................................................................ 98
8.2.1.2 Research branch ................................................................... 100
8.2.1.3 Assembly Branch .................................................................. 100
8.2.1.4 Programming Branch ............................................................ 100
8.2.2 Gantt Chart ..................................................................................... 101
8.2.3 Responsibility Matrix (RM) .............................................................. 103
8.3 Checking the Progress Process ........................................... 104
8.4 Dealing with Problems ....................................................... 104
8.4.1 Overview ........................................................................................ 104
8.4.2 Troubles Section .............................................................................. 104
8.4.2.1 Misunderstanding – STK502 .................................................. 104
8.4.2.2 Power ................................................................................... 105
8.4.2.3 Wires .................................................................................... 105
8.4.2.4 Multiplexer(MUX) ................................................................. 106
8.4.2.5 Crystal .................................................................................. 106
8.4.2.6 Plan changes ......................................................................... 107
8.4 Status at Project Review 2 ................................................. 108
8.4.1 New Gantt Chart - Project Review 2 ................................................. 108
8.4.2 Status of Work Breakdown Structure - Project Review 2 .................. 109
8.4.3 Status of Responsibility Matrix - Project Review 2 ............................ 110
Chapter 9
Future Work .......................................................... 111
9.1 Overview ........................................................................... 112
9.2 Memory Storage ................................................................ 112
Table of Contents vi
GROUP 6 DISPLACEMENT MEASURING USING XYZ ACCELEROMETER SENSOR
9.3 Display ............................................................................... 112
9.4 Wireless Communication ................................................... 113
9.5 External Power Unit ........................................................... 113
9.6 MUX + Other Accelerometers ............................................ 113
9.7 Noise Issues ....................................................................... 114
Chapter 10
Conclusion ............................................................ 115
Chapter 11
References ............................................................ 117
Chapter 12
Glossary ................................................................ 120
Chapter 13
Appendix ............................................................... 124
13.1 Quick Start Tutorial .......................................................... 125
13.1.1 Tutorial Overview .......................................................................... 125
13.1.2 Components ................................................................................. 126
13.1.2 Assembly ...................................................................................... 126
13.1.3 PC Connection. .............................................................................. 129
13.2 Loogbook ........................................................................ 132
Table of Images vii
GROUP 6 DISPLACEMENT MEASURING USING XYZ ACCELEROMETER SENSOR
Table of Images Fig. 2.1: Cartesian coordinate system. ................................................................................ 8
Fig. 2.2: Distance of a point. ................................................................................................ 8
Fig. 2.3: Distance between two points. ............................................................................... 9
Fig. 2.4: Accelerometer. ....................................................................................................... 9
Fig. 2.5: Conversion analog - digital. .................................................................................. 10
Fig. 2.6: Conversion of successive approximation............................................................. 11
Fig. 3.1: QCN Logo. ............................................................................................................ 13
Fig. 3.2: Rolando game. ..................................................................................................... 15
Fig. 4.1: Main Board. .......................................................................................................... 19
Fig.4.2: Accelerometer with evaluation board. ................................................................. 21
Fig. 4.3: Microcontroller ATMega16. ................................................................................. 22
Fig. 4.4: LCD Display. .......................................................................................................... 23
Fig. 4.5: LD1117 Voltage regulator. ................................................................................... 24
Fig. 4.6: RS232 USB Converter. .......................................................................................... 25
Fig. 4.7: Multiplexer. .......................................................................................................... 26
Fig. 4.8: 2 to 1 Multiplexer................................................................................................. 28
Fig. 4.9: Accelerometer sensor ADXL345Z......................................................................... 28
Fig. 5.1 AVR Logo ............................................................................................................... 33
Fig. 5.2 ............................................................................................................................... 34
Fig. 5.3 ............................................................................................................................... 34
Fig. 5.4 ............................................................................................................................... 35
Fig. 5.5 ............................................................................................................................... 36
Fig. 5.6 ............................................................................................................................... 37
Fig. 5.7 ............................................................................................................................... 37
Fig. 5.8 ............................................................................................................................... 38
Fig. 5.9 ............................................................................................................................... 38
Fig. 5.10 ............................................................................................................................. 39
Fig. 5.11 ............................................................................................................................. 39
Fig. 5.12 ............................................................................................................................. 40
Fig. 5.13 ............................................................................................................................. 41
Fig. 5.14 ............................................................................................................................. 42
Fig. 5.15 ............................................................................................................................. 43
Fig. 5.16 ............................................................................................................................. 43
Fig. 5.17 ............................................................................................................................. 45
Fig. 5.18 ............................................................................................................................. 46
Fig. 5.19 ............................................................................................................................. 47
Fig. 5.20 ............................................................................................................................. 48
Fig. 5.21 ............................................................................................................................. 49
Fig. 5.22 ............................................................................................................................. 50
Fig. 5.23 ............................................................................................................................. 50
Fig. 6.1 ............................................................................................................................... 55
Fig. 6.2 ............................................................................................................................... 56
Fig. 6.3 ............................................................................................................................... 57
Table of Images viii
GROUP 6 DISPLACEMENT MEASURING USING XYZ ACCELEROMETER SENSOR
Fig. 6.4 ............................................................................................................................... 57
Fig. 6.5 ............................................................................................................................... 58
Fig. 6.6 ............................................................................................................................... 59
Fig. 6.7 ............................................................................................................................... 59
Fig. 6.8 ............................................................................................................................... 65
Fig. 6.9 ............................................................................................................................... 69
Fig. 6.10 ............................................................................................................................. 70
Fig. 6.11 ............................................................................................................................. 75
Fig. 6.12 ............................................................................................................................. 83
Fig. 7.1 ............................................................................................................................... 92
Fig. 7.2 ............................................................................................................................... 92
Fig. 7.3 ............................................................................................................................... 93
Fig. 7.4 ............................................................................................................................... 94
Fig. 7.5 ............................................................................................................................... 95
Fig. 8.1 – Work Breakdown Structure ............................................................................... 99
Fig. 8.2 - Gantt chart ........................................................................................................102
Fig. 8.3 – Responsibility Matrix ........................................................................................103
Fig. 8.4 – Gantt chart, Project Review 2 ..........................................................................108
Fig. 8.5 – Work Breakdown Structure, Project Review 2 ................................................109
Fig. 8.6 – Responsibility matrix, Project Review 2 ...........................................................110
Fig. 1: Headers description. ............................................................................................125
Fig. 2: Components. ........................................................................................................126
Fig 3:Default jumpers. ....................................................................................................127
Fig 4:STK500 - ISP mode. ................................................................................................127
Fig 5:LCD to ATmega16. ..................................................................................................128
Fig 6:Potentiometers. .....................................................................................................128
Fig 7:LD1117 connection. ...............................................................................................128
Fig 8:Crystal on the board...............................................................................................129
Fig 9:External crystal jumpers setting. ...........................................................................129
Fig. 10: RS232 pins on the board. ....................................................................................129
Fig. 11: RS232 Spare port ................................................................................................130
Fig. 11: Circuit overview ..................................................................................................131
List of Tables ix
GROUP 6 DISPLACEMENT MEASURING USING XYZ ACCELEROMETER SENSOR
List of Tables
Table 4.1: Components in the prototype and their quantity. ........................................ 19
Table 4.2: ATMega16 brief specification ........................................................................ 22
Table 4.3: Multiplexer truth table. .................................................................................. 27
Table 6.1 .......................................................................................................................... 61
Table 6.2 .......................................................................................................................... 61
Table 6.3 .......................................................................................................................... 61
Table 6.4 .......................................................................................................................... 62
Table 6.4 .......................................................................................................................... 77
Table 6.5 .......................................................................................................................... 78
Table 6.6 .......................................................................................................................... 78
Table 6.7 .......................................................................................................................... 79
Table 6.8 .......................................................................................................................... 81
Table 6.9 .......................................................................................................................... 85
Table 6.10 ........................................................................................................................ 85
Table 6.11 ........................................................................................................................ 86
Table 1 ........................................................................................................................... 126

GROUP 6 DISPLACEMENT MEASURING USING XYZ ACCELEROMETER SENSOR
Chapter 1
Introduction
Introduction 2
GROUP 6 DISPLACEMENT MEASURING USING XYZ ACCELEROMETER SENSOR
IPod’s game, steps counter, remote console, airbag, seismic movement detector,
camcorders… What do they have in common? Accelerometers. It is something smaller
than a nail and tremendously useful.
European Project Semester’s Program had offered the opportunity to create a
prototype of a device able to measure displacement with one of those accelerometers. To
be precise, it was a 3-axis accelerometer.
A group of students, from different countries and studies decided to dedicate a
semester for researching and building that prototype. Along the way, they found not only
obstacles to overcome, but also new opportunities to improve their skills and minds.
For example, people have a desire to know the displacement of a car or the exact
position of a wall in order to check if the structure of a building is swaying. Obviously, the
measurement method has to be different. At this point, the question is ‘How can we
detect displacement? And what is displacement in general?’
These questions can be answered with accelerometers. The goal of this project is
to research the theory of the XYZ accelerometer sensor and build a working prototype of
a device able to measure displacement in a range of a couple of centimeters.
In this document all steps and decisions, which were made, are explained. First of
all, the necessary background is explained in order to understand, in a detailed way,
everything related to the sensor and the project. Then hardware and software layers are
presented. Once all material is known, the process itself and its management are
presented. Finally, some brief ideas for future work are recommended.

3
GROUP 6 DISPLACEMENT MEASURING USING XYZ ACCELEROMETER SENSOR
Chapter 2
Background of the Project
Background of the Project 4
GROUP 6 DISPLACEMENT MEASURING USING XYZ ACCELEROMETER SENSOR
2.1 Project Requirements
The goal of the project is to build a prototype of a measuring device. Therefore
operating parameters have to be determined. General assumption is to measure
displacement of the walls. In order to measure displacement of couple walls at the same
time, at last 2 accelerometers have to be used. In this project, only one analog
accelerometer was provided so the second one was simulated using potentiometers.
According to the number of accelerometer and GPIO (General Purpose Input
Output) pins supported with ADC converter (peripheral of ATmega16 unit) necessity of
using multiplexer appeared. Device has to be also equipped with 2 x 16 LCD Display.
Additional requirement was to establish connection between PC and device, using RS232
protocol. In order to establish connection between PC at decent speed, with the ability of
transporting the data without data lost, additional crystal was required. That is why
processing unit was supported with 16 MHz External Crystal. At this stage of the project,
because of PC connection, device does not have to be portable. Even without PC
connection device still needs power supply, which is provided with the common 12V
cable power supply unit what also exclude portability.
2.2 Operating Parameters
The aim is to measure displacement in a range of couple centimeters. Walls
displacement is significant and should be taken under observation only if exceed the limit
of approximately 1-2cm. Earth is moving and vibrating all of the time, so natural
Background of the Project 5
GROUP 6 DISPLACEMENT MEASURING USING XYZ ACCELEROMETER SENSOR
displacement in a range of millimeters is inevitable. That is why, in the project, basic
requirement is to measure the displacement in a range of +/-2 cm as a bottom value,
which should be considered as an unnatural behavior, up to any required level smaller
than 100cm.
What is more, the device can be calibrated to measure displacement in other
similar ranges.
Walls displacement measuring system is an "ad hoc" idea of use, but device can be
adopted to measure almost any kind of displacement.
It is obvious that displacement is related to 3D space, and it is measured in each of
3 axes.
2.3 Theorical Basis
Even when the goal of a project is to build a prototype of a device, behind it, a
long process of research and study is realized. In this paragraph, the two most important
results according to this stage of the project can be found. First of all, some definitions,
although seemingly obvious, provide the necessary basis to understand how
accelerometers work and how is the algorithm program. In order to make it more clear,
why do we use accelerometer, and where nowadays can we find them, some general
examples of use, are being presented in the “Field of use” section.
Displacement is the action of moving something from its place or position [2]. It
means that displacement is the difference between the initial position and the final
position of an object. It can be expressed as:
∆� = �� − ��
Background of the Project 6
GROUP 6 DISPLACEMENT MEASURING USING XYZ ACCELEROMETER SENSOR
Distance is a one-dimensional quantity and the standard unit is the meter (m).
However, this displacement may be only a few tenths of a millimeter or even thousands
of kilometers.
2.4 Acceleration
The acceleration is a measure of how rapidly the velocity is changing [2]. To
calculate acceleration it is necessary to know the speed and elapsed time.
Two types of acceleration can be differentiated. On the one hand, average
acceleration is obtained during a period of time.
�� ≡��� − ����� − ��
=∆��
∆�
Units, used to express acceleration, are meters per second (m/s2). To remember
that speed is expressed as:
�� =∆��∆�
On the other hand, it is possible to calculate the instantaneous acceleration. It is
useful when the average acceleration changes in the different intervals of time. It is
calculated with the equation presented below:
�� ≡ lim∆�→�
∆��∆�
=�����
When the acceleration is positive, it means that the direction is x positive, so
acceleration is in the same direction that earth’s gravity. If otherwise the acceleration is
negative, it means that the direction is x negative.

Background of the Project 7
GROUP 6 DISPLACEMENT MEASURING USING XYZ ACCELEROMETER SENSOR
2.5 Gravity
Newton’s law of universal gravitation says:
"Every particle of matter in the universe attracts every other particle with a force
that is directly proportional to the product of the masses of the particles and inversely
proportional to the square of the distance between them" [1]
If it is translated into an equation:
�� =� · �� · ��
�
This constant of proportionality is G=6.67x10⁻¹¹
N·m2·kg
-2.
To calculate acceleration, the acceleration due to gravity at the earth’s surface
must be taken into account.
It is calculated by:
=� · �
��
mE: Earth’s mass.
RE: Earth’s radius.
2.5 Coordinate System
The most common system is Cartesian coordinates. It consists of three
perpendicular axes. The same scale is used for each one. The horizontal plane
corresponds to x-axis and y-axis and the vertical axis is called z-axis. [2]

Background of the Project 8
GROUP 6 DISPLACEMENT MEASURING USING XYZ ACCELEROMETER SENSOR
Fig. 2.1: Cartesian coordinate system.
A point in the space is defined with three numbers. The first number is to indicate
the displacement by x-axis, the second one to indicate displacement by y-axis and the last
one is to indicate displacement by z-axis. The distance (modulus) between that point and
the coordinates’ center is calculated using:
� = ��� + � + ��
Fig. 2.2: Distance of a point.
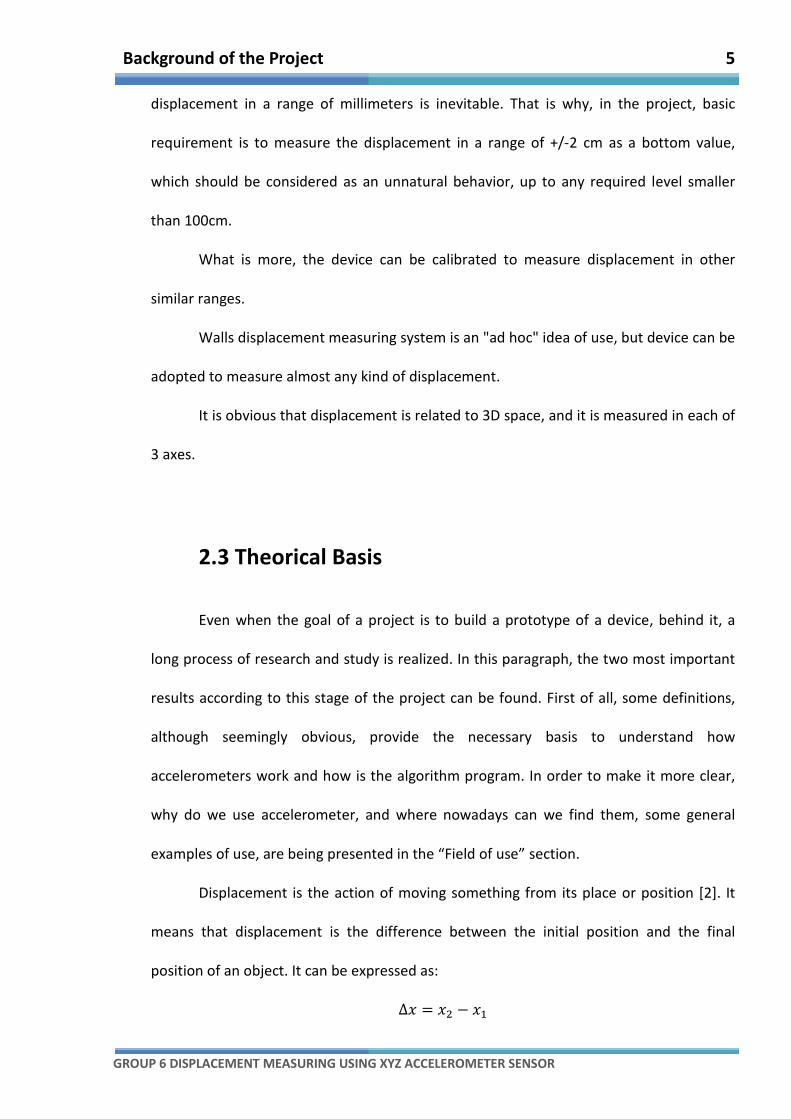
The distance between two points that are not the coordinates’ center is calculated
as the difference between their modulus.
Background of the Project 9
GROUP 6 DISPLACEMENT MEASURING USING XYZ ACCELEROMETER SENSOR
�� = �� − ��
Fig. 2.3: Distance between two points.
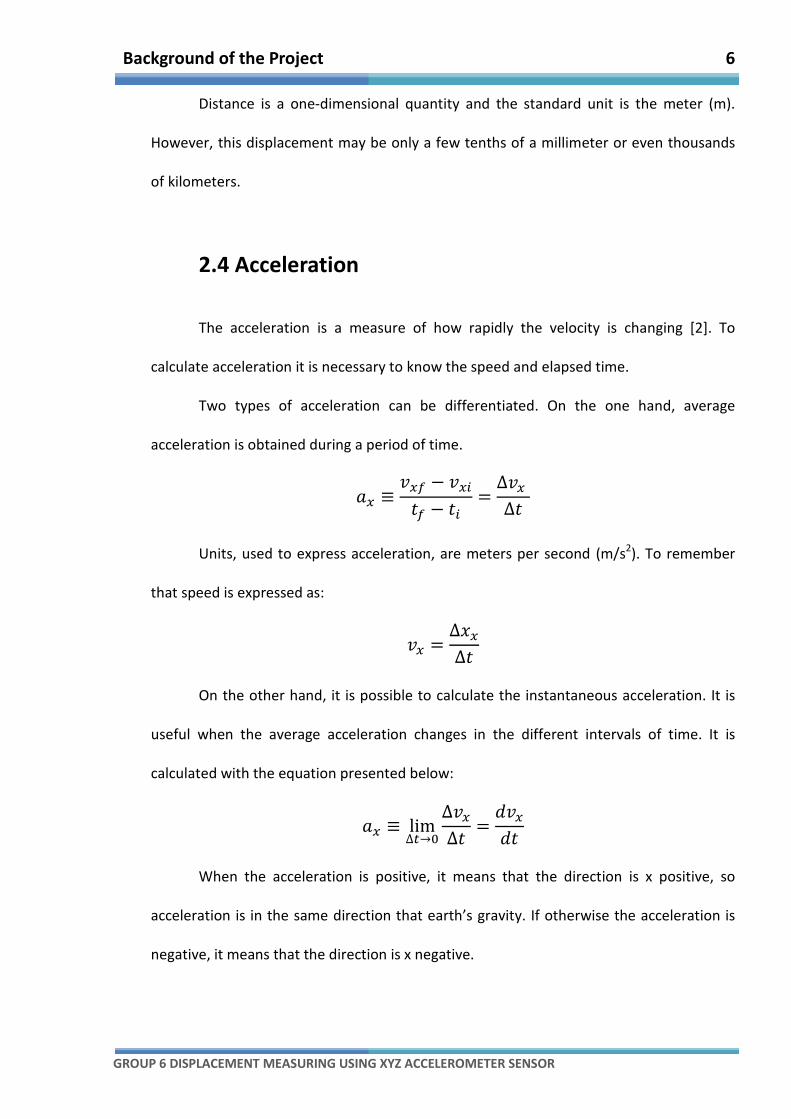
2.6 Accelerometer Sensor
An accelerometer sensor is basically a seismic mass inside a case. A dashpot is
used to absorb the movement between the mass and the case. That movement is
proportional to the acceleration. A variable resistor is used to convert the vibration into
voltage. Because of inertia, the seismic mass is always moving, that is its natural
frequency. Since this frequency, it is considered that the sensor is really moving. The
seismic mass is surrounded with a coil and is made with a magnet. [3]
Fig. 2.4: Accelerometer.
Background of the Project 10
GROUP 6 DISPLACEMENT MEASURING USING XYZ ACCELEROMETER SENSOR
Accelerometers are used to detect very small vibration in stationary and mobile
devices. They internally generate an output voltage proportional to g’s (100mV/g-
common reference value). After the accelerometer output signal is received by the
measurement instrumentation, the acceleration is converted to either velocity or
displacement.[11]
Other type of accelerometer is made with piezoelectric crystals. They are small
and with a very high natural frequency.
Main disadvantage is that the mass influence on the result of nonlinearity and
bias. [4]
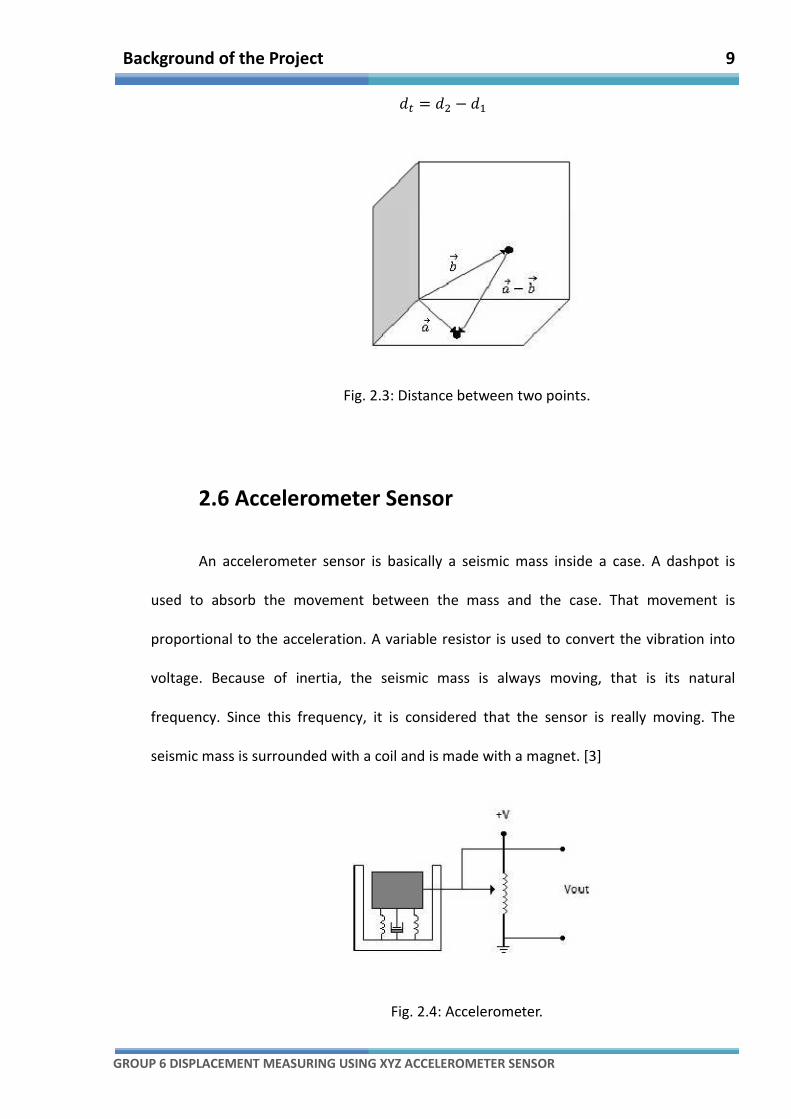
2.7 Analog-to-digital Conversion
When it is working with physical quantities, continuous values are used. By
continuous is meant that the quantity can take any value between two extremes.
However, computers and some electronics devices are working with digital values. An
ACD converts an input voltage (analog domain) into a number (digital domain).
Fig. 2.5: Conversion analog - digital.
Background of the Project 11
GROUP 6 DISPLACEMENT MEASURING USING XYZ ACCELEROMETER SENSOR
If analog data is using, some information can be lost because the noise and
interferences in the wire and electronics. But, using digital data those problems
disappear.
Two groups of conversion techniques exist to convert analog values into digital
values. One of them is comparing the analog signal with a reference voltage. The other is
to change the analog signal in time or frequency and compare these values with others
already known.
In the case of this project the conversion is very easy to make. The power used is
between 0V and 5V and the resolution is between 0 and 1023. With these parameters,
the conversion is:
������ ���5
=� � ��� ���
1023
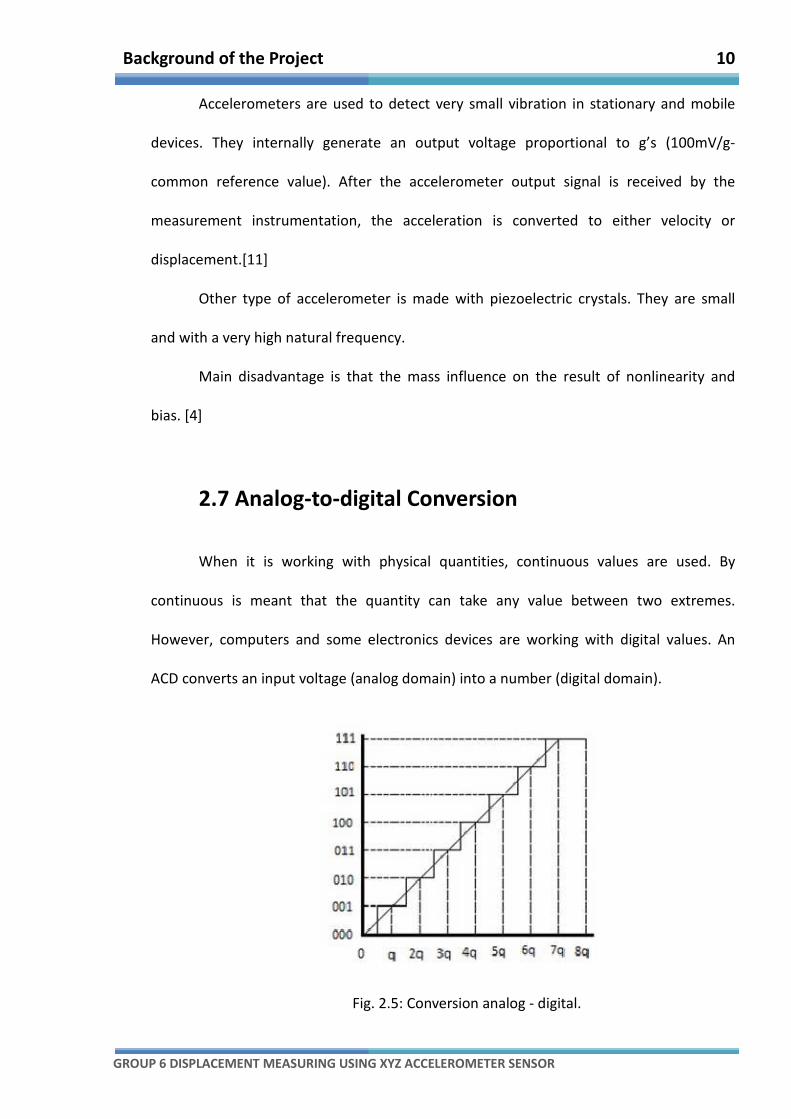
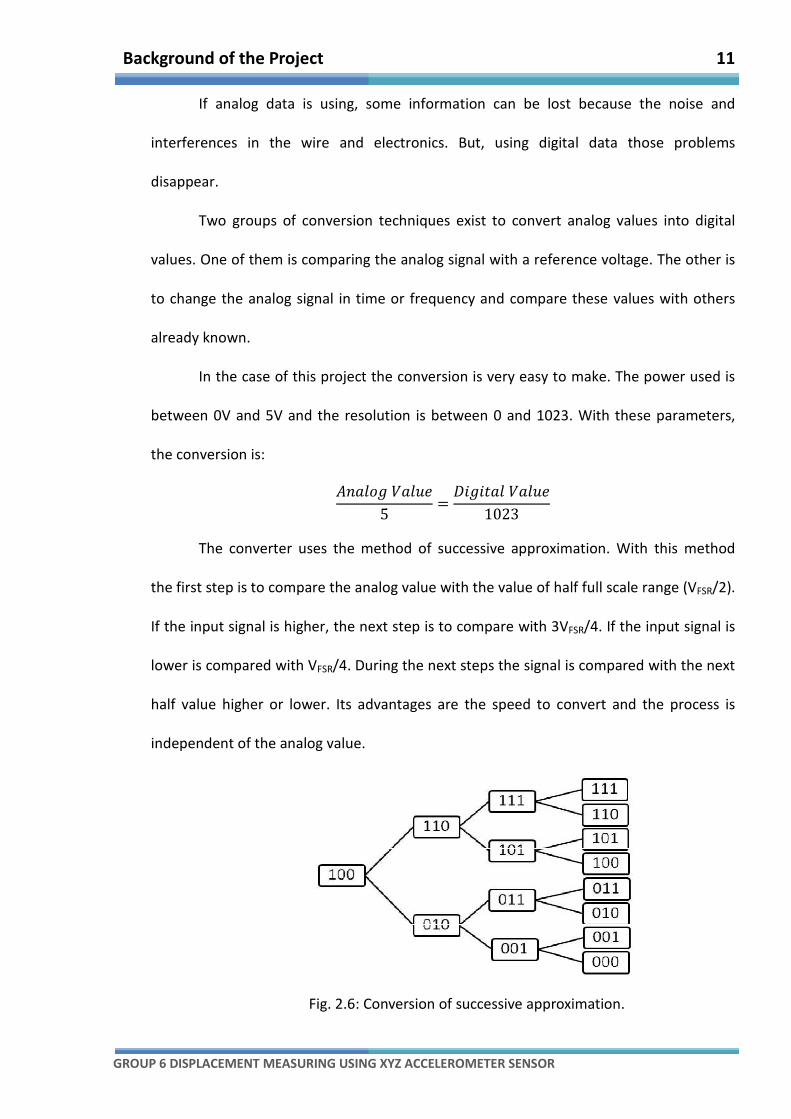
The converter uses the method of successive approximation. With this method
the first step is to compare the analog value with the value of half full scale range (VFSR/2).
If the input signal is higher, the next step is to compare with 3VFSR/4. If the input signal is
lower is compared with VFSR/4. During the next steps the signal is compared with the next
half value higher or lower. Its advantages are the speed to convert and the process is
independent of the analog value.
Fig. 2.6: Conversion of successive approximation.

12
GROUP 6 DISPLACEMENT MEASURING USING XYZ ACCELEROMETER SENSOR
Chapter 3
Field of Use
Field of Use 13
GROUP 6 DISPLACEMENT MEASURING USING XYZ ACCELEROMETER SENSOR
3.1 Seismic Activity
’Quake-Catcher Network’
It is an initiative to detect and to study earthquakes. The idea is to use the sensors
which are inside people laptops to detect seismic activity. Volunteers’ CPU are used to
analyze the signals and, if seismic movement is detected, to send a warning to SETI
center. Also desktop computers are suitable. A universal serial bus accelerometer can be
connected to become part of the network. This option is even better. Many aspects proof
that theory. Desktop computer usually stands on its place without moving and they are
frequently placed on the floor. That reason is fair enough to choose desktop stations.
Fig. 3.1: QCN Logo.
Field of Use 14
GROUP 6 DISPLACEMENT MEASURING USING XYZ ACCELEROMETER SENSOR
3.2 Protection of Hardware
’The ThinkPad APS Accelerometer Interface’
This IBM’s application is designed to detect when a laptop is falling or shaking with
risk for the hard drive. When risk is detected the hard disk its disconnected to avoid the
damage and possible data lost. The accelerometers used to detect potential harmful
movement are placed on the motherboard; these sensors are gathering data about
displacement each 5 microsecond.
3.3 Inertial Navigator System
This is a system that can control the speed and position of a moving vehicle in
order to steer or redirect the object. The Inertial Navigator System controls present
position, orientation and speed using gravitational field, initial position, initial speed and
initial orientation relative to a coordinate system. Accelerometers and gyroscopes are
used to obtain the data. It is very useful for guiding missiles, aircraft, ships, spacecraft and
submarines.
3.4 IPhone Applications
Iphone maximizes the accelerometer’s use with a lot of applications. Here, only
some examples are presented, but there are many more. What is more, it is still possible
to create others and find many new ways to work with accelerometers in smart phones.
Field of Use 15
GROUP 6 DISPLACEMENT MEASURING USING XYZ ACCELEROMETER SENSOR
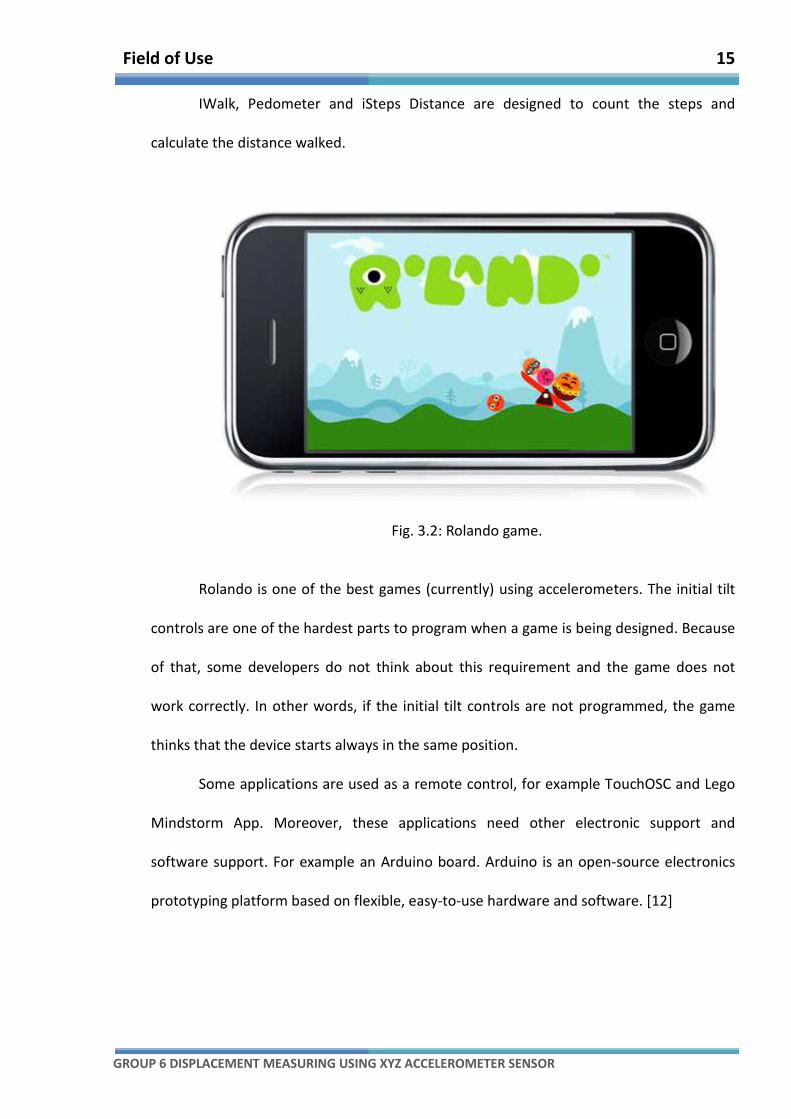
IWalk, Pedometer and iSteps Distance are designed to count the steps and
calculate the distance walked.
Fig. 3.2: Rolando game.
Rolando is one of the best games (currently) using accelerometers. The initial tilt
controls are one of the hardest parts to program when a game is being designed. Because
of that, some developers do not think about this requirement and the game does not
work correctly. In other words, if the initial tilt controls are not programmed, the game
thinks that the device starts always in the same position.
Some applications are used as a remote control, for example TouchOSC and Lego
Mindstorm App. Moreover, these applications need other electronic support and
software support. For example an Arduino board. Arduino is an open-source electronics
prototyping platform based on flexible, easy-to-use hardware and software. [12]
Field of Use 16
GROUP 6 DISPLACEMENT MEASURING USING XYZ ACCELEROMETER SENSOR
3.5 Airbags
Some studies were done to test the usefulness of the accelerometers in airbags
systems. The biggest problem is that the system needs a single-axis sensitive specification
very narrow while the temperature range is very wide. It has to fulfill strict requirements
about vibration system, handler system and instrumentation system.
3.6 Medical Applications
The medical field is very extensive and new applications are developed every day.
It is used, most of all, to translational and angular acceleration measurements. The force
acting on a mass is the method used to know the acceleration of a linear motion. To know
the angular acceleration should be seen the moment of inertia. For measure human body
motions is necessary only a few g and high sensitivity.
Body movements are very easy to measure with accelerometers when some
parameters are known. In this case, they are velocity and displacement. The disadvantage
is to calculate the rotational acceleration. Because of that, sometimes ultrasound
techniques are also used.
A good example is Zoll’s AED Plus which is used to measure the depth of CPR chest
compressions. Is also useful in medical equipment to measure tilt to make sure the angle
is correct. In rehabilitation it is possible to know if the injured person is making progress.
Field of Use 17
GROUP 6 DISPLACEMENT MEASURING USING XYZ ACCELEROMETER SENSOR
3.7 Machine Calibration
The calibration definition is: ’standardization of measuring instrument: the
checking of a measuring instrument against an accurate standard to determine any
deviation and correct for errors’ [Encarta, 2010]. And one of the methods to calibrate a
device is to use a measurement system, in that case, with an accelerometer sensor. Each
device has a very specific function, depending which kind of machines is calibrating. Right
now, auto-calibration devices are being researched. In the moment one of the sensors
detects movement forces some kind of device to return to this position.
To conclude, throughout this chapter theoretical basis has been seen. The
definitions are very useful to know which kind of devices are being looked for and what
the program have to do. Moreover, previous accelerometer sensor’s uses have been
studied to learn accelerometer’s advantages and disadvantages.
18
GROUP 6 DISPLACEMENT MEASURING USING XYZ ACCELEROMETER SENSOR
Chapter 4
Hardware Layer
Hardware Layer 19
GROUP 6 DISPLACEMENT MEASURING USING XYZ ACCELEROMETER SENSOR
4.1 Overview
The market is full of possible solutions for almost everything. However, at the
point, goal is to find devices that satisfy the requirements. They also should be cheap and
easy to use. In this section, description of devices is provided with the explanation for
their choice.
Device Number
STK500 1
ATmega16 1
Potentiometers (10k) 4
LD1117AV33 1
EVAL-ADXL335Z 1
Display MC1602C8-SYL 1
RS232-USB Converter 1
Table 4.1: Components in the prototype and their quantity.
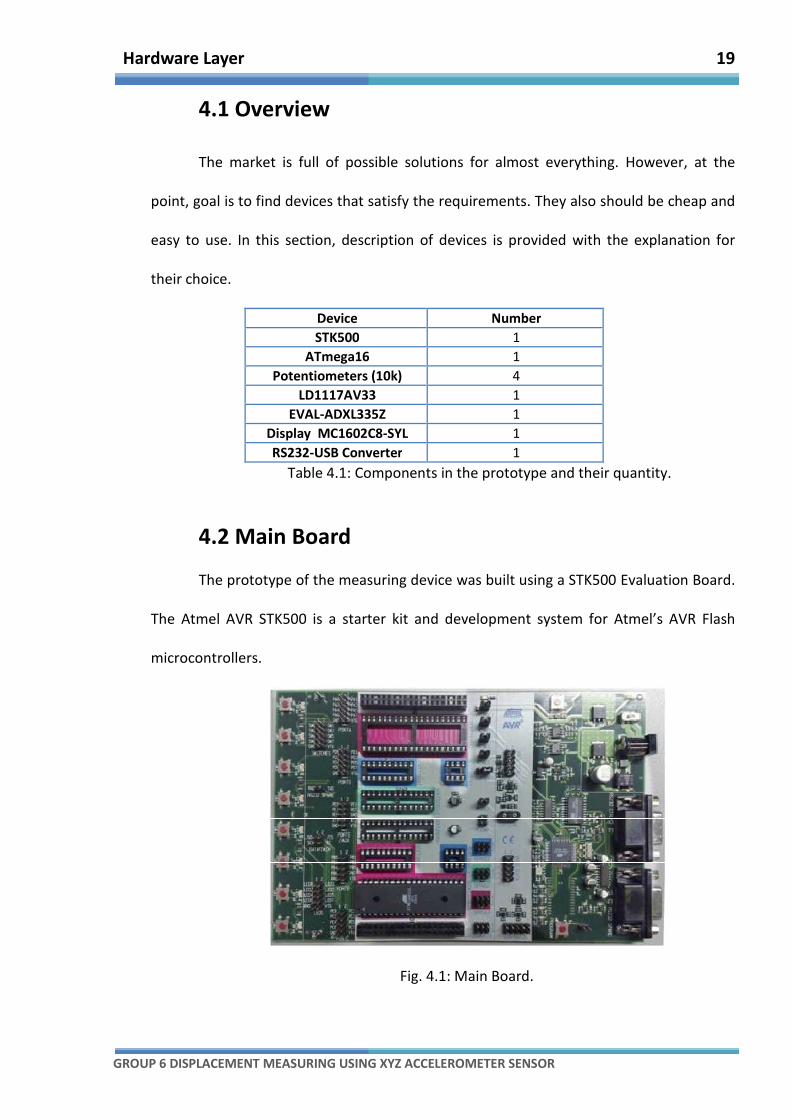
4.2 Main Board
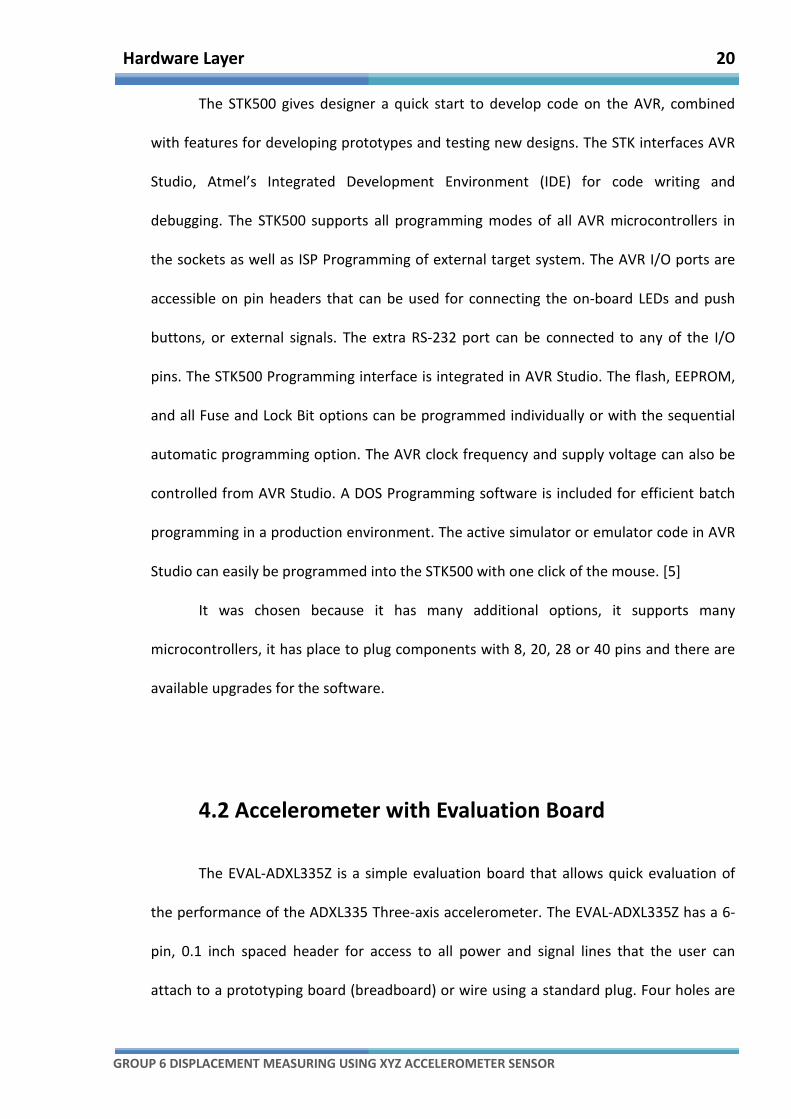
The prototype of the measuring device was built using a STK500 Evaluation Board.
The Atmel AVR STK500 is a starter kit and development system for Atmel’s AVR Flash
microcontrollers.
Fig. 4.1: Main Board.
Hardware Layer 20
GROUP 6 DISPLACEMENT MEASURING USING XYZ ACCELEROMETER SENSOR
The STK500 gives designer a quick start to develop code on the AVR, combined
with features for developing prototypes and testing new designs. The STK interfaces AVR
Studio, Atmel’s Integrated Development Environment (IDE) for code writing and
debugging. The STK500 supports all programming modes of all AVR microcontrollers in
the sockets as well as ISP Programming of external target system. The AVR I/O ports are
accessible on pin headers that can be used for connecting the on-board LEDs and push
buttons, or external signals. The extra RS-232 port can be connected to any of the I/O
pins. The STK500 Programming interface is integrated in AVR Studio. The flash, EEPROM,
and all Fuse and Lock Bit options can be programmed individually or with the sequential
automatic programming option. The AVR clock frequency and supply voltage can also be
controlled from AVR Studio. A DOS Programming software is included for efficient batch
programming in a production environment. The active simulator or emulator code in AVR
Studio can easily be programmed into the STK500 with one click of the mouse. [5]
It was chosen because it has many additional options, it supports many
microcontrollers, it has place to plug components with 8, 20, 28 or 40 pins and there are
available upgrades for the software.
4.2 Accelerometer with Evaluation Board
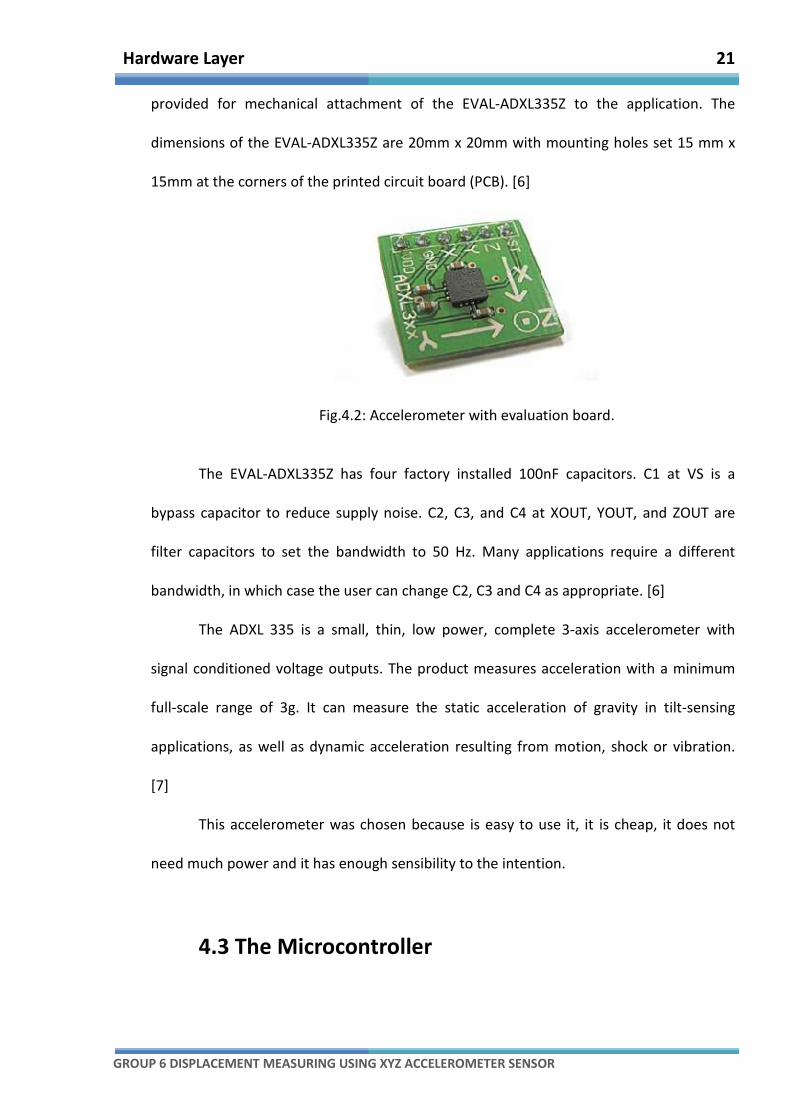
The EVAL-ADXL335Z is a simple evaluation board that allows quick evaluation of
the performance of the ADXL335 Three-axis accelerometer. The EVAL-ADXL335Z has a 6-
pin, 0.1 inch spaced header for access to all power and signal lines that the user can
attach to a prototyping board (breadboard) or wire using a standard plug. Four holes are
Hardware Layer 21
GROUP 6 DISPLACEMENT MEASURING USING XYZ ACCELEROMETER SENSOR
provided for mechanical attachment of the EVAL-ADXL335Z to the application. The
dimensions of the EVAL-ADXL335Z are 20mm x 20mm with mounting holes set 15 mm x
15mm at the corners of the printed circuit board (PCB). [6]
Fig.4.2: Accelerometer with evaluation board.
The EVAL-ADXL335Z has four factory installed 100nF capacitors. C1 at VS is a
bypass capacitor to reduce supply noise. C2, C3, and C4 at XOUT, YOUT, and ZOUT are
filter capacitors to set the bandwidth to 50 Hz. Many applications require a different
bandwidth, in which case the user can change C2, C3 and C4 as appropriate. [6]
The ADXL 335 is a small, thin, low power, complete 3-axis accelerometer with
signal conditioned voltage outputs. The product measures acceleration with a minimum
full-scale range of 3g. It can measure the static acceleration of gravity in tilt-sensing
applications, as well as dynamic acceleration resulting from motion, shock or vibration.
[7]
This accelerometer was chosen because is easy to use it, it is cheap, it does not
need much power and it has enough sensibility to the intention.
4.3 The Microcontroller

Hardware Layer 22
GROUP 6 DISPLACEMENT MEASURING USING XYZ ACCELEROMETER SENSOR
The microcontroller used is ATmega16. It is a low-power CMOS 8-bit
microcontroller based on the AVR enhanced RISC architecture. By executing powerful
instructions in a single clock cycle, the ATmega16 achieves throughputs approaching 1
MIPS per MHz allowing the system designed to optimize power consumption versus
processing speed. [8]
Fig. 4.3: Microcontroller ATMega16.
Technical/Catalog Information ATMEGA 16/16PI
Vendor Atmel
Category Integrated Circuits (ICs)
Program Memory Size 16KB (16K x 8)
RAM Size 1K x 8
Number of I/O 32
Package / Case 40-DIP(600 mil)
Speed 16MHz
Oscillator Type Internal
Packaging Tube
Program Memory Type FLASH
EEPROM Size 512 x 8
Core Processor AVR
Data Converters A/D 8x10b
Core Size 8-Bit
Operating Temperature -40°C 85°C
Connectivity I2C, SPI, UART/USART
Peripherals Brown-out Detect/Reset, POR, PWM, WDT
Voltage-Supply (Vcc/Vdd) 4.5V 5.5V
Lead Free Status Contains Lead
RoHS Status RoHS Non-Compliant
Table 4.2: ATMega16 brief specification
Hardware Layer 23
GROUP 6 DISPLACEMENT MEASURING USING XYZ ACCELEROMETER SENSOR
This microcontroller was chosen because it satisfies the project requirements as
well as supporting system development tools like C compilers, macro assemblers,
program debugger/simulators, in-circuit emulators, and evaluation kits.
4.4 Display
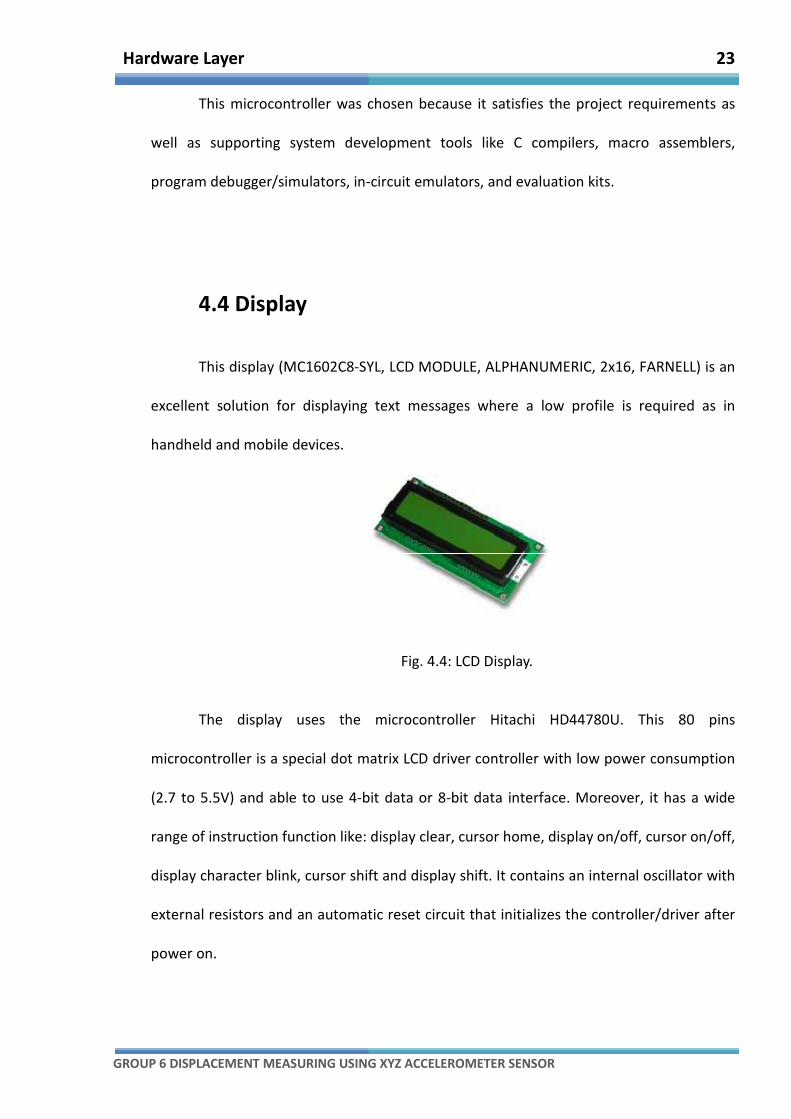
This display (MC1602C8-SYL, LCD MODULE, ALPHANUMERIC, 2x16, FARNELL) is an
excellent solution for displaying text messages where a low profile is required as in
handheld and mobile devices.
Fig. 4.4: LCD Display.
The display uses the microcontroller Hitachi HD44780U. This 80 pins
microcontroller is a special dot matrix LCD driver controller with low power consumption
(2.7 to 5.5V) and able to use 4-bit data or 8-bit data interface. Moreover, it has a wide
range of instruction function like: display clear, cursor home, display on/off, cursor on/off,
display character blink, cursor shift and display shift. It contains an internal oscillator with
external resistors and an automatic reset circuit that initializes the controller/driver after
power on.

Hardware Layer 24
GROUP 6 DISPLACEMENT MEASURING USING XYZ ACCELEROMETER SENSOR
The reason for choosing 2x16 standard display is very simple. While building a
prototype, only one accelerometer was used, and the second one was simulated using
potentiometers. While working with two accelerometers we need nothing more but two
lines with 16 characters each to display the results. Nowadays it is all about the cost so
the choice was very simply. Another advantage is that the display is the most popular
one, supported with many additional libraries and written by amateurs, ready to use,
functions.
4.5 LD1117 Voltage Regulator
Fig. 4.5: LD1117 Voltage regulator.
In the project an LD1117 voltage regulator is being used. The LD1117 is a low drop
voltage regulator able to provide up to 800mA of Output Current, available even in
adjustable version (Vref=1.25V). Concerning fixed versions are offered the following
Output Voltages: 1.2V, 1.8V, 2.5V, 2.85V, 3.0V, 3.3V and 5.0V. The 2.85 type is ideal for
SCSI-2 lines active termination. The adjustable LD1117 is pin to pin compatible with the
Hardware Layer 25
GROUP 6 DISPLACEMENT MEASURING USING XYZ ACCELEROMETER SENSOR
other standard. Adjustable voltage regulators maintaining the better performances in
terms of Drop and Tolerance. [9]
It was chosen because the accelerometer needs 3.3V and the board only offers 5V.
4.6 RS232 Converter
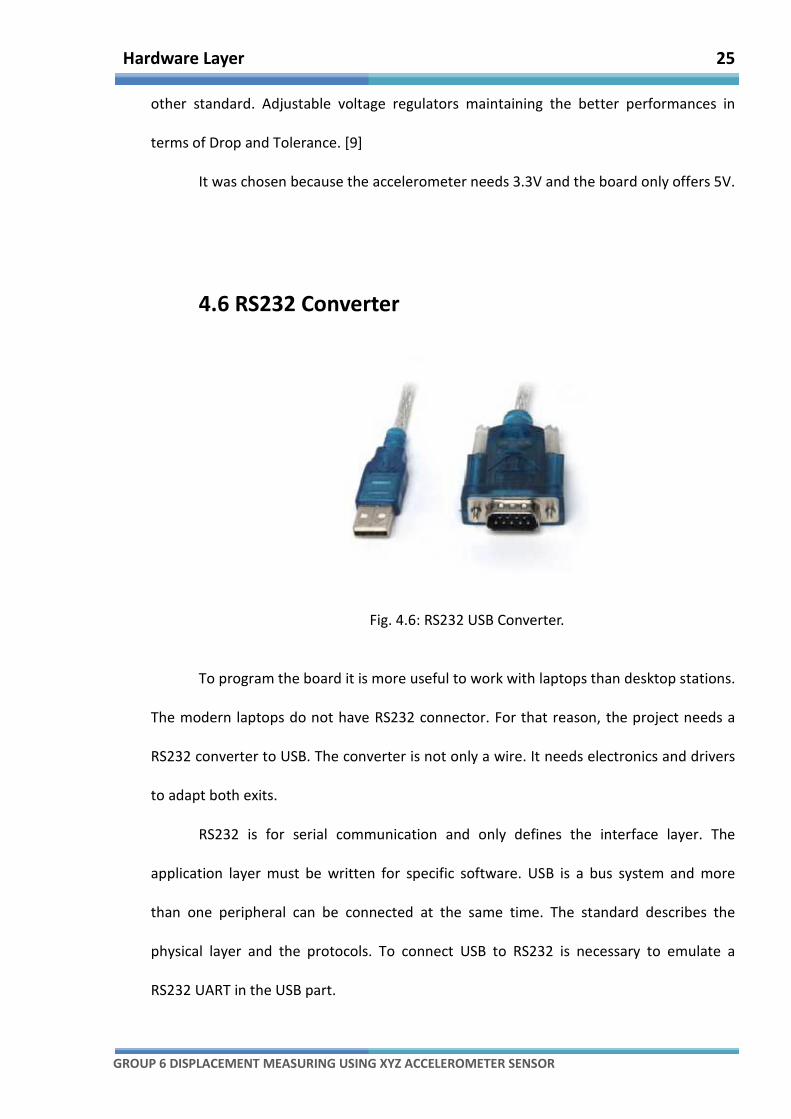
Fig. 4.6: RS232 USB Converter.
To program the board it is more useful to work with laptops than desktop stations.
The modern laptops do not have RS232 connector. For that reason, the project needs a
RS232 converter to USB. The converter is not only a wire. It needs electronics and drivers
to adapt both exits.
RS232 is for serial communication and only defines the interface layer. The
application layer must be written for specific software. USB is a bus system and more
than one peripheral can be connected at the same time. The standard describes the
physical layer and the protocols. To connect USB to RS232 is necessary to emulate a
RS232 UART in the USB part.

Hardware Layer 26
GROUP 6 DISPLACEMENT MEASURING USING XYZ ACCELEROMETER SENSOR
RS232 ports work with three power sources: +5V for the UART logic, and -12V and
+12V for the output drivers. In the USB case, only +5V is necessary. Some converters use
AC/DC converters to provide the right voltages.
4.7 ADC
The ADC is the analog-digital converter. The ADC used in the project was
integrated in the microcontroller. It uses 10-bit of resolution. The inputs are: 8
Multiplexed Single Ended Input Channels, 7 Differential Input Channels and 2 Differential
Input Channels with Optional Gain of 10x and 200x. The Input Voltage Range is between 0
and Vcc. The method used to convert is successive approximation.
4.8 Multiplexer
Fig. 4.7: Multiplexer.
Multiplexer does not appear in the actual prototype, but is the next step if it is
wanted to add more accelerometers.
Hardware Layer 27
GROUP 6 DISPLACEMENT MEASURING USING XYZ ACCELEROMETER SENSOR
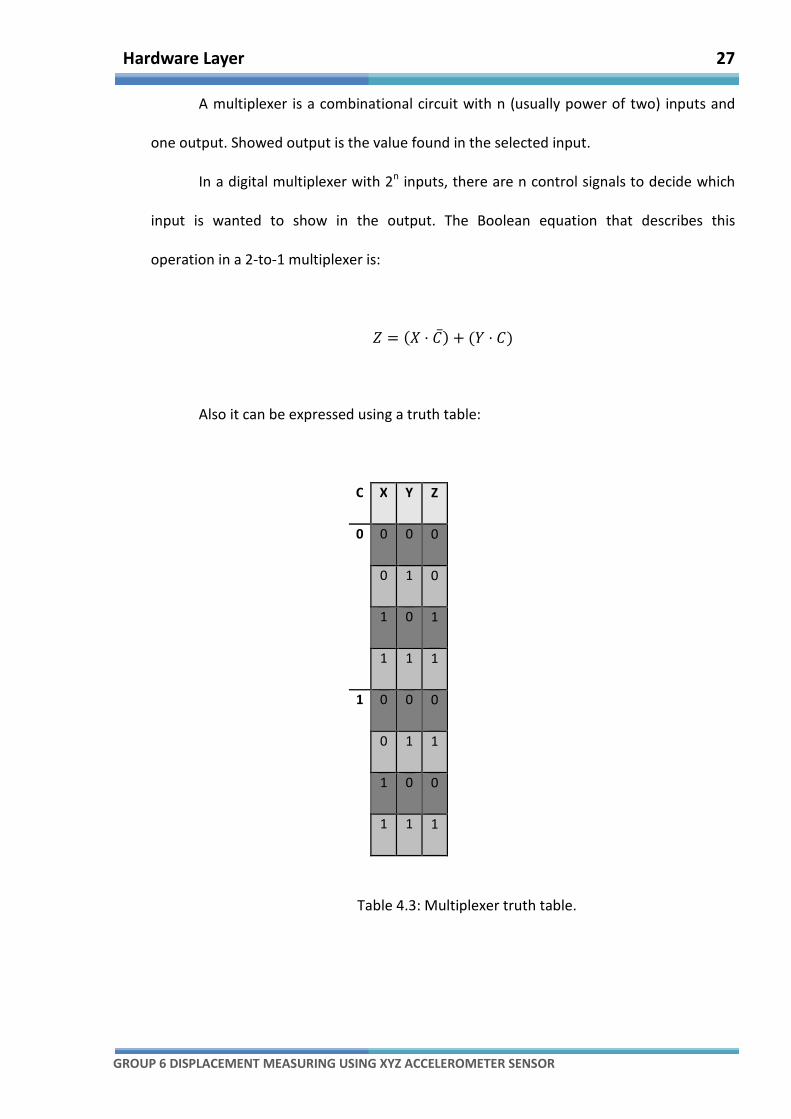
A multiplexer is a combinational circuit with n (usually power of two) inputs and
one output. Showed output is the value found in the selected input.
In a digital multiplexer with 2n inputs, there are n control signals to decide which
input is wanted to show in the output. The Boolean equation that describes this
operation in a 2-to-1 multiplexer is:
� = �� · �̅� + (� · �)
Also it can be expressed using a truth table:
C X Y Z
0 0 0 0
0 1 0
1 0 1
1 1 1
1 0 0 0
0 1 1
1 0 0
1 1 1
Table 4.3: Multiplexer truth table.
Hardware Layer 28
GROUP 6 DISPLACEMENT MEASURING USING XYZ ACCELEROMETER SENSOR
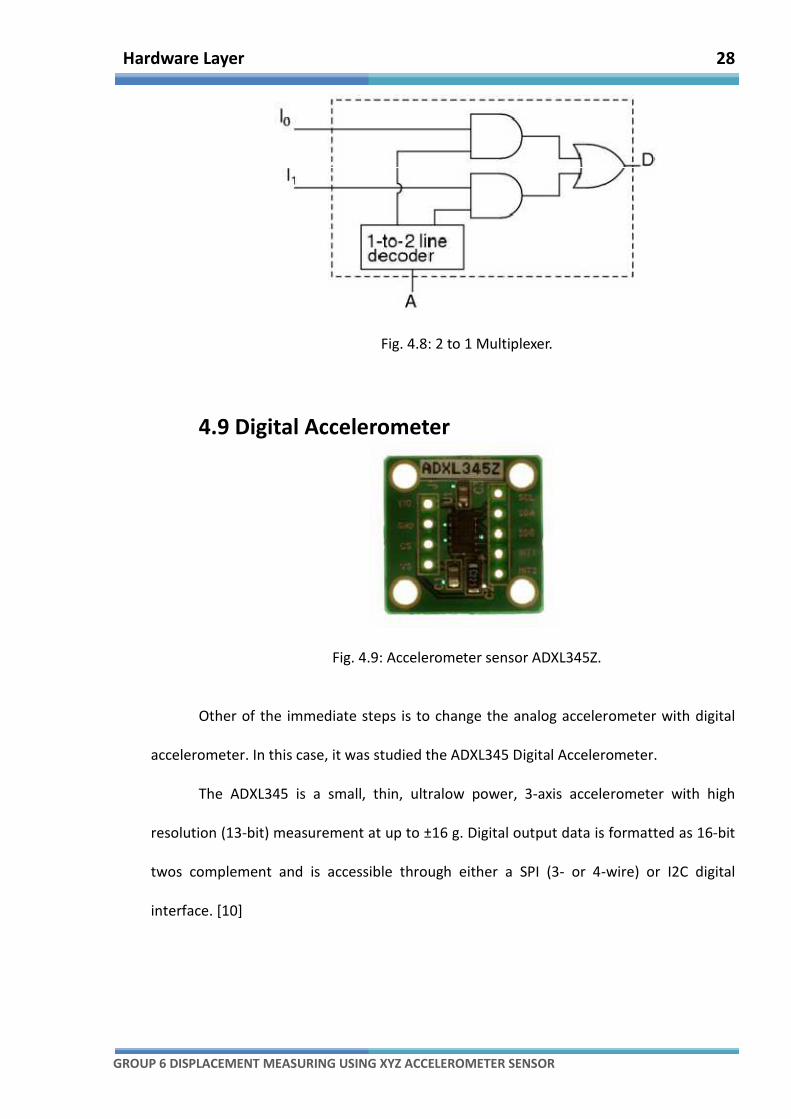
Fig. 4.8: 2 to 1 Multiplexer.
4.9 Digital Accelerometer
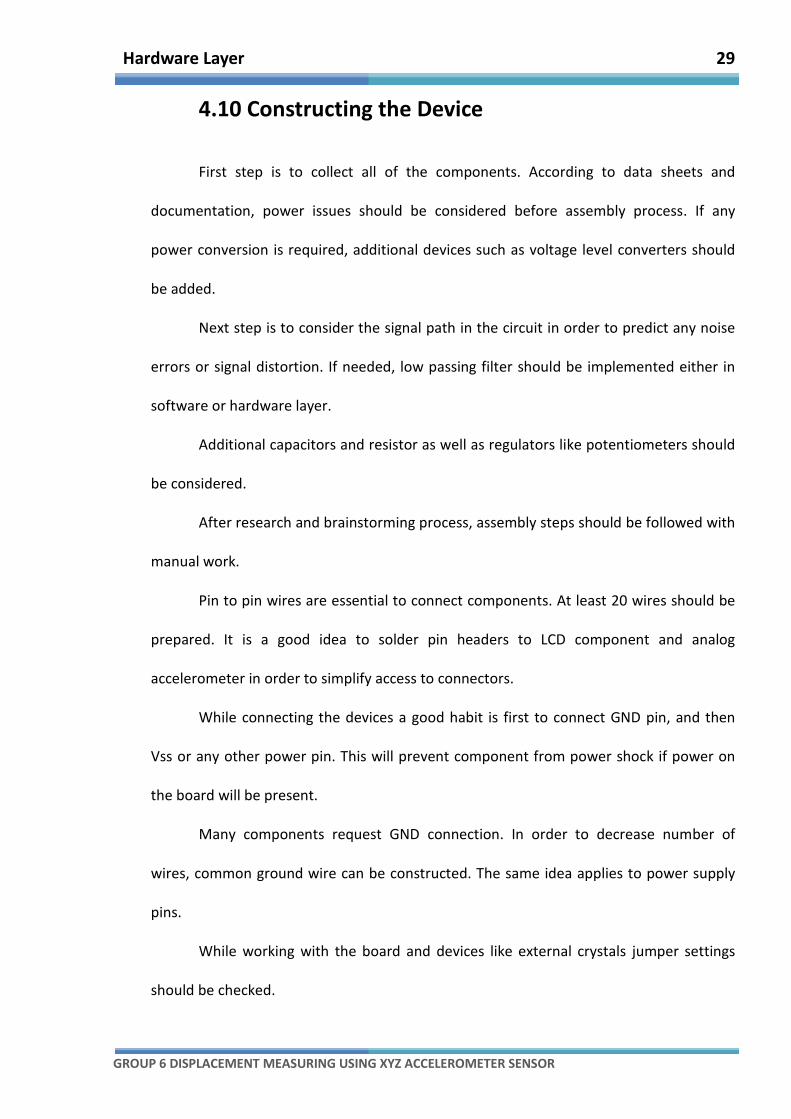
Fig. 4.9: Accelerometer sensor ADXL345Z.
Other of the immediate steps is to change the analog accelerometer with digital
accelerometer. In this case, it was studied the ADXL345 Digital Accelerometer.
The ADXL345 is a small, thin, ultralow power, 3-axis accelerometer with high
resolution (13-bit) measurement at up to ±16 g. Digital output data is formatted as 16-bit
twos complement and is accessible through either a SPI (3- or 4-wire) or I2C digital
interface. [10]
Hardware Layer 29
GROUP 6 DISPLACEMENT MEASURING USING XYZ ACCELEROMETER SENSOR
4.10 Constructing the Device
First step is to collect all of the components. According to data sheets and
documentation, power issues should be considered before assembly process. If any
power conversion is required, additional devices such as voltage level converters should
be added.
Next step is to consider the signal path in the circuit in order to predict any noise
errors or signal distortion. If needed, low passing filter should be implemented either in
software or hardware layer.
Additional capacitors and resistor as well as regulators like potentiometers should
be considered.
After research and brainstorming process, assembly steps should be followed with
manual work.
Pin to pin wires are essential to connect components. At least 20 wires should be
prepared. It is a good idea to solder pin headers to LCD component and analog
accelerometer in order to simplify access to connectors.
While connecting the devices a good habit is first to connect GND pin, and then
Vss or any other power pin. This will prevent component from power shock if power on
the board will be present.
Many components request GND connection. In order to decrease number of
wires, common ground wire can be constructed. The same idea applies to power supply
pins.
While working with the board and devices like external crystals jumper settings
should be checked.
Hardware Layer 30
GROUP 6 DISPLACEMENT MEASURING USING XYZ ACCELEROMETER SENSOR
In the above paragraph only general matters were considered. Assembling the
device from separate components is described in the “Quick Start” tutorial included in the
appendix.
4.11 Signals Circuit
The beginning of the signal path is in the accelerometer. Analog accelerometers
generate level of voltage as their output. Level can differ from 0V to 3.3V (for power
supply of 3.3V).Due to earth’s gravity appropriate analog signal is being sent to
microprocessor. To be more specific the signal is send to PORTA of the ATmega16 unit,
which is supported with internal ADC converters. Resolution of the on-chip ADC
peripheral is 10 bits. That means we can receive a number form 0 up to 1023 (2^10).
As a reference value 5V was used, so numbers around 1000 will never be reached.
Because 5V of output stands for number 1023, and accelerometer can generate 3.3V at
most. This analog signal is converted to the digital one and sent to LCD display as an
integer numbers, as well as, to the PC via RS232 protocol, also as a set of integer
numbers. Digital signal is processed on the PC. That means signal is analyzed and visualize
as a chart or graph. Exactly the same process refers to simulated with potentiometers
accelerometer. Important matter is voltage level conversion realized by LD1117 regulator.
It is done in order to provide required amount of power to the accelerometer. Whole
process of generating output signals and converting them in repeated in infinitive loop.

Hardware Layer 31
GROUP 6 DISPLACEMENT MEASURING USING XYZ ACCELEROMETER SENSOR
A pragmatic strategy to get familiar with a new device is to hook it up and see
what data it delivers. That is how data was analyzed and divided into positive and
negative value for each axis.
During this chapter, it has been explaining the used components and why they
were chosen. The most important reasons were versatility, easy use and low power. Also
some proposals for new devices are described.
32
GROUP 6 DISPLACEMENT MEASURING USING XYZ ACCELEROMETER SENSOR
Chapter 5
Programming Using AVR
Studio 4
Programming Using AVR Studio 4 33
GROUP 6 DISPLACEMENT MEASURING USING XYZ ACCELEROMETER SENSOR
5.1 Software Overview
Software layer can be divided into two parts. First one relates to software on the
microcontroller side, and the second one on the PC side. The high level language such as
C, was another reason why to choose AVR units. There are provided with the dedicated
software and useful free compilers.
Software for the microcontroller was written in the AVR Studio.
AVR Studio 4 is the Integrated Development Environment (IDE) for developing 8-
bit AVR applications in Windows NT/2000/XP/Vista/7 [13] environments. AVR Studio 4
provides a complete set of features including debugger supporting run control including
source and instruction-level stepping and breakpoints; registers, memory and I/O views;
and target configuration and management as well as full programming support for
standalone programmers.
The most important feature of AVR microcontroller is a very high quality ‘C’
compiler for free. It is GNU C compiler. It is extremely popular and it has a large user
base.The reason for choosing AVR is very simple - company provides excellent software at
no cost.
Fig. 5.1 AVR Logo
PC software is written using Visual Studio 2008 Student edition. Connection
between PC and the board was checked also with HyperTerminal software.
Programming Using AVR Studio 4 34
GROUP 6 DISPLACEMENT MEASURING USING XYZ ACCELEROMETER SENSOR
Visit Atmel’s website to see more features and datasheets about AVR Studio 4 and
download AVR Studio 4.[13]
Following subjects are about how to use AVR Studio 4 to develop the project.
5.2 Create a New Project
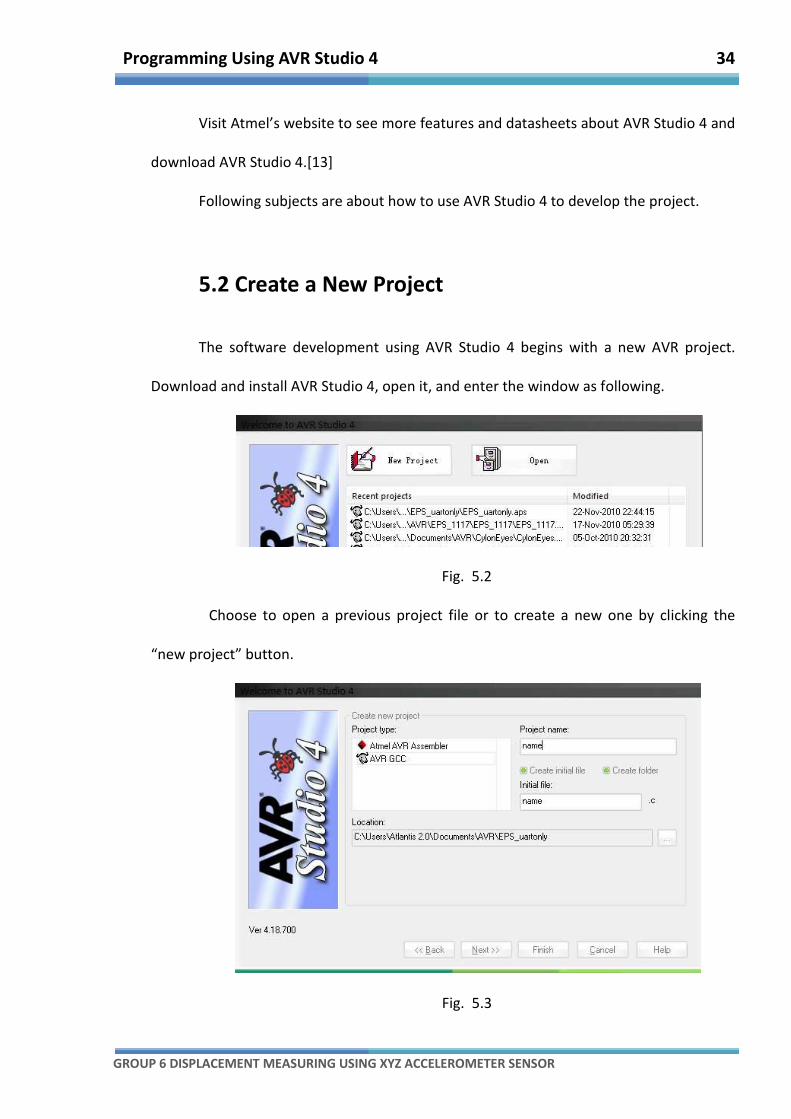
The software development using AVR Studio 4 begins with a new AVR project.
Download and install AVR Studio 4, open it, and enter the window as following.
Fig. 5.2
Choose to open a previous project file or to create a new one by clicking the
“new project” button.
Fig. 5.3

Programming Using AVR Studio 4 35
GROUP 6 DISPLACEMENT MEASURING USING XYZ ACCELEROMETER SENSOR
Then select project type, type in the project name and specify the file path for
the project. GCC is chosen as the C/C++ language compiler, so project type should be
“AVR GCC”. Then, press “Next” button.
Fig. 5.4
The most important option of an AVR project is to select the debug platform and
device. AVR Simulator is a usual way to debug AVR program and the project use
ATmega16 chip. [For hardware selection and description, see Chapter 4, Hardware layer.]
Then, press “Finish” button to set up a new project.
5.3 C Language Project Management
5.3.1 View c files and header files in explorer window
A new project will automatically create the first .c file (source file of a C/C++
program) name after the project name. Programmer can type in the C code in this file
Programming Using AVR Studio 4 36
GROUP 6 DISPLACEMENT MEASURING USING XYZ ACCELEROMETER SENSOR
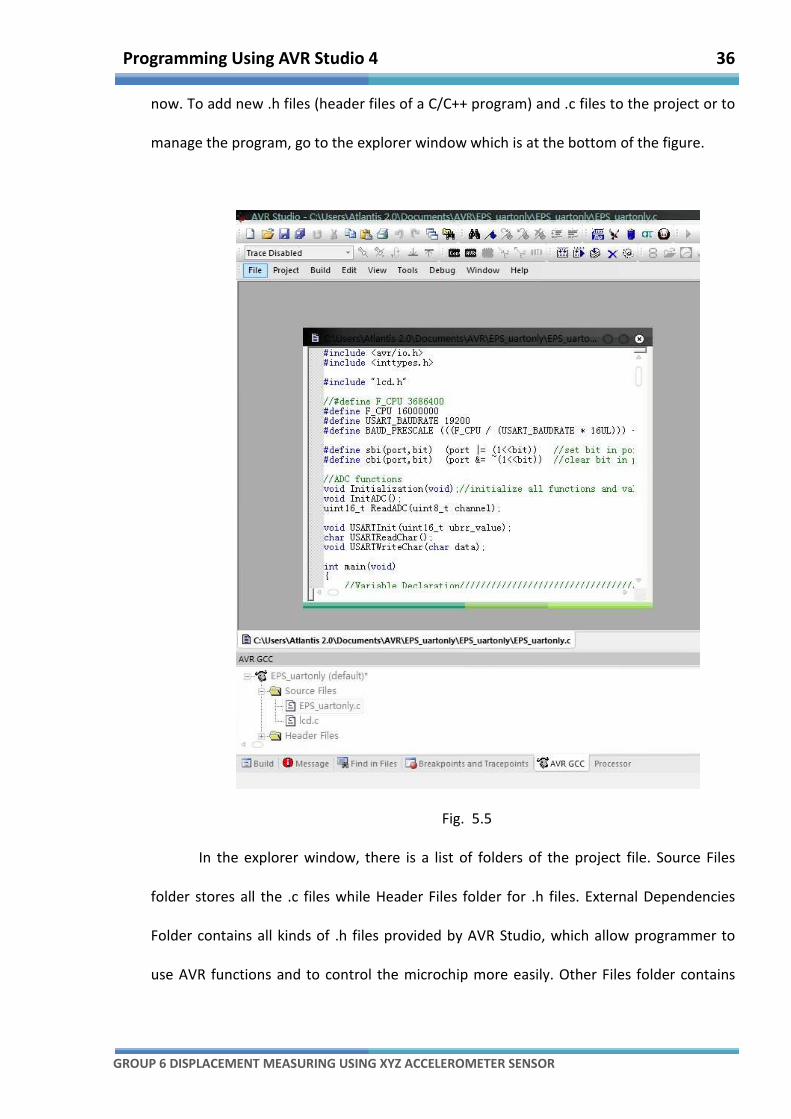
now. To add new .h files (header files of a C/C++ program) and .c files to the project or to
manage the program, go to the explorer window which is at the bottom of the figure.
Fig. 5.5
In the explorer window, there is a list of folders of the project file. Source Files
folder stores all the .c files while Header Files folder for .h files. External Dependencies
Folder contains all kinds of .h files provided by AVR Studio, which allow programmer to
use AVR functions and to control the microchip more easily. Other Files folder contains

Programming Using AVR Studio 4 37
GROUP 6 DISPLACEMENT MEASURING USING XYZ ACCELEROMETER SENSOR
some automatically created files corresponding to the project. They are not so important
to the project and unnecessary to explain.
Fig. 5.6
5.3.2 Add external library to the project
What is really important and necessary to the project is the employment of
external libraries, which stand for a serial of .h files and corresponding .c files
implemented by others but open-source to the public. These libraries always provide
powerful and requisite functions to access certain hardware or to control the device.
Suppose there is an external library called LCD library, which include two files,
lcd.c and lcd.h. Here is the way to add this library (.c and .h files) to the current project.
Fig. 5.7
Copy these files to the AVR project folder. The project file path can be found on
the title of the opening AVR Studio window. Put the file in the same path as the “default”
folder also the .aps file.
Programming Using AVR Studio 4 38
GROUP 6 DISPLACEMENT MEASURING USING XYZ ACCELEROMETER SENSOR
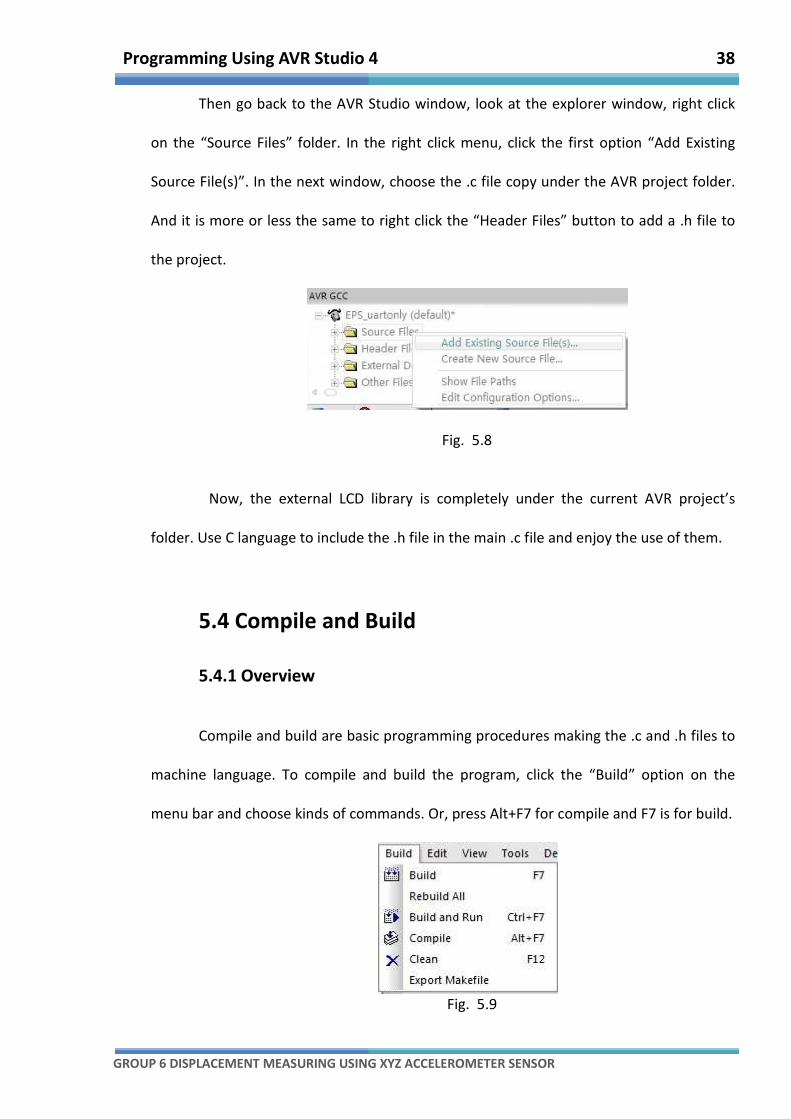
Then go back to the AVR Studio window, look at the explorer window, right click
on the “Source Files” folder. In the right click menu, click the first option “Add Existing
Source File(s)”. In the next window, choose the .c file copy under the AVR project folder.
And it is more or less the same to right click the “Header Files” button to add a .h file to
the project.
Fig. 5.8
Now, the external LCD library is completely under the current AVR project’s
folder. Use C language to include the .h file in the main .c file and enjoy the use of them.
5.4 Compile and Build
5.4.1 Overview
Compile and build are basic programming procedures making the .c and .h files to
machine language. To compile and build the program, click the “Build” option on the
menu bar and choose kinds of commands. Or, press Alt+F7 for compile and F7 is for build.
Fig. 5.9

Programming Using AVR Studio 4 39
GROUP 6 DISPLACEMENT MEASURING USING XYZ ACCELEROMETER SENSOR
5.4.2 Compile and find errors in the codes
Compiling is also a way to check the grammar of the codes. If there is any error
or warning in the program, user will be informed by AVR Studio in the “Build” information
window. Click the line with colored point to track the places of errors or warnings.
Fig. 5.10
Correct these mistakes until there is no error after compiling. Compared with
errors, warnings are lower level mistakes that will not influence the executing of the
program. Build will succeed with warnings in compiling. However, warnings always imply
potential insecurity.
Fig. 5.11
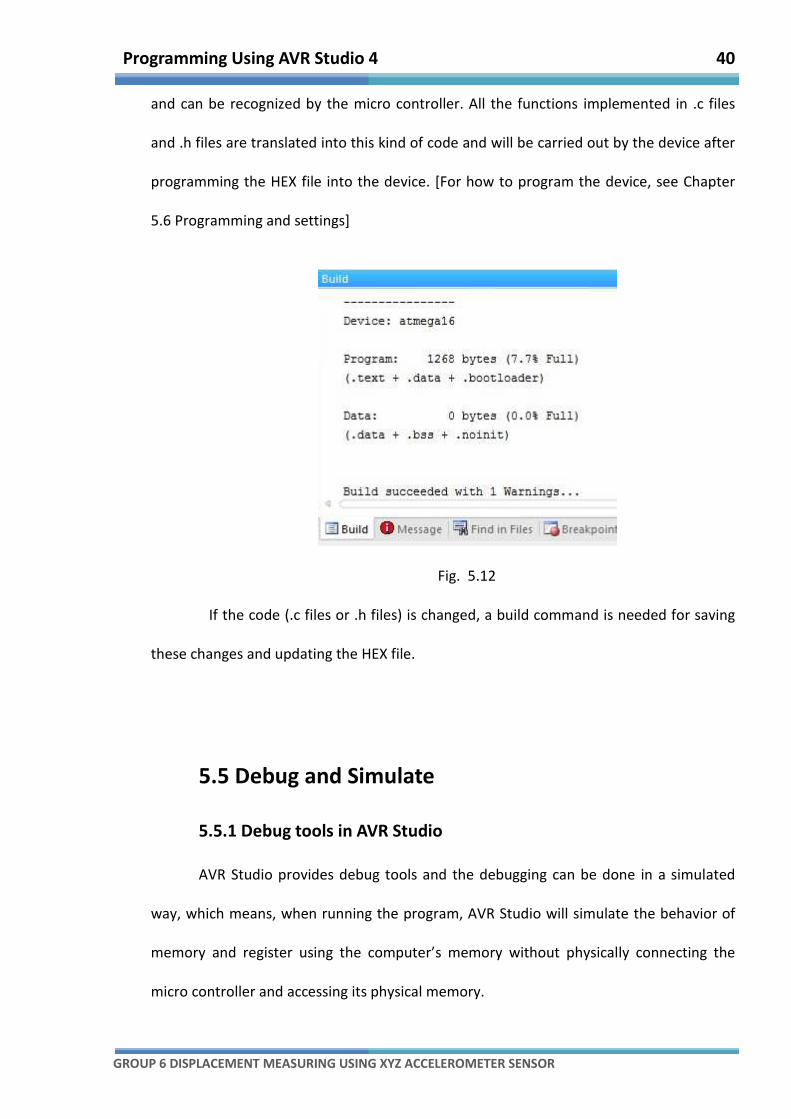
5.4.3 Build and make a .hex file
The build command will first compile the program, and make a .hex file under
user’s AVR project folder after a successful compiling. This file is written in hexadecimal,
Programming Using AVR Studio 4 40
GROUP 6 DISPLACEMENT MEASURING USING XYZ ACCELEROMETER SENSOR
and can be recognized by the micro controller. All the functions implemented in .c files
and .h files are translated into this kind of code and will be carried out by the device after
programming the HEX file into the device. [For how to program the device, see Chapter
5.6 Programming and settings]
Fig. 5.12
If the code (.c files or .h files) is changed, a build command is needed for saving
these changes and updating the HEX file.
5.5 Debug and Simulate
5.5.1 Debug tools in AVR Studio
AVR Studio provides debug tools and the debugging can be done in a simulated
way, which means, when running the program, AVR Studio will simulate the behavior of
memory and register using the computer’s memory without physically connecting the
micro controller and accessing its physical memory.
Programming Using AVR Studio 4 41
GROUP 6 DISPLACEMENT MEASURING USING XYZ ACCELEROMETER SENSOR
The simulating is only valid to the standard memory positions and standard data
registers, which means AVR Studio cannot simulate the memory behavior of external
electronic components. Because AVR Studio will never know what is connected to the
developing board. All it recognizes is the micro controller (ATmega16)’s ports and pins,
which are regarded as the interface between external electronic components and the
micro controller.
Since debug tools in AVR Studio are very powerful, and time is limited searching
for all the usages, this part will only introduce some most easy and commonly used
functions. In fact, these very basic debug functions are already enough for us to test the
program.
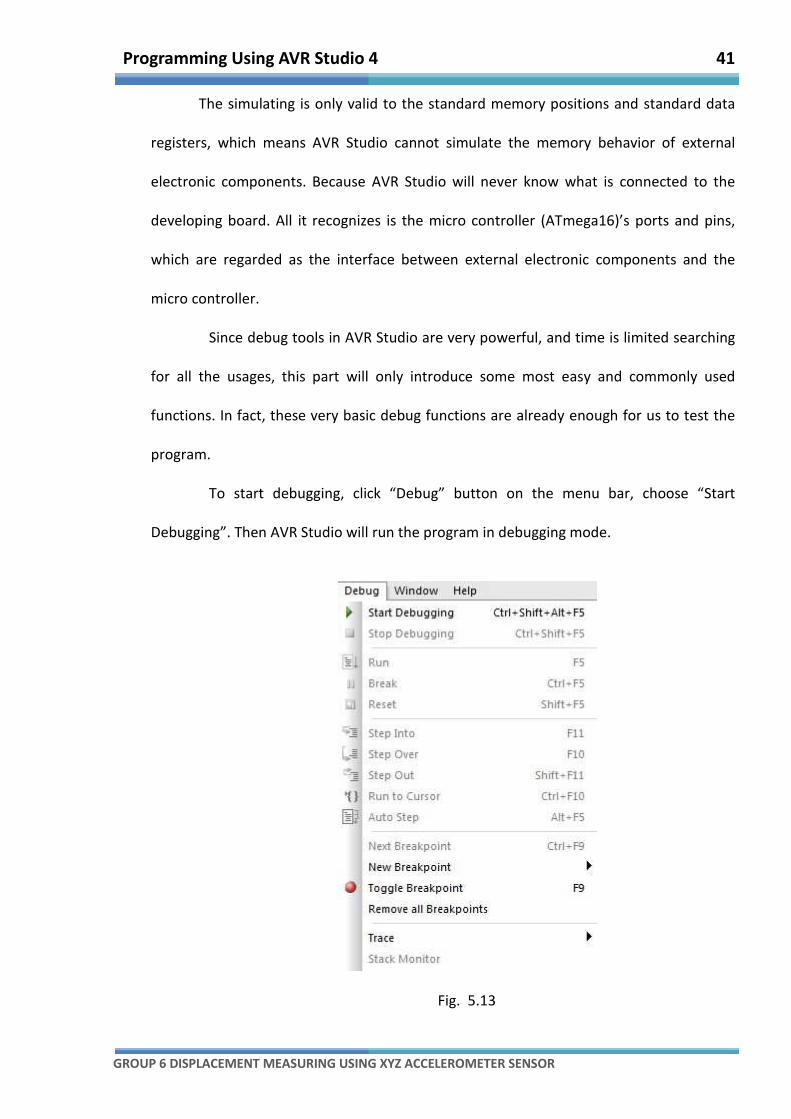
To start debugging, click “Debug” button on the menu bar, choose “Start
Debugging”. Then AVR Studio will run the program in debugging mode.
Fig. 5.13
Programming Using AVR Studio 4 42
GROUP 6 DISPLACEMENT MEASURING USING XYZ ACCELEROMETER SENSOR
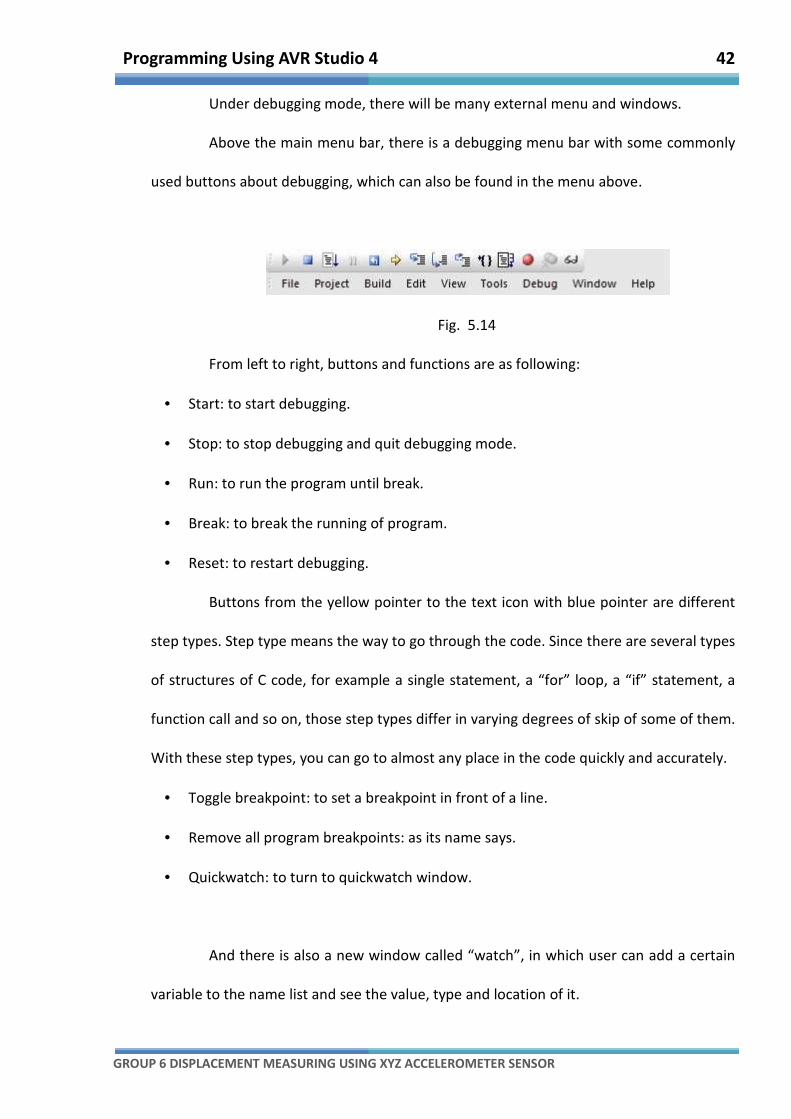
Under debugging mode, there will be many external menu and windows.
Above the main menu bar, there is a debugging menu bar with some commonly
used buttons about debugging, which can also be found in the menu above.
Fig. 5.14
From left to right, buttons and functions are as following:
• Start: to start debugging.
• Stop: to stop debugging and quit debugging mode.
• Run: to run the program until break.
• Break: to break the running of program.
• Reset: to restart debugging.
Buttons from the yellow pointer to the text icon with blue pointer are different
step types. Step type means the way to go through the code. Since there are several types
of structures of C code, for example a single statement, a “for” loop, a “if” statement, a
function call and so on, those step types differ in varying degrees of skip of some of them.
With these step types, you can go to almost any place in the code quickly and accurately.
• Toggle breakpoint: to set a breakpoint in front of a line.
• Remove all program breakpoints: as its name says.
• Quickwatch: to turn to quickwatch window.
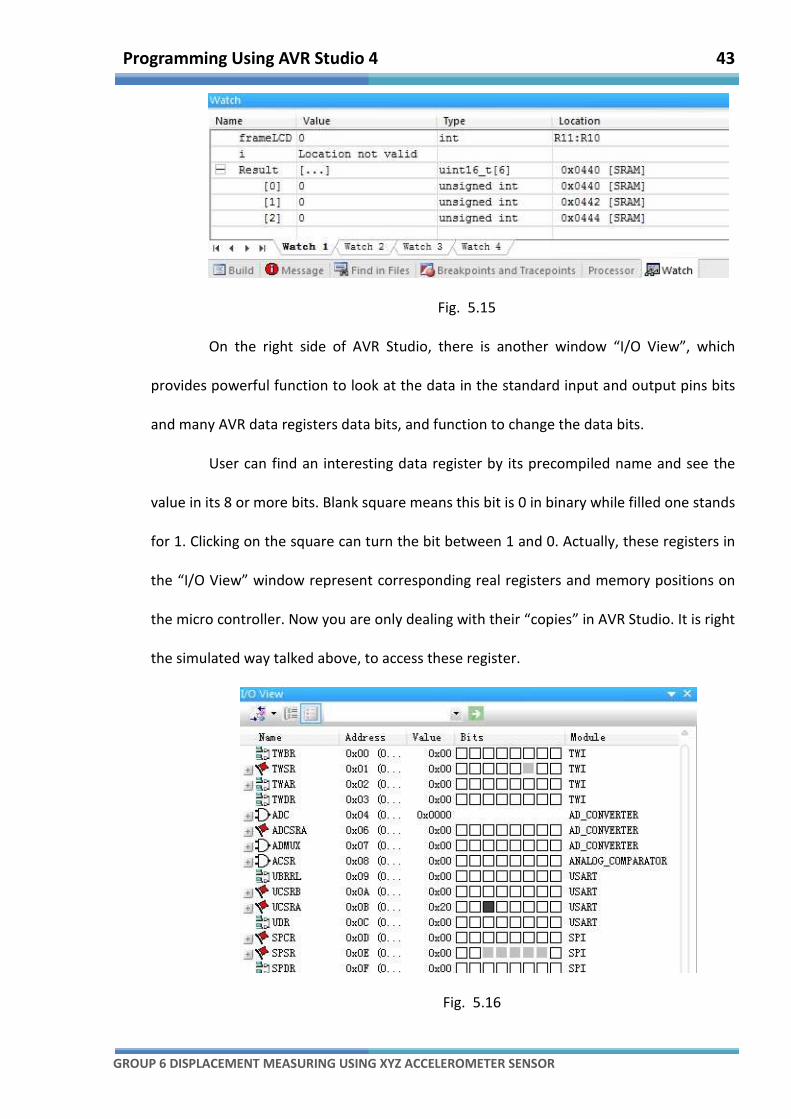
And there is also a new window called “watch”, in which user can add a certain
variable to the name list and see the value, type and location of it.
Programming Using AVR Studio 4 43
GROUP 6 DISPLACEMENT MEASURING USING XYZ ACCELEROMETER SENSOR
Fig. 5.15
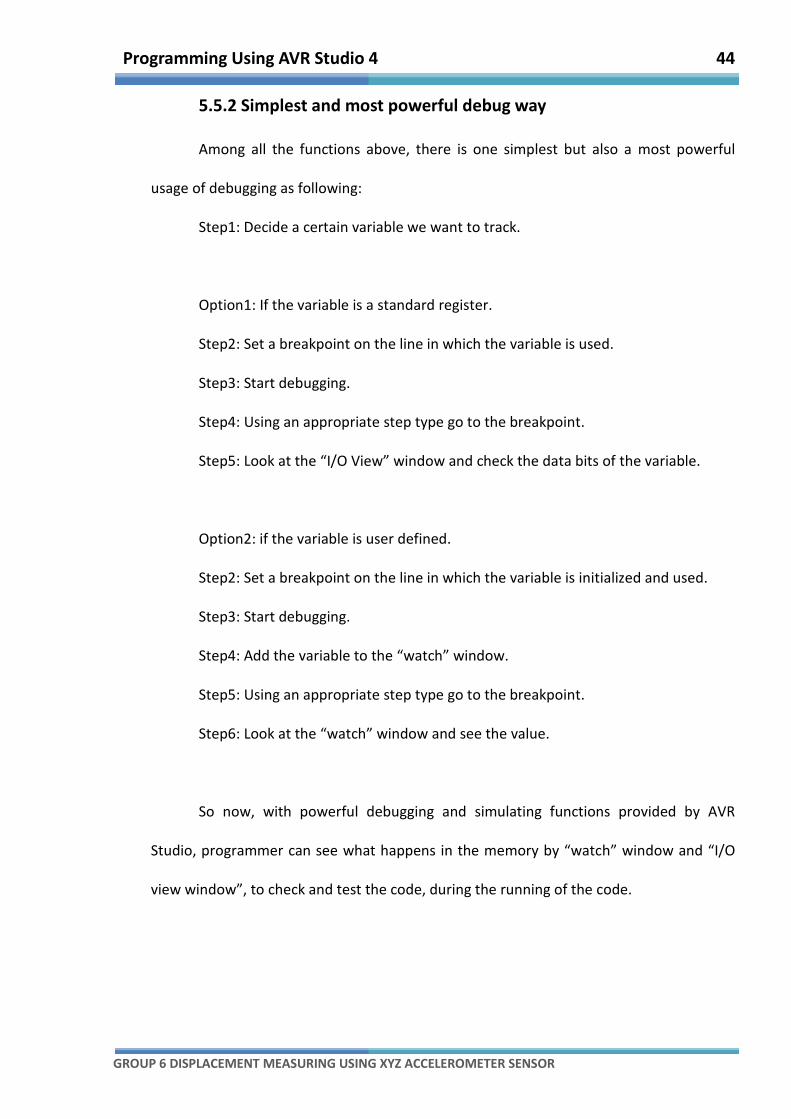
On the right side of AVR Studio, there is another window “I/O View”, which
provides powerful function to look at the data in the standard input and output pins bits
and many AVR data registers data bits, and function to change the data bits.
User can find an interesting data register by its precompiled name and see the
value in its 8 or more bits. Blank square means this bit is 0 in binary while filled one stands
for 1. Clicking on the square can turn the bit between 1 and 0. Actually, these registers in
the “I/O View” window represent corresponding real registers and memory positions on
the micro controller. Now you are only dealing with their “copies” in AVR Studio. It is right
the simulated way talked above, to access these register.
Fig. 5.16
Programming Using AVR Studio 4 44
GROUP 6 DISPLACEMENT MEASURING USING XYZ ACCELEROMETER SENSOR
5.5.2 Simplest and most powerful debug way
Among all the functions above, there is one simplest but also a most powerful
usage of debugging as following:
Step1: Decide a certain variable we want to track.
Option1: If the variable is a standard register.
Step2: Set a breakpoint on the line in which the variable is used.
Step3: Start debugging.
Step4: Using an appropriate step type go to the breakpoint.
Step5: Look at the “I/O View” window and check the data bits of the variable.
Option2: if the variable is user defined.
Step2: Set a breakpoint on the line in which the variable is initialized and used.
Step3: Start debugging.
Step4: Add the variable to the “watch” window.
Step5: Using an appropriate step type go to the breakpoint.
Step6: Look at the “watch” window and see the value.
So now, with powerful debugging and simulating functions provided by AVR
Studio, programmer can see what happens in the memory by “watch” window and “I/O
view window”, to check and test the code, during the running of the code.
Programming Using AVR Studio 4 45
GROUP 6 DISPLACEMENT MEASURING USING XYZ ACCELEROMETER SENSOR
5.6 Programming and Settings
5.6.1 Overview
To put the C codes into the microcontroller and make all the related device work
with these codes, a programming procedure is needed. Programming the device needs
first to connect the target device, and then choose appropriate options for a certain AVR
project.
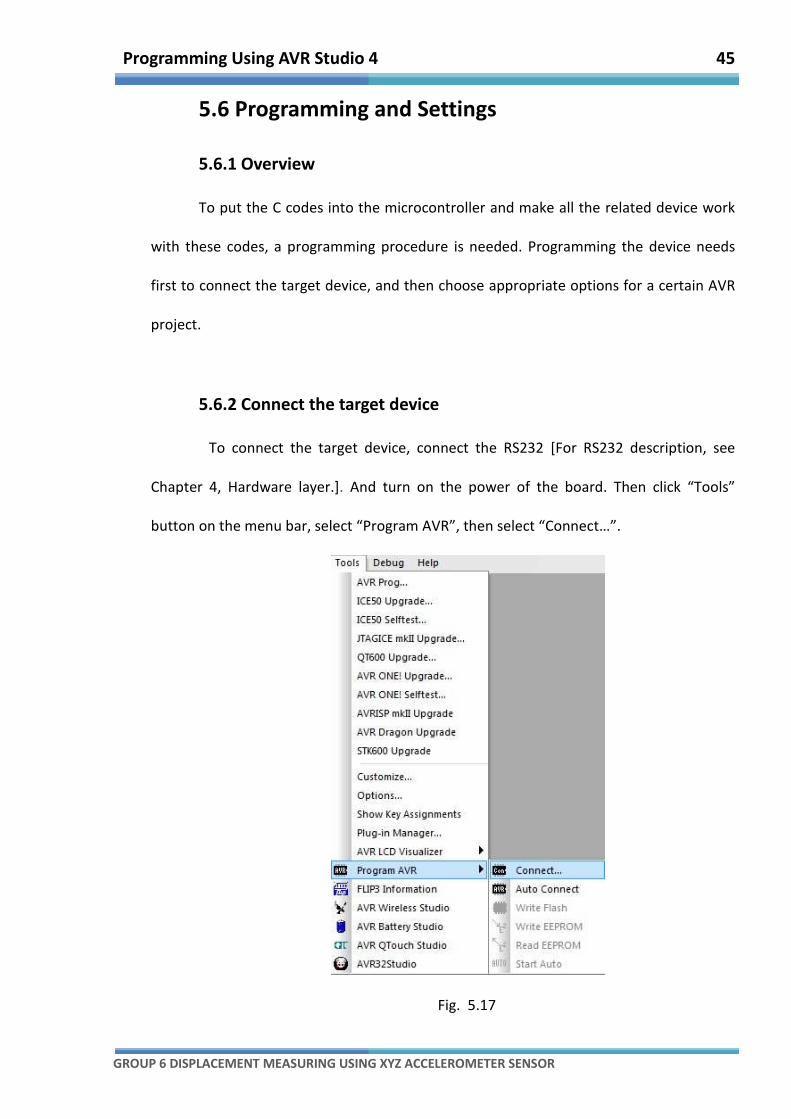
5.6.2 Connect the target device
To connect the target device, connect the RS232 [For RS232 description, see
Chapter 4, Hardware layer.]. And turn on the power of the board. Then click “Tools”
button on the menu bar, select “Program AVR”, then select “Connect…”.
Fig. 5.17

Programming Using AVR Studio 4 46
GROUP 6 DISPLACEMENT MEASURING USING XYZ ACCELEROMETER SENSOR
In the following window, choose STK500 as platform and the correct port on PC.
COM number for PC-board connection can be found in PC’s “Control Panel�Device
Manager�Ports and COMs”. “Auto” can be a better choice without checking the COM
number. At last click “Connect…” button.
Fig. 5.18
After few seconds, if the window goes back to this setting window again,
connection fails. Check the hardware connection and COM number again to retry. If
connection succeeds, a setting window for programming settings appears.
5.6.3 Programming setting
5.6.3.1 Main tab
Successful connection to the STK500 board will lead to the programming settings
window.
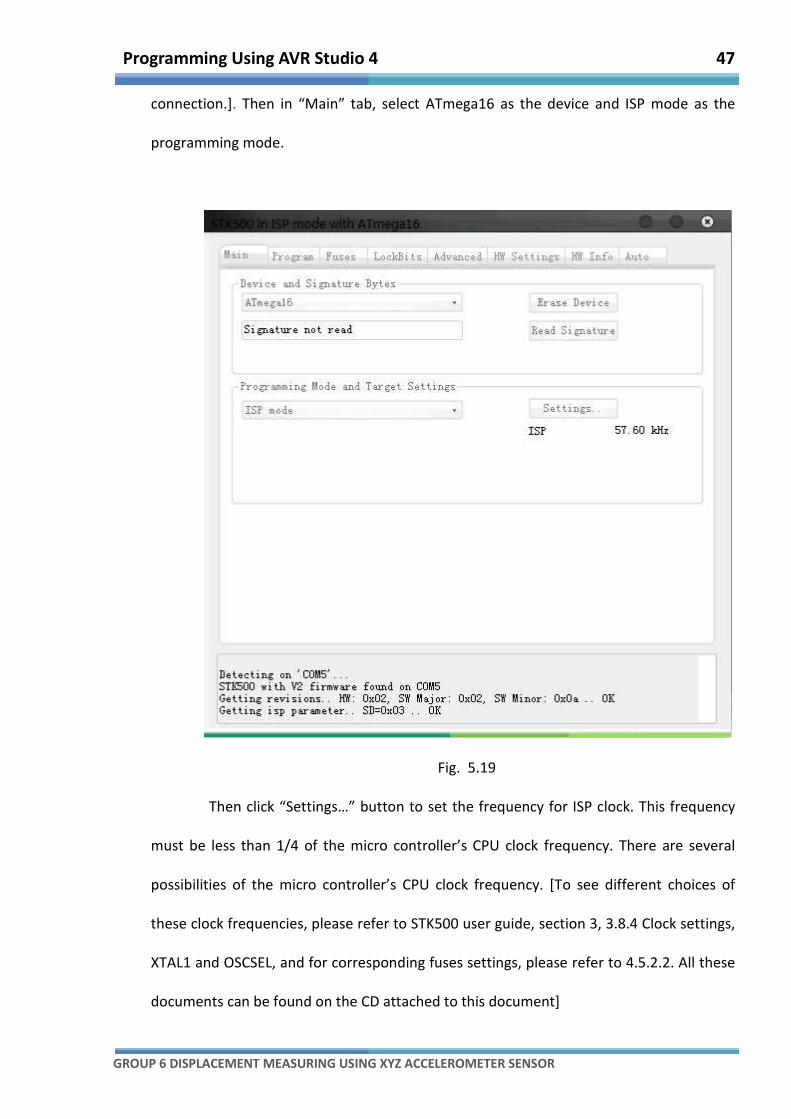
To program the micro controller on the board, first make sure the board is
connected in ISP mode [For ISP description, see Chapter 13.1.3, Part three – PC
Programming Using AVR Studio 4 47
GROUP 6 DISPLACEMENT MEASURING USING XYZ ACCELEROMETER SENSOR
connection.]. Then in “Main” tab, select ATmega16 as the device and ISP mode as the
programming mode.
Fig. 5.19
Then click “Settings…” button to set the frequency for ISP clock. This frequency
must be less than 1/4 of the micro controller’s CPU clock frequency. There are several
possibilities of the micro controller’s CPU clock frequency. [To see different choices of
these clock frequencies, please refer to STK500 user guide, section 3, 3.8.4 Clock settings,
XTAL1 and OSCSEL, and for corresponding fuses settings, please refer to 4.5.2.2. All these
documents can be found on the CD attached to this document]

Programming Using AVR Studio 4 48
GROUP 6 DISPLACEMENT MEASURING USING XYZ ACCELEROMETER SENSOR
Fig. 5.20
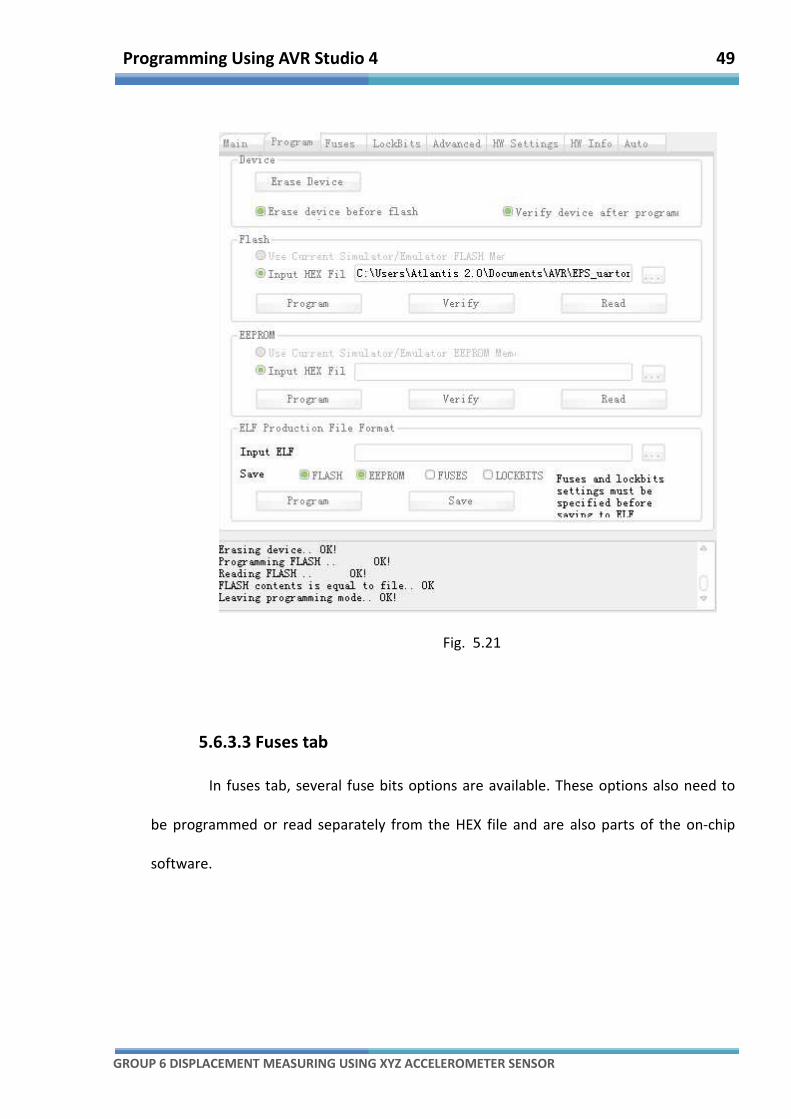
5.6.3.2 Program tab
In program tab, the most critical device writing and reading functions are
provided. “Erase Device” button can remove current program in the micro controller, and
initialize the micro controller. To program user’s AVR program into the micro controller,
first select the HEX file of the program under the AVR program folder. [To see how to get
the hex file from an AVR program, please refer to Chapter 5.4.3, Build and make a .hex
file] Then click “Program” button and wait for seconds until all procedures are OK, and
AVR Studio has left programming mode (see the information window at the bottom of
program tab).
To program is to replace the previous program by a new one. If necessary, “Read”
function can be used to read and save the previous program in HEX file, before
programming or erasing. Click “Read” button, and choose a file path and name for the
HEX file.
Programming Using AVR Studio 4 49
GROUP 6 DISPLACEMENT MEASURING USING XYZ ACCELEROMETER SENSOR
Fig. 5.21
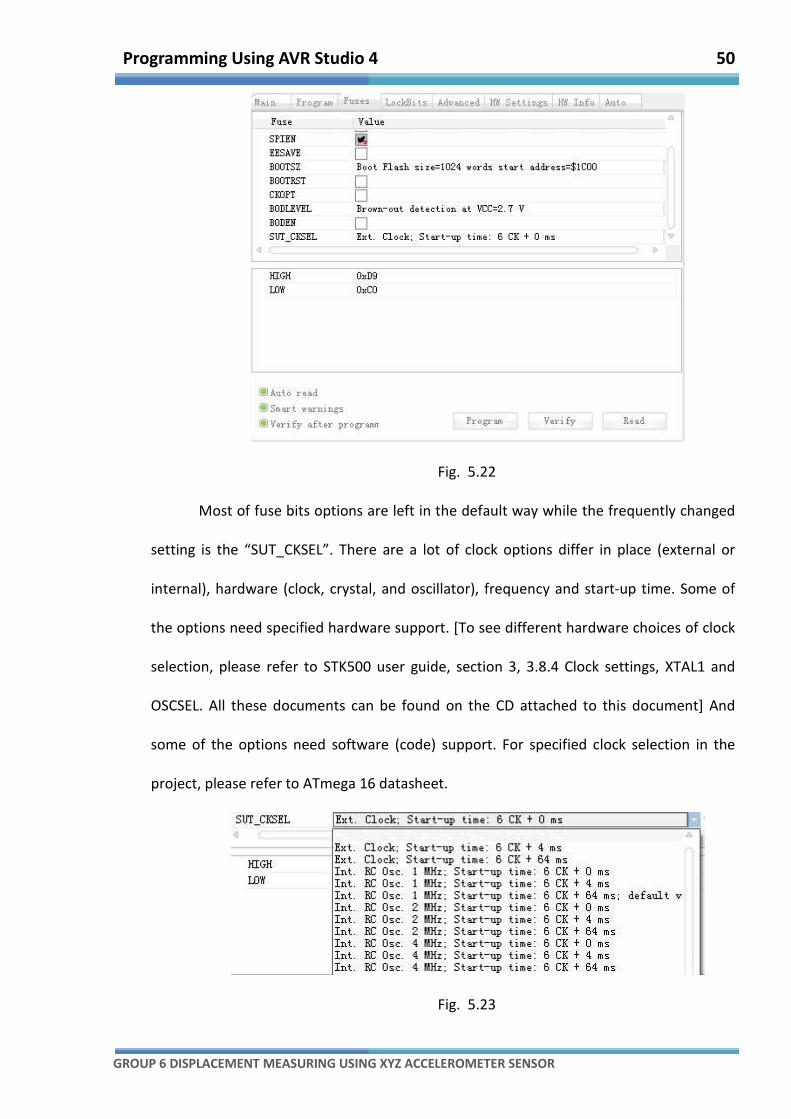
5.6.3.3 Fuses tab
In fuses tab, several fuse bits options are available. These options also need to
be programmed or read separately from the HEX file and are also parts of the on-chip
software.
Programming Using AVR Studio 4 50
GROUP 6 DISPLACEMENT MEASURING USING XYZ ACCELEROMETER SENSOR
Fig. 5.22
Most of fuse bits options are left in the default way while the frequently changed
setting is the “SUT_CKSEL”. There are a lot of clock options differ in place (external or
internal), hardware (clock, crystal, and oscillator), frequency and start-up time. Some of
the options need specified hardware support. [To see different hardware choices of clock
selection, please refer to STK500 user guide, section 3, 3.8.4 Clock settings, XTAL1 and
OSCSEL. All these documents can be found on the CD attached to this document] And
some of the options need software (code) support. For specified clock selection in the
project, please refer to ATmega 16 datasheet.
Fig. 5.23
51
GROUP 6 DISPLACEMENT MEASURING USING XYZ ACCELEROMETER SENSOR
Chapter 6
Design and
Implementation of
Embedded Software

Design and Implementation of Embedded Software 52
GROUP 6 DISPLACEMENT MEASURING USING XYZ ACCELEROMETER SENSOR
6.1 On-chip Software Overview
On-chip software as well as the hardware device, is a critical part of the
displacement measuring system. This software implements all the algorithms to drive the
microcontroller in order to run the whole system.
Development of this software is based on AVR Studio and has gone through
several steps.
There are many previous versions of the software which are developed as studies
and practices of some AVR programming tutorials and are design to implement different
functional modules of the final version.
Current version combines all the useful functions and features in previous
versions, provides a serial of solutions to the project’s problem, and it is provided as the
final edition of this EPS project. However, this version is still a prototype. Many drawbacks
exist.
Following topics in this chapter will introduce these versions of software in details.
[For programming in AVR Studio, please refer to Chapter 5, Programming Using AVR
Studio 4]
6.2 Functions of Current Version
Current version has implement two main functions for user of the displacement
measuring system: Detecting displacement and display the result of each axis and the
resultant displacement on LCD, Communication with external PC through serial port and
display more data on PC screen.
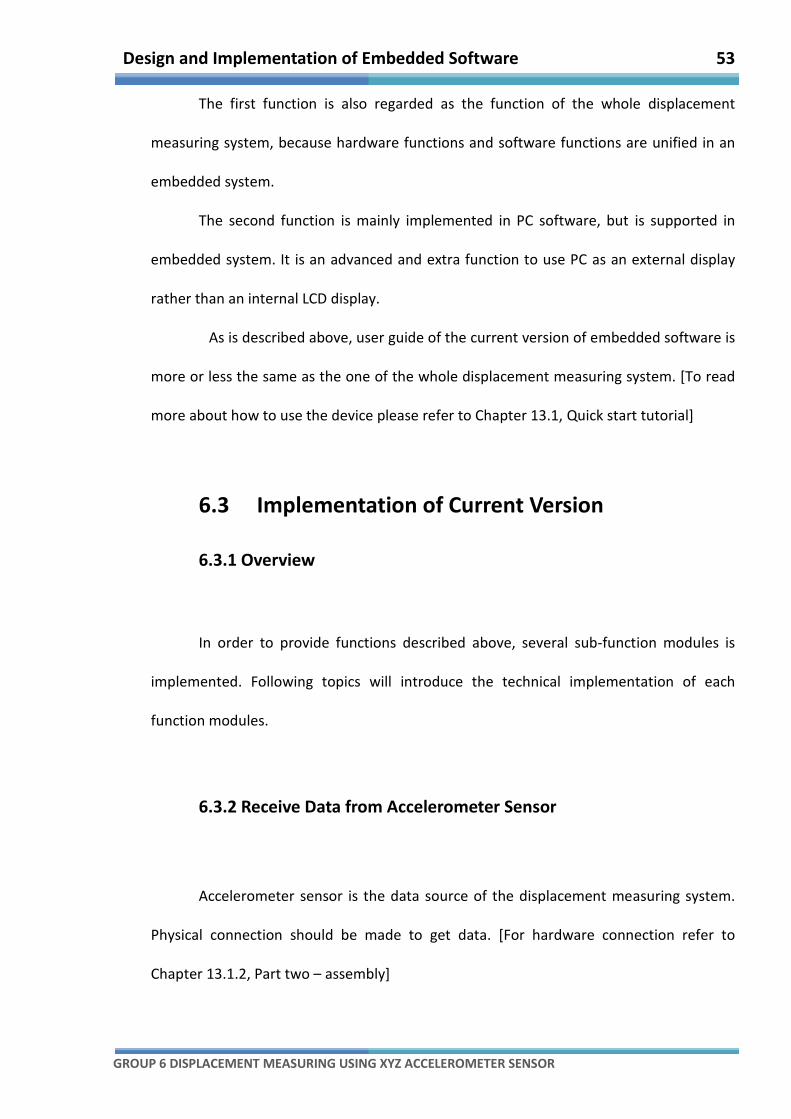
Design and Implementation of Embedded Software 53
GROUP 6 DISPLACEMENT MEASURING USING XYZ ACCELEROMETER SENSOR
The first function is also regarded as the function of the whole displacement
measuring system, because hardware functions and software functions are unified in an
embedded system.
The second function is mainly implemented in PC software, but is supported in
embedded system. It is an advanced and extra function to use PC as an external display
rather than an internal LCD display.
As is described above, user guide of the current version of embedded software is
more or less the same as the one of the whole displacement measuring system. [To read
more about how to use the device please refer to Chapter 13.1, Quick start tutorial]
6.3 Implementation of Current Version
6.3.1 Overview
In order to provide functions described above, several sub-function modules is
implemented. Following topics will introduce the technical implementation of each
function modules.
6.3.2 Receive Data from Accelerometer Sensor
Accelerometer sensor is the data source of the displacement measuring system.
Physical connection should be made to get data. [For hardware connection refer to
Chapter 13.1.2, Part two – assembly]
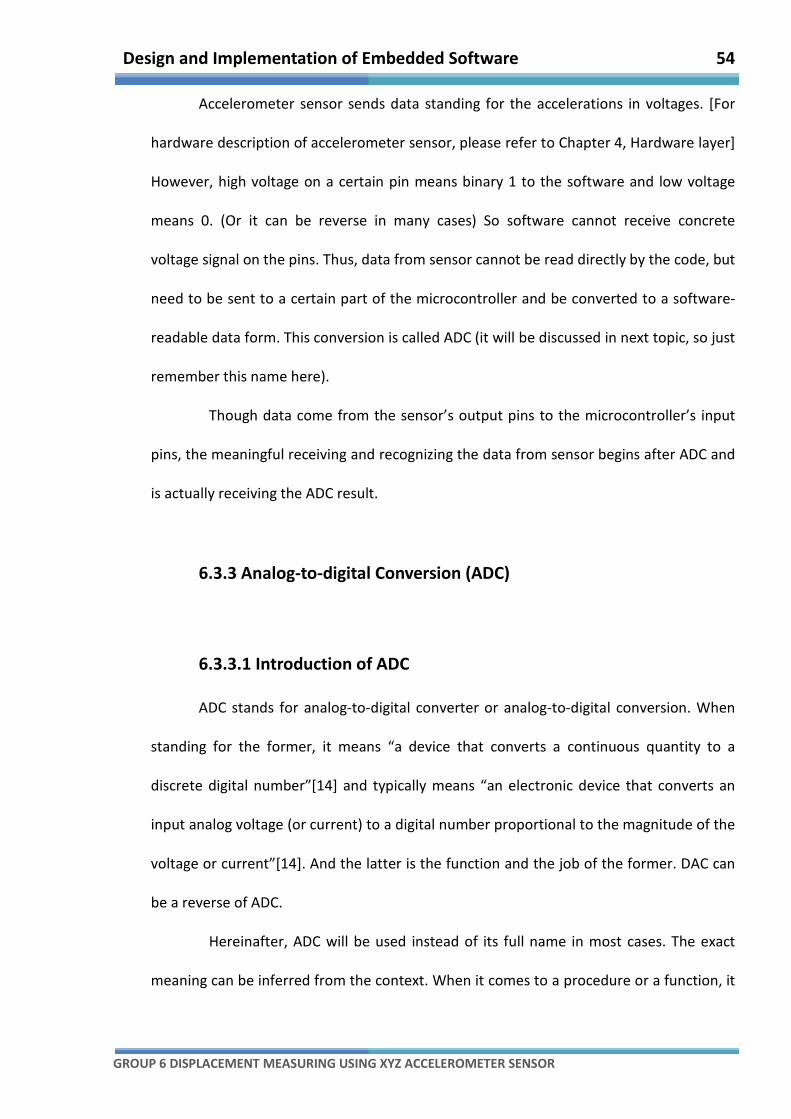
Design and Implementation of Embedded Software 54
GROUP 6 DISPLACEMENT MEASURING USING XYZ ACCELEROMETER SENSOR
Accelerometer sensor sends data standing for the accelerations in voltages. [For
hardware description of accelerometer sensor, please refer to Chapter 4, Hardware layer]
However, high voltage on a certain pin means binary 1 to the software and low voltage
means 0. (Or it can be reverse in many cases) So software cannot receive concrete
voltage signal on the pins. Thus, data from sensor cannot be read directly by the code, but
need to be sent to a certain part of the microcontroller and be converted to a software-
readable data form. This conversion is called ADC (it will be discussed in next topic, so just
remember this name here).
Though data come from the sensor’s output pins to the microcontroller’s input
pins, the meaningful receiving and recognizing the data from sensor begins after ADC and
is actually receiving the ADC result.
6.3.3 Analog-to-digital Conversion (ADC)
6.3.3.1 Introduction of ADC
ADC stands for analog-to-digital converter or analog-to-digital conversion. When
standing for the former, it means “a device that converts a continuous quantity to a
discrete digital number”[14] and typically means “an electronic device that converts an
input analog voltage (or current) to a digital number proportional to the magnitude of the
voltage or current”[14]. And the latter is the function and the job of the former. DAC can
be a reverse of ADC.
Hereinafter, ADC will be used instead of its full name in most cases. The exact
meaning can be inferred from the context. When it comes to a procedure or a function, it
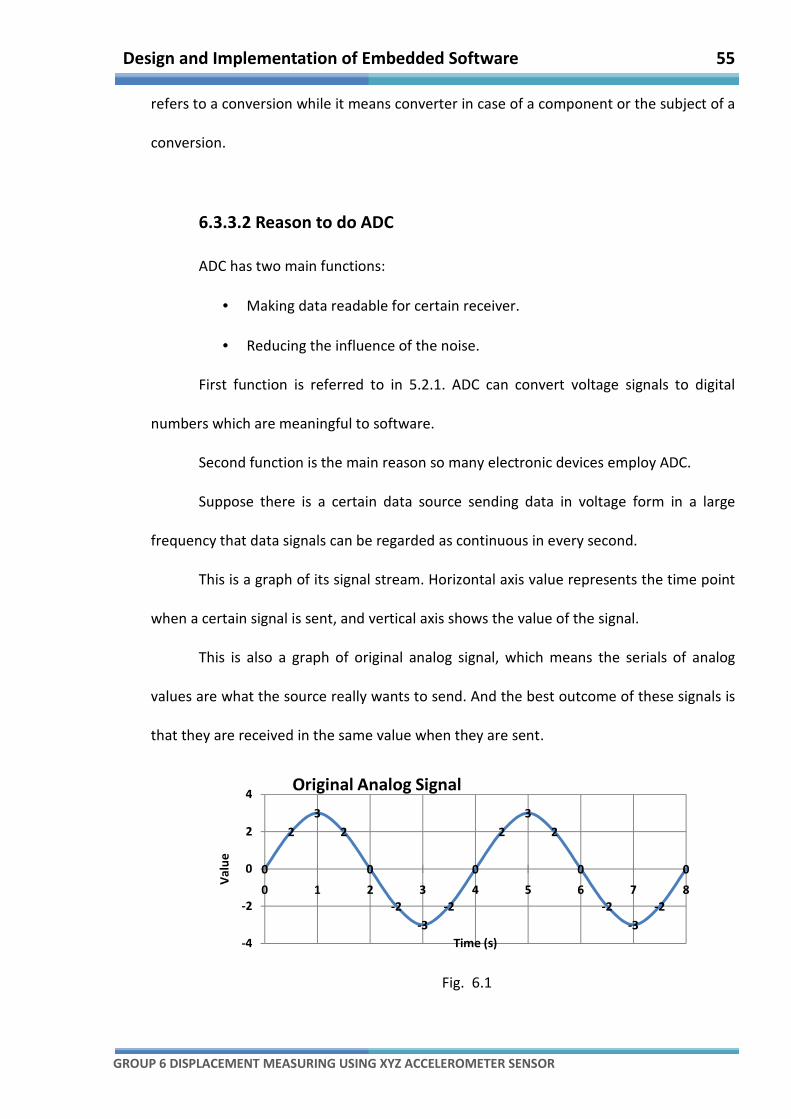
Design and Implementation of Embedded Software 55
GROUP 6 DISPLACEMENT MEASURING USING XYZ ACCELEROMETER SENSOR
refers to a conversion while it means converter in case of a component or the subject of a
conversion.
6.3.3.2 Reason to do ADC
ADC has two main functions:
• Making data readable for certain receiver.
• Reducing the influence of the noise.
First function is referred to in 5.2.1. ADC can convert voltage signals to digital
numbers which are meaningful to software.
Second function is the main reason so many electronic devices employ ADC.
Suppose there is a certain data source sending data in voltage form in a large
frequency that data signals can be regarded as continuous in every second.
This is a graph of its signal stream. Horizontal axis value represents the time point
when a certain signal is sent, and vertical axis shows the value of the signal.
This is also a graph of original analog signal, which means the serials of analog
values are what the source really wants to send. And the best outcome of these signals is
that they are received in the same value when they are sent.
Fig. 6.1
0
2
3
2
0
-2
-3
-2
0
2
3
2
0
-2
-3
-2
0
-4
-2
0
2
4
0 1 2 3 4 5 6 7 8
Value
Time (s)
Original Analog Signal
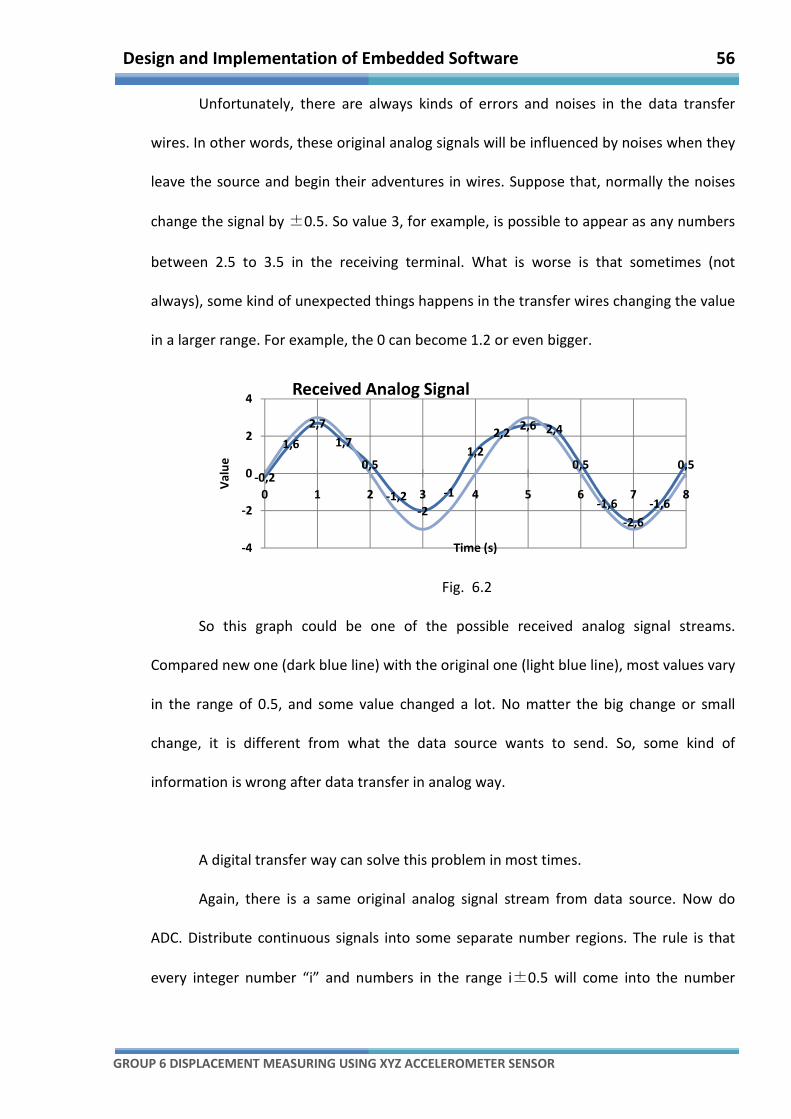
Design and Implementation of Embedded Software 56
GROUP 6 DISPLACEMENT MEASURING USING XYZ ACCELEROMETER SENSOR
Unfortunately, there are always kinds of errors and noises in the data transfer
wires. In other words, these original analog signals will be influenced by noises when they
leave the source and begin their adventures in wires. Suppose that, normally the noises
change the signal by ±0.5. So value 3, for example, is possible to appear as any numbers
between 2.5 to 3.5 in the receiving terminal. What is worse is that sometimes (not
always), some kind of unexpected things happens in the transfer wires changing the value
in a larger range. For example, the 0 can become 1.2 or even bigger.
Fig. 6.2
So this graph could be one of the possible received analog signal streams.
Compared new one (dark blue line) with the original one (light blue line), most values vary
in the range of 0.5, and some value changed a lot. No matter the big change or small
change, it is different from what the data source wants to send. So, some kind of
information is wrong after data transfer in analog way.
A digital transfer way can solve this problem in most times.
Again, there is a same original analog signal stream from data source. Now do
ADC. Distribute continuous signals into some separate number regions. The rule is that
every integer number “i” and numbers in the range i±0.5 will come into the number
-0,2
1,6
2,7
1,7
0,5
-1,2
-2
-1
1,2
2,22,6 2,4
0,5
-1,6
-2,6
-1,6
0,5
-4
-2
0
2
4
0 1 2 3 4 5 6 7 8
Value
Time (s)
Received Analog Signal
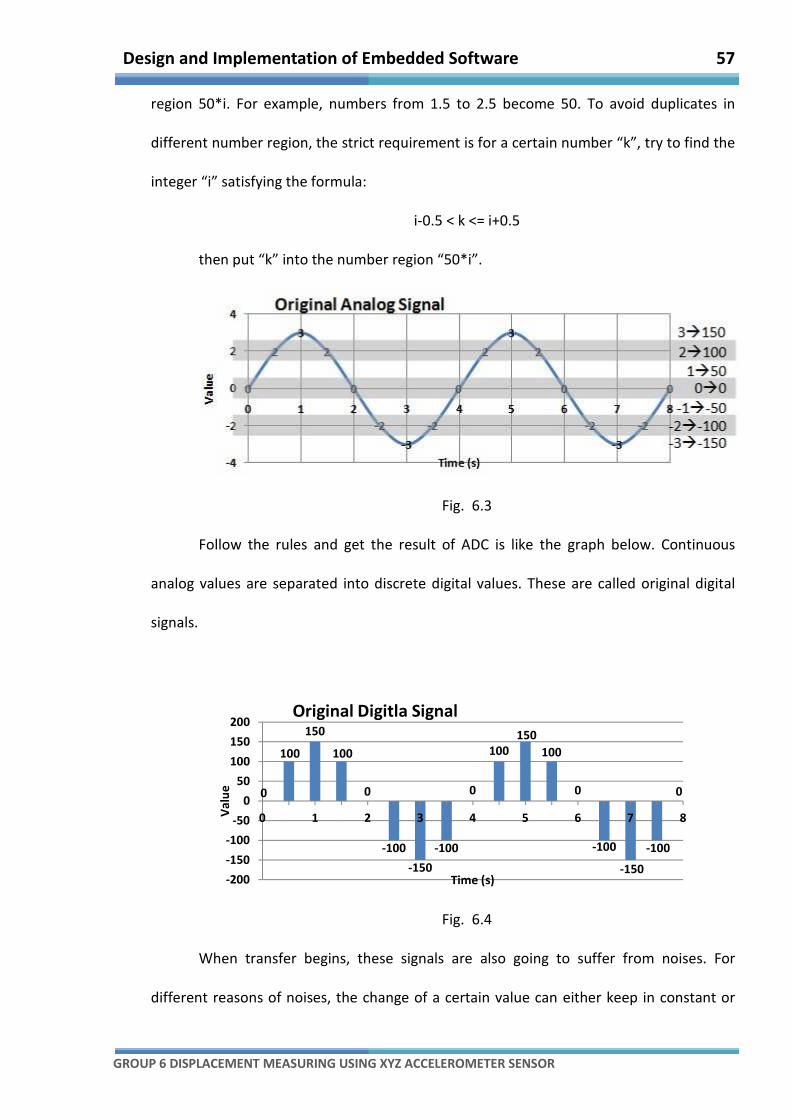
Design and Implementation of Embedded Software 57
GROUP 6 DISPLACEMENT MEASURING USING XYZ ACCELEROMETER SENSOR
region 50*i. For example, numbers from 1.5 to 2.5 become 50. To avoid duplicates in
different number region, the strict requirement is for a certain number “k”, try to find the
integer “i” satisfying the formula:
i-0.5 < k <= i+0.5
then put “k” into the number region “50*i”.
Fig. 6.3
Follow the rules and get the result of ADC is like the graph below. Continuous
analog values are separated into discrete digital values. These are called original digital
signals.
Fig. 6.4
When transfer begins, these signals are also going to suffer from noises. For
different reasons of noises, the change of a certain value can either keep in constant or
0
100
150
100
0
-100
-150
-100
0
100
150
100
0
-100
-150
-100
0
-200
-150
-100
-50
0
50
100
150
200
0 1 2 3 4 5 6 7 8Value
Time (s)
Original Digitla Signal
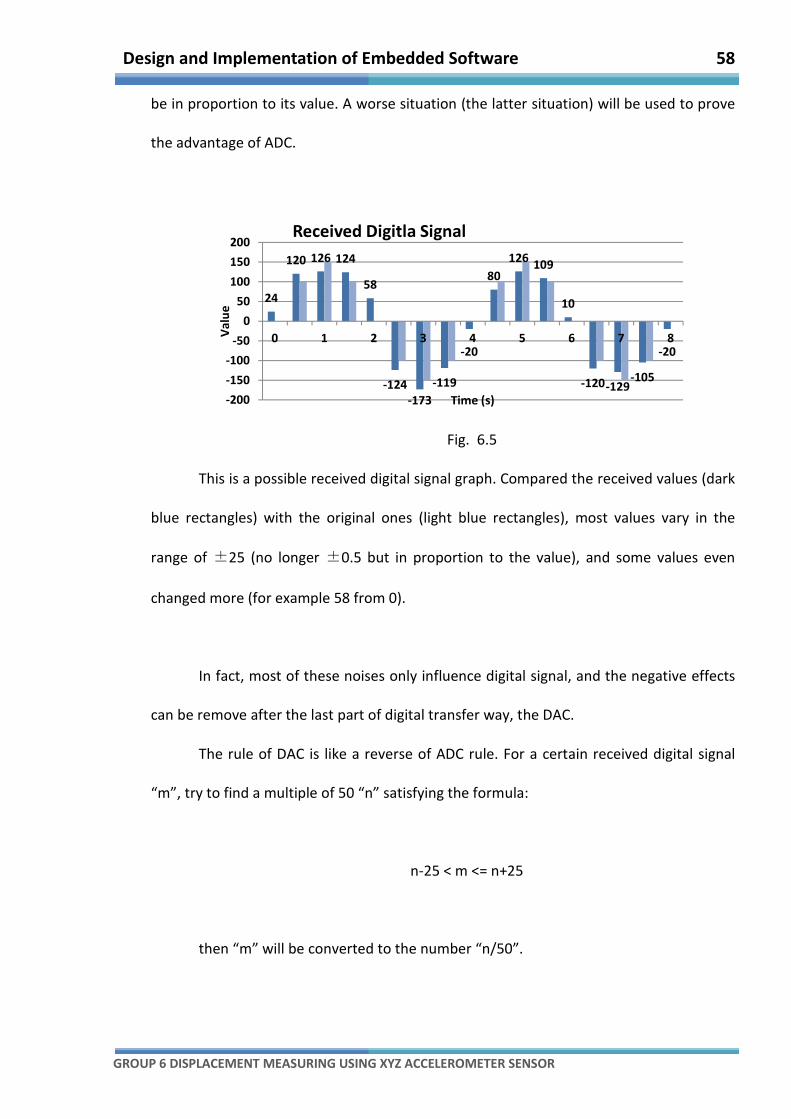
Design and Implementation of Embedded Software 58
GROUP 6 DISPLACEMENT MEASURING USING XYZ ACCELEROMETER SENSOR
be in proportion to its value. A worse situation (the latter situation) will be used to prove
the advantage of ADC.
Fig. 6.5
This is a possible received digital signal graph. Compared the received values (dark
blue rectangles) with the original ones (light blue rectangles), most values vary in the
range of ±25 (no longer ±0.5 but in proportion to the value), and some values even
changed more (for example 58 from 0).
In fact, most of these noises only influence digital signal, and the negative effects
can be remove after the last part of digital transfer way, the DAC.
The rule of DAC is like a reverse of ADC rule. For a certain received digital signal
“m”, try to find a multiple of 50 “n” satisfying the formula:
n-25 < m <= n+25
then “m” will be converted to the number “n/50”.
24
120 126 124
58
-124
-173
-119
-20
80
126109
10
-120-129-105
-20
-200
-150
-100
-50
0
50
100
150
200
0 1 2 3 4 5 6 7 8Value
Time (s)
Received Digitla Signal
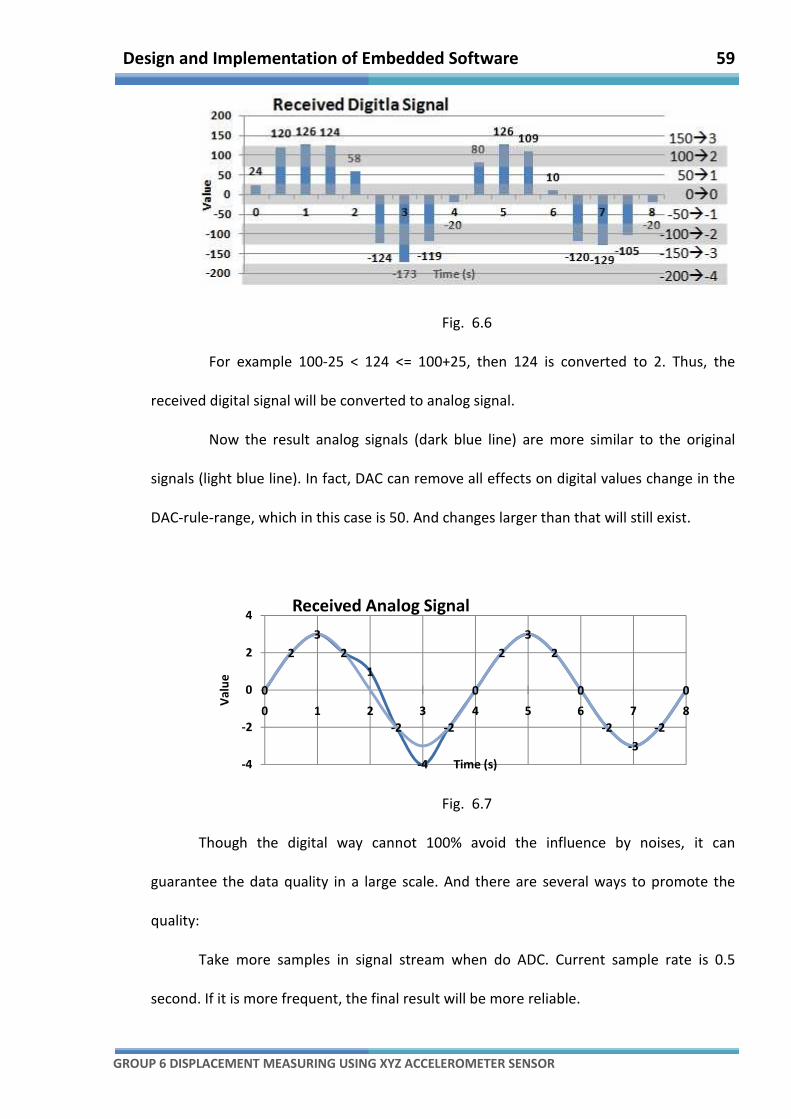
Design and Implementation of Embedded Software 59
GROUP 6 DISPLACEMENT MEASURING USING XYZ ACCELEROMETER SENSOR
Fig. 6.6
For example 100-25 < 124 <= 100+25, then 124 is converted to 2. Thus, the
received digital signal will be converted to analog signal.
Now the result analog signals (dark blue line) are more similar to the original
signals (light blue line). In fact, DAC can remove all effects on digital values change in the
DAC-rule-range, which in this case is 50. And changes larger than that will still exist.
Fig. 6.7
Though the digital way cannot 100% avoid the influence by noises, it can
guarantee the data quality in a large scale. And there are several ways to promote the
quality:
Take more samples in signal stream when do ADC. Current sample rate is 0.5
second. If it is more frequent, the final result will be more reliable.
0
2
3
2
1
-2
-4
-2
0
2
3
2
0
-2
-3
-2
0
-4
-2
0
2
4
0 1 2 3 4 5 6 7 8
Value
Time (s)
Received Analog Signal
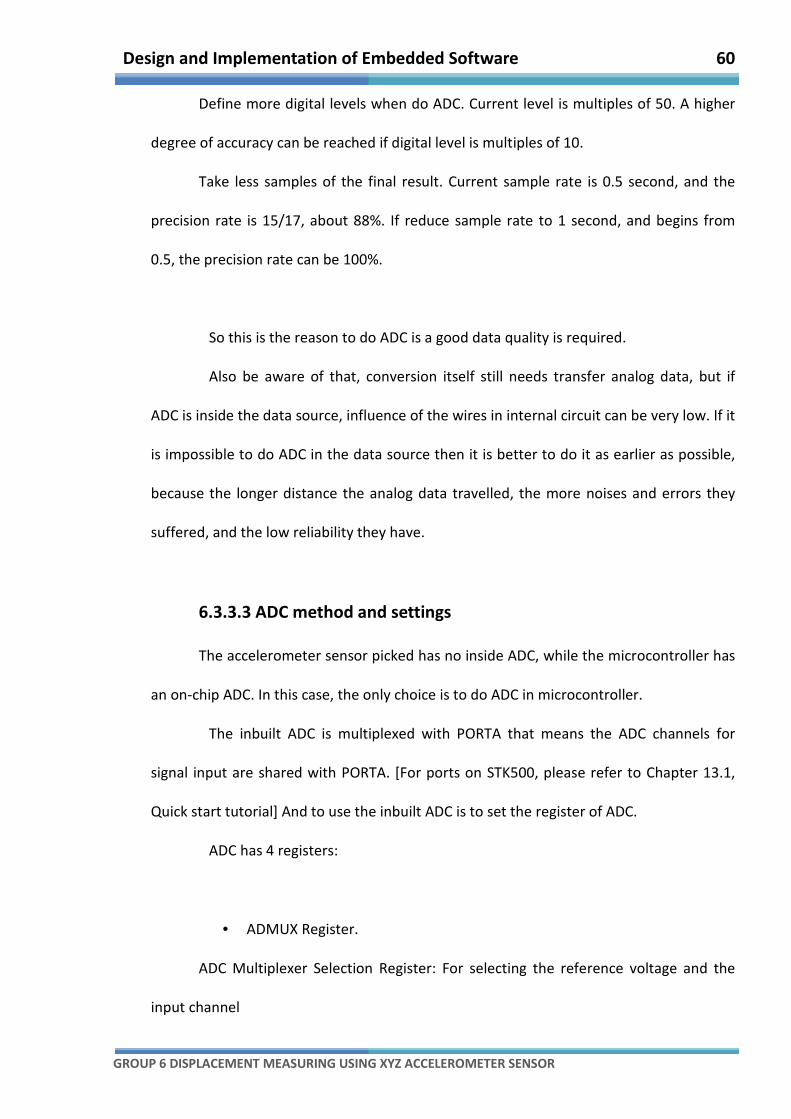
Design and Implementation of Embedded Software 60
GROUP 6 DISPLACEMENT MEASURING USING XYZ ACCELEROMETER SENSOR
Define more digital levels when do ADC. Current level is multiples of 50. A higher
degree of accuracy can be reached if digital level is multiples of 10.
Take less samples of the final result. Current sample rate is 0.5 second, and the
precision rate is 15/17, about 88%. If reduce sample rate to 1 second, and begins from
0.5, the precision rate can be 100%.
So this is the reason to do ADC is a good data quality is required.
Also be aware of that, conversion itself still needs transfer analog data, but if
ADC is inside the data source, influence of the wires in internal circuit can be very low. If it
is impossible to do ADC in the data source then it is better to do it as earlier as possible,
because the longer distance the analog data travelled, the more noises and errors they
suffered, and the low reliability they have.
6.3.3.3 ADC method and settings
The accelerometer sensor picked has no inside ADC, while the microcontroller has
an on-chip ADC. In this case, the only choice is to do ADC in microcontroller.
The inbuilt ADC is multiplexed with PORTA that means the ADC channels for
signal input are shared with PORTA. [For ports on STK500, please refer to Chapter 13.1,
Quick start tutorial] And to use the inbuilt ADC is to set the register of ADC.
ADC has 4 registers:
• ADMUX Register.
ADC Multiplexer Selection Register: For selecting the reference voltage and the
input channel
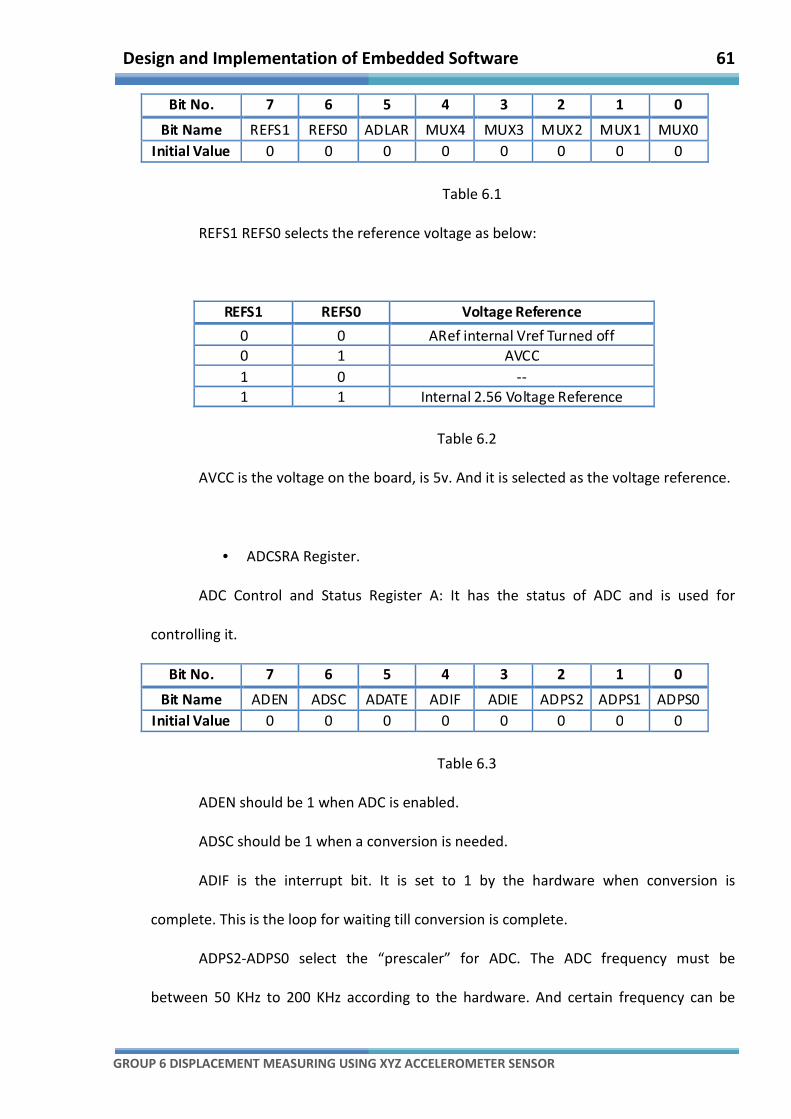
Design and Implementation of Embedded Software 61
GROUP 6 DISPLACEMENT MEASURING USING XYZ ACCELEROMETER SENSOR
Table 6.1
REFS1 REFS0 selects the reference voltage as below:
Table 6.2
AVCC is the voltage on the board, is 5v. And it is selected as the voltage reference.
• ADCSRA Register.
ADC Control and Status Register A: It has the status of ADC and is used for
controlling it.
Table 6.3
ADEN should be 1 when ADC is enabled.
ADSC should be 1 when a conversion is needed.
ADIF is the interrupt bit. It is set to 1 by the hardware when conversion is
complete. This is the loop for waiting till conversion is complete.
ADPS2-ADPS0 select the “prescaler” for ADC. The ADC frequency must be
between 50 KHz to 200 KHz according to the hardware. And certain frequency can be
Bit No. 7 6 5 4 3 2 1 0
Bit Name REFS1 REFS0 ADLAR MUX4 MUX3 MUX2 MUX1 MUX0
Initial Value 0 0 0 0 0 0 0 0
REFS1 REFS0 Voltage Reference
0 0 ARef internal Vref Turned off
0 1 AVCC
1 0 --
1 1 Internal 2.56 Voltage Reference
Bit No. 7 6 5 4 3 2 1 0
Bit Name ADEN ADSC ADATE ADIF ADIE ADPS2 ADPS1 ADPS0
Initial Value 0 0 0 0 0 0 0 0
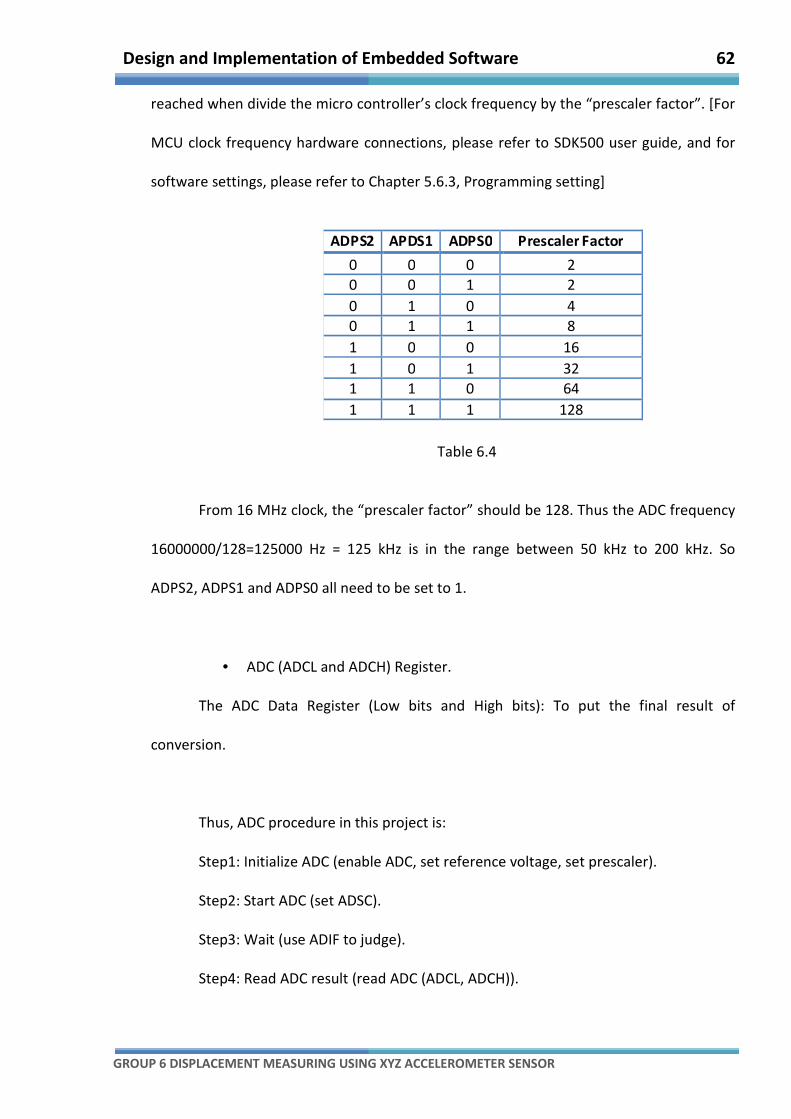
Design and Implementation of Embedded Software 62
GROUP 6 DISPLACEMENT MEASURING USING XYZ ACCELEROMETER SENSOR
reached when divide the micro controller’s clock frequency by the “prescaler factor”. [For
MCU clock frequency hardware connections, please refer to SDK500 user guide, and for
software settings, please refer to Chapter 5.6.3, Programming setting]
Table 6.4
From 16 MHz clock, the “prescaler factor” should be 128. Thus the ADC frequency
16000000/128=125000 Hz = 125 kHz is in the range between 50 kHz to 200 kHz. So
ADPS2, ADPS1 and ADPS0 all need to be set to 1.
• ADC (ADCL and ADCH) Register.
The ADC Data Register (Low bits and High bits): To put the final result of
conversion.
Thus, ADC procedure in this project is:
Step1: Initialize ADC (enable ADC, set reference voltage, set prescaler).
Step2: Start ADC (set ADSC).
Step3: Wait (use ADIF to judge).
Step4: Read ADC result (read ADC (ADCL, ADCH)).
ADPS2 APDS1 ADPS0 Prescaler Factor
0 0 0 2
0 0 1 2
0 1 0 4
0 1 1 8
1 0 0 16
1 0 1 32
1 1 0 64
1 1 1 128
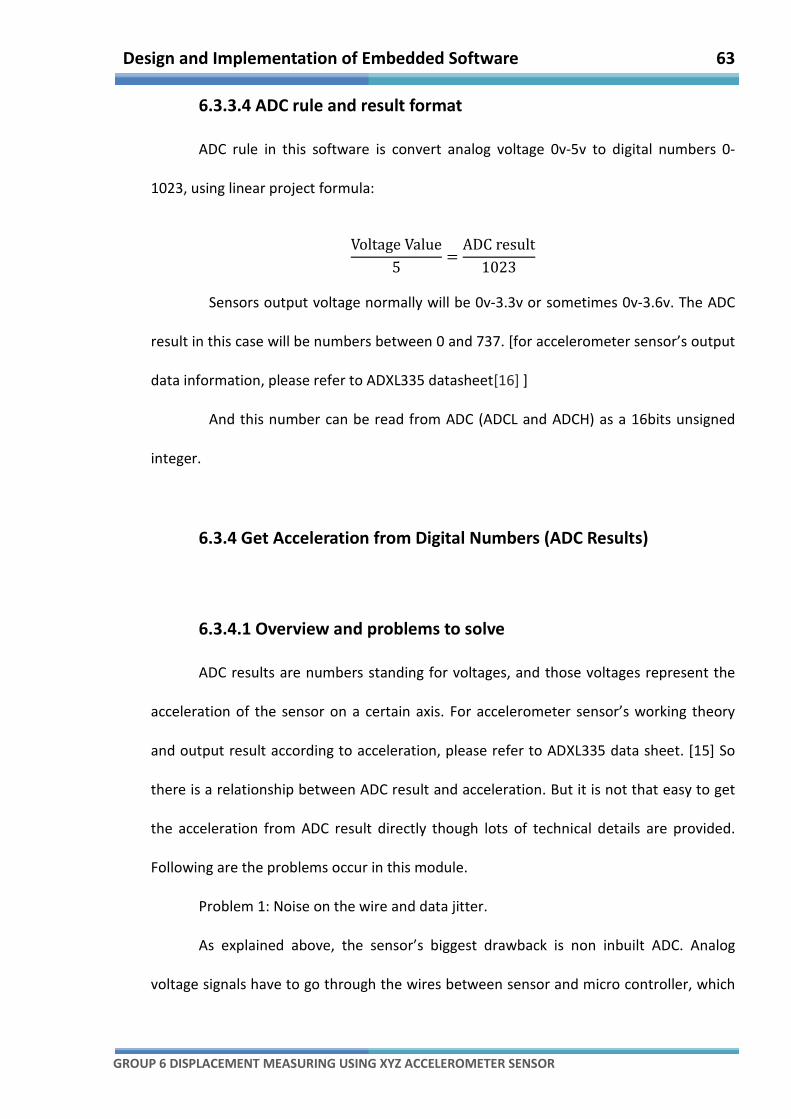
Design and Implementation of Embedded Software 63
GROUP 6 DISPLACEMENT MEASURING USING XYZ ACCELEROMETER SENSOR
6.3.3.4 ADC rule and result format
ADC rule in this software is convert analog voltage 0v-5v to digital numbers 0-
1023, using linear project formula:
Voltage Value
5=
ADC result
1023
Sensors output voltage normally will be 0v-3.3v or sometimes 0v-3.6v. The ADC
result in this case will be numbers between 0 and 737. [for accelerometer sensor’s output
data information, please refer to ADXL335 datasheet[16] ]
And this number can be read from ADC (ADCL and ADCH) as a 16bits unsigned
integer.
6.3.4 Get Acceleration from Digital Numbers (ADC Results)
6.3.4.1 Overview and problems to solve
ADC results are numbers standing for voltages, and those voltages represent the
acceleration of the sensor on a certain axis. For accelerometer sensor’s working theory
and output result according to acceleration, please refer to ADXL335 data sheet. [15] So
there is a relationship between ADC result and acceleration. But it is not that easy to get
the acceleration from ADC result directly though lots of technical details are provided.
Following are the problems occur in this module.
Problem 1: Noise on the wire and data jitter.
As explained above, the sensor’s biggest drawback is non inbuilt ADC. Analog
voltage signals have to go through the wires between sensor and micro controller, which
Design and Implementation of Embedded Software 64
GROUP 6 DISPLACEMENT MEASURING USING XYZ ACCELEROMETER SENSOR
are usually very long in order to allow a large sphere of activities. Although ADC is done as
soon as it is possible to be done, it is too late to avoid noises on wire. No other
experiment can be conducted to analysis the intensity of noise, except keep track of the
ADC results in a long period and find the general rules of data jitter.
Problem 2: High speed of data coming and lack of computing power
ADC begins with one bit of the register set to 1, and is done in a high frequency. So
the ADC is almost continuous in loops. Thus, the coming of ADC result can be very fast
that the data coming period is much less than the time period to calculate the
acceleration and displacement.
Problem 3: Acceleration with gravity factor
According to the datasheet, acceleration detected by the sensor is always due to
the gravity. If resultant force is 0 on the sensor, output voltages on 3 axes lead to
acceleration equal to gravity. Displacement can only be calculated from the pure (the
resultant) acceleration.
As they are the most critical algorithms in the software also the key points in the
displacement measuring system, solutions to problems above will be introduced in
following sub-parts.
6.3.4.2 ADC result collection and calibration
Since exact intensity and rules of noise are unknown, algorithms reducing the
influence of noises are all based on the assumption that the amount and the probabilities
noises increase and decrease the transfer values are equal.
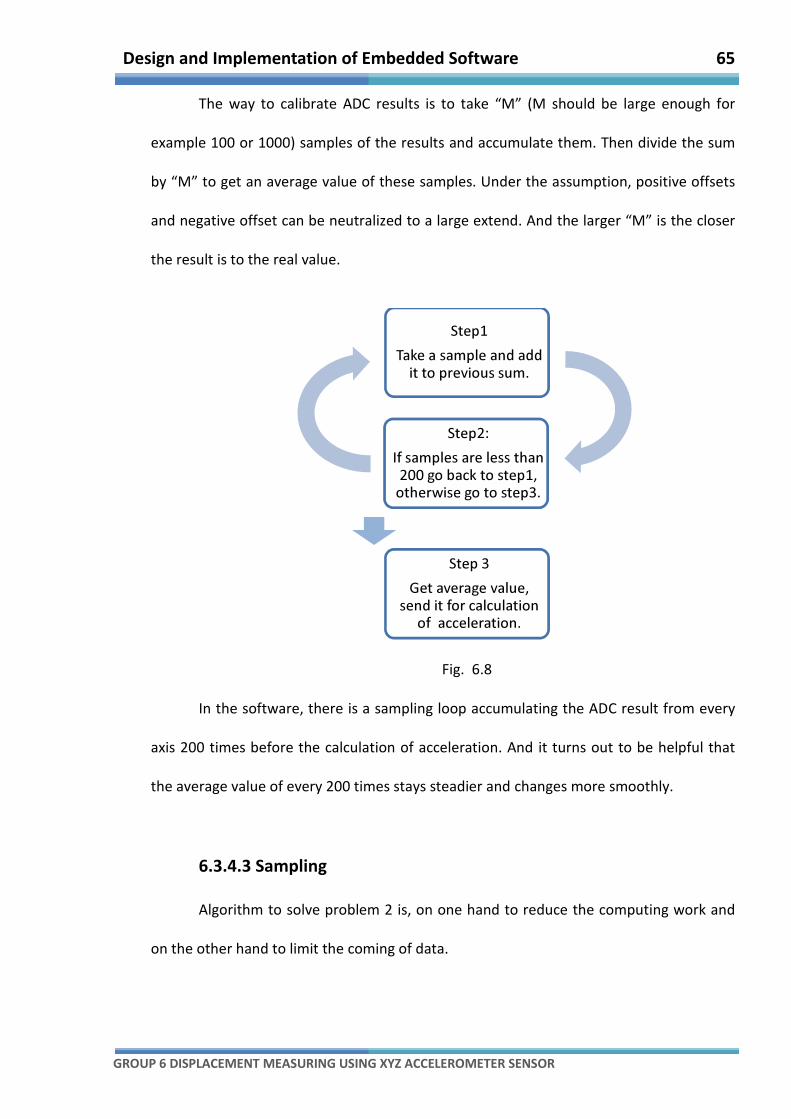
Design and Implementation of Embedded Software 65
GROUP 6 DISPLACEMENT MEASURING USING XYZ ACCELEROMETER SENSOR
The way to calibrate ADC results is to take “M” (M should be large enough for
example 100 or 1000) samples of the results and accumulate them. Then divide the sum
by “M” to get an average value of these samples. Under the assumption, positive offsets
and negative offset can be neutralized to a large extend. And the larger “M” is the closer
the result is to the real value.
Fig. 6.8
In the software, there is a sampling loop accumulating the ADC result from every
axis 200 times before the calculation of acceleration. And it turns out to be helpful that
the average value of every 200 times stays steadier and changes more smoothly.
6.3.4.3 Sampling
Algorithm to solve problem 2 is, on one hand to reduce the computing work and
on the other hand to limit the coming of data.
Step1
Take a sample and add
it to previous sum.
Step2:
If samples are less than
200 go back to step1,
otherwise go to step3.
Step 3
Get average value,
send it for calculation
of acceleration.
Design and Implementation of Embedded Software 66
GROUP 6 DISPLACEMENT MEASURING USING XYZ ACCELEROMETER SENSOR
Sampling completes in both respects. The idea is divide program loops into two
kinds, data-coming loop and calculation loop. And then, keeping track of ADC result
selectively, and doing only data keeping in pure data-coming loop while go into
calculation loop once several data-coming loops have been passed and do extra
calculating work.
A TIMER0 register in AVR Studio is used to count the time (not any frequencies but
appreciable seconds). [For using TIMER0, please refer to Chapter 6.3.9, Using the TIMER0
to Get Time]
The TIMER0 will inform the loop every 1 second (according to current version of
software). Thousands of loops inside every 1 second are pure data-coming loops while
the loop on the boundary of every second (when the TIMER0 informs the loop) is a
calculation loop in which data receiving will still continue but extra calculation work will
be done.
Since ADC result collection and calibration are needed as introduced above,
keeping track of ADC result is right the accumulation. Limitation and selectivity are
reflected by those “200 times”. Only previous 200 times of data coming in every 1 second
will be processed while the left loops of the second are almost empty loops. And the
software will wait patiently in these empty loops for the coming of an approaching
calculation loop which is also a start of a new second.
6.3.4.4 Get acceleration from ADC result
Although there is a relationship between ADC result and acceleration, it is
undefined to software. That is to say how much differences between two ADC results can
represent the changes of 1g in acceleration.
Design and Implementation of Embedded Software 67
GROUP 6 DISPLACEMENT MEASURING USING XYZ ACCELEROMETER SENSOR
Datasheet of ADXL335 gives the 0g voltage of each axis (everything should be
under standard conditions), then the corresponding ADC result is known, for example “K”.
[ For more technical data on ADXL335, please refer to ADXL335 data sheet [16] ] And an
experiment is wanted to get an ADC result from a different acceleration. Keep the board
face up accurately and the Z is under 1g acceleration according to the datasheet. Also
keep the ADC result of it, for example “J”.
Assume that the voltage changes linearly when the acceleration changes. (The
data sheet does not definitely confirm this, but many similar accelerometer sensor works
in this way, so this assumption is reasonable) Then the number representing 1g is “J-K”.
And ADC results can always divide by “J-K” to get how many gs they are corresponded to.
6.3.4.5 Remove gravity factor from acceleration
As described in 6.3.4.2 and 6.3.4.4, acceleration for each axis can be known from
ADC result. But this acceleration is merged with gravity component, which is always
differs from the pure and real acceleration by g·cosθ. Here “g” is gravity acceleration and
“θ” is the angle between a certain axis and gravity direction. It is impossible to know this
angle directly from the 3 axis’s acceleration with gravity component. So it is impossible to
directly remove the gravity component for each axis.
However, gravity is a constant force influencing the sensor all the time. Using
increment algorithm can be a good solution to remove the gravity component indirectly.
Increment algorithm is to compare the differences or changes between two
statuses. Because gravity is the same in former status and latter status, the changing of
the force (with gravity component) on an object is right the changing of the resultant
Design and Implementation of Embedded Software 68
GROUP 6 DISPLACEMENT MEASURING USING XYZ ACCELEROMETER SENSOR
force (without gravity component, the pure force). Therefore, if in the former status the
object is static (resultant force is 0), the changes of the resultant force is right the
resultant force it suffered in the very little period of time between these two statuses.
From the very beginning (static status) to any time point, time can be divided
equally into infinitely small time periods. Resultant force can be known from the first
infinitely small time period, then the second, and at last to all. While resultant force
means resultant acceleration, the pure acceleration of the object in every infinitely small
time period is therefore known, which means the gravity component has been removed
using this algorithm.
6.3.4.6 Algorithms gathering and optimize
Algorithms above solved problems in 6.3.4.1. To make a final and integrated
algorithm, put all the algorithms together and optimize them. Following flow chart
generally shows the integrated algorithm for “get acceleration from digital numbers (ADC
Results)”.
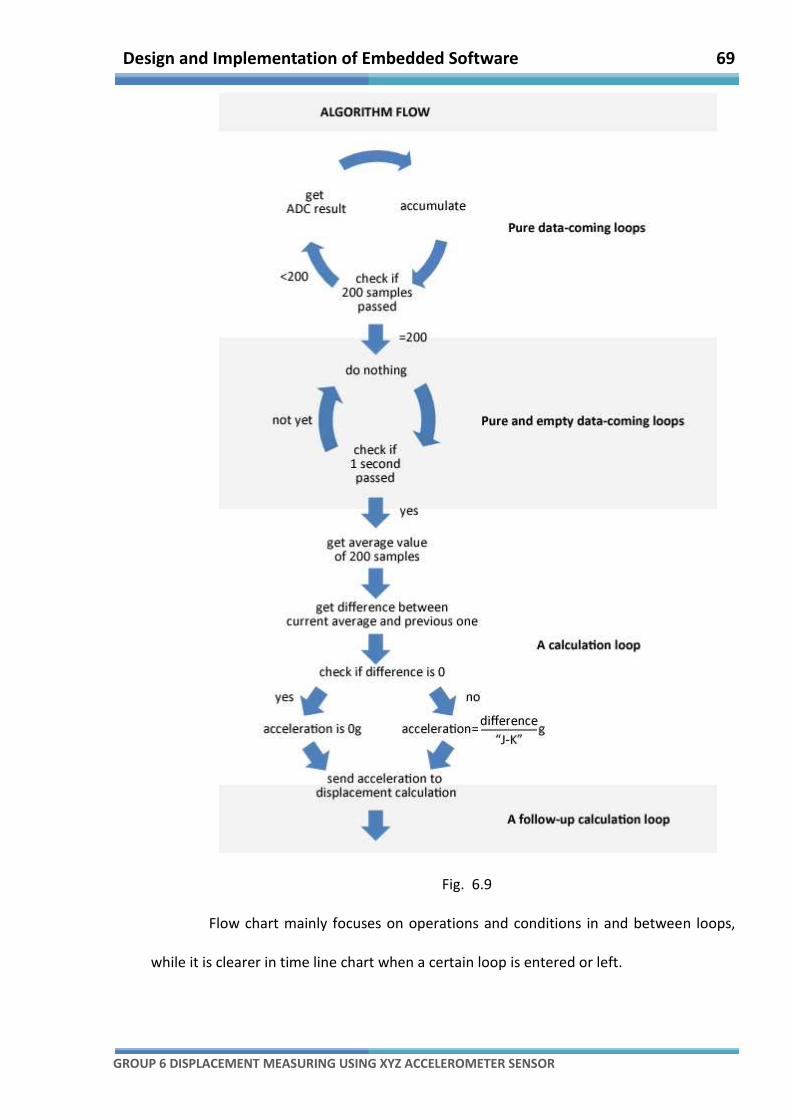
Design and Implementation of Embedded Software 69
GROUP 6 DISPLACEMENT MEASURING USING XYZ ACCELEROMETER SENSOR
Fig. 6.9
Flow chart mainly focuses on operations and conditions in and between loops,
while it is clearer in time line chart when a certain loop is entered or left.
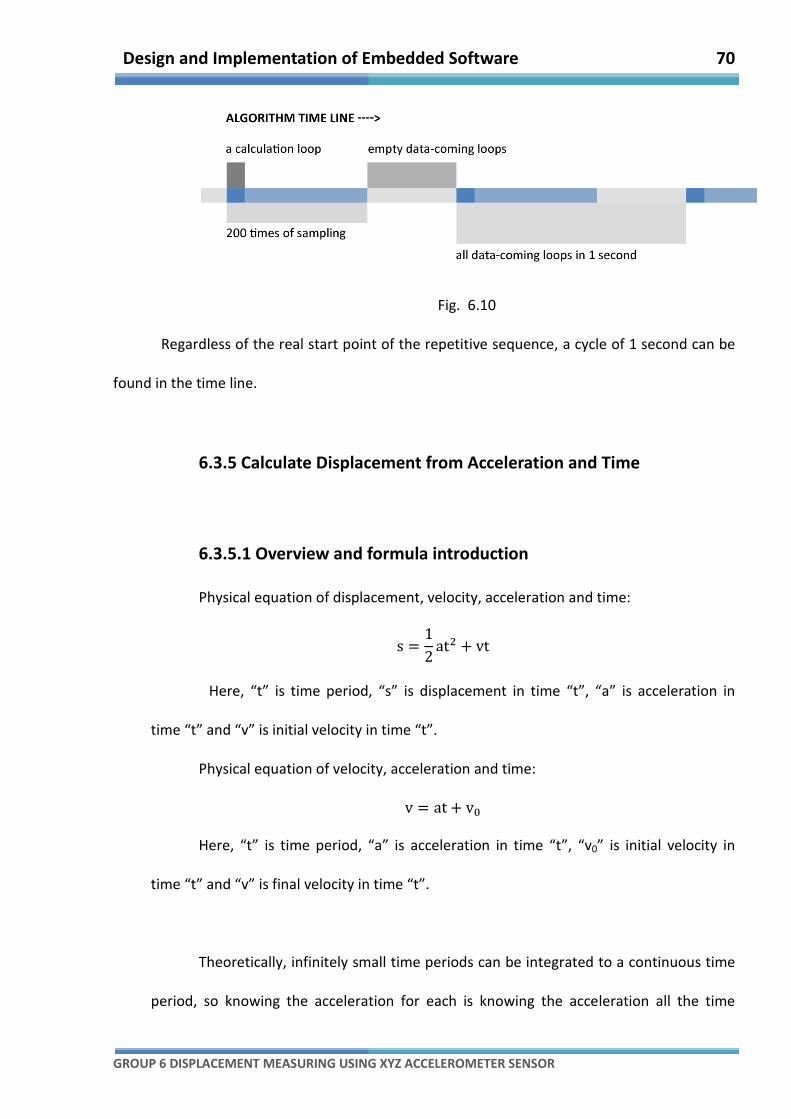
Design and Implementation of Embedded Software 70
GROUP 6 DISPLACEMENT MEASURING USING XYZ ACCELEROMETER SENSOR
Fig. 6.10
Regardless of the real start point of the repetitive sequence, a cycle of 1 second can be
found in the time line.
6.3.5 Calculate Displacement from Acceleration and Time
6.3.5.1 Overview and formula introduction
Physical equation of displacement, velocity, acceleration and time:
s =1
2at� + vt
Here, “t” is time period, “s” is displacement in time “t”, “a” is acceleration in
time “t” and “v” is initial velocity in time “t”.
Physical equation of velocity, acceleration and time:
v = at + v�
Here, “t” is time period, “a” is acceleration in time “t”, “v0” is initial velocity in
time “t” and “v” is final velocity in time “t”.
Theoretically, infinitely small time periods can be integrated to a continuous time
period, so knowing the acceleration for each is knowing the acceleration all the time
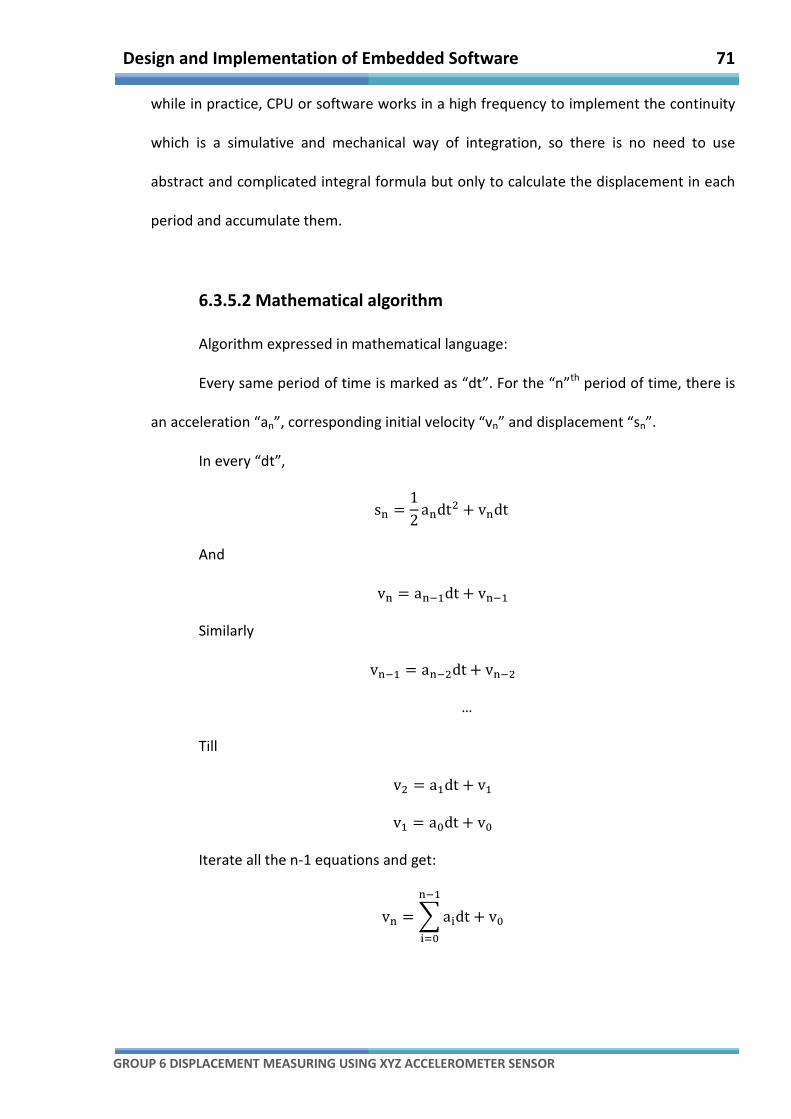
Design and Implementation of Embedded Software 71
GROUP 6 DISPLACEMENT MEASURING USING XYZ ACCELEROMETER SENSOR
while in practice, CPU or software works in a high frequency to implement the continuity
which is a simulative and mechanical way of integration, so there is no need to use
abstract and complicated integral formula but only to calculate the displacement in each
period and accumulate them.
6.3.5.2 Mathematical algorithm
Algorithm expressed in mathematical language:
Every same period of time is marked as “dt”. For the “n”th
period of time, there is
an acceleration “an”, corresponding initial velocity “vn” and displacement “sn”.
In every “dt”,
s� =1
2a�dt� + v�dt
And
v� = a���dt + v���
Similarly
v��� = a���dt + v���
…
Till
v� = a�dt + v�
v� = a�dt + v�
Iterate all the n-1 equations and get:
v� = � a�dt
���
���
+ v�
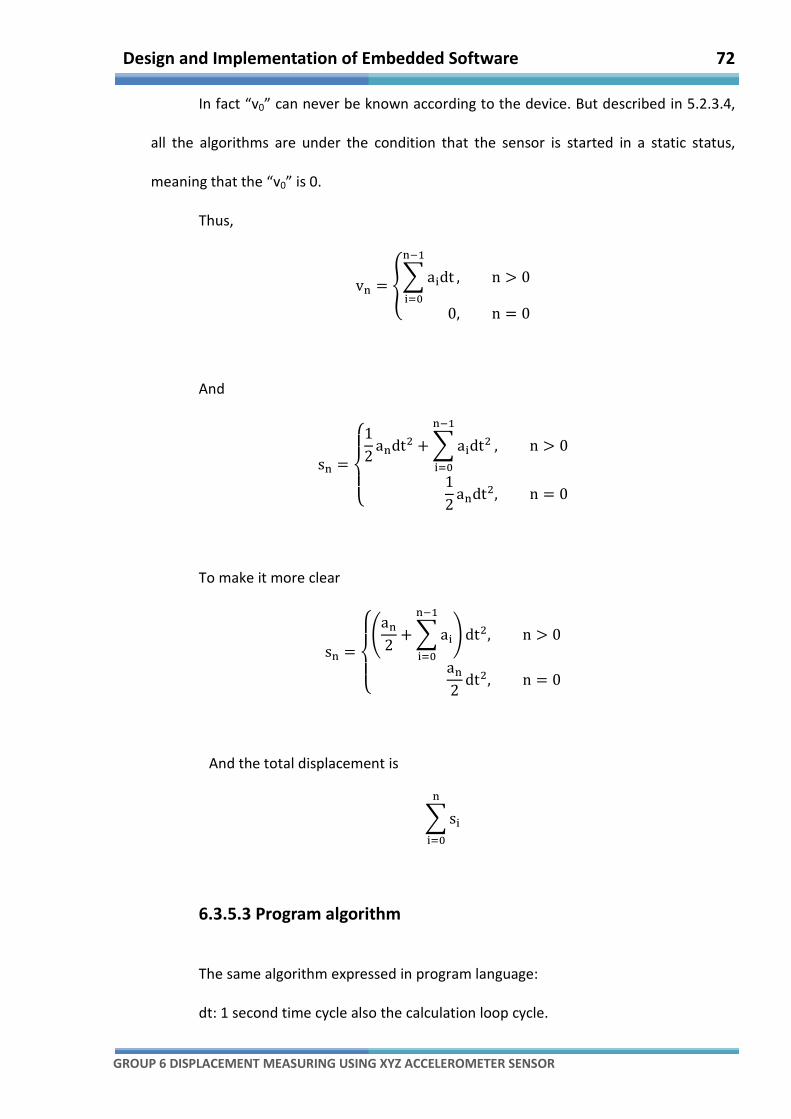
Design and Implementation of Embedded Software 72
GROUP 6 DISPLACEMENT MEASURING USING XYZ ACCELEROMETER SENSOR
In fact “v0” can never be known according to the device. But described in 5.2.3.4,
all the algorithms are under the condition that the sensor is started in a static status,
meaning that the “v0” is 0.
Thus,
v� = �� a�dt
���
���
, n > 0
0, n = 0
�
And
s� =
�����1
2a�dt� + � a�dt�
���
���
, n > 0
1
2a�dt�, n = 0
�
To make it more clear
s� =
������a�
2+ � a�
���
���
�dt�, n > 0
a�
2dt�, n = 0
�
And the total displacement is
� s�
�
���
6.3.5.3 Program algorithm
The same algorithm expressed in program language:
dt: 1 second time cycle also the calculation loop cycle.
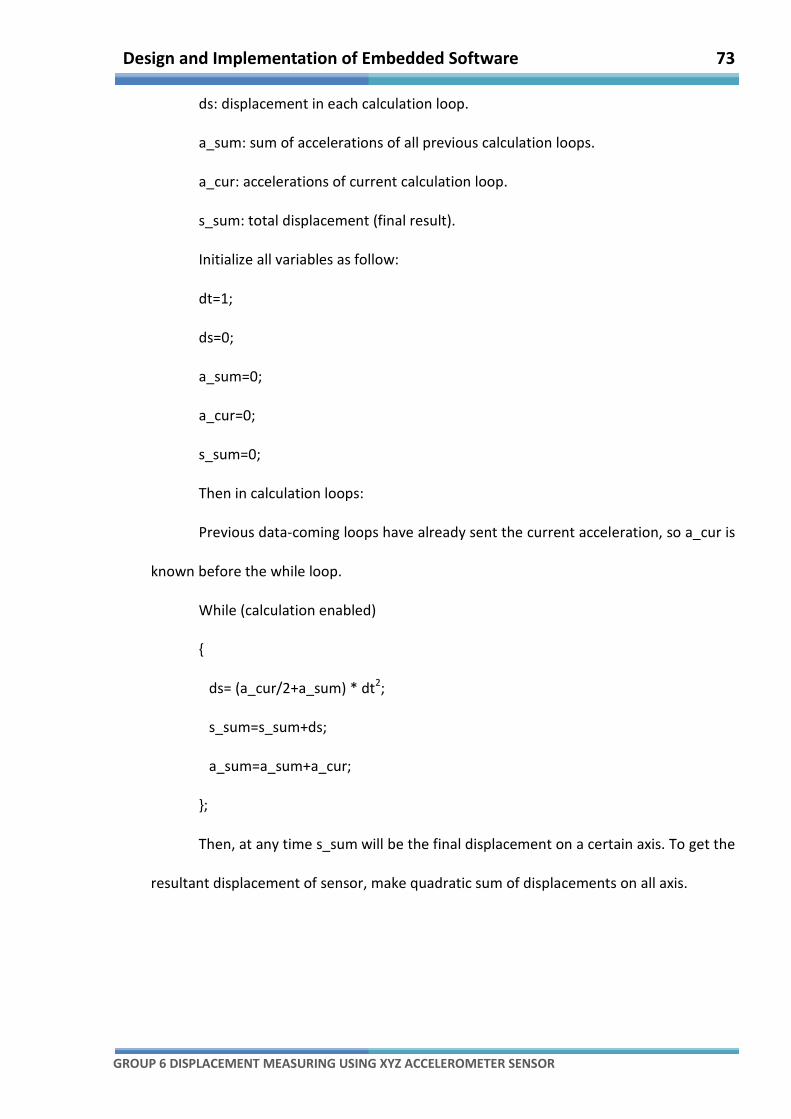
Design and Implementation of Embedded Software 73
GROUP 6 DISPLACEMENT MEASURING USING XYZ ACCELEROMETER SENSOR
ds: displacement in each calculation loop.
a_sum: sum of accelerations of all previous calculation loops.
a_cur: accelerations of current calculation loop.
s_sum: total displacement (final result).
Initialize all variables as follow:
dt=1;
ds=0;
a_sum=0;
a_cur=0;
s_sum=0;
Then in calculation loops:
Previous data-coming loops have already sent the current acceleration, so a_cur is
known before the while loop.
While (calculation enabled)
{
ds= (a_cur/2+a_sum) * dt2;
s_sum=s_sum+ds;
a_sum=a_sum+a_cur;
};
Then, at any time s_sum will be the final displacement on a certain axis. To get the
resultant displacement of sensor, make quadratic sum of displacements on all axis.
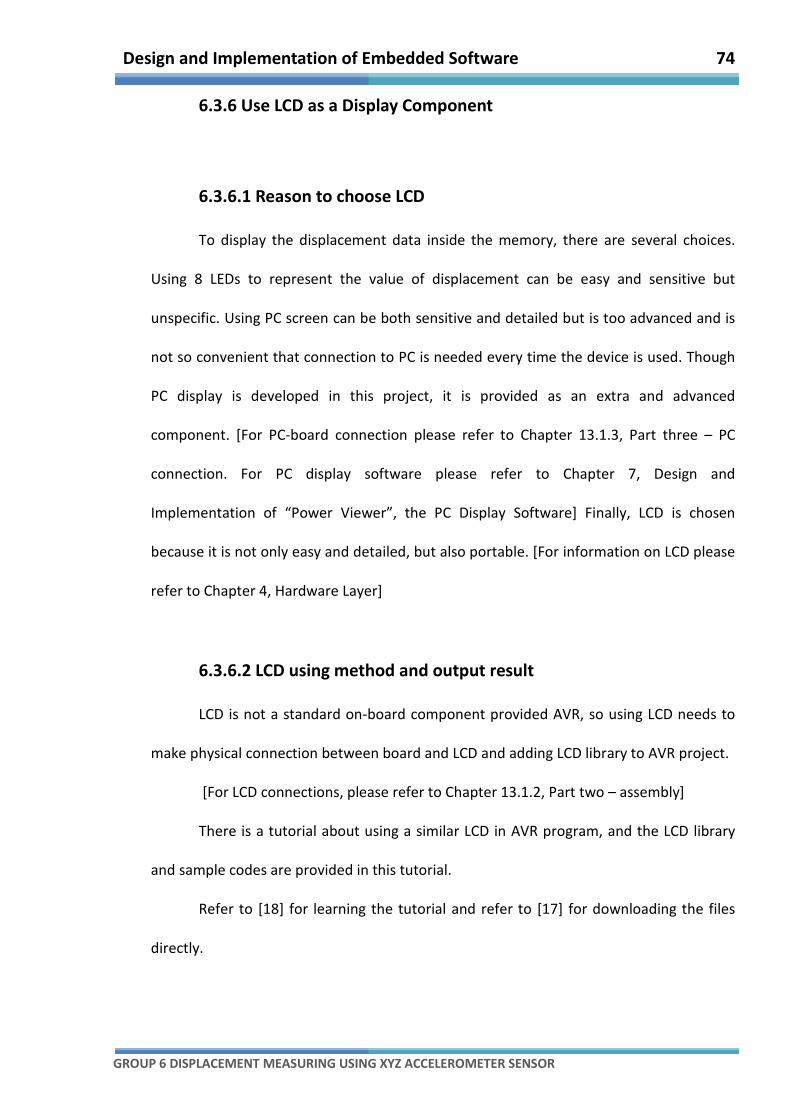
Design and Implementation of Embedded Software 74
GROUP 6 DISPLACEMENT MEASURING USING XYZ ACCELEROMETER SENSOR
6.3.6 Use LCD as a Display Component
6.3.6.1 Reason to choose LCD
To display the displacement data inside the memory, there are several choices.
Using 8 LEDs to represent the value of displacement can be easy and sensitive but
unspecific. Using PC screen can be both sensitive and detailed but is too advanced and is
not so convenient that connection to PC is needed every time the device is used. Though
PC display is developed in this project, it is provided as an extra and advanced
component. [For PC-board connection please refer to Chapter 13.1.3, Part three – PC
connection. For PC display software please refer to Chapter 7, Design and
Implementation of “Power Viewer”, the PC Display Software] Finally, LCD is chosen
because it is not only easy and detailed, but also portable. [For information on LCD please
refer to Chapter 4, Hardware Layer]
6.3.6.2 LCD using method and output result
LCD is not a standard on-board component provided AVR, so using LCD needs to
make physical connection between board and LCD and adding LCD library to AVR project.
[For LCD connections, please refer to Chapter 13.1.2, Part two – assembly]
There is a tutorial about using a similar LCD in AVR program, and the LCD library
and sample codes are provided in this tutorial.
Refer to [18] for learning the tutorial and refer to [17] for downloading the files
directly.
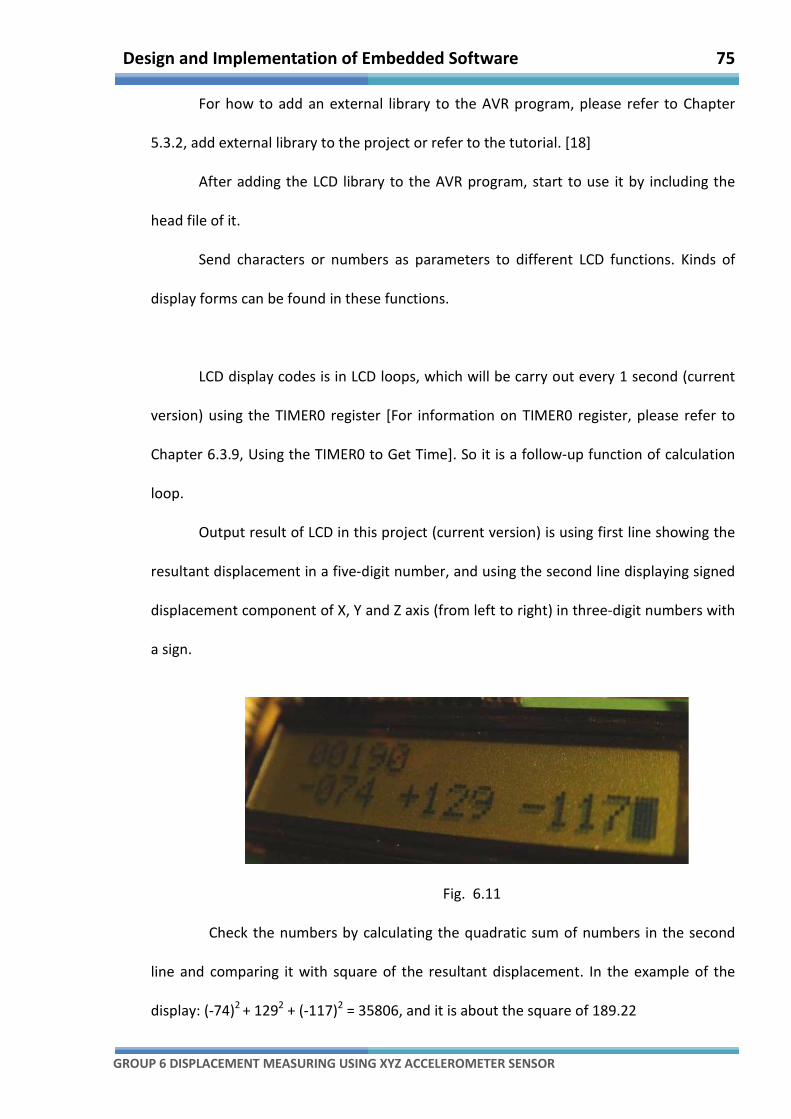
Design and Implementation of Embedded Sof
GROUP 6 DISPLACEMENT MEASURING USING XYZ ACCELEROMETER SENSOR
For how to add
5.3.2, add external library to the project
After adding the LCD library to the AVR program, start to use it by including the
head file of it.
Send characters or numbers as
display forms can be found
LCD display codes is in LCD loops, which will be carry out every 1 second (current
version) using the TIMER0
Chapter 6.3.9, Using the TIMER0 to Get Time]
loop.
Output result of LCD in this project (current version) is using first line showing the
resultant displacement in
displacement component of X, Y and Z axis (from left to right) in three
a sign.
Check the numbers by calculating the
line and comparing it with
display: (-74)2
+ 1292
Design and Implementation of Embedded Software
DISPLACEMENT MEASURING USING XYZ ACCELEROMETER SENSOR
For how to add an external library to the AVR program, please refer to
dd external library to the project or refer to the tutorial. [18]
adding the LCD library to the AVR program, start to use it by including the
Send characters or numbers as parameters to different LCD functions
display forms can be found in these functions.
LCD display codes is in LCD loops, which will be carry out every 1 second (current
version) using the TIMER0 register [For information on TIMER0 register, please refer to
Chapter 6.3.9, Using the TIMER0 to Get Time]. So it is a follow-up function of calculation
Output result of LCD in this project (current version) is using first line showing the
resultant displacement in a five-digit number, and using the second line displaying signed
displacement component of X, Y and Z axis (from left to right) in three
Fig. 6.11
Check the numbers by calculating the quadratic sum of numbers in the seco
line and comparing it with square of the resultant displacement.
+ (-117)2 = 35806, and it is about the square
75
external library to the AVR program, please refer to Chapter
[18]
adding the LCD library to the AVR program, start to use it by including the
s to different LCD functions. Kinds of
LCD display codes is in LCD loops, which will be carry out every 1 second (current
nformation on TIMER0 register, please refer to
up function of calculation
Output result of LCD in this project (current version) is using first line showing the
digit number, and using the second line displaying signed
displacement component of X, Y and Z axis (from left to right) in three-digit numbers with
of numbers in the second
of the resultant displacement. In the example of the
of 189.22

Design and Implementation of Embedded Software 76
GROUP 6 DISPLACEMENT MEASURING USING XYZ ACCELEROMETER SENSOR
6.3.7 Communicate with PC Through Serial Port
6.3.7.1 Overview
It is an advanced function to enable the board-PC communication. The
communication is based on serial ports on the board and PC under RS232 standard.
In telecommunications, RS-232 (Recommended Standard 232) is a standard for
serial binary single-ended data and control signals connecting between a DTE (Data
Terminal Equipment) and a DCE (Data Circuit-terminating Equipment). It is commonly
used in computer serial ports. The standard defines the electrical characteristics and
timing of signals, the meaning of signals, and the physical size and pinout of connectors.
[19]
Since most of modern laptops and PCs do not have a serial port. A USB-serial port
converter is needed. [For information on USB-serial port converter, please refer to
Chpater 4, Hardware layer] This converter still use RS232 standard.
But there is no need to go through all the RS232 rules, because AVR Studio
supports powerful advanced RS232 communication using its USART. USART stands for
“universal synchronous asynchronous receiver transmitter”. USART can be used to
establish the connection.
6.3.7.2 UASRT register usage and setting
Knowledge and technique on this field is provided by “extremeelectronics.co.in”.
For more information on the USART, please refer to the tutorial [20]. For a sample

Design and Implementation of Embedded Software 77
GROUP 6 DISPLACEMENT MEASURING USING XYZ ACCELEROMETER SENSOR
program, please refer to the tutorial. [21] For RS232 basics, please refer to the
tutorial.[22]
Similar to ADC, AVR USART is connected to the CPU by several data registers. To
use USART is to set the following six registers.
• UDR Register
USART Data Register: Read it to get the data stored in receive buffer of it and
write data to send data to the transmitters buffer of it.
• UCSRA Register
USART Control and status Register A: It stores some status about the USART and
can be used to configure the USART.
Table 6.4
RXC is set to 1 when the USART has completed receiving a byte and data are
available to be read from UDR
TXC is set to 1 when the USART has completed transmitting a byte and data are
available to be write to UDR
• UCSRB Register
USART Control and Status Register B: Similar to UCSRA.
Bit No. 7 6 5 4 3 2 1 0
Bit Name RXC TXC UDRE FE DOR PE U2X --
Initial Value 0 0 1 0 0 0 0 --

Design and Implementation of Embedded Software 78
GROUP 6 DISPLACEMENT MEASURING USING XYZ ACCELEROMETER SENSOR
Table 6.5
RXCIE stands for “receive complete interrupt enable” and is set to 1 if the
associated interrupt is enabled.
TXCIE stands for “transmit complete interrupt enable” and is set to 1 if the
associated interrupt is enabled.
RXEN is “receiver enable”. It should be 1 if the USART receiver is enabled.
TXEN is “transmitter enable”. It should be 1 if the USART transmitter is enabled.
In this program RXEN and TXEN should be 1 for both read and write data to PC.
And in the software loops, an endless and unceasing data sending is needed, which
means the micro controller needs always send acceleration data and other kind of data to
PC. TXCIE should be 1 to enable the interrupt, so that if the transmitting of one byte is
finished, the interrupt will inform the hardware as soon as possible in order to begin a
transmitting of next byte.
• UCSRC Register
USART Control and Status Register C: Similar to UCSRA and UCSRB.
Table 6.6
Bit No. 7 6 5 4 3 2 1 0
Bit Name RXCIE TXCIE UDRIE RXEN TXEN UCSZ2 RXB8 --
Initial Value 0 0 0 0 0 0 0 --
Bit No. 7 6 5 4 3 2 1 0
Bit Name URSEL UMSEL UPM1 UPM0 USBS UCSZ1 UCSZ0 --
Initial Value 0 0 0 0 0 0 0 --
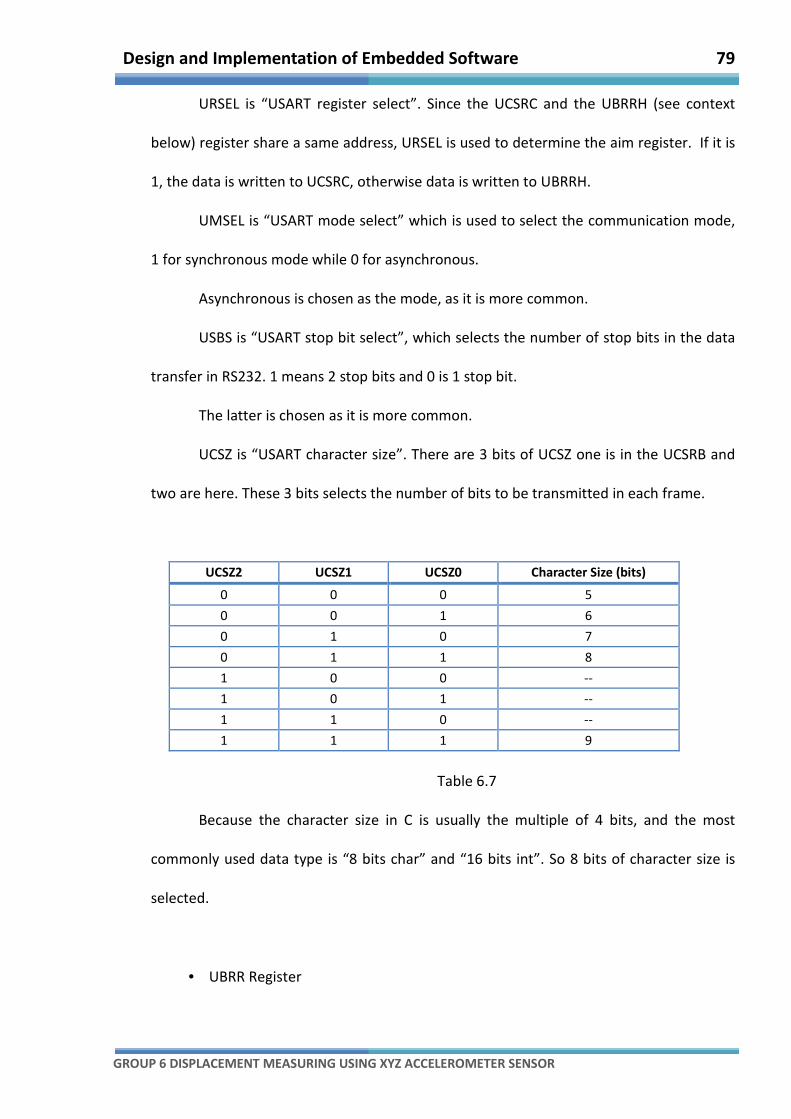
Design and Implementation of Embedded Software 79
GROUP 6 DISPLACEMENT MEASURING USING XYZ ACCELEROMETER SENSOR
URSEL is “USART register select”. Since the UCSRC and the UBRRH (see context
below) register share a same address, URSEL is used to determine the aim register. If it is
1, the data is written to UCSRC, otherwise data is written to UBRRH.
UMSEL is “USART mode select” which is used to select the communication mode,
1 for synchronous mode while 0 for asynchronous.
Asynchronous is chosen as the mode, as it is more common.
USBS is “USART stop bit select”, which selects the number of stop bits in the data
transfer in RS232. 1 means 2 stop bits and 0 is 1 stop bit.
The latter is chosen as it is more common.
UCSZ is “USART character size”. There are 3 bits of UCSZ one is in the UCSRB and
two are here. These 3 bits selects the number of bits to be transmitted in each frame.
UCSZ2 UCSZ1 UCSZ0 Character Size (bits)
0 0 0 5
0 0 1 6
0 1 0 7
0 1 1 8
1 0 0 --
1 0 1 --
1 1 0 --
1 1 1 9
Table 6.7
Because the character size in C is usually the multiple of 4 bits, and the most
commonly used data type is “8 bits char” and “16 bits int”. So 8 bits of character size is
selected.
• UBRR Register

Design and Implementation of Embedded Software 80
GROUP 6 DISPLACEMENT MEASURING USING XYZ ACCELEROMETER SENSOR
USART Baud Rate Register: This 16-bit wide register is made up of UBRRH (8 high
bits in UBRR) and UBRRL (8 low bits in UBRR). This register is used set the data
transmission frequency which has something to do with the baud rate [23].
Actually, the value of UBRR should be:
� !! =CPU frequency
16 ∗ Baud Rate− 1
The result of this formula cannot always be an integer. And UBRR should choose
the nearest integer of the result. For example, if the CPU frequency is 16MHz and the
baud rate is 19200bps, than UBRR should be 51 from the result 51.083. The less the
difference between the result and UBRR value, the more precise the data transmitting
will be. Sometimes, the result of this formula can be X.5, thus no matter which integer (X
or X+1) is chosen, difference is very large. The corresponding CPU frequency and the baud
rate are not recommended.
16MHz CPU frequency and 19200bps baud rate is selected in the project. (for
hardware support of CPU frequency setting, please refer to…, for software setting of CPU
frequency please refer to Chapter 6.3.8, CPU clock frequency setting)
To sum up, USART is used simply in following steps:
Step1: Initialize USART (set UBRR, UCSRC and UCSRB) to make it working in 16MHz
of CPU frequency, 19200bps of baud rate, asynchronous mode, 1 stop bit, 8 bits of
character size and transmission with interruption.
Step2: Send or receive data (write or read UDR)

Design and Implementation of Embedded Software 81
GROUP 6 DISPLACEMENT MEASURING USING XYZ ACCELEROMETER SENSOR
6.3.7.3 Data transfer protocol
When communicating with PC or simply transmitting data, a certain rule is needed
to make both sides recognize the data. That is the data transfer protocol.
The micro controller provides 3 kinds of information to PC, digital number,
acceleration and displacement. Digital numbers are those average values of ADC result
samples. Every data-sending loop (0.5 second according to current version using TIMER0),
the micro controller will send data to PC in the form below:
[x, num1, num2, num3, num4]
This is a transfer unit. This structure is used to hold data flow as below.
Information type x Num1(x) Num2(y) Num3(z) Num4(r)
Digital number n +8888 +8888 +8888 -
Acceleration a +88.88 +88.88 +88.88 +88.88
Displacement s +8888.8 +8888.8 +8888.8 +88.88
Table 6.8
“num1” to “num4” is for data of axis X, Y, Z and the resultant. Format of numbers
are using one bit of sign (“+”positive or “-“negative) and several bits of integer part,
integer part and a bit of decimal point according to different information types. For digital
number, resultant value is useless, so it will use “-” instead of a number.
All the data will be converted into C style 8-bit “char” (if previous data type is not
“chat”), and be sent byte by byte. The reason why not use two bytes transfer an “int”
type number (1 byte for high 8 bits and 1 for low), is that, most of the memory buffers
(data receiving buffers, data printing buffers…) are 8-bit based, it is better that every unit
Design and Implementation of Embedded Software 82
GROUP 6 DISPLACEMENT MEASURING USING XYZ ACCELEROMETER SENSOR
of 8-bit stored a meaningful data. 8-bit means one digit of a number while is means
nothing storing a half of a 16-bit number. And it is harder to divide a “float”.
Three such units are sent to PC every 0.5 second.
6.3.8 CPU Clock Frequency Setting
6.3.8.1 Overview
CPU clock of micro controller is the heart of every speed and frequency used in
related components or software, because all the other speeds and frequencies are either
generated or suffer a limitation from the CPU clock frequency. (For simplicity, context
below will use F_CPU instead of “the CPU clock frequency”.)
For example, ADC needs a 50kHz to 200kHz from F_CPU using a prescaler (see
6.3.3.3), USART needs F_CPU to set the UBRR (see 6.3.7.2) and programming the board in
ISP mode also need F_CPU (see 5.6.3.1) and so on.
A correct and sound F_CPU is needed to handle all these things.
6.3.8.2 Clock setting
There are several ways to select the source of F_CPU. “On-board crystal signal” is
chosen as the final selection. That is a way to use external clock. So, in the fuses setting in
AVR studio, SUT_CKSEL should be one of the three external clock options [For fuses
settings in AVR Studio 4, please refer to Chapter 5.6, Programming and settings]
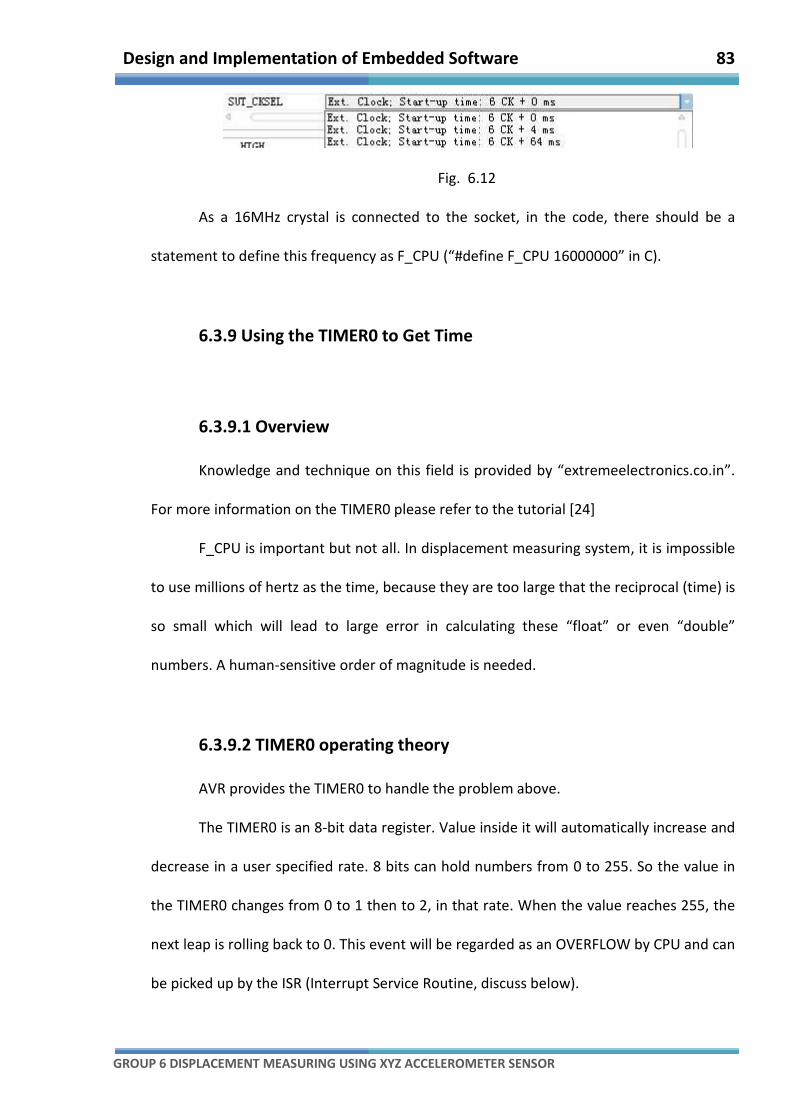
Design and Implementation of Embedded Software 83
GROUP 6 DISPLACEMENT MEASURING USING XYZ ACCELEROMETER SENSOR
Fig. 6.12
As a 16MHz crystal is connected to the socket, in the code, there should be a
statement to define this frequency as F_CPU (“#define F_CPU 16000000” in C).
6.3.9 Using the TIMER0 to Get Time
6.3.9.1 Overview
Knowledge and technique on this field is provided by “extremeelectronics.co.in”.
For more information on the TIMER0 please refer to the tutorial [24]
F_CPU is important but not all. In displacement measuring system, it is impossible
to use millions of hertz as the time, because they are too large that the reciprocal (time) is
so small which will lead to large error in calculating these “float” or even “double”
numbers. A human-sensitive order of magnitude is needed.
6.3.9.2 TIMER0 operating theory
AVR provides the TIMER0 to handle the problem above.
The TIMER0 is an 8-bit data register. Value inside it will automatically increase and
decrease in a user specified rate. 8 bits can hold numbers from 0 to 255. So the value in
the TIMER0 changes from 0 to 1 then to 2, in that rate. When the value reaches 255, the
next leap is rolling back to 0. This event will be regarded as an OVERFLOW by CPU and can
be picked up by the ISR (Interrupt Service Routine, discuss below).
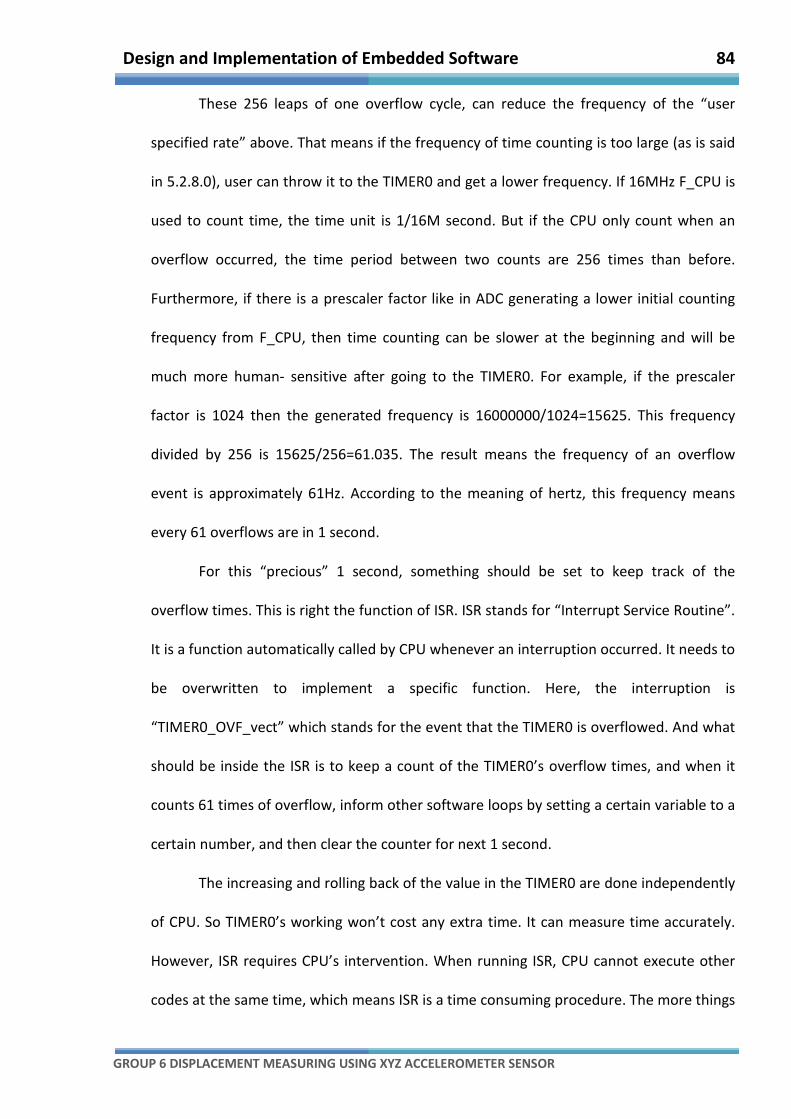
Design and Implementation of Embedded Software 84
GROUP 6 DISPLACEMENT MEASURING USING XYZ ACCELEROMETER SENSOR
These 256 leaps of one overflow cycle, can reduce the frequency of the “user
specified rate” above. That means if the frequency of time counting is too large (as is said
in 5.2.8.0), user can throw it to the TIMER0 and get a lower frequency. If 16MHz F_CPU is
used to count time, the time unit is 1/16M second. But if the CPU only count when an
overflow occurred, the time period between two counts are 256 times than before.
Furthermore, if there is a prescaler factor like in ADC generating a lower initial counting
frequency from F_CPU, then time counting can be slower at the beginning and will be
much more human- sensitive after going to the TIMER0. For example, if the prescaler
factor is 1024 then the generated frequency is 16000000/1024=15625. This frequency
divided by 256 is 15625/256=61.035. The result means the frequency of an overflow
event is approximately 61Hz. According to the meaning of hertz, this frequency means
every 61 overflows are in 1 second.
For this “precious” 1 second, something should be set to keep track of the
overflow times. This is right the function of ISR. ISR stands for “Interrupt Service Routine”.
It is a function automatically called by CPU whenever an interruption occurred. It needs to
be overwritten to implement a specific function. Here, the interruption is
“TIMER0_OVF_vect” which stands for the event that the TIMER0 is overflowed. And what
should be inside the ISR is to keep a count of the TIMER0’s overflow times, and when it
counts 61 times of overflow, inform other software loops by setting a certain variable to a
certain number, and then clear the counter for next 1 second.
The increasing and rolling back of the value in the TIMER0 are done independently
of CPU. So TIMER0’s working won’t cost any extra time. It can measure time accurately.
However, ISR requires CPU’s intervention. When running ISR, CPU cannot execute other
codes at the same time, which means ISR is a time consuming procedure. The more things
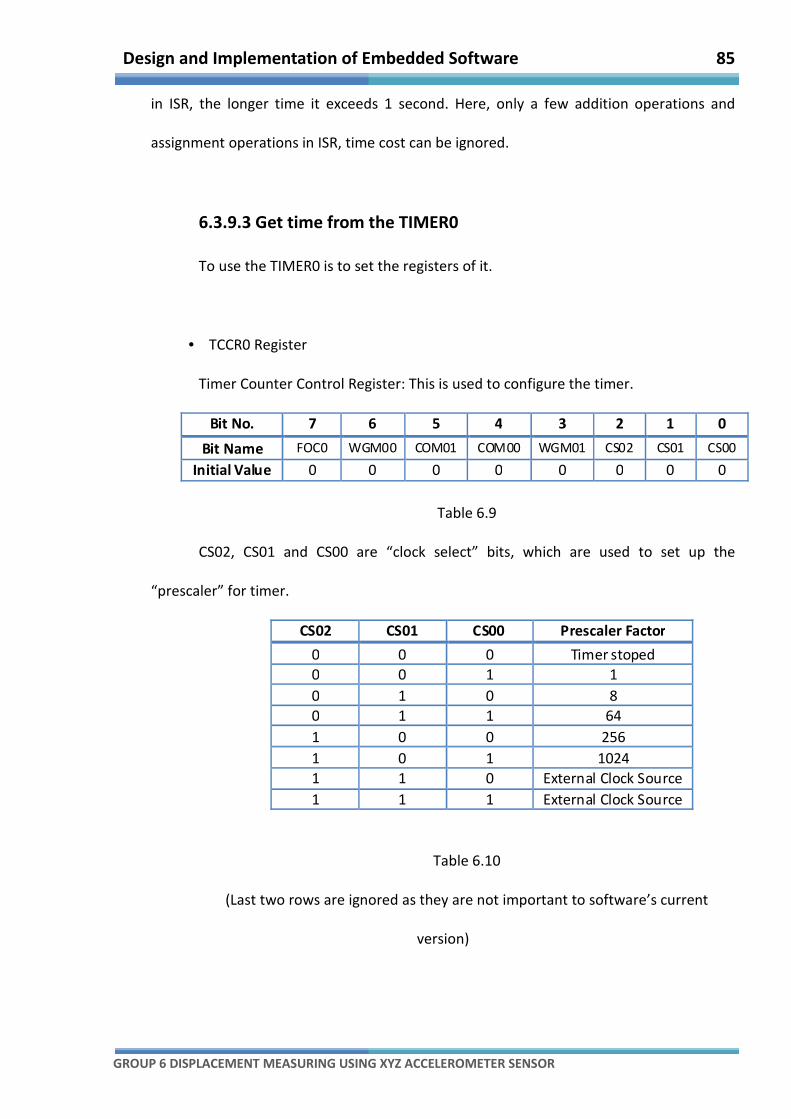
Design and Implementation of Embedded Software 85
GROUP 6 DISPLACEMENT MEASURING USING XYZ ACCELEROMETER SENSOR
in ISR, the longer time it exceeds 1 second. Here, only a few addition operations and
assignment operations in ISR, time cost can be ignored.
6.3.9.3 Get time from the TIMER0
To use the TIMER0 is to set the registers of it.
• TCCR0 Register
Timer Counter Control Register: This is used to configure the timer.
Table 6.9
CS02, CS01 and CS00 are “clock select” bits, which are used to set up the
“prescaler” for timer.
Table 6.10
(Last two rows are ignored as they are not important to software’s current
version)
Bit No. 7 6 5 4 3 2 1 0
Bit Name FOC0 WGM00 COM01 COM00 WGM01 CS02 CS01 CS00
Initial Value 0 0 0 0 0 0 0 0
CS02 CS01 CS00 Prescaler Factor
0 0 0 Timer stoped
0 0 1 1
0 1 0 8
0 1 1 64
1 0 0 256
1 0 1 1024
1 1 0 External Clock Source
1 1 1 External Clock Source
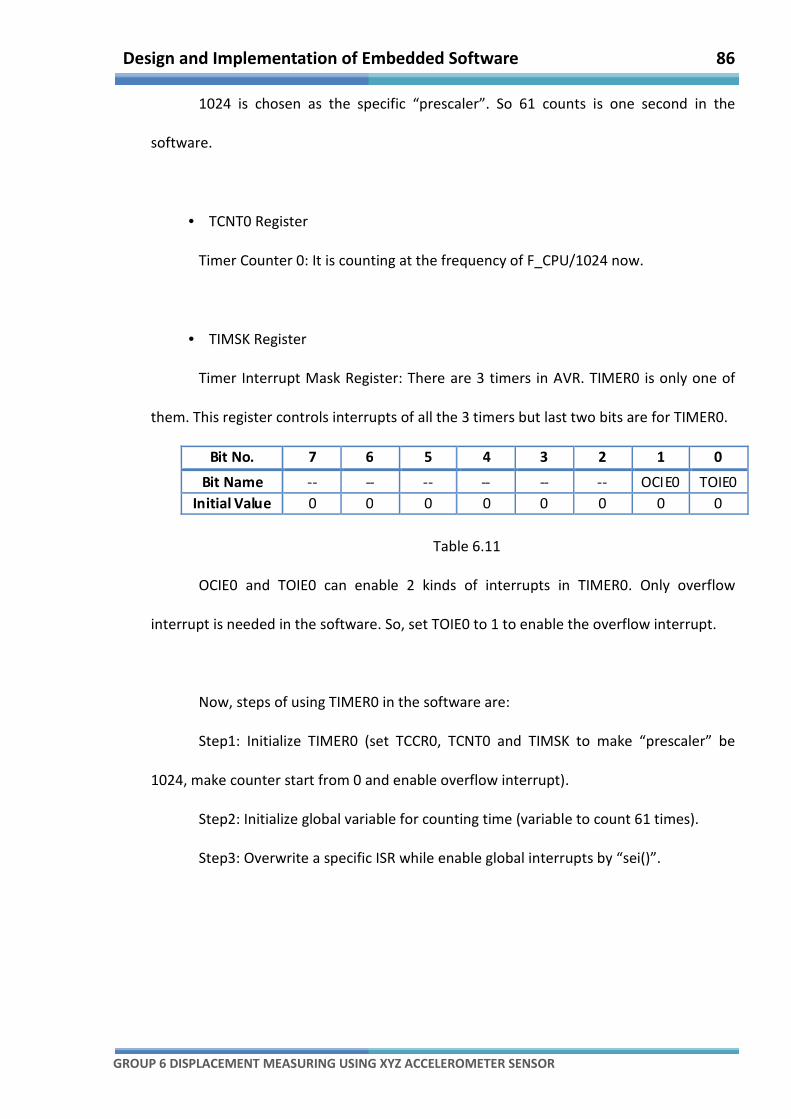
Design and Implementation of Embedded Software 86
GROUP 6 DISPLACEMENT MEASURING USING XYZ ACCELEROMETER SENSOR
1024 is chosen as the specific “prescaler”. So 61 counts is one second in the
software.
• TCNT0 Register
Timer Counter 0: It is counting at the frequency of F_CPU/1024 now.
• TIMSK Register
Timer Interrupt Mask Register: There are 3 timers in AVR. TIMER0 is only one of
them. This register controls interrupts of all the 3 timers but last two bits are for TIMER0.
Table 6.11
OCIE0 and TOIE0 can enable 2 kinds of interrupts in TIMER0. Only overflow
interrupt is needed in the software. So, set TOIE0 to 1 to enable the overflow interrupt.
Now, steps of using TIMER0 in the software are:
Step1: Initialize TIMER0 (set TCCR0, TCNT0 and TIMSK to make “prescaler” be
1024, make counter start from 0 and enable overflow interrupt).
Step2: Initialize global variable for counting time (variable to count 61 times).
Step3: Overwrite a specific ISR while enable global interrupts by “sei()”.
Bit No. 7 6 5 4 3 2 1 0
Bit Name -- -- -- -- -- -- OCIE0 TOIE0
Initial Value 0 0 0 0 0 0 0 0
Design and Implementation of Embedded Software 87
GROUP 6 DISPLACEMENT MEASURING USING XYZ ACCELEROMETER SENSOR
6.3.10 Precision Statement and Error Reducing
6.3.10.1 Algorithm precision statement
Precision of the whole displacement measuring system depends on two parts:
hardware and software. Here is the software precision statement.
“Precision” here means the fidelities of processed data in every software links
compared with the original data. The original data is sensor’s output voltage values.
• ADC
Voltage signals are always suffered from noises on the wires, according to some
previous experiments, ADC results jitter in a range of ±20. According to the sensitivity of
the sensor, a 20 value means 20/67.25=0.2974g, and is an acceleration of about 2.91
m/s2.
• ADC result collection and calibration
Under the assumption of the homogeneous jitter, using collection and calibration
algorithm, most positive and negative errors are cancelled out. The left offset of noise is
about 0-5 in value, according to some experiments. 0-5 means 0-0.73 m/s2 in
acceleration. (This error is totally because of the sensor and wires, see ADXL335 data
sheet for its precision statement [25]
• Calculation
Possible decimal parameters used in displacement calculation are in “float” data
type. C language style “float” has a precision of 6 digits after decimal point. And the
precision will not lose after addition, multiplication or calculation of square root. So
precision in calculation is all the time at 0.000001 which will be covered by error in ADC
result collection and calibration.
Design and Implementation of Embedded Software 88
GROUP 6 DISPLACEMENT MEASURING USING XYZ ACCELEROMETER SENSOR
• Gravity constant
Gravity constant is 9.815 m/s2 in the software. It is precise at 0.01.
• LCD
LCD will show the integer part of a value, while the real information is not lost.
• PC-board connection
The micro controller send ADC sample result in integer, with no precision lost. It
sends accelerations accurate to 0.1 and displacement accurate to 0.01. Precision lost in
data sending will never influence the calculation in the micro controller, but will cause an
accuracy problem in PC.
To sum up, displacement measuring system’s precision in software layer is 0.01.
And the error of the result mostly comes from hardware layer.
6.3.10.2 Error reducing
There are several error reducing algorithms in the software mainly to remove the
error from hardware (sensor and wires).
• ADC result collection and calibration algorithm
Fuzzy compare
While comparing two average samples of ADC result [see flow chart on Chapter
6.3.4.6, algorithms gathering and optimize], a value called “noise offset” is used to make a
fuzzy compare. Because it is a 0-5 float in the value , a fuzzy compare is needed to
recognize two same values within a difference of 5. For example two static status of the
sensor may give 2 average samples in 400 time of sampling. Usually they are not the same
in value according hardware error. If regard one of them as the real value of static and
make a strict comparing, the other one will be regarded as a value of movement. In fact it
Design and Implementation of Embedded Software 89
GROUP 6 DISPLACEMENT MEASURING USING XYZ ACCELEROMETER SENSOR
is incorrect. The noise offset is such a factor to avoid those situations in most cases.
However, it in turn, is also a source of error. There are also possibilities that two different
values of different status, values of which differ in the range of the offset value, and they
are treated the one. So there is certain case that the sensor is stopped but the data is
keeping increasing. Fuzzy compare reduces error to a certain extent but cannot avoid all
influences by error.
• F_CPU choosing
As it was discussed, for baud rate 19200bps, 16MHz F_CPU is a good choice to
reduce transmitting errors.
• Time counter and ISR time error
As is discussed in 6.3.9.2, only assignments operations and addition operations are
in ISR to reduce its CPU- intervenes time in order to reduce errors.
90
GROUP 6 DISPLACEMENT MEASURING USING XYZ ACCELEROMETER SENSOR
Chapter 7
Design and
Implementation of the PC
Display Software
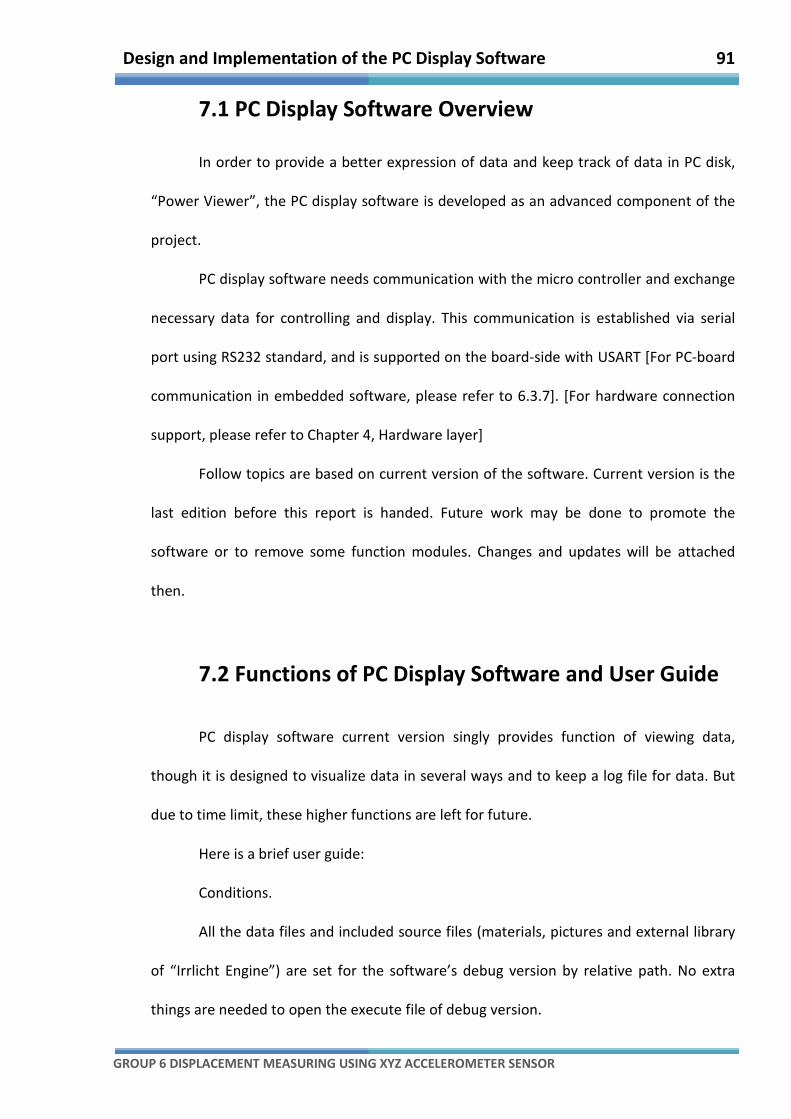
Design and Implementation of the PC Display Software 91
GROUP 6 DISPLACEMENT MEASURING USING XYZ ACCELEROMETER SENSOR
7.1 PC Display Software Overview
In order to provide a better expression of data and keep track of data in PC disk,
“Power Viewer”, the PC display software is developed as an advanced component of the
project.
PC display software needs communication with the micro controller and exchange
necessary data for controlling and display. This communication is established via serial
port using RS232 standard, and is supported on the board-side with USART [For PC-board
communication in embedded software, please refer to 6.3.7]. [For hardware connection
support, please refer to Chapter 4, Hardware layer]
Follow topics are based on current version of the software. Current version is the
last edition before this report is handed. Future work may be done to promote the
software or to remove some function modules. Changes and updates will be attached
then.
7.2 Functions of PC Display Software and User Guide
PC display software current version singly provides function of viewing data,
though it is designed to visualize data in several ways and to keep a log file for data. But
due to time limit, these higher functions are left for future.
Here is a brief user guide:
Conditions.
All the data files and included source files (materials, pictures and external library
of “Irrlicht Engine”) are set for the software’s debug version by relative path. No extra
things are needed to open the execute file of debug version.
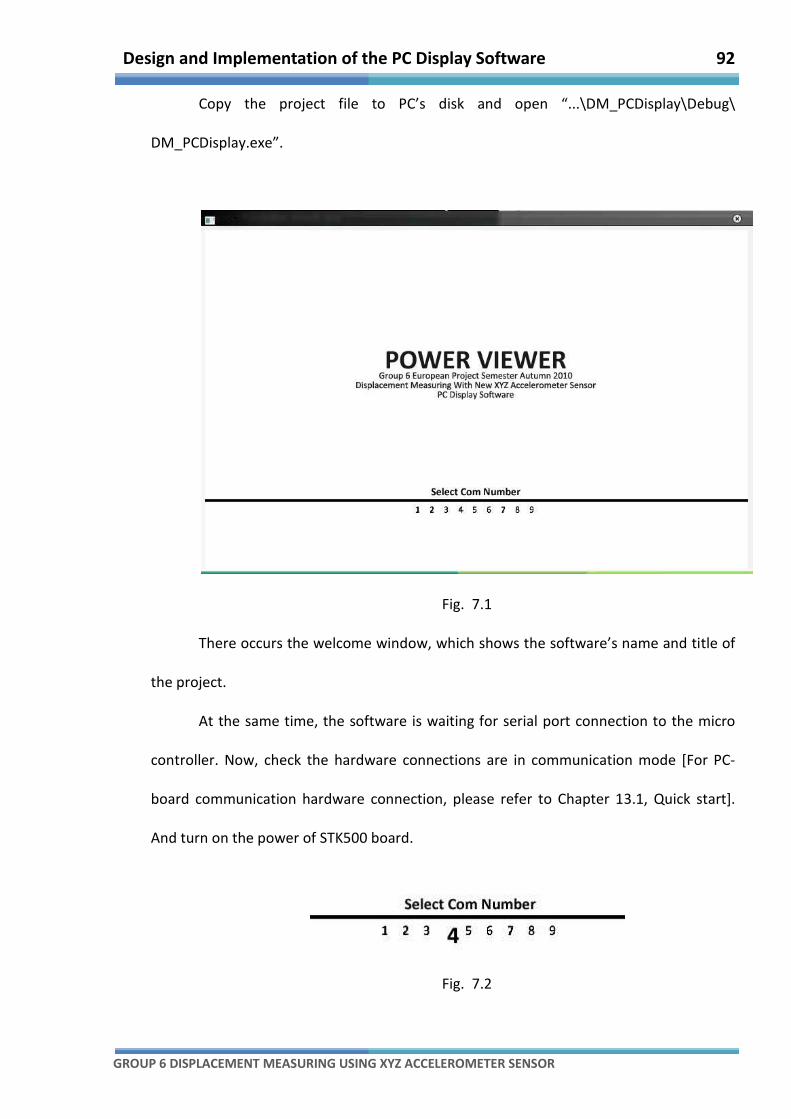
Design and Implementation of the PC Display Software 92
GROUP 6 DISPLACEMENT MEASURING USING XYZ ACCELEROMETER SENSOR
Copy the project file to PC’s disk and open “...\DM_PCDisplay\Debug\
DM_PCDisplay.exe”.
Fig. 7.1
There occurs the welcome window, which shows the software’s name and title of
the project.
At the same time, the software is waiting for serial port connection to the micro
controller. Now, check the hardware connections are in communication mode [For PC-
board communication hardware connection, please refer to Chapter 13.1, Quick start].
And turn on the power of STK500 board.
Fig. 7.2
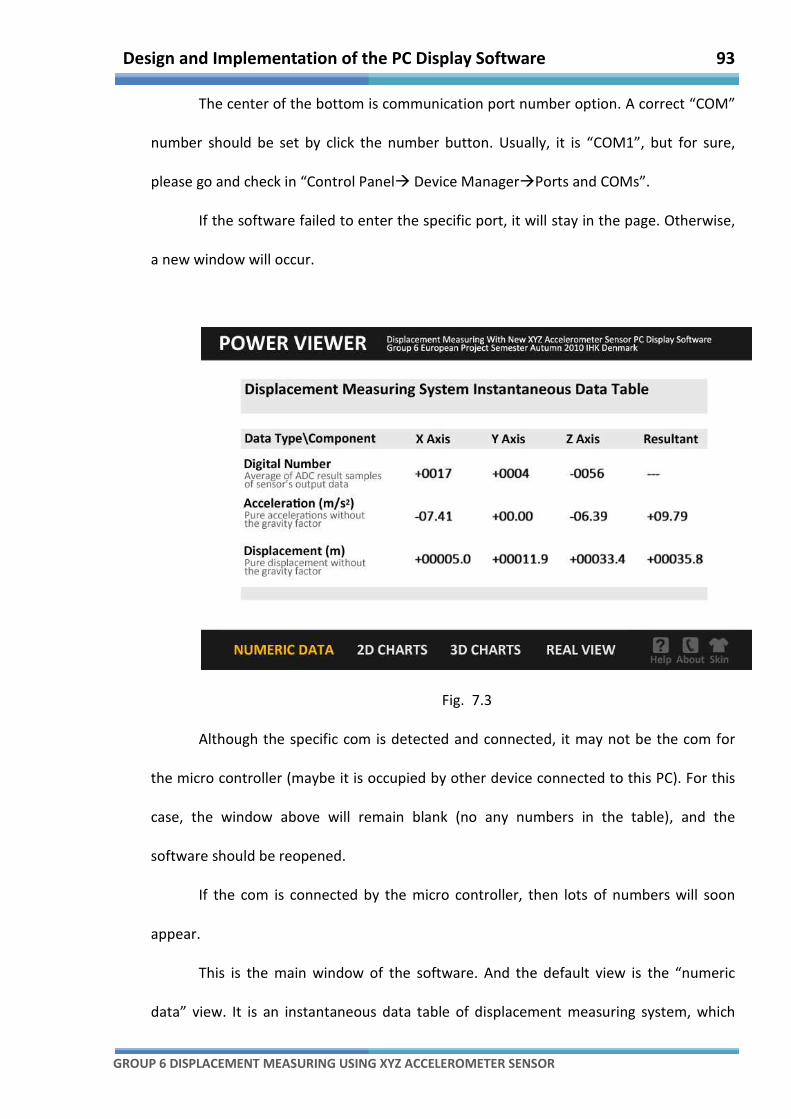
Design and Implementation of the PC Display Software 93
GROUP 6 DISPLACEMENT MEASURING USING XYZ ACCELEROMETER SENSOR
The center of the bottom is communication port number option. A correct “COM”
number should be set by click the number button. Usually, it is “COM1”, but for sure,
please go and check in “Control Panel� Device Manager�Ports and COMs”.
If the software failed to enter the specific port, it will stay in the page. Otherwise,
a new window will occur.
Fig. 7.3
Although the specific com is detected and connected, it may not be the com for
the micro controller (maybe it is occupied by other device connected to this PC). For this
case, the window above will remain blank (no any numbers in the table), and the
software should be reopened.
If the com is connected by the micro controller, then lots of numbers will soon
appear.
This is the main window of the software. And the default view is the “numeric
data” view. It is an instantaneous data table of displacement measuring system, which

Design and Implementation of the PC Display Software 94
GROUP 6 DISPLACEMENT MEASURING USING XYZ ACCELEROMETER SENSOR
shows digital numbers, accelerations and displacements data from the micro controller in
numeric way without any advanced processing.
Fig. 7.4
Main menu of function selection is on the bottom. Several views are planned
other than numeric data, like charts and real view. But current version only implements
numeric view function.
The new edition of user guide will attached if any updates and changed of the
software is done.
7.3 Implementation of Current Version
7.3.1 Overview
This software is developed in C++ language in Visual Studio 2008 and has occupied
several external libraries in Irrlicht Engine. For information on these two tools, please
refer to [26]
It is developed in an object-oriented idea [27]. The whole framework is done,
which means the structure of the software is done. Several basic C++ classes are designed
and implemented, for example the powerful and customizable button class for user input
processing and user-friendly interface and view classes in different levels for a structured
software and so on.
Adding a new module to the software will not be too difficult.

Design and Implementation of the PC Display Software 95
GROUP 6 DISPLACEMENT MEASURING USING XYZ ACCELEROMETER SENSOR
7.3.2 Software Framework Design
Since the software is developed in C++, there are many classes operating as
independent units but forming a relationship net. To understand this net is to quickly
know the idea of design this software. This object relationship chart is almost
implemented now because the software framework is built, but some of the detail
functions in it will be finished in the future.
Fig. 7.5
Simply three circles can make a conclusion of the relationship between each
class objects. Here are the explanations.
First circle, on the upright, is the relation between user, interface and power
viewer class.
User will control the whole software by setting kinds global variables. For
example, user needs to use a menu to select the current on-show view which though is a
function point to a certain class of view, is not available until this view is called and
initialized by the power viewer class. User may click a certain button for help and other
Design and Implementation of the PC Display Software 96
GROUP 6 DISPLACEMENT MEASURING USING XYZ ACCELEROMETER SENSOR
information. And user’s connection command is also sent to power viewer class via
interface elements (buttons).
Second circle, on the upleft, is the relation between user, interface and different
class of views.
Only the numeric view is provided now, but the principle to develop and use other
views are the same. User need to set the property of a certain view, for example to
choose a value for Y-axis, or to change the updating frequency. And these kinds of
interactions are really between the user and those classes rather than having the aid of
power viewer class.
The last circle, the biggest gray one is the relation between view classes, power
viewer class and com class. It will be a hell of mess if every view is able to and have to
read data from the micro controller directly in the com class. So power viewer acts as a
center of distribution. Actually, com is inside the power viewer class. All it is opening,
closing, settings and most important data-reading are controlled by the power viewer
class.
This is the general idea of the PC display software design and implementation. For
more detailed and technical information, see the code and project file in attached CD.

97
GROUP 6 DISPLACEMENT MEASURING USING XYZ ACCELEROMETER SENSOR
Chapter 8
Structure and
Management of the Project

Structure and Management of the Project 98
GROUP 6 DISPLACEMENT MEASURING USING XYZ ACCELEROMETER SENSOR
8.1 Overview
In this chapter description of the project management is provided. It includes
brainstorming, investigation process, constructing process and management issues.
Overview on the project management is presented in order to show how effectively
organize time, deal with troubles, overcome obstacles and what is the most important –
work as a team, international team. This section is as important for the project, as other
engineering sections, if not more as them. It is an essential part of the project.
Main purpose of doing an EPS project is to experience group work. Along the
semester, obstacles like different way of thinking, different field of study, different way of
interpretation and so on and so forth were confronted. The EPS semester is more about
international teamwork than just writing a report or doing a project.
8.2 Managing the Project.
8.2.1 Work Breakdown Structure (WBS)
8.2.1.1 WBS overview In this project numerous issues have to be considered. For instance, study of the
devices like accelerometers, embedded programming skills according to hardware and
software layer, teamwork skills, communication skills, and so on are required.
In order to achieve the final goal and satisfy the requirements, something like
managing structure, has to be organized. That is why, many useful tools were used to
develop and maintain this part of the project. These are functional diagrams,

Structure and Management of the Project
GROUP 6 DISPLACEMENT MEASURING USING XYZ ACCELEROMETER SENSOR
Responsibility Matrix (
most important one are briefly explained below.
This part of organizing the proj
project into manageable components, and successively subdividing them in subtasks or
work packages, of reasonable size, including all the steps necessary to achieve the goal.
The divided process should be h
of structure. Structure defines tasks and makes
necessary.
Such a structure defines tasks that can be completed independently of other
tasks, facilitating resou
and control of the project
The usual structure of WBS is the tree structure, in this particular case the WBS
has three main subdivisions: Research, Assembly and Programming.
Research
Accelerometers
MicroController
Connectors
Software
Compatibility
Display
Structure and Management of the Project
DISPLACEMENT MEASURING USING XYZ ACCELEROMETER SENSOR
Matrix (RM), Work Breakdown Structure (WBS) and Gantt
most important one are briefly explained below.
This part of organizing the project process, consists of the division of the main
project into manageable components, and successively subdividing them in subtasks or
work packages, of reasonable size, including all the steps necessary to achieve the goal.
The divided process should be hierarchical, and should posses some, at least basic, shape
Structure defines tasks and makes them visible and easy to reorder if
Such a structure defines tasks that can be completed independently of other
tasks, facilitating resource allocation, assignment of responsibilities, and measurement
and control of the project. [30]
The usual structure of WBS is the tree structure, in this particular case the WBS
has three main subdivisions: Research, Assembly and Programming.
Fig. 8.1 – Work Breakdown Structure
MEASUREMENT DEVICE PROTOTYPE
Research
Accelerometers
MicroController
Connectors
Software
Compatibility
Display
Assembly
Sensor/Microcontroller
MicroController/Display
PC/Software
99
WBS) and Gantt Chart (GC). The
ect process, consists of the division of the main
project into manageable components, and successively subdividing them in subtasks or
work packages, of reasonable size, including all the steps necessary to achieve the goal.
ierarchical, and should posses some, at least basic, shape
them visible and easy to reorder if
Such a structure defines tasks that can be completed independently of other
rce allocation, assignment of responsibilities, and measurement
The usual structure of WBS is the tree structure, in this particular case the WBS
has three main subdivisions: Research, Assembly and Programming.
Work Breakdown Structure
MEASUREMENT DEVICE PROTOTYPE
Sensor/Microcontroller
Display
Programming
Receive data
A/D
Display
Structure and Management of the Project 100
GROUP 6 DISPLACEMENT MEASURING USING XYZ ACCELEROMETER SENSOR
8.2.1.2 Research branch
First of all, research about the different aspects of the project and suitable
components has been done. The hardware and software layer explanation, as well as the
general descriptions can be found in sections of this report. Detailed information
according to the chosen components, and their suitability are provided by datasheets.
What is important, also compatibility issues were considered. As it is presented on the
WBR, main aspects of the research in the first part of the project were: accelerometer
study, microcontroller study, connections between devises and power issues,
compatibility problems and suitable display analysis.
8.2.1.3 Assembly Branch Those three main boxes presented in the assembly branch represent much more
than just connections. Behind connections between devices, stand many issues like
power problems, length of wires, pin-to-pin wires constructing, adopting microcontroller
to work with the required speed for RS232-PC protocol etc. All of those subtasks were
assembled parallel and there was no need to present so much detailed assembly branch.
Troubles and obstacles which appeared while establishing all of the above connections
are presented in the following sections.
In one of the last parts of the project, assemble of the Plexiglas board to organize
all devices and wire in one place was done.
8.2.1.4 Programming Branch While doing electronic project it is not only about constructing the device, but also
about making it work. What is more, that is the most difficult and time consuming part.
As it was said in the above section, it is impossible to present all things that have to be
Structure and Management of the Project 101
GROUP 6 DISPLACEMENT MEASURING USING XYZ ACCELEROMETER SENSOR
programmed. That is why, only main and the most valid parts are presented.
Programming relates not only to the microcontroller and its peripherals programming,
but also to the development of the software on the PC. While researching this branch,
strong pressure was put not only on compatibility and utility issues but also on open
source matter and availability of software.
8.2.2 Gantt Chart
It is a very useful mean of visualizing a project, and it is an excellent method for
monitoring the progress of a project. This type of bar chart is used to show the beginning
and finish dates of the tasks of a project. These tasks are the elements shown on the
WBS, sometimes in a more detailed way, with subtasks etc. In this chart, it is possible to
see also the interdependency relationships between processes. Chart controls the time
line of the project and prevents form time wasting and possible lost of decent pace.
This GC was done in easily available software – Project Manager from Microsoft
Company.
In is obvious that while doing the project some troubles will appear. This is where
GC presents its strongest features. It is adjustable and suitable for and inevitable changes.
It can be used not only to plan the project work at the beginning of the process but also
to reorganize the whole process and change the durations where it is necessary.

Structure and Management of the Project 102
GROUP 6 DISPLACEMENT MEASURING USING XYZ ACCELEROMETER SENSOR
Fig. 8.2 - Gantt chart

Structure and Management of the Project 103
GROUP 6 DISPLACEMENT MEASURING USING XYZ ACCELEROMETER SENSOR
8.2.3 Responsibility Matrix (RM)
It takes a lot of effort to keep a large project running smoothly. With a large
number of variables, people, and deliverables, it’s hard to keep on top of everything
that’s happening. That is why RM, presented here as a third tool might be useful. It is an
important project communication tool because all members can see clearly who to
contact for each activity [31]
A responsibility matrix is a way to show graphically the responsibility of the
particular member involved in the project in completing tasks.RM presented below shows
not only the responsibility issue but also who is responsible for support in a particular
activity.
In this project the tasks were distributed equally so each member is responsible,
more or less, for the same amount of work.
Fig. 8.3 – Responsibility Matrix
Structure and Management of the Project 104
GROUP 6 DISPLACEMENT MEASURING USING XYZ ACCELEROMETER SENSOR
8.3 Checking the Progress Process
Each day of this semester the schedule has been followed. Project was proceeded
according to presented above managing tools and sometimes unexpected situations.
Issues and problems occurred and there were some delays in the project process. Due to
those obstacles the schedule was reconstructed in order to adapt to new situation.
8.4 Dealing with Problems
8.4.1 Overview
In the next paragraph, some of the main problems are presented. As a brief
summary of the problem, an “ad-hoc” solution is given, for the future development of the
device. According to confronted problems, project plans were reconstructed. Updated
managing tools are presented below “troubles section”.
8.4.2 Troubles Section
8.4.2.1 Misunderstanding – STK502
At the very beginning the project, programming was done using many different
components, which obviously took some time. As a great misunderstanding, work with
STK502 as an extension board for STK500 can be presented. The processor (Atmega Tiny
group) provided with the STK502 is a very uncomfortable to work with.
What is more, to work with the display on the board, additional IDE is required. It
is called IAR. It is not free software, only 30 days version is available for free. The way of
compiling the program in one IDE (IAR), and programming the device using different IDE
Structure and Management of the Project 105
GROUP 6 DISPLACEMENT MEASURING USING XYZ ACCELEROMETER SENSOR
(AVR Studio) is very inefficient and uncomfortable. The problem is a great amount of
time, which was wasted on adopting STK502 for project requirements.
8.4.2.2 Power
First of all, main issue was the power. The board was supplied with the external
12V power supply. By inbuilt resistors and capacitors, as well as, internal circuits’
conversion from 12V to 5V, required by microcontroller, was done on the board without
any interference. Problem occurred when working with accelerometer. It turned out, this
low power devices requires power supply at level of approximately 3V, no more than 3.3
V. The problem was solved by using LD1117 voltage regulator. Another power issue
occurred while attempting multiplexer to work with the division of the signals. It turned
out this analog device needs 10V of power. Unfortunately, this problem was not solved,
and it is left as a part of future work for next EPS teams.
8.4.2.3 Wires
In order to measure displacement of walls, we need to have long wires. The length
of wires my cause possible lost of data or errors in data transmission. In this section data
is understood as an analog signal. That means this signal can be not strong enough to
reach the destination without any change. Long wires are also a great opportunity for
signal distortion by magnetic interference or any other mean that can influence on the
signal. Solution might be to use the amplifier on the way of the signal to make it stronger,
and implement some additional capacitors to clear the signal and remove power noise.
This solution is also a part of future work, not implemented in the described prototype.
Structure and Management of the Project 106
GROUP 6 DISPLACEMENT MEASURING USING XYZ ACCELEROMETER SENSOR
8.4.2.4 Multiplexer(MUX)
At the beginning of the project the multiplexer was not included in the plans but
in the middle of the semester adding one was suggested to expand the functions of the
device. The challenge was accepted but the selection of the multiplexer took some time
and it also took some time to get it from the dealer. When it finally arrived the MUX was
soldered on a supplementary board and it was attached to the main board with the
display and the rest of components. The time was the main problem. Final date of the
project was on the horizon and there was not enough time to deal with other issues
previously included in the schedule. The second reason was the power issue mentioned in
one of the sections above. The solution might be to provide required power to the device
and program it or to use digital, low power MUX suitable to work with digital signals.
Digital MUX, as well as, digital accelerometers are already bought as a future extension of
the project.
8.4.2.5 Crystal
During the project development a decision to extend the requirements of PC
connection was done. It turns out that in order to establish a connection between PC and
evaluation board, using a RS232 serial protocol, adding an external crystal is required.
Because of lack of any useful tutorial or documentation provided by the producer hours
of useless research was done jus to find out how to make a microcontroller work with the
external crystal. The goal was achieved by changing the jumpers on the board and
reprogramming the fuses in the microcontroller. This step is considered as unexpected
trouble issue because of lack of any support in the field of using external crystals.
Structure and Management of the Project 107
GROUP 6 DISPLACEMENT MEASURING USING XYZ ACCELEROMETER SENSOR
8.4.2.6 Plan changes
All this issues and problems changed the distribution of time in the project and
finally a new GC to organize time was made. The next graphics reflects the status of the
project at the second Project Review and the final status after dealing with the problems
previously mentioned.
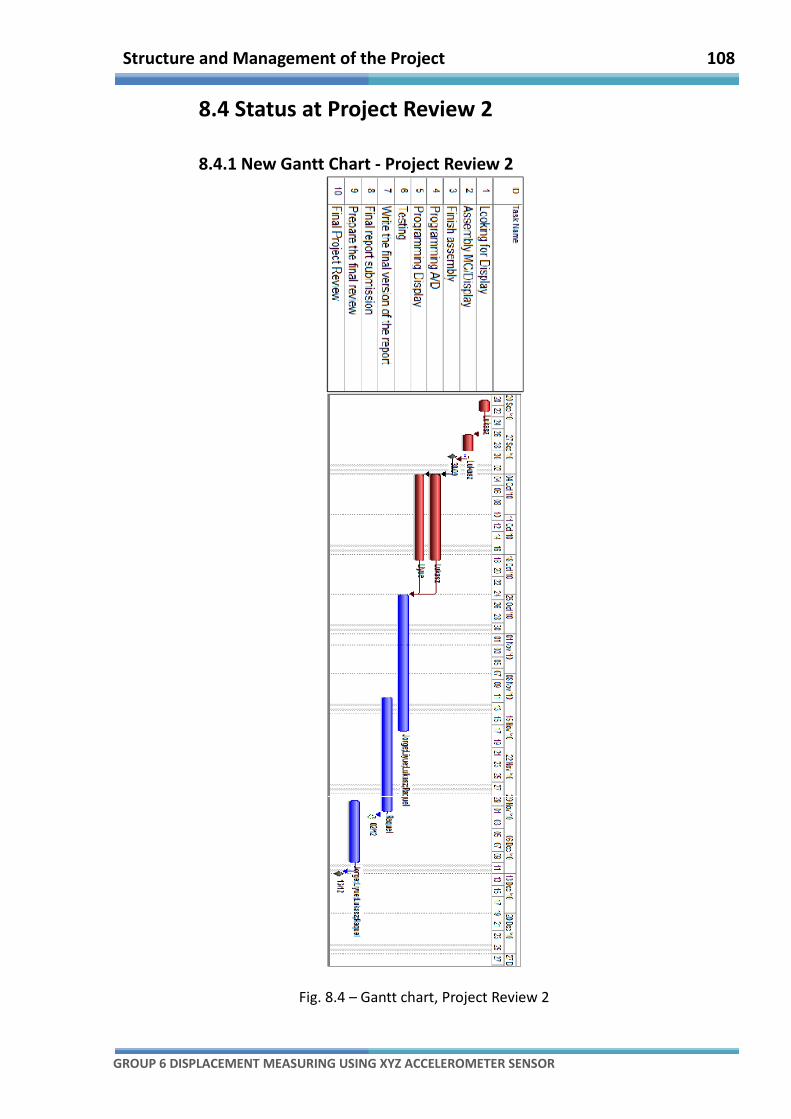
Structure and Management of the Project 108
GROUP 6 DISPLACEMENT MEASURING USING XYZ ACCELEROMETER SENSOR
8.4 Status at Project Review 2
8.4.1 New Gantt Chart - Project Review 2
Fig. 8.4 – Gantt chart, Project Review 2
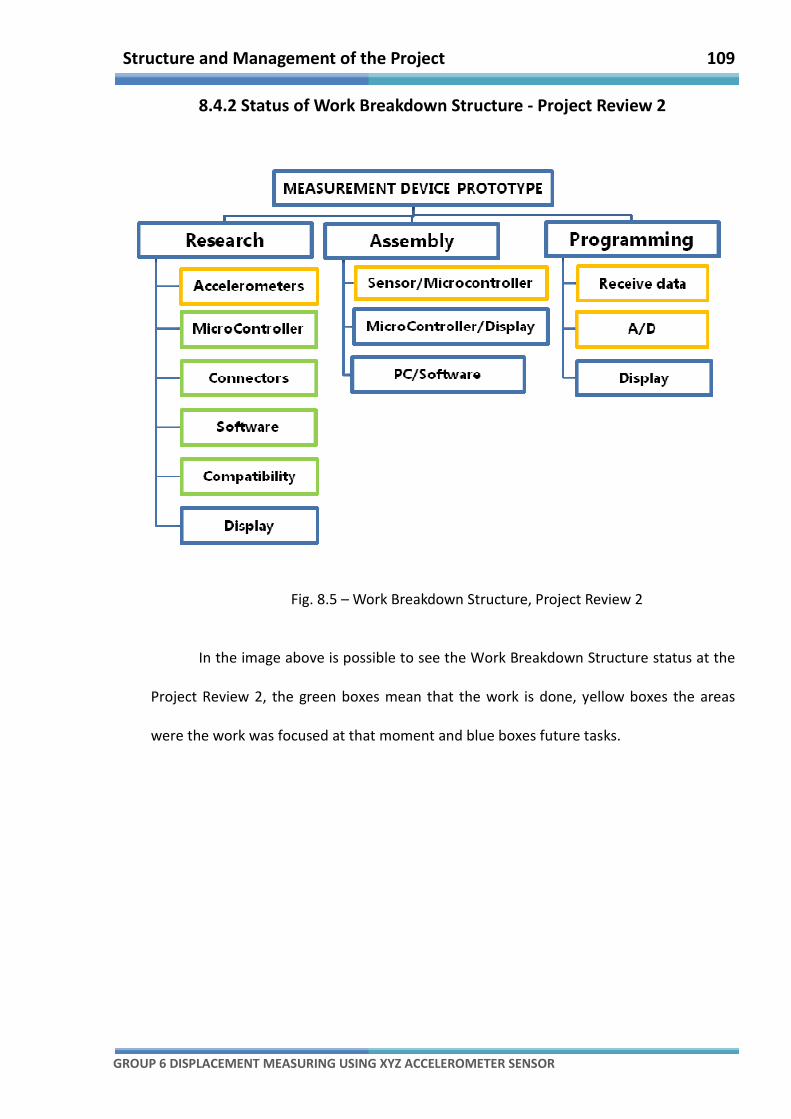
Structure and Management of the Project 109
GROUP 6 DISPLACEMENT MEASURING USING XYZ ACCELEROMETER SENSOR
8.4.2 Status of Work Breakdown Structure - Project Review 2
Fig. 8.5 – Work Breakdown Structure, Project Review 2
In the image above is possible to see the Work Breakdown Structure status at the
Project Review 2, the green boxes mean that the work is done, yellow boxes the areas
were the work was focused at that moment and blue boxes future tasks.
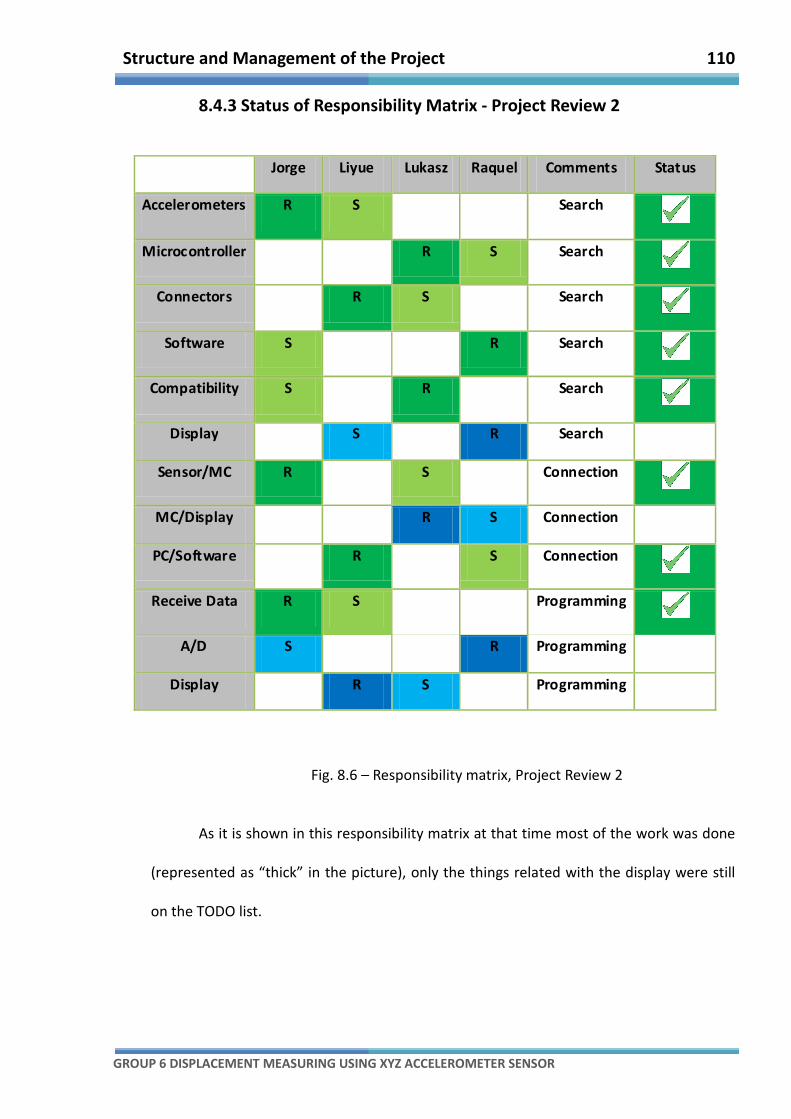
Structure and Management of the Project 110
GROUP 6 DISPLACEMENT MEASURING USING XYZ ACCELEROMETER SENSOR
8.4.3 Status of Responsibility Matrix - Project Review 2
Fig. 8.6 – Responsibility matrix, Project Review 2
As it is shown in this responsibility matrix at that time most of the work was done
(represented as “thick” in the picture), only the things related with the display were still
on the TODO list.
Jorge Liyue Lukasz Raquel Comments Status
Accelerometers R S Search
Microcontroller R S Search
Connectors R S Search
Software S R Search
Compatibility S R Search
Display S R Search
Sensor/MC R S Connection
MC/Display R S Connection
PC/Software R S Connection
Receive Data R S Programming
A/D S R Programming
Display R S Programming

111
GROUP 6 DISPLACEMENT MEASURING USING XYZ ACCELEROMETER SENSOR
Chapter 9
Future Work
Future Work 112
GROUP 6 DISPLACEMENT MEASURING USING XYZ ACCELEROMETER SENSOR
9.1 Overview
The goal of the project was to build a prototype of a measuring device. Behind
word prototype stand many unfinished issues, unsolved problems and even more new
paths for future development.
In this section, ideas for future work are presented. The main aim is to expand
functionality, create a fully portable device, provide the device with its own power source
and find the way to analyze and present the results of measurement in a easily, readable
way.
9.2 Memory Storage
The device is generating data all the time so adding additional memory storage
will be a good idea. That will allow creating data logs to check the variation of the values
in a period of time.
Memory storage will also allow moving with the data and using them in many
other devices.
9.3 Display
Current 2x16 display is good enough for described prototype. Troubles may occur
when working with many accelerometers, or displaying the results in more sophisticated
way than integer numbers. Then 2 lines with 16 characters each, is simply not enough
Future Work 113
GROUP 6 DISPLACEMENT MEASURING USING XYZ ACCELEROMETER SENSOR
space for possible amount of data to display. That is why, bigger graphical display might
be a good solution.
9.4 Wireless Communication
PC connection is done using RS232 serial protocol. A good idea might be to
support STK500 with wifi module and establish the wireless connection between PC (data
analyze and visualization station) and the measuring device.
9.5 External Power Unit
The device need a power supply to work properly but the nature and
characteristics of the product are mainly portable. That is why the addition power source
unit should be investigated.
9.6 MUX + Other Accelerometers
As it is described in the report, device should work with many accelerometers so
adding an MUX to the circuit might be a good choice.
Future Work 114
GROUP 6 DISPLACEMENT MEASURING USING XYZ ACCELEROMETER SENSOR
9.7 Noise Issues
It might be a good idea to make more experiments using laboratory tools as
oscilloscopes etc. in order to check the strength of the signal and support the device with
additional capacitors to reduce the noise and implement low pass filters with resistor-
capacitor components.

115
GROUP 6 DISPLACEMENT MEASURING USING XYZ ACCELEROMETER SENSOR
Chapter 10
Conclusion
Conclusion 116
GROUP 6 DISPLACEMENT MEASURING USING XYZ ACCELEROMETER SENSOR
There is a common misconception that measuring displacement using an
accelerometer is not possible or can lead to erroneous information. In reality,
accelerometers have long been used to measure displacement. Aim of the project was
not only to proof this statement but also to go one step further. Project work proves that
this kind of measuring device is suitable for wide range of measurements, and can be
easily adapt to a new job. In the report several solutions for crating the device and
implementing the algorithm were presented in order to show benefits of using
accelerometers to measure displacement.
The prototype of a device is done. Algorithm is implemented and all required
connections are done. Additional requirements are also fulfilled. However there are still
many possibilities to develop the device, software and algorithm. Recommendation is to
exceed the functionality of the device and to carry out basic experiments.

117
GROUP 6 DISPLACEMENT MEASURING USING XYZ ACCELEROMETER SENSOR
Chapter 11
References
References 118
GROUP 6 DISPLACEMENT MEASURING USING XYZ ACCELEROMETER SENSOR
[1]Hugh D. Young, Roger A. Freedman. University Physics Volume one, 9th
Edition.1996
[2] Alan Jeffrey. Essentials of engineering mathematics, 2nd
Edition. 2004
[3] Thomas L. Floyd. Electronics Fundamentals: Circuits, Devices and Applications.
7th
Edition.2007
[4] Jerry C. Whitaker. The electronics handbook. 2nd
Edition.2005
[5] Atmel Datasheet.
[6] EVAL-ADXL335Z Datasheet.
[7] ADXL335 Datasheet.
[8] ATmega16 Datasheet.
[9] LD1117 Data Sheet.
[10] ADXL345 Datasheet.
[11] Brian Barkley Graham. Using an Accelerometer Sensor to Measure Human
Hand Motion. MIT ,2000.
[12] http://www.arduino.cc [29/11/2010]
[13] http://www.atmel.com/dyn/products/tools_card.asp?tool_id=2725&sour-
ce=redirect
[14] http://en.wikipedia.org/wiki/Analog-to-digital_converter
[15] www.sparkfun.com/datasheets/Components/SMD/adxl335.pdf
[16] www.sparkfun.com/datasheets/Components/SMD/adxl335.pdf
[17] http://extremeelectronics.co.in/avr-tutorials/using-lcd-module-with-avrs/
[18] http://www.extremeelectronics.co.in/avrtutorials/download/lcd.zip
[19] http://en.wikipedia.org/wiki/RS-232

References 119
GROUP 6 DISPLACEMENT MEASURING USING XYZ ACCELEROMETER SENSOR
[20] http://extremeelectronics.co.in/avr-tutorials/using-the-usart-of-avr-
microcontrollers/
[21] http://extremeelectronics.co.in/avr-tutorials/using-the-usart-of-avr-
microcontrollers-reading-and-writing-data/
[22] http://extremeelectronics.co.in/avr-tutorials/rs232-communication-the-
basics/
[23] http://en.wikipedia.org/wiki/Baud
[24] http://extremeelectronics.co.in/avr-tutorials/avr-timers-an-introduction/
[25] http://www.sparkfun.com/datasheets/Components/SMD/adxl335.pdf
[26]http://irrlicht.sourceforge.net/
[27] http://en.wikipedia.org/wiki/Object-oriented_programming

120
GROUP 6 DISPLACEMENT MEASURING USING XYZ ACCELEROMETER SENSOR
Chapter 12
Glossary
Glossary 121
GROUP 6 DISPLACEMENT MEASURING USING XYZ ACCELEROMETER SENSOR
A ADC: Analog-to-digital Converter (Conversion). It is a device that converts a
continuous quantity to a discrete digital number. The conversion is also called ADC.
Analog data: An analog or analogue signal is any continuous signal for which the
time varying feature (variable) of the signal is a representation of some other time varying
quantity.
B Build: In the field of software, build refers either to the process of converting
source code files into standalone software artifact(s) that can be run on a computer, or
the result of doing so.
C CMOS: Complementary metal-oxide-semiconductor. It is a technology for
constructing integrated circuits.
Compiler: It is a computer program (or set of programs) that translates source
code written in a computer language into another computer language (the target
language). This procedure is called “compile”.
CPU: Central Processing Unit. It is the part of an informatics system which realizes
the instructions for a program.
D Debug: Debugging is a methodical process of finding and reducing the number of
bugs, or defects, in a computer program or a piece of electronic hardware, thus making it
behave as expected.
Digital data: In the report it mainly refers to discrete-time signals that have a
discrete number of levels, for example a sampled and quantified analog signal.

Glossary 122
GROUP 6 DISPLACEMENT MEASURING USING XYZ ACCELEROMETER SENSOR
E EEPROM: Electrically Erasable Programmable Read-Only Memory. It is a type of
non-volatile memory.
Embedded: In computers, an Embedded system is a special-purpose system in
which the computer is completely encapsulated by the device it controls.
G GCC: The GNU Compiler Collection. It is a compiler system produced by the GNU
Project supporting various programming languages.
I I2C: Inter-Integrated Circuit. It is a serial bus used to connect low-speed
peripherals to a motherboard.
IDE: Integrated Development Environment. It is also known as integrated design
environment or integrated debugging environment and is a software application that
provides comprehensive facilities to computer programmers for software development.
L LCD: Liquid Crystal Display. It is an electronic visual display which does not emit
light directly.
M MIPS: Microprocessor without Interlocked Pipeline Stages. It is the
microcontroller’s family which use reduced RISC and it is developed by MIPS Computer
Systems.
P PWM: Pulse-Width Modulation. It is a technique for controlling power to inertial
electrical devices.
R RAM: Random-Access Memory. It is one of the forms to store computer data.
Glossary 123
GROUP 6 DISPLACEMENT MEASURING USING XYZ ACCELEROMETER SENSOR
RISC: Reduced Instruction Set Computing. It is a design strategy which uses
simple instructions to reduce the runtime.
ROHS: Restriction of Hazardous Substances Directive.
RS-232: Recommended Standard 232. In telecommunications, RS-232 is a
standard for serial binary single-ended data and control signals connecting between a DTE
(Data Terminal Equipment) and a DCE (Data Circuit-terminating Equipment). It is
commonly used in computer serial ports.
S SCSI: Small Computer System Interface. It is a standard interface to transfer data
between different devices using the computer’s bus.
SPI: Serial Peripheral Interface Bus. It is a synchronous serial data link standard.
U USART: Universal Synchronously/Asynchronous Receiver/Transmitter. It is a
computer hardware that translates data between parallel and serial forms.
V VCC: Common-collector voltage.

124
GROUP 6 DISPLACEMENT MEASURING USING XYZ ACCELEROMETER SENSOR
Chapter 13
Appendix
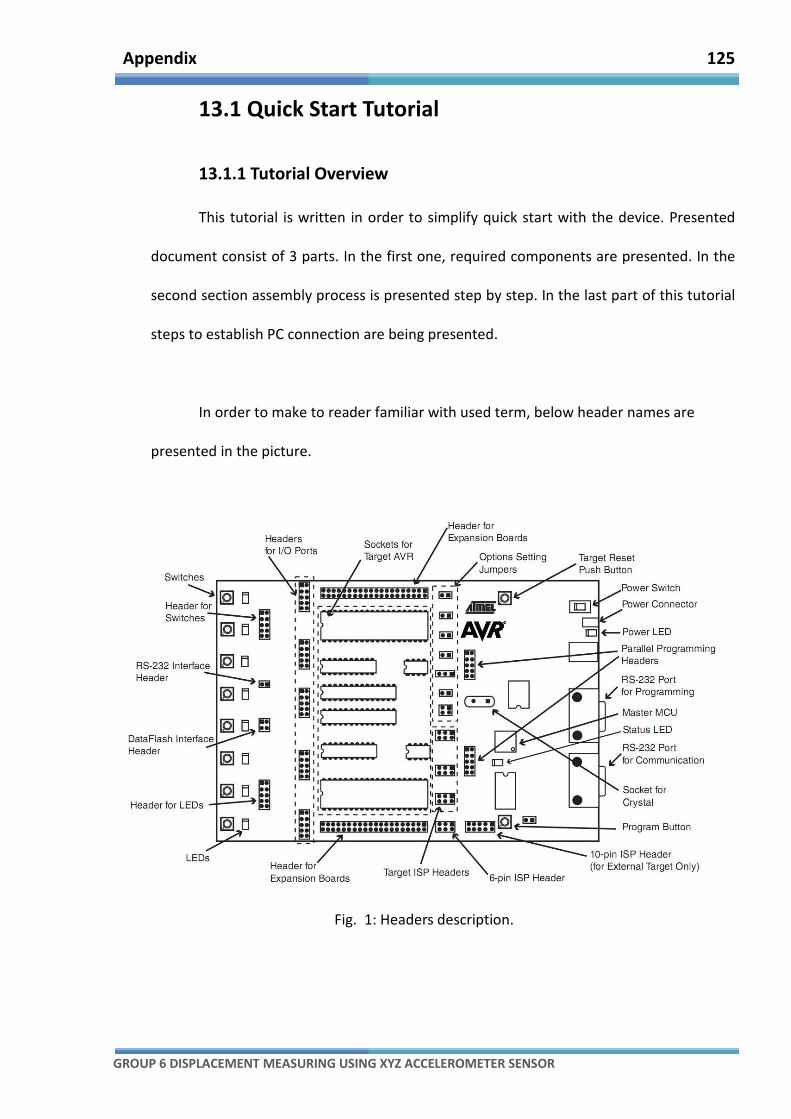
Appendix 125
GROUP 6 DISPLACEMENT MEASURING USING XYZ ACCELEROMETER SENSOR
13.1 Quick Start Tutorial
13.1.1 Tutorial Overview
This tutorial is written in order to simplify quick start with the device. Presented
document consist of 3 parts. In the first one, required components are presented. In the
second section assembly process is presented step by step. In the last part of this tutorial
steps to establish PC connection are being presented.
In order to make to reader familiar with used term, below header names are
presented in the picture.
Fig. 1: Headers description.
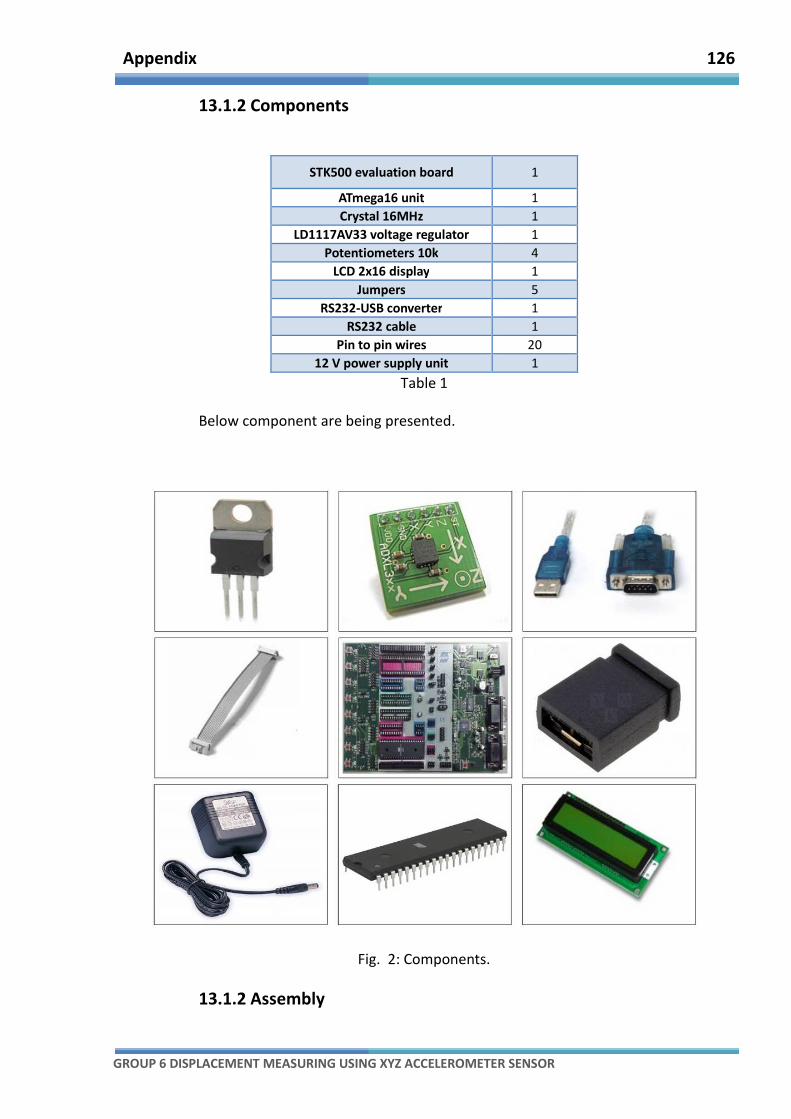
Appendix 126
GROUP 6 DISPLACEMENT MEASURING USING XYZ ACCELEROMETER SENSOR
13.1.2 Components
STK500 evaluation board 1
ATmega16 unit 1
Crystal 16MHz 1
LD1117AV33 voltage regulator 1
Potentiometers 10k 4
LCD 2x16 display 1
Jumpers 5
RS232-USB converter 1
RS232 cable 1
Pin to pin wires 20
12 V power supply unit 1
Table 1
Below component are being presented.
Fig. 2: Components.
13.1.2 Assembly

Appendix
GROUP 6 DISPLACEMENT MEASURING USING XYZ ACCELEROMETER SENSOR
This section is written using step by step method. In order to construct the
hardware layer correctly follow the steps in given order, not jumping between them.
1. Prepare the
STK500 evaluation board. In
order to prepare the board
make sure the power unit is
disconnected. Then set up
the jumpers as presented in
the picture. This is default
jumpers setting.
2. Plug in the
ATmega16 in the Target AVR
socket.
3. Connect ISP
mode(programming mode),
as it is shown on the picture
above(Figure 4).
DISPLACEMENT MEASURING USING XYZ ACCELEROMETER SENSOR
This section is written using step by step method. In order to construct the
hardware layer correctly follow the steps in given order, not jumping between them.
e the
STK500 evaluation board. In
order to prepare the board
make sure the power unit is
disconnected. Then set up
the jumpers as presented in
the picture. This is default
Fig 3:Default jumpers
Plug in the
ATmega16 in the Target AVR
Fig 4:STK500 -
Connect ISP
mode(programming mode),
as it is shown on the picture
127
This section is written using step by step method. In order to construct the
hardware layer correctly follow the steps in given order, not jumping between them.
:Default jumpers.
- ISP mode.
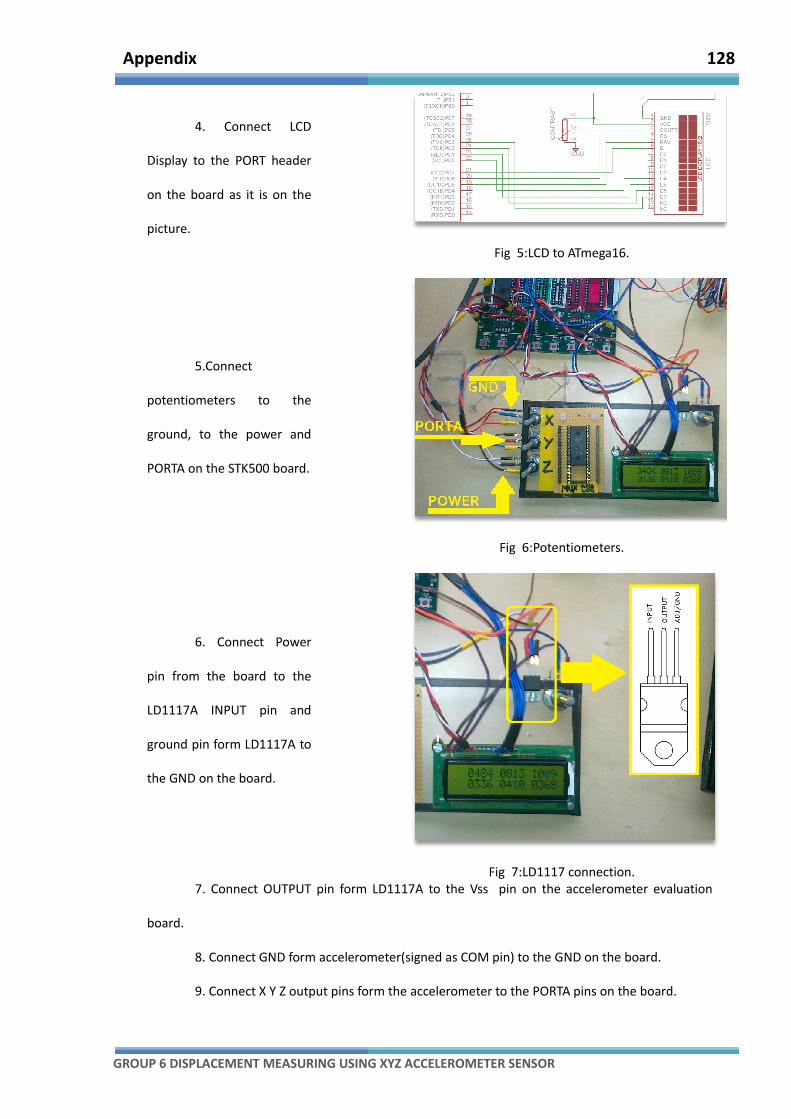
Appendix
GROUP 6 DISPLACEMENT MEASURING USING XYZ ACCELEROMETER SENSOR
4. Connect LCD
Display to the PORT header
on the board as it is on the
picture.
5.Connect
potentiometers to the
ground, to the power and
PORTA on the STK500 board.
6. Connect Power
pin from the board to the
LD1117A INPUT pin and
ground pin form LD1117A to
the GND on the board.
7. Connect OUTPUT pin form LD1117A to the Vss pin on the accelerometer evaluation
board.
8. Connect GND form accelerometer(signed as COM pin) to the GND on the board.
9. Connect X Y Z output pins form the accelerometer to the PORTA pins on the board.
DISPLACEMENT MEASURING USING XYZ ACCELEROMETER SENSOR
Connect LCD
Display to the PORT header
on the board as it is on the
Fig 5:LCD to ATmega16
potentiometers to the
ground, to the power and
PORTA on the STK500 board.
Fig 6:Potentiometers
Connect Power
pin from the board to the
n and
ground pin form LD1117A to
Fig 7:LD1117 connection
Connect OUTPUT pin form LD1117A to the Vss pin on the accelerometer evaluation
Connect GND form accelerometer(signed as COM pin) to the GND on the board.
X Y Z output pins form the accelerometer to the PORTA pins on the board.
128
:LCD to ATmega16.
:Potentiometers.
:LD1117 connection.
Connect OUTPUT pin form LD1117A to the Vss pin on the accelerometer evaluation
Connect GND form accelerometer(signed as COM pin) to the GND on the board.
X Y Z output pins form the accelerometer to the PORTA pins on the board.
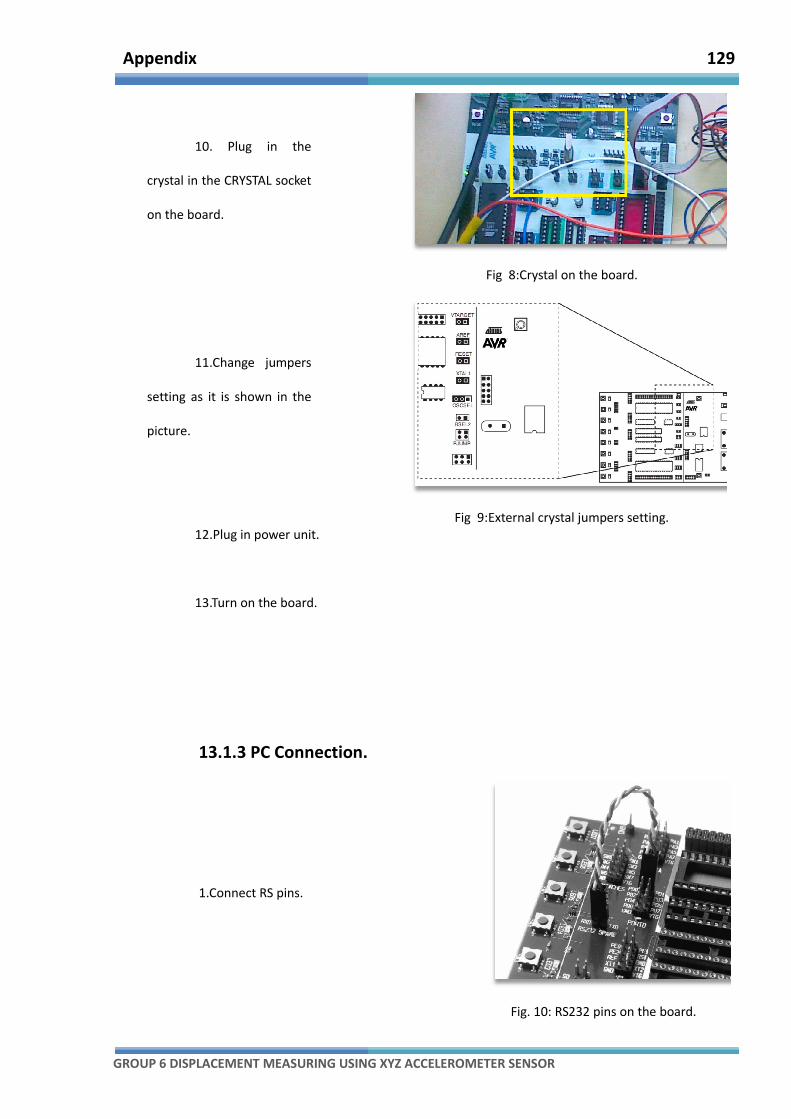
Appendix
GROUP 6 DISPLACEMENT MEASURING USING XYZ ACCELEROMETER SENSOR
10. Plug in the
crystal in the CRYSTAL socket
on the board.
11.Change jumpers
setting as it is shown in the
picture.
12.Plug in power unit.
13.Turn on the board.
13.1.3 PC Connection.
1.Connect RS pins
DISPLACEMENT MEASURING USING XYZ ACCELEROMETER SENSOR
Plug in the
crystal in the CRYSTAL socket
Fig 8:Crystal on the board
11.Change jumpers
setting as it is shown in the
Fig 9:External crystal jumpers setting
12.Plug in power unit.
13.Turn on the board.
onnection.
1.Connect RS pins.
Fig. 10: RS232 pins on the board
129
:Crystal on the board.
:External crystal jumpers setting.
: RS232 pins on the board.

Appendix
GROUP 6 DISPLACEMENT MEASURING USING XYZ ACCELEROMETER SENSOR
2.Change connect rs232 spare
port to PC.
DISPLACEMENT MEASURING USING XYZ ACCELEROMETER SENSOR
2.Change connect rs232 spare
Fig. 11: RS232 Spare port
130
: RS232 Spare port
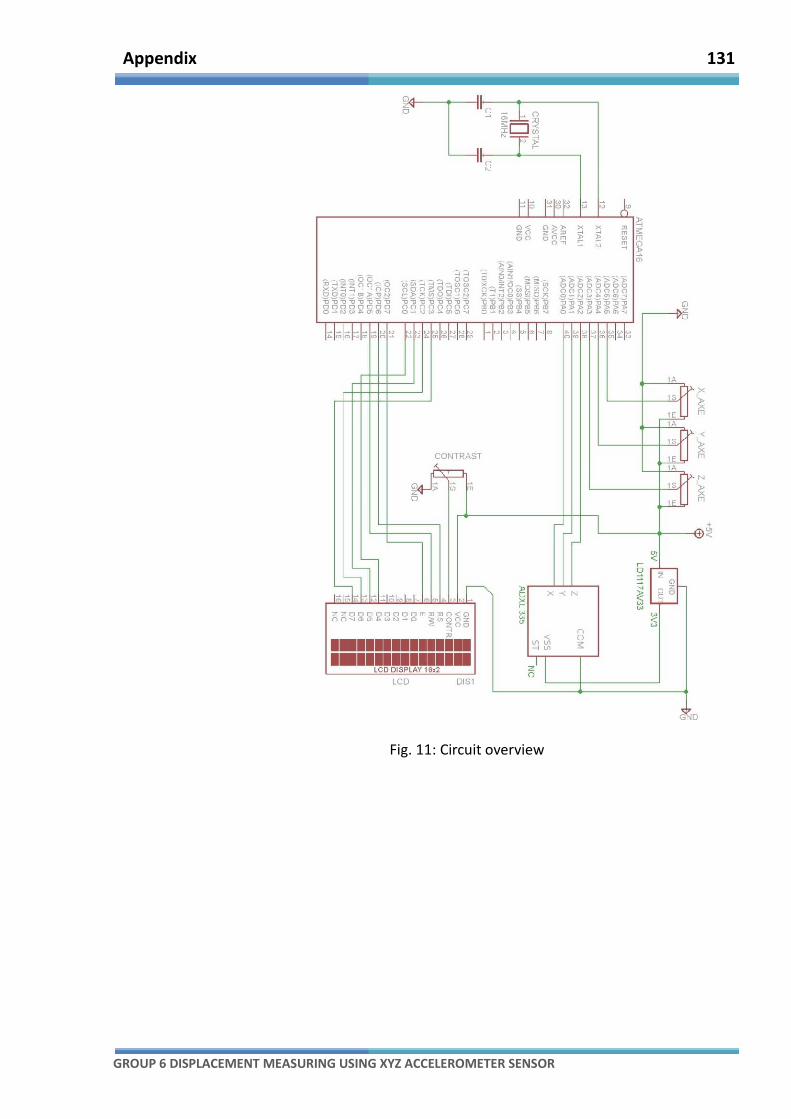
Appendix 131
GROUP 6 DISPLACEMENT MEASURING USING XYZ ACCELEROMETER SENSOR
Fig. 11: Circuit overview
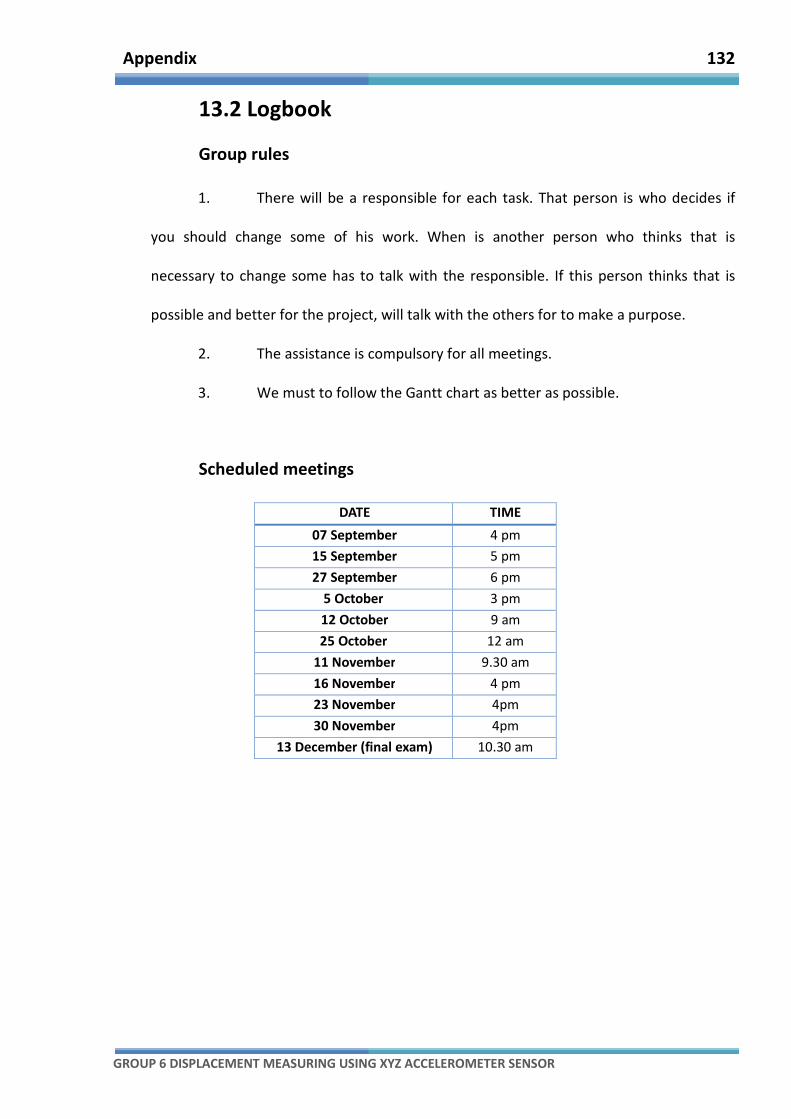
Appendix 132
GROUP 6 DISPLACEMENT MEASURING USING XYZ ACCELEROMETER SENSOR
13.2 Logbook
Group rules
1. There will be a responsible for each task. That person is who decides if
you should change some of his work. When is another person who thinks that is
necessary to change some has to talk with the responsible. If this person thinks that is
possible and better for the project, will talk with the others for to make a purpose.
2. The assistance is compulsory for all meetings.
3. We must to follow the Gantt chart as better as possible.
Scheduled meetings
DATE TIME
07 September 4 pm
15 September 5 pm
27 September 6 pm
5 October 3 pm
12 October 9 am
25 October 12 am
11 November 9.30 am
16 November 4 pm
23 November 4pm
30 November 4pm
13 December (final exam) 10.30 am

Appendix 133
GROUP 6 DISPLACEMENT MEASURING USING XYZ ACCELEROMETER SENSOR
Work
30th August- 5th September
• Introduction meeting
• Education background
• Skills
• Previous projects
• Overview on the project
6th September – 12th September
• Idea for the project
• Research for the tools
• Accelerometer Theory
• Similar Project review
13th September – 19th September
• Documentation study
• Electronic elements study
• Connections between PC and board
• Programming LEDs
• Preparing presentation
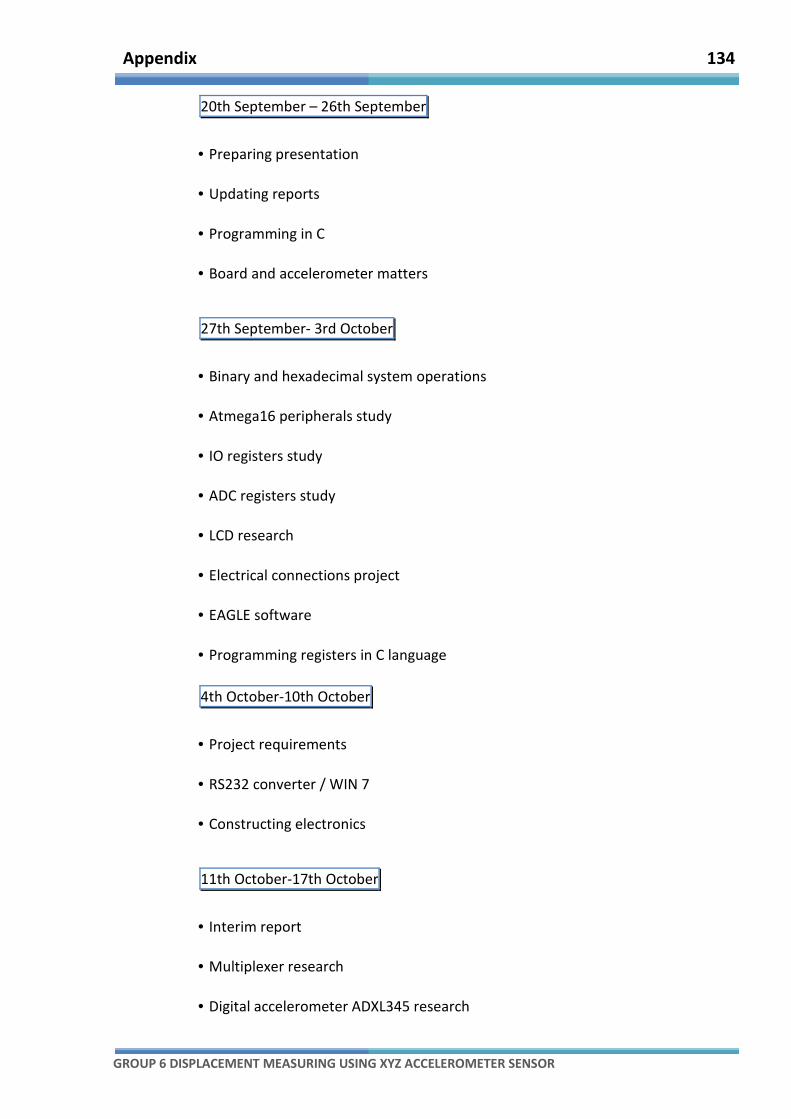
Appendix 134
GROUP 6 DISPLACEMENT MEASURING USING XYZ ACCELEROMETER SENSOR
20th September – 26th September
• Preparing presentation
• Updating reports
• Programming in C
• Board and accelerometer matters
27th September- 3rd October
• Binary and hexadecimal system operations
• Atmega16 peripherals study
• IO registers study
• ADC registers study
• LCD research
• Electrical connections project
• EAGLE software
• Programming registers in C language
4th October-10th October
• Project requirements
• RS232 converter / WIN 7
• Constructing electronics
11th October-17th October
• Interim report
• Multiplexer research
• Digital accelerometer ADXL345 research
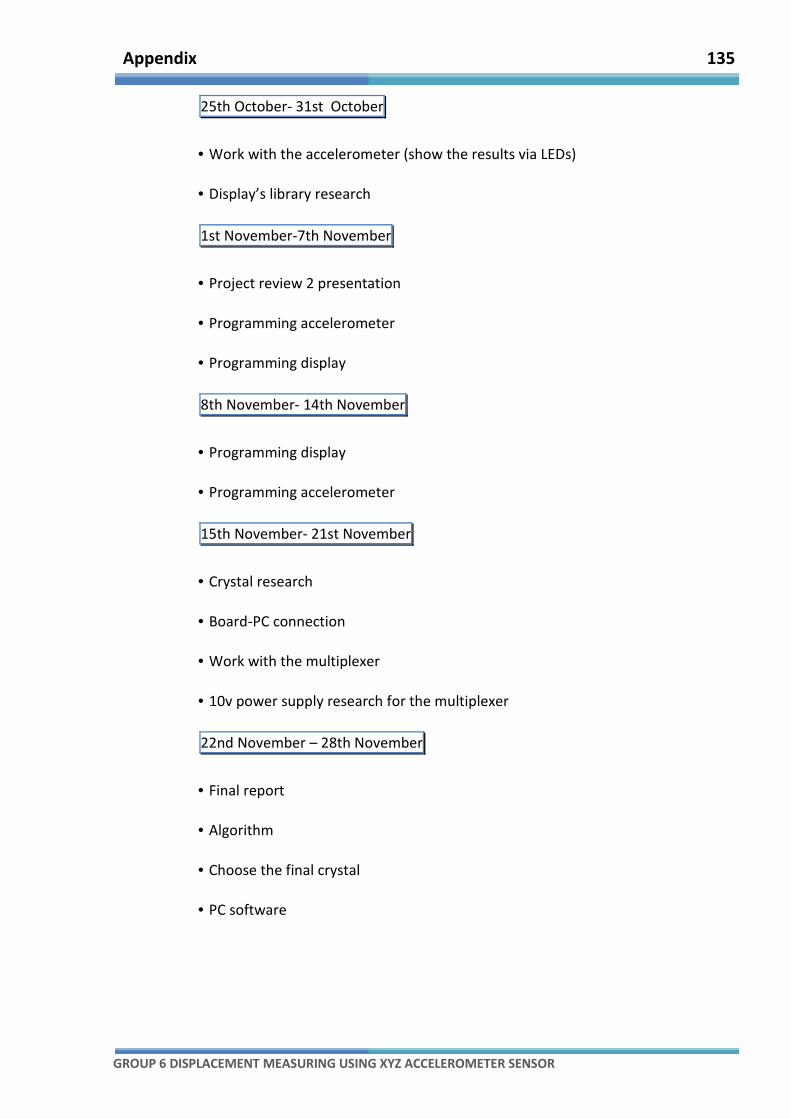
Appendix 135
GROUP 6 DISPLACEMENT MEASURING USING XYZ ACCELEROMETER SENSOR
25th October- 31st October
• Work with the accelerometer (show the results via LEDs)
• Display’s library research
1st November-7th November
• Project review 2 presentation
• Programming accelerometer
• Programming display
8th November- 14th November
• Programming display
• Programming accelerometer
15th November- 21st November
• Crystal research
• Board-PC connection
• Work with the multiplexer
• 10v power supply research for the multiplexer
22nd November – 28th November
• Final report
• Algorithm
• Choose the final crystal
• PC software
Appendix 136
GROUP 6 DISPLACEMENT MEASURING USING XYZ ACCELEROMETER SENSOR
29th November- 5th December
• Final report
• Algorithm
• PC software