Dynamic Numerical Analysis of Displacement Restraining ...
15
applied sciences Article Dynamic Numerical Analysis of Displacement Restraining Effect of Inclined Earth-Retaining Structure during Embankment Construction Su-Won Son , Minsu Seo *, Jong-Chul Im and Jae-Won Yoo Department of Civil Engineering, Pusan National University, Busan 46241, Korea; fi[email protected] (S.-W.S.); [email protected] (J.-C.I.); [email protected] (J.-W.Y.) * Correspondence: [email protected]; Tel.: +82-51-510-1543 Received: 18 April 2019; Accepted: 27 May 2019; Published: 29 May 2019 Abstract: Retaining walls are generally used for temporary installations during the excavation process of a construction project. They are also utilized to construct embankments in order to extend a railway facility. In this case, a retaining wall is installed during the construction process and contributes to the resistance of large amounts of stress, including the railway load. However, it is generally difficult to retain walls to maintain their stability. Therefore, alternative construction methods, such as the use of an inclined earth-retaining wall, have been utilized to suppress the lateral displacement. The stability is verified in advance through field tests; however, the maximum stress acting on the railway is thought to be the concentrated railway load. In this study, a two-dimensional numerical analysis was conducted by changing the railway load to a dynamic load. The analysis was applied according to the number of H-piles of the same length (10 m) when only the front wall was installed and when a back support was also applied. It was determined that the lateral displacement of the latter case is smaller than that of the former, whereas the resistance to dynamic loading of the former case is greater. Keywords: inclined earth retaining; dynamic numerical analysis; earth pressure; embankment construction; back support 1. Introduction Because the facilities installed during a construction project are usually temporary, when applying an earth retaining method for the ground excavation in an urban setting, a stability analysis is generally conducted using the earth pressure and without considering the stability under a cyclic load or earthquake event. However, even when such a retaining method is applied, there may be special circumstances in which the structure is maintained for longer than the normal two-month period (the standard in the Korea [1]). However, investigations into the stability under cyclic loading or earthquake events have typically been simplified or even omitted. The occurrence of earthquakes has recently increased worldwide with the increased activity of the seismic belt. Consequently, the development of stable earth retaining walls is becoming increasingly important. In addition, unlike static loads, the behavior of the ground differs under dynamic load conditions such as cyclic loading. In recent years, the change of earth pressure or earth pressure coefficient have been studied mainly through laboratory model tests or numerical analysis of the grounds with retaining walls or earth retaining walls [2–6]. A few studies have been conducted to assess the deformation of structures caused by dynamic loads such as railway loads. Therefore, dynamic behavioral analyses are required for cyclic railway loading. Figure 1 shows a diagram outlining an earth retaining wall used to improve the stability through the installation of stabilizing piles (hereinafter referred to as the “back support”) at an angle and Appl. Sci. 2019, 9, 2213; doi:10.3390/app9112213 www.mdpi.com/journal/applsci
-
Upload
khangminh22 -
Category
Documents
-
view
0 -
download
0
Transcript of Dynamic Numerical Analysis of Displacement Restraining ...

applied sciences
Article
Dynamic Numerical Analysis of DisplacementRestraining Effect of Inclined Earth-RetainingStructure during Embankment Construction
Su-Won Son , Minsu Seo *, Jong-Chul Im and Jae-Won Yoo
Department of Civil Engineering, Pusan National University, Busan 46241, Korea;[email protected] (S.-W.S.); [email protected] (J.-C.I.); [email protected] (J.-W.Y.)* Correspondence: [email protected]; Tel.: +82-51-510-1543
Received: 18 April 2019; Accepted: 27 May 2019; Published: 29 May 2019�����������������
Abstract: Retaining walls are generally used for temporary installations during the excavation processof a construction project. They are also utilized to construct embankments in order to extend a railwayfacility. In this case, a retaining wall is installed during the construction process and contributes to theresistance of large amounts of stress, including the railway load. However, it is generally difficult toretain walls to maintain their stability. Therefore, alternative construction methods, such as the use ofan inclined earth-retaining wall, have been utilized to suppress the lateral displacement. The stabilityis verified in advance through field tests; however, the maximum stress acting on the railway isthought to be the concentrated railway load. In this study, a two-dimensional numerical analysis wasconducted by changing the railway load to a dynamic load. The analysis was applied according to thenumber of H-piles of the same length (10 m) when only the front wall was installed and when a backsupport was also applied. It was determined that the lateral displacement of the latter case is smallerthan that of the former, whereas the resistance to dynamic loading of the former case is greater.
Keywords: inclined earth retaining; dynamic numerical analysis; earth pressure; embankmentconstruction; back support
1. Introduction
Because the facilities installed during a construction project are usually temporary, when applyingan earth retaining method for the ground excavation in an urban setting, a stability analysis is generallyconducted using the earth pressure and without considering the stability under a cyclic load orearthquake event. However, even when such a retaining method is applied, there may be specialcircumstances in which the structure is maintained for longer than the normal two-month period(the standard in the Korea [1]). However, investigations into the stability under cyclic loading orearthquake events have typically been simplified or even omitted.
The occurrence of earthquakes has recently increased worldwide with the increased activity of theseismic belt. Consequently, the development of stable earth retaining walls is becoming increasinglyimportant. In addition, unlike static loads, the behavior of the ground differs under dynamic loadconditions such as cyclic loading. In recent years, the change of earth pressure or earth pressurecoefficient have been studied mainly through laboratory model tests or numerical analysis of thegrounds with retaining walls or earth retaining walls [2–6]. A few studies have been conductedto assess the deformation of structures caused by dynamic loads such as railway loads. Therefore,dynamic behavioral analyses are required for cyclic railway loading.
Figure 1 shows a diagram outlining an earth retaining wall used to improve the stability throughthe installation of stabilizing piles (hereinafter referred to as the “back support”) at an angle and
Appl. Sci. 2019, 9, 2213; doi:10.3390/app9112213 www.mdpi.com/journal/applsci

Appl. Sci. 2019, 9, 2213 2 of 15
connecting them to the front wall (hereinafter referred to as the “front support”). This is called aninclined earth retaining (IER) method.
Appl. Sci. 2019, 9, x FOR PEER REVIEW 2 of 15
Figure 1 shows a diagram outlining an earth retaining wall used to improve the stability through the installation of stabilizing piles (hereinafter referred to as the “back support”) at an angle and connecting them to the front wall (hereinafter referred to as the “front support”). This is called an inclined earth retaining (IER) method.
Figure 1. Basic structure of the IER (inclined earth retaining) method.
An IER structure increases the stability by preventing the earth pressure from acting on the front wall as a result of the connection between the front and back supports. The stability of an IER structure was confirmed through laboratory model tests and field experiments. First, prior to the laboratory model experiments, an IER model was installed in a plane strain model box placed in ground consisting of sand or clay. The lateral displacement according to the installed back support was then analyzed. The decrease in lateral displacement for the case in which the back support was placed in sandy ground was only 8% compared to the case without a back support [7]. When placed in clay however, the lateral displacement decreased by 68% when the back support was installed [8]. Therefore, the lateral displacement is suppressed from the combination of inclined front and back supports, which is a feature of an IER structure. Based on an analysis of the stability and field applicability, as well as field experiments and laboratory tests of the soil deformation in clay ground, it was confirmed that the spacing between the front and back supports is important [9]. However, such studies did not analyze the dynamic stability required in the field where structures are maintained for a considerably long period, including embankment construction for a double line high-speed railway or rockslide prevention during the installation of a retaining wall (Figure 2).
In this study, the displacement restraining effect of the IER method applied to embankment construction was analyzed by considering the ground and analysis conditions used by Seo et al. [10] under dynamic loading. In addition, a two-dimensional (2D) dynamic numerical analysis was conducted. By analyzing the lateral and vertical displacements, the effect of the presence or absence of the back support was compared and the displacement restraining effect was investigated for the same H-pile per length.
Figure 1. Basic structure of the IER (inclined earth retaining) method.
An IER structure increases the stability by preventing the earth pressure from acting on thefront wall as a result of the connection between the front and back supports. The stability of an IERstructure was confirmed through laboratory model tests and field experiments. First, prior to thelaboratory model experiments, an IER model was installed in a plane strain model box placed inground consisting of sand or clay. The lateral displacement according to the installed back support wasthen analyzed. The decrease in lateral displacement for the case in which the back support was placedin sandy ground was only 8% compared to the case without a back support [7]. When placed in clayhowever, the lateral displacement decreased by 68% when the back support was installed [8]. Therefore,the lateral displacement is suppressed from the combination of inclined front and back supports,which is a feature of an IER structure. Based on an analysis of the stability and field applicability, as wellas field experiments and laboratory tests of the soil deformation in clay ground, it was confirmed thatthe spacing between the front and back supports is important [9]. However, such studies did notanalyze the dynamic stability required in the field where structures are maintained for a considerablylong period, including embankment construction for a double line high-speed railway or rockslideprevention during the installation of a retaining wall (Figure 2).
In this study, the displacement restraining effect of the IER method applied to embankmentconstruction was analyzed by considering the ground and analysis conditions used by Seo et al. [10]under dynamic loading. In addition, a two-dimensional (2D) dynamic numerical analysis wasconducted. By analyzing the lateral and vertical displacements, the effect of the presence or absence ofthe back support was compared and the displacement restraining effect was investigated for the sameH-pile per length.

Appl. Sci. 2019, 9, 2213 3 of 15
Appl. Sci. 2019, 9, x FOR PEER REVIEW 3 of 15
Figure 2. Construction method applied for double-track railway.
2. Restraining Effect of Lateral Displacement of Inclined Earth Retaining (IER) Structure During Field Embankment Experiment
Seo et al. [10] conducted field experiments and a numerical analysis to analyze the restraining effect of the lateral displacement of the back support when IER is utilized for embankment construction. Figure 3 shows the IER utilized during the field embankment experiments. Figure 3(a) shows the constructed IER structure, whereas Figure 3(b) shows the final state with the completed backfill embankment. Table 1 summarizes the results of the field experiments on the lateral displacement after completion of the embankment. It was determined that the lateral displacement can be reduced by up to 22% when the back supports are installed, compared to a case without using back supports. In addition, the higher the height is from the bottom of the embankment, the greater the efficiency. Moreover, based on a numerical analysis, the lateral displacement for various cases with a back support was less than that of cases in which the same number of H-piles per unit length was applied to the front wall. As a result, it was confirmed that the lateral displacement can be significantly restrained with the installation of a back support (see Table 2).
(a)
Figure 2. Construction method applied for double-track railway.
2. Restraining Effect of Lateral Displacement of Inclined Earth Retaining (IER) Structure DuringField Embankment Experiment
Seo et al. [10] conducted field experiments and a numerical analysis to analyze the restrainingeffect of the lateral displacement of the back support when IER is utilized for embankment construction.Figure 3 shows the IER utilized during the field embankment experiments. Figure 3a shows theconstructed IER structure, whereas Figure 3b shows the final state with the completed backfillembankment. Table 1 summarizes the results of the field experiments on the lateral displacement aftercompletion of the embankment. It was determined that the lateral displacement can be reduced byup to 22% when the back supports are installed, compared to a case without using back supports.In addition, the higher the height is from the bottom of the embankment, the greater the efficiency.Moreover, based on a numerical analysis, the lateral displacement for various cases with a back supportwas less than that of cases in which the same number of H-piles per unit length was applied to thefront wall. As a result, it was confirmed that the lateral displacement can be significantly restrainedwith the installation of a back support (see Table 2).
Appl. Sci. 2019, 9, x FOR PEER REVIEW 3 of 15
Figure 2. Construction method applied for double-track railway.
2. Restraining Effect of Lateral Displacement of Inclined Earth Retaining (IER) Structure During Field Embankment Experiment
Seo et al. [10] conducted field experiments and a numerical analysis to analyze the restraining effect of the lateral displacement of the back support when IER is utilized for embankment construction. Figure 3 shows the IER utilized during the field embankment experiments. Figure 3(a) shows the constructed IER structure, whereas Figure 3(b) shows the final state with the completed backfill embankment. Table 1 summarizes the results of the field experiments on the lateral displacement after completion of the embankment. It was determined that the lateral displacement can be reduced by up to 22% when the back supports are installed, compared to a case without using back supports. In addition, the higher the height is from the bottom of the embankment, the greater the efficiency. Moreover, based on a numerical analysis, the lateral displacement for various cases with a back support was less than that of cases in which the same number of H-piles per unit length was applied to the front wall. As a result, it was confirmed that the lateral displacement can be significantly restrained with the installation of a back support (see Table 2).
(a)
Figure 3. Cont.

Appl. Sci. 2019, 9, 2213 4 of 15
Appl. Sci. 2019, 9, x FOR PEER REVIEW 4 of 15
(b)
Figure 3. Field test: (a) IER structure and (b) completion of surcharge load.
Table 1. Lateral displacement and lateral displacement ratio after completion of embankment [10].
Displacement
Measurement Location
Lateral Displacement (mm) Lateral Displacement Ratio Single
Support Double Support Double/Single Support
Height from bottom of embankment (m)
4.5 79.1 61.60 0.78 4.0 70.0 56.40 0.81 3.0 57.1 45.20 0.79 2.0 42.8 35.90 0.84 1.0 29.4 25.30 0.86
Table 2. Lateral displacement from a surcharge based on numerical analysis [10].
No. Case Name * Maximum Lateral Displacement from
Surcharge ∆u (mm) Number of H-piles Per
10 m 1 D-F2-B2-10 7.11 10 2 S-F2-5 Failure 5 3 S-F1-10 17.99 10 4 D-F4-B4-5 13.06 5 5 D-F4-B2-7.5 9.83 7.5 6 D-F2-B1-15 5.4 15
* Description of case names: S(Single support)-F(Front support)2(Interval of front support(m))-(Number of H-piles per 10 m), D(Dual support)-F(Front support)2(Interval of front support(m))-B(Back support)2(Interval of back support(m))-10(Number of H-piles per 10 m).
3. Two-Dimension Dynamic Numerical Analysis
PLAXIS (ver. 2018, PLAXIS, Delft, Netherlands) [11] was used for the 2D dynamic numerical analysis. For the analysis site, the earth retaining method was applied for a high-speed double-line railway line through an embankment. An embankment generally uses a retaining wall structure, for which many static and dynamic studies are currently being conducted. Although a retaining wall is structurally different from an IER structure, many studies have been carried out on a dynamic numerical analysis of an embankment ground. In particular, among the retaining wall structures, a
Figure 3. Field test: (a) IER structure and (b) completion of surcharge load.
Table 1. Lateral displacement and lateral displacement ratio after completion of embankment [10].
Measurement Location
Displacement Lateral Displacement (mm) Lateral Displacement Ratio
Single Support Double Support Double/Single Support
Height from bottom ofembankment (m)
4.5 79.1 61.60 0.784.0 70.0 56.40 0.813.0 57.1 45.20 0.792.0 42.8 35.90 0.841.0 29.4 25.30 0.86
Table 2. Lateral displacement from a surcharge based on numerical analysis [10].
No. Case Name * Maximum Lateral Displacementfrom Surcharge ∆u (mm)
Number of H-pilesPer 10 m
1 D-F2-B2-10 7.11 102 S-F2-5 Failure 53 S-F1-10 17.99 104 D-F4-B4-5 13.06 55 D-F4-B2-7.5 9.83 7.56 D-F2-B1-15 5.4 15
* Description of case names: S(Single support)-F(Front support)2(Interval of front support(m))-(Number of H-pilesper 10 m), D(Dual support)-F(Front support)2(Interval of front support(m))-B(Back support)2(Interval of backsupport(m))-10(Number of H-piles per 10 m).
3. Two-Dimension Dynamic Numerical Analysis
PLAXIS (ver. 2018, PLAXIS, Delft, Netherlands) [11] was used for the 2D dynamic numericalanalysis. For the analysis site, the earth retaining method was applied for a high-speed double-linerailway line through an embankment. An embankment generally uses a retaining wall structure,for which many static and dynamic studies are currently being conducted. Although a retaining wallis structurally different from an IER structure, many studies have been carried out on a dynamicnumerical analysis of an embankment ground. In particular, among the retaining wall structures,a reinforced earth retaining wall reduces the load acting on the front wall by increasing the strengthof the embankment ground using a grid. To take advantage of the structural characteristics of theback support of an IER structure, studies applying a reinforced earth retaining wall have been furtherreferenced. Ling et al. [12] analyzed a reinforced earth retaining wall applied to an embankmentground and used special three-node elements for each block and the boundary surface of the retaining

Appl. Sci. 2019, 9, 2213 5 of 15
wall front plate. In general, a constraint method has been adopted to achieve a more stable numericalanalysis of the interface than that of a Goodman element used in FLAC. Leshchinsky and Vulova [13]applied an analysis method and included a stiffener between the blocks. In the analysis describedin [13], the stiffener was treated with a beam element.
Jiang et al. [14] presented a 2D numerical analysis of a well-monitored pile–slab-supportedembankment for the Beijing–Tianjin high-speed railway in China. The piles, which are arranged ina square shape, are a three-dimensional (3D) problem. To convert a 3D problem into a 2D problem,the equivalent elastic modulus of the pile wall was calculated as follows: Eeq = Epas + Es (1 − as),where Ep and Es are the moduli of the pile and soil, respectively; and as is the area replacement ratio,defined as the ratio of the pile cross-sectional area to the total area. In this study, an analytical approachthat considers the wall area was used, and a retaining wall without a reinforcement was applied asan elastic model. For the 2D analysis, the wall was modeled by calculating the area of the H-beamconstituting the retaining wall.
The backfill can be simulated by assuming an elastoplastic material or an elastic material similarto that used in a general geotechnical structure problem. In general, a backfill is modeled using anelastoplastic model that includes a Mohr–Coulomb failure. Rowe and Ho [15] assumed that the elasticmodulus of the backfill is constant regardless of the height and set the dilation angle for various frictionangles. This study analyzed the forces acting on the wall for various friction angles and found thatthe friction angle of the backfill material is an important parameter determining the magnitude ofthe wall acting force. Bathurst and Hatami [16] estimated the elastic modulus by considering theincrease of the stiffness of backfill along the depth using the Mohr–Coulomb failure model. However,they did not consider the change in the elastic modulus according to the change in stress during theanalysis. Hatami and Bathurst [17] modeled the backfill soil as a nonlinear elastic response prior tothe peak strength, which was simulated using the stress-dependent hyperbolic model proposed byDuncan et al. [18]. In this study, the Mohr–Coulomb model was applied, and results obtained from thefield and laboratory tests were applied.
Simulations of the boundary surface vary from researcher to researcher. The method for simulatingthe interface can be classified as follows: 1) using thin continuum elements [16], 2) specifying differentnodes at the same boundary surface and adjusting the relative displacement between the nodes [15],3) designating specific adhesion stiffnesses and strengths for the shear force at the boundary surfaceto specific elements [13], 4) applying a separate element to the boundary surface using a constraintmethod [12], and 5) applying a connection element comprising a spring plastic section at the same nodeposition between the different elements [13]. Different researchers have utilized different methods andelements to simulate the boundary surface. However, the term “interface” is used in the same way.Such studies do not seem to satisfy the same interface condition, although the results of a comparativeanalysis of an interface simulation method have yet to be presented. In this study, the interface ismodeled by applying an interface method in which the friction coefficients of the wall and backfillinteract with each other.
The boundary condition of the ground is fixed in the horizontal direction along the x-axis and inboth the horizontal and vertical directions along the y-axis. Load A has a uniform distribution, and therailway sleepers, rails, and lower ground are applied as fixed loads. Therefore, the applied surchargeloading was 50 kN/m2, which is the load amount of a high-speed railway [19]. Load B is a dynamicload acting on the railway and is applied to both sides of the rail in a concentrated manner. In a staticanalysis [10], a surcharge load is applied with a uniform distribution. However, in a dynamic analysis,the dynamic sinusoidal loading is applied when considering that the high-speed railway is acted uponrepetitively and at rapid speeds.
The railway target used for the analysis moved at a speed of 300 km/h and had a length of380.14 m, and the railway loads were applied during 46 cycles to simulate the ground points of therailway wheels. The railway load was 170 kN, and a load of 85 kN was applied to each side [20–25].In addition, the time taken for the railway to pass through a single point was 4.56 s. During this

Appl. Sci. 2019, 9, 2213 6 of 15
interval, a frequency of 10.1 Hz was applied for a load of 46 cycles. Finally, the analysis time for theapplication of the dynamic load was 4.56 s. To analyze the residual behavior after the railway passedby, an analysis time of 5 s was added without a dynamic load. Figure 4 shows the analysis section,and Figure 5 illustrates the sinusoidal input wave with a frequency of 10.1 Hz that was applied forthe analysis.
Appl. Sci. 2019, 9, x FOR PEER REVIEW 6 of 15
The railway target used for the analysis moved at a speed of 300 km/h and had a length of 380.14 m, and the railway loads were applied during 46 cycles to simulate the ground points of the railway wheels. The railway load was 170 kN, and a load of 85 kN was applied to each side [20–25]. In addition, the time taken for the railway to pass through a single point was 4.56 s. During this interval, a frequency of 10.1 Hz was applied for a load of 46 cycles. Finally, the analysis time for the application of the dynamic load was 4.56 s. To analyze the residual behavior after the railway passed by, an analysis time of 5 s was added without a dynamic load. Figure 4 shows the analysis section, and Figure 5 illustrates the sinusoidal input wave with a frequency of 10.1 Hz that was applied for the analysis.
Figure 4. Cross-section for numerical analysis (m).
Figure 5. Input motion (10.1 Hz sinusoidal wave).
3.1. Analysis Conditions
Figure 4. Cross-section for numerical analysis (m).
Appl. Sci. 2019, 9, x FOR PEER REVIEW 6 of 15
The railway target used for the analysis moved at a speed of 300 km/h and had a length of 380.14 m, and the railway loads were applied during 46 cycles to simulate the ground points of the railway wheels. The railway load was 170 kN, and a load of 85 kN was applied to each side [20–25]. In addition, the time taken for the railway to pass through a single point was 4.56 s. During this interval, a frequency of 10.1 Hz was applied for a load of 46 cycles. Finally, the analysis time for the application of the dynamic load was 4.56 s. To analyze the residual behavior after the railway passed by, an analysis time of 5 s was added without a dynamic load. Figure 4 shows the analysis section, and Figure 5 illustrates the sinusoidal input wave with a frequency of 10.1 Hz that was applied for the analysis.
Figure 4. Cross-section for numerical analysis (m).
Figure 5. Input motion (10.1 Hz sinusoidal wave).
3.1. Analysis Conditions
Figure 5. Input motion (10.1 Hz sinusoidal wave).

Appl. Sci. 2019, 9, 2213 7 of 15
3.1. Analysis Conditions
The analysis conditions are based on the IER structure used in the field test, and to conduct acomparative analysis according to the number of H-piles per 10 m of retaining wall, six analysis caseswere applied, as shown in Table 3. Figure 6 shows the installation view and number of H-piles per10 m. Analysis cases 1–4 represent the installation effects of the back support when the number ofH-piles per 10 m was 10 or 5. Here, the installation condition of the back support differs. For cases 5and 6, the effects of the H-pile installation arrangement on the front and back supports were analyzedwhen the same number of H-piles were utilized for the IER construction, and the installation intervalbetween the front and back supports was reversed.
Table 3. Summary of the conditions used for numerical analysis.
No. Case Name * Angle of FrontSupport (◦)
Angle of BackSupport (◦)
Interval of FrontSupport (m)
Interval of BackSupport (m)
Number ofH-piles Per 10 m
1 D-F2-B2-10 5 5 2 2 102 S-F1-10 5 - 1 - 103 D-F4-B4-5 5 5 4 4 54 S-F2-5 5 - 2 - 55 D-F4-B2-7.5 5 5 4 2 7.56 D-F2-B4-7.5 5 5 2 4 7.5
* Description of case names: S, single support; D, dual support; F, front support; B, back support; No., number ofH-piles per 10 m (the number after F or B indicates the number of front or back support intervals, respectively).
Appl. Sci. 2019, 9, x FOR PEER REVIEW 7 of 15
The analysis conditions are based on the IER structure used in the field test, and to conduct a comparative analysis according to the number of H-piles per 10 m of retaining wall, six analysis cases were applied, as shown in Table 3. Figure 6 shows the installation view and number of H-piles per 10 m. Analysis cases 1–4 represent the installation effects of the back support when the number of H-piles per 10 m was 10 or 5. Here, the installation condition of the back support differs. For cases 5 and 6, the effects of the H-pile installation arrangement on the front and back supports were analyzed when the same number of H-piles were utilized for the IER construction, and the installation interval between the front and back supports was reversed.
Table 3. Summary of the conditions used for numerical analysis.
No. Case Name * Angle of Front
Support (°) Angle of Back
Support (°) Interval of Front
Support (m) Interval of Back
Support (m) Number of H-piles Per 10 m
1 D-F2-B2-10 5 5 2 2 10 2 S-F1-10 5 - 1 - 10 3 D-F4-B4-5 5 5 4 4 5 4 S-F2-5 5 - 2 - 5 5 D-F4-B2-7.5 5 5 4 2 7.5 6 D-F2-B4-7.5 5 5 2 4 7.5
* Description of case names: S, single support; D, dual support; F, front support; B, back support; No., number of H-piles per 10 m (the number after F or B indicates the number of front or back support intervals, respectively).
(a) (b)
(c) (d)
(e) (f)
Figure 6. Analysis conditions: (a) D-F2-B2-10, (b) S-F1-10, (c) D-F4-B4-5, (d) S-F2-5, (e) D-F4-B2-7.5, and (f) D-F2-B4-7.5.
3.2. Design Parameters
3.2.1. Soil Parameters
The soil parameters used are the same as those applied in the analysis by Seo et al. [10] and are shown in Table 4. The material constitutive model used was the Mohr–Coulomb model. The soil
Figure 6. Analysis conditions: (a) D-F2-B2-10, (b) S-F1-10, (c) D-F4-B4-5, (d) S-F2-5, (e) D-F4-B2-7.5,and (f) D-F2-B4-7.5.

Appl. Sci. 2019, 9, 2213 8 of 15
3.2. Design Parameters
3.2.1. Soil Parameters
The soil parameters used are the same as those applied in the analysis by Seo et al. [10] and areshown in Table 4. The material constitutive model used was the Mohr–Coulomb model. The soilparameters of soft rocks and weathered soil were used as the values of the ground survey report [26].In the case of the muck layer, a ground survey was conducted, and the test results were utilized.The parameters for all layers were applied to the results of the study by Seo et al. [10]. These parametersare shown in Table 4.
Table 4. Geotechnical parameters (Mohr–Coulomb model).
Soil Layers γt (kN/m3) E (kN/m2) ν φ c (kN/m2)
Sedimentary layer 20.0 50,000 0.35 34 10.0Soft rock layer 23.0 4,000,000 0.24 30 500
Muck layer 21.3 5,000 0.30 37 0.2
3.2.2. H-pile Parameters
The dimensions of the H-pile were 300 × 300 × 10 × 15 mm, which are the same as those usedin the field test. During the analysis, the support was applied as a linear elastic model, and the axialstiffness (EA) and bending stiffness (EI) were calculated using Equations (1) and (2), where the elasticmodulus of the H-pile (Es) was 210,000 MPa. These equations were derived with reference to the Plaxismanual [26]. Table 5 shows the H-pile parameters according to the installation interval (c.t.c.).
EA = Es ×A/c.t.c, (1)
EI = Es × IX/c.t.c, (2)
where Es is the elastic modulus of the H-pile (kPa), A is the area of the H-pile (m2), IX is the moment ofthe second order of the H-pile (m4), and c.t.c. is the installation interval of the H-pile (m).
Table 5. H-pile parameters (linear elastic model).
c.t.c. (m) EA (kN/m) EI (kN·m2/m)
1 2,515,800 42,8402 1,257,900 21,4204 628,950 10,710
4. Results of Dynamic Behavior Analysis
A numerical analysis was conducted for types A–F, where type A is D-F2-B2-10, type B is S-F1-10,type C is D-F4-B4-5, type D is S-F2-5, type E is D-F4-B2-7.5, and type F is D- F2-B4-7.5. The resultsof the dynamic behavior analysis for each type are shown in Figures 7–10. Figures 7 and 8 showthe lateral and vertical displacements at the top of the retaining wall, respectively, during dynamicloading. Figures 9 and 10 show the lateral and vertical displacements at the bottom of the retainingwall, respectively, under the same conditions. In the case of the lateral displacement results, a (+)value indicates movement inside the retaining wall (right direction in Figure 4), and the (-) valueindicates movement outside the retaining wall (left direction in Figure 4). Table 6 shows the maximumdisplacement according to type. The dynamic load of a passing railway at a speed of 300 km/hwas utilized, and a residual time of 5 s was used to examine the residual behavior after dynamicloading. As a result, vibrations occurred in the retaining wall during dynamic loading, which graduallydecreased during the residual time.

Appl. Sci. 2019, 9, 2213 9 of 15
Appl. Sci. 2019, 9, x FOR PEER REVIEW 10 of 15
Figure 7. Lateral displacement at the top for each type: D-F2-B2-10 (type A), S-F1-10 (type B), D-F4-B4-5 (type C), S-F2-5 (type D), D-F4-B2-7.5 (type E), and D-F2-B4-7.5 (type F).
Figure 8. Vertical displacement at the top for each type: D-F2-B2-10 (type A), S-F1-10 (type B), D-F4-B4-5 (type C), S-F2-5 (type D), D-F4-B2-7.5 (type E), and D-F2-B4-7.5 (type F).
Figure 9 shows the results of the lateral displacement at the bottom of the front support. The single support resulted in displacement in the ground, whereas the dual support showed the opposite behavior with displacement occurring outside the ground. However, the lateral displacement of the single support was approximately equal to that of the dual support. In this case, the effect of the difference in the number of H-beams was not significant, and the overall amounts of displacement were extremely small and were considered negligible. However, the direction of lateral displacement for a single support occurred outside the ground (left), whereas for a dual support it occurred inside the ground (right). This result shows that the support type affects the direction of displacement.
Figure 7. Lateral displacement at the top for each type: D-F2-B2-10 (type A), S-F1-10 (type B), D-F4-B4-5(type C), S-F2-5 (type D), D-F4-B2-7.5 (type E), and D-F2-B4-7.5 (type F).
Appl. Sci. 2019, 9, x FOR PEER REVIEW 10 of 15
Figure 7. Lateral displacement at the top for each type: D-F2-B2-10 (type A), S-F1-10 (type B), D-F4-B4-5 (type C), S-F2-5 (type D), D-F4-B2-7.5 (type E), and D-F2-B4-7.5 (type F).
Figure 8. Vertical displacement at the top for each type: D-F2-B2-10 (type A), S-F1-10 (type B), D-F4-B4-5 (type C), S-F2-5 (type D), D-F4-B2-7.5 (type E), and D-F2-B4-7.5 (type F).
Figure 9 shows the results of the lateral displacement at the bottom of the front support. The single support resulted in displacement in the ground, whereas the dual support showed the opposite behavior with displacement occurring outside the ground. However, the lateral displacement of the single support was approximately equal to that of the dual support. In this case, the effect of the difference in the number of H-beams was not significant, and the overall amounts of displacement were extremely small and were considered negligible. However, the direction of lateral displacement for a single support occurred outside the ground (left), whereas for a dual support it occurred inside the ground (right). This result shows that the support type affects the direction of displacement.
Figure 8. Vertical displacement at the top for each type: D-F2-B2-10 (type A), S-F1-10 (type B), D-F4-B4-5(type C), S-F2-5 (type D), D-F4-B2-7.5 (type E), and D-F2-B4-7.5 (type F).

Appl. Sci. 2019, 9, 2213 10 of 15
Appl. Sci. 2019, 9, x FOR PEER REVIEW 11 of 15
Figure 10 shows the results for a vertical displacement at the bottom of the front support. These results were very small and similar to those of the lateral displacement. However, the displacement of the single support was approximately 4 to 5 times larger than that of the dual support. As with the lateral displacement shown in Figure 9, the vertical displacement did not significantly affect the number of H-beams or their arrangement on the front and back supports.
Based on these results, the type of support is the most important factor for the bottom layer of the retaining wall, whereas other factors including the number of H-beams and the arrangement of H-beam supports are considered to have little effect.
Figure 9. Lateral displacement at the bottom for each type: D-F2-B2-10 (type A), S-F1-10 (type B), D-F4-B4-5 (type C), S-F2-5 (type D), D-F4-B2-7.5 (type E), and D-F2-B4-7.5 (type F).
Figure 10. Vertical displacement at the bottom for each type: D-F2-B2-10 (type A), S-F1-10 (type B), D-F4-B4-5 (type C), S-F2-5 (type D), D-F4-B2-7.5 (type E), and D-F2-B4-7.5 (type F).
Figure 9. Lateral displacement at the bottom for each type: D-F2-B2-10 (type A), S-F1-10 (type B),D-F4-B4-5 (type C), S-F2-5 (type D), D-F4-B2-7.5 (type E), and D-F2-B4-7.5 (type F).
Appl. Sci. 2019, 9, x FOR PEER REVIEW 11 of 15
Figure 10 shows the results for a vertical displacement at the bottom of the front support. These results were very small and similar to those of the lateral displacement. However, the displacement of the single support was approximately 4 to 5 times larger than that of the dual support. As with the lateral displacement shown in Figure 9, the vertical displacement did not significantly affect the number of H-beams or their arrangement on the front and back supports.
Based on these results, the type of support is the most important factor for the bottom layer of the retaining wall, whereas other factors including the number of H-beams and the arrangement of H-beam supports are considered to have little effect.
Figure 9. Lateral displacement at the bottom for each type: D-F2-B2-10 (type A), S-F1-10 (type B), D-F4-B4-5 (type C), S-F2-5 (type D), D-F4-B2-7.5 (type E), and D-F2-B4-7.5 (type F).
Figure 10. Vertical displacement at the bottom for each type: D-F2-B2-10 (type A), S-F1-10 (type B), D-F4-B4-5 (type C), S-F2-5 (type D), D-F4-B2-7.5 (type E), and D-F2-B4-7.5 (type F). Figure 10. Vertical displacement at the bottom for each type: D-F2-B2-10 (type A), S-F1-10 (type B),D-F4-B4-5 (type C), S-F2-5 (type D), D-F4-B2-7.5 (type E), and D-F2-B4-7.5 (type F).
Appl. Sci. 2019, 9, 2213 11 of 15
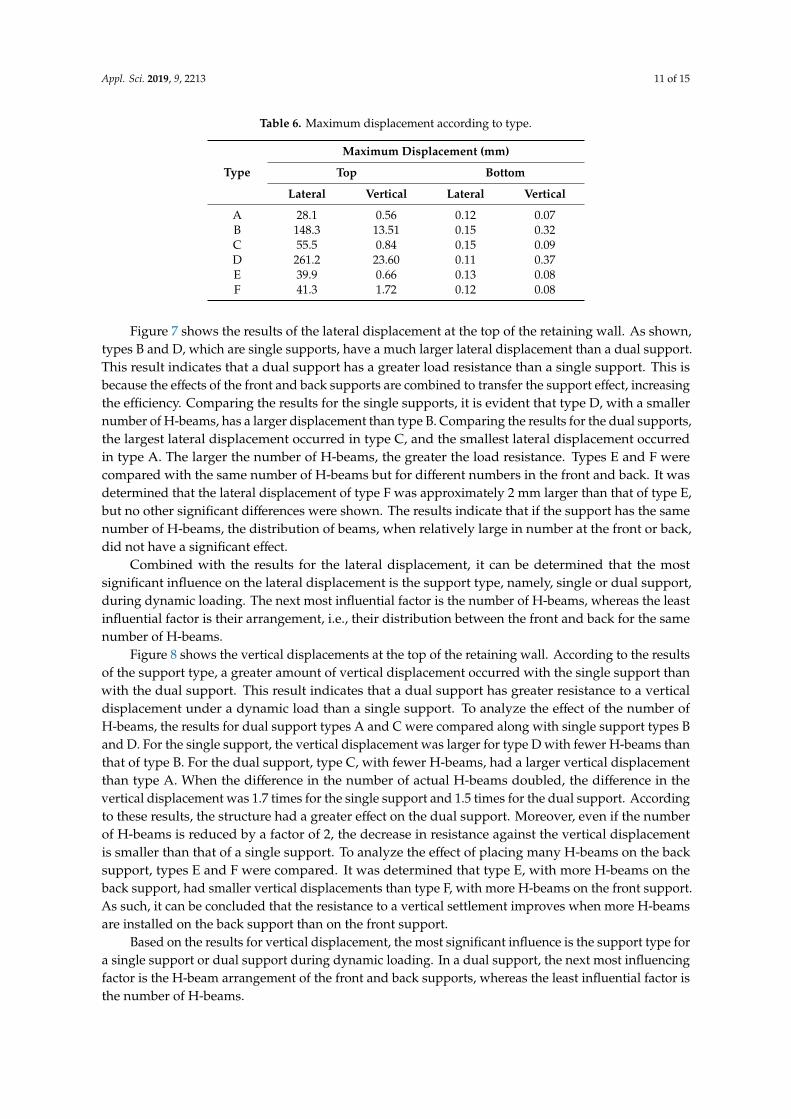
Table 6. Maximum displacement according to type.
Type
Maximum Displacement (mm)
Top Bottom
Lateral Vertical Lateral Vertical
A 28.1 0.56 0.12 0.07B 148.3 13.51 0.15 0.32C 55.5 0.84 0.15 0.09D 261.2 23.60 0.11 0.37E 39.9 0.66 0.13 0.08F 41.3 1.72 0.12 0.08
Figure 7 shows the results of the lateral displacement at the top of the retaining wall. As shown,types B and D, which are single supports, have a much larger lateral displacement than a dual support.This result indicates that a dual support has a greater load resistance than a single support. This isbecause the effects of the front and back supports are combined to transfer the support effect, increasingthe efficiency. Comparing the results for the single supports, it is evident that type D, with a smallernumber of H-beams, has a larger displacement than type B. Comparing the results for the dual supports,the largest lateral displacement occurred in type C, and the smallest lateral displacement occurredin type A. The larger the number of H-beams, the greater the load resistance. Types E and F werecompared with the same number of H-beams but for different numbers in the front and back. It wasdetermined that the lateral displacement of type F was approximately 2 mm larger than that of type E,but no other significant differences were shown. The results indicate that if the support has the samenumber of H-beams, the distribution of beams, when relatively large in number at the front or back,did not have a significant effect.
Combined with the results for the lateral displacement, it can be determined that the mostsignificant influence on the lateral displacement is the support type, namely, single or dual support,during dynamic loading. The next most influential factor is the number of H-beams, whereas the leastinfluential factor is their arrangement, i.e., their distribution between the front and back for the samenumber of H-beams.
Figure 8 shows the vertical displacements at the top of the retaining wall. According to the resultsof the support type, a greater amount of vertical displacement occurred with the single support thanwith the dual support. This result indicates that a dual support has greater resistance to a verticaldisplacement under a dynamic load than a single support. To analyze the effect of the number ofH-beams, the results for dual support types A and C were compared along with single support types Band D. For the single support, the vertical displacement was larger for type D with fewer H-beams thanthat of type B. For the dual support, type C, with fewer H-beams, had a larger vertical displacementthan type A. When the difference in the number of actual H-beams doubled, the difference in thevertical displacement was 1.7 times for the single support and 1.5 times for the dual support. Accordingto these results, the structure had a greater effect on the dual support. Moreover, even if the numberof H-beams is reduced by a factor of 2, the decrease in resistance against the vertical displacementis smaller than that of a single support. To analyze the effect of placing many H-beams on the backsupport, types E and F were compared. It was determined that type E, with more H-beams on theback support, had smaller vertical displacements than type F, with more H-beams on the front support.As such, it can be concluded that the resistance to a vertical settlement improves when more H-beamsare installed on the back support than on the front support.
Based on the results for vertical displacement, the most significant influence is the support type fora single support or dual support during dynamic loading. In a dual support, the next most influencingfactor is the H-beam arrangement of the front and back supports, whereas the least influential factor isthe number of H-beams.

Appl. Sci. 2019, 9, 2213 12 of 15
Figure 9 shows the results of the lateral displacement at the bottom of the front support. The singlesupport resulted in displacement in the ground, whereas the dual support showed the oppositebehavior with displacement occurring outside the ground. However, the lateral displacement of thesingle support was approximately equal to that of the dual support. In this case, the effect of thedifference in the number of H-beams was not significant, and the overall amounts of displacementwere extremely small and were considered negligible. However, the direction of lateral displacementfor a single support occurred outside the ground (left), whereas for a dual support it occurred insidethe ground (right). This result shows that the support type affects the direction of displacement.
Figure 10 shows the results for a vertical displacement at the bottom of the front support.These results were very small and similar to those of the lateral displacement. However, the displacementof the single support was approximately 4 to 5 times larger than that of the dual support. As withthe lateral displacement shown in Figure 9, the vertical displacement did not significantly affect thenumber of H-beams or their arrangement on the front and back supports.
Based on these results, the type of support is the most important factor for the bottom layer ofthe retaining wall, whereas other factors including the number of H-beams and the arrangement ofH-beam supports are considered to have little effect.
5. Displacement Restraining Effect of Back Support
Using the result of the horizontal displacement at the top, the displacement ratio with other typeswas analyzed based on a single type, and the difference in the degree of displacement was analyzed.The analysis was conducted in the following three ways.
5.1. Analysis Based on Retaining Wall Type
The retaining wall type was classified into types B and D of a single-column H-pile structure,and types A and C of an IER structure. Types A and B, and types C and D, with the same numberof H-piles per 10 m of length, were compared. Among them, the displacement ratios were analyzedbased on types B and D, which are of a single column type, the results of which are listed in Table 7.Table 7 shows that the horizontal displacements of the IER structure were only 18.95% and 21.25%those of the single column types B and D. Therefore, when the retaining structure is installed in asimilar way as an IER structure, the horizontal displacement is reduced by 81.05% under a railwayload during operation.
Table 7. Lateral displacement ratio according to type of retaining wall.
Lateral Maximum Displacement of TopLateral Displacement Ratio
Standard/Type B Standard/Type D
A 28.1 0.1895 0.1076B 148.3 1.0000 0.5678C 55.5 0.3742 0.2125D 261.2 1.7613 1.0000
5.2. Analysis Based on Installation of Back Support
To analyze the effect of an installation of a back support, type D was compared with types A andF, which have the same spacing of 2 m. The standard is considered type D, which has no back support,and the lateral displacement ratio was calculated as shown in Table 8. Table 8 indicates that the lateraldisplacement for types A and F after a back support was installed was 10.76% and 15.81% that of typeD without a back support, respectively, which is a reduction of up to 89.24%. It is considered that thesuppression pile effect acts by reducing the earth pressure applied to the front wall when the backsupport is installed.

Appl. Sci. 2019, 9, 2213 13 of 15
Table 8. Lateral displacement ratio according to installation of back support.
Type Lateral Maximum Displacement of Top Lateral Displacement Ratio(Standard/Type D)
A 28.1 0.1076D 261.2 1.0000F 41.3 0.1581
5.3. Analysis Based on Installation Spacing of Back Support
At the time of installation of the back support, to analyze the installation spacing effect, IER structuretypes A, C, E, and F were compared. Types A and F, with a spacing of 2 m for the front support,were compared with types C and E, with a spacing of 4 m. The standard of each analysis was basedon types C and F, with a large spacing (4 m) applied between the back supports. Table 9 shows theanalysis results according to the installation spacing of the back support. When the installation spacingwas narrowed, the displacement was only 71.89% and 68.04%, respectively, and the decrease from theinstallation spacing was approximately 30%.
Table 9. Lateral displacement ratio according to installation interval of back support.
Type Lateral Maximum Displacement of TopLateral Displacement Ratio
Standard/Type C Standard/Type F
A 28.1 0.5063 0.6804C 55.5 1.0000 1.3438E 39.9 0.7189 0.9661F 41.3 0.7441 1.0000
6. Conclusions
A dynamic numerical analysis was conducted to investigate the stability of an inclined earthretaining wall used during an embankment construction. The main conclusions are summarizedas follows:
1. A dual support is more effective for suppressing lateral and vertical displacements than a singlesupport. The resistance to the dynamic loading of a single support was shown to be smaller than thatof a dual support.
2. The most significant factor influencing a lateral displacement at the top of a retaining wall is thesupport type. The next most influential factor is the number of H-beams, whereas the least influentialfactor for the same number of H-beams is their arrangement.
3. As with a lateral displacement, the most significant influencing factor on a vertical displacementat the top of the retaining wall is the support type. For a dual support, the next most influential factorwas the H-beam arrangement, unlike a lateral displacement, and the least influential factor was thenumber of H-beams.
4. The type of support is an important factor affecting both the lateral and vertical displacementsat the front of the retaining wall. Other factors, such as the number of H-beams and the arrangementof the H-beam of the support, did not have much of an effect. The support type affected the directionof the lateral displacement behavior at the bottom of the retaining wall.
5. The lateral displacement of the IER structure was shown to decrease by 81.05% at maximumcompared to a one-row retaining wall with the same H-pile number per 10 m. An IER structure istherefore considered to be more stable.
6. The lateral displacement decreased by 89.24% when the structure was installed under the sameconditions with or without a back support. It is thought that the back support applied to an IERstructure demonstrates a suppression pile effect. The installation of the back support was shown toincrease the structural stability.

Appl. Sci. 2019, 9, 2213 14 of 15
7. For the same IER structure, the lateral displacement decreased by approximately 30% when theinstallation spacing of the back support was reduced by twofold.
8. By using the operating load of the railway, the dynamic numerical analysis was conducted.The results show the substantial displacement suppression effect by using the IER method. Using IERmethod may significantly affect the stability of the embankment construction so that the use of auxiliarymethod such as anchor installation may be eliminated. In addition, the construction period can beshortened and economic efficiency is expected to be increased. Therefore, it is recommended to use theIER method in the future construction of embankments.
Author Contributions: Conceptualization and methodology, J.-C.I. and M.S.; software, S.-W.S. and J.-W.Y.;validation, S.-W.S. and M.S.; analysis, S.-W.S.; investigation, M.S.; writing—original draft preparation, M.S. andS.-W.S.; writing—review and editing, S.-W.S. and M.S.; visualization, S.-W.S.; supervision, M.S.
Funding: This work was supported by a 2-Year Research Grant of Pusan National University and the NationalResearch Foundation of Korea (NRF-2018R1A6A3A01011077).
Conflicts of Interest: The authors declare no conflict of interest.
References
1. Korean Geotechnical Society. Manual Guide for Design Criteria of Structural Foundation; Korean GeotechnicalSociety: Seoul, Korea, 2015; pp. 43–279.
2. Chaudhary, B.; Hazarika, H.; Krishna, A.M. Earth pressures on reinforced soil retaining wall under dynamicloading. In Computer Methods and Recent Advances in Geomechanics, Proceedings of the 14th InternationalConference of International Association for Computer Methods and Recent Advances in Geomechanics, 2014 (IACMAG2014), Leiden, 22–25 September 2014; Taylor & Francis Books Ltd.: London, UK, 2015; pp. 1877–1883.
3. Zhu, Y.L.; Yu, J.; Zhou, J.F.; Tu, B.X.; Cai, Y.Y. Calculation of earth pressure on rigid retaining walls withconsiderations to the seismic load and soil stress-deflection. J. Vibroeng. 2018, 20, 1488–1500.
4. Xu, Q. Investigation of Stability Alarming for Retaining Wall Structures with Damage. Shock Vib. 2017.[CrossRef]
5. Sadighi, C. Analytical Determination of Dynamic Pressure on the Retaining Wall Using Spiral-RankinLogarithm Model. Mapta J. Archit. Urban. Civ. Eng. (MJAUCE) 2018, 1, 26–37.
6. Chehade, H.A.; Dias, D.; Sadek, M.; Jenck, O.; Chehade, F.H. Seismic analysis of geosynthetic-reinforcedretaining wall in cohesive soils. Geotext. Geomembr. 2019, 47, 315–326. [CrossRef]
7. Seo, M.; Im, J.C.; Jeong, D.U.; Yoo, J.W.; Koo, Y.M.; Kim, G.H. An experimental study on the stability ofinclined earth retaining. J. Korean Geotech. Soc. 2012, 28, 99–110. (In Korean) [CrossRef]
8. Jeong, D.U.; Im, J.C.; Yoo, J.W.; Seo, M.; Koo, Y.M.; Kim, S.J. An experimental study on the inclined earthretaining structure in clay. J. Korean Geotech. Soc. 2013, 29, 63–75. (In Korean) [CrossRef]
9. Seo, M.; Im, J.C.; Kim, C.Y.; Yoo, J.W. A study on the applicability of retaining wall using batter piles in clay.Can. Geotech. J. 2016, 53, 1195–1212. [CrossRef]
10. Seo, M.; Im, J.C.; Kim, J.S.; Beak, S.M.; Kim, J.Y.; Kim, C.Y. A study on the effect for restraining lateraldisplacement of inclined earth retaining wall through the field experiment. J. Korean Soc. Hazard Mitig. 2015,15, 255–264. (In Korean) [CrossRef]
11. Plaxis, V. Reference Manual; PLAXIS: Delft, Netherlands, 2018; pp. 228–233.12. Ling, H.I.; Cardany, C.P.; Sun, L.X.; Hashimoto, H. Finite element study of a geosynthetic-reinforced soil
retaining wall with concrete-block facing. Geosynth. Int. 2000, 7, 137–162. [CrossRef]13. Leshchinsky, D.; Vulova, C. Numerical investigation of the effects of geosynthetic spacing on failure
mechanism in MSE block walls. Geosynth. Int. 2001, 8, 343–365. [CrossRef]14. Jiang, Y.; Han, J.; Zheng, G. Numerical analysis of a pile–slab-supported railway embankment. Acta Geotech.
2014, 9, 499–511. [CrossRef]15. Rowe, R.K.; Ho, S.K. Continuous panel reinforced soil walls on rigid foundations. J. Geotech. Geoenviron. Eng.
1997, 123, 912–920. [CrossRef]16. Bathurst, R.J.; Hatami, K. Seismic response analysis of a geosynthetic-reinforced soil retaining wall.
Geosynth. Int. 1998, 5, 127–166. [CrossRef]

Appl. Sci. 2019, 9, 2213 15 of 15
17. Hatami, K.; Bathurst, R.J. Numerical model for reinforced soil segmental walls under surcharge loading.J. Geotech. Geoenviron. Eng. 2006, 132, 673–684. [CrossRef]
18. Duncan, J.M.; Byrne, P.; Wong, K.S.; Mabry, P. Strength, Stress-Strain and Bulk Modulus Parameters forFinite-Element Analysis of Stresses and Movements in Soil Masses; No. UCB/GT/80-01; Department of CivilEngineering, University of California: Berkeley, CA, USA, 1980.
19. Ministry of Land, Transport and Maritime Affairs. Railway Design Standards: Roadbed Side; Korea RailNetwork Authority: Daejeon, Korea, 2017. (In Korean)
20. Kwark, J.W.; Chin, W.J.; Kim, Y.J.; Kim, B.S. Dynamic behavior of concrete box girder bridge due to ridingKorean high-speed train. J. Korean Soc. Civ. Eng. 2003, 23, 27–36. (In Korean)
21. Han, S.H.; Bang, M.S.; Lee, W.S. A study on dynamic capacity assessment of PSC box girder high speedrailway bridges using time series load. J. Korean Soc. Civ. Eng. 2010, 30, 211–219. (In Korean)
22. Yun, J.H.; Choi, K.Y.; Kwon, K.S.; Chung, W.S. Effect of crossbeam on dynamic characteristic and safety ofPSC-I railway bridge. J. Korean Soc. Hazard Mitig. 2012, 12, 25–30. (In Korean) [CrossRef]
23. Cho, J.R.; Kim, D.S.; Kim, Y.J.; Kwark, J.W.; Jang, S.Y. Three dimensional model for dynamic moving loadanalysis of a PSC-I girder railway bridge. J. Korean Soc. Railw. 2013, 16, 286–297. (In Korean) [CrossRef]
24. Seo, J.W.; Cho, K.H. Static and dynamic analysis for railway tunnel according to filling materials foroverbroken tunnel bottom. J. Korean Soc. Railw. 2017, 20, 668–682. (In Korean) [CrossRef]
25. Jeong, Y.D.; Koh, H.I.; Kang, Y.S.; Eom, G.H.; Yi, S.T. Analytical research on dynamic behavior of steelcomposite lower railway bridge. J. Korea Inst. Struct. Maint. Insp. 2019, 23, 27–35. (In Korean)
26. Korea Rail Network Authority. Soil Survey Report of Detailed Design in the Daegu Line; Korea Rail NetworkAuthority: Daejeon, Korea, 2010; p. 56. (In Korean)
© 2019 by the authors. Licensee MDPI, Basel, Switzerland. This article is an open accessarticle distributed under the terms and conditions of the Creative Commons Attribution(CC BY) license (http://creativecommons.org/licenses/by/4.0/).