Relationship between sustainability disclosures and financial ...
100
Supervisor: Kristina Artsberg Examiner: Mattias Haraldsson Value in green pursuits Relationship between sustainability disclosures and financial performance by Josephine Nakiyemba and Musna Yusuf May 2018 Master’s Programme in Accounting and Finance
-
Upload
khangminh22 -
Category
Documents
-
view
1 -
download
0
Transcript of Relationship between sustainability disclosures and financial ...

Supervisor: Kristina Artsberg
Examiner: Mattias Haraldsson
Value in green pursuits
Relationship between sustainability disclosures and financial
performance
by
Josephine Nakiyemba and Musna Yusuf
May 2018
Master’s Programme in Accounting and Finance


1
Abstract
Title: Value in green pursuits: Relationship between sustainability
disclosures and financial performance
Seminar date 30th May 2018
Course: BUSN79 Degree Project in Accounting and Finance, Master Level,
15 credits
Authors: Josephine Nakiyemba and Musna Yusuf
Supervisor: Kristina Artsberg
Key words: Sustainability reporting, financial performance, Slack resources, Good
management, Manufacturing industry, South Africa
Purpose: The purpose of the research is to investigate the relationship between
sustainability disclosures and financial performance from the slack
resources and good management perspective in an emerging economy.
Methodology: This is a mixed method study consisting of semi-structured interviews
and the use of both descriptive and inferential statistics.
Theoretical
perspective:
In our thesis, we discuss two compelling theories that explain why
firms engage in sustainability reporting; legitimacy theory and
stakeholder theory. In addition, we discuss the role of slack resources
theory and the good management theory in explaining the relationship
between sustainability disclosures and financial performance.
Empirical findings: The empirical data consists of both primary and secondary data
sources. The data was collected from interviews, integrated annual
reports, sustainability reports and financial databases. Sustainability
reporting in South Africa is majorly hinged on legislation from the
government and the stock exchange. While sustainability awareness
continues to rise, shareholders and customers marginally contribute to
the drive of sustainability reporting.
The regression analysis identifies a neutral relationship between
sustainability disclosures and firm value, ceteris paribus. Despite the
positive coefficient being insignificant, an interactive model
illuminates that sustainability disclosure does play a role in financial
performance of firms. In addition, profitability and cash position of
firms reporting more on sustainability is lower than their peers who
2
report less on sustainability. Furthermore, prior longer-term financial
performance heavily influences sustainability disclosures whereas the
findings indicate that not all aspects of sustainability positively impact
firm value; only the environmental aspect does. Working Capital as an
indicator of slack is the only measure found consistent with the slack
resources theorists’ view. Lastly, no evidence of a high correlation
between financial performance indicators and sustainability
disclosures is found to support the good management theory.
Conclusions: While an original OLS regression showed there is a neutral
relationship between value of the firm and sustainability disclosures,
our interactive model informs that sustainability disclosures do have
an impact on the value of the firm given that the level of spending on
sustainability initiatives differ between more and less sustainable
firms. That said, it does pay to be green; more sustainable firms have
a higher firm value than the less sustainable firms.

3
Acknowledgements
We owe our deepest gratitude to our supervisor, Kristina Artsberg for her comments and
encouragement during the journey of writing this paper. We would also like to thank Anna
Maria Corciova who assisted us along the way.
Additionally, thanks to the Swedish Institute and our families and close friends for making
our studies and stay in Sweden possible.
Josephine Nakiyemba and Musna Yusuf
Lund, May 2018.
4
Table of Contents
1 Introduction ...................................................................................................................... 8
1.1 Background ................................................................................................................ 8
1.2 Problematization ......................................................................................................... 9
1.3 Research Purpose and Aim ...................................................................................... 12
1.4 Research Limitations ................................................................................................ 12
1.5 Target Audience ....................................................................................................... 13
1.6 Outline of the Thesis ................................................................................................ 14
2 Literature Review ........................................................................................................... 15
2.1 Sustainability ............................................................................................................ 15
2.2 Sustainability reporting ............................................................................................ 16
2.2.1 Rationale for Sustainability reporting .................................................................. 17
2.2.2 Empirical evidence for the rationale of sustainability disclosures ....................... 21
2.3 Sustainability reporting/disclosures and financial performance .............................. 22
2.3.1 Theoretical approaches to analyzing Sustainability reporting/disclosures and
financial performance ....................................................................................................... 22
2.3.2 Empirical evidence on sustainability reporting/disclosures and financial
performance ...................................................................................................................... 27
2.4 Hypothesis development .......................................................................................... 30
2.5 Chapter Summary ..................................................................................................... 31
3 Methodology ................................................................................................................... 33
3.1 Research Approach .................................................................................................. 33
3.2 Sample size ............................................................................................................... 34
3.3 Data Collection Method ........................................................................................... 36
3.4 Longitudinal study .................................................................................................... 37
3.5 Data Analysis ........................................................................................................... 37
3.5.1 Regression model ................................................................................................. 37
3.5.2 Model specifications ............................................................................................ 39
3.5.3 Dependent Variable .............................................................................................. 40
3.5.4 Independent Variables .......................................................................................... 41
3.5.5 Control Variables ................................................................................................. 41
3.5.6 Final regression equation ..................................................................................... 42
3.5.7 Interviews analysis ............................................................................................... 44
3.6 Limitations of Research Method .............................................................................. 44
3.7 Reliability, Replicability and Validity ..................................................................... 45

5
3.7.1 Reliability ............................................................................................................. 45
3.7.2 Replicability ......................................................................................................... 45
3.7.3 Validity ................................................................................................................. 45
3.8 Chapter Summary ..................................................................................................... 46
4 Analysis of Empirical Results ....................................................................................... 47
4.1 Diagnostic Tests ....................................................................................................... 47
4.1.1 Non-normality ...................................................................................................... 47
4.1.2 Multicollinearity ................................................................................................... 47
4.1.3 Endogeneity .......................................................................................................... 47
4.1.4 Autocorrelation ..................................................................................................... 48
4.1.5 Heteroscedasticity ................................................................................................ 48
4.2 Analysis of results .................................................................................................... 48
4.2.1 Correlation Matrix Analysis ................................................................................. 48
4.2.2 Descriptive Statistics Analysis ............................................................................. 49
4.2.3 Causal Model - Regression Analysis ................................................................... 50
4.2.4 Interview findings ................................................................................................ 55
4.3 Chapter summary ..................................................................................................... 56
5 Discussion of Findings .................................................................................................... 58
5.1 Sustainability disclosures and financial performance .............................................. 58
5.2 Sustainability reporting and initiatives in South Africa. .......................................... 60
5.3 Chapter Summary ..................................................................................................... 62
6 Conclusion ....................................................................................................................... 63
6.1 Research Aims .......................................................................................................... 63
6.2 Practical Implications ............................................................................................... 63
6.3 Further Areas for Research ...................................................................................... 64
References ............................................................................................................................... 65

6
List of Tables
Table 1. Summary of previous research ................................................................................... 29
Table 2. Interview Summary………………………………………………………………….37
Table 3. Summary of coding criteria…………………………………………………………38
Table 4. Summary of empirical model variables…………………………………………..…43
Table 5. Relative variable comparison to standard deviation………………………………...51
Table 6: Kruskal Wallis non-parametric test ………………………………………………...51
Table 7: Baseline and interaction model regression outputs …………………………………53
Table 8: Causal model lagged time periods ………………………………………………….54

7
List of Figures
Figure 1. GDP growth per industry 2016. ................................................................................ 13
Figure 2. Triple bottom line model …………………………………………………………..16
Figure 3. Objective of ESG ratings …………………………………………………………..35
Figure 4. Interaction of sustainability disclosures to financial performance…………………52

8
1 Introduction
In this chapter, we set the scene for the reader by providing information on what the thesis
discusses. Section 1.1 provides background of the thesis, Section 1.2 problematizes the research
question, Section 1.3 discusses the purpose and aim of the study, Section 1.4 discusses the
limitations of the study, Section 1.5 discusses the potential target audience for the paper and
finally, Section 1.6 provides the general outline of this paper.
1.1 Background
Sustainability is one of the most discussed topics in the world today under the term ‘Climate
change and global warming’ and ‘diversity’. Gunasekaran and Spalanzani (2012) indicate that
companies are under increasing pressure for inclusion of sustainable business practices by both
external bodies (government regulations, profit and not-for-profit organizations) and internal
pressure (strategic objectives, top management vision, employee safety and well-being, cost).
Legitimation and stakeholder pressures have led to increased sustainability reporting by
organizations as argued by Bellringer et al., (2011). An exponential growth of 63% in
sustainability reporting has thus been seen in companies reporting on sustainability from the
period of 1993 to 2017 according to KPMG (2017) report on Corporate Sustainability
Reporting. Sustainability reporting has spilled over to the corporate world and is now being
embraced by several companies in various industries with much zeal. As advanced by Visser
(2002), companies are using various frameworks/standards: International Standards
Organization, Institute of Social and Ethical Accountability, Global Reporting Initiative
Guidelines and the United Nations’ Global Compact Guidelines, as guidance on sustainability
reporting to increase awareness and visibility of sustainability initiatives.
Successful businesses are currently being defined by integration of concepts such as
management quality, environmental management, customer management and brand reputation
(Lopez et al., 2007). Sustainability practices are seen to facilitate the development of better
systems of internal control, decision making and cost saving innovativeness as indicated by
Adams and Evans (2004) and to further create long-term value (Bebbington, 2001) for
companies.
Dawkins and Ngunjiri (2008) indicate that region-specific institutional pressures play a
significant role in shaping sustainability practices. This also explains the variation of
sustainability practices across countries. In some countries, sustainability reporting is
mandatory for a specific set of companies. For example, listed companies on France and South
Africa respective stock exchanges are required to report on sustainability. In addition, state
owned enterprises in Sweden and Denmark are required by the government to issue
sustainability reports (King, 2010). Minimal and absence of sustainability disclosures is still a
common practice by companies especially in the Middle East and Africa continents. The KPMG
(2017) survey of Corporate Responsibility Reporting indicates that sustainability reporting
continues to drop in the Middle East and Africa regions from 61% in 2011 to 52% in 2017.

9
1.2 Problematization
Sustainability reporting has been associated with a wide spectrum of both tangible and
intangible benefits such as improved financial performance, employee loyalty and consumer
reputation according to a survey carried out by Ernst and Young (EY) (2016). Nonetheless,
some business leaders do not view sustainability as particularly relevant as they believe to have
more urgent problems to worry about such as growth, productivity and profits (Elkington,
1998). However, Hubbard (2009) argues that in today’s reality, firms are under tremendous
pressure to monitor and report on more than just their economic performance.
Numerous studies have been done by academics to link sustainability disclosures to financial
performance. Results from these studies show contradictory results. Some posit a positive
relationship exists between sustainability disclosures and financial performance, others have
concluded an existence of a negative relationship while others stipulate that there is no
relationship between sustainability and financial performance.
A study carried out by Dimson et al., (2015) indicated that companies that engaged in
sustainability reporting increased their share price by an average of 4.4% a year. A contradicting
study carried our Jones et al., (2007), however, indicates that there is a negative relationship
between sustainability reporting and abnormal returns. Extant studies focusing on accounting
indicators as a measure of corporate financial performance have found differing views as well.
A positive relationship between sustainability and performance (See McGuire et al., 1988;
Lopez et al., 2007; Ameer and Othman, 2011), neutral relationships (See McWilliams and
Siegel, 2000) while others show negative relationships on some indicators tested (See Jones et
al., 2007).
Lack of uniformity on what aspects constitute sustainability can be attributed to the different
results. For example, Ameer and Othman (2011) study was based on four dimensions of
sustainability: Community, Environment, Diversity and Ethical Standards, while Schaltegger
and Synnestvedt (2002) based their research on purely the environmental dimension.
Expanding on Ameer and Othman (2011) measures, Dawkins and Ngunjiri (2008) use
employee relations and human rights dimensions as measures of sustainability. Furthermore,
majority of these studies do not stratify according to industry and countries but instead analyze
wider samples (Lopez et al., 2007; Waldman et al., 2006; Hillman and Keim, 2001). The
importance of stratifying according to company type and industry is emphasized by George
(2005) who indicates that the environment in which a company operates in influences its ability
to utilize resources. This implies that industries operating in the same competitive environment
have the same complexities that also impact their performance.
Most of these studies investigating sustainability disclosures and performance use accounting
measures of profitability and efficiency (McWilliams and Siegel 2000; Lopez et.al., 2007; Hart
and Ahuja, 1996) and the explanation of findings are mainly geared towards the stakeholder
theory. We posit that additional intervening variables impact financial performance and
sustainability disclosures in this case the presence or lack of slack resources. Bourgeios (1981)
defines slack resources as ‘…that cushion of actual or potential resources which allows an
organization to adapt successfully to internal pressures for adjustment or to external pressures

10
for change in policy, as well as to initiate changes in strategy with respect to the external
environment’( p.30).
Various studies have used slack resources as a variable in risk taking, (Wiseman and Bromiley,
1996), innovation (Voss et al., 2008), and performance (George, 2005). However, slack
resources as a variable in sustainability disclosures has hardly been explored by researchers. To
our knowledge, such a study has only been conducted by Waddock and Graves (1997) whose
results indicate that there is a positive relationship between corporate social responsibility and
slack resource availability. They define corporate social responsibility as ‘multidimensional
construct with behaviors ranging across wide variety of inputs e.g. investments in pollution
control equipment, or other environmental strategies), internal behaviors or processes (e.g.,
treatment of women and minorities, nature of products produced, relationships with customers),
and outputs (e.g., community relations and philanthropic programs)’ (p. 304). This definition
echoes the modern day sustainability explanation.
To begin with, Waddock and Graves (1997) research is marred by endogeneity problems.
Endogeneity problems arise when an explanatory variable is correlated with the error term
(Brooks, 2014). This firm specific error represents a unique aspect of a firm and is not directly
obvious therefore affecting the regression coefficient of the other variables significantly
(Garcia-Castro et al., 2009). Re-specification of models by accounting for endogeneity
problems has an impact on the results of the study. In a replica study of Waddock and Graves
(1997) investigation of sustainability and financial performance, McWilliams and Siegel (2000)
found a neutral relationship from an earlier positive result. They did account for endogeneity
problems by including research and development as an extra variable in the empirical model.
Secondly, while Waddock and Graves (1997) control for industry as a variable; they do not
stratify their sample by industry through examining interactions in a longitudinal study. Hence
their results are not generalizable as the companies analyzed operate in different complexities.
Besides, these companies approach to resource utilization and allocation differ. In addition,
mechanisms by which slack resources influence sustainability initiatives and firm performance
we believe may vary. Thirdly, not controlling for various dimensions that are known to affect
financial performance leads to model under-specification exposing their empirical study to
omitted variable biases.
Fourthly, observations over longer-term periods to ascertain whether these relationships hold
over time are largely unexplored. Waddock and Graves (1997) study explores short term
interactions (1989-1991) and particularly omits controlling for aspects known to affect firm
value such as capital intensity which when accounted for significantly changes the outcome
arrived at in their study. We use capital intensity as a control mechanism and examine whether
the neutral outcome arrived at by McWilliams and Siegel (2000) by re-specifying Waddock
and Graves (1997) model holds.
Fifth, Waddock and Graves (1997) examine an entire sample of 469 firms from the S&P 500
and does not test for significant variations in sustainability disclosures to financial performance
between more sustainable and less sustainable firms. They instead examine overall whether
slack resources motivate firms to undertake sustainability initiatives. We solve for this by
testing for any significant differences in sub-samples (more sustainable and less sustainable

11
firms) measured by the amount of disclosures on sustainability through use of an interaction
model in our regression analysis. The independent terms interact with the dummy variable that
takes one (1) if firms are listed on a sustainability index and zero (0) if not. We go beyond
Waddock and Graves (1997) study to explicitly test whether financial performance differs
between more sustainable firms and less sustainable firms measured by the level of
sustainability disclosures. A gap therefore exists in studies linking sustainability disclosures to
financial performance of a firm with slack resources as a moderating variable.
In addition, current studies on sustainability disclosures hardly examine the relationship of
sustainability disclosures to financial performance from an emerging and developing markets
perspective. Researchers investigating the relationship between sustainability disclosures and
financial performance tend to cover developed economies rather than emerging markets (See
Ameer and Othman 2011; Jones et al., 2007). This can be attributed in part by a backward slide
in sustainability reporting by companies in the Middle East and Africa regions compared to
companies in the Americas, Asia Pacific and European regions who have made significant
strides in this direction (KPMG 2017). Emerging economies are defined by Hoskisson et al.,
(2000) as low-income, rapid-growth countries using economic liberalization as their primary
engine of growth. These further fall into two groups. Group one comprises of developing
countries in Asia, Latin America, Africa, and the Middle East whereas the second group
transition the former Soviet Union and China. A study by Rahman and Momim (2009) on
sustainability reporting in emerging markets indicates that most studies done in these markets
are descriptive in nature and have focused on the extent and volume of disclosures.
Given the decline in reporting trends, a study linking sustainability disclosures to financial
performance in an emerging market perspective could add to the current knowledge of
economic benefits and or costs arising out of reporting. In addition, such a study could affirm
that sustainability disclosures does influence firm performance in a negative, positive or
maintain neutrality informing managers on strategic choices.
We undertake a mixed research approach examining why slack resources interaction with firm
financial performance would impact the level of sustainability disclosures in an emerging
economy perspective. Several factors explain why there would be a difference in sustainability
disclosure practices between emerging countries and developed economies. The contradictory
results can be explained by Schaltegger and Synnestvedt (2002) who argue that relationship
between sustainability practices/initiatives and financial performance differs according to the
regulatory regime in a country, cultural setting, type and size of industries, companies analyzed
and time span.
Given the ambitious agenda of this research, this paper therefore adds to the literature and
theory of the slack resources by studying the relationship between sustainability disclosures and
financial performance in an emerging markets context. We add to Waddock and Graves (1997)
research by solving for the endogeneity problem through use of a longitudinal study which
gives a better insight on how a company operates in different strategic realms (Garcia-Castro
et al., 2009). We also examine financial performance over longer term periods by lagging all
explanatory variables in time periods -1 to -3, controlling for capital intensity and include
additional specific indicators of slack resources.

12
1.3 Research Purpose and Aim
The purpose of the research is to investigate the relationship between sustainability disclosures
and financial performance in an emerging economy perspective. We also investigate whether
slack resources have an impact on sustainability reporting. The results of this study aim to
inform on perceived benefits and costs attached to sustainability reporting of companies in
emerging markets.
The research seeks to investigate:
Is there a relationship between sustainability reporting and corporate financial performance
in an emerging markets perspective?
In the pursuit of answering this question, the following sub-questions guide our research efforts;
Why do firms in emerging markets practice sustainability?
What sustainability initiatives are reported on most by these companies?
Do slack resources have an impact on sustainability initiatives undertaken by companies
in an emerging market?
Do more sustainable firms (measured by the level of disclosure) outperform their less-
sustainable peers?
1.4 Research Limitations
We focus our study exclusively on manufacturing firms in South Africa listed on the FTSE/JSE
Responsible Investment Index 2016 adopted from a universe of the Johannesburg All Share
Index (JALSH). South Africa as an emerging economy takes the lead in Africa for the ‘Most
Sustainable Countries’ according to a survey carried out by Robecosam and KPMG (2017).
The country comes fourth globally after India, Malaysia and the United Kingdom in highest
rate of corporate responsibility information in annual financial reports (KPMG 2017). In
addition, South Africa accounts for 95% of sustainable investments in Sub-Saharan Africa
(IFC, 2011). Furthermore, International Finance Corporation (IFC, 2011) suggests that trends
exhibited from South Africa are more likely to radiate across other developing African nations
This motivates the focus of our study on the South African Market.
The choice of industry (manufacturing) is mainly motivated by the fact that according to our
study of sustainability disclosures on base year 2016, the industry was the third highest
contributor to GDP in the economy. It contributed 13.7% (percent) to the nations GDP coming
after Government and Finance industry (See Figure 1 below). Our choice is also accrued to the
fact that among the three top sectors, the manufacturing industry has the highest impact on the
environment with high resource consumption.

13
Figure 1: GDP growth per industry 2016
Source: Industrial Development Corporation South Africa (IDC, 2017)
We adopt the Statistics South Africa (Stattsa, 2014) definition and categorization of
manufacturing firms in South Africa as companies in the divisions: Furniture and other
manufacturing, Wood and wood products, paper, printing and publishing, Glass and non-
metallic mineral products, Petroleum, chemical products, rubber and plastic products,
Telecommunication and medical, Entire manufacturing industry, Electrical machinery, Food
and beverages, Textiles and clothing, Motor vehicles, parts and accessories and other transport
equipment, Basic iron and steel, non-ferrous metal products, metal products and machinery.
In addition, Schaltegger and Synnestvedt (2002) argue that results are more conclusive if
industries with similar characteristics and legislation are analyzed. Therefore, based on our
sampling bias our study is longitudinal in nature and may not be generalizable for the whole
economy but rather for only manufacturing industries in emerging markets.
Lastly, our study is limited to publicly available information on manufacturing companies
accessed through publicly used financial databases (Thomson Reuters and S&P Capital IQ) and
respective company websites included in our research sample. We also limit our time period
from 2013 to 2017 as earlier years’ sustainability reports for majority of the companies included
in the sample are not in existence. We further exclude companies that are subsidiaries of
Multinational Corporations (MNC) outside Africa to limit the spillover of parent-effects.
1.5 Target Audience
The study is primarily intended for companies in evaluating the impact of sustainability
practices on financial performance. The findings herein will inform managers on aligning
strategic decisions to sustainability outcomes. The secondary target group is academia and
students who study sustainability initiatives and economic performance.
14
1.6 Outline of the Thesis
We approach answering our research above through five chapters: Literature review,
Methodology, Data analysis and results, Discussion of findings and Conclusion.
Chapter 2: Literature Review will explain the main parts of our research namely: Sustainability,
Sustainability Reporting and Sustainability reporting and Disclosure and financial performance.
Chapter 3: Methodology discusses the research approach, sample size, data collection method
and how our data will be analyzed.
Chapter 4: Analysis of Empirical results discusses the results from the mixed method approach.
Chapter 5: Discussion of findings explains the results of the analysis in relation to the tested
hypotheses and the research question.
Chapter 6: Conclusion provides answers to our research question, implications, and
contributions to research and limitations to our study as well as suggestions to future research.

15
2 Literature Review
This chapter seeks to analyze existing literature in order to determine relevant theoretical
frameworks and hypotheses. We analyze existing literature to give the reader the knowledge
and understanding of sustainability and financial performance. The chapter explains different
aspects of sustainability and highlights the general trends on sustainability reporting/disclosures
and financial performance. Findings from previous studies are highlighted for a deeper
understanding before concluding with the hypotheses of this study.
2.1 Sustainability
According to the World Conservation Union (2006), sustainability is a concept that dates more
than 60 years back. It was pushed to the forefront by the Brundtland report (1987) which
attempted to define sustainable development as meeting ‘the needs and aspirations of the
present without compromising the ability of future generations to meet their own needs’ (p.39).
Viederman (1994) defined sustainability as “a participatory process that creates and pursues a
vision of a community that respects and makes prudent use of all its resources” (p.5). The
Brundtland definition according to Hopwood et al., (2005) clearly emphasizes the dependency
of humans on the environment for their well-being rather than merely exploiting resources.
In defining sustainable development, the Brundtland report further introduced three principles:
Environmental integrity, social equity and economic dimensions of sustainability. Slaper and
Hall (2011) summarized the economic aspect as dealing with the bottom line flow of money
from income, expenditure, taxes, business climate factors, employment and business diversity
factors. In the environmental dimension, they indicated that the variables represent
measurements of natural resources and reflect potential influences on the environments
viability. Finally, the social dimension represents variables on communities or regions that may
cover education, equity and access to social resources, health and wellbeing, quality of life and
social capital (Slaper and Hall, 2011).
Various definitions of sustainability have proposed incorporating the three dimensions
mentioned adopted from the Brundtland report. Barbier (1987) defined sustainability as “the
simultaneous maximization of the biological, economic system and social systems goals”
(p.103). Further, Institute of Directors of Southern Africa (IoD) (2009) define sustainability as
“…the primary, moral and economic imperative of the 21st century” (p8).
Different organizations and scholars refer to the term sustainability to mean many various
things. ‘Vision expressions,’ ‘ social recognition’, ‘ moral development’, ‘value change towards
a better future’, ‘corporate social responsibility’ (See: Lee, 1993; Clark, 1989; Van, 2003;
Waddock and Graves,1997) are some of the other diversity of terms used to mean sustainability.
Bansal (2002) found that some organizations do not distinguish the environmental aspect from
sustainability while others equate sustainability with economic sustainability. Relatedly,
Briassoulis (2001) argues that the concept of sustainability is understood instinctively but
remains a difficult one to express in concrete operational terms. Robinson (2004) talks about
apparent difficulties surrounding the definition of sustainability have led sustainability practices

16
to be indistinguishable from green-washing and branded as delusional, misrepresentational, and
duplicitous. In contrast, Van (2003) argues that sustainability has led organizations to rethink
their position and act in the ‘complex social context’ of which they are part of. Hubbard (2009)
further argues that the emergence of sustainability concepts does reflect an influential change
in global thinking which has caused firms to re-evaluate their approach to measuring
organizational performance.
Embarking on this study, we adopt the Brundtland definition on sustainability as ‘meeting the
needs of the present generation without compromising the needs of the future generation.’ We
also adopt the use of the three dimensions; social, environmental and economic (SEE) proposed
in the Brundtland 1987 report. This suggestion is supported by Slaper and Hall (2011) who
argue that the concept of these dimensions can be used by companies to encourage economic
development growth in a sustainable manner.
2.2 Sustainability reporting
Sustainability reporting also referred to as corporate social disclosure is defined by Songini and
Pistoni as “the complex of information, mainly not financial, that a company decides to publish
in order to communicate its performances concerning the impact on the relationship with the
environment and society” (2015, p.1). GRI (2016) defines sustainability reporting as “an
organization practice of reporting publicly on its economic, environmental and or social
impacts, and hence its contributions - positive and negative towards the goal of sustainable
development” (p.3).
We agree with both definitions of sustainability reporting as they do incorporate the three
dimensions of sustainability included in the Brundtland report. These dimensions were further
summarized by Elkington (1998) into the model he referred to as the ‘Triple Bottom Line’
(TBL) reporting whereby he stressed the importance of an organization reporting on its social,
environmental activities the same way it reports on its financial activities (See Figure 2: Triple
bottom line model)
Gray and Milne (2004) argue that TBL reporting shows the stakeholders where the actual
accountability lies. They further indicate that TBL reporting remains a mirage and will continue
to be since the practice of social and environmental reporting owes more to “rhetoric and
ignorance than to practice and transparency” (Pg. 7)
Figure 2: Triple bottom line model (Elkington, 1998)
PeopleSocial Performance
PlanetEnvironmental Performance
Profit Economic Performance
Sust
ain
abil
ity

17
In addition, similar to Ameer and Othman (2011), we approach the concept of sustainability
disclosures and sustainability reporting as synonymous to an organization’s take of its
legitimate existence in society. Sustainability disclosures in this case reflect sustainability
initiatives on the ground within business practices and therefore warranting the examination of
its relationship to financial performance.
2.2.1 Rationale for Sustainability reporting
Hubbard (2009) indicates that sustainability practices are triggered by legal obligations such as
employment standards accelerated by government, communities or customer pressure.
However, while sustainability reporting could be viewed as an obligation by companies, it
provides a balanced and reasonable representation of the sustainability performance of a
reporting company including both positive and negative contributions (Maubane et al., 2014).
Below we discuss the main drivers and benefits of sustainability reporting.
Bellringer et al., (2011) argue that legitimacy theory and stakeholder theory are the two main
theories that have been advanced to explain motives for sustainability reporting. We review
these two theories below followed by empirical studies on the motives for sustainability
reporting.
Legitimation Theory
Suchman (1995) expresses legitimacy to be a general perception that an entity’s actions are
proper, desirable and appropriate within a social-cultural context of beliefs, norms, values and
definitions. He further adds that it is a process through which an organization justifies its right
to exist to a peer or a superior system in a cultural setting. Suchman (1995) further highlights
three primary forms of legitimacy as pragmatic, moral and cognitive which separately hinge on
different behavioral dynamics elaborated herein.
Pragmatic legitimacy is based on self-interest and that of the organization’s most immediate
audience- in this case, the stakeholders (Suchman, 1995) .He indicates that these audiences
become constituencies who then scrutinize a firm’s actions to determine specific consequences
that accrue to them because of these behaviors after which they lend support to these
organizational policies in other words giving rise to exchange legitimacy. In addition, Suchman
(1995) indicates that pragmatic legitimacy gives rise to influence legitimacy which manifests
when these audiences support the organization because of perception that the firm supports their
broader interests.
Moral legitimacy hinges on audiences’ normative approval and evaluations based on pro-social
logic (Suchman, 1995). Within which he adds consequential legitimacy has audiences
evaluating a firm’s outputs, procedural legitimacy evaluates a firm’s procedures and techniques,
structural legitimacy evaluates a firm’s categories while personal legitimacy looks at a firm’s
representatives and leaders.
Cognitive legitimacy is based on inevitability and interpretability (Suchman, 1995). While
firms can source pragmatic legitimacy by redirecting resources to specific audiences, cognitive
legitimacy is harder to attain as unlike these other two it doesn’t rest on discursive evaluation
(Suchman, 1995).
18
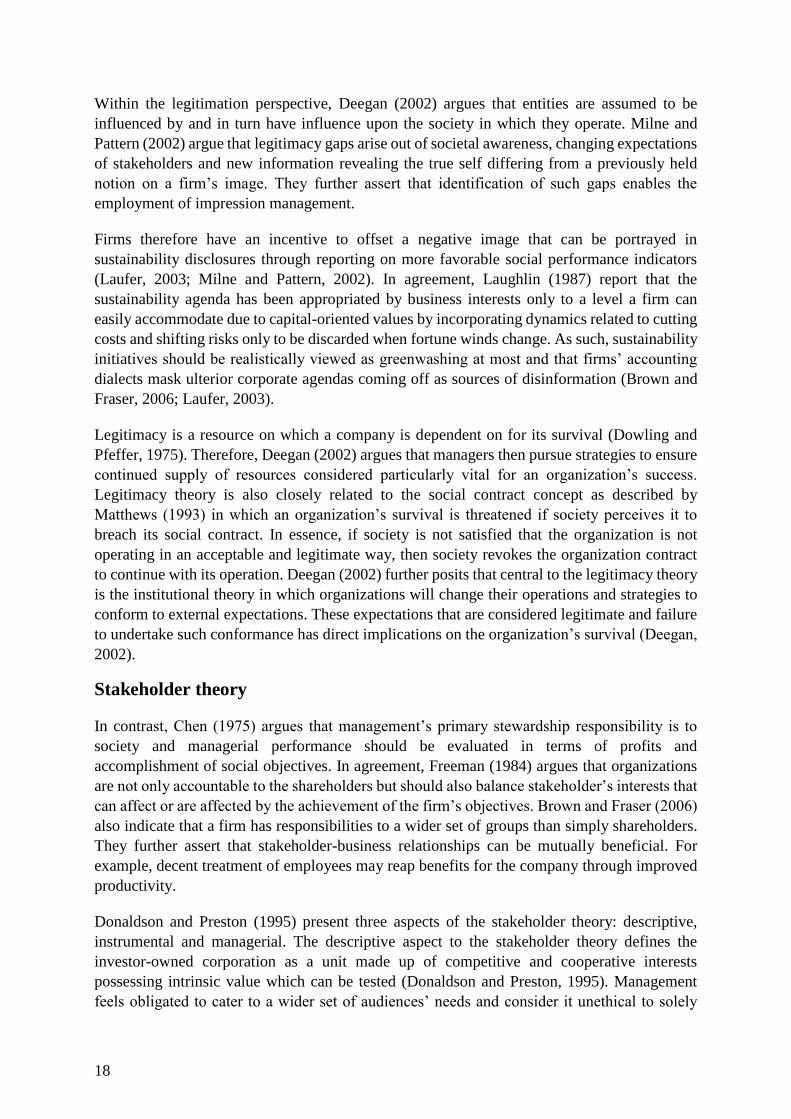
Within the legitimation perspective, Deegan (2002) argues that entities are assumed to be
influenced by and in turn have influence upon the society in which they operate. Milne and
Pattern (2002) argue that legitimacy gaps arise out of societal awareness, changing expectations
of stakeholders and new information revealing the true self differing from a previously held
notion on a firm’s image. They further assert that identification of such gaps enables the
employment of impression management.
Firms therefore have an incentive to offset a negative image that can be portrayed in
sustainability disclosures through reporting on more favorable social performance indicators
(Laufer, 2003; Milne and Pattern, 2002). In agreement, Laughlin (1987) report that the
sustainability agenda has been appropriated by business interests only to a level a firm can
easily accommodate due to capital-oriented values by incorporating dynamics related to cutting
costs and shifting risks only to be discarded when fortune winds change. As such, sustainability
initiatives should be realistically viewed as greenwashing at most and that firms’ accounting
dialects mask ulterior corporate agendas coming off as sources of disinformation (Brown and
Fraser, 2006; Laufer, 2003).
Legitimacy is a resource on which a company is dependent on for its survival (Dowling and
Pfeffer, 1975). Therefore, Deegan (2002) argues that managers then pursue strategies to ensure
continued supply of resources considered particularly vital for an organization’s success.
Legitimacy theory is also closely related to the social contract concept as described by
Matthews (1993) in which an organization’s survival is threatened if society perceives it to
breach its social contract. In essence, if society is not satisfied that the organization is not
operating in an acceptable and legitimate way, then society revokes the organization contract
to continue with its operation. Deegan (2002) further posits that central to the legitimacy theory
is the institutional theory in which organizations will change their operations and strategies to
conform to external expectations. These expectations that are considered legitimate and failure
to undertake such conformance has direct implications on the organization’s survival (Deegan,
2002).
Stakeholder theory
In contrast, Chen (1975) argues that management’s primary stewardship responsibility is to
society and managerial performance should be evaluated in terms of profits and
accomplishment of social objectives. In agreement, Freeman (1984) argues that organizations
are not only accountable to the shareholders but should also balance stakeholder’s interests that
can affect or are affected by the achievement of the firm’s objectives. Brown and Fraser (2006)
also indicate that a firm has responsibilities to a wider set of groups than simply shareholders.
They further assert that stakeholder-business relationships can be mutually beneficial. For
example, decent treatment of employees may reap benefits for the company through improved
productivity.
Donaldson and Preston (1995) present three aspects of the stakeholder theory: descriptive,
instrumental and managerial. The descriptive aspect to the stakeholder theory defines the
investor-owned corporation as a unit made up of competitive and cooperative interests
possessing intrinsic value which can be tested (Donaldson and Preston, 1995). Management
feels obligated to cater to a wider set of audiences’ needs and consider it unethical to solely

19
serve the shareowners’ interests (Donaldson and Preston, 1995). They further add that statutory
law and legal opinion have evolved in regarding the corporation’s mandate as that limited to its
owners with global trends requiring broader societal constituents’ needs be factored in
corporation’s practices and decisions.
The instrumental aspect of the theory examines connections or lack thereof between the
stakeholder management practice and achievement of corporate performance goals (Donaldson
and Preston, 1995). They further indicate that by adherence to stakeholder practices, the firm
will achieve its corporate performance objectives better than if it were to use rival approaches.
The classic agency theory representing the principal as owners and agent as the managers is
now expanded to include all other constituents making up the stakeholders as principals too
(Donaldson and Preston, 1995). They continue to advance that the principals are then drawn in
to agent activities in achieving efficiency for the firm thereby linking this theory to
organizational performance. The normative aspect recognizes stakeholders’ legitimate interest
in the firm’s activities as of intrinsic value and is exclusive of furthering the owner’s needs
(Donaldson and Preston, 1995). Through the normative aspect, they identify the philosophical
and moral guidelines that underpin management of the firm. Changes in law dictate that even
if a firm does not achieve profits and therefore does not satisfy its owners, it should ethically
engage in philanthropy besides abiding by law (Donaldson and Preston, 1995).
The managerial aspect of the theory evaluates cause-effect relationships and recommends
structures and practices for effective governance of constituents (Donaldson and Preston, 1995).
They advance that managers have been recognized as powerful constituents in stakeholder
management and may practice self-serving behaviors. The stakeholder theory though limits this
aberration by prohibiting attention on any one single constituency (Donaldson and Preston,
1995).
Deegan (2002) builds on Donaldson and Preston (1995) research arguing that the stakeholder
theory has two branches: ethical and managerial. He explains that the ethical branch provides
prescriptions on how organizations should treat their stakeholders which re-emphasizes the
responsibilities of organizations. He further informs that the managerial branch emphasizes the
need to manage stakeholder groups particularly those considered powerful. Managers therefore
have the incentive to disclose information about various initiatives to particular groups of
stakeholders more especially the powerful ones to conform to their expectations (Deegan,
2002). This is similar to the normative and descriptive aspects of the stakeholder theory
advanced by Donaldson and Preston (1995).
Agency theory
Venkataraman (2002) stresses that stakeholders do often have conflicting claims on the
organization and hence the entrepreneurial process of the firm through value creation is
supposed to address these arising conflicts. He adds that some of these conflicts arise through
the agency relationships between agents working on behalf of the shareholders and
stakeholders.
Jensen and Meckling (1976) infer that institutional pressures underscored by the agency
relationship guide managers as agents to look out for its principals’- the shareholder’s needs

20
(Waldman et al., 2006). The traditional role of the firm currently extends resource allocation to
its stakeholders; delving in activities traditionally dealt with by non-profits and the government.
The manager as the agent is therefore accountable to a broader audience - the principal
(Donaldson and Preston, 1995).
Furthermore, revisionist views have emerged informing that investors are increasingly aware
of sustainability investment benefits and are willing to pay a premium for it consistent with the
notion that increased discretionary disclosure practices trigger a favorable investor preference
(Altuwaijri et al., 2004).
That said, with both parties as utility maximizers; the agent doesn’t always act in the principal’s
best interest (Jensen and Meckling, 1976). If these agents translate the reputational advantage
associated with earning a certification emblem to prescribed standards as distancing the firm
from any alleged wrongdoing, these senior managers’ discharge of accountability towards
sustainability initiatives may reduce (Laufer 2003). Further, commoditization of compliance
increases white collar deviance if certain aspects of compliance is seen by managers as a hedge
against liability since in some firms, this is sufficient to shift risk of loss (Laufer, 2003).
Preston and O’Bannon (1997) capture managerial opportunism as arising through senior
managers cashing in on strong financial performance by reducing investments in sustainability
initiatives so as to further their own short-term personal gains. They add that in periods of weak
financial performance, these managers may try to offset and appear to justify the disappointing
results by publicly engaging in sustainable programs. The discretionary disclosure model
therefore capturing signaling issues related to sustainability disclosures explains why this trend
holds (Verrecchia, 1983).
The discretionary disclosure model advanced by Verrecchia (1983) postulates that while traders
have a rational expectation on a manager’s motive to withhold unfavorable reports, presence of
costs related to disclosure ‘introduce noise by extending the range of possible interpretations of
withheld information to include news which is actually favorable’ (Verrecchia,1983, p.82).
Disclosure-related costs in this regard include proprietary information (presenting proprietary
costs) that may potentially damage a firm. This information (disclosed or otherwise) acts as a
signal about the underlying assets a firm possesses (Verrecchia, 1983). He further advances
even if the information released is favorable; it sometimes may harm a firm’s prospects-subject
to which firms may elect to minimize these disclosures. Specifically in existence of proprietary
costs, speculation abounds on whether withheld information represents bad news or the
opposite but not good enough to warrant the incurrence of proprietary costs (Verrecchia, 1983).
He argues that in absence of proprietary costs though, managers practice full disclosure.
In order to avoid conflicts, Mendelow (1993) proposes that organizations need to first ascertain
who their stakeholders are and then determine the outputs desired by these stakeholders as this
process will then check the conflicting demands made by the different stakeholder groups. Gray
et al., (1997) agrees with Mendelow’s (1993) proposition and adds that through the application
of the stakeholder model, an organization will be able to make specifications of the
organization’s potential accountabilities.

21
In summary, Gray et al., (1997) argue that treating the legitimacy and stakeholder theory as two
separate theories is misleading as both theories are based on the assumption set in an economy.
This is supported by Deegan (2002) who indicates that the stakeholder theory provides insights
similar to those provided for in the legitimacy theory.
2.2.2 Empirical evidence for the rationale of sustainability disclosures
There have been numerous studies done by academics and researchers to examine the rationale
for sustainability reporting adopted by companies worldwide. Gray et al., (1997) study on
corporate social and environmental reporting indicated that legitimacy and stakeholder
pressures were the main reasons for the increased number of sustainability reporting of UK
companies studied over a period of 13 years (1979-1991).
Bellringer et al., (2011) research investigated the reasons for sustainability accounting by
companies in New Zealand. Results from this study showed that companies engage in
sustainability reporting for reasons of legitimation, accountability to stakeholders and for
financial incentives. Further, in a survey conducted by Ernst and Young (EY) (2016) on
members of the Center for Corporate Citizenship, improved reputation, increased employee
loyalty, improved access to capital, increased efficiency and waste reduction were the top
reasons cited by the professionals for reporting on sustainability. In addition, the survey
reported that companies were motivated to report because of transparency with stakeholders,
risk management advantages, stakeholder pressure, competitive advantage and brand
reputation.
KPMG (2017) survey of 4900 companies in 49 countries notes that regulation, stock exchanges
and investor pressure were the leading motivators and drivers for sustainability reporting.
Similarly, a study by Farneti and Guthrie (2009) on Australian firms showed that accountability
to stakeholders was the main motivation for reporting. However, in a study conducted by
Hedberg and Malmborg (2003) on Swedish companies indicated that companies reported on
sustainability because they were actually interested in the rationale of a sustainable world.
Additional reasons cited were to seek legitimacy in their organization fields through brand
reputation.
From these studies, it can be concluded that sustainability is motivated strongly more by
pragmatism and economic rationales rather than the idealistic desire to ensure a sustainable
world (Bellringer et al., 2011). In agreement Ehrenfeld (2005) asserts that new sustainability
reports do not come close to representing the requirements of true social sustainability.

22
2.3 Sustainability reporting/disclosures and financial
performance
2.3.1 Theoretical approaches to analyzing Sustainability
reporting/disclosures and financial performance
Management of sustainability performance requires a framework that links environment and
social sustainability initiatives to the business integrating the information with economic
information and sustainability reporting (Schaltegger and Wagner 2006). Several theories have
been discussed by academics in an attempt to link sustainability initiatives to firm performance.
They include the Stakeholder theory, Legitimacy theory, Dynamic integration theory, Slack
resources theory, Good Management theory and Theory of the firm. However, all these theories
are interlinked and build on each other. For this study, we focus on the slack resources and good
management theory and refer to the other theories for supplementary information.
Slack Resources and Good Management Theory
March (1979) definition of slack is captured by; ‘organizations do not always optimize, they
accumulate spare resources and unexploited opportunities which then become a buffer against
bad times’ (quoted in Stanford GSB, p.17). Bourgeois (1981) supplemented March’s definition
informing that organizational slack is an absorption mechanism that enables firms to adopt to
environmental discontinuities and shifts thus furthering innovation. It translates to extra
resources at a firm’s disposal that can be used to solve a myriad of problems and or facilitate
goal pursuit outside of those demanded for by the optimization principle (Bourgeois, 1981).
Both definitions of slack are similar. We however consider Bourgeois (1981) definition to be
more superior as it covers the financial, operational and strategic aspects of a business unit
hence its adoption.
Slack can develop as a result of either efficient (deliberate) use of resources arising from
accumulating resources deliberately for future use or inefficient use of resources (unintended)
arising from incomplete information about future developments as advanced by Gral (2013).
He further informs that slack can be created via actions of management or external factors to
the firm. This is supported by good management theorists’ argument that overall firm
performance arises out of the good practices of the management team (Waddock and Graves,
1997). In addition, Hansen and Wernefelt (1989) agree that environmental factors (social,
political, economic, technological) external to the firm affect overall organizational
performance.
Bourgeious (1981) informs that effective firm performance leads to profits which can be
translated into slack. Echoing similar sentiments, Waddock and Graves (1997) advances that
better financial performance results in slack resources which are then invested in sustainability
initiatives culminating in better corporate social performance. Gral (2013) further informs that
financial slack resources can act as a buffer in rapidly changing environments allowing
managers to have room for maneuvering. In addition, George (2005) adds that when firms
experience growth, excess resources are absorbed that will be used during periods of distress
thereby slack stabilizes the firm’s operations in ensuring continuity. Moreover, slack resources
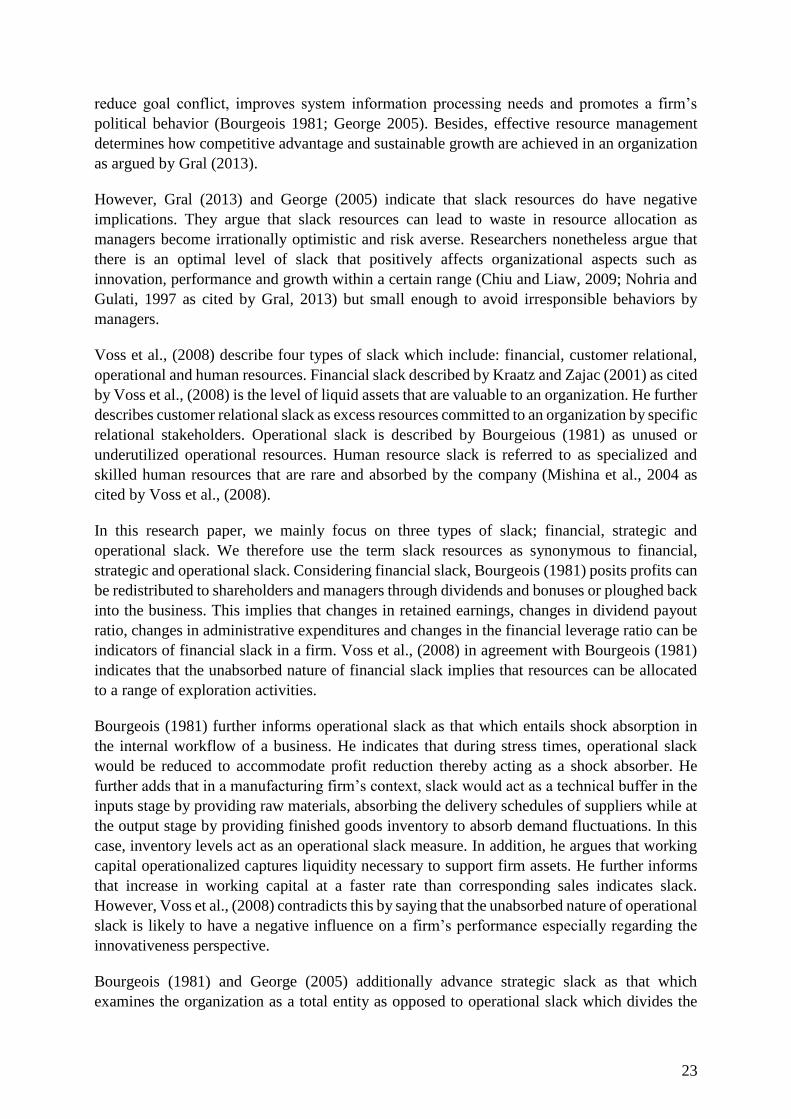
23
reduce goal conflict, improves system information processing needs and promotes a firm’s
political behavior (Bourgeois 1981; George 2005). Besides, effective resource management
determines how competitive advantage and sustainable growth are achieved in an organization
as argued by Gral (2013).
However, Gral (2013) and George (2005) indicate that slack resources do have negative
implications. They argue that slack resources can lead to waste in resource allocation as
managers become irrationally optimistic and risk averse. Researchers nonetheless argue that
there is an optimal level of slack that positively affects organizational aspects such as
innovation, performance and growth within a certain range (Chiu and Liaw, 2009; Nohria and
Gulati, 1997 as cited by Gral, 2013) but small enough to avoid irresponsible behaviors by
managers.
Voss et al., (2008) describe four types of slack which include: financial, customer relational,
operational and human resources. Financial slack described by Kraatz and Zajac (2001) as cited
by Voss et al., (2008) is the level of liquid assets that are valuable to an organization. He further
describes customer relational slack as excess resources committed to an organization by specific
relational stakeholders. Operational slack is described by Bourgeious (1981) as unused or
underutilized operational resources. Human resource slack is referred to as specialized and
skilled human resources that are rare and absorbed by the company (Mishina et al., 2004 as
cited by Voss et al., (2008).
In this research paper, we mainly focus on three types of slack; financial, strategic and
operational slack. We therefore use the term slack resources as synonymous to financial,
strategic and operational slack. Considering financial slack, Bourgeois (1981) posits profits can
be redistributed to shareholders and managers through dividends and bonuses or ploughed back
into the business. This implies that changes in retained earnings, changes in dividend payout
ratio, changes in administrative expenditures and changes in the financial leverage ratio can be
indicators of financial slack in a firm. Voss et al., (2008) in agreement with Bourgeois (1981)
indicates that the unabsorbed nature of financial slack implies that resources can be allocated
to a range of exploration activities.
Bourgeois (1981) further informs operational slack as that which entails shock absorption in
the internal workflow of a business. He indicates that during stress times, operational slack
would be reduced to accommodate profit reduction thereby acting as a shock absorber. He
further adds that in a manufacturing firm’s context, slack would act as a technical buffer in the
inputs stage by providing raw materials, absorbing the delivery schedules of suppliers while at
the output stage by providing finished goods inventory to absorb demand fluctuations. In this
case, inventory levels act as an operational slack measure. In addition, he argues that working
capital operationalized captures liquidity necessary to support firm assets. He further informs
that increase in working capital at a faster rate than corresponding sales indicates slack.
However, Voss et al., (2008) contradicts this by saying that the unabsorbed nature of operational
slack is likely to have a negative influence on a firm’s performance especially regarding the
innovativeness perspective.
Bourgeois (1981) and George (2005) additionally advance strategic slack as that which
examines the organization as a total entity as opposed to operational slack which divides the

24
organization into subunits for examination. It relates to employment of the resource by higher
management to experiment with novel ideas and deal with its competitive external environment
minimizing hiccups to a firm. While strategic slack allows for investment outside of the
traditional business realm through exploring new ideas, operational and financial slack absorb
workflow hiccups (such as accommodation of low profits by re-assigning funds) ensuring
processes run smoothly. These measures therefore impact managerial policy/ discretion.
Good management theory on the other hand advances that high correlation between
sustainability practices and overall firm performance (among them financial) arises from good
practices of the management team (Waddock and Graves 1997). Improved stakeholder
perception on the firm’s mandate besides its corporate function as a result becomes a basis for
competition as it leads to reduced stakeholder management costs or increased sales (Waddock
and Graves 1997). They further argue that this provides empirical basis for having financial
performance as a dependent variable based on previous studies.
Expounding on the good management idea, proponents of social impact hypothesis advance
that sustainability benefits outweigh the costs with high levels of sustainability indicators
perceived to indicate superiority in management skill leading to lowering of explicit costs
(Waddock and Graves 1997). Waddock and Graves (1997) inform that through this framework
tension exists between a firm’s explicit costs to its shareholders and implicit costs to its
stakeholders reflected in sustainable initiatives. Therefore, an attempt to lower implicit costs by
the firm through socially irresponsible acts will earn it a competitive disadvantage resulting in
even higher explicit costs employed through damage control or similar measures (Waddock and
Graves, 1997).
The above two theories complement each other and do not exist in isolation. Jones et al., (2007)
takes on both theories informing that high performing companies across a number of financial
indicators have effective management practices which spill over to sustainable activities and
have discretionary resources to engage in more sustainability disclosures. They add that this
differentiation factor in firms’ investment portfolios creates a positive image through which
stakeholders perceive them favorably. Lopez et al., (2007) underscores the same sentiments that
changes in values due to adoption of superior sustainability practices create shifts in resource
allocation reflected through changes in revenues. They add that cost savings are thought to
accrue due to better exploitation of resources by firms engaging in sustainability activities
which in turn reflect in higher profit growth. Therefore, a further differentiation should be
reflected through increased business volume seen in sales and turnover (Lopez et al., (2007).
On the flipside however, Lopez et al., (2007) caution that in the short term, the changes may be
minimal with the exception of scandalous actions of the firm impacting its performance
negatively whose effects will be immediate on sales. Another way profits would reduce is
through having surplus funds re-assigned to investments that have sustainability dimensions
which then translate as costs for the firm (Lopez et al., 2007; McGuire et al., 1988, Orlitzky et
al., 2003).
Hart and Ahuja (1996) advise that cost savings may also not be immediately realized because
of supply contract renegotiation and internal processes reorganization required when savings
have been realized from sustainability endeavors. In addition, when firms fail to meet

25
stakeholders’ needs, market fears generated results in risk premium to the firm culminating in
lost profit opportunities and or higher costs (McGuire et al., 1988: Preston and O’Bannon,
1997).
Barney (1991) advances in the resource-based view of the firm that for a firm to create value
for its shareholders and outperform its competitors to achieve competitive advantage, it should
be well organized to deploy valuable, inimitable and rare resources. These resources include
unobserved firm specific characteristics such as knowledge assets, contractual relationships
with suppliers, reputation and company culture (Barney, 1991; Garcia-Castro et al., 2009).
Management’s decision to improve its stakeholder performance therefore is endogenous and
likely correlated with these firm-specific characteristics (Garcia-Castro et al., 2009).
While Waddock and Graves (1997) conclude that there is a positive relationship between
financial performance and sustainability disclosures under both theories an improved study by
McWilliams and Siegel (2000) using similar variables with additional control variables of
advertising and R&D intensity arrived at a neutral conclusion. We therefore investigate whether
the neutral relationship holds in our empirical examination.
Alternative theory: Theory of the firm
The theory of the firm is based on the premise that managers make optimal choices in
attempting to maximize profits for the firm and therefore sustainability initiatives are perceived
as a form of investment (McWilliams and Siegel, 2001). They further highlight that the theory
looks at sustainability from two aspects of demand and supply. Two major sources of demand
of sustainability: consumer demand and demand from other stakeholders such as investors,
employee and communities are considered (McWilliams and Siegel, 2001). They indicate that
consumer related sustainability involves intangible attributes such as reputation. Organizations
therefore assess sustainability investment in terms of product differentiation seen in superior
attributes in outputs and use of sustainability-related resources in the production process as a
signal of firms’ commitment. (McWilliams and Siegel, 2001). As a result, stakeholder demand
increases and for the firm to fetch a diversification premium it may have to invest further in
Research and Development (R&D) resulting in product and process innovations valued by end-
users (McWilliams and Siegel, 2001).
On the supply side, McWilliams and Siegel (2001) note that to generate outputs bearing
sustainability attributes, the inputs needed would come at additional capital expenditure costs
which are higher for firms that delve more in sustainability than those who do not. Lopez et al.,
(2007) chimes in citing that reflective of the degree of resource exploitation and differentiation
aspect it is expected that there would be significant differences in the performance ratios
between firms listed on sustainability indexes and those not listed on these indices.
McWilliams and Siegel (2001), however, argue that there should be no difference between these
two groups at equilibrium. They indicate that sustainability attributes are like any other
attributes that a firm offers. Therefore, firms choose the level of attributes at which performance
can be maximized given the demand and cost of providing the attribute subject to the caveat
that managers are attempting to maximize shareholder wealth (McWilliams and Siegel, 2001).

26
In the demand and supply framework, McWilliams and Siegel (2001) advance that there is
some optimal level of sustainability for the firm to provide depending on the demand for the
characteristics and costs of generating them. Therefore, they add that companies that do not
supply sustainability attributes have lower costs and face a lower demand curve than firms
providing them. In essence, firms that supply sustainability attributes will have higher costs for
production than firms that do not supply these attributes yet produce similar goods (McWilliams
and Siegel, 2001). At equilibrium, both sets of firms (sustainability intense vs non-
sustainability intense) will equally be profitable (McWilliams and Siegel, 2001). They affirm
that the former may have higher costs but this is offset by higher revenues while the latter will
have lower costs but lower revenues as well.
McWilliams and Siegel (2001) add that capital expenditures in generating outputs bearing
sustainable attributes may not uniformly increase across firms since they carry a fixed cost
attribute and may lead to economies of scale. They inform that larger diversified firms will then
have lower average costs than smaller ones as they can spread costs leveraged across other
products. Managerial decisions therefore should factor implications for this cost in making
sustainability investment decisions (McWilliams and Siegel, 2001). ‘To maximize profit, the
firm should offer precisely that level of sustainability for which the increased revenue (from
increased demand) equals the higher cost (of using resources to provide sustainability)’
(McWilliams and Siegel 2001).
Diminishing returns has been theorized to come into play in the production sector sustainability
practices. Frosch and Gallopoulos (1989) posit that in the early stage of sustainability practices,
benefits of environmental initiatives undertaken are easily identifiable up to a point beyond
which significant process overhaul and or adoption of entirely new technology would be
required to sustain this green performance indicative of future increase in capital expenditure
and heavy investment in R&D. McWilliams and Siegel (2001) argue that consumers who value
sustainability are willing to pay a higher price for products with additional social characteristics
than an identical product without that characteristic. They highlight that it is also important to
note that sustainability attributes are dependent on certain characteristics of the market, degree
of product differentiation, industry life cycle, demographic and technological changes among
others.
Echoing similar sentiments, Lopez et al., (2007) inform that assuming sufficient economic
results secure a firm’s going concern; businesses can achieve long-term profits through
reorienting operations and processes contributing to the triple bottom line. They further add that
over time, these changes will then create differentiation elements a priori through superior
disclosure practices and ultimately in business processes for the firm earning a competitive
advantage.
This theory concludes by saying that there is an ideal level of sustainability which managers
can determine via cost-benefit analysis. Further, each firm makes optimal choices and hence
process at a profit maximizing level of output and that there is a neutral relationship between
sustainability and financial performance.

27
2.3.2 Empirical evidence on sustainability reporting/disclosures and
financial performance
Several studies have been carried out by different researchers regarding the link between
sustainability and financial performance with varying results. Different variables, various
methodologies and various companies in a range of years have been tested. Secondly, different
dimensions have been tested uniquely defined by several researchers. The results from these
studies hence bear varying conclusions (Simpson and Kohers, 2002).
Lopez et al., (2007) study on European companies listed on the Dow Jones Sustainability Index
(DJSI) index for the period of 1998-2004 investigated whether there were significant
differences in performance between companies that adopted sustainability practices and those
that did not. The objective of their study was to obtain empirical evidence that the adoption of
sustainability practices influence accounting indicators. From the study, they noted that
significant changes were only observed in profitability indicators and no significant differences
were found to variations in total assets, capital or revenues. They, therefore, concluded that the
differences in performance were due to changes in costs.
Similarly, Ameer and Othman (2011) modelling after Lopez et al., (2007) tested whether
companies that have superior sustainable practices have higher financial performance compared
to those that do not engage in such practices. The study constituted of top 100 sustainable
companies from developed and emerging markets for the period of 2006-2010. Results from
the study indicated that higher sales growth, return on assets, profit before tax and cash flows
were significant compared to the control group. These findings differ from Lopez et al., (2007)
who found no significant differences in profitability ratios.
Waddock and Graves (1997) results indicate that there is a positive relationship between
sustainability and prior financial performance. This they motivated was brought on by the fact
that firms with available resources can afford sustainable initiatives unlike firms without
available resources as those have little ability to make discretionary investments. Their results
were based on a sample of S&P 500 companies tested for the period of 1989-1991.
A study carried out by Hillman and Keim (2000) on Fortune 1000 between the periods of 1994-
1996 tested the relationship between shareholder value, stakeholder management and social
sustainability. They argued that building better relationships with primary stakeholders helps
firms develop valuable assets and could lead to increased shareholder wealth unlike using
corporate resources for social issues not related to primary stakeholders. Their outcomes
highlight that stakeholder management leads to improved shareholder value whereas social
sustainability is negatively associated with shareholder value. They further add that if an
activity is directly tied to primary stakeholders, then investments may benefit not only
stakeholders but also lead to increased shareholder wealth.
McWilliams and Siegel (2000) research investigated the notion of misspecifications of models
used in the linking of corporate social responsibility to financial performance. They
demonstrated the flaws existing in economics studies of the relationship between social and

28
financial performance. They regressed the model estimated by Waddock and Graves (1997) by
controlling for variables that included size, industry and risk. This replica model additionally
controlled for R&D. They argued that R&D leads to product and process innovation which
enhances firm productivity and hence excluding it in an econometric model would be
problematic. From re-specifying the model, the results indicated a neutral relationship between
CSR and financial performance which varied from Waddock and Graves (1997) who indicated
a positive relationship.
Jones et al., (2007) study investigated market returns and financial performance of entities
engaged in sustainability reporting. Top 100 companies listed on the Australian Stock Exchange
for the period 2004 were used for the study. Results indicated that sustainability index is weakly
associated with abnormal returns. However, the weakness in the relationship varied by industry
with some industries having weaker negative returns than others. Jones et al., (2007) concluded
by suggesting that industry may be influential on reporting on sustainability information. The
second construct of financial performance indicated that there is a generally positive
relationship between sustainability indices with financial performance since many various
industries were analyzed.
Gray et al., (2001) studied the social and environmental disclosures and corporate
characteristics of Top 100 UK companies for the period 1988 to 1995. Their results indicated
that the relationship between social and environmental disclosures and company size and profit
characteristics tend to vary over time. The variability in their results could be explained by
industry sector suggesting that such factors play an important role in improving the explanatory
power in the model. They conclude by noting that while researchers claim that there is a direct
link between size, profit and industry to social and environmental disclosures, this is highly
plausible as there was little systematic evidence from the sample reviewed.
McGuire et al., (1988) similarly investigated the relationship between corporate social
responsibility and firm financial performance. Their study was based on companies in the
Fortune 100 magazine ratings between the years 1983 to1985. Results indicated that prior
performance of firms in terms of stock market returns and accounting based measures were
more closely related to Corporate Social Responsibility than subsequent performance. In
addition, the results indicated that measures of risk were closely related with Corporate Social
Responsibility. Below we provide a summary of previous studies as discussed above.

29
Table 1: Summary of previous research
Study Topic Time data Index Results
Lopez et al.,
(2007)
Sustainable
development and
Corporate Performance
1998-2004 DJSI-
European
countries
Significant relationships
with profitability indicators.
No significant relationships
with non-profitability
indicators.
Ameer and
Othman (2011)
Sustainable practices
and corporate financial
performance
2006-2010 Global 100
companies
Higher profitability over
time for sustainable firms
than non - sustainable firms.
Waddock and
Graves (1997)
Corporate Social
Performance and
Financial Performance
Link
1989-1991 S&P 500 Positive relationship
between financial
performance and CSP for
prior performance
Hillman and Keim
(2001)
Shareholder Value,
Stakeholder
Management, And
Social Issues: What's
The Bottom Line?
1994-1996 Fortune 1000 Activities directly linked to
primary stakeholders lead to
increased shareholder wealth
unlike those not directly
related.
McWilliams &
Siegel (2000)
Corporate Social
Responsibility And
Financial Performance:
Correlation Or
Misspecification?
1991-1996 DSI 400 Neutral relationship between
CSR and financial
performance.
Jones et al.,(2007) Empirical examination
of the market returns
and financial
performance of entities
engaged in
Sustainability Reporting
2003-2004 Top 100
Australian
Stock
Exchange
Negative relationship
between sustainability
disclosures and abnormal
returns.
Positive relationship
between sustainability
indexes and financial
performance.
Gray et al., (2001) Social and
Environmental
Disclosure and
Corporate
Characteristics:
1988-1995 Top 100 UK
companies
Relationship between
sustainability and disclosures
varied over time.

30
Study Topic Time data Index Results
McGuire et al.,
(1988)
Corporate Social
Responsibility And
Firm Financial
Performance
1983-1985 Fortune
Magazine 131
companies
Prior performance of stock
returns and accounting based
indicators are closely related
to Corporate Social
Responsibility.
Risk based measures were
also closely related to CSR.
As seen, hardly any studies have been conducted covering the emerging market and secondly,
the findings from the above studies are contradictory.
2.4 Hypothesis development
To conduct our investigation on the relationship between sustainability disclosures and
financial performance, we develop different hypotheses to be tested empirically. The
hypotheses are based on theories discussed above and findings from similar studies done by
different researchers. Our hypotheses are based on two main constructs, Sustainability
disclosure and financial performance.
Waddock and Graves (1997) argue that highly profitable firms are more likely to engage in
sustainable practices/disclosures than their counterparts and hence there is a positive
relationship between sustainability disclosures and profitability. As earlier informed, this study
faced endogeneity problems which when accounted for affects the relationship between the
investigated variables. This is evidenced by a study conducted by McWilliams and Siegel
(2000) who corrected for misspecifications resulting in a neutral relationship between
sustainability disclosures and financial performance. In addition, the theory of the firm as
advanced by McWilliams and Siegel (2001) stipulates that managers make optimal choices at
a profit maximizing level of output and therefore, there is an ideal level of investment
determined through a cost-benefit analysis.
This insight brings us to our Hypothesis 1 taking the South African context into consideration.
H1: There is a neutral relationship between sustainability disclosures and value of the firm for
FTSE/JSE Responsible investment index manufacturing companies and less-sustainable
manufacturing companies (control group) over the period 2013-2017.
Further, previous studies exploring the relationship between sustainability disclosures and
financial performance tend to be geared towards the stakeholder theory when explaining results.
However, intervening variables such as slack resources do have an impact on the relationship.
Some empirical studies have indicated that there is a positive relationship between
sustainability disclosures and firm performance (See Ameer and Othman 2011; Waddock and
Graves 1997; Lopez et al., 2007) while other studies have indicated weak and neutral
relationships between sustainability disclosures and firm performance (See Gray et al., 2001;
Hillman and Keim 2001; Jones et al., 2007).

31
We go further and test whether there would be significant differences in financial performance
ratios as a result of adoption of more sustainable practices by firms. Waddock and Graves
(1997) inform that better financial performance results in slack resources which are then
invested in sustainability initiatives culminating in better corporate social performance.
McGuire et al., (1988) inform that expenditure in discretionary programs such as social
programs is more sensitive to slack resources with more profitable firms more willing to
undertake sustainability initiatives unlike less profitable companies. Ameer and Othman (2011)
inform that sustainable companies have a competitive advantage over unsustainable companies
and this is reflected in reduction in costs therefore bringing about higher cash flows and profits.
While Ameer and Othman (2011) results indicate that higher sales growth, return on assets,
profit before tax and cash-flows were significant compared to the control group, Lopez et al.,
(2007) found no significant differences in profitability ratios between sustainable and
unsustainable firms.
These findings hence bring us to our second hypothesis:
H2a: Profitability of most sustainable manufacturing companies ratified by FTSE/JSE
Responsible investment index is higher than profitability of less sustainable manufacturing
companies (control group) following on slack resources and good management theory over the
period 2013-2017.
H2b: Cash Position of most sustainable manufacturing companies ratified by FTSE/JSE
Responsible investment index is higher than cash position of less sustainable manufacturing
companies (control group) following on slack resources and good management theory over the
period 2013-2017.
Hilman and Keim (2001) posit that due to reporting practicalities, sustainability disclosure is
not expected to have an immediate effect on value of the firm. They therefore examined a lagged
effect on all independent variables in their empirical study finding no significant differences in
the 3 year lag model.
We therefore investigate whether this relationship holds in our third hypothesis:
H3: Previous financial performance, captured by slack resources allocation (retained earnings
and working capital) and profitability influences current sustainability disclosures and value
of the firm for FTSE/JSE Responsible investment index manufacturing companies and less-
sustainable manufacturing companies (control group) over the period 2013-2017.
2.5 Chapter Summary
This chapter has discussed existing literature in relation to our topic of sustainability disclosures
and financial performance. Section 2.1 discusses our different definitions and understandings
of sustainability by different academics. For the purpose of this study, we adopt the
sustainability definition in the Brundtland report (1987) whereby sustainability is defined as
“meeting the needs and aspirations of the present without compromising the ability of future
generations to meet their own needs”. This is attributed to the fact that this definition clearly
emphasizes the dependency of humans on the environment for their well-being rather than

32
merely exploiting resources (Hopwood et al., 2005). Further this section discusses the three
broad dimensions of sustainability: Environmental, Social and Economic sustainability. Section
2.2 discusses the developing norm of sustainability reporting focusing on two theories that
ground why companies are increasingly reporting on sustainability; legitimacy and stakeholder
theory. Reasons for sustainability reporting for firms are mainly hinged on these two theories.
The other reasons for reporting such as risk management; financial performance, increased
employee etc. are majorly attributed to these two theories. Section 2.3 discusses sustainability
reporting and financial performance focusing on the slack resources and good management
theory as linking theories.
According to slack resources theorists: Bourgeois (1981) and George (2005), firms that have
spare resources are likely to indulge more in activities or opportunities presented than their
counterparts without slack resources. On the contrary, the good management theorist, Waddock
and Graves (1997) argue that high correlation between sustainability practices and financial
performance arises from the good practices of the management team. We have gained an
understanding of the topic by looking at empirical evidence on sustainability reporting and
financial performance. The results tend to be varying as researchers tend to use different
methodologies in form of variables tested and different definitions of sustainability. Finally,
we conclude with Section 2.4 in which we develop the hypotheses of the study from the
literature and empirical findings discussed.
33
3 Methodology
This section explains and motivates our research approach; followed by the data collection
technique, sample size, how the hypotheses are operationalized into variables, and how
econometrics is applied in data processing. Lastly, we discuss the limitations, validity and
reliability of our chosen research design.
3.1 Research Approach
We apply a deductive approach also known as theory testing whereby our goal is to test
concepts and patterns known from theory using new empirical data (Bhattacherjee, 2012).
Bhattacherjee (2012) argues that a deductive approach is most productive when there are many
competing theories and when the researcher is interested in knowing which theory works best
under what circumstances. One theory, stakeholder theory, has been heavily used by academics
to explore the relationship between sustainability reporting and financial performance.
However, for this paper, we explore this relationship using the slack resources theory and the
good management theory which have hardly been investigated.
Saunders et al., (2010) argues that there is no research approach inherently superior to the other.
He further argues that the choice of approach should be guided by research questions,
objectives, extent of existing knowledge and the amount of time available. In light of this, the
main purpose of this study is to investigate the relationship between sustainability disclosures
and financial performance. For the purpose and aim of this paper, we employ the idea of
complementarity as referred to by Hammersley (1996) cited by Bryman and Bell (2013)
whereby we use both qualitative and quantitative research for different aspects of the research
purpose to be dovetailed and harmonized hence a mixed method approach.
A quantitative method is best suited for investigating a relationship on numerical data as argued
by Bryman and Bell (2013) and more relevant for theory testing hence our choice. Further for
this approach, we use both inferential and descriptive analysis, where we statistically describe,
aggregate and present our two constructs and test our hypotheses. Since the relationship
between sustainability and performance is heavily accrued to the cultural setting and the country
in which an entity operates in (Schaltegger and Synnestvedt, 2002), a qualitative research in
form of semi-structured interviews would deepen the understanding of the sustainability
environment in South Africa. The qualitative method provides contextual information
supplementing findings from the quantitative method (Bryman and Bell, 2013).
In addition, our choice of a mixed method approach is motivated by the fact that most studies
on sustainability and financial performance are more quantitative focused. Introducing a
qualitative approach to the research provides clearer contextual information to supplement the
findings of quantitative research while enhancing the generality of findings as indicated by
Bryman and Bell (2013).

34
Our hypotheses derived from the literature review are highlighted below:
H1: There is a neutral relationship between sustainability disclosures and value of the firm for
FTSE/JSE Responsible investment index manufacturing companies and less-sustainable
manufacturing companies (control group) over the period 2013-2017.
H2: Profitability of most sustainable manufacturing companies ratified by FTSE/JSE
Responsible investment index is higher than profitability of less sustainable manufacturing
companies (control group) following on good management and slack resources theory over the
period 2013-2017.
H2b: Cash Position of most sustainable manufacturing companies ratified by FTSE/JSE
Responsible investment index is higher than cash position of less sustainable manufacturing
companies (control group) following on slack resources and good management theory over the
period 2013-2017.
H3: Previous financial performance, in time period t-1 to t-3, captured by slack resources
allocation (retained earnings and working capital) and profitability influences current value of
the firm for FTSE/JSE Responsible investment index manufacturing companies and less-
sustainable manufacturing companies (control group) over the period 2013-2017.
Hypotheses one and three will be tested through a regression analysis while hypothesis two will
be observed from a run of descriptive statistics.
3.2 Sample size
Our sample was derived from a base universe of Financial Times Stock Exchange
/Johannesburg Stock Exchange (FTSE/JSE) Responsible investment index for the year 2016
which ranks JSE All share index most sustainable firms in South Africa. The FTSE/JSE
Responsible investment index firms had a total of 69 constituents in the period examined 2016.
We applied a number of screens to derive our study sample outlined further. Interested in
manufacturing firms only as earlier defined by the national statistical service of South Africa
(Stattsa, 2014), we narrowed the sample down to 16 manufacturing firms. Further, we excluded
firms that are subsidiaries of multinational corporations (MNCs) to limit parent effects and
ensure homogeneity in disclosure practices thus narrowing down to 13 firms.
Another control group of 13 peer manufacturing firms listed on JSE All Share Index platform
but not featured on the Responsible Investment Index for the year 2016 was determined for the
study period 2013-2017. The JSE All share index is a market capitalization-weighted index
with constituent companies making ‘up the top 99% of total pre- free float market capitalization
of all listed companies on the Johannesburg Stock Exchange’ (Bloomberg 2018). Company
matching for the control group was based on similarity in activity sectors and size captured by
total sales, total assets or total market capitalization of a plus or minus 20% of sampled firms.
The FTSE/JSE Responsible Investment Index was chosen for reasons explained herein: First,
the existence of the index gives credence to sustainability practices and value creation of firms
and models closely around the UNGlobal compact and the widely adopted GRI index.
Secondly, the index ratifies firms listed on the FTSE/JSE All Share Index platform as

35
sustainability champions. Third, fulfilment of sustainability criteria does inform on best
practices relating to information disclosure on sustainability matching the regulators.
FTSE/JSE responsible investment index was adopted by the Johannesburg Stock Exchange
after its predecessor the Sustainable Responsible Investment (SRI) index was discontinued in
2015. This SRI index, founded on the triple bottom line principles was launched in May 2004
using the Global Reporting Initiative (GRI) guidelines as a reference and recommendations
from the King III report on Corporate Governance in South Africa (Maubane et al., 2014). The
FTSE/JSE index was launched in October 2015 replacing the SRI to identify South African
companies with leading environmental, social and governance practices (FTSE, 2018). The
ratings on the FTSE/JSE Responsible Investment are based on FTSE Russell’s Environment,
Social and Governance (ESG) considerations (FTSE, 2018). See Figure 3 on objective of ESG
ratings. The Environmental pillar measures the quality of a company’s management of
Environmental Issues; Social pillar measures the quality of company’s social issues while the
Governance pillar delves in the management of governance issues of the triple bottom line
including corporate governance (FTSE, 2018). 300 indicators are included in each pillar and on
average, 125 indicators are applied per company (FTSE, 2018).
The FTSE Russell ESG ratings are based on a transparent and consistent methodology that
measures risks and performance across the ESG areas (FTSE, 2018). These ratings not only
aim at managing exposure to ESG aspects, but also meet manifested stewardship requirements,
integrate ESG data into securities and portfolio analysis and implement ESG- aware investment
strategies (FTSE, 2018).
Figure 3: Objective of ESG ratings
Source: FTSE (2018)
The key features of the ESG ratings and data model is that it minimizes subjectivity by having
clearly defined rules for assessing and rating companies (FTSE, 2018). The ESG ratings and
data model also has a separate measure for exposure calculated using the exposure weighted
average allowing users to identify which ESG models are relevant for a given company
(FTSE, 2018). The data is based on publicly available information of the companies and is not
collected via private surveys therefore making the judgement independent (FTSE, 2018).
Finally, the ESG data model is overseen by an independent external committee comprising of

36
experts from investment community, business, non-government organizations, unions and
academia making the ratings credible (FTSE, 2018).
3.3 Data Collection Method
A mix of primary and secondary data collection methods was used. Traditional annual
integrated reports and independent sustainability reports were scoured from the companies’
websites primarily for information on sustainability disclosures for the selected sample. Data
on financial performance for each company was sourced secondarily from Standard & Poors
CapitalIQ financial database and Thomas Reuters.
Secondary data has its limitations as it has been collected for presumably different purposes
and may not have been collected in a systematic manner as indicated by Bhatarcharjee (2012).
Saunders et al., (2010) add that secondary data may not match the needs of the researchers.
However, given the different reviews on reliability of market-intelligence databases posted on
Trustradius (2018), the databases we use have no negative reviews. Besides, Bryman and Bell
(2013) argue that secondary data is high quality data because rigorous procedures are usually
applied in their generation and are additionally reviewed by highly experienced and qualified
analysts and researchers.
Primary data was also sourced by carrying out semi-structured interviews with specialists on
sustainability affairs in South Africa. A semi structured interview is defined by Bryman and
Bell (2013) as one in which a ‘researcher has a list of questions on fairly specific topics to be
covered……but the interviewee has a great deal of leeway on how to reply’ (p. 467). A semi-
structured interview is relevant for adoption in our research since the study has a fairly clear
focus given the subject themes obtained from the quantitative study
We conducted a web-search to aid the identification of our interview experts. Our key words
were ‘Sustainability reporting in South Africa’ and ‘Sustainability Specialists in South Africa’.
We obtained three e-mail addresses and proceeded to contact the experts. We received one
positive reply who recommended three other specialists in the sustainability field whom we
contacted. We received two positive responses from these specialists hence bringing the total
number of interviews to three. It is worth noting that all the participants have solid knowledge
and a wealth of experience spanning several years on sustainability practices and initiatives in
an emerging economy perspective more so in South Africa. Since different academics,
researchers and field experts tend to define sustainability dimensions differently, we explained
to the interviewees the different dimensions of sustainability our study covers. The interviews
were recorded and transcribed to obtain an appropriate understanding of the interviewees’
perspective on the topic. Bryman and Bell (2013) argue that the anonymity and privacy of those
who participate in the research process should be respected. We therefore exclude the names of
the persons we interviewed and refer to them as A, B and C.
Lastly, Fusch and Ness (2015) posit that failure to reach data saturation has an impact on the
quality of the research and therefore hampers the content validity. They further argue that there
is no one-size-fits-all in relation to the number of interviews to be conducted. It is best to think
of data in terms of rich and thick (Dibley, 2011 as cited by Fusch and Ness (2015) rather than
the sample size (Burmeister and Aitken, 2012 as cited by Fusch and Ness, 2015). With this

37
insight, we believe that our sample size of 3 is representative enough as the interviewees are
specialists with undoubted expertise and knowledge in the field of sustainability and hence the
results are enough to reach data saturation.
Below, we outline the way in which the interviews were carried out.
Table 2: Interview summary
Interviewee Form Structure Date Duration
A Telephonic Semi-structured 9 May 2018 35 minutes
B Telephonic Semi-structured 11 May 2018 23 minutes
C Telephonic Semi-structured 11 May 2018 53 minutes
The questions of the interview were guided by our research questions and preliminary findings
from the quantitative study. Further, our interview guide was prepared according to guidelines
proposed by Bryman and Bell (2013). They advise that the interview guide should have a certain
amount of order for the questions to flow reasonably well, questions be formulated in a way
that enables one to answer their research questions, using comprehensible and relevant
language. See Appendix 1 on the interview questions.
3.4 Longitudinal study
Lopez et al., (2007) study on sustainability and performance recommended that a longer time
frame be analyzed to determine continuity of sustainability practices and effects on firm
performance. This in agreement with Bryman and Bell (2013) and Saunders et al., (2010) who
argue that a longitudinal design helps map changes in business and management research
allowing causal inferences to be made. We adapted this recommendation by carrying out a
longitudinal study covering a period of five years (2013-2017).
3.5 Data Analysis
3.5.1 Regression model
We used content analysis method to analyze sustainability data from the sustainability reports/
annual integrated reports. This method enabled use of sustainability disclosures as a variable in
the regressions run analyzing its relationship and or influence on financial performance.
Regressions for the causal model were run on E-views10 statistical software.

38
Content analysis is defined by Bryman and Bell (2013) as an ‘approach to the analysis of
documents and text that seeks to quantify content in terms of pre-determined categories in a
systematic and replicable manner’ (p. 289). This definition conforms to our use of content
analysis to review reports on sustainability disclosures for the selected sample enabling the
quantification of sustainability as a variable in a regression run. Our coding manual or content
analysis dictionary as referred to by Bryman and Bell (2013) is adopted from Dawkins and
Ngunjiri (2008). Contents in a text with the sentence as the unit of measure were systematically
analyzed through selective choosing of sample text as opposed to random methods and reduced
to mutually exclusive categories (Bhattacherjee, 2012; Ameer and Othman 2011). A score was
assigned per disclosure type and further aggregated per firm to derive the sustainability variable.
A number of researchers use the scoring methodology (Ameer and Othman 2011; Jones et al.,
2007; Altuwaijri et al., 2004) in empirical measurement of financial performance to deduce the
sustainability variable. We scored the key issues based on uncovering a similar pattern as did
Dawkins and Ngunjiri (2008) on four level of activities in the sustainability reports after which
numerical ranking was assigned to these activities. Dawkins and Ngunjiri (2008) were inspired
by researchers: Hackston and Milne (1996), Thompson and Zakaria (2004), Warsame et al.,
(2002) and Wiseman (1982), earlier works. The scoring adopted a scale of 0 to 3. 0- no policy
disclosure, 1-policy description, 2- policy activity, and 3- policy outcome. This approach is
considered superior to others used by academics as in its simplicity minimizes individual
judgement/ too much subjectivity further allowing for replicability and reduction of the margin
of error.
The table below summarizes the coding criteria used as explained above.
Table 3: Summary of coding criteria
Score Activity Criteria
0 no policy disclosure no mention was made of ESG activities
reporting dimension
1 policy description General mention of a ESG activities but
gave no indication of a desired level of
performance
2 policy activity ESG activities were indicated but in a non-
measurable manner
3 policy outcome ESG activities were indicated but in a
measurable manner
We further adopted four indexes in the definition of sustainability as proposed by Fadul (2004):
Environmental index, Community Index, Diversity Index and Ethical Index. He argues that
these four indices are indicators of social performance which can in turn contribute to firm

39
value. He defines the Environmental Index as one that measures a company’s effort to do
business in a manner that minimizes negative impact on the environment and Community Index
as one that measures investments a company makes to help communities in which it operates.
He additionally defines Diversity Index as a measure of what the company advocates for and
builds a workforce with equal employment opportunity and the Ethical Index as to measure
whether the company operates in a manner consistent with expected business conduct.
Specific questions adopted from Fadul (2004) to aid our content analysis are included in
Appendix 2. A sample of our content analysis scoring has been included in Appendix 3. The
unit of analysis is sentences since they are more reliable than words (Milne and Adler, 1999).
It is important to note that the scoring applied was purely subjective since we lack an insight
on actual implication for these actions on the ground. The aggregate score for total firms
analyzed (split via more sustainable and less sustainable firms) was then used to derive the SSI
score discussed below in Section 3.5.3.
Regarding the entire quantitative analysis, the Data set is a panel data as it has both cross-
sectional and time dimensions appropriate for a pooled Ordinary Least Squares (OLS)
regression. A preliminary descriptive statistics analysis was done with outliers revealing
skewness defined as four standard deviations from the mean further corrected for as outlined in
the subsequent section. Total number of observations narrowed down to 121 from an initial 130
giving an unbalanced panel data structure.
3.5.2 Model specifications
In it ‘pays to be green’ literature, measures of firms’ economic performance are understood in
form of financial ratios and market-based measures (Altuwaijri et al., 2004; Wagner, 2007).
Our objective centers around costs and benefits from innovations in processes and or
productivity gains/loss in embracing more sustainable initiatives. We specified three
multivariate equations in which one variable is a function of several explanatory variables.
A number of common financial performance and operations measures were used to analyze
variations if any accruing from adoption of sustainable practices. Additionally, to control for
model misspecifications and variable omission bias that plagued previous studies, we include a
number of variables that have not been widely used despite evidence of their explanatory power
(see McWilliams and Siegel 2000) as highlighted below.
To determine direction of causality, we adopt Waddock and Graves (1997) view that the
corporate social performance is both a predictor and a consequence of the firm’s financial
performance. Majority of extant research have treated indicators of sustainability as an
independent variable that predicts firms’ financial performance (Garcia-Castro et al., 2009). We
therefore model direction of causality from the sustainability indicator to Tobin’s Q after
controlling for firm specific factors.

40
3.5.3 Dependent Variable
A number of studies (Waddock and Graves (1997); McWilliams and Siegel (2000); Garcia-
Castro et al., 2009) have embraced accounting measures: ROA, ROE and ROS as appropriate
variables for measuring firm performance. Hillman and Keim (2001) caution though that these
measures focus more on firm’s historical performance and are more short term in nature
therefore falling short of capturing long term value created by the firm. Further they inform that
these accounting measures largely capture transactional aspects which are easily duplicated by
competitors while coming short of adequately assessing the relational intangible aspects of
value in sustainability activities. Market-based measures too have been equally faulted as giving
credence to investors’ evaluation of a firm over other constituencies that hold claims to a firm
(McGuire et al., 1988). In light of this, we use measures of financial performance and slack
including both accounting-based and market-based measures.
Tobin Q is a common proxy for firm value denoted by ratio of a firm’s market value to its asset
replacement costs (Hillman and Keim, 2001). Conceptually a measure of value added by
management, Tobin’s Q as a measure of economic profit is more forward looking capturing the
market’s perception of current and potential profitability (Huselid, 1995). He adds that there is
widespread agreement that capital market measures are superior to accounting measures which
can be affected by timing issues, measurement errors and adjustment for depreciation. Previous
studies that have used Tobin Q and its variations as a measure for economic profit are Garcia-
Castro et al., (2009) and Huselid (1995). They however used a simplistic market value to book
value ratio.
Extant literature investigating the role of sustainability disclosures to firm value have regressed
Tobin’s Q against several variables (Dowell et al., 2000; King and Lenox 2001; Konar and
Cohen 2001; Ameer and Othman 2011).
Variations of Tobin’s Q do exist:
i. Wagner (2010) uses log of the ratio of market value to replacement costs.
ii. Dowell et al., (2000) summed firm equity value with net current liabilities and book
value of long term debt while calculated replacement costs as sum of net value PP&E
to book value of inventory.
iii. Konar and Cohen (2001) use sum of market value of equity, debt and preferred stock to
replacement value sum of PP&E, Inventory and short-term assets.
iv. King and Lenox (2001) used sum of firm equity value, net current liabilities and book
value of long term debt dividing this by book value of total assets
For simplicity we adopt market value of equity ratio to book value of total assets.

41
3.5.4 Independent Variables
SSIit is a sustainability scoring index based on content analysis of firm i over time period t.
Historical studies have treated indicators of sustainability as an independent variable that
predicts firms’ financial performance (Castro 2009). Heterogeneity problems in previous
research have been advanced due to lack of a uniform and reliable instrument with recent
studies adopting indexed measures (Castro, 2009). Details on how this index was computed are
discussed in section 3.5 above.
Profit Margin (MARGIN) adopted from Altuwaijri et al., (2004), measure captures both the
presence of competitive markets and profitability. We additionally assume as Altuwaijri et al.,
(2004) that the large manufacturing firms analyzed from the JALSH index do operate in a
national competitive market where cost management would involve price increases, cutting of
costs or both. They further indicate that in such a market potential for price increases are limited,
cost reduction is crucial affirming therefore that higher profit margins would signal better
control of costs.
Working Capital (WCTA) denotes working capital ratio of firm i to total assets over period t
while Retained Earnings (RETA) denotes ratio of retained earnings of firm i to total assets over
period t. These two measures have been adopted to investigate whether more disclosure is likely
to be adopted by firms with better than average financial performance since these firms would
have the financial resources to devote to voluntary sustainability reporting (Jones et al., 2007).
Cash Position (CATA) and Capital Expenditure (CAPEXTA) follow from slack resources
argument and serves to investigate whether more sustainable firms report a negative capital
expenditure to suggest slack resources are being applied to capital expenditure activities (Jones
et al., 2007).
Firm Beta (RISK) obtained from S&P CapitalIQ database is used as a measure of systematic
risk (Garcia- Castro et al., 2009; McGuire et al., 1988). Higher investments in sustainability
may lower a firm’s financial risk and investors may perceive entities that do not invest
significantly in sustainability as riskier investments attributing it to poor management skills
(McGuire et al., 1988). They add that high investing firms in sustainability may therefore have
access to better financial resources given their low risk status. They inform that impact of
sustainability on systematic risk may be minimal given not all events affecting a firm’s
sustainability practices systematically affects all other firms in the market.
3.5.5 Control Variables
To avoid the omitted variable problem, we include control variables for variables known to
affect Tobin Q and related to choice of sustainability disclosure (Dowell et al., 2000).
A significant number of studies (Hillman and Keim, 2001; Ameer and Othman, 2011; Lopez et
al., 2007; Jones et al., 2007; Wagner, 2007 and Altuwaijri et al., 2004) propose size to be
included in the model as a control variable and regressed to observe significance relative to
other variables. They argue for size as appropriate citing that larger firms have more incentive
to commit to society and commit more resources to sustainability therefore reporting more.

42
Different measures of size previously used are log of employees (Wagner, 2007), ratio of assets
to sales (Jones et al., 2007) total assets (Lopez et al., 2007) and market value of common equity
(Altuwaijri et al., 2004). We employ Jones et al., (2007) ratio of total assets to total sales as
proxy for size. Size alone however doesn’t appropriately control for influence of strategic
decisions that create endogeneity problems and other firm specific variables are recommended
to be used in estimations (Hart and Ahuja 1996; McWilliams and Siegel 2000).
Capital intensity (CAPSALES) affects both index disclosure rating (SSI) and financial
performance (Hart and Ahuja 1996; McWilliams and Siegel 2000). For this reason, we adopt
CAPSALES to blunt effects of differences in firm commitment and particularly solve for the
endogeneity problem in Waddock and Graves (1997) study.
Further we include Leverage (LEV) (Hart and Ahuja 1996; Garcia-Castro et al., 2009; Dowell
et al., 2000; Jones et al., 2007; Lopez et al., 2007) as control variable for risk. Highly levered
firms may lack the ability to invest in superior sustainability practices while the opposite is true
(Dowell et al., 2000).
3.5.6 Final regression equation
The final regression equation was selected for its explanatory power. It captures relationship of
sustainability disclosures to financial performance while at the same time factoring in strategic
effects of discretionary disclosures of managers.
To test for the hypotheses developed in chapter two, the below equations were selected for their
explanatory power.
H1: There is a neutral relationship between sustainability disclosures and value of the firm for
FTSE/JSE Responsible investment index manufacturing companies and less-sustainable
manufacturing companies (control group) over the period 2013-2017.
Tobin Qit= α + β1 SSIit + β2 MARGINit + β3 CAPEXTAit + β4 CATAit + β5 RETAit + β6WCTAit
+ β7 RISKit + β8SSIDit + β9CAPSALESit+ β10SIZEit + β11LEVit + εit
H2 will be tested by means from a descriptive statistical analysis.
H3: Previous financial performance, captured by slack resources allocation and profitability
influences current sustainability disclosures and value of the firm for FTSE/JSE Responsible
investment index manufacturing companies and less-sustainable manufacturing companies
(control group) over the period 2013-2017.
To examine this relationship, we analyze three time periods of t-1 to t-3. Which brings our
investigation to:
H3a: Previous financial performance, in time period t-1 captured by slack resources allocation
and profitability influences current sustainability disclosures and value of the firm for
FTSE/JSE Responsible investment index manufacturing companies and less-sustainable
manufacturing companies (control group) over the period 2013-2017.

43
Tobin Qit= α + β1 SSIit-1 + β2 MARGINit-1 + β3 CAPEXTAit-1 + β4 CATAit-1 + β5 RETAit-1 +
β6WCTAit-1 + β7 RISKit-1 + β8SSIDit-1 + β9CAPSALESit-1+ β10SIZEit-1 + β11 LEVit-1 + εit
H3b: Previous financial performance, in time period t-2 captured by slack resources allocation
and profitability influences current sustainability disclosures and value of the firm for
FTSE/JSE Responsible investment index manufacturing companies and less-sustainable
manufacturing companies (control group) over the period 2013-2017.
Tobin Qit= α + β1 SSIit-2 + β2 MARGINit-2 + β3 CAPEXTAit-2 + β4 CATAit-2 + β5 RETAit-2 +
β6WCTAit-2 + β7 RISKit-2 + β8SSIDit-2 + β9CAPSALESit-2+ β10SIZEit-2 + β11 LEVit-2 + εit
H3c: Previous financial performance, in time period t-3 captured by slack resources allocation
and profitability influences current sustainability disclosures and value of the firm for
FTSE/JSE Responsible investment index manufacturing companies and less-sustainable
manufacturing companies (control group) over the period 2013-2017.
Tobin Qit= α + β1 SSIit-3 + β2 MARGINit-3 + β3 CAPEXTAit-3 + β4 CATAit-3 + β5 RETAit-3 +
β6WCTAit-3 + β7 RISKit-3 + β8SSIDit-3 + β9CAPSALESit-3+ β10SIZEit-3 + β11 LEVit-3 + εit
Where:
Table 4: Summary of empirical model variables
Variable Formula
𝞪
Denotes a constant term
SSID
Denotes a dummy variable that takes the value of 1 for firms listed
on the FTSE/JSE Responsible Investment index 2016 and 0 for
firms not on the index in 2016 therefore making up the control
group
Dependent Variable
Tobin Q
𝑄 =𝑀𝑎𝑟𝑘𝑒𝑡 𝑉𝑎𝑙𝑢𝑒 𝑂𝑓 𝐸𝑞𝑢𝑖𝑡𝑦
𝐵𝑜𝑜𝑘 𝑉𝑎𝑙𝑢𝑒 𝑜𝑓 𝑇𝑜𝑡𝑎𝑙 𝐴𝑠𝑠𝑒𝑡𝑠
Independent Variables
Sustainability Score Index
(SSI)
𝑆𝑆𝐼 =∑(Ethical Disclosure score + Diversity Disclosure Score +
Environmental Disclosure Score+ Community Disclosure Score)
Profit Margin
MARGIN=𝑁𝑒𝑡 𝐼𝑛𝑐𝑜𝑚𝑒
𝑁𝑒𝑡 𝑆𝑎𝑙𝑒𝑠

44
Variable Formula
Working Capital
WCTA=𝑊𝑜𝑟𝑘𝑖𝑛𝑔 𝐶𝑎𝑝𝑖𝑡𝑎𝑙
𝑇𝑜𝑡𝑎𝑙 𝐴𝑠𝑠𝑒𝑡𝑠
where Working Capital = Current Assets - Current Liabilities
Retained Earnings
RETA=𝑅𝑒𝑡𝑎𝑖𝑛𝑒𝑑 𝐸𝑎𝑟𝑛𝑖𝑛𝑔𝑠
𝑇𝑜𝑡𝑎𝑙 𝐴𝑠𝑠𝑒𝑡𝑠
Cash Position
CATA=𝐶𝑎𝑠ℎ 𝑃𝑜𝑠𝑖𝑡𝑖𝑜𝑛
𝑇𝑜𝑡𝑎𝑙 𝐴𝑠𝑠𝑒𝑡𝑠
where Cash Position = Cash + Receivables
Capital Expenditure 𝐶𝐴𝑃𝐸𝑋𝑇𝐴 =Capital Expenditure
𝑇𝑜𝑡𝑎𝑙 𝐴𝑠𝑠𝑒𝑡𝑠
Firm Beta
RISK=β
Control Variables
Size
SIZE =𝑇𝑜𝑡𝑎𝑙 𝐴𝑠𝑠𝑒𝑡𝑠
𝑇𝑜𝑡𝑎𝑙 𝑆𝑎𝑙𝑒𝑠
Capital Intensity
CAPSALES =𝑇𝑜𝑡𝑎𝑙 𝐶𝑎𝑝𝑖𝑡𝑎𝑙
𝑇𝑜𝑡𝑎𝑙 𝑆𝑎𝑙𝑒𝑠
where Total Capital = ∑(Book Value of Common equity +
Preferred Equity+ Total Minority Interest + Total Debt)
Leverage
LEV=𝑇𝑜𝑡𝑎𝑙 𝐷𝑒𝑏𝑡
𝑇𝑜𝑡𝑎𝑙 𝐸𝑞𝑢𝑖𝑡𝑦
3.5.7 Interviews analysis
Unlike quantitative data analysis which has clear cut rules on how analyses should be carried
out, qualitative data is not as straightforward to analyze (Bryman and Bell, 2013). Our
qualitative analysis is guided by the analytic induction strategy as discussed by Bryman and
Bell (2013). In the analytic induction, we begin with the definition of the research question and
seek hypothetical explanations from the interviews through matching trends and patterns. We
use pattern and trend matching as discussed by Yin (2009) to compare theory anticipations and
preliminary results from the quantitative study to results from the interviews.
3.6 Limitations of Research Method
A combination of data sources by conducting a mixed method research design approach is
considered preferable as it results in a balanced and in-depth understanding of the topic.
However, it is important to note that the mixed method is not intrinsically superior to the mono-

45
method research as argued by Bryman and Bell (2013) given some researchers have questioned
the quality of mixed method research.
For this fact, we employ the use of quantitative data analysis tools whereby we account for
assumptions fitting to the OLS regression. Further, for the content analysis we carried out
multiple cross checks as discussed below in Section 3.7. To control for endogeneity problems,
it is recommended to use research and development intensity, advertising intensity and capital
intensity as extra control variables (McWilliams and Siegel, 2000; Hart and Ahuja, 1996). We
adopt only capital intensity as majority of entire firms analyzed did not have the advertising
and research and development items captured by the financial databases we sourced data from.
For the qualitative data analysis, we transcribed the interviews and conducted a systematic
review of the data as guided by the process of an analytic induction discussed by Bryman and
Bell (2013).
3.7 Reliability, Replicability and Validity
Reliability, Replicability and Validity are the three most prominent criteria in the evaluation of
business and management research as indicated by Bryman and Bell (2013). Below we discuss
how we considered these criteria in our research paper.
3.7.1 Reliability
To ensure coding reliability in our content analysis, we report on the manner in which we
constructed our decision categories and decision rules as advised by Milne and Adler (1999).
In measuring coding stability, we used the test-retest method as referred to by Bryman and Bell
(2013) whereby we re-tested the analysis thrice with a gap of one week between each analysis
and recalibrated our criteria confirming that the coding was consistent across all periods.
To test for quantitative data reliability and robustness, we performed a series of diagnostic tests
on E-views outlined in the subsequent chapter since in a regression model heteroscedasticity
and multicollinearity may inflate variances (Garcia-Castro et al., 2009).
3.7.2 Replicability
Schaltegger and Synnestvedt (2002) argue that results are more conclusive if industries with
similar characteristics and legislation are analyzed. Therefore, our study that is only based on a
single industry may not be generalizable for the whole economy but rather for only
manufacturing industries in South Africa.
3.7.3 Validity
Whether sustainability disclosures are the absolute measure of sustainability initiatives is a
topic that has been discussed widely by academics and researchers. Ehrenfeld (2005) research
concluded that new sustainability reports do not come close to representing the requirements of
true social sustainability. This can be explained by the institutional theory by Suchman (1995)
which states that as companies experience coercive and normative pressure from a powerful
institution compliance is inevitable and only the bare minimum is given. However, Maubane

46
et al., (2014) argue that sustainability reports provide a balanced and reasonable representation
of the sustainability performance of a reporting company.
3.8 Chapter Summary
This chapter motivates the choice of our entire research approach. We undertake a deductive
approach in which we test sustainability reporting and financial performance using the slack
resources theory and good management theory. Our choice for this study is based on the fact
that researchers tend to heavily rely on the stakeholder theory when exploring this relationship.
We, however, sense that slack resources and good management do have an impact on this
relationship hence the focus on these two theories. Further, we adopt a mixed method research
whereby we employ the idea of complementarity as referred to by Hammersley (1996) by use
of both qualitative and quantitative research for different aspects of the study to create harmony.
In addition, most of the studies on the topic tend to adopt a mono-method focused approach. A
mixed method study provides more contextual information enhancing the results and more so
the discussion of the study. We also employ a mix of primary and secondary data in our analysis.
We approach the qualitative hand by conducting interviews with specialists in the field of
sustainability and the quantitative method by using regressions.
In Section 3.2 we argue for our sample size of the study. The sample is derived from the
FTSE/JSE responsible investment index for the year 2016. Screens applied to this sample
narrowed down the sample from an initial 69. Given that our focus is manufacturing firms, the
sample further reduced to 16 then to a further 13 because we excluded 3 additional companies
who are subsidiaries of MNCs given they would likely project parent effects leading to lack of
homogeneity in the companies analyzed. For the control group, company matching for the 13
peer manufacturing firms was selected from the JSE All Share index primarily based on activity
sector and company size.
In Section 3.5 we explain how our data will be analyzed. For the quantitative aspect, we employ
the use of regressions to analyze the data using statistical software known as E-views. Model
specifications for the regressions are based on existing literature and empirical findings from
the research. For the qualitative method, we are guided by a strategy referred to as ‘analytic
induction’ by Bryman and Bell (2013). We seek hypothetical explanations from interviews
matching trends and patterns.

47
4 Analysis of Empirical Results
This chapter presents empirical findings from the regressions run. First, we discuss the
diagnostic tests conducted to support the validity of the regression estimator and then present
the results of the regression describing the relationships identified.
The regression models highlighted in the previous chapter sought to uncover the relationship
between sustainability disclosure and financial performance and examine further whether
sustainable manufacturing firms ratified by the FTSE/JSE responsible investment index in 2016
outperform the control group of manufacturing firms not on the index in 2016. We examine the
period 2013-2017. The regressions were performed on an ordinary least squares (OLS)
estimator on E-views 10 statistical software.
4.1 Diagnostic Tests
OLS has a series of assumptions for which we performed significant tests outlined further.
4.1.1 Non-normality
Brooks (2014) informs in determining normality, a normal distribution is symmetric around the
mean with a kurtosis of 3 while a skewed distribution has one tail longer than another. Outliers
which are extreme residuals cause the normality assumption to be rejected. A test for normality
is the Jarque-Bera test with a bell shaped histogram distribution.
An initial run of descriptive statistics (See Appendix 4) revealed that the majority of these values
(Q, MARGIN, CAPSALES and LEVERAGE) were highly skewed, had outliers and showed
kurtosis. A further test for normality (See Appendix 5) revealed high Jarque-Bera values for
variables Q, MARGIN and CAPSALES. Brooks (2014) recommends dummy variables or use
of other transformations as corrections to fulfill this assumption. We therefore use log -
transformation in the empirical model. The resulting regression (See Appendix 7) has a better
fit than the original one (See Appendix 6) from an adjusted R squared of 73% to 80.6% .As a
result, observations were reduced from 130 to 121 having an unbalanced panel data.
4.1.2 Multicollinearity
This assumption in OLS requires the explanatory variables not be highly correlated to one
another (Brooks, 2014). Multicollinearity arises when one or more variables are highly
correlated to one another with values above 0.8. No multicollinearity problems were found
between the variables observed from a correlation matrix (See Appendix 8).
4.1.3 Endogeneity
To avoid the problem of omitted variable bias and model misspecification which introduces
endogeneity problems we control for several factors in the regression model. Endogeneity
problems arise when an explanatory variable is correlated with the error term (Brooks, 2014).
Recent studies recommend for use of longitudinal data and or instrumental variables (Garcia-

48
Castro et al., 2009). We adopt the former in this study since variables herewith gathered are
observable and limit the model from under-specification problems.
An initial regression run reveals leverage having a positive coefficient to Q which violates our
expectation of a negative sign indicating possible presence of endogeneity. To rule out
additional measurement errors and or reverse causality, we include cross-section random effects
and run a Hausman test (See Appendix 9) for endogeneity given that our data is unbalanced
panel and therefore cannot have two way effects testing for cross-section and period. The result
gives a p value of 1.000 meaning the test couldn’t be performed perhaps due to few time periods
(5 years). We therefore keep to transforming the leverage variable in the model.
4.1.4 Autocorrelation
Another OLS assumption requires that the errors should not be correlated to each other. To test
for this we examine the Durbin Watson statistic value at 0.8. It however does not confidently
inform of level of autocorrelation given the rule of thumb is values closer to 2 would mean the
lack of autocorrelation. We run a further cross-section dependence test (See Appendix 10) which
informs of low p-values indicating presence of spatial autocorrelation.
4.1.5 Heteroscedasticity
OLS requires same variance i.e. homoscedasticity the absence of which causes
heteroscedasticity. Unequal variance can heavily undermine parameter estimates’ statistical
power (Jones et al., 2007). Plotting residuals to check for presence of heteroscedasticity reveals
the residuals are systematically changing variability on the sample indicative of potential
heteroscedasticity (See Appendix 11). Subsequent testing reveals the heteroscedasticity occurs
more in cross-section than period (See Appendix 12).
We applied White cross-section standard errors (See Appendix 13) to estimate the regression
using heteroscedasticity robust standard errors (Brooks, 2014). Comparing this to the initial
regression reveals marginal changes to parameters from the ordinary standard errors estimate.
The p-values are now smaller for variables; t-values have increased while the r-squared is
consistent as previous estimation.
4.2 Analysis of results
Firm value depends on profit margin, capital expenditure, cash position, sustainability practices,
retained earnings, working capital and level of risk. We therefore explored whether these
independent variables have an explanatory power in the model in line with the theories tested.
4.2.1 Correlation Matrix Analysis
A correlation matrix analysis revealed that there’s a highly significant moderate negative
correlation between sustainability disclosures and profit margin for the control group (See
Appendix 14). As sustainability disclosure increases, the less sustainable manufacturing firms'
profit margin increases slightly.

49
However, a weak positive correlation not significant at all levels is seen between sustainability
disclosures and profit margin for the responsible investment index group firms (See Appendix
15). This means changes in sustainability disclosures has no relationship on the profit margin
trends of responsible investment index firms.
There is a negative weak correlation between sustainability disclosures and cash position for
the responsible investment index group firms- not significant at all levels while a weak positive
correlation significant at 0.1 is seen for the control group.
There's a weak negative correlation between sustainability and value of the firm for both the
responsible investment index group and the control sample as well. The correlation is not
significant for the control group at all levels while it is significant at 0.1 level for the responsible
investment index group.
Additionally we examined the correlation patterns between sustainability disclosures and slack
resources indicators used in addition to risk. For the responsible investment index firms, there’s
no significant correlation between sustainability disclosures and slack resources indicators.
Changes in sustainability disclosures have no relationship to the slack resources trends of
responsible investment index firms.
There’s a weak significant correlation between sustainability disclosure and firm risk at 0.005
level. Otherwise sustainability disclosure is not significantly correlated to slack resources
indicators for the control group. Meaning as the control group firms disclose and therefore
practice sustainability more, their systematic risk goes down to a smaller extent. We posit that
for the control group, sustainability is therefore used as a tool to hedge against risk.
4.2.2 Descriptive Statistics Analysis
Investigation of whether financial performance ratios; cash position and profitability is higher
for responsible investment index companies than the control group is explained further via
descriptive statistics analyses.
Descriptive statistics indicate that responsible investment index firms (See Appendix 16) have
a firm value higher than the control group (See Appendix 17) depicted by their means.
Additionally, their profit margins are lower than the control group.
For the control group, capital expenditure and cash position of the control group is higher than
that of the responsible investment index companies. This is in contrast to slack resources theory
which advances that these should be higher for more sustainable firms.
Responsible investment companies have a higher retained earnings and working capital
compared to the control group firms. All control variables are highly significant in controlling
for levels of firm commitment meaning they do have an explanatory power in the relationship
between firm value and sustainability disclosures.

50
4.2.3 Causal Model - Regression Analysis
Analyzing the regression model (See table 7 and Appendix 18), we find that sustainability
disclosures have no relationship to firm value. While the coefficient sign is positive, it’s p
values (0.1096) is not significant at all levels. The empirical model’s goodness of fit is 81%
highlighting a superior explanatory power.
To test if these trends endure over time we examine whether past financial performance impacts
sustainability disclosure and firm value by lagging all independent variables -1 to -3 years.
Overall there’s no significant relationship between firm value and sustainability disclosures for
lag -1 and lag-2 and the coefficient sign is still positive consistent with the baseline model. Lag
-3 while also maintaining a positive coefficient for sustainability disclosures, has a highly
significant relationship to firm value (See Table 8 and Appendix 19 to 21).
To test for significant differences between sustainable and less sustainable sub-samples we run
an integration model (See Table 6 and Appendix 22) in which the independent variables interact
with the dummy that takes 1 if firms are on the responsible investment index and 0 if not. This
particular regression has a better fit and reduced standard error than the initial one with adjusted
r squared of 85.8% compared to the initial one of 80.7%. The intercepts for both models and all
independent variables are significantly different from each other.
To determine whether indulging in all aspects of sustainability increases firm value, we
examined ethical, diversity, environmental and community disclosure aspects further. All
dimensions are moderately positively correlated to each other (See Appendix 23) with the
exception of diversity which has a strong positive correlation to environmental and community
aspects. Meaning disclosure and practice on diversity aspect is highly correlated to
environmental practices and disclosures and the community.
Descriptive statistics informs that both groups practice more and therefore report more on
environmental aspect with a mean (median) of 40% (44.5%) followed by diversity with a mean
(median) of 33.6% (38%).Community and ethical aspects are equally practiced and reported on
with a mean (median) of 22% (See Appendix 24).The more sustainable firms do practice and
report more on aspects; environmental, diversity and community than the control group
captured by their higher means and medians (See Appendix 25). The control group reports more
on ethical dimension than the responsible investment index manufacturing firms though (See
Appendix 26).
Investigating whether one aspect of sustainability influences firm value more than the other
reveals the following: Overall, only the environmental aspect has a positive coefficient to firm
value significant at 0.05 level. This translates to a positive impact on firm value by engaging in
environmental sustainability. The other aspects; ethical, diversity and community have a
negative coefficient (relationship) (See Appendix 27).
Relating the variables estimated effects to standard deviation reveals diversity is more costly to
the entire lot followed by community and ethical respectively. Benefits from environmental
aspect are minimal though to the value of the firm (See Table 5). Examining the sub-samples
split at their mean reveals that for each group, more sustainable companies and the control

51
group, there is a positive relationship between diversity (significant at 0.05 level) and value of
the firm meaning for each particular sub-sample, diversity does influence firm value positively.
Table 5: Relative variable comparison to Standard Deviation.
In addition, for the control group ethical aspects (not statistically significant) of sustainability
do have a positive relationship to the value of the firm (See Appendix 28). For the more
sustainable firms’ sample, any benefits that would have been realized from diversity are
minimal as costs in community sustainability endeavors are comparatively high (See Appendix
29). The control group benefits more from diversity activities and ethical reporting which
increases their firm value whereas environmental and community sustainability aspects are
costly to them.
Assuming that the sub-samples (responsible investment index and the control group) are
independent, we perform a Kruskal-Wallis nonparametric rank-based test (See Table 6 and
Appendix 30) to ascertain the statistical significance in the difference between the sustainability
disclosure aspects. The Kruskal-Wallis tests the null hypothesis that the ‘subgroups have the
same general distribution, against the alternative that at least one subgroup has a different
distribution’ (Eviews 2018).
Table 6: Kruskal Wallis non parametric test
Community Environmental Diversity Ethical
Mean Rank Responsible investment index firms 71.26923 77.80769 74.92308 63
Mean Rank control group firms 59.73077 53.19231 56.07692 68
asymptotic significance 0.0797*** 0.000200 0.0041** 0.4482
grouping: cohort df=1
n=65 control group firms n=65 responsible investment index firms
p≤0.05* p≤0.01** p≤0.1***

52
The mean difference in ranking for community aspect is significant at 0.1 level and not beyond
while for Environmental and Diversity aspects significance is at 0.001 and 0.005 level
respectively. Ethical dimension ranking is not significantly different between the subgroups.
See Figure 4 below on interaction of level of sustainability disclosures to financial performance
for manufacturing firms in South Africa.
Figure 4: Interaction of sustainability disclosures to financial performance
-30.0
-20.0
-10.0
0.0
10.0
20.0
30.0
40.0
50.0
ethical diversity environmental community
Mean to Relative Impact of Manufacturing Firms in South Africa
Mean Responsible Investment Index Firms
Mean Control Group Firms
Relative Impact Responsible Investment IndexFirmsRelative Impact Control Group Firms

53
Table 7: Baseline and interaction model regression outputs
Year 2013 to 2017 Dependent variable Tobin Q
Independent financial and control variables coefficient t-value p value
(constant)
Combined indices 3.29395 8.07939 0.0000**
Interaction model 1.56712 5.68264 0.0000**
Sustainability Scoring index
Combined indices 0.00188 1.61328 0.1096
Interaction model 0.00081 0.170164 0.8652
Margin (net income/net sales)
Combined indices 0.35485 8.17356 0.0000**
Interaction model 0.87659 4.55214 0.0000**
Capital Expenditure/Total Assets
Combined indices -1.02649 -2.76372 0.0067**
Interaction model -1.59265 -3.06520 0.0028**
Total Capital /Total Assets
Combined indices -2.31043 -2.55844 0.0119*
Interaction model -2.29934 -1.08316 0.2814
Retained Earnings/Total Assets
Combined indices 0.72398 2.20577 0.0295*
Interaction model 1.28576 2.04237 0.0438*
Working Capital /Total Assets
Combined indices -0.22875 -0.36451 0.7162
Interaction model -2.24660 -2.22171 0.0286*
RISK
Combined indices -0.36368 -1.47664 0.1427
Interaction model 0.71826 0.79412 0.4290
SSID
Combined indices 0.14346 2.35809 0.0202*
Interaction model 4.12035 8.54724 0.0000**
Capsales (total capital to total sales)
Combined indices 0.85587 18.17900 0.0000**
Interaction model 0.43762 1.32520 0.1882
Size (total assets/total sales)
Combined indices -1.19382 -16.93688 0.0000**
Interaction model -1.03300 -3.91057 0.0002**
Leverage (total debt/total equity)
Combined indices -0.09601 -1.69575 0.0928***
Interaction model 0.24553 1.30328 0.1955
N
Combined indices 121
Interaction model 121
Adjusted R sq.
Combined indices 81.0%
Interaction model 86.6%
p≤0.05* p≤0.01** p≤0.1***

54
Table 8: Causal model lagged time periods
Year 2013 to 2017 Dependent variable Tobin Q
Independent financial and control variables coefficient t-value p value
(constant)
Lagged 1 3.73070 16.09027 0.0000**
Lagged 2 3.35913 5.48588 0.0000**
Lagged 3 4.93003 21.54140 0.0000**
Sustainability Scoring index
Lagged 1 0.00220 0.91606 0.3622
Lagged 2 0.00345 1.318010 0.1924
Lagged 3 0.00544 105.8642 0.0000**
Margin (net income/net sales)
Lagged 1 0.23584 3.57792 0.0006**
Lagged 2 0.17922 4.43589 0.0000**
Lagged 3 0.15159 3.77768 0.0006**
Capital Expenditure/Total Assets
Lagged 1 -1.81277 -4.57238 0.0000**
Lagged 2 -1.87952 3.24158 0.0019**
Lagged 3 -3.55154 -14.42407 0.0000**
Total Capital /Total Assets
Lagged 1 -3.50748 -13.70897 0.0000**
Lagged 2 -2.72969 -9.62622 0.0000**
Lagged 3 -4.48201 -9.69070 0.0000**
Retained Earnings/Total Assets
Lagged 1 0.72274 1.44151 0.1531
Lagged 2 0.50028 0.51439 0.6088
Lagged 3 0.44698 0.50955 0.6135
Working Capital /Total Assets
Lagged 1 -0.10625 -0.11540 0.9084
Lagged 2 -1.73054 -7.35507 0.0000**
Lagged 3 -2.07861 -2.20786 0.0337*
RISK
Lagged 1 -0.66767 -1.83591 0.0699***
Lagged 2 -0.59038 -6.01000 0.0000**
Lagged 3 -0.85915 -4.02854 0.0003**
SSID
Lagged 1 0.12744 1.32765 0.1878
Lagged 2 0.25519 1.82245 0.0733***
Lagged 3 0.08245 0.64934 0.5202
Capsales (total capital to total sales)
Lagged 1 0.99250 17.69497 0.0000**
Lagged 2 1.15761 11.10514 0.0000**
Lagged 3 1.35066 379.74190 0.0000**
Size (total assets/total sales)
Lagged 1 -1.37851 -24.59804 0.0000**
Lagged 2 -1.51219 -7.32017 0.0000**
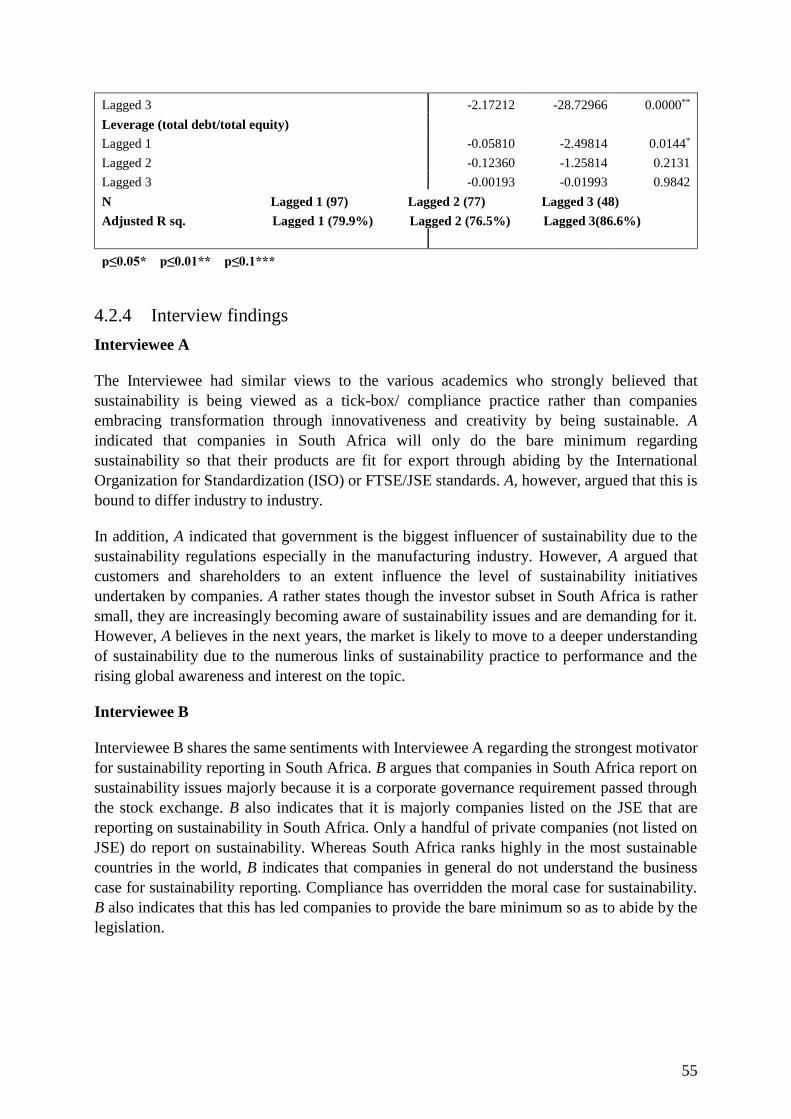
55
Lagged 3 -2.17212 -28.72966 0.0000**
Leverage (total debt/total equity)
Lagged 1 -0.05810 -2.49814 0.0144*
Lagged 2 -0.12360 -1.25814 0.2131
Lagged 3 -0.00193 -0.01993 0.9842
N Lagged 1 (97) Lagged 2 (77) Lagged 3 (48)
Adjusted R sq. Lagged 1 (79.9%) Lagged 2 (76.5%) Lagged 3(86.6%)
p≤0.05* p≤0.01** p≤0.1***
4.2.4 Interview findings
Interviewee A
The Interviewee had similar views to the various academics who strongly believed that
sustainability is being viewed as a tick-box/ compliance practice rather than companies
embracing transformation through innovativeness and creativity by being sustainable. A
indicated that companies in South Africa will only do the bare minimum regarding
sustainability so that their products are fit for export through abiding by the International
Organization for Standardization (ISO) or FTSE/JSE standards. A, however, argued that this is
bound to differ industry to industry.
In addition, A indicated that government is the biggest influencer of sustainability due to the
sustainability regulations especially in the manufacturing industry. However, A argued that
customers and shareholders to an extent influence the level of sustainability initiatives
undertaken by companies. A rather states though the investor subset in South Africa is rather
small, they are increasingly becoming aware of sustainability issues and are demanding for it.
However, A believes in the next years, the market is likely to move to a deeper understanding
of sustainability due to the numerous links of sustainability practice to performance and the
rising global awareness and interest on the topic.
Interviewee B
Interviewee B shares the same sentiments with Interviewee A regarding the strongest motivator
for sustainability reporting in South Africa. B argues that companies in South Africa report on
sustainability issues majorly because it is a corporate governance requirement passed through
the stock exchange. B also indicates that it is majorly companies listed on the JSE that are
reporting on sustainability in South Africa. Only a handful of private companies (not listed on
JSE) do report on sustainability. Whereas South Africa ranks highly in the most sustainable
countries in the world, B indicates that companies in general do not understand the business
case for sustainability reporting. Compliance has overridden the moral case for sustainability.
B also indicates that this has led companies to provide the bare minimum so as to abide by the
legislation.

56
Interviewee C
C argues that all the initiatives being undertaken by the companies are a mirage of being
sustainable and only exist to ensure businesses can continue to be a going concern and
maximize shareholder wealth in the long-term. C argues that the increasing number of indices
ranking companies on sustainability continue to mislead companies and in effect killing the
moral value of sustainability. C emphasizes that the main influencer of sustainability reporting
who also majorly informed on sustainability practices are the primary stakeholders;
shareholders. These publics entrust their investments with the agents who are responsible for
the utilization of resources at their own discretion so as to maximize shareholder wealth and in
turn also their own wealth. C concludes by saying that there is no relationship between
sustainability and organizational performance as sustainability initiatives are majorly engaged
in as a form of risk management by trying to keep the secondary stakeholders in check
(government, customers, and communities) to avoid any occurrences that might result to the
company not being a going concern.
4.3 Chapter summary
This chapter presents the empirical findings from both the qualitative and quantitative
investigations done. Diagnostic tests in section 4.1 to fulfill assumptions of the OLS estimator
were performed and further corrective tests were applied. The data was non-normal defined as
highly skewed data with outliers. It did not meet a histogram test for bell-shaped distribution
besides variables possessing high Jarque Bera Values. No multicollinearity problems were
found while endogeneity problems as expected abound. Leverage showed a positive sign to
firm value indicating possibility of endogeneity problems. Being an unbalanced panel data, we
cannot have two-way effects testing and therefore use cross-section random effects to run a
Hausman test. The test is inconclusive we suspect given out time period of 5 years is not long-
enough. We therefore stick to transforming the leverage variable. A cross-section dependence
test illustrates presence of spatial autocorrelation while presence of unequal variance is
indicative of heteroscedasticity. We applied White cross-section standard errors to correct for
the autocorrelation and heteroscedasticity problems.
Section 4.2 highlights findings from a correlation matrix, descriptive statistics, regression
analysis and the semi-structured interviews. Aside from the semi-structured interviews, the rest
of the analysis was discerned from E-views 10 statistical software. Correlation matrix inform
of absence of high correlations between sustainability disclosures and financial performance
variables as advanced by the good management theory. Descriptive statistics inform the
responsible investment firms have higher firm value, retained earnings, and working capital
compared to the less responsible firms. Additionally, their profitability, cash position, and
capital expenditure are lower than the control group. The causal model highlighted that the
coefficient sign for sustainability disclosures is positive though not significant and therefore
bearing a neutral relationship to firm value. The empirical model’s goodness of fit is 81%
highlighting a superior explanatory power. Prior longer term performance t-3 influences
sustainability disclosure relationship to firm value positively. An integration model reveals
sustainability disclosures do play a role in financial performance of firms while indulging in
environmental disclosures pays off for firms as opposed to aspects diversity, community and
ethical which come bearing costs overall. Relating the variables estimated effects to standard

57
deviation reveals diversity is more costly to the entire lot followed by community and ethical
aspects respectively. The responsible investment index firms disclose more on all aspects
community, diversity and environmental than the control group who disclose more on the
ethical dimension which we find rather odd. All three interviewees maintain the view that
sustainability is embraced in South Africa more for compliance than for moral consciousness
by listed manufacturing firms. Regulators drive need for sustainability in the country with
mushrooming indices serving to drive firms further towards legitimating their existence through
sustainability initiatives.

58
5 Discussion of Findings
This chapter presents our discussion of the collected and analyzed quantitative and qualitative
empirical data. Our study attempts to address whether there is a relationship between
sustainability reporting and financial performance in an emerging markets perspective. In
undertaking the study, we first discuss our findings from hypotheses developed followed by
arguments discussing the sustainability environment in South Africa.
5.1 Sustainability disclosures and financial performance
The results obtained from our empirical analysis indicate that there is a neutral relationship
between sustainability disclosures and firm value. This hypothesis supports a similar study
undertaken by McWilliams and Siegel (2000) affirming that endogeneity problems which
marred Waddock and Graves (1997) study causes the hypothesized relationship to change when
the empirical model is correctly specified. Hypothesis one is accepted. The neutral relationship
suggests that there are other variables, unobserved which mediate the relationship between
sustainability disclosures and firm performance (Garcia-Castro et al., 2009). Given that the
environment in which the manufacturing firms operate in is legislation intensive, a neutral
relationship between sustainability disclosures and firm value would be expected. Normative
pressure implies that firms are not actually exploring and exploiting the benefits through
innovation but rather are doing the bare minimum to ensure their companies do not lose out on
revenue. This relationship can also be explained by our alternative theory, theory of the firm
stipulated by McWilliams and Siegel (2001) which argues that managers will make optimal
choices so as to maximize profits and hence there is an optimal level of investments on
sustainability that a firm can make depending on the costs and the benefits.
The interactive model results suggest that more sustainability practices and therefore
disclosures (captured by firms on the responsible investment index) have a significant impact
on firm value as sustainability level of investments differ between the responsible investment
index firms and those not on it. We also find no evidence of a high correlation between
sustainability disclosures and firm performance due to management’s practices. This is
consistent with Garcia-Castro et al., (2009) who informs that management decisions originate
from within the firm and are more likely to be correlated instead with unobservable firm-
specific characteristics such as culture.
Profitability of responsible investment index firms is lower than the control group. We therefore
reject hypothesis 2a. This reduction in overall profit margin can be explained by; engaging in
sustainability initiatives come as a cost to the firm reducing the profits. In addition, cash
position for the responsible investment group is lower than that of the control group. We
therefore reject hypothesis 2b. This can also be observed due to the responsible investment
index firms increase in working capital with high investments in working capital reducing cash
for these firms. Working capital could be reassigned to sustainability activities from other
primary firm activities. The costs manifest in form of training, research, risk management,
quality control and effectiveness utilization of capacity (Lopez et al., 2007).

59
Profit arises when revenues are more than costs therefore the more sustainable firms can
increase their output base to spread out costs through volume we recommend in order to
maintain a gain from sustainability endeavors. Ameer and Othman (2011) inform that for
sustainability endeavors to be rewarding, a new rethinking would have to be done by managers
by identifying specific restrictions and incentives they seek to gain from these endeavors.
Failure to which we posit such trends as the one we have analyzed arise. This is consistent with
interviewee A and C view that sustainability endeavors is not seen from an innovation
perspective that would bring about competitive advantage to firms.
Likewise, for the more sustainable firms, any perceived benefits from sustainability endeavors
would in turn necessitate supply chain renegotiation and internal processes reorganization
which would come at additional costs affecting their finances (Hart and Ahuja,1996)
Redistribution of some measures of slack resources explained below from primary activities of
the firm to sustainability activities affects profitability (Lopez et al., 2007). A myriad of
competing claims by different publics on a firm’s sustainability practices could also be another
reason that may lead to higher costs translating to lost profit opportunities. As we have shown,
not aspects of sustainability are practiced equally with some dimensions disclosed more than
others. This failure to meet a specific subset of stakeholders’ needs will generate market fears
from these groups resulting in a risk premium to the firm (McGuire et al., 1988: Preston and
O’Bannon, 1997). Indeed the more sustainable firms do have higher risk than the control group.
For the other measures of slack resources, we observe that while increase in slack resources
capital expenditures and cash position is seen for the control group, the responsible investment
index firms have a higher working capital and retained earnings. Because profits are low for
the responsible investment index firms, their corresponding slack measures reduce too
consistent with Bourgeois (1981) definition of operational slack as that which acts as a shock
absorber in the internal workflow during stress times of a business by accommodating profit
reduction.
Nevertheless, not all indicators of slack can be said to contribute to value of the firm given that
the responsible investment index firms have lower profit margins than the control group besides
having a higher firm value. The interesting trend for the control group firms can be attributed
to the non-exclusivity in form of slack resources capital expenditure and cash position. For the
control group there exists managerial irrational exuberance in undertaking entrepreneurial
sustainability initiatives via experimentation (George, 2005; Gral, 2013). Additionally, an
attempt at lowering sustainability implicit costs by firms not on the responsible investment
index thereby practicing fewer initiatives may result in higher explicit costs brought on by
competitive disadvantage necessitating extra funds allotted to damage control measures. We
believe this is what the control group exhibits.
We however point out that while profit margin and cash position are low; the value of the firm
for the more sustainable firms is higher compared to the control group. Therefore responsible
investment firms may have to make a trade off in regards to what index to pursue reflective of
returns or costs from sustainability endeavors. Multiple yardsticks as a benchmark for financial
performance may distract them from seeing the bigger picture and we therefore recommend
that the costs sacrificing a reduction in profits should not overshadow the higher overall value
accrued to the firm.
60
Hypothesis three rejection for lagged periods -1 and -2 but accepted for -3 period affirms that
previous longer-term financial performance does affect positively the relationship between
sustainability disclosure and financial performance. This can be explained by strategic
decisions of firms taking a longer period to be realized. Prior longer term sustainability practices
affects a firm’s liability exposure and value as the market is more aware of the company’s
corporate citizenship stance (Hart and Ahuja 1996). Sustainability investments require
substantial funding (Lopez et al., 2007) and the longer time frame additionally enables firms to
accumulate resources and strategically allocate to sustainability functions thereby increasing
the firms’ performance. Also consumer awareness of the ethics surrounding sustainability takes
time to manifest and therefore their subsequent demand for this from firms may not be
immediate (Lopez et al., 2007).
In addition, structural factors such as assets take time to develop and firm-specific
characteristics such as culture and organizational processes too take time to manifest (Lopez et
al., 2007). Therefore value creation from sustainability practices is not an immediate realization.
Besides development of sustainability in outputs, adoption of technology that supports
sustainability and firm differentiation are strategic patterns that take time to reveal positive
effects to firms. Moreover, the baseline model neutral relationship can be construed to mean
that these firms have already adopted sustainability practices thereby conforming to standards
and any benefits seen in prior -3 period is neutral in the current state has not been sustained.
This can be because of imitability factor of sustainability practices and shifting audience focus
as discussed by Lopez et al., (2007).
5.2 Sustainability reporting and initiatives in South
Africa.
Breaking down sustainability disclosures by aspects to determine effects on firm value as
examined further supports the notion that not all aspects of sustainability practices increase the
value of the firm; only delving in environmental sustainability does increase firm value. This is
in contrast to Ameer and Othman (2011) who found community aspect sustainability practices
as the one that influences firm value.
As expected of high impact industries, our results are not surprising given that firms in the
manufacturing industry in South Africa report more on environmental issues. This is similar to
the findings of Dawkins and Ngunjiri (2008) who argue that institutional pressures through laws
and regulations especially from governments in emerging markets tend to play a significant role
by driving and shaping sustainability especially environmental sustainability.
Further, Laufer (2003) argues that the commoditization of compliance increases white collar
deviance if certain aspects of compliance is seen by managers as a hedge against liability since
in some firms, this is sufficient to shift risk of loss. This is emphasized by Interviewee C who
indicates that sustainability is being used as a risk management strategy for firms. Firms are not
interested in the moral case for sustainability but are rather more interested in ensuring they
abide by legislation. Compliance for them will in turn enable them meet the interests of all the
stakeholders but more importantly the shareholder whose major interest is maximizing his
returns on investment.

61
In addition, Interviewee A and B argued that the increasing global awareness on sustainability
issues especially environmental disclosure has heavily influenced the amount of reporting. This
to a large extent is responsible for the adoption of sustainability practices in South Africa. It
also relates to Friedman’s (1970) shareholder approach who argues that the sole existence of a
business is to generate profits and hence businesses will engage in activities that will in the
short or long term lead to growth in shareholder wealth. Still heavily bound by legislation as
indicated by the interviewees, businesses engage in sustainability to meet the stakeholders
needs and wants.
Using Suchman (1995) categorization of legislation, the South African manufacturing industry
is more hinged on pragmatic legitimacy compared to cognitive and moral aspects. Companies
seek legitimacy through complying with the existing laws as failure to comply has an impact
on their returns and more so their business continuity. This is supported and re-emphasized by
Matthew’s (1993) notion that an organization’s survival is threatened if it breaches its social
contract because society can revoke the organization’s contract to continue its operations.
Our findings also indicate that the diversity and community index disclosure on sustainability
is relatively high despite them being more costly for the firms that engage in them. Despite this
negative effect though, firms still delve in them affirming the need to meeting their ‘social
contract’ with stakeholders and its need for legitimacy. We posit this is so because of the high
requirement /legislation put in place requiring black empowerment (Dawkins and Ngunjiri,
2008), HIV/AIDS and King's code of corporate governance bearing extra costs. These
legislation requirements aim at inclusivity of marginalized persons in economic participation
(Dawkins and Ngunjiri, 2008). While engaging in environmental sustainability does come at a
cost, it is offset by higher value to the firm re-enforcing the theory of the firm discussed by
McWilliams and Siegel (2001).
In addition, the above findings are similar to Dawkins and Ngunjiri (2008), who argues that
emerging economies are bound to engage more and report more on social sustainability. This
can be attributed to the nature of tangible benefits accrued to this index hence it is more likely
for it to have an impact and maintain the company’s social contract with the stakeholders.
Improved firm reputation can spur the community to engage more with the organization’s
offerings while the reverse can lead to total shunning of its existence altogether.
Splitting the groups though revealed less sustainable firms report more on ethical aspect of
sustainability than do the more responsible investment index firms. This in turn is reflected as
a benefit to their firm value. This trend is suspect and the pattern can be attributed to fueling
the legitimation theorists view of sustainability practices being a ‘smokes-and-mirrors’
construct. The responsible investment index firm’s hesitation may be explained by the
discretionary disclosure model which holds that in presence of proprietary costs, managers may
withhold favorable information to investors when such news may lead to negative
consequences (Verrecchia, 1983). An example is reporting on political contributions yet this
may result to a bias from its community.

62
5.3 Chapter Summary
This chapter begins by discussing findings from hypotheses developed after which the South
African sustainability environment is elaborated on. Hypothesis one is accepted that there is a
neutral relationship between sustainability disclosures and financial performance affirming
McWilliams and Siegel (2000) claim that endogeneity problems not correctly accounted for
influenced Waddock and Graves (1997) earlier study. Normative pressure backs up why this
outcome is observed while our alternative theory –the theory of the firm claim that there is an
optimal level of investments on sustainability that a firm can make depending on the costs and
the benefits illuminates our findings further. No evidence of good management role on
sustainability disclosure relationship to financial performance is found confirming that
management decisions are endogenous and are more likely to be correlated with unobserved
firm-specific characteristics such as culture as proposed by Garcia-Castro et al., (2009).
Hypothesis 2 (a) on profitability and 2 (b) on cash position is rejected that these indicators on
more sustainable firms is higher than the control group. For the control group the opposite is
seen because they do not bear the accompanying sustainability costs the responsible investment
index firms bear. Working capital as a slack resource is reassigned to sustainability endeavors
cutting back on the responsible investment index firms’ cash position. Competing publics needs
therefore giving rise to market fears from select constituents give rise to a risk premium for the
responsible investment index firms resulting in lost profit opportunities. These firms’ capital
expenditure is low reflective of lower profits. The control group had higher capital expenditure
and cash position indicating over-indulgence in sustainability endeavors as a damage control
measure. The value of the firm is higher though for the responsible investment index firms than
the control group which we believe should be the metric managers uphold to as opposed to
profitability.
Hypothesis 3 rejection for lagged periods t-1 and t-2 but accepted for lagged period t-3 confirms
that markets take time to reflect awareness of sustainability practices of firms and this in turn
takes time to be reflected in a firm’s financial performance. Structural factors too take time to
manifest such as organizational processes. Furthermore, not all aspects of sustainability
increase a firm’s value- only the environmental aspect does highlighting the legislative
intensive atmosphere manufacturing firms in South Africa operate in. More stringent
regulations on social issues passed down through laws rhymes with higher sustainability
disclosures in those aspects as well by manufacturing firms in South Africa.

63
6 Conclusion
This chapter presents conclusions arrived at, recommendations and suggestions for further
research.
6.1 Research Aims
This research paper sought to investigate the existence of a relationship between sustainability
disclosures and financial performance of manufacturing firms in an emerging market - South
Africa. We examined why these firms indulge in sustainability practices and which aspect they
do report on more. Additionally we investigated the role of good management, slack resources,
legitimation and our alternative theory- the theory of the firm in explaining the rationale for
sustainability practices by these firms. We went further to ascertain the performance of more
sustainable firms compared to the performance of the less sustainable firms not on the
FTSE/JSE responsible investment index 2016.
While an original OLS regression showed there is a neutral relationship between value of the
firm and sustainability disclosures, our interactive model informs that sustainability disclosures
do have an impact on the value of the firm given that the level of spending on sustainability
initiatives differ between more and less sustainable firms. That said, it does pay to be green;
more sustainable firms have a higher firm value than the less sustainable firms. Sustainability
is a new pursuit for companies demanded from increasing awareness of publics. The regulator
to a larger extent drives the need for sustainability practices by companies. Organizations
therefore are spurred to delve in these activities mainly for compliance purposes and
additionally so that their outputs can gain first mover advantage in ‘green’ export markets.
Failure to fully embrace sustainability endeavors has less sustainable firms expending more
slack resources to save face as they are seen to delve more in ethical aspect disclosure- merely
a token effort. Not all measures of slack resources impact sustainability disclosures and
financial performance. Only working capital is consistent with slack resources theory. The
responsible investment group who engage more in sustainability practice experience a reduction
in profits but an overall increase in firm value. Their managers must therefore make a trade-off
on what financial metric to prioritize and therefore pursue. Pursuing firm value as a metric is in
line with social-welfare maximization presenting a win-win scenario for both the firm and its
stakeholders.
We establish not all aspects of sustainability influence the value of the firm positively. Only the
environmental aspect does. Additionally, firms in South Africa report more on the social aspect
of sustainability largely given the regulator puts more emphasis on these factors.
6.2 Practical Implications
Manufacturing firms in South Africa delve in sustainability practices for legitimation purposes.
We posit this is to secure their reason for existence with the stakeholders as opposed to the need

64
for doing good. We therefore advance that if management pursues sustainability practices
beyond a tick-box exercise, the positive relationship of sustainability disclosures to financial
performance will be a significant one capturing additional competitive advantages brought on
from this differentiating factor. The regulators to encourage embracement of sustainability in
the region may offer these firms incentives to offset their social obligations to the community.
6.3 Further Areas for Research
Previous research and ours included have largely focused on analysis of public companies with
little exploration done on private companies analysis. For further research, we recommend an
exploration of the relationship between sustainability disclosure and financial performance of
private companies in South Africa to establish if an umbrella trend does exist between listed
and unlisted firms. Future work could also replicate such a study and examine whether
additional factors known to correct for endogeneity problems (research and development
intensity and advertising intensity) would sustain a neutral relationship as ours has. While we
have used capital intensity to factor endogeneity problems, we consider it adequate given
supplementary information that compliance largely drives sustainability practices. The extra
control factors would provide a glimpse on whether innovation too can impact firm value
arising from sustainability practices or affirm that company’s pursuit of sustainability is
myopic, limited to checking of boxes and or hinged on gaining a first -mover advantage in
‘green’ export markets.
65
References
Adams, C. & Evans, R. (2004). Accountability, completeness, credibility and the audit
expectations gap. Journal of Corporate Citizenship, [e-journal] vol 14, pp.97–115, Available
through: LUSEM Library website http://www.lusem.lu.se/library [Accessed 23 March 2018]
Altuwaijri, S.A., Christensen, T.E. & Hughes Ii, K.E. (2004). The relations among
environmental disclosure, environmental performance, and economic performance: a
simultaneous equations approach. Accounting, organizations and society, [e-journal] vol.29,
no.5-6, pp.44o.7-471, Available through: LUSEM Library website
http://www.lusem.lu.se/library [Accessed 21 March 2018]
Ameer, R. & Othman, R. (2011). Sustainability practices and corporate financial performance:
A study based on the top global corporations. Journal of Business Ethics, [e-journal] vol.108,
no.1, pp.61-79, Available through: LUSEM Library website http://www.lusem.lu.se/library
[Accessed 18 April 2018]
Bansal, P. (2002). The corporate challenges of sustainable development. Academy of
Management Review, [e-journal] vol.16, no 2, pp.122–131, Available through: LUSEM Library
website http://www.lusem.lu.se/library [Accessed 28 March 2018]
Barbier, E.B. (1987). The concept of sustainable economic development. Environmental
conservation, [e-journal] vol. 14 no. 2, pp.101-110. Available through: LUSEM Library
website http://www.lusem.lu.se/library [Accessed 8 April 2018]
Barney, J. (1991). Firm resources and sustained competitive advantage. Journal of
management, [e-journal] vol.17, no 1, pp.99-120, Available through: LUSEM Library website
http://www.lusem.lu.se/library [Accessed 12 April 2018]
Bebbington, J. (2001). Sustainable development: A review of the international development,
business and accounting literature. Accounting Forum, vol.25, no.2, pp.128–157.Available at:
http://citeseerx.ist.psu.edu/viewdoc/download?doi=10.1.1.456.7371&rep=rep1&type=pdf
[Accessed 29 March 2018]
Bellringer, A., Amanda, B. & Russell C. (2011). Reasons for sustainability reporting by New
Zealand local governments. Sustainability Accounting, Management and Policy Journal, [e-
journal] vol.2, no. 1, pp. 126-138. Available through: LUSEM Library website
http://www.lusem.lu.se/library [Accessed 31 March 2018]
Bhattacherjee, A. (2012). Social science research: Principles, methods, and practices:USF
Tampa Bay Open Access Textbooks Collection [pdf] Available at:
http://scholarcommons.usf.edu/cgi/viewcontent.cgi?article=1002&context=oa_textbooks
[Accessed 28 March 2018]
Bloomberg (2018). FTSE/JSE All Africa Share Index. Available Online:
https://www.bloomberg.com/quote/JALSH:IND [Accessed 14 April 2018]

66
Bourgeois III, L.J. (1981). On the measurement of organizational slack. Academy of
Management review,[e-journal] vol.6, no.1, pp.29-39, Available through: LUSEM Library
website http://www.lusem.lu.se/library [Accessed 17 April 2018]
Briassoulis, H. (2001) Sustainable development and its indicators: through a (planner’s) glass
darkly. Journal of Environmental Planning and Management, [e-journal] vol.44, no.3, pp.409-
427. Available through: LUSEM Library website http://www.lusem.lu.se/library [Accessed 25
March 2018]
Brooks, C., (2014). Introductory econometrics for finance. Cambridge university press.
Brown, J. & Fraser, M. (2006). Approaches and perspectives in social and environmental
accounting: an overview of the conceptual landscape. Business Strategy and the Environment,
[e-journal] vol.15, no.2, pp.103-117. Available through: LUSEM Library website
http://www.lusem.lu.se/library [Accessed 25 March 2018]
Brundtland, G.H. (1987). Report of the World Commission on environment and development:"
our common future.", United Nations.[pdf] Available at: http://www.un-documents.net/our-
common-future.pdf [Accessed 8 March 2018]
Bryman, A & Bell, E. (2013). Business research methods. Oxford: Oxford University Press
Burmeister, E. & Aitken, L. M. (2012). Sample size: How many is enough? Australian Critical
Care, vol.25, pp. 271-274.
Chen, R.S. (1975). Social and financial stewardship. The Accounting Review, [e-journal] vol.
50, no. 3, pp 533-543, Available through: LUSEM Library website
http://www.lusem.lu.se/library [Accessed 18 March 2018]
Chiu, Y.C. & Liaw, Y.C. (2009) “Organizational slack: is more or less better?”, Journal of
Organizational Change Management, vol. 22, no. 3, pp. 321–342,
Clark, W.C. (1989). Managing planet earth. Scientific American, [e-journal] vol. 261, no. 3,
pp.47-54, Available through: LUSEM Library website http://www.lusem.lu.se/library
[Accessed 17 April 2018]
Dawkins, C. & Ngunjiri, F.W. (2008). Corporate social responsibility reporting in South Africa:
A descriptive and comparative analysis. The Journal of Business Communication, [e-journal]
vol.45, no.3, pp.286-307. Available through: LUSEM Library website
http://www.lusem.lu.se/library [Accessed 18 March 2018]
Deegan, C. (2002). Introduction: The legitimizing effect of social and environmental
disclosures: a theoretical foundation. Accounting, Auditing & Accountability Journal, [e-
journal], vol.15, no.3, pp.282-311. Available through: LUSEM Library website
http://www.lusem.lu.se/library [Accessed 18 March 2018]
Dibley, L. (2011). Analyzing narrative data using McCormack’s lenses. Nurse Researcher,
vol.18, no. 3, p. 13-19. Available online: http://nurseresearcher.rcnpublishing.co.uk/news-
andopinion/commentary/analysing-qualitative-data

67
Dimson E., Karakas.O & Li.X. (2015).Active Ownership. The Review of Financial Studies. [e-
journal], vol.28, no.12, pp.3225-3268. Available through: LUSEM Library website
http://www.lusem.lu.se/library [Accessed 28 March 2018]
Donaldson, T. & Preston, L.E. (1995). The stakeholder theory of the corporation: Concepts,
evidence, and implications. Academy of management Review, [e-journal], vol. 20, no.1, pp.65-
91. Available through: LUSEM Library website http://www.lusem.lu.se/library [Accessed 21
March 2018]
Dowell, G., Hart, S. & Yeung, B. (2000). Do corporate global environmental standards create
or destroy market value? Management science, [e-journal] vol.46, no.8, pp.1059-1074.
Available through: LUSEM Library website http://www.lusem.lu.se/library [Accessed 22
March 2018]
Dowling, J. & Pfeffer, J. (1975). Organizational legitimacy: Social values and organizational
behavior. Pacific sociological review, [e-journal], vol.18, no.1, pp.122-136. Available through:
LUSEM Library website http://www.lusem.lu.se/library [Accessed 28 March 2018]
Ehrenfeld, J.R. (2005). The roots of sustainability. MIT Sloan Management Review, [e-journal],
vol.46, no.2, p.23. Available through: LUSEM Library website http://www.lusem.lu.se/library
[Accessed 18 March 2018]
Elkington, J. (1998). Cannibals with forks. The triple bottom line of 21st century, [e-book]
Oxford: Capstone. Available through: LUSEM University Library website
http://www.lusem.lu.se/library [Accessed 26 March 2018]
EY (2016). Value of sustainability reporting A study by EY and Boston College Center for
Corporate Citizenship [pdf] Available at:
http://www.ey.com/Publication/vwLUAssets/EY_Sustainability_reporting_-
_the_time_is_now/$FILE/EY-Sustainability-reporting-the-time-is-now.pdf [Accessed 13
March 2018]
Fadul, J. (2004). Business ethics, corporate social responsibility, and firm value in the oil and
gas industry, PhD thesis, Department of Applied Management and Decision Sciences, Walden
University, Available online:
https://scholarworks.waldenu.edu/cgi/viewcontent.cgi?article=1000&context=dilley
[Accessed 15 April 2018]
Farneti, F. & Guthrie, J. (2009). Sustainability reporting by Australian public-sector
organizations: Why they report. In Accounting forum, [e-journal], vol. 33, no. 2, pp. 89-98.
Available through: LUSEM University Library website http://www.lusem.lu.se/library
[Accessed 26 March 2018]
Freeman, R.E. (1984). Strategic Management: A Stakeholder Approach, Boston: Pitman,
Organizational Studies, vol. 7, no. 3, p.302
Friedman, M. (1970). “The Social Responsibility of Business is to Increase Its Profits.” Ethical
Issues in Business. A Philosophical Approach. pp. 217-223.

68
Frosch, R.A. & Gallopoulos, N.E. (1989). Strategies for manufacturing. Scientific American,
[e-journal] vol. 261, no. 3, pp.144-153. Available through: LUSEM University Library website
http://www.lusem.lu.se/library [Accessed 26 March 2018]
FTSE. (2018). ESG Ratings and data model. Available online
:http://www.ftse.com/products/downloads/ESG-ratings-overview.pdf?796 [Accessed 15 April
2018]
Fusch, P.I. and Ness, L.R. (2015). Are we there yet? Data saturation in qualitative research. The
qualitative report, [e-journal], vol. 20, no.9, pp.1408. Available through: LUSEM University
Library website http://www.lusem.lu.se/library [Accessed 21 May 2018]
Garcia-Castro, R., Ariño, M.A. & Canela, M.A. (2009). Does social performance really lead to
financial performance? Accounting for endogeneity. Journal of Business Ethics, [e-journal]
vol.92, no.1, pp.107-126. Available through: LUSEM University Library website
http://www.lusem.lu.se/library [Accessed 15 April 2018]
George, G. (2005). Slack resources and the performance of privately held firms. Academy of
Management Journal, [e-journal], vol.48, no.4, pp.661-676. Available through: LUSEM
University Library website http://www.lusem.lu.se/library [Accessed 20 March 2018]
Gral, B. (2013). How Financial Slack Affects Corporate Performance: An Examination in an
Uncertain and Resource Scarce Environment. Springer Science & Business Media.
Gray, R. & Milne, M. (2004). Towards reporting on the triple bottom line: mirages, methods
and myths. The triple bottom line: Does it all add up, pp.70-80, Available online:
https://www.researchgate.net/profile/Markus_Milne/publication/45417330_Towards_reportin
g_on_the_triple_bottom_line_mirage_methods_and_myths/links/560364e208ae08d4f171626
b/Towards-reporting-on-the-triple-bottom-line-mirage-methods-and-myths.pdf [Accessed 21
March 2018]
Gray, R., Dey, C., Owen, D., Evans, R. & Zadek, S. (1997). Struggling with the praxis of social
accounting: Stakeholders, accountability, audits and procedures. Accounting, Auditing &
Accountability Journal, [e-journal], vol.10, no.3, pp.325-364. Available through: LUSEM
University Library website http://www.lusem.lu.se/library [Accessed 16 April 2018]
GRI (2016). Sustainability reporting guidelines. Available online:
https://www.globalreporting.org/resourcelibrary/G3.1-Guidelines-Incl-Technical-Protocol.pdf
[Accessed 15 April 2018]
Gunasekaran, A. & Spalanzani, A. (2012). Sustainability of manufacturing and services:
Investigations for research and applications. International Journal of Production Economics,
[e-journal], vol.140, no.1, pp.35-47. Available through: LUSEM University Library website
http://www.lusem.lu.se/library [Accessed 26 April 2018]
Hackston, D. & Milne, M.J. (1996). Some determinants of social and environmental disclosures
in New Zealand companies. Accounting, Auditing & Accountability Journal, [e-journal], vol.9

69
, no.1, pp.77-108. Available through: LUSEM University Library website
http://www.lusem.lu.se/library [Accessed 29 March 2018]
Hammersley, M. (1996). The relationship between qualitative and quantitative research:
Paradigm loyalty versus methodological eclecticism.
Hansen, G. & Wernerfelt, B. (1989). Determinants Of Firm Performance: The Relative
Importance Of Economic And Organizational Factors, Strategic Management Journal, [e-
journal], vol.10,no.5, pp. 399-411. Available through: LUSEM University Library website
http://www.lusem.lu.se/library [Accessed 16 May 2018]
Hart, S.L. & Ahuja, G. (1996). Does it pay to be green? An empirical examination of the
relationship between emission reduction and firm performance. Business strategy and the
Environment, [e-journal], vol.5, no.1, pp.30-37. Available through: LUSEM University Library
website http://www.lusem.lu.se/library [Accessed 26 March 2018]
Hedberg, C.J. & Malmborg, V.F. (2003). The global reporting initiative and corporate
sustainability reporting in Swedish companies. Corporate social responsibility and
environmental management, [e-journa], vol.10, no.3, pp.153-164. Available through: LUSEM
University Library website http://www.lusem.lu.se/library [Accessed 16 April 2018]
Hillman, A.J. & Keim, G.D. (2001). Shareholder value, stakeholder management, and social
issues: What's the bottom line? Strategic management journal, [e-journal], vol.22, no.2,
pp.125-139. Available through: LUSEM University Library website
http://www.lusem.lu.se/library [Accessed 16 March 2018]
Hoskisson, R. E., Eden, L., Lau, C. M., & Wright, M. (2000). Strategy in emerging
economies. Academy of management journal, [e-journal] vol.43 no.3,pp. 249-267. Available
through: LUSEM University Library website http://www.lusem.lu.se/library [Accessed 16
March 2018]
Hopwood, B., Mellor, M, & O'Brien, G. (2005). Sustainable development: mapping different
approaches. Sustainable Development, [e-journal], vol.13, no.1, pp. 38-52, Available through:
LUSEM University Library website http://www.lusem.lu.se/library [Accessed 24 March 2018]
Hubbard, G. (2009). Measuring organizational performance: beyond the triple bottom line.
Business strategy and the environment, [e-journal], vol.18, no.3, pp.177-191. Available
through: LUSEM University Library website http://www.lusem.lu.se/library [Accessed 21
March 2018]
Huselid, M.A. (1995). The impact of human resource management practices on turnover,
productivity, and corporate financial performance. Academy of management journal, [e-
journal] vol. 38, no.3, pp.635-672. Available through: LUSEM University Library website
http://www.lusem.lu.se/library [Accessed 28 March 2018]
IDC, (2017). Economic trends: Key trends in the South African economy. [pdf] Available at:
https://www.idc.co.za/images/2017/IDC_RI_publication_Key-trends-in-SA-economy_31-
March-2017.pdf

70
IFC (2011). Sustainable investment in Sub-Saharan Africa. Available Online:
https://www.ifc.org/wps/wcm/connect/65c3300048865905b7faf76a6515bb18/IFC_Sustainabl
e_Investment_in_SubSaharan_Africa.pdf?MOD=AJPERES&CACHEID=65c330004886590
5b7faf76a6515bb18 [Accessed 20 April 2018]
IOD Institute of Directors of Southern Africa. (2009). King III report on corporate governance
for South Africa. Available Online: http://african.ipapercms.dk/IOD [Accessed 27 March 2018]
Jensen, M.C. & Meckling, W.H. (1976). Theory of the firm: Managerial behavior, agency costs
and ownership structure. Journal of financial economics, [e-journal], vol.3, no.4, pp.305-360.
Available through: LUSEM University Library website http://www.lusem.lu.se/library
[Accessed 29 March 2018]
Jones, S., Frost, G., Loftus, J. & Laan, S. (2007). An empirical examination of the market
returns and financial performance of entities engaged in sustainability reporting. Australian
Accounting Review,[e-journal], vol. 17, no.41, pp.78-87. Available through: LUSEM
University Library website http://www.lusem.lu.se/library [Accessed 29 March 2018]
King, A.A. & Lenox, M.J. (2001). Does it really pay to be green? An empirical study of firm
environmental and financial performance: An empirical study of firm environmental and
financial performance. Journal of Industrial Ecology, [e-journal] vol.5, no.1, pp.105-116. .
Available through: LUSEM University Library website http://www.lusem.lu.se/library
[Accessed 11 April 2018]
King, M. E. (2010). The synergies and interaction between King III and the Companies Act 61
of 2008. Acta Uridica,[e-journal], no.1, 446–455. Available through: LUSEM University
Library website http://www.lusem.lu.se/library [Accessed 6 April 2018]
Konar, S. & Cohen, M.A. (2001). Does the market value environmental performance? Review
of economics and statistics, [e-journal], vol.83 no.2, pp.281-289. Available through: LUSEM
University Library website http://www.lusem.lu.se/library [Accessed 4 April 2018]
KPMG (2017), The road ahead: The KPMG Survey of Corporate Responsibility Reporting.
Available online: https://assets.kpmg.com/content/dam/kpmg/xx/pdf/2017/10/kpmg-survey-
of-corporate-responsibility-reporting-2017.pdf [Accessed 17 April 2018]
Kraatz, M. S. & Zajac, E. J. (2001). How organizational resources affect strategic change and
performance in turbulent environments: Theory and evidence. Organization Science, vol.12,
pp. 632– 657.
Laufer, W.S. (2003). Social accountability and corporate greenwashing. Journal of business
ethics,[e-journal],vol.43, no.3, pp.253-261. Available through: LUSEM University Library
website http://www.lusem.lu.se/library [Accessed 12 April 2018]
Laughlin, R.C. (1987). Accounting systems in organisational contexts: a case for critical theory.
Accounting, Organizations and Society, [e-journal], vol.12, no.5, pp.479-502. Available
through: LUSEM University Library website http://www.lusem.lu.se/library [Accessed
21April 2018]

71
Lee, K.N. (1993). Greed, scale mismatch and learning. Ecological Applications, [e-journal],
vol. 3 no. 4, pp. 560-564. Available through: LUSEM University Library website
http://www.lusem.lu.se/library [Accessed 22 March 2018]
Lopez, M.V., Garcia, A& Rodriguez, L. (2007).Sustainable development and corporate
performance: A study based on the Dow Jones sustainability index. Journal of Business Ethics.[
e-journal], vol.75, no. 3, pp. 285-300. Available through: LUSEM University Library website
http://www.lusem.lu.se/library [Accessed 28 March 2018]
Matthews, M.R. (1993). Socially Responsible Accounting. London: Chapman and Hall
Maubane, P., Prinsloo, A. and Van Rooyen, N. (2014). Sustainability reporting patterns of
companies listed on the Johannesburg securities exchange. Public Relations Review,[e-journal],
vol. 40, no.2, pp.153-160. Available through: LUSEM University Library website
http://www.lusem.lu.se/library [Accessed 12 April 2018]
Mendelow, A.L. (1983). Setting corporate goals and measuring organizational effectiveness—
A practical approach. Long Range Planning, [e-journal] vol.16, no.1, pp.70-76. Available
through: LUSEM University Library website http://www.lusem.lu.se/library [Accessed 29
March 2018]
McGuire, J. B., Sundgren, A., & Schneeweis, T. (1988). Corporate social responsibility and
firm financial performance. Academy of Management Journal, 31(4), 854–872. Available
through: LUSEM University Library website http://www.lusem.lu.se/library [Accessed 28
March 2018]
McWilliams, A. & Siegel, D. (2001). Corporate social responsibility: A theory of the firm
perspective. Academy of management review, [e-journal], vol.26, no.1, pp.117-127. Available
through: LUSEM University Library website http://www.lusem.lu.se/library [Accessed 18
March 2018]
McWilliams, A. & Siegel, D., (2000). Corporate social responsibility and financial
performance: correlation or misspecification?. Strategic management journal, [e-journal],
vol.21, no.5, pp.603-609. Available through: LUSEM University Library website
http://www.lusem.lu.se/library [Accessed 11 April 2018]
Milne, M. J., & Patten, D. M. (2002). Securing organizational legitimacy: An experimental
decision case examining the impact of environmental disclosures. Accounting Auditing and
Accountability Journal, vol.15, no.3,pp. 372–405. Available through: LUSEM University
Library website http://www.lusem.lu.se/library [Accessed 18 March 2018]
Milne, M.J. and Adler, R.W. (1999). Exploring the reliability of social and environmental
disclosures content analysis. Accounting, Auditing & Accountability Journal, [e-journal]
vol.12, no.2, pp.237-256. Available through: LUSEM University Library website
http://www.lusem.lu.se/library [Accessed 8 March 2018]
Mishina, Y., Pollock, T. G., & Porac, J. F. (2004). Are more resources always better for growth?
Resource stickiness in market and product expansion. Strategic Management Journal, vol.25,
pp.1179 –1197.

72
Nohria, N. and Gulati, R. (1997). “What is the Optimum Amount of Organizational Slack? A
Study of the Relationship between Slack and Innovation of Multinational Firms”, European
Management Journal, vol. 15 no. 6, pp. 603–611
Orlitzky, M., Schmidt, F.L. & Rynes, S.L. (2003). Corporate social and financial performance:
A meta-analysis. Organization studies, [e-journal], vol.24, no.3, pp.403-441. Available
through: LUSEM University Library website http://www.lusem.lu.se/library [Accessed 31
March 2018]
Preston, L.E. & O'bannon, D.P. (1997). The corporate social-financial performance
relationship: A typology and analysis. Business and Society, vol. 36, no.4, pp.419-429.
Available through: LUSEM University Library website http://www.lusem.lu.se/library
[Accessed 10 March 2018]
Rahman, B.A. & Momin, M. (2009). Corporate social reporting (CSR) in emerging economies:
A review and future direction. Accounting in Emerging Economies [e-journals], pp.119-143
Available through: LUSEM University Library website http://www.lusem.lu.se/library
[Accessed 8 March 2018]
RobecoSam. (2017). Country Sustainability Ranking Update-November 2017. Available
online: http://www.robecosam.com/images/Country_Ranking_Update_October_2017.pdf
Robinson, J. (2004). Squaring the circle? Some thoughts on the idea of sustainable
development. Ecological economics, [e-journal], vol.48, no.(4), pp.369-384. Available
through: LUSEM University Library website http://www.lusem.lu.se/library [Accessed 31
March 2018]
Saunders, M.., Lewis, P. & Thornhill, A. (2010), Research Methods for Business Students,
Pearson Education, London.
Schaltegger, S. & Synnestvedt, T. (2002). The link between ‘green’ and economic success:
environmental management as the crucial trigger between environmental and economic
performance. Journal of Environmental Management, [e-journal], vol.65, pp.339–346.
Available through: LUSEM University Library website http://www.lusem.lu.se/library
[Accessed 18 April 2018]
Schaltegger, S. and Wagner, M. (2006). Integrative management of sustainability performance,
measurement and reporting. International Journal of Accounting, Auditing and Performance
Evaluation, 3(1), pp.1-19. Available through: LUSEM University Library website
http://www.lusem.lu.se/library [Accessed 21 March 2018]
Simpson, W.G.& Kohers, T. (2002). The link between corporate social and financial
performance: Evidence from the banking industry. Journal of business ethics, vol.35, no.2,
pp.97-109. Available through: LUSEM University Library website
http://www.lusem.lu.se/library [Accessed 29 March 2018]
Slaper, T. F. & Hall, T. J. (2011). The Triple Bottom Line: What Is It and How Does It Work?
Indiana Business Review, [e-journal],vol. 86, no.1, pp. 4–8. Available through: LUSEM
University Library website http://www.lusem.lu.se/library [Accessed 29 March 2018]

73
Songini, L. & Pistoni, A. (2015). Sustainability disclosure: State of the art and new directions.
Emerald Group Publishing,Available through: LUSEM University Library website
http://www.lusem.lu.se/library [Accessed 21 March 2018]
Stattsa, (2014). Manufacturing industry: Financial 2014 [pdf]. Available at:
http://www.statssa.gov.za/publications/Report-30-02-03/Report-30-02-032014.pdf [Accessed:
28 March 2018]
Suchman, M. C. (1995). Managing legitimacy: Strategic and institutional approaches. Academy
of Management Review, vol.20, pp. 571-610. , Available through: LUSEM University Library
website http://www.lusem.lu.se/library [Accessed 31 March 2018]
Thompson, P. and Zakaria, Z., (2004). Corporate social responsibility reporting in
Malaysia. Journal of Corporate Citizenship, [e-journal], vol.13, pp.125-136. Available
through: LUSEM University Library website http://www.lusem.lu.se/library [Accessed 26
March 2018]
Trustradius (2018). Capital IQ reviews Available online:
https://www.trustradius.com/products/capital-iq/reviews [Accessed Online: 8 April 2019]
Van. M., (2003). Concepts and definitions of CSR and corporate sustainability: Between
agency and communion. Journal of business ethics, [e-journal] , vol.44, no.2-3, pp.95-105.
,Available through: LUSEM University Library website http://www.lusem.lu.se/library
[Accessed 21 March 2018]
Venkataraman, S. (2002). Stakeholder value equilibration and the entrepreneurial process. The
Ruffin Series of the Society for Business Ethics, [e-journal], vol. 3, pp.45-57. Available through:
LUSEM University Library website http://www.lusem.lu.se/library [Accessed 19 April 2018]
Verrecchia, R.E. (1983). Discretionary disclosure. Journal of accounting and economics,[e-
journal], vol.5, pp.179-194. Available through: LUSEM University Library website
http://www.lusem.lu.se/library [Accessed 14 April 2018]
Viederman, S. (1994). The economics of sustainability: Challenges. New York: Jessie Smith
Noyes Foundation
Visser, W.A.M.T. (2002). Sustainability reporting in South Africa. Corporate Environmental
Strategy, [e-journal], vol.9, no.1, pp.79-85. Available through: LUSEM University Library
website http://www.lusem.lu.se/library [Accessed 8 April 2018]
Voss, G.B., Sirdeshmukh, D. &Voss, Z.G. (2008). The effects of slack resources and
environmental threat on product exploration and exploitation. Academy of Management
Journal, [e-journal], vol.51, no.1, pp.147-164. Available through: LUSEM University Library
website http://www.lusem.lu.se/library [Accessed 18 May 2018]
Waddock, S.A. & Graves, S.B. (1997). The corporate social performance-financial
performance link. Strategic management journal, [e-journal], pp.303-319. Available through:
LUSEM University Library website http://www.lusem.lu.se/library [Accessed 14 April 2018]

74
Wagner, M. (2007). Integration of environmental management with other managerial functions
of the firm: empirical effects on drivers of economic performance. Long Range Planning, [e-
journal], vol.40, no.6, pp.611-628. Available through: LUSEM University Library website
http://www.lusem.lu.se/library [Accessed 2 April 2018]
Waldman, D. A., De Luque, M. S., Washburn, N., House, R. J., Adetoun, B., Barrasa, A… et
al. (2006). Cultural and leadership predictors of corporate social responsibility values of top
management: A GLOBE study of 15 countries. Journal of International Business Studies, [e-
journal] vol.37, pp. 823-837. Available through: LUSEM University Library website
http://www.lusem.lu.se/library [Accessed 12 April 2018]
Warsame, H., Simmons, C.V. Neu, D. (2002). Responding to “discrediting” events: Annual
report disclosure responses to environmental fines. Accounting and the Public Interest, [e-
journal] vol.2, no.1, pp.22-40. Available through: LUSEM University Library website
http://www.lusem.lu.se/library [Accessed 5 May 2018]
Wiseman, J., (1982). An evaluation of environmental disclosures made in corporate annual
reports. Accounting, Organizations and Society, [e-journal] vol.7,no.1, pp.53-63. Available
through: LUSEM University Library website http://www.lusem.lu.se/library [Accessed 15
April 2018]
Wiseman, R. & Bromiley, P. (1996). Towards a model of risk in declining organizations: An
empirical examination of risk, performance and decline. Organization Science, [e-journal],
vol.7, pp.524- 543. Available through: LUSEM University Library website
http://www.lusem.lu.se/library [Accessed 22 April 2018]
World Conservation Union (2006). The Future of Sustainability Re-thinking Environment and
Development in the Twenty-first Century [pdf] Available at:
http://cmsdata.iucn.org/downloads/iucn_future_of_sustanability.pdf [Accessed 21 March
2018]
Yin, R.K., (2009). Case study research: Design and methods (applied social research
methods). London and Singapore: Sage.

75
APPENDIX 1: INTERVIEW QUESTIONS
General questions on Sustainability
How would you describe the overall sustainability normative landscape pertaining to
manufacturing firms in South Africa?
What general approaches do manufacturing firms in South Africa use in implementing
sustainability practices?
Which group(s) of people would you say majorly influence/ drive companies’ attention
to sustainability in South Africa?
Sustainability disclosures
Our findings indicate that investigated manufacturing firms report more on
environmental followed by diversity aspects compared to equal reporting on community
and ethical aspects. Why do you think this appears to be so especially in a country
(South Africa) where people empowerment is critical
We explored relative impact of sustainability individual disclosures to firm value and
found some patterns:
Both groups of manufacturing firms analysed benefit most from environmental
sustainability practices to a small degree.
More sustainable firms do benefit more from environmental practices while
community is equally costly for them. Ethical sustainability comes close in cost
followed by environmental sustainability practices.
Less sustainable firms benefit most from diversity followed by ethical practices
while community practices is most costly for them followed by environmental
practices. This group also reports more on ethical sustainability dimensions than
the most sustainable firms.
How would you comment on these trends?
In your opinion, why have very few companies in South Africa adopted the practice of
issuing separate sustainability reports?
Would you consider South African consumers to be aware of sustainability practices of
companies and therefore base their interactions with firms’ outputs on their level of
practise? If yes, what key sustainability aspect would you say is more preferred by
consumers? (Community work, diversity, environment, ethical)
Does the existence of sustainability ranking of companies by e.g Robescom, FTSE/JSE
index and other indices fuel more adoption of sustainability practices by South African
manufacturing companies?
How would you perceive the environment manufacturing firms operate in: Does it have
an impact –if any, on the level of sustainability practices other than prevailing legislation
from the government and oversight authorities?

76
Do financial institutions such as banks in South Africa focus on sustainability affairs of
companies before approving finances or lines of credit for companies?
How do you envision the future of sustainability reporting and disclosures would look
like in South Africa in the next 5 years?
APPENDIX 2: Questions for content analysis adopted from Fadul (2004)
Ethical Standards Index (ESI)
Does the company have a written Code of Business Conduct used as a guide to help
employees live up to the company's ethical standards?
Does the code go beyond the legal minimums?
Does the code include corporate policies dealing with business conduct specifically
related to Equal Employment Opportunity?
Does the code include corporate policies dealing with business conduct specifically
related to conflicts of interest?
Does the code include corporate policies dealing with business conduct specifically
related to commercial bribery?
Does the code include corporate policies dealing with business conduct specifically
related to international business relationships?
7.Does the code include corporate policies dealing with business conduct specifically
related to use and public disclosure of inside information, and the use of confidential
and proprietary information?
8.Does the code include corporate policies dealing with business conduct specifically
related to export compliance and international economic sanctions?
9.Does the code include corporate policies dealing with business conduct specifically
related to political contributions?
10.Does the code include corporate policies dealing with business conduct specifically
related to antitrust and competition laws?
11.Does the code include corporate policies dealing with business conduct specifically
related to health, safety and environment?
12. Does the code include corporate policies dealing with business conduct specifically
related to harassment?
13.Has the company, its executives, managers, and employees consistently operated
within the framework provided by the Code of Business Conduct in the past three years?

77
Community Service Index (CSI)
Does the company have a charitable foundation and if so, how much was given during
the most recent fiscal year?
Does the company have exceptional or particularly innovative charitable-giving
programs?
Is the company an industry leader with respect to its performance in Community
activism?
Does the company have exceptional volunteer programs?
Is there evidence of new initiatives implemented by or awards given to the company
with respect to its performance in this category?
What community programs does the company have in place?
Does the company have employee volunteer programs?
Do the company's volunteer programs involve a large portion of the company's current
and former workforce?
Does the company participate in public/private partnerships related to education, job
training, or urban revitalization and if so, what is the nature of the company's
commitment to them?
Does the company have partnerships with local schools or community-based groups?
Does the company have a corporate giving program and if so, how much was given
during the most recent fiscal year?
Is the company committed to donating a given percentage of its pretax profits to
charitable organizations and if so, what percentage is the target goal?
Environmental Index (El)
Is the company in compliance with environmental laws and regulations?
What civil lawsuits, particularly those covering overseas issues, has the company been
subject to, with respect to its environmental performance in the past three years?
What assets has the company accrued for pollution remediation?
Does the company have environmental remediation liabilities?
Does the company have current substantial liabilities for the remediation of asbestos?
Is the company dedicated to the conservation of energy and natural resources, with
emphasis on the impact of operations on the local community?

78
Is the company proactive in its environmental efforts?
Has the company demonstrated a commitment to change, with respect to its
environmental performance?
Has the company developed new products and/or processes that will reduce or
minimize environmental impact?
Has the company adopted new technologies and/or redesigned products to conserve
the use of energy, water, materials, and/or land?
Is the company involved with the new development or use of clean energy, sustainable
renewable energy, or natural foods?
Is the company perceived as an industry leader, with respect to its performance in this
category?
What is the effectiveness of the company's environmental policies; specifically, are the
company's established programs and/or goals actually improving its environmental
performance?
Has the company taken positive steps toward preserving our environment?
Does the company have environmental policies in effect with measurable goals,
companywide responsibility, and quantitative accountability?
Does the company have voluntary programs in place, including recycling?
Does the company have specific environmental policies and if so, what are they?
What are the company's major policies to prevent air and water pollution?
Does the company have an environmental report, including quantitative data on
emissions/pollution? What are the company's levels of emission? What are the
company's levels of environmental data, e.g., TRI, spills, etc. ?
What are the company's recycling efforts?
Are all company operations (including those abroad) in compliance with
environmental statutes?
What is the nature and amount of EPA violations and fines paid?

79
Diversity Index (DI)
Has the company demonstrated a commitment to workforce diversity?
Does the company actively hire and promote minorities and women?
Has the company demonstrated its commitment to diversity through strong
representation of women, minorities, and the disabled on boards of directors, in top
management, and/or among the company's highest paid employees?
Has the company demonstrated its commitment to diversity through its training and
advancement programs (e.g., support networks, management reviews, mentoring)?
Has the company demonstrated its commitment to diversity through participation in
women and minority vendor and banking programs?
Has the company demonstrated its commitment to diversity through implementation
of innovative work/life programs (e.g., flextime, job sharing, child care, elder care)?
Does the company have programs to train woman for advancement?
Does the company conduct diversity training for its employees?
Does the company have a history of violations in the area of abusive labor conditions?
Does the company have a poor Equal Employment Opportunity Commission (EEOC)
record?
Does the company's record in this area show a systematic or repeated disregard for the
need to foster an open and diverse work environment?
Does the company have affirmative action programs pertaining to recruitment and
promotion?
Does the company, at a minimum, have in place specifically stated policies against
discrimination in hiring and promotion based upon sexual orientation?
Does the company have a set of standards for its overseas operations and non-U.S.
contractors and suppliers?
Does the company have a board or staff task force or committee set up to address
diversity related issues?
Does the company clearly exclude women from positions in operating top
management?
Does the company have women and minorities serving in positions with substantial
profit and loss responsibilities?

80
Does the company have gender equity in wages?
How does the company portray woman in advertising and marketing materials?
What is the nature and extent of any civil discrimination lawsuits brought against the
company?
Does the company have an understanding of the need for minority constituencies to
have more of a voice in business?

81
APPENDIX 3: Content Analysis scoring
Statement in Sustainability report Score
Company W is proud to say that we have met and exceeded our objectives;
and what started out as a small project has turned into a full-scale recycling
programme benefiting the communities of Northern KwaZulu-Natal.
2
Company X does not unfairly discriminate on any arbitrary ground against
individuals or groups of people and supports the principle of developing and
promoting employees from within where vacancies arise. If no suitably
qualified candidates are available, vacancies are advertised externally.
2
A flagship project was undertaken in 2015/2016 in respect of x mine and was
finalized during the course of 2016. This project was a joint venture between
the mine and its key suppliers whereby the mine provided a maths and science
laboratory affording eight schools in the area access to library equipment. The
maths and science educational software worth R112 000 was donated towards
the project.
3
We experienced a significant increase in the number of lost time and medical
treatments and a slight increase in the number of lost working days of 116
(2015: 104), equally spread across employees and contractors. Five incidents
were related to manual handling activities and the majority of these injuries
point to unsafe behavior by operators and drivers, and in some cases, a
hindered management line of sight. The total recordable incidents were
marginally higher from the previous year at 25 (2015: 24).
3
We support and are committed to the concept of broad-based black economic
empowerment and actively promote the empowerment of staff members and
the communities (continued) in which we operate. We have a 100% score on
enterprise development, mainly as a result of our strategy to use contract
growers with a Black ownership component. We also scored 100% in socio-
economic development as a result of our wellness programme. Our rating
improved to a Level BBBA, which is an improvement of 90% since our first
rating.
2
Car rental operations in South Africa produced 105 179 t carbon dioxide
(2015: 99 162 tCO2,e) an increase of 6% from 2015. This figure has been
included in our external assurance review for the first time this year. Over
2015, emissions intensity per rental day increased marginally while emissions
intensity per kilometre decreased marginally. We intend to report emissions
from other significant rental fleets. These processes are being refined and
disclosure will be considered in due course.
2

82
APPENDIX 4: Descriptive Statistics combined firms
APPENDIX 5: Normality Test Initial regression combined firms
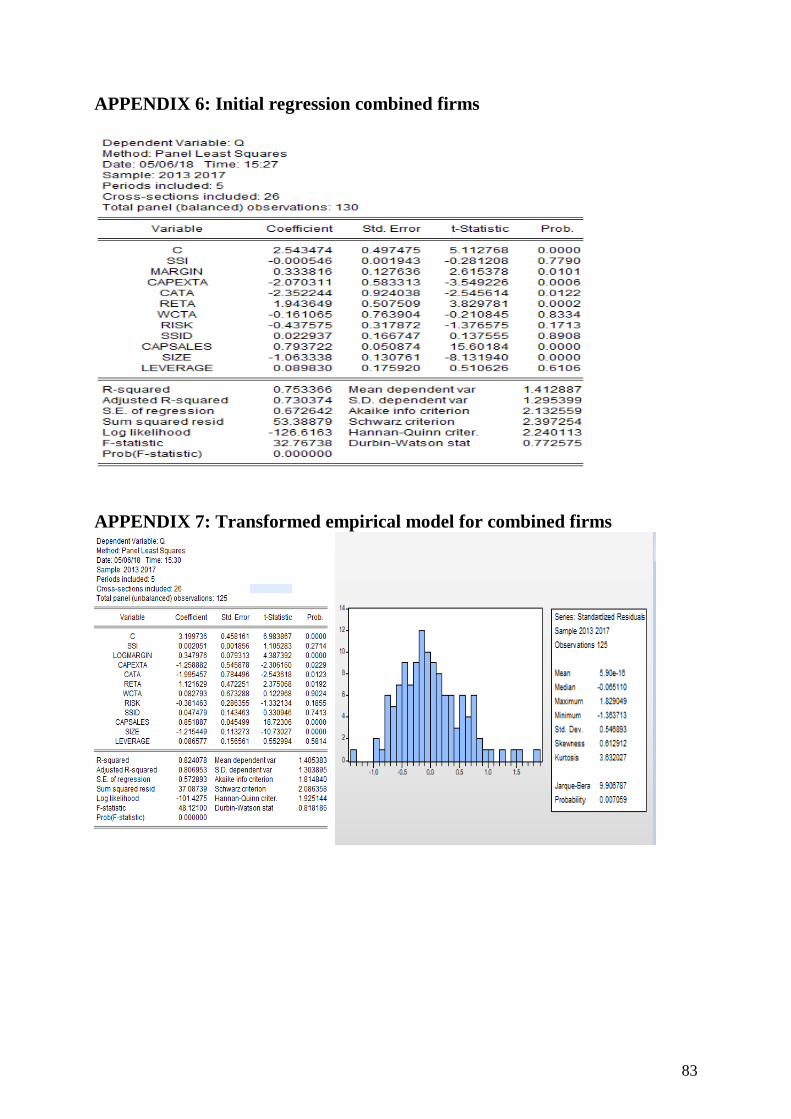
83
APPENDIX 6: Initial regression combined firms
APPENDIX 7: Transformed empirical model for combined firms

84
APPENDIX 8: Correlation Matrix combined firms
APPENDIX 9: Hausman Test for endogeneity

85
APPENDIX 10: Autocorrelation test for combined firms model
APPENDIX 11: Heteroscedasticity Residual check for combined firms
model

86
APPENDIX 12: Heteroscedasticity Test for combined firms model

87

88
APPENDIX 13: Applied heteroscedasticity white correction for combined
firms model
APPENDIX 14: Correlation Matrix control group firms

89
APPENDIX 15: Correlation Matrix Responsible Investment index firms
APPENDIX 16: Descriptive Statistics Responsible Investment index firms

90
APPENDIX 17: Descriptive Statistics control group firms
APPENDIX 18: Final regression equation

91
APPENDIX 19: Lag -1 regression combined firms
APPENDIX 20: Lag -2 regression combined firms

92
APPENDIX 21: Lag -3 regression combined firms
APPENDIX 22: Interaction model regression combined firms

93
APPENDIX 23: Correlation Matrix sustainability disclosures combined
firms
APPENDIX 24: Descriptive statistics sustainability disclosures combined
firms

94
APPENDIX 25: Descriptive statistics sustainability disclosures responsible
investment index firms
APPENDIX 26: Descriptive statistics sustainability disclosures control
group firms

95
APPENDIX 27: Model regression Q versus sustainability disclosures
combined firms
APPENDIX 28: Model regression Q versus sustainability disclosures
control group firms

96
APPENDIX 29: Model regression Q versus sustainability disclosures
responsible investment index firms

97
APPENDIX 30: Kruskal-Wallis non parametric test

98