Benchmarking Indian Megacities for Sustainability ― An Indicator‐Based Approach
84
SANEI WORKING PAPER SERIES 13 – 02 Benchmarking Indian Megacities for Sustainability ― An Indicator‐Based Approach B Sudhakara Reddy Balachandra Patil www.saneinetwork.net
Transcript of Benchmarking Indian Megacities for Sustainability ― An Indicator‐Based Approach

SANEI WORKING PAPER SERIES
13 – 02
Benchmarking Indian Megacities for Sustainability ― An Indicator‐Based Approach
B Sudhakara Reddy
Balachandra Patil
www.saneinetwork.net
SANEI WORKING PAPER SERIES
13 – 02
Benchmarking Indian Megacities for Sustainability ― An Indicator‐Based Approach
B Sudhakara Reddy Email: [email protected]
Indira Gandhi Institute of Development Research (IGIDR) India
Balachandra Patil Email: [email protected]
Indian Institute of Science (IISc) India
December 2013
Bangladesh Institute of Development Studies (BIDS) E-17 Agargaon, Sher-e-Bangla Nagar, Dhaka-1207, Bangladesh
T: +880 2 9118324, F: +880 2 8181237, E: [email protected], W: www.saneinetwork.net

First Published December 2013 The SANEI Working Papers present research studies completed by the Network under its different Programs. These papers reflect research carried out by researchers from South Asian countries who were selected by SANEI to conduct research on specific topics. It is expected that these papers would eventually be published in learned journals or form chapters of books after undergoing due review process and hence comments are most welcome. Neither the Management of SANEI nor any other agency associated with SANEI necessarily endorses any or all of the views expressed in these papers. The Working Papers reflect views based on professional analysis of the authors and the usual caveat of research reports applies. Terms of Use
The materials contained in the Working Papers are free for publication in its entirety or in part in newspapers, wire services, internet-based information networks and newsletters. One may also use the information in radio-TV discussions or as basis for discussion in different fora. We would, however, appreciate it if you could let us know when and where the publication was used. Recommended Citation
Reddy, B., Sudhakara, and Patil, Balachandra (2013). Benchmarking Indian Megacities for Sustainability ― An Indicator-Based Approach, SANEI Working Paper Series No. 13-02, South Asia Network of Economic Research Institutes, Dhaka. South Asia Network of Economic Research Institutes 1st Floor, Bangladesh Institute of Development Studies E-17 Agargaon, Sher-e-Bangla Nagar Dhaka-1207 Bangladesh T: +880 2 9118324 F: +880 2 8181237 E: [email protected] W: www.saneinetwork.net SANEI Working Paper Series Number: 13 - 02
Cover Design, Cover Photo and Typeset: Samiul Ahsan
Printed and bound by: Linc Communications, Dhaka, Bangladesh

CONTENTS
List of Tables ............................................................................................................................ iii List of Figures .......................................................................................................................... iv Acknowledgements ..................................................................................................................... v Abstract .................................................................................................................................... vi
CHAPTER 1: INTRODUCTION ................................................................................................................. 1
1.1 Background of the study ................................................................................................................ 1 1.2 Urbanisation and its impacts .......................................................................................................... 2 1.3 Urban sustainability ....................................................................................................................... 3 1.4 Megacities and sustainability ......................................................................................................... 3 1.5 Indicators of sustainability ............................................................................................................. 5 1.6 Objectives, scope and the expected outcomes................................................................................ 6 1.7 Urban sustainability—Mumbai and Bangalore .............................................................................. 6
CHAPTER 2: METHODOLOGY OF THE STUDY .................................................................................. 8
2.1 Urban sustainable indicators: background ..................................................................................... 8 2.2 Urban sustainability indicators—literature review ......................................................................... 8 2.3 Objectives and scope .................................................................................................................... 16 2.4 Methodology ................................................................................................................................ 16
2.4.1 Design of an indicator-based approach ............................................................................... 17 2.4.2 Need for indicators .............................................................................................................. 17 2.4.3 Sustainability indicators ...................................................................................................... 18 2.4.4 Identification of indicators .................................................................................................. 18 2.4.5 Quantifying indicators ......................................................................................................... 22 2.4.6 Determining indicator and dimension weights .................................................................... 22 2.4.7 Developing composite indicator dimensions developing composite urban sustainability indicator (USI) .............................................................................................. 23 2.4.8 Developing composite urban sustainability indicator (USI) ............................................... 23
2.5 Benchmarking urban sustainability—a gap analysis approach .................................................... 24 CHAPTER 3: A COMPARATIVE ANALYSIS OF MUMBAI AND BANGALORE .......................... 26
3.1 Demographic profile .................................................................................................................... 26 3.2 Land use ...................................................................................................................................... 26 3.3 Economic profile ......................................................................................................................... 27 3.4 Household characteristics ........................................................................................................... 28 3.5 Household assets .......................................................................................................................... 30 3.6 Education ..................................................................................................................................... 31 3.7 Transport ..................................................................................................................................... 31 3.8 Energy ......................................................................................................................................... 32 3.9 Resource consumption ................................................................................................................ 34 3.10 Municipal solid waste .................................................................................................................. 34 3.11 Emission inventory ...................................................................................................................... 35 3.12 Concluding remarks ..................................................................................................................... 35
CHAPTER 4: BENCHMARKING URBAN SUSTAINABILITY—A COMPOSITE URBAN SUSTAINABILITY INDEX FOR MUMBAI AND BANGALORE .............................. 37
4.1 Introduction .................................................................................................................................. 37 4.2 Dimensions of sustainability ........................................................................................................ 37 4.3 Categories of sustainability .......................................................................................................... 38 4.4 Indicators of urban sustainability ................................................................................................. 39 4.5 Quantifying indicators of urban sustainability ............................................................................. 44 4.6 Comparing indicators of urban sustainability with threshold values .......................................... 48 4.7 Normalized indicators of urban sustainability ............................................................................. 48 4.8 Composite indicator values of different categories and dimensions of sustainability .................. 53 4.9 Developing a composite USI ....................................................................................................... 54 4.10 Benchmarking urban sustainability ............................................................................................. 55
ii
CHAPTER 5: DISCUSSION AND CONCLUSIONS .............................................................................. 60 5.1 Introduction .................................................................................................................................. 60 5.2 Summary ...................................................................................................................................... 61 5.3 Important findings ........................................................................................................................ 62 5.4 Implementing the benchmark initiative ........................................................................................ 63 5.5 Inputs for policies ........................................................................................................................ 63 5.6 Conclusions .................................................................................................................................. 65
Bibliography .................................................................................................................................................. 65

iii
LIST OF TABLES
Table 2.1: List of Indicator ....................................................................................................................... 19 Table 3.1: Demographic data for the cities of Bangalore and Mumbai (2001-2011) ................................ 26 Table 3.2: Land use pattern ......................................................................................................................... 27 Table 3.3: Per capita gdp, income and exports (2011) ................................................................................ 28 Table 3.4: Households by ownership and dwelling status .......................................................................... 29 Table 3.5: Profile of housing and amenities ................................................................................................ 29 Table 3.6: Households by main source of drinking water ........................................................................... 30 Table 3.7: Number of households having specified vehicle assets ............................................................. 30 Table 3.8: Households having specified electronic assets .......................................................................... 31 Table 3.9: Education—civic statistics ......................................................................................................... 31 Table 3.10: Vehicle population (millions) in mumbai and bangalore (2010) ............................................... 32 Table 3.11: Electricity use by sector ............................................................................................................. 33 Table 3.12: Households by type of fuel used for cooking............................................................................. 33 Table 3.13: Households by main source of lighting ...................................................................................... 34 Table 3.14: Resource consumption per capita .............................................................................................. 34 Table 3.15: Municipal solid waste generation (tpd) ...................................................................................... 35 Table 3.16: Emission inventory (t/day) ......................................................................................................... 35 Table 4.1: Indicators of urban sustainability—economic dimension .......................................................... 41 Table 4.2: Indicators of urban sustainability—social dimension ................................................................ 42 Table 4.3: Indicators of urban sustainability—environmental dimension .................................................. 43 Table 4.4: Indicators of urban sustainability—institutional/governance dimension ................................... 44 Table 4.5: Quantifying indicators of urban sustainability—economic dimension ...................................... 45 Table 4.6: Quantifying indicators of urban sustainability—social dimension ............................................ 46 Table 4.7: Quantifying indicators of urban sustainability—environmental dimension .............................. 47 Table 4.8: Quantifying indicators of urban sustainability—institutional/governance dimension ............... 48 Table 4.9: Indicators of urban sustainability—comparing with threshold values ....................................... 49 Table 4.10: Indicators of urban sustainability—normalized indicator values ............................................... 51 Table 4.11: Composite indicators of urban sustainability ............................................................................. 54

iv
LIST OF FIGURES
Figure 1.1: The world urban explosion .......................................................................................................... 1 Figure 1.2: Urban sustainability: as the intersection of two phenomena ........................................................ 4 Figure 1.3: Hierarchy of information to indicators and their use ................................................................... 5 Figure 2.1: Fields of sustainable development ............................................................................................. 18 Figure 2.2: Benchmarking urban sustainability ........................................................................................ 24 Figure 4.1: Benchmarking economic sustainability ..................................................................................... 56 Figure 4.2: Benchmarking social sustainability ........................................................................................... 57 Figure 4.3: Benchmarking environmental sustainability .............................................................................. 57 Figure 4.4: Benchmarking urban sustainability ............................................................................................ 58 Figure 4.5: Comparing USI ......................................................................................................................... 59

v
ACKNOWLEDGEMENTS
A project of this size and dimension would not have been possible without the support and cooperation of several institutions and input from a large number of people. We are particularly grateful to the South Asia Network of Economic Research Institutes (SANEI) for financing this study and record our appreciation of the cooperation extended to us throughout the study by Mr. Samiul Ahsan, Manager, Administration and Communications, SANEI Secretariat, Dhaka, Bangladesh. The empirical study of this nature involves the collection of a large amount of data and would only be possible with the willingness and cooperation of people from the two urban centers under study, viz., Mumbai, and Bangalore. Our sincere thanks are due to them. Thanks are also due to Dr. K. Venkata Reddy, Centre for Economic and Social Sciences, Hyderabad and Ms. Veena Prabhu, Bangalore who have been involved throughout this project and have participated in the survey whole heartedly. Mr. K. Sreenivasa Rao, formerly Assistant Editor, Journal of the Indian Institute of Science, Bangalore, had gone through the report and provided valuable suggestions. We are grateful to Prof. S. Mahendra Dev, Director, IGIDR, Mumbai and Prof. Balasubramanya, Chairman, Department of Management Studies, IISc, Bangalore, for their keen interest in this work and constant guidance at all stages of the study.
B Sudhakara Reddy
Balachandra Patil

vi
ABSTRACT
The study investigates if the present pattern of urban development in India in the creation of mega cities is sustainable. This has been done by comparing the Indian cities Mumbai and Bangalore with a sustainable mega city of a developed country (London) using indicator-based approach. The objectives of the study are: (i) developing sustainable urban indicator variables spanning all the relevant sectors of a typical mega city, (ii) developing a benchmark sustainable indicator-base for a selected mega city, (iii) developing the database for Mumbai and Bangalore by adopting the same methodology and same indicators, (iv) comparing and evaluating the indicator data with the benchmark indicator database using “gap analysis” approach, and (v) suggesting appropriate policy measures and implementation strategies to bridge identified gaps to attain the goal of sustainable urban system. Economic, Environmental, social and institutional indicators are proposed to be examined in the context of resource utilization. The indicators represent a primary tool to provide guidance for policy makers and to potentially assist in decision-making and monitoring local strategies/plans. The outcome of the study will contribute to the design of policies, tools, and approaches essential for planning to attain the goal of sustainable development and the social cohesion of metropolitan regions. Although it is not an in-depth research of the urban performance of Indian cities, it is a relatively quick demonstration of using the existing data sets that benchmarking can be an effective tool in identifying areas for improvement.
Benchmarking Indian Megacities for Sustainability ― An Indicator-Based Approach B Sudhakara Reddy Balachandra Patil
CHAPTER 1
INTRODUCTION
1.1 BACKGROUND OF THE STUDY
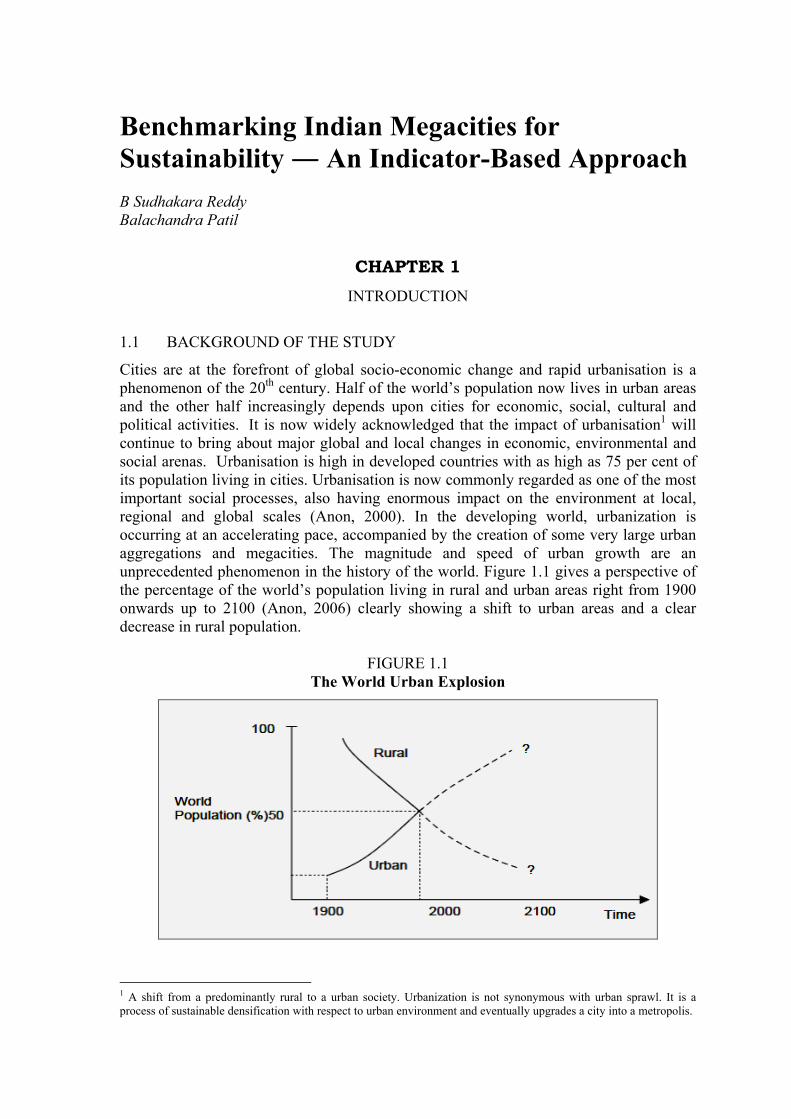
Cities are at the forefront of global socio-economic change and rapid urbanisation is a phenomenon of the 20th century. Half of the world’s population now lives in urban areas and the other half increasingly depends upon cities for economic, social, cultural and political activities. It is now widely acknowledged that the impact of urbanisation1 will continue to bring about major global and local changes in economic, environmental and social arenas. Urbanisation is high in developed countries with as high as 75 per cent of its population living in cities. Urbanisation is now commonly regarded as one of the most important social processes, also having enormous impact on the environment at local, regional and global scales (Anon, 2000). In the developing world, urbanization is occurring at an accelerating pace, accompanied by the creation of some very large urban aggregations and megacities. The magnitude and speed of urban growth are an unprecedented phenomenon in the history of the world. Figure 1.1 gives a perspective of the percentage of the world’s population living in rural and urban areas right from 1900 onwards up to 2100 (Anon, 2006) clearly showing a shift to urban areas and a clear decrease in rural population.
FIGURE 1.1 The World Urban Explosion
1 A shift from a predominantly rural to a urban society. Urbanization is not synonymous with urban sprawl. It is a process of sustainable densification with respect to urban environment and eventually upgrades a city into a metropolis.

2 Reddy and Patil: Benchmarking Indian Megacities for Sustainability
Cities can be defined by population, by administrative jurisdictions, by function and by territory (Kyrkoua and Karthaus, 2011 and European Foundation, 1998). Population- and jurisdiction-based definitions depend on the availability of data, which often are unreliable for extended urban agglomerations with multiple jurisdictions. Satellite photographs taken at night of light illumination on the surface of the earth provide a clear picture of urbanisation. Function (e.g. services, industries, transportation hubs) and territory can help separate cities from other human aggregates, such as villages or barrios. Historically, the growth of urban concentration is the result of the invention of agriculture and of the surplus of food it produced. As cities have become increasingly concentrated sites for the generation of knowledge and the development of science and technology, they have, in turn, with that knowledge, impacted agriculture which, today, absorbs from the outside (fertilizers, fuel, etc.) over four times the energy it produces in the form of food.
In developing countries the pace of urbanisation is rather slow and stood at about 45 per cent in 2010. The population lived in urban areas in 2010 was 3.6 billion which is four times higher than in 1950, which is likely to rise to 5 billion by 2030 showing a net addition of 1.4 billion to the world population, largely to cities and towns in developing countries. In contrast, the addition to the urban population of developed countries will only be 0.1 billion. The magic number of one billion urban population was reached as recently as 1961 and it took only a quarter of a century to add another billion, and later only 15 years for another billion. In 1950, there were only two megacities with population exceeding 10 million. After six decades, such cities rose in number to 22 of which 13 belong to developing countries. By 2010, about 12 per cent of the world population lived in megacities and this will increase to 20% by 2020. This clearly shows the quick pace and irresistibility of the urbanisation process. 1.2 URBANISATION AND ITS IMPACTS
Urbanisation results in major irreversible changes in production and consumption styles. This will have a significant impact on the carrying capacity of the earth. The diffusion power of the urbanisation process affects the health, migration, production systems and natural resource use which in turn influences the global economy. The expansion of a city devours acres of land and materials for infrastructure like highways, water supply and power. It intensifies traffic problems on commuting roads from a city’s central location to suburban areas. Hence, it is important to study the rapid urban change that is likely to take place in developing countries that are least equipped with the means to invest in basic urban infrastructure—water, sanitation, housing—and are unable to provide vital economic opportunities for urban residents. Thus, the urbanisation process that is being witnessed in developing countries is to be viewed through socio-economic and environmental perspectives. It is surprising to note that the urbanisation process is being viewed through a ‘sustainability’ lens since lately only.
It is hardly an exaggeration to say that with increasing urbanisation, resource use has moved into the very centre of public concern. As population expands and people strive for better standard of living, the per capita resource use rises many fold. It is not surprising, therefore, that those who advocated "limits to growth" have been ridiculed for years as impractical and opponents of development. However, in recent years, there seems to be a realisation of the negative impact of growth, particularly, in the area of "urban development".

SANEI Working paper Series 3
No: 13 – 02
The availability of resources, their utilisation and their impact on the economy, environment and society are important considerations for any urban region. The interconnection among these suggest that all these crises were symptoms of some common fault that lay deep within the design of the urban system that governs how resources are produced, transported, distributed and used. Thus, it is obvious that the idea of studying all these aspects of urban resource use is more than ever in need of support, as the advances of science and technology multiply the hazards.
Until recently, growth in resource use was equated with economic and social development. As with the case of other resources like land, potable water and clean air, energy is exhaustible. It is also being distributed unevenly and it will become increasingly difficult to extract and deliver in the future. Finally, the transportation and utilisation of resources are causing irreversible damage to human and natural environment. However, much of the information required to deal effectively with these issues is not available. An obvious gap has been the absence of statistics on resource utilisation. So, even at the beginning of 21st century, we have no comprehensive urban plan to describe the system, let alone correct its serious faults in distribution networks and consumption patterns. 1.3 URBAN SUSTAINABILITY
Published in 1987, Our Common Future popularized “sustainable development” as the most widely accepted framework for considering and tracking humanity’s progress (WECD, 1987). The sustainable development paradigm is important because it integrates environmental, social and economic factors as targets of development, and helps us understand how these three dimensions are linked. Cities also accommodate social, economic and political systems. Disparity between the rich and poor is a growing problem in urban areas, and providing services for low-income populations is becoming an increasing challenge. In addition, cities house an increasing diversity of jobs. While a city’s economy is dependent on many local factors including strategic location and a skilled work force, the local economy is also tied to wider factors such as the global economy and politics. An appropriate balance of development pertaining to environmental, social, and economic factors has become increasingly important and difficult to achieve in our cities. 1.4 MEGACITIES AND SUSTAINABILITY
The term mega-city was created by the United Nations in mid-1980 in a study addressing issues generated by rapid urbanization and a growing population (UNPF, 1997). The common issues relating to urban energy use include transportation, building and housing, public health and safety, and an increase in the standard of living. (Phdungsilp, 2005). In 1800 only 3 per cent of the world’s population lived in cities while in 2010 it is over 50 per cent. Big cities are growing at unprecedented rates and sizes. By 2010, there are 25 megacities with 14 of them in Asia alone. Hence, the future of urban regions is a defining theme of the present generation. In this context, it is important to address issues such as sustainability in the context of megacities. Meeting the challenges ahead will require a deeper understanding of these issues to facilitate appropriate urban policies and management practices.

4 Reddy and Patil: Benchmarking Indian Megacities for Sustainability
In general, it is recognised that, in order to respond to the idea of sustainability, urban areas have to maintain an internal equilibrium among economic activity, population growth, infrastructure and services, pollution, waste, noise, etc., in such a way that urban system and its dynamics evolve in harmony, internally limiting, as much as possible, impacts on the natural environment. Thus, for this purpose, there is a need to understand concepts of urban sustainability. It is difficult to give one definition to sustainable urban development since sustainability is fundamentally a complex and multilateral issue. Many terms like Green urbanism, Urban Sustainable Development, Eco-cities, Green Cities, and Sustainable Cities are used. Girardet in “Cities, People, Planet”, defines a ´sustainable city´ as one which enables all its citizens to meet their own needs and enhances their well-being without degrading the natural world or the lives of other people, now or in the future (Girardet, 2008).
Urban systems emerge as distinct entities from the complex interactions among social, financial, and cultural attributes, and information, energy, and material stocks and flows that operate on different temporal and spatial scales. The paradigm of sustainability has emerged as the key concern in regard to the future. Sustainable urban development specifically means achieving a balance between the development of the urban areas and protection of the environment with an eye to equity in employment, shelter, basic services, social infrastructure and transportation in the urban areas. Obviously, at the simplest level, sustainability is survival, but as human organizations and cities become more complicated, sustainability itself becomes more complex.
Urban sustainability is defined by the intersection of both urbanization and global sustainability and is depicted in Figure 1.2.
FIGURE 1.2 Urban sustainability: As the intersection of two phenomena
In the context of rapid urbanization in developing countries, it is essential that we apply the concept of sustainability in policy and planning decisions. However, the criteria for sustainability differ between developed and developing countries. These differences prohibit us from transferring the models of sustainability from advanced societies to those which lag behind. In such a scenario, we have to develop different models which can be applied to the urban regions of developing countries.

SANEI Working paper Series 5
No: 13 – 02
1.5 INDICATORS OF SUSTAINABILITY
Indicators can play an important role in turning data into relevant information for policy makers and help in decision-making. They also simplify a complex and large information base. In this way, the indicators provide a “synthesis” view of existing situation. The indicators have become well established and are widely used in diverse fields and at various levels, viz., global, regional, national and local (Anon, 2000). Examples of indicators include such measurements as GDP (Gross Domestic Product) as a way of assessing economic development in a country, the infant mortality rate (IMR) as an indicator of the health status of a community, or the rise in carbon emissions as a way of estimating the environmental conditions of a region (Figure 1.3). The selection criteria for the construction of indicators include factors such as transparency, scientific validity, robustness, sensitivity and the extent to which they are linkable to each other. The main criteria for the selection of indicators include:
a) Easily understood by stakeholders; b) Related to the interests of various stakeholders; c) Measurable using the available data at city and national levels; and d) Clearly related to urban policy goals and capable of being changed
To be useful, indicators should be user-driven and depend on factors and the purpose for which they are to be used. The indicators could be assessed depending on their relevance to the issue they are intended to describe and to changes in policy and practice. Figure 1.3 shows the development of indicators. In developing the indicators, certain parameters are especially adhered to. These include:
(i) Importance for policy—relevant to policies and directly measure outcomes
(ii) Comprehensive—provide a broad overview of the economic, social and environmental 'health' of the city
(iii) Priority—identified based on priority
(iv) Easily understood—simple and reliable
(v) Cost effective and timely—information to be collected in a cost effective way
(vi) Measurable—likely to show the magnitude of the problem
(vii) Sensitive—flexible enough to accept changes
(viii) Independence—separate indicators are used to measure different outcomes
FIGURE 1.3
Hierarchy of information to indicators and their use
Measurement
Compilation
Aggregation
Analysis
Interpretation and use
Primary/Secondary Survey
Data
Statistics
Indicators
Decision
6 Reddy and Patil: Benchmarking Indian Megacities for Sustainability
The applicability of the criteria depends on the indicator in question, and the purpose of the indicator to be used. However, no single set of criteria will be applicable to all indicators and all situations since each have priorities for data collection and analysis. 1.6 OBJECTIVES, SCOPE AND THE EXPECTED OUTCOMES
Sustainability indicators quantify performance, providing clear and compelling measures of key trends in the environment, social systems, economy, and human well-being. Indicators measure changes that matter to people. For example, changes in the environment include things such as the concentration of different pollutants in the air and the amount of resources, such as water and electricity, consumed, and the quantity of waste produced. Shifts in the social environment can include factors such as community participation, while economic changes involve issues such as housing affordability and unemployment rates. Indicators are presented as charts and graphics, helping to visualize and measure progress in our efforts to move towards urban sustainability.
The main aim is to investigate whether the present pattern of urban development in India in the creation of mega cities is sustainable. This has been done by performing an indicator-based evaluation of Mumbai and Bangalore cities against a sustainable mega city from a developed country (London or Singapore). The objectives of the study include: (i) developing sustainable urban indicator variables spanning all the relevant sectors of a typical megacity, (ii) developing a benchmark sustainable indicator-base for a selected megacity (e.g., London or Singapore), (iii) by adopting the same methodology and same indicators develop the database for Mumbai and Bangalore in India, (iv) comparing and evaluating the indicator data with the benchmark indicator database using a “gap analysis” approach, and (v) suggesting appropriate policy measures and implementation strategies to bridge the identified gaps to attain the goal of sustainable urban system. The household, industrial, commercial and transport activities are proposed to be examined in the context of resource utilization and benefit sharing.
The project outcome gives several pointers for further application of the approach developed in this study. The sustainability indicators developed here can play an instrumental role in policy making and assessing policy implementation. If sustainability is identified as a coherent policy goal, it must be measureable to know if we are moving towards or away from the directions desired, and indicators do exactly that. The indicators represent a primary tool to provide guidance for policy makers and to potentially assist in decision-making and monitoring local strategies/plans. The outcome of the study is expected to contribute to the design of policies, tools, and approaches essential for planning to attain the goal of sustainable development and the social cohesion of metropolitan regions. 1.7 URBAN SUSTAINABILITY—MUMBAI AND BANGALORE
With the broad objective of studying the performance of megacities, Mumbai and Bangalore, the two rapidly developing cities of India, have been selected for the study. They have been chosen for several reasons. Compared to other Indian cities, these two are cosmopolitan in character, and have a large and rising population. This increase results in a demand for resources which grows exponentially and is difficult to manage. It is therefore important to the metabolism patterns as both exhibit consumption patterns that negatively impact the ecosystem. The indicators for these cities are chosen such that they
SANEI Working paper Series 7
No: 13 – 02
correspond with policy areas within the mandate of the cities. The study cities were chosen for convenience as both the authors belong to both the cities.
For our analysis of these two mega cities, we have analysed four different aspects of resource consumption. This analysis quantifies the impact of humans on the planet. It measures and analyzes the city’s level of resource consumption and compares with the best in the world. For the present study, we have chosen London as the model city. We can plan to achieve the objective of attaining the standards of the model city by implementing sustainable development practices. Studies like this will help sustainability become a greater focus of development planning in the region as a whole by demonstrating the interactions between the cities and resource consumption. The metabolism studies are important tools for assessing the current state of resource consumption versus sustainability of natural resources. The consumption data we gathered have been divided into five separate categories: food, water, materials, energy and urban biomass. Research was carried out on all the four of these categories as well as on sustainability from economic, environmental and social dimensions. The information collected is used to discuss the resource flows and their impacts to arrive at sustainable indices for these cities.
Applying this approach on a nation-wide scale is difficult, so these urban centres are chosen to serve as reference case studies and an in-depth analysis is made. We seek to generalise, but, are aware that differences in urban demographic and other characteristics are impediments. An in-depth analysis of this nature is bound to throw up some new factors or eliminate a few existing ones. Either way, the methodology developed here has to be replicated for other urban settings. This gives all the learning components, just as wisdom dawns after knowledge is acquired.

CHAPTER 2
METHODOLOGY OF THE STUDY
2.1 URBAN SUSTAINABLE INDICATORS: BACKGROUND
In recent years, the discussion on sustainable development with respect to urban regions has gained momentum. The indicators should reveal the fields in which a city is doing better over others and according to its specific goals. The indicators should contribute to making the city more visible and transparent, aid in comparison, evaluation and prediction, help construct and harmonize data banks, provide decision-making with relevant information, stimulate communication, and promote citizen empowerment and participation (Mega, 2005). The ability of a city to survive and prosper indefinitely involves factors such as the economy of the city, the availability of jobs and services, the health and attraction of the urban environment and the availability of resources, such as water, materials and energy, as well as space for growth.
In general, sustainability is a subjective concept that refers to a set of social goals such as improving the welfare of the people and the quality of the environment, having an equitable distribution of resources, and improvement in health and education systems. In this context, cities can be seen as focal points for achieving sustainability. They offer many opportunities: from an energy point of view, the efficiency of cities both in transport and building sectors has great potential. The provision of services is easy and efficient in an urban area than in rural regions (Anon, 2003).
Sustainability indicators play a significant role in policy making and assessing policy implementation. If sustainability is identified as a policy goal, it is essential that we measure the direction of the movement, i.e., whether we are moving towards or away from the directions desired, and the role of the indicators is to exactly do that. The indicators represent a tool to provide guidance for policy makers and will potentially assist in decision making and monitoring local strategies/plans 2.2 URBAN SUSTAINABILITY INDICATORS—LITERATURE REVIEW
Literature has been reviewed comprehensively for information to pursue the objectives of this study by gathering it from books, academic journals, government and institutional reports, sustainable urban development plans and websites.
Sustainability has emerged as a planning concept from its beginnings in economics and ecological thinking and has widely been applied to urban development. Urban sustainability is simply described as a desirable state or set of urban conditions that persists over time. Just as the task of defining sustainability has progressed in response to early economic thinking, so has the task of its assessment. Ever since sustainable development became the catchword in most international discussions, several approaches to its assessment have been developed. Lawrence (1997), considers it as simply applying the broad principles of sustainability to ascertain whether, and to what extent, various actions might advance the cause of sustainability. Many urban sustainability assessment methods can be identified from the literature.
The ecologist Eugene Odum has written that “the city is a parasite on the natural and domesticated environments,” since it does not grow food, and dirties its air and water (Odum, 1989). Urban economic activity is based on the continued availability of resources. Past efforts at the improvement of urban environmental quality have typically

SANEI Working paper Series 9
No: 13 – 02
concentrated on the protection of environmentally sensitive areas. However, sustainable development, more than merely `protecting' the environment, requires a paradigm shift—economic, social and environmental. Roseland (1991) addressed the implications of sustainable development for north-American cities by raising the issues of transportation management, land-use planning and housing, energy conservation and efficiency, waste reduction and recycling, community livability, and sustainable administration. Urban development needs to be on a sustainable basis if the long-term health of urban dwellers and integrity of the environment is not to be irreversibly damaged.
Sustainable urban development develops and grows in harmony with, and can reinforce the productive potential of, their life-support environments, ranging from local and regional to global ecosystems (Huang et al., 1995). A key goal for urban policy is, therefore, sustainable development and the prevention of damage to the life-support functions provided by the environment. Indicators are bits of information that reject the status of large systems and have long been useful in science, health, economics and many public policy areas as feedback mechanisms to decision making.
Indicators represent components or processes of real-world systems. The numeric values of indicators have a special meaning to particular observers, a meaning that goes beyond the numerical value itself. For example, the green coverage ratio may be used to represent the life-support capability of the metropolitan region. Sustainability indicators differ from classical environmental indicators; they do not simply reject environmental conditions or pressures on the environment, but indicate interactive characters between socio-economic and ecological systems (Opschoor and Reijnders, 1991).
Urban sustainability indicators are crucial for helping on target setting, performance reviews and facilitate communication among the policy makers, experts and public (Verbruggen & Kuik, 1991). A wide range of urban sustainability indicators is therefore in use across the diversity of different cities and regions, which vary according to their particular needs and goals (Brandon & Lombardi, 2005; Verbruggen and Kuik, 1991). However, practical challenges have led to mixed results in applying sustainability indicators in different environments and sometimes with little gain in sustainability performance (Alshuwaikhat and Nkwenti, 2002; Seabrooke, et al, 2004; Selman, 1999). It has been argued that one of the main reasons for failing to attain the desired performance is the inadequate selection of indicators guiding and monitoring the sustainable urbanization process (Briassoulis, 2001; Seabrooke et al., 2004). It has also been argued that the lack of consensus on urban sustainability indicators among different practices has been causing confusion when selecting and relating them with the objectives defined or policies implemented (Legrand et al., 2007; Planque and Lazzeri, 2006).
Maclaren (1996) distinguished urban sustainability indicators from simple environmental, economic, and social indicators by the fact that they are not only integrating, but forward-looking, distributional, and with input from multiple stakeholders. In this study, urban sustainability indicators are defined as those which can be used as measurements to represent the vital signs of our society by telling us in which direction the society is moving. Development of appropriate sets of indicators is a laborious process and is likely to involve many arbitrary decisions with variables to select and aggregate.
Evidence of progress on urban sustainability is important for justifying urban management at a policy level. A significant barrier to determine whether or not a community is marching toward sustainable development is the absence of a clearly articulated methodology for reporting on urban sustainability (Maclaren, 1996). The

SANEI Working paper Series 10 No: 13 – 02
challenge for urban planners is to find indicators which can be easily assessed, and are as reliable as length on a scale.
Hardoy et al., 2001; McGranahan et al., 2005 and Grimm et al., 2008 have well documented the battle for sustainability highlighting the importance of cities in pursuit of broader sustainability goals. Despite the fact that there is a rapidly growing literature on ‘‘good’’ urban practices, very little is known about how they are practiced and their role in policy-making processes (Bulkeley, 2006).
To develop sustainable communities and cities it is necessary to recognize the progress towards sustainability. Some method for measuring the direction of current trends and success or failure of initiatives is crucial. As more and more cities adopt sustainability as a goal and aim to radically change current ways of cities´ development, it becomes an urgency to determine whether the actions taken are indeed leading the communities towards sustainability. Formulating clearly articulated methods for measuring and reporting on urban sustainability is a prerequisite in any attempt for sustainable urban development.
In order to measure and evaluate the progress, indicators are used while reporting on urban sustainability. In general, indicators are parameters or values that provide information about a phenomenon (Guy and Kibert, 1998). Most of the indicators are, in fact, simplifications of complex phenomena and provide only an indication of conditions or problems (Whorton and Morgan, 1975; Clarke and Wilson, 1994). The purpose is to show how well a system is working. If there is a problem, an indicator can help determine the to be taken to address the issue. In brief, if chosen properly, indicators can contribute to sustainability debates through two major roles: reducing the amount of data required to describe a situation fully and facilitating communication with diverse audiences (Keirstead, 2007).
In urban sustainability, indicators of a city reveal the fields in which it is doing better than others and according to its specific goals. They should contribute to making the city more visible and transparent, aid in comparison, evaluation and prediction, help construct and harmonize data banks, provide decision-making with relevant information, stimulate communication, and promote citizen empowerment and participation (Mega, 2005).
Huang et al. (1998) presented a conceptual framework of the indicator system for measuring its metropolitan life-support system through economic vitality for enhancing its urban productivity and quality. Based on the conceptual framework of urban ecological economic system, 80 indicators, selected with the participation of non-governmental organizations (NGOs), have been used as policy-making indicators for measuring Taipei's urban sustainability. The policy-making indicators are further aggregated into ten general public indicators and evaluated using signal lights (green, yellow and red).
Boyko and Cooper (2011) consider a tool kit developed in UK which facilitates the use of scenarios in any urban context and at any scale relevant to that context. It comprises two key components, namely, (i) a series of indicators comprising both generic and topic area-specific indicators (e.g., air quality, biodiversity, density, water) that measure sustainability performance, and (ii) a list of characteristics (i.e., 1–2- sentence statements about a feature, issue or small set of issues) that describe four future scenarios. In combination, these two components enable them to measure the performance of any given sustainability indicator, and establish the relative sensitivity or vulnerability of that indicator to different future scenarios. An important aspect of the methodology underpinning the tool kit is that it is flexible enough to incorporate new scenarios,

SANEI Working paper Series 11
No: 13 – 02
characteristics and indicators, thereby allowing the measurement of long-term performance of our urban environments to be considered in the broadest possible sense.
Natalie Rosales (2011) in his paper builds on the background of the recent movement towards the use of indicators by introducing a carefully chosen set for quantifying sustainability performance at the urban level and into the planning process. By moving indicators from the ex-post evaluation of cities’ performance to an ex-ante stage in which they can be operationalized as planning tools, this study provides a significant contribution to the traditional urban planning instruments and provides a step forward with regard to the construction of sustainability indicators. In this framework, indicators become key instruments in the analysis, design of policies, strategies, actions and programs for sustainable urban development. The paper introduces the methodology and the urban sustainable indicators system for planning. This model is tested and applied in a case study based on Mexico City’s metabolism. It provides a series of reflections on how successful strategies enhance the long-term sustainability of cities by developing sustainability indicators into urban planning process.
Keirstead (2007) explores the selection of indicators for urban energy use in London City, drawing on the work of Maclaren (1996) and Ravetz (2000). Potential urban energy indicators for London are presented to demonstrate the selection procedure and to highlight the challenges posed by the measurement of urban energy use. He suggests a mix of data sources, supported by a strong theoretical framework, to evaluate both urban energy systems and urban sustainability.
Mega and Pedersen state that the European Commission's Report on Sustainable Cities (EC 1996a) recognises the need for indicators as tools for quantifying sustainability performance. If sustainability is a coherent policy goal, it must be possible to visualize whether we are moving towards it. The World Bank defines indicators as performance measures that aggregate information into usable forms, highlighting the unresolved issues of fluctuation, inter-temporal variations and uncertainty. All experts and organisations involved in indicator construction seem to agree that indicator development provides a useful tool for policy making (prospective) and assessing policy implementation (retrospective indictors), but stress limitations (World Resources Institute, 1994). The suggested set of indicators includes nine environmental indicators. The indicators for the themes Responsibility for Global Climate, Acidification of the Environment, Toxification of Ecosystems and Local Disturbances follow the directions of the Dutch set, with its limitations and its potential (Adriaanse,1993).
Block and Van Assche (1999) put forward an innovative approach for developing SDIs (Sustainable Development Indicators) for decision-making processes in cities from a complexity acknowledging perspective. Cities are confronted with multi-level and -actor governance settings, uncertain evolutions, unplanned policy stream convergences, emergent problems and opportunities, and that these complex processes and situations require—in addition to more traditional, rational-normative and actor related approaches—a specific way of dealing with the issues raised by the indicators. It is argued that actor-exceeding and policy exogenous SDIs, including their construction, through a participative approach, can be used as a learning and communication instrument for all actors involved in urban development, elevating the quality of the policy debate and strengthening decision-making processes.
Transportation problems in most cities are among the most pressing strategic development issues. They are major constraints for long-term urban development in general and very closely related to land development, economic structure, energy policies, and environmental quality in particular. Since all citizens are either enjoying the

SANEI Working paper Series 12 No: 13 – 02
transportation system or, and often at the same time, suffering from it, it is an important element of the urban quality of life. Therefore, Nathan and Reddy (2012) have proposed a Multi-view Black-box (MVBB) framework for development of sustainable development indicators (SDIs) for an urban set up. The framework is flexible enough to be applied to any domain or sector of an urban system. The proposed framework has been applied for the transportation sector of Mumbai City. The paper begins with a discussion on transportation sector and its un-sustainability links and trends. It outlines the concept of sustainable transportation system and reviews some of the prominent sustainable transportation indicator initiatives. In order to formalize sustainable development indicators for transportation sector, the study collates the indicators from the literature, places them in Mumbai’s context and classifies them into the three dimensions of urban sustainability—economic efficiency, social well-being and ecological acceptability.
Adinyira et.al (2007) presents an appraisal of the relative potentials and limitations of methods developed around the three identified methodological foundations. They concur with the much held view that the available urban sustainability assessment methods fail to demonstrate sufficient understanding of the interrelations and interdependencies of social, economic and environmental considerations. It further points to a wide gap between assessment theories and practices. To help narrow this gap, they recommend a pragmatic shift in focus, from theory development to application and auditing. A suggestion is made for the application of key assessment methods in a given urban area and across various issues, spatial and time scales so as to allow for method comparison. It is hoped that the parallel application of existing methods will greatly accelerate the urban sustainability assessment learning process and will help in the improvement of both theory and practice.
Marcotullio (2003) considers the process of achieving urban sustainable development as uncharted. Despite knowing that plans should address the economic, environmental and social health issues of a city, they can be accomplished only by approaching each of these issues at different scales. For rapidly developing world cities, ‘sustainability’ is becoming an increasingly elusive objective, in part, because of the impacts by forces beyond their borders. Using the Asia-Pacific region as a case study, a framework is developed relating regional transnational flows to the state of the urban environment and the social conditions of rapidly developing cities. The ‘‘functional city system’’ within the Asia-Pacific is both an engine of urban growth and the force behind differentiating urban environmental and social issues. At the same time, while globalization forces have been particularly strong within the cities, local factors also play a crucial role in urban development. Globalization-driven growth has not translated into a single path of development, rather localities have demonstrated context specific paths.
Xuemei Bai et.al (2009) examine 30 innovative urban practices in Asia from a system innovation and urban environmental evolution perspective. This is an attempt to identify common patterns and pathways that can aid up-scaling and thereby broader application of effective sustainability practices. They have developed a five-tier framework (e.g. triggers–actors–linkages–barriers–pathways) to explore a successful broad-scale application that relates to the patterns within each of the tiers and see whether certain combinations of tiers lead to certain application pathways. The results indicate the importance of policy changes and cumulative effects; the importance of local government, community and international agencies as main actors; and the prominent role of political and institutional barriers, while technology doesn’t seem to be a major barrier in urban sustainability experiment in Asia. The results also indicate that those cases that are up-scaled through broader application often have strong vertical linkages with state or

SANEI Working paper Series 13
No: 13 – 02
national governments. Many international development agency initiatives tend to remain as experiments or duplicated elsewhere but are seldom up-scaled to change the system of practice. Nearly half of the innovative practices examined were either mainstreamed or duplicated elsewhere suggesting that these innovative practices might play an important role in sustainability transitions in Asia.
China has experienced significant economic growth during the last three decades through urbanization, but many of its ecological and social issues have been marginalized, leading to problems in public safety, health, and social equity. Such a pattern of development is unlikely to be sustainable in the long run. These issues and challenges that come with resolving them are examined by Wang and Hofe (2007) who advocated a holistic and pragmatic approach to the research and practice of urban sustainability in China.
Kari Lautso et.al (2002) presented a modelling system developed to simulate and evaluate the impacts of different land-use and transport policies in seven European agglomerations in terms of sustainability. The system developed is unique in several respects.
The key intellectual challenge for urban policy-makers is a complete understanding of the complexity of urban systems and their environment. Zellner et.al (2002) address this challenge by developing an assessment framework with two main components: (i) a simple agent-based model of a hypothetical urbanizing area that integrates data on spatial economic and policy decisions, energy and fuel use, emissions and assimilation, and test how policy decisions affect urban form, consumption and pollution; and (ii) an information index to define the degree of order and sustainability of the hypothetical urban system in different scenarios, to determine whether specific policy and individual decisions contribute to the sustainability of the entire urban system or to its collapse.
Xing et.al (2009) report on the development of an Urban Development Sustainability Assessment Model (UD-SAM) which allows decision-makers to identify sustainability indicators (economic, environmental and social) and lead to more holistic evaluation of the sustainability impact of elements of the urban environment. The UD-SAM builds on a sustainability assessment model (SAM) developed originally in the oil industry. It describes how SAM has been tailored for the assessment of construction industry and how a set of generic sustainable development indicators have been identified and validated by various stakeholders.
Holden et.al (2008) focus on the role that major global gatherings play in the pursuit of urban sustainability. To this end, the study examines the outcomes from the United Nations Habitat II Forum (1996, Istanbul), the World Summit on Sustainable Development (2002, Johannesburg), the World Social Forum (2001, Porto Alegre), and the World Urban Forum 3 (2006, Vancouver). For comparative purposes, the study included reflections on the contributions made by the United Nations on sustainability and the Millennium Development Goals (MDGs) without an accompanying major global gathering.
Barredo and Demicheli (2003) assessed the framework of the European Commission’s MOLAND project and consider urban sustainability issues in African countries with a focus on urban growth. The need for urban management tools that are able to provide prospective scenarios is addressed. Urban simulations represent a useful approach to an understanding of the consequences of current planning policies or their incompleteness. Simulations of future urban growth are usually quite difficult without tools that embrace the complexity of the urban system. The study describes the growth

SANEI Working paper Series 14 No: 13 – 02
simulation in Lagos in Nigeria using a dynamic spatial model prototype. This is a bottom-up approach, integrating land-use factors with a dynamic modeling arriving at urban land-use scenarios. The model for Lagos was calibrated and tested using measured time-series data on land use, through a set of spatial metrics and Kappa (k) coefficients. Afterwards, a 20-year simulation was run until 2020. The simulation results are realistic and relatively accurate, confirming the effectiveness of the proposed model.
Kyrkou and Karthaus (2011) discuss the increasing number of scheme operators developing and running sustainability assessment methods for neighbourhood scale development. The work suggests that opportunities exist for new approaches to urban sustainability assessment systems that will allow future research focusing on frameworks with a transparent and auditable structure as a better response than an ever-more detailed set of criteria for different urban systems.
Berrini and Bono (2012) share the best practices among cities. The evaluation criteria are based on the following aspects: (i) the 'greenest' city, (ii) Implementation of efficient and innovative measures and future commitment, and (iii) Communication and networking. Policies are described with qualitative information and a selection of local best practices. McGeough, et al. (2004) state that the consensus of stakeholders in the Binational Metropolitan Region provides the political will and direction for policy decisions. This will move the region in the appropriate direction for (i) evolution of the new urban design and building systems, (ii) innovative transportation systems, (iii) new solutions for water, wastewater, and solid and hazardous waste issues, (iv) a new energy system, and (v) delivery of urban, social, and health services. The same policy decisions will move the region into a process of sustainable economic development, based on synergies of the Mexican and U.S. portions of the regional economy that emphasize R&D and advanced technology and services as well as skilled labor and manufacturing capabilities of the region.
In urban development and sustainability perspectives, urban form and land uses are fundamentally shaped by transportation. PuiChingin (2005) illustrates how the vertical and horizontal integration of different institutions and policies and pedestrian environment and physical linkages should be put on the agenda for sustainable urban form and environmental qualities. The study argues that transit-oriented development (TOD) cannot be truly sustainable without an integrated approach and that every ad hoc improvement measure will be in vain. Embracing the principles of sustainable development, the strength and weakness of Hong Kong's TOD experience will serve to help local communities reflect upon the sustainable development agenda. With case study evaluations and findings, the paper concludes that the potential benefits, including social, economic and environmental, of Hong Kong's TOD have not been captured to the fullest extent as it is not implemented in an integrated and coherent approach.
Kouloumpi (2006) focuses on the analysis and comparison of assessment tools for sustainable urban communities. They include: BREEAM Communities, BREEAM Gebiedsontwikkeling, GPR Stedenbouw, and LEED for Neighbourhood Development. The main goal of the comparison is to examine how the four tools assess energy sustainability in the urban environment, and evaluate their strengths and weaknesses, draw up conclusions for an improved tool.
The report of the Working Group on Urban Design for Sustainability (2004) identifies models and strategies of good practice in urban design to support sustainability in EU (European Union) and EU-accession countries, and present review of best practice and recommendations for action at all levels. It explores the themes of re-designing and retro-fitting existing urban areas, designing for green field sites, and knitting the urban

SANEI Working paper Series 15
No: 13 – 02
fabric together to achieve an integrated city-wide vision. The themes are explored within the broader context of achieving sustainable urban development in Europe. The report sets out the main issues to be faced by Europe as whole in response to a common set of ‘mega trends’. It sets out a vision of Urban Design for Sustainability in the European context. It is an inclusive and participatory planning, design and management process that aims at creating socially integrated and inclusive places; promotes equitable economic development; conserves land; looks at towns and cities in relation to one another and their hinterlands; ensures the strategic location of new developments in relation to the natural environment and transport systems; ensures development is mixed and of appropriate density; includes a well-developed green structure and a high-quality and well-planned public infrastructure and builds upon the existing cultural heritage and social capital.
Nickl (2004) portrays and analyses Santiago de Chile’s new integrated transport system, Tran Santiago, and identifies the three key components that are essential in the context of achieving urban sustainability—visionary leadership, institutional stringency and widespread public participation. Tran Santiago was considered a failure when compared with the initial aims and objectives and the huge social cost involved and the lack of environmental and economic benefits that the system has created.
An increase in environmental load from the transport sector is of particular concern in Asian mega-cities due to the anticipated increase of automobile traffic. KATO et.al (2005) proposes a framework for an inter-city comparison of Asian mega-cities to evaluate their states of urban spatial structure, transport and environmental situation. Motorization, as the dominant factor increases environmental load from the transport sector, has the characteristics of irreversibility and synergism with urban sprawl. To deal with such issues, five topics are introduced: i) induced vehicle traffic due to road improvement, ii) relationship between vehicle-related taxation and road budget, iii) relationship between public transport improvement and motorization, iv) impact of urban planning and land-use management, and v) public consensus for enforcing policy measures for Environmentally Sustainable Transport (EST). Finally, they point out the necessity of benchmarking based on the given five topics for inter-city comparison and relative evaluation.
Fedra (2004) describes the methodology and application examples of SUTRA, Sustainable Urban Transportation project under the EU Energy, Environment and Sustainable Development Research Programme. The primary objective of SUTRA is to develop a consistent and comprehensive model-based approach and planning methodology for the analysis of urban transportation problems to support design strategies for sustainable cities. This includes an integration of socio-economic, environmental and technological concepts including the development, integration, and demonstration of simulation tools to improve scenario design, assessment and policy-level decision support. Combining the indicator based approach with simulation modelling ranging from techno-economic optimisation to street canyon modelling, the methodology ranges from awareness building end educational aspects for citizens and stake-holders participating in urban decision-making processes to detailed technical modelling and optimisation results for the planning professional.
Joe and Ralph (2006) describe the principles of sustainability and ecologically sustainable development (ESD) which are widely accepted as important components of urban planning and development. However, the activity on the incorporation of ESD principles into the planning and design of the broader urban form is yet pick up pace. This study focuses on assessment tools aimed at the suburb or precinct scale, presenting a representative review of the existing initiatives. It highlights the strengths and weaknesses

SANEI Working paper Series 16 No: 13 – 02
of the approaches reviewed and propose directions for the provision of assessment tools to improve the ecological sustainability performance of urban development.
There has been little attempt to identify commonalities across a large number of individual cases. To anticipate the consequences of urban growth in the megacities of developing countries is a difficult task. There are complex rules at work that make difficult the forecasting of urban dynamics. This present study develops a set of Urban Sustainable Indicators which helps in designing a sustainable framework. The study addresses issues concerning social, economic, environment and infrastructure activities of the city. 2.3 OBJECTIVES AND SCOPE
The key research objective of the project is to investigate is whether the present pattern of urban development in India by creating mega cities is sustainable. This would be carried out by performing an indicator-based evaluation of Mumbai and Bangalore cities, the emerging megacities of India, against a hypothetical sustainable mega city developed based on threshold indicators (maximum and minimum) derived from the best and the worst indicator values from cities across the world. For this investigation, a benchmark sustainable indicator-base would be developed using the threshold indicator values, which could be categorized as a sustainable megacity (hypothetical city) based on its performance against different indicators. The proposed study will have the following specific objectives: (i) developing sustainable urban indicator variables spanning all the relevant sectors of a typical megacity, (ii) developing a benchmark sustainable indicator-base using sustainability threshold values, (iii) by adopting the same methodology and same indicators develop the database for Mumbai and Bangalore in India, (iv) comparing and evaluating the indicator data with the benchmark indicator database using a “gap analysis” approach, and (v) suggesting appropriate policy measures and implementation strategies to bridge the identified gaps to attain the goal of sustainable urban system. Household, industrial, commercial and transport activities are proposed to be examined in the context of resource utilization and benefit sharing. The project outcomes are expected to contribute to the design of policies, tools, and approaches essential for planning to attain the goal of sustainable development and the social cohesion of metropolitan regions. 2.4 METHODOLOGY
The project’s basic aim is to study the phenomenon of urbanization and creation of mega cities and their impact on social, environmental and economic development. Towards this objective, the study performs a comparative assessment of urbanization in India by studying Mumbai and Bangalore and evaluates them against a hypothetical sustainable mega city. This comparative assessment is expected to be performed by developing appropriate indicator variables, and quantifying those using data from various sources (mainly secondary)2. The impacts will be measured in terms of various indicators such as
2 Initially there was no clarity on the methodology to be adopted since everything depends on the data availability. Statistical analyses like Principal Component Analysis/factor analysis are more appropriate for such analysis; however, data requirements are very comprehensive for using such tools. Considering the scope of the data, we used an alternate quantitative method, i.e., indicator-based approach. Even here, there were uncertainties with the availability of data for quantifying the relevant indicators. Hence, we restricted ourselves to proposing a broad-based methodology, which appeared to be qualitative. Statistical analysis requires a series of data (either time series or cross-sectional for several

SANEI Working paper Series 17
No: 13 – 02
economic, social, technological, infrastructural, environmental, human development. The various steps used for achieving the set objectives are briefly discussed below. 2.4.1 Design of an Indicator-based approach
The first step in this approach is to prioritize the relevant indicators. An in-depth literature survey has been carried out to enable us in prioritizing the indicators. The next step is to develop comprehensive indicators linking urbanization and sustainable development, which include indicators belonging to the following dimensions—Economic, Social, Environmental and Institutional/Governance. Next, the indicators will be quantified by analysing extensively the data collected, mostly from secondary sources. The threshold indicator database for the best and worst sustainability indicator values across the globe would enable the development of the benchmark sustainable urban indicator template for comparison and evaluation. This template will be used to evaluate Mumbai and Bangalore for identifying gaps and deviations from the desired status. A gap analysis approach will be used for estimating the essential differences in the observed indicator values for these cities with those of sustainable urban development indicators. A gap analysis in the present context can be defined as the process of matching and comparing the existing urbanization process as against those urbanization processes needed for achieving the goal of sustainable urban system and identifying the gaps. This kind of matching process will help to identify the reasons for such gaps to devise strategies to overcome these gaps and to evolve a plan for future course of action. The next step would be to identify the strategies, policies and approaches to be adopted for bridging these gaps. This would form part of the framework for the policy recommendations to achieve the desired goal. 2.4.2 Need for indicators
Indicators are quantified information which help to explain how things are changing over time. For many years, a limited number of key economic measures have been used to judge how the economy is performing—for example, output, the level of employment, the rate of inflation, the balance of payments, public sector borrowing, etc. These statistics give an overall picture but do not explain why particular trends are taking place, and do not necessarily reflect the situation of a particular industry, society or area. They do, however, provide policy-makers and the public reasonable indicators of changes in the economy, assisting economic policy decision making and allowing the public to judge for them how the economy is performing overall.
There are three basic functions of indicators—simplification, quantification, and communication. Indicators generally simplify to make complex phenomena quantifiable so that the information can be communicated. The general public are concerned about sustainable development and the environment. They like to be informed about the state of the environment and the economy and how and why they are changing.
cities) and such data are hard to get or not available. Keeping this aspect, as well as time constraints in mind, we proposed the indicator-based approach as an analytical framework for the study. Our apprehensions proved to be right when we started the data collection work for the study. This forced us to revise the methodology keeping the research objectives intact. We have used an analytical framework for identifying and analyzing the indicator gaps (with benchmark indicators developed from threshold values).
SANEI Working paper Series 18 No: 13 – 02
2.4.3 Sustainability indicators
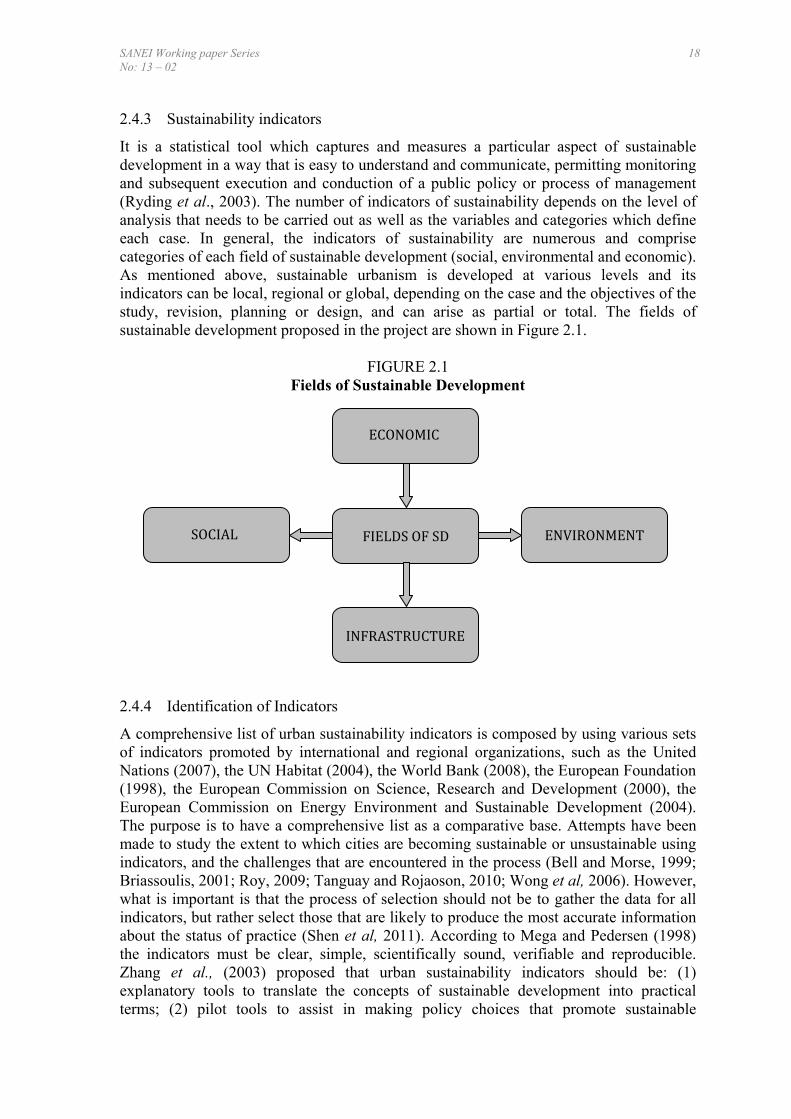
It is a statistical tool which captures and measures a particular aspect of sustainable development in a way that is easy to understand and communicate, permitting monitoring and subsequent execution and conduction of a public policy or process of management (Ryding et al., 2003). The number of indicators of sustainability depends on the level of analysis that needs to be carried out as well as the variables and categories which define each case. In general, the indicators of sustainability are numerous and comprise categories of each field of sustainable development (social, environmental and economic). As mentioned above, sustainable urbanism is developed at various levels and its indicators can be local, regional or global, depending on the case and the objectives of the study, revision, planning or design, and can arise as partial or total. The fields of sustainable development proposed in the project are shown in Figure 2.1.
FIGURE 2.1 Fields of Sustainable Development
2.4.4 Identification of Indicators
A comprehensive list of urban sustainability indicators is composed by using various sets of indicators promoted by international and regional organizations, such as the United Nations (2007), the UN Habitat (2004), the World Bank (2008), the European Foundation (1998), the European Commission on Science, Research and Development (2000), the European Commission on Energy Environment and Sustainable Development (2004). The purpose is to have a comprehensive list as a comparative base. Attempts have been made to study the extent to which cities are becoming sustainable or unsustainable using indicators, and the challenges that are encountered in the process (Bell and Morse, 1999; Briassoulis, 2001; Roy, 2009; Tanguay and Rojaoson, 2010; Wong et al, 2006). However, what is important is that the process of selection should not be to gather the data for all indicators, but rather select those that are likely to produce the most accurate information about the status of practice (Shen et al, 2011). According to Mega and Pedersen (1998) the indicators must be clear, simple, scientifically sound, verifiable and reproducible. Zhang et al., (2003) proposed that urban sustainability indicators should be: (1) explanatory tools to translate the concepts of sustainable development into practical terms; (2) pilot tools to assist in making policy choices that promote sustainable
ENVIRONMENT
ECONOMIC
INFRASTRUCTURE
FIELDS OF SDSOCIAL
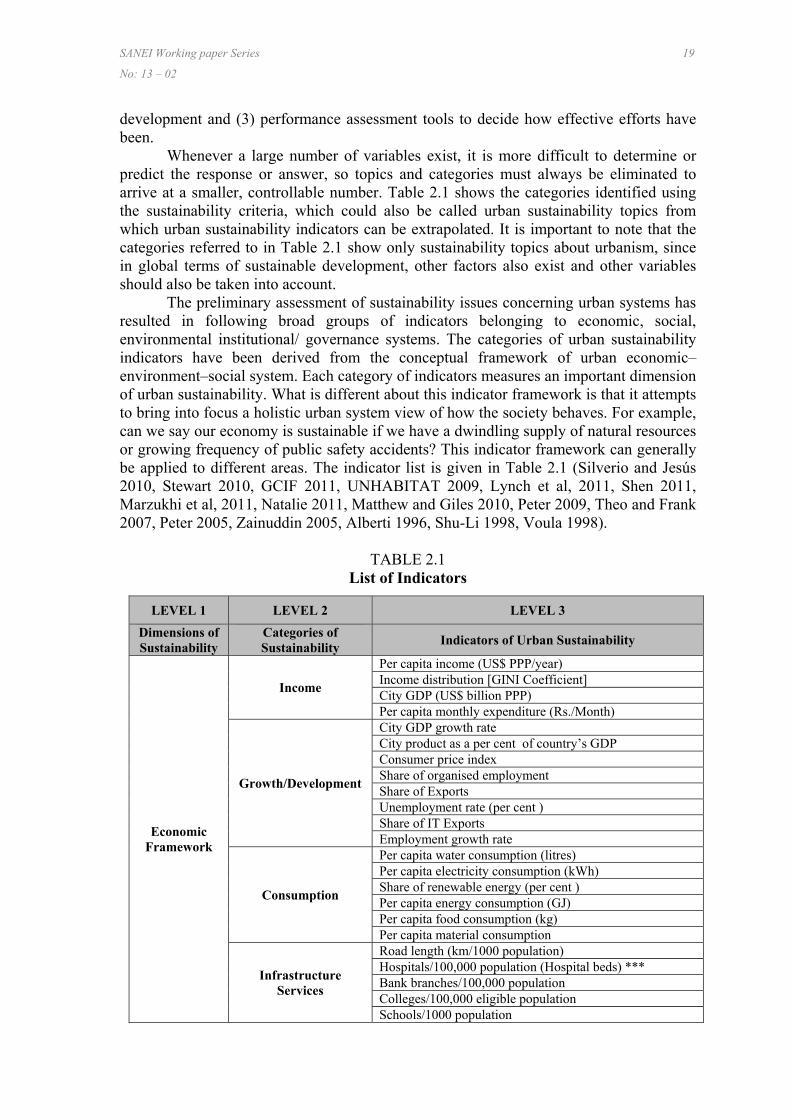
SANEI Working paper Series 19
No: 13 – 02
development and (3) performance assessment tools to decide how effective efforts have been.
Whenever a large number of variables exist, it is more difficult to determine or predict the response or answer, so topics and categories must always be eliminated to arrive at a smaller, controllable number. Table 2.1 shows the categories identified using the sustainability criteria, which could also be called urban sustainability topics from which urban sustainability indicators can be extrapolated. It is important to note that the categories referred to in Table 2.1 show only sustainability topics about urbanism, since in global terms of sustainable development, other factors also exist and other variables should also be taken into account.
The preliminary assessment of sustainability issues concerning urban systems has resulted in following broad groups of indicators belonging to economic, social, environmental institutional/ governance systems. The categories of urban sustainability indicators have been derived from the conceptual framework of urban economic–environment–social system. Each category of indicators measures an important dimension of urban sustainability. What is different about this indicator framework is that it attempts to bring into focus a holistic urban system view of how the society behaves. For example, can we say our economy is sustainable if we have a dwindling supply of natural resources or growing frequency of public safety accidents? This indicator framework can generally be applied to different areas. The indicator list is given in Table 2.1 (Silverio and Jesús 2010, Stewart 2010, GCIF 2011, UNHABITAT 2009, Lynch et al, 2011, Shen 2011, Marzukhi et al, 2011, Natalie 2011, Matthew and Giles 2010, Peter 2009, Theo and Frank 2007, Peter 2005, Zainuddin 2005, Alberti 1996, Shu-Li 1998, Voula 1998).
TABLE 2.1 List of Indicators
LEVEL 1 LEVEL 2 LEVEL 3
Dimensions of Sustainability
Categories of Sustainability
Indicators of Urban Sustainability
Economic Framework
Income
Per capita income (US$ PPP/year) Income distribution [GINI Coefficient] City GDP (US$ billion PPP) Per capita monthly expenditure (Rs./Month)
Growth/Development
City GDP growth rate City product as a per cent of country’s GDP Consumer price index Share of organised employment Share of Exports Unemployment rate (per cent ) Share of IT Exports Employment growth rate
Consumption
Per capita water consumption (litres) Per capita electricity consumption (kWh) Share of renewable energy (per cent ) Per capita energy consumption (GJ) Per capita food consumption (kg) Per capita material consumption
Infrastructure Services
Road length (km/1000 population) Hospitals/100,000 population (Hospital beds) *** Bank branches/100,000 population Colleges/100,000 eligible population Schools/1000 population

SANEI Working paper Series 20 No: 13 – 02
No. of telephones landlines per 100,000 population No. of telephones (cell) per 100,000 population No. of internet connections per 100,000 population
Transportation
Accessibility of public transportation infrastructure (per cent ) Public suburban rail/metro transport seats (per 1000 population) Public bus transport seats (per 1000 population) Para-Public (Auto, Taxi, Maxicabs) transport seats (per 1000 population) Private Road Transport seats (per 1000 population) Cars per 1000 population Two-wheelers per 1000 population Share of non-motorized transport (including walking) Share of walking (per cent ) Transport fuel consumption (GJ/capita/year) Vehicle km/capita/year Passenger car units (PCU)/1000 population Transportation fatalities per 100000 population Transportation injuries per 100000 population Transportation accidents per 100000 population Average travel time/km (min) Travel time (h./day) Automobile ownership (no/family) Average public transport cost/km (Rs.) Pedestrians killed (no/year)
Social Framework
Demographics
City population (million) Children as per cent of population (%) Youth as per cent of population (%) Senior citizens as per cent of population (%) Gender ratio (Females/1000 males) Child sex ratio Literacy rate (per cent ) Male literacy Female literacy Number of houses/1000 population Population growth rate (per cent /annum) Population density (persons/sq.km) Average household size (no) Slum population (per cent of total) Migration rate (per cent )
Education
per cent of students completing primary and secondary education per cent of students completing secondary education per cent of students completing primary education School enrolment rate (No)
Health
Number of hospital beds per 100000 population Number of physicians per 100000 population Number of nursing personnel per 100000 population Life expectancy at birth (years) Adolescent fertility rate Maternal mortality rate (per 100,000 pop) Birth rate Death rate Infant mortality Child mortality rate (no/1000)
Equity Households below poverty line (per cent )

SANEI Working paper Series 21
No: 13 – 02
per cent of HH with access to water per cent of HH with access to sanitation per cent of women councillors
Poverty
Minimum wage (Rs/month) Share of people with unhealthy living conditions per cent of poor without electricity per cent of poor with LPG connection
Housing quality Average household size (sq.m) Share of population living in pucca (permanent) houses
Safety Number of police officers per 100000 population Number of fire fighters per 100000 population Crime rate per 100000 population
Access to basic needs (energy, water,
sanitation)
Share of pucca (permanent) houses per cent of HH having piped water connection Households with electricity connection (per cent ) HH with LPG connection (per cent ) Per cent of HH having toilet facility
Environmental Framework
Climate Change CO2 Emissions per person [tonne per capita] GHG emission/city GDP (kg/US$ PPP)
Air Pollution SO2 emissions (μg/m3) NO2 emission (μg/m3) PM10 emission (μg/m3)
Soil pollution
Per capita Solid waste (kg/cap/year) Average cost of waste disposal (Rs/ton) Sewage disposal (per cent ) Wet waste per capita (kg/person/day) per cent of solid waste that is recycled Dry waste capita (kg/cap/day) Biodegradable waste (per cent )
Water pollution
Waste water per capita (l./cap) Share of treated water (per cent ) Share of population with access to treated water (per cent ) Water leakage (per cent of total) Cost of wastewater treatment (Rs/kl) Share of waste water recycled (per cent )
Urban green spaces Green spaces/person (m2) Area of green cover (Sq.m/1000 population)
Land use pattern Share of green space (per cent ) Share of area used for roads (per cent ) Share of residential area (per cent )
Energy
Electricity consumption/capita LPG/Gas consumption/capita (kg) Diesel Consumption/capita (litre/year) Petrol consumption/capita (litre/year) Biomass use/capita Kerosene/capita Penetration of solar water heaters Share of income spent on energy Electricity price (Rs/Kwh) LPG price (Rs/kg.) T&D losses (per cent )
Water consumption
per cent of population with potable water supply service Share of houses with sources of water within premises Consumption of water (l./day) Piped water supply reliability (no.of hours of supply/day) per cent of HH having piped water connection Price of water (RS./kl)

SANEI Working paper Series 22 No: 13 – 02
Raw materials consumption
Per capita raw material consumption
Institutional/ Governance Framework
Government
Total expenditure per capita Revenue generation per capita No. of councillors per 1000 population Voter participation rates by men Voter participation rates by women Share of salaries in budget Police personnel per 1000 population Per-capita capital expenditure
Industry SMEs per 1000 population Large industries per 1000 population Industry value added per capita
2.4.5 Quantifying indicators
Quantification of prioritized indicators will be done using data gathered from secondary sources. Further, deliberations have been made with experts from stakeholder organizations, research institutes working in the area of urbanisation, NGOs, planners, policy-makers, etc., to substantiate the information thus gathered. 2.4.6 Determining indicator and dimension weights
As stated, indicator-based approach uses a set of dimensions and several indicators under each dimension to measure the sustainability of an urban system. In this context, it is critical to derive the extent of contributions made by each of the dimensions to the overall urban sustainability. Similarly, it is also important to determine the extent of contributions made by each of the indicators to the dimension it belongs to. Simplest assumption is that all the dimensions contribute equally to urban sustainability and all the indicators contribute equally to the dimensions. In other words, it means that all the indicators and dimensions will have equal weights assigned to them. A more rigorous approach could be to derive weights for every indicator and associated dimensions by seeking inputs from relevant stakeholders. This would enable assigning differential weights to indicators and dimensions depending on their relative importance in determining the extent of sustainability. In other words, stakeholders would be asked to assign weights to the indicators. A stakeholder survey would be designed for this purpose and either paired comparison or ranking method would be used for deriving weights for indicators as well as dimensions.
In real-life situations, indicator values have different measurement units (income in rupees, Electricity in kWh, etc.). For developing composite indicators, it is essential to transform the values all these indicators into some standard form. Thus, for each of the indicators included in the analysis, a relative indicator is estimated using the actual and the sustainability threshold values. For each indicator, a minimum and maximum threshold values will be determined. The relative indicator is developed by using a scaling technique where the minimum value is set to 0 and the maximum to 1.
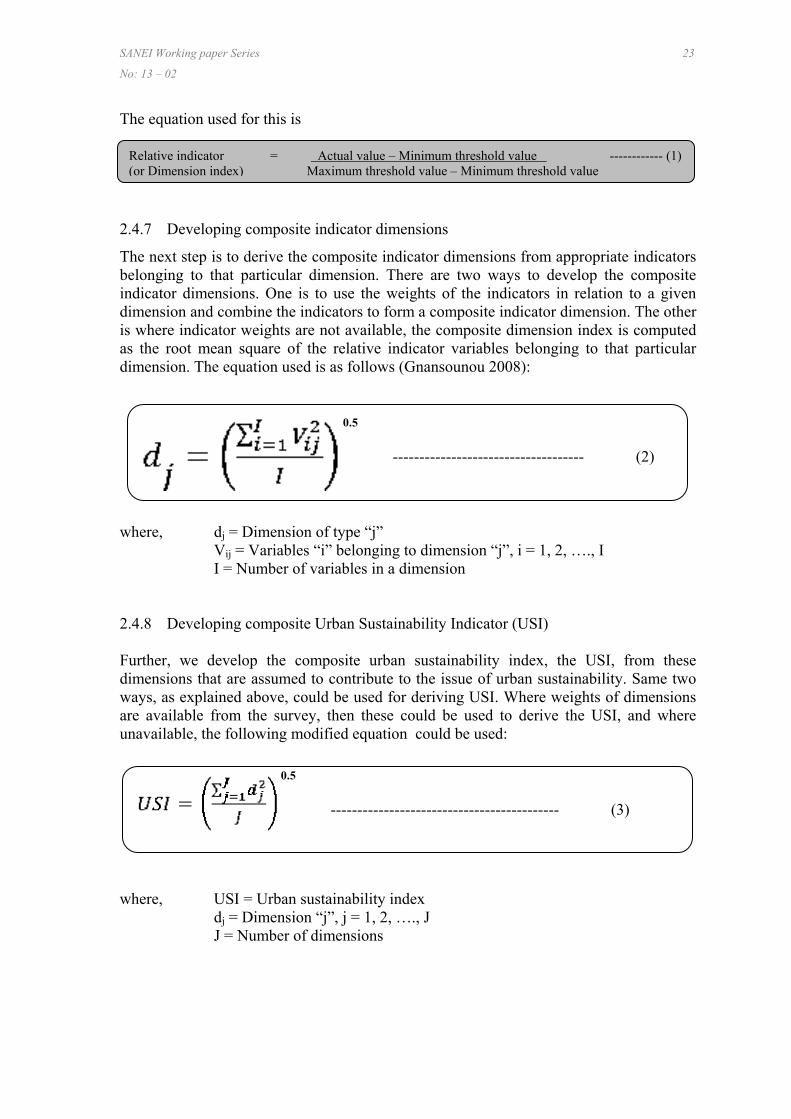
SANEI Working paper Series 23
No: 13 – 02
The equation used for this is 2.4.7 Developing composite indicator dimensions
The next step is to derive the composite indicator dimensions from appropriate indicators belonging to that particular dimension. There are two ways to develop the composite indicator dimensions. One is to use the weights of the indicators in relation to a given dimension and combine the indicators to form a composite indicator dimension. The other is where indicator weights are not available, the composite dimension index is computed as the root mean square of the relative indicator variables belonging to that particular dimension. The equation used is as follows (Gnansounou 2008):
where, dj = Dimension of type “j” Vij = Variables “i” belonging to dimension “j”, i = 1, 2, …., I I = Number of variables in a dimension 2.4.8 Developing composite Urban Sustainability Indicator (USI) Further, we develop the composite urban sustainability index, the USI, from these dimensions that are assumed to contribute to the issue of urban sustainability. Same two ways, as explained above, could be used for deriving USI. Where weights of dimensions are available from the survey, then these could be used to derive the USI, and where unavailable, the following modified equation could be used: where, USI = Urban sustainability index dj = Dimension “j”, j = 1, 2, …., J J = Number of dimensions
Relative indicator = Actual value – Minimum threshold value ------------ (1) (or Dimension index) Maximum threshold value – Minimum threshold value
0.5
------------------------------------ (2)
0.5
------------------------------------------- (3)

SANEI Working paper Series 24 No: 13 – 02
2.5 BENCHMARKING URBAN SUSTAINABILITY—A GAP ANALYSIS
APPROACH
As stated earlier, the indicators of sustainability for each of the dimensions that are being determined for Mumbai and Bangalore cities will be compared with the benchmark indicators of a hypothetical sustainable megacity developed using maximum and minimum threshold values of sustainability indicators. The values will be derived from the best and the worst values obtained for a given indicator by any city in the world. In the first step, the standardized indicator dimensions for both the study cities (Mumbai and Bangalore) and the sustainable city will be mapped on a radar diagram as shown in Figure 2.2 (a hypothetical depiction of such mapping). The distance between the two points of a given dimension for the two cities gives the prevailing gap. It is same even for other dimensions. These dimension gaps for the study city suggest how far they are from achieving the level of a benchmark sustainable city, and also provide insights on which dimensions they are seriously lacking. Similar radar graphs will be developed for each of the dimensions using standardized indicators belonging to that dimension. Thus, the quantified gaps in dimensions as well as individual indicators can provide greater insights into the reasons for existence of such sustainability gaps, targets need to be fixed for bridge them and strategies that need to be adopted for achieving these targets.
FIGURE 2.2 Benchmarking Urban Sustainability
National and international experience demonstrates that the search for a core set of sustainability indicators should not stop at the identification. There is a need to understand what we want to achieve. Once done, the details on how indicators should be measured and reported can be addressed relatively quickly and generate a real indication of how the city is performing. This will result in the development of a framework that

SANEI Working paper Series 25
No: 13 – 02
specifies operational objectives. Indicators are a means to achieve the objectives and are not an end in themselves. Achieving objectives, rather than measuring common quantities, become the basis for reporting progress and are more likely to be accepted at the local, national or global scales.

CHAPTER 3
A COMPARATIVE ANALYSIS OF MUMBAI AND BANGALORE 3.1 DEMOGRAPHIC PROFILE
The demographic base of Mumbai and Bangalore is structurally different and distinct in terms of overall size and features. Mumbai is historically an urban region, an industrial power house and a port city. On the other hand, Bangalore’s growth dates back to 1980s after information technology became prominent and fuelled in part by a strong in-flow of migrants, particularly educated youth. Mumbai constitutes only 0.16per cent of the area of the state of Maharashtra, but home to 16.4per cent of its population. This results in a very high population density (28,330/km2) which is 90 times higher than the state as a whole. Mumbai is the administrative and commercial center of Maharashtra with many national and international enterprises having their headquarters here. It is also a seat of manufacturing industries, above all electro-technical and chemical industries and manufacturing of fabricated metal products. Comparatively, Bangalore has a larger land area (2190 km2) and uses much of its land for housing, industry and parks. The Bangalore Urban Agglomeration has grown faster than Mumbai between the years 1981 and 2011. During the last decade, Mumbai’s population grew by 4.8per cent whereas that of Bangalore grew by 31.8per cent. A key feature of population growth in Bangalore is that most of the growth is occurring in the surrounding areas. However, the population density of Mumbai is higher than that of Bangalore thus necessitating different kind of long-term planning and significant investments for improved service delivery. The population density of Mumbai is about seven times of that of Bangalore but it is the other way round with green cover; it being about six times higher in Bangalore than in Mumbai per person.
TABLE 3.1 Demographic data for the Cities of Bangalore and Mumbai (2001-2011)
Description Bangalore Mumbai
2001 2011 2001 2011 Population (million) 6.54 9.59 16.91 18.48 Male (million) 3.43 5.03 8.71 9.86 Female (million) 3.11 4.56 7.20 8.52 Population Growth (decadal) (per cent ) 31.8 4.8 Area Sq. km 2,190 2,190 653 653 Population Density/km2 2,985 4,378 25,880 28330 Proportion to state Population (per cent ) 12.37 15.69 17.47 16.41 Green cover (m2/person) 41 6.6 Sex Ratio (Per 1000) 930 908 777 838
Average Literacy 82.96 88.48 86.4 88.48 Source: For Mumbai: http://www.census2011.co.in/census/district/357-mumbai-city.html For Bangalore: http://www.census2011.co.in/census/district/242-bangalore.html
3.2 LAND USE
The study of land-use patterns helps in arriving at solutions that limit the decaying of areas through a sustainable development of core city and the suburban areas. The data indicate that the residential area of Mumbai constitutes 36 per cent followed by an equal

SANEI Working paper Series 27
No: 13 – 02
percentage by green cover under forest land and agriculture. In Bangalore the residential areas comprise around 43 per cent. The central core in both the cities (and more strikingly in Mumbai) is underdeveloped. This means that business and commercial activities that normally provide services to the city and its region have not been developed fully. Instead, the city has a mix of uses, such as industrial, agricultural, residential, and water bodies around their core. This signals that markets have not operated to allocate land to higher value uses, such as commerce and services, as would be seen in comparable Asian cities. In effect, the land utilisation pattern is influenced by central planning controls, and this introduces rigidities into the system (Table 3.2).
TABLE 3.2 Land use pattern
Land use Mumbai Bangalore
Residential Formal 34 40.2 Residential Informal 2.05 2.9 Business/industry 10.02 6.8 Agriculture 2.5 4.5 Transport /Roads 10.3 20.7 Green cover (forest, coastal wet land, agriculture, etc.) 37 21.5 Wet land 2.12 1.4 Water body 2.01 2.0 Average temp (summer) 20 to 38 20 to 36 Winter 17 to 25 10 to 30 Average rain fall (cm) 254 86 Source: For Mumbai: http://www.regionalplan-mmrda.org For Bangalore: Bharath and Uttam (2009)
3.3 ECONOMIC PROFILE
Presently, large cities contribute significant shares of GDP to the national economy. In 2010, Mumbai generated almost six percent of India’s GDP. Large cities have such relative economic weight for two reasons. Firstly, they are home to 20 percent of the population. Secondly, they have relatively high per-capita incomes (about US $10,000). The average per capita GDP of urban India is about 10 times higher than that in rural areas.
Mumbai and Bangalore are not only the administrative capitals but also the economic and financial capitals of the respective states. They are the largest contributors to the states’ GDP. Over past two decades, Mumbai’s economy has shifted from a manufacturing-intensive to a more diversified profile comprising trade, commerce, industry, transportation, storage, communication and construction sectors. In the case of Bangalore, the economic profile has undergone a significant transformation in recent years with service industry playing a major role in economic development. The tertiary or service sector has increased in recent years with a significant proportion of new jobs across a whole range of activities. Of late, this sector has emerged as the single largest employer and will continue to grow as the dominant sector in the future considering the developmental initiatives planned in the city.
The economies of both the cities are built on a broad regional resource base that extends into surrounding areas which are rural, agriculture-dependent and primary resource hinterlands which depend, in turn, on the markets, services of these cities. It

SANEI Working paper Series 28 No: 13 – 02
should be noted that the fortunes of the surrounding rural areas, and the prospects for employment are inextricably linked to the fate of these city economies.
TABLE 3.3 Per capita GDP, income and exports (2011)
Details Mumbai Bangalore
GDP (US$. billion) 209 83 Per capita income3 (US$) 10885 10273 City product as a per cent of country’s GDP 5.76 2.29 Share of Exports 14 2.2 Share of IT Exports 2.1 6.2 Unemployment rate (per cent ) 17 14 Per cent of Households availing bank services 87.8 66.9 Source: PricewaterhouseCoopers (2010), IMF (2012), http://business.rediff.com/slide-show/2010/apr/23/slide-show-1-the-top-10-cities-in-india-by-gdp.htm, Web search
In terms of economic structure the difference between the two cities actually is narrowing, an indication that the economies are tending to converge, but the pace of convergence is slow. Despite this slow convergence in economic structure, the difference in absolute employment is actually increasing. Between 2001 and 2011, the total employment in Mumbai rose by 2.9 per cent, and in Bangalore by 6.2 per cent. This is because, in Mumbai the share of construction, manufacturing and transport remains high, while in Bangalore those of tourism, ICT, and cultural activities is greater. The latter sectors, more than the specialties of Mumbai, are considered as the characteristic of advanced knowledge-based urban economies in which the “creative” element, added value and employment growth are expected to be relatively high. Consequently, in Bangalore, the share of rapidly growing service sectors is larger, whereas Mumbai benefits less from its larger share of manufacturing industry, which is becoming increasingly labor-extensive. It is important to note that nearly 86 per cent of the households in Mumbai have Bank accounts while in Bangalore, it is about 67 per cent. 3.4 HOUSEHOLD CHARACTERISTICS
Table 3.4 provides information on the status of households. In Mumbai, 67.14 per cent of population own a house compared with only 38.4 per cent in Bangalore. The households in accommodation are 29 per cent in Mumbai while it is double of it (58.7per cent) in Bangalore. The type of household may be viewed as an indicator of the quality of housing (a wealth dimension) as well as an indicator of health risk. Overall, in Mumbai, over 51.8 out of every 100 are pucca (permanent) houses (built with material such as stone, brick, cement, concrete, and timber with floors made of vinyl-asphalt strips, ceramic tiles or cement) where as their share is as high as 78 per cent in Bangalore. On the other hand, 46.4 per cent of households in Mumbai are semi-pucca houses (with brick masonry and RC foundation and having earth or sand floors) compared with only 20.7 per cent in
3 To estimate per capita income, Purchasing Power Parity (PPP) based estimate of City GDP was used using the IMF approaches. As per this study by PricewaterhouseCoopers, the GDP in 2008 for Mumbai was US$ PPP 209 billion. Using this and population data per capita income was estimated. These estimates are in PPP terms which is approximately three times higher than the US$ at market exchange rates. For example, the per capita GDP for India in 2010 was US $ 3,403 (in PPP) and at market exchange rate it was approximately US $1,100.

SANEI Working paper Series 29
No: 13 – 02
Bangalore. The rest of the houses are Katcha houses (temporary, made of mud used for walls/roof and/or dry stone masonry). Mumbai has, on an average, 3.4 persons per room and Bangalore 2.5. Similarly, 72.9 per cent of households in Mumbai have one room compared to 33.2 per cent in Bangalore.
TABLE 3.4 Households by ownership and dwelling Status
Details Mumbai Bangalore
Total HH 63,77,380 23,77,056 Owned 67.14 38.4 Rented 29.04 58.7 Others 4 2.9 Pucca (Permanent) 51.8 78 Semi pucca 46.4 20.7 Katcha (Temporary) 1.8 1.3 Average no. of persons/room 3.4 2.5 Per cent of Households with one room 72.9 33.2
Source: Census 2011
Table 3.5 provides information relating to other characteristics of dwellings such as power connections, toilets, water facilities. Access to electricity is much higher in Bangalore, almost universal (98 per cent), than in Mumbai (89.6 per cent). In case of toilet facilities, over 78 per cent in Mumbai and 94.8 per cent households in Bangalore have access. Increased access to safe drinking water results in improved health conditions in the form of reduced cases of water-borne diseases such as dysentery and cholera. In both the cities, about one third of the households do not have access to tap water in the household premises.
An abundant water supply is essential for the growth of a city. It is important to monitor volumes of water consumption and its sources. Since water can be treated, it can act as a basis for calculating the efficiency of water use. Overall, water consumption can be divided into the following categories: domestic, industrial, commercial and miscellaneous. Mumbai meets its fresh water needs mainly from rainfall, whereas Bangalore draws its water from Cauvery River and some through rainfall. Estimates show that about 15–20% of water supply is lost due to leakage in pipes. Very little work has been done to maintain the water pipes, which can account for this significant water loss.
TABLE 3.5 Profile of Housing and amenities
Details Mumbai Bangalore
Average no. of persons per room 3.4 2.5 Per cent of Households with one room 72.9 33.2 Per cent of Households reporting availability of
(i) Electricity 89.6 98.0 (ii) Toilet facilities 78.2 94.8 (iii) Tap Water Within Premises 67.7 66.6 (iv) Tap Water Outside Premises 32.3 12.5
Source: Census, 2011
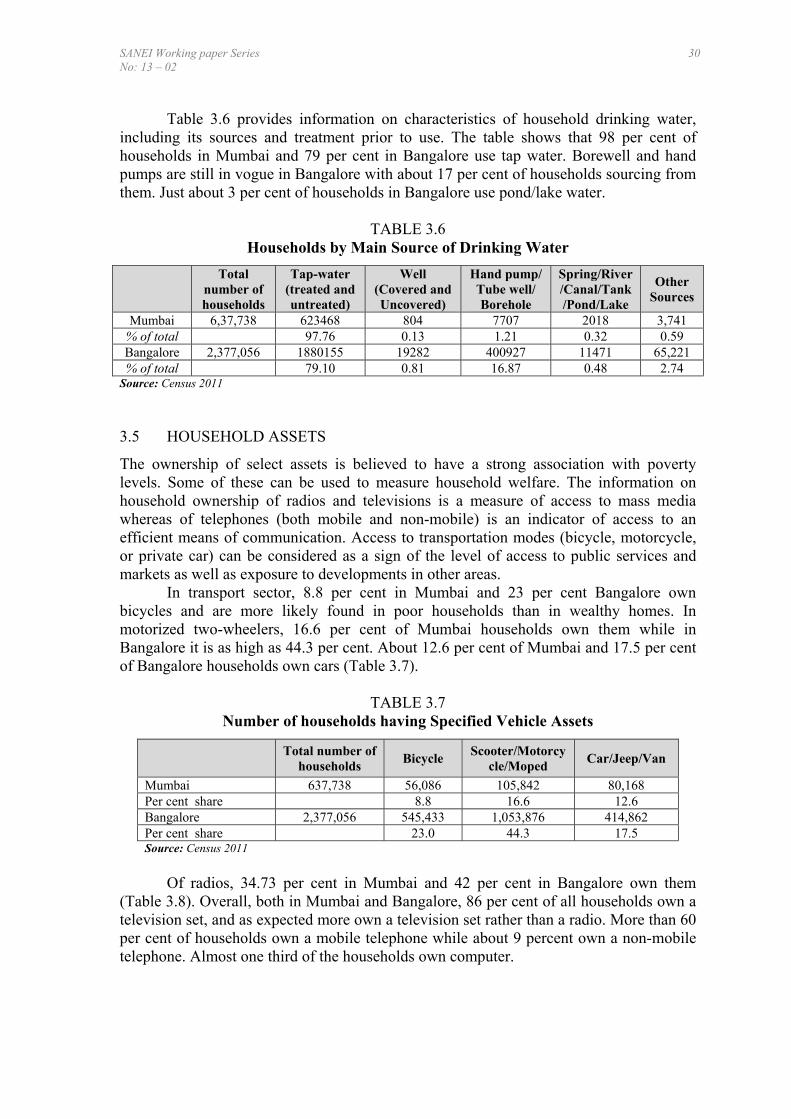
SANEI Working paper Series 30 No: 13 – 02
Table 3.6 provides information on characteristics of household drinking water, including its sources and treatment prior to use. The table shows that 98 per cent of households in Mumbai and 79 per cent in Bangalore use tap water. Borewell and hand pumps are still in vogue in Bangalore with about 17 per cent of households sourcing from them. Just about 3 per cent of households in Bangalore use pond/lake water.
TABLE 3.6 Households by Main Source of Drinking Water
Total number of households
Tap-water (treated and untreated)
Well (Covered and Uncovered)
Hand pump/ Tube well/ Borehole
Spring/River/Canal/Tank/Pond/Lake
Other Sources
Mumbai 6,37,738 623468 804 7707 2018 3,741 % of total 97.76 0.13 1.21 0.32 0.59 Bangalore 2,377,056 1880155 19282 400927 11471 65,221 % of total 79.10 0.81 16.87 0.48 2.74 Source: Census 2011 3.5 HOUSEHOLD ASSETS
The ownership of select assets is believed to have a strong association with poverty levels. Some of these can be used to measure household welfare. The information on household ownership of radios and televisions is a measure of access to mass media whereas of telephones (both mobile and non-mobile) is an indicator of access to an efficient means of communication. Access to transportation modes (bicycle, motorcycle, or private car) can be considered as a sign of the level of access to public services and markets as well as exposure to developments in other areas.
In transport sector, 8.8 per cent in Mumbai and 23 per cent Bangalore own bicycles and are more likely found in poor households than in wealthy homes. In motorized two-wheelers, 16.6 per cent of Mumbai households own them while in Bangalore it is as high as 44.3 per cent. About 12.6 per cent of Mumbai and 17.5 per cent of Bangalore households own cars (Table 3.7).
TABLE 3.7 Number of households having Specified Vehicle Assets
Total number of
households Bicycle
Scooter/Motorcycle/Moped
Car/Jeep/Van
Mumbai 637,738 56,086 105,842 80,168 Per cent share 8.8 16.6 12.6 Bangalore 2,377,056 545,433 1,053,876 414,862 Per cent share 23.0 44.3 17.5 Source: Census 2011
Of radios, 34.73 per cent in Mumbai and 42 per cent in Bangalore own them
(Table 3.8). Overall, both in Mumbai and Bangalore, 86 per cent of all households own a television set, and as expected more own a television set rather than a radio. More than 60 per cent of households own a mobile telephone while about 9 percent own a non-mobile telephone. Almost one third of the households own computer.

SANEI Working paper Series 31
No: 13 – 02
TABLE 3.8 Households Having Specified Electronic Assets
Total number of households
Radio/ Transistor
Television Computer/Laptop Telephone/Mobile Phone
With Internet
Without Internet
Landline Mobile Both
Mumbai 63,77,380 2,21,503 5,43,699 1,21,344 82,890 61,038 3,90,211 1,50,960 Per cent of total
34.73 85.25 19.03 13.00 9.57 61.19 23.67
Bangalore 23,77,056 10,08,239 20,42,977 4,30,880 3,59,223 2,11,852 16,09,899 3,59,041 Per cent of total
42.42 85.95 18.13 15.11 8.91 67.73 15.10
Source: Census 2011 3.6 EDUCATION
As India offers free school education, little variation is observed in Mumbai and Bangalore in enrolment to primary education. The likelihood of completing secondary and ‘more than secondary’ level education increases as household wealth quintile increases. Ninety one point eight per cent of males from Mumbai and 92.5 per cent from Bangalore are literate. A similar pattern is observed among women too, with 84.8 per cent from Mumbai and 86 per cent from Bangalore having attained literacy levels.
TABLE 3.9 Education—Civic Statistics
Mumbai Bangalore
Municipal School Children 801,665 230,134 Municipal Primary Schools 1,266 1,312 Aided Schools 355 553 Unaided Schools 616 898 Teachers in Municipal Schools 16,489 6,324 Male Literacy 91.8 92.5 Female Literacy 84.8 86.1 Average literacy 88.4 89.5 Note: Aided school are run by private individuals or bodies with financial support from the government. Source: Maharashtra Key Data 2010–11 The Blue Book, Kaalnimay, Sumangal Press Pvt. Ltd, Mumbai
3.7 TRANSPORT
The first railway line in India, the Bombay-Thane railway, was built in 1853. At present, Mumbai’s suburban trains (comprising the systems run by Central and Western Railways, two important Indian Railways zones touching the city) carry about 7.5 million passengers a day, which is about half of the total number of daily passenger journeys in India. Mumbai has developed mainly due to its excellent rail and bus networks featuring low-priced services of the suburban rail system. Bangalore has no such suburban rail network and only recently skeletal metro rail system came into operation.
A study of the vehicles shows that two-wheelers, cars and taxis are high in Bangalore at 3.79 million, while Mumbai has only 1.87 million suggesting a 4:1 ratio between Bangalore and Mumbai. This is because, in Bangalore, the principal mode of travel is road transport (bus, car, autorickshaw and two-wheelers), whereas in Mumbai

SANEI Working paper Series 32 No: 13 – 02
rail transport is predominant as over half of the total travelling population travels by it. Bicycle is used by very few. Bus travel includes city buses, chartered buses, school buses, etc. The vehicle population in Mumbai is characterised by high number of cars and taxis. During 2010, for instance, the share of cars in Mumbai was 31.55 per cent of all the vehicle population in comparison with only 7.1 per cent in Bangalore. The share of autorickshaws (motorized tri-wheeler public transport) in Mumbai was 8.5 per cent during the same period. The share of two wheelers in total vehicle population was 69.22 per cent for Bangalore and 55.83 per cent for Mumbai (Table 3.10).
TABLE 3.10 Vehicle Population (millions) in Mumbai and Bangalore (2010)
Mumbai per cent Share Bangalore per cent Share
Two Wheelers 1.044 55.83 2.62 69.22 M/Cars 0.59 31.55 0.71 18.73 A/R Cabs 0.16 8.50 0.12 3.19 Others 0.075 4.01 0.034 8.86
Total 1.87 3.79 Source: For Mumbai: Motor Transport Statistics of Maharashtra 2010–2011 (http://www.mahatranscom.in/pdf/STATISTICAL.BOOK.10-11.pdf) For Bangalore: Bangalore Road Transport Organisation (http://rto.kar.nic.in/)
3.8 ENERGY
In 2010, Mumbai consumed 160 Peta Joules of energy, equivalent to 4 million tonnes of oil, all of it coming from outside. The Primary Energy Sources (PES) consists of solid (coal and biomass), liquid (petroleum products), gas (LPG and Natural Gas) and electricity. The energy is consumed by four principal sectors: (i) households, (ii) industries, (iii) commercial establishments, and (4) transport. Coal is used by the power sector. Oil products such as petrol, diesel and LPG as well as natural gas are used for transportation and domestic use. Mumbai’s household and transport sectors use over 60per cent of the PES while the industry uses about 22 per cent. Within the transport sector, around 60 per cent of energy consumed is associated with the movement of passengers that is dominated by cars, and the remainder with the distribution of goods and services. The share of various energy carriers in the energy mix of Mumbai and Bangalore varied considerably (Table 3.11). The utilisation of electricity in Mumbai in various sectors is as follows: residential 40.49 per cent, industrial 14.66 per cent, commercial 39.08 per cent and transport 5.04 per cent. In the case of Bangalore, industrial are dominant consumer of electricity with a share of about 55 per cent and residential sector occupies second position with a share of 30.3 per cent.

SANEI Working paper Series 33
No: 13 – 02
TABLE 3.11 Electricity use by sector
Per cent share by sector Mumbai Bangalore Domestic 40.49 30.31 Industrial 14.66 55.24 Commercial/ Services 39.08 13.72 Traction 5.04 0.00 Miscellaneous 0.72 0.73 Total (GWh) 16,290 14,252 Source: (i) Estimates based on primary data collected by the authors for Mumbai. (ii) BESCOM data was used for Bangalore (http://bescom.org/wp-content/uploads/2011/12/Financial-details.pdf)
The household fuel use data indicate a variation in the contribution of different energy carriers to the energy mix of households which are being used for cooking and water-heating. LPG is the main fuel for cooking in more than 75 per cent of all households in Mumbai and Bangalore, while kerosene is used in 17.42 per cent of households in Mumbai and about 16 per cent in Bangalore (Table 3.12). Bio fuels are used by 2.3 per cent of all households in Mumbai and by 6.93 per cent in Bangalore. Cooking fuel affects the air quality for household members. Clean fuel is not accessible to poor households and they instead use bio fuels and kerosene that emit a lot of smoke. As a result, household members, mainly the female members, are likely to be exposed to indoor air pollution.
TABLE 3.12 Households by Type of Fuel Used For Cooking
Total
number of households
Fuel Used For Cooking
Biomass Coal/Lignite
/Charcoal Kerosene LPG/PNG Electricity Biogas
Any Other
No cooking
Mumbai 6,37,738 14695 570 1,11,124 4,94,884 241 1,729 1,044 13,453
per cent of total
2.30 0.09 17.42 77.60 0.04 0.27 0.16 2.11
Bangalore 23,77,056 164695 1,681 3,79,053 17,88,912 4,245 20,613 2,191 15,666
per cent of total
6.93 0.07 15.95 75.26 0.18 0.87 0.09 0.66
Source: Census 2011
Lighting is an important household energy service as it is directly related to quality and productivity of life. Unlike heating or cooking, lighting is the end use of energy that is associated more exclusively with electricity as it provides high levels of light at high efficiency compared to other fuel sources. During the early seventies, the share of households using electricity for lighting in both the cities was only about 60per cent which increased steadily over the years. By 2010, it reached about 98per cent , leaving only 2 per cent of the total households to kerosene use (for fuel-based lighting). Lack of infrastructure and high initial connection and service costs are the main reasons for the households not having electricity connection (Table 3.13).
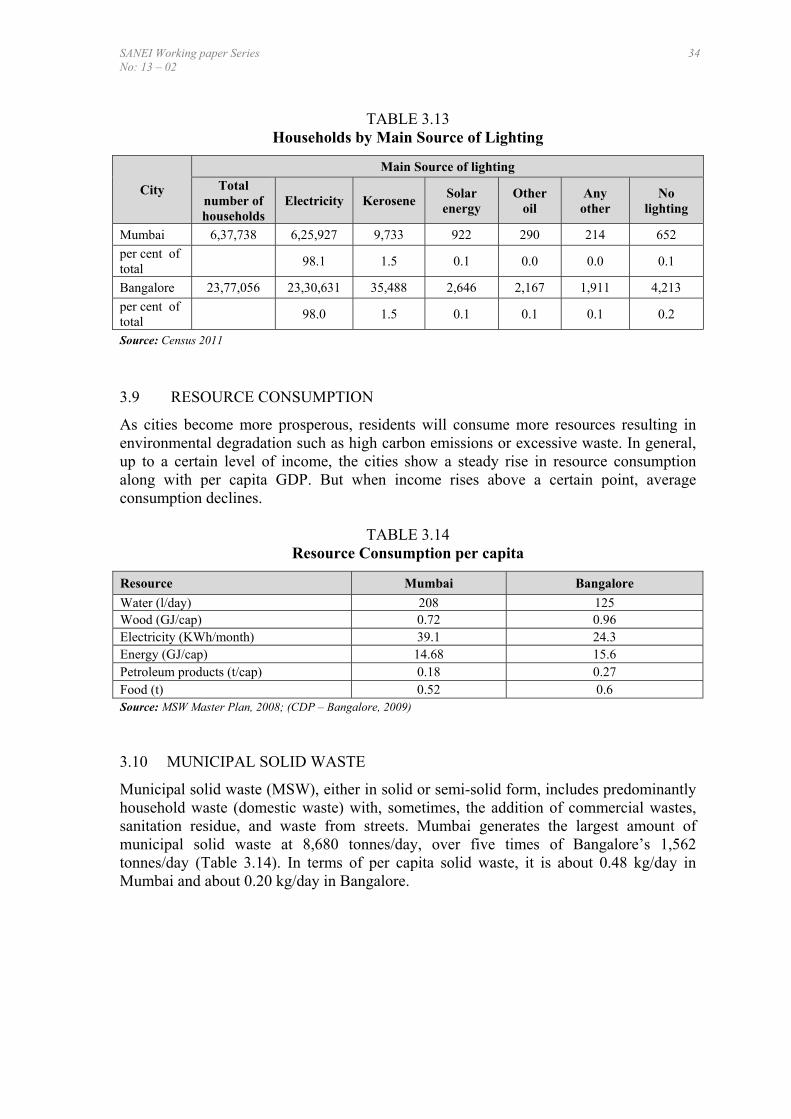
SANEI Working paper Series 34 No: 13 – 02
TABLE 3.13 Households by Main Source of Lighting
City
Main Source of lighting
Total number of households
Electricity Kerosene Solar
energy Other
oil Any other
No lighting
Mumbai 6,37,738 6,25,927 9,733 922 290 214 652
per cent of total
98.1 1.5 0.1 0.0 0.0 0.1
Bangalore 23,77,056 23,30,631 35,488 2,646 2,167 1,911 4,213
per cent of total
98.0 1.5 0.1 0.1 0.1 0.2
Source: Census 2011
3.9 RESOURCE CONSUMPTION
As cities become more prosperous, residents will consume more resources resulting in environmental degradation such as high carbon emissions or excessive waste. In general, up to a certain level of income, the cities show a steady rise in resource consumption along with per capita GDP. But when income rises above a certain point, average consumption declines.
TABLE 3.14 Resource Consumption per capita
Resource Mumbai Bangalore
Water (l/day) 208 125 Wood (GJ/cap) 0.72 0.96 Electricity (KWh/month) 39.1 24.3 Energy (GJ/cap) 14.68 15.6 Petroleum products (t/cap) 0.18 0.27 Food (t) 0.52 0.6 Source: MSW Master Plan, 2008; (CDP – Bangalore, 2009)
3.10 MUNICIPAL SOLID WASTE
Municipal solid waste (MSW), either in solid or semi-solid form, includes predominantly household waste (domestic waste) with, sometimes, the addition of commercial wastes, sanitation residue, and waste from streets. Mumbai generates the largest amount of municipal solid waste at 8,680 tonnes/day, over five times of Bangalore’s 1,562 tonnes/day (Table 3.14). In terms of per capita solid waste, it is about 0.48 kg/day in Mumbai and about 0.20 kg/day in Bangalore.

SANEI Working paper Series 35
No: 13 – 02
TABLE 3.15 Municipal solid waste Generation (TPD)
Source Mumbai Bangalore Residences 6,760 1,562 Markets/industry 700 84 Hotels and Restaurants 1,220 96 Total 8,680 1,742 Per capita (kg/day) 0.48 0.2 Source: MSW Master Plan, 2008 (CDP-Bangalore, 2009)
3.11 EMISSION INVENTORY
Emission inventory is an estimate of the amount of pollutants emitted into atmosphere. It is characterized by the following: (i) Type of activities that cause emissions, (ii) Chemical or physical identity of the pollutants included, (iii) Geographic location, and (iv) Time period over which emissions are estimated. Motor vehicles in Mumbai contribute bulk of the CO emissions with the 2010 inventory at around 70 per cent. Bangalore’s contribution, however, is relatively less. Domestic sources contribute nearly 27 per cent in Mumbai. Over the years, PM10 emissions have fallen mainly due to a shift away from coal and wood for both domestic heating and industrial use, and are predicted to fall further in both the cities with change in fuel use trends and technology improvements. As shown in Table 3.15, domestic sector of Mumbai is the major source for PM10 emissions contributing nearly 60 per cent of the total, whereas the transport sector is the main contributor in Bangalore (45 per cent). The main source of NOx emissions in Bangalore is motor vehicles (75 per cent), and DG sets contribute about 20 per cent. In Mumbai, transport sector contributes to 61 per cent of the total and industry about 30 per cent. Domestic and commercial combustion are only minor sources of NOx in the regions. The main source of SO2 emissions is industry. This source contributes 78 per cent of the total SO2 emissions in Mumbai compared to 60 per cent in Bangalore. The other major sources are transport and domestic sources.
TABLE 3.16 Emission inventory (t/day)
Source CO PM10 NOx SO2
Mumbai Bangalore Mumbai Bangalore Mumbai Bangalore Mumbai Bangalore Transport 280 --- 1.98 22.4 34 146.36 5.34 2.31 Road dust --- 10.9 0 0 Domestic 108.6 --- 10.77 1.8 4.22 2.73 3.57 0.68 Industry --- 3.77 7.8 16.1 1.2 30.78 8.2 Commercial --- 0.2 0.1 0.45 0.2 0.03 0.02 Construction --- 2.7 0 0 Others (DG set)
5.42 --- 1.37 3.6 0.25 51 0.11 3.35
Source: TERI, 2010 3.12 CONCLUDING REMARKS
The resource consumption in both Mumbai and Bangalore seems unsustainable. Mumbai has a high population density as well as 37 per cent of its total land area is already

SANEI Working paper Series 36 No: 13 – 02
developed. It uses crude oil and coal as its main energy resources. These are non-renewable and only a limited supply is available. These factors combine to lead to a lowered standard of living. Bangalore is unable to sustain its needs for water. Only 20 per cent of its water comes from local water catchment areas. Both cities import food products. We need time series date to compare the resource use consumption patterns of the two cities. However, due to paucity of time and resource constraints these gaps could not be addressed at this time.

CHAPTER 4
BENCHMARKING URBAN SUSTAINABILITY—A COMPOSITE URBAN SUSTAINABILITY INDEX FOR MUMBAI AND BANGALORE
4.1 INTRODUCTION
The previous chapter has presented a comparison of Mumbai and Bangalore cities on various urban dimensions. The discussions mainly revolved around the trends in demographics, infrastructure, access to services, mobility, etc. In this chapter, we focus on similar comparisons but from an urban sustainability perspective using an indicator-based approach. The approach adopted for this purpose is described in the methodology chapter (Chapter 2). In this, we discuss the prioritization of indicators relevant to measure urban sustainability under different categories as well as dimensions. Prioritization is made on the basis of logical assessment and data availability. Literature has been reviewed extensively. Later, values were obtained from secondary sources for prioritized indicators and to develop sustainability benchmarks, the threshold values (maximum and minimum) for the prioritized indicators were generated again from literature. Subsequently, the composite sustainability index values, category- and dimension-wise, were developed using the approach explained in the methodology chapter. Finally, USI for both Mumbai and Bangalore were developed and compared with the benchmark USI. The following sections discuss these aspects in detail. 4.2 DIMENSIONS OF SUSTAINABILITY
As mentioned earlier, the sustainability of any system is defined in terms of three dimensions, namely, economic, social and environmental sustainability. This is true even for an urban system, which consists of these three dimensions. The dream of sustainable urban system can be achieved only when the functioning of the economic, social and environmental systems in an urban set-up conforms to the standards fixed based on sustainability requirements. It is important to note that the objectives of the three dimensions to achieve sustainability standards are conflictive in nature. Thus, the desired outcome is an optimal trade-off necessitating effective transactions among these three dimensions. For example, economic sustainability needs increased energy consumption, social sustainability requires this to benefit the poor at affordable prices whereas environmental sustainability demands a reduction in energy consumption. A possible solution, though a difficult one, could be energy production from renewable energy systems in a distributed mode with government support. However, for an effective transaction among these dimensions of sustainability there is a need for access to efficient and effective institutional and governance systems (private as well as public). These systems have to perform the functions of governance, regulation, implementation, production, distribution, management, monitoring, etc. Thus, in the present study, we have used four dimensions to assess the sustainability of the urban systems. The indicators developed for measuring the sustainability of an urban system are grouped into the following four dimensions –
Economic Sustainability—The indicators under this dimension capture the current as well as dynamic economic strength of an urban system.

SANEI Working paper Series 38 No: 13 – 02
Social Sustainability—The indicators under social dimension map the extent of equitable distribution of the benefits of economic development to the people.
Environmental Sustainability—The indicators under this dimension attempt to assess the conformation of the economic development to environmental standards.
Institutional/Governance Sustainability—The indicators measure the extent and effectiveness of institutions in creating opportunities like employment, financial resources, community services, government support, etc.
4.3 CATEGORIES OF SUSTAINABILITY
The four sustainability dimensions represent different aspects of a typical urban system and a significant number of indicator variables are necessary to measure their extent. In other words, these dimensions constitute large number of representative indicators belonging to different groups of indicators. Thus, at next level of classification of indicators, we have developed representative set of categories under each dimension. These indicators represent different aspects of sustainability and contribute collectively to measure it. Further, all the categories belonging to a dimension collectively measure the extent of sustainability reached by that dimension. Finally, collectively, all the four dimensions measure the extent or magnitude of sustainability of a given urban system.
The prioritization of categories of urban sustainability indicators has been made with the support of literature and logical assessment (Silverio and Jesús 2010, Stewart 2010, GCIF 2011, UNHABITAT 2009, Lynch et al, 2011, Shen 2011, Marzukhi et al, 2011, Natalie 2011, Matthew and Giles 2010, Peter 2009, Theo and Frank 2007, Peter 2005, Zainuddin 2005, Alberti 1996, Shu-Li 1998, Voula 1998). This process facilitated short-listing of 25 categories of indicators under four dimensions of sustainability.
(a) Economic Sustainability: Income: Indicators belonging to this category measure the current status of
the economic achievements of an urban system or a city. Growth/Development: The dynamics of economic progress by capturing
the growth potential, capacity to grow, etc. Consumption: Quantity and quality of consumption of livelihood and
lifestyle goods and services. Infrastructure, Services and Urban Equipment: Availability of good and
adequate infrastructure (roads, schools, hospitals, banks, etc.). Transportation: Mobility through efficient transport systems provides
access to employment, markets, education/health facilities, etc.
(b) Social Sustainability: Demographics: Indicators related to gender composition, children, youth,
population growth and density, etc., capture important aspects of social empowerment.
Education: Facilitates knowledge empowerment and better decisions. Health: Physical empowerment. Equity: Distributive justice Poverty: Ability to enjoy the benefits of economic progress. Housing quality: One more aspect of social empowerment and status. Safety: Social security. Access to basic needs: Extent of poverty and living standards.
SANEI Working paper Series 39
No: 13 – 02
(c) Environmental Sustainability: The following categories of indicators determine the extent of environmental
sustainability achieved by the urban systems. Most of the categories do not need additional explanation. With respect to categories related to consumption of energy resources/carriers, water and raw material, the indicators are likely to capture the negative impact on the environment due to uncontrolled consumption.
Global Climate Change Air Pollution Soil Pollution Water Pollution Urban green spaces Land-use pattern Energy Consumption Water consumption Raw material consumption
(d) Institutional/Governance Sustainability: As explained earlier, the institutional and governance dimensions constitute
categories of indicators that capture the effectiveness of institutions in the public and private sectors to manage, monitor and support the transactions among the three dimensions of sustainability.
Government: Indicators capturing the effectiveness of governance, support, etc.
Banking: Access to and adequacy of financial services. Industry: Extent of industrialization and access to employment.
4.4 INDICATORS OF URBAN SUSTAINABILITY
The next step in finalising the indicator sets for developing urban sustainability index for an urban system is prioritization of representative indicator variables for each of the categories under the four dimensions. Again with the support of extensive literature review, discussions with experts and logical analysis, the final list of indicator variables is derived (Silverio and Jesús 2010, Stewart 2010, GCIF 2011, UNHABITAT 2009, Lynch et al, 2011, Shen 2011, Marzukhi et al, 2011, Natalie 2011, Matthew and Giles 2010, Peter 2009, Theo and Frank 2007, Peter 2005, Zainuddin 2005, Alberti 1996, Shu-Li 1998, Voula 1998). The following criteria were used for prioritizing the indicators:
The indicator should be representative of the category and dimension to which it belongs.
The relationship between the indicators and the categories/dimensions are easily deducible.
It should be easily quantifiable and observable. The required data for quantifying indicators is accessible and available.
The final lists of sustainability indicators for different dimensions and categories are given in Tables 4.1–4.4 which show adequate numbers of indicators for each of the sustainability categories. A total of 56 indicators are used for representing the economic dimension of urban sustainability (Table 4.1). Similarly, the social dimension of urban sustainability is represented by 52 indicators (Table 4.2), the environmental dimension by 42 indicators (Table 4.3) and Institutional and Governance dimension by 13 indicators

SANEI Working paper Series 40 No: 13 – 02
(Table 4.4). Thus a total of 163 indicators are used for assessing the sustainability of urban system. All the indicators are self-explanatory. Some indicators contribute positively to the urban sustainability and others negatively. In terms of magnitude of the indicator values, the contribution of positive indicators to sustainability will increase with increase in their values and vice versa. In the case of negative indicators, the contribution to sustainability will decrease with increase in value. For example, with increase in per capita income there will be an increase in economic sustainability. On the other hand, any increase in the value of CO2 emissions per person will cause decrease in environmental sustainability.
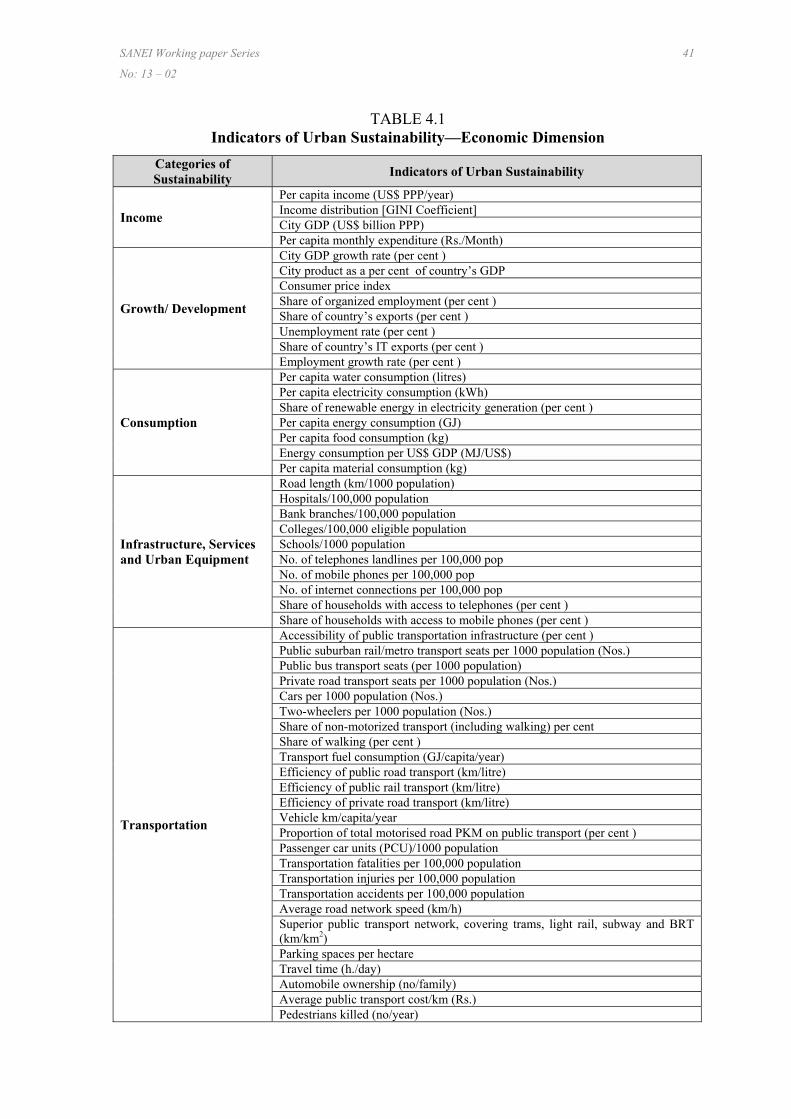
SANEI Working paper Series 41
No: 13 – 02
TABLE 4.1 Indicators of Urban Sustainability—Economic Dimension
Categories of Sustainability
Indicators of Urban Sustainability
Income
Per capita income (US$ PPP/year) Income distribution [GINI Coefficient] City GDP (US$ billion PPP) Per capita monthly expenditure (Rs./Month)
Growth/ Development
City GDP growth rate (per cent ) City product as a per cent of country’s GDP Consumer price index Share of organized employment (per cent ) Share of country’s exports (per cent ) Unemployment rate (per cent ) Share of country’s IT exports (per cent ) Employment growth rate (per cent )
Consumption
Per capita water consumption (litres) Per capita electricity consumption (kWh) Share of renewable energy in electricity generation (per cent ) Per capita energy consumption (GJ) Per capita food consumption (kg) Energy consumption per US$ GDP (MJ/US$) Per capita material consumption (kg)
Infrastructure, Services and Urban Equipment
Road length (km/1000 population) Hospitals/100,000 population Bank branches/100,000 population Colleges/100,000 eligible population Schools/1000 population No. of telephones landlines per 100,000 pop No. of mobile phones per 100,000 pop No. of internet connections per 100,000 pop Share of households with access to telephones (per cent ) Share of households with access to mobile phones (per cent )
Transportation
Accessibility of public transportation infrastructure (per cent ) Public suburban rail/metro transport seats per 1000 population (Nos.) Public bus transport seats (per 1000 population) Private road transport seats per 1000 population (Nos.) Cars per 1000 population (Nos.) Two-wheelers per 1000 population (Nos.) Share of non-motorized transport (including walking) per cent Share of walking (per cent ) Transport fuel consumption (GJ/capita/year) Efficiency of public road transport (km/litre) Efficiency of public rail transport (km/litre) Efficiency of private road transport (km/litre) Vehicle km/capita/year Proportion of total motorised road PKM on public transport (per cent ) Passenger car units (PCU)/1000 population Transportation fatalities per 100,000 population Transportation injuries per 100,000 population Transportation accidents per 100,000 population Average road network speed (km/h) Superior public transport network, covering trams, light rail, subway and BRT (km/km2) Parking spaces per hectare Travel time (h./day) Automobile ownership (no/family) Average public transport cost/km (Rs.) Pedestrians killed (no/year)

SANEI Working paper Series 42 No: 13 – 02
TABLE 4.2 Indicators of Urban Sustainability—Social Dimension
Categories of Sustainability Indicators of Urban Sustainability
Demographics
City population (million) Children as per cent of population Youth as per cent of population Seniors (65 years and above) as per cent of population Gender ratio (Females/1000 males) Child sex ratio Literacy rate (per cent ) Male literacy (per cent ) Female literacy (per cent ) Number of houses/1000 population Population growth rate (per cent /annum) Population density (persons/sq.km) Average household size (no) Slum population (per cent of total) Migration rate (per cent )
Education
per cent of students completing primary and secondary education per cent of students completing secondary education per cent of students completing primary education Mean years of schooling (years) School enrolment rate (No) Expected years of schooling (years) Literacy rate (per cent ) Teachers in govt. schools (per 100 students)
Health
Number of hospital beds per 10,000 population Number of physicians per 10,000 population Number of nursing personnel per 100000 population Life expectancy at birth (years) Adolescent fertility rate Maternal mortality rate (per 100,000 pop) Birth rate (births/1,000 population) Death rate Infant mortality Malnourished children under five (no/1000) Child mortality rate (no/1000)
Equity
Households below poverty line (per cent ) per cent of HH with access to water per cent of HH with access to sanitation per cent of women councillors
Poverty
Minimum wage (Rs./month) Share of people with unhealthy living conditions per cent of poor without electricity per cent of poor with LPG connection
Housing quality Average household size (sq.m) Share of population living in pucca (permanent) houses
Safety Number of police officers per 100,000 population Number of fire fighters per 100000 population Crime rate per 100000 population
Access to basic needs (energy, water, sanitation)
Share of pucca houses per cent of HH having piped water connection Households with electricity connection (per cent ) HH with LPG connection (per cent ) Population with access to sanitation (per cent )

SANEI Working paper Series 43
No: 13 – 02
TABLE 4.3 Indicators of Urban Sustainability—Environmental Dimension
Categories of Sustainability Indicators of Urban Sustainability
Global Climate Change CO2 emissions per person [tonne per capita] GHG emission/city GDP (kg/US$ PPP)
Air Pollution SO2 emissions (μg/m3)
NO2 emission (μg/m3) PM10 emission (μg/m3)
Soil pollution
Per capita solid waste (kg/cap/year) Average cost of waste disposal (Rs./tonne) Sewage disposal (per cent ) Wet waste per capita (kg/person/day) per cent of solid waste recycled Dry waste capita (kg/cap/day) Biodegradable waste (per cent )
Water pollution
Waste water per capita (Litres/cap) Share of treated water (per cent ) Share of population with access to treated water (per cent ) Water system leakage (per cent of total) Cost of wastewater treatment (Rs./kl) Share of waste water treated (per cent )
Urban green spaces Green spaces/person (m2) Area of green cover (sq.m/1000 population)
Land use pattern Share of green space (per cent ) Share of area used for roads (per cent ) Share of residential area (per cent )
Energy Consumption
Electricity consumption per capita (kWh) LPG/Gas consumption/capita (kg) Diesel consumption/capita (litre/year) Petrol consumption/capita (litre/year) Biomass use/capita Kerosene/capita Share of income spent on energy Electricity price (US Cents/kWh) LPG price (Rs/kg.) T&D losses (per cent )
Water consumption
per cent of population with potable water supply service Share of houses with sources of water within the premises Consumption of water (l/day/person) Piped water supply reliability (no. of hours of supply/day) per cent of HH having piped water connection Price of water (RS./kl)
Raw materials consumption Per capita raw material consumption Share of recycled material

SANEI Working paper Series 44 No: 13 – 02
TABLE 4.4 Indicators of Urban Sustainability—Institutional/Governance Dimension
Categories of sustainability Indicators of urban sustainability
Government
Total expenditure per capita Revenue generation per capita No. of councillors per 1000 population Voter participation rates by men Voter participation rates by women Share of salaries in budget Voter turnout (per cent ) Per-capita capital expenditure
Banking Accounts per 1000 population Bank turnover per 1000 population
Industry SMEs per 1000 population Large industries per 1000 population Industry value added per capita
4.5 QUANTIFYING INDICATORS OF URBAN SUSTAINABILITY
As explained in Chapter 2, the proposal is to assess how the mega cities in India perform against sustainability yardstick. In other words, the objective is to compare Indian mega cities with a sustainability benchmark established using prioritized and classified list of indicators as explained above. We have chosen two mega cities—Mumbai, already a mega city and Bangalore, an emerging mega city for evaluation. The first step in the process of benchmarking these two cities for sustainability is to gather the required data for quantifying all the prioritized indicators. The data were gathered mainly from secondary sources of information (NUMBEO 2012, Samuel et al 2012, World atlas 2012, UNHABITAT 2012, Bangalore Census 2011, BBMP 2011, BRSIPP 2011, Chaudhuri 2011, John 2011, Rode and Kandt 2011, Siemens 2011, TERI 2011a, WHO, 2011, Anonymous 2010, Edward 2010, Mahendra et al 2010, Singh 2010, UNHABITAT 2010, GOK 2009, PWC 2009, World Bank 2009, UNHABITAT 2009, Chanakya et al, 2008, Gopakumar 2008, Sitharam 2008, Sekher et al 2008, UNHABITAT 2008). Even after spending significant efforts and time for collecting relevant data, we were not able to get data for all the indicator variables. Finally, we could collect data on 48 indicators under economic dimension (original list 56), 45 under social dimension (original 52), 36 under environmental dimension (original 42) and 6 under institutional/governance dimension (original 13). Thus, we have gathered data for both Mumbai and Bangalore cities on a total of 135 sustainability indicators (Tables 4.5–4.8).

SANEI Working paper Series 45
No: 13 – 02
TABLE 4.5 Quantifying indicators of urban sustainability—Economic dimension
Categories of sustainability
Indicators of urban sustainability Mumbai Bangalore
Income
Per capita income (US$ PPP/year) 10,885 10,247 Income distribution [GINI coefficient] 0.35 0.32 City GDP (US$ billion PPP) 209 83 Per capita monthly expenditure (Rs./Month) 1800 2721
Growth/ Development
City GDP growth rate (per cent ) 6.3 6.5 City product as a per cent of country’s GDP 5.76 2.29 Consumer price index 37.33 31.96 Share of organised employment (per cent ) 35 31 Share of exports 14 2.22 Unemployment rate (per cent ) 17 14 Share of IT exports (per cent ) 2.1 6.22 Employment growth rate (per cent ) 2.9 6.12
Consumption
Per capita water consumption (litres) 208 129 Per capita electricity consumption (kWh) 1600 1576 Share of renewable energy in electricity generation (per cent ) 21 61 Energy consumption per US$ GDP (MJ/US$) 6.5 4.6
Infrastructure, Services and Urban Equipment
Road length (km/1000 population) 0.102 0.65 Hospitals/100,000 population 12.1 13.4 Bank branches/100,000 population 7.9 17 Colleges/100,000 eligible population 8.5 21.21 Schools/1000 population 0.125 0.521 No. of telephones landlines per 100,000 pop 12973 10,823 No. of mobile phones per 100,000 pop 7070 6777 No. of internet connections per 100,000 pop 1040 3847 Share of households with access to telephones (Landline) 38.2 24.1 Share of households with access to mobile phones 83 82.8
Transportation
Accessibility of public transportation infrastructure (per cent ) 88 46 Public suburban rail/metro transport seats (per 1000 population)
4.1 0
Public bus transport seats (per 1000 population) 28.2 35 Para-Public (Auto, Taxi, Maxicabs) transport seats (per 1000 population)
8.6 352
Private Road Transport seats (per 1000 population) 6.5 10 Cars per 1000 population 26.5 47 Two-wheelers per 1000 population 49.1 258 Share of non-motorized transport (including walking) 33 38 Share of walking (per cent ) 27 34 Transport fuel consumption (GJ/capita/year) 0.92 2.78 Vehicle km/capita/year 1064 1259 Proportion of total motorised road PKM on public transport (per cent )
65.5 72.2
Passenger car units (PCU)/1000 population 47.7 195.8 Transportation fatalities per 100,000 population 3.29 9.4 Transportation injuries per 100,000 population 32.1 70.0 Transportation accidents per 100,000 population 155 84.9 Average road network speed (km/h) 23 27 Superior public transport network , covering trams, light rail, subway and BRT (km/km2)
0 0
Travel time (hrs/day) 1.8 0.5 Automobile ownership (no/family) 0.36 1.7 Average public transport cost/km (Rs.) 0.5 15.6 Pedestrians killed (no/year) 350 348

SANEI Working paper Series 46 No: 13 – 02
TABLE 4.6 Quantifying indicators of urban sustainability—Social dimension
Categories of sustainability
Indicators of urban sustainability Mumbai Bangalore
Demographics
City population (million) 19.2 8.1 Children as per cent of population 8.34 10.31 Youth as per cent of population 62.8 64.2 Seniors (above 65 years) as per cent of population 6.4 5.4 Gender ratio (females/1000 males) 810 922 Child sex ratio 910 941 Literacy rate (per cent ) 82.5 88.48 Male literacy 87.9 91.82 Female literacy 72.8 84.8 Number of houses/1000 population 237 317 Population growth rate (per cent /annum) 1.13 3.25 Population density (persons/sq.km) 35400 17,723 Average household size (no) 4.5 3.24 Slum population (per cent of total) 58.2 10 Migration rate (per cent ) 17 13.4
Education
Per cent of students completing primary and secondary education
83 83
Per cent of students completing secondary education
83 82
Per cent of students completing primary education 88 89 School enrolment rate (No) 95.25 97 Literacy rate (per cent ) 82.5 88.48 Teachers in govt. schools (per 100 students) 2.5 5
Health
Number of hospital beds per 10,000 population 19.2 22 Number of physicians per 10,000 population 5.4 5 Life expectancy at birth (years) 71 70 Adolescent fertility rate 45.9 3.5 Maternal mortality rate (per 100,000 pop) 63 125 Birth rate (births/1,000 population) 13.8 27 Death rate 6.9 7.2 Infant mortality 34.6 31 Child mortality rate (no/1000) 40 54.7
Equity Households below poverty line (per cent ) 20 18 Per cent of HH with access to water 98.4 99.2 Per cent of HH with access to sanitation 52 95.9
Poverty
Minimum wage (Rs./month) 3600 5044 Share of people with unhealthy living conditions 48 1.09 per cent of poor without electricity connection 3.2 1.4 per cent of poor with LPG connection 68.5 75.9
Housing quality Share of population living in pucca (permanent) houses
46 61
Safety Number of police officers per 100,000 population 140 283 Crime rate per 100000 population 440 318
Access to basic needs (energy, water, sanitation)
Share of pucca houses (per cent ) 38 61 per cent of HH having piped water connection 69 79.00 Households with electricity connection (per cent ) 98 98.6 HH with LPG connection (per cent ) 65 75.9 Population with access to sanitation (per cent ) 49 94.82

SANEI Working paper Series 47
No: 13 – 02
TABLE 4.7
Quantifying indicators of urban sustainability—Environmental dimension
Categories of sustainability
Indicators of urban sustainability Mumbai Bangalore
Global Climate Change
CO2 emissions per person [tonne per capita] 1 0.5 GHG emission/city GDP (kg/US$ PPP) 0.092 0.049
Air Pollution SO2 emissions (μg/m3) 34 15.1 NO2 emission (μg/m3) 86 41 PM10 emission (μg/m3) 132 90
Soil pollution
Per capita solid waste (kg/cap/year) 209 266.5 Average cost of waste disposal (Rs/tonne) 1600 1450 Sewage disposal (per cent ) 51 40 Wet waste per capita (kg/person/day) 0.243 0.176 Per cent of solid waste that is recycled 32.4 80 Dry waste capita (kg/cap/day) 0.027 0.082 Biodegradable waste (per cent ) 37 76
Water pollution
Waste water per capita (Litre/cap) 150 95 Share of treated water (per cent ) 89 70 Share of population with access to treated water (per cent )
87.5 66.56
Water system leakage (per cent of total) 13.6 39 Cost of wastewater treatment (Rs/kl) 24,000 41,194 Share of waste water treated (per cent ) 67.6 42.4
Urban green spaces Green spaces/person (m2) 6.6 41 Area of green cover (sq.m/1000 population) 30.6 23171
Land use pattern Share of green space (per cent ) 35.6 28.83 Share of area used for roads (per cent ) 9.5 24.3 Share of residential area (per cent ) 36.2 40.4
Energy Consumption
Electricity consumption per capita (kWh) 1600 1576 LPG/gas consumption/capita (kg) 32.3 30 Diesel consumption/capita (l/year) 12.3 57.9 Petrol consumption/capita (l/year) 15.9 39.4 Electricity price (US Cents/kWh) 7.2 9.6 LPG price (Rs/kg.) 28 30 T&D losses (per cent ) 5.3 9.02
Water consumption
Per cent of population with potable water supply service
97.6 94.8
Share of houses with sources of water within premises
68 76
Consumption of water (l/day/person) 208 129 Piped water supply reliability (no. of hours of supply/day)
7 4
per cent of HH having piped water connection 69 79.00 Price of water (Rs./kl) 2.25 6
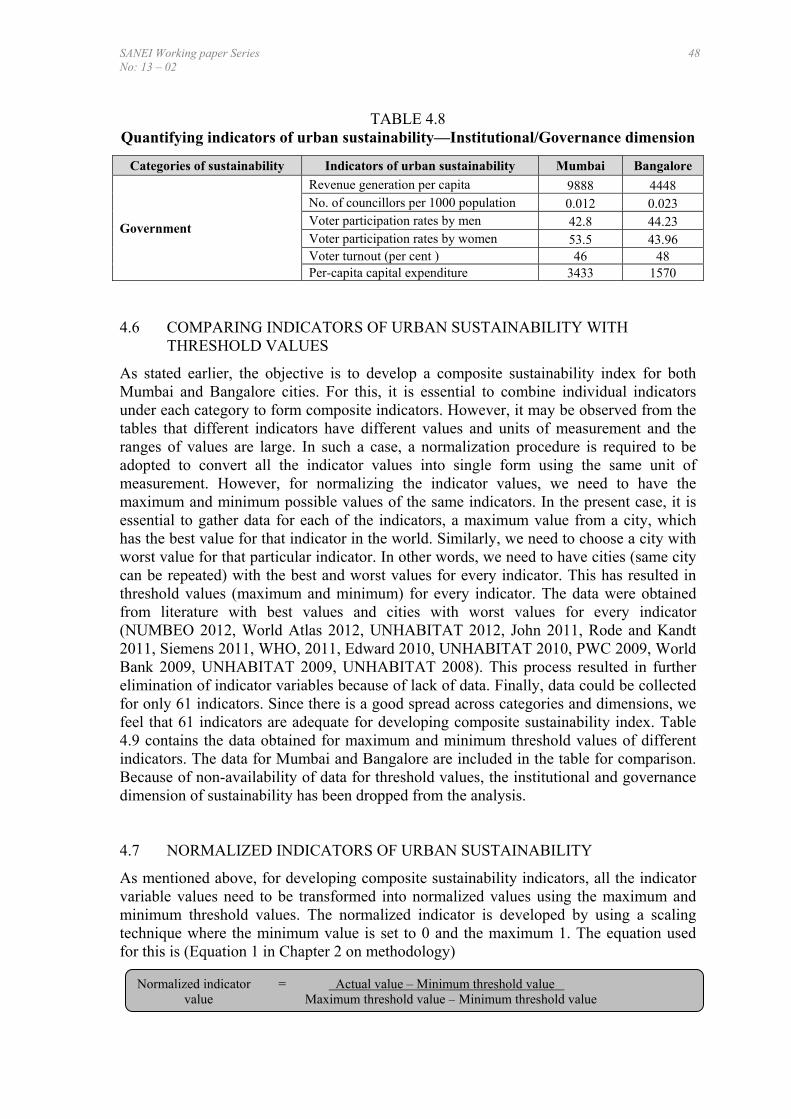
SANEI Working paper Series 48 No: 13 – 02
TABLE 4.8 Quantifying indicators of urban sustainability—Institutional/Governance dimension
Categories of sustainability Indicators of urban sustainability Mumbai Bangalore
Government
Revenue generation per capita 9888 4448 No. of councillors per 1000 population 0.012 0.023 Voter participation rates by men 42.8 44.23 Voter participation rates by women 53.5 43.96 Voter turnout (per cent ) 46 48 Per-capita capital expenditure 3433 1570
4.6 COMPARING INDICATORS OF URBAN SUSTAINABILITY WITH
THRESHOLD VALUES
As stated earlier, the objective is to develop a composite sustainability index for both Mumbai and Bangalore cities. For this, it is essential to combine individual indicators under each category to form composite indicators. However, it may be observed from the tables that different indicators have different values and units of measurement and the ranges of values are large. In such a case, a normalization procedure is required to be adopted to convert all the indicator values into single form using the same unit of measurement. However, for normalizing the indicator values, we need to have the maximum and minimum possible values of the same indicators. In the present case, it is essential to gather data for each of the indicators, a maximum value from a city, which has the best value for that indicator in the world. Similarly, we need to choose a city with worst value for that particular indicator. In other words, we need to have cities (same city can be repeated) with the best and worst values for every indicator. This has resulted in threshold values (maximum and minimum) for every indicator. The data were obtained from literature with best values and cities with worst values for every indicator (NUMBEO 2012, World Atlas 2012, UNHABITAT 2012, John 2011, Rode and Kandt 2011, Siemens 2011, WHO, 2011, Edward 2010, UNHABITAT 2010, PWC 2009, World Bank 2009, UNHABITAT 2009, UNHABITAT 2008). This process resulted in further elimination of indicator variables because of lack of data. Finally, data could be collected for only 61 indicators. Since there is a good spread across categories and dimensions, we feel that 61 indicators are adequate for developing composite sustainability index. Table 4.9 contains the data obtained for maximum and minimum threshold values of different indicators. The data for Mumbai and Bangalore are included in the table for comparison. Because of non-availability of data for threshold values, the institutional and governance dimension of sustainability has been dropped from the analysis. 4.7 NORMALIZED INDICATORS OF URBAN SUSTAINABILITY
As mentioned above, for developing composite sustainability indicators, all the indicator variable values need to be transformed into normalized values using the maximum and minimum threshold values. The normalized indicator is developed by using a scaling technique where the minimum value is set to 0 and the maximum 1. The equation used for this is (Equation 1 in Chapter 2 on methodology)
Normalized indicator = Actual value – Minimum threshold value value Maximum threshold value – Minimum threshold value
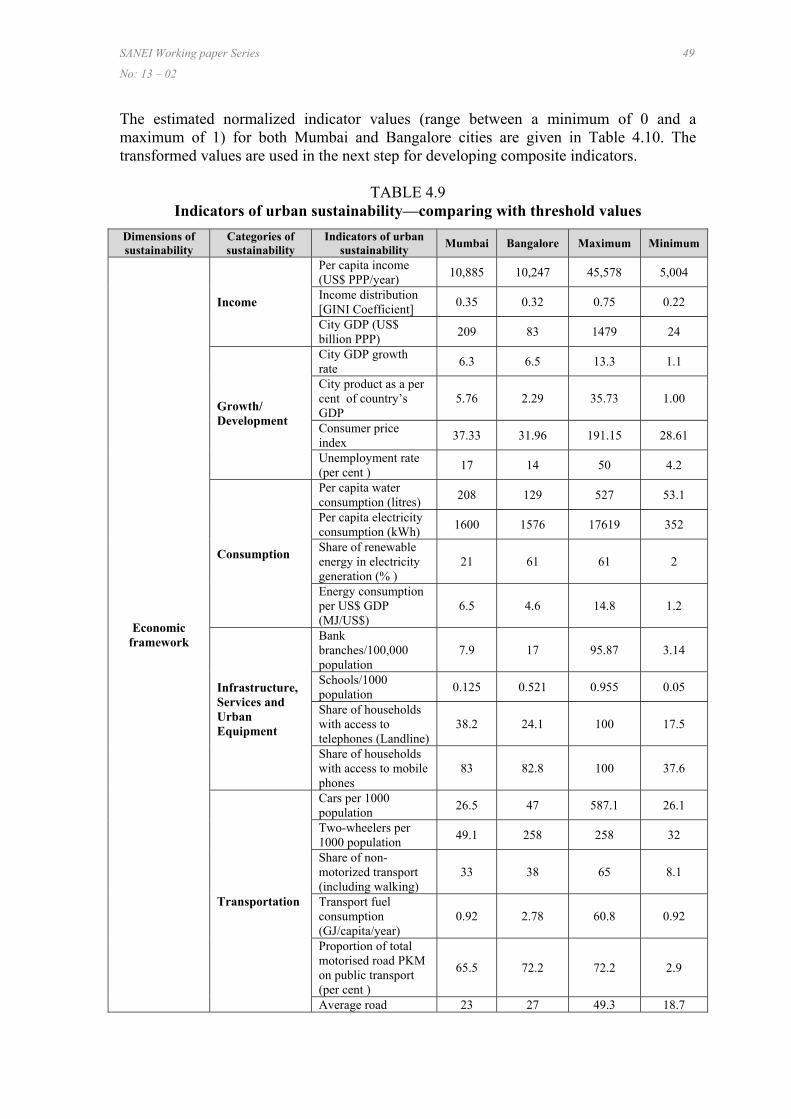
SANEI Working paper Series 49
No: 13 – 02
The estimated normalized indicator values (range between a minimum of 0 and a maximum of 1) for both Mumbai and Bangalore cities are given in Table 4.10. The transformed values are used in the next step for developing composite indicators.
TABLE 4.9 Indicators of urban sustainability—comparing with threshold values
Dimensions of sustainability
Categories of sustainability
Indicators of urban sustainability
Mumbai Bangalore Maximum Minimum
Economic framework
Income
Per capita income (US$ PPP/year)
10,885 10,247 45,578 5,004
Income distribution [GINI Coefficient]
0.35 0.32 0.75 0.22
City GDP (US$ billion PPP)
209 83 1479 24
Growth/ Development
City GDP growth rate
6.3 6.5 13.3 1.1
City product as a per cent of country’s GDP
5.76 2.29 35.73 1.00
Consumer price index
37.33 31.96 191.15 28.61
Unemployment rate (per cent )
17 14 50 4.2
Consumption
Per capita water consumption (litres)
208 129 527 53.1
Per capita electricity consumption (kWh)
1600 1576 17619 352
Share of renewable energy in electricity generation (% )
21 61 61 2
Energy consumption per US$ GDP (MJ/US$)
6.5 4.6 14.8 1.2
Infrastructure, Services and Urban Equipment
Bank branches/100,000 population
7.9 17 95.87 3.14
Schools/1000 population
0.125 0.521 0.955 0.05
Share of households with access to telephones (Landline)
38.2 24.1 100 17.5
Share of households with access to mobile phones
83 82.8 100 37.6
Transportation
Cars per 1000 population
26.5 47 587.1 26.1
Two-wheelers per 1000 population
49.1 258 258 32
Share of non-motorized transport (including walking)
33 38 65 8.1
Transport fuel consumption (GJ/capita/year)
0.92 2.78 60.8 0.92
Proportion of total motorised road PKM on public transport (per cent )
65.5 72.2 72.2 2.9
Average road 23 27 49.3 18.7

SANEI Working paper Series 50 No: 13 – 02
network speed (km/h) Superior public transport network , covering trams, light rail, subway and BRT (km/km2)
0 0 0.55 0
Social framework
Demographics
City population (million)
19.2 8.1 32.45 4.796
Seniors (65 years) as per cent of population
6.4 5.4 20.4 5.4
Gender ratio (Females/1000 males)
810 922 1176 734
Population growth rate (per cent /annum)
1.13 3.25 11.4 0.29
Population density (persons/sq.km)
35400 17,723 43079 1700
Education
per cent of students completing primary and secondary education
83 83 100 56
School enrolment rate (No)
95.25 97 100 45
Literacy rate (per cent )
82.5 88.48 100 22
Health
Number of hospital beds per 10,000 population
19.2 22 137 3
Number of physicians per 10,000 population
5.4 5 42 3
Life expectancy at birth (years)
71 70 83.75 48.69
Maternal mortality rate (per 100,000 pop)
63 125 540 25
Birth rate (births/1,000 population)
13.8 27 50.06 6.85
Death rate 6.9 7.2 17.23 1.55 Infant mortality 34.6 31 61.27 2.65
Equity
Households below poverty line (per cent )
20 18 70 3.8
Per cent of HH with access to water
98.4 99.2 100 40
Per cent of HH with access to sanitation
52 95.9 100 25
Safety Number of police officers per 100,000 population
140 283 558 55
Access to basic needs (energy, water, sanitation)
per cent of HH having piped water connection
69 79.00 100 26
Households with electricity connection (per cent )
98 98.6 100 86.3
Population with access to sanitation
49 94.82 100 12
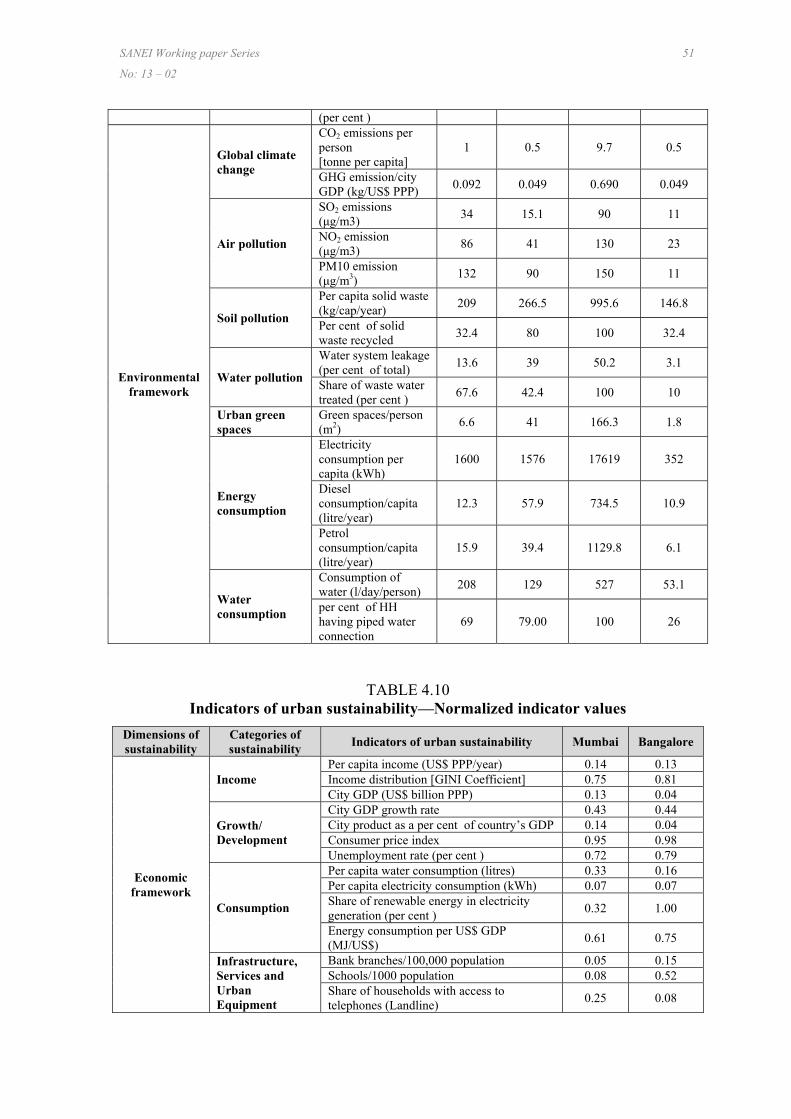
SANEI Working paper Series 51
No: 13 – 02
(per cent )
Environmental framework
Global climate change
CO2 emissions per person [tonne per capita]
1 0.5 9.7 0.5
GHG emission/city GDP (kg/US$ PPP)
0.092 0.049 0.690 0.049
Air pollution
SO2 emissions (μg/m3)
34 15.1 90 11
NO2 emission (μg/m3)
86 41 130 23
PM10 emission (μg/m3)
132 90 150 11
Soil pollution
Per capita solid waste (kg/cap/year)
209 266.5 995.6 146.8
Per cent of solid waste recycled
32.4 80 100 32.4
Water pollution
Water system leakage (per cent of total)
13.6 39 50.2 3.1
Share of waste water treated (per cent )
67.6 42.4 100 10
Urban green spaces
Green spaces/person (m2)
6.6 41 166.3 1.8
Energy consumption
Electricity consumption per capita (kWh)
1600 1576 17619 352
Diesel consumption/capita (litre/year)
12.3 57.9 734.5 10.9
Petrol consumption/capita (litre/year)
15.9 39.4 1129.8 6.1
Water consumption
Consumption of water (l/day/person)
208 129 527 53.1
per cent of HH having piped water connection
69 79.00 100 26
TABLE 4.10 Indicators of urban sustainability—Normalized indicator values
Dimensions of sustainability
Categories of sustainability
Indicators of urban sustainability Mumbai Bangalore
Economic framework
Income Per capita income (US$ PPP/year) 0.14 0.13 Income distribution [GINI Coefficient] 0.75 0.81 City GDP (US$ billion PPP) 0.13 0.04
Growth/ Development
City GDP growth rate 0.43 0.44 City product as a per cent of country’s GDP 0.14 0.04 Consumer price index 0.95 0.98 Unemployment rate (per cent ) 0.72 0.79
Consumption
Per capita water consumption (litres) 0.33 0.16 Per capita electricity consumption (kWh) 0.07 0.07 Share of renewable energy in electricity generation (per cent )
0.32 1.00
Energy consumption per US$ GDP (MJ/US$)
0.61 0.75
Infrastructure, Services and Urban Equipment
Bank branches/100,000 population 0.05 0.15 Schools/1000 population 0.08 0.52 Share of households with access to telephones (Landline)
0.25 0.08

SANEI Working paper Series 52 No: 13 – 02
Share of households with access to mobile phones
0.73 0.72
Transportation
Cars per 1000 population 0.00 0.04 Two-wheelers per 1000 population 0.08 1.00 Share of non-motorized transport (including walking)
0.44 0.53
Transport fuel consumption (GJ/capita/year) 0.00 0.03 Proportion of total motorised road PKM on public transport (per cent )
0.90 1.00
Average road network speed (km/h) 0.14 0.27 Superior public transport network (km/km2) 0.00 0.00
Social framework
Demographics
City population (million) 0.52 0.12 Seniors (above 65 years) as per cent of population
0.93 1.00
Gender ratio (females/1000 males) 0.17 0.43 Population growth rate (per cent /annum) 0.92 0.73 Population density (persons/sq.km) 0.19 0.61
Education
per cent of students completing primary and secondary education
0.61 0.61
School enrolment rate (No) 0.91 0.95 Literacy rate (per cent ) 0.78 0.85
Health
Number of hospital beds per 10,000 population
0.12 0.14
Number of physicians per 10,000 population 0.06 0.05 Life expectancy at birth (years) 0.64 0.61 Maternal mortality rate (per 100,000 pop) 0.93 0.81 Birth rate (births/1,000 population) 0.84 0.53 Death rate 0.66 0.64 Infant mortality 0.45 0.52
Equity Households below poverty line (per cent ) 0.76 0.79 Per cent of HH with access to water 0.97 0.99 Per cent of HH with access to sanitation 0.36 0.95
Safety Number of police officers per 100,000 population
0.17 0.45
Access to basic needs (energy, water, sanitation)
Per cent of HH having piped water connection
0.58 0.72
Households with electricity connection (per cent )
0.85 0.90
Population with access to sanitation (per cent )
0.42 0.94
Environmental framework
Global climate change
CO2 Emissions per person [tonne per capita]
0.95 1.00
GHG emission/city GDP (kg/US$ PPP) 0.93 1.00
Air pollution SO2 emissions (μg/m3) 0.71 0.95 NO2 emission (μg/m3) 0.41 0.83 PM10 emission (μg/m3) 0.13 0.43
Soil pollution Per capita solid waste (kg/cap/year) 0.93 0.86 per cent of solid waste recycled 0.00 0.70
Water pollution Water system leakage (per cent of total) 0.78 0.24 Share of waste water treated (per cent ) 0.64 0.36
Urban green spaces
Green spaces/person (m2) 0.03 0.24
Energy consumption
Electricity consumption per capita (kWh) 0.93 0.93 Diesel Consumption/capita (litre/year) 1.00 0.94 Petrol consumption/capita (litre/year) 0.99 0.97
Water consumption
Consumption of water (l/day/person) 0.67 0.84 per cent of HH having piped water connection
0.58 0.72

SANEI Working paper Series 53
No: 13 – 02
4.8 COMPOSITE INDICATOR VALUES OF DIFFERENT CATEGORIES AND DIMENSIONS OF SUSTAINABILITY
The next step is to derive the composite indicator values for different categories of sustainability from appropriate indicators belonging to that particular category. Further, these category-wise indicator values are used for developing composite indicator values for various dimensions of sustainability. In this case, the composite category-wise indices are computed as the root mean square of the normalized or relative indicator variables belonging to that particular category. Similarly, composite dimension indices are computed as the root mean square of the composite indicator values of categories belonging to that particular dimension. The equation (2) given in Chapter 2 on methodology is used for developing composite indicators. where, dj = Dimension or category of type “j” Vij = Variables or categories “i” belonging to category or
dimension “j”, i = 1, 2, …., I I = Number of variables in a dimension
The category- and dimension-wise composite sustainability indicator values, estimated using the above equation, are presented in Table 4.11.
First, the composite indicators are estimated for each category of sustainability under three dimensions (Table 4.11). In the next step, the category-wise composite indicator values are used for developing composite indicator values for different dimensions. We observe from Table 4.11 that Bangalore city appears to perform better than Mumbai City in most categories of sustainability indicators. In other words, this observation suggests that Bangalore is more sustainable compared to Mumbai over most category-wise composite sustainability indicators. Under economic dimension, Bangalore is more sustainable compared to Mumbai with respect to all the categories, the differences being more significant with respect to indicator categories like consumption and transportation. In Social dimension, Bangalore’s conformity to sustainability is higher than that of Mumbai with regard to all categories of sustainability indicators expect health. Under environmental dimension, the status remains the same except for categories like water pollution and energy consumption. In these two categories of sustainability indicators, Mumbai outperforms Bangalore (Table 4.11).
0.5

SANEI Working paper Series 54 No: 13 – 02
TABLE 4.11 Composite indicators of urban sustainability
Dimensions of sustainability
Categories of sustainability
Composite indicator values (categories)
Composite indicator values (dimensions)
Mumbai Bangalore Mumbai Bangalore
Economic Framework
Income 0.450 0.475
0.459 0.567
Growth/Development 0.635 0.666 Consumption 0.383 0.631 Infrastructure, Services and Urban Equipment
0.388 0.454
Transportation 0.384 0.580
Social Framework
Demographics 0.642 0.649
0.630 0.724
Education 0.777 0.816 Health 0.613 0.535 Equity 0.741 0.910 Safety 0.169 0.453 Access to basic needs (energy, water, sanitation)
0.644 0.857
Environmental Framework
Global Climate Change 0.939 1.000
0.671 0.722
Air pollution 0.479 0.770 Soil pollution 0.655 0.785 Water pollution 0.712 0.305 Urban green spaces 0.029 0.238 Energy consumption 0.844 0.823 Water consumption 0.629 0.780
Composite Urban Sustainability Index (USI)
0.594 0.675
The good performance of Bangalore in category-wise sustainability indicators naturally gets translated into good performance even in the case of dimension-wise sustainability. Bangalore is thus more sustainable compared to Mumbai with respect to all the three dimensions; economic, social and environmental (Table 4.11). With respect to economic sustainability, Bangalore City has an indicator value of 0.567 compared to 0.459 for Mumbai. Similarly, in the case of social sustainability, Bangalore has a value of 0.724 compared to Mumbai’s 0.630. Finally, with respect to environmental sustainability, Bangalore has a value of 0.722 and Mumbai 0.671. In dimensions of sustainability, Mumbai obtains a high value for environmental sustainability whereas Bangalore has a high value for social sustainability. It may be appropriate to reiterate here that these indicator values fall between the range of 1 indicating the highest sustainability and 0 indicating the least sustainability. 4.9 DEVELOPING A COMPOSITE USI
The next logical step in indicator analysis for benchmarking urban sustainability is to develop a composite USI. This provides a single number (within the range of 0 and 1) for comparing the level of sustainability reached by a city or an urban system. The USI is developed using the composite indicator values (Table 4.11) of above three dimensions that are assumed to contribute to the issue of urban sustainability. The modified equation that is used for developing USI is as follows:
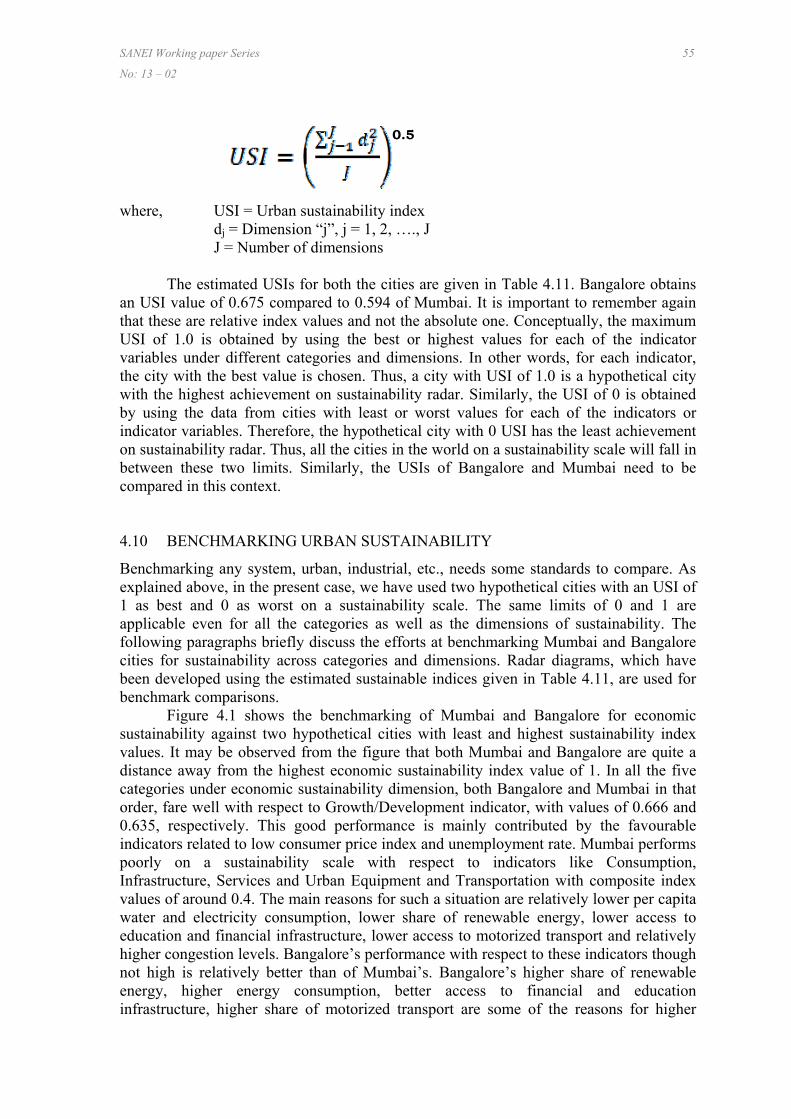
SANEI Working paper Series 55
No: 13 – 02
where, USI = Urban sustainability index dj = Dimension “j”, j = 1, 2, …., J J = Number of dimensions
The estimated USIs for both the cities are given in Table 4.11. Bangalore obtains an USI value of 0.675 compared to 0.594 of Mumbai. It is important to remember again that these are relative index values and not the absolute one. Conceptually, the maximum USI of 1.0 is obtained by using the best or highest values for each of the indicator variables under different categories and dimensions. In other words, for each indicator, the city with the best value is chosen. Thus, a city with USI of 1.0 is a hypothetical city with the highest achievement on sustainability radar. Similarly, the USI of 0 is obtained by using the data from cities with least or worst values for each of the indicators or indicator variables. Therefore, the hypothetical city with 0 USI has the least achievement on sustainability radar. Thus, all the cities in the world on a sustainability scale will fall in between these two limits. Similarly, the USIs of Bangalore and Mumbai need to be compared in this context. 4.10 BENCHMARKING URBAN SUSTAINABILITY
Benchmarking any system, urban, industrial, etc., needs some standards to compare. As explained above, in the present case, we have used two hypothetical cities with an USI of 1 as best and 0 as worst on a sustainability scale. The same limits of 0 and 1 are applicable even for all the categories as well as the dimensions of sustainability. The following paragraphs briefly discuss the efforts at benchmarking Mumbai and Bangalore cities for sustainability across categories and dimensions. Radar diagrams, which have been developed using the estimated sustainable indices given in Table 4.11, are used for benchmark comparisons.
Figure 4.1 shows the benchmarking of Mumbai and Bangalore for economic sustainability against two hypothetical cities with least and highest sustainability index values. It may be observed from the figure that both Mumbai and Bangalore are quite a distance away from the highest economic sustainability index value of 1. In all the five categories under economic sustainability dimension, both Bangalore and Mumbai in that order, fare well with respect to Growth/Development indicator, with values of 0.666 and 0.635, respectively. This good performance is mainly contributed by the favourable indicators related to low consumer price index and unemployment rate. Mumbai performs poorly on a sustainability scale with respect to indicators like Consumption, Infrastructure, Services and Urban Equipment and Transportation with composite index values of around 0.4. The main reasons for such a situation are relatively lower per capita water and electricity consumption, lower share of renewable energy, lower access to education and financial infrastructure, lower access to motorized transport and relatively higher congestion levels. Bangalore’s performance with respect to these indicators though not high is relatively better than of Mumbai’s. Bangalore’s higher share of renewable energy, higher energy consumption, better access to financial and education infrastructure, higher share of motorized transport are some of the reasons for higher
0.5
SANEI Working paper Series 56 No: 13 – 02
indicator values. Both Mumbai and Bangalore are at the same level with respect to indicator on income sustainability.
FIGURE 4.1 Benchmarking Economic Sustainability
The next dimension used for benchmarking is social sustainability (Figure 4.2). Mumbai and Bangalore have similar sustainability index values with respect to demographics, education and health. With index values of 0.78 and 0.74 respectively for education and equity categories, Mumbai city compares favourably with the benchmark sustainability index value of 1 for these two categories. Bangalore performs even better with 0.82 and 0.91 index values for these two categories. Even with respect to access to basic needs Bangalore with an index value of 0.86 is close to the sustainability benchmark. These indicate that both Mumbai and Bangalore have better performance with respect to the chosen social sustainability indicators. The main reasons for this good performance are the relatively high values obtained for indicators related to longevity, population growth rate, literacy rate, maternal mortality rate, access to potable water, access to basic needs, etc. However, Mumbai has a very low index value of less than 0.2 for safety, which is captured through availability of adequate number of police officers.

SANEI Working paper Series 57
No: 13 – 02
FIGURE 4.2 Benchmarking Social Sustainability
Figure 4.3 shows the comparison of the composite environmental sustainability index values Mumbai and Bangalore with benchmark sustainability value. Compared to economic and social sustainability index values, Mumbai City performs better with respect to environmental sustainability dimension. Especially, the index values for climate change, energy consumption and water pollution are relatively high. Availability of urban green spaces in Mumbai is extremely low as indicated by a low index value of 0.03 and compared it Bangalore has a value of 0.24 (Figure 4.2). Bangalore city does well with respect to environmental sustainability. It has obtained high index value of about 0.8 for climate change, air pollution, soil pollution, energy consumption and water consumption. In regard to indicators related to water pollution and urban green spaces, Bangalore has low values. Overall, both Bangalore and Mumbai compare favourably with environmental sustainability benchmark.
FIGURE 4.3 Benchmarking Environmental Sustainability

SANEI Working paper Series 58 No: 13 – 02
Finally, the composite index values of the dimensions of economic, social and environmental sustainability are compared with the benchmark index values (Figure 4.4). For this comparison, we have included London City in addition to Indian mega cities of Mumbai and Bangalore. London City derives its the composite sustainability index values for economic, social and environmental dimensions from similar index values published in the UN HABITAT’s report on “State of the World’s Cities 2012-2013—Prosperity of Cities” (UNHABITAT 2012). The report contained the city prosperity index values for major cities of the world developed using various dimensions like productivity, quality of life, infrastructure development, equity and social inclusion and environmental sustainability. We have used these dimension index values for deriving the composite sustainability index values for London. Figure 4.4 shows the comparison of all the three cities with the benchmark index values. Among the three cities, London is the most sustainable with respect to all the three dimensions followed by Bangalore and Mumbai in that order. For all the three cities, the index values for economic sustainability are the least.
FIGURE 4.4 Benchmarking Urban Sustainability
Finally, the USI is compared for all the three cities (Figure 4.5). As with individual dimension index values, the rank order remain the same for the USIs too.

SANEI Working paper Series 59
No: 13 – 02
FIGURE 4.5 Comparing USI
CHAPTER 5
DISCUSSION AND CONCLUSIONS 5.1 INTRODUCTION
There is a growing concern world-wide that increasing urbanisation and the related environmental impacts are posing new challenges to the stakeholders—governments, policy makers, industries, service providers, users and the public. With limited resource availability, these problems are becoming more widespread and the approaches to tackle them are becoming complex. There is an urgent need to develop new approaches which should be based on integrated policy and planning mechanisms involving all the stakeholders. This will result in clear policy goals and strategies which can support new ways of thinking that results in sustainable urban systems. The present study is an attempt to lay the basis to achieve that goal through the development and use of indicators belonging to economic, environmental and social dimensions of sustainability to establish the baseline status of sustainability of an urban system. It should be emphasised here that indicators are effective when they are developed as a part of the overall policy and planning process. They facilitate comparisons among urban regions world-wide across time periods for a given city and comparison with a benchmark city. However, it should be recognized that it is difficult to develop common indicators which are universally applicable and measurable. Nevertheless, providing a basis for developing indicators and a framework for the comparison is essential. There is also a need to monitor the progress of these indicators over time.
In this study, we have discussed elaborately an attempt at developing indicators of sustainability for two mega cities, namely, Mumbai and Bangalore with an objective of developing an urban sustainability baseline. In the next step, this baseline sustainability status for the two cities was compared with a sustainable benchmark hypothetical city developed using threshold index values. The following sections present the summary of this effort and some important findings as well as a few inputs for policy formulation. 5.2 SUMMARY
As explained elaborately earlier, the study was conducted with the following specific objectives: (i) developing sustainable urban indicator variables spanning all the relevant sectors of a typical mega city, (ii) developing a benchmark indicator-base for a sustainable city, (iii) similarly develop the indicator database for Mumbai and Bangalore cities, (iv) comparing and evaluating the indicator data with the benchmark indicator database using a “gap analysis” approach, and (v) suggesting appropriate policy measures and implementation strategies to bridge the identified gaps to attain the goal of sustainable urban system.
The study began with the prioritization of indicators that are relevant for measuring urban sustainability under different categories as well as dimensions of sustainability. Based on literature, four dimensions of urban sustainability—economic sustainability, social sustainability, environmental sustainability and institutional/governance sustainability—were used. The prioritization was made on the basis of literature review, logical assessment and data availability. In the next step, for the prioritized indicators, values were obtained from secondary sources for both the cities. In the third step, to develop a sustainability benchmark, the threshold values (maximum and

SANEI Working paper Series 61
No: 13 – 02
minimum) for prioritized indicators were generated. In the fourth step, the composite sustainability index values, category- and dimension-wise, were developed. Finally, the USI for both the cities were developed and compared with the benchmark USI. The results presented in the study provide a snapshot of the state of un-sustainability prevailing in the chosen cities.
As the study shows, there are interactions among economic activity, social empowerment and environmental development, and understanding this relationship is essential. It is important to monitor the feedback and status of these relationships in the interest of resource use and its impact on the urban economy and environment. Indicators can give guidance for such efforts. Basically, the study outlines the steps of an approach to develop indicators for urban regions considering the challenges of scale, capacity, data comparability and reliability. This approach can be extended to other urban centres based on consensus around basic objectives (founded on basic needs), core and optional questions recognizing the unique nature of the urban region and geographic location and the need to monitor the activities.
Measuring the sustainability of urban regions poses many challenges. It includes the processes of identification and collection of data which is valid, reliable and comprehensive. In some cases the data may not be readily available and the activities of identifying and collecting it constitute no small task. The collection and organisation of information in a way that is valid, efficient and meets the growing needs for comparable data across cities to address the sustainability issues are the major challenges. The generation of and access to information requires significant commitment of resources, coordination of efforts and collaboration among agencies and organizations at various levels. The next problem is of interpreting indicators and drawing conclusions from them for effective use in decision-making processes. It is important to note that the data for basic indicators may already be available in some form but for some (especially for interventions) a new indicator development process is required. In order to be comprehensive in the approach and allow indications of status across the world, it is necessary to be flexible about the way the data are collected.
Regarding the approach to be adopted, in general, it is based on the understanding of what constitutes a sustainable city. Studies suggest that the most beneficial approach may be the one which is based on the measurement of resource use and its impacts (water use, energy use, air pollution, etc.) and incorporate the metabolism approach without converting everything into a single unit of land. The results presented in this study provide a snapshot of the state of un-sustainability as well as the targets to be reached, and do not recognise the efforts to move towards sustainability. This is an issue one has to keep in mind. If the concepts discussed in this study were applied to other cities, what could it mean for their progress in terms of sustainability? It is difficult to be certain of the answer, particularly in regard to the sustainability indicator measurement because the choice of indicators will clearly influence the results.
In order to manage issues pertaining to economic, environmental and social development more effectively, decision-makers should develop and use appropriate indicators, so that the information provided and analysed in this study would become useful and meaningful for policy and planning at various levels. In this regard there is an urgent need to harmonize indicator development initiatives at all levels—local, national and global.
SANEI Working paper Series 62 No: 13 – 02
5.3 IMPORTANT FINDINGS
Mumbai has reached a stage in its evolution where 35 per cent of its territory is developed. Consequently, it is becoming crucial for Mumbai to incorporate renewable and sustainable development in all areas of its planning. Since one third of Mumbai’s land dedicated to forests, better records of biodiversity and ecosystems need to be kept to track biodiversity change. Mumbai is one of the few cities with a substantial use of public transport. In Bangalore, the use of public transport has decreased continuously since 1990 and its present share is only 20 per cent. The indicator of energy consumption seems quite coherent with increase in the use of private transport. Mumbai has a high population density as well as 35 per cent of its total land area has already been developed. These two factors combined lead to a lowered standard of living. Bangalore cannot sustain its population’s needs for water. Only 20 per cent of its water comes from local water catchment areas. Mumbai’s water consumption is slightly higher than that of Bangalore. The indicator on waste management reveal an insignificant rate of reuse and recycling in both Mumbai and Bangalore despite the former having introduced pioneering recycling schemes. The social indicator, particularly for Mumbai, reveals that nearly half of the population suffers from various degrees of exclusion (housing, water, energy). In unemployment, Mumbai has a high rate of 17 per cent and Bangalore 14 per cent.
As explained earlier, the benchmarking of Mumbai and Bangalore for urban sustainability was done by comparing the sustainability index values obtained for these two cities with two hypothetical cities with the least and the highest sustainability index values. Some important observations from the analysis are as follows.
With index values of 0.46 and 0.57 for economic sustainability both Mumbai and Bangalore respectively have occupied a lower position on urban sustainability scale when compared with the benchmark value of 1.0. Bangalore is better than Mumbai in this regard. The main reasons for this are lower sustainability scores obtained by both cities for indicators related to income, infrastructure and transportation.
With respect to social sustainability, both Mumbai and Bangalore have bettered their performance with index values of 0.63 and 0.72, respectively. This relatively better performance is due to high scores obtained for sustainability indicators like education, equity and access to basic needs. The results suggest that both the cities can further improve their social sustainability index values by focusing on issues related safety of citizens and development of the health infrastructure.
In relation to economic and social sustainability index values, both the cities perform slightly better with respect to environmental sustainability. The index values of 0.67 and 0.72, respectively, for Mumbai and Bangalore reflect this, and are relatively high because of better sustainability scores for indicators related to climate change, energy consumption and soil pollution. The very low score for urban green spaces is one of the contributors for lowering the environmental sustainability index values for both the cities. Individually, Bangalore has low sustainability scores for water pollution and Mumbai scores low on air pollution. Both the cities need to make targeted interventions with respect to indicator categories where they have got low normalised scores.

SANEI Working paper Series 63
No: 13 – 02
5.4 IMPLEMENTING THE BENCHMARK INITIATIVE
Chapter 4 presented benchmark values and comparisons between Mumbai and Bangalore, and those of London. The next step is to use the comparative analysis and develop appropriate benchmarks for each city. Establishing a benchmarking initiative should reflect the desired policy objectives and include only relevant indicators. The first step towards any meaningful benchmarking is to have a thorough understanding of the performance of a city. This not only involves comparison with other cities but also an understanding of changes in the performance of the city itself (economic, environmental, social and governance) during the past years. In terms of external comparison, it is important to choose an appropriate urban region that clearly has a better performance in the dimensions that are investigated. It is therefore logical that the benchmarking of Mumbai and Bangalore has been done using a peer city (London) in Europe.
Having a specific target sets a clear direction for the city. Hence, one of the first steps towards establishing benchmarking targets is to have strong policy commitment and a clear vision to achieve improvement strategies. Therefore, the target performance or benchmark level is decided based on a combination of: (i) the city’s current performance and its desired position in the future; and (ii) the background of the city in terms of future objectives for public policies regarding urban renewal. Of course, depending on the resource availability, and the time-frame, one may accept a lower performance level than the target. Therefore a future target should be set on the basis of practical incremental improvements (Theuns et al., 2011). Benchmarking can only be successful if it becomes a continued process of measurement and reporting against the set targets. Apart from obvious progress in monitoring that takes place, it will also ensure that the overall outcomes progress in a desired direction. Having continuous measurement and reporting in mind should also help set the expectations in terms of the scope and magnitude of the benchmarking framework. Experience shows that the best approach would be to start with a small set of indicators and increase them over time keeping in mind the marginal benefits and costs of such additions. 5.5 INPUTS FOR POLICIES
In order to manage issues pertaining to economic, environmental and social development more effectively, decision-makers should develop and use appropriate indicators, so that the information provided and analysed in this or similar studies would become useful and meaningful for policy and planning at various levels.
The city administration needs to develop an integrated policy and legislative framework that will facilitate the implementation of programmes towards advancing sustainability. The roles and responsibilities of each stake holder should be clarified to enhance the provision of basic services such as water and sanitation in areas within the municipalities and beyond the municipal boundaries also. The coordination among inter-governmental agencies and alignment of various development programmes will improve the implementation in key areas such as poverty reduction, employment generation and reduction in environment pollution. Programme-level indicators for implementing sustainable development projects are important in improving urban sustainability. These could include: renewable energy programmes, green building programmes and urban organic farming programmes. Indicators should therefore address the linkage among various dimensions of sustainability, viz., economy, society and the environment.
SANEI Working paper Series 64 No: 13 – 02
The macro-economic and environmental policies will need to support local policies in establishing small businesses and skills development programmes that match market needs. It is important that the government takes a leading role in providing basic services rather than relying on the private sector. This will enable basic services at prices affordable to the poor.
While selected indicators should describe the existing state of urban systems and show undesirable trends, indicators should include policy implementation indicators to assess whether programmes are effective in improving the quality of life of the inhabitants. The indicators need to be reviewed periodically to align them with the evolving urban system and used to inform new policies and programmes where required. It is important that urban regions innovate and evolve. To make that transition successful, the city administration needs to work with a wide array of stakeholders from business, labour and philanthropy
There is also a need to develop feedback indicators which help in resource conservation. For example, introducing green buildings regulations help in reducing the amount of energy and materials used in construction. A public forum should be established to develop a clear vision and plan for implementing sustainable development programmes. The forum should consist of representatives from local communities, professionals, technical and social groups, including youth, women and disadvantaged groups of the population. Active participation of policy makers in this forum is critical to enable linkage of indicators to policies and corrective measures. The forum should focus on issues that it can control or influence and agree on what indicators are required to monitor sustainability. The involvement of technical experts after the indicators have been identified is crucial to advise whether the indicators are practical, suitable, and measurable. The form can improvise the list of indicators, policy prescriptions and corrective measures through workshops and awareness campaigns.
Institutional arrangements for effective coordination and implementation of action plans among local, municipal, state and central government departments, private sector, civil society and the local communities need to be developed. The creation of such institutional mechanisms will improve knowledge on challenges facing cities and for capacity building that will be useful in improving urban management and decision making processes. For this reason government officials across various departments as well as representatives from local community, private companies, academia and NGOs should be involved in decision-making processes that influence urban sustainability.
At the municipality level, effective coordination and institutional alignment is important at ward and sub-council levels and also needs the active participation of communities in planning, policy development and implementation. This should be supported by allowing municipalities to exercise control of their budget allocations.
Sustainability issues are inherently interconnected, and any approach that needs implementation requires the administration to think across various sectors, viz., housing, transportation, education and workforce, and energy policy and act collaboratively to construct feasible sustainability plans. Finally, to achieve sustainability a common commitment and effort to cooperate on initiatives must be adopted. This commitment must include the enhancement of capacities of the stakeholders and the political will to monitor and act on these issues to ensure a common minimal standard of global urban sustainability.

SANEI Working paper Series 65
No: 13 – 02
5.6 CONCLUSIONS
The study involving two urban regions, viz., Mumbai and Bangalore and London as a comparator demonstrated the value of benchmarking to obtain a better understanding of the practical and data-related aspects of benchmarking. The study demonstrated the value of these comparisons in the context of four dimensions—economic, environmental, social and governance. Although it is not an in-depth research of the urban performance in Indian cities, it is a relatively quick demonstration, by using the existing data sets that benchmarking can be an effective tool in identifying areas for improvement.
The use of indicators for assessing urban sustainability performance is an important tool and is being adopted widely in recent times. Even though various indicators have been selected and applied, the final goal is the same, to attain urban sustainability. It must be noted that the selection of indicators should be done with the clear understanding of the needs where these are going to be applied. Initially, a short list of indicators is recommended and later more indicators can be added or eliminated depending on emerging needs. There is an urgent need to harmonize indicator development initiatives at all levels—local, national and global. Many studies have explored the potential of various urban regions to achieve sustainability and indicator-base can be used for tracking such progress and setting targets.
Institutional innovations and indicators are needed to provide fertile ground for socio-economic improvements and creativity. All actors have a major role to play in this process. It involves establishing a sense of urgency, developing a vision and strategy, communicating the vision of change and proposing new measures for evaluating progress. They must proceed with empowering people for broad-based action, winning short-term goals, consolidating gains, producing more changes and anchoring new changes in the life style of the inhabitants. Urban regions need paradigm shifts towards a new economic, political and socio-environmental equilibrium. Bibliography
Abhishek, A. (2012a), Citizen Matters, 50% women councillors in BBMP help Bengaluru, http://bangalore.citizenmatters.in/articles/view/4162-will-50-women-councillors-in-bbmp-help-bengaluru
Abhishek, A. (2012b), Citizen Matters, http://bangalore.citizenmatters.in/articles/view/4321-cauvery-is-too-far
Adikeshavalu, R. (2004), Evaluation Capacity Development: An Assessment of the Impact of Bangalore Citizen Report Cards on the Performance of Public Agencies. http://siteresources. worldbank.org/EXTEVACAPDEV/Resources/4585672-1251461875432/ecd_wp_12.pdf.
Agarwal, O.P. (2006), Urban Transport, http://www.iitk.ac.in/3inetwork/html/reports/IIR2006/ Urban%20Transport.pdf.
Alberti, M. (1996), Measuring Urban Sustainability, Environmental Impact Assessment Rev., 16 (4–6), pp 381–423, ftp://colbun.utalca.cl/redcauquenes/Papers/measuring%20urban% 20sustainability.pdf.
Alshuwaikhat, H.M. and Nkwenti, D.I. (2002), Developing Sustainable Cities in Arid Regions, Cities, Vol. 19, No. 2, pp. 85–94.
Ambiente Italia,(2003), ‘European common indicators—towards a local sustainability profile’, Final Project Report, Ambiente Italia Research Institute, Milano, Italy, May.
Amna, S. and Salman, Q. (2005), Indicators of sustainable urban development: A review of urban regeneration projects in Karachi, Pakistan, http://www.herodot.net/conferences/ayvalik/ papers/geog-04.pdf.

SANEI Working paper Series 66 No: 13 – 02
Angel, D.P. and Rock, M.T. (2001), Policy Integration: Environment and Development in Asia. United States–Asia Environmental Partnership, Asia Policy Network II, Technical area: Environmental and Economic Growth Linkages, March.
Anonymous (2010), Mumbai Human Development Report 209, Oxford University Press, New Delhi, http://mhupa.gov.in/W_new/Mumbai%20HDR%20Complete.pdf
Anon (2000), Selected Papers from the Quebec City Consensus Conference on Environmental Health Indicators, Canadian Journal of Public Health, Vol. 93, Sept-Oct.
Anon, (2003), Report of the Montreal urban indicators system project, The Woodcock Foundation, November.
Anon, (2006), Urban Explosion: the facts, New Internationalist, January.
Anon, (2008), Sustainable Energy Planning Office report on Model for Sustainable Urban Design With Expanded Sections on Distributed Energy Resources
Anon, (2010), Revised Land use Plan, Mumbai Metropolitan Regional Development Authority, Mumbai. http://www.regionalplan-mmrda.org
Anon, (2004), Working Group on Urban Design for Sustainability, Final Report on Urban Design For Sustainability European Union Expert Group on the Urban Environment, January.
Andre Nickl, (2008), A thesis on Urban Sustainability in the Global South and the Role of Integrated Transport Solutions—Experiences from Latin America with a Focus on Chile’s TranSantiago School of Geography, Environment and Earth Sciences June.
Asnani, P.U. (2010), Solid Waste Management, http://environmentclearance.nic.in/ writereaddata/Form-1A/HomeLinks/TGM_%20Comman%20Municipal%20Sold%20Waste% 20Management_160910_NK.pdf.
Aumnad Phdungsilp, (2006), Licentiate Thesis, Department of Energy Technology, Royal Institute of Technology, Stockholm, Sweden.
Balachandra, P. and Chanakya, H.N. (2009), “Sustainability Proofing of Energy Technologies”,
UK-India Sustainable Energy Technologies Conference”, 9–10 September, University of Nottingham, Nottingham, UK.
Balachandra, P., (2009), “Access to Modern Energy Services: A case of Bangalore City”, Regional Workshop on Urban Energy Access and Development in Asia, 4–5 August, Jakarta, Indonesia.
Balachandra, P. and B. Sudhakara Reddy, (2007), “Hydrogen Energy for Indian Transport Sector: A Well-To-Wheel Techno-Economic and Environmental Feasibility Analysis, Discussion Paper No. WP-2007-007, Indira Gandhi Institute of Development Research (IGIDR), Mumbai, 2007, http://www.igidr.ac.in/pdf/publication/WP-2007-004.pdf.
Balachandra, P. and Sudhakar, Y, (2006), “Cleaner Mobility in Urban Area”, Technical Paper, submitted to UNDP, New Delhi, September
BMBF (Federal Ministry of Education & Research) (2004), ‘The urban transition: research for the sustainable development of the megacities of tomorrow’, Division 622 ‘Global Change’, BMBF, Germany.
Boyko, C. T. and Cooper, R., (2011), Clarifying and re-conceptualising density. Progress in Planning, 76 (1), 1–61.
Bulkeley H, (2006), "Urban sustainability: learning from best practice?" Environment and Planning A, 38(6) 1029–1044.
Bangalore Census (2011), Bangalore (Bengaluru) District Census 2011 data, http://www.census2011.co.in/census/district/242-bangalore.html.
Becky, P.Y. (2006), Sustainable Urban Transportation: Concepts, Policies, and Methodologies, http://ascelibrary.org/doi/abs/10.1061/%28ASCE%290733-9488%282006%29132%3A2%2876%29?journalCode=jupddm.
BESCOM (2003), Citizen Report Card on Bescom Services, http://www.citizenreportcard.com/ crc/pdf/Written_Document.pdf.
SANEI Working paper Series 67
No: 13 – 02
Bharath, H. A. and Uttam, K. (2009), Fusion of multi resolution remote sensing data for urban sprawl analysis, http://wgbis.ces.iisc.ernet.in/energy/paper/cosmar09/Fusion%20of%20multi %20resolution%20remote%20sensing.pdf.
Banister, D. (2008), Urban sustainability: Dilemmas, challenges and paradigms, Transport Policy, Vol. 15, pp. 73–80.
BBMP (2011), City Statistics, http://218.248.45.169/download/health/swm.pdf.
Bell, S. G., and Morse, S. (1999), Sustainability indicators: Measuring the immeasurable. London: Earthscan.
Briassoulis, H., (2001), Sustainable development and its indicators: through a (planner’s) glass darkly. Journal of Environmental Planning and Management, 44(3), pp. 409–427.
BRSIPP (2011), Program and Results, http://www.nimhans.kar.nic.in/epidemiology/ bisp/brsipp2011c.pdf.
BS Reporter (2011), City has lowest CO2 emissions, Business Standard, http://www.business-standard.com/india/news/city-has-lowest-co2-emissions/425165/.
Bureau (2012), Financial Express, http://www.financialexpress.com/news/karnataka-increases-power-tariff-by-average-13-paiseunit/943869/.
Chanakya, H.N, Ramachandra, T.V, and Shwetmala, (2008), Towards a sustainable waste management system for Bangalore, http://wgbis.ces.iisc.ernet.in/energy/paper/ wms_for_bangalore/sustainable_waste_management_system_for_Bangalore.pdf.
Chaudhuri, A. (2011), A tale of two cities: How Bangalore is losing out, http://www.iipm.edu/ itt/11-july.html.
Correspondent (2008), Carbon emissions from vehicles in Bangalore alarming: Study, Outlook India, http://news.outlookindia.com/items.aspx?artid=538422.
Correspondent (2012), LPG Price down by Rs. 6.55, Times of India, http://articles.timesofindia. indiatimes.com/2012-07-27/bangalore/32888512_1_lpg-price-domestic-lpg-cylinders-price-dip.
Christopher, T. Boyko, Mark R. Gaterell, Austin R.G. Barber, Julie Brown, John R. Bryson, David Butler (*), Benchmarking sustainability in cities: The role of indicators and future scenarios, Journal of Global Environmental Change-951; pp. 10
Deccan Herald Correspondent (2012), Delhi stands 4th in employment growth in country, Deccan Herald, http://www.deccanherald.com/content/271008/delhi-stands-4th-employment-growth.html.
Deepa, K. (2012), We may be the tech hub, but our residents aren’t that wired, The Hindu, http://www.thehindu.com/news/cities/bangalore/article3751424.ece
Deepti, B and Ankita, D. (2007), Citizens’ Report Cards On Public Services: Bangalore, India, http://internationalbudget.org/library/publications/guides/our-money-our-responsibility/our-money-our-responsibility-part-7/
Dimitra, K. and Roland, K. (2011), Urban sustainability standards: predetermined checklists or adaptable frameworks? Procedia Engineering, Vol. 21, pp 204–211.
Correspondent (2012), New, improved Bangalore coming up near BIA, Daily News and Analysis, http://www.dnaindia.com/bangalore/report_new-improved-bangalore-coming-up-near-bia_1698289.
Edward, L. G. (2010), Making Sense of Bangalore, http://www.google.co.in/url?sa=t&rct=j&q=&esrc=s&source=web&cd=1&ved=0CDIQFjAA&url=http%3A%2F%2Fciteseerx.ist.psu.edu%2Fviewdoc%2Fdownload%3Fdoi%3D10.1.1.180.1358%26rep%3Drep1%26type%3Dpdf&ei=1kW0UIzbM8LprQesjoHYCQ&usg=AFQjCNH9XBZKo_rCKJl1nUwneVLdt4qiwA&sig2=J33QBGfkqP6pz6yxYNMZFw.
Emmanuel Adinyira, Samuel Oteng-Seifah, and TheophilusAdjei-Kumi, 2007, A Review of Urban Sustainability Assessment Methodologies, Paper presented at the International Conference on Whole Life Urban Sustainability and its Assessment, Glasgow.
European Foundation, (1998), European Sustainable Cities and Towns Campaign. Charter of European Cities and Towns: Towards Sustainability, Brussels.

SANEI Working paper Series 68 No: 13 – 02
Fedra, K. (2004), Sustainable Urban Transportation: a model-based approach. Cybernetics and Systems, 35: 455–485.
Gnansounou, E., (2008), “Assessing the energy vulnerability: Case of industrialised countries”, Energy Policy, Vol. 36, pp. 3734-3744.
George, B. (2006), Urban sustainability: Dilemmas, challenges and paradigms, Technology in Society, Vol. 28, pp. 19–26.
Goel (2012), Times Of India, http://mobiletoi.timesofindia.com/mobile.aspx?article=yes& pageid=3§id=edid=&edlabel=TOIBG&mydateHid=10-10-2012&pubname= Times+of+ India+-+Bangalore&edname=&articleid=Ar00300&publabel=TOI
Girardet, Herbert, (2008). Cities People Planet: Urban Development and Climate Change. Second edition, England: John Wiley &Sons Ltd.
Gopakumar, (2008), Bangalore climate change, http://www.authorstream.com/Presentation/ Mertice-36585-Bangalore-climate-change-Gopakumar-Oil-greatest-discovery-ever-Indias-consumption-Bangalores-as-Entertainment-ppt-powerpoint/.
GOK (2009), Bangalore Mobility Indicators 2008, Government of Karnataka, http://www.indiaenvironmentportal.org.in/files/Draft%20Bangalore%20Mobility%20Indicators%202008.pdf.
Gowda, B.N. (2012), Deccan Herald, Karnataka government revises minimum wages, http://www.deccanherald.com/content/100847/karnataka-government-revises-minimum-wages.html
Globe Scan and MRC McLean Hazel, (2010), Megacity Challenges: A stakeholder perspective, Siemens AG Corporate Communications (CC), Munich.
Hardoy, J.E., Mitlin, D. and Satterhwaite, D. (2001), Environmental Problems in an Urbanizing World: Finding Solutions for Cities in Africa, Asia and Latin America.Earthscan, London.
Hippu, S. K and Reddy, B.S. (2011), Urban Transport Sustainability Indicators—Application of Multi-view Black-box (MVBB) framework, http://www.igidr.ac.in/pdf/publication/WP-2011-022.pdf.
Ides Consulting Pvt. Ltd. Bangalore (2005), Policy Paper for Pedestrian Movement in the Bangalore Metropolitan Region, http://www.indiaenvironmentportal.org.in/files/Draft%20 Pedestrian%20Policy%20for%20BMR.pdf.
Hilda LEUNG PuiChing, (2005), A report on Planning For Urban Sustainability: Promoting Integrated Transit-Oriented Development, The Centre of Urban Planning Environment Management, The University of Hong Kong, June.
Hirokazu Kato, Kentaro Jimbo, and Yoshitsugu Hayashi, (2005), A Framework For Benchmarking Environmental Sustainability Of Transport In Asian Mega-Cities, Journal of the Eastern Asia Society for Transportation Studies, Vol. 6, pp. 3241–3249.
Hurley, Joe and Horne, Ralph. (2006) “Review and Analysis of Tools for the Implementation of Sustainable Urban Development,” EIANZ.
Ilektra Kouloumpi, (2012), Rating Energy Sustainability of Urban Communities A comparison of four sustainability assessment tools for urban areas, M.Sc. Thesis, Sustainable Development – Energy and Resources, May. which institution?
International Institute for Sustainable Development, (2005), Sustainable Development Indicators – Proposals for a Way Forward .**
International Institute for Sustainable Development, (2010), ‘Compendium of Sustainability Indicators’, IISD, available at http://www.iisd.org/measure/compendium/searchinitiatives.aspx (accessed on 7 July 2010).
Jesper, O. J. (2009), Sustainability Profile for Urban Districts in Copenhagen, http://vbn.aau.dk/ files/18950039/Sustainable__profile.pdf.
John, D.S. (2011), Vulnerability Assessment of Urban Marginalised Communities: A Pilot study in Bangalore Slum areas,http://www.ced.org.in/docs/inecc/member_reports/VA-rep-urban-marginalised.pdf.

SANEI Working paper Series 69
No: 13 – 02
James, K. (2007), Selecting sustainability indicators for urban energy systems, paper presented at International Conference on “Whole Life Urban Sustainability and its Assessment”, Glasgow.
Jose, I. B. and Luca, D. (2003), Urban sustainability in developing countries’ megacities: modeling and predicting future urban growth in Lagos, Cities, Vol. 20, No. 5, pp 297–310.
Joe Hurley, and Ralph Horne (*), Review and Analysis of Tools for the Implementation and Assessment of Sustainable Urban Development ????
Kari Lautso, Klaus Spiekermann, and Michael Wegener, (2002), Modelling Policies for Urban Sustainability, Paper presented at the 42nd Congress of the European Regional Science Association (ERSA), Dortmund, August 27–31.
Kelkar, U., Balachandra, P. and Gurtoo, A., (2011), “Assessing Indian Cities for Vulnerability to Climate Change”, International Conference on Environmental Science and Development, January 7–9, Mumbai, India,
KSPCB (2011), Karnataka State Pollution Control Board, Annual Report 2009-2010, http://kspcb.gov.in/Anual%20Report%202009-2010.pdf
Klaus, S. and Michael, W. (2003), Modelling Urban Sustainability, International Journal of Urban Sciences, Vol.7, pp 47–64.
Liyin, S., Peng, Xiaoling, Z. and Yuzhe, W. (2011), An alternative model for evaluating sustainable urbanization. Cities, Vol. 29, pp. 32–39.
Lundin, M. and Morrison, G.M. (2002), A life cycle assessment based procedure for development of environmental sustainability indicators for urban water systems, Urban Water, Vol. 4, pp. 145–152.
Lynch, A.J., Andreason, S., Eisenman, T., Robinson, J., Steif, K., and Birch, E.J. (2011), Sustainable Urban Development Indicators for the United States, Report to the Office of
International and Philanthropic Innovation, Office of Policy Development and Research, U.S. Department of Housing and Urban Development, http://penniur.upenn.edu/uploads/ media_items/sustainable-urban-development-indicators-for-the-united-states.original.pdf.
Madhavi, R. (2012), Bangalore costliest Indian city to live in: Survey, Times of India, http://articles.timesofindia.indiatimes.com/2012-03-29/bangalore/31254095_1_mumbai-and-delhi-cities-bangalore-s-cpi.
Mahendra, B., Harikrishnan, K., and Gowda, K. (2010), Urban Governance and Master Plan of Bangalore City, Institute of Town Planners, India Journal Vol. 7, pp 01–18.
Maheshwara, R. (2012), Daily News and Analysis, http://dnasyndication.com/dna/dna_english_ news_and_features/Budget-promises-fine-but-wheres-the-cash-BBMP/DNBAN58185
Manohar, M. (2012), Deccan Herald, Child mortality rate declines in Karnataka, http://www. deccanherald.com/content/37260/ipl-2012.html
Maria Berrini and Lorenzo Bono, Ambiente Italia (2011), Measuring Urban Sustainability, Analysis of the European Green Capital Award 2010 & 2011 application round, Ambiente Italia (research and consultancy, Italy).
Marzukhi, M.A., Dasimah, O., Oliver, L., and Muhammad, S. (2011), Malaysian Urban Indicators Network: A Sustainable Development Initiative in Malaysia, European Journal of Social Sciences, Vol. 25, No 1, pp 77–84.
Matthew, W. and Giles, C. (2010), The CDB Process: Developing and Applying Urban Indicators, http://www2.adb.org/Documents/Books/Cities_Data_Book/03chapter3.pdf?Referer= www.clickfind.com.au.
McGranahan, G., Marcotullio, P.J. and Xuemei Bai et al. (2005), “Urban systems”, in Rashid Hassan, Robert Scholes and Neville Ash (editors), Ecosystems and Human Well-Being: Current Status and Trends, Island Press, Washington DC, pp. 795–825.
McGeough, U., Newman, D. and Wrobel, J., (2004), Model for Sustainable Urban Design, Sustainable Energy Planning Office, Gas Technology Institute. ???

SANEI Working paper Series 70 No: 13 – 02
Maclaren, V., (1996). Developing indicators of urban sustainability: a focus on the Canadian experience. ????
Meera, S. (2008), I Change My City, http://www.ichangemycity.com/node/1264.
Meg, H., Mark, R., Karen, F., and Anthony, P. (2008), Seeking urban sustainability on the world stage, Habitat International, Vol. 32, pp 305–317.
Mega Voula, (2010). Sustainable Cities for the Third Millennium: The Odyssey of Urban Excellence. Springer , September.
Mega Voula, (2005). Sustainable Development, Energy and the City: A civilization of concepts and actions, Springer, New York.
Meg Holden, Mark Roseland, Karen Ferguson, and Anthony Perl, (2008), Seeking urban sustainability on the world stage Habitat International, 32, 305–317.
Miranda, H.F. and Rodrigues, A.F. (2012), Benchmarking sustainable urban mobility: The case of Curitiba, Brazil, Transport Policy, Vol. 21, pp. 141–151.
Moira, L. Z., Thomas, L., Arunprakash, T.K., Ahjond, S.G., Heriberto, C. (2008), A new framework for urban sustainability assessments: Linking complexity, information and policy, Computers, Environment and Urban Systems, Vol. 32, pp. 474–488.
Montgomery, R., Stren, R., Cohen, B., and Reed, H.E., (2003), Cities transformed: demographic change and its implications in the developing world. Washington, DC: The National Academies Press.
Mumford L. (1961), The city in history—its origin, its transformations and its prospects. San Diego: Harcourt, Brace & World , New York. Nanjuddappa (2011), Dr. Nanjundappa's Report,http://planning.kar.nic.in/sites/ planning.kar.nic. in/files/DR_Nanjundappa/
Nancy B Grimm, David Foster, Peter Groffman, J Morgan Grove, Charles S Hopkinson, Knute J Nadelhoffer, Diane E Pataki, and Debra PC Peters, (2008), The changing landscape: ecosystem responses to urbanization and pollution across climatic and societal gradients, Ecol. Environ., 6(5): 264–272.
Natalie, R. (2011), Towards the modeling of sustainability into urban planning: Using indicators to build sustainable cities, Procedia Engineering, Vol. 21, pp. 641–647.
NUMBEO (2012), Cost of Living Index Rate, http://www.numbeo.com/cost-of-living/rankings_ current.jsp.
Odum, (1989), Ecology and our endangered life-support systems, Sinauer Associates, Sunderland, MA. Opschoor and Reijnders, 1991, Towards sustainable development indicators. In: Kuik O,
Peter, N. (2009),Urban Indicators for Managing Cities, http://www.google.co.in/url?sa=t&rct=j&q=&esrc=s&source=web&cd=4&sqi=2&ved=0CEsQFjAD&url=http%3A%2F%2Fciteseerx.ist.psu.edu%2Fviewdoc%2Fdownload%3Fdoi%3D10.1.1.200.4083%26rep%3Drep1%26type%3Dpdf&ei=3Ue0UKnEN8-qrAe_-IGADw&usg=AFQjCNG81tD7q4cdajGkF3w3jJtgxDPFkA&sig2=3zs2jU8t3t2PfUPGr9ukDw.
Peter, H. (2005), Urban Indicators for Asia’s Cities: From Theory to Practice, http://sd-cite.iisd. org/cgi-bin/koha/opac-detail.pl?biblionumber=19660.
Peter, J.M. (2001), Asian urban sustainability in the era of globalization, Habitat International, Vol. 25, pp. 577–598.
Peter, J. M., (2003), “Globalization, urban form and environmental conditions in Asia Pacific cities,” Urban Studies, 40(2): 219–248.
PWC (2009), Which are the largest city economies in the world and how might this change by 2025? PricewaterhouseCoopers UK Economic Outlook November.http://www. ukmediacentre.pwc.com/imagelibrary/downloadMedia.ashx?MediaDetailsID=1562.
Rahul, T.M. and Ashish, V. (2012), Impact of non-motorised transportation in Indian cities, Times of India, http://articles.timesofindia.indiatimes.com/2012-07-12/bangalore/32647505_1 congestion-bangalore-iisc
Rajiv, K. (2012), Times of India, http://articles.timesofindia.indiatimes.com/2012-02-24/ bangalore/31094741_1_fire-stations-fire-safety-measures-fire-tender
SANEI Working paper Series 71
No: 13 – 02
Ramachandra, T. V. and Uttam, K. (2010), Greater Bangalore: Emerging Urban Heat Island, http://www.ces.iisc.ernet.in/energy/paper/Bangalore_heatisland/index.htm
Ramesh, R. (2007), Federalism, Urban Decentralisation and Citizen Participation, http://www. epw.in/governance-and-development-karnataka/federalism-urban-decentralisation-and-citizen-participation.htm.
Richard, D., Sven, S., Jaana, R., James, M., Charles, R., Alejandra, R. (2011), Urban world: Mapping the economic power of cities, http://www.google.co.in/url?sa=t&rct=j&q=&esrc=s&source=web&cd=6&ved=0CE8QFjAF&url=http%3A%2F%2Fstrategy2020.rian.ru%2Fload%2F366074447&ei=sEi0ULTkBNGHrAevrYDgBw&usg=AFQjCNHER4Rqh-y-sxq-TXbd0kmC4Krm0g&sig2=f5hchywa_ A7faaLBQ8y0UQ.
Rode, P. and Kandt, J. (2011), Inequality in Transport Accessibility, Sao Paulo, Istanbul and Mumbai, http://www.tsu.ox.ac.uk/research/uktrcse/UKTRC-w3-prode.pdf.
Rosales, Natalie, Universidad Complutense, (2011), Towards a Design of Sustainable Cities: Incorporating sustainability indicators in urban planning, Procedia Engineering, Vol.21, 641–647.
Roberts, B.K. (1996), Landscape of settlement: prehistory to the present. New York: Routledge.
Shu-Li Huanga, Jui-Hao Wong, Tzy-Chuen Chen, 1998, A framework of indicator system for measuring Taipei's urban sustainability Landscape and Urban Planning, 42, 15–27.
Roy, M., (2009), Planning for sustainable urbanisation in fast growing cities: mitigation and adaptation issues addressed in Dhaka, Bangladesh. Habitat International, 33, pp. 276–286.
Samuel, P. (2005), On Stimulating Citizen Activism, http://www.google.co.in/url?sa=t& rct=j&q=&esrc=s&source=web&cd=1&ved=0CDcQFjAA&url=http%3A%2F%2Fwww.sasanet.org%2Fdocuments%2FCurriculum%2FStrategic%2520Communication%2FSam%2520Paul.doc&ei=2Ui0UMuEBoL5rQe8-4CICQ&usg=AFQjCNEzik-7QSgb4hCbT-9gIGjm6_8uSQ&sig2=6NPgPd2KexF1ti_MN6DL7Q.
Samuel P., Kala S.S., Venugopala, R., Pavan, S. (2012), The State of Our Cities: Evidence from Karnataka. Oxford University Press, New Delhi.
Seabrooke, W., Yeung, S.C.W., Ma, F.M.F and Li, Y. (2004), Implementing sustainable urban development at the operational level (with special reference to Hong Kong and Guangzhou), Habitat International, 28, pp. 443–466.
Sekher, T.V., Ram, Ladusingh, Paswan, B., Sayeed, U., Rajiva, P. (2008), District Level Household Survey, http://www.rchiips.org/pdf/rch3/report/KA.pdf.
Selman, P. (1999), The demography of inter-country adoption, in A. Ryvgold, M. Dalen & B. Saetersdal, Mine – Yours – Ours and Theirs, University of Oslo.
Shen Li Yun, Ochoa, J, Shah M N. and Zhang X, (2011) The application of urban sustainability indicators: A comparison between various practices, Habitat International, 35, 17–29.
Siemens (2011), Asian Green City Index: Assessing the environmental performance of Asia’s major cities, http://www.siemens.com/press/pool/de/events/2011/corporate/2011-02-asia/asian-gci-report-e.pdf.
Siemens (2011), Asian Green City Index: Assessing the environmental performance of Asia’s major cities, http://www.siemens.com/press/pool/de/events/2011/corporate/2011-02-asia/asian-gci-report-e.pdf.
Selva, K.S. (2012), State tops South in infant, mother mortality rate, Deccan Herald, http://www.deccanherald.com/content/273523/state-tops-south-infant-mother.html.
Shen, L., Jorge, J., Mona, N., Shah, B., and Xiaoling, Z. (2011), The application of urban sustainability indicators: A comparison between various practices, Habitat International, Vol. 35, pp. 17–29.
Shu-Li H., Jui, H.W., and Chuen, C. (1998), A framework of indicator system for measuring Taipei's urban sustainability, Landscape and Urban Planning , Vol. 42, pp. 15–27.
Silverio, H.M, and Jesús, D. (2010), Indicators of Urban Sustainability in Mexico, Theoretical and Empirical Researches in Urban Management, Vol. 7(16), http://um.ase.ro/no16/4.pdf.
Singh, D.P. (2010), Employment Situation in Mumbai: An analysis, http://webcache. googleusercontent.com/search?q=cache:VmZvcLQMZKUJ:www.global-labour-

SANEI Working paper Series 72 No: 13 – 02
university.org/fileadmin/GLU_conference_2010/papers/44._Employment_situation_in_MumbaiAn_analysis.pdf+&hl=en&gl=in.
Sitharam, T.G. (2008), A Framework For Achieving Sustainable Urban Mobility, http://cistup.iisc.ernet.in/TGS%20Urban%20mobility%20at%20Malleshwaram%20March%203rd%202012.pdf.
Special Correspondent (2008), The Hindu, http://www.hindu.com/2008/01/25/ stories/ 2008012550140100.htm.
Staff Reporter (2009), The Hindu, BSNL launches prepaid broadband service, http://www.thehindu.com/news/cities/bangalore/bsnl-launches-prepaid-broadband-service/ article37536.ece.
Staff Reporter (2012), The Hindu, http://www.thehindu.com/news/cities/bangalore/ article3579834.ece.
Stewart, S. (2010), Global Sustainable Urban Development Indicators (GDI), http://www.huduser.org/publications/pdf/OECD%20Paris%20Presentation%20SSB%2029Nov2010.pdf.
Subrahmanya, A .T. (2008) ,Courtesy broadband, landlines too in demand, Times of India, http://articles.timesofindia.indiatimes.com/2008-08-25/bangalore/27916333_1_broadband-connections-landline-broadband-plan.
Sudhakara Reddy, B. and Balachandra, P., 2012, “Dynamics of Urban Mobility: A Comparative analysis of megacities of India”, Transport Policy, 21, pp. 152–164.
Sudhir and Sameera (2006), Bangalore: Silicon City or Black City, http://www.bangalured.net/bangalured/Bangalore-Silicon_Capital_or_Black_City.pdf.
Sudhir, G. and Prashant, M. (2005), Congestion to Demotorisation—A Paradigm Shift for Bangalore, http://cleanairinitiative.org/portal/system/files/72398_resource_1.pdf
Swathi Shivanand (2007), Times of India, http://www.hindu.com/2007/01/31/stories/2007013117900300.htm.(chk one part says TOI, and the other links to the Hindu)
Swati, R. (2003), White Paper On Sustainable Urbanization In India, http://www.janaagraha.org/ sites/default/files/Urban_design_in_India.pdf.
Swati, R. (2005), Blueprint For the City Integrated Transport: The Networked City, http://janaagraha.org/sites/default/files/integrated-20transport.pdf.
Tanguay, G. A., Rojaoson, J., Lefebvre, J. F. and Lanoie, P, 2010, Measuring the sustainability of cities: an analysis of the use of local indicators, Ecological Indicators, 10, 407–418.
TERI, 2010, Air quality assessment, emission inventory and source apportionment study for Bangalore city, The Energy Research Institute, New Delhi.
Tanuj, L. (2011), Youth Survey—where is the opportunity for brands, http://www.indiasocial.in/youth-survey-where-is-the-opportunity-for-brands/.
Team DNA (2010), As Bangalore city grows, footpaths shrink,
Daily News and Analysis, http://www.dnaindia.com/bangalore/report_as-bangalore-city-grows-footpaths-shrink_1460934.
TERI (2011a), Air quality monitoring, emission inventory and source apportionment study for Indian cities, http://www.theicct.org/sites/default/files/RHooda_0.pdf.
TERI (2001), Restructuring Options for Urban Public Transport in India, http://www.teriin.org/index.php?option=com_publication&task=details&sid=190.
TERI (2011b), Solar Water heating systems, http://www.teriin.org/ResUpdate/reep/ch_9.pdf.
Terry, M. (2005), Comparing The Cities Database: The Context of The Cities Data Book, http://www2.adb.org/documents/books/cities_data_book/05chapter5.pdf.
Theuns, H., Mohammed, D.E. and Jung, E.O., (2011), A Framework For Urban Transport Benchmarking, The World Bank, Washington D.C.
SANEI Working paper Series 73
No: 13 – 02
Theo, K., Frank, F. (2007), Developing urban Indicators for Managing Mega Cities, http://www.fig.net/pub/fig_wb_2009/papers/urb/urb_2_koetter.pdf.
Thomas, B., Assche, Gert, G. (2011), Unravelling urban sustainability: How the Flemish City Monitor acknowledges complexities, Ecological Informatics (in Press).
Thomas B., and Assche G, (1999), Co-design of Indicators on Urban Sustainable Development, Case Ghent–Belgium, Centre for Sustainable Development, Ghent University
Thomas B, and Assche G, Gert Goeminne (2004), Unravelling urban sustainability. How the Flemish City Monitor acknowledges complexities Ecological Informatics-00255; pp.
UNHABITAT (2012), State of the World’s Cities 2012/2013: Prosperity of Cities, http://www.unhabitat.org/pmss/getElectronicVersion.aspx?nr=3387&alt=1.
Turner II B. L., Clark, W.C., Kates, R.W., Richards, J.F., Mathews, J.T. and Meyer, W.B., (1990), The Earth as Transformed by Human Action: Global and Regional Changes in the Biosphere Over the Past 300 Years. Cambridge University Press with Clark
UNHABITAT (2010), The State of Asian Cities 2010/11, http://www.unescap.org/esd/apuf-5/documents/SACR.pdf.
UN Habitat (2004), State of the World's Cities 2004-05
United Nations Center for Human Settlement, (2004), Urban Indicator Guidelines: Monitoring the Habitat Agenda and Millenium Development Goals, UNCHS, Nairobi.
United States Agency for International Development, (2004), ‘Policy reform lessons learned—ten years of environmentally related policy reform activities in developing countries’, USAID, Washington, DC.
UNPF, (1997), The state of world population 1996: changing places: population, development and the urban future. United Nations Population Fund, New York.
UNHABITAT (2009), Global Urban Indicators – Selected statistics, UN-HABITAT, http://www.unhabitat.org/downloads/docs/global_urban_indicators.pdf.
UNHABITAT (2008), State of the World’s Cities 2010/2011: Bridging the Urban Divide, Earthscan, London, www.unhabitat.org/pmss/getElectronicVersion.aspx?nr=2917&alt=1.
Vasavi, A.R. (2002), Urban Poverty and Basic Education Deprivation, http://www.nias.res.in/ docs/revblore.pdf.
Verbruggen H, In search of indicators of sustainable development. Dordrecht: Kluwer Academic Publications. Year?
Verbruggen and Kuik, (1991), In Search of Indicators of Sustainable Development. Kluwer Academic Publishers, Dordrecht.
Virginia, W. M. (1996), Urban Sustainability Reporting, Journal of the American Planning Association, Vol. 62(2), pp. 184–202.
Voula, M. and Jørn, P. (1998), Urban Sustainability Indicators, http://eurofound.europa.eu/ pubdocs/1998/07/en/1/ef9807en.pdf.
Wei, N.X., Robyn, M.B., and Xuchu, M. (2011), Meeting critical challenges and striving for urban sustainability in China, Landscape and Urban Planning, Vol. 100, pp. 418–420.
WHO (2011), Urban outdoor air pollution database, www.who.int/entity/phe/health_topics/ outdoorair/databases/OAP_database.xls.
World Bank (2009), World Development Indicators 2009, World Bank, Washington, D.C.
Wei-Ning Xiang, Robyn, M.B., Stuber, XuchuMeng (*) Meeting critical challenges and striving for urban sustainability in China Landscape and Urban Planning Chk
Wang, X. and Von Hofe, Rainer (2007). Research Methods in Urban and Regional Planning, Springer Chk
Wong, S.W., Tang, B.S., and Van Horen, B., 2006, Strategic urban management in China: a case study of Guangzhou Development District, Habitat International, 30, pp. 645–667.
World Atlas (2012), Largest Cities of the World, http://www.worldatlas.com/citypops.htm.

SANEI Working paper Series 74 No: 13 – 02
Xuemei, B., Brian, R., and Jing, C. (2010), Urban sustainability experiments in Asia: Patterns and Pathways, Environmental Science & Policy, Vol. 13, pp. 312–32 5.
World Bank, (2008), Exploring Urban Growth Management: Insights from Three Cities, Urban Paper Series. UP-7, Urban Development Unit France.
Xuemei, B, Anna J. Wieczorek, Kaneko, S., Lisson, S. and Contreras, C., (2009), Enabling sustainability transitions in Asia: The importance of vertical and horizontal linkages, Technological Forecasting and Social Change, 76, 255–266.
Xuemei Bai, Brian Roberts, Jing Chen, (2010), Urban sustainability experiments in Asia: patterns and pathways, Environmental Science & Policy, 13, 312–325.
Yangang, X., Malcolm, W.H., Mohamed, A.E., and Jan, B. (2009), A framework model for assessing sustainability impacts of urban development, Accounting Forum, Vol. 33, pp. 209–224.
Yoshitsugu, H. (2008), Mobility for Sustainable Development, Bangalore Case Study, http://www.indiaenvironmentportal.org.in/files/Prof-Hayashi-report-august.pdf.
Zainuddin, B.M. (2005), Development of Urban Indicators: A Malaysian Initiative, http://hornbillunleashed.files.wordpress.com/2012/09/preliminary-blueprint-english.pdf.
Wei, N.X., Robyn, M.B., Xuchu, M. (2011), Meeting critical challenges and striving for urban sustainability in China, Landscape and Urban Planning, Vol. 100, pp 418–420.
WHO (2011), Urban outdoor air pollution database, www.who.int/entity/phe/health_topics/outdoorair/databases/OAP_database.xls.
World Bank (2009), World Development Indicators 2009, World Bank, Washington, D.C.
Wei-Ning Xiang, Robyn M.B. Stuber, Xuchu Meng (*) Meeting critical challenges and striving for urban sustainability in China Landscape and Urban Planning
Wang, X. and Von Hofe, Rainer (2007). Research Methods in Urban and Regional Planning, Springer
Wong, S. W., Tang, B. S., and Van Horen, B, (2006), Strategic urban management in china: a case study of Guangzhou Development District, Habitat International, 30, pp 645-667.
World Atlas (2012), Largest Cities of the World, http://www.worldatlas.com/citypops.htm.
Xuemei, B., Brian, R., Jing, C. (2010), Urban sustainability experiments in Asia: patterns and Pathways, environmental science & policy, Vol. 13, pp 312 – 32 5.
World Bank, (2008), Exploring Urban Growth Management: Insights from Three Cities, Urban Paper Series. UP-7, Urban Development Unit France
Xuemei B, Anna J. Wieczorek, Kaneko S, Lisson S and Contreras C, (2009), Enabling sustainability transitions in Asia: The importance of vertical and horizontal linkages, Technological Forecasting and Social Change, 76, 255–266
Xuemei Bai, Brian Roberts, Jing Chen, (2010), Urban sustainability experiments in Asia: patterns and pathways Environmental Science & Policy 13, 312 – 325
Yangang, X., Malcolm, W.H., Mohamed, A.E., Jan, B. (2009), A framework model for assessing sustainability impacts of urban development, Accounting Forum, Vol. 33, pp 209–224.
Yoshitsugu, H. (2008), Mobility for Sustainable Development Bangalore Case Study, http://www.indiaenvironmentportal.org.in/files/Prof-Hayashi-report-august.pdf.
Zainuddin, B. M. (2005), Development of Urban Indicators: A Malaysian Initiative, http://hornbillunleashed.files.wordpress.com/2012/09/preliminary-blueprint-english.pdf

Bangladesh Institute of Development Studies (BIDS) E-17 Agargaon, Sher-e-Bangla Nagar, Dhaka-1207, Bangladesh
T: +880 2 9118324, F: +880 2 8181237, E: [email protected], W: www.saneinetwork.net
The study has been carried out under the 13th Round of the SANEI
Regional Research Competition (RRC) made possible with a financial grant from the Global Development Network (GDN).