14 BENCHMARKING 2014 A4 Web version
132
Benchmarking Working Europe 2014
-
Upload
independent -
Category
Documents
-
view
0 -
download
0
Transcript of 14 BENCHMARKING 2014 A4 Web version

BenchmarkingWorking Europe2014

Brussels, 2014© Publisher: ETUI aisbl, BrusselsAll rights reservedPrint: Imprimerie Bietlot s.a., B-6060 Gilly
D/2014/10.574/04ISBN: 978-2-87452-307-6 (print version)ISBN: 978-2-87452-308-3 (online version)
The ETUI is financially supported by the European Union. The European Union is not responsible for any use made of the information contained in this publication.

3
Benchmarking Working Europe2014Contents
Foreword ...................................................................................................5Introduction ..............................................................................................7
1. Europe five years into crisis: investment not austerity as the way out ....................................................................................13
2. Crisis takes its toll: disentangling five years of labour market developments .....................................................................................27
3. Developments in inequality and social protection in Europe ...........45
4. Deregulation of labour law at any price ............................................59
5. Half a decade of pressure on wages and collective bargaining ........ 69
6. Workers’ health and safety exposed to crisis ................................... 83
7. Chipping away at workers’ participation rights .................................91
8. Where is all that green investment? ................................................ 113
References ............................................................................................. 121List of figures ........................................................................................129List of abbreviations ............................................................................. 131The Benchmarking Group ....................................................................132

The year 2010 saw the launch of the Europe 2020 strategy. The new EU strategy had been devised for the purpose of promoting smart, sustainable and inclusive growth that would help Europe recover from the crisis and re-emerge stronger and more prosperous on the other side. In June of the same year, the European Semester was put in place to ensure the implementation and progress of macro-economic policy developments and structural reforms contained in the Europe 2020 strategy.
Now, in 2014, nearly five years into the strategy, the mid-term review of Europe 2020 is scheduled to take place in order to assess the effectiveness and relevance of the strategy and the mode of its governance and implementation. At a superficial glance, this mid-term review might appear to be taking place at a point in time when claims are issuing from various quarters that Europe is edging itself out of crisis, that the current policy direction is taking effect, and that it is indeed giving Europe the requisite boost to move from economic downturn to recovery. A more careful assessment will reveal, however, that Europe is still experiencing a devastatingly high level of unemployment; that growth is at best fragile; and that, rather than a narrowing of the gap separating us from the targets set for Europe 2020, we are seeing widening divergence, signifying that the current approach is definitely not achieving what it was set up to do. The assessment of the extent to which the European Semester, and in particular Europe 2020, has – or has not – helped Europe get out of the crisis will, accordingly, be instrumental in determining how European-level policies and strategies are to be redirected in the future.
With the choice of focus on ‘half-way through a lost decade’, this year’s edition of Benchmarking Working Europe sets out to assess and analyse the state of working Europe using a multi-level and multi-dimensional set of indicators. This volume is thus intended as one contribution to the mid-term review of the Europe 2020 strategy.
The chapters of this report conclude on a negative note. The macro-economic indicators point to a stagnation in domestic demand, as well as in both public and private investment, and to no real increase in exports. The reduction in public spending has, if anything, prolonged the financial and economic crisis and encouraged its further spread. Insofar as this dire macro-economic context shapes and sets the framework conditions for labour markets, it is in no way surprising that, here too, several worrying trends are appearing. Unemployment remains high and is showing no real signs of decreasing in a majority of member states. At the same time, full-time jobs are subject to net job destruction while part-time jobs display net job creation. Youth, migrants and the low-skilled are the hardest hit by the adverse labour market conditions, and their situation is not improving. To compound these dire economic circumstances on the labour market itself, structural reforms aimed at increasing flexibility are exacerbating the vulnerability of many categories of workers in Europe and further widening the many forms of inequality observed over the past decade. One telling example is that the greatest relative increase in risk of poverty over the last five years has occurred within the employed population.
The findings in this report point to policy failures and to the need to redefine alternatives in order to get Europe back on to a sustainable growth path that will lead to an upward harmonisation of standards and outcomes. The current trend towards ever greater economic as well as social divergence across the European Union cannot form a viable basis for the future of European integration. The conclusions of the mid-term review should take the above-mentioned highly alarming trends seriously into account and should reassess the direction of EU policy to include a fully-fledged investment strategy for the future, a halt to the deregulatory process, a consolidation of social protection and commitment to a Europe characterised by high social standards including in the field of health and safety. What is clear above all else is that the current focus on austerity and deregulation is failing to deliver what Europe citizens are entitled to expect.
Foreword
5

Foreword
6
Bernadette SégolETUC General Secretary
Maria JepsenETUI Director of Research Department
Philippe PochetETUI General Director
Benchmarking Working Europe, which first appeared in 2001, represents a contribution to the monitoring of the European Union, by providing a genuine benchmarking exercise applied to the world of labour and social affairs and grounded in effective labour and social rights. It aims at establishing what progress – or lack of it – has taken place in selected areas of importance to the trade unions and of significance for a social Europe.
We hope you will derive both interest and benefit from your reading of this year’s edition of Benchmarking Working Europe.
7
As in previous years, this new edition of Benchmarking Working Europe presents a statistical portrait of Europe regarded from a predominantly macro-economic and social standpoint. Its chapters deliver few surprises, for the indicators examined in this framework reflect the social impact of five years of an economic crisis that was triggered, in the first instance, by a financial crisis. Aspects subjected to detailed analysis in the chapters of this edition will accordingly be the surge in unemployment – particularly among youth, as well as in long-term unemployment – alongside wage developments and the increase in precarious forms of work.
Since 2010, however, these indicators seem to have become also – if not indeed principally – the reflection of the austerity policies conducted both at the European level and in the member states. Successive annual editions of this report have tracked the indicators, as the crisis not only showed no signs of ending but actually worsened, generating recession in some countries, as well as an increase in social inequality, in conjunction with the weakening of national solidarity mechanisms alongside the dismantling of national social models, traditions and practices of consultation and social dialogue.
In 2013-2014 we hear reports that the financial markets are now displaying few signs of the earlier turbulence, that the risks of collapse of the eurozone have been removed, the fears of sovereign default allayed, the domino effect halted, and economic governance strengthened. Is it not astonishing then that the ailing economic and social condition of Europe should appear so chronic, that growth should continue to stagnate, unemployment to soar, and deflation to rear its threatening head?
This very mixed context, consisting of problems that have been – or are in the process of being – solved (the banking sector alone, in which the crisis originated, has not, at the time of writing, revealed its current state of health) at the same time as the socio-economic situation continues to worsen, inevitably forces us to pose the following question: is Europe still suffering the consequences of crisis, or is the current situation rather the outcome of inappropriate policy choices? And if the wrong policies have indeed been followed, is it possible to envisage more effective alternatives?
One way of contributing some components of an answer to this question is to go back to the period frequently presented as the ‘austerity turning point’, namely, the year 2010. Whereas, during 2008 and 2009, the national and European authorities were busy taking steps to support the economy, industry, and employment, and to accelerate the transition towards a low-carbon economy, the situation underwent a volte-face in 2010 when restoring order and stringency to public finances suddenly became the number-one priority. This change of direction entailed the adoption, within the space of just a few months, of austerity programmes throughout the length and breadth of the European Union.
What explanation can be given for this about-turn? Is it something that was bound to happen? Several relevant factors have been put forward by way of explanation; they include the following: the general increase in public debts, overburdened by the rescue of the financial industry – between 2008 and 2012 ‘the total cash equivalent transfer from tax payers to the financial sector amounts to 1,839.5 billion euros or 14.2% of 2012 GDP’ (Kloeck 2014; see also European Commission 2013) – and further stretched by the economic crisis; the sudden emergence of the economic and financial problems afflicting the so-called ‘periphery countries’; the mistrust shown by the financial markets in relation to the eurozone’s solidity – and solidarity – as well as to its system of governance; and the resulting increase in the costs of financing the periphery countries’ deficits (De Grauwe 2011).
IntroductionHalf-way through a lost decade?Taking stock of five years of crisis
‘Is Europe still suffering the consequences of crisis, or is the current situation rather the outcome of inappropriate policy choices? And if the wrong policies have indeed been followed, is it possible to envisage more effective alternatives?‘

Introduction — Half-way through a lost decade? Taking stock of five years of crisis
Yet these factors do not on their own suffice to explain the abrupt switch from the nascent European Keynesian-style policy in relation to climate change that was being followed in 2008-2009 (even if the environmental component of the recovery plans was to be regarded with some caution – HSBC 2009; Watt 2009) to an obsessive focus on austerity policies so extreme that the EU today finds itself on the brink of a deflationary precipice.
One of the central, and yet frequently omitted, explanatory factors is the arrival on the scene, in 2010, of The Creditors. Just at the point when it had become necessary to put in place aid plans for the countries in difficulty – Greece, Ireland, Portugal – in order to halt a domino effect in the eurozone that was given a further shove by the behaviour of the financial markets (Boyer 2013), these ‘financial sponsors’ put in their appearance, in the form of the Troika (Commission, European Central Bank and International Monetary Fund) and the large eurozone countries. By the concerted action of these creditors the change in European policy priorities was imposed and implemented. It was thus the appearance on the European stage of this new entity – consisting of those able and willing to put up the necessary funds to rescue the most seriously ailing economies and bail out the most severely indebted states – that brought about a complete change of course, plunging Europe into the adoption of policy options which, on the basis of the evidence provided by an increasing number of indicators (including those included in this edition of Benchmarking Working Europe), have manifestly inflicted severe damage on the European economy, on social models and business activity, on workers and citizens, as well as on the transition to a sustainable and low-carbon economy.
The idea of a joint IMF-EU aid plan was first discussed at the beginning of 2010 on the fringes of an official visit to Brussels by the IMF Managing Director who met, among others, the Presidents of the European Council and European Commission, Herman Van Rompuy and José Manuel Barroso, and warned against the hesitancy of European responses in the face of the risk of a rapid spread of the Greek crisis. But the Europeans were divided: the German Chancellor, initially opposed to a bail-out plan for Greece, finally agreed to it only on condition of a joint intervention with the IMF (an idea initially rejected by France and by the European Central Bank) and of a formal strengthening of budgetary discipline within the EU. The main purpose of insisting on IMF involvement was to circumvent the prohibition on EU rescue of a member state.
Such were the events that led, in the course of 2010, to the setting up of the Troika and to the launching of measures designed to strengthen budgetary discipline (the infamous Six Pack, which was followed by a series of other legislative, institutional and procedural innovations in the framework of what came to be called the ‘European Semester’ and which became, in actual fact, a ‘European Year’).
This was the context in which excessive public indebtedness came to be presented as the number-one problem. As Carmen Reinhart and Kenneth Rogoff have shown, the history of economics teaches us that crises of public indebtedness can be dealt with in five different ways: by economic growth; by austerity; by defaulting on or restructuring the debt; by inflation; or by a certain dose of financial repression and inflation (Reinhart and Rogoff 2013). In the case of the European crisis the creditors considered, from the outset, just one single option, namely, budgetary adjustment and austerity (the ECB was to oppose any ‘non-voluntary’ restructuring of the Greek debt). It is this policy choice that explains the about-turn of 2010.
Yet this choice was far from being a matter of unanimity within the Troika. While differences of opinion were, at the time, kept relatively hushed up, recent publications
8
‘The history of economics teaches us that crises of public indebtedness can be dealt with in five different ways: by economic growth; by austerity; by defaulting on or restructuring the debt; by inflation; or by a certain dose of financial repression and inflation. In the case of the European crisis the creditors considered, from the outset, just one single option, namely, budgetary adjustment and austerity.‘

9
Introduction — Half-way through a lost decade? Taking stock of five years of crisis
today throw new light on aspects revealing a degree of internal controversy. It should be remembered, first of all, that since the beginning of the crisis in 2008 the IMF, rather than playing the policeman, had been admonishing the proponents of austerity. As early as December 2008, it called on the European governments to launch more ambitious recovery plans to support economic activity. The IMF’s chief economist Olivier Blanchard pointed out that ‘under normal circumstances we would have advised Europe to reduce its deficits, but the current circumstances are not normal’. ‘It is essential’, he added ‘to boost and, if necessary, to provide a substitute for private demand, if we want to avoid a situation whereby recession turns into a Great Depression’. The chief economist accordingly called for budgetary expansion of 2 to 3%, stressing that it was surely better for recovery to be stimulated by an increase in public spending than by a drop in revenue (Le Monde 2008). The IMF Managing Director meanwhile proposed in 2009 that his institution become the world lender of last resort through the pooling of a share of the central banks’ reserves. In 2010, when the Troika was being set up, he predicted that if monetary policy were to prove ineffectual in Europe, the 2% inflation goal would have to be raised to 4%. What was to be preferred, he asked: an additional 1 per cent of inflation or an additional 2°C of climate warming? On 8 March 2010 he proposed the creation of a Green Fund to enable the developing countries to invest in low-greenhouse-gas technologies to be funded to the tune of 100 billion dollars a year until 2020 (Faujas 2010). In 2011 the IMF was again the first to point out that the European banking sector was under-capitalised (IMF 2011); and at the beginning of 2012 it was the IMF that warned that the concerted application, at an unprecedented pace, of austerity plans in Europe would inevitably entail recessionary effects (IMF 2012). At the beginning of 2014 the European press revealed that the IMF had expressed doubts about the effectiveness of the aid to Greece as early as 2010, that non-European members of its board had been critical of an aid programme designed for the rescue of private creditors by the European institutions and had also expressed its reservations about the imposition of untenable budgetary stringency.
The only purpose of re-enumerating these points here is to stress that the policies adopted in Europe as from 2010 were actually subject to vehement controversy within the Troika itself. At the level of theoretical debate, austerity was not the only option available; nor did it – in the view of some of the parties involved at the time – constitute the best choice. Are we to believe that the international financial body may indeed have displayed greater clear-sightedness than the European elite? However this may be, since 2010 the economy has been stagnating and in the periphery countries there is no end in sight to recession, while public debts and unemployment continue to rise (ETUC 2014). If the failure of the 2000-2010 Lisbon Strategy could be – quite correctly – attributed in part to the crisis of 2008 (itself, however, exacerbated by the deregulatory strategies conducted during the second part of the Lisbon strategy), it will be the European elites who will alone bear responsibility for the – virtually already certain – failure of the Europe 2020 Strategy. The goals set in the framework of this strategy are receding one after the other; in the chapters that follow, the main causes of this failure stand revealed.
The policies of internal devaluation have not achieved the expected results, in particular in the peripheral countries such as Greece, Portugal and Cyprus (Chapter 1). While having failed to promote a recovery of export-led growth, these policies have contributed to a collapse of domestic demand. They have exacerbated the crisis and prolonged the recession. A narrow vision of competitiveness based on lowering wages has led to underestimating the importance of investment, innovation and modernisation. The crisis has exacerbated inequality in terms of access to credit, in particular for small and medium-sized businesses, between the eurozone core where such firms experience no real difficulty in obtaining loans and the periphery where
‘The policies adopted in Europe as from 2010 were actually subject to vehement controversy within the Troika itself. At the level of theoretical debate, austerity was not the only option available; nor did it – in the view of some of the parties involved at the time – constitute the best choice.‘

Introduction — Half-way through a lost decade? Taking stock of five years of crisis
borrowing is problematic in terms of both access and interest rates. Such inequality exacerbates the crisis, helps to further reduce income, and causes increasing mistrust among creditors, among other ills. What is more, the reduction in public spending – presented by the European Commission as a success – is contributing to the stagnation of the economy. The drop in both private and public investment leads to unemployment and unexploited capacities within the economy.
These misguided policies take a heavy toll on the labour market (Chapter 2). The Europe 2020 policy targets in relation to employment rates (75% for the 20-64 age group) are still far away; the rate at the beginning of 2013 was 68%. What is more, labour market developments have generated increased inequality between men and women and this inequality becomes even more pronounced when the distinction is made between full-time and part-time jobs, for the percentage of women is much higher in the latter. Generally speaking, it is those with the least skills who have suffered most from the employment crisis which has swollen the pool of the unemployed by 10 million between 2008 and 2013 (from 16.2 in 2008 to 26.1 million in 2013). The worst affected categories are young persons, migrants, particularly non-EU migrants, and low-skilled workers. The incidence of long-term unemployment, what is more, is far greater than during the period preceding the crisis. While vocational training policies are certainly to be recommended, they will not provide a way to recreate the 10 million jobs that have been destroyed.
The chronic nature of this highly adverse labour market situation, and the trend towards a destruction of full-time in favour of part-time jobs, naturally have a serious impact on the development of inequality and poverty; it is those members of the population who are unemployed or inactive that are most exposed to the risk of poverty (Chapter 3). The worsening labour market situation increases the risk of poverty and other forms of inequality. One goal set by the heads of state and government in the Europe 2020 Strategy is to raise 20 million persons out of poverty by 2020. The means to be deployed to this end are social protection systems, increased employment rates and better education and training provision. But in 2012 the share of the population at risk of poverty was 16.9%, representing not a reduction but an increase of 2.4% since 2008. In relation to the policies conducted, a relevant fact to consider is that there is an increased risk of poverty among persons in work (11.4% increase between 2008 and 2012), not only in the ‘new’ member states but also in some of the so-called ‘peripheral’ countries (Greece, Spain, Italy) and in countries of the European core and/or northern Europe. An even more striking point is that this increase is proportionately strongest among workers on permanent and part-time contracts in comparison with temporary workers (although the latter are, in absolute terms, at greater risk of poverty). Another development to be observed is a relatively greater increase in precariousness among skilled workers than among the less skilled (even if the latter are, in absolute terms, more subject to precariousness than the more highly skilled). Is not this situation the direct consequence of the policies conducted? It raises questions, in any case, about the pertinence of the notion that employment is the best way of combatting poverty, at a time when wages are being reduced, the labour market is being deregulated, and unemployment is exploding. A further striking and noteworthy development is the increase in national wage inequality in no less than fourteen countries i.e. exactly half of the member states.
The development of these, and other, indicators suggests that labour market and social protection reforms are key factors in determining the worsening poverty rates. The situation is compounded by the fact that, precisely at a time when citizens are exposed to increased risk of poverty, the mechanisms of solidarity are being undermined by the current reform policies (Chapters 4 and 5). Concealed behind the implementation of
10
‘In 2012 the share of the population at risk of poverty was 16.9%, representing not a reduction but an increase of 2.4% since 2008. And there is an increased risk of poverty among persons in work.‘
11
Introduction — Half-way through a lost decade? Taking stock of five years of crisis
the ‘structural reforms’ recommended in the member states in the framework of the European Semester, the following are some of the developments currently taking place: direct political intervention in national collective bargaining outcomes and procedures designed to ensure wage restraint, as well as the decentralisation of collective bargaining for example by enabling local-level agreements to fall below the terms of sectoral agreements or of provisions or minimum standards enshrined in the law; the introduction of sub-minima wages for young people and the long-term unemployed; the relaxation of the rules governing redundancies and dismissals; the revision of rules governing atypical employment; the revision of unemployment benefit systems; and a weakening of occupational health and safety standards.
It is doubtless here that one can see most clearly some of the ways in which, for the last three years, the social indicators have been reflecting less the economic crisis than the political choices to dismantle a series of forms and institutions of social protection that constitute the European social model. This process of dismantling leads directly to an increased state of precariousness within the labour force and the population at large, in some cases to situations in which those in work are nonetheless living below the poverty threshold, and even to violations of the fundamental rights of workers as enshrined in the EU Treaty and in other European and international treaties. Some observers see the political design of the current European elites as constituting a desire to align Europe on the US model.
Over and above social policy considerations, what is to be said about the parlous state of climate policy? Here too commitments have been taken in the framework of the European 2020 Strategy and it is expected that the EU will indeed achieve its short-term climate targets (Chapter 8). The following single observation, however, enables this relative success to be seen in its true colours: in Europe the reduction of greenhouse gases is attributable principally to economic recession, whereas in other regions of the world it is the result of programmes designed to invest in renewable forms of energy and to strengthen the energy efficiency of the economy. This observation, taken alongside the awareness that European ambitions in this sphere appear likely to suffer a loss of steam over the medium and long term, represents definite cause for concern at a moment in the history of the planet where, for the first time in hundreds of thousands of years, the levels of CO2 in the atmosphere in 2013 exceeded 400 parts per million, while extreme climate phenomena are becoming ever more frequent. On the basis of the climate policies currently being conducted, the increase in temperature previously estimated at between 3.6 and 5.3 degrees appears certain to be exceeded (the original goal having been 2 degrees for this century).
Europe, having given priority to austerity measures and to steps designed to ensure propriety in terms of public budgetary management, has made inadequate commitments on the path to a sustainable reduction in emissions, as will not fail to become manifest once the economy is back on its feet. Since 2011 it is in Europe that the drop in clean-energy investment has been most marked. The EU is losing ground in this field, above all in comparison with developing countries – e.g. China which, meanwhile, is improving its performance. Europe currently falls short of its targets for 2020 in terms of energy efficiency and a tremendous investment effort is required in the energy-saving field. The dividend of such investment, over and above its environmental impact, would be to fuel recovery in terms of economic activity and employment.
So much for a rapid – and far from exhaustive – overview of the contents of this edition of Benchmarking Working Europe. Especially since 2014 is a year in which the political personnel of the European institutions is up for renewal, it is a good time
‘Europe, having given priority to austerity measures and to steps designed to ensure propriety in terms of public budgetary management, has made inadequate commitments on the path to a sustainable reduction in emissions, as will not fail to become manifest once the economy is back on its feet.‘
Introduction — Half-way through a lost decade? Taking stock of five years of crisis
to draw up a mid-term (2010-2020) balance sheet of its policy implementation and achievements so far. Such a stocktaking exercise reveals, alas, a truly calamitous state of affairs. When economic stability and the confidence of the markets is obtained at the cost of unemployment, precarious living and working conditions and inequality, then political instability can lie only just around the next corner. Martin Wolf, a journalist on the Financial Times, does not hesitate to speak of the ‘failure of the economic, financial, intellectual and political elites who mostly misunderstood the consequences of headlong financial liberalisation’; of the failure of these same elites when they are viewed by the mass of the people ‘as richly rewarded for mediocre performance and interested only in themselves, yet expecting rescue when things go badly’; of the failure also of the ‘eurozone elites’ within the eurozone where ‘power is now concentrated in the hands of the governments of the creditor countries, principally Germany, and a trio of unelected bureaucracies – the European Commission, the European Central Bank and the International Monetary Fund’ (Wolf 2014).
The year 2014 – an election year that will see preparation for the mid-term revision of the Europe 2020 strategy – thus lends itself to a thoroughgoing stocktaking exercise in relation to the policies conducted and to a radical change of direction for a European Union that needs to get itself back on track in terms of its vocation to promote upward convergence of the living and working conditions of all its citizens. Proposals do exist to strengthen cooperation among member states, for the purpose of redressing the European economy, in areas that include tax cooperation, reform of financial markets, improvement of public services, the involvement of social partners in economic governance processes, or the promotion of labour standards. Detailed proposals have been drafted with a view to investing in sustainable growth and the creation of quality jobs. Implementation of the ‘Plan for Investment, Sustainable Growth and Quality Jobs’ drawn up by the European Trade Union Confederation (ETUC) would generate up to 11 million new jobs in Europe and would contribute to a sustainable economic and social recovery in the course of the coming decade (ETUC 2013).
Apart from the question of recovery as such, thought must be given, already now, within the European institutions and the member states, to the question of the future distribution of the fruits of the recovery when it happens. The political challenge is how to ensure that future gains are directed, as a matter of priority, towards those who have suffered most from the crisis. These are the categories of workers and citizens concealed within the statistical indicators in the chapters you are going to read: young people, migrants, workers suffering from the precarious conditions prevailing on the labour market, the unemployed, and persons of all ages and varying categories living, and struggling for survival, below the poverty threshold.
12
‘When economic stability and the confidence of the markets is obtained at the cost of unemployment, precarious living and working conditions and inequality, then political instability can lie only just around the next corner.‘
‘Apart from the question of recovery as such, thought must be given, already now, within the European institutions and the member states, to the question of the future distribution of the fruits of the recovery when it happens.‘

Europe five years into crisis: investment not austerity as the way outIntroduction
Economic performance across the EU from 2008 to 2013 has been poor in com-
parison with previous decades and with much of the rest of the world. Overall, GDP
levels were lower at the end than at the beginning of the period. There has been little
move towards more modern and innovative economies. No new base has been laid
for greater international competitiveness in the future and economic stagnation has
been accompanied by widening divergences between countries.
Part of the explanation for the exceptionally poor performance of EU member
states lies in past development, but the central explanation set out in what follows is
the wrong choice of policies. The EU was not designed to take rapid action, but the
first steps were moving in the right direction. It advocated economic stimulus meas-
ures, with public spending replacing the falling private-sector activity.
From 2010 the EU emphasis shifted. The crisis had previously appeared consider-
ably less severe within the eurozone than outside it. Difficulties with Greece’s public
debt changed this. Rather than finding an effective solution, the EU favoured condi-
tional help, with conditions that blocked sustained recovery.
Failure to resolve Greece’s crisis led to a loss of investor confidence in a further
series of eurozone countries, all previously judged secure. The widening of austerity
in turn depressed economic activity, particularly within the eurozone while those
outside have begun to perform slightly better. As the following sections demonstrate,
the imposition of tough rules, justified as a means to restore confidence so that a
future crisis would be avoided, has neither resolved the current crises nor put the EU
back on the road to economic growth and modernisation.
Topics
> Economic developments: struggling with stagnation 14> Restoring current account balances 16> From banking crisis to public debt 19> Cuts that lead nowhere 22> Conclusions 25
13

Figure 1.1 shows the growth rates for the EU and eurozone compared with the USA and the world as a whole over the period from 2008, when the financial crisis spread beyond the banking sector in the USA, to 2013. Much of the world, largely unaffected by the previous excesses of the banking system, weathered the crisis with only a slight drop in growth rates. The EU too showed recovery after 2009, helped by continued public spending to counter the falling activity from the pri-vate sector. However, as Figure 1.1 shows, the EU diverged from the USA and the rest of the world from 2010, falling back into depression.
As is shown in the sections that fol-low, the second depression followed pol-icy changes within the EU. It has slowed growth in the rest of the world by reduc-ing demand for imports from China and other rapidly developing countries. Nev-ertheless, annual growth rates in devel-oping Asian countries were still above 6% in 2013, compared with the small decline in the EU.
This second depression, although fully predictable in the context of poli-cies pursued, was not foreseen by the
the banking sector and a misunderstand-ing of the determinants of export suc-cess. These mistakes led to the emphasis on austerity and wage reductions which contributed to Europe’s poor economic performance from 2010.
The longer-term future remains very uncertain. European Commission forecasts suggest a continuation of their expected recovery for another year, after which they make no predictions. Even this growth is to be modest, 1.7% in 2015 for the eurozone and 1.9% for the EU as a whole. A little growth is indeed likely, assuming there is no further tighten-ing of austerity. However, that will leave Europe barely struggling out of stagna-tion as widening divergences leave parts of the continent in deep depression.
European Commission. Its autumn fore-cast of 2010 claimed that ‘the economic recovery in the European Union and the euro area is making progress’ (Euro-pean Commission 2010: vii). It predicted 2% growth by 2012. In spring 2012 the forecast, by then acknowledging stagna-tion for that year, was for recovery that would ‘gather speed’ in 2013, leading to 1.3% growth in the EU and 1.0% in the eurozone. By November 2013 the Euro-pean Commission acknowledged a likely decline of 0.4% for the eurozone that year alongside 0.0% growth for the EU as a whole, but predicted renewed growth of 1.4% for the EU and 1.1% for the euro-zone in 2014. Unemployment would not fall below 11% for the EU as a whole in 2014. The ever optimistic EU Commis-sioner Olli Rehn (2013) claimed on 13 September 2013 to see signs that the EU economy ‘has reached a turning point’.
Economic forecasts are hazardous and revisions are common. Policy mak-ers are often prone to optimism. How-ever, the inaccuracy of forecasts suggests that policy makers were failing to under-stand the likely effects of their policies. Mistakes included a substantial underes-timation of the depressive effects of cuts in public spending, as acknowledged in IMF publications (Blanchard and Leigh 2013). There was also an over-optimistic faith in spontaneous growth from small businesses, an underestimation of the depth and consequences of difficulties in
A double-dip recession
1.Europe five years into crisis: investment not austerity as the way out
Economic developments: struggling with stagnation
Figure 1.1 Real GDP growth (at 2005 market prices), EU27, EA, US, World, 2008-2014
Source: Own calculations using IMF data.Note: 2013-2014 are forecasts.
-5
-4
-3
-2
-1
0
1
2
3
4
5
6
2008 2009 2010 2011 2012 2013 2014
World
US
EU 27
EA
14
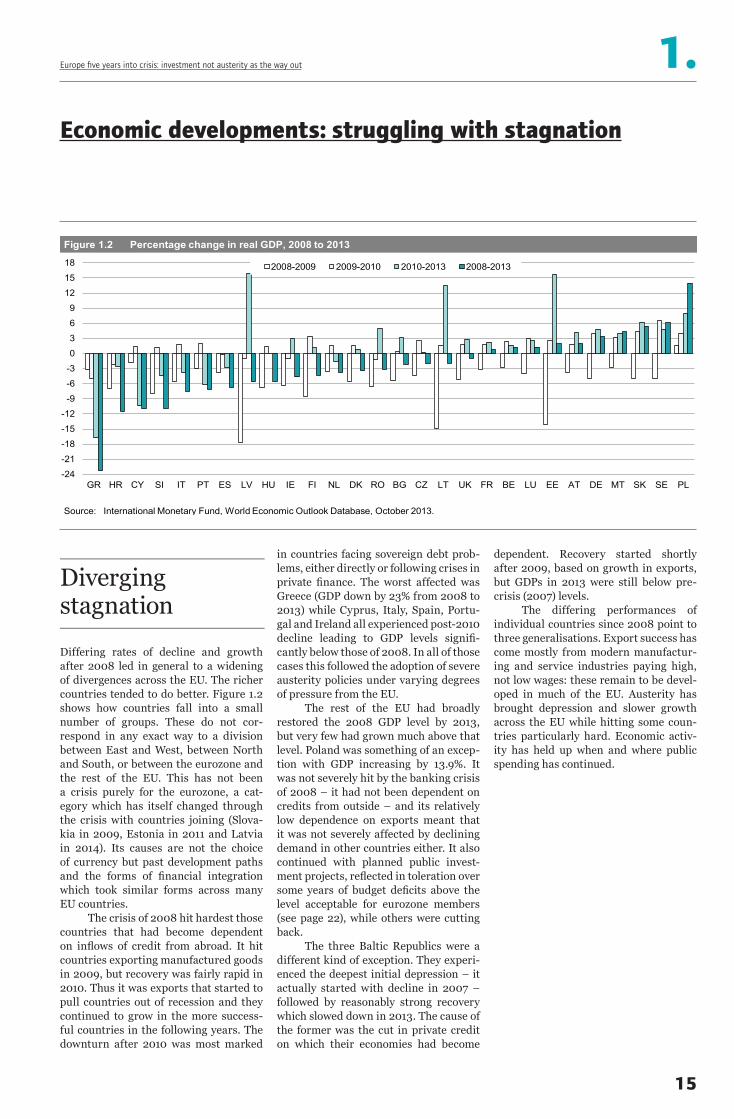
Differing rates of decline and growth after 2008 led in general to a widening of divergences across the EU. The richer countries tended to do better. Figure 1.2 shows how countries fall into a small number of groups. These do not cor-respond in any exact way to a division between East and West, between North and South, or between the eurozone and the rest of the EU. This has not been a crisis purely for the eurozone, a cat-egory which has itself changed through the crisis with countries joining (Slova-kia in 2009, Estonia in 2011 and Latvia in 2014). Its causes are not the choice of currency but past development paths and the forms of financial integration which took similar forms across many EU countries.
The crisis of 2008 hit hardest those countries that had become dependent on inflows of credit from abroad. It hit countries exporting manufactured goods in 2009, but recovery was fairly rapid in 2010. Thus it was exports that started to pull countries out of recession and they continued to grow in the more success-ful countries in the following years. The downturn after 2010 was most marked
dependent. Recovery started shortly after 2009, based on growth in exports, but GDPs in 2013 were still below pre-crisis (2007) levels.
The differing performances of individual countries since 2008 point to three generalisations. Export success has come mostly from modern manufactur-ing and service industries paying high, not low wages: these remain to be devel-oped in much of the EU. Austerity has brought depression and slower growth across the EU while hitting some coun-tries particularly hard. Economic activ-ity has held up when and where public spending has continued.
in countries facing sovereign debt prob-lems, either directly or following crises in private finance. The worst affected was Greece (GDP down by 23% from 2008 to 2013) while Cyprus, Italy, Spain, Portu-gal and Ireland all experienced post-2010 decline leading to GDP levels signifi-cantly below those of 2008. In all of those cases this followed the adoption of severe austerity policies under varying degrees of pressure from the EU.
The rest of the EU had broadly restored the 2008 GDP level by 2013, but very few had grown much above that level. Poland was something of an excep-tion with GDP increasing by 13.9%. It was not severely hit by the banking crisis of 2008 – it had not been dependent on credits from outside – and its relatively low dependence on exports meant that it was not severely affected by declining demand in other countries either. It also continued with planned public invest-ment projects, reflected in toleration over some years of budget deficits above the level acceptable for eurozone members (see page 22), while others were cutting back.
The three Baltic Republics were a different kind of exception. They experi-enced the deepest initial depression – it actually started with decline in 2007 – followed by reasonably strong recovery which slowed down in 2013. The cause of the former was the cut in private credit on which their economies had become
Diverging stagnation
1.Europe five years into crisis: investment not austerity as the way out
Economic developments: struggling with stagnation
Figure 1.2 Percentage change in real GDP, 2008 to 2013
Source: International Monetary Fund, World Economic Outlook Database, October 2013.
-24
-21
-18
-15
-12
-9
-6
-3
0
3
6
9
12
15
18
GR HR CY SI IT PT ES LV HU IE FI NL DK RO BG CZ LT UK FR BE LU EE AT DE MT SK SE PL
2008-2009 2009-2010 2010-2013 2008-2013
15
Turning current accounts into surplus
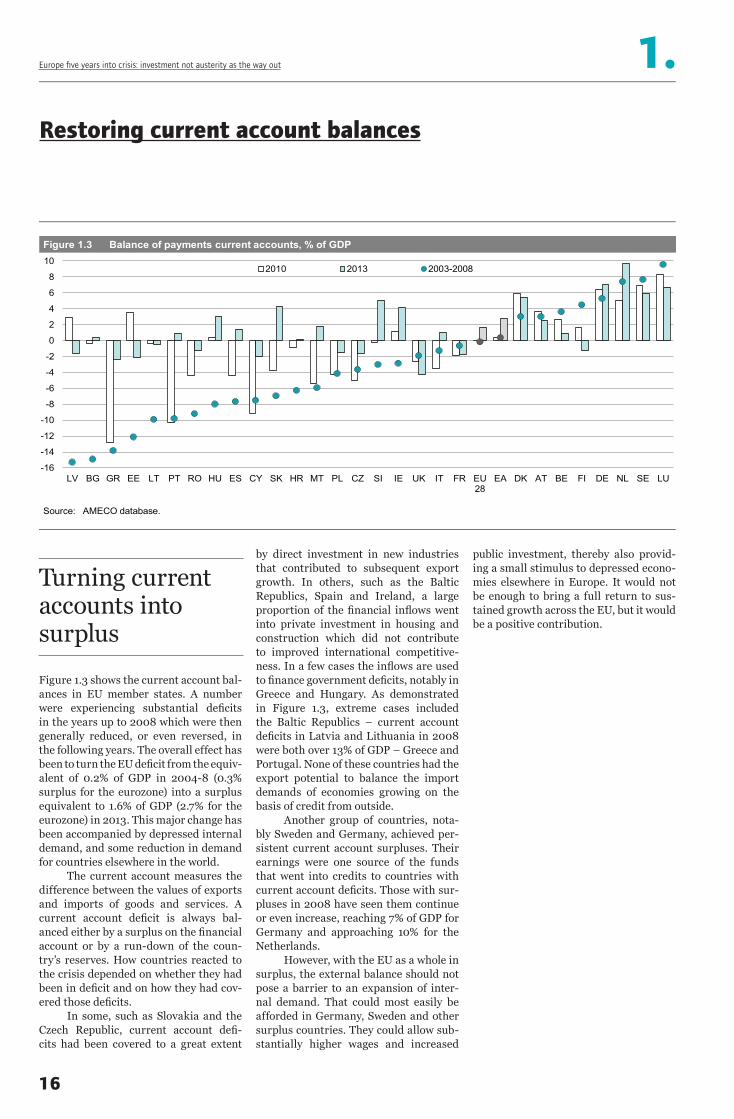
Figure 1.3 shows the current account bal-ances in EU member states. A number were experiencing substantial deficits in the years up to 2008 which were then generally reduced, or even reversed, in the following years. The overall effect has been to turn the EU deficit from the equiv-alent of 0.2% of GDP in 2004-8 (0.3% surplus for the eurozone) into a surplus equivalent to 1.6% of GDP (2.7% for the eurozone) in 2013. This major change has been accompanied by depressed internal demand, and some reduction in demand for countries elsewhere in the world.
The current account measures the difference between the values of exports and imports of goods and services. A current account deficit is always bal-anced either by a surplus on the financial account or by a run-down of the coun-try’s reserves. How countries reacted to the crisis depended on whether they had been in deficit and on how they had cov-ered those deficits.
In some, such as Slovakia and the Czech Republic, current account defi-cits had been covered to a great extent
public investment, thereby also provid-ing a small stimulus to depressed econo-mies elsewhere in Europe. It would not be enough to bring a full return to sus-tained growth across the EU, but it would be a positive contribution.
by direct investment in new industries that contributed to subsequent export growth. In others, such as the Baltic Republics, Spain and Ireland, a large proportion of the financial inflows went into private investment in housing and construction which did not contribute to improved international competitive-ness. In a few cases the inflows are used to finance government deficits, notably in Greece and Hungary. As demonstrated in Figure 1.3, extreme cases included the Baltic Republics – current account deficits in Latvia and Lithuania in 2008 were both over 13% of GDP – Greece and Portugal. None of these countries had the export potential to balance the import demands of economies growing on the basis of credit from outside.
Another group of countries, nota-bly Sweden and Germany, achieved per-sistent current account surpluses. Their earnings were one source of the funds that went into credits to countries with current account deficits. Those with sur-pluses in 2008 have seen them continue or even increase, reaching 7% of GDP for Germany and approaching 10% for the Netherlands.
However, with the EU as a whole in surplus, the external balance should not pose a barrier to an expansion of inter-nal demand. That could most easily be afforded in Germany, Sweden and other surplus countries. They could allow sub-stantially higher wages and increased
1.Europe five years into crisis: investment not austerity as the way out
Restoring current account balances
Figure 1.3 Balance of payments current accounts, % of GDP
Source: AMECO database.
-16
-14
-12
-10
-8
-6
-4
-2
0
2
4
6
8
10
LV BG GR EE LT PT RO HU ES CY SK HR MT PL CZ SI IE UK IT FR EU28
EA DK AT BE FI DE NL SE LU
2010 2013 2003-2008
16

Figure 1.4 shows the changes in exports and imports that led to the transforma-tion of the EU into an area in net cur-rent account surplus with the rest of the world. Variation between countries is enormous. Exports grew most rapidly in the Baltic Republics, Poland, Roma-nia and Slovakia. There was also strong growth in Spain, Germany, the Nether-lands and Portugal, but decline in Greece, Italy and Finland and stagnation in Den-mark and Sweden. The variations cannot be explained by differences in policies pursued at the time. They depended on countries having products to export and on developments in their export markets. On the other hand, changes in imports relate more clearly to policy choices, fall-ing most sharply where the most severe austerity policies were imposed, such as Greece, Spain and Portugal.
This indicates the actual effects of the policy of so-called ‘internal devalua-tion’, favoured by the European Commis-sion for eurozone countries in the great-est difficulty. The argument was that, unable within the common currency to devalue, they should achieve the same reduction in export prices by cutting
into a surplus has been the fall in domes-tic demand, leading to the 6.7% drop in imports shown in Figure 1.4. Real recovery depends on finding new activi-ties to replace the jobs lost since 2008, for example, in construction which are equivalent to 9% of the total labour force.
Thus internal devaluation has appeared most effective where it has reduced domestic demand, deepening and prolonging depression. It is not the key determinant of export performance.
wage costs. This was believed to be the means to stimulate exports and thereby to restore external balance.
The approach was pioneered in the Baltic Republics and also lay behind the Troika policies (see page 24) for Greece, Portugal, Ireland and Cyprus, and poli-cies pressed on Spain and Italy by the European Commission and the ECB. However, internal devaluation did not determine changes in exports. The first emphasis was put on cutting public sec-tor pay and this had minimal impact on export costs. In Greece private sector pay was cut, but export prices actually increased by 20% from 2009 to 2013, the highest increase in any eurozone mem-ber for which the average was 8.6% (cal-culated from figures in European Com-mission 2013: 141). Lower wages seem to have led only to higher business profits.
In Latvia, often presented as an example of the success of internal deval-uation, pay in export sectors probably increased (Blanchard et al. 2013: 22-23) and export prices increased over this period by 29%.
Ireland is another case of claimed success for internal devaluation, although its GDP was still stagnating in 2013 and export growth in 2013 was barely 0.5%. The success there has been a growth in output from computer services, employ-ing little over 3% of the labour force and paying relatively high wages. The other big contributor to turning the Irish deficit
1.Europe five years into crisis: investment not austerity as the way out
Restoring current account balances
Figure 1.4 Percentage changes in exports and imports, 2008-2013, 2005 prices
Source: calculated from AMECO database.
-50
-40
-30
-20
-10
0
10
20
30
40
GR FI CY HR LU IT SE DK SI AT FR UK BE EA EU28
IE DE NL HU PT ES CZ MT BG PL LV RO SK EE LT
imports exports
Did ‘internal devaluation’ help?
17

Figure 1.5 shows the changing shares of an indicator of sophisticated prod-ucts (meaning machinery and transport equipment, pharmaceuticals and scien-tific instruments) in countries’ exports. This is a good starting point for assessing the sophistication of individual econo-mies, albeit not an exact one. The years up to 2008 saw dramatic transforma-tions across Europe. Large-scale manu-facturing, especially motor vehicles, was brought by multinational companies to parts of central and southern Europe. The share of complex products rose to over 60% in Hungary and approached that figure in the Czech Republic and Slovakia. Semi-manufactures (steel and bulk chemicals), raw materials and light industry increasingly gave way to machinery and other complex products in those countries’ export structures, which came to resemble that of Germany, albeit with dependence on foreign multi-national companies for technology and innovation.
The years after 2008 have seen rel-ative structural stagnation. Romania was a striking exception, with growth in mod-ern sectors, while some other countries
firms compete with the quality, sophisti-cation and innovativeness of their prod-ucts rather than with price. Unit labour costs are therefore low if product quality is high. They are the result of a high level of competitiveness rather than its cause.
The crisis has cut modernisa-tion and investment. Wage reductions cannot counter this trend. Wage levels make some difference over the longer term – modern industries came to cen-tral Europe partly because pay was lower than across western Europe – but only in conjunction with investment in infra-structure and skills. An understanding of competitiveness in line with Europe 2020 would point to the need for adequate pay levels to attract, retain and motivate the qualified labour force needed for a mod-ern economy.
have continued to lose established activi-ties to lower-wage countries, notably Ire-land and Finland. Portugal had moved more slowly from older industries and showed some reversion to the old struc-ture. Greece remained with very little modern manufacturing. Baltic Republics remain exporters mostly of raw materi-als and simpler products, albeit ones for which markets have recovered.
Improving the competitiveness of individual member states and of the EU as a whole has been central to EU economic policy for many years. Targets were set in March 2010 for improving qualifications, skills, research and development output, energy sustainability, social cohesion and active participation in employment as part of the European Commission’s 10-year strategy, Europe 2020. That strategy remains the formal guide for EU policy targets. It is also in line with much of modern economic thinking within which competitiveness is understood as the ability to compete on international markets while also paying high wages. That is the real measure of success.
The crisis has seen a reinterpreta-tion. The target of higher competitive-ness is increasingly linked to reducing wages. The key measure has been ‘unit labour costs’, meaning employment costs per unit of output. Both lower wages and higher productivity can lead to lower unit labour costs. In advanced economies the latter is more important. Countries and
No easy measure of competitiveness
1.Europe five years into crisis: investment not austerity as the way out
Restoring current account balances
Figure 1.5 Percentage share of complex products in selected countries' exports, 2000-2012
Source: Calculated from Comtrade data base. Note: Complex sectors are SITC 7, 54, 87, 88.
0
10
20
30
40
50
60
70
BG GR LV EE PT CY RO ES PL IT UK IE FI FR SI DE SK CZ HU
2000 2008 2012
18

The crisis of 2008 was precipitated and transmitted by the private banks. They had lent irresponsibly, both within coun-tries and across borders, and had become involved in speculative and risky activi-ties that were at the time poorly regulated.
Figure 1.6 shows total private debt, including bank credits and other forms of borrowing, in 2008. Levels were gen-erally lower in newer member states, such as the Czech Republic, Slovakia, Poland and Romania, but higher in some other new member states, notably Bal-tic Republics and Hungary. The highest levels of private debt were in the UK, the Netherlands, Portugal, Cyprus, Spain, Ireland and Denmark. A major compo-nent was credit for housing construction and for private house purchase. This lat-ter had an enormous capacity to increase because the availability of credit fuelled increases in house prices which in turn increased the demand for more credit.
The end to easy credit therefore marked the end of housing booms setting off a downward spiral. Figure 1.6 shows the credit flows before and after the cri-sis of 2008. Increases in lending were extremely rapid in the earlier period in
problems. Germany appears the least affected, showing hardly any change in credit growth before and after the cri-sis. For others the decline in credits has contributed to economic depression and falling incomes. Falling incomes in turn made it harder to repay debts, further discouraging new bank lending. Poli-cies aimed at expanding demand and incomes across the EU would therefore be one form of contribution to restoring bank lending.
a number of new member states, notably Baltic Republics, Bulgaria and Cyprus. They were also rapid in Ireland, Spain, Denmark and to lesser extents Portugal, Sweden and the UK. The striking con-trast is with Germany in which credit growth was minimal. The big difference was that individual ownership of housing is lower in that country and there was no private housing boom in this period.
The financial crisis of 2008 and its aftermath led to dramatic reductions in new loans such that the total volume of private credit actually declined in the UK, the Baltic Republics, Greece and Spain. Smaller businesses were the hard-est hit and they are more important to the economies in the EU periphery. An ECB survey (ECB 2013: 41-47) for the six months up to March 2013 showed that 85% of SMEs seeking credits in Ger-many encountered no obstacles, while only 25% in Greece had the same good fortune. Interest rates charged also var-ied widely, with businesses in periphery countries paying about twice as much as those in Germany.
Causes of these differences included the need for banks to restore their balance sheets. It also followed from banks’ fears that demand would remain depressed and credits would not be repaid, a logical fear in countries faced with the most severe austerity policies.
Private debt and difficulties in the banking sector remain very intractable
1.Europe five years into crisis: investment not austerity as the way out
From banking crisis to public debt
Figure 1.6 Private credit flow, percent of GDP, 2004-2012 and volume of private credit, percent of GDP, 2008
Souce: Eurostat.
-150
-100
-50
0
50
100
150
200
250
300
350
400
-12
-8
-4
0
4
8
12
16
20
24
28
32
CZ RO SK PL LT SI DE HR GR IT LV FR BG AT HU FI EE BE MT UK ES NL SE PT DK CY IE LU
average 2004-2008 average 2009-2012 volume, 2008 (right-hand scale)
19
The burden of private debt

Figure 1.7 shows one of the key responses to the drop in bank lending from central banks. In an effort to maintain credit flows, they reduced their lending rates, down to historically low levels, 0.25% for the ECB by 2013 and 0.5% for the Bank of England. The change was more rapid and sudden in the latter case, where there was greater concern over the breakdown in private credit. The depth of difficul-ties in the eurozone was recognised only gradually. These central bank rates, used for lending to commercial banks seeking speedy access to finance, set a lower limit to interest rates on bank credits. How-ever, as Figure 1.6 shows, lower interest rates did not prevent a substantial drop in credit flows.
The Bank of England also pursued a policy of ‘quantitative easing’; mean-ing in effect the expansion of the quan-tity of money by the equivalent of 24% of GDP. As Figure 1.6 indicates, the UK still experienced contraction, rather than expansion, in net credits. Quantitative easing may nevertheless have prevented still deeper depression. It has not, despite fears of critics, led to higher inflation. It has probably contributed to maintaining
It will do nothing to overcome the diver-gences in current banking behaviour. It is more aimed at preventing another crisis in the rather distant future, but it may not do very much towards that either.
share prices, in which case the main benefits have been to the wealthiest in society.
The ECB has not formally followed this route, but a similar effect could have been achieved by its decisions in 2011 and 2012 to offer cheap three-year loans to banks to the equivalent of 14% of euro-zone GDP. In practice most of this went into countries facing public debt prob-lems and banks used the resources to improve their own balance sheets or to lend to their governments. This therefore reduced the interest rates paid by gov-ernments especially in Greece, Ireland, Italy and Spain. It did not revive credits to businesses or households.
The measure has not been repeated, following opposition from some member states that see themselves subsidising the troubled countries of the periphery. Instead, attention has focused on solving banking sector problems by the creation of a European banking union, following an EC proposal of May 2012.
However, the proposal agreed in December 2013 is unlikely to contribute much. The ECB should become a central regulator for bigger banks, but it has yet to prove that it would be better at spot-ting risky behaviour than national cen-tral banks. A fund will be established for banks facing difficulties, building up to 55 billion euros after 10 years. That is a small amount compared with the 473 bil-lion euros already spent on bank rescues.
Help from the central banks?
1.Europe five years into crisis: investment not austerity as the way out
From banking crisis to public debt
Figure 1.7 Central Bank policy rates, ECB, BoE, 2008-2013
Sources: European Central Bank and Bank of England.
0
1
2
3
4
5
6
2007
12
2008
03
2008
06
2008
09
2008
12
2009
03
2009
06
2009
09
2009
12
2010
03
2010
06
2010
09
2010
12
2011
03
2011
06
2011
09
2011
12
2012
03
2012
06
2012
09
2012
12
2013
03
2013
06
2013
09
Bank of England, Offficial Bank Rate European Central Bank, Fixed Rate
20

Public debt problems followed after the private debt crisis. Figure 1.8 shows public debt levels in EU members which changed little relative to GDP between 2000 and 2008, increasing slightly in a few and decreasing in somewhat more countries. The highest levels, in Greece and Italy, were little different from those in 2000. The lowest level was recorded in Estonia, falling to a low point of 3.7% of GDP in 2007. Figure 1.8 shows that, with the exceptions of Bulgaria and Sweden, the debt to GDP ratio was higher in 2013 than the average for 2004 to 2008.
The private debt crisis was trans-formed into a problem of public debt by three mechanisms:–– the first was that governments were
obliged to rescue failing banks. This was done in the UK by the central bank, the Bank of England, acting as lender of last resort. In 2008 it provided the funds to keep banks operating, taking several into state ownership, and there was no formal increase in public debt. Had the extent of this rescue been measured as a cost to the state, public debt would have been increased to 155% of GDP in 2012, not far behind
also because the ECB has been very reluc-tant to behave as a lender of last resort.
The result is a paradox of uneven development. Some countries have faced extreme difficulty in raising loans. The yield on 10-year Greek government bonds in October 2013 was 8.74%, a potentially crushing burden for a coun-try facing escalating public debt. Others have been paying interest rates on long-term credit that are little above zero in real terms. For Germany the equivalent figure was 1.76%. Funds are there to be invested. Government debt from Ger-many, the UK, France and several other EU member countries seems the safest investment available.
Thus, when taken as a whole, there should not be a debt crisis for the EU, or even for the eurozone. Mobilising the financial resources available in pension funds, investment funds and other forms of saving should be a central part of any policy for restoring income levels and growth across the EU.
the Greek figure. Within the eurozone the European Central Bank did not act as a lender of last resort. Thus the Irish government used public money to rescue an insolvent bank, contributing to the doubling of public debt between 2008 and 2010.
–– the second was that the fall in GDP in 2009 was countered by continued public spending, and by increases in some items both to cover costs of higher unemployment and to prevent a still deeper depression. Budget deficits were covered by borrowing.
–– the third was that continued depression, reducing GDP and also tax revenues, made it even more difficult to hold back budget deficits which were covered by more borrowing.
There is no precise level of debt-to-GDP ratio at which public debt levels become unsustainable, in the sense that further borrowing becomes impossible or requires an unacceptably high inter-est rate. Past experience shows very varied levels of debt leading to a loss of confidence from potential purchasers of government debt. The eurozone sets a formal limit of debt at 60% of GDP, a figure exceeded by all but a few eurozone members in 2013. However, the euro-zone remains particularly vulnerable to a loss in investor confidence because of its prolonged depression – lack of growth means lack of growth in public revenues that are required to repay debts – and
After private debt came public debt
1.Europe five years into crisis: investment not austerity as the way out
From banking crisis to public debt
Figure 1.8 Gross public debt as percent of GDP
Source: AMECO database.
0
20
40
60
80
100
120
140
160
180
EE BG LU RO LT SE LV DK CZ SK PL FI HR SI MT NL AT DE HU FR UK ES EA BE CY IE PT IT GR
average 2004-2008 2013
21
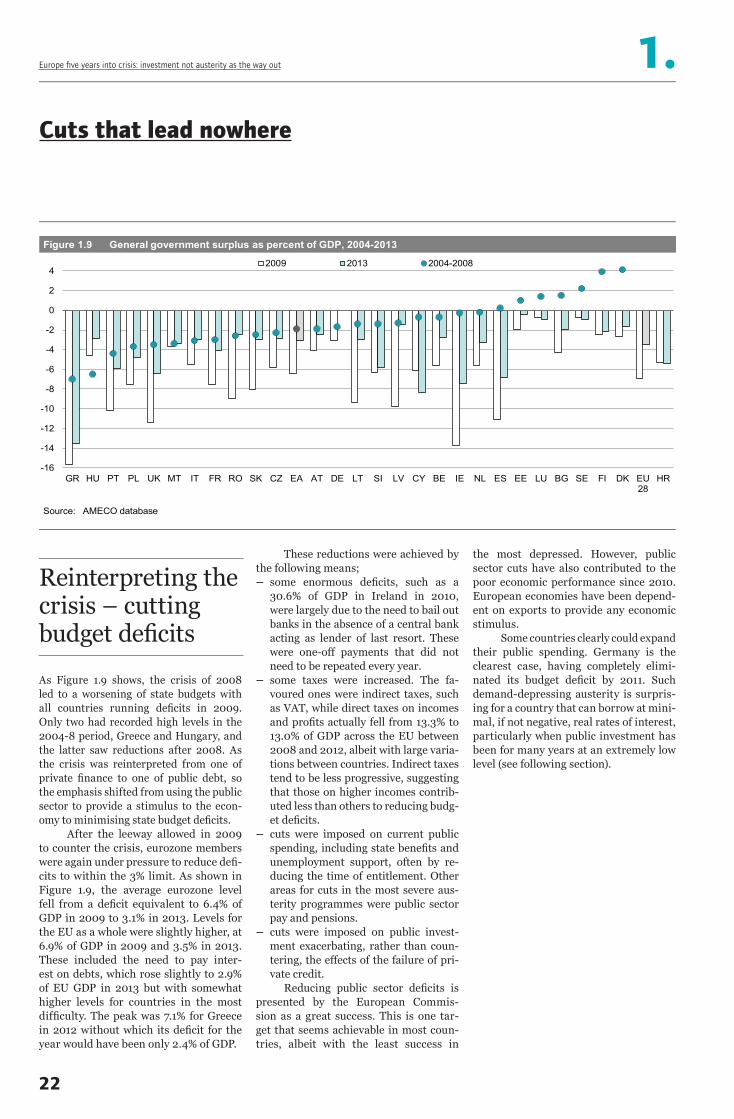
As Figure 1.9 shows, the crisis of 2008 led to a worsening of state budgets with all countries running deficits in 2009. Only two had recorded high levels in the 2004-8 period, Greece and Hungary, and the latter saw reductions after 2008. As the crisis was reinterpreted from one of private finance to one of public debt, so the emphasis shifted from using the public sector to provide a stimulus to the econ-omy to minimising state budget deficits.
After the leeway allowed in 2009 to counter the crisis, eurozone members were again under pressure to reduce defi-cits to within the 3% limit. As shown in Figure 1.9, the average eurozone level fell from a deficit equivalent to 6.4% of GDP in 2009 to 3.1% in 2013. Levels for the EU as a whole were slightly higher, at 6.9% of GDP in 2009 and 3.5% in 2013. These included the need to pay inter-est on debts, which rose slightly to 2.9% of EU GDP in 2013 but with somewhat higher levels for countries in the most difficulty. The peak was 7.1% for Greece in 2012 without which its deficit for the year would have been only 2.4% of GDP.
the most depressed. However, public sector cuts have also contributed to the poor economic performance since 2010. European economies have been depend-ent on exports to provide any economic stimulus.
Some countries clearly could expand their public spending. Germany is the clearest case, having completely elimi-nated its budget deficit by 2011. Such demand-depressing austerity is surpris-ing for a country that can borrow at mini-mal, if not negative, real rates of interest, particularly when public investment has been for many years at an extremely low level (see following section).
These reductions were achieved by the following means;–– some enormous deficits, such as a
30.6% of GDP in Ireland in 2010, were largely due to the need to bail out banks in the absence of a central bank acting as lender of last resort. These were one-off payments that did not need to be repeated every year.
–– some taxes were increased. The fa-voured ones were indirect taxes, such as VAT, while direct taxes on incomes and profits actually fell from 13.3% to 13.0% of GDP across the EU between 2008 and 2012, albeit with large varia-tions between countries. Indirect taxes tend to be less progressive, suggesting that those on higher incomes contrib-uted less than others to reducing budg-et deficits.
–– cuts were imposed on current public spending, including state benefits and unemployment support, often by re-ducing the time of entitlement. Other areas for cuts in the most severe aus-terity programmes were public sector pay and pensions.
–– cuts were imposed on public invest-ment exacerbating, rather than coun-tering, the effects of the failure of pri-vate credit.
Reducing public sector deficits is presented by the European Commis-sion as a great success. This is one tar-get that seems achievable in most coun-tries, albeit with the least success in
1.Europe five years into crisis: investment not austerity as the way out
Cuts that lead nowhere
Figure 1.9 General government surplus as percent of GDP, 2004-2013
Source: AMECO database
-16
-14
-12
-10
-8
-6
-4
-2
0
2
4
GR HU PT PL UK MT IT FR RO SK CZ EA AT DE LT SI LV CY BE IE NL ES EE LU BG SE FI DK EU28
HR
2009 2013 2004-2008
22
Reinterpreting the crisis – cutting budget deficits

Figure 1.10 shows that investment has fallen dramatically in the aftermath of the crisis, but with wide divergences in experiences of countries. GDP in 2013 for the EU as a whole was 1.3% below its 2008 level, but total fixed investment had fallen by 18.8%, from 21.1% of GDP to 17.2%. In some countries – notably Germany, Austria and Sweden – there was little net change over this period. For some the drop was enormous. In Ireland investment fell from 25.5% of GDP at its peak in 2007 to 11.0% (of a lower level) of GDP in 2013.
Most of the decline was in private investment, including housing construc-tion and industry, but public fixed invest-ment also fell by more than 50% in Ireland, Spain and Greece. It held up well in some periphery countries, remaining roughly unchanged in the Baltic Republics where there was a large contribution from EU support. The highest level was retained in Estonia at 4.6% of GDP in 2013. Germany and Austria were the lowest, both in the years before the crisis and in 2013, with levels of 1.5% and 1.0% of GDP respectively.
debt levels. Borrowing in one form or another has always been the standard means for financing investment, both private and public. When it leads to growth, debts are relatively easily repaid.
Some past investment was misdi-rected, contributing to the construction and housing bubbles that led to the bank-ing crises. However, levels are extraor-dinarily low in a number of countries, leaving unemployed people and unused capacity that could contribute to a revival of well-directed investment activity.
A revival in investment activity would provide an immediate stimulus to demand. It is also essential for long-term growth and for overcoming grow-ing divergences and inequality within the EU. All countries have demonstrable needs for investment to cope with the challenges of the future in such areas as education and research, climate change, energy, environment, and ageing of pop-ulations. All could benefit from increased public investment undertaken by their own governments. A clearly European investment programme, using exist-ing methods and institutions of Struc-tural Funds and the European Invest-ment Bank, could help direct investment towards reversing the widening diver-gences in economic performance across the EU.
As indicated (on page 21), financial resources are available and actively seek-ing safe investment opportunities. How-ever, their utilisation has been blocked by the determination to avoid extra bor-rowing even for productive purposes and even though policies pursued have actu-ally led to sustained increases in public
Reversing the downward spiral of investment
1.Europe five years into crisis: investment not austerity as the way out
Cuts that lead nowhere
Figure 1.10 Gross fixed investment as % of GDP, 2008 and 2013
Source: Eurostat.
0
5
10
15
20
25
30
35
UK MT DE SE NL IT DK EU28
FR LU FI EA AT HU IE PL BE PT GR CY SK LT CZ HR SI ES LV EE RO BG
2008 2013
23

From 2008 onwards a number of EU member states have been hit by the inability to sell bonds – meaning pub-lic debt – on the international markets. The first major problem was in Hungary in November 2008, followed by Latvia and Romania. Help came from the IMF and EU with conditions attached that required cutting budget deficits. These packages reached a completely new scale when Greece, a eurozone member, was affected in 2010. Its government admit-ted that previous public deficit figures had been inaccurate and private inves-tors lost confidence in Greek public debt.
The Greek crisis saw the rise of the Troika, bringing together the EC, the IMF and the ECB, but with the last of these playing no significant role. They provided emergency credit, but with high interest rates and with a range of further conditions attached. The package failed to resolve the Greek crisis and a further bail out was required in March 2012. The total volume of credit made available was greater than in any previous IMF pro-gramme, equivalent to 25% of Greek GDP. Rescue packages were also devised for Ireland in December 2010 and Portugal
about ever more countries, including Portugal and Ireland but also Spain and Italy. This domino effect would have been prevented had the ECB followed the example of central banks elsewhere in the world and acted as a lender of last resort, guaranteeing debts of eurozone members. That would have killed inves-tor fears from the start.
In September 2012 the ECB finally stepped in to buy state debt from the countries in the greatest difficulty. This implicitly guaranteed new debt from eurozone members, putting a stop to speculation about countries leaving the eurozone. However, conditions attached have continued to hamper prospects for economic recovery.
in June 2011. Results are set out in Figure 1.11, showing the predictions for the next two years from the European Commis-sion’s first regular forecast after terms were set out, compared with results actu-ally achieved.
Budget deficit and debt figures were not too far off target. These were priori-ties and further budget changes were required if the target looked like being missed. GDP figures were significantly worse than predicted and unemployment results were somewhat worse than fore-cast. Exports were not bad for Portugal but well below target for the other two. As covered in Sections 4 and 5, these depend on factors that cannot be changed quickly. The Troika’s policies made little difference there, despite their optimistic predictions.
The main effects of the Troika’s policies have been to depress demand, leading to lower GDP and to increasing debt levels, the former not foreseen but the latter partly acknowledged in their forecasts. In fact the debt to GDP ratio for Greece escalated to 176.2% in 2013, as depressed domestic demand reduced the GDP level and tax revenues. There is no basis for expecting a reduction in that debt level in the near future and a further bail out(s) may well prove necessary.
The terms required by the Troika did not end the crises in the eurozone. They prolonged them. Failure to resolve the issue in Greece encouraged doubts
What the Troika did
1.Europe five years into crisis: investment not austerity as the way out
Cuts that lead nowhere
Figure 1.11 Results of Troika policies in three programme countries, 2010-2013
Sources: European Commission, Autumn Forecast 2010, 2011, 2013, Spring Forecast 2011.Note: GDP and export figures show percentage growth, budget deficits are percent of GDP.
90
100
110
120
130
140
150
160
-10
-5
0
5
10
15
20
25
GD
P
expo
rts
budg
etde
ficit
unem
ploy
men
tra
te
GD
P
expo
rts
budg
etde
ficit
unem
ploy
men
tra
te
GD
P
expo
rts
budg
etde
ficit
unem
ploy
men
tra
te
Gre
ece,
May
201
0
Irela
nd,
Dec
embe
r 201
0
Portu
gal,
June
201
1
Greece, May 2010 Ireland, December 2010 Portugal, June 2011 public debt/GDP(right-hand scale)
predicted achieved
24

1.Europe five years into crisis: investment not austerity as the way out
Recovery also requires current spending from governments. They can-not take advantage of investment oppor-tunities if they cannot pay interest on loans. There is also little point in trying to modernise societies, for example with new facilities for education, research and health, if there are no resources to pay the employees. Therefore, at least until growth is restored, the rules on fiscal deficits and debt levels need to be inter-preted much more flexibly. More radical measures would include steps towards mutualisation of public debt and/or for the ECB to take on more clearly the role of lender of last resort. This would enable the countries facing exorbitant interest rates on their public debt to borrow again at rates comparable to those of the most favoured EU members.
It is not difficult to find alternative policies for Europe that could restore growth and employment. Europe, after all, has been performing exceptionally badly in comparison with the rest of the world. Without a change of course it risks losing the next five years as it has the last.
Economically it is one of the most advanced parts of the world. It is in cur-rent account surplus with the rest of the world. It has no difficulty accessing pri-vate finance, as evidenced by the very low rates of interest on long-term govern-ment debt paid by a number of EU gov-ernments. Restoring growth, prosperity and employment levels requires mobilis-ing the resources that exist for moderni-sation and investment.
Recovery is held back both in indi-vidual countries and at EU level by fears over levels of public debt. In fact, public debt has grown because of the crisis – and because of austerity - rather than being its cause. It will continue to increase as a proportion of GDP as long as growth remains subdued. This is an absolutely basic proposition in macroeconomic theory and is confirmed by Europe’s post 2008 experience. Gross debt as a propor-tion of GDP has increased across the EU and, with only a couple of exceptions, in every country and every year since 2008. Reversing that trend requires renewed growth, providing the growth in tax rev-enues which can reduce budget deficits.
Renewed growth requires renewed investment, both public and private, and renewal of bank lending. None of these can come on an adequate scale from the current policies of austerity. Public investment can be undertaken through existing institutions, the Structural Funds and the European Investment Bank at EU level, and other national institutions. It can be financed by bor-rowing. That would increase debt lev-els, but would generate the growth from which those, and previous, debts could be repaid. There is no other feasible way to resolve debt problems.
Private investment can be expected to increase following a stimulus from public investment. It would benefit enor-mously from a restoration of bank lending. That in turn would be helped by comple-tion of negotiations over a banking union. However, for such an approach to be fully effective requires that means be found to ensure that banks in difficulty can con-tinue to function normally, offering cred-its to businesses with sound investment plans. That requires the creation of an adequately funded lender of last resort.
The European economy has gone through two depressions since 2008. The first policy reactions to the crisis in 2008 sug-gested that the EU was on the right track. The fall in private sector activity was to be countered by a stimulus from the pub-lic sector. The second depression, after 2010, followed after the reversal of that early approach. The European Commis-sion predicted at the time a fairly quick recovery. By 2013 it was more cautiously promising only that a turning point was at hand. Taken as a whole the EU econo-mies are facing the prospect of an agonis-ingly slow recovery in which several are being left behind. There is no likelihood of a return to the growth and employ-ment rates of the period up to 2008.
When the overall picture looks dis-appointing, emphasis has been placed from the European Commission on some particular countries that are presented as the way forward for all. Baltic Repub-lics have figured prominently.
These countries suffered an early and deep depression following restric-tions on the inward flows of credit that had sustained their economies up to 2007. They underwent some recovery from the depths of depression, albeit not growing as rapidly as in the years up to 2008. This was possible because of quite specific cir-cumstances. Their troubled banks were largely foreign-owned – with one signifi-cant exception in Latvia – and they mostly received external funding rather requir-ing state help. Their traditional export markets recovered quickly and there was some inward investment from manufac-turing companies. They also experienced high levels of emigration, equivalent to 8% of the population for Latvia, which reduced the need to pay benefits for the unemployed. Baltic Republics also received high levels of EU support, equiv-alent to up to 8% of GDP, which held back the fall in their investment levels.
It should not be difficult to find a better way forward for Europe Union.
Where to find the alternatives
Conclusions
25


Crisis takes its toll: disentangling five years of labour market developments
Introduction
The protracted economic crisis that first broke out in 2008 has taken a tremen-
dous toll on labour markets across the EU. Unemployment figures have skyrocketed,
while employment rates continue to fall. The crisis, it has been observed, has served
to accelerate previously existing structural trends, generating increasing inequality,
polarisation and atypical employment (ETUC and ETUI 2012). What is more, meas-
ures introduced in the effort to deal with the crisis have entailed, in some cases,
an adverse impact on employment. For instance, the flexibilisation of employment
promoted in the expectation of stimulating job creation may have the undesirable
side effect of exacerbating labour market segregation and further extending atypical
employment. The severe austerity measures enacted in the female-dominated public
sector, that have led to job losses and wage cuts in many EU countries, are likely to
affect gender gaps on the labour market as a whole, with knock-on effects also for
private-sector employment. With reference to developments such as these, we seek in
this chapter to ascertain and examine the condition of European labour markets as
the crisis moves through its sixth year.
Our analysis of the magnitude of the damage to employment is structured around
three main questions. First, what is the overall extent of job losses? Secondly, what are
the consequences on the structure of employment? Thirdly, how are different socio-
economic groups affected? In relation to this last question, our analysis includes a
particular focus on the labour market situation of young people.
Topics
> Overview of labour market developments 28> Shifts in the job structure 33> Developments in employment for young people 36> Developments in youth population 40> Conclusions 43
27

Employment levels declined sharply with the onset of economic crisis so that, between 2008 and 2010, the over-all employment rate in the EU28 fell by 1.7 percentage points. The average rate subsequently stagnated; in the second quarter of 2013 it was 64% for the work-ing population as a whole (15-64 years). As such, the Lisbon target of 70% by 2010 remains way beyond reach. The Europe2020 strategy equally appears highly ambitious in setting the employ-ment rate target for the population aged 20-64 at 75%. After dropping steadily since 2008, the employment rate for this section of population had fallen to 68% in the second quarter of 2013 (not shown).
However, the average employ-ment rate, having remained rather stable since 2010, conceals some of the signifi-cant changes in employment that have occurred across the EU28 within specific labour market groups.
The gender difference, first of all, is still highly apparent since we see, on average, 69% of working-age men but only 59% of working-age women in paid employment. This gap widens, however, even further – because of women’s higher
the EU28 (2013 Q2). However, for men the increase in the proportion of part-timers has accelerated considerably during the crisis, suggesting either that the wide-spread job losses have disproportionately affected full-time positions or that exist-ing full-time jobs have been turned into part-time ones. The total share of men and women engaged in part-time work has increased by 2 percentage points between 2008 and 2013.
The incidence of temporary employ-ment at the EU level showed a slight decrease between 2008 and 2013, revers-ing or at least attenuating the pre-crisis long-term upward trend. At the country level, however, patterns remain diverse. The share of temporary jobs actually declined in only seven out of the EU28 countries – including countries severely affected by the crisis (e.g. Spain, Greece, Portugal) and others (e.g. Germany) only moderately affected by it – while in the remaining twenty-one countries it either remained stable or increased (not shown).
Nearly 15% of European workers are self-employed. Own-account work is the most common and yet also regarded as the most precarious form of self-employ-ment; this form of work was reported by one in ten employed persons in the EU in 2013. After a rather slight increase at the beginning of the crisis (2008-2010), the rates of both overall self-employment and own-account work remained quite stable.
concentration in part-time jobs – when the labour market participation compari-son is made in terms of full-time equiva-lents. One impact of the crisis has in fact been a narrowing of gender gaps, with the gap in the employment rate having fallen by 3.5 percentage points between 2008 and 2013 (for unemployment rates see Figure 2.2). Yet this statistical ‘improve-ment’ results from a worsening of men’s situation rather than from any genuine improvement for women (Smith et al. 2013; Karamessini and Rubery 2013). Moreover, while the employment rate for men has been declining constantly since 2008 (more rapidly between 2008 and 2010 and more slowly between 2010 and 2013), the employment rate for women declined only during the first period and by 2013 it had returned to the pre-crisis level. The decline in employment is par-ticularly pronounced for the group with the lowest educational levels (pre-pri-mary, primary and lower secondary edu-cation), a category for which it shows no signs of reversal since 2008.
Non-standard forms of employment display a mixed pattern. On the one hand, the proportion of workers in part-time employment has increased considerably and in the second quarter of 2013 nearly one in five workers in the EU28 had a job that was part-time. This form of employ-ment remains highly gendered with, on average, 9% of employed men and 32% of employed women working part-time in
Employment still in crisis
2.Crisis takes its toll: disentangling five years of labour market developments
Overview of labour market developments
Figure 2.1 Developments in key employment indicators over the crisis, EU28, 2008, 2010, 2013, comparison of second quarters, population 15-64 years
Source: Eurostat (2013).Notes: 15-64 years.
0
5
10
15
20
25
30
35
40
0
10
20
30
40
50
60
70
80
total men women lowesteducationISCED 0-2
total men women total own-account
employment rate part-time temporaryemployment
self-employed
2008 Q2 2010 Q2 2013 Q2
28

The unemployment rate in the EU28 has been rising steadily since 2008. While the analysis of quarterly data (Figure 2.2) might suggest some declines in the second quarter of 2013, these are in all likelihood attributable to seasonal vari-ation for, when corresponding quarters of each year since 2008 are compared, it is clear that the unemployment rate has continued to climb, from 7% in 2008, to 10% in 2010 and 11% in 2013 (second quarters). This adds up to a dramatic total increase of 10 million – from 16.2 to 26.1 million – in the numbers of persons unemployed in the EU28 over the five-year period in question (not shown).
Gender differences in unemploy-ment rates not only narrowed – simi-larly, as we have seen, to the trend in employment rates (see Figure 2.1) – but, in this case, actually closed. As in the case of employment rates, here too this development is the result of worsen-ing labour market conditions for men. While female unemployment in the EU28 showed a large increase from 7% to 11% between 2008 and 2013, for men
drop in demand. Moreover, the quarterly variation in the unemployment rates of migrant workers is considerable and much greater than for any other group presented in Figure 2.2, suggesting that employment of migrants tends to be both seasonal and highly volatile.
Among persons with the lowest levels of educational achievement (pre-primary, primary and lower secondary) overall rates of unemployment tend to be higher. Moreover, the effect of the crisis has been more severe for this group than for those having gained at least upper secondary levels of education. Thus, the unemployment rate for those with the lowest educational achievement, which had been 11% in 2008, had risen to 16% by 2010 and 20% by 2013. Unemploy-ment among this group is a trend that appears to have been accelerating con-stantly throughout the period of crisis.
The share of the unemployed clas-sified as ‘long-term unemployed’ (i.e. out of paid employment for 12 months or longer) fell at the beginning of the crisis, driven down by large numbers of newly unemployed workers. By the sec-ond quarter of 2013, however, the long-term unemployment rate had reached 47%, well above pre-crisis levels, with virtually no difference between men and women; it remained on an upward trajectory.
the increase has been even steeper, from 6% to 11%.
The experiences of different sub-groups have been quite diverse. Youths, defined as those aged between 15 and 24, have chronically higher rates of unem-ployment, with steeper rates of increase during the crisis, than older age groups; in the second quarter of 2013 unemploy-ment among this particular age group reached 23%. A more detailed analysis of the labour market situation of youth will be developed later on in this chapter.
While migrant workers are also subject to higher-than-average rates of unemployment, there is a sizeable differ-ence in the situation of this group depend-ing on their region of origin, reflecting differences in the conditions of their access to the EU labour market. Among non-EU27 migrants the unemployment rate is much higher; it increased, what is more, from 14% in 2008 to 20% in 2010 and 22% in 2013 (second quarters). Among EU migrants, unemployment is not only lower but has also shown a somewhat lesser tendency to increase during the crisis; it has risen, even so, from 8% in 2008 to 12% in 2010 and 13% in 2013. For both groups, the increase in unemployment was sharpest at the early stages of economic crisis, between 2008 and 2009, exposing migrant workers’ high vulnerability and concentration in sectors – such as construction and indus-try – that were the first to experience a
Unemployment rates continue to climb
2.Crisis takes its toll: disentangling five years of labour market developments
Overview of labour market developments
Figure 2.2 Unemployment rates, %, EU 28, 2008 Q2 – 2013 Q2
Source: Eurostat (2013).
0
10
20
30
40
50
5
10
15
20
25
30
2008
Q2
2008
Q3
2008
Q4
2009
Q1
2009
Q2
2009
Q3
2009
Q4
2010
Q1
2010
Q2
2010
Q3
2010
Q4
2011
Q1
2011
Q2
2011
Q3
2011
Q4
2012
Q1
2012
Q2
2012
Q3
2012
Q4
2013
Q1
2013
Q2
youth (15-24)
migrant (non-EU27)
lowest education (ISCED 0-2)
migrant (EU27)
men
women
total
long-term unemployment as % ofunemployment (right-hand scale)
29

Figure 2.3 shows a country-by-country comparison of changes in employment rates during the crisis and the employment rates for 2013. The particular focus here is on comparison between changes that took place over two periods: 2008-2010 and 2010-2013 (data for second quarters).
Employment rates continue to vary greatly across EU member states. In 2013 (second quarter, latest available) the southern European cluster had the low-est average rates. While in Greece less than 50% of the working population was in paid employment, employment rates were particularly low also in Croatia, Spain and Italy. With the exceptions of Estonia, Latvia and the Czech Repub-lic, all post-2004 member states have rates that are below the EU28 average. The best performer was Sweden where, in 2013, nearly 75% of the working-age
France, Finland, Sweden and the UK, in all of which employment rates declined between 2008 and 2010 and subsequently showed marginal increases too small to ensure a return to pre-2008 levels.
In only four countries – Austria, Belgium, the Czech Republic and Hun-gary – can trends in employment rates be described in terms of recovery. In these countries employment rates declined only moderately over the first two years of the crisis and by 2013 they had either recovered or even recorded a net increase compared to 2008. Finally, in Germany, Luxembourg, Poland, Romania and Malta employment rates rose over both the periods considered here and in 2013 were therefore above their 2008 levels.
It is important to note that the trends in employment rates discussed in this section do not take account of changes in the volume of work when this is measured as the sum of the hours worked by the workforce as a whole. As a result of the implementation of working time reforms, the proliferation of short-time working measures, the spread of zero-hours contracts and the increase in part-time rates (Holst and Dörre 2013; Walling and Clancy 2010; Horemans and Marx 2013), a redistribution of work has taken place such that the total amount of available work is spread among more workers but in smaller portions. This issue is addressed in detail later on in this chapter (Figure 2.5).
population was in employment, followed by the Netherlands, Germany, Denmark, Austria, the UK and Finland, all with employment rates of above 70%.
Drops in employment were steep-est over the first two years of the crisis when the share of the employed in the total working-age population fell in 23 out of 28 EU member states. During that period (2008-2010), the Baltic States, Ireland and Spain were the hardest-hit countries. Germany, on the other hand, recorded a 1.3-percentage-point increase in its employment rate and in Poland, Romania, Malta and Luxembourg the employment rate either showed a slight increase or remained constant.
In the following period, between 2010 and 2013, employment rates contin-ued to decline in 10 EU member states. In Greece the 11-percentage-point drop was the largest, precipitating this country to bottom ranking in employment rates in the EU (2013Q2). Other countries with persistently declining employment rates since 2008 are Croatia, Spain, Italy, Bul-garia, Portugal, Cyprus, Slovenia, as well as Denmark and the Netherlands.
In the Baltic States – Estonia, Lat-via and Lithuania – after initially huge employment losses, rates climbed back up markedly between 2010 and 2013, albeit nowhere sufficiently to achieve a return to pre-crisis levels. A similar pattern, but with much less volatility in employment, can be observed in Slovakia, Ireland,
Employment rates continue to decline in many countries alongside some instances of improvement
2.Crisis takes its toll: disentangling five years of labour market developments
Overview of labour market developments
Figure 2.3 Developments in employment rates, 15-64, comparison of second quarters
Source: Eurostat (2013).
0
10
20
30
40
50
60
70
80
-15
-10
-5
0
5
10
15
GR HR ES IT HU BG PL SK IE RO MT PT CY BE SI LT EU28
FR LV LU CZ EE FI UK AT DK DE NL SE
change 2010-2013, pp. change 2008-2010, pp. 2013 Q2 (right-hand scale)
30

Unemployment rates have increased steeply since 2008 and there are no signs of any reversal of this upward trend across most of the EU member states. In fact, unemployment rates rose continu-ously over both the periods analysed here (2008-2010 and 2010-2013, comparisons based on second quarters) in 15 out of 28 EU countries, and in all EU28 countries – with the single exception of Germany – unemployment rates in 2013 were higher than in 2008. Several patterns emerge from the country-by-country compari-son of unemployment rate changes.
The greatest increases in unem-ployment rates over both periods were experienced, generally speaking, by the countries subject to IMF and EU reform prescriptions, including Greece, Spain, Portugal and Cyprus (Leschke et al. 2012), and also by Croatia. In Croatia and Spain the unemployment rate rose at a faster pace between 2008 and 2010, while in Cyprus, Portugal and Greece it was the period between 2010 and 2013 that saw an accelerated increase in unem-ployment. In 2013, in all these countries,
second quarter of 2013, Germany and Austria had the lowest levels of unem-ployment in the EU28, in both cases around 5%.
unemployment rates within the labour force as a whole (15-64 years) were above 15%. Greece and Spain represent the two most extreme cases; between 2008 and 2013 the unemployment rate in these two countries increased by 20 and 16 percent-age points respectively, to reach 27% in Greece and 26% in Spain.
In Estonia, Latvia and Lithuania, unemployment rates showed dramatic volatility, in parallel with tremendous variability in employment rates (see Fig-ure 2.3). After initial increases of 13-15 percentage points, between 2010 and 2013 unemployment again began to fall. The biggest drop, amounting to 11 per-centage points, was seen in Estonia.
In a considerable number of coun-tries unemployment rates showed an intermediate increase in the first two years of the crisis followed by a slow decrease. In all these countries, however, unemployment in 2013 remained at a higher level – on average just above 2 per-centage points higher – than before the onset of the crisis. This group includes the Nordic countries, Belgium, Malta and three eastern European countries (the Czech Republic, Slovakia and Hun-gary). Conversely, in Luxembourg the unemployment rate initially decreased, only to rise again subsequently, between 2010 and 2013.
Germany is the outlying case where the overall unemployment rate has been declining throughout the crisis. In the
Unemployment still on the rise in most parts of the EU
2.Crisis takes its toll: disentangling five years of labour market developments
Overview of labour market developments
Figure 2.4 Developments in unemployment rates, 15-64, comparison of second quarters
Source: Eurostat (2013).
-15
-10
-5
0
5
10
15
20
25
30
AT DE LU NL CZ MT DK RO UK BE EE SE FI FR HU SI PL EU28
LV LT IT BG IE SK CY HR PT ES GR
change 2008-2010, pp. change 2010-2013, pp. 2013 Q2 (right-hand scale)
31
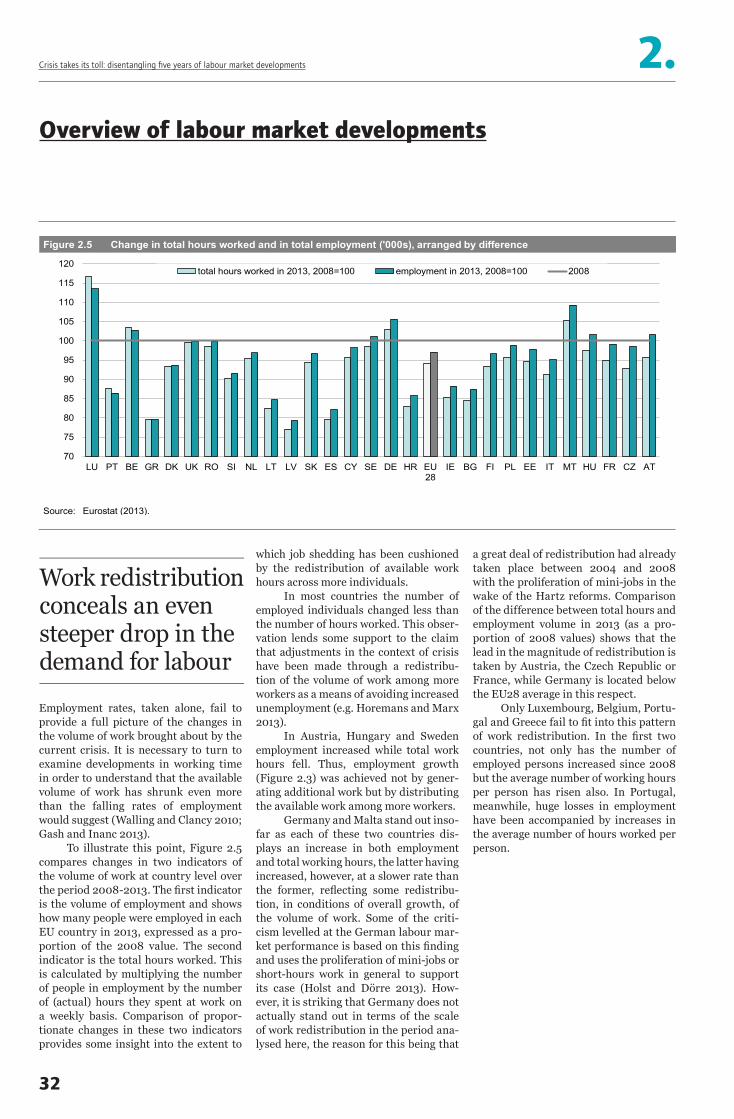
Employment rates, taken alone, fail to provide a full picture of the changes in the volume of work brought about by the current crisis. It is necessary to turn to examine developments in working time in order to understand that the available volume of work has shrunk even more than the falling rates of employment would suggest (Walling and Clancy 2010; Gash and Inanc 2013).
To illustrate this point, Figure 2.5 compares changes in two indicators of the volume of work at country level over the period 2008-2013. The first indicator is the volume of employment and shows how many people were employed in each EU country in 2013, expressed as a pro-portion of the 2008 value. The second indicator is the total hours worked. This is calculated by multiplying the number of people in employment by the number of (actual) hours they spent at work on a weekly basis. Comparison of propor-tionate changes in these two indicators provides some insight into the extent to
a great deal of redistribution had already taken place between 2004 and 2008 with the proliferation of mini-jobs in the wake of the Hartz reforms. Comparison of the difference between total hours and employment volume in 2013 (as a pro-portion of 2008 values) shows that the lead in the magnitude of redistribution is taken by Austria, the Czech Republic or France, while Germany is located below the EU28 average in this respect.
Only Luxembourg, Belgium, Portu-gal and Greece fail to fit into this pattern of work redistribution. In the first two countries, not only has the number of employed persons increased since 2008 but the average number of working hours per person has risen also. In Portugal, meanwhile, huge losses in employment have been accompanied by increases in the average number of hours worked per person.
which job shedding has been cushioned by the redistribution of available work hours across more individuals.
In most countries the number of employed individuals changed less than the number of hours worked. This obser-vation lends some support to the claim that adjustments in the context of crisis have been made through a redistribu-tion of the volume of work among more workers as a means of avoiding increased unemployment (e.g. Horemans and Marx 2013).
In Austria, Hungary and Sweden employment increased while total work hours fell. Thus, employment growth (Figure 2.3) was achieved not by gener-ating additional work but by distributing the available work among more workers.
Germany and Malta stand out inso-far as each of these two countries dis-plays an increase in both employment and total working hours, the latter having increased, however, at a slower rate than the former, reflecting some redistribu-tion, in conditions of overall growth, of the volume of work. Some of the criti-cism levelled at the German labour mar-ket performance is based on this finding and uses the proliferation of mini-jobs or short-hours work in general to support its case (Holst and Dörre 2013). How-ever, it is striking that Germany does not actually stand out in terms of the scale of work redistribution in the period ana-lysed here, the reason for this being that
Work redistribution conceals an even steeper drop in the demand for labour
2.Crisis takes its toll: disentangling five years of labour market developments
Overview of labour market developments
Figure 2.5 Change in total hours worked and in total employment ('000s), arranged by difference
Source: Eurostat (2013).
70
75
80
85
90
95
100
105
110
115
120
LU PT BE GR DK UK RO SI NL LT LV SK ES CY SE DE HR EU28
IE BG FI PL EE IT MT HU FR CZ AT
total hours worked in 2013, 2008=100 employment in 2013, 2008=100 2008
32
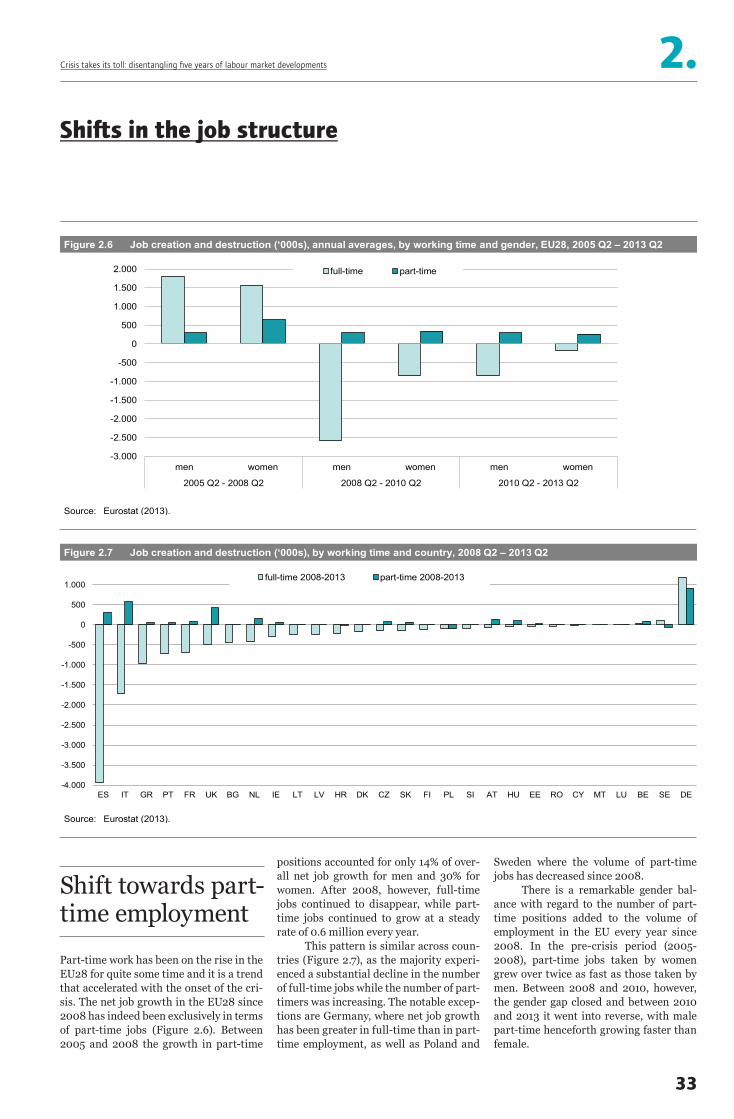
Shift towards part-time employment
2.Crisis takes its toll: disentangling five years of labour market developments
33
Figure 2.7 Job creation and destruction (‘000s), by working time and country, 2008 Q2 – 2013 Q2
Source: Eurostat (2013).
-4.000
-3.500
-3.000
-2.500
-2.000
-1.500
-1.000
-500
0
500
1.000
ES IT GR PT FR UK BG NL IE LT LV HR DK CZ SK FI PL SI AT HU EE RO CY MT LU BE SE DE
full-time 2008-2013 part-time 2008-2013
Part-time work has been on the rise in the EU28 for quite some time and it is a trend that accelerated with the onset of the cri-sis. The net job growth in the EU28 since 2008 has indeed been exclusively in terms of part-time jobs (Figure 2.6). Between 2005 and 2008 the growth in part-time
Sweden where the volume of part-time jobs has decreased since 2008.
There is a remarkable gender bal-ance with regard to the number of part-time positions added to the volume of employment in the EU every year since 2008. In the pre-crisis period (2005-2008), part-time jobs taken by women grew over twice as fast as those taken by men. Between 2008 and 2010, however, the gender gap closed and between 2010 and 2013 it went into reverse, with male part-time henceforth growing faster than female.
positions accounted for only 14% of over-all net job growth for men and 30% for women. After 2008, however, full-time jobs continued to disappear, while part-time jobs continued to grow at a steady rate of 0.6 million every year.
This pattern is similar across coun-tries (Figure 2.7), as the majority experi-enced a substantial decline in the number of full-time jobs while the number of part-timers was increasing. The notable excep-tions are Germany, where net job growth has been greater in full-time than in part-time employment, as well as Poland and
Shifts in the job structure
Figure 2.6 Job creation and destruction (‘000s), annual averages, by working time and gender, EU28, 2005 Q2 – 2013 Q2
Source: Eurostat (2013).
-3.000
-2.500
-2.000
-1.500
-1.000
-500
0
500
1.000
1.500
2.000
men women men women men women
2005 Q2 - 2008 Q2 2008 Q2 - 2010 Q2 2010 Q2 - 2013 Q2
full-time part-time
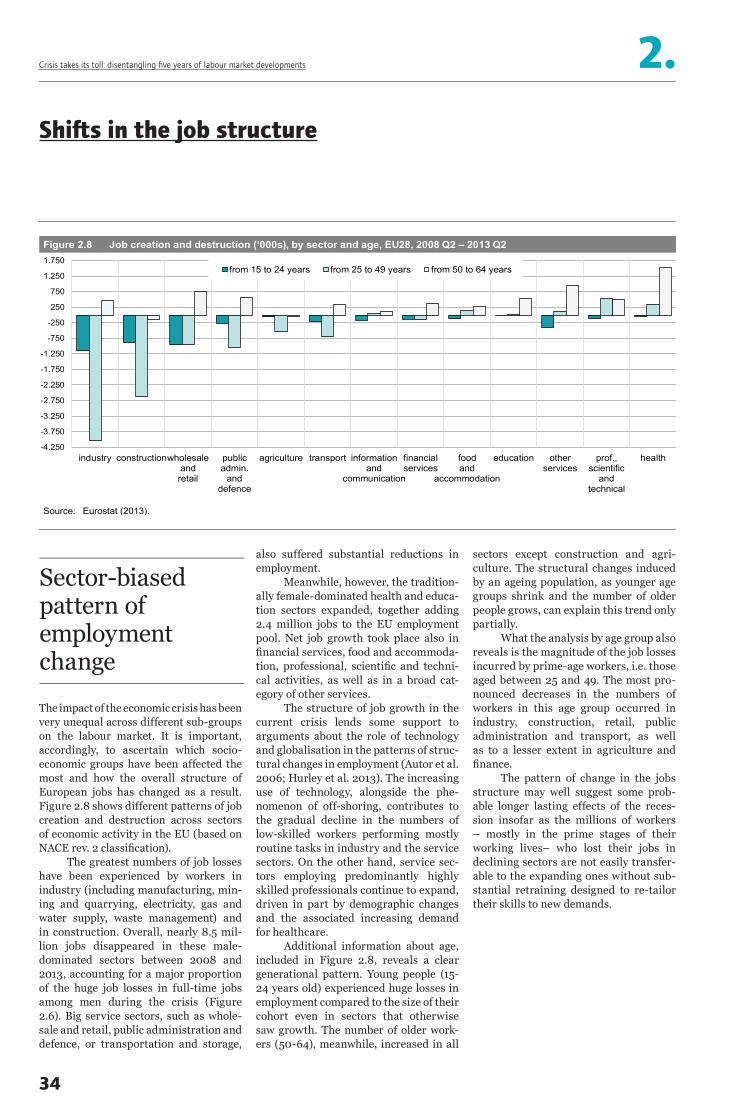
The impact of the economic crisis has been very unequal across different sub-groups on the labour market. It is important, accordingly, to ascertain which socio-economic groups have been affected the most and how the overall structure of European jobs has changed as a result. Figure 2.8 shows different patterns of job creation and destruction across sectors of economic activity in the EU (based on NACE rev. 2 classification).
The greatest numbers of job losses have been experienced by workers in industry (including manufacturing, min-ing and quarrying, electricity, gas and water supply, waste management) and in construction. Overall, nearly 8.5 mil-lion jobs disappeared in these male-dominated sectors between 2008 and 2013, accounting for a major proportion of the huge job losses in full-time jobs among men during the crisis (Figure 2.6). Big service sectors, such as whole-sale and retail, public administration and defence, or transportation and storage,
sectors except construction and agri-culture. The structural changes induced by an ageing population, as younger age groups shrink and the number of older people grows, can explain this trend only partially.
What the analysis by age group also reveals is the magnitude of the job losses incurred by prime-age workers, i.e. those aged between 25 and 49. The most pro-nounced decreases in the numbers of workers in this age group occurred in industry, construction, retail, public administration and transport, as well as to a lesser extent in agriculture and finance.
The pattern of change in the jobs structure may well suggest some prob-able longer lasting effects of the reces-sion insofar as the millions of workers – mostly in the prime stages of their working lives– who lost their jobs in declining sectors are not easily transfer-able to the expanding ones without sub-stantial retraining designed to re-tailor their skills to new demands.
also suffered substantial reductions in employment.
Meanwhile, however, the tradition-ally female-dominated health and educa-tion sectors expanded, together adding 2.4 million jobs to the EU employment pool. Net job growth took place also in financial services, food and accommoda-tion, professional, scientific and techni-cal activities, as well as in a broad cat-egory of other services.
The structure of job growth in the current crisis lends some support to arguments about the role of technology and globalisation in the patterns of struc-tural changes in employment (Autor et al. 2006; Hurley et al. 2013). The increasing use of technology, alongside the phe-nomenon of off-shoring, contributes to the gradual decline in the numbers of low-skilled workers performing mostly routine tasks in industry and the service sectors. On the other hand, service sec-tors employing predominantly highly skilled professionals continue to expand, driven in part by demographic changes and the associated increasing demand for healthcare.
Additional information about age, included in Figure 2.8, reveals a clear generational pattern. Young people (15-24 years old) experienced huge losses in employment compared to the size of their cohort even in sectors that otherwise saw growth. The number of older work-ers (50-64), meanwhile, increased in all
Sector-biased pattern of employment change
2.Crisis takes its toll: disentangling five years of labour market developments
Shifts in the job structure
Figure 2.8 Job creation and destruction (‘000s), by sector and age, EU28, 2008 Q2 – 2013 Q2
Source: Eurostat (2013).
-4.250
-3.750
-3.250
-2.750
-2.250
-1.750
-1.250
-750
-250
250
750
1.250
1.750
industry constructionwholesaleandretail
publicadmin.
anddefence
agriculture transport informationand
communication
financialservices
foodand
accommodation
education otherservices
prof.,scientific
andtechnical
health
from 15 to 24 years from 25 to 49 years from 50 to 64 years
34

2.Crisis takes its toll: disentangling five years of labour market developments
35
Crisis-induced shifts in occupations
Figure 2.10 Part-time rate, change by occupation and gender, EU28, 2008 Q2 – 2013 Q2
Source: Eurostat (2013).
0
10
20
30
40
50
60
men women men women men women men women men women men women men women men women men women
craft andrelatedtrades
workers
managers plant andmachine
operators, andassemblers
techniciansand
associateprofessionals
clericalsupportworkers
elementaryoccupations
skilledagricultural,forestry and
fishery workers
service andsales
workers
professionals
2008 Q2 2013 Q3
The occupational structure has changed as the effects of the crisis spread and develop. Two occupational groups: service and sales workers, and professionals, have recorded some overall growth since 2008. All other
associate professional, clerks, and man-agers – shrank by a total of seven million jobs. This pattern is a reflection, to some extent, of sector-specific responses to the crisis.
Moreover, there has been a substan-tial increase in the proportion of part-time work within ‘elementary occupations’ (Figure 2.10), where part-time rates were as high, in 2013, as 54% for women and 22% for men. These percentages are higher than in any other occupational category, leading to a concentration of low hours and low incomes among such workers.
occupations were characterised by a net decline in employment. It is noteworthy that among the declining occupations the greatest job losses took place in the more recent period (2010-2013) rather than dur-ing the early stage of the crisis (2008-2010).
For men, the greatest decline in employment between 2008 and 2010 was in ‘craft and related trades’ occupations; while more recently among managers. Among women, decline in employment was modest over the 2008-2010 period, while between 2010 and 2013 three particularly hard-hit occupations – technicians and
Shifts in the job structure
Figure 2.9 Job creation and destruction (‘000s), by occupation and gender, EU28, 2008 Q2 – 2013 Q2
Source: Eurostat (2013).
-4.000
-3.000
-2.000
-1.000
0
1.000
2.000
3.000
4.000
5.000
craft andrelated trades
workers
managers plant andmachineoperators
technicians andassociate
professionals
clericalsupportworkers
elementaryoccupations
agriculturalworkers
service andsales workers
professionals
men, change 2008-2010 men, change 2010-2013 women, change 2008-2010 women, change 2010-2013

2.Crisis takes its toll: disentangling five years of labour market developments
36
Developments in employment for young people
Figure 2.11 shows developments in unem-ployment among 15-24 year-olds (‘young people’) across member states (for the EU28 average see Figure 2.2) expressed both in rates and in absolute numbers.
unemployment rate among this age group is often higher than that of the labour force as a whole (see Figure 2.3), it is apparent that ‘young adults’ find themselves in a highly vulnerable position across Europe.
In 20082q young women in both the 15-24 and 25-29 age groups had slightly higher unemployment rates than young men. Data for 2010 and 2013 show a reverse trend with young men having higher unemployment rates; however, in both age groups, the steady increase in female unemployment is very likely to reduce this gap.
During the first phase of the crisis the numbers of unemployed people in this age group increased in most countries, except for Germany. In the second phase of the crisis the number of young unemployed started to decrease, expect in some coun-tries which included Italy, Spain, the UK and Greece.
Figure 2.12 shows that, even among the ‘young adult’ population aged between 25 and 29, unemployment rates are on the rise and have reached very high levels in several countries (34.4% in Spain and 44.4% in Greece in 2013 2q). Insofar as the
Figure 2.11 Youth unemployment rate and absolute numbers ('000s), 15-24, 2008 Q2, 2010 Q2, 2013 Q2
0
15
30
45
60
75
0
100
200
300
400
500
600
700
800
900
1.000
DE AT NL DK MT EE CZ LU LV UK LT BE FR RO SI PL FI HU SE BG IE SK PT IT CY HR ES GR
2008 Q2 2010 Q2 2013 Q2 2013 Q2, % (right-hand scale)
Source: Eurostat Labour Force Survey (2013).
Similar patterns for ‘young people’ and ‘young adults’
Figure 2.12 Youth unemployment rate and absolute numbers ('000s), 25-29, 2008 Q2, 2010 Q2, 2013 Q2
0
15
30
45
60
75
0
100
200
300
400
500
600
700
800
900
1.000
MT AT DE CZ NL EE DK UK FI SE LV LU BE RO HU LT FR PL IE BG SI SK CY HR IT PT ES GR
2008 Q2 2010 Q2 2013 Q2 2013 Q2, % (right-hand scale)
Source: Eurostat (2013).Notes: data missing for MT (absolute numbers); data missing for EE (absolute numbers 2008 Q2).

2.Crisis takes its toll: disentangling five years of labour market developments
37
An alternative indicator to the youth unemployment rate is the youth unem-ployment ratio indicating the extent of unemployment within the 15-24 youth population taken as a whole. While the resulting data (not shown) appear less dramatic, the distribution of countries across the board does not differ greatly from the picture provided by the youth unemployment rates (Figure 2.11). In 2012, Greece and Spain had the high-est unemployment ratios, respectively 16% and 20.6%, meaning that, in Spain, one in five young persons aged 15- 24 is unemployed. At the other end of the spec-trum, the youth unemployment ratio for Germany, Luxembourg and Austria was around 5% or less. Since the beginning of the crisis the youth unemployment ratio has increased in most countries, strik-ingly so in Spain and Greece.
While there are some divergent views on the magnitude of youth (15-24) unemployment and its relative impor-tance compared to the rate among the adult (25-64) population, there is a broad consensus concerning the lengthening
is not apparent from the available figures whether young people in these countries are subject to a higher number of short spells of unemployment.
The highest recorded rate of long-term unemployment is for Slovakia where above 60% of unemployed young people are long-term unemployed. Very high shares – between 45% and 55% – are found also in Croatia, Italy, Greece and Bulgaria.
Figure 2.13 suggests that a combina-tion of labour market policies specifically designed to tackle and prevent a further increase of long-term unemployment is required in several European countries. When considering the slow pace of job creation in most of the countries (see Fig-ure 2.7), it seems unlikely that work-first policies – i.e. active labour market poli-cies designed to achieve a quick return of young people to the labour market – are the most appropriate response to these increasing rates of long-term unemploy-ment. Training policies and individual-ised and comprehensive approaches to the variety of social and health problems that afflict these young people may well prove more efficient in the long term.
of unemployment spells and its nega-tive effects on the long term, particularly in terms of wellbeing and future earn-ings (Scarpetta et al. 2010; O’Higgins 2012; Cockx and Picchio 2011; Blanch-flower 2010). Figure 2.13 shows rates of long-term unemployment (more than 12 months of unemployment) as a share of young people unemployed. In the first year of the crisis (not shown), in those countries highly affected by the crisis, the relative share of long-term unemploy-ment decreased due to a high inflow of ‘newly’ unemployed workers. However, in 2010, in these countries – for instance, Italy and Spain – the share of long-term unemployed youth was already on the rise and it increased again in 2013 (sec-ond quarter) suggesting that young peo-ple, once unemployed, do have difficulty in finding their way back on to the labour market.
The incidence of long-term unem-ployment partially follows the youth unemployment rates (see Figure 2.11). A figure of less than 5% for Sweden and Fin-land suggests that youth unemployment in these countries is mainly short-term and temporary. The same is true of Den-mark, the Netherlands and Austria, all of which also have low shares of long-term unemployment at levels that changed only very slightly in the course of the cri-sis. Better job opportunities and more efficient activation measures can par-tially explain these low rates. However, it
Long-term unemployment a particular scourge
Figure 2.13 Long-term unemployment among young people aged 15-24 as a % of the total youth unemployment –2013 Q2 and change in pp. 2008-2010 and 2010-2013
-15-10-505
101520253035404550556065
FI SE DK NL AT LT DE LU FR UK HU BE CZ LV CY PL EU28
IE PT SI RO ES EE BG GR IT HR SK
change 2008-2010 change 2010-2013 2013Q2
Source: Eurostat Labour Force Survey (2013).Notes: 2008 figures for FI, CY, LV and LT are from 2007; missing data for MT and changes for DK.
Developments in employment for young people

The youth/adult unemployment ratio is calculated by dividing the youth unem-ployment rate by the adult unemploy-ment rate. This ratio is often proposed as a complementary measure to aid in understanding the relative magnitude of youth unemployment compared with the adult unemployment rate (O’Higgins 2012) and to indicate whether one age group is disproportionately affected by overall labour market trends. Figure 2.14 shows the youth/adult unemployment ratio for the EU28 between 2003 and 2013 (annual data, second quarter for 2013) as well as the speed of change of the unemployment rates of the two groups measured as the percentage change on the previous year.
The youth/adult ratio appears quite stable over time with youth unemploy-ment levels that are approximately twice as high as adult ones. The fairly stable ratio can be explained by the similar pat-terns and speed of change in unemploy-ment rates in both age groups.
The unemployment rate decreased slightly more rapidly for adults than for
in 2012, subsequently remaining almost stable in the second quarter of 2013. The speed of change of the adult rate has been similar but somewhat more volatile: it increased by 9.1% in 2010, remained sta-ble in 2011 and increased again by 9.5% and then by more than 4.3% in the fol-lowing two years.
The fact that the youth/adult unem-ployment ratio has remained almost stable since 2009 suggests that, across Europe, both age groups have been hit hard by the crisis. Although the posi-tion of the young unemployed popula-tion relative to adults has improved over time, the rate of unemployment has been continuously on the increase for both groups. This could be an interesting indi-cator, illustrating the impact of the crisis on youth compared to adults; however, in order to better grasp the absolute size of the active population affected by unem-ployment other indicators need to be included.
youths in the years preceding the crisis (lowest level in 2007 with a drop of 27.7% for adults and 10.9% for youths), mean-ing that even before the crisis the youth workforce suffered more from unem-ployment than did adults and that these two groups displayed differing reactions to the favourable economic situation up until 2007.
In 2008 the youth/adult ratio increased because in 20082q the pro-portion of young people unemployed remained stable (0.6% increase) while it slightly decreased for adults (-3.2% com-pared to 2007). In that year the crisis had not yet hit the labour market.
Subsequently, however, both the youth and adult unemployment rates started to follow similar patterns, yet characterised by slightly different speeds of change. In 2009 when the crisis hit, the increase in the unemployment rate among young people and adults was similar (27.6% for youth and 28.3% for adults). In subsequent years, the speed of change in unemployment has been slightly more favourable for young peo-ple than for adults. The unemployment rate of young people increased at a slower pace, probably due to the already very high rates in some countries as well as because of the phenomenon whereby young unemployed persons became inac-tive and left the workforce. The propor-tion of young unemployed increased steadily: by 5% in 2010; 2.4% in 2011; 7%
Similar patterns, different speeds, similar risks
2.Crisis takes its toll: disentangling five years of labour market developments
Developments in employment for young people
Figure 2.14 Youth/adult unemployment ratio - 2003-2013
Source: Eurostat Labour Force Survey (2013); authors’ calculations.Note: data for 2013 are from the second quarter.
-1,5
-1,0
-0,5
0,0
0,5
1,0
1,5
2,0
2,5
3,0
-15
-10
-5
0
5
10
15
20
25
30
2003 2004 2005 2006 2007 2008 2009 2010 2011 2012 2013
Y15-24 Y25-64 youth/adults ratio (right axis)
38
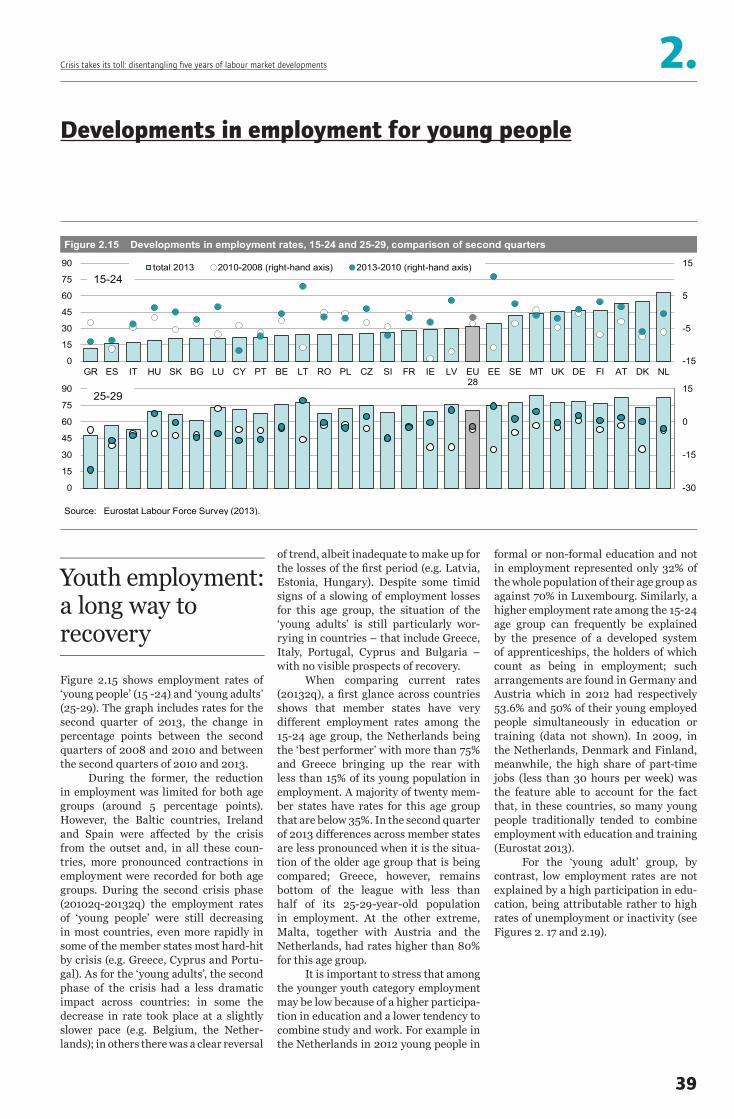
Figure 2.15 shows employment rates of ‘young people’ (15 -24) and ‘young adults’ (25-29). The graph includes rates for the second quarter of 2013, the change in percentage points between the second quarters of 2008 and 2010 and between the second quarters of 2010 and 2013.
During the former, the reduction in employment was limited for both age groups (around 5 percentage points). However, the Baltic countries, Ireland and Spain were affected by the crisis from the outset and, in all these coun-tries, more pronounced contractions in employment were recorded for both age groups. During the second crisis phase (20102q-20132q) the employment rates of ‘young people’ were still decreasing in most countries, even more rapidly in some of the member states most hard-hit by crisis (e.g. Greece, Cyprus and Portu-gal). As for the ‘young adults’, the second phase of the crisis had a less dramatic impact across countries: in some the decrease in rate took place at a slightly slower pace (e.g. Belgium, the Nether-lands); in others there was a clear reversal
formal or non-formal education and not in employment represented only 32% of the whole population of their age group as against 70% in Luxembourg. Similarly, a higher employment rate among the 15-24 age group can frequently be explained by the presence of a developed system of apprenticeships, the holders of which count as being in employment; such arrangements are found in Germany and Austria which in 2012 had respectively 53.6% and 50% of their young employed people simultaneously in education or training (data not shown). In 2009, in the Netherlands, Denmark and Finland, meanwhile, the high share of part-time jobs (less than 30 hours per week) was the feature able to account for the fact that, in these countries, so many young people traditionally tended to combine employment with education and training (Eurostat 2013).
For the ‘young adult’ group, by contrast, low employment rates are not explained by a high participation in edu-cation, being attributable rather to high rates of unemployment or inactivity (see Figures 2. 17 and 2.19).
of trend, albeit inadequate to make up for the losses of the first period (e.g. Latvia, Estonia, Hungary). Despite some timid signs of a slowing of employment losses for this age group, the situation of the ‘young adults’ is still particularly wor-rying in countries – that include Greece, Italy, Portugal, Cyprus and Bulgaria – with no visible prospects of recovery.
When comparing current rates (20132q), a first glance across countries shows that member states have very different employment rates among the 15-24 age group, the Netherlands being the ‘best performer’ with more than 75% and Greece bringing up the rear with less than 15% of its young population in employment. A majority of twenty mem-ber states have rates for this age group that are below 35%. In the second quarter of 2013 differences across member states are less pronounced when it is the situa-tion of the older age group that is being compared; Greece, however, remains bottom of the league with less than half of its 25-29-year-old population in employment. At the other extreme, Malta, together with Austria and the Netherlands, had rates higher than 80% for this age group.
It is important to stress that among the younger youth category employment may be low because of a higher participa-tion in education and a lower tendency to combine study and work. For example in the Netherlands in 2012 young people in
Youth employment: a long way to recovery
2.Crisis takes its toll: disentangling five years of labour market developments
Developments in employment for young people
Figure 2.15 Developments in employment rates, 15-24 and 25-29, comparison of second quarters
-15
-5
5
15
0
15
30
45
60
75
90
GR ES IT HU SK BG LU CY PT BE LT RO PL CZ SI FR IE LV EU28
EE SE MT UK DE FI AT DK NL
total 2013 2010-2008 (right-hand axis) 2013-2010 (right-hand axis)15-24
Source: Eurostat Labour Force Survey (2013).
-30
-15
0
15
0
15
30
45
60
75
9025-29
39

Figures 2.16 and 2.17 show ‘young peo-ple’ (aged 15-24) and ‘young adults’ (aged 25-29) who were Not in Employment, Education or Training (NEET) in 2008, 2010 and 2012.
The NEET indicator is calculated by Eurostat by placing as the denomina-tor the whole population of the respective age group and as the numerator those young people who either are unemployed or are inactive, i.e., in the latter case, young people who are not part of the labour force because they are not avail-able to join the labour market.
These two graphs tell at least three stories. Firstly, and most importantly, ‘young adults’ (Figure 2.17) suffer from very high rates of NEETs, in many cases higher than those of the ‘young people’. However, the distribution of countries across the board is pretty similar in both cases with Greece, Bulgaria and Italy scoring the three highest double-digit figures for both age groups (around or higher than 30% for ‘young adults’ and
higher than 20% for ‘young people’), and with the Netherlands, Austria and Lux-embourg displaying the lowest rates.
In 2012 the share of inactive NEETs among ‘young adults’ accounted for 52% of the whole NEET share for that group and in 2011 27.95% of NEETs aged between 25 and 29 years had no work experience whatsoever (Mascherini et al. 2012). The proportion of inactivity has decreased fast during the crisis (inac-tives accounted for 64% of ‘young adult’ NEETs in 2008 in the EU28) as the share of unemployed has been growing more rapidly (data not shown), in all countries except Luxembourg and Germany where the relative share of inactives increased due to a decrease in unemployment.
Moreover, the high rates of NEETs for this 25-29 age group are strongly gen-der-biased as in all European countries in 2012 the share of young women NEET is higher than that of men (not shown). The gap varies across countries, being close to zero in Spain and Ireland where rates for both men and women are very high (in 2012 in Spain rates were 28.5% for men and 28.9% for women; in Ireland 25.4% for men and 25.5% for women). In the EU28 25.4% of young women were NEETs, a much higher rate than for young men (15.9%). In 2012 the gap was higher than 20 percentage points in Slovakia and in the Czech Republic and in eight countries it was higher than 10 percentage points.
Young adults display high incidence of NEETs
2.Crisis takes its toll: disentangling five years of labour market developments
Developments in youth population
Figure 2.16 Developments in NEETs rates, 15-24, by educational attainment, 2008-2012
0
5
10
15
20
25
NL LU AT DK DE SE FI CZ SI MT LT PL FR BE EE EU28
SK UK PT HU LV CY HR RO IE ES GR IT BG
2008 2010 2012 total 20120-2 ISCED
Source: Eurostat, Education and Training (2013).
0
5
10
15
20
25
3-6 ISCED
40

A second point to emphasise in relation to NEETs is that both ‘young people’ and ‘young adults’ having at least an upper secondary educational attainment dis-play, on average at the EU28 level, a higher rate of NEETs than their peers with lower educational attainments. Differences between ‘young adults’ with at least upper secondary education or higher and those with a lower educa-tional attainment are striking in several countries including the Czech Republic, Slovenia, Cyprus, Slovakia, Greece, and Poland but also Finland. When broken down by gender, the gap between low-educated women and low-educated men in 2012 was in favour of young women in nine countries.
The situation among the ‘young people’ is pretty similar. Here too those with upper secondary or higher edu-cational attainment (corresponding to level 3 to 6 of the International Stand-ard Classification of Education – ISCED) often have higher rates of NEETs. Differ-ences between the medium/high-skilled and the low-skilled (with at most lower
and 2010 rates increased on average by 1.1 percentage points for the lower edu-cated while they increased by 7 percent-age points, on average, for the medium/highly skilled. In the second phase of the crisis (2010-2012), the pace of increase speeded up for the lower skilled (increased by 2.2 percentage points on average) while rates remained stable, but higher, for the medium/highly skilled. Indeed, NEETs are a heterogeneous pop-ulation and educational attainment is not always an explanatory factor of labour market exclusion; moreover, these cross-sectional figures fail to tell us whether ‘NEET’ status is temporary or long-term, particularly in the case of those with at least an upper secondary educational attainment.
However this may be, it would appear that for neither ‘young people’ nor ‘young adults’ does education provide a fully reliable shelter against unemploy-ment and inactivity.
secondary education, ISCED 0-2) are, however, less dramatic than for the older age group; however, in the Baltic coun-tries as well as in several others – which include Greece, Croatia, Poland, Slovakia, Bulgaria and Cyprus – the gap between the two educational attainment groups has been increasing rapidly during the crisis, suggesting a stronger impact dur-ing the second phase of the crisis for the more skilled in these countries.
The third important point to note is that the crisis had a different impact on the two age groups and on low- and medium/high-skilled young people.
In most countries, both ‘young people’ and ‘young adults’ experienced increases in NEET rates in the first phase of the crisis; however, the low and the medium/high skilled were affected to a different extent: low-skilled youth aged between 15 and 24 recorded lower increases (with Spain recording the high-est change of 2.3 percentage points) com-pared to the medium/high skilled young people (in Bulgaria the rate increased by 4.4 percentage points). In the second phase of the crisis (2010-2012) shares for both educational attainment groups remained fairly stable, with the excep-tion of Greece whose share of medium/highly educated ‘young people’ increased dramatically compared to 2010.
Among the ‘young adults’, changes for the low and the medium/high-skilled were markedly higher. Between 2008
But what if education were not the key?
2.Crisis takes its toll: disentangling five years of labour market developments
Developments in youth population
Figure 2.17 Developments in NEETs rates, 25-29, by educational attainment, 2008-2012
0
10
20
30
40
SE NL AT LU DK DE MT FI SI UK BE PT CY CZ EE FR LT EU28
LV PL RO HR IE HU SK ES IT BG GR
2008 2010 2012 total 20120-2 ISCED0-2 ISCED0-2 ISCED3-6 ISCED0-2 ISCED0-2 ISCED
Source: Eurostat, Education and Training (2013).
0
10
20
30
400-2 ISCED0-2 ISCED0-2 ISCED3-6 ISCED0-2 ISCED3-6 ISCED
41

2.Crisis takes its toll: disentangling five years of labour market developments
Developments in youth population
42
Figures 2.18 and 2.19 show the labour market position of the ‘young people’ and ‘young adult’ populations in the EU28. In 2012 the share of ‘young people’ (15-24) in education reached 53.9 %. This higher share cannot be attributed to the crisis alone – although its faster increasing trend compared to the years preceding the crisis seems a rather likely correlation – but it
the onset of crisis there have been more young adults not employed who are also in education or training, probably due to an increasing participation in active labour market policies. However, there is a steady decrease in young adults receiving train-ing or education while being employed.
results also from a decreasing tendency to drop out, a steadily increasing participa-tion in higher education, and an increased share of unemployed taking part in active labour market programmes (such as train-ing). The share of NEETs follows a simi-lar upward pattern, reaching in 2012 the same level as in 2003 (13.1 %). The share of young people in employment shows a reverse trend shrinking to 19.2% in 2012.
In 2012 a majority of ‘young adults’ (25-29) were in employment, though the share has been decreasing since 2008 and one in five are NEETs (20.6%). Since
Figure 2.18 Population by employment and education and training status, 15-24, EU 28
Source: Eurostat, Education and Training (2013).
12,2 12,7 13,4 13,9 14,5 14,9 14,3 13,6 13,5 13,5
23,5 22,9 22,2 22,5 22,6 22,4 20,6 20,3 20,1 19,2
51,2 51,3 51,4 51,6 51,5 51,4 52,3 53,1 53,4 53,9
13,1 12,8 12,7 11,7 10,9 10,9 12,4 12,8 12,9 13,1
0%
10%
20%
30%
40%
50%
60%
70%
80%
90%
100%
2003 2004 2005 2006 2007 2008 2009 2010 2011 2012
student and employed employed student neither student nor employed (NEETs)
Back to education?
Figure 2.19 Population by employment and education and training status, 25-29, EU 28
Source: Eurostat, Education and Training (2013).
10,3 10,8 11,8 12,0 12,3 12,4 12,3 12,0 11,8 11,7
62,4 62,1 61,3 62,4 62,9 63,0 60,8 60,1 60,2 59,3
7,3 7,1 7,3 7,1 7,0 7,0 7,5 7,9 8,0 8,1
19,9 19,7 19,2 18,1 17,3 17,0 19,0 19,7 19,8 20,6
0%
10%
20%
30%
40%
50%
60%
70%
80%
90%
100%
2003 2004 2005 2006 2007 2008 2009 2010 2011 2012
student and employed employed student neither student nor employed (NEETs)

2.Crisis takes its toll: disentangling five years of labour market developments
the crisis. In the period 2010-2013 the net growth of part-time jobs was higher for men than for women, representing a reversal of a longstanding trend.
This bleak conclusion can be extended to the labour market prospects for young people and young adults. Data show that in most of the member states youth unemployment rates are still ris-ing, albeit at a slower pace compared to the first years of the crisis; the trend shown by employment rates is equally negative, for only a few countries show timid signs of a reversal of the downward trend.
The group consisting of young adults aged between 25 and 29 is fre-quently not addressed in the context of considerations pertaining to youth; how-ever, it is clear that the crisis has placed these slightly older young people too in an increasingly difficult labour market situ-ation, despite the fact that they are more likely to have already gained some form of relevant labour market experience.
Looking at the youth and young adult populations as a whole, it becomes clear that the biggest contraction is that which affects employment: young peo-ple have indeed increased their par-ticipation in education and training, but they have equally increased their likeli-hood of becoming inactive or long-term unemployed. The likelihood of becom-ing trapped in inactivity and unemploy-ment represents a particular hazard for women aged between 25 and 29 years old in southern Europe (Greece, Italy and Spain) but also in some eastern European countries, such as Hungary, Slovakia, Bulgaria, Poland and the Czech Republic.
Current active labour market poli-cies – such as the Youth Guarantee (Euro-pean Commission 2012; European Coun-cil 2013) – generally focus on job-search behaviour, skills, and the provision of a first work experience. They tend to con-centrate, in other words, on the supply rather than the demand side. Although such solutions may help to reduce short-term unemployment, they are not neces-sarily appropriate for facing the prospect of becoming trapped in temporary and low quality jobs against the background of a necessarily bleak outlook, given the still very slow rate of job creation.
However, a simple analysis of labour market participation patterns is in many respects misleading, for it conceals more profound and structural changes. Faced with the unprecedented losses in full-time jobs, the EU’s capacity for job crea-tion is currently weak and newly created jobs are predominantly part-time. In the second quarter of 2013 nearly one in five workers in the EU held a part-time job. Accordingly, the amount of work availa-ble to individual workers (i.e. total hours worked in the economy) has shrunk even more than the employment figures taken alone would suggest. The findings here reveal a particularly worrying pattern among the lowest skilled manual workers employed in the ‘elementary occupations’ where the share of part-time jobs has increased the most, resulting, for work-ers in this group, in an accumulated dis-advantage of low incomes and low work hours.
The patterns of job creation and destruction varied greatly across sec-tors and occupations. The greatest job losses have been recorded in the male-dominated industry and construction sectors, and among ‘craft and related trades’ workers, while the female-domi-nated health and education sectors have been expanding. This structural pattern of job loss may well slow down the recov-ery process as workers from the declin-ing sectors and occupations are not easily transferable into jobs in the expanding sectors which require quite different skills.
One impact of the crisis has been a narrowing of gender gaps in employment patterns. This has been achieved, how-ever, by a deterioration in the employ-ment situation of men rather than by any improvement in that of women. For instance, while the gender difference in employment rates is still substantial with, on average, 69% of men and only 59% of women in paid work in 2013, this gap actually narrowed by 3.5 percentage points over the 2008-2013 period. The gender gap in unemployment rates even closed completely at the EU28 level as a result of steeply rising unemployment figures for men. Moreover, increases in the proportion of part-time employment among men accelerated markedly during
As Europe struggles through the sixth year of the crisis, little improvement is in sight for its labour markets. In terms of the impact of the crisis on the volume of work in the EU, analysis of unemployment and employment figures only begins to reveal the magnitude of the disaster. While the average over-all employment rate (working popula-tion aged 15-64) in the EU28 has been stagnating at a low level of 64%, the rate among men continues to fall. Unem-ployment rates have been rising steadily since 2008 and in 2013 (second quar-ter, latest available) had climbed to an EU28 average of 11%. Overall, between 2008 and 2013 the pool of unemployed in the European Union as a whole grew by 10 million people. The proportion of long-term unemployed continues to soar and in 2013, at 47%, was well above the pre-crisis levels, indicating the endur-ing long-term negative consequences of the crisis for the labour markets. What is more, the EU remains far from the employment targets set by both the 2010 Lisbon strategy and its successor the Europe 2020 strategy.
Country performance varies con-siderably. In 19 out of the EU28 countries employment rates have either continued to fall since 2008, or have recently begun to show some slight improvement while remaining below pre-crisis levels. More-over, unemployment rates have been on a continuous upward trajectory in 15 EU countries, while in all countries except Germany they were higher in 2013 than in 2008. In 2013 national unemployment rates ranged from a best performance of 5% in Austria and Germany to cata-strophic levels of 26% in Spain and 27% in Greece.
Volume and structure of employment deeply shaken by the crisis
Conclusions
43


Developments in inequality and social protection in Europe
Introduction
In 2010, in response to what was arguably a crisis of globalisation, the EU launched
the Europe 2020 strategy for growth as a successor to its only partially successful
Lisbon strategy (ETUI/ETUC 2009). ‘Inclusive growth’ was one of the three objec-
tives of the new strategy and a stated ‘headline target’ was to lift 20 million people
out of poverty in the EU. This goal is consistent with a longstanding objective of Euro-
pean integration, namely to drive upward convergence of living standards among EU
citizens.
The main policy tools through which the aforementioned goal was to be pursued
were employment, education and training policies, and social protection systems.
The notion underlying this policy mix was that to improve people’s chances of finding
sufficiently well paid employment by enabling them to acquire the appropriate skills,
in conjunction with a labour market that allows individuals to move across jobs and
countries and a social protection system that supports income and increased labour
market participation, constituted a recipe for success. A further key challenge for the
reduction of poverty and social exclusion was the mitigation of health inequalities
(European Commission 2010).
Almost halfway through the decade, Europe is still at the crossroads (see chap-
ters 1 and 2). The adjustment strategies of relentless fiscal austerity and internal
devaluation have been putting pressure on the European Social Model(s) (Degryse
et al. 2013). This chapter examines developments in inequality and poverty in the
EU27 since 2008 and evaluates whether the EU policy responses are likely to reduce
inequality and achieve the goal of ‘inclusive growth’.
Topics
> Developments in inequality and poverty 46> Developments in social protection systems 52> Looking ahead: halfway through a lost decade? 56> Conclusions 57
45
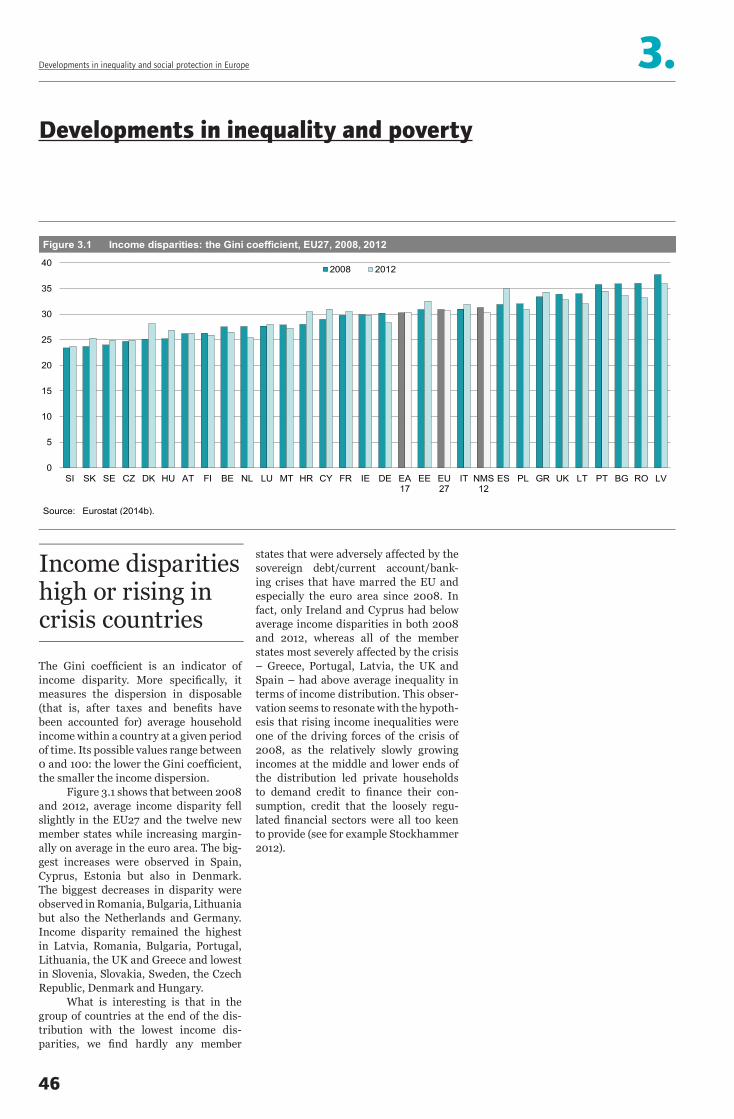
The Gini coefficient is an indicator of income disparity. More specifically, it measures the dispersion in disposable (that is, after taxes and benefits have been accounted for) average household income within a country at a given period of time. Its possible values range between 0 and 100: the lower the Gini coefficient, the smaller the income dispersion.
Figure 3.1 shows that between 2008 and 2012, average income disparity fell slightly in the EU27 and the twelve new member states while increasing margin-ally on average in the euro area. The big-gest increases were observed in Spain, Cyprus, Estonia but also in Denmark. The biggest decreases in disparity were observed in Romania, Bulgaria, Lithuania but also the Netherlands and Germany. Income disparity remained the highest in Latvia, Romania, Bulgaria, Portugal, Lithuania, the UK and Greece and lowest in Slovenia, Slovakia, Sweden, the Czech Republic, Denmark and Hungary.
What is interesting is that in the group of countries at the end of the dis-tribution with the lowest income dis-parities, we find hardly any member
states that were adversely affected by the sovereign debt/current account/bank-ing crises that have marred the EU and especially the euro area since 2008. In fact, only Ireland and Cyprus had below average income disparities in both 2008 and 2012, whereas all of the member states most severely affected by the crisis – Greece, Portugal, Latvia, the UK and Spain – had above average inequality in terms of income distribution. This obser-vation seems to resonate with the hypoth-esis that rising income inequalities were one of the driving forces of the crisis of 2008, as the relatively slowly growing incomes at the middle and lower ends of the distribution led private households to demand credit to finance their con-sumption, credit that the loosely regu-lated financial sectors were all too keen to provide (see for example Stockhammer 2012).
Income disparities high or rising in crisis countries
3.Developments in inequality and social protection in Europe
Developments in inequality and poverty
Figure 3.1 Income disparities: the Gini coefficient, EU27, 2008, 2012
Source: Eurostat (2014b).
0
5
10
15
20
25
30
35
40
SI SK SE CZ DK HU AT FI BE NL LU MT HR CY FR IE DE EA17
EE EU27
IT NMS12
ES PL GR UK LT PT BG RO LV
2008 2012
46

As figure 3.2 illustrates, in 2012, the share of population at risk of poverty or social exclusion, that is, the share of the EU population either with income below 60 percent of the median average house-hold income or facing severe material deprivation or living in a low work inten-sity household, stood at 24.8 percent, having risen by 1.1 percentage point (p.p.) or 4.6 percent in relative terms, since the onset of the crisis in 2008. In the euro area, the share was 23.2 percent in 2012, having increased by 1.6 p.p. or 7.4 percent since 2008. This indicator is the one used in the context of the Europe 2020 strat-egy and does not, for that reason, focus on money-defined poverty alone.
Bulgaria, Romania, Latvia, Greece, Lithuania, Hungary and Italy were the member states with the highest shares of population at risk of poverty or social exclusion in 2012, all ranging from 30 to almost 50 percent, while in Ireland the share was 29.4 percent. All of these countries, bar Romania, saw an increase in the share of their population at risk of poverty or social exclusion between 2008 and 2012. At the other end of the distribu-tion, the Netherlands, the Czech Republic and Finland had the lowest at-risk-of-poverty-rates in 2012, ranging between 15 percent (the Czech Republic) and
United Kingdom and the Baltics. With the addition of Luxembourg and the exceptions of Portugal and Romania, these member states also saw the largest relative increases in risk of poverty, when anchored to 2008 incomes. Most of these countries had found themselves in the eye of the crisis storm since 2008. Sweden, on the other hand, a country whose poverty risk appeared to have relatively increased since 2008, registered a reduction of 1.2 p.p. or 9.8 percent in relative terms.
These figures suggest, therefore, that the crisis has had proportionately stronger effects on poverty in most of the member states that were hardest-hit by it.
17.2 percent (Austria). By far the largest increase between 2008 and 2012 in the share of population at risk of poverty or social exclusion was observed in Greece (6.5 p.p.), followed by Ireland (5.7 p.p.) and Lithuania (4.9 p.p.), while Romania, the member state with the second highest poverty rate in 2008 and 2012, registered the second greatest reduction in its rate, amounting to 2.5 p.p. (5.7 percent in rela-tive terms).
However, given the devastating effects of the crisis on several mem-ber states’ output (see chapter 1) and, thereby, on the level of income that defines the poverty threshold, it would be useful, in order to gain a more accu-rate sense of how the risk of poverty has evolved, to consider an indicator that uses 2008 incomes to define the poverty threshold (see lower part of figure 3.2). If we consider the risk-of-poverty indica-tor calculated on what would have been the median average household income in 2008, before the crisis started, the picture becomes more dramatic. In the EU27 the share of population at risk of poverty had risen in 2012 by an average of 10 percent (1.7 p.p.) and in the euro area by 17 per-cent (2.7 p.p.) (Eurostat 2014b). On the basis of the same indicator, the ranking of countries whose population faced the highest risks changes somewhat. Thus, in 2012, above-EU27-average risk was faced by populations in Ireland, Greece, Spain, Italy and Portugal, Romania, the
Poverty on the rise
3.Developments in inequality and social protection in Europe
Developments in inequality and poverty
Figure 3.2 Population at risk of poverty or social exclusion and population at risk of poverty (% of population), 2008, 2012, EU27 member states
Source: Eurostat (2014b).
-50
-40
-30
-20
-10
0
10
20
30
40-40
-30
-20
-10
0
10
20
30
40
50
NL CZ FI SE LU AT DK FR SI DE SK BE MT EA EE UK EU27
PT PL CY ES IE IT NMS12
HU LT GR LV RO BG
2008 2012
population at risk of poverty or social exclusion
population at risk of poverty, based on a poverty threshold defined by 2008 income distribution
47

The risk of poverty or social exclusion fac-ing different segments of the population depending on their activity status has varied widely, as has the relative change in this risk across different categories of population between 2008 and 2012 (see figure 3.3). Given that employment has been a key factor for helping households escape poverty, it would seem reasonable to expect that employed people would be less adversely affected by the risk of pov-erty or social exclusion than those who are unemployed or inactive.
In 2012, those over 18 years old who were either employed or retired indeed faced a much lower risk than those who were unemployed or otherwise inactive. On average in the EU27 in 2012, the share of the employed population at risk of pov-erty or social exclusion was 13.6 percent, almost 40 percent less than the risk for the total population aged over 18 years. The share of those retired facing the same risks was 20 percent, almost 20 percent less than the risks facing the general pop-ulation over 18. On the other hand, two out of three unemployed and three out of five otherwise inactive persons were at
risk of poverty or social exclusion in the EU27 in 2012, respectively almost three times and almost twice as much as the risk for the population at large.
Interestingly, however, the share of employed persons at risk of poverty or social exclusion in the EU27 rose rela-tively more (11.4 percent) than all other categories between 2008 and 2012, and twice as much as the share of the gen-eral population over 18 facing the risk of poverty or social exclusion; the share of retired persons, meanwhile, fell. The share of unemployed people at risk of poverty or social exclusion increased by 4.7 percent in the EU27 between 2008 and 2012 and by a further 4.2 percent between 2010 and 2012. It can thus be seen that the risk of poverty among people who are employed had risen by relatively more than the risk among the unemployed since the crisis started. Given that the share of retired people at risk of poverty has slightly decreased, this suggests further that the effectiveness of employment as an antidote against pov-erty has somewhat lessened since 2008. Labour market inactivity (other than retirement), on the other hand, was asso-ciated with a relatively higher increase, compared with unemployment, in the risk of poverty or exclusion (7.1 percent) between 2008 and 2012.
Converging poverty risk by activity status
3.Developments in inequality and social protection in Europe
Developments in inequality and poverty
Figure 3.3 Population at risk of poverty or social exclusion by main activity status, EU27, 2008, 2012 (%)
Source: Own calculations based on data from Eurostat (2014b).
-20
-10
0
10
20
30
40
50
60
70
total employed retired unemployed other inactivepersons
2008 2012 relative change 2008-2012
48
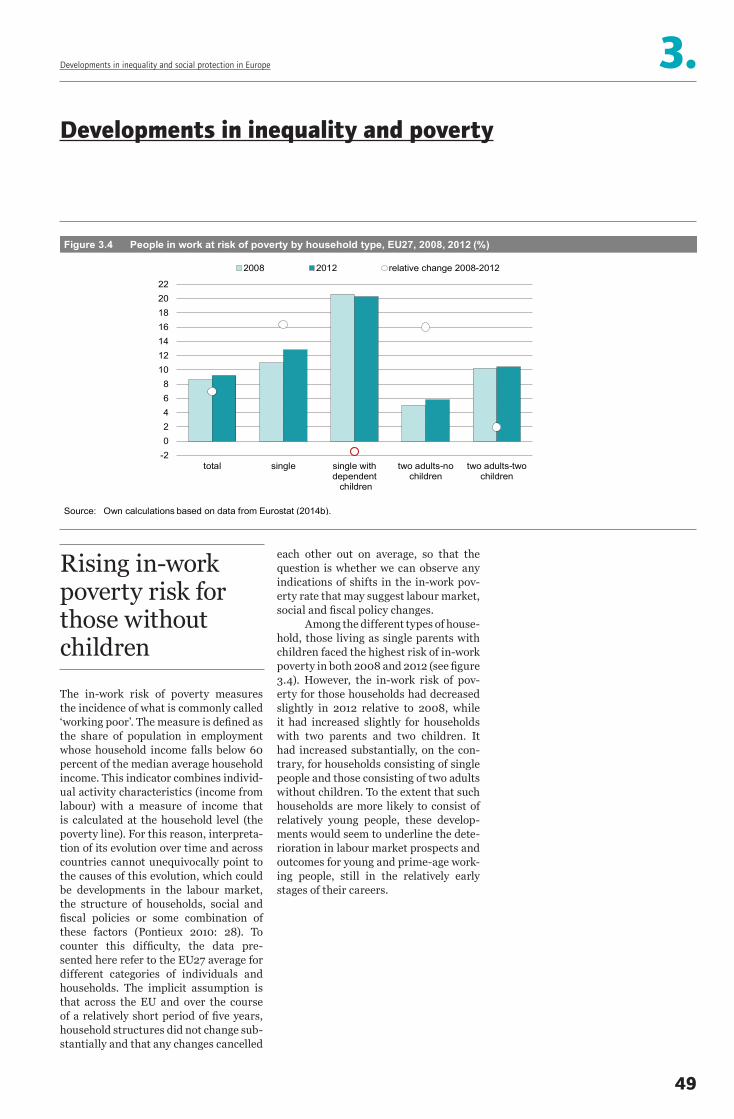
The in-work risk of poverty measures the incidence of what is commonly called ‘working poor’. The measure is defined as the share of population in employment whose household income falls below 60 percent of the median average household income. This indicator combines individ-ual activity characteristics (income from labour) with a measure of income that is calculated at the household level (the poverty line). For this reason, interpreta-tion of its evolution over time and across countries cannot unequivocally point to the causes of this evolution, which could be developments in the labour market, the structure of households, social and fiscal policies or some combination of these factors (Pontieux 2010: 28). To counter this difficulty, the data pre-sented here refer to the EU27 average for different categories of individuals and households. The implicit assumption is that across the EU and over the course of a relatively short period of five years, household structures did not change sub-stantially and that any changes cancelled
each other out on average, so that the question is whether we can observe any indications of shifts in the in-work pov-erty rate that may suggest labour market, social and fiscal policy changes.
Among the different types of house-hold, those living as single parents with children faced the highest risk of in-work poverty in both 2008 and 2012 (see figure 3.4). However, the in-work risk of pov-erty for those households had decreased slightly in 2012 relative to 2008, while it had increased slightly for households with two parents and two children. It had increased substantially, on the con-trary, for households consisting of single people and those consisting of two adults without children. To the extent that such households are more likely to consist of relatively young people, these develop-ments would seem to underline the dete-rioration in labour market prospects and outcomes for young and prime-age work-ing people, still in the relatively early stages of their careers.
Rising in-work poverty risk for those without children
3.Developments in inequality and social protection in Europe
Developments in inequality and poverty
Figure 3.4 People in work at risk of poverty by household type, EU27, 2008, 2012 (%)
Source: Own calculations based on data from Eurostat (2014b).
-202468
10121416182022
total single single withdependent children
two adults-nochildren
two adults-twochildren
2008 2012 relative change 2008-2012
49

In terms of employment arrangements and educational qualification levels, Fig-ure 3.5 shows that the highest risk of in-work poverty in both 2008 and 2012 was faced by persons temporarily employed, part-time employed, and those with lower qualifications.
Among the different types of em -ploy ment contract and working-time arrangement, the share of ‘employed at-risk-of-poverty’ increased relatively more among those employed in perma-nent jobs and those working part-time. In 2012 the share of those at risk of poverty among employees on temporary contract was more than twice as high as among those with permanent contracts. How-ever, the relative increase in the poverty rate between 2008 and 2012 was much higher (12.2 percent) among the perma-nently employed than among the tempo-rarily employed (7.9 percent). A variety of non-mutually exclusive reasons may explain this development. Many people
In other words, and assuming no substantial changes in the structure of households, the strength of this associa-tion weakened between 2008 and 2012. During the same period, the in-work risk of poverty for those with highest educa-tional attainment rose by 20 percent, more than twice as much as the relative increase in the in-work risk of poverty among those with the lowest educational attainment (9 percent) and two thirds more than the relative increase of the same risk for those with middle educational qualifications. In other words, since the onset of the crisis, higher formal qualifications have been less effectively shielding people in employment from the risk of poverty.
While the difference in the in-work risk of poverty across groups of population with different levels of qualification is still substantial, this last observation consti-tutes a development giving cause for con-cern. Investment in skills has been central to the EU’s growth strategies for inclusive growth and for good reason, given the sub-stantial difference in in-work risk of pov-erty between those with higher and those with lower educational qualifications. However, the consequences of the crisis seem to have been associated with a lower effectiveness of higher skills in shielding people from the in-work risk of poverty, most likely because of developments in the labour market.
on temporary contracts were most likely the first to be fired, as jobs have been destroyed, and thus stopped facing any ‘in-work’ poverty risk. The income of employees with permanent contracts may have fallen because of a slowdown in wage growth as a consequence of high and ris-ing unemployment and because of higher labour tax rates as a consequence of fiscal austerity. Last but not least, unemploy-ment increases are likely to have adversely impacted on household incomes where one earner has lost his/her job. What is more, the relatively high increase in the in-work risk of poverty of those employed part-time and the increase in part-time jobs is consonant with the increase of in-work poverty risk among employed people.
People with low educational attain-ment faced the highest in-work risk of pov-erty both at the beginning of the crisis in 2008 and still in 2012. On average in the EU27, people with pre-primary, primary and lower-secondary education faced four to five times higher in-work risk of poverty than those with first- and second-stage tertiary education and about twice as high a risk of in-work poverty as those with upper-secondary and post-second-ary non-tertiary education. Other things being equal, higher educational attain-ment has thus been associated with a lower in-work risk of poverty, though this risk did increase across groups of educa-tional attainment between 2008 and 2012.
Converging in-work poverty risk across types of contract and qualification levels
3.Developments in inequality and social protection in Europe
Developments in inequality and poverty
Figure 3.5 In-work poverty by type of employment contract, working time arrangement and educational qualifications, EU27, 2008, 2012 (%)
Source: Own calculations based on data from Eurostat (2014b).
0
2
4
6
8
10
12
14
16
18
20
22
total permanent temporary full time part time lowereducation
middleeducation
highereducation
2008 2012 relative change 2008-2012
50

Inequality is manifested not in income alone but also in effective access to public services and social protection. An impor-tant case in point is healthcare services. Figure 3.6. above shows the shares of different segments of the population, characterised by their activity status, which reported that they could not access healthcare services because they were too expensive. The share of unemployed peo-ple was by far the highest both in 2008 (6.2 percent) and still in 2011 (4.9 per-cent), although it fell during that period. The respective shares of people reporting that they could not meet their health-care needs because of services being too expensive rose for all other groups, including the general population (2.3 percent in 2012), employed people (1.4 percent in 2012), retired people (3.0 in 2012) and other inactive people (also 3.0 percent in 2012). The most substantial
relative increase was observed for other inactive people, suggesting that the access to affordable healthcare services for those detached from the labour mar-ket became more difficult. Thus, in addi-tion to facing a higher risk of monetary poverty, labour market outsiders have also been facing more limited access to healthcare services due to their cost.
What is also interesting is that the population group which reported the sec-ond relatively higher unmet health care needs due to healthcare services being too expensive was, after inactive peo-ple, employed people. The share of those employed reporting such unmet needs due to their cost rose by 16.7 percent (or 0.2 p.p.) between 2008 and 2011. We see, therefore, that employed people have been seeing a relative deterioration in their risk of poverty and access to afford-able healthcare services since 2008, a development that is very likely linked to labour market developments (see chap-ter 2) but also, if not more importantly, to developments in healthcare that shift more of the costs of these services to individuals and households.
Convergence in poverty risks across contracts, working-time arrangements and skill levels
3.Developments in inequality and social protection in Europe
Developments in inequality and poverty
Figure 3.6 Unmet healthcare needs due to unaffordable services by labour market status (%)
Source: Eurostat (2014b).
0
1
2
3
4
5
6
7
total employed unemployed retired other inactivepersons
2008 2011
51

Figure 3.7. shows the evolution of public social spending per inhabitant in PPS terms for the EU27 member states in 2008 and 2011. Public social expenditure per inhabitant rose everywhere except in the United Kingdom, where it fell by 4. 5 percent. On average, in both the EU27 and the euro area, this spending increased by 8.8 and 9.9 percent respec-tively. Behind these averages, there was, however, a wide variation. The largest increase took place in Ireland (33.3 per-cent), while the vast majority of member states with above EU27 average relative increases were new member states and also Germany, Finland, Belgium, France, Denmark and Spain.
However, these figures do not in themselves provide a clear picture of whether there has been a retrenchment in social protection spending. This is because in the face of a double-dip reces-sion – and in fact the greatest reces-sion in the postwar era – it is likely that demand for social protection increased by more than what might be suggested, at
first glance, by these increases in spend-ing per inhabitant. In Greece, for exam-ple, not only was public social expendi-ture per inhabitant relatively low in 2008 and still in 2011 but it also registered the second lowest increase in the EU27 (just slightly more than Sweden), in spite of the massive contraction in Greek output and the increase in unemployment (see chapters 1 and 2).
Although these developments would at first glance suggest some convergence, given that the new member states tend to have relatively lower public social protec-tion spending per inhabitant (Eurostat 2014a), the standard deviation of the val-ues in 2011 was higher than in 2008, sug-gesting a greater dispersion.
Divergence in public social spending per inhabitant
3.Developments in inequality and social protection in Europe
Developments in social protection systems
Figure 3.7 Public social expenditure per inhabitant in PPS, EU27, 2008, 2011
Source: Own calculations based on data from Eurostat (2014a).
-5
0
5
10
15
20
25
30
35
0
2.000
4.000
6.000
8.000
10.000
12.000
14.000
16.000
IE BG PL RO SK LV CZ DK FI BE MT CY FR DK EA17
LT EE ES EU27
PT SI HU AT NL IT HR LU GR SE UK
2008 2011 relative change 2008-2011 (right-hand axis)
52

As spending in social protection alone cannot provide an accurate picture of the characteristics of the welfare state, we look also at the extent to which social protection benefits are targeted through means-testing and at whether that tar-geting has increased since 2008. A higher share of means-tested in total ben-efits implies, other things being equal, a greater restriction of social benefits to the poor segments of population (Mat-saganis 2013) and, thereby, an increas-ing importance of the poverty alleviation function of social protection as opposed to redistribution and the tackling of ine-qualities more generally.
Figure 3.8 above shows the evolu-tion of means-tested benefits, that is, of benefits to which entitlement is estab-lished on the basis of criteria related to the income and wealth of potential recip-ients, as a share of total social benefits (cash and in-kind) in the EU27 member states. These data alone do not allow exact identification of the cause of under-lying shifts towards or away from means-testing. However, an increase in the value of means-tested benefits as a share of
other end of the distribution, in the Bal-tic states, the Czech Republic, Sweden and Finland, only 5 percent or less of the total social benefits were means-tested in 2008. The three Baltic states demon-strated sizeable increases in the propor-tion of means-tested benefits, ranging from 4.3 p.p. in Lithuania (261 percent) to 2.5 p.p. (125 percent) in Latvia to 0.6 p.p. (130 percent in Estonia). Other mem-ber states with substantial increases in means-tested benefits between 2008 and 2012 were Poland with 1.9 p.p. (45 per-cent), Luxembourg with 0.8 p.p. (28 per-cent), Spain with 3 p.p. (22 percent) and Finland with 0.5 p.p. (11 percent). The proportion of means-tested benefits over total social benefits fell in a few member states, most notably Hungary by 1.3 p.p. ( or 23 percent), Greece by 1.2 p.p. (or 16.5 percent), Portugal by 1.1 p.p. (or 11 per-cent), Bulgaria by 0.5 p.p. (or 10 percent) and the Czech Republic by 0.2 p.p. (or 9 percent).
total social benefits may be attributed to two broad reasons. First, an increase in the number of recipients who do not qualify for social insurance benefits, either because they have not contributed enough (e.g. unemployed persons who are also new entrants to the labour mar-ket) or because they have exhausted the duration of their social insurance benefit entitlement (e.g. long-term unemployed who start receiving assistance benefits). Secondly, it could signify a shift in policy and more specifically in relation to the eligibility criteria for benefit entitlement away from universalism or needs-testing (e.g. family benefits paid to any fam-ily having a certain number of children regardless of income and wealth) and towards means-testing. In practice, an increase in the share of means-tested in total benefits could be caused by a com-bination of the above factors, all of which are aggravated by the crisis and the pol-icy responses to it and all of which sug-gest either an expansion in the popula-tion segment that qualifies as ‘poor’ or a shift in social policy priorities towards an emphasis on poverty alleviation.
There has been a wide variation in the use of means-tested benefits, with Ireland being the member state that used them by far the most in 2008 and still in 2012, followed by the UK, the Nether-lands, Malta and Spain. In Ireland more than 25 percent of total social protec-tion benefits were means-tested. At the
Wide variation in targeting of social benefits
3.Developments in inequality and social protection in Europe
Developments in social protection systems
Figure 3.8 Targeting social protection: Means-tested benefits as % of total social benefits, EU27 member states, 2008, 2011
Source: Own calculations based on data from Eurostat (2014a).
-50
0
50
100
150
200
250
300
02468
10121416182022242628
IE UK NL MT ES DE CY FR EA17
EU27
PT SI GR AT IT HU BE SK RO DK BG PL FI LU SE CZ LV LT EE
2008 2011 relative change 2008-2011 (right-hand scale)
53

Another dimension that delineates the contours of a social protection system is the balance in public social spending between cash and in-kind (that is, either paid as reimbursements or as directly pub-licly provided goods and services) social benefits. Research evidence suggests that cash benefits can reduce poverty and ine-quality more than can benefits in kind, although the latter have an additional redistributive impact in the longer run thanks to their role in increasing employ-ment for women (Matsaganis 2013).
Figure 3.9 above suggests that on average in both the EU27 and the euro area, public social expenditure – as a share of GDP – on in-kind benefits increased by more (10 and 8.9 percent respectively) than public social spend-ing in cash benefits (7.8 and 8.6 percent respectively). Thus, in a short to medium-run it is suggested that redistribution and poverty alleviation are likely to be affected negatively.
The member states which experi-enced the largest reductions in in-kind social benefits between 2008 and 2011 were Latvia (30.5 percent), Slovakia,
Greece, Portugal, Spain, Bulgaria, Slo-venia, Cyprus, Italy and Romania. Most of these countries have had to implement fiscal adjustments either under the pres-sure of financial markets or in the context of EU/IMF conditionality programmes of financial support to their govern-ments. Given the particular focus of the conditionality adjustment programmes that member states had to implement in exchange for EU-IMF financial assis-tance on reducing public sector employ-ment, it is likely that any longer-term redistribution effects that the relative increase in in-kind benefits could have through the employment of women may be constrained. Fiscal austerity alone, however, does not necessarily predict the evolution of spending on in-kind social benefits, as Ireland was in fact the coun-try with the highest increase between 2008 and 2011, of 37.4 percent.
Spending on in-kind benefits increases
3.Developments in inequality and social protection in Europe
Developments in social protection systems
0
5
10
15
20
25
30
35
DK FR NL FI BE SE GR EA17
AT IT DE IE EU27
UK ES PT SI HU CY LU HR CZ PL MT SK BG LT RO EE LV
2008 cash benefits 2008 benefits in-kinds
2011 cash benefits 2011 benefits in-kinds
Figure 3.9 Composition of spending in social protection: cash and in-kind benefits as % GDP, EU27, 2008, 2011
Source: Eurostat-ESSPROS.
54

Figure 3.10 shows the evolution of the efficiency of social protection systems in alleviating poverty in the EU27 in 2008 and 2011, measured by the relative change in the share of population at risk of poverty before and after social bene-fits (excluding pensions). The higher the percentage, the more efficient the social protection system is. On average in the EU27, this efficiency remained stable, although it was reduced in both the euro area and the group of the twelve new member states.
Among member states, there has been a wide variation both in the level of efficiency of social protection sys-tems and in the relative change since the onset of the crisis. Greece stands out as the member state with the social protec-tion system least efficient in alleviating poverty in both 2008 and 2012. This suggests that the problem with public finances there had little if anything to do with the overall size of the country’s ill-designed social protection system and that, in principle, there would be substantial scope for tackling the public finances crisis while providing a more adequate social safety net than hitherto (Matsaganis 2011). To support this point,
states whose social protection systems lost some of their efficiency also includes Romania and Bulgaria, that is member states with among the highest shares of population at risk of poverty or social exclusion.
the majority of member states whose social protection systems had become more efficient in alleviating poverty since 2008 were member states that were par-ticularly hard-hit by the crisis and whose governments were forced or chose to implement tough fiscal austerity policies, namely Ireland, the UK, Lithuania, Por-tugal, Cyprus, Estonia, Spain and Latvia, as well as the Netherlands, Luxembourg and Finland.
This, of course, does not mean that austerity and the prolonged recession have not been affecting income distribu-tion and social protection systems in an adverse manner, especially in the most affected member states. In fact, we have seen the shares of population at risk of poverty or social exclusion increasing, even in countries where the efficiency of the social protection system in alleviat-ing poverty has improved. Moreover, it should be noted that poverty alleviation is only one of the potentially desirable outcomes of social protection systems and the above figures do not tell us eve-rything about increases in other forms of inequality.
On the other hand, member states whose social protection systems lost in efficiency since 2008 included Hungary, Sweden, the Czech Republic, France and Slovakia. Yet in 2008 all these countries had social protection systems able to boast among the highest or higher than average efficiency. The group of member
Varied efficiency in poverty alleviation
3.Developments in inequality and social protection in Europe
Developments in social protection systems
0
10
20
30
40
50
60
70
HU DK SE CZ IE FI AT NL SI FR BE LU SK DE UK EU27
NMS12
MT EA17
PL CY LT PT RO EE BG IT ES LV GR
2008 2012
Figure 3.10 Efficiency of social protection systems in alleviating poverty in the EU27 member states, 2008, 2012 (%)
Source: Own calculations using Eurostat-EU-SILC.
55
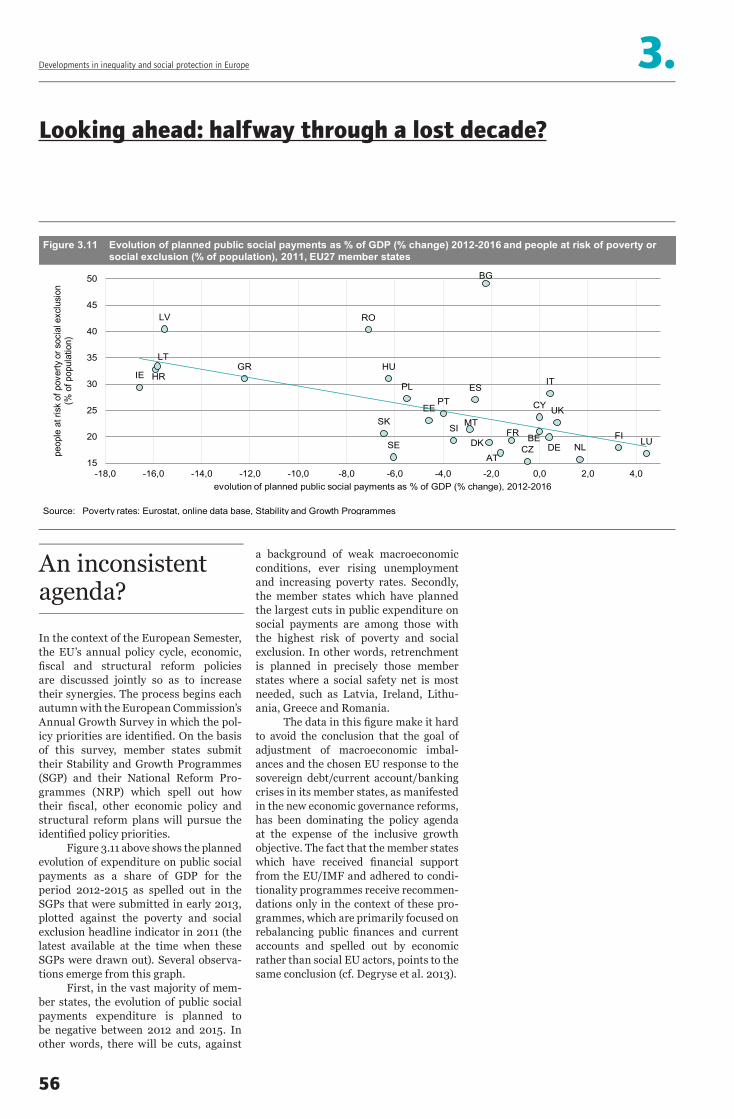
In the context of the European Semester, the EU’s annual policy cycle, economic, fiscal and structural reform policies are discussed jointly so as to increase their synergies. The process begins each autumn with the European Commission’s Annual Growth Survey in which the pol-icy priorities are identified. On the basis of this survey, member states submit their Stability and Growth Programmes (SGP) and their National Reform Pro-grammes (NRP) which spell out how their fiscal, other economic policy and structural reform plans will pursue the identified policy priorities.
Figure 3.11 above shows the planned evolution of expenditure on public social payments as a share of GDP for the period 2012-2015 as spelled out in the SGPs that were submitted in early 2013, plotted against the poverty and social exclusion headline indicator in 2011 (the latest available at the time when these SGPs were drawn out). Several observa-tions emerge from this graph.
First, in the vast majority of mem-ber states, the evolution of public social payments expenditure is planned to be negative between 2012 and 2015. In other words, there will be cuts, against
a background of weak macroeconomic conditions, ever rising unemployment and increasing poverty rates. Secondly, the member states which have planned the largest cuts in public expenditure on social payments are among those with the highest risk of poverty and social exclusion. In other words, retrenchment is planned in precisely those member states where a social safety net is most needed, such as Latvia, Ireland, Lithu-ania, Greece and Romania.
The data in this figure make it hard to avoid the conclusion that the goal of adjustment of macroeconomic imbal-ances and the chosen EU response to the sovereign debt/current account/banking crises in its member states, as manifested in the new economic governance reforms, has been dominating the policy agenda at the expense of the inclusive growth objective. The fact that the member states which have received financial support from the EU/IMF and adhered to condi-tionality programmes receive recommen-dations only in the context of these pro-grammes, which are primarily focused on rebalancing public finances and current accounts and spelled out by economic rather than social EU actors, points to the same conclusion (cf. Degryse et al. 2013).
An inconsistent agenda?
3.Developments in inequality and social protection in Europe
Looking ahead: halfway through a lost decade?
Figure 3.11 Evolution of planned public social payments as % of GDP (% change) 2012-2016 and people at risk of poverty or social exclusion (% of population), 2011, EU27 member states
Source: Poverty rates: Eurostat, online data base, Stability and Growth Programmes
IE HR
LT
LV
GR
RO
SK
HU
SE
PL
EEPT
SI MT
ES
BG
DKAT
FR
CZBE
CY
DE
IT
UK
NLFI LU
15
20
25
30
35
40
45
50
-18,0 -16,0 -14,0 -12,0 -10,0 -8,0 -6,0 -4,0 -2,0 0,0 2,0 4,0
peop
le a
t ris
k of
pov
erty
or s
ocia
l exc
lusi
on
(% o
f pop
ulat
ion)
evolution of planned public social payments as % of GDP (% change), 2012-2016
56

3.Developments in inequality and social protection in Europe
indeed, to stand in the way of any sort of growth, let alone convergence towards higher living standards, in the foresee-able future.
in public social spending and of a diver-gence in the level of such spending across the EU. On average in the EU27 and the euro area, public social expenditure per inhabitant was increasing between 2008 and 2011, although the rate of this increase slowed dramatically after 2010 which is also when the shift towards aus-terity policies took place, especially in the member states most hard-hit by cri-sis. In general, there were no dramatic shifts in the targeting of benefits through means-testing, although in some notable cases – such as the Baltic states, Spain, Ireland and Poland – the share of means-tested in total social benefits increased substantially, signalling perhaps that benefits are being now aimed more at poverty alleviation than at redistribution and the creation of equal opportunities. There has also been a general shift from cash benefits to benefits in kind, another development suggestive of a potential weakening of the capacity of social pro-tection systems to reduce inequality and poverty in the EU, while the rise in the share of people declaring unmet health-care needs due to unaffordable services, especially among the employed popula-tion, is yet another pointer to a roll-back of social protection.
Generally speaking, the efficiency of social protection systems in alleviat-ing poverty was reduced after 2008 in member states that either had relatively low poverty rates or that had been little affected by the crisis (exceptions here being Bulgaria and Romania). In several of the ‘crisis’ countries, meanwhile, the efficiency of these systems increased, an observation which – given the large increases in the need for social protection – would seem to point to the invaluable role played by social protection systems in alleviating poverty. And yet, in spite of the ongoing crisis and its devastating and increasingly widening consequences for the labour markets, further cuts in social spending are on the agenda, in the context of new economic governance, in the majority of member states. Consider-ing the social consequences of the crisis so far and the fragility of macroeconomic conditions, these plans will most cer-tainly put paid to the Europe 2020 ambi-tion of inclusive growth. They are likely,
On a European average, income inequal-ity has been on the rise since 2008, and more steeply so since 2010, the year that saw a fairly general policy shift towards fiscal austerity. In particular, the share of people at risk of poverty and social exclu-sion has increased in some – but not all – of the member states that, having been most adversely affected by the crisis, have had to pursue the most far-reaching aus-terity policies. These countries include Greece, Ireland, Spain and Italy. The EU policies cannot, however, account for all cases of increasing shares of population at risk of poverty, for among the coun-tries displaying the highest increases in this indicator we also find more prosper-ous member states such as Sweden, Lux-embourg and Denmark.
Unemployment, low skills, relatively few hours of work and temporary employ-ment contracts remain more strongly asso-ciated with a risk of in-work poverty in the EU27. The same applies to people living in single-parent households. However, since 2008, the largest relative increases in the in-work risk of poverty were registered among employees with permanent con-tracts, and those with high and medium skills. In a similar vein, employed people experienced the highest relative increase in risk of poverty since 2008 compared to unemployed people. This suggests that the fight to reduce unemployment, alongside the creation of high quality jobs (charac-terised, that is, by permanent contracts and the absence of involuntary part-time), is key to reducing the risk of poverty. At the same time, rather worryingly for a policy strategy of ‘active inclusion’ and with an emphasis on education and skills, recent developments in the labour markets in the wake of the crisis have resulted in a weak-ening of the extent to which employment and education serve as effective shields from poverty.
Turning to social protection sys-tems, there are indications of a roll-back
Halfway through a lost decade for ‘inclusive growth’?
Conclusions
57


Deregulation of labour law at any priceIntroduction
Since 2008 national governments in all 28 European Union member states have
undertaken, under the umbrella of the EU’s deregulatory agenda and its chosen
approach to crisis management, fundamental reforms that have triggered a veritable
storm of inequality and insecurity for workers. In several cases, what is more, the
terms of the regulatory or legislative provisions underpinning these reforms repre-
sent infringements of fundamental social rights obligations to which the states in
question have subscribed under international, European, or national law.
Several major areas covered by individual and collective labour law are affected.
These include working time, atypical employment, and dismissal protection law, as
well as collective bargaining systems. The reforms affect individual member states in
different ways. While the ‘programme countries’ – i.e. those currently in receipt of, or
having in the past received, financial assistance from the EU as a bailout to cope with
the crisis (i.e. Greece, Ireland, Portugal and Cyprus) – face drastic reform require-
ments via Memorandums of Understanding (MoUs), other member states are required
to implement ‘Country-Specific Recommendations’ (CSRs) issued by the European
Commission under the so-called ‘European Semester’ procedure. This distinction not-
withstanding, all the reforms implemented are structural, being designed to pursue
one and the same objective, namely, a reform of labour markets effected predomi-
nantly through the provisions of labour law and intended to secure greater flexibility
by, among other things, loosening ‘hire and fire’ provisions , legitimising the curtail-
ment of labour rights, and weakening collective bargaining actors and processes.
This chapter firstly critically addresses the sources of the reforms and the question
of their legality. Secondly, it conducts a stocktaking exercise in relation to the last five
years of significant labour law reforms, focussing on the deregulatory waves as they
affect working time, atypical employment and dismissal protection law. Finally, the
chapter gives an overview of (trade union) reactions to austerity measures in terms of
litigation initiated at the international, European and national levels.
Topics
> The European sources of labour law reforms and the role of the ‘Troikan horse’ 60> Working time, atypical employment and dismissal protection law under attack 62> Fighting the dismantling of labour law via litigation 65> Conclusions 68
59

4.Deregulation of labour law at any price
The European sources of labour law reforms and the role of the ‘Troikan horse’
60
While labour law reforms are adopted at national level in the member states, the impetus and initiative for such reforms have their roots in the European Union’s management of the financial and eco-nomic crisis, followed by the sovereign debt crisis, and in its new economic gov-ernance programme. At this European level, two main tools can be identified: the country-specific recommendations (CSRs) for most member states and the memorandums of understanding (MoU) for the programme countries. Another development that will affect European legislation – in this area and more gen-erally – is the recent introduction by the European Commission of a new Regu-latory Fitness and Performance Pro-gramme (REFIT) that will impact on the entire EU legislative stock and, in par-ticular, the social field (see the subchapter on information and consultation rights under attack in this Benchmarking Work-ing Europe give, chapter 7, page 94).
To understand the significance of the CSRs it is necessary to go back to 2010 when the European Commission presented, as a successor to its earlier Lisbon strategy, the so-called ‘Europe
programmes and proposes CSRs to be endorsed by the European Council (Clau-waert 2013).
Interestingly, CSRs are not actu-ally binding, although they do represent strong incentives for action by member states which are required to provide reg-ular evidence that the recommendations have been heeded in national legisla-tion and/or policy action. Those mem-ber states that sign an MoU are, on the contrary, bound by a bilateral agreement concluded with the ‘Troika’, a recently formed ‘body’ composed of the European Commission, the European Central Bank (ECB) and the International Monetary Fund (IMF).
The MoU is thus another instru-ment, alongside the CSR, whereby the EU is able to impose conditions upon those member states that have entered a Euro-pean economic adjustment programme. These countries are Greece, Ireland, Por-tugal, as well as Latvia, Romania, Hun-gary and Cyprus. An MoU is a detailed ‘adjustment programme’ negotiated between the national ‘caretaker govern-ment’ and the European Commission, together with the ECB and in liaison with the IMF (i.e. the components of the abovementioned ‘Troika’), spelling out the terms of the conditionality attach-ing to the financial assistance facility. Insofar as the memorandum relates to economic policy, an economic adjust-ment programme is issued specifying the
2020 strategy’. The principal aim of the new strategy is to deliver more growth that is simultaneously ‘smart’ – by means of additional investment in education, research and innovation; ‘sustainable’ – by, among other things, moving in the direction of a low-carbon economy; and ‘inclusive’ – by boosting job creation and reducing poverty (European Commission 2010). In order to ensure that the Europe 2020 strategy delivers on these goals, a system of economic governance has been put in place to coordinate policy actions between the EU and the national levels. Since 2011, the Commission has launched reviews of the economic and social per-formance of each EU member state and, on an annual basis, it draws up the CSRs for the purpose of guiding national policy reform. Such recommendations are elab-orated in the framework of the European Semester, set by the European Commis-sion as a yearly cycle of economic policy coordination, to ensure that all member states that have committed to achieving Europe 2020 targets actually do translate them into national targets and growthen-hancing policies. Following presentation of the Annual Growth Survey, the EU Heads of State and Government issue EU guidance for national policies at their Spring meeting so that member states can submit their stability or convergence pro-grammes as well as their national reform programmes. The European Commission then carries out an assessment of the
Figure 4.1 Different sources of reforms
National reforms
EU law
REFITCountry-specific recommendations
Source: ETUI own research.
Memorandum of understanding
Where do reforms come from?

measures that have to be implemented at national level in return for access to the agreed financial support. Within this framework, a range of measures address structural reforms of the labour market and social security provision, coupled with major privatisation plans and fis-cal adjustments designed to make labour less costly for businesses. Aspects specifi-cally covered here include detailed wage reforms via the decentralisation of wage bargaining and changes in the wage-set-ting mechanisms so as to allow the local level to opt out from the wage increases agreed at sectoral level; the introduction of subminima wages for youth and the long-term unemployed; the revision of important aspects of the law governing dismissals and redundancies, as well as of atypical employment regulations; and the revision of the unemployment insur-ance system. There is a fixed deadline for implementation of such reforms and regular monitoring of the national imple-mentation initiatives takes place accord-ing to a three-month cycle. The MoUs have, since their creation, come in for some heavy criticism, on several counts. Alongside questions about the legality of the Troika itself, as well as of the changes introduced in the Treaty architecture to allow the setting up of a new European economic governance, some of the meas-ures imposed on member states via such memorandums fail to comply with pro-visions of international, European and
with the Commission’s smart regulation agenda, the main outcomes of the REFIT initiative will be threefold: 1) simplifica-tion: EU law is screened and evaluated to ensure that it is working as intended and so as to identify any inconsistent, unnec-essary or ineffective measures as well as any opportunities to simplify the legisla-tion (‘Regulatory Fitness’); 2) consolida-tion: integration within a single new act of an earlier legislative act and all its succes-sive amendments and corrigenda (includ-ing certain developments stemming from ECJ case law), after which the new act passes through the full legislative process and repeals all preceding acts included in the recast; and 3) recast: identical to cod-ification, except that, unlike codification, recast involves new substantive changes, as amendments are made to the original act during preparation of the recast text (Interinstitutional Agreement 2001).
In a nutshell, therefore, it can be seen that the labour law reforms that have been taking place in Europe since the out-break of the financial and economic crisis in 2008 have their roots in the European Union’s liberal approach to social legisla-tion that became manifest under, in par-ticular, the Barroso Commissions I and II. It is an approach that further gained steam during the crisis and that has now become an inherent part of the new Euro-pean economic governance process.
national (constitutional) law and have already been subject to judicial review, as will be detailed in the last section of this chapter. The European Parliament, more-over, has recently launched an enquiry to report on the role and operations of the Troika, expressing its concern about, amongst other things, this entity’s lack of democratic legitimacy.
Meanwhile, the European Commis-sion introduced, in August 2013, a new Regulatory Fitness and Performance Pro-gramme, referred to for short as REFIT. This exercise has the twofold aim of, first, mapping and screening the entire EU legislative stock in order to identify burdens, gaps and inefficient or ineffec-tive measures; secondly, reviewing and setting out the next steps in the process which will take the form of, as appropri-ate, a simplification or a repeal of existing legislation (European Commission 2013a and 2013b). REFIT is the latest Commis-sion initiative in the framework of its longstanding agenda in this area: better law-making (2002); simplification of the regulatory environment (2005); better and smart regulation (2007 and 2009); all leading up to the fitness check of 2010. The REFIT initiative encompasses the entire EU legislative acquis and, in par-ticular, the social dimension including health and safety, labour law in terms of working conditions and worker partici-pation, but also vocational qualifications and public procurement. In accordance
4.Deregulation of labour law at any price
The European sources of labour law reforms and the role of the ‘Troikan horse’
61
Figure 4.2 Overview of the number of CSRs per country compared to the ‘social’ CSRs for 2011-2012, 2012-2013 and 2013-2014
country AT BE BG CY CZ DE DK EE ES FI FR HU IT LT LU LV MT NL PL RO SE SI SK UK
CSRs 2011-2012
total 5 6 6 7 6 4 5 4 7 5 5 5 6 6 4 – 5 4 7 – 3 6 6 5 11746.15%
‘social’ 2 3 3 3 3 1 2 1 4 2 4 2 2 2 3 – 3 2 3 – 1 3 3 2 54
CSRs 2012-2013
total 7 7 7 7 6 4 5 5 8 5 5 7 6 6 5 7 6 5 6 – 4 7 7 6 13744.52%
‘social’ 2 2 2 3 3 1 2 2 5 2 3 3 3 3 2 3 3 2 2 – 1 4 5 2 61
CSRs 2013-2014
total 7 7 7 – 7 4 3 5 9 5 6 7 6 6 6 7 5 4 7 8 4 9 6 6 14240.14%
‘social’ 3 4 3 – 3 1 1 2 4 2 4 3 2 3 3 3 2 2 2 3 1 2 2 2 57
Source: European Commission country-specific recommendations; Clauwaert (2013).

Labour law reforms in the member states are manifold and their introduction has been spread over time. What all have in common, however, is that they are struc-tural reforms designed to boost business flexibility, to reduce the alleged complex-ity and strictness of labour law, using the financial and economic crisis as a pretext to carry out reforms that in some coun-tries – Hungary being a significant exam-ple – would have been adopted anyway. Reforms may either deal, in separate acts, with one or more of the numerous issues at stake or they may, alternatively, address the issues cumulatively, in a sin-gle act. Reforms may also address the same areas at different points in time during the crisis, further relaxing prior amendments and/or extending earlier reforms initially deemed to have been issued for a limited period of time to adapt to some aspect of the crisis situa-tion. A further common feature of the reforms is that all address, in a rather systematic and cumulative manner, essential areas in which labour law pro-vides protection: working time, atypical employment contracts and protection against dismissal/redundancy, as well as
bias can be observed at both national and European level in the latest attempts to revise Directive 2003/88/EC concerning certain aspects of the organisation of working time. Reforms introducing flex-ible working time adopted in the member states comprise measures entailing a threefold aim: 1) to increase working time duration by extending maximum working time and making changes to overtime and time-off provisions, often without, or with only reduced, compen-sation; 2) conversely, to allow employers to shorten working time duration, using short-time schemes for example, with the aim of preserving jobs in companies tem-porarily experiencing low demand; and 3) to allow employers to adjust the alloca-tion of working hours to suit their needs. As is readily apparent, such reforms give precedence to productivity and competi-tiveness over workers’ health, safety and wellbeing; they can be seen, what is more, as impeding job creation. Short-time schemes, meanwhile, can be sustained only when used to deal with a cyclical and not a structural shock, for in the lat-ter case they will lead to increased labour market segmentation. Moreover, short-time working has direct short-term nega-tive effects for workers insofar as it reduces their purchasing power and thereby forces them to contribute to the survival of the company by themselves bearing part of the cost of short-time working (see Lang et al. 2013b).
collective bargaining, to name only the most important of the numerous issues at stake (Clauwaert and Schömann 2012).
The roots of the narrative that accompanies the reforms are to be found in the economic analysis of the labour markets in Europe carried out by, amongst others, the OECD. These efforts have entailed the elaboration of indica-tors designed to compare, for example, the stringency of employment protection law, with the aim of demonstrating that, the stricter the labour law, the less flexi-bly the labour market can operate, thereby creating segmentation that is damaging to employment and growth. Interestingly, however, the OECD did consider it appropriate to note that, ‘by contrast, the effectiveness of legislation in protecting workers might not be well captured by these indicators’ (OECD 2013). Along similar lines, the World Bank has elaborated indicators on which, it is claimed, labour market reforms should be based. Employment protec-tion, for example, should be replaced by taxation as a means of making the pro-tection offered by labour law less costly for employers (Muller 2011).
The issue of working time is of par-ticular importance because of the way in which, in the labour market reforms, it is treated as a key adjustment mechanism, predominantly for the purpose of satisfy-ing employers’ needs for cost reductions and greater flexibility. This particular
General deregulatory trends
4.Deregulation of labour law at any price
Working time, atypical employment and dismissal protection law under attack
62
Figure 4.3 Announced and/or adopted changes to IR/CB systems and certain aspects of labour law
AT BE BG CY CZ DE DK EE ES FI FR GR HR HU IE IT LT LU LV MT NL PL PT RO SE SI SK UK
Reform of Industrial relations and collective bargaining systems (incl. decentralisation of CB)
Changes to individual/ collective dismissal rules
Changes to working time legislation
Changes to rules on atypical contracts
Creation of new types of contract in particular for youth
Source: ETUI own research.Note: No data available for Malta.

In relation to reforms of atypical employment contracts, one of the main characteristics of the measures has been to diminish the protection provided by existing regulations. Such steps lead to greater precariousness for workers employed in the diverse forms of ‘atypi-cal’ employment relationship which include fixed-term and part-time con-tracts but also temporary agency work contracts (with the evidence showing, in this latter case, that most of the amend-ments made in this area relate to the implementation of Directive 2008/104 on temporary agency work). Additionally, the introduction of new types of contract that are often less protective and that tar-get specific groups of workers, mainly the young, has become a recurrent feature of reforms (Lang et al. 2013a).
Looking specifically at reforms of the provisions governing fixed-term con-tracts, evidence shows that the quality of this particular form of atypical work has drastically worsened because of the relaxation of a range of preventive meas-ures that were intended to curb abuse and discriminatory treatment of fixed-term workers. In many cases, the reforms adopted combine a threefold set of provi-sions: 1) amendments relating to the requirement for statement of objective reasons justifying the renewal of such employment contracts and relationships; 2) extension of the maximum total dura-tion thresholds for successive fixed-term
to open-ended contracts. However, the example of the Greek ‘youth contract’ measures to hire people up to the age of 25 on wages 20 per cent lower than the previous rate for first jobs, with a two-year probationary period, no social con-tributions for employers, and no entitle-ment to unemployment benefits at the end of the contract, has been shown to violate the rights to vocational training, social security and fair remuneration enshrined in the Council of Europe’s (Revised) European Social Charter (see Cases 65 and 66/2011).
The protection afforded atypical workers has been particularly affected by the impact of the economic crisis, placing these workers in an increasingly precari-ous situation and contravening both the letter and the spirit of European law. The measures in question have contributed, at the same time, to a more segmented labour market. Accordingly, what is intended as a ‘stepping stone’ to better quality jobs often turns into a way of ‘trapping’ workers in precarious employment.
Finally, the main features of the dismantling of the protection of workers against unfair dismissal/redundancy range, in practice, from a widening of the grounds for dismissal, a loosening of the notice period, a reviewing of the require-ment for advance notification, and a reduction of the severance pay due, as well as of the right to demand
employment contracts; and 3) increase in the number of renewals allowed for fixed-term contracts. However, increasing the maximum duration permitted for a fixed-term contract, thereby increasing the period during which workers find them-selves in an atypical situation, serves to undermine the effect of the ‘anti-abuse’ provisions contained in the Directive 1999/70/EC on Fixed-Term Work. Such measures further prevent, what is more, the likelihood of fixed-term contracts becoming a stepping stone to open-ended employment (see Lang et al. 2013a).
In the same vein, and turning to the adoption of new types of contract, evi-dence confirms that some member states have opened up ways of circumventing the legal framework of the Directives on fixed-term work and part-time work by using the possibilities offered by these Directives to exclude from their scope certain contracts that frequently offer less employment protection than stand-ard contracts, for example, by weakening rights to unemployment or social bene-fits, severance pay, or offering reduced wages. Such contracts are implemented with the idea of ‘helping’ particular cate-gories of workers, i.e. young and older workers, mainly those who have been affected the most by the recession. Here too, according to governments (and employers), the main aim of the reforms is to turn non-traditional forms of employment into a good stepping-stone
4.Deregulation of labour law at any price
Working time, atypical employment and dismissal protection law under attack
63
Figure 4.4 Developmentof the number of social CSRs from 2011-2013
CSRs CSRs CSRs2011–2012 2012–2013 2013–2014
WagesReviewing wage indexation 5 4 2Wage-setting mechanisms 8 7 7
EPL Employment protection legislation 6 8 4
Labour market participationWomen 6 9 5Older workers 8 7 12Tax disincentives for second earners 3 2 3
Youth
Youth Guarantee 0 0 12Transition from school to work via companies 0 2 5Apprenticeships/work-based learning 9 12 8‘Drop outs’ 4 7 6
PensionsLink pensionable age to life expectancy 13 12 11Reducing early retirement 12 11 10
VulnerableSocial protection systems 4 2 5Quality social services 0 1 2Targeting social assistance 2 4 3
Child povertyEffective child support 0 1 2Childcare facilities 6 7 9
Tax Shift tax burden away from labour 9 9 10
Source: European Commission country-specific recommendations; Clauwaert (2013).

4.Deregulation of labour law at any price
Working time, atypical employment and dismissal protection law under attack
64
compensation or reinstatement and /or the possibility of out-of-court dispute resolution procedure, to the reorganisa-tion of redress, i.e. access to court. The aim of the reforms is to increase the scope for avoidance of employment pro-tection and of recourse to the (labour) tribunal in case of dispute, in particular by raising the seniority threshold for access to employment protection rights and increasing the fees payable when fil-ing a case.
Turning to the rules governing col-lective redundancies, reforms can be seen to have raised the thresholds for qualifying dismissals as collective redun-dancies, thereby enabling circumvention of collective redundancy rules. In order to simplify collective redundancy proce-dures, some member states have amended the obligation contained in Article 4 of Directive 98/59/EC to obtain an authorisation from the relevant public authorities before making workers redundant on economic grounds. Reforms have also amended the employ-er’s duty to consider other measures before termination of employment and have loosened, for example, their obliga-tion to put in place a social plan for the benefit of workers made redundant. The criteria for selection of employees for dis-missal have also been relaxed, even though this violates the terms of ILO convention 166 which apply insofar as national measures do not detail the selec-tion criteria to be applied when a worker is dismissed. Selection criteria are of par-ticular importance to ensure that pro-tected groups of workers, such as work-ers’ representatives, are not dismissed in an arbitrary manner on the pretext of the collective termination of employment (see ILO 2011).
Not only does the European Com-mission’s deregulation agenda contra-vene primary and secondary European hard law on employment protection, but it has led to further precariousness of the workforce and, in combination with other reforms, to the impoverishment of the working population, thereby violat-ing the fundamental workers’ and social rights as enshrined in the EU Treaty and other European and international treaties.
Since the onset of the financial and economic crisis, most member states,
and in particular those that – unlike Ger-many – did not reform their employment protection law prior to the crisis, under-took a relaxation of their regulations on individual or collective dismissals, some-times coupled with reforms of working time arrangements and atypical employ-ment law, while decentralising collective bargaining systems and restructuring public services. Additionally, specific rules have been established for small businesses, with the general effect of excluding them from the scope of employ-ment protection law. Furthermore, national public services, social security and welfare systems/benefits (in particu-lar in the area of pensions) have been reformed within the framework of the European Commission’s austerity pro-gramme. Taken together, these far-reaching reforms have severely damaged the protective role of labour law and social security provision.
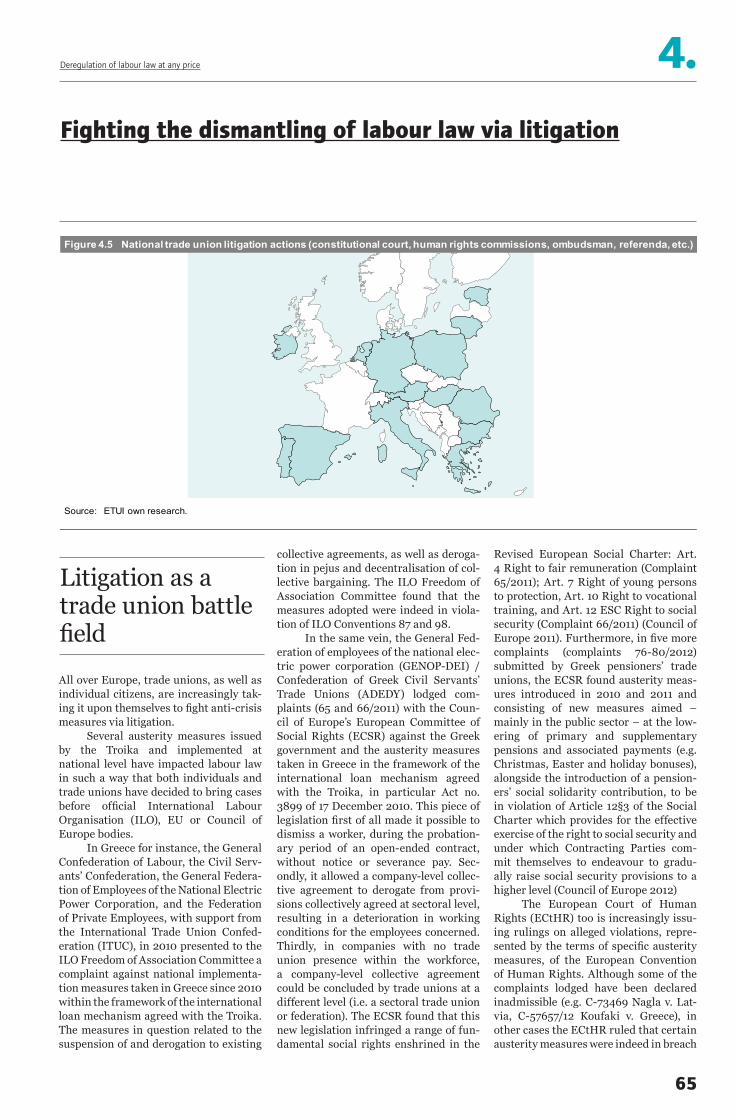
4.Deregulation of labour law at any price
Fighting the dismantling of labour law via litigation
All over Europe, trade unions, as well as individual citizens, are increasingly tak-ing it upon themselves to fight anti-crisis measures via litigation.
Several austerity measures issued by the Troika and implemented at national level have impacted labour law in such a way that both individuals and trade unions have decided to bring cases before official International Labour Organisation (ILO), EU or Council of Europe bodies.
In Greece for instance, the General Confederation of Labour, the Civil Serv-ants’ Confederation, the General Federa-tion of Employees of the National Electric Power Corporation, and the Federation of Private Employees, with support from the International Trade Union Confed-eration (ITUC), in 2010 presented to the ILO Freedom of Association Committee a complaint against national implementa-tion measures taken in Greece since 2010 within the framework of the international loan mechanism agreed with the Troika. The measures in question related to the suspension of and derogation to existing
Revised European Social Charter: Art. 4 Right to fair remuneration (Complaint 65/2011); Art. 7 Right of young persons to protection, Art. 10 Right to vocational training, and Art. 12 ESC Right to social security (Complaint 66/2011) (Council of Europe 2011). Furthermore, in five more complaints (complaints 76-80/2012) submitted by Greek pensioners’ trade unions, the ECSR found austerity meas-ures introduced in 2010 and 2011 and consisting of new measures aimed – mainly in the public sector – at the low-ering of primary and supplementary pensions and associated payments (e.g. Christmas, Easter and holiday bonuses), alongside the introduction of a pension-ers’ social solidarity contribution, to be in violation of Article 12§3 of the Social Charter which provides for the effective exercise of the right to social security and under which Contracting Parties com-mit themselves to endeavour to gradu-ally raise social security provisions to a higher level (Council of Europe 2012)
The European Court of Human Rights (ECtHR) too is increasingly issu-ing rulings on alleged violations, repre-sented by the terms of specific austerity measures, of the European Convention of Human Rights. Although some of the complaints lodged have been declared inadmissible (e.g. C-73469 Nagla v. Lat-via, C-57657/12 Koufaki v. Greece), in other cases the ECtHR ruled that certain austerity measures were indeed in breach
collective agreements, as well as deroga-tion in pejus and decentralisation of col-lective bargaining. The ILO Freedom of Association Committee found that the measures adopted were indeed in viola-tion of ILO Conventions 87 and 98.
In the same vein, the General Fed-eration of employees of the national elec-tric power corporation (GENOP-DEI) / Confederation of Greek Civil Servants’ Trade Unions (ADEDY) lodged com-plaints (65 and 66/2011) with the Coun-cil of Europe’s European Committee of Social Rights (ECSR) against the Greek government and the austerity measures taken in Greece in the framework of the international loan mechanism agreed with the Troika, in particular Act no. 3899 of 17 December 2010. This piece of legislation first of all made it possible to dismiss a worker, during the probation-ary period of an open-ended contract, without notice or severance pay. Sec-ondly, it allowed a company-level collec-tive agreement to derogate from provi-sions collectively agreed at sectoral level, resulting in a deterioration in working conditions for the employees concerned. Thirdly, in companies with no trade union presence within the workforce, a company-level collective agreement could be concluded by trade unions at a different level (i.e. a sectoral trade union or federation). The ECSR found that this new legislation infringed a range of fun-damental social rights enshrined in the
Source: ETUI own research.
Figure 4.5 National trade union litigation actions (constitutional court, human rights commissions, ombudsman, referenda, etc.)
Litigation as a trade union battle field
65

of the Convention. For example, in sev-eral cases against Hungary the imposi-tion of a 98% tax on the upper bracket of severance pay due in cases of individual dismissal was in breach of article 1 of Protocol n° 1 of the Convention on the right to property (e.g. C-66529/11 NKM v. Hungary).
At the EU level, and in addition to the complaints against national imple-mentation measures imposed by the Troika, changes in the architecture of the Lisbon Treaty – such as the setting up of the European Stability Mechanism as an intergovernmental organisation under public international law, as well as the Treaty on Stability, Coordination and Governance in the Economic and Mon-etary Union, also called Fiscal Compact, which had been adopted as emergency measures in the context of crisis – raise a series of legal issues in terms of com-petences, scope and the possibility of judicial review. Such amendments have indeed led, in many cases, to infringement of fundamental social rights enshrined at the international, European and national constitutional levels. A landmark judg-ment, the Pringle v. Government of Ire-land (CJEU C-370/12) case, in which the Irish Supreme Court was seeking a pre-liminary ruling, concerned the compati-bility of the Treaty establishing the Euro-pean Stability Mechanism (hereafter ESM Treaty or ESMT) with EU law. The case focussed on the legal validity – or
policy-making. It also involves a social deficit, as programme countries are com-pelled to progressively dismantle their social welfare systems in order to comply with strict budgetary requirements. Even more strikingly, the CJEU omits to men-tion that European institutions are bound by the European Charter of fundamental rights, as stated in Art. 51 (1) of the Charter according to which: ‘the provisions of this Charter are addressed to the institutions, bodies, offices and agencies of the Union with due regard for the principle of sub-sidiarity and to the Member States only when they are implementing Union law. They shall therefore respect the rights, observe the principles and promote the application thereof in accordance with their respective powers and respecting the limits of the powers of the Union as conferred on it in the Treaties.’ Pursuant to Art. 51 (1), at least the European Com-mission and the European Central Bank fall under the scope of application of the Charter of fundamental rights. Indeed, the link between, on the one hand, the ESMT and the Fiscal Compact and, on the other, the Lisbon Treaty, and their respectively different relations to EU law, creates a great deal of confusion and gen-erates a European hegemony of economic governance principles and structures over member states and other European fields of European law. The pending CJEU case C-264/12 Sindicato Nacional dos Profissionais de Seguros e Afins, may
otherwise – of adopting as matters ‘of exceptional urgency’, in an area of exclu-sive EU competence, crisis measures in the form of intergovernmental acts. Additionally, the question was raised of the legal validity of, first, the ESMT itself and its compatibility with the principles and provisions of the EU Treaties, given that it entered into force prior to the for-mal amendment of the Treaty which was conditional upon ratification by all mem-ber states; and, secondly, the recourse to the simplified revision procedure (Art. 48 (6) TEU) to amend the Treaty. The ques-tion of whether the ESMT constitutes a violation of the right to effective judicial protection under Art. 47 of the EU Char-ter of fundamental rights was also raised. The CJEU held that the treaty amend-ment confirmed the competence of the member states to conclude a treaty such as the ESMT, while seeking to ensure the compatibility of that Treaty with EU law through the imposition of strict con-ditionality. The CJEU further ruled that the ESMT was compatible with EU law, interpreting the ‘no bailout’ clause as allowing grants of financial assistance to member states in need when the stability of the euro area as a whole is at risk.
With the Pringle case, however, the CJEU constitutionalised the requirement of strict conditionality, so as to assert the ESM’s compliance with EU law. Yet, as argued by Van Malleghem (2013), con-ditionality alters domestic democratic
4.Deregulation of labour law at any price
Fighting the dismantling of labour law via litigation
International: ILO, other UN texts
European: Council of Europe/ECtHR, EU/CJEU
Figure 4.6 Trade union litigation actions at international level
Source: ETUI own research.
66
perhaps supply an answer to the question of the compatibility with the Charter of fundamental rights of the memorandum of understanding concluded with Portu-gal as a condition of financial assistance from the European Financial Stability Mechanism (EFSM) and the European Financial Stability Facility (EFSF).Recent evidence has shown, further-more, that initiatives taken by the Troika in imposing austerity policy measures represent an infringement of EU primary law including the Charter of fundamental rights (Fischer-Lescano 2013). Indeed, the financial and economic crisis, fol-lowed in a number of member states by the sovereign debt crisis, do not represent a state of emergency such as to prevent EU institutions from complying with EU law. The European Commission and the Central Bank have violated EU law, and in particular fundamental rights, by the adoption, for programme countries, of disproportionate conditionality that has led these countries to dismantle their labour law and social security systems. Furthermore, the approach adopted by the EU institutions in its use of the Euro-pean Stability Mechanism disregards core competences of EU law.
Such developments are at odds with the European values and principles of economic, social and territorial cohe-sion, as well as of solidarity among mem-ber states, social justice and protection, equality between women and men and solidarity between generations. Nor are they in keeping with a sustainable devel-opment of Europe based on balanced economic growth and price stability, a highly competitive social market econ-omy, aimed at full employment and social progress, or a high level of protection.
Finally, constitutional reviews conducted in some member states have identified certain anti-crisis measures as violations of national constitutional principles and values. Member states where this is the case include the follow-ing: Hungary in 2010; the Netherlands in 2012; Germany in 2012; Greece and Aus-tria in 2012; Poland in 2013; as well as Estonia in 2012. In 2013, the Portuguese constitutional court saw fit to revoke national implementation measures of the economic austerity plan agreed with the Troika that would, among other things, have made it easier to lay off civil
servants. The court ruled such a meas-ure to be unconstitutional insofar as it violates the guarantee of secure employ-ment and the principle of trust between employer and employee.
As is evident from the above instances, cases are increasingly being brought, at different levels and by dif-ferent actors, to contest the devastating impact of austerity measures. While the outcome of complaints lodged so far has been variable, it can only be expected that more cases will come to the fore as austerity reforms continue to be pursued.
4.Deregulation of labour law at any price
Fighting the dismantling of labour law via litigation
67

4.Deregulation of labour law at any price
omnes’ with the EU acquis communau-taire, including the existing provisions in crucial social fields like information and consultation rights and health and safety protection at work. The financial reward for member states reporting back to Brussels on the success of their labour law reforms may be high, but the highest price is paid by society at large, and by workers in particular.
This ‘outlawing’ of individual and collective labour law has to stop. After five years of austerity measures of this sort, it is abundantly clear that they have not worked, that this much-hailed route out of crisis is ineffective and singularly ill chosen. For more people than ever are out of work, and more of those who still have jobs are numbered among the ‘working poor’ or have hardly any decent statutory protection rights remaining to them. It is time, therefore, for a radical change of course and for a move away from austerity to ‘social investment’, as demanded by, among others, the Euro-pean trade union movement. It is to be hoped that, unlike Mr Somavia’s alert two-and-a-half years ago, this call will not fall on deaf ears. It is to be hoped, above all, that it will be heard and heeded by the new European Commissioners, and by the new members of the European Parliament to be elected in May 2014.
In spite of the lack of evidence that the financial and economic crisis is in any way attributable to existing labour law provisions in the member states, hardly a single essential stone in the edifice of individual and collective labour law – be it working time, atypical employment, employment protection law in respect of individual or collective dismissals, or collective bargaining systems – has been left unturned.
Over and above the deregulation of labour law in the interests of flexicurity arrangements and adaptability at a time of crisis, this is a full-blown exercise in the deconstruction of labour law with complete and utter disregard for exist-ing labour standards enshrined in inter-national, European and national law.
The instruments and institutions created and the means employed at Euro-pean level (Memorandum of Understand-ing, Country Specific Recommendations, European Stability Mechanism Treaty, Fiscal Treaty, etc.) for the promotion of such reforms, together with the requisite narrative backup scenario describing the so-called ‘emergency situation’ and the need for reform, simply do not stand up to sound legal investigation and scrutiny. The legality of the austerity measures themselves can indeed be contested and is, quite rightly, increasingly subject to question.
Slowly but steadily, international and European human – and social – rights bodies, like the ILO, the European Court of Human Rights, the European Committee for Social Rights, but also national – constitutional – courts faced with complaints about austerity meas-ures as envisaged and/or implemented, condemn these measures as being in clear and blatant breach of the interna-tional, European and national funda-mental rights and obligations that these institutions have been set up to guaran-tee and safeguard.
And yet these rulings continue to be ignored by European-level and national policymakers. The European Commission, in particular, has affixed a large ‘wanted’ stamp on the whole cor-pus of individual and collective labour law and has, via the recently adopted REFIT programme, done the same ‘erga
This chapter demonstrates the alarm-ingly adverse impact of labour law reforms, enacted under cover of the eco-nomic and financial crisis, on workers’ rights in particular and on fundamen-tal social rights in general. The recent national-level reforms frequently consti-tute further deregulation of labour law provisions that have been already relaxed in the past in response to political or employer demands for greater workforce flexibility; they thus represent, in most cases, a backward step in terms of work-ers’ protection, as well as a real threat to any remaining hopes of European social integration.
Indeed, since 2008, the European Union’s deregulatory agenda and crisis management practices have led all mem-ber states to engage in hard-hitting and wide-ranging reforms of their labour and social law, as well as of the regula-tions governing their public sectors. The national governments’ zeal in this respect has hardly been curbed by the numerous international and national signals that such reforms constitute violations of fun-damental social rights which, in accord-ance with their obligations under inter-national, European and national law, the governments in question are required to observe and to promote.
On 14 September 2011, in an address to the European Parliament, for-mer ILO Director-General Juan Somavia stated, ‘Respect for fundamental princi-ples and rights at work is non-negotiable, even in times of crisis when questions of fairness abound.(…) We cannot use the crisis as an excuse to disregard interna-tionally agreed labour standards’. This warning has clearly fallen on deaf ears. In particular, it has not been heeded by the current European Commission mem-bers and their leader Mr. Barroso.
Attacks on indivi-dual and collective labour law have to stop now
Conclusions
68

Half a decade of pressure on wages and collective bargainingIntroduction
The neoliberal transformation of industrial relations involving processes of
decentralisation and de-collectivisation is not a new phenomenon, for it can be
traced back to the 1980s (Baccaro and Howell 2011). However, during the past five
years the austerity approach and the structural reforms pursued by European and
national policy-makers in the effort to come to terms with the crisis have further
advanced this process of change. In the field of wages and collective bargaining,
the impact of the reform policies manifests itself in the following three respects:
first, in the continuing pressure for wage restraint; second, in the growing
decentralisation of collective bargaining processes; and third, in the increasing
direct political intervention in collective bargaining designed to ensure the effective
implementation of the wage moderation and decentralisation policies (Müller and
Bernaciak 2013; Schulten and Müller 2013a).
The aim of this chapter is to provide a more detailed analysis of these three key
implications of the crisis. The starting point will be the analysis of the different
mechanisms used for the purpose of direct intervention in national collective
bargaining developments; we will thus highlight the important role played by
Country-Specific Recommendations and Memorandums of Understanding in
exerting pressure on national governments and collective bargaining actors.
Subsequently, the chapter will deal with the quantitative and qualitative implications
of this newly emerging European wage policy interventionism. This part will cover
the following issues: the development of public sector wages and minimum wages as
the primary targets of political intervention into wage levels, the various initiatives
to undermine multi-employer bargaining arrangements, and finally the impact of all
these measures on the overall pattern of wage developments. The chapter concludes
with an analysis of the impact of the crisis on the forms of collective organisation
and action of workers in terms of unionisation trends and strike patterns.
Topics
> European wage policy interventionism 70> Wage developments and bargaining procedures 75> Collective organisation and action of workers 79> Conclusions 82
69

The new European system of economic governance that has been put in place in response to the financial and eco-nomic crisis has created the conditions for increasingly direct political interven-tion in national bargaining outcomes and procedures. The key objective of this new interventionist approach was to ensure that national wage policies should con-tribute to the successful implementa-tion of the EU reform policies which, for their part, combine two main emphases: the pursuit of austerity policies aimed at reducing public expenditure and consoli-dating state budgets; and the implemen-tation of so-called ‘structural reforms’ designed to improve national competitive-ness. In the field of wages and collective bargaining this led to increasing political pressure for wage restraint and for more decentralised wage-setting mechanisms.
In order to implement the austerity and structural reform agenda in the field of collective bargaining, two instruments of wage policy intervention have been
between the two instruments of political intervention notwithstanding, the policy intention remains the same: to put pres-sure on national governments and col-lective bargaining actors to ensure wage restraint and the decentralisation of col-lective bargaining.
In view of a growing discomfort with the non-binding character of CSRs, the German chancellor Angela Merkel proposed the conclusion of competitive-ness pacts between the EU and individ-ual member states as the next-step build-ing block in an even stronger system of economic governance (Merkel 2013). The ultimate purpose of this suggestion is to transfer the contractual logic of MoUs and SBAs to all member states and to cre-ate a ‘Troika for all’ (Oberndorfer 2013) in which the member states commit them-selves to implement ‘structural reforms’ in return for some kind of financial sup-port. Since, following the logic of MoU and SBAs, these ‘structural reforms’ would also cover the area of wages and collective bargaining, such competitive-ness pacts would represent the next turn of the screw in wage policy intervention-ism. Even though this idea was rejected at the meeting of the European Coun-cil in December 2013, the insistence on further reforms in the Annual Growth Survey 2014 suggests that the European institutions are not willing to ease their interventionist wage policy approach vis-à-vis the member states (Janssen 2013a).
used: country-specific recommenda-tions (CSRs) issued in the context of the European Semester; and bilateral agree-ments between national governments and the Troika or the IMF/EU – the so-called ‘Memorandums of Understand-ing’ (MoU) and ‘Stand-by Arrangements (SBA) respectively. The two types of instrument vary in the extent to which they are binding. Though there is the possibility of imposing financial sanc-tions in the case of non-compliance, CSRs are not legally binding. Since in the case of MoUs and SBAs there is a contractual agreement to implement cer-tain wage policy measures in return for financial support, political intervention through this second channel has a more immediate impact and is therefore more binding in character (Schulten and Mül-ler 2013a: 188).
Figure 5.1, which lists the vari-ous EU-level measures put forward between 2011 and 2013 in the context of CSRs and MoUs and/or SBAs, illustrates that, within this period, 18 out of 28 EU countries have been affected by at least one EU-level measure directly affecting collective bargaining outcomes or pro-cedures. This clearly shows that wage policy intervention was not confined to the so-called ‘programme countries’ – even though as regards their content, the measures imposed in these coun-tries have been far more severe and pro-found. However, these formal differences
Political intervention in national collective bargaining
5.Half a decade of pressure on wages and collective bargaining
European wage policy interventionism
Figure 5.1 New European wage policy interventionism, 2011-2013
Recommendations in the field of wages and collective bargaining European Semester (CSRs)
Troika / IMF(MoUs/SBAs)
Wage restraint BG, FI (2012), IT, SI
Restrictive minimum wage developments FR, SI
Freezes/cuts of minimum wage GR, IE, LV, PT, RO
Freezes/cuts of public sector wages GR, IE, HU, LV, PT, RO
Freezes of private sector wages GR
Higher wage dispersion at the lower end of the wage scale SE
Wage developments in line with productivity DE, FI (2013)
Decentralisation of collective bargaining BE, ES, IT GR, PT, RO
Stricter rules for extension of collective agreements GR, PT, RO
Reform/abolition of wage indexation BE, CY, LU, MT CY (since 2013)
Source: Schulten and Müller (2013a, 299).
70
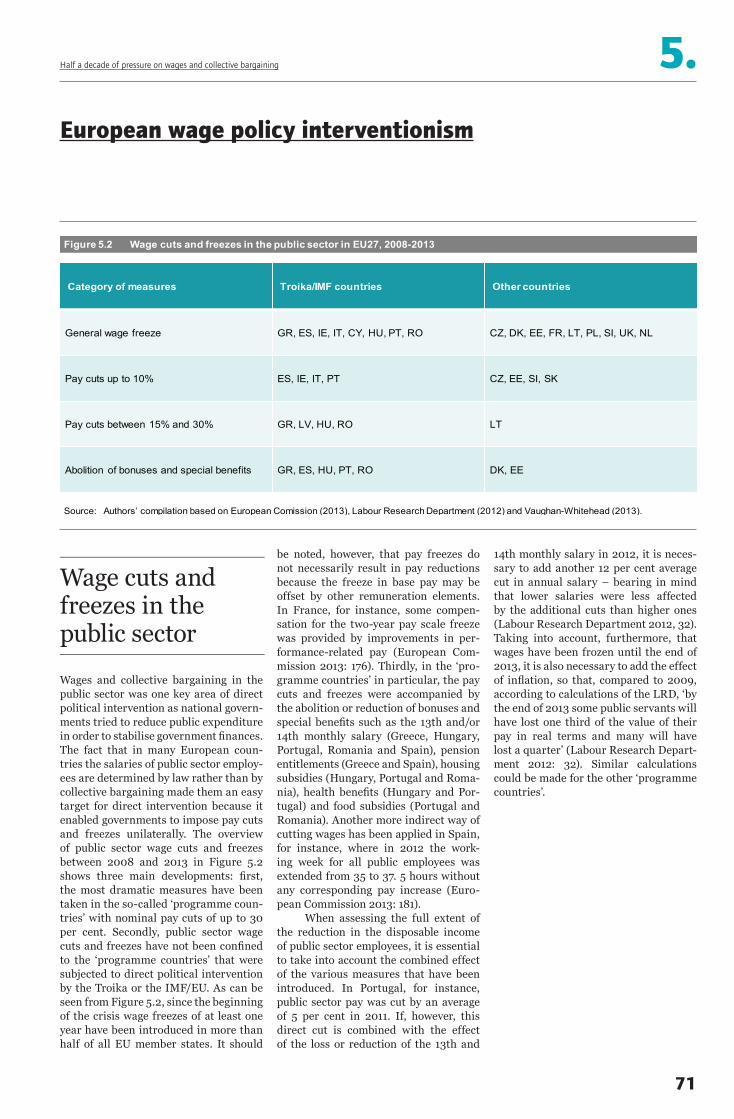
Wages and collective bargaining in the public sector was one key area of direct political intervention as national govern-ments tried to reduce public expenditure in order to stabilise government finances. The fact that in many European coun-tries the salaries of public sector employ-ees are determined by law rather than by collective bargaining made them an easy target for direct intervention because it enabled governments to impose pay cuts and freezes unilaterally. The overview of public sector wage cuts and freezes between 2008 and 2013 in Figure 5.2 shows three main developments: first, the most dramatic measures have been taken in the so-called ‘programme coun-tries’ with nominal pay cuts of up to 30 per cent. Secondly, public sector wage cuts and freezes have not been confined to the ‘programme countries’ that were subjected to direct political intervention by the Troika or the IMF/EU. As can be seen from Figure 5.2, since the beginning of the crisis wage freezes of at least one year have been introduced in more than half of all EU member states. It should
14th monthly salary in 2012, it is neces-sary to add another 12 per cent average cut in annual salary – bearing in mind that lower salaries were less affected by the additional cuts than higher ones (Labour Research Department 2012, 32). Taking into account, furthermore, that wages have been frozen until the end of 2013, it is also necessary to add the effect of inflation, so that, compared to 2009, according to calculations of the LRD, ‘by the end of 2013 some public servants will have lost one third of the value of their pay in real terms and many will have lost a quarter’ (Labour Research Depart-ment 2012: 32). Similar calculations could be made for the other ‘programme countries’.
be noted, however, that pay freezes do not necessarily result in pay reductions because the freeze in base pay may be offset by other remuneration elements. In France, for instance, some compen-sation for the two-year pay scale freeze was provided by improvements in per-formance-related pay (European Com-mission 2013: 176). Thirdly, in the ‘pro-gramme countries’ in particular, the pay cuts and freezes were accompanied by the abolition or reduction of bonuses and special benefits such as the 13th and/or 14th monthly salary (Greece, Hungary, Portugal, Romania and Spain), pension entitlements (Greece and Spain), housing subsidies (Hungary, Portugal and Roma-nia), health benefits (Hungary and Por-tugal) and food subsidies (Portugal and Romania). Another more indirect way of cutting wages has been applied in Spain, for instance, where in 2012 the work-ing week for all public employees was extended from 35 to 37. 5 hours without any corresponding pay increase (Euro-pean Commission 2013: 181).
When assessing the full extent of the reduction in the disposable income of public sector employees, it is essential to take into account the combined effect of the various measures that have been introduced. In Portugal, for instance, public sector pay was cut by an average of 5 per cent in 2011. If, however, this direct cut is combined with the effect of the loss or reduction of the 13th and
Wage cuts and freezes in the public sector
5.Half a decade of pressure on wages and collective bargaining
European wage policy interventionism
Figure 5.2 Wage cuts and freezes in the public sector in EU27, 2008-2013
Category of measures Troika/IMF countries Other countries
General wage freeze GR, ES, IE, IT, CY, HU, PT, RO CZ, DK, EE, FR, LT, PL, SI, UK, NL
Pay cuts up to 10% ES, IE, IT, PT CZ, EE, SI, SK
Pay cuts between 15% and 30% GR, LV, HU, RO LT
Abolition of bonuses and special benefits GR, ES, HU, PT, RO DK, EE
Source: Authors’ compilation based on European Comission (2013), Labour Research Department (2012) and Vaughan-Whitehead (2013).
71

Comparing the development of compen-sation of public administration employ-ees before and during the crisis, Figure 5.2 illustrates that in the majority of EU countries (19 out of 27) the crisis has led to a slowdown in the rate of increase in compensation and that this slowdown has been most severe in the ‘programme countries’. The salary cuts and freezes have often been introduced unilaterally by government without any involvement of trade unions. This applies in particu-lar to the ‘programme countries’, which were under the pressure from the Troika and financial markets. Even in those countries with a tradition of collective bargaining and/or social dialogue in the public sector (such as Greece, Italy, Portugal, Spain and the UK) these pro-cesses have been suspended or sidelined (European Commission 2013: 154). To be sure, there exist a few examples of ‘crisis-driven corporatism’, such as an agree-ment on wage reductions in the public sector concluded in May 2012 between
concentrated on lower-skilled work-ers and is reversed for higher-skilled employees in higher job positions (De Castro et al. 2013). This in turn means that the wage premium characteristic of the public sector can also be explained by the more equal and compressed pay structure found there, displaying smaller ranges in pay between the lowest and the highest pay groups. Taking all this into consideration, it is even more startling how the crisis-induced wage cuts and freezes in some ‘programme countries’ turned the wage premium that existed before the crisis into a wage penalty within a very short period of time. In Romania, for instance, the 45 per cent public sector wage premium recorded in 2009 had, by the end of 2010, been turned into a loss of 15 per cent. Hungary is another case in point because the pre-mium of 15 per cent existing in 2004 had been converted into a penalty of 12 per cent by 2009 (Vaughan-Whitehead 2013: 21). This illustrates the extent to which public sector employees had to bear the brunt of the so-called ‘crisis adjustment measures’. In other countries, the Neth-erlands being a good example, the public sector wage premium disappeared over a much longer period, in this case between 1979 and 2004 – with therefore much less dramatic social consequences.
the Slovenian government and the coun-try’s public sector unions (Skledar 2012). Another example of negotiated solutions is found in Ireland where austerity meas-ures have been based on two agreements between the government and public sec-tor trade unions signed in June 2010 and July 2013. However, these two exam-ples of negotiated austerity measures are rather the exception than the rule (Bernaciak 2013). Closely linked with the emergence of unilateralism is the re-centralisation of wage-setting because in many countries measures have been decided and defined at central level and then applied ‘in a generalized and undif-ferentiated way to all services and all employees’ (Bach and Bordogna 2013: 291).
The severe public sector pay cuts and freezes in the ‘programme countries’ also had implications for the relation-ship between public and private sector wages. In general, it can be expected that pay levels in the public sector tend to be higher than those in the private sec-tor due to labour force characteristics and compositional effects. As such, the higher pay levels in the public sector can be explained by the fact that public sector employees tend to be older, to have higher levels of education and training, as well as longer seniority (Vaughan-Whitehead 2013: 18). An analysis recently published by DG ECFIN also found that the wage premium in the public sector is mainly
Public sector wage developments before and during the crisis
5.Half a decade of pressure on wages and collective bargaining
European wage policy interventionism
Figure 5.3 Compensation of public administration employees in EU27, 2002–2007 and 2007-2011
-5
0
5
10
15
20
25
30
LV PT IE HU GR IT CZ SE RO UK FR DE LT NL AT ES FI EE DK BE SK MT CY SI BG LU PL
2002-2007 2007-2011
Source: European Commission (2013). Note: Annual % change averaged over the 2002-2007 and 2007-2011 periods.
72

Besides cuts and freezes in public sector wages, a restrictive minimum wage pol-icy was another important element of the European crisis management based on austerity and internal devaluation. Like wages in the public sector, minimum wages were an easy target for direct polit-ical intervention because in the majority of the 21 EU countries where a national minimum wage exists, its level is statuto-rily determined by the state (for an over-view of different minimum wage systems see Schulten 2012a and Kampelmann et al. 2013). Against this background it is not surprising that in countries includ-ing Greece, Ireland, Portugal, Romania, Latvia, and (more informally) Spain, cuts and freezes of minimum wages belonged to the Troika’s core demands in return for financial assistance. The intervention of the Troika also extended to changes in the way the minimum wage is deter-mined. In Romania and Greece the mini-mum wage was traditionally determined by a national collective agreement. In response to demands from the Troika, in both countries the system of negotiated
show a substantial decline in real mini-mum wages over the last six years. In the latter, minimum wages were increased in 2013 (by 3.8%) for the first time since January 2007 (Veverková 2013).
What Figure 5.4 also shows is that countries – Luxembourg, France, Malta, Belgium and (to some extent) The Nether-lands – which apply an indexation model whereby national minimum wages are quasi automatically linked and adjusted to economic indicators achieved much better results. Such countries at least managed – more or less – to maintain the real value of the national minimum wage.
Substantial real minimum wage increases of 10% or more took place only in some Central and Eastern European countries ranging from 9.9% in Latvia to 27.2% in Romania. These impressive-looking increases are however, at least partly, attributable to statistical base effects due to the very low – below 3€ – absolute level of hourly minimum wages (Schulten 2014b), such that a compara-tively small increase in absolute terms makes for a fairly large increase in rela-tive terms.
minimum wages was replaced by a sys-tem of statutory minimum wages – in Romania in 2011 and in Greece in 2012 (Schulten 2014a).
The rationale behind the impo-sition of a restrictive minimum wage policy was based on the view that high minimum wages represent an obstacle to the downward flexibility of wages, which in turn is seen as a central prerequisite for restoring competitiveness (Janssen 2012). Since in many European countries minimum wages have an important sig-nalling function for overall wage devel-opments, the restrictive minimum wage policy also served to set the tone for wage negotiations in order to ensure overall wage restraint.
Figure 5.4 shows that, as a result of this policy, real hourly minimum wages decreased in a range of countries. While, as a rule, the development of minimum wages was closely linked to the economic development, in some countries like Greece, Spain and Ireland this process of declining real minimum wages was rein-forced by political intervention from the EU level. If one looks only at the develop-ment of real minimum wages since 2011, this applies also to Portugal where there has been a decrease of more than 5% over the last three years (Schulten and Müller 2013a: 195). Figure 5.4 shows also, how-ever, that this process was not confined to the ‘programme countries’. The United Kingdom and the Czech Republic also
Crisis keeps minimum wages down
5.Half a decade of pressure on wages and collective bargaining
European wage policy interventionism
Figure 5.4 Development of real hourly minimum wages in EU28, 2007-2013
Source: Author's calculations based on WSI Minimum Wage Database (version January 2014).
-30
-20
-10
0
10
20
30
RO SI PL BG SK HU LV LU HR FR PT MT BE NL LT IE EE ES UK CZ GR
73
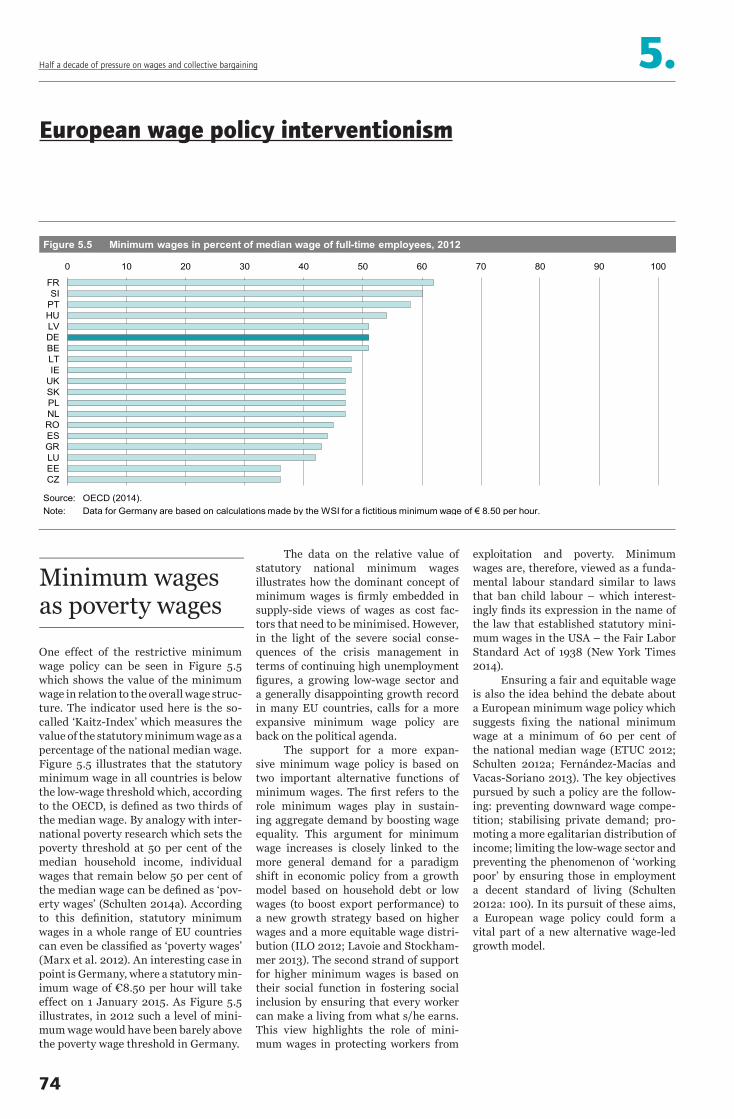
One effect of the restrictive minimum wage policy can be seen in Figure 5.5 which shows the value of the minimum wage in relation to the overall wage struc-ture. The indicator used here is the so-called ‘Kaitz-Index’ which measures the value of the statutory minimum wage as a percentage of the national median wage. Figure 5.5 illustrates that the statutory minimum wage in all countries is below the low-wage threshold which, according to the OECD, is defined as two thirds of the median wage. By analogy with inter-national poverty research which sets the poverty threshold at 50 per cent of the median household income, individual wages that remain below 50 per cent of the median wage can be defined as ‘pov-erty wages’ (Schulten 2014a). According to this definition, statutory minimum wages in a whole range of EU countries can even be classified as ‘poverty wages’ (Marx et al. 2012). An interesting case in point is Germany, where a statutory min-imum wage of €8.50 per hour will take effect on 1 January 2015. As Figure 5.5 illustrates, in 2012 such a level of mini-mum wage would have been barely above the poverty wage threshold in Germany.
exploitation and poverty. Minimum wages are, therefore, viewed as a funda-mental labour standard similar to laws that ban child labour – which interest-ingly finds its expression in the name of the law that established statutory mini-mum wages in the USA – the Fair Labor Standard Act of 1938 (New York Times 2014).
Ensuring a fair and equitable wage is also the idea behind the debate about a European minimum wage policy which suggests fixing the national minimum wage at a minimum of 60 per cent of the national median wage (ETUC 2012; Schulten 2012a; Fernández-Macías and Vacas-Soriano 2013). The key objectives pursued by such a policy are the follow-ing: preventing downward wage compe-tition; stabilising private demand; pro-moting a more egalitarian distribution of income; limiting the low-wage sector and preventing the phenomenon of ‘working poor’ by ensuring those in employment a decent standard of living (Schulten 2012a: 100). In its pursuit of these aims, a European wage policy could form a vital part of a new alternative wage-led growth model.
The data on the relative value of statutory national minimum wages illustrates how the dominant concept of minimum wages is firmly embedded in supply-side views of wages as cost fac-tors that need to be minimised. However, in the light of the severe social conse-quences of the crisis management in terms of continuing high unemployment figures, a growing low-wage sector and a generally disappointing growth record in many EU countries, calls for a more expansive minimum wage policy are back on the political agenda.
The support for a more expan-sive minimum wage policy is based on two important alternative functions of minimum wages. The first refers to the role minimum wages play in sustain-ing aggregate demand by boosting wage equality. This argument for minimum wage increases is closely linked to the more general demand for a paradigm shift in economic policy from a growth model based on household debt or low wages (to boost export performance) to a new growth strategy based on higher wages and a more equitable wage distri-bution (ILO 2012; Lavoie and Stockham-mer 2013). The second strand of support for higher minimum wages is based on their social function in fostering social inclusion by ensuring that every worker can make a living from what s/he earns. This view highlights the role of mini-mum wages in protecting workers from
Minimum wages as poverty wages
5.Half a decade of pressure on wages and collective bargaining
European wage policy interventionism
Figure 5.5 Minimum wages in percent of median wage of full-time employees, 2012
Source: OECD (2014).Note: Data for Germany are based on calculations made by the WSI for a fictitious minimum wage of € 8.50 per hour.
0 10 20 30 40 50 60 70 80 90 100
CZEELUGRESRONLPLSKUKIELTBEDELVHUPTSI
FR
74

So far, this chapter has demonstrated that the recent downturn and the sub-sequent austerity drive have negatively affected wage levels in the EU. However, direct political intervention has not been confined to bargaining outcomes. Since the outbreak of the crisis, governments across Europe have launched compre-hensive reforms of collective bargaining institutions and procedures. This pro-cess has been most pronounced in the programme countries where the Troika pushed for a radical decentralisation of wage-setting procedures in return for financial assistance. The objectives of the intended ‘reforms’ were set out remarkably openly in a report published by DG ECFIN in 2012. Under the head-ing ‘employment-friendly reforms’ DG ECFIN lists the following measures which they view as necessary to achieve the desired decentralisation of the wage bargaining framework: decrease the bargaining coverage; decrease auto-matic extension of collective bargaining; remove or limit the favourability princi-ple; introduce or extend the possibility to
(Schulten and Müller 2013a). Some of the reforms were complementary in charac-ter; for instance, new regulations facili-tating derogations from sectoral collec-tive agreements often went hand in hand with the introduction of more restrictive criteria for the extension of collective agreements or with the elimination of their ‘after effect’. The combined effect of these changes was the decentralisation and de-collectivisation of industrial rela-tions in these countries. This can be seen from the dramatic decline in collective bargaining coverage. Between 2008 and 2012, the number of registered collec-tive agreements in Spain went down by 43% from 6,000 to approximately 3,400, while the number of workers covered by such agreements decreased by 41% from 12 million to just above 7 million (Minis-terio de Empleo y Seguridad Social 2013). The corresponding figures for Portugal are even more dramatic. The number of registered collective agreements went down by 71% (from 295 to 85) and the number of workers covered by a collec-tive agreement collapsed by 84% from 1.9 million to 328,000 (Campos Lima 2013). Even in Latvia where collective bargain-ing coverage was already traditionally low the number of workers covered by a collective agreement decreased by 43% between 2007 and 2011 (Karnite 2013).
derogate from higher-level agreements or to negotiate firm-level agreements; finally, reduce the wage-setting power of trade unions (European Commission 2012: 103-104). The overview of major reforms of the wage-setting system in the ‘programme countries’ in Figure 5.6 demonstrates that the items on the DG ECFIN list have been put into practice virtually without exception.
A look at changes in individual countries shows that Romania and Ireland saw a complete breakdown of national-level collective bargaining structures that had been in place before the crisis. In the case of Ireland, this was the result of the government’s with-drawal from negotiations on the public sector reform in 2009. In Romania, the national collective agreement was abol-ished in 2011 by the so-called Social Dialogue Act, unilaterally implemented by the government (Trif 2013). Since at the same time the Act re-organised branch-level bargaining structures and introduced new representativeness cri-teria for social partner organisations, the bargaining process virtually came to a standstill. In effect, the collective bargaining coverage rate has gone down from 90% to an estimated 20% (Visser 2013). In Greece, Portugal and Spain, sectoral bargaining structures have for-mally remained intact, but have been hollowed out by legal changes introduced in response to the Troika’s conditionality
Farewell to multi-employer bargaining?
5.Half a decade of pressure on wages and collective bargaining
Wage developments and bargaining procedures
Figure 5.6 Decentralisation of collective bargaining systems in EU countries under EU, ECB and/or IMF surveillance
Source: Schulten and Müller (2013b, 198).
Measures Affected countries
Abolition/termination of national collective agreements Ireland, Romania
Facilitating derogation of firm-level agreements from sectoralagreements or legislative (minimum) provisions
Greece, Portugal, Hungary, Italy, Spain
General priority of company agreements/abolition of the favourability principle
Greece, Italy, Spain
More restrictive criteria for extension of collective agreements Greece, Portugal, Romania
Reduction of the ‘after-effect’ of expired collective agreements Greece, Spain
Possibilities to conclude company agreements by non-union group of employees
Greece, Hungary, Portugal, Romania, Spain
75

The implications of the far-reaching changes, both quantitative and qualita-tive, that have been implemented in the field of wages and collective bargain-ing in many European countries can be seen in Figures 5.7 and 5.8 which show the development of real wages during the crisis. To illustrate how different countries have been affected to differ-ing degrees and at different points in time, the crisis period has been broken up into two periods. Figure 5.7 shows the development from 2007 to 2009 and Figure 5.8 from 2009 to 2013. In order to understand the magnitude of the change, real wage developments during the cri-sis have to be set against developments in the pre-crisis period. In the first part of the 2000s, real wages grew in all EU member states except Germany (ETUC and ETUI 2013: 50). Central and east-ern European (CEE) countries, together with the United Kingdom and Ireland, recorded the largest increases. Latvia, Estonia and Lithuania topped the scale with real wage increases of more than 60 per cent between 2001 and 2007: in the case of all three ‘Baltic Tigers’, high GDP growth rates (see Chapter 1) went hand
period, moving from the top to the very bottom of the table. The real wage decline was also substantial in Hungary, plagued by high government debt levels, unequal balance of payments, and problems with banking sector liquidity. In line with the deal attached to a 25-billion-dollar res-cue package provided by the IMF, the EU and the European Central Bank, the country embarked on a tough auster-ity programme, while, at the same time, the real economy suffered as a result of dwindling exports. Other CEE countries managed to maintain positive real wage growth rates. This is true of Bulgaria, which avoided major upheavals thanks to relatively low pre-crisis spending levels and macroeconomic discipline, as well as of Slovakia and Poland, where the decline in exports and the corresponding fall in industrial output proved only temporary. Importantly, between 2007 and 2009, western European countries were largely unaffected by the crisis. This positive development was mirrored in real wage growth figures, which remained positive in all but three (Germany, the UK and Sweden) of the ‘old’ EU member states.
in hand with substantial increases in real employee compensation.
With the outbreak of the crisis, the nearly universal real wage growth trend came to an end. The new trend of real wage decreases in many countries is the expression of the reduced bargain-ing power of trade unions due to a rapid surge in unemployment and the eco-nomic downturn. As a result, they were often forced to accept wage freezes or to make wage concessions in order to safe-guard employment. Finally, direct politi-cal intervention in wage outcomes and wage-setting systems, guided by a nar-row supply-side view of wages as compet-itiveness factor, led to the spread of wage restraint policies in Europe.
The impact of the crisis and the subsequent austerity drive on wages was not uniform across the EU and it also var-ied considerably over time. However, as a general rule, it can be stated that at any given point in time, EU member states that were most affected by the crisis and implemented far-reaching austerity measures featured the largest real wage decreases. In 2007-2009, the economic slowdown was discernible mainly in new EU member states. Figure 5.7 shows that this was also the time of a major slump in real wages in the CEE countries. The Baltic countries saw their real wages con-tracting by 5-15% and thus diametrically changed their position on the European wage scale compared to the pre-crisis
Real wages: from boom to bust
5.Half a decade of pressure on wages and collective bargaining
Wage developments and bargaining procedures
Figure 5.7 Development of real wages in EU28, 2007-2009 (2007=100)
Source: Authors' calculations based on Ameco (version November 2013).
-20
-15
-10
-5
0
5
10
15
20
RO BG ES SK PL PT IE SI NL DK AT GR FR CY IT FI LU MT BE HR DE UK SE CZ EE HU LT LV
76
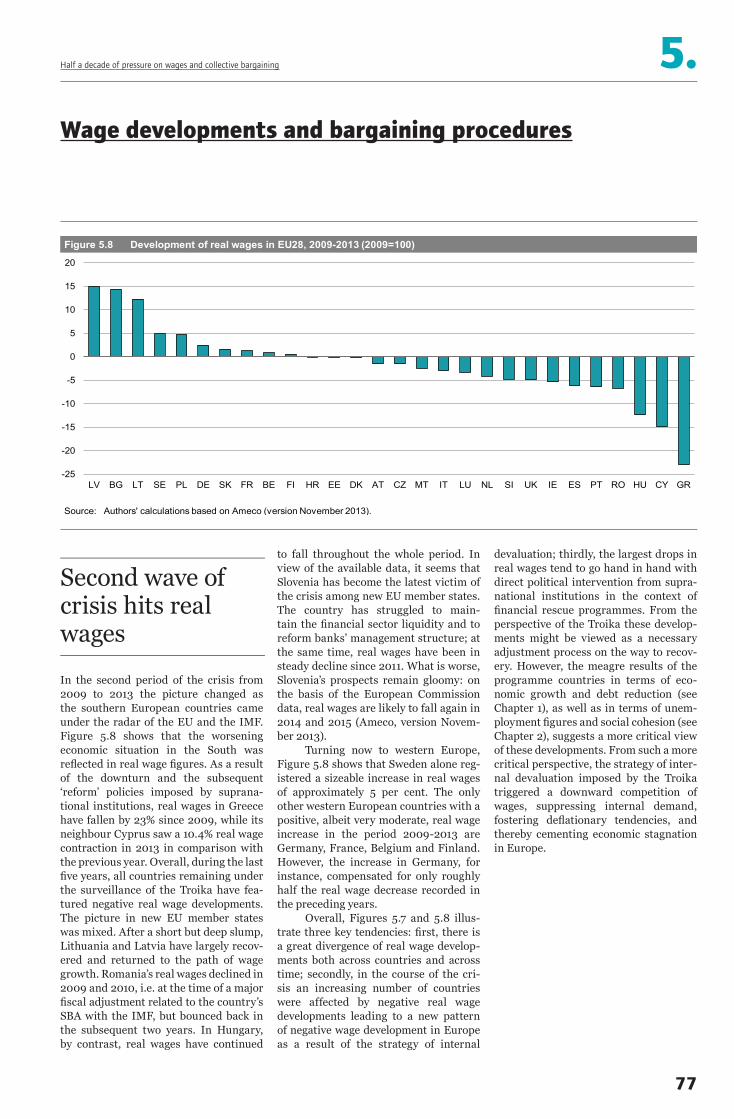
In the second period of the crisis from 2009 to 2013 the picture changed as the southern European countries came under the radar of the EU and the IMF. Figure 5.8 shows that the worsening economic situation in the South was reflected in real wage figures. As a result of the downturn and the subsequent ‘reform’ policies imposed by suprana-tional institutions, real wages in Greece have fallen by 23% since 2009, while its neighbour Cyprus saw a 10.4% real wage contraction in 2013 in comparison with the previous year. Overall, during the last five years, all countries remaining under the surveillance of the Troika have fea-tured negative real wage developments. The picture in new EU member states was mixed. After a short but deep slump, Lithuania and Latvia have largely recov-ered and returned to the path of wage growth. Romania’s real wages declined in 2009 and 2010, i.e. at the time of a major fiscal adjustment related to the country’s SBA with the IMF, but bounced back in the subsequent two years. In Hungary, by contrast, real wages have continued
devaluation; thirdly, the largest drops in real wages tend to go hand in hand with direct political intervention from supra-national institutions in the context of financial rescue programmes. From the perspective of the Troika these develop-ments might be viewed as a necessary adjustment process on the way to recov-ery. However, the meagre results of the programme countries in terms of eco-nomic growth and debt reduction (see Chapter 1), as well as in terms of unem-ployment figures and social cohesion (see Chapter 2), suggests a more critical view of these developments. From such a more critical perspective, the strategy of inter-nal devaluation imposed by the Troika triggered a downward competition of wages, suppressing internal demand, fostering deflationary tendencies, and thereby cementing economic stagnation in Europe.
to fall throughout the whole period. In view of the available data, it seems that Slovenia has become the latest victim of the crisis among new EU member states. The country has struggled to main-tain the financial sector liquidity and to reform banks’ management structure; at the same time, real wages have been in steady decline since 2011. What is worse, Slovenia’s prospects remain gloomy: on the basis of the European Commission data, real wages are likely to fall again in 2014 and 2015 (Ameco, version Novem-ber 2013).
Turning now to western Europe, Figure 5.8 shows that Sweden alone reg-istered a sizeable increase in real wages of approximately 5 per cent. The only other western European countries with a positive, albeit very moderate, real wage increase in the period 2009-2013 are Germany, France, Belgium and Finland. However, the increase in Germany, for instance, compensated for only roughly half the real wage decrease recorded in the preceding years.
Overall, Figures 5.7 and 5.8 illus-trate three key tendencies: first, there is a great divergence of real wage develop-ments both across countries and across time; secondly, in the course of the cri-sis an increasing number of countries were affected by negative real wage developments leading to a new pattern of negative wage development in Europe as a result of the strategy of internal
Second wave of crisis hits real wages
5.Half a decade of pressure on wages and collective bargaining
Wage developments and bargaining procedures
Figure 5.8 Development of real wages in EU28, 2009-2013 (2009=100)
Source: Authors' calculations based on Ameco (version November 2013).
-25
-20
-15
-10
-5
0
5
10
15
20
LV BG LT SE PL DE SK FR BE FI HR EE DK AT CZ MT IT LU NL SI UK IE ES PT RO HU CY GR
77

International comparative research (Rhein 2013; Schmitt 2012) shows that the size of the low-wage sector, i.e. the proportion of the workforce earning less than two thirds of the national median hourly wage, is determined by the inter-play of a whole range of factors. These include individual characteristics (such as age, gender, nationality education and working time), company-specific char-acteristics (such as company size and sector) and institutional characteristics such as, in particular, minimum wage arrangements and collective bargaining coverage. In the context of this chap-ter the institutional characteristics are of particular interest because the cur-rent EU reform policies of pushing for a restrictive minimum wage policy and the decentralisation of collective bargain-ing undermine the central role of mini-mum wages and collective agreements in reducing the share of low-wage work. The failure of minimum wages in fulfill-ing this protective role can be explained
majority of CEE countries and the UK and Ireland. The common feature of this group is a highly decentralised wage-setting system in which weakened trade unions are not in a position to ensure high collective bargaining coverage and in which the state provides little or no support through different kinds of legal extension mechanisms.
Since the downward flexibility of wages is one of the key objectives of the EU reform policies to improve com-petitiveness, it is no surprise that in the CSR of 2012 Sweden, as the country with the smallest low-wage sector and a highly compressed wage structure, was asked to ensure higher wage dispersion at the lower end of the wage scale – i.e. to enlarge the low-wage sector. Follow-ing the link between low collective bar-gaining coverage and the size of the low-wage sector illustrated in Figure 5.9, the ‘structural reforms’ imposed by the Troika on the ‘programme countries’ lead in entirely the wrong direction. Rather than dismantling collective bargaining systems and, in so doing, increasing the low-wage sector, what these countries actually need is more internal demand and investment. The support of collective bargaining institutions could be a first step in this direction.
by the fact that in the majority of EU countries the statutory minimum wage remains below the low-wage threshold (see Figure 5.5). Moreover, France and Slovenia, as the only two countries where statutory minimum wages actually are at or above the low-wage threshold, were asked in the CSRs 2012 and 2013 to ensure restrictive minimum wage growth (see Figure 5.1. and Clauwaert 2013).
Figure 5.9 illustrates the link between the size of the low-wage sector and the extent of collective bargaining coverage. Even though there is a need for caution in establishing a direct causal link, due to the multitude of factors that determine the size of the low-wage sector, Figure 5.9 shows a clear trend according to which high collective bargaining cov-erage goes hand in hand with a small low-wage sector. This group of countries at the right bottom corner of the graph comprises Sweden and Denmark where high collective bargaining coverage rests on the organisational strength of the col-lective bargaining parties but also Fin-land, France and Belgium where high collective bargaining coverage is ensured by the extension of collective agreements (Schulten 2012b). At the other extreme are those countries which combine low collective bargaining coverage with a large low-wage sector of more than 20 per cent of employees earning less than two thirds of the national median wage. This group covers the Baltic states, the
Low-wage sector and collective bargaining coverage
5.Half a decade of pressure on wages and collective bargaining
Wage developments and bargaining procedures
Figure 5.9 Collective bargaining coverage (%) and the proportion of low-wage earners (% of total employees in establishments with 10 employees or more), EU28
Sources: Authors' calculations based on Eurostat 2010 data for the proportion of low-wage earners, ICTWSS database (version April 2013) for collective bargaining coverage; latest available figure for each country. Schulten (2013) for the bargaining coverage data for Germany, Austria and Portugal.
BE
BG
CZ
DK
DEEEIE
GRES
FR
HR
IT
CY
LVLT
LU
HUMT NL
AT
PL
PT
RO
SISK
FISE
UK
0
5
10
15
20
25
30
0 10 20 30 40 50 60 70 80 90 100
prop
ortio
n of
low-
wage
earn
ers
collective bargaining coverage
78

Effective collective bargaining depends on, among other factors, the membership rate of the organisations representing the interests of workers and employers (Traxler et al. 2001). Figure 5.10 provides an overview of the development of trade union density in 27 EU member states. The line graphs (right-hand scale) depict the annual development of the (weighted) EU27 average union density over the last two decades. The bar graphs (left-hand scale) ideally compare the average union density from the steepest part of the cri-sis (2009-11) and a period of equal length before its deepening (2006-8). Such comparison is fully possible, however, for only ten countries; the data is missing for other countries and for some an assess-ment is impossible (HU, LU, LV, RO).
The line graphs show an almost continuous trend of de-unionisation: whereas about half of the employees in the EU were unionised in 1991, this ratio had decreased to one in three in 2010. Yet, this trend towards de-unionisation seems to have been disrupted around 2007; based on the non-weighted average there has even been a slightly increasing trend since the beginning of the crisis.
the coverage of collective bargaining and works councils, might explain the further German de-unionisation (Addison et al. 2010), although some unions have been able to increase their membership (Drib-busch 2014). Finally, in some countries (DK, FI, SE, UK) the loss in membership has been rather limited (at least up to 2010/2011).
The picture of unionisation in Europe is thus mixed. Considerable divergence in unionisation rates remains (cf. Schnabel 2013). Some unions are indeed still able to recruit new mem-bers, sometimes inspired by the ‘organis-ing model, although in most cases their membership gains cannot keep pace with the (increasing) labour market participa-tion. In conclusion, the stability or even slight increase in union density in some countries should be taken with a large grain of salt as workers’ power is based not only on their associational power (Lévesque and Murray 2010) but also on their structural, institutional, and dis-cursive capacity and power, all of which are ‘challenged’, to say the least, by high unemployment in various member states and the neo-liberal austerity drive of the European Commission and the national governments in most countries, leading to structural socio-economic changes, particularly in the realm of collective bargaining – as shown above.
Indeed, when comparing the two periods (2006-8 and 2009-11), there is a group of countries actually displaying an increase – albeit mostly small – in union density. French and Italian unions have been able to recruit more members, while the number of wage- and salary-earners has remained relatively stable. In 2011 Italian union membership (minus pen-sioners’ unions) even stood at its highest level since 1986.
Other countries, significantly affected by the crisis and the ‘austerity syndrome’ (EE, ES, GR, IE, IT, LT), saw some growth in unionisation, at least until 2011. This finding must first and foremost be explained by the decrease in the denominator, i.e. the drop in the number of wage- and salary-earners hav-ing been larger than the decline in union membership, with emigration being one of the main reasons behind this develop-ment (European Commission 2013).
Portugal, another country seriously affected by the crisis, belongs rather to the majority of countries where union density has started to decrease or contin-ues to decline (AT, BE, BG, CY, CZ, DE, MT, NL, PL, SI, SK). The fact that Austria and Germany are included in this group of countries indicates that very different reasons, not necessarily directly related to the crisis, might explain the further drop in unionisation. The continuting erosion of the dual system of industrial relations, with its ongoing shrinkage of
Continued de-unionisation?
5.Half a decade of pressure on wages and collective bargaining
Collective organisation and action of workers
Figure 5.10 Union density per country (2006-2008 and 2009-2011) and per year (1991-2010) in EU27
Source: Visser (2013).Notes: BG and CZ: average 2006-8 and 2009; CY: average 2006 and 2008 and 2011; DK, ES, FR, LT, PT, SE, UK: average 2006-8 and 2009-10;
EE: average 2007-8 and 2009-10; GR: average 2006-8 and 2011; HU and LU, LV: average 2006-8; PL: average 2006-8 and 2010; RO: average 2006 and 2008; SI: average 2006 and 2008 and 2009-11; sa: simple average; wa: weighted average.
1991 1992 1993 1994 1995 1996 1997 1998 1999 2000 2001 2002 2003 2004 2005 2006 2007 2008 2009 2010
0%
10%
20%
30%
40%
50%
60%
70%
80%
SE FI DK BE MT CY LU IE RO IT sa AT UK SI GR wa BG PT NL DE CZ SK HU LV ES PL LT FR EE
average 2006-2008 average 2009-2011simple average weighted average
79

In today’s world, social mobilisation and unrest are rife and within the EU the aus-terity drive pursued by national govern-ments has been particularly contested. Trade unions have shown their ability to continue to play an organisational role in social mobilisation, insofar as they are the main vehicles for organising demon-stration and political mass strikes. Other forms of social unrest have, by contrast, proved more ephemeral, entailing often only a weak involvement of unions or sometimes indeed displaying ignorance or even hostility towards them. As in any cycle of social protest, the repertoire of contention has been enriched with more innovative forms of collective action, even if their ‘invention’ may in some cases represent no more than the ‘rediscovery’ of long abandoned older forms. Yet con-vincing data about forms of protest other than strikes are unlikely to be available on a longitudinal and comparative basis.
Moreover, in recent times, several political authorities, particularly in the crisis-hit southern European countries – an area that has been characterised as the geographical epicentre of social unrest (Schmalz and Weinmann 2013) – have lost interest in gathering strike data. Accordingly, official information on strike
if the age of austerity has not triggered a pronounced upsurge, although the years 2008 and 2010 were marked by some degree of increase in the average volume. Nonetheless, from the bar graphs, it is clear that in at least seven countries (AT, CY, EE, FR, IE, MT, NL) the volume has increased. There can be little doubt, what is more, that the volume in Greece, Italy and Portugal has been affected to such an extent that they too belong to this group of countries. This would apply equally to Spain if the general strikes of 2010 and 2012 were to have been included in the official strike data. Hence, in eleven EU member states, the strike volume, on average, has increased since the cri-sis compared to an equal period of time before. However, where the relationship with the crisis and the austerity poli-cies is clear and direct (CY, EE, IE, FR, southern Europe), this is far less the case for some other countries (AT, MT, NL). All other countries, for which sufficient official data is available, saw a decline in the average strike volume in the period 2009-12 compared to the previous four-year period (BE, DE, DK, FI, LT, PL, SE, SK, UK).
action has been ‘postponed’ in the case of Portugal (since 2007) or is no longer available at all for Greece (since 1999) or Italy (since 2010). For several other coun-tries too, either recent data is partially missing or no official data has been col-lected at all. Furthermore, it is clear also that the strike volume, as a quantitative proxy for comparing the most straight-forward expression of workers’ militancy and collective resistance in countries over time, is usually underestimated.
Nonetheless, previous research has shown that the strike volume in the EU has generally declined in the period 2001-10 compared to the previous dec-ade, although considerable cross-country differences in strike levels remain (Van-daele 2011). So far little is known about the development of the strike volume since the crisis. Figure 5.11 shows the development of the (weighted) average of the volume in the EU member states for which data is available and compares the average volume during two periods (2005- 8 and 2009-12) in 21 members states. It should be emphasised that any interpretation of strike data is also evi-dently dependent on the country selec-tion and the period studied.
The line graphs demonstrate that the strike volume is quite volatile and that it is particularly sensitive to very large strikes tending to dominate the vol-ume. However, considering the period since the crisis, it looks, at first glance, as
Strike volume
5.Half a decade of pressure on wages and collective bargaining
Collective organisation and action of workers
Figure 5.11 Relative strike volume per country (2005-2008 and 2009-2012) and per year (1991-2012) in selected EU member states
Source: Eurostat, Laborsta and national statistical offices.Notes: AT and FR: average 2005-8 and 2009-11; IT, LV, HU RO and SI: average 2005-8 and 2009; PT: average 2005-7; sa: simple average; wa:
weighted average.
1991 1992 1993 1994 1995 1996 1997 1998 1999 2000 2001 2002 2003 2004 2005 2006 2007 2008 2009 2010 2011 2012
0
50
100
150
200
250
300
0
50
100
150
200
250
FR CY BE FI ES IE LU wa sa UK MT IT SI EE DE NL PT DK AT SE LV HU PL SK LT RO
average 2005-2008 average 2009-2012simple average weighted average
80

Even in the absence of recent data on strike action for most countries in south-ern Europe, it is clear that general strikes have been on the increase in this part of Europe, particularly in Greece. Whereas the period 1980 to 2012 saw a total of 130 general strikes or threats of such strike in eleven countries of the EU15 and Norway, 36 of these took place between 2010 and 2012 alone (Hamann et al. 2013).
Instead of focussing solely on gen-eral strikes, the concept of strike waves is used here to assess the significance of mass strikes since the crisis. Using the concept of mass strikes allows for a more disaggregated picture at the secto-ral level. In order to identify recent strike waves, the Shorter/Tilly (1976) definition will be applied to the volume and the rel-ative strike participation, the latter bet-ter grasping workers’ willingness to act. It is acknowledged that mass strikes are underestimated due to this method or the under-reporting in the official data.
Secondary sources are used for interpreting the waves identified. This enables the waves to be categorised as
austerity measures (see ETUC and ETUI 2013 for an overview of those strikes between 2009-11). In 2012 strike waves in Cyprus, Estonia and Lithuania (the lat-ter based only on the strike participation) can be attributed respectively to strikes in the construction sector (Soumeli 2012a, 2012b) and to public sector strikes in edu-cation (Blaziene 2012) and in the educa-tion and health-care sector (Osila 2012).
Similarly, in multi-employer bar-gaining systems, industry-wide strikes have been more limited since the crisis, whereas political mass strikes have been on the rise, via either general strikes (BE in 2012; FR in 2010) or strikes in the public sector (BE in 2011) (see ETUC and ETUI 2013 for an overview of those strikes between 2009-11). Strike waves in 2012 are dominated by a general strike against austerity measures in Belgium, strikes in the education sector in both the Netherlands and Slovakia (Cziria 2013), and especially a large strike in the clean-ing sector in The Netherlands (Centraal Bureau voor de Statistiek 2012).
predominantly produced by industry-wide or by political mass strikes. Political mass strikes can be directly and strongly associated with the so-called ‘European sovereign debt crisis’ and the workers’ protest against the austerity regimes put in place by most European governments. Although this association is less clear-cut for industry-wide strikes, the crisis could nonetheless be exerting a more indirect influence as employers’ organisations might take a firmer stance at the bargain-ing table.
Because the structure of the bar-gaining system tends to have an impact on the shape of the strike volume (Clegg 1976), in Figure 5.12 a distinction is made between single- and multi-employer bar-gaining systems. The figure shows overall that, since the crisis, a shift has occurred in the strike waves towards political mass strikes in both single-employer and multi-employer bargaining systems. In other words, in the current economic and social situation of Europe, industry-wide strikes are not central to the new social protest cycle.
In single-employer bargaining sys-tems mass strikes used to be character-ised as industry-wide strikes before the crisis, particularly in the public sector. Based on both the strike participation and volume, this has altered since the crisis: strike waves have been predomi-nantly caused by political mass strikes, particularly in the public sector against
A shift towards political mass strikes
5.Half a decade of pressure on wages and collective bargaining
Collective organisation and action of workers
Figure 5.12 Strike waves in SEB- and MEB-systems, 2005-8 and 2009-12
Source: Eurostat, Laborsta, national statistical offices; own calculation.
9
5
1
22
3
6
5
0
1
2
3
4
5
6
7
8
9
10
SEB (CY except 2012; EE;IE; LT; MT; PL and UK)
MEB (AT except 2012; BE;DE; DK; ES; FI; FR except
2012; NL; SE and SK)
SEB(CY except 2012; EE; IE;LT; MT; PL and UK)
MEB (AT except 2012; BE;DE; DK; ES; FI; FR except
2012; NL; SE and SK)
industry-wide strikes political mass strikes
num
ber o
f stri
ke w
aves 2005-8 2009-12
81
5.Half a decade of pressure on wages and collective bargaining
social cohesion. In the ‘programme coun-tries’, where growth relies more heavily on domestic demand than on exports, such a view is particularly problematic since any positive effects of wage cuts and reduction of unit labour costs for net exports may be more than offset by the negative impact of falling wages on domestic demand. What is more, the currently proposed export-oriented reform policies systematically overestimate the significance of exports for the overall economic development (Feigl and Zuckerstätter 2012). An additional fac-tor overlooked by the internal devaluation approach is that – in accordance with the Keynesian ‘paradox of thrift’ – in a highly integrated economic area such as the euro-zone not all the countries can cut their way out of the crisis at the same time. Within such an area, one country’s domestic demand is another country’s export poten-tial (Janssen 2013b). Thus, if all countries try to improve their competitive position by cutting wages at the same time, over-all domestic demand will collapse, as will, together with it, the flow of imports and exports between the eurozone countries.
The fact that these supply-side-ori-ented reform policies have achieved so lit-tle in terms of improving the economic and social situation in the ‘programme coun-tries’ (see Chapters 1, 2 and 3) points une-quivocally to the need for a U-turn in the current mode of crisis management. One such alternative approach could be a shift towards a demand-side-oriented wage-led growth model based on sustained wage growth, an increase in the wage share, and the reduction of wage dispersion, with the ultimate goal of strengthening domestic demand. Such a model would embrace the multiple functions of wages as cost factor and source of demand and social cohesion. The implementation of such an approach would rely on a whole package of measures in several different policy fields. In the specific field of wages and collective bar-gaining, however, the requisite measures would include the following: the establish-ment of minimum wages that are not below the low-wage threshold; improved legisla-tive provision to strengthen the bargain-ing power of trade unions; and measures to increase collective bargaining coverage (Lavoie and Stockhammer 2012; Hein and Mundt 2013).
in its policy recommendations a decentral-ised, company-based bargaining system is the central reference point because it is assumed that such a decentralised system would better allow companies to make the requisite adjustments to varying eco-nomic circumstances (Schulten and Müller 2013a). In the field of wages and collective bargaining, ‘structural reforms’ can there-fore be read as a euphemism for the radical decentralisation and even de-collectivisa-tion of collective bargaining systems. In order to ensure the implementation of this austerity and structural reform agenda, the European and national policy-makers have used CSRs and bilateral agreements (i.e. MoUs/SBAs) to intervene in national bargaining outcomes and procedures.
This interventionist approach, con-sisting in the virtual enforcement of wage restraint and decentralisation of collective bargaining systems, is problematic in at least two respects. In the first instance, its narrow focus on cost competitiveness pre-cludes any consideration of differences in non-price competitiveness factors such as product structure, product quality and the price elasticity of exports (i.e. the demand for exports and the price which consumers are willing to pay for the exported prod-ucts) as the potential source of macro-eco-nomic imbalances. Given the substantial decline in the complexity of their export basket during the crisis (see Figure 1.5 in Chapter 1), an alternative way to improve the competitiveness of the southern Euro-pean ‘programme countries’ Greece, Por-tugal and Spain, and perhaps also of other crisis-ridden EU member states, would be to provide financial assistance in order to help them to upgrade their economic and industrial structure. This would in turn enable them to specialise in specific sec-tors and niche markets and to compete on the basis of the quality, sophistication and innovativeness of their products rather than on the sole basis of their price.
Rather than considering such addi-tional or alternative aspects of competitive-ness, the reform policies view the reduction of wages and labour costs as the primary route to solving the competitiveness prob-lems experienced by the ‘programme countries’. This narrow view of wages as a cost factor neglects the role of wages in generating domestic demand and fostering
‘Austerity is a form of voluntary deflation in which the economy adjusts through the reduction of wages, prices, and pub-lic spending to restore competitiveness, which is (supposedly) best achieved by cutting the state’s budget, debts and defi-cits’ (Blyth 2013: 2).
Blyth’s definition of austerity provides a concise description of the overarching idea which has guided developments in the field of wages and collective bargaining over the past five years. It highlights the fact that a narrow conception of competitiveness as cost competitiveness has become the dominant frame of reference for recent and current reforms. This overall approach has had far-reaching implications in the field of wages and collective bargaining insofar as it gives rise to an equally narrow and sup-ply-side-oriented view of the role of wages as a cost factor that needs to be minimised by the pursuit of austerity measures and ‘structural reforms’. It is thus that cuts and freezes of public sector wages, alongside the abolition or reduction of fringe benefits for public sector employees, were part and parcel of national governments’ efforts to reduce public spending and to consolidate state budgets. Alongside these measures directly aimed at the immediate intro-duction of wage austerity, European and national policy-makers pursued structural reforms designed to produce framework conditions that would be more conducive to the longer-term pursuit of wage restraint. The key objective of the structural reforms in the field of wages and collective bargain-ing has been to increase the downward flexibility of wages in order to improve cost competitiveness by reducing labour costs. Even though DG ECFIN itself acknowl-edges that, with respect to the macro-eco-nomic performance of collective bargain-ing systems, ‘there is no strong evidence in support of a single superior wage-setting model’ (European Commission 2011: 17),
In search of an alternative role for wages
Conclusions
82
Workers’ health and safety exposed to crisisIntroduction
European integration has until now been an important driver of the upward har-
monisation of working conditions. From a regulatory point of view, the European level
has, especially since 1989, been instrumental in framing and promoting the health
and safety agenda in most EU member states, regardless of the current state or stage
of the economy or business cycle. In terms of the progress towards better working
conditions and prevention, as achieved through the regulations adopted and institu-
tions set up, the impact has overall been positive. Yet this level of improvement serves
to conceal growing gaps between specific groups of workers, for example between
core workforces and those employed on the peripheries of the labour market where
precarious conditions are rife. Still today in Europe between 65,000 and 100,000
workers a year lose their lives because of insufficient prevention.
This chapter on the mid-term assessment of occupational health and safety in the
EU will assess to what extent the current situation at the European level corresponds
to the challenges faced by workers in the EU. This assessment will start with an over-
view of the EU strategies in this field, focusing on the specific strategy followed in the
health and safety field as well as the larger agenda represented by REFIT (European
Commission 2013a). The chapter then turns to examine developments on the labour
market and their impact on occupational health and safety. As the situation of work-
ers in general becomes more uncertain and the dire economic situation is leading to
cuts in occupational health and safety provision, existing risks are compounded and
new risks are inadequately identified and prevented. Companies and governments
are cutting back on prevention, leading to an alarming situation in which not only old
risks but also ‘new’ ones such as stress and musculoskeletal disorders are neglected
and swept under the carpet. The conclusion sets out the main issues and proposes
ways forward.
Topics
> Health and safety exposed to crisis 84> New and emerging hazards as a consequence of the crisis 87> Conclusions 90
83

Health and safety has been a pillar in the construction of the European Union for the past 40 years. Back in 1978, the Euro-pean Commission started the process by adopting the first Action Programme on health and safety at work, its purpose being to focus directly on specific health and safety issues and to confirm the will of the European Community to rein-force the social dimension of the internal market (European Commission 1988). Specific matters tackled included safety aspects of machinery, handling of dan-gerous substances, monitoring workers’ health, occupational safety inspector-ates, and improving of human attitudes (European Council 1978).
A Second Action Programme was drawn up for the period 1984-1988, concentrating on safety and ergonom-ics, health and hygiene, information
started in 2002–2006. It once again expanded the scope by adopting a global approach to well-being in the workplace and emphasised the culture of risk pre-vention, yet failed to detail a concrete work programme. The follow-up strategy in 2007-2012 once again represented a shift in priority as it focused, rather than on prevention and enhanced well-being, on improving quality, productivity at work and growth.
In 2011 a new strategy was announced for the period 2013 – 2020. Not long afterwards, however, in 2012, the European Commission informally announced a delay, arguing that the pri-ority was the crisis.
In essence, it might be concluded that, over the past ten years, a ‘softer’ and perhaps less binding and coer-cive approach has emerged with regard to occupational health and safety. As things stand today, however, in 2014, for the first time in 40 years, the European Union has completely stepped down from its responsibility to ensure the continu-ous improvement of health and safety at the workplace.
and training, initiatives for small and medium-sized enterprises and social dia-logue, thereby extending the scope and governance methods.
During this period, the EU adopted the Single European Act (1987), which incorporated new health and safety pro-visions. The Treaty set minimum require-ments, allowed the Council to adopt occupational health and safety directives and member states to introduce stricter measures for the protection of workers. The aim was to harmonise conditions in the working environment, to prevent ‘social dumping’ during the process of completion of the internal market, and to prevent companies from moving to areas with a lower level of protection for the purpose of gaining a competitive edge. A major step forward was the adop-tion of the Framework Directive 89/391/EEC focusing on the principles of preven-tion. This Framework Directive aims to improve the protection of workers from workplace accidents and occupational disease by harmonising preventive meas-ures, information, consultation, balanced participation and training of workers and their representatives. In a nutshell, the Directive looks at the humanisation of the working environment. In its wake, a total of 23 individual ‘daughter’ direc-tives addressing specific issues have been adopted and implemented.
The process of the Community Strategy on Safety and Health at Work
Change of tack: health and safety issues taken off the priority list; 35 years of momentum lost?
6.Workers’ health and safety exposed to crisis
Health and safety exposed to crisis
Figure 6.1 Timeline of EU approach to the regulation of health and safety
1978-1982 1984-1998 1987 2002-2006 2007-2012 2013-2020 2020 - ?
1st Action Programme 2nd Action
Programme Single European Act EU strategy on
H&S EU strategy on H&S No strategy
launched What future?
Source: author’s own research.
84
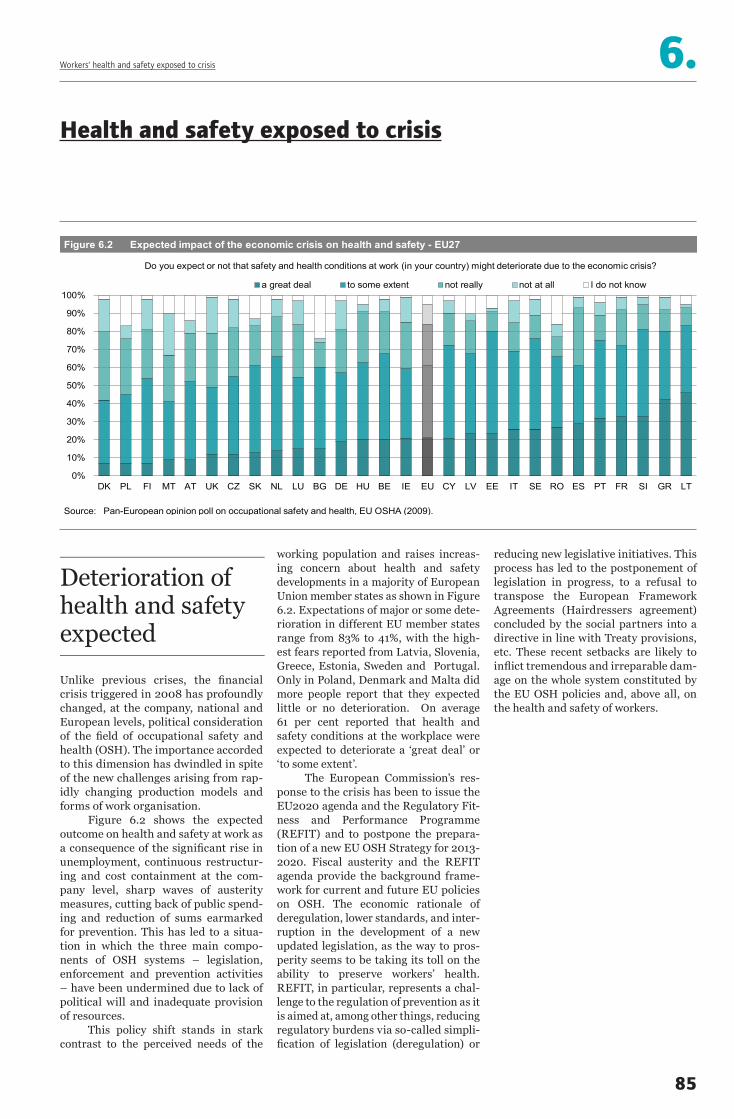
Unlike previous crises, the financial crisis triggered in 2008 has profoundly changed, at the company, national and European levels, political consideration of the field of occupational safety and health (OSH). The importance accorded to this dimension has dwindled in spite of the new challenges arising from rap-idly changing production models and forms of work organisation.
Figure 6.2 shows the expected outcome on health and safety at work as a consequence of the significant rise in unemployment, continuous restructur-ing and cost containment at the com-pany level, sharp waves of austerity measures, cutting back of public spend-ing and reduction of sums earmarked for prevention. This has led to a situa-tion in which the three main compo-nents of OSH systems – legislation, enforcement and prevention activities – have been undermined due to lack of political will and inadequate provision of resources.
This policy shift stands in stark contrast to the perceived needs of the
reducing new legislative initiatives. This process has led to the postponement of legislation in progress, to a refusal to transpose the European Framework Agreements (Hairdressers agreement) concluded by the social partners into a directive in line with Treaty provisions, etc. These recent setbacks are likely to inflict tremendous and irreparable dam-age on the whole system constituted by the EU OSH policies and, above all, on the health and safety of workers.
working population and raises increas-ing concern about health and safety developments in a majority of European Union member states as shown in Figure 6.2. Expectations of major or some dete-rioration in different EU member states range from 83% to 41%, with the high-est fears reported from Latvia, Slovenia, Greece, Estonia, Sweden and Portugal. Only in Poland, Denmark and Malta did more people report that they expected little or no deterioration. On average 61 per cent reported that health and safety conditions at the workplace were expected to deteriorate a ‘great deal’ or ‘to some extent’.
The European Commission’s res-ponse to the crisis has been to issue the EU2020 agenda and the Regulatory Fit-ness and Performance Programme (REFIT) and to postpone the prepara-tion of a new EU OSH Strategy for 2013-2020. Fiscal austerity and the REFIT agenda provide the background frame-work for current and future EU policies on OSH. The economic rationale of deregulation, lower standards, and inter-ruption in the development of a new updated legislation, as the way to pros-perity seems to be taking its toll on the ability to preserve workers’ health. REFIT, in particular, represents a chal-lenge to the regulation of prevention as it is aimed at, among other things, reducing regulatory burdens via so-called simpli-fication of legislation (deregulation) or
Deterioration of health and safety expected
6.Workers’ health and safety exposed to crisis
Health and safety exposed to crisis
Figure 6.2 Expected impact of the economic crisis on health and safety - EU27
Source: Pan-European opinion poll on occupational safety and health, EU OSHA (2009).
0%
10%
20%
30%
40%
50%
60%
70%
80%
90%
100%
DK PL FI MT AT UK CZ SK NL LU BG DE HU BE IE EU CY LV EE IT SE RO ES PT FR SI GR LT
a great deal to some extent not really not at all I do not know
Do you expect or not that safety and health conditions at work (in your country) might deteriorate due to the economic crisis?
85

The impact of the economic crisis on occupational health and safety occurs at different levels and encompasses a wide range of dimensions. ILO (2013) sets out a classification grouping the drivers into the macro-economic context of the financial crisis and those occuring from organisational changes and direct meas-ures with regard to OSH policies. Over-all, the crises delivers a negative impact to the health and safety of workers due to the overall increase in insecurity, the adverse organisational changes, and the readiness to compromise OSH standards and established measures.
On the macro-economic level the economic crisis puts pressure on public finances, while jobs are cut as companies downsize or shut down. This induces a general feeling of insecurity and increases unemployment, thereby increasing health-related risks. Further, it induces companies to undertake organisational changes and restructuring as they attempt to adapt so as to weather the economic
et al. 2010). The survey corroborated the thesis that the crisis is impacting OSH negatively; the factors put forward as negatively influencing the health and safety of workers at a time of recession were:–– Lack of resources such as time, money
and staff.–– Lack of expertise.–– Unsatisfactory health and safety cul-
ture.–– Lack of sensitivity in dealing with health
and safety issues.–– Lack of technical support or guidance.
As such, none of the above listed factors are solely linked to the economic crisis, but each of them clearly is affected by the dire situation. In particular at times of crisis, less attention is devoted to the health and safety of workers. The above-mentioned EU OSHA study iden-tifies the major reasons for addressing health and safety issues at the level of the enterprise. Fulfilment of legal obli-gations and pressure from employees and/or their representatives are ranked as the most important determinants for employers (90 per cent and 76 per cent). Pressure from labour inspector-ates comes in the fifth place with 60 per cent. These findings give rise to con-cern as all three factors are under pres-sure from the economic situation, the associated policy reforms, budgetary cuts and interruption in new legislative provisions.
downturn. The organisational changes often bring more sub-contracting, part-time and temporary jobs, workforce cuts and fewer resources for ‘non-productive’ work. These changes put more pressure on workers and, furthermore, complicate companies’ standard health and safety policies and practices (ILO 2013). To com-pound these negative impacts of the crisis, OSH policies and strategies are impacted directly as OSH personnel are laid off or transferred to other posts, budgets for the provision of OSH services are cut and the associated policies placed on the back burner. The potential impact of the cri-sis on OSH is, accordingly, multidimen-sional, entailing a host of interrelated phe-nomena leading to a potential increase in accident rates, diseases and loss of life for those in employment, alongside increased ill health for those not in employment.
The above analysis clearly demon-strates the need to increase the atten-tion paid to OSH as work organisation becomes more complex and unemploy-ment increases. If improvement is too much to ask in the current environment, then at the very least current OSH stand-ards should be maintained. However, as the previous section has shown, health and safety regulations are to be reviewed and no new Directives will be processed or adopted in the near future.
The study findings by ILO (2013) are compounded by a recent survey car-ried out by the EU OSHA (Rial González
The crisis’ multidimensional impact on workers’ health and safety
6.Workers’ health and safety exposed to crisis
Health and safety exposed to crisis
Figure 6.3 The financial crisis and its potential impact on health and safety at work
Source: ILO (2013).
increase in workplace accidents, diseases and fatalities
- cutting costs- decreased public spending- decreased production- cutting jobs (downsizing)- shutting down of facilities
financial crisis
- re-prioritizing resources- reduction of ‘non-productive’
functions- cutting OSH resources- more part-time/temporary work- more outsourcing/subcontracting- dismissing workers
organisational changes- loss of OSH professionals in
enterprises- decline in OSH measures- Deteriorating OSH conditions in
informal jobs- hazards from overwork/new tasks- longer working hours for some- more insecurity- psychosocial stress from sudden
unemployment
compromise in OSH measures
andincrease in ill-health from unemployment
86

While the policy shift in itself clearly gives rise to concern, the development of jobs and the labour market at large is likely to compound its potentially negative impact. While it is a well-known fact that both the threat of unemployment and the gen-eral feeling of insecurity generated by the possibility of impending job loss entail considerable consequences for workers’ health, several studies confirm that job insecurity can in itself represent a higher risk factor than actual unemployment for mental – but not only mental – health (Quinlan et al. 2001; Quinlan and Bohle 2009). In this context, the crisis and asso-ciated processes of restructuring increase the risk of poor health outcomes for both unemployed and employed, with depres-sion and anxiety being the most frequently cited health problems. About 70% of work-ers may be exposed to high risk of psycho-social diseases and chronic illness when their employment security is low (Parent-Thirion et al. 2010).
The comparison of job insecurity data from 2008 and 2012 in the Euro-pean Union member states in Figure 6.4 shows a growing trend toward increased insecurity during the crisis and hence an
increase in musculoskeletal disorders, stress and other psychosocial factors at work, remain a major hazard. This asso-ciation between job insecurity and tem-porary work generates an increased risk for health. Scientific evidence shows that with this type of combination, workers are more likely to be exposed to risks leading to higher injury rates, higher sickness rates and poorer health overall, greater risk of suicide and higher rates of chronic health problems, including heart disease and strokes (Quinlan and Bohle 2009; László et al. 2010).
increased risk of health problems. As we do not have comparable date on job inse-curity across the EU, the data in Figure 6.4 is measured in different ways, e.g. self-perceived job insecurity, perceived danger of job loss within a short period of time, associated with the expectation of difficul-ties in finding a new job. In spite of this difference in the definition of job insecu-rity which makes it difficult to compare the data across countries, this information does allow us to deduce general trends within countries.
The overall trend shows that the European population is feeling more inse-cure with regard to job situation and out-look, although there are a few examples of stagnation (Bulgaria) or even improvement (Czech Republic). The perceived increase in job insecurity can lead to psycho-social problems among the workers concerned. Workers may also, under pressure of job insecurity, accept lower OSH standards and agree to work in unsafe conditions, to work longer hours, to overlook minor inci-dent and accidents, to refuse to report work accidents or to request compensation. Job insecurity can lead also to ‘presenteeism’ which increases the risk for the workers themselves but also for others present in the workplace when workers are deter-mined to be present under whatever condi-tions out of concern to protect their jobs.
The combination of increased job insecurity, increase in temporary em ploy-ment (see chapter 2), restructuring,
Job insecurity on the rise
6.Workers’ health and safety exposed to crisis
New and emerging hazards as a consequence of the crisis
Figure 6.4 Evolution of job insecurity during the crisis
Source: Van Gyes and Szekér 2013.
-5
0
5
10
15
20
25
30
35
DE AT NL SE LU BE MT DK FI HU EU27
UK EE FR IT PL IE RO ES LT CZ BG PT SK LV GR CY SI
2007 2012 change
87
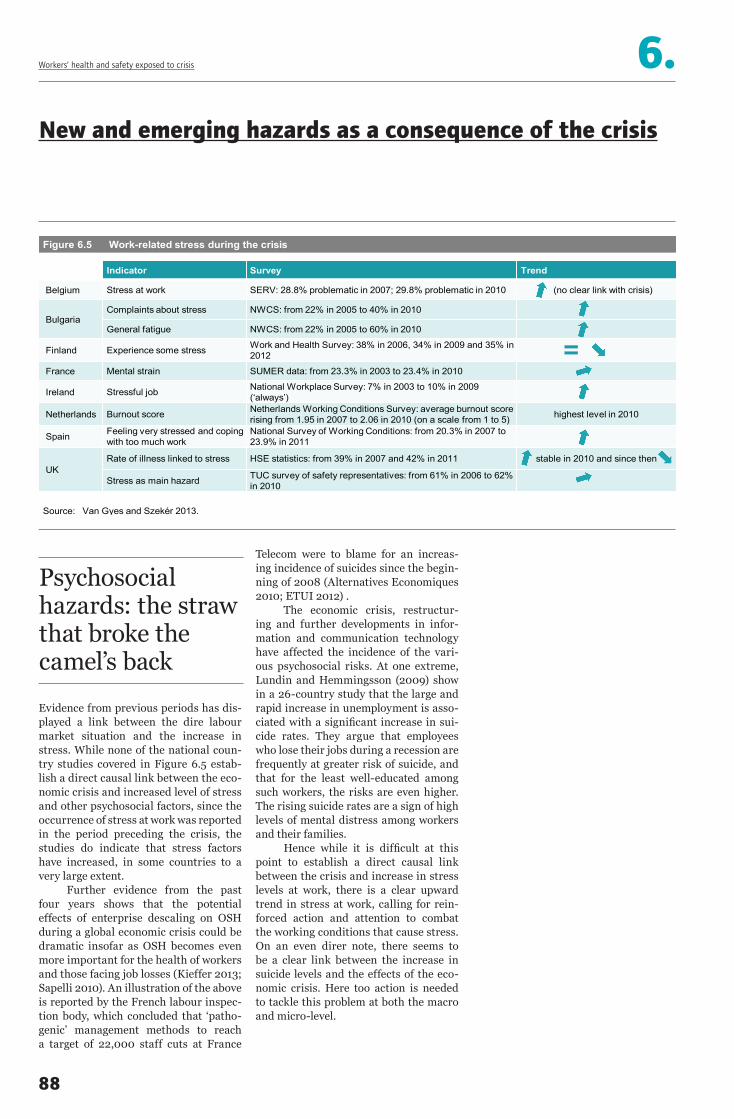
Evidence from previous periods has dis-played a link between the dire labour market situation and the increase in stress. While none of the national coun-try studies covered in Figure 6.5 estab-lish a direct causal link between the eco-nomic crisis and increased level of stress and other psychosocial factors, since the occurrence of stress at work was reported in the period preceding the crisis, the studies do indicate that stress factors have increased, in some countries to a very large extent.
Further evidence from the past four years shows that the potential effects of enterprise descaling on OSH during a global economic crisis could be dramatic insofar as OSH becomes even more important for the health of workers and those facing job losses (Kieffer 2013; Sapelli 2010). An illustration of the above is reported by the French labour inspec-tion body, which concluded that ‘patho-genic’ management methods to reach a target of 22,000 staff cuts at France
Telecom were to blame for an increas-ing incidence of suicides since the begin-ning of 2008 (Alternatives Economiques 2010; ETUI 2012) .
The economic crisis, restructur-ing and further developments in infor-mation and communication technology have affected the incidence of the vari-ous psychosocial risks. At one extreme, Lundin and Hemmingsson (2009) show in a 26-country study that the large and rapid increase in unemployment is asso-ciated with a significant increase in sui-cide rates. They argue that employees who lose their jobs during a recession are frequently at greater risk of suicide, and that for the least well-educated among such workers, the risks are even higher. The rising suicide rates are a sign of high levels of mental distress among workers and their families.
Hence while it is difficult at this point to establish a direct causal link between the crisis and increase in stress levels at work, there is a clear upward trend in stress at work, calling for rein-forced action and attention to combat the working conditions that cause stress. On an even direr note, there seems to be a clear link between the increase in suicide levels and the effects of the eco-nomic crisis. Here too action is needed to tackle this problem at both the macro and micro-level.
Psychosocial hazards: the straw that broke the camel’s back
6.Workers’ health and safety exposed to crisis
New and emerging hazards as a consequence of the crisis
Figure 6.5 Work-related stress during the crisis
Indicator Survey Trend
Belgium Stress at work SERV: 28.8% problematic in 2007; 29.8% problematic in 2010 (no clear link with crisis)
BulgariaComplaints about stress NWCS: from 22% in 2005 to 40% in 2010
General fatigue NWCS: from 22% in 2005 to 60% in 2010
Finland Experience some stress Work and Health Survey: 38% in 2006, 34% in 2009 and 35% in 2012
France Mental strain SUMER data: from 23.3% in 2003 to 23.4% in 2010
Ireland Stressful job National Workplace Survey: 7% in 2003 to 10% in 2009 (‘always’)
Netherlands Burnout score Netherlands Working Conditions Survey: average burnout score rising from 1.95 in 2007 to 2.06 in 2010 (on a scale from 1 to 5) highest level in 2010
Spain Feeling very stressed and coping with too much work
National Survey of Working Conditions: from 20.3% in 2007 to 23.9% in 2011
UKRate of illness linked to stress HSE statistics: from 39% in 2007 and 42% in 2011 stable in 2010 and since then
Stress as main hazard TUC survey of safety representatives: from 61% in 2006 to 62% in 2010
Source: Van Gyes and Szekér 2013.
88
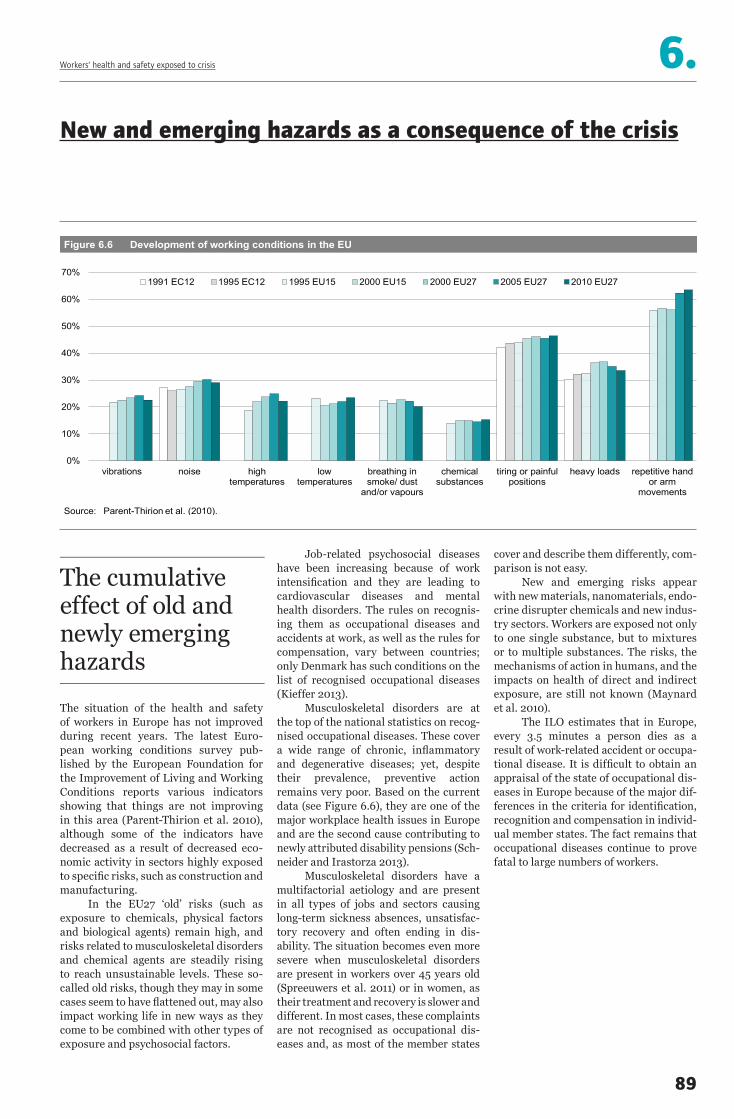
The situation of the health and safety of workers in Europe has not improved during recent years. The latest Euro-pean working conditions survey pub-lished by the European Foundation for the Improvement of Living and Working Conditions reports various indicators showing that things are not improving in this area (Parent-Thirion et al. 2010), although some of the indicators have decreased as a result of decreased eco-nomic activity in sectors highly exposed to specific risks, such as construction and manufacturing.
In the EU27 ‘old’ risks (such as exposure to chemicals, physical factors and biological agents) remain high, and risks related to musculoskeletal disorders and chemical agents are steadily rising to reach unsustainable levels. These so-called old risks, though they may in some cases seem to have flattened out, may also impact working life in new ways as they come to be combined with other types of exposure and psychosocial factors.
cover and describe them differently, com-parison is not easy.
New and emerging risks appear with new materials, nanomaterials, endo-crine disrupter chemicals and new indus-try sectors. Workers are exposed not only to one single substance, but to mixtures or to multiple substances. The risks, the mechanisms of action in humans, and the impacts on health of direct and indirect exposure, are still not known (Maynard et al. 2010).
The ILO estimates that in Europe, every 3.5 minutes a person dies as a result of work-related accident or occupa-tional disease. It is difficult to obtain an appraisal of the state of occupational dis-eases in Europe because of the major dif-ferences in the criteria for identification, recognition and compensation in individ-ual member states. The fact remains that occupational diseases continue to prove fatal to large numbers of workers.
Job-related psychosocial diseases have been increasing because of work intensification and they are leading to cardiovascular diseases and mental health disorders. The rules on recognis-ing them as occupational diseases and accidents at work, as well as the rules for compensation, vary between countries; only Denmark has such conditions on the list of recognised occupational diseases (Kieffer 2013).
Musculoskeletal disorders are at the top of the national statistics on recog-nised occupational diseases. These cover a wide range of chronic, inflammatory and degenerative diseases; yet, despite their prevalence, preventive action remains very poor. Based on the current data (see Figure 6.6), they are one of the major workplace health issues in Europe and are the second cause contributing to newly attributed disability pensions (Sch-neider and Irastorza 2013).
Musculoskeletal disorders have a multifactorial aetiology and are present in all types of jobs and sectors causing long-term sickness absences, unsatisfac-tory recovery and often ending in dis-ability. The situation becomes even more severe when musculoskeletal disorders are present in workers over 45 years old (Spreeuwers et al. 2011) or in women, as their treatment and recovery is slower and different. In most cases, these complaints are not recognised as occupational dis-eases and, as most of the member states
The cumulative effect of old and newly emerging hazards
6.Workers’ health and safety exposed to crisis
New and emerging hazards as a consequence of the crisis
Figure 6.6 Development of working conditions in the EU
Source: Parent-Thirion et al. (2010).
0%
10%
20%
30%
40%
50%
60%
70%
vibrations noise hightemperatures
lowtemperatures
breathing insmoke/ dust
and/or vapours
chemicalsubstances
tiring or painfulpositions
heavy loads repetitive handor arm
movements
1991 EC12 1995 EC12 1995 EU15 2000 EU15 2000 EU27 2005 EU27 2010 EU27
89

6.Workers’ health and safety exposed to crisis
finalised, the musculoskeletal disorders Directive needs to be addressed, occu-pational diseases need updated data and prevention structures need to be sup-ported. And last but not least, new risks such as those constituted by nanomate-rials and endocrine disrupters, must be recognised and dealt with appropriately.
Assessing the state of OSH half-way through a lost decade leads to the conclu-sion that the political impulse for OSH has been placed on hold, at the very time when new challenges are arising and there is a need for more, rather than less, attention to be given to these matters.
of minimum health and safety standards and employment conditions to economic issues like the fight against undeclared work. The cutting of resources and shift-ing of activities compound an already existing chronic lack of resources and undermine the possibility of fulfilling the enforcement provisions contained in new or already well-established legislation.
The crisis also seems to have slowed down or induced inappropri-ate implementation of the European or national OSH strategies, such that far less has been achieved than anticipated. The number of occupational accidents, meanwhile, fell during the 2007-2012 period, some of the main reasons for this being that high-risk sectors have con-tracted as a result of the crisis, employ-ment has decreased, and workers tend to fear reporting the accidents.
As the crisis drags on, the chal-lenges to OSH are increasing. The num-bers of temporary workers and subcon-tracted employees are increasing and, at the same time, the European population is ageing so that workers will be required to work longer as the retirement age con-tinues to be raised. Meanwhile, the inten-sity of work is also increasing.
Last but not least, a lack of aware-ness is the principal barrier to prevention. Given this worrying evolution (less pre-vention services, poor work-life balance, workers dying because of unsafe prac-tices), what will be the future scenario for occupational health and safety?
The review of the standstill of the OSH strategy and the rising challenges to OSH call for a new way forward. A first step must be to adopt a new Euro-pean health and safety strategy as well as to adopt the Directives already on the table. REFIT cannot be the only driver of OSH at the European level. The preven-tive structures such as labour inspector-ates must be provided with the resources and authority to carry out their mandate. Meanwhile, less traditional and yet little dealt with challenges such as psycho-social risks, the ageing workforce and the gendered aspect of OSH, must be accorded the requisite attention. A sec-ond element is that key issues still need to be solved: the revision of the carcino-gens and mutagens Directive needs to be
The economic crisis is a major obstacle to ensuring competiveness, productivity and growth in the EU and for reaching the goals of the EU2020 strategy. It was recognised by the European Commis-sion in its document Evaluation of the European Strategy on Safety and Health at Work 2007 - 2012 that ‘OSH policy can create benefits (both at the societal and individual company level) which exceed the costs’ (European Commission 2013b). This study also recognized that there are numerous factors which affect developments in the incidence of occu-pational accidents and disease and that a crisis is a highly important determinant within this broad configuration.
An appropriate and meaningful form of prevention provision means, primarily, a modern and comprehensive legislative corpus, sufficient resources – both human and financial – for well-developed and properly functioning preventive structures, and a high level of commitment on the part of both community and authorities to promot-ing the improvement and sustainable development of working conditions and the working environment. A substantial component of the preventive structures should be the enforcement bodies, in other words, the Labour Inspectorates.
Since resources, including public spending, are cut at times of economic uncertainty, the European Commis-sion (2013b) acknowledges that in many countries the resources for Labour Inspection have indeed decreased. The main activities of labour inspectorates have in the past ranged, the Commission adds, from monitoring and enforcement
All on board: not allowing the crisis to become an excuse for inaction or undermining standards
Conclusions
90

Chipping away at workers’ participation rightsIntroduction
European legislators, practitioners, and the courts have developed an approach to
workers’ participation which is capable of accommodating a rich diversity of tradition.
This integrative and innovative process is far from complete, and recent years have
been marked by some worrying setbacks. This chapter takes stock of workers’ rights
to information, consultation and board-level employee representation at both the
national and transnational levels.
A review of over 40 years of legislation reminds us of the long legacy of information
and consultation rights which has been enshrined in successive European employment
law, company law, and health and safety legislation. However, recent crisis-induced
changes in labour law have been undermining this legacy; the European Commission’s
announced deregulation programmes threaten to further weaken workers’ rights,
particularly in smaller companies which, already today, often fail to benefit from
adequate participation structures. Strategies pursued by multinational corporations
increasingly challenge workers’ representatives to coordinate their activities across
borders. This year’s analysis of transnational information and consultation rights
systematically integrates, for the first time, the analysis of SE Works Councils (SEWCs)
into the ETUI’s longstanding analysis of European Works Councils (EWCs). Our
examination of the sanctions provided for in the implementation of the Recast EWC
Directive underscores the already vexing question of EWCs’ unequal access to justice.
We map board-level employee participation in the EU and outline recent changes in
national legislation. Turning to the transnational level, the chapter shows how the
European Company (SE) and the application of the cross-border mergers Directive
have opened up new arenas for cross-border cooperation and coordination amongst
employee representatives. Finally, in a review of recent company law, we point out how
the potential contribution of a stakeholder-orientation has been left underdeveloped.
Topics
> Information and consultation rights 92> Structures and strategies of companies 95> Transnational information and consultation 97> Board-level employee representation 103> Corporate governance 109> Conclusions 112
91
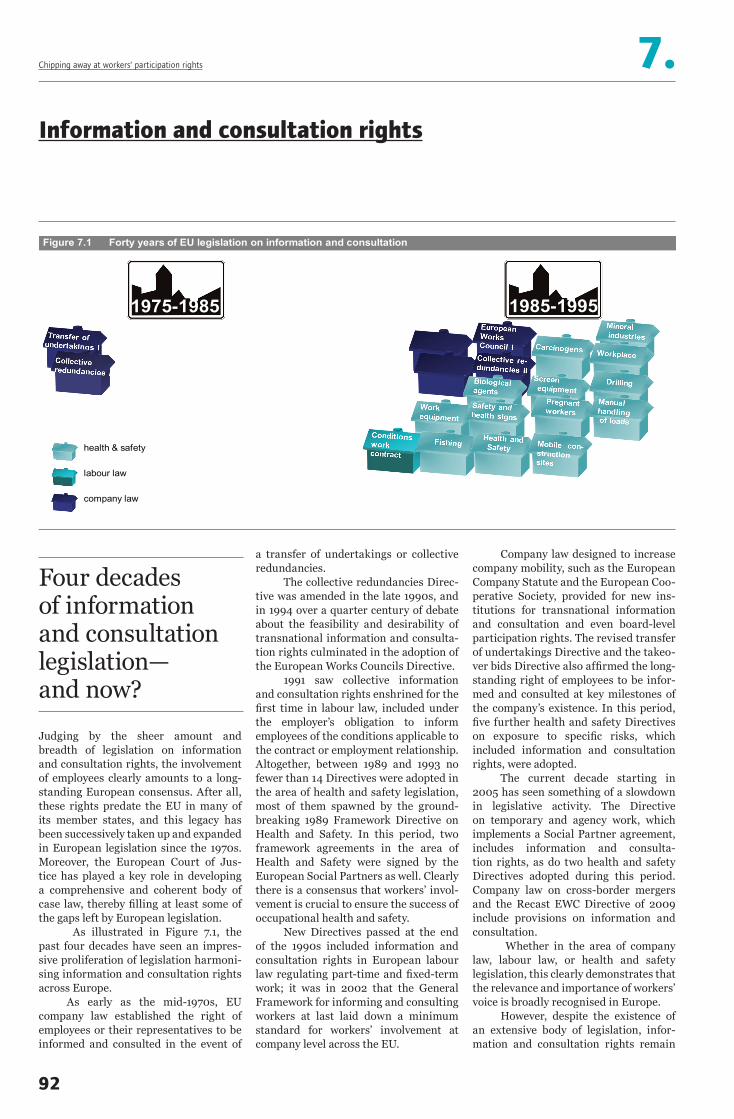
7.Chipping away at workers’ participation rights
Information and consultation rights
92
Judging by the sheer amount and breadth of legislation on information and consultation rights, the involvement of employees clearly amounts to a long-standing European consensus. After all, these rights predate the EU in many of its member states, and this legacy has been successively taken up and expanded in European legislation since the 1970s. Moreover, the European Court of Jus-tice has played a key role in developing a comprehensive and coherent body of case law, thereby filling at least some of the gaps left by European legislation.
As illustrated in Figure 7.1, the past four decades have seen an impres-sive proliferation of legislation harmoni-sing information and consultation rights across Europe.
As early as the mid-1970s, EU company law established the right of employees or their representatives to be informed and consulted in the event of
Company law designed to increase company mobility, such as the European Company Statute and the European Coo-perative Society, provided for new ins-titutions for transnational information and consultation and even board-level participation rights. The revised transfer of undertakings Directive and the takeo-ver bids Directive also affirmed the long-standing right of employees to be infor-med and consulted at key milestones of the company’s existence. In this period, five further health and safety Directives on exposure to specific risks, which included information and consultation rights, were adopted.
The current decade starting in 2005 has seen something of a slowdown in legislative activity. The Directive on temporary and agency work, which implements a Social Partner agreement, includes information and consulta-tion rights, as do two health and safety Directives adopted during this period. Company law on cross-border mergers and the Recast EWC Directive of 2009 include provisions on information and consultation.
Whether in the area of company law, labour law, or health and safety legislation, this clearly demonstrates that the relevance and importance of workers’ voice is broadly recognised in Europe.
However, despite the existence of an extensive body of legislation, infor-mation and consultation rights remain
a transfer of undertakings or collective redundancies.
The collective redundancies Direc-tive was amended in the late 1990s, and in 1994 over a quarter century of debate about the feasibility and desirability of transnational information and consulta-tion rights culminated in the adoption of the European Works Councils Directive.
1991 saw collective information and consultation rights enshrined for the first time in labour law, included under the employer’s obligation to inform employees of the conditions applicable to the contract or employment relationship. Altogether, between 1989 and 1993 no fewer than 14 Directives were adopted in the area of health and safety legislation, most of them spawned by the ground-breaking 1989 Framework Directive on Health and Safety. In this period, two framework agreements in the area of Health and Safety were signed by the European Social Partners as well. Clearly there is a consensus that workers’ invol-vement is crucial to ensure the success of occupational health and safety.
New Directives passed at the end of the 1990s included information and consultation rights in European labour law regulating part-time and fixed-term work; it was in 2002 that the General Framework for informing and consulting workers at last laid down a minimum standard for workers’ involvement at company level across the EU.
1985-1995
Figure 7.1 Forty years of EU legislation on information and consultation
company law
labour law
health & safety
1975-1985
Four decades of information and consultation legislation— and now?

poorly implemented at the national level, as has been shown time and again by the Commission’s own implementa-tion reports (e.g. European Commission 2008a, 2008b) as well as by implementa-tion analyses conducted by the ETUI (e.g. Schömann et al. 2006). Furthermore, as national and European case law shows, information and consultation rights are often not respected and labour law requi-rements are circumvented, making it all the more difficult for workers and their representatives to make effective use of their rights.
During the ongoing crisis, recent labour law reforms and reforms of col-lective bargaining systems have served to undermine information and consulta-tion rights. In particular, crisis-induced labour law reforms of collective redun-dancy procedures have taken their toll on information and consultation rights. In Spain, for example, the labour law reforms of 2010 and 2012 drastically simplified and reduced the period of consultation of workers’ representatives in the event of collective redundancy. This clearly contravenes provisions of the 1998 collective redundancies Directive which explicitly emphasise the need for quality consultation and hence the fact that adequate time is required for a well-informed consultation. A shortening of the procedure places the emphasis on making workers redundant as quickly as possible, rather than on facilitating
the employer agrees not to dismiss the employee for the duration of the collective agreement (at most two years). The wor-ker, in return, agrees to changes in his/her working time and remuneration, the-reby modifying the individual contract of employment. Redundancy is in this way turned into an individual measure, the-reby quite obviously circumventing the collective redundancies Directive.
In the United Kingdom, the revised implementation of the EU collective redundancies and transfer of underta-kings Directives allows consultations by the new employer that took place prior to the actual transfer to count for the purposes of subsequent collective redun-dancy consultation. This means that any pre-transfer consultation will be part of the 30- or 45-day collective consul-tation period compulsory under UK law on collective redundancies, thereby substantially reducing the information and consultation obligations of the new employer.
Slowly but surely, a 40-year legacy of workers’ rights is being torn to shreds. Its repair is a matter of urgency.
qualitative solutions, such as alternatives to collective redundancy or accompa-nying social measures that might include redeployment or retraining. This posi-tion was confirmed by a judgement of the Spanish Supreme court in the Talleres López Gallego case of 20 March 2013, which also emphasised that an adequate consultation procedure takes time and that mass redundancies require proper information and consultation of workers with a view to developing an appropriate social plan.
In 2011, six trade unions brought Hungary’s draft labour code before the ILO for review, claiming that it failed to comply with international labour stan-dards. The labour code vaguely mentio-ned that collective redundancies could be justified by ‘employers’ operations’, whe-reas ILO Convention 158 and Recom-mendation 166 specify that collective redundancies can be justified only by ‘reasons of an economic, technological, structural or similar nature’. The ILO, in its response, reaffirmed that, in the context of information and consultation procedures, the employer must give spe-cific reasons for collective redundancies (ILO 2011).
Reforms adopted in France on 14 May 2013 undermine the rights enjoyed by workers in the event of collective redundancy by allowing the conclusion, in severely ailing companies, of indivi-dual job security agreements whereby
7.Chipping away at workers’ participation rights
Information and consultation rights
93
Source: ETUI own research.
1995-2005 2005-2015
Figure 7.1 Forty years of EU legislation on information and consultation (cont.)

The European Commission’s longstand-ing deregulatory approach towards EU social legislation has recently gathered pace (see timeline in Figure 7.2).
In 2010, the Fitness Check pro-gramme was piloted in the field of employ-ment and social affairs; three Directives which contained (rather different) provi-sions on information and consultation were placed under scrutiny: collective redundancies, transfers of undertakings, and the framework Directive on informa-tion and consultation.
The Fitness Check aimed to iden-tify excessive administrative burdens, overlaps, gaps, inconsistencies and/or obsolete measures; it also sought to assess the cumulative impact of legisla-tion, using a highly controversial meth-odology based on a cost/benefit analysis. The findings, which were intended to provide a basis for drawing policy con-clusions, clearly state that those three EU Directives on information and consulta-tion are broadly fit for their purpose, i.e. are deemed generally relevant, effective, coherent and mutually reinforcing. The
and competences) but also each is a piece of legislation dealing with a highly specific situation hardly lending itself to generali-sation without losing the specificity of its provisions in terms of definition, scope and impact.
In addition to these three Direc-tives, the Refit programme also covers a staggering range of other Directives deal-ing directly or indirectly with information and consultation rights. Alongside eight company law Directives, the Commission plans to evaluate labour law legislation on the information obligations for employers in relation to employment contracts, as well as on temporary agency work, part-time work and fixed-term work. Finally, the 1989 Framework Directive on health and safety and its more than 20 related Directives are also to be examined in the Refit programme.
Such large-scale and fundamental initiatives put massive pressure on work-ers’ information and consultation rights. What is particularly worrying is the risk that rights will be eroded across the board for small and medium-sized companies (see Figure 7.3). Far from improving exist-ing information and consultation rights, the Refit approach weakens workers’ rights to involvement in the improvement of working conditions and in health and safety protection; it diminishes their abil-ity to contribute to safeguarding jobs and ensuring the development of tailor-made social measures at the company level.
benefits they generate are likely to out-weigh the costs.
At the same time, the analysis did identify some important shortcomings in the actual implementation of the legisla-tion at national level. The study concluded, however, that ‘it may be more oppor-tune to pursue non-legislative action at national level to improve the practical effectiveness of the existing I&C legisla-tion’ (Deloitte final report of July 2012).
Turning to its latest initiative, the European Commission adopted the ‘Refit – Fit For Growth’ or ‘Regulatory Fitness and Performance Programme’ in August 2013 (European Commission 2013: 685). As part of its competitiveness-boosting plans, the European Commission intends to screen, repeal or withdraw legislation – in par-ticular in the social field – that it deems no longer ‘fit for purpose’. Despite the fact that the Fitness Check unequivocally concluded that no legislative action was required on these particular information and consul-tation Directives, the European Commis-sion apparently still sees a need for further examination and discussion of their scope and operation; this may lead to a proposal to consolidate them—following a consulta-tion of the European social partners (Euro-pean Commission 2013: 293).
However, it is doubtful whether these three Directives even lend them-selves to consolidation, since not only does each Directive have a different legal basis (and thus different legislative procedures
Fitness Check and Refit: just more buzzwords?
7.Chipping away at workers’ participation rights
Information and consultation rights
Figure 7.2 European Union initiatives pressuring (information and consultation) rights
Source: ETUI own research.
Barroso Commission I 2004-2009 Barroso Commisson II 2010- 2014
2001 2003 2010 2012 - 2013
94

In its Fitness Check and Regulatory Fitness and Performance Programme (REFIT), the European Commission tar-gets small and medium-sized firms as particularly in need of relief from bureau-cracy and administrative burdens.
For anyone thinking that this would affect only a handful of compa-nies and a fraction of the total European workforce, a look at the numbers may prompt a precautionary jolt: as shown in Figure 7.3, between 53 and 82% of the European workforce is employed in small and medium-sized enterprises.
It is equally important to real-ize that large multinational companies (MNCs) shape employment and work-ing conditions in smaller companies too (van Klaveren andTijdens 2013). Firstly, many SMEs are in fact directly controlled by large MNCs. They may or may not have set up an EWC to at least provide a bridge between the local and European spheres of action. Secondly, where they are not directly controlled by a mother company, SMEs are often integrated into global value chains, which are in turn typically coordinated by leading MNCs. These global value chains are estimated to
received, between 24 and 34% of SME employee representatives report that it was not timely and between 19 and 26% that it was insufficiently detailed for its purpose (Riedmann et al. 2009: 51-52).
Bearing in mind that MNCs may in fact amount to a loose family of SMEs distributed across several countries, it is apparent that, even if the Commission’s deregulation initiatives actually target SMEs alone, workers’ rights in MNCs are in fact equally threatened.
If 60% of workplaces employing between 50 and 199 employees have no institutionalised workers’ representa-tion, and only one in three employees in enterprises employing between 10 and 49 employees can rely upon the support of such representation, this is an alarm-ing state of affairs indeed. If already the most elementary rights to information are not being met, this raises in earnest the question of what more damage will be inflicted by the European Commission’s REFIT agenda.
account for 80% of global trade (UNCTAD 2013). Furthermore, it has been dem-onstrated that the leading MNCs shape employment systems in many of these value chains (see Lakhani et al. 2013).
At the same time, the coverage of smaller workplaces by workers’ repre-sentation structures is patchy at best. As can be seen in Figure 7.3, whether or not the workforces of small and medium-sized enterprises are in a position to benefit from an institutionalised form of employee representation varies widely by country, ranging from below 3% to over 90% coverage (Riedmann et al. 2009: 51).
In nine member states, workers’ representation structures were in place in just under 40% of workplaces employ-ing between 50 and 199 employees. The picture for small enterprises, i.e., those employing between 10 and 49 employ-ees, is even more fragmented: in 17 member states, no more than a third of such workplaces reported the presence of some form of worker representation. Even where representation structures do exist, research has found that even the most basic information rights are often flaunted. Despite the stipulations of the 2002 information and consulta-tion Directive, between 20 and 26% of employees in SMEs (10-199 employees) reported that they did not receive from the employer basic annual information on economic, financial or employment issues. In cases where information was
Are SMEs falling through the cracks?
7.Chipping away at workers’ participation rights
Structures and strategies of companies
Figure 7.3 Worker representation and employment in Micro and SMEs in non-financial business
Source: Eurostat (2010 B and number of persons employed by enterprise size class, non-financial business economy, 2010A); European Company Survey 2009.
Note: No data available for SME employment in GR, MT, IE, NL and DK.
0102030405060708090
100UK FI DE FR SE RO EU
27LU AT PL BE HR CZ SI SK HU LT ES BG LV EE PT IT CY
small(10-49 empl) medium size (50-199 empl)
% of companies with worker representation
0102030405060708090 % employment in SME (10-250 empl) whereof Micro (<10 empl)
95

The prolonged depression in the EU has been reflected in companies’ strategic deci-sions. While SMEs were constrained by the lack of credit ensuing from the prolonged malaise in the banking sector, many Euro-pean multinational companies (MNCs) reacted to uncertainties about future demand by either pursuing wait-and-see strategies or already heavily divesting their assets by way of precaution.
The variation in the importance of foreign-controlled companies across EU member states is shown in Figure 7.2. This is an indirect indicator of reliance on MNCs, but it does not take into account home-based multinationals.
On the macroeconomic level, foreign direct investment (FDI) in European coun-tries stagnated in 2009-2012 in terms of both inflows and outflows. Though many countries have not had a chance to recover from the dramatic drop in FDI in 2009, national experiences have varied. While Ireland and Germany confounded the general trend in FDI outflows, in Ireland, Hungary, the Czech Republic, and the UK, inflows picked up rapidly.
such as human resource management (HRM) and accounting, can thus be seg-mented and centralised. This in turn implies that key make-or-buy decisions are also made about corporate functions, thereby potentially also facilitating the outsourcing of business support activities.
At the same time, HRM integration remains problematic, as trade unions and other local actors are often able to prevent attempts at HRM in centralisation (Cooke 2007). Furthermore, decisions about sub-sidiaries’ market position, such as links with suppliers and customers, are increas-ingly centralised. This may prompt compa-nies to concentrate decisions about devel-oping local resources and skills, which is a key concern for unions at the local level. In this way, the significance of the centralised MNC level vis-à-vis the subsidiary level in shaping business strategy is simultane-ously shifting and growing. In some cases, subsidiary management may be left with-out any discretion on business strategy.
This in turn raises important ques-tions for EWCs and SEWCs as well as board-level employee representatives. As decision-making about such a wide range of internal processes becomes centralised and/or fragmented, local employee rep-resentatives have ever less with which to engage. At the same time, employee repre-sentatives at the European level continue to encounter difficulties in ensuring com-pliance with their right to transnational information and consultation.
Low levels of net FDI inflows and outflows reflect divestment decisions by European, North American, and Japanese MNCs. Many MNCs in Europe, choosing a strategy of focusing on core business and geographical areas, disposed of non-core businesses and assets. Re-shoring and relocation of foreign affiliates have become important elements of this divestment strategy, which has in turn contributed to a drop in the number of mergers and acquisi-tions in 2009-2012 (UNCTAD 2013).
MNCs in Europe and other devel-oped regions thus slowed internationali-sation by reducing their assets (both total and foreign. These short-term responses should be assessed in the context of longer-term restructuring trends. Technological change and institutional reforms initially allowed – and provided incentives for – the pursuit of Europe-wide production and market strategies. Internal resource con-straints subsequently represented incen-tives to focus on core competencies, hence to restructure and shed activities (e.g. Meyer 2006).
These very factors are also likely to lead to a concentration of decision-making in headquarters, or to the increasing influ-ence of company headquarters on decisions about what were once traditionally seen as matters best left to the subsidiaries.
Two trends are particularly worth highlighting. First, firms across sectors have increasingly unbundled their corpo-rate functions. Business support activities,
Shifts in MNCs’ strategy and decision-making
7.Chipping away at workers’ participation rights
Structures and strategies of companies
Figure 7.4 Employment share of foreign-controlled enterprises, 2010
0
5
10
15
20
25
30
35
40
45
CY IT ES DE PT FR SI BG LT NL MT FI LV UK DK AT NO SE PL IE HU RO CZ SK EE LUSource: Eurostat (online data code: fats_g1a_08)Note: BE and GR: not available; MT: 2008; CZ: provisional.
96

The right to transnational information and consultation was introduced by the EU to equip employee representatives to address the realities of multinational enterprises operating on a European scale. Just as companies are becoming more genuinely transnational in their organisation, processes and hierarchies, so should the information and consul-tation of employees keep pace with this development.
After nearly a quarter century of intermittent debate, the first EU legis-lation establishing a basis for transna-tional information and consultation as the essential European counterpart to national-level workers ‘ participation was the European Works Councils (EWC) Directive adopted in 1994. The passage of the EWC Directive sparked off an unprec-edented wave of creation of EWCs: by the end of 1996 at least 522 of these bodies had been established, 399 of which were set up in 1996 alone (ETUI database of EWCs, see www.ewcdb.eu). The sheer numbers proved the pressing need for a genuinely transnational body for the implementation of information and con-sultation rights – and also proved beyond
rights were more extensive and precise than they had been in the 1994 EWC reg-ulations. The mutually reinforcing effect of the two Directives (Jagodzinski 2012) was seen again in 2009, when the EWC Recast Directive was adopted; the new EWC legislation closed some of the gaps between SEWCs and EWCs. Indeed, it is one of the most marked features of this particular legislative field that the dec-ades-old harmonising dilemma has been solved by procedural innovations: in this case, the primacy of negotiations backed up by the default application of increas-ingly robust rules. Where the harsh light of practice revealed that provisions were insufficient, they were – at least in part –strengthened at the next opportunity in a sort of legislative leapfrog from one Directive to the other.
Interestingly, however, the first proposals put forward to the social part-ners about a possible revision of the SE Directive contained rather few refer-ences to the Recast EWC Directive. This suggests that the hitherto rather positive – if only gradual – leapfrogging learning effect is not to be actively pursued in the future, presumably under the pressure of the deregulatory philosophy in the field of EU labour legislation (see Figure 7.2).
a doubt that decades of relying solely on companies’ willingness to negotiate had obviously led to nothing but an enormous backlog.
It should therefore have come as no surprise that when the first Community-wide corporate form – the European Company (SE) – was being developed, the need for an analogous body for trans-national information and consultation rights would be perceived as indispensa-ble. This is the SE-Representative Body foreseen in the standard rules, referred to here as the SEWC.
Both bodies for cross-border infor-mation and consultation of workers draw upon the same basic model: a transna-tional works council comprises employee representatives who are elected or nomi-nated by the national workforces or their representatives. As the collective interest representation of the European work-force, EWCs and SEWCs meet with com-pany management, are provided with information, and formulate opinions that are to be taken into account in the com-pany’s decision-making process.
When the SE Directive 2001/86/EC was adopted, it contained some sig-nificant improvements over the EWC Directive of 1994. Clearly policy makers had learned their lessons from the early experiences with the EWC Directive, and laudably tried to fill at least a few gaps. Most importantly, for example, the defi-nitions of information and consultation
EWC and SEWC: two of a kind
7.Chipping away at workers’ participation rights
Transnational information and consultation
2 4 2 4 5 6 9 19
72
401
5169 83 85
52 36 42 36 36 36 40 51 37 23 19 25 17
0
200
400
600
800
1000
1200
0
150
300
450
1985
1988
1989
1990
1991
1992
1993
1994
1995
1996
1997
1998
1999
2000
2001
2002
2003
2004
2005
2006
2007
2008
2009
2010
2011
2012
2013
existing EWC bodies (left-hand axis)
EWC bodies created (right-hand axis)
Figure 7.5 Evolution of number of EWCs and SE Works Councils with landmark events
Source: ETUI database of EWCs, www.ewcdb.eu, January 2014.
Adoption of EWC Directive
Deadline: voluntary Art. 13 agreements
1995-96: number of new agreements (voluntary negotiations)
UK covered by EWC Directive
Adoption of National I&C Directive
Adoption of SE Directive
Adoption Recast EWC Directive
National implementation deadline Recast EWCDirective
97

Despite the fact that EWCs and SEWCs share a basic legislative model of negoti-ating with the safety net of fallback provi-sions, the rules of the game of negotiated solutions are quite different for EWCs and SEWCs; the specific conditions of SEWC negotiations could be expected to result in qualitatively better outcomes than do EWC negotiations. Firstly, past analysis has shown that the fallback posi-tions have a strong impact on the text of agreements (ETUC and ETUI 2013). It would therefore be reasonable to expect that SEWC Agreements would, across the board, reflect the more advanced and detailed fallback provisions con-tained in the SE legislation. Secondly, the trade unions were able to draw upon a long history of multinational negotia-tions based on the EWC Directive. After all, by 2001 an established EWC stand-ard had already been de facto in place. Thirdly, SEWC negotiations were always initiated by the employer, rather than the employee side, and the employer had a clear interest in a rapid and smooth com-pletion of the negotiations. This, together
very similar for both types of agree-ment; indeed, the evolutionary patterns observed for both types of agreement are strikingly similar as well. Both types of transnational worker representation bodies have followed similar develop-ment patterns. They started with more diverse agreements, which were more broadly spread across the range (i.e. more agreements at the bottom and/or top end of our quality scale), and have gravitated over time towards more homogeneity, i.e. have become more standardised and close to what is considered the standard (average) practice. With regard to the latter, the EWCs have clearly benefitted from a great learning experience, while the SE-inspired recast of the EWC Direc-tive in 2009 also made a strong impact (See also the next section).
with the assumption that in many cases more attention was paid to the more con-tentious subject of board-level employee representation than to transnational information and consultation, would lead one to assume a better outcome to the SEWC negotiations.
The ETUI’s analysis of EWC and SEWC agreements sheds new light on the matter. To measure the quality of agree-ments, the points system developed by ETUI in 2013, which awards scores to individual agreements, was used. Avail-able EWC and SEWC agreements were analysed according to identical criteria (see Figure 7.6). In order to account for the substantial difference in sample size between EWCs and SE Works Councils, the points system was complemented by a calculation of a standard deviation indicator, which shows the spread of values for both types of agreement: the higher the standard deviation value, the greater the spread between high and low scores, and hence the greater the varia-tion in the quality of the provisions.
Overall, we found an almost iden-tical scope and quality of information and consultation competences and basic facilities in EWCs and SEWCs. Contrary to expectations, the average scores for EWC agreements in both periods were slightly higher than those attained by SEWCs. On the other hand, the concen-tration of agreements around the aver-age (the standard deviation value) was
Do different rules of the game make a difference?
7.Chipping away at workers’ participation rights
Transnational information and consultation
0
2
4
6
8
10
12
pre-
1996
1996
-200
0
2001
-200
9
2009
-now
2001
-200
9
2009
-now
EWC SE Works Council
average quality of agreement standard deviation minimum standard deviation maximum
Figure 7.6 Quality and diversity of EWC and SE Works Council agreements
Source: ETUI database of EWCs, www.ewcdb.eu, January 2014.Note: Point System: for agenda items: 0.5 point per agenda item listed in fallback provisions; 1 point for items going beyond fallback provisions. For
other issues: 1 point for: provision of translation and interpretation; at least one regular meeting per year, the right to extraordinary meetings upon request, and access to experts.
98

Despite the similar character and qual-ity of provisions of EWC and SE Works Council agreements (see previous page), the latter display, in some respects, bet-ter quality than the former. While EWC agreements provide, more frequently than SEWC agreements, for training opportunities for their members (Figure 7.7), it is the SEWC agreements which display more innovations and higher standards than the EWC agreements.
SEWC agreements tend to slightly redefine and even expand the role of the SEWC. For example, individual SEWCs are by agreement entitled to ‘give opin-ion/comment’, ‘initiate projects’, ‘make recommendations’, engage in ‘negotia-tions’, and aim to ‘reach consensus’ far more frequently than are EWCs.
The analysed SEWC agreements consistently provide for more frequent plenary meetings per year than do EWC agreements. 47% of SEWC agreements signed in 2001-2008 and 62% of SEWC agreements signed since 2009 provide for more than one annual meeting, com-pared to 14% of EWC agreements signed in 2001-2008 and 40% of EWC agree-ments signed since 2009.
down in the agreements, but was prac-tised nonetheless.
SEWC agreements are marked by less stringent confidentiality rules (or more permissive derogations from con-fidentiality obligations), thereby allowing EWC members to communicate effec-tively with national-level representa-tion and supervisory board members. Clearly, the influence of German legis-lation (there are currently 66 SEWCs in German companies) on confidentiality has had a decisive impact on this issue. A growing number of EWC agreements, however, have been copying this solution from the SE arrangements since 2001.
While some deficiencies persist, the quality of EWC agreements has been consistently rising. This finding corrobo-rates the 2013 analysis (ETUC and ETUI 2013: 101-102). All in all, however, with direct and indirect (via the 2009 Recast EWC Directive) feedback and influence of SE legislation, EWC agreements rose to the same levels in terms of quality as SEWC agreements, and have gradually surpassed them, at least as far as con-tractual guarantees (but not necessarily practice) are concerned.
Not surprisingly, SEWC agreements contain more precise and extensive defi-nitions of information and consultation than do the pre-2009 EWC agreements. 81 SEWC agreements have by and large taken on the definitions laid down in the SE legislation, compared to 55 cases, i.e. 4.1% of pre-2009 EWC agreements. This is, of course, not surprising: since the 1994 EWC Directive contained no robust definitions – an omission repaired by the later Recast – so one can hardly expect contemporary negotiators to have included them. Indeed, that gap has been quickly filled in practice: it is striking that the number of EWC agree-ments signed since 2009 which take up the Recast EWC Directive’s definition of information and consultation has almost doubled to reach 103 cases, i.e. 57% of all EWC agreements. This rise in the qual-ity of definitions of the core EWC com-petences demonstrates the remarkable influence of both the revised EWC leg-islation and, indirectly, the SE Directive and the signed SEWC agreements.
Interpretation and translation facilities are explicitly provided for in all SEWC agreements analysed. By contrast, only 63 % (i.e. 950 of 1498) of EWC agree-ments provide for interpretation and/or translation during plenary meetings. However, it must be noted here that the sample of EWC agreements includes very early agreements, in which the provision of interpretation was not necessarily laid
EWCs vs. SEWCs: similar yet different
7.Chipping away at workers’ participation rights
Transnational information and consultation
Figure 7.7 Occurrence of training provisions in EWC and SE works council agreements (% of total agreements)
Source: ETUI database of EWCs, www.ewcdb.eu, January 2014.
31
before 1996 1996 - 2000 2001 - 2009 2009 - now
European Works Councils
SE Works Councils
5172 93
5982
99

Recital 7 of the Recast EWC Directive indicates that one of the goals of the new EWC legislation is to increas(e) the proportion of European Works Coun-cils established (…)’. Provisions to this end in the Recast EWC Directive include more precise obligation on employers to provide data on workforce distribution, and the obligation to inform the social partners at the European level about the launch of negotiations (see also Jagodz-inski 2009).
Has the Recast EWC Directive, in the nearly five years since its adoption and nearly three years since its entry into force at national level, really boosted the number of newly created EWCs and agreements? Figure 7.8 shows how the number of EWCs and SEWCs has grown over the years: we trace the quantity of newly established EWCs as well renegoti-ated agreements.
The data shows that, despite the improved legal basis, the number of EWCs has not yet grown significantly. For several reasons, it may simply be too soon to expect a surge in num-bers. Firstly, most trade unions warned against signing EWC agreements during
to be far more informal, so there is often less acceptance of what is perceived as overly formalised and expensive trans-national negotiations which culminate in an actual written agreement.
Furthermore, several authors have pointed to other reasons why negotia-tions in companies have been slow to be launched: obstruction by management, inadequate and imprecise definitions, the absence of appropriate sanctions, lack of transparency on employee figures, and the lack of a company register at the EU level (Jagodzinski et al. 2008; Whittall et al. 2008).
At the same time, recent years have seen a steady increase in renegotia-tion activities; today just over half of the negotiations are actually renegotiations. This demonstrates that employee repre-sentatives and trade unions are keen to build upon experience and make active use of their improved legal rights.
the transposition period (May 2009 to June 2011), in order to avoid being cov-ered forever by the old EWC legislation. Having slowed down the negotiating machinery, it has taken a bit of time to get it moving again. Secondly, the impact of the crisis and the ensuing restructuring initiatives pursued in many companies have deflected attention from institution building. Thirdly, it should be borne in mind that, because in most cases full use has been made of the three-year window for negotiation, there is a corresponding three-year time lag before any trend in initiating negotiations actually translates into signed agreements.
Indeed, some European Trade Union Federations (ETUFs) report higher than pre-2009 rates of request for new negotiations. However, with most of the largest companies already covered, new negotiation initiatives are currently being launched increasingly often in smaller companies (ca. 10,000 employees and fewer) where, for a num-ber of reasons, negotiating conditions are often less favourable than in large companies. For example, the individual sites are usually smaller, employing per-haps only a few hundred people or less. This often means that the negotiators are less able to rely on the existence of a stable trade union network to support and coordinate EWC negotiations across sites. Furthermore, the company culture within medium-sized companies tends
Negotiations and renegotiations
7.Chipping away at workers’ participation rights
Transnational information and consultation
Figure 7.8 Ratios of renegotiated to new European Works Council agreements
Source: ETUI database of EWCs, www.ewcdb.eu, January 2014.
0%
40%
80%
120%
0
100
200
300
400
500
600
700
800
900
pre-1996 1996-2000 2001-2009 2009-now
installation renegotiated ratio renegotiated to installation (right-hand axis)
100

One of the stated goals of the the Recast EWC Directive is to ‘resolve the problems encountered in the practical applica-tion of Directive 94/45/EC and remedy the lack of legal certainty resulting from some of its provisions or the absence of certain provisions’ (Recital 7, EWCD). The improved definitions of information and consultation are certainly important, if insufficient, steps towards this goal, as are a range of other improvements and clarifications. One other improvement of the EWC Recast Directive is the rec-ognition of the obligation to equip EWCs with ‘the means required to apply duties arising from’ the Directive, and the rec-ognition of the mandate of the EWC to ‘represent collectively the interests of the employees’ (Art. 10.1).
Clearly, these provisions also require the member states to provide EWCs with effective access to justice in case of conflict. Unfortunately, the national legislation implementing the Recast Directive largely fails in this regard. In terms of enforcement, apart from obliging the member states to
which the EWC found the resources and support of trade unions to initiate litiga-tion, and in which the legal admissibil-ity of the case was at least fairly clear. Anecdotal evidence strongly suggests that there are many more conflicts that, despite their gravity, did not make it to courtrooms, simply for lack of legal cer-tainty and resources, both political and legal.
As a forthcoming ETUI study on enforcement provisions in EWC legis-lation shows, the member states have failed to address this issue with any rig-our or consistency (Jagodzinski 2014 for-thcoming). Most member states took no steps to adjust their existing provisions in order to ensure that EWCs have the necessary resources, such as legal stand-ing and/or the capacity to act in courts. The latter is an obvious prerequisite to gaining access to justice; it would seem that, in as many as nine member states (BG, CY, CZ, HU, IT, LU, MT, PT and SL), EWCs are deprived of any form of legal personality or similar conception that would enable them to take a complaint to a court of law.
Since the effectiveness of the EWCs hinges on their legal certainty and access to justice, it is essential that the Euro-pean Commission carefully scrutinise implementation of these provisions of the Recast EWC Directive.
provide for ‘effective, proportionate and dissuasive’ sanctions (Recital 36), the Directive goes no further in specifying member states’ obligations.
Furthermore, the evidence shows that the quality of EWC and SEWC agree-ments is steadily improving: agreements are increasingly more specific and coher-ent. EWCs and SEWCs have reason to be more self-confident, since both the wording of the Recast Directive and the debates held at the time of its adoption made clear that the EWC was to be an institution to be reckoned with. It has an explicit mandate to serve as the collec-tive interest representation of the Euro-pean workforce; it has the right to timely, topical and exhaustive information and consultation; and its deliberations are to be explicitly linked with the work of employee representation taking place at the national or local level.
At the same time, responses to the economic crisis have increased the pace and scope of restructuring within com-panies. Fuelled by their increased confi-dence in the purpose of the EWC, more and more EWCs are defending their rights in court. The ETUI data on EWC-related litigation has revealed at least eleven court cases and judgments which have been initiated and/or completed since the adoption of the Recast EWC Directive in May 2009.
However, it must be noted that this number reflects only those conflicts in
No conflicts — or just no access to justice?
7.Chipping away at workers’ participation rights
Transnational information and consultation
50 765
1.32
7
200
711
290
145
62 251 23
1.16
4
4 446
19.8
30
7.65
0
7.70
0
7.99
5
3.19
5
3.20
0
3.81
1
18.7
50
15.0
00
10.0
00
7.11
0
1.45
0 3.71
8
3.75
0
11.6
47
11.6
47
16.7
50
1.25
0
893
othe
r
Dir
1994
Dir
1994
Dir
2009
Dir
1994
Dir
2009
Dir
1994
Dir
2009
Dir
1994
Dir
1994
Dir
2009
othe
r
Dir
1994
othe
r
Dir
1994
Dir
2009
Dir
1994
Dir
2009
othe
r
Dir
1994
Dir
1994
BE BG CZ HR EE FR DE IE (2) LV LT LU MT NL PL RO
min max
Figure 7.9 Minimum and maximum fines for breach of EWC regulations before and after implementation of directive 2009/38/EC in selected EU member states (eur) (1)
Source: Jagodzinski (2014, forthcoming).Note: ‘other’ refers to legislation other than EWC transposition
101
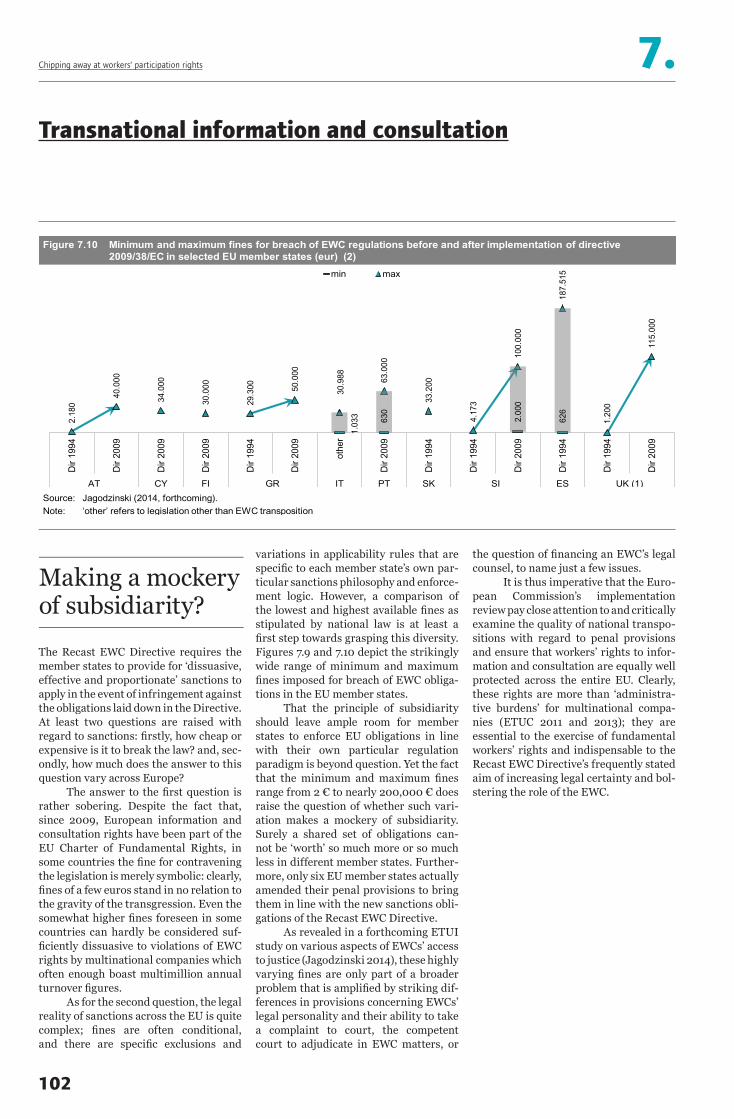
The Recast EWC Directive requires the member states to provide for ‘dissuasive, effective and proportionate’ sanctions to apply in the event of infringement against the obligations laid down in the Directive. At least two questions are raised with regard to sanctions: firstly, how cheap or expensive is it to break the law? and, sec-ondly, how much does the answer to this question vary across Europe?
The answer to the first question is rather sobering. Despite the fact that, since 2009, European information and consultation rights have been part of the EU Charter of Fundamental Rights, in some countries the fine for contravening the legislation is merely symbolic: clearly, fines of a few euros stand in no relation to the gravity of the transgression. Even the somewhat higher fines foreseen in some countries can hardly be considered suf-ficiently dissuasive to violations of EWC rights by multinational companies which often enough boast multimillion annual turnover figures.
As for the second question, the legal reality of sanctions across the EU is quite complex; fines are often conditional, and there are specific exclusions and
the question of financing an EWC’s legal counsel, to name just a few issues.
It is thus imperative that the Euro-pean Commission’s implementation review pay close attention to and critically examine the quality of national transpo-sitions with regard to penal provisions and ensure that workers’ rights to infor-mation and consultation are equally well protected across the entire EU. Clearly, these rights are more than ‘administra-tive burdens’ for multinational compa-nies (ETUC 2011 and 2013); they are essential to the exercise of fundamental workers’ rights and indispensable to the Recast EWC Directive’s frequently stated aim of increasing legal certainty and bol-stering the role of the EWC.
variations in applicability rules that are specific to each member state’s own par-ticular sanctions philosophy and enforce-ment logic. However, a comparison of the lowest and highest available fines as stipulated by national law is at least a first step towards grasping this diversity. Figures 7.9 and 7.10 depict the strikingly wide range of minimum and maximum fines imposed for breach of EWC obliga-tions in the EU member states.
That the principle of subsidiarity should leave ample room for member states to enforce EU obligations in line with their own particular regulation paradigm is beyond question. Yet the fact that the minimum and maximum fines range from 2 € to nearly 200,000 € does raise the question of whether such vari-ation makes a mockery of subsidiarity. Surely a shared set of obligations can-not be ‘worth’ so much more or so much less in different member states. Further-more, only six EU member states actually amended their penal provisions to bring them in line with the new sanctions obli-gations of the Recast EWC Directive.
As revealed in a forthcoming ETUI study on various aspects of EWCs’ access to justice (Jagodzinski 2014), these highly varying fines are only part of a broader problem that is amplified by striking dif-ferences in provisions concerning EWCs’ legal personality and their ability to take a complaint to court, the competent court to adjudicate in EWC matters, or
Making a mockery of subsidiarity?
7.Chipping away at workers’ participation rights
Transnational information and consultation
1.03
3 630
2.00
0
626
2.18
0
40.0
00
34.0
00
30.0
00
29.3
00 50.0
00
30.9
88 63.0
00
33.2
00
4.17
3
100.
000
187.
515
1.20
0
115.
000
Dir
1994
Dir
2009
Dir
2009
Dir
2009
Dir
1994
Dir
2009
othe
r
Dir
2009
Dir
1994
Dir
1994
Dir
2009
Dir
1994
Dir
1994
Dir
2009
AT CY FI GR IT PT SK SI ES UK (1)
min max
Figure 7.10 Minimum and maximum fines for breach of EWC regulations before and after implementation of directive 2009/38/EC in selected EU member states (eur) (2)
Source: Jagodzinski (2014, forthcoming).Note: ‘other’ refers to legislation other than EWC transposition
102

Coupled to works councils or union-based institutions of worker representation, board-level employee representation constitutes an integral element of worker participation systems in many compa-nies in Europe. While works councils and union-based institutions of worker rep-resentation are primarily concerned with day-to-day issues, board-level employee representatives focus on long-term stra-tegic company decision-making.
Board-level employee representa-tion was introduced in most countries in one of two periods. Eleven western European countries enacted legisla-tion during the 1970s and early-1980s: Austria (1974), Denmark (1973), France (1983), Germany (1976), Greece (1983), Ireland (1977), Luxembourg (1974), The Netherlands (1971), Norway, (1972), Por-tugal (1979) and Sweden (1973 and 1976). In a twelfth western European coun-try, Malta, a combination of bipartite
agreements and legislation underpinned board-level employee representation.
A second significant tranche of leg-islation was adopted in five central and dastern European countries preceding their accession as EU member states in 2004: Czech Republic (1997); Hungary (1988), Poland (1992), Slovakia (1990) and Slovenia (1993).
Beyond these two principal peri-ods, legislation dating from 1981 cover-ing state-owned companies remains in place in Poland, as does German legisla-tion from 1951 and 1952; Spanish legisla-tion of 1985, which is coupled to bipartite agreements concluded in 1986 and 1993; Finnish legislation of 1990; and Croatian legislation enacted in 2010.
There is considerable variation between the national systems of board-level employee representation, particu-larly regarding their sectoral coverage, the workforce size threshold at which rules apply, and whether these arrange-ments are statutory or triggered by employees. A failure of Maltese govern-ments to renew the mandates of board-level employee representatives after about 1990 resulted in the eventual elimination of the systems of board-level employee representation in Malta. The point remains, however, that prior to the post-2007 financial crisis board-level employee representation was in place in some form in nineteen European coun-tries, as is illustrated in Figure 7.11.
Variations on a theme: board-level employee representation in Europe
7.Chipping away at workers’ participation rights
Board-level employee representation
Figure 7.11 Workers’ board-level participation in the 31 European Economic Area countries
Source: Kluge, Stollt and Conchon (2013).
No (or very limited) participation rights(12 countries)
Limited participation rightsmainly state-owned or privatised companies (5 countries)
Widespread participation rights comprising state-owned as well as private companies (14 countries)
CYMT
LI
IT
IS
UK
EE
LV
LT
RO
BE
BG
FI
SE
NO
DK
DENL
FR AT
CZSK
HU
HRSI
PL
GRESPT
IE
103

The post-2007 financial crisis has dra-matically increased pressure on board-level employee representation in some countries. In Greece, Ireland and Spain, privatisation required by the Troika as a condition of financial support threatens the existence of board-level employee representation, since it is found only in state-owned enterprises in the first place. Indeed, it is likely that none of the mandates of the existing board-level employee representatives will ‘survive’ the dramatic privatisation programme in Greece. Defenders of board-level employee representation in Ireland are campaigning to revise the legislation to ensure that board-level representation remains in place even after privatisation. The outcome of this campaign remains to be seen. The point, however, is that the coverage of board-level employee representation is contracting in Ire-land because of changes to the status of
will no longer be any obligation for Czech public limited liability companies to have employee representatives on their boards from 1 January 2014 when the new law comes into force. A Polish government proposal to eliminate board-level repre-sentation in privatised companies stalled in the parliamentary process after March 2011, but the number of employee repre-sentatives has fallen markedly from 618 in 2009 to 306 three years later.
companies rather than direct legislative reform which would limit its scope of application.
In contrast to the developments in Greece, Ireland and Spain, legisla-tion enacted in France in June 2013 (Loi relative à la sécurisation de l’emploi) has extended the coverage of board-level employee representation to cover large private sector companies in addition to the state-owned and privatised com-panies that were already covered. This measure originated in a national cross-sectoral agreement concluded in January 2013 between employers’ associations and trade union confederations.
Within the New Member States of 2004 the emphasis is very different to that found in Western Europe insofar as the state, supported if not prompted by employers’ organisations, is concerned to weaken, if not eliminate, board-level employee representation. The revi-sions of the Companies Acts in Hungary and Slovenia, for example, introduced the possibility for companies to adopt monistic board structures coupled to weaker forms of employee representa-tion on boards. Similarly, a new act on commercial corporations implemented in 2012 in the Czech Republic introduced the possibility for companies to adopt monistic board structures, while main-taining none of the previously existing legal provisions for board-level employee representation. In consequence, there
Moving the goalposts? Changes to board-level employee representation
7.Chipping away at workers’ participation rights
Board-level employee representation
Figure 7.12 Changes to rules or practice of board-level employee participation
Source: ETUI own research.
ES
FR
IE PL
HU
CZ
GR
104

A further result of the post-2007 finan-cial crisis has been high levels of com-pany restructuring as enterprises have attempted to adjust to changed economic circumstances. Such restructuring is clearly associated with long-term strate-gic company policy and thus falls within the ambit of company boards.
Figure 7.13 reports the results from a large-scale survey of the activities and influence of board-level employee repre-sentatives based in 17 of the 19 countries where such representation is in place. The survey was conducted between 2009 and 2011, thereby allowing an examina-tion of the influence exerted by board-level employee representatives on com-pany restructuring during the crisis.
Overall, more board-level employee representatives reported that they were ‘not very influential’ or ‘not at all influ-ential’ than reported having an influ-ence on restructuring. Three points arise from this observation. First, it suggests that the capacity of board-level employee representatives to secure the protection of employees during
in Germany. In practice, a direct rela-tionship exists between the perceived influence of board-level employee rep-resentatives and the strength of their constitutional position on the board. To illustrate, in one-third codetermination 2.8 per cent of board-level employee rep-resentatives thought that they were ‘very influential’ on decisions to restructure compared to 5.5 per cent and 10.5 per cent in parity and Montan codetermina-tion respectively.
The implications of the develop-ments in the coverage of board-level employee representation during the post-2007 financial crisis and the sur-vey results are straightforward: board-level employee representation is becom-ing more limited in coverage and many of the employee representatives that sit on company boards have been unable to influence the terms on which companies restructure. If, as repeated documents emanating from the European Commis-sion make clear, board-level employee representation is a key element of work-place participation in Europe, it is clear that the time has come for the introduc-tion of European legislation to stabi-lise the situation and allow board-level employee representatives to exert the influence that national legislation ini-tially intended.
corporate restructuring events is limited in practice. Second, the limited influ-ence brought to bear on restructuring by board-level employee representatives brings into question the intensity of par-ticipation of board level representation.
The positive index scores reported by board-level employee representatives in the Netherlands, Ireland, Greece, and Spain suggest a greater degree of influence for employee representatives in these countries. The index scores reported by Germanic and Nordic board-level employee representatives are not as negative as those for their counterparts based in the Francophone countries and the New Member States of 2004. This clearly suggests that the more wide-ranging systems of participation which are characteristic of the Germanic and Nordic countries in effect allow board-level employee representatives to exert more influence in the overall restructur-ing process. That being said, nearly 23% of Germanic respondents and just over a quarter of Nordic respondents regarded themselves as either ‘very influential’ or ‘influential’ on the restructuring process.
There is clearly a positive correla-tion between the influence attained by board-level employee representatives during company restructuring and the composition of the board.
This relationship can be further assessed by reference to the three sys-tems of board-level representation found
Perceptions of power and influence
7.Chipping away at workers’ participation rights
Board-level employee representation
Figure 7.13 If your company has restructured over the past two years, how influential were you on the process?
0% 10% 20% 30% 40% 50% 60% 70% 80% 90% 100%
SEs
IE, GR, ES
NMS
Francophone
The Netherlands
Nordic
Germanic
All
very influential influential intermediate not very influential not at all influential no restructuring has taken place over the past two years
Source: ETUI own research.
105

Figure 7.11 has vividly depicted that board-level employee representation (BLER) constitutes an important ele-ment of corporate governance in many EEA countries. However, at EU level there has never been a consensus on this issue. The most far-reaching initiative in this respect was a proposal from the European Commission for a fifth com-pany law Directive in 1972, which aimed to impose a two-tier governance struc-ture for companies with compulsory one-third employee representation (Con-chon 2011: 32). The Directive, however, never saw the light of day, a fate which was also nearly suffered by the Euro-pean Company Statute. The compromise which finally enabled its adoption lim-its board-level employee representation to those SEs where such rights already existed before. This so-called ‘before and after principle’ is a key to understanding the relatively low number of SEs where workers are represented on the adminis-trative or supervisory board.
which is deeply embedded in their indus-trial relations systems. In Sweden for example, trade unions can appoint 2-3 representatives to the boards of limited companies employing 25 employees or more (Conchon et al. 2013).
It is far more likely that the real reasons for the relatively low attractive-ness of the SE lie in its very construction, which apparently does not offer enough advantages for businesses in Europe.
Despite the limited number of SEs with BLER, their impact goes beyond their own company’s industrial rela-tions: Firstly, at least in some member states, the SE has stimulated discus-sions about board-level employee rep-resentation in general and the role that employees should play in corporate gov-ernance. Secondly, board-level employee representation has indirectly spread via non-domestic employee board-level representatives, especially in Germany-headquartered SEs (see next page). This has had the knock-on effect that trade unions of their home countries had to rethink their general approach towards the issue of board-level employee repre-sentation and find ways to support their members. Thirdly, the compromise found in the SE Directive was and still is the key reference for all company law initiatives which (potentially) touch upon board-level employee representation, such as the Cross-Border Merger Directive (see Figure 7.16).
Figure 7.14 indicates the number of SEs per country. Out of the ca. 2000 SEs registered in total, the ETUI’s SEEurope network has identified at least 104 SEs with a transnational information and consultation arrangement (usually an SE Works Council). 54 of these SEs have also negotiated board-level employee representation rights. 81 percent of them are headquartered in Germany, a coun-try with a long tradition in BLER (on the dubious motives of some German compa-nies hoping to ‘freeze’ employee board-level representation arrangements and/or reduce the board size by founding an SE see e.g. Keller and Werner 2008).
Some authors have argued that the prospect of having employee rep-resentatives on the board amounts to a major blemish on the SE’s attractiveness, thereby explaining its lack of uptake in many countries (Ernst&Young 2009). As elaborated elsewhere (Cremers 2013), this argument fails to convince: the before-and-after principle ensures that companies without board-level employee representation need have no fear of its imposition. In fact, after over a decade of SE founding, there is not a single SE with board-level employee representation known where it did not exist before. For example, in the four Nordic countries, a total of only 14 SEs has been registered. It is hard to believe that the rarity of the SE in these countries is due to opposition to the board-level employee representation
The SE as a laboratory for workers’ participation
7.Chipping away at workers’ participation rights
Board-level employee representation
Figure 7.14 Geographical distribution of European Companies (SE)
Source: ETUI (2014) European Company (SE) Database.
1 1 1 2 2 4 4 4 5 5 5 5 6 6 10 10 14 19 25 26 31
62
83
1 1 2 6
44
0
20
40
60
80
100
120
140
160
180
200
PT FI IT PL LT ES LV NO DK HU MT SE LI EE BE IE CY AT FR LU NL UK SK DE CZ
number of SEs per country number of SEs with BLER per country 272 1363
total number = 2052 total number = 54
106

What do we know about board-level employee representatives in SEs?
The European Workers’ Participa-tion Competence Centre has identified at least 156 worker representatives on super-visory and administrative boards of SEs (EWPCC 2013). The vast majority of these sit on a supervisory board, but there are a few SEs which have a single board struc-ture. Here, the employees are represented on the SE’s administrative board.
Depending on the legal construction prior to the establishment of the SE, the share of board-level employee representa-tives ranges from a single member to up to half of the board seats. However, in no SE can the worker side ultimately prevent a board decision from being taken as long as the representatives of the sharehold-ers act in unison. Where half of the board consists of employee representatives, the chairman has a casting vote in the event of a tie (SE Regulation, Art. 50 (2)).
The selection procedure of the board members differs from one SE to
This Europeanisation of board-level employee representation entails both opportunities and challenges. On the one hand, for workers outside the home coun-try, an additional channel for interest representation is opened up, and a new arena emerges for international coopera-tion and articulation between workers’ representatives and trade unions across Europe.
On the other hand, it brings a number of new challenges, chiefly the increased need for coordination among the workers’ representatives and their unions, in order to ensure a joint under-standing and a common approach. As a rule, there are only one or two repre-sentatives from countries other than the country in which the company has its headquarters. Furthermore, if these come from a country where board-level employee representation is unknown or practised differently, there is even more need to align the employee side. Different approaches to confidentiality can, in par-ticular, be problematic, especially against the background of the individual liability of board members.
Furthermore, it should be borne in mind that the internationalisation of boards is no longer limited to the SE alone: the application of the Cross-Border Merger Directive (CBMD) for example, can also result in a board which includes employee representatives from different countries (see next page).
another. In most cases, the SE agreements on worker involvement provide the SE Works Council with the decisive role in determining the employee representatives to the board (Rose and Köstler 2014: 99).
The most fundamental innovation brought about by the SE legislation was the possibility to internationalise the composition of the employee represen-tation on company boards. In general, employee mandates on the board are allocated in proportion to the geographi-cal distribution of the workforce across countries. The employee board-level rep-resentatives come from 16 different coun-tries. 77 per cent of them come from Ger-many, which can be explained by the high number of SEs with board-level employee representation rights headquartered in Germany, and the commonly found con-centration of the workforce in the home country. In many cases, the SE has thus indeed led to an internationalisation of the boardroom; experience with board-level employee representation has in this way been indirectly spread to countries in which such representation does not exist in the domestic corporate governance systems.
The European trade union move-ment has insisted from the beginning that board-level employee representatives must be understood to hold and act upon a genuinely European mandate to represent the interests of the entire European work-force (ETUC 2008).
SE board members: workers’ participation ambassadors
7.Chipping away at workers’ participation rights
Board-level employee representation
Figure 7.15 Nationality of workers’ representatives in SE boards
Source: EWPCC (2014).
AT 4DK 1IT 1RO 2
BE 2
FR 4
NL 7
UK 4CZ 1
HU 2
PL 4
US 1DE 120
IE 1
PT 1CH 1
other 36
107

With the entry into force of the Cross-Bor-der Merger Directive (CBMD) in December 2007, the ‘unique selling point’ of the Euro-pean Company (SE) –that it alone enabled companies to merge easily across national borders – was made obsolete. Before the transposition of the CBMD, implementing a cross-border merger was a very difficult, burdensome and costly procedure.
By making available a company law instrument for mergers across different EEA countries, the CBMD, however, also significantly enlarged the potential scope for the Europeanisation of board-level employee representation.
A recent review of the CBMD com-missioned by the EU provides the first ever European-wide data on its actual use. Between 2008 and 2012, the num-ber of cross-border mergers (CBMs) increased by a staggering 173% from 132 to 361 transactions. Despite some methodological difficulties, the authors conclude ‘that the CBMD has been very effective in promoting economic activity between Member States’ (Bech-Bruun and Lexidale 2013: 975).
case for the SE, there is no adequate Euro-pean registration procedure which would allow the application of the Cross-Border Mergers Directive to be systematically monitored. Unfortunately, the EU-com-missioned CBMD study also did not look at the impact on employee participation.
At least for German companies, recent research casts some light into the darkness (Bayer 2013). According to the study, mergers involving German compa-nies and which are relevant for board-level employee representation constituted only a small minority (6%) of all cross-border mergers in the period 2007 to 2012. In total, 22 such mergers were identified which concerned 17 German companies in all (some companies were involved in several mergers).
As we are not aware of similar studies from other countries, the overall picture remains hazy. It also remains to be seen how the use of the Directive will develop further in the future. The above-mentioned CBMD study underlined that the increase in CBMs over the past years took place in an economic environment in which mergers and acquisitions had significantly decreased (Bech-Bruun and Lexidale 2013: 976). It is therefore likely that CBMs will increase in the future, thereby also increasing the likely impact on cross-border employee participation, especially in countries with relatively low thresholds for board-level employee representation.
Article 16 of the CBMD addresses the issue of board-level employee repre-sentation. In many cases, the negotia-tion-based approach of the SE Directive applies. The CBMD thus also offers oppor-tunities to internationalise board-level employee representation. As for the SE, however, the rules apply only to companies in which board-level employee representa-tion existed prior to the merger.
However, the CBMD falls far below the standard set by the SE legislation; for example, no EWC-type transnational information and consultation body is provided for. Furthermore, the company is allowed to directly apply the standard rules without any negotiations if it unilat-erally so chooses. The employees are thus deprived of any say in their future repre-sentative structures.
This constitutes a break in the policy-making traditions in this area of law, whereby the primacy of company-based negotiations was the solution to the dilemma of not being able to find a one-size-fits-all legislative consensus. Indeed, the opportunity to jointly negotiate tailor-made representation structures that take the traditions and needs of the constitu-ent parts of the company into account is widely acknowledged as one of the success factors of the EWC and SE legislation.
Little is yet known about the impact that the CBMD has and will have on worker involvement, and specifically on board-level employee representation. As is the
Break with tradition leaves everybody guessing
7.Chipping away at workers’ participation rights
Board-level employee representation
Figure 7.16 Number of cross-border mergers per year
Source: Bech-Bruun and Lexidale (2013)
132
194208
332361
0
50
100
150
200
250
300
350
400
2008 2009 2010 2011 2012
108
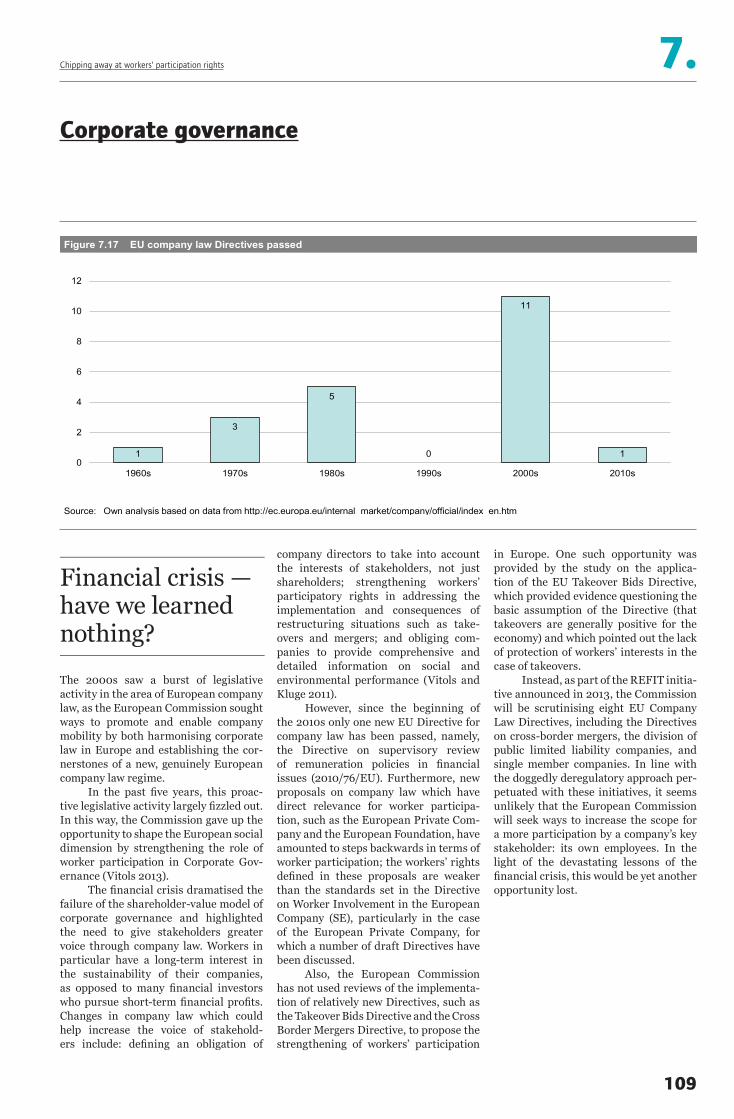
The 2000s saw a burst of legislative activity in the area of European company law, as the European Commission sought ways to promote and enable company mobility by both harmonising corporate law in Europe and establishing the cor-nerstones of a new, genuinely European company law regime.
In the past five years, this proac-tive legislative activity largely fizzled out. In this way, the Commission gave up the opportunity to shape the European social dimension by strengthening the role of worker participation in Corporate Gov-ernance (Vitols 2013).
The financial crisis dramatised the failure of the shareholder-value model of corporate governance and highlighted the need to give stakeholders greater voice through company law. Workers in particular have a long-term interest in the sustainability of their companies, as opposed to many financial investors who pursue short-term financial profits. Changes in company law which could help increase the voice of stakehold-ers include: defining an obligation of
in Europe. One such opportunity was provided by the study on the applica-tion of the EU Takeover Bids Directive, which provided evidence questioning the basic assumption of the Directive (that takeovers are generally positive for the economy) and which pointed out the lack of protection of workers’ interests in the case of takeovers.
Instead, as part of the REFIT initia-tive announced in 2013, the Commission will be scrutinising eight EU Company Law Directives, including the Directives on cross-border mergers, the division of public limited liability companies, and single member companies. In line with the doggedly deregulatory approach per-petuated with these initiatives, it seems unlikely that the European Commission will seek ways to increase the scope for a more participation by a company’s key stakeholder: its own employees. In the light of the devastating lessons of the financial crisis, this would be yet another opportunity lost.
company directors to take into account the interests of stakeholders, not just shareholders; strengthening workers’ participatory rights in addressing the implementation and consequences of restructuring situations such as take-overs and mergers; and obliging com-panies to provide comprehensive and detailed information on social and environmental performance (Vitols and Kluge 2011).
However, since the beginning of the 2010s only one new EU Directive for company law has been passed, namely, the Directive on supervisory review of remuneration policies in financial issues (2010/76/EU). Furthermore, new proposals on company law which have direct relevance for worker participa-tion, such as the European Private Com-pany and the European Foundation, have amounted to steps backwards in terms of worker participation; the workers’ rights defined in these proposals are weaker than the standards set in the Directive on Worker Involvement in the European Company (SE), particularly in the case of the European Private Company, for which a number of draft Directives have been discussed.
Also, the European Commission has not used reviews of the implementa-tion of relatively new Directives, such as the Takeover Bids Directive and the Cross Border Mergers Directive, to propose the strengthening of workers’ participation
Financial crisis —have we learned nothing?
7.Chipping away at workers’ participation rights
Corporate governance
Figure 7.17 EU company law Directives passed
Source: Own analysis based on data from http://ec.europa.eu/internal_market/company/official/index_en.htm
1
3
5
0
11
10
2
4
6
8
10
12
1960s 1970s 1980s 1990s 2000s 2010s
109

In recent years a consensus has emerged that company sustainability is a multi-dimensional concept involving not only environmental issues but also social issues such as training, health and safety and human rights. However, at the same time it has become obvious that current progress on the road to sustainability is slow at best. For example, on the human resources front, demographic change combined with weak training efforts by companies has created a looming skills shortage for workers (OECD 2012). On the environmental front, the Carbon Disclosure Project has found that CO2 reduction commitments by large com-panies fall far short of what would be needed to meet the international com-mitment to limiting global warming to 2 degrees centigrade (CDP 2012).
This lack of progress raises the question of what catalysts can encour-age companies to become more sustain-able. From the workers’ point of view, can workers’ participation make a positive
higher than the group of companies with neither form). Similar results were found for many other important sustain-ability policies. For example, companies with both an EWC and BLER were three times more likely to comply with ILO guidelines on health and safety, twice as likely to comply with either ILO or UN policies on human rights and more than 50% more likely to have emissions reduc-tion targets than companies with neither form of representation.
This analysis suggests that worker participation is an important component which already contributes to sustainable companies along a number of dimen-sions. Furthermore, the strengthening of workers’ participation could be a signifi-cant contributor to making our compa-nies even more sustainable.
contribution here? Are companies with worker involvement more sustainable than companies without? An analysis of sustainability data for large European companies listed on the stock market (the STOXX 600 companies) indicates that worker representation is positively associated with better social and envi-ronmental performance by companies.
The first step in the analysis was to identify which of these 600 companies had a European Works Council (EWC) and/or Board-Level Employee Represen-tation (BLER). Data was obtained from the ETUI’s EWC database and BoardEx. The second step was to examine data provided by ASSET4, a leading sustain-ability ratings agency, on the presence or absence of important environmental and social policies at these companies in 2012.
In almost all cases the analysis showed that companies with either form of worker representation performed bet-ter than those without. The best overall performance was achieved by the group of companies with both an EWC and BLER. For example, only 9% of compa-nies with neither form of worker repre-sentation had a job security policy in 2012. In contrast, three times as many companies with an EWC (30%) and twice as many companies with BLER (17%) had such a policy. The highest propor-tion was reached by companies with both forms of representation (four times
Workers’ participation and the sustainable company
7.Chipping away at workers’ participation rights
Corporate governance
Figure 7.18 Companies with sustainability policies, by type of worker representation
Source: Own analysis based on ASSET4 data and own database on worker representation in large European companies.
9%
8%
39%
49%
30%
20%
74%
80%
17%
7%
43%
61%
40%
29%
78%
84%
both EWC and BLER
just BLER
just EWC
no EWC no BLER
Has the company set targets or objectives to be achieved on emission reduction?
Does the company claim to comply with the fundamental human rights convention of the ILO or
support the UN Declaration of Human Rights?
Does the company comply with the ILO Code of Practice on "Recording and notification of
occupational accidents and diseases" or the ILO "Guidelines on occupational safety and health
management systems"?
Does the company have a job security policy?
companies with
110

In the last half decade, concern with the environmental and social impact of com-panies has increased significantly. In order to properly measure this impact, companies need to provide comprehen-sive and credible information on issues like training, health and safety, CO2 emissions reduction, and a host of other policies (Hojnik 2012).
In most EU member states, compa-nies disclose this information on a purely voluntary basis. Although international frameworks for this so-called ‘non-finan-cial’ reporting exist, such as the Global Reporting Initiative (GRI), these are mostly used by large companies listed on the stock market. Even among these com-panies, reporting is done on a selective basis, resulting in very patchy informa-tion even on very basic indicators (Centre for Strategy & Evaluation Services 2011). Figure 7.19 shows that only 60% of the largest 960 European listed companies provide information on CO2 emissions. Regarding social indicators, even fewer
to provide detailed nonfinancial infor-mation on the basis of a common and comprehensive standard (such as GRI); to have this information audited; and to create a role for workers’ representatives to verify social information (Vitols and Kluge 2011).
companies provide basic information; for example, only 33% report the injury rate for workers, while 25% report working days lost due to injury. The reporting rate among smaller and medium-sized com-panies is even lower.
In response to the pressure from the public and investors to receive bet-ter information from companies, in April 2013 the European Commission sub-mitted a proposal for a Directive on the provision of nonfinancial and diversity information by large companies. From a stakeholder point of view, however, this proposal is much too weak. Firstly, the proposal allows companies to choose among different reporting standards, allowing them to use the weakest stand-ard. Secondly, reporting would be on a ‘comply or explain’ basis, which leaves companies considerable leeway in choos-ing what items to provide information on. Thirdly, there are no requirements for independent auditing or trade union involvement in verifying the informa-tion provided; clearly this is needed to ensure confidence in the validity of the data. Finally, the threshold for reporting is too high, since the rules would apply only to companies with more than 500 employees.
In the interest of credible informa-tion for stakeholders, and in order to reli-ably measure progress towards company sustainability, the European Commission should be urged to require companies
Non-financial reporting: making it real with worker involvement
7.Chipping away at workers’ participation rights
Corporate governance
Figure 7.19 Transparency of European companies on sustainability policies
Source: Own analysis based on ASSET4 data.
60%
C02 direct emissions
share of companies that provide data on
58%
C02 indirect emissions
33%
injury rate
25%
lost work days
44%
employee turnover
111

7.Chipping away at workers’ participation rights
phrases in the Recast EWC Directive not-withstanding – still a long way to go until EWCs and SEWCs enjoy adequate access to justice and to the law.
Despite some changes in legislation, the coverage of board-level employee participation remains fairly widespread, although rights or coverage in this area have been curtailed in several countries (an exception being France where, on the contrary, some progress has been made). At the same time, the European Company (SE) and the application of the cross-bor-der mergers Directive have opened up new arenas for cross-border cooperation and coordination amongst employee rep-resentatives: the resulting internation-alisation of board-level representation offers new opportunities to develop this form of workers’ participation into a gen-uinely European instrument. Indeed, the application of the cross-border mergers Directive must be monitored carefully, to assist trade unions in optimally support-ing their representatives on these boards as well as on the boards of SEs.
Finally, the potential contribution of a stakeholder orientation in corporate governance has been left woefully under-developed, as a review of recent company law and sustainability performance indi-cators shows. In the light of the recogni-tion that the financial crisis was largely caused by a misguided reliance on share-holder value, the European Commission has missed the opportunity to strengthen the development of an alternative inclu-sion of stakeholder interests as a guaran-tor of long-term stability and social and environmental sustainability.
In the light of the challenges fac-ing the European Union, its workers and its companies, it is clearly time to move forwards rather than backwards and to create a socially responsible and robust social dimension to the single market, one that is able to engage the interest, as well as the active commitment, of its citi-zens and its workers.
representatives in SMEs, where compli-ance and enforcement of existing rights is already extremely weak, then the impact on the majority of the European workforce will be tremendous. What jus-tification can there possibly be for steps that are tantamount to a claim that work-ers in smaller companies deserve weaker rights?
In cases where such already dis-advantaged SMEs are combined into MNCs, the problems of these smaller firms are compounded: information and consultation is inadequate at both the local and the cross-border level. That this dilemma should emerge at a time when multinationals’ internal decision-making and strategy definition is taking place in a constantly shifting and unpredictable landscape of local, national, divisional, European, and global processes raises the stakes even further. It is thus time for the EU to make its information and consultation legislation more coherent, flexible and responsive to the realities of today’s cross-border economy.
Turning to transnational informa-tion and consultation rights, in this year’s analysis for the first time, SE Works Councils (SEWCs) are systematically integrated into the ETUI’s longstanding analysis of EWCs. Until recently, under the glare of the europeanisation of board-level employee representation in the European Company (SE), little attention was paid to the cross-border informa-tion and consultation processes foreseen in SE agreements. The analysis confirms that, despite their very different starting conditions, EWCs and SEWCs should be considered analogous institutions for the purposes of transnational information and consultation.
Furthermore, the monitoring of agreements signed over the years shows that as much effort is today being expended on renegotiation as on the negotiation of first-time EWC and SEWC agreements. That trade unions and employee representatives should expend such effort on the renegotiation of agree-ments is evidence of the usefulness of these institutions as well as of the impact exerted by the slow – but still incomplete – improvements in the legislative refer-ences. There is indeed – certain noble
This chapter has shown that the emerg-ing European architecture of participa-tion rights is being steadily dismantled. What was once a growing consensus about the importance of the workers’ voice has become the primary object of deregulation: whether it be the employ-ment law reforms enacted in the wake of the crisis, the European Commission’s reheated deregulation agenda, or the missed opportunities in company law, the past five years have seen a rollback in the various kinds of forward-looking leg-islation previously designed to increase citizens’ engagement in the organisation of their working lives.
A hitherto shared European con-viction that employees’ voice matters is being crowded out from several sides. Firstly, crisis-induced changes in labour law and collective bargaining systems have weakened employee representa-tion, particularly in the event of collec-tive redundancies. Secondly, the Fitness Check and the REFIT process – the most recent incarnations of the European Commission’s longstanding preoccupa-tion with deregulation for deregulation’s sake – threaten to dangerously under-mine employees’ rights to information and consultation, particularly in smaller companies.
This is only one among several reasons why we have taken a closer look at the state of employee representation structures in small and medium-sized enterprises (SME) across the EU. The empirical evidence shows that, while SMEs employ between half and two thirds of the total working population of the EU, institutionalised forms of worker participation are not widespread in such workplaces. Taken on its own, this representation gap in SMEs is already worrying enough; but if the European Commission follows through with its intention to curtail the rights of employee
It’s time to rebuild workers’ participation rights
Conclusions
112
Where is all that green investment?Introduction
There is an emerging consensus in Europe (European Commission 2012; Kolev et
al. 2012; OFCE et al. 2013) that, in the absence of a powerful kick to revive its anaemic
efforts at investment both public and private, the European economy is not going to
make the turnaround for sustainable growth. The commitments undertaken by the
EU 2020 Strategy and by the related Commission documents on sustainable develop-
ment – such as the Energy Roadmap 2050 (European Commission 2012) – contain
a clear definition of the investment required to reach the targets set. But this invest-
ment is simply not happening, the reason being that austerity policies have gained the
upper hand.
At the same time, global greenhouse gas emissions continue to increase rapidly
and, in mid-2013, carbon-dioxide (CO2) levels in the atmosphere exceeded 400 parts
per million for the first time in several hundred thousand years (EIA 2014). The UN
International Panel of Climate Change (IPCC) 5th Assessment report (IPCC 2013)
delivers convincing scientific evidence that the climate is already changing and that
extreme weather events are expected more frequently. Policies that have been imple-
mented suggest that the most likely long-term average temperature increase will be
between 3.6 °C and 5.3 °C (compared with pre-industrial levels), with most of the
increase occurring this century. Europe is losing momentum in greening its economy
and the leadership claimed by it in this sphere in the past is quickly eroding. The
greatest setback suffered by Europe in the last two years has been in clean energy
investment. At the same time, fuel poverty is growing and the public support for green
policies is diminishing, as the decreasing affordability of energy prices is frequently
associated with support for renewables (see also ETUC and ETUI 2013: 85-87). This
chapter argues for a policy shift that will give a serious boost to green investment.
Topics
> Greenhouse gas emissions 114> Clean energy investments 116> The investment rationale 118> Social implications 119> Conclusions 120
113

Europe has in the past laid claim to a lead-ing role in climate policy and in decar-bonising its economy. However, though it remains the region of the world with the most comprehensive climate policy frame-work, Europe is now, at the same time, for-feiting its ‘climate policy leadership’. As we show in this chapter, even though green-house-gas (ghg) emissions have indeed decreased, most of the decrease is due to contraction of the European economy, while other regions of the world are able to boast higher emission reductions and, at the same time, higher growth. Europe is also the main laggard in clean energy investment in the recent years.
Despite progress in some countries, global energy-related CO2 emissions increased by 1.4% in 2012 to reach 31.6 gigatonnes (Gt), a historic high. Develop-ing countries accounted for 60% of global emissions in 2012, up from 45% in 2000. In 2012, China had the largest share in the increase in global CO2 emissions, but its growth in that year was one of the lowest in a decade, driven largely by the deploy-ment of renewables and a significant improvement in the energy intensity of its economy.
contributed to a decrease in emissions to approximately the 2009 level.
Preliminary results for 2012 show a 0.5% decrease for the EU15 that is broadly in line with the GDP change, while for the EU27 preliminary data indicate a 2.8% reduction in emissions.
Although a modest absolute decou-pling of ghg emissions from GDP growth had been achieved over the years, the result does not place Europe on a sus-tainable track of emission reductions, especially in the event of a more dynamic future economic development.
This modest decoupling, what is more, is largely the result of changes in the energy mix that entail energy sources generating lower emissions, rather than of improvements in energy efficiency, as will be show in the next sections. Energy saving has the greatest potential in reduc-ing greenhouse-gas emissions and in providing more cost-efficient solutions.
The current path of emission reduc-tions is far from sufficient to reach the 80% reduction target by 2050. Even the compromise of a 40% reduction target for 2030 proposed by the European Com-mission would require more effort than is suggested by current performance. There is, in any case, a need for Europe to step up its decarbonisation efforts sub-stantially in the future.
In the United States, a switch from coal to gas in power generation helped reduce emissions by 200 million tonnes (Mt), bringing them back to the level of the mid-1990s. Emissions in Europe declined by 50 Mt as a result of economic contraction, growth in renewables, and a cap on emissions from the industry and power sectors.
Figure 8.1 shows the development of greenhouse gas emissions in Europe between the reference year of 1990 and the latest available year, 2012. As ghg emissions in 2012 were down by 18.3% for the EU27 and by 15.3% for the EU15, the 2020 target is within reach (data take account of the effect of the clean development mechanism, but values for 2012 are still preliminary). Although Europe will thus meet the 2020 target of reducing greenhouse gas emissions by 20% compared to the level of emissions in the reference year, there is actually no reason for satisfaction. As Figure 8.1 shows, substantial reductions over the years were correlating with decreasing output, whether on account of the transformation crisis in central-eastern Europe and eastern Germany in the early nineties, or of the great recession triggered by the financial crisis in 2008 and 2009. In the upward turn of the double-dip recession in 2010 ghg emissions were growing by 2-3% for the EU15 and the EU27 respectively. In the next two years, stagnation and recession
Greening through recession
8.Where is all that green investment?
Greenhouse-gas emissions in Europe
Figure 8.1 Greenhouse gas emissions as percentage of emissions in the base year 1990
Source: EEA dataservice (2013). Note: EU15 and EU27 values for 2012 are preliminary.
95,7
89,384,790,7
85,72
81,28
55
60
65
70
75
80
85
90
95
100
105
1990 1991 1992 1993 1994 1995 1996 1997 1998 1999 2000 2001 2002 2003 2004 2005 2006 2007 2008 2009 2010 2011 2012
EU15
EU27
2020target
2030target
114

In the United States, a switch from coal to gas in power generation helped reduce emissions by 200 million tonnes (Mt), bringing them back down to the level of the mid-1990s.
The American economy performed better than Europe in 2012, growing at 2.2% year-on-year. Yet CO2 emissions fell faster in the US than in Europe – by 3.8%.
Due to the controversial shale gas boom a large-scale shift from coal to natural gas in the power sector reduced the carbon-intensity of the American economy by 5.9%, which was more than enough to offset stronger GDP growth. As Figure 8.2 shows, US CO2 emissions are now 11.7% below 2005 levels, not far behind Europe’s 13.4%, although Europe had been the unquestioned forerunner in emission reductions during the previous period (Houser 2013).
When comparing the achieve-ments in CO2 reductions by the US and Europe in two different periods – 1990 to
low of 33% in April 2013, and electricity demand is growing due to continued eco-nomic recovery and colder weather than in 2012. US CO2 emissions were up by 1.5% during the first two months of 2013 (EIA 2014).
As for Europe, given the significant drop in emissions in the last two years, EU ETS allowances are trading at very low prices, creating room for coal to gain back market shares in Europe as well. Oil demand will continue to decline, which will limit the impact of increased coal consumption on total emissions. The net effect is likely to be a very modest decline in EU emissions in 2013, if there is a decline at all.
The apparent success of the US in cutting emissions and catching up with Europe in the last decade is clearly not a sustainable way of decarbonising the economy. Nor is it a model. It nonethe-less delivers lessons for Europe on how to strengthen its climate-change policy strategy.
2005 and post 2005 – a sharp contrast appears, as Figure 8.2 illustrates.
The US, which did not sign the Kyoto Protocol for emission reductions commitments, had been the clear laggard in reducing CO2 emissions between 1990 and 2005. In fact, CO2 emissions in the US grew by 18.6% in those 15 years, while Europe still achieved a modest decrease of 3.1%. Figure 8.2 shows that the US still has an emission increase of 6.9% for the entire period, while Europe achieved a reduction of 16.5%. It should be noted also that per capita ghg emissions are twice as high in the US as in Europe, as is per capita energy intensity as shown in the next pages. The trends from 2005 show, even so, a sharp turn in favour of the US such that in 2012 the US actually outperformed Europe.
It is true that the background of the US CO2 reductions is the controversial boom in shale gas extraction. The tech-nology is widely disputed and carries serious environmental risks. Moreover, placing greater stakes on fossil fuel, even if gas and oil are ‘cleaner’ than coal, is not a sustainable solution.
The impressive decline in US emis-sions in 2012 will also turn out to be short-lived in the absence of new policy either on federal or state level. Coal has already clawed its way back into the power sector due to rising natural gas prices. Coal’s share of US power gen-eration is back at 40%, after falling to a
Two ways to achieve a non-sustainable reduction of emissions
8.Where is all that green investment?
Greenhouse-gas emissions: Europe and the US
Figure 8.2 Change in CO2 emissions, US versus EU, %
Source: EPA, EEA, EIA, Eurostat and Rhodium Group estimates.
6,9
-11,7
-3,8
-16,5-13,4
-2,1
-20
-15
-10
-5
0
5
10
2012/1990 2012/2005 2012/2011
US EU27
115

Global clean energy investment has fallen substantially for the second year in 2013 according to data from Bloomberg New Energy Foundation (BNEF 2013).
The third quarter’s decline in in -vestment will push the year’s overall investment in renewable energy and energy-smart technologies down below 2012’s $281 billion, an investment value that was itself 11% down on the record established in 2011.
The latest setback reflects policy uncertainty in Europe, the lure of cheap gas in the US, a levelling-off in wind and solar investment in China, and a gen-eral weakening of political will in major economies.
The collapse in clean energy invest-ment is most spectacular in Europe. Figure 8.3 shows that when compared to the investment peak in 2011, a major setback of almost 30% occurred in 2012. The negative trend seems to be continu-ing, if not accelerating. Data available for the first three quarters of 2013 indicate
by 5.2%, coal input to power genera-tion grew by only 1.2%. As a result the energy intensity of the Chinese economy decreased by 13.5% between 2006 and 2012.
that as much as a 50% drop in investment compared to 2011 can be expected.
Figure 8.4 shows the changing shares in global clean energy investment of developed and developing economies. Before 2006 developed industrialised countries accounted for three to four times the clean energy investment made by developing countries. Between 2008 and 2011 the lead of developed countries had been reduced to a factor of two. Data for the last fully available year in 2012 show a substantial narrowing of the gap. Preliminary results for 2013 indicate that this will be the year when developing countries catch up with the investment level achieved by developed economies.
This clearly indicates that Europe (which accounts for the largest drop in clean energy investment in the last years and is thus responsible for the bulk of the drop for the developed country group) is losing ground rapidly.
Even if it is China that made the largest contribution to the global increase in greenhouse-gas emissions, with its emissions rising by 300 Mt, or 3.8%, this level of growth is one of the smallest in the past decade and less than half of the increase in emissions in 2011. This indi-cates the progress achieved by China in terms of climate policy, reflecting above all Chinese efforts to install low-carbon generating capacity and achieve improve-ments in energy intensity. While total electricity generation in China increased
Collapsing European investment in renewables
8.Where is all that green investment?
Clean energy investments
Figure 8.3 New investments in renewable energy (USD bn)
Source: BNEF (2013 and 2014).
0
20
40
60
80
100
120
2004 2005 2006 2007 2008 2009 2010 2011 2012 2013
US China EU27
116

Not only is Europe losing its climate pol-icy and decarbonisation leadership in the world, as Figures 8.3 and 8.4 show, but it is lagging behind its own commitments as well.
With regard to its 2050 targets, there is a yearly investment gap of nearly €300 bn. As a result of calculations by the European Investment Bank (EIB), compared to investment levels in 2011 an additional investment of €220 billion to €380 billion per year is needed to move the EU economy on to a path that would double emission reductions in order to fulfil the 2050 climate policy targets. This additional need for investment adds up to between 1.2 and 2.1% of EU GDP (Kolev et al. 2012).
The EIB study also highlights that investment directly aimed at energy savings is projected to account for some 60-70% of the additional investment needed to accelerate the decarbonisa-tion of the EU economy. It also shows that the difference between the most and the least capital-intensive scenarios is almost entirely due to investment in
sector grew by nearly 30% and that of the services sector by over 40%.
The household sector which, with 26%, has a higher share in energy con-sumption than industry has also seen an increase in its energy consumption amounting to 12.5%. This indicates that, although energy-efficiency investment like insulating and retrofitting buildings is high on the European agenda (and a number of member states have launched promising programmes), the results so far are modest.
Given these facts and the chronic underinvestment in European econo-mies that is the major reason behind the stagnating economy, one may won-der why European leaders are still not capable of launching the investment pro-gramme that is actually underpinned by the Europe 2020 Strategy.
energy savings. This reveals that the most capital-intensive decarbonisation path is the one that envisages a greater role for energy savings than alternative scenarios, which rely more on renewa-bles, carbon capture and storage, or nuclear energy.
On the one hand, investment in energy saving, such as retrofitting build-ings, is expected to make up the bulk of the investment required to decarbonise the economy. Here Europe clearly has a huge investment need. On the other hand, Europe is lagging most seriously behind its own EU2020 targets in improvements in energy efficiency. Figure 8.5 shows that final energy consumption in the EU27 had grown by over 7% between 1990 and 2010. Per capita energy intensity in 2010 was 2.3 tonne oil equivalent (toe) in the EU27 and 4.2 toe in the US, while China, with its lower development and consump-tion level, had a per capita energy use of 1.1 toe. The world average in 2010 was 1.2 toe (EEA 2013).
Figure 8.5 also shows final energy consumption and its change by economic sector for the EU27. Industry, with a 25% share in energy consumption, was the only major economic sector to achieve a reduction in energy consumption and, at 20%, this is also quite substantial (agriculture, which achieved a similar percentage reduction, has a low share in total emissions). On the other hand, the energy consumption of the transport
Europe falling also behind its own targets
8.Where is all that green investment?
Clean energy investments
Figure 8.4 New investments in renewable energy (USD bn)
Source: BNEF (2013).
0
20
40
60
80
100
120
140
160
180
200
2004 2005 2006 2007 2008 2009 2010 2011 2012
developing countries developed countries
117

8.Where is all that green investment?
118
Between 1990 and 2010 final energy con-sumption has increased by over 7% in the EU27 and the household sector had a large share in this, as Figure 8.5 shows.
While industry has managed to reduce energy consumption by 20% in that period, it increased by 12% in the
for the Euro area), the construction sec-tor in this period lost 38% of its employ-ees in Spain, nearly 35% in Portugal and 23% in Greece. Stepping up investment for the retrofitting of buildings would induce growth, create jobs, improve fuel poverty, as well as benefitting the environment.
household sector. At the same time per capita energy intensity in the EU27 grew by 31.9% (EEA 2013). Lack of progress in energy efficiency is itself a strong argu-ment for more investment in energy-sav-ing, such as building retrofitting.
Figure 8.6 delivers another argu-ment. As is well known, the construction sector had been the hardest hit by crisis when the real estate bubble burst in a num-ber of countries. Employment losses in this sector have also been among the highest.
While employment losses since 2010 in the EU27 were nearly 10% (13%
The investment rationale
Figure 8.5 Final energy consumption by sector
Source: EEA (2013).
Fishing, Agriculture &Forestry and non-specified
Industry Households Transport Services-30
-20
-10
0
10
20
30
40
50share 2010, % change 1990-2010, %
Figure 8.6 Index of employment in construction industry, 2013 Q2 (in %, 2010=100,0)
Source: Eurostat (2014).
50
60
70
80
90
100
110
120
130
ES PT CY SI BG GR HR MT EA17
NL SK EU28
CZ IE HU LU UK FR DK PL FI DE LT RO AT EE SE LV
Two birds with one stone

8.Where is all that green investment?
119
Figure 8.8 Utility bill arrears in % of total population, 2007 and 2012
0
5
10
15
20
25
30
35
LU NL DE DK SE AT CZ SK PT BE FR ES EU15
FI UK MT EU27
EE IT LT PL IE NM12
CY SI LV HU HR BG RO GR
2007 2012
Source: Eurostat (2013). Note: AT and IE 2012 data are from 2011; HR (2007) no data.
Fuel poverty, defined as the share of the population unable to heat the home adequately (a major indicator of mate-rial deprivation), has reached alarmingly high levels in a number of member states. What is more, there is a growing division among member states in this respect.
Figure 8.7 shows fuel poverty rates in EU member states for 2007 and 2012
Figure 8.8 shows utility bill arrears by member state for 2007 and 2012. NMS once again have higher levels (13.3% for 2007 and 18% for 2012) than EU15 coun-tries (5.7% for 2007 and 7.6% for 2012), but for this indicator both country groups show an increasing trend. The worst situation is in Greece where utility bill arrears have doubled since 2007 to reach the highest level in any EU member state, namely 31.8%, in 2012. The worsening of the situation is most dramatic in Roma-nia, where arrears rose from 8.3% in 2007 to 28.3% in 2012.
based on EU SILC data. Fuel poverty is characteristically higher in the new member states (NMS) than in the EU15; in the former 23.8% and in the latter 9.5% of the population were affected in 2007.
By 2012 fuel poverty in Greece and Italy had doubled as a result of the crisis and austerity policies.
Utility bill arrears, i.e. the share of the population who delay more than three months in paying their bills, shows an alarmingly increasing trend in most EU member states.
Divided Europe
Social implications: fuel poverty and utility bill arrears
Figure 8.7 Fuel poverty in the EU: share of the population unable to keep the home warm (%)
0
10
20
30
40
50
60
70
LU SE FI NL AT DK EE DE SK FR SI BE CZ IE UK ES EU15
HR EU27
PL HU RO NM12
LV IT MT GR PT CY LT BG
2007 2012
Source: Eurostat (2013). Note: AT and IE 2012 data are from 2011; HR (2007) no data.

8.Where is all that green investment?
poverty and utility bill arrears have dou-bled since 2007 and in Bulgaria 46% of the population suffers from fuel poverty.
Beside their dramatic social impact, current European policies also put energy transformation efforts at risk, as the lack of affordable utility ser-vice prices is often associated in people’s minds with the promotion by the author-ities of renewable energy generation. Proper social policy measures, including social tariffs for energy, are needed to redress this inequality and at the same time reverse the diminishing public sup-port for the energy transition.
What is most essential of all, how-ever, is investment in clean energy and energy efficiency.
There is nothing at all new here: the need for investment is a clear con-sequence of policy targets identified and defined long ago. The dividend, were these policies to be seriously promoted, would be higher growth and employment creation, a higher probability of fulfilling long-term climate policy commitments and a greater degree of social justice. The only question is why this is not happen-ing, why such vitally necessary policies are not being wholeheartedly pursued.
sectoral breakdown showed that, among the major sectors, industry alone made a substantial contribution to energy effi-ciency improvement (20% lower energy consumption). Services and trans-port were the laggards (by 41 and 30% increase respectively) but the household sector also performed poorly (a 12 % increase in energy consumption).
This trend makes one wonder where are the effects of energy saving investment, above all in insulation and retrofitting of buildings. Both the ETUC Investment Plan and iAGS report by the OFCE-IMK-ECLM research consortium argue for more green investment. Yet one needs to look no further than the mid-term EU climate policy objectives, the EU2020 Strategy and Commission docu-ments like the Energy Roadmap 2050, to see that the need for green investment had already been established. This chap-ter also refers to an EIB-Bruegel report containing calculations that Europe’s own climate policy objectives determine the need for additional annual invest-ment of between 1.2 and 2.1% of EU27 GDP (or between €220 and €380 billion) compared to the current (2011) invest-ment level. A major part of this invest-ment should be devoted to energy-saving measures.
This additional investment would help to give a kick to the anaemic Euro-pean economy and set it on a sustainable growth trajectory. The employment-crea-tion effect of such investment would also be crucial. This chapter also indicated that it is precisely the construction indus-try, which suffered the highest employ-ment losses during the crisis of up to 38%, that would benefit from a dynamic investment programme in energy saving. This form of investment also has a guar-anteed return and, given the low interest rate environment, the requisite financing background is also present.
A further aspect that we have emphasised in this chapter is the case of just transition. For trade unions this is a key issue. We showed the alarming trends in fuel poverty and the inability of a large section of the population to pay utility bills given the adverse effects of austerity policies and the lack of social policy intervention. In Greece both fuel
Europe has laid claim to a leading role in climate policy and decarbonisation of its economy.
We have shown that, even if green-house-gas emissions in Europe have decreased substantially and the 2020 target will be reached, to a great extent this is due to the weak performance of the European economy, while other regions of the world can boast simulta-neously higher emission reductions and higher growth. Europe is also the main laggard in clean energy investment over recent years and 2013 is the first year when developing countries (non-OECD) would appear to have overtaken the developed ones (OECD) in terms of clean energy investment. These two trends would seem to indicate that Europe’s self-proclaimed climate policy leadership – its assumption of some kind of excep-tional status – is over and that attitudes like ‘more ambitious climate targets if others do more’ are no longer justified. Europe thus needs to make more sus-tained climate policy efforts and such efforts should be apparent in the 2030 climate policy targets. Besides establish-ing a solid and comprehensive climate policy framework that is also linked to an industrial policy strategy, the major aim of this chapter has been to argue for a much higher degree of green investment.
The rationale of our argument was built up as follows. Clean energy invest-ment is at a historical low and progress in energy efficiency – one of the key ele-ments of a decarbonisation path – is extremely modest. In this context, we showed that between 1990 and 2010 the EU27 final energy consumption grew by 7%, that ghg emission reductions were achieved by a mix of low growth/reces-sion and some minor contribution from the effect of positive changes in the energy mix, energy efficiency improve-ments playing only a marginal role. The
An appeal for green investment with a triple dividend
Conclusions
120

References
Introduction
Boyer R. (2013) The institutional and political crisis of the European Union and some ways for overcoming it, Perspectives on Europe, 43 (1), Spring 2013, 64-71.
European Commission (2013) State aid scoreboard 2013. http://ec.europa.eu/competition/state_aid/scoreboard/financial_economic_crisis_aid_en.html
De Grauwe P. (2011) The governance of a fragile eurozone, Working Document No. 346, Brussels, The Centre for European Policy Studies.
ETUC (2013) A new path for Europe: ETUC plan for investment, sustainable growth and quality jobs. http://www.etuc.org/a/11715
ETUC (2014) The functioning of the Troïka: a report from the ETUC, 27 January 2014. http://www.etuc.org/sites/www.etuc.org/files/press-release/files/the_functioning_of_the_troika_finaledit2.pdf
Faujas A. (2010) La boîte à idées planétaire de Dominique Strauss-Kahn, Le Monde, 9 March 2010.
Giles C. (2013) IMF warns on threat of income inequality, Financial Times, 19 January 2013.
HSBC (2009) A climate for recovery. The colour of stimulus goes green, HSBC Global Research, 25 February 2009.
IMF (2011) Global financial stability report: grappling with crisis legacies, Washington, D.C., International Monetary Fund. http://www.imf.org/external/pubs/ft/gfsr/2011/02/pdf/text.pdf
IMF (2012) Global recovery stalls, downside risks intensify, World Economic Outlook Update, Press release, 24 January 2012.
Kloeck A. (2014) Implicit subsidies in the EU banking sector. An intermediary report which is part of the forthcoming study “Banking structural reforms: a Green perspective”, Brussels, The Greens / European Free Alliance in the European Parliament.
Le Monde (2008) Le FMI souhaite des plans de relance plus ambitieux, 24 December 2008.
Reinhart C.M. and Rogoff K.S. (2013) Financial and sovereign debt crises: some lessons learned and those forgotten, Working Paper WP/13/266, Washington, D.C., International Monetary Fund.
Watt A. (2009) A quantum of solace? An assessment of fiscal stimulus packages by EU Member States in response to the economic crisis, Working paper 2009.05, Brussels, ETUI. http://www.etui.org/Publications2/Working-Papers/A-quantum-of-solace-An-assessment-of-fiscal-stimulus-packages-by-EU-Member-States-in-response-to-the-economic-crisis
Wolf M. (2014) Failing elites threaten our future, Financial Times, 14 January 2014.
1. Europe five years into crisis: investment not austerity as the way out
Blanchard O., Griffiths M. and Gruss B. (2013) Boom, bust, recovery: forensics of the Latvia crisis, paper presented at the Fall 2013 Brookings Panel on Economic Activity, Brookings, Washington, D.C., 19-20 September 2013.
Blanchard O. and Leigh D. (2013) Growth forecast errors and fiscal multipliers, Working Paper WP/13/1, Washington, D.C., International Monetary Fund. http://www.imf.org/external/pubs/ft/wp/2013/wp1301.pdf
ECB (2013) Monthly Bulletin, July 2013, Frankfurt am Main, European Central Bank.
European Commission (2010) European Economic Forecast - Autumn 2010, European Economy 7/2010, Luxembourg, Publications Office of the European Union. http://ec.europa.eu/economy_finance/publications/european_economy/2010/pdf/ee-2010-7_en.pdf
European Commission (2013) European Economic Forecast - Autumn 2013, European Economy 7/2013, Luxembourg, Publications Office of the European Union. http://ec.europa.eu/economy_finance/publications/european_economy/2013/pdf/ee7_en.pdf
Rehn O. (2013) Remarks by Vice-President Olli Rehn at the Eurogroup press conference, European Commission - SPEECH/13/701, 13 September 2013. http://europa.eu/rapid/press-release_SPEECH-13-701_en.htm
2. Crisis takes its toll: disentangling five years of labour market developments
Autor D.H., Katz L.F. and Kearney M.S. (2006) The polarization of the U.S. labor market, American Economic Review, 96 (2), 189-194.
Blanchflower D.G. (2010) The wellbeing of the young, Hanover, NH, Dartmouth College. http://www.dartmouth.edu/~blnchflr/papers/bjir%20youth%20attitudes%20draft.pdf
Cockx B. and Picchio M. (2011) Scarring effects of remaining unemployed for long-term unemployed school-leavers, IZA Discussion Paper No. 5937, Bonn, Institute for the Study of Labor.
ETUC and ETUI (2012) Benchmarking working Europe 2012, Brussels, ETUI.
European Commission (2012) Proposal for a Council Recommendation on establishing a youth guarantee, COM(2012) 729 final, 5 December 2012.
European Council (2013) European Council 7/8 February 2013, Conclusions Multiannual Financial Framework, Brussels.
References
121

122
References
Eurostat (2013) Education and training, Eurostat reference to the dataset edat_lfse_18. http://epp.eurostat.ec.europa.eu/portal/page/portal/product_details/dataset?p_product_code=EDAT_LFSE_18.
Gash V. and Inanc H. (2013) Job insecurity and the peripheral workforce, in Duncan G. (ed.) Economic crisis, quality of work, and social integration, Oxford, Oxford University Press, 142-168.
Holst H. and Dörre K. (2013) Revival of the ‘German Model’? Destandardization and the new labour market regime, in Koch M. and Fritz M. (eds.) Non-standard employment in Europe. Paradigms, prevalence and policy responses, Basingstoke, Palgrave Macmillan, 132-149.
Horemans J. and Marx I. (2013) In-work poverty in times of crisis: do part-timers fare worse?, ImPRovE Working Papers No. 13/14, Antwerp, University of Antwerp.
Hurley J., Fernández-Macías E. and Storrie D. (2013) Employment polarisation and job quality in the crisis, European jobs monitor 2013, Dublin, Eurofound.
Karamessini M. and Rubery J. (eds.) (2013) Women and austerity: the economic crisis and the future for gender equality, London, Routledge.
Lefresne F. (2003) Les jeunes et l’emploi, Paris, La Découverte.
Leschke J., Theodoropoulou S. and Watt A. (2012) How do economic governance reforms and austerity measures affect inclusive growth as formulated in the Europe 2020 Strategy?, in Lehndorff S. (ed.) A triumph of failed ideas: European models of capitalism in the crisis, Brussels, ETUI, 243-281.
Mascherini M. et al. (2012) NEETs - Young people not in employment, education or training: characteristics, costs and policy responses in Europe, Luxembourg, Publications Office of the European Union. http://www.eurofound.europa.eu/publications/htmlfiles/ef1254.htm
O’Higgins N. (2012) This time it’s different? Youth labour markets during ‘the Great Recession’, IZA Discussion Paper No. 6434, Bonn, Institute for the Study of Labor. http://nbn-resolving.de/urn:nbn:de:101:1-201207125679
Scarpetta S., Sonnet A. and Manfredi T. (2010) Rising youth unemployment during the crisis: how to prevent negative long-term consequences on a generation, Social, Employment and Migration Working Papers No. 106, Paris, Organisation for Economic Co-operation and Development.
Smith M. et al. (2013) Women, men and working conditions in Europe, Luxembourg, Publications Office of the European Union.
Walling A. and Clancy G. (2010) Underemployment in the UK labour market, Economic and Labour Market Review, 4 (2), 16-24.
3. Developments in inequality and social protection in Europe
Degryse C., Jepsen M. and Pochet P. (2013) The Euro crisis and its impact on national and European social policies, Working Paper 2013.05, Brussels, ETUI. http://www.etui.org/Publications2/Working-Papers/The-Euro-crisis-and-its-impact-on-national-and-European-social-policies
ETUC and ETUI (2009) Benchmarking working Europe 2009, Brussels, ETUI.
European Commission (2010) The European platform against poverty and social exclusion: a European framework for social and territorial cohesion, COM(2010) 758 final, 16 December 2010.
Eurostat (2014a) ESSPROS. Eurostat. http://epp.eurostat.ec.europa.eu/portal/page/portal/social_protection/introduction
Eurostat (2014b) EU-SILC database. http://epp.eurostat.ec.europa.eu/portal/page/portal/income_social_inclusion_living_conditions/introduction
Matsaganis M. (2011) Social policy at hard times: economic crisis, fiscal austerity and social protection, Athens, Kritiki Publishing. [in Greek]
Matsaganis M. (2013) Benefits in kind and in cash, in Greve B. (ed.) The Routledge handbook of the welfare state, London, Routledge, 84-93.
Pontieux S. (2010) In-work poverty in the EU, Eurostat Methodologies and Working Papers 2010 edition, Luxembourg, Publications Office of the European Union.
Stockhammer E. (2012) Rising inequality as a root cause of the present crisis, Working Paper Series No. 282, Amherst, MA, Political Economy Research Institute.
4. Deregulation of labour law at any price
Clauwaert S. and Schömann I. (2012) The crisis and national labour law reforms: a mapping exercise, Working Paper 2012.04, Brussels, ETUI. http://www.etui.org/Publications2/Working-Papers/The-crisis-and-national-labour-law-reforms-a-mapping-exercise
Clauwaert S. (2013) The country-specific recommendations (CSRs) in the social field. An overview and initial comparison, Background analysis 2013.02, Brussels, ETUI. http://www.etui.org/Publications2/Background-analysis/The-country-specific-recommendations-CSRs-in-the-social-field
Council of Europe (2011) European Social Charter: the collective complaint procedure, cases 65/2011 and 66/2011. http://www.coe.int/t/dghl/monitoring/socialcharter/Complaints/Complaints_en.asp
References

References
Council of Europe (2012) European Social Charter: the collective complaint procedure, cases 76/2012 to 80/2012. http://www.coe.int/t/dghl/monitoring/socialcharter/Complaints/Complaints_en.asp
European Commission (2010) Communication from the Commission, Europe 2020: a strategy for smart, sustainable and inclusive growth, COM(2010) 2020 final, 3 March 2010.
European Commission (2013a) Commission Staff Working Document, Regulatory Fitness and Performance Programme (REFIT): initial results of the mapping of the acquis, SWD(2013) 401 final, 1 August 2013.
European Commission (2013b) Communication from the Commission to the European Parliament, the Council, the European Economic and Social Committee and the Committee of the Regions, Regulatory Fitness and Performance (REFIT): results and next steps, COM(2013) 685 final, 2 October 2013.
European Commission (2013c) Industrial relations in Europe 2012, Luxembourg, Publications Office of the European Union. http://ec.europa.eu/social/main.jsp?catId=738&langId=en&pubId=7498
European Parliament (2013) Enquiry report on the role and operations of the Troika (ECB, Commission and IMF) with regard to the euro area programme countries, 2013/2277/INI, 17 December 2013.
Fischer-Lescano A. (2013) Austeritätspolitik und Menschenrechte: Rechtspflichten der Unionsorgane beim Abschluss von Memoranda of Understanding, Wien, Kammer für Arbeiter und Angestellte für Wien. http://wien.arbeiterkammer.at/service/studien/eu/Austeritaetspolitik_und_Menschenrechte.html
European Parliament, Council of Europe and European Commission (2002) Interinstitutional agreement of 28 November 2001 on a more structured use of the recasting technique for legal acts, Official Journal of the European Union, C 77, 28 March 2002.
ILO (2011) Memorandum of technical comments on the draft labour code of Hungary, Geneva, International Labour Office.
Lang C., Schömann I. and Clauwaert S. (2013a) Atypical forms of employment contracts in times of crisis, Working Paper 2013.03, Brussels, ETUI. http://www.etui.org/Publications2/Working-Papers/Atypical-forms-of-employment-contracts-in-times-of-crisis
Lang C., Clauwaert S. and Schömann I. (2013b) Working time reforms in times of crisis, Working Paper 2013.04, Brussels, ETUI. http://www.etui.org/Publications2/Working-Papers/Working-time-reforms-in-times-of-crisis
Muller A. (2011) Employment protection legislation tested by the economic crisis. A global review of the regulation of collective dismissals for economic reasons, Dialogue in Brief No. 3, Geneva, International Labour Office.
OECD (2013) Protecting jobs, enhancing flexibility: a new look at employment protection legislation, in OECD Employment Outlook 2013, Paris, Organisation for Economic Co-operation and Development, 65-126.
Van Malleghem P.-A. (2013) A paradigm shift in the European Union’s monetary constitution, German Law Journal, 14 (1), 142- 168.
Vaughan-Whitehead D. (ed.) (2013) Public sector shock. The impact of policy retrenchment in Europe, Cheltenham, Edward Elgar.
5. Half a decade of pressure on wages and collective bargaining
Addison J.T. et al. (2010) The state of collective bargaining and worker representation in Germany: the erosion continues, IZA Discussion paper No. 5030, Bonn, Institute for the Study of Labor.
Baccaro L. and Howell C. (2011) A common neoliberal trajectory: the transformation of industrial relations in advanced capitalism, Politics & Society, 39 (4), 521-563.
Bach S. and Bordogna L. (2013) Reframing public service employment relations: the impact of economic crisis and the new EU economic governance, European Journal of Industrial Relations, 19 (4), 279-294.
Bernaciak M. (2013) Social dialogue revival or ‘PR corporatism’? Negotiating anti-crisis measures in Poland and Bulgaria, Transfer, 19 (2), 239-251.
Blaziene I. (2012) Fresh uncertainty after resolution of teachers’ strike, EIROnline. http://eurofound.europa.eu/eiro/2012/10/articles/lt1210019i.htm
Blyth M. (2013) Austerity: the history of a dangerous idea, New York, Oxford University Press.
Campos Lima M. (2013) Portugal: dramatic decline in collective agreements and worker coverage, EIROnline. http://www.eurofound.europa.eu/eiro/2013/02/articles/pt1302029i.htm
Centraal Bureau voor de Statistiek (2012) Veel stakingsdagen in 2012. http://www.cbs.nl/nl-NL/menu/themas/arbeid-sociale-zekerheid/publicaties/artikelen/archief/2013/2013-3832-wm.htm
Clauwaert S. (2013) The country-specific recommendations (CSRs) in the social field: an overview and initial comparison, Background analysis 2013.02, Brussels, ETUI. http://www.etui.org/Publications2/Background-analysis/The-country-specific-recommendations-CSRs-in-the-social-field
Clegg H.A. (1976) Trade unionism under collective bargaining: a theory based on comparisons of six countries, Oxford, Blackwell.
References
123

References
Cziria L. (2013) Teachers strike over pay demand, EIROnline. http://www.eurofound.europa.eu/eiro/2012/11/articles/sk1211019i.htm
De Castro F., Salto M. and Steiner H. (2013) The gap between public and private wages: new evidence for the EU, Economic Papers No. 508, Brussels, European Commission.
Dribbusch H. (2014) Union membership holds up well, EIROline. http://www.eurofound.europa.eu/eiro/2013/04/articles/de1304019i.htm
ETUC (2012) Solidarity in the crisis and beyond: towards a coordinated European trade union approach to tackling social dumping, Discussion Note to the ETUC Winter School, Copenhagen, 7–8 February 2012, Brussels, ETUC.
ETUC and ETUI (2013) Benchmarking working Europe 2013, Brussels, ETUI.
European Commission (2011) Assessing the links between wage setting, competitiveness, and imbalances, Ares (2011) 666366. http://gesd.free.fr/epc666.pdf
European Commission (2012) Labour market developments in Europe 2012, European Economy 5/2012, Luxembourg, Publications Office of the European Union.
European Commission (2013) Industrial relations in Europe 2012, Luxembourg, Publications Office of the European Union. http://ec.europa.eu/social/main.jsp?catId=738&langId=de&pubId=7498
Feigl G. and Zuckerstätter S. (2012) Wettbewerbs(des)orientierung, Materialien zu Wirtschaft und Gesellschaft No. 117, Wien, Arbeitkammer Wien.
Fernández-Macías E. and Vacas-Soriano C. (2013) A coordinated EU minimum wage policy?, Draft version, Dublin, Eurofound. http://www.eurofound.europa.eu/docs/press/minimumwages/draftreport_minimumwage_21oct13.pdf
Friedman G. (2008) Reigniting the labor movement: restoring means to ends in a democratic labor movement, London, Routledge.
Hamann K., Johnston A. and Kelly J.E. (2013) The electoral consequences of general strikes in Western Europe, APSA 2013 Annual Meeting Paper, American Political Science Association. http://ssrn.com/abstract=2303140
Hein E. and Mundt M. (2013) Financialization, the financial and economic crisis, and the requirements and potentials for wage-led recovery, in Lavoie M. and Stockhammer E. (eds.) Wage-led growth: an equitable strategy for economic recovery, Basingstoke, Palgrave Macmillan, 153-186.
ILO (2012) Global wage report 2012/13: wages and equitable growth, Geneva, International Labour Office.
ILO (2013) Jobs, growth and social justice, Report of the Director-General, 9th European Regional Meeting, Oslo, 8-11 April 2013, Geneva, International Labour Office.
Janssen R. (2012) Minimum wages in Europe under pressure, Social Europe Journal. http://www.social-europe.eu/2012/10/minimum-wages-in-europe-under-pressure/
Janssen R. (2013a) Structural reforms – Be careful what you wish for!, Social Europe Journal. http://www.social-europe.eu/2013/11/structural-reforms-careful-wish/
Janssen R. (2013b) Internal wage devaluation – The IMF admits it does not work, Social Europe Journal. http://www.social-europe.eu/2013/12/internal-wage-devaluation/
Kampelmann S., Garnero A. and Rycx F. (2013) Minimum wages in Europe: does the diversity of systems lead to a diversity of outcomes?, Report No. 128, Brussels, ETUI. http://www.etui.org/Publications2/Reports/Minimum-wages-in-Europe-does-the-diversity-of-systems-lead-to-a-diversity-of-outcomes
Karnite R. (2013) Latvia: impact of the crisis on industrial relations, EIROnline. http://www.eurofound.europa.eu/eiro/studies/tn1301019s/lv1301019q.htm
Lavoie M. and Stockhammer E. (2012) Wage-led growth: concept, theories and policies, Conditions of work and employment series No. 41, Geneva, International Labour Office. http://www.ilo.org/wcmsp5/groups/public/---ed_protect/---protrav/---travail/documents/publication/wcms_192507.pdf
Lavoie M. and Stockhammer E. (eds.) (2013) Wage-led growth: an equitable strategy for economic recovery, Basingstoke, Palgrave Macmillan.
Lévesque C. and Murray G. (2010) Understanding union power: resources and capabilities for renewing union capacity, Transfer, 16 (3), 333-350.
Marx I., Marchal S. and Nolan B. (2012) Mind the gap: net incomes of minimum wage workers in the EU and the US, IZA Discussion Paper No. 6510, Bonn, Institute for the Study of Labor.
Merkel A. (2013) Rede von Bundeskanzlerin Merkel beim Jahrestreffen 2013 des World Economic Forum, Davos, 24 January 2013. http://www.bundeskanzlerin.de/ContentArchiv/DE/Archiv17/Reden/2013/01/2013-01-24-merkel-davos.html
Ministerio de Empleo y Seguridad Social (2013) Estadistica de convenios colectivos de trabajo - Avance Mensual 2013, Registrados hasta 30 de junio de 2013, Madrid. http://www.empleo.gob.es/estadisticas/cct/welcome.htm
References
124

References
Müller T. and Bernaciak M. (2013) European wages and collective bargaining under pressure, International Union Rights Journal, 20 (4), 17-19.
New York Times (2014) Editorial: the case for a higher minimum wage, 8 February 2014.
Oberndorfer L. (2013) Pakt(e) für Wettbewerbsfähigkeit als nächste Etappe in der Entdemokratisierung der Wirtschaftspolitik?, Infobrief EU & International No. 1, Wien, Arbeiterkammer Wien, 19-26.
OECD (2014) Minimum wages in per cent of median wage of full-time employees. https://stats.oecd.org/Index.aspx? DataSetCode=MIN2AVE
Osila L. (2012) Teachers strike over low pay, EIROline. http://www.eurofound.europa.eu/eiro/2012/02/articles/ee1202029i.htm
Rhein T. (2013) Deutsche Geringverdiener im europäischen Vergleich, IAB-Kurzbericht 15/2013, Nuremberg, Institute for Employment Research. http://doku.iab.de/kurzber/2013/kb1513.pdf
Schmalz S. and Weinmann N. (2013) Zwei Krisen, zwei Kampfzyklen: Gewerkschaftsproteste in Westeuropa im Vergleich, in Schmalz S. and Dörre K. (eds.) Comeback der Gewerkschaften? Machtressourcen, innovative Praktiken, internationale Perspektiven, Frankfurt, Campus Verlag, 76-98.
Schmitt J. (2012) Low-wage lessons, Washington, D.C., Center for Economic and Policy Research.
Schnabel C. (2013) Union membership and density: some (not so) stylized facts and challenges, European Journal of Industrial Relations, 19 (3), 255-272.
Schulten T. (2012a) European minimum wage policy: a concept for wage-led growth and fair wages in Europe, International Journal of Labour Research, 4 (1), 85-104.
Schulten T. (2012b) Stellenwert der Allgemeinverbindlicher-klärung für die Tarifvertragssysteme in Europa, WSI-Mitteilungen, 7, 485-495.
Schulten T. (2014a) Minimum wage regimes in Europe ... and what Germany can learn from them, Berlin, Friedrich-Ebert-Stiftung. http://library.fes.de/pdf-files/id-moe/10558.pdf
Schulten T. (2014b) WSI-Mindestlohnbericht 2014 – stagnierende Mindestlöhne, WSI-Mitteilungen, 2, 132-139.
Schulten T. and Müller T. (2013a) A new European interventionism? The impact of the new European economic governance on wages and collective bargaining, in Natali D. and Vanhercke B. (eds.) Social developments in the European Union 2012, Brussels, OSE and ETUI, 181-213.
Schulten T. and Müller T. (2013b) Ein neuer europäischer Interventionismus? Die Auswirkungen des neuen Systems der europäischen Economic Governance auf Löhne und Tarifpolitik, Wirtschaft und Gesellschaft, 39 (3), 291-321.
Shorter E. and Tilly C. (1974) Strikes in France, 1830-1968, London, Cambridge University Press.
Skledar S. (2012) Slovenia: agreement reached on austerity in the public sector, EIROnline. http://www.eurofound.europa.eu/eiro/2012/05/articles/si1205019i.htm
Soumeli E. (2012a) Industrial action in the construction sector, EIROnline. http://www.eurofound.europa.eu/eiro/2012/02/articles/cy1202039i.htm
Soumeli E. (2012b) Construction unions step up industrial action, EIROnline. http://www.eurofound.europa.eu/eiro/2012/11/articles/cy1211039i.htm
Traxler F., Blaschke S. and Kittel B. (2001) National labour relations in industrialized markets: a comparative study of institutions, change, and performance, Oxford, Oxford University Press.
Trif A. (2013) Romania: collective bargaining institutions under attack, Transfer, 19 (2), 227-237.
Vandaele K. (2011) Sustaining or abandoning ‘social peace’? Strike development and trends in Europe since the 1990s, Working paper 2011.05, Brussels, ETUI. http://www.etui.org/Publications2/Working-Papers/Sustaining-or-abandoning-social-peace
Vaughan-Whitehead D. (2013) Public sector shock in Europe: between structural reform and quantitative adjustment, in Vaughan-Whitehead D. (ed.) Public sector shock. The impact of policy retrenchment in Europe, Cheltenham, Edward Elgar, 1-42.
Veverková S. (2013) Czech Republic: minimum wage increase comes into effect, EIROnline. http://www.eurofound.europa.eu/eiro/2013/08/articles/cz1308019i.htm
Visser J. (2013) ICTWSS: database on institutional characteristics of trade unions, wage setting, state intervention and social pacts in 34 countries between 1960 and 2012, April 2013. http://www.uva-aias.net/207
6. Workers’ health and safety exposed to crisis
Alternatives économiques (2010) Souffrance au travail: un rapport accablant pour France Télécom, 287, 7.
ETUI (2012) Ex-France Telecom chief Lombard probed over suicides. http://www.etui.org/Topics/Health-Safety/News/Ex-France-Telecom-chief-Lombard-probed-over-suicides
References
125

References
European Commission (1988) Commission communication on its programme concerning safety, hygiene and health at work, Official Journal of the European Union, C 28, 3 February 1988.
European Commission (2013a) Communication from the Commission to the European Parliament, the Council, the European Economic and Social Committee and the Committee of the Regions, Regulatory Fitness and Performance (REFIT): results and next steps, COM(2013) 685 final, 2 October 2013.
European Commission (2013b) Evaluation of the European strategy on safety and health at work 2007-2012, Final report.
European Council (1978) Council resolution of 29 June 1978 on an action programme of the European commission on safety and health at work, Official Journal of the European Union, C 165, 11 July 1978.
ILO (2013) Protecting workplace safety and health in difficult economic times – The effect of the financial crisis and economic recession on occupational safety and health, Geneva, International Labour Office.
Kieffer C. (2013) What recognition of work-related mental disorders? A study on 10 European countries, Paris, EUROGIP.
László K.D. et al. (2010) Job insecurity and health: a study of 16 European countries, Social Science and Medicine, 70 (6), 867-74.
Lundin A. and Hemmingsson T. (2009) Unemployment and suicide, The Lancet, 374 (9686), 270-271.
Maynard A.D., Warheit D.B. and Philbert M.A. (2011) The new toxicology of sophisticated materials: nanotoxicology and beyond, Toxicological Sciences, 120 (Suppl 1), 109-129.
Parent-Thirion A. et al. (2012) Fifth European working conditions survey, Luxembourg, Publications Office of the European Union.
Quinlan M. and Bohle P. (2009) Overstretched and unreciprocated commitment: reviewing research on the occupational health and safety effects of downsizing and job insecurity, International Journal of Health Services, 39 (1), 1-44.
Quinlan M., Mayhew C. and Bohle P. (2001) The global expansion of precarious employment, work disorganization, and consequences for occupational health: a review of recent research, International Journal of Health Services, 31 (2), 335-414.
Rial González E., Cockburn W. and Irastorza X. (2010) European survey of enterprises on new and emerging risks: managing safety and health at work – ESENER, Bilbao, European Agency for Safety and Health at Work.
Sapelli G. (2010) Does work have a meaning? Basis for a positive work culture, La Medicina del Lavoro, 101 (Suppl 2), 7-10.
Schneider E. and Irastorza X. (2010) OSH in figures: work-related musculoskeletal disorders in the EU —Facts and figures, Bilbao, European Agency for Safety and Health at Work.
Spreeuwers D. et al. (2011) Work-related upper extremity disorders: one-year follow-up in an occupational diseases registry, International Archives of Occupational and Environmental Health, 84 (7), 789-796.
Van Gyes G. and Szekér L. (2013) Impact of the crisis on working conditions in Europe, Dublin, Eurofound.
7. Chipping away at workers’ participation rights
Bayer W. (2013) Grenzüberschreitende Verschmelzungen im Zeitraum 2007 bis 2012, Erstellt im Auftrag der Hans-Böckler-Stiftung. http://www.boeckler.de/pdf/mbf_2013_06_verschmelzungen_bayer.pdf
Bech-Bruun and Lexidale (2013) Study on the application of the cross-border mergers Directive. http://ec.europa.eu/internal_market/company/mergers/index_en.htm
CDP (2012) Global 500 climate change report 2012, London, Carbon Disclosure Project.
Centre for Strategy & Evaluation Services (2011) Disclosure of non-financial information by companies: final report for DG Internal Market and Services. http://ec.europa.eu/internal_market/accounting/docs/non-financial-reporting/com_2013_207-study_en.pdf
Conchon A. (2011) Board-level employee representation rights in Europe. Facts and trends, Report No. 121, Brussels, ETUI. http://www.etui.org/Publications2/Reports/Board-level-employee-representation-rights-in-Europe
Conchon A., Kluge N. and Stollt M. (2013) Comparative overview: worker board-level participation in the 31 European Economic Area countries, July 2013 update. http://bit.ly/1dYqThx
Cooke B. (2007) Multinational companies and global human resource strategy, in Boxall P., Purcell J. and Wright P. (eds.) The Oxford handbook of human resource management, New York, Oxford University Press, 489–508.
Cremers J. (2013) The EU assessment of the SE corporate form, in Cremers, J., Stollt M. and Vitols S.(eds.) A decade of experience with the European Company, Brussels, ETUI, 229-250.
References
126

References
References
Ernst & Young (2009) Study on the operation and the impacts of the statute for a European Company (SE) – 2008/S 144-192482, Final Report, 9 December. http://ec.europa.eu/internal_market/consultations/docs/2010/se/study_SE_9122009_en.pdf
ETUC (2008) ETUC Resolution on the European Workers Participation Fund, 15–16 October 2008, Annex 1: background document. http://www.etuc.org/a/5778
ETUC (2011) Resolution on workers participation at risk: towards better employee involvement, 7-8 December 2011. http://www.etuc.org/a/9425
ETUC (2013) Strengthening information, consultation and participation rights for all workers, 22-23 October 2013. http://www.etuc.org/a/11754
ETUC and ETUI (2013) Benchmarking working Europe 2013, Brussels, ETUI.
ETUI (2014) European Company (SE) Database – The online SE inventory of the ETUI. http://ecdb.worker-participation.eu
European Commission (2008a) Communication on the review of the application of Directive 2002/14/EC in the EU, COM (2008) 146 final, 17 March 2008.
European Commission (2008b) Staff working document accompanying the Communication from the Commission to the Council, the European Parliament, the European Economic and Social Committee and the Committee of the Regions on the review of the application of Directive 2002/14/EC in the EU, SEC(2008) 0334, 17 March 2008.
European Commission (2013) ‘Fitness check’ on EU law in the area of information and consultation of workers, SWD(2013) 293 final, 26 July 2013. http://eur-lex.europa.eu/LexUriServ/LexUriServ.do?uri=COM:2008:0146:FIN:EN:PDF
European Council (2010) Roadmap. Council Regulation modifying Regulation 2001/2157/EC on the statute for a European Company (SE). http://ec.europa.eu/smart-regulation/impact/planned_ia/docs/2010_markt_031_statute_for_a_european_company_se_en.pdf
Eurostat (2010a) Eurostat structural business statistics. http://epp.eurostat.ec.europa.eu/portal/page/portal/statistics/search_database
Eurostat (2010b) Employment. http://epp.eurostat.ec.europa.eu/statistics_explained/index.php?title=File:Number_of_persons_employed_by_enterprise_size_class,_non-financial_business_economy,_2010_A.png&filetimestamp=20130507105622
EWPCC (2013) Database of the European Workers’ Participation Competence Centre on employee board-level representatives in European Companies (SE). http://www.worker-participation.eu/About-WP/European-WP-Competence-Centre
Hojnik J. (2012) Sustainability reporting and the modernisation of EU accounting rules, in Vitols S. and Heuschmid J. (eds.) European company law and the sustainable company: a stakeholder approach. Vol. II, Brussels, ETUI, 287-318.ILO (2011) Memorandum of technical comments on the draft labour code of Hungary, Geneva, International Labour Office.
Jagodzinski R. (2009) Recast directive on European works councils: cosmetic surgery or substantial progress?, Industrial Relations Journal, 40 (6), 534-545.
Jagodzinski R. (2012) Transnational collective bargaining: a literature review, in Schömann I. et al. (eds.) Transnational collective bargaining at company leval. A new component of European industrial relations?, Brussels, ETUI, 19-76.
Jagodzinski R. (2014) “European Works Councils’ access to justice”. A study on the implementation of enforcement provisions in national transpositions of Directive 94/45/EC and Recast Directive 2009/38/EC, Brussels, ETUI. [Forthcoming]
Jagodzinski R., Kluge N. and Waddington J. (2008) Memorandum European Works Councils: recommendations for policy-making based on current experiences, Brussels, ETUI.
Keller B. and Werner F. (2008) The establishment of the European Company: the first cases from an industrial relations perspective, European Journal of Industrial Relations, 14 (2), 153–175.
Lakhani T., Kuruvilla S. and Avgar A. (2013) From the firm to the network: global value chains and employment relations theory, British Journal of Industrial Relations, 51 (3), 440–472.
Meyer K.E. (2006). Globalfocusing: from domestic conglomerates to global specialists, Journal of Management Studies, 43 (5), 1109–1144.
OECD (2012) Better skills, better jobs, better lives: a strategic approach to skills policies, Paris, Organisation for Economic Co-operation and Development.
Riedmann A. et al. (2010) European Company Survey 2009 - Overview, Luxembourg, Publications Office of the European Union.
Rose E. and Köstler R. (2014) Mitbestimmung in der Europäischen Aktiengesellschaft (SE). Betriebs- und Dienstvereinbarungen. Analyse und Handlungsempfehlungen, 2nd ed., Frankfurt am Main, Bund-Verlag.
Schömann I., Clauwaert S. and Warneck W. (2006) Information and consultation in the European Community, Report No. 97, Brussels, ETUI. http://www.etui.org/Publications2/Reports/Information-and-consultation-in-the-European-Community
127

References
References
UNCTAD (2013) World investment report 2013. Global value chains: investment and trade for development, Geneva, United Nations Conference on Trade and Development.
Van Klaveren M. and Tijdens K. (2013) Working in multinationals and domestic firms compared - myths and realities, Policy Brief 1/2013, Brussels, ETUI. http://www.etui.org/en/Publications2/Policy-Briefs/European-Economic-Employment-and-Social-Policy/Working-in-multinationals-and-domestic-firms-compared-myths-and-realities
Vitols S. (2013) European corporate governance. Is there an alternative to neo-liberalism?, in Schmidt V.A. and Thatcher M. (eds.) Resilient liberalism in Europe’s political economy, Cambridge, Cambridge University Press, 257-288.
Vitols S. and Kluge N. (eds.) (2011) The sustainable company: a new approach to corporate governance, Brussels, ETUI. http://www.etui.org/Publications2/Books/The-Sustainable-Company-a-new-approach-to-corporate-governance
Whittall M., Lücking S. and Trinczek R. (2008) Understanding the European Works Council deficit in German multinationals, Transfer, 14 (3), 453–467.
8. Where is all that green investment?
BNEF (2013) Global trends in renewable energy investment, New York, Bloomberg New Energy Finance. http://www.unep.org/pdf/GTR-UNEP-FS-BNEF2.pdf
EEA (2013) Total energy intensity, relative energy intensity (as PPS) and per capita consumption, Copenhagen, European Environment Agency. http://www.eea.europa.eu/data-and-maps/figures/total-energy-intensity-2
EIA (2014) Short-term energy outlook, Washington, D.C., U.S. Energy Information Administration. http://www.eia.gov/forecasts/steo/pdf/steo_full.pdf
ETUC and ETUI (2013) Benchmarking working Europe 2013, Brussels, ETUI.
European Commission (2012) Energy roadmap 2050, Luxembourg, Publications Office of the European Union. http://ec.europa.eu/energy/publications/doc/2012_energy_roadmap_2050_en.pdf
Houser T. (2013) Neck and neck: US and European GHG emissions trends, New York, Rhodium Group. http://rhg.com/notes/neck-and-neck-us-and-european-ghg-emissions-trends
IPCC (2013) Climate change 2013: the physical science basis, Fifth assessment report, Geneva, Intergovernmental Panel on Climate Change. http://www.climatechange2013.org/images/uploads/WGIAR5_WGI-12Doc2b_FinalDraft_TechnicalSummary.pdf
Kolev A. et al. (2012) Investment and growth in the time of climate change, Luxembourg, European Investment Bank. http://www.bruegel.org/publications/publication-detail/view/728/
OFCE, IMK and ECLM (2013) Independent annual growth survey 2014, Paris, Observatoire français des conjonctures économiques. http://www.progressiveeconomy.eu/sites/default/files/iAGS%202014.pdf
All web pages links were checked on 27 February 2014.
128

List of figures
List of figures
1. Europe five years into crisis: investment not austerity as the way out
Figure 1.1 Real GDP growth, EU27, EA, US, World ............14Figure 1.2 Percentage change in real GDP ...........................15Figure 1.3 Balance of payments current accounts ..............16Figure 1.4 Percentage changes in exports and imports,
2008-2013, 2005 prices ...................................... 17Figure 1.5 Percentage share of complex products in
selected countries’ exports, 2000-2012 .............18Figure 1.6 Private credit flow, percent of GDP, 2004-2012
and volume of private credit 2008 .....................19Figure 1.7 Central Bank policy rates, ECB, BoE,
2008-2013 .......................................................... 20Figure 1.8 Gross public debt as percent of GDP ..................21Figure 1.9 General government surplus as percent of
GDP, 2004-2013 ................................................. 22Figure 1.10 Gross fixed investment as % of GDP, 2008
and 2013 ............................................................. 23Figure 1.11 Results of Troika policies in three programme
countries, 2010-2013 ......................................... 24
2. Crisis takes its toll: disentangling five years of labour market developments
Figure 2.1 Developments in key employment indicators over the crisis, EU28 .......................................... 28
Figure 2.2 Unemployment rates EU 28 ............................... 29Figure 2.3 Developments in employment rates, 15-64 ....... 30Figure 2.4 Developments in unemployment rates, 15-64....31Figure 2.5 Change in total hours worked and in total
employment ........................................................ 32Figure 2.6 Job creation and destruction by working time
and gender, EU28 ............................................... 33Figure 2.7 Job creation and destruction by working time
and country ........................................................ 33Figure 2.8 Job creation and destruction by sector and age,
EU28 ................................................................... 34Figure 2.9 Job creation and destruction by occupation
and gender, EU28 ............................................... 35Figure 2.10 Part-time rate, change by occupation and
gender, EU28 ...................................................... 35Figure 2.11 Youth unemployment rate and absolute
numbers, 15-24 ................................................... 36Figure 2.12 Youth unemployment rate and absolute
numbers, 25-29 .................................................. 36Figure 2.13 Long-term unemployment among young
people aged 15-24 ............................................... 37Figure 2.14 Youth/adult unemployment ratio, 2003-2013 ... 38Figure 2.15 Developments in employment rates, ................ 39Figure 2.16 Developments in NEETs rates, 15-24,
by educational attainment, 2008-2012 ............. 40
Figure 2.17 Developments in NEETs rates, 25-29, by educational attainment, 2008-2012 ..............41
Figure 2.18 Population by employment and education and training status, 15-24, EU 28 ..................... 42
Figure 2.19 Population by employment and education and training status, 25-29, EU 28 ..................... 42
3. Developments in inequality and social protection in Europe
Figure 3.1 Income disparities: the Gini coefficient, EU27, 2008, 2012 ............................................... 46
Figure 3.2 Population at risk of poverty or social exclusion and population at risk of poverty, 2008, 2012, EU27 member states .......................................... 47
Figure 3.3 Population at risk of poverty or social exclusion by main activity status, EU27, 2008, 2012 ............................................... 48
Figure 3.4 People in work at risk of poverty by household type, EU27, 2008, 2012 ...................................... 49
Figure 3.5 In-work poverty by type of employment contract, working time arrangement and educational qualifications, EU27, 2008, 2012 .... 50
Figure 3.6 Unmet healthcare needs due to unaffordable services by labour market status ........................51
Figure 3.7 Public social expenditure per inhabitant in PPS, EU27, 2008, 2011 ................................................ 52
Figure 3.8 Targeting social protection: Means-tested benefits as % of total social benefits, EU27 member states, 2008, 2011 ................................ 53
Figure 3.9 Composition of spending in social protection: cash and in-kind benefits, EU27, 2008, 2011 .... 54
Figure 3.10 Efficiency of social protection systems in alleviating poverty in the EU27 member states, 2008, 2012 .......................................................... 55
Figure 3.11 Evolution of planned public social payments 2012-2016 and people at risk of poverty or social exclusion, 2011, EU27 member states ..... 56
4. Deregulation of labour law at any price
Figure 4.1 Different sources of reforms ..............................60Figure 4.2 Overview of the number of CSRs per country
compared to the ‘social’ CSRs for 2011-2012, 2012-2013 and 2013-2014 ...................................61
Figure 4.3 Announced and/or adopted changes to IR/CB systems and certain aspects of labour law ........ 62
Figure 4.4 Developmentof the number of social CSRs from 2011-2013 ................................................... 63
Figure 4.5 National trade union litigation actions ............... 65Figure 4.6 Trade union litigation actions at international
level ..................................................................... 66
129

List of figures
List of figures
5. Half a decade of pressure on wages and collective bargaining
Figure 5.1 New European wage policy interventionism .... 70Figure 5.2 Wage cuts and freezes in the public sector in
EU27, 2008-2013 ................................................71Figure 5.3 Compensation of public administration
employees, EU27, 2002–2007 and 2007-2011 .... 72Figure 5.4 Development of real hourly minimum wages
in EU28, 2007-2013 ........................................... 73Figure 5.5 Minimum wages in percent of median wage
of full-time employees, 2012 ...............................74Figure 5.6 Decentralisation of collective bargaining
systems in EU countries under EU, ECB and/or IMF surveillance .....................................75
Figure 5.7 Development of real wages in EU28, 2007-2009 .......................................................... 76
Figure 5.8 Development of real wages in EU28, 2009-2013 ...........................................................77
Figure 5.9 Collective bargaining coverage (%) and the proportion of low-wage earners, EU28 ............. 78
Figure 5.10 Union density per country (2006-2008 and 2009-2011) and per year (1991-2010) in EU27 ... 79
Figure 5.11 Relative strike volume per country (2005-2008 and 2009-2012) and per year (1991-2012) in selected EU member states ................................80
Figure 5.12 Strike waves in SEB- and MEB-systems, 2005-8 and 2009-12 ...........................................81
6. Workers’ health and safety exposed to crisis
Figure 6.1 Timeline of EU approach to the regulation of health and safety ................................................84
Figure 6.2 Expected impact of the economic crisis on health and safety - EU27 .................................... 85
Figure 6.3 The financial crisis and its potential impact on health and safety at work .............................. 86
Figure 6.4 Evolution of job insecurity during the crisis ..... 87Figure 6.5 Work-related stress during the crisis ................88Figure 6.6 Development of working conditions in the EU ... 89
7. Chipping away at workers’ participation rights
Figure 7.1 Forty years of EU legislation on information and consultation ............................................92-93
Figure 7.2 European Union initiatives pressuring (information and consultation) rights ............... 94
Figure 7.3 Worker representation and employment in Micro and SMEs in non-financial business ...... 95
Figure 7.4 Employment share of foreign-controlled enterprises, 2010 ................................................ 96
Figure 7.5 Evolution of number of EWCs and SE Works Councils with landmark events ......................... 97
Figure 7.6 Quality and diversity of EWC and SE Works Council agreements ............................................98
Figure 7.7 Occurrence of training provisions in EWC and SE works council agreements ..................... 99
Figure 7.8 Ratios of renegotiated to new European Works Council agreements .............................. 100
Figure 7.9 Minimum and maximum fines for breach of EWC regulations before and after implementation of the Recast EWC Directive in selected EU member states (€) (1) ......................................... 101
Figure 7.10 Minimum and maximum fines for breach of EWC regulations before and after implementation of the Recast EWC Directive in selected EU member states (€) (2) ........................................102
Figure 7.11 Workers’ board-level participation in the 31 European Economic Area countries ............103
Figure 7.12 Changes to rules or practice of board-level employee participation .................................... 104
Figure 7.13 If your company has restructured over the past two years, how influential were you on the process? .......................................................105
Figure 7.14 Geographical distribution of European Companies (SE) ................................................ 106
Figure 7.15 Nationality of workers’ representatives in SE boards ...........................................................107
Figure 7.16 Number of cross-border mergers per year ...... 108Figure 7.17 EU company law Directives passed ................. 109Figure 7.18 Companies with sustainability policies,
by type of worker representation ......................110Figure 7.19 Transparency of European companies on
sustainability policies ........................................111
8. Where is all that green investment?
Figure 8.1 Greenhouse gas emissions as percentage of emissions in the base year 1990 ....................... 114
Figure 8.2 Change in CO2 emissions, US versus EU ......... 115Figure 8.3 New investments in renewable energy ............. 116Figure 8.4 New investments in renewable energy ............. 117Figure 8.5 Final energy consumption by sector ................ 118Figure 8.6 Index of employment in construction industry,
2013 Q2 .............................................................. 118Figure 8.7 Fuel poverty in the EU: share of the population
unable to keep the home warm ......................... 119Figure 8.8 Utility bill arrears in % of total population,
2007 and 2012 ................................................... 119
130

List of abbreviations
List of abbreviations
AGS Annual Growth SurveyBLER board-level employee representationBNEF Bloomberg New Energy FoundationCB collective bargainingCBM cross-border mergerCBMD Cross-Border Mergers DirectiveCJEU Court of Justice of the European UnionCSR country-specific recommendationsCEE central and eastern EuropeanDG ECFIN Directorate General for Economic and Financial Affairs, European CommissionEC European CommissionECB European Central BankECJ European Court of JusticeECSR European Committee of Social RightsECtHR European Court of Human RightsEEA European Environment AgencyEFSF European Financial Stability FacilityEFSM European Financial Stability MechanismEIB European Investment BankESM European Stability MechanismESMT Treaty establishing the European Stability MechanismETS emission trading systemETUC European Trade Union ConfederationETUF European Trade Union FederationETUI European Trade Union InstituteEU-OSHA European Agency for Safety and Health at WorkEWC European Works CouncilEWCD European Works Council DirectiveEWPCC European Workers’ Participation Competence CentreGDP gross domestic productghg greenhouse gasesGRI Global Reporting InitiativeH&S health and safetyI&C information and consultationILO International Labour OrganisationIMF International Monetary FundIPCC International Panel of Climate ChangeIR industrial relationsISCED international standard classification of educationITUC International Trade Union ConfederationLRD Labour Research DepartmentMNC Multinational CompanyMt million tonnesMoU memorandum of understandingNACE Nomenclature Générale des Activités Economiques dans I’Union Européenne (General Classification for Economic Activities in the European Union)NEET people not in employment, education or trainingNMS new member statesNRP national reform programmeOECD Organisation for Economic Co-operation and DevelopmentOSH occupational safety and healthPPS purchasing power standardREFIT regulatory fitness and performance programmeSBA stand-by arrangementSE Societas Europaea (European Company)SEWC SE works councilSGP stability and growth programmeSITC standard international trade classificationSME small and medium enterprisesTEU Treaty on European Uniontoe tonne oil equivalentUN United NationsVAT value added taxWSI Wirtschafts- und Sozialwissenschaftliches Institut in der Hans-Böckler-Stiftung
131

The Benchmarking Group
The Benchmarking Group
ForewordBernadette Ségol, ETUC, General SecretaryMaria Jepsen, ETUI, Director of Research DepartmentPhilippe Pochet, ETUI, General Director
IntroductionHalf-way through a lost decade? Taking stock of five years of crisisChristophe Degryse (ETUI)
Chapter 1Europe five years into crisis: investment not austerity as the way outMartin Myant (ETUI)
Chapter 2Crisis takes its toll: disentangling five years of labour market developmentsAgnieszka Piasna and Margherita Bussi (ETUI)
Chapter 3Developments in inequality and social protection in Europe: halfway through a lost decade for inclusive growth?Sotiria Theodoropoulou and Maria Jepsen (ETUI)
Chapter 4Deregulation of labour law at any priceStefan Clauwaert and Isabelle Schömann (ETUI)
Chapter 5Half a decade of pressure on wages and collective bargainingMagdalena Bernaciak, Torsten Müller and Kurt Vandaele (ETUI)
Chapter 6Workers’ health and safety exposed to crisisVictor Kempa and Aída María Ponce del Castillo (ETUI)
Chapter 7Chipping away at workers’ participation rightsStefan Clauwaert, Aline Conchon, Jan Drahokoupil, Aline Hoffmann, Romuald Jagodzinski, Isabelle Schömann, Michael Stollt and Sigurt Vitols (ETUI)
Chapter 8Where is all that green investment?Béla Galgóczi (ETUI)
Torsten Müller, ETUI, editorKathleen Llanwarne, ETUI, language editor/translatorIrmgard Pas, ETUI, data-processing managerFabienne Depas, ETUI, documentation centreEric Van Heymbeeck, ETUI, layouter
For further informationwww.etuc.org www.etui.orgwww.labourline.org
132