Strategic environmental assessment and monitoring: Arctic key gaps and bridging pathways
Upload
khangminh22Category
view
3download
0
energies
Article
Review of Key Performance Indicators for ProcessMonitoring in the Mining Industry
Paulina Gackowiec 1,* , Marta Podobinska-Staniec 1 , Edyta Brzychczy 1 ,Christopher Kühlbach 2 and Toyga Özver 2
1 Faculty of Mining and Geoengineering, AGH University of Science and Technology, 30-059 Cracow, Poland;[email protected] (M.P.-S.); [email protected] (E.B.)
2 Talpasolutions GmbH, 45327 Essen, Germany; [email protected] (C.K.);[email protected] (T.Ö.)
* Correspondence: [email protected]
Received: 8 September 2020; Accepted: 2 October 2020; Published: 4 October 2020
Abstract: The sustainable development of an organisation requires a holistic approach to theevaluation of an enterprise’s goals and activities. The essential means enabling an organisation toachieve goals are business processes. Properly managed, business processes are a source of revenueand become an implementation of business strategy. The critical elements in process managementin an enterprise are process monitoring and control. It is therefore essential to identify the KeyPerformance Indicators (KPIs) that are relevant to the analysed processes. Process monitoring canbe performed at various levels of management, as well as from different perspectives: operational,financial, security, or maintenance. Some of the indicators known from other fields (such as personnelmanagement, finance, or lean manufacturing) can be used in mining. However, the operationalmining processes require a definition of specific indicators, especially in the context of increasing theproductivity of mining machines and the possibility of using sensor data from machines and devices.The article presents a list of efficiency indicators adjusted to the specifics and particular needs of themining industry resulting from the Industry 4.0 concept, as well as sustainable business performance.Using the conducted research and analysis, a list of indicators has been developed concerning persongroups, which may serve as a benchmark for mining industry entities. The presented proposal is aresult of work conducted in the SmartHUB project, which aims to create an Industrial Internet ofThings (IIoT) platform that will support process management in the mining industry.
Keywords: mining process; key performance indicators; process monitoring; mining industry;sustainable management
1. Introduction
In response to the constantly growing requirements of the business environment interms of the quality of provided products and the necessity to increase their competitiveness,companies are seeking methods and techniques for the continuous improvement of their processes.Currently, organisations have the opportunity to develop and improve their performance throughprogressive technological development and the dissemination of computer devices [1,2]. The presenttechnical conditions allow for the implementation of advanced technological solutions and providemore widespread access to the infrastructure that enables the acquisition of information directlyfrom industrial equipment. Data collection is the starting point for a comprehensive understandingof the processes and specifics of the utilised machines and, consequently, the implementation ofimprovements at all levels of management in the organisation.
Energies 2020, 13, 5169; doi:10.3390/en13195169 www.mdpi.com/journal/energies

Energies 2020, 13, 5169 2 of 20
In the context of the current industrial and digital transformation, the widely discussed termof Industry 4.0 has a significant role to play. Industry 4.0 is a concept that involves a variety oftechnological solutions and covers activities and measures affecting the entire industrial ecosystem [3]and may improve the policy of sustainable business development. The main assumptions of theIndustry 4.0 concept are exemplified in papers undertaken by [4–8]. An essential component ofIndustry 4.0 is the Internet of Things (IoT), which enables the integration of multiple devices into oneintegrated system, collecting data from the entire infrastructure and environment. The monitoringof various machines based on IoT systems is an invaluable source of knowledge about the process.With a view to the application of Industry 4.0 in mines, the concept of the Industrial Internet of Things(IIoT) is particularly important, bringing the assumptions of the Internet of Things to the field ofindustrial operations.
The implementation of the concept of Industry 4.0 marks the beginning of intensive industrialprogress and enables a new approach to the development of sustainable knowledge-based management.Sustainable development is a key factor determining the selection and deployment of appropriateprocess evaluation indicators, which can significantly affect not only the performance of the conductedoperations but also sustainable development from a business perspective. Technological development,enabling the acquisition of measurable process parameters, may be a starting point for makingreasonable decisions; properly managing resources; increasing the level of safety; and, as a result,improving the overall sustainable business performance in the mining industry.
Nevertheless, despite the considerable benefits and opportunities arising from the implementationof Industry 4.0, the potential for implementing emerging technologies often remains unexploited,and sensor-based information is rarely fully used to support decision-making systems. These challengesare mainly rooted in the high costs of implementing new technologies, the demands for the appropriatequalifications of personnel, and the necessity to store and analyse large amounts of data. A prerequisitefor the optimum use of existing infrastructure and the achievement of company goals is the formulationof appropriate measures and tools for evaluating the efficiency of industrial processes. Measurable andsignificant instruments in assessing the success of an organisation’s objectives are indicators definedby the term Key Performance Indicators (KPIs). The definition in the paper [9] states that “KPIs act asa set of measures focusing on those sides of organisational performance that are critical for the successof the organisation”.
The improvement of the mining processes has become increasingly noticeable in recent years.Mining companies are looking for new opportunities to optimise processes, implementing new policiesfor automation, using digital technologies [1,5,10–13], and utilising modern computer programmes tosupport technological processes [14]. Taking into account the progressive digitalisation of the miningindustry, there is a need to identify mining KPIs which are suited to enable the comprehensive andsustainable management of mines. Increasing the efficiency of the conducted processes is invariablythe major objective of mining companies. Efficient processes determine the efficiency of the entireorganisation and are dependent on the established management system in the company. The crucialissue at this point is to know how to make use of the collected data to improve the performance of thework. By taking advantage of the opportunities offered by digital transformation, such as real-timeprocess and machine monitoring, minimising equipment downtime, and reducing maintenance costs,companies are able to implement the required infrastructure and systems to collect and store processand machine data to improve performance and increase productivity. With the accurate and detailedprocessing and interpretation of the data, this is the basis for a monitoring and managing system forboth individual machines and processes as a whole.
Performance indicators are widely used and highly beneficial in many economic sectors [15–17].Mining process management may make use of KPIs established in other fields, however, we must bearin mind that operational mining processes require the formulation of reliable performance indicatorsto account for a range of different mining operations. In the literature, various examples may be founddescribing the applicability of indicators in the field of optimisation and, less commonly, concrete KPI

Energies 2020, 13, 5169 3 of 20
classification. The literature references cover very different fields, most often discussing financial andhuman resources and operational KPI implementation [18–21]. The topics discussed are also to befound in publications from the mining domain [21–23]; however, these are often incomplete and donot reflect the possibilities offered by the use of sensor data. Thus, the main contribution of our articleis a comprehensive list of indicators applicable at different management levels, taking into account themain perspectives of a process, such as work environment, machinery, and the human factor.
Our paper presents the results of research conducted in the SmartHUB project (financed by EITRaw Materials), which aims to create an IIoT platform that will support process management in themining industry.
The paper is organised as follows: Section 2 presents an introduction to process monitoring andthe methodology of Systematic Literature Review (SLR). The obtained results from the SLR and theproposal of KPIs in the mining industry and their discussion are presented in Section 3. Finally, Section 4concludes the paper and points out the value of KPI benchmarking in the effective management ofmining processes, as well as indicating possible directions for future work based on a KPI survey.
2. Materials and Methods
In this section, we present selected materials and methods crucial for the paper’s content, such asprocess monitoring and control, as well as a systematic literature review plan, which are presented inSections 2.1 and 2.2, respectively.
2.1. Process Monitoring and Control
Process monitoring and control is one of the essential phases of Business Process Management(BPM). The main reasons why companies have to monitor and control their business activities andprocesses come from legal regulations or the need to find and correct errors in process execution andincrease the process efficiency. An increase in process efficiency can be achieved by using monitoringdata to optimise the process, as well as performing integrated planning based on the available processdata. One possibility in this area is to identify important goals and success factors and use them todefine KPIs [24]. Defined KPIs are monitored in order to find deviations from the reference values,enabling immediate reaction and the provision of corrections to process execution.
Process monitoring can be performed at various levels of management, as well as fromdifferent perspectives, including technical, operational, financial, safety, or maintenance perspectives.However, it should combine extensive knowledge about the process with available data sourcesproviding up-to-date information on its performance.
Some of the indicators known from other fields (such as personnel management, finance,or lean manufacturing) can be used in mining (e.g., earnings before deducting interest and taxes(EBIT), the turnover per employee, value added per employee, health and environment incidents,Total Effective Equipment Performance (TEEP), loading time, cycle time, etc.). However, the operationalmining processes require a definition of specific indicators, especially in the context of increasing theproductivity of mining machines and the possibility of using sensor data from machines and devices.
As part of the current adoption of IIoT solutions in the mining industry, mines are equippedwith various sensors enabling the monitoring of processes. Among them, one can find machinerysensors, environmental sensors, and human sensors (implemented, among others, in wearabledevices such as smartwatches, smart eyewear, smart clothing, wearable cameras, and others [25]).Their application covers all aspects of process execution, such as machinery performance (i.e., statuses,payloads, energy consumption); environmental conditions (i.e., temperature, humidity, air quality,raw material quality); the monitoring of natural hazards [26]; and, last but not least, human performance(i.e., body readings, such as temperature, pulse, the monitoring of the brain activity, and the detectionof worker fatigue levels or worker tracking).
These rather technical readings are the basis for conversion into more general KPIs (Figure 1).

Energies 2020, 13, 5169 4 of 20
Energies 2020, 13, x FOR PEER REVIEW 4 of 21
Figure 1. Background of Key Performance Indicators definition regarding the process perspectives (own development).
The definition of KPIs has to take into consideration the following perspectives of a mining process, such as work environment (deposit, natural hazards, ventilation issues), machinery (becoming in recent years more advanced from the information technology point of view), and finally the human factor. These three perspectives decide the process performance and raise, at their cross-sections, important issues which should be monitored and managed in the process, such as maintenance issues, safety issues, and operational issues.
In our research, we investigated the most important indicators for a mining company related to all the mentioned perspectives. The collection of KPIs was initiated with the SLR approach, whose methodology is described in the next section.
2.2. Systematic Literature Review
The company’s efforts to improve their processes over the years resulted in significant progress in terms of the development of performance indicators and popularised the subject of KPIs among decision-makers. Taking these issues and the gap observed in the mining industry in the area of process performance assessment into consideration, the following research questions (RQ) were formulated:
RQ1: What are the main areas of the application of KPIs in an organisation? RQ2: What are the most commonly used KPIs for data-based process optimisation in the mining
industry?
RQ1 focuses on illustrating the areas of the organisation in which KPIs are applied. Organisations adopt different performance indicators depending on the industry in which they operate and the market where they compete. The measures of process evaluation are strictly related to the function of the decision-maker, as well as the scale of operation and strategy of the company. The process understanding and availability of data will also differentiate the indicators applied in a particular organisation. It is, therefore, important to consider the various examples of the use of KPIs as a basis for further analysis and define the main fields of KPI application.
RQ2 is dedicated to identifying KPIs that have been used in the raw materials industry. The searches in this area focus on the analysis of literature examples, discussing efficiency indicators
Figure 1. Background of Key Performance Indicators definition regarding the process perspectives(own development).
The definition of KPIs has to take into consideration the following perspectives of a mining process,such as work environment (deposit, natural hazards, ventilation issues), machinery (becoming inrecent years more advanced from the information technology point of view), and finally the humanfactor. These three perspectives decide the process performance and raise, at their cross-sections,important issues which should be monitored and managed in the process, such as maintenance issues,safety issues, and operational issues.
In our research, we investigated the most important indicators for a mining company relatedto all the mentioned perspectives. The collection of KPIs was initiated with the SLR approach,whose methodology is described in the next section.
2.2. Systematic Literature Review
The company’s efforts to improve their processes over the years resulted in significant progressin terms of the development of performance indicators and popularised the subject of KPIs amongdecision-makers. Taking these issues and the gap observed in the mining industry in the area of processperformance assessment into consideration, the following research questions (RQ) were formulated:
RQ1: What are the main areas of the application of KPIs in an organisation?RQ2: What are the most commonly used KPIs for data-based process optimisation in the
mining industry?
RQ1 focuses on illustrating the areas of the organisation in which KPIs are applied.Organisations adopt different performance indicators depending on the industry in which theyoperate and the market where they compete. The measures of process evaluation are strictly relatedto the function of the decision-maker, as well as the scale of operation and strategy of the company.The process understanding and availability of data will also differentiate the indicators applied in aparticular organisation. It is, therefore, important to consider the various examples of the use of KPIsas a basis for further analysis and define the main fields of KPI application.
RQ2 is dedicated to identifying KPIs that have been used in the raw materials industry. The searchesin this area focus on the analysis of literature examples, discussing efficiency indicators dedicated
Energies 2020, 13, 5169 5 of 20
to the mining industry and the optimisation of mining processes based on specific measurementsand parameters.
To identify the primary literature references covering the issue of KPIs Web of Science (WoS) andWiley Online Library (WOL) were investigated as the primary databases for research. Both databaseswere selected due to their broad thematic scope and interdisciplinary papers. The main steps used inthe SLR are illustrated in Figure 2.
Energies 2020, 13, x FOR PEER REVIEW 5 of 21
dedicated to the mining industry and the optimisation of mining processes based on specific measurements and parameters.
To identify the primary literature references covering the issue of KPIs Web of Science (WoS) and Wiley Online Library (WOL) were investigated as the primary databases for research. Both databases were selected due to their broad thematic scope and interdisciplinary papers. The main steps used in the SLR are illustrated in Figure 2.
Figure 2. Selection of papers for Systematic Literature Review.
The first step primarily focuses on literature research to find papers from a wide range of fields, covering publications from a variety of sectors as benchmarks for the examination. The period covered by the analysis is 2010–2020 and it is deemed most relevant for the study. The literature review comprises research and review articles, conference papers, book chapters, as well as additional publications and the reports of leading mining companies published on their homepages. In order to increase the relevance of the conducted search, a list of criteria has been defined to help select the most appropriate literature positions.
The keyword used for the selection of articles was “Key Performance Indicator” in the article titles or abstracts. Only peer-reviewed articles written in English were selected. In the first step of the research, we obtained a total of 8640 results in Web of Science and 729,465 results in the Wiley Online Library.
In the second step, the literature review was focused on issues covering mining and raw materials. In this case, we used a selection of options according to scientific categories. Here, the following results were obtained in science categories:
1. For the WoS searching for “mining”, mineral”, “processing”, the results are 32 articles; 2. For the WOL searching for “key performance indicator” in keywords and “mining industry”,
there were 26 articles.
In the last screening evaluation, the selection was based on the full text by examining the contents of 58 articles in depth (as presented in Figure 2). The main inclusion criteria used to identify the most relevant papers for the review were as follows: the item thematically corresponds to the main objective of the research—i.e., it proposes measurable parameters for process performance evaluation and provides a significant answer to the formulated research questions.
3. Results
3.1. SLR Results
In the first step, we aimed at presenting areas of the organisation in which KPIs are used. The yearly distribution of papers resulting from the first step of SLR is shown in Figure 3.
Figure 2. Selection of papers for Systematic Literature Review.
The first step primarily focuses on literature research to find papers from a wide range of fields,covering publications from a variety of sectors as benchmarks for the examination. The period coveredby the analysis is 2010–2020 and it is deemed most relevant for the study. The literature review comprisesresearch and review articles, conference papers, book chapters, as well as additional publicationsand the reports of leading mining companies published on their homepages. In order to increase therelevance of the conducted search, a list of criteria has been defined to help select the most appropriateliterature positions.
The keyword used for the selection of articles was “Key Performance Indicator” in the articletitles or abstracts. Only peer-reviewed articles written in English were selected. In the first step ofthe research, we obtained a total of 8640 results in Web of Science and 729,465 results in the WileyOnline Library.
In the second step, the literature review was focused on issues covering mining and raw materials.In this case, we used a selection of options according to scientific categories. Here, the following resultswere obtained in science categories:
1. For the WoS searching for “mining”, mineral”, “processing”, the results are 32 articles;2. For the WOL searching for “key performance indicator” in keywords and “mining industry”,
there were 26 articles.
In the last screening evaluation, the selection was based on the full text by examining the contentsof 58 articles in depth (as presented in Figure 2). The main inclusion criteria used to identify themost relevant papers for the review were as follows: the item thematically corresponds to the mainobjective of the research—i.e., it proposes measurable parameters for process performance evaluationand provides a significant answer to the formulated research questions.

Energies 2020, 13, 5169 6 of 20
3. Results
3.1. SLR Results
In the first step, we aimed at presenting areas of the organisation in which KPIs are used. The yearlydistribution of papers resulting from the first step of SLR is shown in Figure 3.Energies 2020, 13, x FOR PEER REVIEW 6 of 21
Figure 3. Number of papers from selected databases by year (WOL—Wiley Online Library; WoS—Web of Science).
The most popular fields with KPIs in WOL were business and management, chemical and biochemical engineering, along with agriculture. The most common science categories for KPIs in WoS were engineering, electrical, and electronics, then management and telecommunications.
We indicated the following areas in an organisation where KPIs are most often used: 1. Finance [18]; 2. Human resources [19,20]; 3. Customer service [16]; 4. Information technology [27,28]; 5. Marketing and sales [29]; 6. Logistics [17]; 7. Technical/operational (differentiated by industry—e.g., manufacturing, quality [21], ergonomic
[30]).
In presenting the wide range of use of KPIs in industrial applications, several examples can be given to creating a benchmark list in the selected areas:
1. Human resources: compensation cost, % of participants in communication training, % of training courses matching company requirements, consistent development of leadership skills, and the strengthening of the manager’s role as a coach and a mentor (leadership index) [20].
2. Finance: value added per employee, value added in relation to cost, turnover per employee, investment per employee, value added in relation to investments, and the share of investments to the total costs [18].
3. Operational: availability, utilisation, cycle time, flow time, corrective maintenance ratio, mean time to failure, mean time to repair, overall equipment effectiveness (OEE), production effectiveness, production process ratio, quality, % of available man hours used in proactive work, the number of work order requests, % of scheduled man hours over the total available man hours, the number of unplanned maintenance interventions, unscheduled maintenance downtime, health and environment incidents, and the number of unplanned maintenance interventions [31,32].
To answer RQ2, an overview of examples of KPIs used in the mining industry was created. This study was carried out in two stages. In the first stage, we analysed selected articles (32 in Web of Science and 26 in the Wiley Online Library), which can be further divided into papers related to KPIs in the raw materials in the following domains: financial, organisational, and transport. Most of the
Figure 3. Number of papers from selected databases by year (WOL—Wiley Online Library; WoS—Webof Science).
The most popular fields with KPIs in WOL were business and management, chemical andbiochemical engineering, along with agriculture. The most common science categories for KPIs in WoSwere engineering, electrical, and electronics, then management and telecommunications.
We indicated the following areas in an organisation where KPIs are most often used:
1. Finance [18];2. Human resources [19,20];3. Customer service [16];4. Information technology [27,28];5. Marketing and sales [29];6. Logistics [17];7. Technical/operational (differentiated by industry—e.g., manufacturing, quality [21],
ergonomic [30]).
In presenting the wide range of use of KPIs in industrial applications, several examples can begiven to creating a benchmark list in the selected areas:
1. Human resources: compensation cost, % of participants in communication training, % of trainingcourses matching company requirements, consistent development of leadership skills, and thestrengthening of the manager’s role as a coach and a mentor (leadership index) [20].
2. Finance: value added per employee, value added in relation to cost, turnover per employee,investment per employee, value added in relation to investments, and the share of investments tothe total costs [18].
3. Operational: availability, utilisation, cycle time, flow time, corrective maintenance ratio, mean timeto failure, mean time to repair, overall equipment effectiveness (OEE), production effectiveness,production process ratio, quality, % of available man hours used in proactive work, the number of

Energies 2020, 13, 5169 7 of 20
work order requests, % of scheduled man hours over the total available man hours, the numberof unplanned maintenance interventions, unscheduled maintenance downtime, health andenvironment incidents, and the number of unplanned maintenance interventions [31,32].
To answer RQ2, an overview of examples of KPIs used in the mining industry was created.This study was carried out in two stages. In the first stage, we analysed selected articles (32 in Web ofScience and 26 in the Wiley Online Library), which can be further divided into papers related to KPIsin the raw materials in the following domains: financial, organisational, and transport. Most of thearticles used in our research were published between 2017 and 2019. In the next stage, we made a listof publications (Table 1) which could be a benchmark for creating our proposal to the mining industry.
Table 1. Types of indicators in the selected publications.
Author (s) Year Field of Application Examples of KPIsProvided by Article KPI Types Used
[33] 2020 Mining and mineralprocessing Yes Indicators related to a mine’s organisation.
[34] 2020 Potash Yes Degree of blockage or degree of starvation.
[22] 2020 Rock raw materials Yes Measurement of performance in an aggregateproduction process—simulation in real time.
[35] 2019 Geometallurgy No x
[36] 2019 Iron ore Yes Mining process planning—NPV (net presentvalue) and LOM (life of mine).
[21] 2019 Coal Yes Quality indicator set.
[23] 2019 Minerals Yes Indicators related to loading and transportsystems.
[37] 2019 Cement plant Yes Energy consumption, carbon footprint, specificwater consumption, effectiveness.
[38] 2018 Mining industry Yes Effectiveness, maintenance, and operationsmanagement indicators.
[39] 2018 Coal Yes Productivity improvement (e.g., bucket fillfactor, loading conditions, cycle time).
[40] 2018 Gravel YesEmployees’ working time, time of runningmachines, fuel consumption, and electricity
consumption.
[41] 2018 Mineral Yes Key flotation performance indicators: frothheight above the recovery and silica recovery.
[42] 2017 Rock in oil well Yes Rate of penetration.
[43] 2017 Platinum Yes Production (e.g., face length mined, achievedblasts, development to mill).
[44] 2016 Rock No x
[45] 2016 Platinum YesImprovement in the overall efficiency of
mining equipment at levels of availability,utilisation, productivity, and quality.
[46] 2016 Platinum Yes Financial.[47] 2016 Coal No x[48] 2016 Copper No x
[49] 2015 Coal Yes Predicting the performance of surface minerproduction.
[50] 2015 Coal hauling Yes Optimisation of shuttle car utilisation (e.g.,analysing the away time and safety).
[30] 2015 Coal Yes Ergonomic.[51] 2015 Coal Yes Environmental and economic.
[52] 2014 Coal Yes Transport (e.g., time to repair, time to reach aperson).
[53] 2012 Hard rock No x
[54] 2011 Copper YesProduction (e.g., maximising settle time, noslag skimming when tap hole is open to the
vessel).
[55] 2011 Load haul dumpmachinery Yes Machine availability and utilisation.
[56] 2011 Platinum flotationgrade No x

Energies 2020, 13, 5169 8 of 20
The results of the literature review were supplemented by reports and materials published bycompanies operating in the mining industry. The purpose of adding these supplementary sources wasto draw attention to the indicators used in practice. We referred to the reports and data published byselected mining companies, taking into account the leading indicators used by these companies toassess the performance of the organisation.
The exemplary companies selected for the analysis are the mining companies which representa significant position on the mineral resource market and constitute an essential benchmark for themining industry as a whole. The following companies were selected for review: BHP Billiton, Rio Tinto,Glencore, Vale, Anglo American, Fortescue Metal, Fresnillo, Newmont, Boliden, and First QuantumMinerals. In addition, these companies regularly publish reports on sustainability performance whichprovide information on the indicators employed. Based on the information contained in the annualreports available on the companies’ websites (year 2019), the main performance indicators used bythe selected companies were identified. The summary of the reported groups’ KPIs in the selectedcompanies is presented in Table 2.
Table 2. KPIs monitored by the selected mining companies.
Main Groupsof KPIs
MiningCompanies
BH
PB
illi
ton
Rio
Tint
o
Gle
ncor
e
Val
e
Ang
loA
mer
ican
Fort
escu
eM
etal
Fres
nill
o
New
mon
t
Bol
iden
Firs
tQ
uant
umM
iner
als
Business ethics and transparency x xCommunity relationships and development x x x x x
Economic performance x x x x x x xEnvironment x x x x x x x x x x
Equal opportunities xHealth and safety x x x x x x x x x xPeople/employees x x x x x
Production x xRecovery of degraded areas x
Society x x xSocio-political performance x
Source: based on [57–66].
Table 2 presents aggregated and general groups of indicators used by companies to assessperformance. For instance, indicators related to financial performance, such as payments, expenditures,dividends, etc., are classified in one group of economic performance indicators, and measurementsincluding energy consumption, biodiversity, climate change, air emissions, and waste are integratedinto one group called environment performance. Based on the data presented in the table above, one canobserve that many of the indicators are frequently repeated among the analysed companies. The mostcommonly considered performance monitoring areas cover health and safety, environmental andclimate change, community and employee-related performance, and economic performance. Less often,companies address issues such as community relationships and development, production, and societyin their reports. The indicators least frequently considered by enterprises are the following: businessethics and transparency, equal opportunities, and the recovery of degraded areas.
For the selected companies, the reported KPI data mainly concern performance in the sustainabilitydimension, and the reports do not specify indicators focused on the operational measurement ofactivity in the selected companies. This leads to the conclusion that mining companies concentrate theiractivities significantly on aspects of sustainable development, bearing in mind that the management andsustainable exploitation of resources is a necessary requirement for companies consciously planningtheir development.
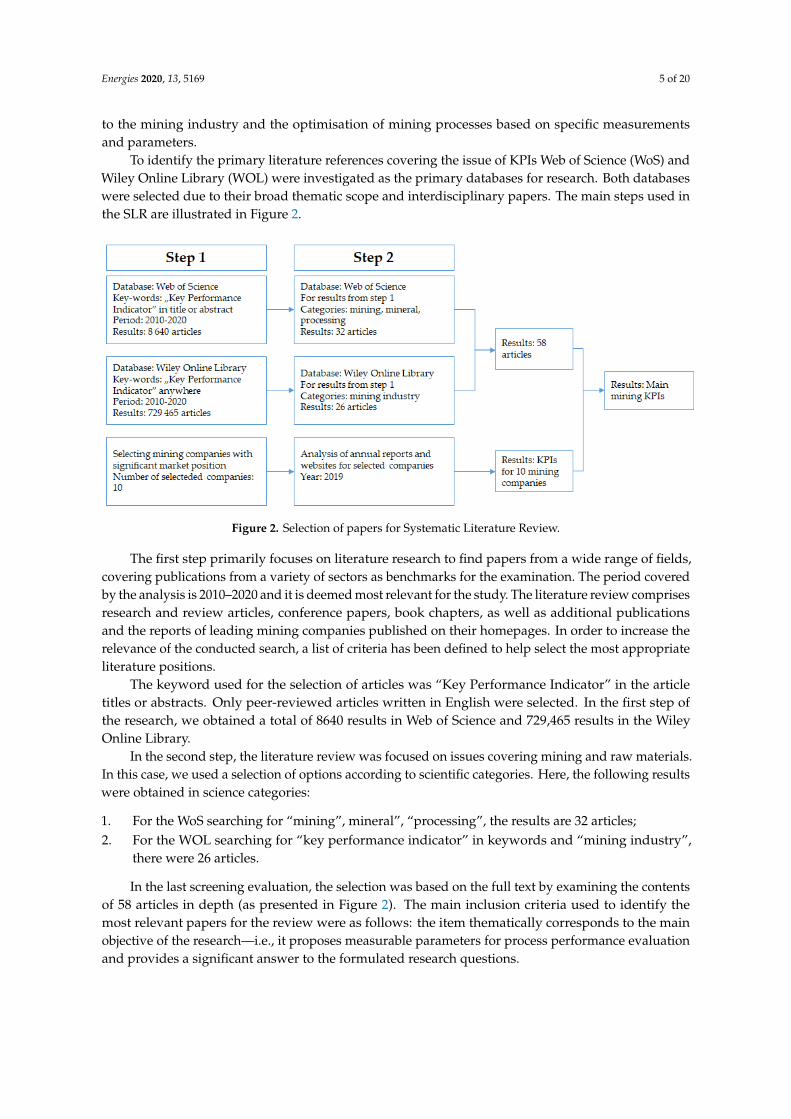
Some examples can be found in branchial reports and other sources—e.g., “Extraction in termsof efficiency” [67], where several KPIs referring to an excavator, electric shovel, hydraulic excavator,front loader, or mining cables could be found in [68,69], where more specific indicators for the miningsector are presented. Examples of additional indicators are included in Table 3.
Energies 2020, 13, 5169 9 of 20
Table 3. Examples of KPIs in the selected fields.
Field Exemplary KPIs
Maintenance
Average bucket weight, average fuel use per machine, average number of loads perhour/day/week/month, average loading time, average swing time, average numberof dumps per hour/day/week/month, dump time, total minutes lost per shift due tobreaks, average payload, overall equipment effectiveness (OEE).
Financial Cash operating costs per unit produced, lifting costs, unit variable costs, utilisation.
TemporalChange time (time between cycles), empty travel time, lost time incident frequencyrate, cycle distance, loaded travel time, tons of ore feed, cycle time, loaded stoptime, tons per load, tons per hour, empty stop time.
Safety Fatality frequency rate, incident rate (accidents, etc.) per hour.
Physical characteristic
Degree of purity and physical characteristics, raw material substitution rate(percentage), dilution of ore, reserve and resource replacement, the efficiency ofmetallurgical recovery, fuel consumption (e.g., litres/hour), waste volume, wasteper ton, waste recycling (e.g., tons per time unit).
Source: based on [68,69].
Based on the conducted SLR, it may be noted that in the literature, many studies address theissue of KPIs at different levels of detail. On the grounds of the literature review, it can be statedthat the most commonly used non-financial groups of indicators in the raw materials industryinclude safety and health, employees, corporate governance, footprint management, social investment,innovation research, manufacturing, and sales.
The analysis of the selected publications and detailed examination of the indicators presentedin the literature leads to the conclusion that there are no comprehensive classifications and specificexamples of indicators applicable in the area of process management taking into consideration thementioned process perspectives. Only a few publications present grouped indicators—e.g., in [68] theproposed classification we include areas such as safety, quality, cost, delivery, and fleet management,and in [22] we can find KPI classification from -process and equipment point of view. Some publicationsfrom Tables 1 and 2 include examples of KPIs, but in our opinion this sector needs a frameworkenabling a meaningful analysis and classification of KPIs related to the most important issues, such asoperations, maintenance, and safety.
Moreover, the unexploited potential of the Industry 4.0 concept has been identified in the use ofdata from machine sensors for the evaluation of the efficiency of mining processes, with particularemphasis on the operation of machinery and equipment. In response to the lack of a definedclassification for indicators relying on the possibilities of IIoT development in the field of monitoringthe mining process at work, an attempt was undertaken to develop a comprehensive classification ofmining KPIs that also covered this issue.
3.2. Classification and Definition of Mining KPIs for Process Monitoring
The results of the SLR presented in Section 3.1 reveal the variability of utilised KPIs basedon the industry they have been defined for. A wide range of available indicators applied formany layers of operations in companies proves the significant potential of implementing KPImonitoring methods, as well as their versatility and the possibility to adapt these indicators tovarious industries, including mining. While there are several KPIs that overlap with similar industries(e.g., machine availability), the use of specific KPIs tailored to the mining industry is necessary to allowfor the comprehensive monitoring of all the involved processes and parameters. This procedure isrecommended, as the application of an excessive number of indicators to the process assessment maydiminish the focus on the company’s main objectives and result in the lower efficiency of plannedimprovements [9].
Taking into account the findings above, to support decision-making processes in the miningindustry effectively a classification of KPIs adapted to the specificity of the mining process and

Energies 2020, 13, 5169 10 of 20
machinery is necessary. In the scope of this research, KPIs directly contributing to the economicviability of a mining operation are defined and classified. Special consideration is given to theunderlying raw material production process and the maintenance works that enable interruption-freemachine operation. The selection of indicators for process monitoring should also reflect the objectivesof the company, which may require support in decision-making processes in different areas of operation.A particularly beneficial opportunity for mining companies to automate their processes and generateinsights from machines is the use of indicators and measures based on real-time data obtained fromthe machines of the mining operation. The undertaken research was initiated by identifying themain components of performance in mines. From a process perspective, an essential viewpoint indetermining KPIs for monitoring a mine’s production performance is the classification of indicatorsinto groups related to the operational perspective, including the technical, temporal, and spatialdimensions of the machines involved in the process (Figure 4).
Energies 2020, 13, x FOR PEER REVIEW 11 of 21
time data obtained from the machines of the mining operation. The undertaken research was initiated by identifying the main components of performance in mines. From a process perspective, an essential viewpoint in determining KPIs for monitoring a mine’s production performance is the classification of indicators into groups related to the operational perspective, including the technical, temporal, and spatial dimensions of the machines involved in the process (Figure 4).
Figure 4. Mining KPIs from technical, temporal, and spatial dimensions.
When considering the KPIs introduced in Figure 4, the technical KPIs are based on sensor measurements on individual machines. As those KPIs can be measured with a high frequency and level of detail, they are directly applicable for the technical monitoring of a machine’s performance. The categories of temporal and spatial KPIs, however, require analyses of machine activities and their surrounding environment, as well as additional information on the ways of working of a machine, increasing the complexity of value collection for these indicators. When looking at the use of a machine, it is relevant to consider at which step within the production process a machine is working and if it is interacting with other machines. Disregarding the required data transmission efforts, the computational effort is necessary to establish the activity and cycle classifications of individual and interacting machines.
It should be noted that, depending on the type of machine, several KPIs may be inapplicable or refer to different ways of working—e.g., while both wheel loaders and dump trucks perform cycles and can carry a payload, their cycles consist of different steps and serve different purposes in the production process. Most of the technical KPIs derived from sensors regarding the inner workings of a machine are independent of the production process and can be compared throughout a multitude of machines (Table 4). The presented technical KPIs are exemplary and can differ from machine to machine, depending on the type of sensor hardware installed on the machine.
Figure 4. Mining KPIs from technical, temporal, and spatial dimensions.
When considering the KPIs introduced in Figure 4, the technical KPIs are based on sensormeasurements on individual machines. As those KPIs can be measured with a high frequency andlevel of detail, they are directly applicable for the technical monitoring of a machine’s performance.The categories of temporal and spatial KPIs, however, require analyses of machine activities and theirsurrounding environment, as well as additional information on the ways of working of a machine,increasing the complexity of value collection for these indicators. When looking at the use of amachine, it is relevant to consider at which step within the production process a machine is workingand if it is interacting with other machines. Disregarding the required data transmission efforts,the computational effort is necessary to establish the activity and cycle classifications of individual andinteracting machines.
It should be noted that, depending on the type of machine, several KPIs may be inapplicable orrefer to different ways of working—e.g., while both wheel loaders and dump trucks perform cyclesand can carry a payload, their cycles consist of different steps and serve different purposes in theproduction process. Most of the technical KPIs derived from sensors regarding the inner workings ofa machine are independent of the production process and can be compared throughout a multitudeof machines (Table 4). The presented technical KPIs are exemplary and can differ from machine tomachine, depending on the type of sensor hardware installed on the machine.

Energies 2020, 13, 5169 11 of 20
Table 4. Basic technical indicators for machinery.
Engine Transmission HydraulicSystems
Tires andSuspensions
ExhaustAftertreatment
Engine speed Retarder oil temperature Oil pressure Pressure Filter regenerationTorque Retarder oil pressure Oil temperature Temperature Exhaust temperatures
Coolant temperature Shaft gear Power supply Strain AdBlue consumptionOil temperature Oil level Gas mass flow rate
Oil pressureEngine fuel rate
Throttle
Since most of the introduced KPIs in Table 4 only give specific insights on a single machine,they have to be collected on every machine individually. In order to provide KPIs that are representativeof multiple machines and shifts or for the complete machine fleet of a mine, the data and KPIs ofindividual machines need to be aggregated. The most common type of aggregation is the averaging ofvalues, as it allows for comparison with other time frames or machines. This type of aggregation isespecially suitable for temporal KPIs, such as operating and idle time or cycle durations, as well astechnical KPIs for other machines of the same type and/or model. When KPIs are aggregated, the levelof detail decreases, while the considered time span or number of machines increases, allowing theuse of KPIs for different use cases. Assigning KPIs to the groups introduced in Figure 4 allows fora segmentation based on the requirements of the different parties working with the data gathered.The different parties or persons are defined to be representative for most mining operations. In thescope of this work, the following persons have been identified and related to KPIs and monitoringrequirements: superintendent, shift supervisor, operator, and maintenance manager. Depending onthe size of an operation, the types of applicable persons can vary—e.g., multiple management levelscan be required when a corporation runs several mine sites. Generally, the interests of these personsare the production performance of one or multiple machines, machine health, or both (Figure 5).
Similar to the hierarchical structure of the persons within a mining operation, their interests are ondifferent levels of detail. Whereas a superintendent is interested in the production performance of themine as a whole, a shift supervisor’s aim is to reach the production targets of his/her jurisdiction. At thesame time, an operator is merely interested in his/her individual work performance. This hierarchicalstructure expresses an inverse relationship between the level of management and the level of detail.When considering the aspect of machine health, the interested persons are reduced to the maintenancemanager, with a responsibility towards the superintendent and shift supervisor persons of ensuringmachine health throughout the mining operation, and the operator, whose interest it is to have awell-working machine in order to fulfil his/her work. By segmenting the KPIs based on persons,the potential of process improvements increases, as suitable KPIs for the different types of work to becarried out allow for the application of mitigating measures at the appropriate levels of responsibilityand detail. Therefore, a KPI aggregation concept, as previously introduced, can be applied to the areasof responsibility and the scope of tasks performed by a person.
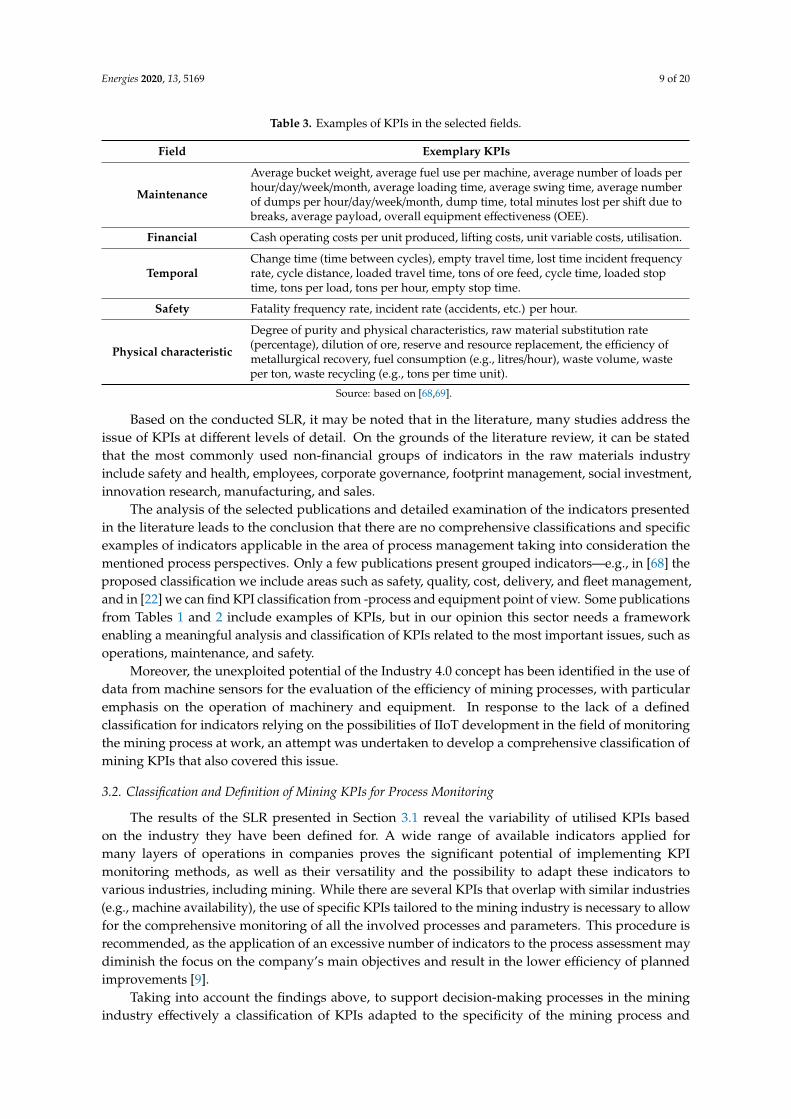
In Table 5, we present our proposal of the most important KPIs concerning the introduced persongroups. A discussion of the concept is presented in the next section.
Energies 2020, 13, 5169 12 of 20
Table 5. The most important KPIs for different person groups.
KPIs
Decision-Makers
Supe
rint
ende
nt
Shif
tSu
perv
isor
Ope
rato
r
Mai
nten
ance
Man
ager
Technical KPIs
Fuel/energy consumption x x xPayload x x x
Temperatures x xPressures x x
Engine load and speed x xErrors and warnings x x xHydraulic systems x
Tires and suspensions xExhaust after-treatment x
Temporal KPIs
Operating and idle time x x x xCycle duration x x x
Loading and dumping times x xQueuing and spotting times x x
Relocation times x xDowntimes x x x
Maintenance durations x x x x
Spatial KPIs
Geolocation of machine x x xCycle distance x x
Loaded/empty travel distance xTravel distance at beginning/end of shift x x
Slope angle and inclination x x
Safety KPIs
Lost Time Injuries (LTI) x xLost Time Injury Frequency Rate (LTIFR) x x
Frequency of refresher training x x x xPlanned routine safety checks versus completed routine
safety checks x x x
Percentage reduction in exposure hours to hazardousmaterials/activities x x x x
Worker compensation costs x xIncident rate (accidents, etc.) per x hours x x
Maintenance KPIs
Number of equipment failures perday/week/month/year) x x x x
Total minutes lost per shift due to breaks x x x xMean time between failures (MTBF) x x x x
Maintenance man-hours (MMH) x x xMean time between shutdowns (MTBS) x x
Mean time to restore/repair (MTTR) x x x xMean downtime (MDT) x x x x
Maintenance ratio (MR = maintenanceman-hours/equipment operating hours) x x x
Availability x x x
Source: own development.

Energies 2020, 13, 5169 13 of 20
Energies 2020, 13, x FOR PEER REVIEW 12 of 21
Table 4. Basic technical indicators for machinery.
Engine Transmission Hydraulic systems
Tires and suspensions
Exhaust aftertreatment
Engine speed
Retarder oil temperature Oil pressure
Pressure Filter regeneration
Torque Retarder oil pressure
Oil temperature
Temperature
Exhaust temperatures
Coolant temperature
Shaft gear Power supply Strain AdBlue consumption
Oil temperature Oil level Gas mass flow rate
Oil pressure
Engine fuel rate
Throttle
Since most of the introduced KPIs in Table 4 only give specific insights on a single machine, they
have to be collected on every machine individually. In order to provide KPIs that are representative of multiple machines and shifts or for the complete machine fleet of a mine, the data and KPIs of individual machines need to be aggregated. The most common type of aggregation is the averaging of values, as it allows for comparison with other time frames or machines. This type of aggregation is especially suitable for temporal KPIs, such as operating and idle time or cycle durations, as well as technical KPIs for other machines of the same type and/or model. When KPIs are aggregated, the level of detail decreases, while the considered time span or number of machines increases, allowing the use of KPIs for different use cases. Assigning KPIs to the groups introduced in Figure 4 allows for a segmentation based on the requirements of the different parties working with the data gathered. The different parties or persons are defined to be representative for most mining operations. In the scope of this work, the following persons have been identified and related to KPIs and monitoring requirements: superintendent, shift supervisor, operator, and maintenance manager. Depending on the size of an operation, the types of applicable persons can vary—e.g., multiple management levels can be required when a corporation runs several mine sites. Generally, the interests of these persons are the production performance of one or multiple machines, machine health, or both (Figure 5).
Figure 5. Interests of persons in a mining operation. Figure 5. Interests of persons in a mining operation.
3.3. Discussion of the Presented Concept
The KPIs in Table 5 are mostly in the area of interest of multiple persons. In fact, the associatedtasks regarding these KPIs vary significantly for the people involved. For instance, a machine operatorrecognises the trend of fuel/energy consumption, payload, temperature, engine load, and speed usingIIoT solutions. Machine operators inform maintenance managers of any presence of abnormality oftemperature, payload, or engine speed, and accordingly receive required directions for troubleshooting.The payload and fuel consumption data are tracked by machine operators, shift engineers, and themine superintendent. Since the machine operators track the payload and fuel consumption data toevaluate individual performance, the shift engineers and mine superintendents analyse mostly theoverall sum for specific time frames, such as shifts, days, weeks, months, or quarters.
The temporal KPIs in Table 5 constitute the combination of the design, operation, and maintenanceparameters of a mine. The loading and dumping, queueing and spotting, and relocation durationsof a dump truck are the components of its cycle. For a number of operating machines in the mine,the operational quality of the loading machine operator and dump truck operator; machine health; andlength, inclination, and quality of the haul road are the deciding factors in these KPIs. Machine operatorsfocus on optimising the durations associated with the cycle, while shift supervisors analyse the overallpit structure, interview the machine operators and maintenance managers regarding the temporalKPIs, and identify the potential bottlenecks in the operation to report all the factors decreasing theefficiency and increasing the cycle durations to the mine superintendents. Mine superintendentsanalyse all these inputs and take action regarding the mine design and operational workflows basedon the temporal KPIs.
The spatial KPIs in Table 5 constitute the mine design factors discussed for spatial KPIs,excluding the KPI “geolocation” of a machine. These KPIs are the responsibility of the minesuperintendents and shift supervisors, and directly correlate to the efficiency of the mine designapproved by the mine superintendents and the execution quality of these plans. The geolocation of themachine is required for ensuring safety measures—for instance, to identify any machine activity ormotion in forbidden areas during a blasting event.
Occupational health and safety (OHS) measures are over-hierarchical measures where complianceto the safety measures is an obligation for each person in the mining environment. The persons sharethe same aim to reduce the incident rate, Lost Time Injuries (LTI), and Lost Time Injury FrequencyRate (LTIFR). Refresher training is arranged by mine superintendents regularly or depending on anunexpected incident, and each mining person’s participation is mandatory. Mine superintendentscollect the reports of incidents or accidents occurring in the operation from the shift supervisor toimprove OHS practices and update the guidelines to avoid them in the future. Except for the financial

Energies 2020, 13, 5169 14 of 20
safety indicators, the organisation involves people actively to provide further input for all safetyindicators. The worker compensation costs must be tracked by the mine superintendents and includedin the financial plans of the mine.
Machine failures and downtime are significant factors impacting the efficiency of a mine operation.Since they have a direct influence on the overall machine availability, the maintenance indicators inTable 5 are tracked by all the people covered in this study. Machine operators record the number offailures to track their performance and evaluate their operational excellence in order to not cause anyfurther faults or failures. The frequency of failures and the duration of the repair works induces financialand temporal stress on the mine, as well as procurement planning and spare part stock management.Therefore, maintenance managers must report the mean time between failures, the distribution offailure types, the man-hours needed for the maintenance practices, and the other KPIs covered inTable 5. These reports must be evaluated by shift supervisors, mine superintendents, and maintenancemanagers to identify the cause of a machine failure. These causes can be classified as follows:poor pit conditions, low operational quality, inefficient mine design, not-fit-for-purpose machine fleet.For instance, a bumpy haul road might lead to damaged tires on a dump-truck, which then leads tosuspension failure or a flat tire, where the shift supervisor is the person responsible to ensure the haulroad quality of the mine. On the other hand, poor maintenance practices can cause long maintenanceman-hours (MMH), mean time to restore/repair (MTTR), and mean downtime (MDT), as well asdecreased mean time between failures (MTBF) and mean time between shutdowns (MTBS).
In this research, we also want to introduce the concept of a chain of causality to detail theinterdependencies of different persons, their works, and their KPIs of interest within a hierarchicallystructured operation such as a mine (Figure 6).
Energies 2020, 13, x FOR PEER REVIEW 15 of 21
for the financial safety indicators, the organisation involves people actively to provide further input for all safety indicators. The worker compensation costs must be tracked by the mine superintendents and included in the financial plans of the mine.
Machine failures and downtime are significant factors impacting the efficiency of a mine operation. Since they have a direct influence on the overall machine availability, the maintenance indicators in Table 5 are tracked by all the people covered in this study. Machine operators record the number of failures to track their performance and evaluate their operational excellence in order to not cause any further faults or failures. The frequency of failures and the duration of the repair works induces financial and temporal stress on the mine, as well as procurement planning and spare part stock management. Therefore, maintenance managers must report the mean time between failures, the distribution of failure types, the man-hours needed for the maintenance practices, and the other KPIs covered in Table 5. These reports must be evaluated by shift supervisors, mine superintendents, and maintenance managers to identify the cause of a machine failure. These causes can be classified as follows: poor pit conditions, low operational quality, inefficient mine design, not-fit-for-purpose machine fleet. For instance, a bumpy haul road might lead to damaged tires on a dump-truck, which then leads to suspension failure or a flat tire, where the shift supervisor is the person responsible to ensure the haul road quality of the mine. On the other hand, poor maintenance practices can cause long maintenance man-hours (MMH), mean time to restore/repair (MTTR), and mean downtime (MDT), as well as decreased mean time between failures (MTBF) and mean time between shutdowns (MTBS).
In this research, we also want to introduce the concept of a chain of causality to detail the interdependencies of different persons, their works, and their KPIs of interest within a hierarchically structured operation such as a mine (Figure 6).
Figure 6. Exemplary chain of causality representing availability and performance optimisation in a mining organisation.
The chain of causality links the tasks of various people, allowing for the analysis of the KPI’s contextual integrity along with the hierarchical levels. For example, the effective basic indicator monitoring of parameters such as hydraulic pressures or cooling water temperatures represented in Table 4 of the basic machine indicators and overall mine efficiency can be correlated using a chain of causality. A failure of a hydraulic system or exceeding safe cooling water temperatures might result in irreversible equipment failure and a decrease in uptime. As a result, the overall availability decreases and, ultimately, so does the overall efficiency. Similarly, the wrong selected gear during uphill drives of a dump truck can lead to excessive fuel consumption and the rapid wear of the
Figure 6. Exemplary chain of causality representing availability and performance optimisation in amining organisation.
The chain of causality links the tasks of various people, allowing for the analysis of the KPI’scontextual integrity along with the hierarchical levels. For example, the effective basic indicatormonitoring of parameters such as hydraulic pressures or cooling water temperatures represented inTable 4 of the basic machine indicators and overall mine efficiency can be correlated using a chainof causality. A failure of a hydraulic system or exceeding safe cooling water temperatures mightresult in irreversible equipment failure and a decrease in uptime. As a result, the overall availabilitydecreases and, ultimately, so does the overall efficiency. Similarly, the wrong selected gear during uphilldrives of a dump truck can lead to excessive fuel consumption and the rapid wear of the equipment.

Energies 2020, 13, 5169 15 of 20
This leads to eventual machine failure, reducing uptime, as well as elevated fuel consumption andtime costs regarding fuel procurement. Therefore, it is recommended to group KPIs based on persongroups, as well as to link them in a chain of causality to understand the process schemes and potentialbottlenecks or inefficiencies of a mining operation.
The strategies developed and decisions taken by mine superintendents to improve overall efficiencyare distributed to the workflow, and the other persons working in the lower hierarchical levels alignthemselves to the new work order in a chain of causality. As discussed above, not all the KPIs areof interest for all persons. Each person evaluates their performance and aims to achieve sufficientvalues for the corresponding KPIs within their field of responsibility. For example, the commitmentof mine superintendents to increase the overall availability is strongly dependent on the uptime ofthe fleet. The monitoring and reporting of the uptime are the responsibilities of the shift supervisor.Shift supervisors try to identify factors leading to a reduction in the uptime, where the machinecondition and maintenance practices are the determining factors of uptime. The commitment of amine superintendent to increase the machine availability results in decisions which target maintenancepractices. They can be exemplified by the improvement or optimisation of spare part procurementbased on the feedback of the maintenance manager or the improvement of operational quality of amachine driver based on the engine load KPI. This corresponds to an increased level of detail among thedownstream movement of hierarchy and different KPIs to be tracked in the chain of causality (Figure 6).As another example, commitment to increasing performance might result in strict tracking of truckcycle times of the machine operators, whereas the machine operator might aim to optimise the loadingand unloading times by increasing the communication with the operator of a loading machine toreduce the queueing times or the positioning nearby of the loading machine. Furthermore, the overallefficiency of a mine can be tracked down to the KPIs of technical, temporal, and spatial dimensions,as shown in Figure 4, in the chain of causality. At the highest level of detail, the basic indicators ofmachinery are analysed to understand their impact on the dimensions.
By establishing a chain of causality, hierarchical dependencies and KPIs of interest can be analysedfrom different perspectives to provide additional insights into mining operations. This concept combinesthe need for KPIs tailored to the application in mining as well as the possibility to represent varyinglevels of detail by aggregation. Formerly difficult data acquisition on the most detailed level, as inindividual machines, is becoming significantly more accessible with the use of IIoT in the miningindustry. This makes it possible to base management-level KPIs on aggregated information of theunderlying levels within the chain of causality. From the perspective of operational and economicperformance, this concept enables different persons to draw customised insights from the sameunderlying data sources to address problems at the appropriate level and scope. Therefore, an alignedoperational optimisation among the whole operation can be achieved by utilising state-of-the-art IIoTdata logging solutions and the analysis of real-time data. The application of a chain of causality in abottom-up approach allows us to transform high-detail, continuously collected data into KPIs with anadjustable level of detail while providing transparency for the processes involved.
4. Conclusions
The progressive development of information technology, the requirements of Industry 4.0, and thepursuit of sustainable development raise new challenges for companies currently operating on themarket. One of the possibilities of addressing the emerging requirements is an in-depth understandingof the processes conducted in a company, which is enabled by the use of appropriately selected KPIs,adopted for the specific needs of a given industry. Identifying KPIs as measures and metrics tailored tothe specificity of the mining industry to monitor processes and make decisions based on reliable datacollection is the basis for the sustainable development of the entire company. The analysis of industryreports showed that mining companies assign considerable importance to the aspect of sustainabledevelopment, taking into account both operational issues and environmental aspects in their activities,with the intent to improve the overall sustainability of the system.

Energies 2020, 13, 5169 16 of 20
Our article aimed at filling an identified lack of a unified and comprehensive KPI list in the area ofmining process monitoring for essential process perspectives such as machinery, work environment,and the human factor. In view of achieving this result, the main research questions for the SLR wereformulated, and several dimensions where KPIs can be applied were defined.
The literature review investigated two research questions—what are the main areas of theapplication of KPIs in an organisation, and what are the most commonly used KPIs for data-basedprocess optimisation in the mining industry. The result of the literature research was a substantialnumber of publications covering the subject matter of the KPIs, on the basis of which specificindicators for application in mining process management have been identified. However, we couldnot find comprehensive classification covering all the mentioned process perspectives, also taking intoconsideration the opportunities raised by the use of sensor data.
Our paper proposes an original classification of KPIs, covering the main vital issues in processmonitoring, such as operational issues (divided into technical, temporal, and spatial indicators), safety,and maintenance. In addition, we also pointed out the main interest groups using the indicators inthe decision-making processes. We defined the following persons, superintendent, shift supervisor,operator, and maintenance manager, and assigned them KPIs from the identified groups. In this study,we have also demonstrated the interdependencies between persons by using a chain of causality.Furthermore, we have clarified the point of view of persons on KPIs based on their area of responsibility.
When looking at the available data sources for KPIs, it becomes apparent that summarisingand abstracting is required to meet the expected levels of detail for the different people. During thethird industrial epoch, the acquisition and evaluation of operational data took place in a high levelof aggregation based on observation and paper reports, leading to a loss of detailed operationalinformation and relevant optimisation possibilities. The application of IIoT in mining operationsreveals the influences of decisions by the mine management on the other levels of hierarchy in anorganisation, as well as indicating the multiple dimensions of solving a specific problem depending onthe perspective of the person being tasked with this problem.
As part of further research, we have developed a questionnaire for the evaluation of the mostcritical performance indicators that can be used in the mining industry. The study was preparedinvolving mixed methods of research to collect both qualitative and quantitative data [70] and willbe distributed among mining practitioners. The survey is part of a research work carried out in theSmartHUB project, and its results will be used to select the most important indicators to be included inthe SmartHUB IIoT platform for process monitoring. The study was constructed with the assumptionthat practitioners and people directly related to the mining industry are the best sources of informationfor complementing and confirming the results of the literature research on the determination of KPIsfor the monitoring of mining processes. Moreover, a valuable aspect of further work will be theanalysis and evaluation of the effectiveness of applying the proposed indicators in the area of processmonitoring based on data from the released smartHUB platform.
Author Contributions: Conceptualisation, E.B. and P.G.; methodology, P.G., M.P.-S.; validation, P.G., M.P.-S., C.K.and T.Ö.; formal analysis, P.G., M.P.-S.; investigation, P.G., M.P-S., C.K., T.Ö.; resources, P.G., M.P.-S.; data curation,P.G., M.P.-S., writing—original draft preparation, E.B., P.G., M.P.-S., C.K., T.Ö.; writing—review and editing, E.B.,P.G.; supervision, E.B. All authors have read and agreed to the published version of the manuscript.
Funding: This research was funded by EIT Raw Materials, grant number 18327, project SmartHUB—smart courierfield data IIoT radio network and big data analytics.
Conflicts of Interest: The authors declare no conflict of interest.
References
1. Zhou, C.; Damiano, N.; Whisner, B.; Reyes, M. Industrial Internet of Things (IIoT) applications in undergroundcoal mines. Min. Eng. 2017, 69, 50–56. [CrossRef] [PubMed]
2. Lin, B.; Wu, W.; Song, M. Industry 4.0: Driving factors and impacts on firm’s performance: An empiricalstudy on China’s manufacturing industry. Ann. Oper. Res. 2019. [CrossRef]

Energies 2020, 13, 5169 17 of 20
3. Xu, L.D.; Xu, E.L.; Li, L. Industry 4.0: State of the art and future trends. Int. J. Prod. Res. 2018, 56, 2941–2962.[CrossRef]
4. Lu, Y. Industry 4.0: A survey on technologies, applications and open research issues. J. Ind. Inf. Integr. 2017,6, 1–10. [CrossRef]
5. Pereira, A.C.; Romero, F. A review of the meanings and the implications of the Industry 4.0 concept.Proc. Manuf. 2017, 13, 1206–1214. [CrossRef]
6. Alcácer, V.; Cruz-Machado, V. Scanning the Industry 4.0: A Literature Review on Technologies forManufacturing Systems. Eng. Sci. Technol. Int. J. 2019, 22, 899–919. [CrossRef]
7. Bertayeva, K.; Panaedova, G.; Natocheeva, N.; Kulagovskaya, T.; Belyanchikova, T. Industry 4.0 in the miningindustry: Global trends and innovative development. E3S Web Conf. 2019, 135. [CrossRef]
8. Lööw, J.; Abrahamsson, L.; Johansson, J. Mining 4.0—The Impact of New Technology from a Work PlacePerspective. Min. Metall. Explor. 2019, 36, 701–707. [CrossRef]
9. Badawy, M.; El-Aziz, A.A.A.; Idress, A.M.; Hefny, H.; Hossam, S. A survey on exploring key performanceindicators. Future Comput. Inf. J. 2016, 1, 47–52. [CrossRef]
10. Ralston, J.; Reid, D.; Hargrave, C.; Hainsworth, D. Sensing for advancing mining automation capability:A review of underground automation technology development. Int. J. Min. Sci. Technol. 2014, 24, 305–310.[CrossRef]
11. Sganzerla, C.; Seixas, C.; Conti, A. Disruptive Innovation in Digital Mining. Proc. Eng. 2016, 138, 64–71.[CrossRef]
12. Singh, A.; Kumar, D.; Hötzel, J. IoT Based information and communication system for enhancing undergroundmines safety and productivity: Genesis, taxonomy and open issues. Ad. Hoc. Netw. 2018, 78, 115–129.[CrossRef]
13. Gautham, B.P.; Reddy, S.; Runkana, V. Future of Mining, Mineral Processing and Metal Extraction Industry.Trans. Indian Inst. Met. 2019, 72, 2159–2177. [CrossRef]
14. Skrzypkowski, K. The influence of room and pillar method geometry on the deposit utilization rate and rockbolt load. Energies 2019, 12, 4770. [CrossRef]
15. Torkko, M.; Katajavuori, N.; Linna, A.; Juppo, A.M. The utilisation of quality KPIs in the pharmaceuticalindustry. J. Pharm. Innov. 2014, 9, 175–182. [CrossRef]
16. Lu, D.; Asian, S.; Ertek, G.; Sevinc, M. Mind the perception gap An integrative performance managementframework for service supply chains. Int. J. Phys. Distrib. Logist. Manag. 2019, 49, 33–51. [CrossRef]
17. Torbacki, W.; Kijewska, K. Identifying Key Performance Indicators to be used in Logistics 4.0 and Industry4.0 for the needs of sustainable municipal logistics by means of the DEMATEL method. In Proceedingsof the 3rd International Conference Green Cities—Green Logistics For Greener Cities, Szczecin, Poland,13–14 September 2018; Iwan, S., Thompson, R.G., Kijewska, K., Eds.; Elsevier Science Bv.: Amsterdam,The Netherlands, 2019; Volume 39, pp. 534–543.
18. Hedvicáková, M.; Král, M. Benefits of KPIS For Industry Sector Evaluation: The Case Study From The CzechRepublic. E+M Ekon. Manag. 2019, 22, 97–113. [CrossRef]
19. Zámecník, R. The Qualitative Indicators in Human Resource Accounting. Mark. Manag. Innov. 2016, 4,325–341.
20. Gabcanová, I. Human Resources Key Performance Indicators. J. Compet. 2012, 4, 117–128. [CrossRef]21. Voronov, A.; Voronov, Y.; Voronov, A.; Demirel, N. Operation Quality Indicators for Shovel-Truck Systems at
Open-Pit Coal Mines. In Proceedings of the IV International Innovative Mining Symposium, Kemerovo,Russia, 14–16 October 2019; EDP Sciences: Les Ulis, France, 2019; Volume 105.
22. Bhadani, K.; Asbjornsson, G.; Hulthen, E.; Evertsson, M. Development and implementation of keyperformance indicators for aggregate production using dynamic simulation. Miner. Eng. 2020, 145.[CrossRef]
23. Voronov, Y.; Voronov, A.; Voronov, A. Quality Criterion of the Loading and Transport System Operation atOpen-Pit Mines. In Proceedings of the IV International Innovative Mining Symposium, Kemerovo, Russia,14–16 October 2019; EDP Sciences: Les Ulis, France, 2019; Volume 105.

Energies 2020, 13, 5169 18 of 20
24. Fisseler, D.; Kemény, Z.; Reiners, R. Monitoring and Control Framework for Business Processes in UbiquitousEnvironments. In Proceedings of the 2016 Intl IEEE Conferences on Ubiquitous Intelligence Computing,Advanced and Trusted Computing, Scalable Computing and Communications, Cloud and Big DataComputing, Internet of People, and Smart World Congress (UIC/ATC/ScalCom/CBDCom/IoP/SmartWorld),Toulouse, France, 18–21 July 2016; pp. 863–868.
25. Mardonova, M.; Choi, Y. Review of Wearable Device Technology and Its Applications to the Mining Industry.Energies 2018, 11, 547. [CrossRef]
26. Skrzypkowski, K.; Korzeniowski, W.; Zagórski, K.; Zagórska, A. Adjustment of the yielding system ofmechanical rock bolts for room and pillar mining method in stratified rock mass. Energies 2020, 13, 2082.[CrossRef]
27. Aksu, U.; Schunselaar, D.M.M.; Reijers, H.A. Automated Prediction of Relevant Key Performance Indicatorsfor Organisations. In Business Information Systems, PTI; Abramowicz, W., Corchuelo, R., Eds.; Springer-Verlag:Berlin/Heidelberger, Germany, 2019; Volume 353, pp. 283–299.
28. Sathananthan, S. Data valuation considering knowledge transformation, process models and data models.In Proceedings of the 2018 12th International Conference on Research Challenges In Information Science(RCIS), New York, NY, USA, 29–31 May 2018.
29. Kaganski, S.; Majak, J.; Karjust, K.; Toompalu, S. Implementation of Key Performance Indicators SelectionModel as Part of the Enterprise Analysis Model. In Proceedings of the Manufacturing Systems 4.0, The 50thCIRP Conference on Manufacturing Systems, Taichung City, Taiwan, 3–5 May 2017; Tseng, M.M., Tsai, H.Y.,Wang, Y., Eds.; Elsevier Science Bv.: Amsterdam, The Netherlands, 2017; Volume 63, pp. 283–288.
30. Grozdanovic, M.; Savic, S.; Marjanovic, D. Assessment of the key factors for ergonomic design of managementinformation systems in coal mines. Int. J. Min. Reclam. Environ. 2015, 29, 96–111. [CrossRef]
31. Alkan, B.; Bullock, S. Assessing operational complexity of manufacturing systems based on algorithmiccomplexity of key performance indicator time-series. J. Oper. Res. Soc. 2020, 1–15. [CrossRef]
32. Aditya, P.; Kumar, U.; Galar, D.; Stenström, C. Performance measurement and management for maintenance:A literature review. J. Qual. Maint. Eng. 2015, 21, 2–33.
33. Visser, W.F. A Blueprint for Performance-Driven Operations Management. Min. Metall. Explor. 2020, 37,823–831. [CrossRef]
34. Bouffard, S.C. Benefits realised and lessons learned from modeling the production capacity of the JansenPotash Project. Miner. Process. Extr. Metall. Rev. 2020, 41, 50–58. [CrossRef]
35. Navarra, A.; Alvarez, M.; Rojas, K.; Menzies, A.; Pax, R.; Waters, K. Concentrator operational modes inresponse to geological variation. Miner. Eng. 2019, 134, 356–364. [CrossRef]
36. Otto, T.J.; Musingwini, C. A spatial mine-to-plan compliance approach to improve alignment of short- andlong-term mine planning at open pit mines. J. South. Afr. Inst. Min. Metall. 2019, 119, 253–259. [CrossRef]
37. Jena, M.C.; Mishra, S.K.; Moharana, H.S. Application of Industry 4.0 to enhance sustainable manufacturing.Environ. Prog. Sust. Energy 2020, 39, 1–11. [CrossRef]
38. Viveros Gunckel, P.; Kristjanpoller, F.; López-Campos, M.; Crespo Márquez, A.; Pascual, R. Graphical analysisfor overall effectiveness management: A graphical method to support operation and maintenanceperformance assessment. Qual. Reliab. Eng. Int. 2018, 34, 1615–1632. [CrossRef]
39. Pasch, O.; Uludag, S. Optimization of the load-and-haul operation at an opencast colliery. J. South. Afr. Inst.Min. Metall. 2018, 118, 449–456. [CrossRef]
40. Olkiewicz, M.; Wolniak, R.; Ostapko, B. The Analysis of Dependencies Between Extraction And ResourceConsumption in 2008–2014 on the Example of Glisno Gravel Pit. Arch. Min. Sci. 2018, 63, 801–812. [CrossRef]
41. Li, C.; Runge, K.; Shi, F.; Farrokhpay, S. Effect of froth rheology on froth and flotation performance. Miner. Eng.2018, 115, 4–12. [CrossRef]
42. Bezminabadi, S.N.; Ramezanzadeh, A.; Jalali, S.-M.E.; Tokhmechi, B.; Roustaei, A. Effect of Rock Propertieson Rop Modeling Using Statistical and Intelligent Methods: A Case Study of an Oil Well in Southwest ofIran. Arch. Min. Sci. 2017, 62, 131–144. [CrossRef]
43. Sebutsoe, T.C.; Musingwini, C. Characterising a mining production system for decision-making purposes ina platinum mine. J. South. Afr. Inst. Min. Metall. 2017, 117, 199–206. [CrossRef]
44. Bester, M.; Russell, T.; van Heerden, J.; Carey, R. Reconciliation of the mining value chain—Mine to design asa critical enabler for optimal and safe extraction of the mineral reserve. J. South. Afr. Inst. Min. Metall. 2016,116, 407–411. [CrossRef]

Energies 2020, 13, 5169 19 of 20
45. Fourie, H. Improvement in the overall efficiency of mining equipment: A case study. J. South. Afr. Inst.Min. Metall. 2016, 116, 275–281. [CrossRef]
46. Petit, P.J. Business optimisation for platinum mining projects and operations. J. South. Afr. Inst. Min. Metall.2016, 116, 123–130. [CrossRef]
47. Zaruba Natalyi, A.; Egorova Natalyi, N. Lean Governance as a Condition for the Creation of IntellectualCoal Industry. In Proceedings of the 8th Russian-Chinese Symposium Coal In The 21st Century: Mining,Processing, Safety, Kemerovo, Russia, 10–12 October 2016; Tailakov, O.V., Ed.; Atlantis Press: Paris, France,2016; Volume 92, pp. 39–44.
48. Nikulin, C.; Ulloa, A.; Carmona, C.; Creixell, W. A Computer-Aided Application For Modeling AndMonitoring Operational And Maintenance Information In Mining Trucks. Arch. Min. Sci. 2016, 61, 695–708.[CrossRef]
49. Prakash, A.; Murthy, V.M.S.R.; Singh, K.B. A new rock cuttability index for predicting key performanceindicators of surface miners. Int. J. Rock Mech. Min. Sci. 2015, 77, 339–347. [CrossRef]
50. Segopolo, P.R. Optimization of shuttle car utilisation at an underground coal mine. J. South. Afr. Inst.Min. Metall. 2015, 115, 285–296. [CrossRef]
51. Czaplicka-Kolarz, K.; Burchart-Korol, D.; Turek, M.; Borkowski, W. Model of Eco-Efficiency Assessment ofMining Production Processes. Arch. Min. Sci. 2015, 60, 477–486. [CrossRef]
52. Dauber, C.; Bendrat, N. Key performance indicators—A tool to assess ICT applications in underground coalmines. J. South. Afr. Inst. Min. Metall. 2014, 114, 1017–1022.
53. Schoevaerts, B.; Balg, C.; Brown, S.; Van Zyl, C. Fast, safe, and fully mechanised installation of high-tensilechain-link mesh for underground support. J. South. Afr. Inst. Min. Metall. 2012, 112, 127–133.
54. Tan, P. Modeling and control of copper loss in smelting slag. JOM 2011, 63, 51–57. [CrossRef]55. Mkhwanazi, D. Optimizing LHD utilisation. J. South. Afr. Inst. Min. Metall. 2011, 111, 273–280.56. Marais, C.; Aldrich, C. The estimation of platinum flotation grade from froth image features by using artificial
neural networks. J. South. Afr. Inst. Min. Metall. 2011, 111, 81–85.57. BHP Sustainability Report. 2019. Available online: https://www.bhp.com/-/media/documents/investors/
annual-reports/2019/bhpsustainabilityreport2019.pdf (accessed on 26 June 2020).58. Rio Tinto. Sustainability Reporting. Available online: https://www.riotinto.com/sustainability/sustainability-
reporting (accessed on 25 June 2020).59. Glencore. Sustainability Reporting Highlights 2019. Available online: https://www.glencore.com/
dam:jcr/c7f6c5fc-b275-4e12-9448-de5302805781/2019-Glencore-Sustainability-Highlights--.pdf (accessed on22 June 2020).
60. Vale. Sustainability Report 2019. Available online: http://www.vale.com/EN/investors/information-market/annual-reports/sustainability-reports/Sustainability%20Reports/Relatorio_sustentabilidade_vale_2019_alta_en.pdf (accessed on 29 June 2020).
61. Anglo American. Sustainability Report. 2019. Available online: https://www.angloamerican.com/~/media/
Files/A/Anglo-American-Group/PLC/investors/annual-reporting/2020/aa-sustainability-report-2019-v1.pdf (accessed on 23 June 2020).
62. Fortescue Metal Group Ltd. Annual Report FY19. Available online: https://www.fmgl.com.au/docs/default-source/annual-reporting-suite/fy19-annual-report.pdf (accessed on 29 June 2020).
63. Fresnillo PLC Annual Report and Accounts. Available online: http://www.fresnilloplc.com/media/451923/
fres-33085-annual-report-2019-web.pdf (accessed on 23 June 2020).64. Newmont. Sustainability Report Performance Data. 2019. Available online: https://s24.q4cdn.com/382246808/
files/doc_downloads/2019/sustainability/Newmont-2019-sustainability-report-ESG-tables.pdf (accessed on26 June 2020).
65. Boliden Annual and Sustainability Report 2019. A Sustainable Future with Metals. 2019. Available online:https://vp217.alertir.com/afw/files/press/boliden/202003107199-1.pdf (accessed on 22 June 2020).
66. First Quantum Minerals Environment, Safety and Social Data Report. 2019. Available online:https://s24.q4cdn.com/821689673/files/doc_downloads/environmental-health-and-safety/2019-Environment-Safety-Social-Data-Report-FINAL.pdf (accessed on 29 June 2020).
67. Lumley, G.; McKee, M. Mining for Efficiency; PricewaterhouseCoopers: London, UK, 2014.68. Dougall, A.W.; Mmola, T.M. Identification of key performance areas in the southern African surface mining
delivery environment. J. South. Afr. Inst. Min. Metall. 2015, 115, 1001–1006. [CrossRef]

Energies 2020, 13, 5169 20 of 20
69. Korski, J.; Tobór-Osadnik, K.; Wyganowska, M. Mining machines effectiveness and OEE Indicator. IOP Conf.Ser. Mater. Sci. Eng. 2017, 268. [CrossRef]
70. Johnson, R.B.; Onwuegbuzie, A.J. Toward a Definition of Mixed Methods Research. J. Mix. Methods Res.2007, 1, 112–133. [CrossRef]
© 2020 by the authors. Licensee MDPI, Basel, Switzerland. This article is an open accessarticle distributed under the terms and conditions of the Creative Commons Attribution(CC BY) license (http://creativecommons.org/licenses/by/4.0/).
Copyright © 2022 FDOKUMEN