KEY PERFORMANCE INDICATORS FOR THE EVALUATION ...
10
Proceedings of the 2012 Winter Simulation Conference C. Laroque, J. Himmelspach, R. Pasupathy, O. Rose, and A.M. Uhrmacher, eds KEY PERFORMANCE INDICATORS FOR THE EVALUATION OF BALANCED LINES Lothar März LOM Innovation GmbH & Co. KG Kemptener Str. 99 D-88131 Lindau (Lake Constance), GERMANY ABSTRACT Sales and operations planning and production planning for vehicle production are carried out mainly with cascading planning processes. This paper focuses on planning of the final assembly of truck manufacturers. In this industrial sector, mixed-model assembly lines show very different capacity requirements according to the product because of high product variants and shifting product mixes. The main task of line balancing is to evenly utilize the line staff. Market requirements and process planning both influence the utilization of staff. Furthermore, peaks in capacity can be met by flexible use of employees. A system of key performance indicators for the evaluation of balanced lines in truck assembly is presented, where simulation software is necessary to include employee flexibility. 1 INTRODUCTION Global truck manufacturers are faced with a number of challenges. They have to be aware of growth trends in emerging markets, and at the same time stay alert to continuous market cyclicality. Market cyclicality occurs in both mature and emerging markets. To manage the up and downs, original equipment manufacturers (OEMs) have to be flexible. Manufacturers in mature markets have established processes and measures to increase flexibility. Nevertheless, especially for the capital-intensive manufacturing industry, market cyclicality still presents huge challenges for internally focused strategies like flexible employment relationships, variability of fixed costs or fractal factory concepts (KPMG 2011). Truck assembly represents a cost-management factor with high cost-reduction potential (Mercer Management Consulting 2004). Up to 75% of module manufacturing and module assembly is done by suppliers, whereas final assembly is realized at least by 95% of the OEMs. On one hand, the OEMs have to ensure high flexibility to assemble all required trucks. Only high labor intensity, not automation, can provide this flexibility (Boysen, Fliedner, and Scholl 2009). On the other hand, manual work is expensive. The main task in truck assembly is to use staff as efficiently as possible. The question is: What is efficient? Of course, if the process requirements are always the same, it is easy to assign staff to processes in a way that means they are utilized by 100%. But the process requirements change from truck to truck and over time, as can be seen in Figure 1. Even more, it can be the case that one truck will lead to process peaks in one staff team and underutilization in another staff team and the next truck will lead to a contrary situation. This depends on the equipment and the corresponding assembly processes. It must be noted that the assembly of a truck follows restrictions, e.g. mandatory process consecutions, which cannot be ignored. The process planning must respect these constraints and the structure of the assembly line. Hence, the changes in process requirements for every staff team depend on market cyclicality and process planning. But if the process requirements are constant, the potential flexibility of a staff team has no effect. On the contrary, an organization with low flexibility and alternating work content will lead to high labor costs. 978-1-4673-4780-8/12/$31.00 ©2012 IEEE 1321 978-1-4673-4782-2/12/$31.00 ©2012 IEEE
-
Upload
khangminh22 -
Category
Documents
-
view
0 -
download
0
Transcript of KEY PERFORMANCE INDICATORS FOR THE EVALUATION ...
Proceedings of the 2012 Winter Simulation Conference C. Laroque, J. Himmelspach, R. Pasupathy, O. Rose, and A.M. Uhrmacher, eds
KEY PERFORMANCE INDICATORS FOR THE EVALUATION OF BALANCED LINES
Lothar März
LOM Innovation GmbH & Co. KG Kemptener Str. 99
D-88131 Lindau (Lake Constance), GERMANY
ABSTRACT
Sales and operations planning and production planning for vehicle production are carried out mainly with cascading planning processes. This paper focuses on planning of the final assembly of truck manufacturers. In this industrial sector, mixed-model assembly lines show very different capacity requirements according to the product because of high product variants and shifting product mixes. The main task of line balancing is to evenly utilize the line staff. Market requirements and process planning both influence the utilization of staff. Furthermore, peaks in capacity can be met by flexible use of employees. A system of key performance indicators for the evaluation of balanced lines in truck assembly is presented, where simulation software is necessary to include employee flexibility.
1 INTRODUCTION
Global truck manufacturers are faced with a number of challenges. They have to be aware of growth trends in emerging markets, and at the same time stay alert to continuous market cyclicality. Market cyclicality occurs in both mature and emerging markets. To manage the up and downs, original equipment manufacturers (OEMs) have to be flexible. Manufacturers in mature markets have established processes and measures to increase flexibility. Nevertheless, especially for the capital-intensive manufacturing industry, market cyclicality still presents huge challenges for internally focused strategies like flexible employment relationships, variability of fixed costs or fractal factory concepts (KPMG 2011).
Truck assembly represents a cost-management factor with high cost-reduction potential (Mercer Management Consulting 2004). Up to 75% of module manufacturing and module assembly is done by suppliers, whereas final assembly is realized at least by 95% of the OEMs. On one hand, the OEMs have to ensure high flexibility to assemble all required trucks. Only high labor intensity, not automation, can provide this flexibility (Boysen, Fliedner, and Scholl 2009). On the other hand, manual work is expensive. The main task in truck assembly is to use staff as efficiently as possible.
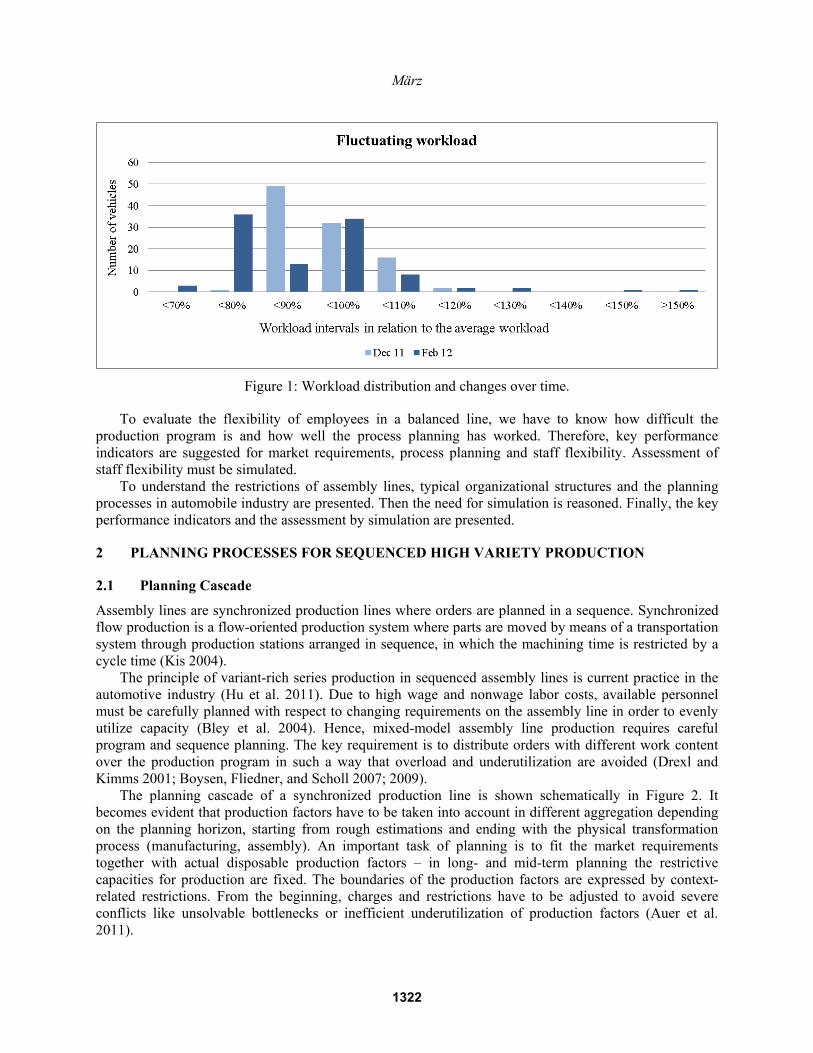
The question is: What is efficient? Of course, if the process requirements are always the same, it is easy to assign staff to processes in a way that means they are utilized by 100%. But the process requirements change from truck to truck and over time, as can be seen in Figure 1. Even more, it can be the case that one truck will lead to process peaks in one staff team and underutilization in another staff team and the next truck will lead to a contrary situation. This depends on the equipment and the corresponding assembly processes. It must be noted that the assembly of a truck follows restrictions, e.g. mandatory process consecutions, which cannot be ignored. The process planning must respect these constraints and the structure of the assembly line. Hence, the changes in process requirements for every staff team depend on market cyclicality and process planning. But if the process requirements are constant, the potential flexibility of a staff team has no effect. On the contrary, an organization with low flexibility and alternating work content will lead to high labor costs.
978-1-4673-4780-8/12/$31.00 ©2012 IEEE 1321978-1-4673-4782-2/12/$31.00 ©2012 IEEE
März
Figure 1: Workload distribution and changes over time.
To evaluate the flexibility of employees in a balanced line, we have to know how difficult the production program is and how well the process planning has worked. Therefore, key performance indicators are suggested for market requirements, process planning and staff flexibility. Assessment of staff flexibility must be simulated.
To understand the restrictions of assembly lines, typical organizational structures and the planning processes in automobile industry are presented. Then the need for simulation is reasoned. Finally, the key performance indicators and the assessment by simulation are presented.
2 PLANNING PROCESSES FOR SEQUENCED HIGH VARIETY PRODUCTION
2.1 Planning Cascade
Assembly lines are synchronized production lines where orders are planned in a sequence. Synchronized flow production is a flow-oriented production system where parts are moved by means of a transportation system through production stations arranged in sequence, in which the machining time is restricted by a cycle time (Kis 2004).
The principle of variant-rich series production in sequenced assembly lines is current practice in the automotive industry (Hu et al. 2011). Due to high wage and nonwage labor costs, available personnel must be carefully planned with respect to changing requirements on the assembly line in order to evenly utilize capacity (Bley et al. 2004). Hence, mixed-model assembly line production requires careful program and sequence planning. The key requirement is to distribute orders with different work content over the production program in such a way that overload and underutilization are avoided (Drexl and Kimms 2001; Boysen, Fliedner, and Scholl 2007; 2009).
The planning cascade of a synchronized production line is shown schematically in Figure 2. It becomes evident that production factors have to be taken into account in different aggregation depending on the planning horizon, starting from rough estimations and ending with the physical transformation process (manufacturing, assembly). An important task of planning is to fit the market requirements together with actual disposable production factors – in long- and mid-term planning the restrictive capacities for production are fixed. The boundaries of the production factors are expressed by context-related restrictions. From the beginning, charges and restrictions have to be adjusted to avoid severe conflicts like unsolvable bottlenecks or inefficient underutilization of production factors (Auer et al. 2011).
1322

März The initial point of the planning cascade is the definition – which brands the company want to
produce. Normally, the decisions are based on market analysis. The brand strategy will lead to annual and budget planning with sales forecast as a result. This planning is a rolling forecast in a period of up to 7–10 years.
In the next step, sales planning precises models by main criteria, like motorization, auto body, gear drive etc., and allocates possible production sites to models and production volumes. At this stage, the determination of a production site is governed by location-related costs and local conditions for existing or planned production sites and suppliers.
Sales prognosis, installation rates, and monthly production and sales quantities serve as input for production program planning. Restrictions which have to be taken into account are minimum line load resulting from the model mix problem (provision for the production factor resources), the capacity of plants with regard to annual working hours (workforce), technical solutions in the line (equipment) and potential bottlenecks on the supplier side (material).
To understand the production program planning, we have to explain the process planning, which determines the assignments of processes to staff teams. All leveling efforts depend on a given process planning configuration.
Figure 2: Planning tasks and interrelationships
2.2 Process Planning
Process planning is illustrated with an example from the car assembly. Planning the assembly process is done by means of “time-path diagrams,” depicting the physical path of a worker over time and chronologically measuring and evaluating each step. Based on the time requirements, each step can be assigned to a point of the assembly line and material withdrawal and the distances between material withdrawal and the assembly have to be bridged. Since the car-body moves with the cycle time, extra
1323
März
stretches occur. The personnel periodically carry out similar assembly steps, necessitating that all steps at a station add up to fit within the cycle-time in order to allow cyclical processing (Mayrhofer, März, and Sihn 2011).
The number of process steps and the overall duration of the assembly process vary depending on the product variant. Due to those differences, overload can occur if variants with high time requirements are assembled successively. This is one of the typical cases necessitating production program leveling.
The single process steps can be assigned to an assembly operation as a whole, i.e., the process steps of material withdrawal, moving to assembly site, preparation of the assembly, catching hold of auxiliary materials, etc. are combined into one assignment (i.e. assembly of a rear-view mirror). Variants with different process times are represented as the same assignment, with accordingly adjusted assembly time and optional variants by means of distinct assembly operations. However, not every assignment has to be completed within a work cycle. Either the preceding and subsequent assignments are so short that overlong accomplishments can be performed without difficulty, or alternatively two or more workers (i.e., n) are deployed to work overlapping on every second or nth vehicle to be assembled.
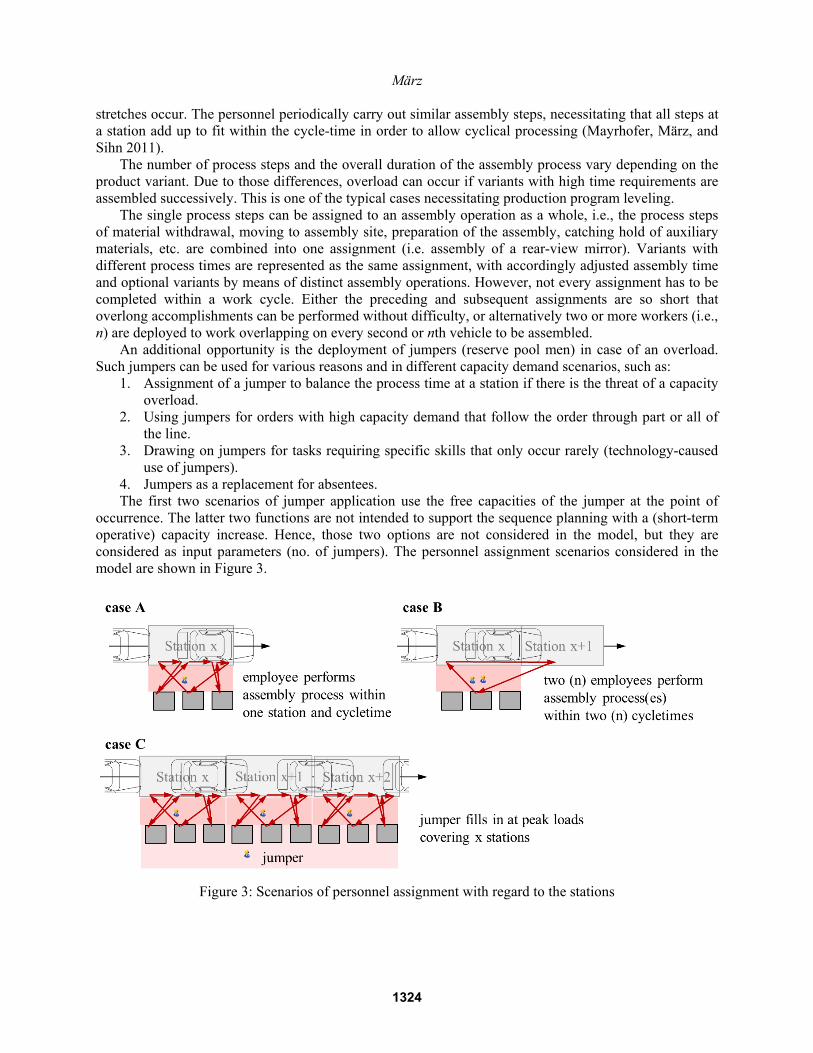
An additional opportunity is the deployment of jumpers (reserve pool men) in case of an overload. Such jumpers can be used for various reasons and in different capacity demand scenarios, such as:
1. Assignment of a jumper to balance the process time at a station if there is the threat of a capacity overload.
2. Using jumpers for orders with high capacity demand that follow the order through part or all of the line.
3. Drawing on jumpers for tasks requiring specific skills that only occur rarely (technology-caused use of jumpers).
4. Jumpers as a replacement for absentees. The first two scenarios of jumper application use the free capacities of the jumper at the point of
occurrence. The latter two functions are not intended to support the sequence planning with a (short-term operative) capacity increase. Hence, those two options are not considered in the model, but they are considered as input parameters (no. of jumpers). The personnel assignment scenarios considered in the model are shown in Figure 3.
Figure 3: Scenarios of personnel assignment with regard to the stations
1324

März
2.3 Slotting, Balancing and Sequencing
Production program planning is usually continuous. The allocation of orders to week or day periods or to shifts is called slotting. In this planning step the production program is split up into daily or weekly order pools. At this point planned or real customer orders have usually been placed. Sometimes, orders within the daily or weekly order pools are not fully specified dummy orders. Their specification level includes only items such as engine type or number of axles for truck assemblies. If a real order is placed by a customer, an eligible dummy order is replaced and hence will turn into a fully specified customer order (März et al. 2010).
Cyclical planning may require slotting until the sequence is fixed, which has a smoothing effect on material and capacitive dependent criteria. Under consideration of more detailed limits, single orders can be moved to other production periods; such leveling shifts are called balancing. The determination of a sequence assigns a defined production position to every order of the stock (also called pool) and hence is also called sequencing. Any later changes in the sequence lead to higher expenses, because the availability of components cannot be guaranteed. The whole workflow of slotting, balancing, sequencing, and re-sequencing is shown in Figure 4.
Figure 4: Planning process of sequenced production lines
The implementation method and sequencing goals can differ, leading to three different classes of optimization model: level scheduling, mixed-model scheduling and car sequencing. Level scheduling is derived from the Toyota production system (Monden, 1993) and targets a level demand for materials in the production sequence (Boysen 2005). Mixed-model sequencing aims at avoiding resource capacity overloads of the flow system, which are minimized by detailed timing of the variants regarding their specific process duration at every station, defining the length of the station and cycle time (Wester and Kilbridge 1964; Bard, Shtub, and Joshi 1994; Tsai 1995; Scholl, Klein, and Domschke 1998). Car sequencing tries to avoid these detailed entries by prohibiting partial sequences with capacity overload via H0:N0 sequence rules. A sequence rule of 1:3 relating to the sunroof option states that of three back-to-
1325
März
back components, only one can have the sunroof option. Otherwise capacity overload occurs. Solution techniques for car sequencing can be found in Drexl and Kimms (2001), Drexl, Kimms, and Matthießen (2006), Gravel, Gagné, and Price (2006), and Fliedner and Boysen (2008). Most European manufacturers use car sequencing to avoid the complex data acquisition needed for mixed-model sequencing.
2.4 The Need for Simulation
Present sequence planning systems are able to accommodate planning objectives, more or less, by means of sequencing rules that stem from a multitude of vehicle criteria. Yet sequencing does not always prevent dynamic load peaks at certain stations, since sequencing rules are not created from a forecast but are based on experiences from the line. Once an excessive peak load as a result of the sequence of vehicle types and/or configuration reaches a team, this specific overload can be avoided in the future by defining a rule that will prevent this specific scenario causing an overload (Solnon et al. 2008). A variety of possible vehicle configurations can result in an overload and it is likely impossible to find a solution without any overload in acceptable computation time (Kis 2004). In addition, increased processing time requirements which become apparent in the course of sequences built in the future are not detected. Reasons for this are rare vehicle sequences or shifts in the proportion of certain product types or configuration variants.
Hence, a preview of processing time requirements per cycle and team is of high value. A forecast of the impact on employee workload requires variables representing additional degrees of freedom stemming from the organization of labor within each team (i.e., negative or positive drift). Organizational measures such as “roll-over teams,” with different characteristics regarding the execution of assembly tasks in comparison to station-bound teams, should be part of the analysis. Further, the extent of the individual processes that form a task affects the cycle of the line.
It is daily practice that process time requirements exceed the capacity of the teams. The simulation is aimed at accurately forecasting process time requirements and resulting workloads of the assembly. This is the foundation of exact personal assignment planning and especially alerts the planner if provisions with respect to wo/manpower (i.e., making use of a jumper) are necessary. Hence, demand for assembly personnel is known even before assembly starts. Necessary measures can be taken to fulfill those capacity requirements. A simulation application is geared to personnel assignment planning in daily operations (shift) as well as in medium-term (weekly preview) and strategic planning.
With the use of simulation, transparency in the analysis and evaluation of planning data increases. But to be able to value the flexibility and the potential of the simulation-based forecast, key performance indicators are necessary, which will help to judge how difficult the production program is. For the assessment of balancing concepts it is necessary to consider the different influences at the different planning levels which were explained in more detail above.
3 KEY PERFORMANCE INDICATORS
3.1 Market Indicators
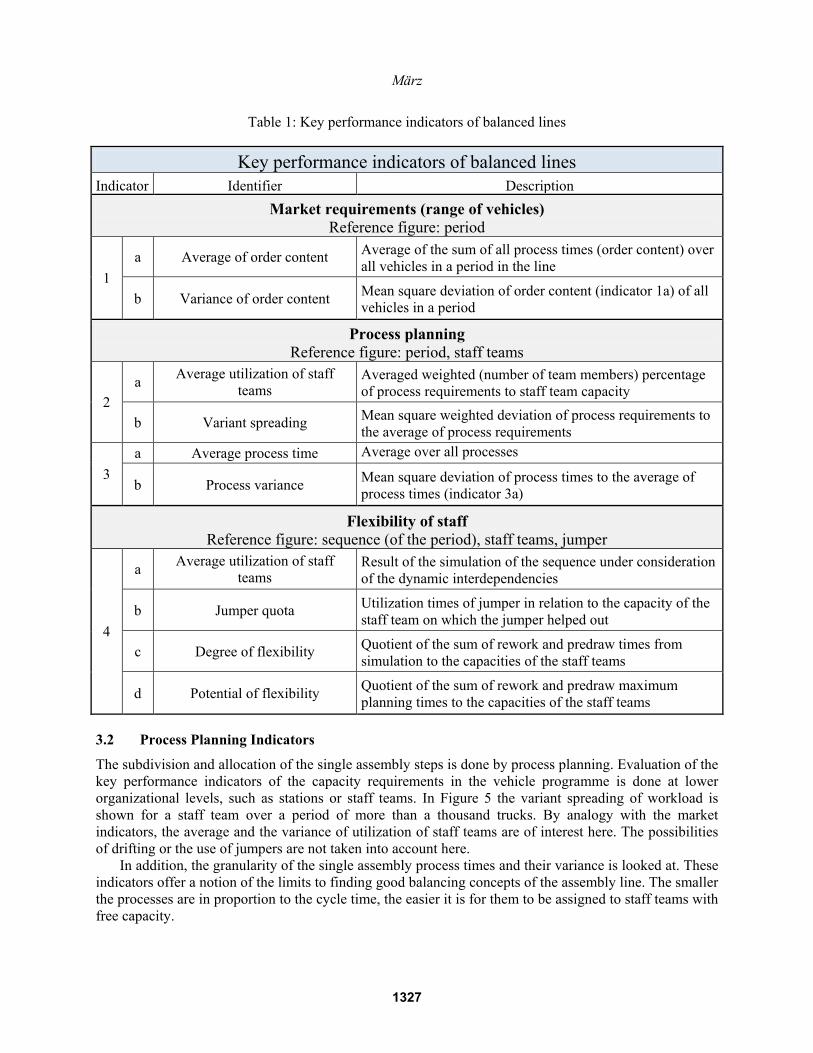
The key performance indicator for assessment of market requirements represents the vehicle program to be made within the chosen period concerning the workloads for the whole assembly line. The average workload is of interest to be able to judge changes of capacity requirements. However, the variance is the main trigger for loss of productiveness in the line and, hence, is to be confronted with the following key performance indicators of process planning and the employee’s flexibility. Table 1 gives an overview of the developed key performance indicators for the assessment of production lines.
1326
März
Table 1: Key performance indicators of balanced lines
Key performance indicators of balanced lines Indicator Identifier Description
Market requirements (range of vehicles) Reference figure: period
1 a Average of order content Average of the sum of all process times (order content) over
all vehicles in a period in the line
b Variance of order content Mean square deviation of order content (indicator 1a) of all vehicles in a period
Process planning Reference figure: period, staff teams
2 a Average utilization of staff
teams Averaged weighted (number of team members) percentage of process requirements to staff team capacity
b Variant spreading Mean square weighted deviation of process requirements to the average of process requirements
3 a Average process time Average over all processes
b Process variance Mean square deviation of process times to the average of process times (indicator 3a)
Flexibility of staff Reference figure: sequence (of the period), staff teams, jumper
4
a Average utilization of staff teams
Result of the simulation of the sequence under consideration of the dynamic interdependencies
b Jumper quota Utilization times of jumper in relation to the capacity of the staff team on which the jumper helped out
c Degree of flexibility Quotient of the sum of rework and predraw times from simulation to the capacities of the staff teams
d Potential of flexibility Quotient of the sum of rework and predraw maximum planning times to the capacities of the staff teams
3.2 Process Planning Indicators
The subdivision and allocation of the single assembly steps is done by process planning. Evaluation of the key performance indicators of the capacity requirements in the vehicle programme is done at lower organizational levels, such as stations or staff teams. In Figure 5 the variant spreading of workload is shown for a staff team over a period of more than a thousand trucks. By analogy with the market indicators, the average and the variance of utilization of staff teams are of interest here. The possibilities of drifting or the use of jumpers are not taken into account here.
In addition, the granularity of the single assembly process times and their variance is looked at. These indicators offer a notion of the limits to finding good balancing concepts of the assembly line. The smaller the processes are in proportion to the cycle time, the easier it is for them to be assigned to staff teams with free capacity.
1327

März
Figure 5: Variant spreading of workload of a staff team
3.3 Employees’ Flexibility Indicators
The shown key performance indicators can be obtained from the available enterprise resource planning systems. To analyse the employee’s flexibility a simulation is necessary because of the huge number of data to be processed and the mutual dependencies. The main focus is still utilization of the core staff, but this time drift behaviour will be taken into account. In this way, ascertained key performance indicators can reflect the circumstances in the line in a more realistic way.
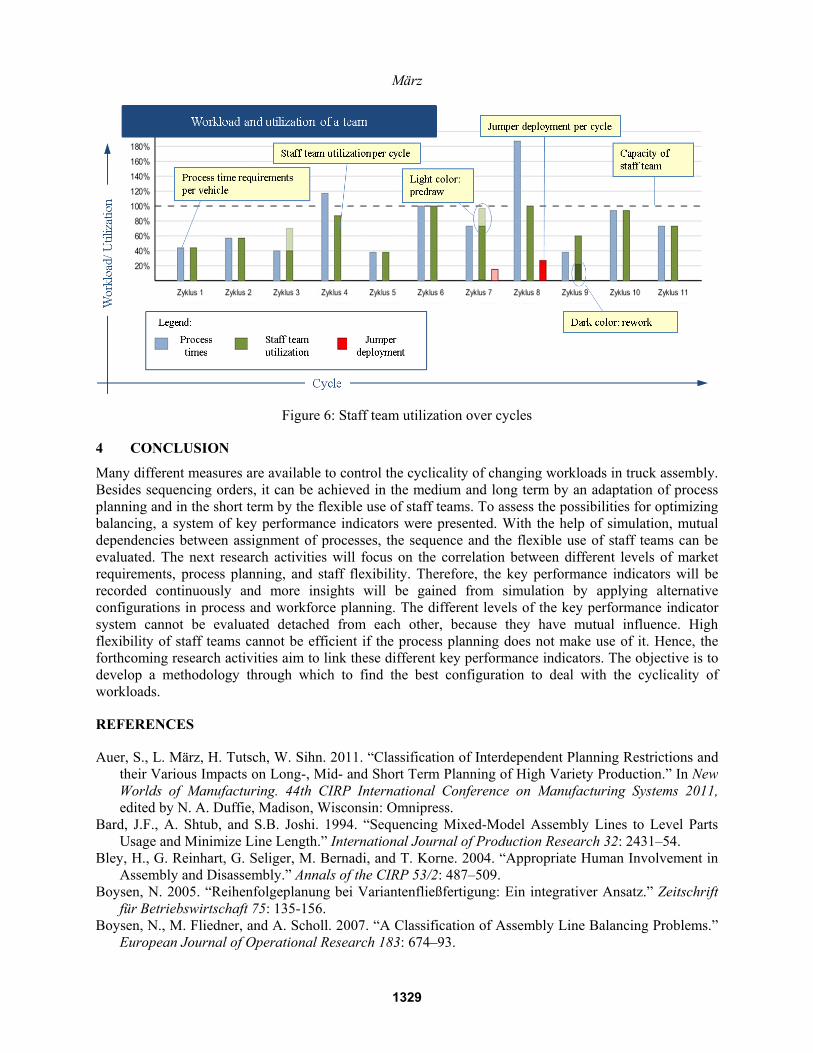
In addition, the need for jumpers must be valued, because this is often necessary to cover capacity “hot spots.” Due to the higher qualification of the jumper, add-on costs and productiveness losses from longer travel times occur. Moreover, the key performance indicators allow analysis of the drift behavior of the staff teams and the portion of predraw and rework is compared with the utilization and confronted, in addition, with the given drift possibilities. The latter can deliver clues about adaptation of the production structure or changes in the organization of the employees, so that, e.g., fewer mutual impediments take place. Figure 6 shows process time requirements and the utilization of a team per cycle.
Each cycle is assigned to a vehicle; the required process time represents the assigned work content which results for the current vehicle in a cycle. One set of bars visualizes the work content in relation to the capacity of the team. Another set of bars shows the utilization of the team in the cycle for the vehicle. Work content can exceed the 100% level of staff capacity. In this case, the additional work is visualized as follows:
• negative drift of the team (predraw) • negative drift of the jumper group • use of the jumper group in the cycle • positive drift of the team (rework) • positive drift of the jumper group
1328
März
Figure 6: Staff team utilization over cycles
4 CONCLUSION
Many different measures are available to control the cyclicality of changing workloads in truck assembly. Besides sequencing orders, it can be achieved in the medium and long term by an adaptation of process planning and in the short term by the flexible use of staff teams. To assess the possibilities for optimizing balancing, a system of key performance indicators were presented. With the help of simulation, mutual dependencies between assignment of processes, the sequence and the flexible use of staff teams can be evaluated. The next research activities will focus on the correlation between different levels of market requirements, process planning, and staff flexibility. Therefore, the key performance indicators will be recorded continuously and more insights will be gained from simulation by applying alternative configurations in process and workforce planning. The different levels of the key performance indicator system cannot be evaluated detached from each other, because they have mutual influence. High flexibility of staff teams cannot be efficient if the process planning does not make use of it. Hence, the forthcoming research activities aim to link these different key performance indicators. The objective is to develop a methodology through which to find the best configuration to deal with the cyclicality of workloads.
REFERENCES
Auer, S., L. März, H. Tutsch, W. Sihn. 2011. “Classification of Interdependent Planning Restrictions and their Various Impacts on Long-, Mid- and Short Term Planning of High Variety Production.” In New Worlds of Manufacturing. 44th CIRP International Conference on Manufacturing Systems 2011, edited by N. A. Duffie, Madison, Wisconsin: Omnipress.
Bard, J.F., A. Shtub, and S.B. Joshi. 1994. “Sequencing Mixed-Model Assembly Lines to Level Parts Usage and Minimize Line Length.” International Journal of Production Research 32: 2431–54.
Bley, H., G. Reinhart, G. Seliger, M. Bernadi, and T. Korne. 2004. “Appropriate Human Involvement in Assembly and Disassembly.” Annals of the CIRP 53/2: 487–509.
Boysen, N. 2005. “Reihenfolgeplanung bei Variantenfließfertigung: Ein integrativer Ansatz.” Zeitschrift für Betriebswirtschaft 75: 135-156.
Boysen, N., M. Fliedner, and A. Scholl. 2007. “A Classification of Assembly Line Balancing Problems.” European Journal of Operational Research 183: 674–93.
1329

März
Boysen, N., M. Fliedner, and A. Scholl. 2009. “Sequencing Mixed-Model Assembly Lines: Survey, Classification and Model Critique.” European Journal of Operational Research 192 H2: 349–73.
Drexl, A., and A. Kimms. 2001. “Sequencing JIT Mixed-Model Assembly Lines under Station-Load and Part-Usage Constraints.” Management Science 47: 480–91.
Drexl, A., A. Kimms, and L. Matthießen. 2006. “Algorithms for the Car Sequencing and the Level Scheduling Problem.” Journal of Scheduling 2006: 153–76.
Fliedner, M., and N. Boysen. 2008. “Solving the Car Sequencing Problem via Branch & Bound.” European Journal of Operational Research 191: 1023–42.
Gravel, M., C. Gagné, and W. L. Price. 2006. “Review and Comparison of Three Methods for the Solution of the Car Sequencing Problem.” Journal of the Operational Research Society 56: 1287–95.
Hu, S.J., J. Ko, L. Weyand, H.A. ElMaraghy, T.K. Lien, Y. Koren, H. Bley, G. Chryssolouris, N. Nasr, and M. Shpitalni. 2011. “Assembly System Design and Operation for Product Variety.” Annals of the CIRP 60/2: 715–73.
Kis, T. 2004. “On the Complexity of the Car Sequencing Problem.” Operations Research Letters Volume 32/4: 331–35.
KPMG. 2011. KPMG’s Global Automotive Executive Survey 2011. Publ. No. 101205. März, L., H. Tutsch, S. Auer, and W. Sihn. 2010. “Integrated Production Program and Human Resource
Allocation Planning of Sequenced Production Lines with Simulated Assessment.” In Advanced Manufacturing and Sustainable Logistics, edited by W. Dangelmaier, A. Blecken, R. Delius, and S. Klöpfer, 408–19, Berlin: Springer.
Mayrhofer, W., L. März, and W. Sihn. 2011. “Planning Assistance for Pearl Chain Forecasts and Personnel Assignment Planning of Sequenced Assembly Lines.” Annals of the CIRP 60/1: 481–84.
Monden, Y. 1993. “Toyota Production System. An integrated approach to just-in-time.” Second edition, Industrial Engineering and Management Press, Institute of Industrial Engineers, Norcross, Georgia.
Mercer Management Consulting, Fraunhofer-Institut für Produktionstechnik und Automatisierung, Stuttgart, Fraunhofer-Institut für Materialfluß und Logistik, Dortmund. 2004. “Future Automotive Industry Structure (FAST) 2015 - die neue Arbeitsteilung in der Automobilindustrie.” Frankfurt/M.: VDA 2004, Materialien zur Automobilindustrie, 32.
Scholl, A., R. Klein, and W. Domschke. 1998. “Pattern Based Vocabulary Building for Effectively Sequencing Mixed-Model Assembly Lines.” Journal of Heuristics 4: 359–81.
Solnon, C., V. D. Cung, A. Nguyen, and C. Artigues. 2008. “The Car Sequencing Problem: Overview of State-of-the-Art Methods and Industrial Case-Study of the ROADEF’2005 Challenge Problem.” European Journal of Operational Research 191: 912–27.
Tsai, L.-H. 1995. “Mixed-Model Sequencing to Minimize Utility Work and the risk of Conveyor Stoppage.” Management Science 41/3: 485-95.
Wester, L., and M. Kilbridge. 1964. “The assembly line model-mix sequencing problem.” In Proceedings of the Third International Conference on Operations Research, Oslo 1963: 247–60.
AUTHOR BIOGRAPHIES
LOTHAR MÄRZ studied mechanical engineering at Technische Hochschule Darmstadt, Germany as well as mathematics and computer science at Ecole Centrale de Lyon, France, and was a Ph.D. student at the Fraunhofer Institute for Production Technology and Automation (IPA), Stuttgart. Dr März worked in leading functions for research and consulting companies for more than 10 years. In 2010 he founded, as managing partner, LOM Innovation, which develops and provides simulation-based planning software.
Dr März is a well-known expert in the area of event-discrete simulation and optimization in production and logistics. He has realized a multitude of simulation and optimization projects and is the author of more than 50 scientific publications. His email address is [email protected].
1330