Performance Evaluation of Polybenzimidazole for Potential ...
195
Performance Evaluation of Polybenzimidazole for Potential Aerospace Applications
-
Upload
khangminh22 -
Category
Documents
-
view
0 -
download
0
Transcript of Performance Evaluation of Polybenzimidazole for Potential ...

Performance Evaluation of
Polybenzimidazole for Potential
Aerospace Applications

Performance Evaluation of
Polybenzimidazole for Potential Aerospace
Applications
Proefschrift
ter verkrijging van de graad van doctor aan de
Technische Universiteit Delft,
op gezag van de Rector Magnificus prof. ir. K.C.A.M. Luyben,
voorzitter van het College voor Promoties,
in het openbaar te verdedigen op woensdag 15th of Januari 2014 om 15:00 uur
door
Hafiz Muhammad Saleem, IQBAL
Hafiz Muhammad Saleem Iqbal
geboren te Lahore, Pakistan
Dit proefschrift is goedgekeurd door de promotor:
Prof. Dr. ir. R. Benedictus
Prof. Dr. S. Bhowmik
Samenstelling promotiecommissie:
Rector Magnificus, voorzitter
Prof. R. Benedictus, Technische Universiteit Delft, promotor
Prof. Dr. S. Bhowmik, Amrita University, copromotor
Prof. dr. S.J. Picken, Technische Universiteit Delft
Prof. dr. ir. R. Marissen, Technische Universiteit Delft
Prof. dr.ir. H.E.J.G. Schlangen, Technische Universiteit Delft
Dr. ir. K.M.B. Jansen, Technische Universiteit Delft
Prof. Dr. Ir. R. Akkerman, Technische Universiteit Twente
ISBN: 978-90-8891-781-3
Keywords: Polybenzimidazole, Carbon Nano-fibers, Fire Testing, Radiation
testing, Adhesive bonding, PBI coating, Environmental Testing
Copyrights @ 2014 by Hafiz M. Saleem Iqbal
All rights reserved. No part of this publication may be reproduced, stored in a
retrieval system or transmitted in any form or by any means, electronic,
mechanical, photocopying, recording or otherwise, without the prior written
permission of the author.
Printed in Netherlands by Uitgeverij BOXPress, Oisterwijk
Dedicated To
My caring Parents My loving wife
& My sweet Ali and Inaayah

Summary
vii
SUMMARY
Performance Evaluation of Polybenzimidazole for Potential Aerospace Applications
With the increasing use of polymer based composite materials, there is
an increasing demand of polymeric resins with high glass transition
temperature (Tg), high thermal stability and excellent mechanical
properties at high temperature. Polybenzimidazole (PBI) is a recently
emerged high performance polymer. It has the highest glass transition
temperature (425°C) of any commercially available organic polymer,
high decomposition temperature (500°C – 600°C), good oxidation
resistance and it maintains excellent strength at cryogenic
temperatures. Due to its excellent thermal and mechanical properties,
PBI has great potential to be used for many high temperature
applications. However, at the same time, it has very high melt viscosity
which is too high to allow its processing by conventional manufacturing
techniques.
The processing of PBI itself is a real challenge due to high processing
temperature and pressure requirement. This is the main reason that
compression molded PBI has found very few industrial applications.
Recently, PBI is also available in solution form but its performance has
not been explored for potential applications. In solution form, a great
potential lies in exploring PBI as a film and coating material. Therefore,
the objective of present work is to investigate the potential of PBI film
and coating for various aerospace applications. The possible
applications can be the thermal control films in spacecraft, protective
coating for polymer composites in low earth orbit (LEO) and the
radiation shielding material in geosynchronous earth orbit (GEO). The
polymer also has the great prospective to be used as protective coating
for composite aircraft. Due to its superior non-flammability, the
material has a potential to be used as a fire resistant coating for aircraft
application.
Summary
viii
In present work, unfilled and carbon nano-fibers (CNFs) reinforced PBI
films were manufactured and their thermal and mechanical properties
were investigated. Unfilled PBI film has exhibited thermal properties
comparable to the thermal properties of molded PBI whereas it has
demonstrated higher mechanical properties than molded PBI. Addition
of 2 weight percent of CNFs has further improved the thermal and
mechanical properties of PBI film.
In present work, performance of PBI is also evaluated as a fire resistant
coating for aircraft. Unfilled PBI could not improve the fire resistant
properties of aerospace grade unidirectional epoxy/carbon composite.
However, addition of 2 weight percent of CNFs to PBI has improved the
coating performance remarkably. Nano-filled PBI coating has reduced
the average heat release rate (HRR) from 27 KW/m2 (for uncoated
epoxy/carbon composite) to 1 kW/m2. Also, nano-filled PBI coating has
reduced the peak heat release rate (PHHR) from 87 KW/m2 (for
uncoated epoxy/carbon composite) to 53 KW/m2. Furthermore, ignition
time of epoxy/carbon composite has increased from 165 seconds to
730 seconds. These results demonstrate the effectiveness and potential
of PBI for fire resistant applications in aircraft.
Performance of both unfilled and nano-filled PBI films is evaluated after
exposure to simulated LEO environment. Both unfilled and nano-filled
PBI have retained most of thermal and mechanical properties after
exposure to simulated LEO environmental conditions. Though, PBI has
exhibited high erosion yield value which is a mass dependent
parameter. However, a detailed investigation has shown that value of
high erosion yield is due to the loss of water (absorbed by PBI) rather
than the degradation of PBI itself.
Both unfilled PBI and nano-filled PBI were also exposed to different
high energy radiations and they have retained most of their thermal
and mechanical properties after exposure to these high energy
radiations. Though, unfilled PBI has shown about 40% decrease in
tensile strain after exposure to mixed radiations. However, addition of
CNFs to PBI has improved its performance by retaining 80% tensile
strain after exposure to mixed radiations. PBI has retained most of its
properties after exposure to even higher doses of gamma radiations
and electron radiations in present study. These results are encouraging
and research can be further extended to evaluate the performance of
Summary
ix
PBI after exposure to different radiations under various temperature
conditions.
PBI is also evaluated as an adhesive for high temperature applications.
Due to high solvent contents, the process optimization required lot of
efforts to form PBI bonded joints with considerable lap shear strength.
Therefore, in present work, efforts are devoted to optimize the
adhesive bonding process of PBI. PBI adhesive bonded joints were
formed successfully with single lap shear strength of 30 MPa using
epoxy based unidirectional carbon fiber composite substrate. These
results are quite encouraging and efforts can be made to further
optimize the bonding process in order to improve the lap shear
strength. PBI adhesive bonded joints were also exposed to hot/wet
environment at 80oC and 95% RH for 1000 hours. Exposed joints have
retained about 80% of the joint strength even after exposure to
hot/wet environment for 1000 hours. Furthermore, PBI adhesive
bonded joints were tested at 80oC to evaluate the high temperature
performance of PBI. Bonded joints have retained about 50% of the
original joint strength.
The present work has contributed to the knowledge and understanding
of several aspects of the PBI polymer. Different problems related to the
processing of PBI are highlighted and efforts are made to evaluate the
performance of PBI as a film, coating and adhesive. PBI has not been
manufactured and characterized in such detail in the past. Also the
potential of nano-filler based PBI has never been explored in the past.
Present work has produced some encouraging results to perform
further research on PBI as a coating and adhesive material for different
aerospace applications.
H.M.S.IQBAL
Delft, Netherlands

Contents
xi
Contents
SUMMARY………………………………………………………………………………………………..vii
ABBREVIATIONS………………………………………………………………..………………..xix
Chapter 1 Introduction…………………………………………………….1
1.1. General Background………………………………………………………...………… 1
1.2. High Performance Polymers .......................................................... 2
1.2.1. Definition of High Performance Polymers ...................................... 2
1.2.2. History of High Performance Polymers .......................................... 2
1.3. Polybenzimidazole – A high Performance Polymer ........................ 3
1.3.1. Historical background of Polybenzimidazole (PBI) ......................... 4
1.3.2. Applications of Polybenzimidazole (PBI) ........................................ 5
1.4. Research Goals .............................................................................. 5
1.5. Outlines of Thesis .......................................................................... 6
1.6. References .................................................................................... 8
Chapter 2 Processing and Characterization of Unfilled and
Nano-fibers Reinforced Polybenzimidazole……………………………11
2.1. Introduction ................................................................................ 11
2.2. Polymer Based Nano-composites ................................................ 12
2.2.1. Processing issues of Carbon Nano-fibers ..................................... 13
2.3. Experimental............................................................................... 13
2.3.1. Materials ..................................................................................... 13
2.3.2. Processing of Polybenzimidazole by Compression Molding ......... 13
Contents
xii
2.3.3. Solution casting of Basic PBI Film ................................................ 14
2.3.4. Solution casting of PBI nano-composite film ................................ 15
2.4. Thermal and Mechanical Characterization .................................. 15
2.4.1. Thermal Gravimetric Analysis (TGA) ............................................ 15
2.4.2. Dynamic Mechanical Analysis (DMA) .......................................... 16
2.4.3. Tensile Testing ............................................................................. 16
2.4.4. Scanning Electron Microscopy (SEM Analysis) ............................. 16
2.5. Results and Discussion ................................................................ 16
2.5.1. Compression Molding of PBI ........................................................ 16
2.5.2. Processing of PBI neat film and nano-composite film .................. 18
2.5.3. Thermal Gravimetric Analysis (TGA) ............................................ 19
2.5.4. Dynamic Mechanical Analysis (DMA) .......................................... 20
2.5.5. Tensile testing ............................................................................. 24
2.5.6. Scanning Electron Microscope (SEM) Analysis ............................. 26
2.5.7. Fracture morphology ................................................................... 27
2.6. Conclusions ................................................................................. 28
2.7. References .................................................................................. 29
Chapter 3 Fire Testing of Nano-fibers Reinforced
Polybenzimidazole Coating for Aircraft Application…………..31
3.1. Introduction ................................................................................ 31
3.2. Combustion Process of Polymers ................................................ 33
3.3. Classification of Polymers Based on Thermal Decomposition
Mechanism ........................................................................................... 35
3.4. Effect of Char Formation on Fire Resistant Properties of Polymers
36
3.5. Elements of Material Flammability ............................................. 37
3.5.1. Time-to-Ignition (TTI) .................................................................. 37
3.5.2. Heat Release Rate (HRR) ............................................................. 38
Contents
xiii
3.5.3. Flame Propagation Index (FPI) .................................................... 38
3.5.4. Smoke generation ....................................................................... 38
3.6. Methods to Improve the Fire Resistance of Polymers and Polymer
Based Composites................................................................................. 39
3.6.1. Addition of flame retardants to Polymers .................................... 39
3.6.2. Limitation of Using Fire retardants .............................................. 40
3.6.3. Nano-filler based flame retardant nano-composites ................... 40
3.6.4. Application of fire protective coatings ......................................... 41
3.7. Experimental............................................................................... 43
3.7.1. Materials ..................................................................................... 43
3.7.2. Preparation of Composite Laminates .......................................... 43
3.7.3. Plasma Treatment of Composite Laminates ................................ 43
3.7.4. Contact Angle Measurement ....................................................... 43
3.7.5. Adhesion Testing ......................................................................... 43
3.7.6. Preparation of Unfilled PBI Coated Samples ................................ 44
3.7.7. Preparation of Nano-filled PBI Coated Samples ........................... 44
3.7.8. Thermal gravemetric Analysis (TGA) ........................................... 44
3.7.9. Cone Calorimeter and fire testing ................................................ 45
3.8. Results and Discussion ................................................................ 45
3.8.1. Thermal Gravimetric Analysis (TGA) ............................................ 45
3.8.2. Contact Angle measurement of Plasma treated Composite
Substrate ............................................................................................... 47
3.8.3. Adhesion Testing ......................................................................... 48
3.8.4. Cone Calorimeter test results ...................................................... 50
3.9. Conclusions ................................................................................. 58
3.10. References .................................................................................. 60
Chapter 4 Performance Evaluation of Polybenzimidazole
in Simulated Low Earth Orbit Environment…………………………....63
4.1. Introduction ................................................................................ 63
Contents
xiv
4.2. LEO Space Environment .............................................................. 64
4.2.1. Ultra High Vacuum ...................................................................... 64
4.2.2. Ultraviolet radiations (UV radiations) .......................................... 64
4.2.3. Thermal Cycling ........................................................................... 65
4.2.4. Atomic Oxygen (AO) .................................................................... 66
4.3. Experimental............................................................................... 67
4.3.1. Materials ..................................................................................... 67
4.3.2. Solution casting of Unfilled PBI Film ............................................ 67
4.3.3. Solution casting of nano-filled PBI films ....................................... 67
4.3.4. Exposure to LEO Environment ..................................................... 67
4.3.5. Tensile Testing ............................................................................. 70
4.3.6. Scanning Electron Microscopy (SEM) ........................................... 70
4.3.7. Atomic Force Microscopy (AFM) .................................................. 70
4.4. Results and Discussion ................................................................ 70
4.4.1. Mass Loss and Erosion Yield Measurements of exposed samples 70
4.4.2. Tensile Test Results ..................................................................... 73
4.4.3. Scanning Electron Microscopy (SEM) ........................................... 77
4.4.4. Atomic Force Microscopy (AFM) .................................................. 80
4.5. Conclusion .................................................................................. 82
4.6. References .................................................................................. 82
Chapter 5 Performance Evaluation of Polybenzimidazole
under High Energy Radiations Environment……………………….... 85
5.1. Introduction ................................................................................ 85
5.2. Effect of Ionizing Radiations on Polymeric Materials ................... 86
5.3. Experimental............................................................................... 87
5.3.1. Materials ..................................................................................... 87
5.3.2. Preparation of Unfilled PBI and Nano-filled PBI Film ................... 87
5.3.3. Exposure to Electron radiations and Gamma radiations .............. 87
5.3.4. Exposure to Mixed radiations ...................................................... 87
Contents
xv
5.4. Testing and Characterization ....................................................... 88
5.4.1. Thermal Gravimetric Analysis (TGA) ............................................ 88
5.4.2. Dynamic Mechanical Analysis (DMA) .......................................... 88
5.4.3. Tensile Testing ............................................................................. 89
5.4.4. UV/VIS Spectroscopy ................................................................... 89
5.4.5. Surface morphology .................................................................... 89
5.5. Results and Discussion ................................................................ 89
5.5.1. Thermal gravimetric analysis (TGA) ............................................. 89
5.5.2. Dynamic Mechanical Analysis (DMA) .......................................... 92
5.5.3. Tensile Test Results ..................................................................... 96
5.5.4. UV/VIS photospectroscopy .......................................................... 98
5.5.5. Surface morphology .................................................................. 101
5.6. Conclusion ................................................................................ 103
5.7. References ................................................................................ 104
Chapter 6 Performance Evaluation of Polybenzimidazole
as an Adhesive for Aerospace Applications…………………………. 107
6.1. Introduction .............................................................................. 107
6.2. Selection of the surface treatment ............................................ 109
6.2.1. Atmospheric Pressure Plasma Treatment (APPT) ...................... 110
6.3. Experimental............................................................................. 110
6.3.1. Materials ................................................................................... 110
6.3.2. Atmospheric Pressure Plasma Treatment of Composite Specimen
………………………………………………………………………………………………..111
6.3.3. Contact Angle Measurements ................................................. 111
6.3.4. Specimen Preparation for Lap Shear Testing ............................. 112
6.3.5. Environmental Conditioning of Specimens ................................ 112
6.3.6. Specimen Preparation for Lap Shear Testing ............................. 112
6.3.7. Scanning Electron Microscopy (SEM) ......................................... 113
6.4. Results and Discussion .............................................................. 113
Contents
xvi
6.4.1. Atmospheric Pressure Plasma Treatment .................................. 113
6.4.2. Surface Treatment for Lap Shear Testing................................... 120
6.4.3. PBI adhesive bonded joints Preparation .................................... 121
6.4.4. Process Optimization of PBI Adhesive to form bonded joints ..... 121
6.4.5. Environmental Conditioning of PBI adhesive bonded joints ....... 128
6.4.6. Testing of PBI adhesive bonded Joints at High Temperature ..... 131
6.4.7. Study of Failure Modes .............................................................. 133
6.5. Conclusions ............................................................................... 135
6.6. References ................................................................................ 136
Chapter 7 Performance Evaluation of Polybenzimidazole
coating for Aircraft Application…………………………….……………………139
7.1. Introduction .............................................................................. 139
7.2. Experimental............................................................................. 140
7.2.1. Materials ................................................................................... 140
7.3. Testing and Characterization ..................................................... 141
7.3.1. Atmospheric pressure Plasma Treatment of Composite Substrate
………………………………………………………………………………………………. 141
7.3.2. Contact Angle Measurements ................................................... 141
7.3.3. Application of Coating ............................................................... 142
7.3.4. Adhesion Testing of PBI coating ................................................ 142
7.4. Environmental Resistance of PBI coating .................................. 142
7.4.1. Conditioning of PBI coated Panels at high Temperature and
Humidity.............................................................................................. 142
7.4.2. Liquid Immersion of PBI Coated Panels ...................................... 142
7.4.3. Adhesion testing of Conditioned Samples .................................. 143
7.4.4. Scratch testing of PBI Coated panels after exposure to Various
Environmental Conditions ................................................................... 143
Contents
xvii
7.4.5. Nano-indentation testing of PBI Coated panels after exposure to
Various Environmental Conditions ....................................................... 143
7.5. Results and Discussion .............................................................. 144
7.5.1. Contact angle measurement of Atmospheric Pressure Plasma
Treated Composite Substrate .............................................................. 144
7.5.2. Adhesion Testing of PBI coating ................................................ 145
7.5.3. Adhesion testing of Conditioned Specimens .............................. 147
7.5.4. Scratch Testing of PBI coated Panels after exposing to Various
Environmental Conditions ................................................................... 148
7.5.5. Nano-indentation testing of PBI coated Panels after exposing to
Various Environmental Conditions ....................................................... 153
7.6. Conclusions ............................................................................... 156
7.7. References ................................................................................ 157
Conclusions and Recommendations for Future Work……..159
8.1. Conclusions ............................................................................... 159
8.1.1. Compression Molding of PBI ...................................................... 159
8.1.2. Solution Casting of PBI film ....................................................... 160
8.1.3. Thermal and Mechanical Properties of PBI ................................ 161
8.1.4. Testing in LEO Simulated Environment ...................................... 161
8.1.5. Radiation Testing ...................................................................... 162
8.1.6. Fire Testing of PBI Coating ........................................................ 163
8.1.7. Lap Shear Testing of PBI ............................................................ 163
8.1.8. Testing for Aircraft Application ................................................. 164
8.2. Recommendations for future work ........................................... 165
CURRICULUM VITAE……………………………………………………………….…………….170
LIST OF PUBLICATIONS………………………………………………………………………...171
ACKNOWLEDGEMENT…………………………………………………………………………..174

Abbreviations
xix
ABBREVIATIONS
PBI Polybenzimidazole
DMAc Dimethyl-acetamide
CNFs Carbon Nano-fibers
APPT Atmospheric Pressure Plasma Treatment
TGA Thermal Gravimetric Analysis
DMA Dynamic Mechanical Analysis
SEM Scanning Electron Microscope
HRR Heat Release Rate
PHRR Peak Heat Release Rate
TTI Time-to-Ignition
SEA Smoke Extinction Area
MLR Mass loss rate
LEO Low Earth Orbit
GEO Geosynchronous Earth Orbit
UV Ultraviolet
AO Atomic Oxygen
AFM Atomic force microscopy
CA Contact Angle
CSM Continuous Stiffness Measurement

1
CHAPTER 1
Introduction
In this chapter, a brief introduction about Polybenzimidazole
and its historical background is presented. Motivations behind
this thesis and its research objectives are described. The
structure of this dissertation is also outlined briefly.
1.1. General Background
Polymers and polymer based composite materials have been gaining
significant attention since last decade. With wide range of possible
fillers and resins, composite materials have opened the way to an
enormous range of materials with diverse chemical, physical, and
mechanical properties. These materials have an impressive and diverse
range of applications in automotive, aviation, spacecrafts, civil
infrastructure and sports industry [1-5]. In recent times, there has
been a steady increase in the use of polymer based composite
materials in both military and commercial aircraft [3, 6-7]. Polymeric
materials are also being extensively used in space systems as multi-
layer insulations, matrix in the substrate for solar panels, adhesives,
thermal control coatings for spacecraft and insulation for electrical
wiring [8, 9]. Despite having many advantages, polymeric based
materials are facing challenges for demanding aerospace applications.
As an example, at a temperature of above 200oC, many of the
polymeric materials cannot maintain their thermal stability and
mechanical properties which ultimately leads to collapse of the
composite structures [10]. Also, the exposure of these materials to
harsh space environment, affects the thermal, mechanical and optical
properties of these materials [9, 11-12]. These demanding conditions
are limiting the use of polymer based materials for aerospace industry.
Introduction
2
Therefore, in order to meet the requirement of aerospace industry,
research is continued to develop new high performance polymers which
can maintain the desired properties under working environmental
conditions for longer duration of time and serve their purpose properly.
1.2. High Performance Polymers
1.2.1. Definition of High Performance Polymers
High performance polymers can be defined in many ways depending on
the type of application. High performance is a general term which can
be used to describe many polymers. In term of high temperature
applications, the most popular definition of high performance polymer is
the polymer which can retain the useable properties at a temperature
greater than 177oC [13]. These polymers have a glass transition (Tg)
greater than 200oC and they can maintain their thermal stability (5%
weight loss) up to a temperature of 450oC [13].
1.2.2. History of High Performance Polymers
High performance polymers have long historical background. The
development of high performance polymers started in late 1950s
mainly to meet the requirement of aerospace industry. The most
productive period for the development of high performance polymers
was between 1960 and 1970. During this period, many high
performance polymers were developed with high glass transition
temperature (Tg) and high thermal stability. Despite their high thermal
stability, cost and processing of these polymers was the major issue.
The chemical structure of these high performance polymers resulted in
difficult processing and poor solubility in organic solvents. Their
softening points or melt viscosities were too high to process using
conventional manufacturing techniques. Polybenzimidazole, polyimide
and polysulfone are the main examples of initially developed high
performance polymers. Polybenzimidazole could not get the attraction
to a sizeable market due to its high cost and difficult processability [13,
14]. Polyimide (PI) film designated as Kapton was the first material
among high performance polymers which was fabricated by DuPont.
Kapton attracted a big market and since then it has been the largest
selling high performance polymer in the world. In aerospace industry,
it is used primarily as insulation for aircraft and spacecraft wiring. Other
applications include high performance flexible films for photovoltaic
substrates and printed circuit boards. After the commercialization of
Chapter 1
3
Kapton in 1970s, efforts were made to develop other high performance
polymers with low cost, easy processing and improved mechanical
properties. One example of such polymer is thermoplastic
Polyetherimide (PEI) designated as Ultem produced by General Electric
[13]. Kapton is also being used in satellites for thermal management
[15]. Other important developments during this period were polyamide
imide (PAI) and polybenzoxazole (PBO) but they never reached the
success of PI.
1.3. Polybenzimidazole – A high Performance Polymer
One of the families of high performance polymers is the imidized
family. Imidized polymers are said to offer the best combination of
thermal and mechanical properties of any commercially available
polymer. The family of imidized polymers includes polyimide (PI),
polyamideimide (PAI), polybenzimidazole (PBI), and polyetherimide
(PEI). Other than PI from imidized family, PBI has gained wide
recognition in recent years as high-temperature polymer. PBI is a
thermoplastic polymer and, in molded form, it has the highest
compressive and tensile strength of any unfilled polymeric resin [16-
18]. PBI has the highest glass transition temperature (425°C) of any
commercial available organic polymer [19]. It has high decomposition
temperatures (500°C-600°C), good oxidation resistance and it
maintains excellent strength at cryogenic temperatures [20]. The
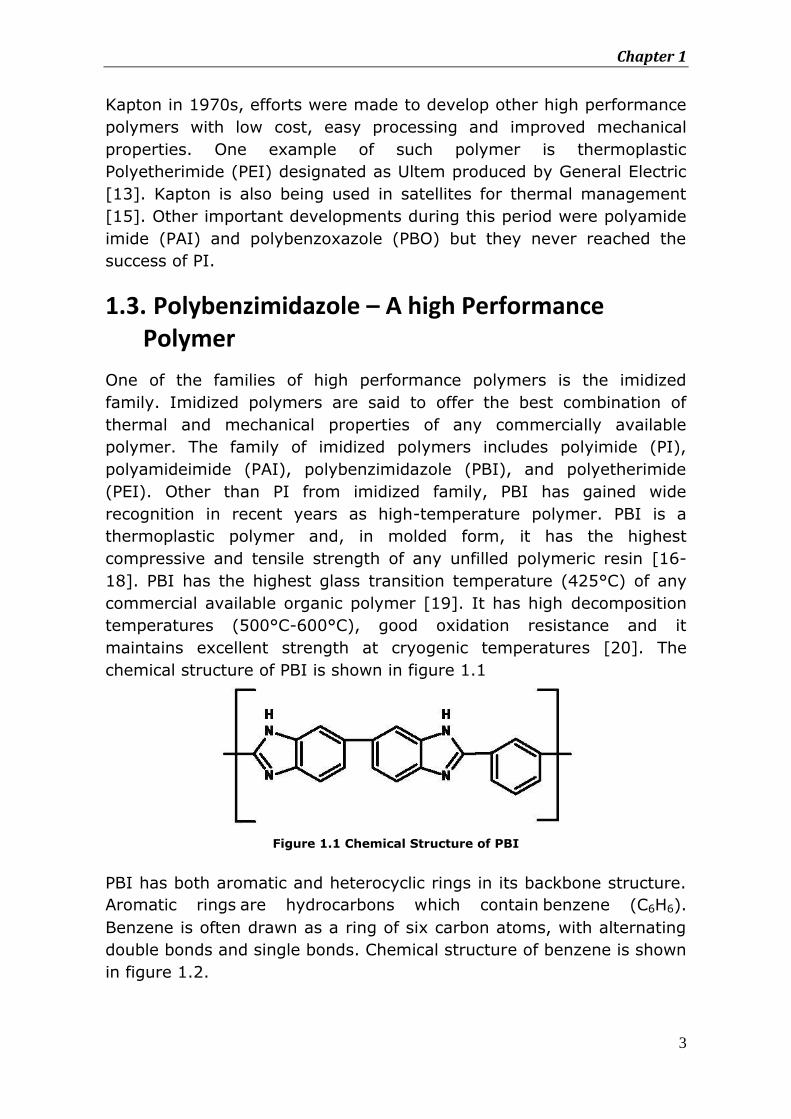
chemical structure of PBI is shown in figure 1.1
Figure 1.1 Chemical Structure of PBI
PBI has both aromatic and heterocyclic rings in its backbone structure.
Aromatic rings are hydrocarbons which contain benzene (C6H6).
Benzene is often drawn as a ring of six carbon atoms, with alternating
double bonds and single bonds. Chemical structure of benzene is shown
in figure 1.2.
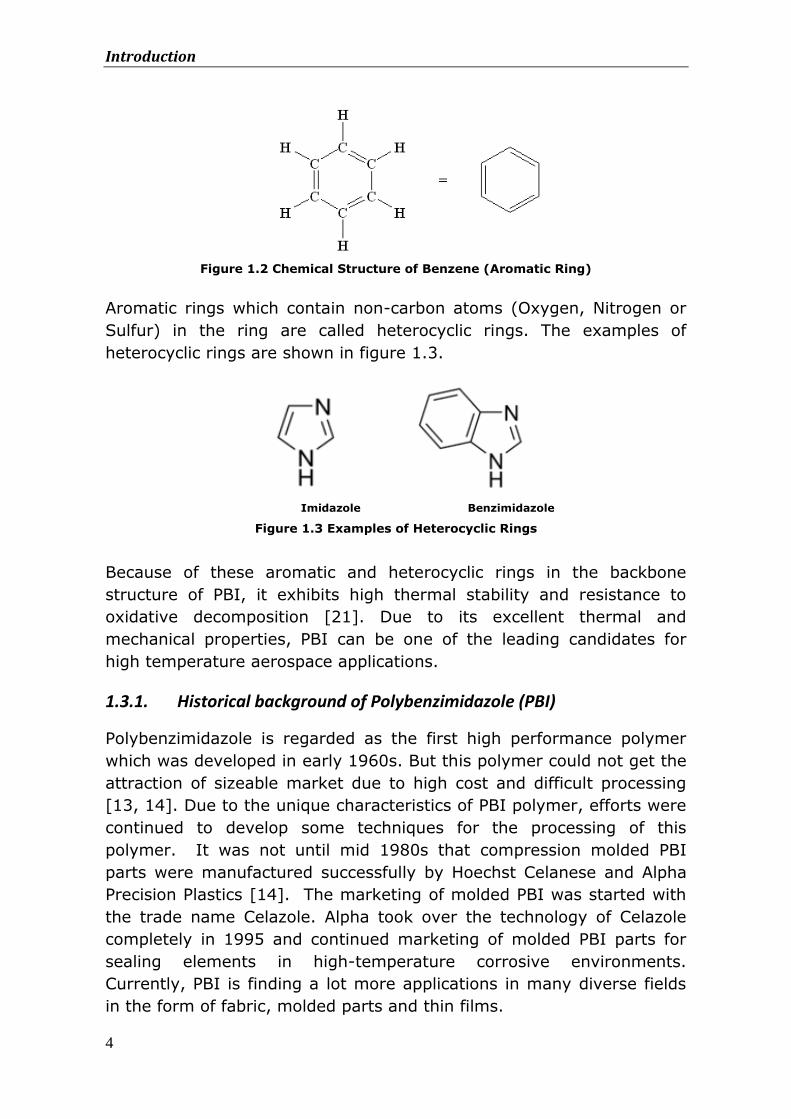
Introduction
4
Figure 1.2 Chemical Structure of Benzene (Aromatic Ring)
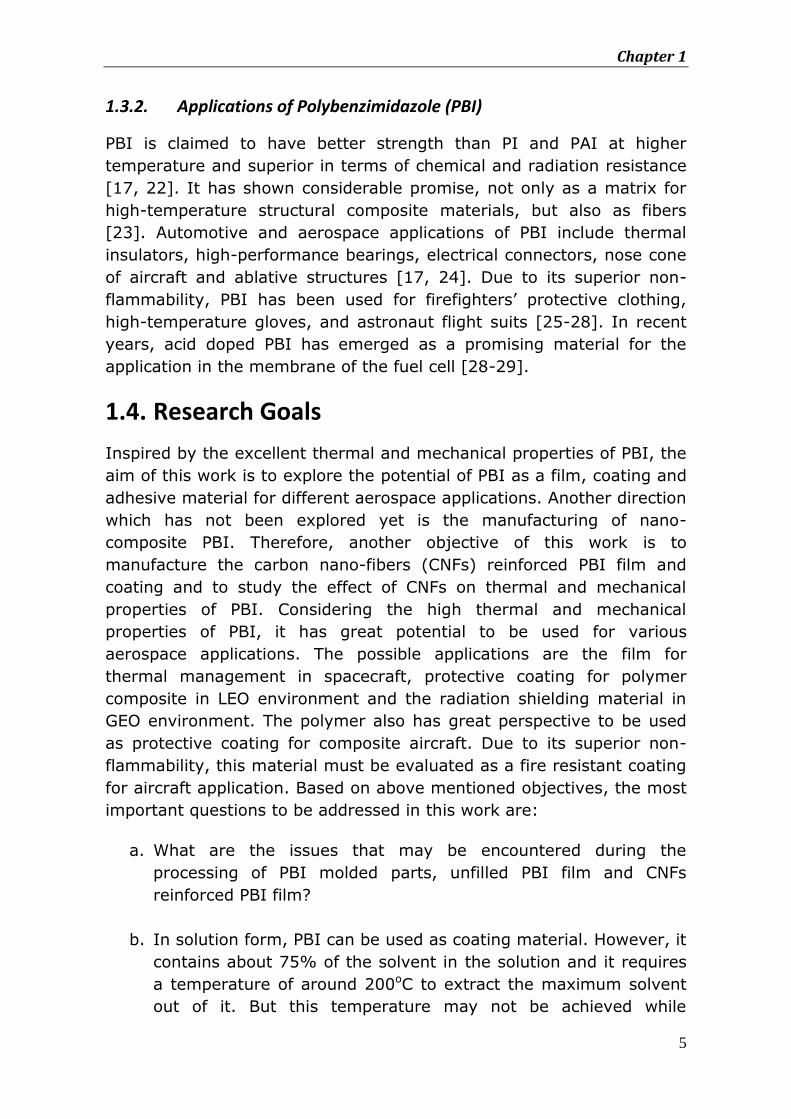
Aromatic rings which contain non-carbon atoms (Oxygen, Nitrogen or
Sulfur) in the ring are called heterocyclic rings. The examples of
heterocyclic rings are shown in figure 1.3.
Imidazole Benzimidazole
Figure 1.3 Examples of Heterocyclic Rings
Because of these aromatic and heterocyclic rings in the backbone
structure of PBI, it exhibits high thermal stability and resistance to
oxidative decomposition [21]. Due to its excellent thermal and
mechanical properties, PBI can be one of the leading candidates for
high temperature aerospace applications.
1.3.1. Historical background of Polybenzimidazole (PBI)
Polybenzimidazole is regarded as the first high performance polymer
which was developed in early 1960s. But this polymer could not get the
attraction of sizeable market due to high cost and difficult processing
[13, 14]. Due to the unique characteristics of PBI polymer, efforts were
continued to develop some techniques for the processing of this
polymer. It was not until mid 1980s that compression molded PBI
parts were manufactured successfully by Hoechst Celanese and Alpha
Precision Plastics [14]. The marketing of molded PBI was started with
the trade name Celazole. Alpha took over the technology of Celazole
completely in 1995 and continued marketing of molded PBI parts for
sealing elements in high-temperature corrosive environments.
Currently, PBI is finding a lot more applications in many diverse fields
in the form of fabric, molded parts and thin films.
Chapter 1
5
1.3.2. Applications of Polybenzimidazole (PBI)
PBI is claimed to have better strength than PI and PAI at higher
temperature and superior in terms of chemical and radiation resistance
[17, 22]. It has shown considerable promise, not only as a matrix for
high-temperature structural composite materials, but also as fibers
[23]. Automotive and aerospace applications of PBI include thermal
insulators, high-performance bearings, electrical connectors, nose cone
of aircraft and ablative structures [17, 24]. Due to its superior non-
flammability, PBI has been used for firefighters’ protective clothing,
high-temperature gloves, and astronaut flight suits [25-28]. In recent
years, acid doped PBI has emerged as a promising material for the
application in the membrane of the fuel cell [28-29].
1.4. Research Goals
Inspired by the excellent thermal and mechanical properties of PBI, the
aim of this work is to explore the potential of PBI as a film, coating and
adhesive material for different aerospace applications. Another direction
which has not been explored yet is the manufacturing of nano-
composite PBI. Therefore, another objective of this work is to
manufacture the carbon nano-fibers (CNFs) reinforced PBI film and
coating and to study the effect of CNFs on thermal and mechanical
properties of PBI. Considering the high thermal and mechanical
properties of PBI, it has great potential to be used for various
aerospace applications. The possible applications are the film for
thermal management in spacecraft, protective coating for polymer
composite in LEO environment and the radiation shielding material in
GEO environment. The polymer also has great perspective to be used
as protective coating for composite aircraft. Due to its superior non-
flammability, this material must be evaluated as a fire resistant coating
for aircraft application. Based on above mentioned objectives, the most
important questions to be addressed in this work are:
a. What are the issues that may be encountered during the
processing of PBI molded parts, unfilled PBI film and CNFs
reinforced PBI film?
b. In solution form, PBI can be used as coating material. However, it
contains about 75% of the solvent in the solution and it requires
a temperature of around 200oC to extract the maximum solvent
out of it. But this temperature may not be achieved while
Introduction
6
applying PBI coating on composite substrate due to the fact that
properties of most of the composites degrade at high
temperature. This fact will make it challenging to apply PBI
coating on composite substrate. Therefore, the question need to
be addressed that if PBI coating can be applied on the composite
substrate at low curing temperature? And if the application of PBI
coating is possible at low temperature then to what extent it will
affect the performance of PBI?
c. PBI has superior non-flammability in molded form. However, it
has never been tested as a fire resistant coating. Inspired by its
thermal properties, one of the objectives of this work is to
evaluate that if PBI has a real potential to be used as a fire
resistant coating for epoxy based carbon fiber composite?
d. Space environment consist of ultraviolet radiations, ionizing
radiations, high vacuum, thermal cycling. These radiations and
thermal cycling degrade the thermo-mechanical and optical
properties of polymers. In this context, the question need to be
addressed is; how and to what extent, the exposure of PBI to
simulated Low Earth Orbit environment and under high energy
radiations, will affect the thermo-mechanical and optical
properties of PBI.
This work only includes the initial evaluation of PBI for different
aerospace applications. Detail evaluation of the material for any specific
application is out of the scope of this work. However, recommendations
for the future work will be given on the basis of the results obtained in
this work. On the basis of these recommendations, PBI can be further
evaluated in detail for a specific application.
1.5. Outlines of Thesis
This thesis mainly divided into three parts. Part 1 includes the process
optimization, thermal and mechanical characterization of unfilled and
nano-fibers reinforced PBI. Part 2 mainly relates to the evaluation of
unfilled and nano-filler based PBI film and coating materials for
potential aerospace applications. Part 3 is related to the evaluation of
PBI as an adhesive for high temperature applications. A separate
chapter is included for the conclusions and recommendation for future
work.
Chapter 1
7
A brief history of high performance polymers and their development
with the course of time is presented in the introductory chapter. The
development history of Polybenzimidazole (PBI) and its thermal and
mechanical properties are presented in this chapter. Current state of
art applications and potential future applications of PBI are highlighted
in this chapter.
Chapter 2 explains the manufacturing of both compression molded PBI
and PBI film. Different techniques are illustrated to manufacture the
CNFs based PBI nano-composite. Thermal and mechanical properties of
PBI in different forms are presented in this chapter. SEM analysis of
fractured surfaces of tested specimens is also presented in this chapter.
Chapter 3 deals with the study and evaluation of PBI as a fire resistant
coating for epoxy based unidirectional carbon fiber composite. A
comparison of fire resistant properties of uncoated carbon/epoxy
composite and composite coated with unfilled and nano-filled PBI
coating is presented in this chapter.
Chapter 4 and chapter 5 mainly deals with the exposure of basic PBI
and PBI nano-composite to different space environmental conditions
and its evaluation after having exposed to these conditions. The effect
of simulated LEO environment and high energy radiations on
characteristic behavior of unfilled PBI and PBI nano-composite is
assessed and results are presented to evaluate its potential for future
space applications.
Chapter 6 shed light whether or not it is feasible to fabricate the
bonded joints of polymer based composite material for aerospace
application using PBI as an adhesive. On the basis of the results
obtained, the potential of PBI as an adhesive for high temperature
applications is also discussed.
Chapter 7 studies the behavior of PBI as a protective coating for epoxy
based carbon fiber composite for aircraft application. Response of PBI is
described after exposure to hot wet environment and liquid immersion.
Critical properties including hardness, scratch resistance and adhesion
of PBI coating are assessed and the results are presented.
Introduction
8
Chapter 8 summarizes the undertaken research and highlights the main
findings of this work. On the basis of these finding, some conclusions
are made and recommendations are given for future work.
1.6. References
1- A. Baker, S. Dutton, K. Donald, Composite materials for aircraft structures, 2nd edition, 2004
2- A.P. Mouritz, E. Gellert, P. Burchill, K. Challis, Review of advanced composite structures for naval ships and submarines, Composite structures 53 (2001)
3- A.P.Mouritz and A.G.Gibson, Fire Properties of polymer composite materials,
Solid Mechanics and its applications, Volume 143, 2006, ISBN-13 978-1-4020-5356-6
4- A.P.Mouritz, Fire safety of advanced composites for aircraft, B2004/0046,
April 2006
5- E. Grossman, I. Gouzman, Space Environment Effects on Polymers in Low Earth Orbit, Nuclear Instruments and Methods in Physics Research B 208, 2003
6- A.P. Mouritz, Fire resistance of aircraft composite laminates, Journal of
Material Science Letters, 22, (2203), pp. 1507-1509
7- S. Gandhi, Postcrash Health Hazards from Burning Aircraft Composites, Galaxy Scientific Corporation, Fire Safety Section, AAR-422, Federal Aviation Administration
8- L. R. Kiefer and A. R. Orwoll, space environmental effects on polymeric
materials, final technical report n88- 168 79, 1987
9- E. M. Silverman, Space environmental effects on spacecraft: LEO materials selection guide, NASA Contractor Report 4661, Part 2
10- S. Feih, A. P. Mouritz, Z. Mathys and A.G. Gibson, Fire Structural Modeling of
Polymer Composites with Passive Thermal Barrier, Journal of Fire Sciences, Vol. 28 – March 2010
11- Joo-Hyun Han, Chun-Gon Kim, Low Earth Orbit Space Environment Simulation
and its Effects On Graphite/Epoxy Composites, Composite Structures vol. 72, 2006
12- Kwang-Bok Shina, Chun-Gon Kima, Chang-Sun Honga, Ho-Hyung Leeb,
Prediction of Failure Thermal Cycles in Graphite/Epoxy Composite Materials Under Simulated Low Earth Orbit Environments, Composites: Part B, Vol. 31, 2000
Chapter 1
9
13- Paul M. Hergenrother, The Use, Design, Synthesis, and Properties of High
Performance/High Temperature Polymers: An Overview, 2003
14- Tai-Shung Chung, A Critical Review of Polybenzimidazoles , Department of Chemical Engineering, National University of Singapore, 10 Kent Ridge Crescent, Republic of Singapore, 119260, Available online: 23 Sep 2006
15- A. N. Hammoud, E. D. Baumann, E. Overton, I. T. Myers, J. L. Suthar, W.
Khachen and J. R. Laghari, High Temperature Dielectric Properties of Apical, Kapton, Peek, Teflon AF, And Upilex Polymers, Conference on Electrical Insulation and Dielectric Phenomenon, USA, 1992, 549-554
16- Tai-Shung Chung, A Critical Review of Polybenzimidazoles , Department of
Chemical Engineering, National University of Singapore, 10 Kent Ridge Crescent, Republic of Singapore, 119260, Available online: 23 Sep 2006
17- Kemmish, D. J., “High Performance Engineering Plastics,” Rapra Review
Reports, Vol. 8, No. 2, 1995, Rept. 86.
18- Beland, S., High Performance Thermoplastic Resins and Their Composites, 1st ed., Noyes Data Corp., Park Ridge, NJ, 1990, pp. 47–50
19- Steinerand, P. A., and Sandor, R., “Polybenzimidazole Prepreg: Improved
Elevated Temperature Properties with Autoclave Processability,” High Performance Polymers,Vol. 3, No. 3, 1991, pp. 139–150.
20- Bhowmik, S., Bonin, H.W., Bui, V. T., and Weir, R. D., “Modification of High-Performance Polymer Composite Through High-Energy Radiation and Low-Pressure Plasma for Aerospace and Space Applications,” Journal of Applied Polymer Science, Vol. 102, Jan. 2006, pp. 1959–1967.
21- O. R. Hughes, O. N. Chen, W.M. Cooper, L. P. Disano, E. Alvarez and T.E. Andres, PBI powder processing to performance parts, Journal of Applied Polymer Science, Published online 10 March 2003, Vol. 53, No. 5,1994, pp. 485- 496
22- Yasuhiko Onishi, Atsushi Maeno, Hideyuki Tanigawa, Kazuo bra,Takashi Ito,
Masayuki Nagata and Tsuneo Sasuga, Poly( benzimidazole) as insulator for superconductors, Cryogenics 35 ( 1995) 795-798
23- “Fibrous Reinforcement for Space Applications,” NASA CR-796, 1967.
24- Robert R. Dickey a, John H. Lundell a & John A. Parker, The Development of
Polybenzimidazole Composites as Ablative Shields, NASA-Ames Research Center, Moffett Field
25- Zhang, L., Ni, Q.-Q., Shiga, A., Fu, Y., and Natsuki, T., “Synthesis and Mechanical
Properties of Polybenzimidazole Nanocomposites Reinforced byVapor Grown Carbon Nanofibers,” Polymer Composites, Vol. 31, No. 3, 2009, pp. 491–496.
Introduction
10
26- Okamoto, M., Fujigaya, T., and Nakashima, N., “Individual Dissolution of Single-
Walled Carbon Nanotubes by Using Polybenzimidazole, and Highly Effective Reinforcement of Their Composite Films,” Advanced Functional Materials, Vol. 18, No. 12, 2008, pp. 1776–1782.
27- Sidman, K. R., and Gregory, J. B., “Development of Thermally Stable
Polybenzimidazole (PBI) Fiber,” Aeronautical Systems Div., TR 72-50, Nov. 1971.
28- Sannigrahi, A., Arunbabu, D., Sankar, M., and Jana, T., “Tuning the Molecular
Properties of Polybenzimidazole by Copolymerization,” Journal of Physical Chemistry B, Vol. 111, No. 42, 2007, pp. 12124–12132.
29- Hel, R., Li, Q., Bach, A., Jensen, J. O., and Bjerrum, N. J., “Physicochemical
Properties of Phosphoric Acid Doped Polybenzimidazole Membranes for Fuel Cells,” Journal of Membrane Science, Vol. 277, 2006, pp. 38–45.
11
CHAPTER 2
Processing and Characterization of Unfilled and Nano-fibers Reinforced Polybenzimidazole
In this chapter, processing of Polybenzimidazole is presented
both in powder and solution form. Processing of nano-fibers
reinforced PBI films is also discussed. Thermal and mechanical
properties of compression molded PBI, unfilled PBI film and
carbon nano-fibers reinforced PBI films were evaluated using
Thermal-Gravimetric Analysis, Dynamic Mechanical Analysis
and tensile testing and results are presented.
2.1. Introduction
Polybenzimidazole (PBI) is a thermoplastic polymer having excellent
thermo-mechanical and chemical properties [1]. In molded form, PBI
has the highest compressive and tensile strength of any unfilled
polymeric resin [2, 3]. It has the highest glass transition temperature
(425°C) of any commercial available organic polymer [1]. It exhibits
high decomposition temperatures (500°C-600°C), good oxidation
resistance and it maintains excellent strength at cryogenic
temperatures [4]. Despite having better thermal and mechanical
properties, the real challenge is the processing of PBI as such, because
this particular polymer is not melt processable. Moreover, compression
molded PBI requires very high processing temperature (440°C) and
pressure (50 MPa). Therefore, very few research articles are available
till today regarding processing of PBI. Some researchers have
demonstrated compression molding processing of PBI using PBI powder
whereas only two articles have demonstrated the processing of PBI in
solution form to produce PBI nano-composite films [5-7]. However, a
Processing and Characterization of Unfilled and Nano-fibers Reinforced PBI
12
detailed study about thermal and mechanical behavior of unfilled PBI
and carbon nano-fibers reinforced PBI nano-composite under different
environmental conditions is not conducted till date. In this context,
present chapter will cover the processing of PBI using PBI powder and
PBI solution. A detailed study about thermal ad mechanical behavior of
unfilled and nano-filled PBI will also be the part of this chapter.
2.2. Polymer Based Nano-composites
Nano-composites are a class of composite materials where one of the
constituents has dimensions in the range of nanometers [8, 9]. In the
last decade, there has been a strong emphasis on the development of
polymeric nano-composites. The increasing interest in the development
of polymeric nano-composites exists not only because of their high
specific strength but also for the possibility of making products with
unique mechanical, electrical and thermal properties [10, 11]. However
these properties depend on several factors such as type of nano-filler,
surface treatments, type of polymer matrix and synthesis methods
[12]. At present, there are many types of nano-fillers available to
produce polymer nano-composites. Some of the most commonly used
nano-fillers are carbon nano-fibers (CNFs), carbon nano-tubes (CNTs)
and nano-clay. CNFs and CNTs have been used to modify several
polymers including polypropylene, polymethyl-methacrylate,
polyethylene-terepthalate, polystyrene and polycarbonate [13]. Both
CNFs and CNTs have similar rope-like structures, but CNTs exhibits
much smaller diameter and better mechanical, thermal and electrical
properties compared to CNFs [11, 14]. However, addition of CNTs to
polymeric resin significantly increases the viscosity of polymers. In
addition, it is difficult to uniformly disperse CNTs into polymer due to
strong Vander Waals forces between them. Contrary to CNTs, CNFs are
drawing significant attention to form nano-composite because of
relatively better dispersion and low cost [10-11, 15]. The potential of
nano-filler reinforced PBI nano-composite has not been explored yet.
Considering the high thermal and mechanical properties of PBI, CNFs
based PBI nano-composite has great potential to be used for various
aerospace applications. Therefore, the objective of this work is to
manufacture CNFs reinforced PBI film and coating in order to study the
effect of nano-fibers on thermal and mechanical properties of PBI. CNFs
were selected as nano-filler due to the ease of dispersion and relatively
low cost as compare to CNTs.
Chapter 2
13
2.2.1. Processing issues of Carbon Nano-fibers
Dispersion of CNFs into polymer matrix is not an easy task. There are
numbers of challenges arise from the small size of CNFs during the
manufacturing process. Although significant advances are made in
recent years to overcome the problems of dispersing CNFs, processing
still remains a key challenge in fully utilizing the properties of these
fibers. A primary difficulty while adding the nano-filler to the polymer is
to attain a good dispersion of the nano-filler, independent of filler shape
and aspect ratio. Without proper dispersion, filler agglomerations tend
to act as defect sites which limit the mechanical performance of the
nano-composite. Therefore, it is very important to get the uniform
dispersion of CNFs in the polymer matrix to take the full advantage of
nano-fibers reinforcement. Different dispersion methods are being used
including the dilution method, mechanical stirring, bath sonication,
melt spinning, extrusion processing and high shear mixing [16, 17].
Researchers have obtained well dispersed carbon nano-fillers in a
polymer by high energy sonication of polymer solution containing
dispersed nano-fillers followed by a solvent-evaporation method which
successfully achieved homogeneous composites [17, 18].
2.3. Experimental
2.3.1. Materials
PBI powder having molecular weight of 20,000 g/mole was supplied by
PBI Performance Products. 26% concentrated solution of
Polybenzimidazole (PBI) in Dimethyl-acetamide (DMAc) was supplied by
PBI Performance Products. This solution was used for casting the film of
unfilled PBI and CNFs reinforced PBI. CNFs with diameter ranging from
70 nm to 200 nm and length 50 μm to 200 μm were supplied by
Pyrograf Products, Inc. with trade name PR-19-XT-LHT.
2.3.2. Processing of Polybenzimidazole by Compression Molding
Processing of PBI powder was carried out using compression molding.
As PBI is not melt processable, therefore, during compression molding
process, the polymer is heated above its glass transition temperature.
The pressure was varied during compression molding in order to get
specimens with high tensile properties. Following are the three different
methods that were used to make the specimens using PBI powder.
Processing and Characterization of Unfilled and Nano-fibers Reinforced PBI
14
Method 1
In first method, mold was filled with required amount of PBI powder
and placed in the press. Mold was heated to 440°C at a rate of
5°C/min. It was kept at 440°C for 30 minutes to get a uniform heat
distribution followed by applying a pressure of 10 MPa. The mold was
kept at this pressure and temperature for 3 hours. After 3 hours, the
mold was allowed to cool down to temperature of 50°C. Afterwards,
pressure was released and the molded part was removed.
Method 2
In second method, mold was filled with required amount of PBI powder
and placed in the press. Mold was heated to 440°C at a rate of
5°C/min. It was kept at 440°C for 30 minutes to get a uniform heat
distribution followed by applying a pressure of 50 MPa. The mold was
kept at this pressure and temperature for 3 hours. After 3 hours, the
mold was allowed to cool down to a temperature of 50°C. Afterwards,
pressure was released and the molded part was removed. The
difference between first and second method is the change of pressure
during compression molding. The pressure has increased from 10 MPa
to 50 MPa in the second method.
Method 3
In this method, PBI powder was dried at 200°C for 12 hours in forced
air convection oven. After drying the PBI powder, mold was filled and
placed in the press. Mold was heated to 440°C at a rate of 5°C/min. It
was kept at 440°C for 30 minutes to get a uniform heat distribution.
Then a pressure of 50 MPa was applied on the mold with same
temperature for 3 hours. During this period, the pressure was released
for 30 seconds in order to escape any gas evolved during heating
process. After 3 hours, the mold was allowed to cool down to a
temperature of 50°C. At this point, the pressure was released and the
molded part was removed.
2.3.3. Solution casting of Basic PBI Film
In present work, efforts were made to fabricate PBI films using PBI
solution in DMAc. The as-received solution of PBI in DMAc was highly
viscous and therefore, it was diluted to 17% by adding DMAc followed
by mechanical stirring at 60°C for 15 minutes. The mixture was then
used to produce 60 to 80 µm thick film. The film was prepared by
spreading the mixture over the glass plate with the help of adjustable
Chapter 2
15
doctor blade. The film was allowed to dry in the vacuum oven at 80°C
for 2 hours and then it was further heated at 200°C for overnight. Then
the film was peeled off from the glass plate by immersing in the hot
distilled water. After removing the film from hot distilled water,
wrinkles were formed in the film more likely due the presence of some
DMAc and moisture. Therefore, in order to remove the wrinkles before
mechanical testing, the film was pressed in the hot press at 250°C and
at a pressure of 0.5 MPa.
2.3.4. Solution casting of PBI nano-composite film
In present work, PBI nano-composite film was prepared using
mechanical stirring and bath sonication methods. In first method, pre-
calculated amount of CNFs was carefully weighed and directly mixed in
the diluted solution of PBI. The mixture was then stirred mechanically
using IKA stirrer at 300 rpm for 30 minutes. In another method,
calculated amount of CNFs was weighed and added to the DMAc
solvent. CNFs were dispersed in DMAc solvent using bath sonication for
30 minutes at 60°C. After bath sonication of CNFs in DMAc, they were
added to PBI solution. The sonication process in combination with
mechanical stirring was continued for next 15 minutes. The mixture
was then used to cast the film on the glass plate as described in section
2.3.3. The nano-composite films were prepared with CNFs contents of
0.5 wt%, 1 wt% and 2 wt%.
2.4. Thermal and Mechanical Characterization
2.4.1. Thermal Gravimetric Analysis (TGA)
Thermal gravimetric analysis (TGA) was conducted to determine the
thermal stability of PBI powder, compression molded PBI, PBI neat film
and PBI nano-composite film. Tests were performed using Perkins
Elmer Thermal Analysis Instrument (Pyris Diamond Thermal
Gravimetric Analyzer). Compression molded samples were cut into
small pieces using a cutter to get the small size specimens for TGA test.
The weight of all the samples was maintained between 5 to 10 mg. The
samples were heated from a temperature range of 25°C to 550°C at a
heating rate of 10°C/min. The furnace was purged with nitrogen gas to
prevent oxidation at a flow rate of 25ml/min.
Processing and Characterization of Unfilled and Nano-fibers Reinforced PBI
16
2.4.2. Dynamic Mechanical Analysis (DMA)
Dynamic mechanical analysis (DMA) was performed in tensile mode at
an oscillation frequency of 1 Hz using Perkin-Elmer dynamic mechanical
analyzer (Pyris Dynamic Mechanical Analyzer). Samples of compression
molded PBI were cut into rectangular shape to final dimensions of
(40x8x1.2) mm3. PBI neat film and nano-composite films were cut into
rectangular shape having dimension of (40x8x0.06) mm3. Data was
collected from 25oC to 500oC at a scanning rate of 3oC/min. Elastic
modulus and loss factor of the all the samples were measured.
2.4.3. Tensile Testing
Tensile testing of compression molded PBI, unfilled PBI film and nano-
composite films was carried out using Zwick Tensile machine at a test
speed of 2 mm/min at 20°C. Rectangular specimens of 100x10x0.06
mm3 were cut from the casted films. Compression molded specimens
were machined to Dumbbell-shape according to ISO-527 for tensile
testing. Five specimens for each material were tested for the
reproducibility of the results. Force-displacement curves were recorded
from which Young’s Modulus and tensile strength was evaluated. An
extensometer was also used to determine the exact value of Young’s
Modulus.
2.4.4. Scanning Electron Microscopy (SEM Analysis)
Scanning electron microscopy of gold coated films was carried out to
examine the dispersion of CNFs in the polymer matrix and to study the
fracture surfaces after mechanical testing. Images were obtained using
JOEL-7500-FE scanning electron microscope.
2.5. Results and Discussion
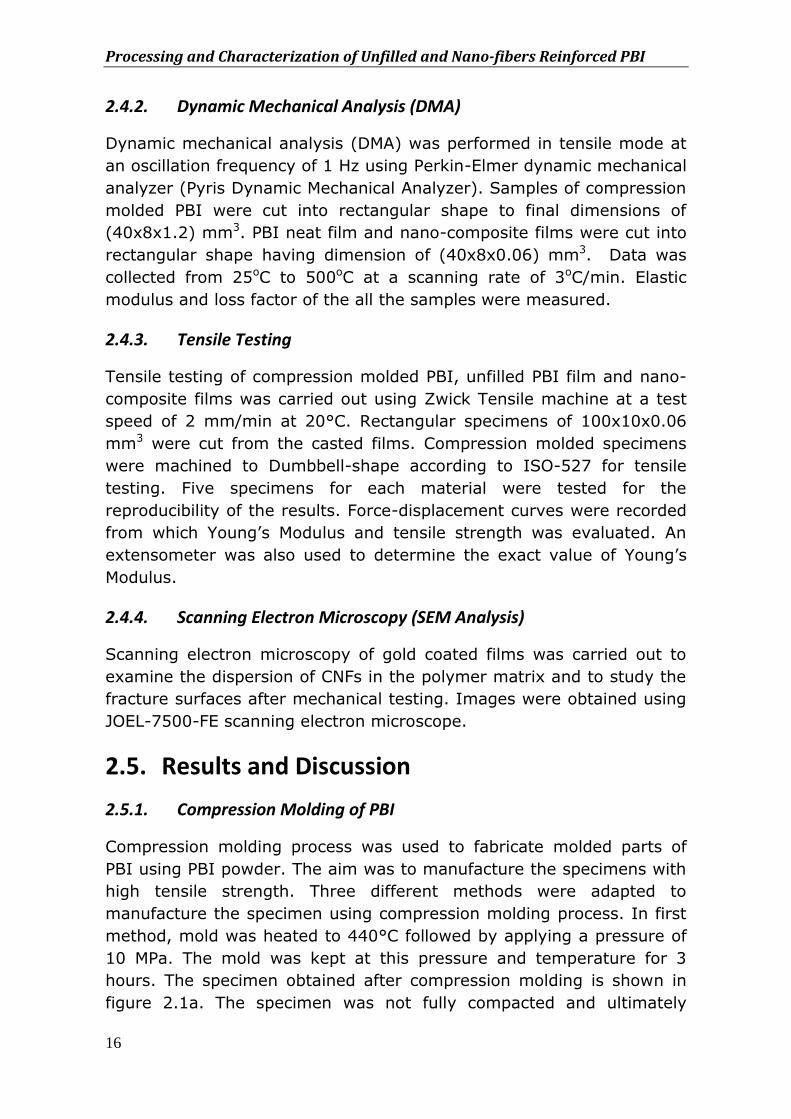
2.5.1. Compression Molding of PBI
Compression molding process was used to fabricate molded parts of
PBI using PBI powder. The aim was to manufacture the specimens with
high tensile strength. Three different methods were adapted to
manufacture the specimen using compression molding process. In first
method, mold was heated to 440°C followed by applying a pressure of
10 MPa. The mold was kept at this pressure and temperature for 3
hours. The specimen obtained after compression molding is shown in
figure 2.1a. The specimen was not fully compacted and ultimately
Chapter 2
17
broken while removing from the mold. Failure in getting proper
specimen is more likely due to the low pressure during compression
molding. This low pressure resulted in incomplete compactness of the
material. Required temperature and pressure was not applied to get
enough compaction of the material so that it can get desired strength.
Figure 2.1 (a) Molded specimen compressed at 10MPa and 440°C (b) Molded specimen compressed at 50 MPa and 440°C (c) Molded specimen compressed at 50
MPa and 440°C using pre-dried PBI powder
In the second method, molding pressure was increased from 10 MPa to
50 MPa. The mold was heated to 440°C followed by applying a pressure
of 50 MPa at 440°C. The mold was kept at this pressure and
temperature for 3 hours. The specimen obtained after compression
molding is shown in figure 2.1b. This time the specimen got enough
compaction and specimen with desired shape is obtained. However, C-
Scan of this specimen depicted some voids in the specimen which was
more likely due to the fact that PBI powder was not dried before
performing the compression molding process. Due to the presence of
moisture, the molded specimen got voids inside which ultimately
resulted in decreased tensile strength. The results of tensile tests are
presented in coming section.
(a)
(b)
(c)
Processing and Characterization of Unfilled and Nano-fibers Reinforced PBI
18
In order to prevent voids in the molded specimen, PBI powder was
dried at 200°C for 12 hours in forced air convection oven. After drying
the PBI powder, compression molding process was used to form PBI
molded parts using a temperature of 440°C and molding pressure of 50
MPa. The specimen obtained with this method is shown in figure 2.1c.
Using this method, proper specimen was obtained having no voids.
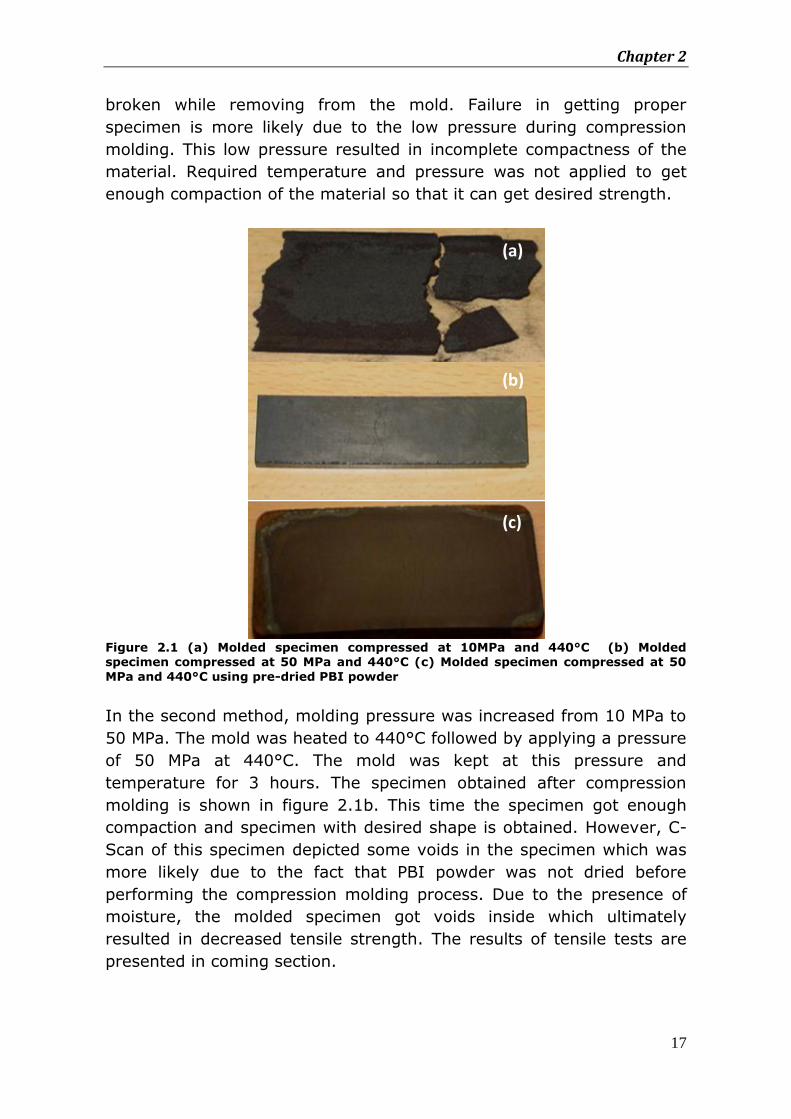
2.5.2. Processing of PBI neat film and nano-composite film
PBI films were produced to evaluate thermal and mechanical properties
of the polymer film. Unfilled and CNFs reinforced PBI films obtained
after solution casting is shown in figure 2.2.
Figure 2.2 (a) PBI neat film (b) PBI with 2 wt. % of CNF obtained after direct mechanical mixing (c) PBI with 2 wt. % of CNF obtained after bath sonication of CNFs into DMAc solvent followed by mechanical mixing (d) Compression molded PBI sample
Unfilled PBI film is shown in figure 2.2a whereas, PBI nano-composite
films obtained after performing two different dispersion techniques are
shown in figure 2.2b and 2.2c. The nano-composite film obtained with
separate dispersion of CNFs in DMAc solvent using bath sonication is
shown in figure 2.2c. After dispersion of CNFs in the polymer solution,
the color of the film was totally changed from brown, as in the case of
unfilled PBI film, to blackish which could be the first test of examining
the uniform dispersion of CNFs in the polymer matrix. PBI nano-
composite film obtained by directing mixing of CNFs into the PBI resin
has shown agglomeration which is clearly evident from figure 2.2b.
(a)
(d) (c)
(b)
Chapter 2
19
These results indicate that direct mixing of CNFs into PBI resin is not an
effective way to prepare nano-fibers reinforced PBI. Therefore, it can be
concluded that bath sonication of CNFs before adding to PBI solution is
more effective way to get PBI nano-composite films. Compression
molded specimen before mechanical testing is shown in figure 2.4d.
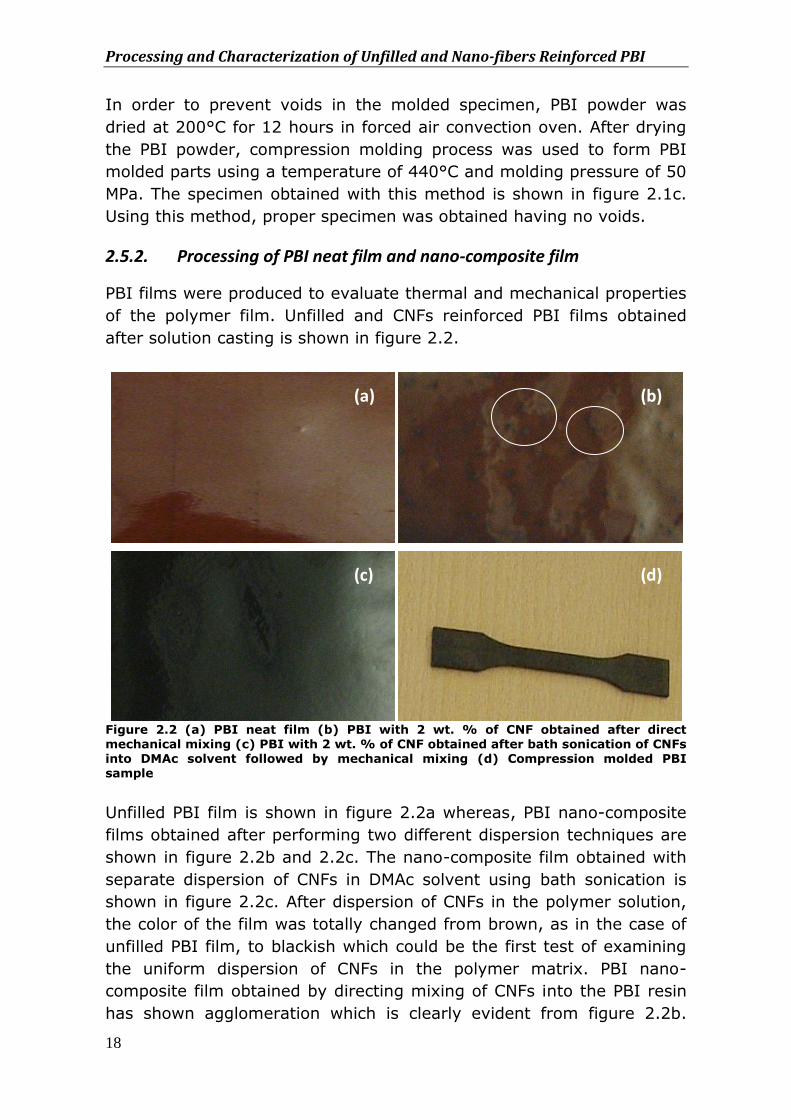
2.5.3. Thermal Gravimetric Analysis (TGA)
Thermal Gravimetric Analysis (TGA) of PBI powder, compression
molded PBI, PBI neat film and PBI nano-composite film was carried out
to determine the thermal stability of PBI. Figure 2.3a represents a
comparison of thermal stability of PBI in different forms.
Figure 2.3 Comparison of thermal stability of (a) PBI in different forms (b) Comparison of thermal stability of unfilled PBI and nano-filled PBI film with 0.5 wt%, 1wt% and 2wt% of CNFs
TGA curve of PBI powder has shown two steps decomposition. PBI has
shown initial weight loss of 2.35% which occurred between 40°C and
130°C. This initial weight loss is more likely due to the evaporation of
water. The weight loss at the initial stage can be minimized by drying
the powder in the oven. After first degradation step, weight loss starts
very slowly but continuously until the temperature reached to 550°C.
PBI has depicted only 5% weight loss up to this temperature. The high
thermal stability of PBI is due to the presence of aromatic and
heterocyclic ring in the polymer chain. The second degradation step
started around 500°C. The weight loss around 500°C is more likely due
to the loss of phenol and other gaseous products which is confirmed by
experiments [19]. Due to high thermal stability, PBI has real potential
to be used for high temperature applications. Comparing the thermal
decomposition behavior of compression molded PBI with PBI powder, it
52
62
72
82
92
102
0 100 200 300 400 500 600
Wei
ght
(%)
Temperature (°C)
PBI-PowderPBI-MoldedPBI Film
a b c
a
b
c (a)
52
62
72
82
92
102
0 100 200 300 400 500 600
Wei
ght
(%)
Temperature (°C)
Unfilled PBI
PBI+0.5%CNF
PBI+1%CNF
PBI+2%CNF
a
b d
c
a b c d
(b)
Processing and Characterization of Unfilled and Nano-fibers Reinforced PBI
20
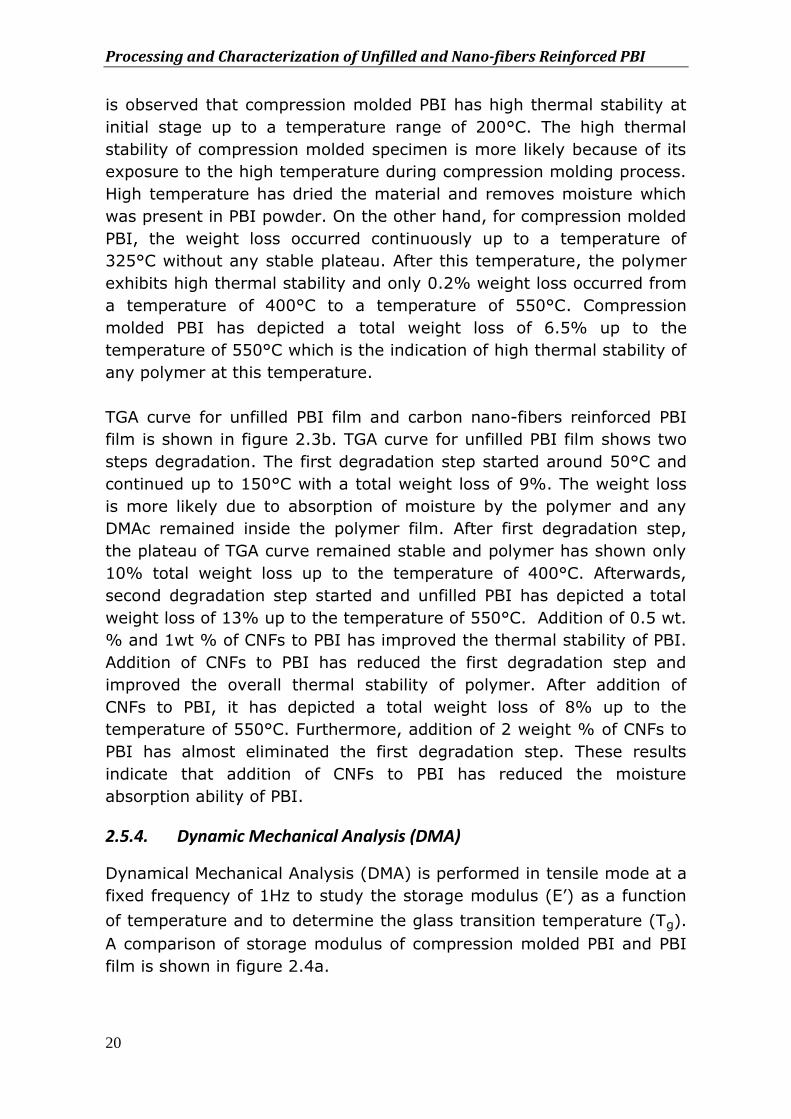
is observed that compression molded PBI has high thermal stability at
initial stage up to a temperature range of 200°C. The high thermal
stability of compression molded specimen is more likely because of its
exposure to the high temperature during compression molding process.
High temperature has dried the material and removes moisture which
was present in PBI powder. On the other hand, for compression molded
PBI, the weight loss occurred continuously up to a temperature of
325°C without any stable plateau. After this temperature, the polymer
exhibits high thermal stability and only 0.2% weight loss occurred from
a temperature of 400°C to a temperature of 550°C. Compression
molded PBI has depicted a total weight loss of 6.5% up to the
temperature of 550°C which is the indication of high thermal stability of
any polymer at this temperature.
TGA curve for unfilled PBI film and carbon nano-fibers reinforced PBI
film is shown in figure 2.3b. TGA curve for unfilled PBI film shows two
steps degradation. The first degradation step started around 50°C and
continued up to 150°C with a total weight loss of 9%. The weight loss
is more likely due to absorption of moisture by the polymer and any
DMAc remained inside the polymer film. After first degradation step,
the plateau of TGA curve remained stable and polymer has shown only
10% total weight loss up to the temperature of 400°C. Afterwards,
second degradation step started and unfilled PBI has depicted a total
weight loss of 13% up to the temperature of 550°C. Addition of 0.5 wt.
% and 1wt % of CNFs to PBI has improved the thermal stability of PBI.
Addition of CNFs to PBI has reduced the first degradation step and
improved the overall thermal stability of polymer. After addition of
CNFs to PBI, it has depicted a total weight loss of 8% up to the
temperature of 550°C. Furthermore, addition of 2 weight % of CNFs to
PBI has almost eliminated the first degradation step. These results
indicate that addition of CNFs to PBI has reduced the moisture
absorption ability of PBI.
2.5.4. Dynamic Mechanical Analysis (DMA)
Dynamical Mechanical Analysis (DMA) is performed in tensile mode at a
fixed frequency of 1Hz to study the storage modulus (E’) as a function
of temperature and to determine the glass transition temperature (Tg).
A comparison of storage modulus of compression molded PBI and PBI
film is shown in figure 2.4a.
Chapter 2
21
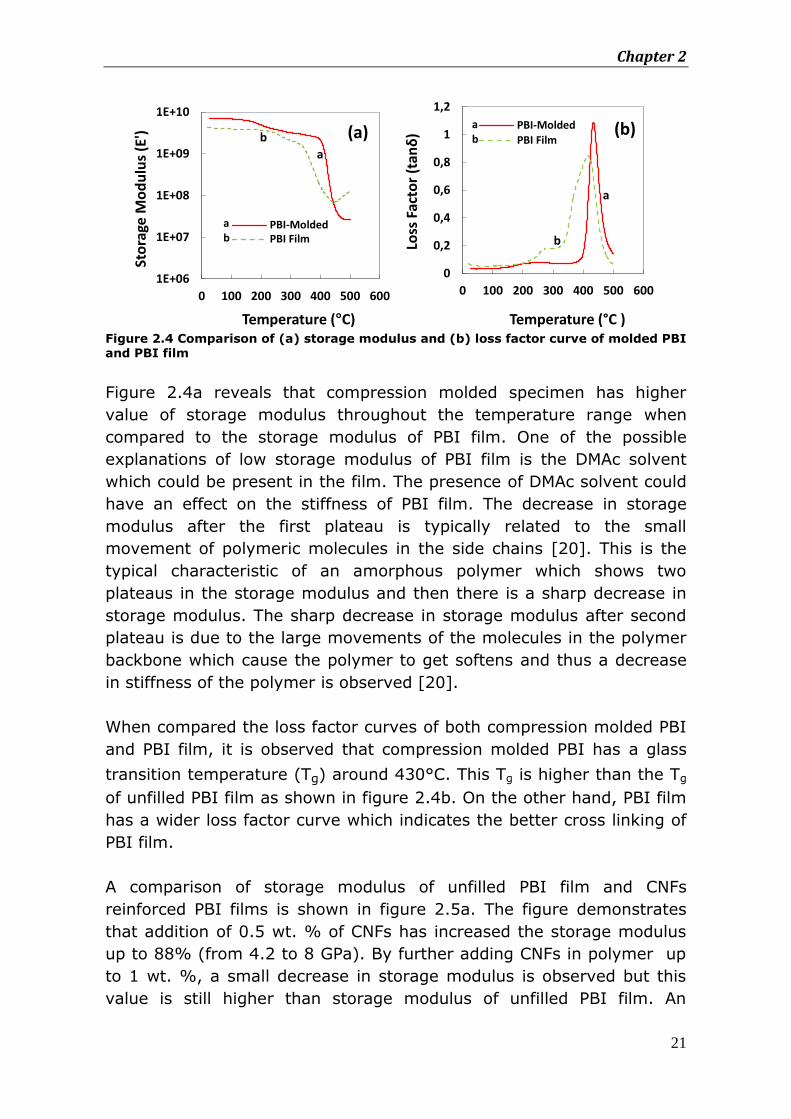
Figure 2.4 Comparison of (a) storage modulus and (b) loss factor curve of molded PBI and PBI film
Figure 2.4a reveals that compression molded specimen has higher
value of storage modulus throughout the temperature range when
compared to the storage modulus of PBI film. One of the possible
explanations of low storage modulus of PBI film is the DMAc solvent
which could be present in the film. The presence of DMAc solvent could
have an effect on the stiffness of PBI film. The decrease in storage
modulus after the first plateau is typically related to the small
movement of polymeric molecules in the side chains [20]. This is the
typical characteristic of an amorphous polymer which shows two
plateaus in the storage modulus and then there is a sharp decrease in
storage modulus. The sharp decrease in storage modulus after second
plateau is due to the large movements of the molecules in the polymer
backbone which cause the polymer to get softens and thus a decrease
in stiffness of the polymer is observed [20].
When compared the loss factor curves of both compression molded PBI
and PBI film, it is observed that compression molded PBI has a glass
transition temperature (Tg) around 430°C. This Tg is higher than the Tg
of unfilled PBI film as shown in figure 2.4b. On the other hand, PBI film
has a wider loss factor curve which indicates the better cross linking of
PBI film.
A comparison of storage modulus of unfilled PBI film and CNFs
reinforced PBI films is shown in figure 2.5a. The figure demonstrates
that addition of 0.5 wt. % of CNFs has increased the storage modulus
up to 88% (from 4.2 to 8 GPa). By further adding CNFs in polymer up
to 1 wt. %, a small decrease in storage modulus is observed but this
value is still higher than storage modulus of unfilled PBI film. An
1E+06
1E+07
1E+08
1E+09
1E+10
0 100 200 300 400 500 600
Sto
rage
Mo
du
lus
(E')
Temperature (°C)
PBI-MoldedPBI Film
a
b
a b
(a)
0
0,2
0,4
0,6
0,8
1
1,2
0 100 200 300 400 500 600
Loss
Fac
tor
(tan
δ)
Temperature (°C )
PBI-Molded
PBI Film
b
a
a b
(b)
Processing and Characterization of Unfilled and Nano-fibers Reinforced PBI
22
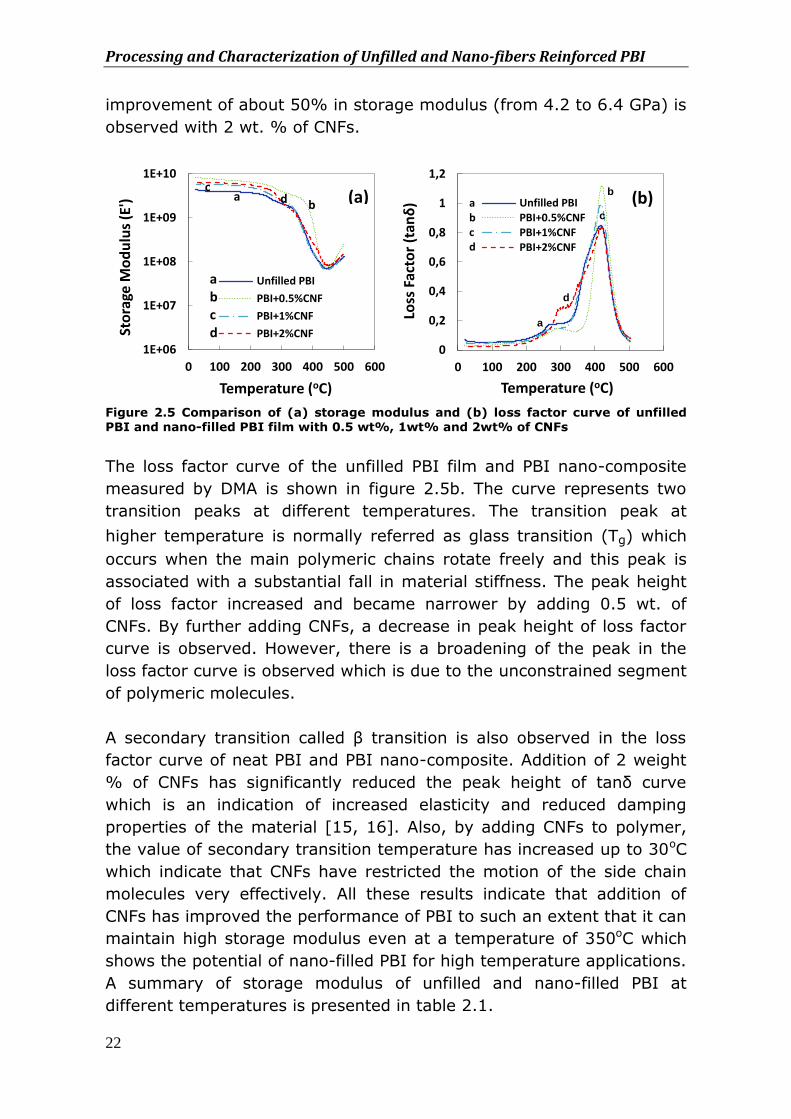
improvement of about 50% in storage modulus (from 4.2 to 6.4 GPa) is
observed with 2 wt. % of CNFs.
Figure 2.5 Comparison of (a) storage modulus and (b) loss factor curve of unfilled PBI and nano-filled PBI film with 0.5 wt%, 1wt% and 2wt% of CNFs
The loss factor curve of the unfilled PBI film and PBI nano-composite
measured by DMA is shown in figure 2.5b. The curve represents two
transition peaks at different temperatures. The transition peak at
higher temperature is normally referred as glass transition (Tg) which
occurs when the main polymeric chains rotate freely and this peak is
associated with a substantial fall in material stiffness. The peak height
of loss factor increased and became narrower by adding 0.5 wt. of
CNFs. By further adding CNFs, a decrease in peak height of loss factor
curve is observed. However, there is a broadening of the peak in the
loss factor curve is observed which is due to the unconstrained segment
of polymeric molecules.
A secondary transition called β transition is also observed in the loss
factor curve of neat PBI and PBI nano-composite. Addition of 2 weight
% of CNFs has significantly reduced the peak height of tanδ curve
which is an indication of increased elasticity and reduced damping
properties of the material [15, 16]. Also, by adding CNFs to polymer,
the value of secondary transition temperature has increased up to 30oC
which indicate that CNFs have restricted the motion of the side chain
molecules very effectively. All these results indicate that addition of
CNFs has improved the performance of PBI to such an extent that it can
maintain high storage modulus even at a temperature of 350oC which
shows the potential of nano-filled PBI for high temperature applications.
A summary of storage modulus of unfilled and nano-filled PBI at
different temperatures is presented in table 2.1.
1E+06
1E+07
1E+08
1E+09
1E+10
0 100 200 300 400 500 600
Sto
rage
Mo
du
lus
(E')
Temperature (oC)
Unfilled PBI
PBI+0.5%CNF
PBI+1%CNF
PBI+2%CNF
a b c d
a b
c d (a)
0
0,2
0,4
0,6
0,8
1
1,2
0 100 200 300 400 500 600
Loss
Fac
tor
(tan
δ)
Temperature (oC)
Unfilled PBIPBI+0.5%CNFPBI+1%CNFPBI+2%CNF
a b c d
a
b
c
d
(b)
Chapter 2
23
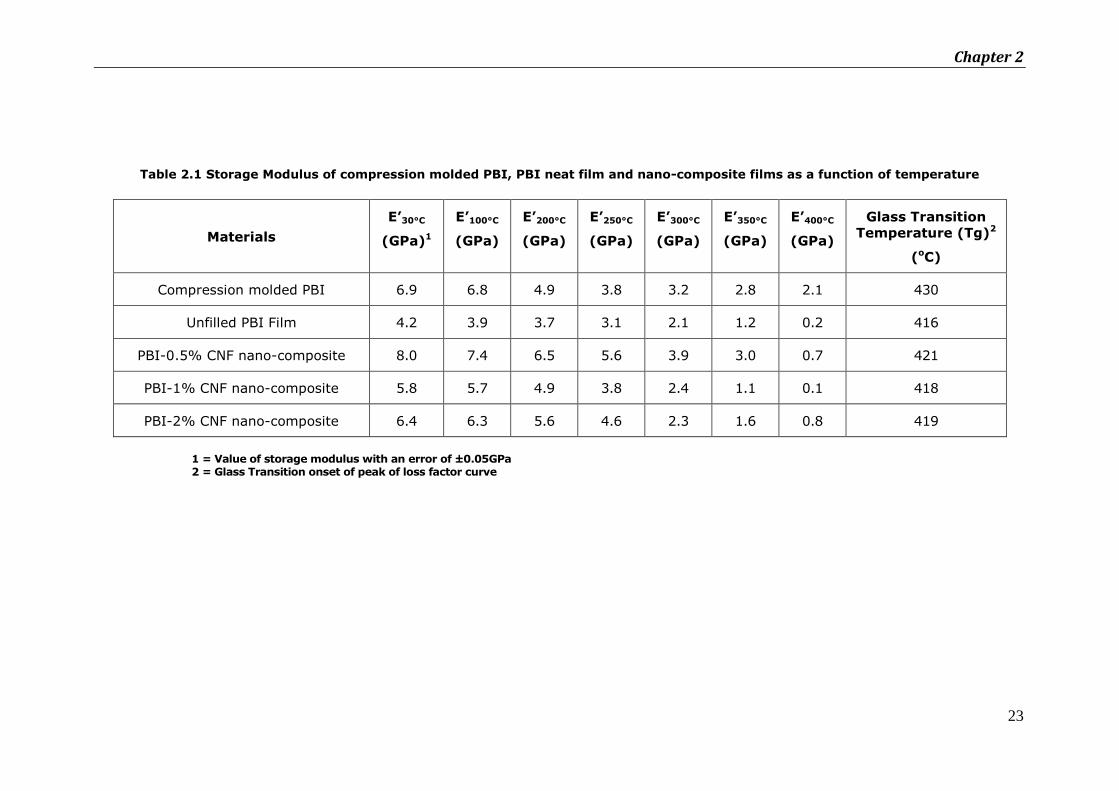
Table 2.1 Storage Modulus of compression molded PBI, PBI neat film and nano-composite films as a function of temperature
Materials
E’30°C
(GPa)1
E’100°C
(GPa)
E’200°C
(GPa)
E’250°C
(GPa)
E’300°C
(GPa)
E’350°C
(GPa)
E’400°C
(GPa)
Glass Transition
Temperature (Tg)2
(oC)
Compression molded PBI 6.9 6.8 4.9 3.8 3.2 2.8 2.1 430
Unfilled PBI Film 4.2 3.9 3.7 3.1 2.1 1.2 0.2 416
PBI-0.5% CNF nano-composite 8.0 7.4 6.5 5.6 3.9 3.0 0.7 421
PBI-1% CNF nano-composite 5.8 5.7 4.9 3.8 2.4 1.1 0.1 418
PBI-2% CNF nano-composite 6.4 6.3 5.6 4.6 2.3 1.6 0.8 419
1 = Value of storage modulus with an error of ±0.05GPa 2 = Glass Transition onset of peak of loss factor curve
Processing and Characterization of Unfilled and nano-filled PBI
24
Table 2.1 shows that both compression molded PBI and unfilled PBI film
have retained high storage modulus even at a temperature of 350oC.
Furthermore, addition of CNFs to PBI has further improved the
performance of PBI film and film has retained even higher storage
modulus at 350oC. Table 2.1 also represents the glass transition
temperature measurement as an onset of maximum peak height of loss
factor curve. Both unfilled PBI film and nano-filled PBI films have
depicted very high glass transition temperature as reported in the table
2.1.
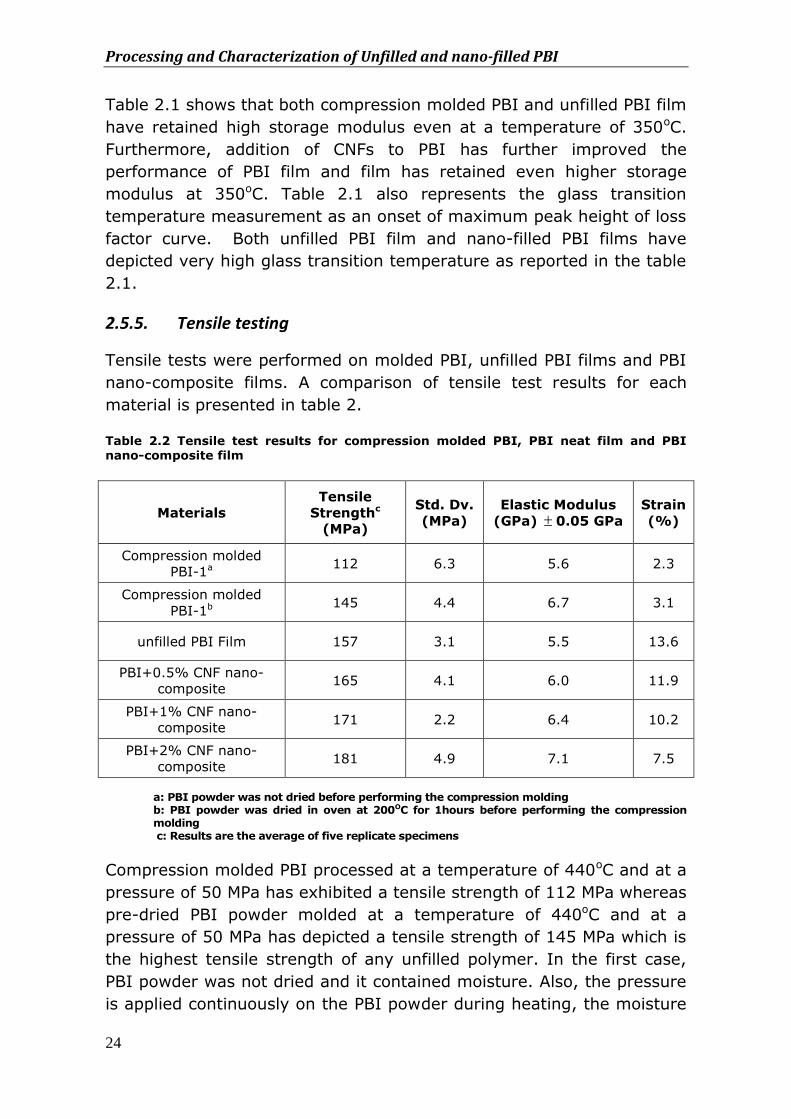
2.5.5. Tensile testing
Tensile tests were performed on molded PBI, unfilled PBI films and PBI
nano-composite films. A comparison of tensile test results for each
material is presented in table 2. Table 2.2 Tensile test results for compression molded PBI, PBI neat film and PBI nano-composite film
Materials
Tensile
Strengthc
(MPa)
Std. Dv.
(MPa)
Elastic Modulus
(GPa) 0.05 GPa
Strain
(%)
Compression molded
PBI-1a 112 6.3 5.6 2.3
Compression molded
PBI-1b 145 4.4 6.7 3.1
unfilled PBI Film 157 3.1 5.5 13.6
PBI+0.5% CNF nano-
composite 165 4.1 6.0 11.9
PBI+1% CNF nano-
composite 171 2.2 6.4 10.2
PBI+2% CNF nano-
composite 181 4.9 7.1 7.5
a: PBI powder was not dried before performing the compression molding b: PBI powder was dried in oven at 200OC for 1hours before performing the compression molding
c: Results are the average of five replicate specimens
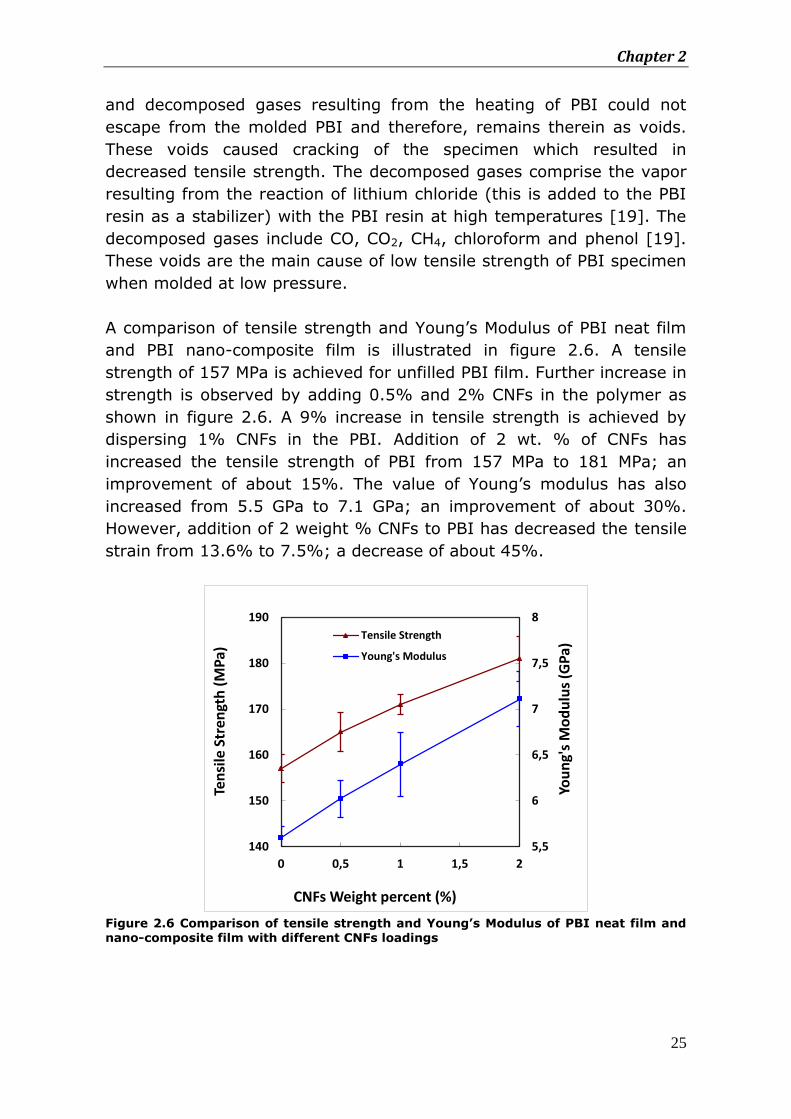
Compression molded PBI processed at a temperature of 440oC and at a
pressure of 50 MPa has exhibited a tensile strength of 112 MPa whereas
pre-dried PBI powder molded at a temperature of 440oC and at a
pressure of 50 MPa has depicted a tensile strength of 145 MPa which is
the highest tensile strength of any unfilled polymer. In the first case,
PBI powder was not dried and it contained moisture. Also, the pressure
is applied continuously on the PBI powder during heating, the moisture
Chapter 2
25
and decomposed gases resulting from the heating of PBI could not
escape from the molded PBI and therefore, remains therein as voids.
These voids caused cracking of the specimen which resulted in
decreased tensile strength. The decomposed gases comprise the vapor
resulting from the reaction of lithium chloride (this is added to the PBI
resin as a stabilizer) with the PBI resin at high temperatures [19]. The
decomposed gases include CO, CO2, CH4, chloroform and phenol [19].
These voids are the main cause of low tensile strength of PBI specimen
when molded at low pressure.
A comparison of tensile strength and Young’s Modulus of PBI neat film
and PBI nano-composite film is illustrated in figure 2.6. A tensile
strength of 157 MPa is achieved for unfilled PBI film. Further increase in
strength is observed by adding 0.5% and 2% CNFs in the polymer as
shown in figure 2.6. A 9% increase in tensile strength is achieved by
dispersing 1% CNFs in the PBI. Addition of 2 wt. % of CNFs has
increased the tensile strength of PBI from 157 MPa to 181 MPa; an
improvement of about 15%. The value of Young’s modulus has also
increased from 5.5 GPa to 7.1 GPa; an improvement of about 30%.
However, addition of 2 weight % CNFs to PBI has decreased the tensile
strain from 13.6% to 7.5%; a decrease of about 45%.
Figure 2.6 Comparison of tensile strength and Young’s Modulus of PBI neat film and nano-composite film with different CNFs loadings
5,5
6
6,5
7
7,5
8
140
150
160
170
180
190
0 0,5 1 1,5 2
You
ng'
s M
od
ulu
s (G
Pa)
Ten
sile
Str
engt
h (
MP
a)
CNFs Weight percent (%)
Tensile Strength
Young's Modulus
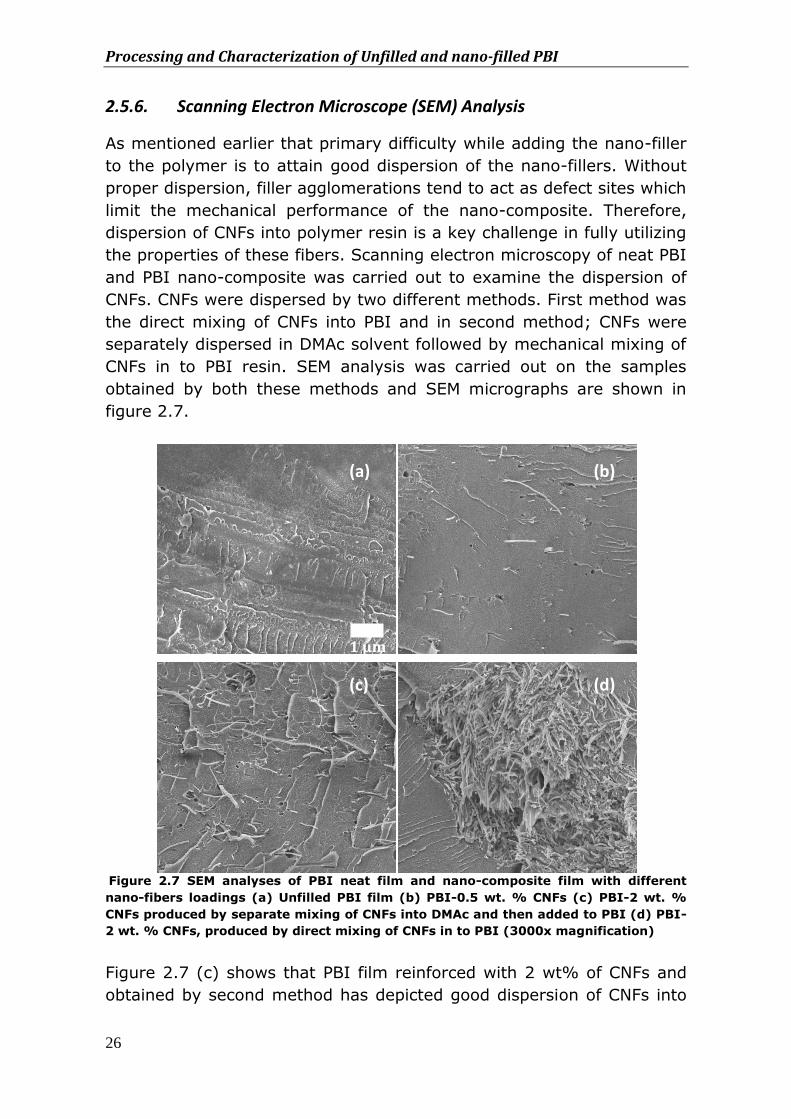
Processing and Characterization of Unfilled and nano-filled PBI
26
2.5.6. Scanning Electron Microscope (SEM) Analysis
As mentioned earlier that primary difficulty while adding the nano-filler
to the polymer is to attain good dispersion of the nano-fillers. Without
proper dispersion, filler agglomerations tend to act as defect sites which
limit the mechanical performance of the nano-composite. Therefore,
dispersion of CNFs into polymer resin is a key challenge in fully utilizing
the properties of these fibers. Scanning electron microscopy of neat PBI
and PBI nano-composite was carried out to examine the dispersion of
CNFs. CNFs were dispersed by two different methods. First method was
the direct mixing of CNFs into PBI and in second method; CNFs were
separately dispersed in DMAc solvent followed by mechanical mixing of
CNFs in to PBI resin. SEM analysis was carried out on the samples
obtained by both these methods and SEM micrographs are shown in
figure 2.7.
Figure 2.7 SEM analyses of PBI neat film and nano-composite film with different
nano-fibers loadings (a) Unfilled PBI film (b) PBI-0.5 wt. % CNFs (c) PBI-2 wt. %
CNFs produced by separate mixing of CNFs into DMAc and then added to PBI (d) PBI-
2 wt. % CNFs, produced by direct mixing of CNFs in to PBI (3000x magnification)
Figure 2.7 (c) shows that PBI film reinforced with 2 wt% of CNFs and
obtained by second method has depicted good dispersion of CNFs into
100 μm
100 μm
1 μm
(a) (b)
(d) (c)
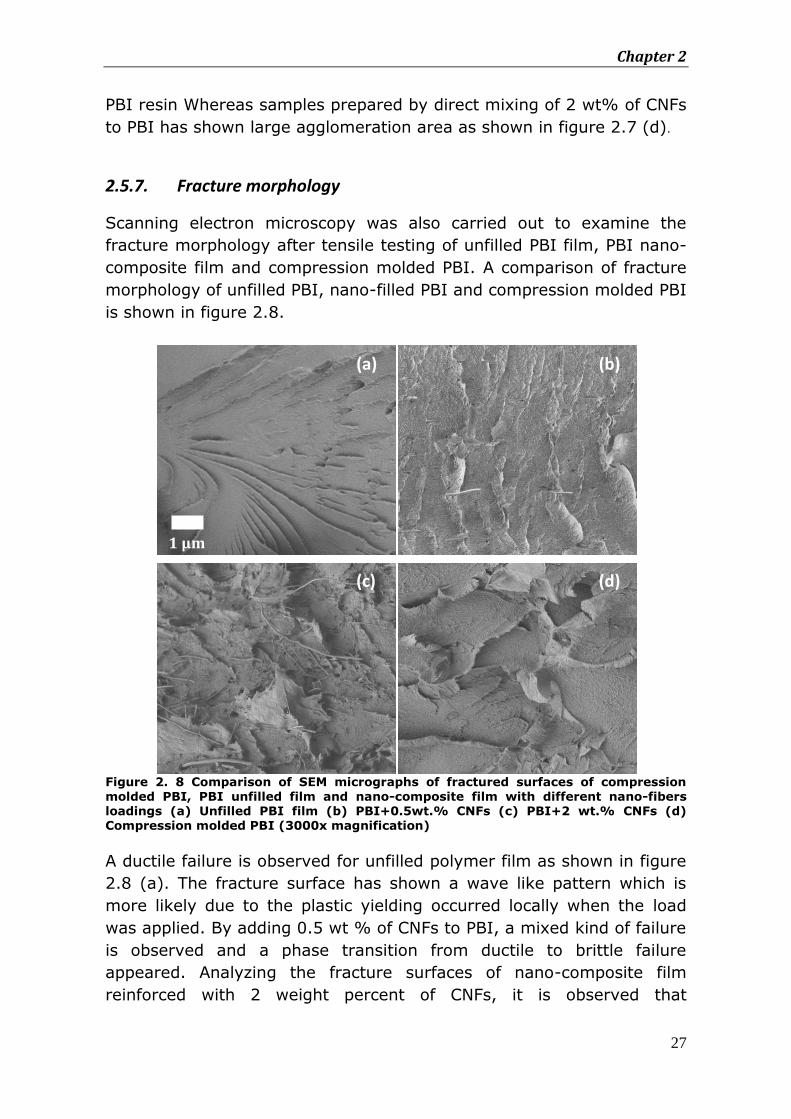
Chapter 2
27
PBI resin Whereas samples prepared by direct mixing of 2 wt% of CNFs
to PBI has shown large agglomeration area as shown in figure 2.7 (d).
2.5.7. Fracture morphology
Scanning electron microscopy was also carried out to examine the
fracture morphology after tensile testing of unfilled PBI film, PBI nano-
composite film and compression molded PBI. A comparison of fracture
morphology of unfilled PBI, nano-filled PBI and compression molded PBI
is shown in figure 2.8.
Figure 2. 8 Comparison of SEM micrographs of fractured surfaces of compression
molded PBI, PBI unfilled film and nano-composite film with different nano-fibers loadings (a) Unfilled PBI film (b) PBI+0.5wt.% CNFs (c) PBI+2 wt.% CNFs (d) Compression molded PBI (3000x magnification)
A ductile failure is observed for unfilled polymer film as shown in figure
2.8 (a). The fracture surface has shown a wave like pattern which is
more likely due to the plastic yielding occurred locally when the load
was applied. By adding 0.5 wt % of CNFs to PBI, a mixed kind of failure
is observed and a phase transition from ductile to brittle failure
appeared. Analyzing the fracture surfaces of nano-composite film
reinforced with 2 weight percent of CNFs, it is observed that
100 μm
1 μm
(a) (b)
(c) (d)
Processing and Characterization of Unfilled and nano-filled PBI
28
deformation occurred in different directions. This is more likely due to
the fact that crack growth is diverged from one direction to another as
a result of interaction with the CNFs in PBI matrix. A much rougher
fracture surface is observed upon adding 2 wt. % of CNF to PBI as
shown in figure 2.8 (c). The increased surface roughness implies that
the path of the crack tip is distorted because of the CNFs, making crack
propagation more difficult. Fracture surface of compression molded PBI
is shown in figure 2.8 (d). Compression molded specimen failed in a
brittle fashion both on microscopic and macroscopic level. Cracks are
formed, and there is no sign of large-scale plastic deformation.
2.6. Conclusions
In this study, efforts were made to develop CNFs reinforced PBI nano-
composite. Processing of PBI was carried out using PBI both in powder
and solution form. Thermo-mechanical properties of compression
molded PBI, unfilled PBI film and nano-composite films were
investigated using TGA, DMA and tensile testing. TGA analysis shows
that both compression molded PBI and PBI film have depicted only 5%
and 9% weight loss respectively up to a temperature of 550oC which
indicate that PBI has high thermal stability. DMA studies indicate that
both compression molded PBI and unfilled PBI film exhibit very high
storage modulus even at a temperature of 300oC. PBI nano-composite
films were casted with different loading of CNFs. Addition of CNFs has
improved the thermal stability and storage modulus of PBI film.
Mechanical testing shows that both compression molded PBI and PBI
film have the highest ultimate tensile strength compared to any unfilled
polymer. Scanning electron microscopy has confirmed the uniform
dispersion of CNFs in polymer solution. Analysis of fractured surfaces
revealed that a ductile failure was occurred for unfilled PBI film.
Contrary to the unfilled PBI, a much rough fracture surface is observed
in case of PBI nano-composite which implies that the path of the crack
tip is distorted due to the presence of CNFs. Addition of CNFs to PBI has
made the crack propagation more difficult. These results end up with
the conclusion that both unfilled PBI and nano-filled PBI have excellent
thermal and mechanical properties and these properties make PBI a
potential candidate for future aerospace applications. Furthermore,
addition of CNFs to PBI polymer has improved both thermal and
mechanical properties of PBI which will be beneficial for different high
temperature applications of polymer.
Chapter 2
29
2.7. References
1- Paul A. Steinerand Robert Sandor, “Polybenzimidazole Prepreg: Improved Elevated Temperature Properties with Autoclave Processability, “High performance polymers, Vol. 3, No. 3, 1991, pp. 139-150
2- D.J.Kemmish, High performance engineering plastics, Rapra review reports,
Vol. 8, No. 2, Report 86, 1995
3- Sylvie beland, High performance thermoplastic resins and their composites, 1st ed., ISBN-08155 1278-3, Noyes, New Jersy, 1990, pp. 47-50
4- S. Bhowmik, H. W. Bonin, V. T. Bui, R. D. Weir, Modification of high-
performance polymer composite through high-energy radiation and low-pressure plasma for aerospace and space applications, “Jouranl of Applied Polymer Science, Jan 2006, Vol. 102, 2006, pp. 1959-1967
5- O. R. Hughes, O. N. Chen, W.M. Cooper, L. P. Disano, E. Alvarez and T.E. Andres,
PBI powder processing to performance parts, Journal of Applied Polymer Science, Published online 10 March 2003, Vol. 53, No. 5,1994, pp. 485- 496
6- Li Zhang, Qing-Qing Ni, Akihiko Shiga, Yaqin Fu, Toshiaki Natsuki, “Polymer
Composites, “Synthesis and Mechanical Properties of Polybenzimidazole Nanocomposites Reinforced by Vapor Grown Carbon Nanofibers, 2009, Vol. 31, pp. 491-496
7- Minoru Okamoto, Tsuyohiko Fujigaya, and Naotoshi Nakashima, “Individual
Dissolution of Single-Walled Carbon Nanotubes by Using Polybenzimidazole, and Highly Effective Reinforcement of Their Composite Films, “Advanced Functional Materials, 2008, Vol. 18, pp.1776–1782
8- Milo S.P. Shaffer and Jan K.W. Sandler, Carbon Nanotube/Nanofibre Polymer
Composites, Department of Chemistry, Imperial College London
9- Farzana Hussain, M.H., Masami Okamoto and Russell E. Gorga, Polymer-matrix Nanocomposites, Processing, Manufacturing, and Application: An Overview, 1511,Journal of Composite Materials, 2006. 40(17): p. 65.
10- Aruna Kumar Barick, Deba Kumar Tripathy, Effect of nanofiber on material properties of vapor-grown carbon nanofiber reinforced thermoplastic polyurethane (TPU/CNF) nanocomposites prepared by melt compounding, composite Part A, 2010, Vol. 41, pp. 1471-1482
11- Zhongfu Zhao and Jan Gou, Improved fire retardancy of thermoset composites
modified with carbon nanofibers, Sci. Technol. Adv. Mater. 10 (2009) 015005 (6pp)
Processing and Characterization of Unfilled and nano-filled PBI
30
12- Joseph H. Koo, Polymer Nanocomposites, processing characteristics and applications, Department of Mechanical Engineering The University of Texas at Austin Austin, Texas
13- Bernadette A. Higgins, William J. Brittain, Polycarbonate carbon nanofiber composites, European Polymer Journal 41 (2005) 889–893
14- Shuying Yang, Jaime Taha-Tijerina, Vero´nica Serrato-Diaz, Krystal Hernandez, Karen LozanoDynamic mechanical and thermal analysis of aligned vapor grown carbon nanofiber reinforced polyethylene, Composites: Part B 38 (2007) 228–235
15- M.C. Saha, Md.E. Kabir, S. Jeelani , Enhancement in thermal and mechanical
properties of polyurethane foam infused with nanoparticles, Materials Science and Engineering A 479 (2008) 213–222,
16- S.G. Prolongo, M.B., M.R. Gude, R. Chaos-Morán, M. Campo, A. Urena, Effects of dispersion techniques of carbon nanofibers on the thermo-physical properties of epoxy nanocomposites. Composites Science and Technology, 2008. 68: p. 9.
17- Young-Kuk Choi, K.-i.S., Sung-Moo Song, Yasuo Gotoh, Yutaka Ohkoshi,
Morinobu Endo, Mechanical and physical properties of epoxy composites reinforced by vapor grown carbon nanofibers Carbon 2005. 43: p. 10.
18- Peng He, Y.G., Jie Lian, Lumin Wang, Dong Qian, Jian Zhao, Wei Wang, Mark J.
Schulz, Xing Ping Zhou, Donglu Shi, Surface modification and ultrasonication effect on the mechanical properties of carbon nanofiber/polycarbonate composites Composites: Part A, 2006. 37: p. 6.
19- M. Kurisaki, Y.Sasaki, U.S. Patenet 5770142, “Process for manufacturing
sintered polybenzimidazole article, filed 13 June 1997
20- P.M.Kevin, Dynamic Mechanical Analysis: A practical Introduction, 2nd edition, Florida (1999)
31
CHAPTER 3
Fire Testing of Nano-fibers Reinforced Polybenzimidazole Coating for Aircraft Application
In this chapter, a brief overview of combustion process and
decomposition mechanism of polymeric materials is
presented. Fire reaction properties of uncoated carbon/epoxy
composite and composite with unfilled and carbon nano-fibers
reinforced PBI coating are studied using thermal gravimetric
analysis and cone calorimeter test and results are presented.
3.1. Introduction
In recent times, the use of polymer based composite materials is
becoming significantly popular. Composites materials, with their wide
range of possible fillers and resins, have opened the way to an
enormous range of materials with diverse chemical, physical, and
mechanical properties. These materials have an impressive and diverse
range of applications in automotive, aviation, spacecrafts, civil
infrastructure and sports industry [1-4]. In recent years, there has
been a steady increase in the use of composite materials in both
military and commercial aircraft. The body of Boeing 777 aircraft had
consumed about 12% of polymer composite and 50% of Aluminum by
weight. The weight percent of composite has increased from 12 percent
to 50 percent in the newly developed Boeing 787 and A380 passenger
aircraft [3, 5-7]. The increasing interest in the use of composite
materials is due to some advantages of composites materials over
many metallic materials. The key advantages are low weight, high
strength to weight ratio, excellent corrosion resistance, outstanding
Fire Testing of Nano-fibers Reinforced PBI coating for Aircraft Application
32
thermal insulation and low thermal expansion. However, there are
some disadvantages of composite materials and these include low
through thickness mechanical properties, poor impact damage and poor
performance under fire [3].
An important consideration while using composites in load-bearing
structures is their mechanical integrity in the event of fire. When
composite materials are exposed to high temperature of 300oC to
400oC, organic matrix decomposes with the release of heat, smoke and
toxic volatiles. Softening and decomposition of the polymer matrix
caused by fire rapidly reduces the properties of composite material
which ultimately lead to collapse of the composite structure [8].
Although polymer based composites are flammable at lower
temperature than Aluminum, yet these materials possess some
inherently useful properties which are not the characteristics of metals.
The rate of heat conduction of composite material is much lower than
metals [3]. The low heat conduction rate is significantly beneficial in
slowing the fire spread rate. Other important characteristic of many
polymer composites is that they can provide protective barrier in the
form of char (carbonaceous layer) against flame, heat smoke and toxic
fumes.
Due to their high flammability, epoxy composite cannot be used in the
aircraft cabin. Phenolic based composites have better fire resistant
properties. Therefore, phenolic based composites are most commonly
used material in the aircraft cabin and they account for 80 to 90
percent of the interior furnishings of modern passenger aircraft [4].
However, these materials have low mechanical properties [9].
Therefore, phenolic based composites are not being used as structural
components in the airframe of the aircraft. It is very important that
composite materials used in the structural parts of aircraft should retain
their load bearing properties during and after a fire. One of the worst
accidents due to fire in the aircraft occurred in May 1996 when a
ValuJet DC-9 crashed in Florida. The fire developed in the cargo after
the take-off and soon after, the aircraft crashed resulted in the death of
all 105 passengers and crew members. The investigation about the
accident has shown that failure of flight control systems due to extreme
heat and structural collapse resulted in the loss of control of the aircraft
[3]. This incident demonstrates the importance of fire resistant
properties of structural components.
Chapter 3
33
Fire in the aircraft is extremely hazardous because of little time for
response. During a fire in an aircraft, the flight crew has two minutes to
escape and the pilots have about 14 minutes to land and evacuate
safely [3]. The growing use of composite material in aircraft highlights
the importance of understanding fire reaction and fire resistant
properties of these materials. In the coming sections, an understanding
about the decomposition mechanism of polymeric based materials will
be presented. After having an understanding of fire reaction properties
of these materials, efforts will be devoted to develop fire resistant PBI
coating for aircraft application.
3.2. Combustion Process of Polymers
Polymeric materials undergo both physical and chemical changes when
exposed to heat. The chemical processes are responsible for the
generation of flammable volatiles whereas physical changes are
responsible for melting and charring which can markedly alter the
decomposition and burning characteristics of materials [10, 11]. The
behavior of polymer based composite material in fire is governed
mainly by the chemical processes which are responsible for thermal
decomposition of the polymer matrix and fibers. In case of fire, polymer
combustion occurred as a cycle of coupled events namely, heating of
the polymer, decomposition, ignition and combustion. Heat transferred
to the polymer results in increased temperature of the polymer to a
point where it starts to decompose and gives out non-combustible
(CO2, H2O) and combustible volatiles (hydrocarbons, carbon mono
oxide and monomers). These combustible volatiles diffuse into the
flame zone above the burning polymer and undergo the combustion
process. As a result, large amount of heat is evolved and under steady
state burning conditions, a part of heat is transferred back to the
polymer surface to sustain the combustion cycle [3, 12]. The overall
burning mechanism of polymer based composite material during a fire
is shown in figure 3.1.
The decomposition products, rate of decomposition and mechanisms of
thermal decomposition not only depends on the chemical composition
of the polymer but also on its physical properties such as glass
transition, melting, and decomposition temperatures. All these
temperatures influence the thermal decomposition processes due to the
fact that polymer undergoes phase transitions at these temperatures.
These phase transitions are responsible for the changes in physical
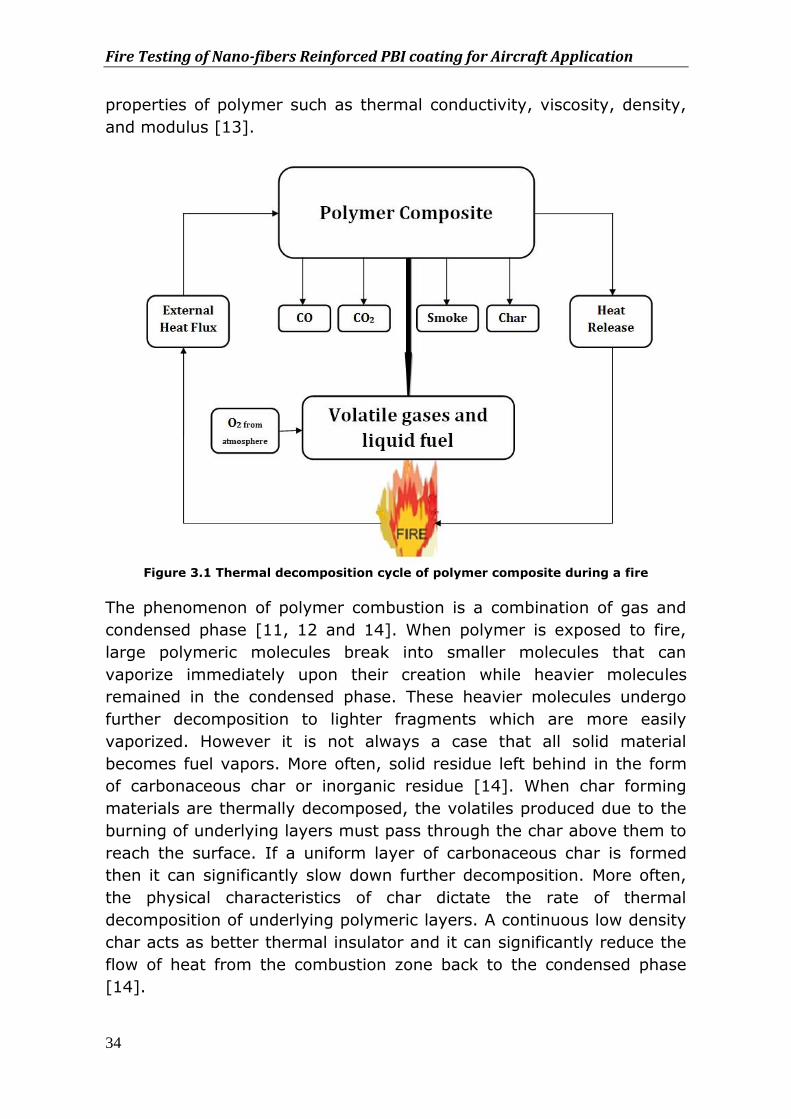
Fire Testing of Nano-fibers Reinforced PBI coating for Aircraft Application
34
properties of polymer such as thermal conductivity, viscosity, density,
and modulus [13].
Figure 3.1 Thermal decomposition cycle of polymer composite during a fire
The phenomenon of polymer combustion is a combination of gas and
condensed phase [11, 12 and 14]. When polymer is exposed to fire,
large polymeric molecules break into smaller molecules that can
vaporize immediately upon their creation while heavier molecules
remained in the condensed phase. These heavier molecules undergo
further decomposition to lighter fragments which are more easily
vaporized. However it is not always a case that all solid material
becomes fuel vapors. More often, solid residue left behind in the form
of carbonaceous char or inorganic residue [14]. When char forming
materials are thermally decomposed, the volatiles produced due to the
burning of underlying layers must pass through the char above them to
reach the surface. If a uniform layer of carbonaceous char is formed
then it can significantly slow down further decomposition. More often,
the physical characteristics of char dictate the rate of thermal
decomposition of underlying polymeric layers. A continuous low density
char acts as better thermal insulator and it can significantly reduce the
flow of heat from the combustion zone back to the condensed phase
[14].
Chapter 3
35
3.3. Classification of Polymers Based on Thermal Decomposition Mechanism
Based on decomposition mechanism, polymers can be classified in
three categories [3]. In first class of polymers, degradation process
takes place by random chain scission reaction in which all of the
molecular structure is converted into volatile gases on heating and no
char left behind them. The examples of such polymers include some
thermosets and thermoplastics such as polypropylene, polyethylene
Polystyrene and poly methyl methacrylate [3].
The second group undergoes random chain scission, end-chain scission
and chain stripping reactions which leads to the loss of hydrogen
atoms, pendant groups (atoms attached to backbone of polymer) and
other low molecular weight organic groups from the main chain. These
polymers yield a small amount of char of about 5-20% of the original
mass [3]. Examples of such polymers are polyesters, vinyl esters,
epoxies and polyvinyl chlorides.
The third group of polymers is characterized by a high aromatic ring
contents that decomposes into aromatic fragments which results in the
formation of char. The examples of such polymers are highly aromatic
thermosets (Phenolics, polyimides, cyanate esters) and some
thermoplastics (PPS, PI, PEEK, PBI). These polymers tend to form a
carbonaceous char residue through cross-linking reaction. The char
yield is the mass fraction of carbonaceous char that remains after
flaming combustion of the polymer.
Study shows that polymers with aliphatic hydrocarbon such as PE, PP,
and PS are much more flammable than the polymers that contain
aromatic, hetero-aromatic rings with hetero atoms such as N, S and O
[12]. As the decomposition of aliphatic polymers starts by bond
scission, low molecular fragments are generated which can easily
evaporated and provide additional fuel to fire. However, aromatic
polymers usually form relatively large aromatic fragments that can be
kept in solid state for a longer time. Also, aromatic polymers usually
produce relatively high char yields. The char can reduce the amount
and release rate of volatile fuels and act as a barrier for heat and mass
transfer. Therefore, aromatic polymers generally have lower
flammability [12]. Based on above discussion it can be summarized
Fire Testing of Nano-fibers Reinforced PBI coating for Aircraft Application
36
that, in general, the ideal fire-resistant polymers should have the
following characteristics:
a. high decomposition temperature
b. Ability to form high char yield
c. low amount and release rate of volatile fuels
d. release of chemical flame-retardant molecules such as halogen
and water
3.4. Effect of Char Formation on Fire Resistant Properties of Polymers
When polymeric material is exposed to a sufficiently large heat flux
radiated from a fire, the polymer matrix decomposes to yield volatile
gases, solid carbonaceous char and airborne soot particles (smoke).
Char formation at the surface of the polymer during the decomposition
slows down further decomposition of underlying polymeric layers. The
physical structure of char is very important in slowing down the
decomposition of a polymer [14]. The important characteristics of char
are density, continuity, adherence, oxidation resistance and thermal
insulation properties. A dense char layer with low thermal conductivity
over the exposed surface acts a thermal insulator for underneath
polymer and at the same time it acts as physical barrier to combustible
gaseous products [11].
Aromatic rings are the basic building blocks from which char is formed.
The higher the aromatic content of the polymer, the higher the char
yield is obtained. Studies on different polymers with varying amount of
aromatic contents in their backbone reveal that the char yield increases
linearly with the concentration of multiple-bonded aromatic ring groups
in the polymer system. Figure 3.2 shows the relationship between the
density of aromatic groups in the back-bone of polymers against their
percentage yields of volatile gas and char [3]. There is a linear
correlation between the density of aromatic groups and char yield, with
a corresponding decrease in volatiles. Hence, increasing the aromatic
contents in polymer backbone generally results in better flame
retardant properties of polymer. Figure 3.2 shows that phenolic resins
which are well known for their fire resistant properties, form a char
residue of about 65% with a volatile yield of about 35%. On the other
hand, polybenzimidazole (PBI) which is the candidate coating for this
study, form a residue of about 85% with a volatile yield of about 15%.
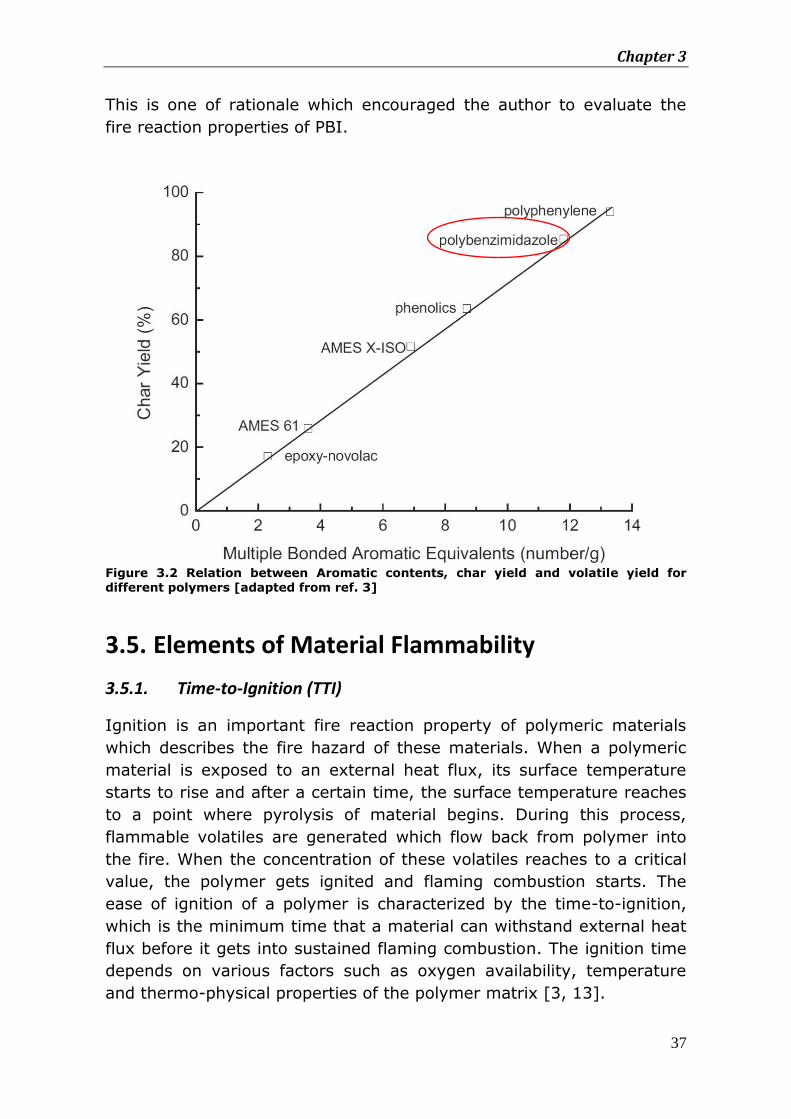
Chapter 3
37
This is one of rationale which encouraged the author to evaluate the
fire reaction properties of PBI.
Figure 3.2 Relation between Aromatic contents, char yield and volatile yield for different polymers [adapted from ref. 3]
3.5. Elements of Material Flammability
3.5.1. Time-to-Ignition (TTI)
Ignition is an important fire reaction property of polymeric materials
which describes the fire hazard of these materials. When a polymeric
material is exposed to an external heat flux, its surface temperature
starts to rise and after a certain time, the surface temperature reaches
to a point where pyrolysis of material begins. During this process,
flammable volatiles are generated which flow back from polymer into
the fire. When the concentration of these volatiles reaches to a critical
value, the polymer gets ignited and flaming combustion starts. The
ease of ignition of a polymer is characterized by the time-to-ignition,
which is the minimum time that a material can withstand external heat
flux before it gets into sustained flaming combustion. The ignition time
depends on various factors such as oxygen availability, temperature
and thermo-physical properties of the polymer matrix [3, 13].
Fire Testing of Nano-fibers Reinforced PBI coating for Aircraft Application
38
3.5.2. Heat Release Rate (HRR)
Heat release is the thermal energy produced per unit area of surface
when exposed to external heat flux. It is the single most important fire
reaction property of polymers and polymer based composite materials
which provide the information about the material response during a
fire. Higher heat release rate (HRR) from a material could result in
rapid fire growth because the heat released by a burning material can
provide the additional thermal energy required for the growth and
spread of fire [3, 15]. Several other flame resistant properties of
materials, such as flame spread rate, smoke generation and CO
emission are related to the HRR [16].
3.5.3. Flame Propagation Index (FPI)
As mentioned earlier that heat release rate of a material during a fire is
the single most important parameter in characterizing the hazard of a
material in fire. Recently, it has been established that fire propagation
index (FPI) which is the ratio of the peak heat release rate (PHRR) to
TTI is a more accurate predictor of the time to flashover in both room
and aircraft compartment fires because it also takes into accounts the
thickness effect of the materials [15].
PHRR (KW/m2) FPI =
TTI (Seconds)
In a compartment fire, the time to flashover is the time available for
escape which is one of the most important factors in determining the
fire hazards of a material in a compartment fire. The time to flashover
can be derived using the following relation [9, 15].
Time to Flashover (Sec) = 991- 631log10FPI
3.5.4. Smoke generation
Smoke production and emission of toxic gases are the most important
fire hazards other than HRR. Polymers and polymer based composites
release dense smoke in a fire. The smoke produced by the burning of
these materials consists of small fiber fregments and soot particles. The
smoke can be extremely dense and limit the visibility which cause the
hindrance of the people trying to escape from fire. Both aliphatic and
aromatic polymers can emit large quantities of smoke during
Chapter 3
39
combustion. However, highly aromatic polymers such as aromatic
polyimides, phenolics and PBI give little smoke [3]. With these
polymers, effective char formation leads to little aromatic fuel release.
Several factors such as high thermal stability of polymers, their char
forming capability and small release of volatile fuels are important
factors which can reduce the smoke generated during a fire [10].
3.6. Methods to Improve the Fire Resistance of Polymers and Polymer Based Composites
Fire resistance of organic polymers can be improved by the following
ways.
a. Addition of Flame retardants to Polymers
b. Addition of nano-fillers to Polymers
c. Application of fire protective coatings
3.6.1. Addition of flame retardants to Polymers
One of the most commonly used approach to get the fire resistant
polymer is the use of fire retardant additives to the inexpensive
polymers such as PP, PE and PS. These polymers can be made fire
retardant by adding some halogen (chlorine, bromine) or phosphorus
additives which enhance the ability of cross linking of these polymers
and thus increase the char formation during the fire [3, 10, 11 and 17].
The action of the flame retardant depends on the structure of the
additive and polymer. Generally, the main flame retardant action of
halogenated polymers is the disruption of the gas phase reactions that
control the flame temperature of a fire. Reactive halogen species are
released from a decomposing brominated or chlorinated polymer into
the flame where they terminate the exothermic decomposition
reactions of organic volatiles, and thereby lower the temperature [12].
The flammability resistance of polymers can also be greatly improved
by the addition of phosphorus. The most commonly used phosphorus
based flame retardants are ammonium polyphosphates and
trialylphosphates. The flame-retardant mechanisms of these
phosphorus compounds include the formation of a glassy layer on the
surface to protect the underlying substrate from flame and enhanced
capability of the material to form char [17].
Fire Testing of Nano-fibers Reinforced PBI coating for Aircraft Application
40
3.6.2. Limitation of Using Fire retardants
Although fire retardants are widely used in polymers but they have
some limitations as well. A major concern with halogenated polymers is
the release of smoke which contains acidic and toxic gases. These
gases are serious hazards for health and environment [12, 17].
Chlorinated polymers release plentiful HCl gas which attacks the
respiratory system and eyes and ultimately hinder the people to escape
from fire. Brominated polymers, on decomposition, produce a variety of
toxic bromine-containing volatiles which also affect breathing. Of
particular concern is the formation of brominated dibenzodioxine
compound [12, 17]. Exposure to a high concentration of dioxins can
cause a variety of health problems, including cancers, skin discoloration
and skin rashes. For these reasons, environmental groups have
pressurized the Governments especially in Europe to ban or severely
restrict the use of halogens [11].
3.6.3. Nano-filler based flame retardant nano-composites
Nano-fillers have been increasingly used to fabricate polymer nano-
composites. Common nano-fillers include nano-clay, carbon nano-tubes
(CNTs) and carbon nano-fibers (CNFs). Recent studies have confirmed
that the addition of these nano-fillers to polymers could reduce the
materials flammability, while improving their mechanical properties
[18]. The interest in polymer-clay nano-composites has developed due
to the fact that the presence of layered silicate materials at relatively
low loading levels of about 3 to 5 weight percent can greatly improve
the mechanical properties, enhance the barrier properties and improve
the fire retardancy of polymers [3]. Layered silicates are widely used
for an improvement in flame retardancy, but carbon nano-tubes (CNTs)
have been proved more efficient [19]. A Better fire resistant
performance of polymer reinforced with CNTs is observed due to the
fact that polymers with CNTs formed a relatively uniform carbonaceous
layer covering the entire sample surface without any cracks or gaps
[20]. The network layer re-emits much of the incident radiations back
into the gas phase from its hot surface. As a result, it reduces the
transmitted flux to the underlying polymer layer and thus slows down
the polymer pyrolysis rate [20]. Just like CNTs, CNFs form continuous
protective barrier layer through the accumulation of nano-fillers on the
combusting surfaces [19]. However, one of the previous studies shows
that the flame-retardant performance of the CNFs reinforced polymers,
containing cracks in the protective char layer, was much poorer than
Chapter 3
41
that of the nano-composites forming a continuous protective network
layer [21]. Thus, the formation of a continuous protective network layer
without any opening or crack is an essential requirement for the large
reduction in heat release rate. Many flammability studies have been
performed on nano-filler based polymers [19, 20, 22-24]. All these
studies have shown improvement in the fire resistant properties of
polymers. Many of these studies were performed using commodity
polymers to study the effect of nano-fillers on polymer flammability.
However, effect of these nano-fillers on flammability properties of
inherently flame retardant polymers has not been studied till date.
Therefore, in this context, one of the objectives of this work is to study
the effect of CNFs on fire resistant properties of inherently flame
retardant Polybenzimidazole (PBI).
3.6.4. Application of fire protective coatings
One of the methods to improve the fire resistant performance of
composite material is to insulate the composite structure using a
thermal barrier protective coating to extend the survival time in high
temperature fires. The purpose of applying a coating on composite
materials is to slow down the heat conduction into the composite from
the fire and thus improve the fire endurance and survivability of
composite materials. The coatings can extend the time to flashover by
slowing the heat-up rate and decomposition rate of the composite
material. Research on composite materials with thermal barrier
coatings have shown an improvement in fire reaction properties of
composites such as increased time-to-ignition and reduced heat release
rate [8]. For effective protection of composite material, it is desirable to
have a coating with low flammability, low thermal conductivity and
strong adhesion.
Coating can be classified into the following three groups.
a. flame retardant paints
b. thermal barriers
c. Intumescent
Flame retardant paints are inherently fire resistant resins that are
applied over the composite substrate. These paints delay ignition and
flaming combustion of the substrate due to their high thermal stability.
The most commonly used fire retardant paints are phenolics,
brominated paints and alkyde resins. These coatings include moderate
cost, light-weight and good chemical compatibility with the composite
Fire Testing of Nano-fibers Reinforced PBI coating for Aircraft Application
42
substrate that ensures good adhesion [3]. Phenolic coatings are an
effective and low cost method to improve the flammability resistance of
composites materials. Phenolic resins improve the fire performance due
to their low yield of flammable volatiles that delays ignition and forms
an insulating char layer. However, a thick layer is required to create an
effective insulation while using phenolic paint. Some commercial
organic coatings do not provide much protection with a coating
thickness of about 0.5 mm [3].
Thermal barrier coatings are usually ceramic-based coatings that are
non-flammable and have low heat of conduction. Examples of these
coatings include silica, rockwool fibrous mats and zirconia (a plasma
spray coating). Thermal barrier coatings provide fire protection due to
the fact that these coatings having excellent insulating properties and
some ceramic based coatings have heat reflective properties which
ultimately help to direct the heat back towards the fire. Despite the
improved fire resistance, ceramic coatings are used carefully on
composites due to their high cost. Furthermore, these coatings are
prone to cracking due to the mismatch in their thermal expansion
properties with the substrate.
Intumescent coatings are excellent heat insulators which slow down the
rate of heat transfer into composite laminates during fire. Intumescent
materials provide fire protection by undergoing a chemical reaction at
elevated temperature that causes the coating to foam and swell. This
reaction produces a thick char layer which has very low thermal
conductivity [3]. A major problem with many commercial instumecent
coating is that they do not bond strongly with the substrate, and often
fall off during swelling, exposing the underlying composite directly to
the flame [3]. Therefore, it is essential that the coating is bonded
strongly to the substrate and has mechanical strength to ensure
adequate fire protection. Another drawback of these coatings is their
incompatibility with certain manufacturing processes, poor durability,
and low resistance to wear and erosion [3].
Based on the discussion in the previous section, in present work, efforts
are devoted to improve the fire resistance performance of aerospace
grade epoxy based carbon fiber composite by applying an inherently
flame retardant coating reinforced with CNFs.
Chapter 3
43
3.7. Experimental
3.7.1. Materials
Solution of PBI in DMAc (with 26% concentration of PBI) supplied by
PBI Performance Products. 99% concentrated N, N-Dimethyl-acetamide
(DMAc) is purchased from Aldrich chemicals to dilute the PBI solution.
M21 epoxy based unidirectional (UD) carbon fiber prepregs were
supplied by Hexcel. CNFs with diameter ranging from 70 nm to 200 nm
and length 50 μm to 200 μm were supplied by Pyrograf Products, Inc.
with trade name PR-19-XT-LHT.
3.7.2. Preparation of Composite Laminates
Composite laminates were prepared by stacking up number of prepreg
layers followed by curing in the autoclave at a pressure of 7 bars and at
a temperature of 180°C for 2 hours. Laminates with a thickness of 3.4
mm was prepared by using a cure cycle provided by the supplier of the
material.
3.7.3. Plasma Treatment of Composite Laminates
Composite samples were plasma treated using TIGRES Plasma-
BLASTER MEF equipment. For this particular study, the gas used for
treatment was air at a pressure of 4.5 bars. Before performing the
plasma treatment, the samples were first cleaned with methanol using
ultrasonic cleaning to remove any contamination on the surface. After
cleaning, the specimens were heated at 80°C under vacuum for four
hours. Then the surfaces of these specimens were treated using
atmospheric pressure plasma.
3.7.4. Contact Angle Measurement
Change in the surface energy after atmospheric pressure plasma
treatment was determined in term of contact angle value. A reduced
value of contact angle indicates an improvement in surface energy of
material which in turn results in an improved adhesion of the coating.
Water was used as a liquid to determine the contact angle on
composite surface before and after the plasma treatment.
3.7.5. Adhesion Testing
Lap shear tests were performed to study the effect of atmospheric
pressure plasma treatment on the adhesion properties of PBI.
Fire Testing of Nano-fibers Reinforced PBI coating for Aircraft Application
44
Specimens for lap shear testing were cut to the dimensions of (100 x
25 x 3.4) mm3 and they were adhesively bonded for single lap shear
tensile tests. Lap shear tests were performed at Zwick tensile testing
machine using a test speed of 5 mm/min.
3.7.6. Preparation of Unfilled PBI Coated Samples
The as-received 26% solution of PBI in DMAc was highly viscous and
therefore, it was essential to dilute the solution for proper processing.
DMAc was added to the PBI solution to dilute the solution down to the
17%. The solution was stirred mechanically at 60°C for 15 minutes to
get a uniform mixture of PBI in DMAc. The mixture was then used as a
coating material for composite laminates to produce a coating thickness
of about 750 - 800 µm. The coating was applied on cured composite
laminates with the help of adjustable doctor blade which also allows
controlling the thickness of the coating. The coating was allowed to dry
in the vacuum oven at 80°C for 2 hours. Afterwards, the coated
samples were further dried in vacuum oven at 125°C for overnight.
3.7.7. Preparation of Nano-filled PBI Coated Samples
CNFs reinforced PBI solution was prepared as described in section
2.3.4. CNFs reinforced PBI solution was used as a coating material for
cured composite laminates to produce a coating thickness of about
750-800 µm. The nano-filled coating was prepared with 2 weight
percent of CNFs. The coating was applied on composite laminates in the
same way as the unfilled PBI coating.
3.7.8. Thermal gravemetric Analysis (TGA)
TGA is used to measure the change in mass of a sample as a function
of temperature, time or both. This technique can provide quantitative
information about the thermal decompositions of the polymeric
materials from which thermal stability of the polymer can be evaluated.
TGA was conducted to determine the thermal stability of unfilled PBI
film, CNFs reinforced PBI film and carbon/epoxy composite. Tests were
performed using Perkins Elmer Thermal Analysis Instrument (Pyris
Diamond Thermal gravimetric Analyzer). The weight of all the samples
was maintained between 7 to 10 mg. The samples were heated in air
from a temperature range of 25°C to 575°C at a heating rate of
10°C/min.
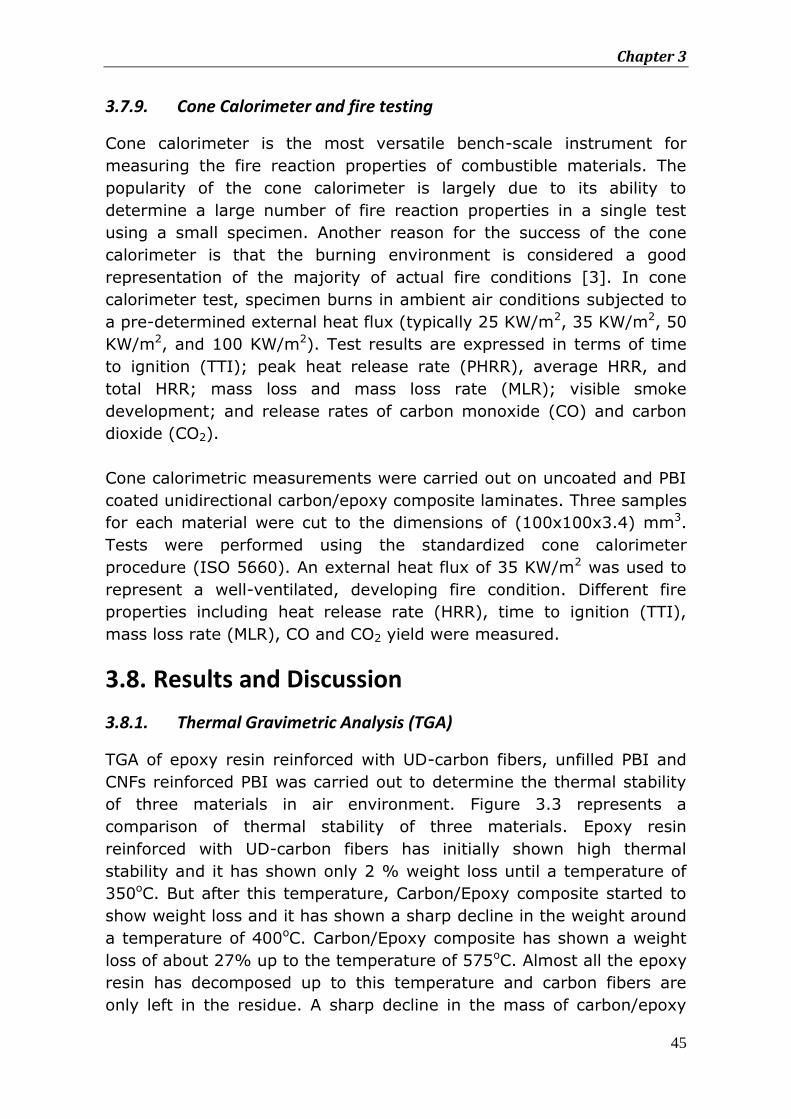
Chapter 3
45
3.7.9. Cone Calorimeter and fire testing
Cone calorimeter is the most versatile bench-scale instrument for
measuring the fire reaction properties of combustible materials. The
popularity of the cone calorimeter is largely due to its ability to
determine a large number of fire reaction properties in a single test
using a small specimen. Another reason for the success of the cone
calorimeter is that the burning environment is considered a good
representation of the majority of actual fire conditions [3]. In cone
calorimeter test, specimen burns in ambient air conditions subjected to
a pre-determined external heat flux (typically 25 KW/m2, 35 KW/m2, 50
KW/m2, and 100 KW/m2). Test results are expressed in terms of time
to ignition (TTI); peak heat release rate (PHRR), average HRR, and
total HRR; mass loss and mass loss rate (MLR); visible smoke
development; and release rates of carbon monoxide (CO) and carbon
dioxide (CO2).
Cone calorimetric measurements were carried out on uncoated and PBI
coated unidirectional carbon/epoxy composite laminates. Three samples
for each material were cut to the dimensions of (100x100x3.4) mm3.
Tests were performed using the standardized cone calorimeter
procedure (ISO 5660). An external heat flux of 35 KW/m2 was used to
represent a well-ventilated, developing fire condition. Different fire
properties including heat release rate (HRR), time to ignition (TTI),
mass loss rate (MLR), CO and CO2 yield were measured.
3.8. Results and Discussion
3.8.1. Thermal Gravimetric Analysis (TGA)
TGA of epoxy resin reinforced with UD-carbon fibers, unfilled PBI and
CNFs reinforced PBI was carried out to determine the thermal stability
of three materials in air environment. Figure 3.3 represents a
comparison of thermal stability of three materials. Epoxy resin
reinforced with UD-carbon fibers has initially shown high thermal
stability and it has shown only 2 % weight loss until a temperature of
350oC. But after this temperature, Carbon/Epoxy composite started to
show weight loss and it has shown a sharp decline in the weight around
a temperature of 400oC. Carbon/Epoxy composite has shown a weight
loss of about 27% up to the temperature of 575oC. Almost all the epoxy
resin has decomposed up to this temperature and carbon fibers are
only left in the residue. A sharp decline in the mass of carbon/epoxy
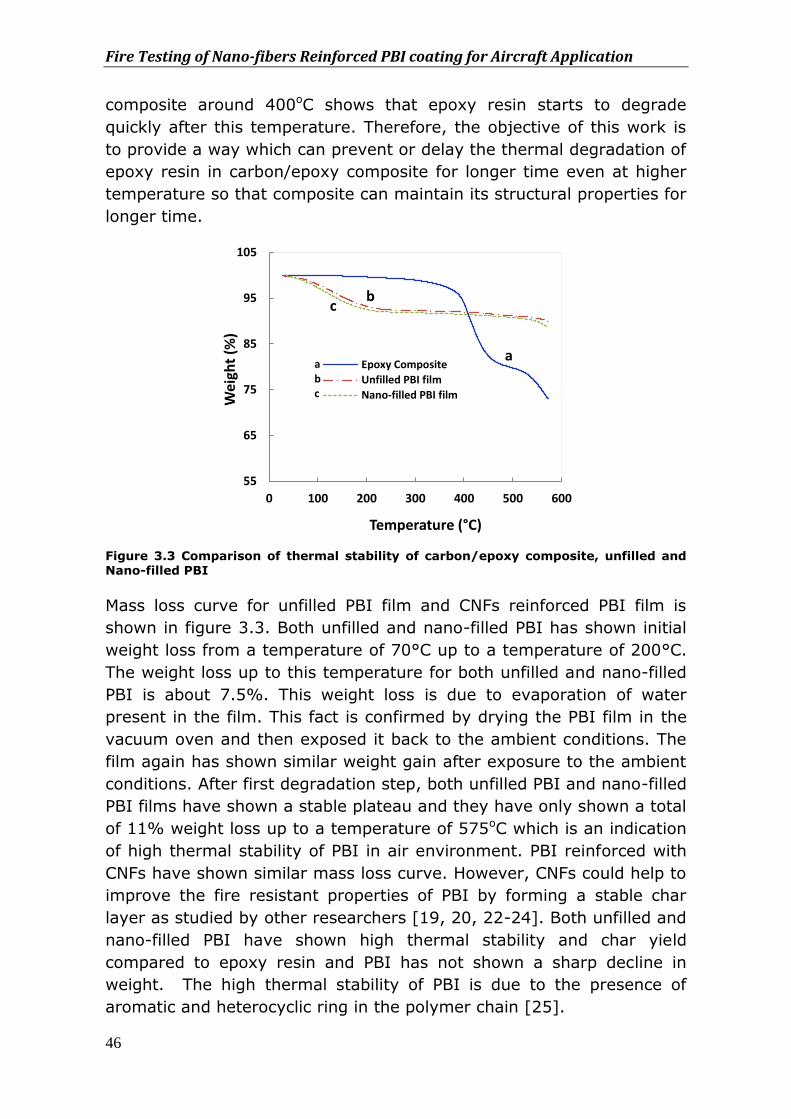
Fire Testing of Nano-fibers Reinforced PBI coating for Aircraft Application
46
composite around 400oC shows that epoxy resin starts to degrade
quickly after this temperature. Therefore, the objective of this work is
to provide a way which can prevent or delay the thermal degradation of
epoxy resin in carbon/epoxy composite for longer time even at higher
temperature so that composite can maintain its structural properties for
longer time.
Figure 3.3 Comparison of thermal stability of carbon/epoxy composite, unfilled and
Nano-filled PBI
Mass loss curve for unfilled PBI film and CNFs reinforced PBI film is
shown in figure 3.3. Both unfilled and nano-filled PBI has shown initial
weight loss from a temperature of 70°C up to a temperature of 200°C.
The weight loss up to this temperature for both unfilled and nano-filled
PBI is about 7.5%. This weight loss is due to evaporation of water
present in the film. This fact is confirmed by drying the PBI film in the
vacuum oven and then exposed it back to the ambient conditions. The
film again has shown similar weight gain after exposure to the ambient
conditions. After first degradation step, both unfilled PBI and nano-filled
PBI films have shown a stable plateau and they have only shown a total
of 11% weight loss up to a temperature of 575oC which is an indication
of high thermal stability of PBI in air environment. PBI reinforced with
CNFs have shown similar mass loss curve. However, CNFs could help to
improve the fire resistant properties of PBI by forming a stable char
layer as studied by other researchers [19, 20, 22-24]. Both unfilled and
nano-filled PBI have shown high thermal stability and char yield
compared to epoxy resin and PBI has not shown a sharp decline in
weight. The high thermal stability of PBI is due to the presence of
aromatic and heterocyclic ring in the polymer chain [25].
55
65
75
85
95
105
0 100 200 300 400 500 600
Wei
ght
(%)
Temperature (°C)
Epoxy Composite
Unfilled PBI film
Nano-filled PBI film
a a b c
b c
Chapter 3
47
Mass loss rate (MLR) is another important parameter to evaluate the
material response during fire. MLR of a material gives an indication
about the rate at which fuel is supplied to the fire. The temperature at
which significant mass loss occurs during decomposition in air provides
information about the ignition temperature of the polymer [26]. This is
the point when significant fuel is supplied by the polymer to the fire. A
comparison of MLR of three materials is shown in figure 3.4.
Figure 3.4 comparison of Mass Loss Rate of carbon/epoxy composite, unfilled and
Nano-filled PBI
Figure 3.4 shows that carbon/epoxy composite has shown very low MLR
up to a temperature 300oC and afterwards, it started to show an
increase in MLR. Carbon/epoxy composite has shown a peak in the MLR
around a temperature of 400oC which is an indication that
carbon/epoxy composite reached to its ignition temperature. This is the
same temperature where carbon/epoxy composite has shown a large
decrease in the weight during TGA. On the other hand, PBI has shown a
small initial peak in the MLR which is due to the evaporation of water as
mentioned earlier and then it remained stable and has not shown any
further peak in MLR up to a temperature of 550oC. After this
temperature PBI has started to show a rise in MLR but this high
temperature is not expected during the fire testing under an external
heat flux of 35 KW/m2 [27].
3.8.2. Contact Angle measurement of Plasma treated Composite Substrate
Very often, composite materials do not possess the surface properties
needed to achieve better adhesion of the coating. Atmospheric pressure
0
1
2
3
4
5
6
7
0 100 200 300 400 500 600
DTG
(%
/min
)
Temperature (°C)
Epoxy Composite
Unfilled PBI film
Nano-filled PBI film
b
a b c
a
c
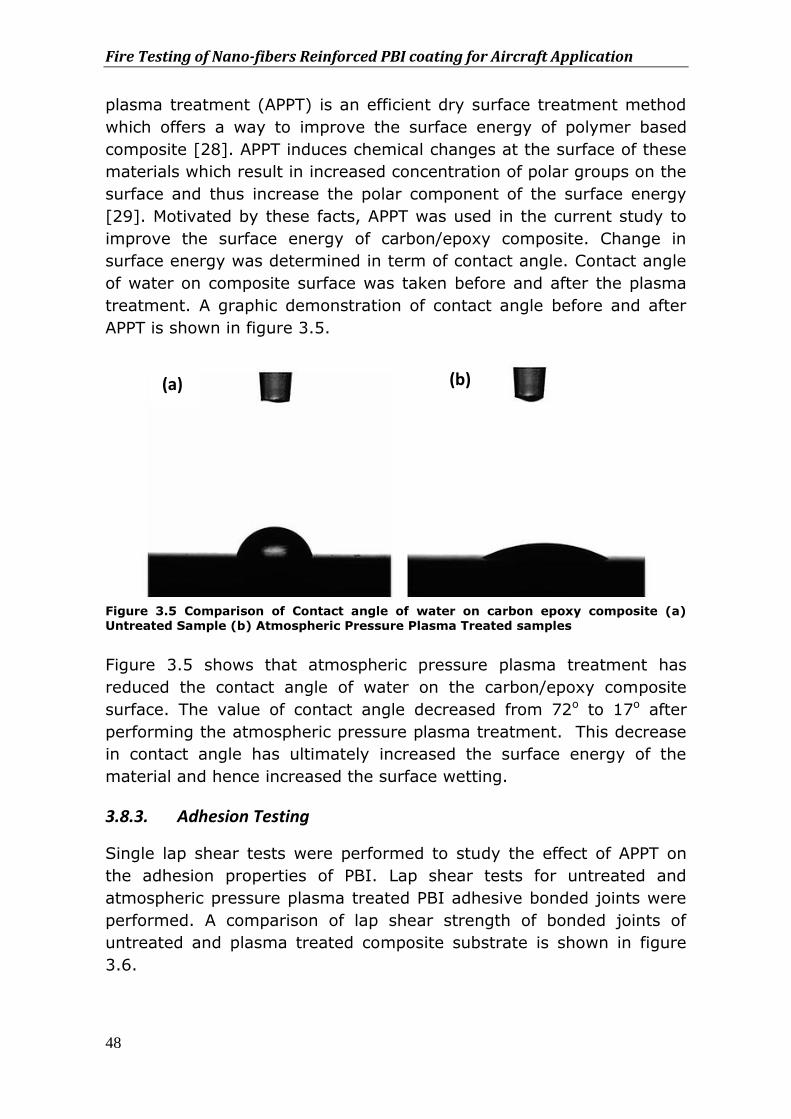
Fire Testing of Nano-fibers Reinforced PBI coating for Aircraft Application
48
plasma treatment (APPT) is an efficient dry surface treatment method
which offers a way to improve the surface energy of polymer based
composite [28]. APPT induces chemical changes at the surface of these
materials which result in increased concentration of polar groups on the
surface and thus increase the polar component of the surface energy
[29]. Motivated by these facts, APPT was used in the current study to
improve the surface energy of carbon/epoxy composite. Change in
surface energy was determined in term of contact angle. Contact angle
of water on composite surface was taken before and after the plasma
treatment. A graphic demonstration of contact angle before and after
APPT is shown in figure 3.5.
Figure 3.5 Comparison of Contact angle of water on carbon epoxy composite (a)
Untreated Sample (b) Atmospheric Pressure Plasma Treated samples
Figure 3.5 shows that atmospheric pressure plasma treatment has
reduced the contact angle of water on the carbon/epoxy composite
surface. The value of contact angle decreased from 72o to 17o after
performing the atmospheric pressure plasma treatment. This decrease
in contact angle has ultimately increased the surface energy of the
material and hence increased the surface wetting.
3.8.3. Adhesion Testing
Single lap shear tests were performed to study the effect of APPT on
the adhesion properties of PBI. Lap shear tests for untreated and
atmospheric pressure plasma treated PBI adhesive bonded joints were
performed. A comparison of lap shear strength of bonded joints of
untreated and plasma treated composite substrate is shown in figure
3.6.
(a) (b)
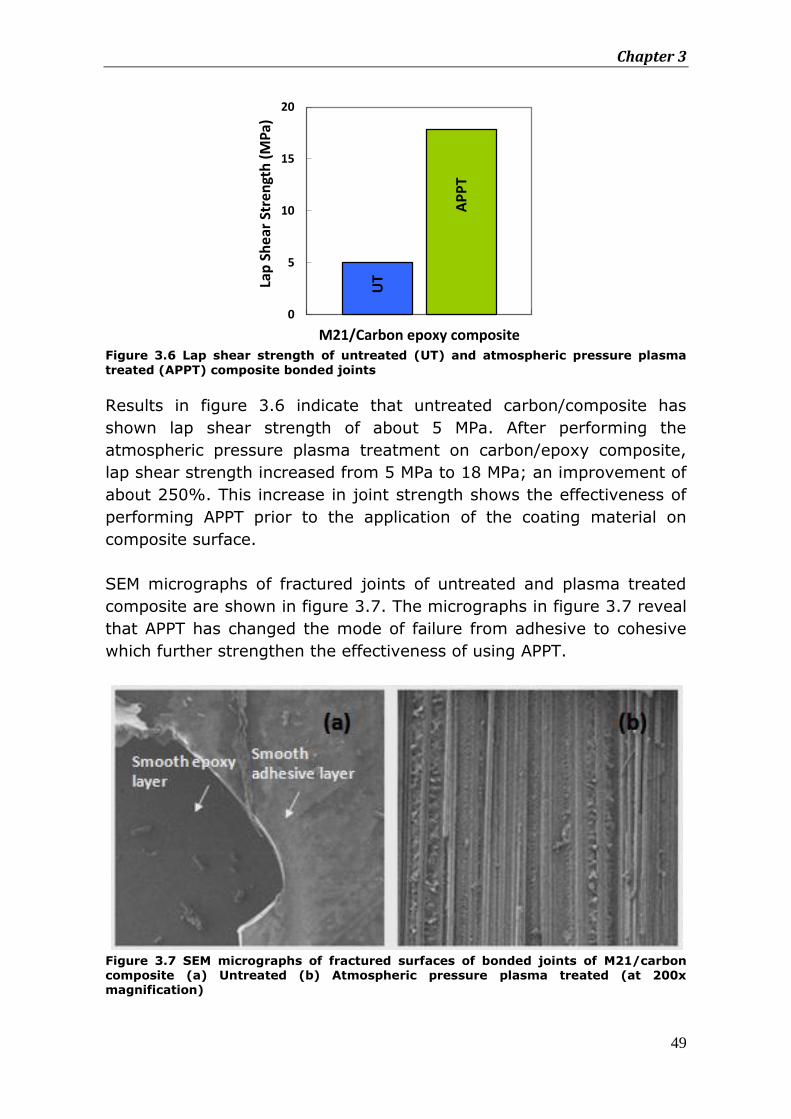
Chapter 3
49
Figure 3.6 Lap shear strength of untreated (UT) and atmospheric pressure plasma
treated (APPT) composite bonded joints
Results in figure 3.6 indicate that untreated carbon/composite has
shown lap shear strength of about 5 MPa. After performing the
atmospheric pressure plasma treatment on carbon/epoxy composite,
lap shear strength increased from 5 MPa to 18 MPa; an improvement of
about 250%. This increase in joint strength shows the effectiveness of
performing APPT prior to the application of the coating material on
composite surface.
SEM micrographs of fractured joints of untreated and plasma treated
composite are shown in figure 3.7. The micrographs in figure 3.7 reveal
that APPT has changed the mode of failure from adhesive to cohesive
which further strengthen the effectiveness of using APPT.
Figure 3.7 SEM micrographs of fractured surfaces of bonded joints of M21/carbon composite (a) Untreated (b) Atmospheric pressure plasma treated (at 200x magnification)
UT
AP
PT
0
5
10
15
20
M21/Carbon epoxy composite
Lap
Sh
ear
Str
engt
h (
MP
a)
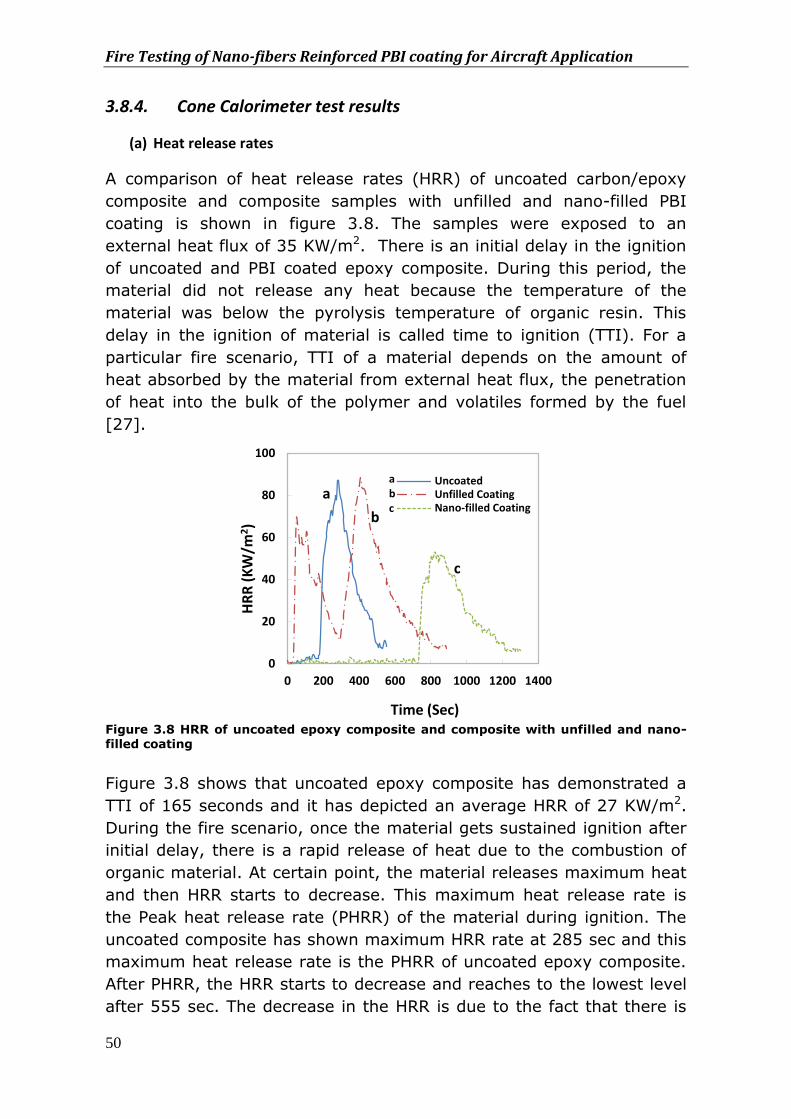
Fire Testing of Nano-fibers Reinforced PBI coating for Aircraft Application
50
3.8.4. Cone Calorimeter test results
(a) Heat release rates
A comparison of heat release rates (HRR) of uncoated carbon/epoxy
composite and composite samples with unfilled and nano-filled PBI
coating is shown in figure 3.8. The samples were exposed to an
external heat flux of 35 KW/m2. There is an initial delay in the ignition
of uncoated and PBI coated epoxy composite. During this period, the
material did not release any heat because the temperature of the
material was below the pyrolysis temperature of organic resin. This
delay in the ignition of material is called time to ignition (TTI). For a
particular fire scenario, TTI of a material depends on the amount of
heat absorbed by the material from external heat flux, the penetration
of heat into the bulk of the polymer and volatiles formed by the fuel
[27].
Figure 3.8 HRR of uncoated epoxy composite and composite with unfilled and nano-filled coating
Figure 3.8 shows that uncoated epoxy composite has demonstrated a
TTI of 165 seconds and it has depicted an average HRR of 27 KW/m2.
During the fire scenario, once the material gets sustained ignition after
initial delay, there is a rapid release of heat due to the combustion of
organic material. At certain point, the material releases maximum heat
and then HRR starts to decrease. This maximum heat release rate is
the Peak heat release rate (PHRR) of the material during ignition. The
uncoated composite has shown maximum HRR rate at 285 sec and this
maximum heat release rate is the PHRR of uncoated epoxy composite.
After PHRR, the HRR starts to decrease and reaches to the lowest level
after 555 sec. The decrease in the HRR is due to the fact that there is
0
20
40
60
80
100
0 200 400 600 800 1000 1200 1400
HR
R (
KW
/m2)
Time (Sec)
UncoatedUnfilled CoatingNano-filled Coating
a
b
c
a b c
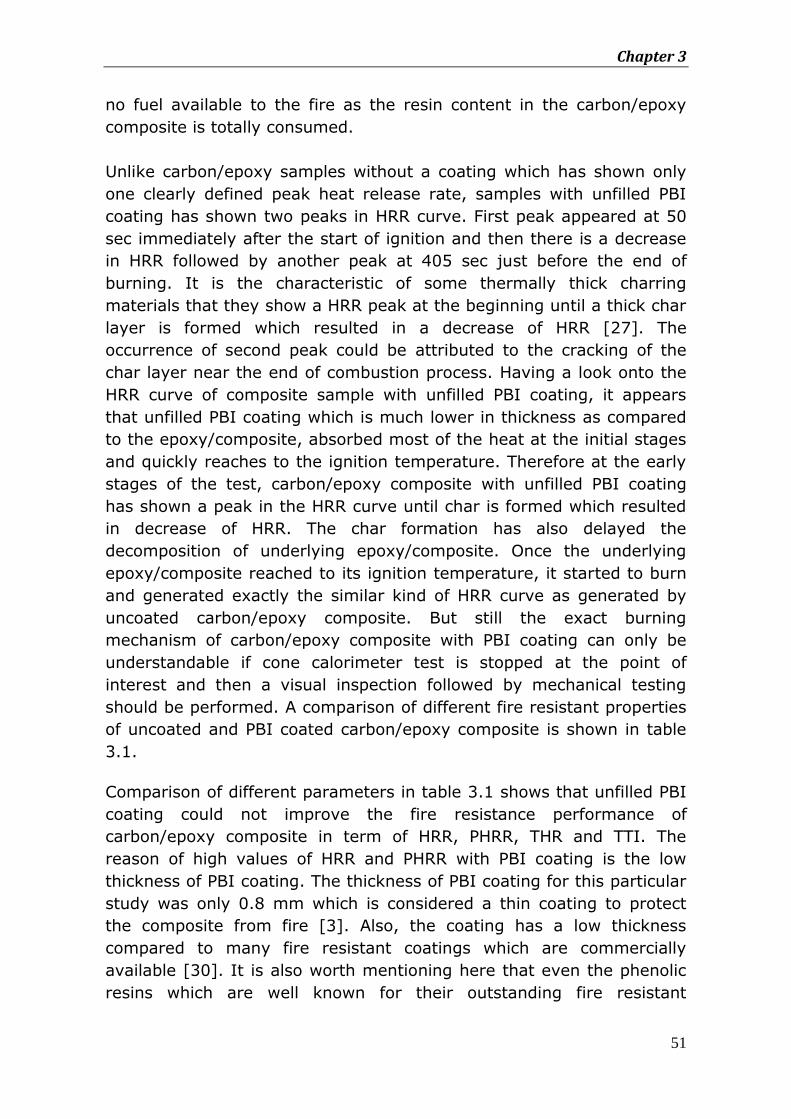
Chapter 3
51
no fuel available to the fire as the resin content in the carbon/epoxy
composite is totally consumed.
Unlike carbon/epoxy samples without a coating which has shown only
one clearly defined peak heat release rate, samples with unfilled PBI
coating has shown two peaks in HRR curve. First peak appeared at 50
sec immediately after the start of ignition and then there is a decrease
in HRR followed by another peak at 405 sec just before the end of
burning. It is the characteristic of some thermally thick charring
materials that they show a HRR peak at the beginning until a thick char
layer is formed which resulted in a decrease of HRR [27]. The
occurrence of second peak could be attributed to the cracking of the
char layer near the end of combustion process. Having a look onto the
HRR curve of composite sample with unfilled PBI coating, it appears
that unfilled PBI coating which is much lower in thickness as compared
to the epoxy/composite, absorbed most of the heat at the initial stages
and quickly reaches to the ignition temperature. Therefore at the early
stages of the test, carbon/epoxy composite with unfilled PBI coating
has shown a peak in the HRR curve until char is formed which resulted
in decrease of HRR. The char formation has also delayed the
decomposition of underlying epoxy/composite. Once the underlying
epoxy/composite reached to its ignition temperature, it started to burn
and generated exactly the similar kind of HRR curve as generated by
uncoated carbon/epoxy composite. But still the exact burning
mechanism of carbon/epoxy composite with PBI coating can only be
understandable if cone calorimeter test is stopped at the point of
interest and then a visual inspection followed by mechanical testing
should be performed. A comparison of different fire resistant properties
of uncoated and PBI coated carbon/epoxy composite is shown in table
3.1.
Comparison of different parameters in table 3.1 shows that unfilled PBI
coating could not improve the fire resistance performance of
carbon/epoxy composite in term of HRR, PHRR, THR and TTI. The
reason of high values of HRR and PHRR with PBI coating is the low
thickness of PBI coating. The thickness of PBI coating for this particular
study was only 0.8 mm which is considered a thin coating to protect
the composite from fire [3]. Also, the coating has a low thickness
compared to many fire resistant coatings which are commercially
available [30]. It is also worth mentioning here that even the phenolic
resins which are well known for their outstanding fire resistant
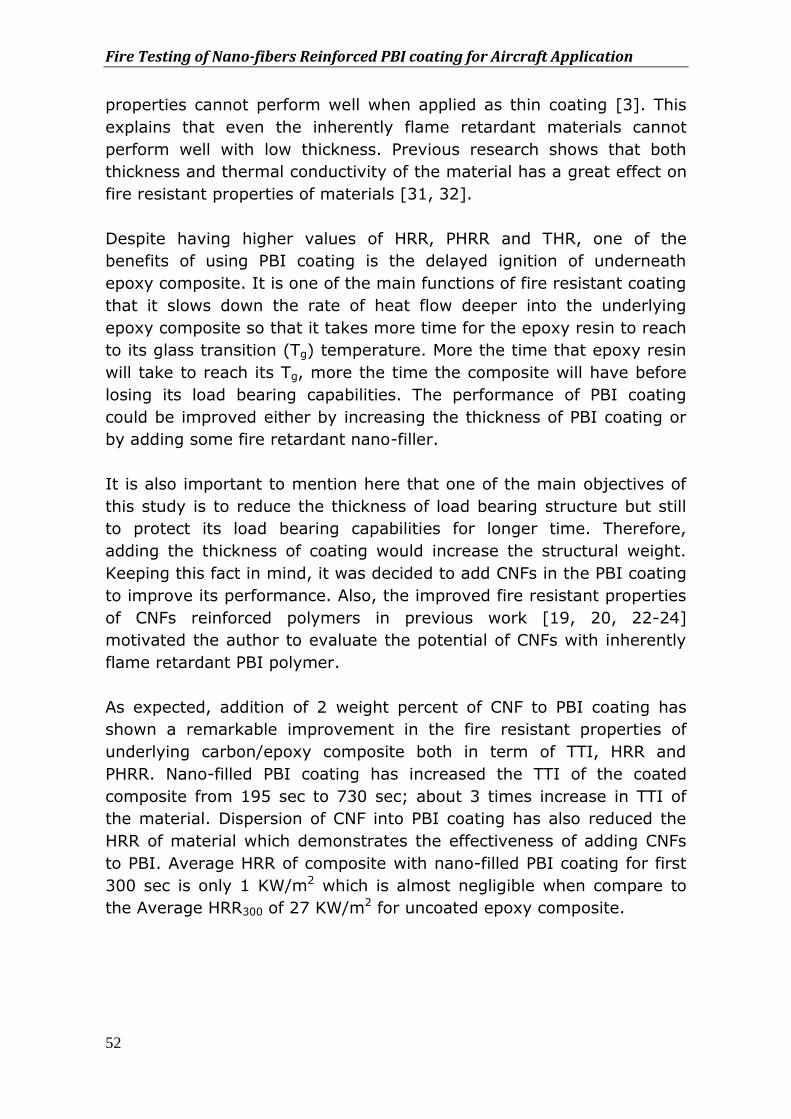
Fire Testing of Nano-fibers Reinforced PBI coating for Aircraft Application
52
properties cannot perform well when applied as thin coating [3]. This
explains that even the inherently flame retardant materials cannot
perform well with low thickness. Previous research shows that both
thickness and thermal conductivity of the material has a great effect on
fire resistant properties of materials [31, 32].
Despite having higher values of HRR, PHRR and THR, one of the
benefits of using PBI coating is the delayed ignition of underneath
epoxy composite. It is one of the main functions of fire resistant coating
that it slows down the rate of heat flow deeper into the underlying
epoxy composite so that it takes more time for the epoxy resin to reach
to its glass transition (Tg) temperature. More the time that epoxy resin
will take to reach its Tg, more the time the composite will have before
losing its load bearing capabilities. The performance of PBI coating
could be improved either by increasing the thickness of PBI coating or
by adding some fire retardant nano-filler.
It is also important to mention here that one of the main objectives of
this study is to reduce the thickness of load bearing structure but still
to protect its load bearing capabilities for longer time. Therefore,
adding the thickness of coating would increase the structural weight.
Keeping this fact in mind, it was decided to add CNFs in the PBI coating
to improve its performance. Also, the improved fire resistant properties
of CNFs reinforced polymers in previous work [19, 20, 22-24]
motivated the author to evaluate the potential of CNFs with inherently
flame retardant PBI polymer.
As expected, addition of 2 weight percent of CNF to PBI coating has
shown a remarkable improvement in the fire resistant properties of
underlying carbon/epoxy composite both in term of TTI, HRR and
PHRR. Nano-filled PBI coating has increased the TTI of the coated
composite from 195 sec to 730 sec; about 3 times increase in TTI of
the material. Dispersion of CNF into PBI coating has also reduced the
HRR of material which demonstrates the effectiveness of adding CNFs
to PBI. Average HRR of composite with nano-filled PBI coating for first
300 sec is only 1 KW/m2 which is almost negligible when compare to
the Average HRR300 of 27 KW/m2 for uncoated epoxy composite.
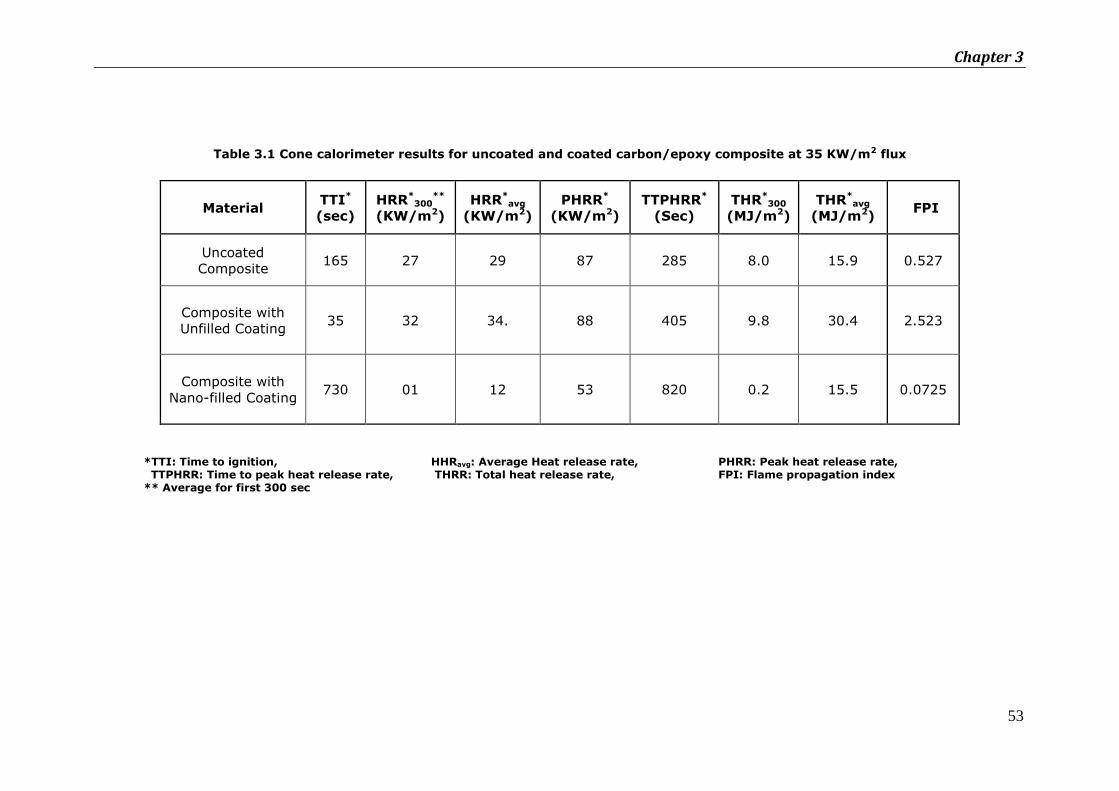
Chapter 3
53
Table 3.1 Cone calorimeter results for uncoated and coated carbon/epoxy composite at 35 KW/m2 flux
*TTI: Time to ignition, HHRavg: Average Heat release rate, PHRR: Peak heat release rate, TTPHRR: Time to peak heat release rate, THRR: Total heat release rate, FPI: Flame propagation index ** Average for first 300 sec
Material TTI*
(sec)
HRR*300
**
(KW/m2)
HRR*avg
(KW/m2)
PHRR*
(KW/m2)
TTPHRR*
(Sec)
THR*300
(MJ/m2)
THR*avg
(MJ/m2) FPI
Uncoated
Composite 165 27 29 87 285 8.0 15.9 0.527
Composite with
Unfilled Coating 35 32 34. 88 405 9.8 30.4 2.523
Composite with
Nano-filled Coating 730 01 12 53 820 0.2 15.5 0.0725
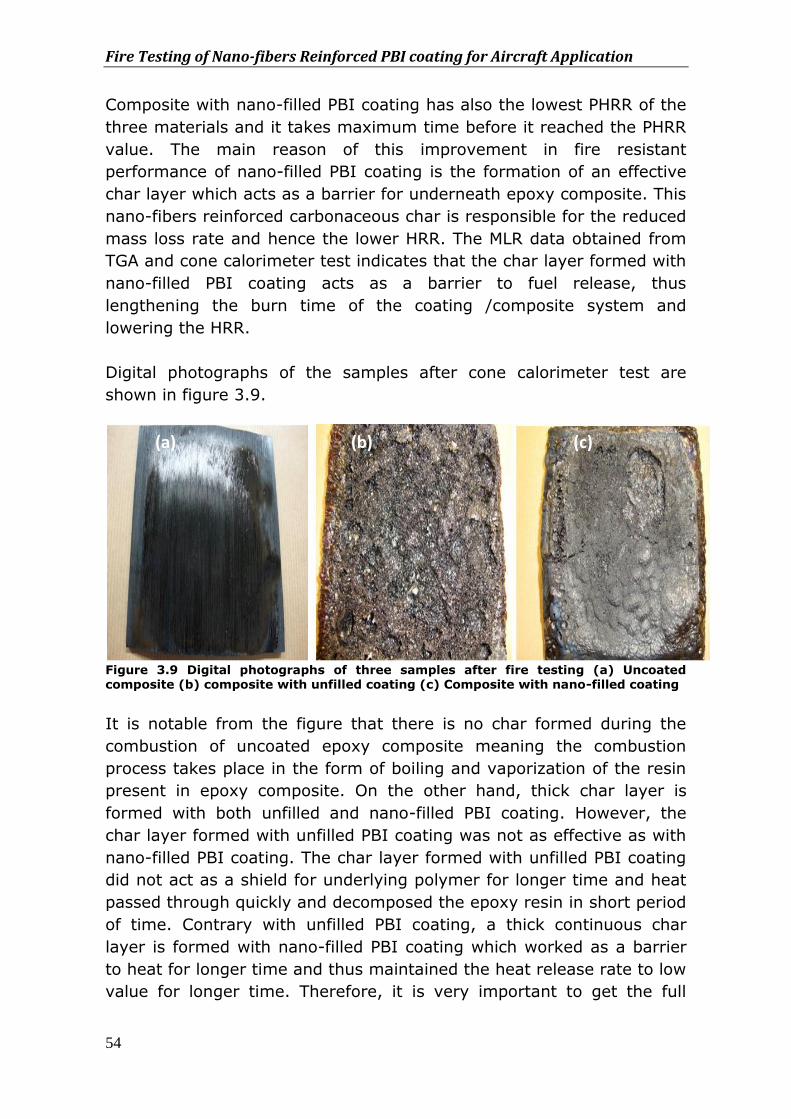
Fire Testing of Nano-fibers Reinforced PBI coating for Aircraft Application
54
Composite with nano-filled PBI coating has also the lowest PHRR of the
three materials and it takes maximum time before it reached the PHRR
value. The main reason of this improvement in fire resistant
performance of nano-filled PBI coating is the formation of an effective
char layer which acts as a barrier for underneath epoxy composite. This
nano-fibers reinforced carbonaceous char is responsible for the reduced
mass loss rate and hence the lower HRR. The MLR data obtained from
TGA and cone calorimeter test indicates that the char layer formed with
nano-filled PBI coating acts as a barrier to fuel release, thus
lengthening the burn time of the coating /composite system and
lowering the HRR.
Digital photographs of the samples after cone calorimeter test are
shown in figure 3.9.
Figure 3.9 Digital photographs of three samples after fire testing (a) Uncoated composite (b) composite with unfilled coating (c) Composite with nano-filled coating
It is notable from the figure that there is no char formed during the
combustion of uncoated epoxy composite meaning the combustion
process takes place in the form of boiling and vaporization of the resin
present in epoxy composite. On the other hand, thick char layer is
formed with both unfilled and nano-filled PBI coating. However, the
char layer formed with unfilled PBI coating was not as effective as with
nano-filled PBI coating. The char layer formed with unfilled PBI coating
did not act as a shield for underlying polymer for longer time and heat
passed through quickly and decomposed the epoxy resin in short period
of time. Contrary with unfilled PBI coating, a thick continuous char
layer is formed with nano-filled PBI coating which worked as a barrier
to heat for longer time and thus maintained the heat release rate to low
value for longer time. Therefore, it is very important to get the full
(a) (c) (b)
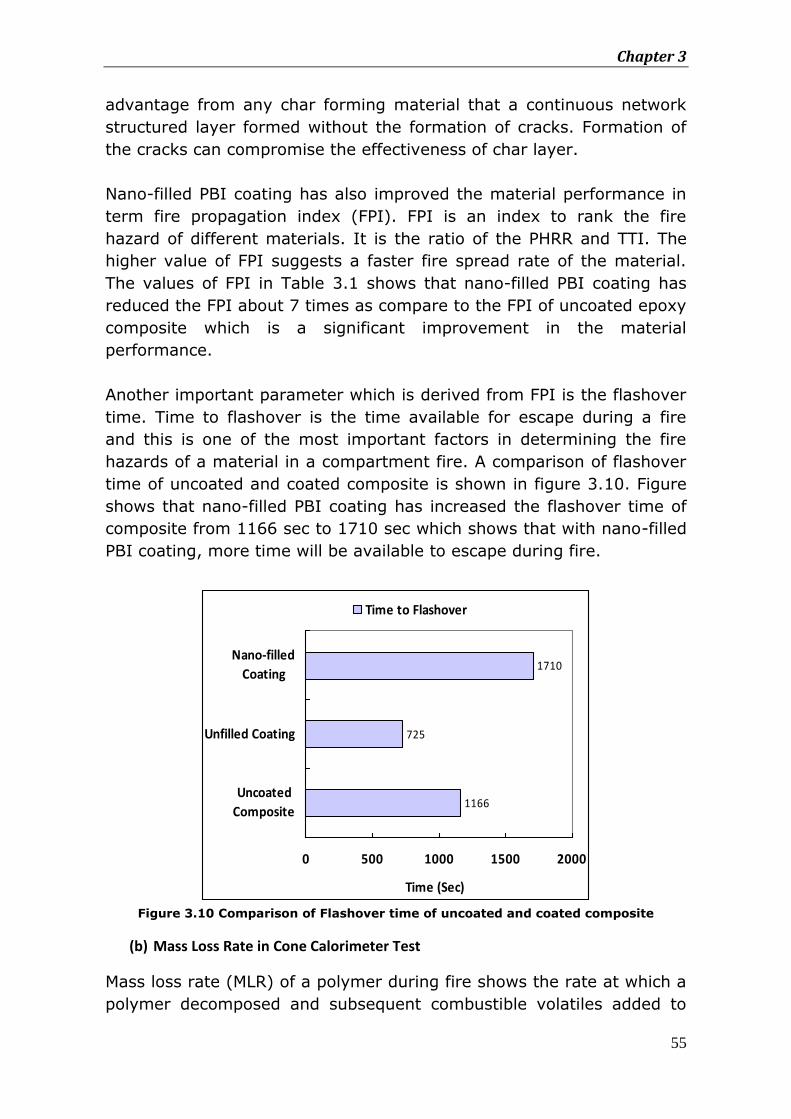
Chapter 3
55
advantage from any char forming material that a continuous network
structured layer formed without the formation of cracks. Formation of
the cracks can compromise the effectiveness of char layer.
Nano-filled PBI coating has also improved the material performance in
term fire propagation index (FPI). FPI is an index to rank the fire
hazard of different materials. It is the ratio of the PHRR and TTI. The
higher value of FPI suggests a faster fire spread rate of the material.
The values of FPI in Table 3.1 shows that nano-filled PBI coating has
reduced the FPI about 7 times as compare to the FPI of uncoated epoxy
composite which is a significant improvement in the material
performance.
Another important parameter which is derived from FPI is the flashover
time. Time to flashover is the time available for escape during a fire
and this is one of the most important factors in determining the fire
hazards of a material in a compartment fire. A comparison of flashover
time of uncoated and coated composite is shown in figure 3.10. Figure
shows that nano-filled PBI coating has increased the flashover time of
composite from 1166 sec to 1710 sec which shows that with nano-filled
PBI coating, more time will be available to escape during fire.
Figure 3.10 Comparison of Flashover time of uncoated and coated composite
(b) Mass Loss Rate in Cone Calorimeter Test
Mass loss rate (MLR) of a polymer during fire shows the rate at which a
polymer decomposed and subsequent combustible volatiles added to
1166
725
1710
0 500 1000 1500 2000
Uncoated
Composite
Unfilled Coating
Nano-filled
Coating
Time (Sec)
Time to Flashover
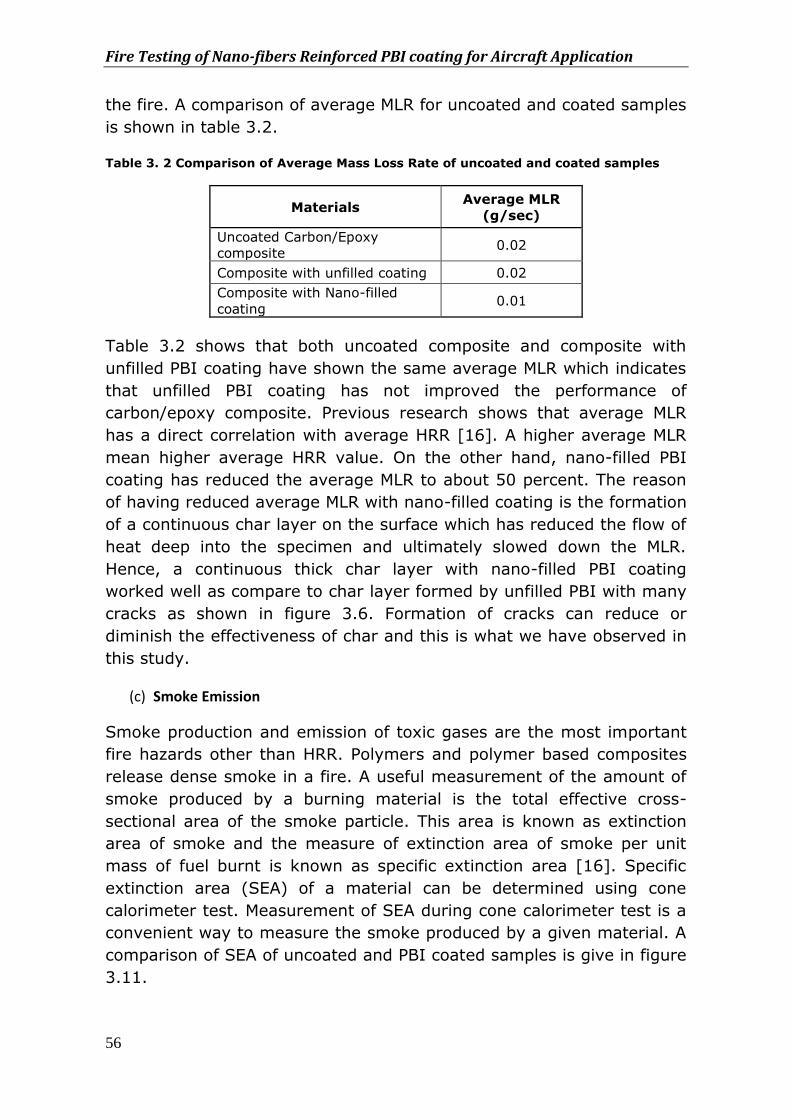
Fire Testing of Nano-fibers Reinforced PBI coating for Aircraft Application
56
the fire. A comparison of average MLR for uncoated and coated samples
is shown in table 3.2. Table 3. 2 Comparison of Average Mass Loss Rate of uncoated and coated samples
Materials Average MLR
(g/sec)
Uncoated Carbon/Epoxy
composite 0.02
Composite with unfilled coating 0.02
Composite with Nano-filled
coating 0.01
Table 3.2 shows that both uncoated composite and composite with
unfilled PBI coating have shown the same average MLR which indicates
that unfilled PBI coating has not improved the performance of
carbon/epoxy composite. Previous research shows that average MLR
has a direct correlation with average HRR [16]. A higher average MLR
mean higher average HRR value. On the other hand, nano-filled PBI
coating has reduced the average MLR to about 50 percent. The reason
of having reduced average MLR with nano-filled coating is the formation
of a continuous char layer on the surface which has reduced the flow of
heat deep into the specimen and ultimately slowed down the MLR.
Hence, a continuous thick char layer with nano-filled PBI coating
worked well as compare to char layer formed by unfilled PBI with many
cracks as shown in figure 3.6. Formation of cracks can reduce or
diminish the effectiveness of char and this is what we have observed in
this study.
(c) Smoke Emission
Smoke production and emission of toxic gases are the most important
fire hazards other than HRR. Polymers and polymer based composites
release dense smoke in a fire. A useful measurement of the amount of
smoke produced by a burning material is the total effective cross-
sectional area of the smoke particle. This area is known as extinction
area of smoke and the measure of extinction area of smoke per unit
mass of fuel burnt is known as specific extinction area [16]. Specific
extinction area (SEA) of a material can be determined using cone
calorimeter test. Measurement of SEA during cone calorimeter test is a
convenient way to measure the smoke produced by a given material. A
comparison of SEA of uncoated and PBI coated samples is give in figure
3.11.
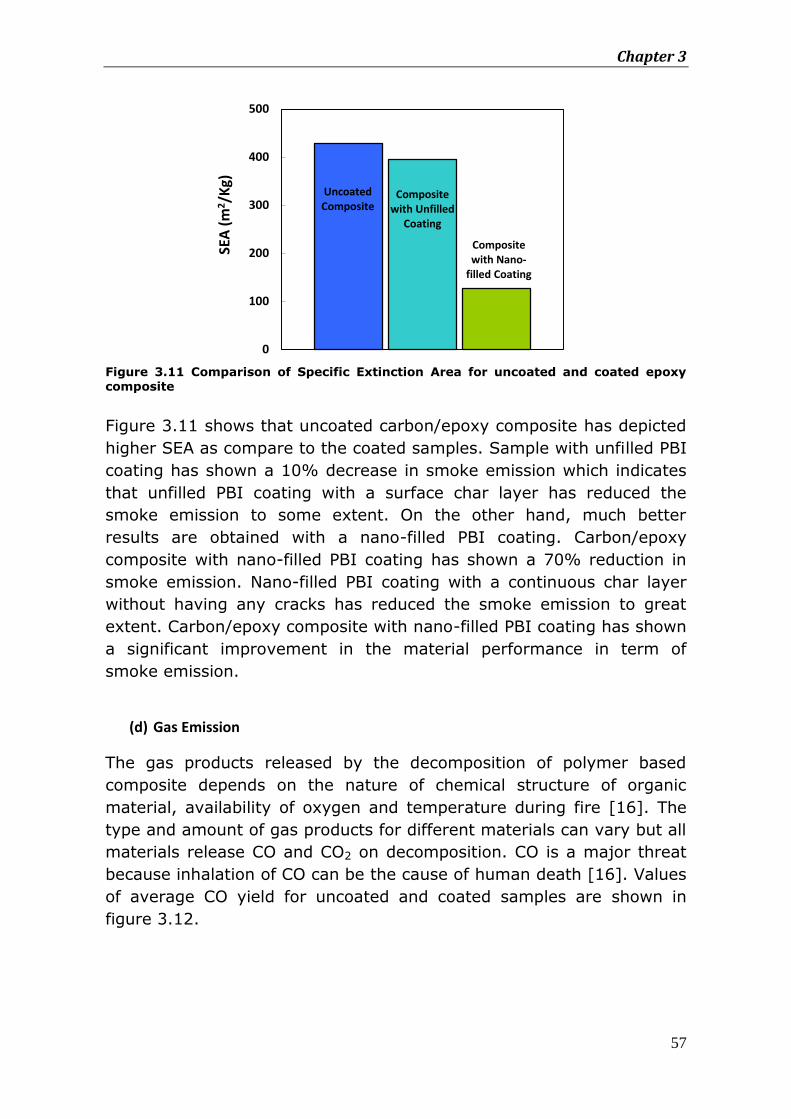
Chapter 3
57
Figure 3.11 Comparison of Specific Extinction Area for uncoated and coated epoxy composite
Figure 3.11 shows that uncoated carbon/epoxy composite has depicted
higher SEA as compare to the coated samples. Sample with unfilled PBI
coating has shown a 10% decrease in smoke emission which indicates
that unfilled PBI coating with a surface char layer has reduced the
smoke emission to some extent. On the other hand, much better
results are obtained with a nano-filled PBI coating. Carbon/epoxy
composite with nano-filled PBI coating has shown a 70% reduction in
smoke emission. Nano-filled PBI coating with a continuous char layer
without having any cracks has reduced the smoke emission to great
extent. Carbon/epoxy composite with nano-filled PBI coating has shown
a significant improvement in the material performance in term of
smoke emission.
(d) Gas Emission
The gas products released by the decomposition of polymer based
composite depends on the nature of chemical structure of organic
material, availability of oxygen and temperature during fire [16]. The
type and amount of gas products for different materials can vary but all
materials release CO and CO2 on decomposition. CO is a major threat
because inhalation of CO can be the cause of human death [16]. Values
of average CO yield for uncoated and coated samples are shown in
figure 3.12.
Uncoated Composite
Composite with Unfilled
Coating
Composite with Nano-
filled Coating
0
100
200
300
400
500
SEA
(m
2/K
g)
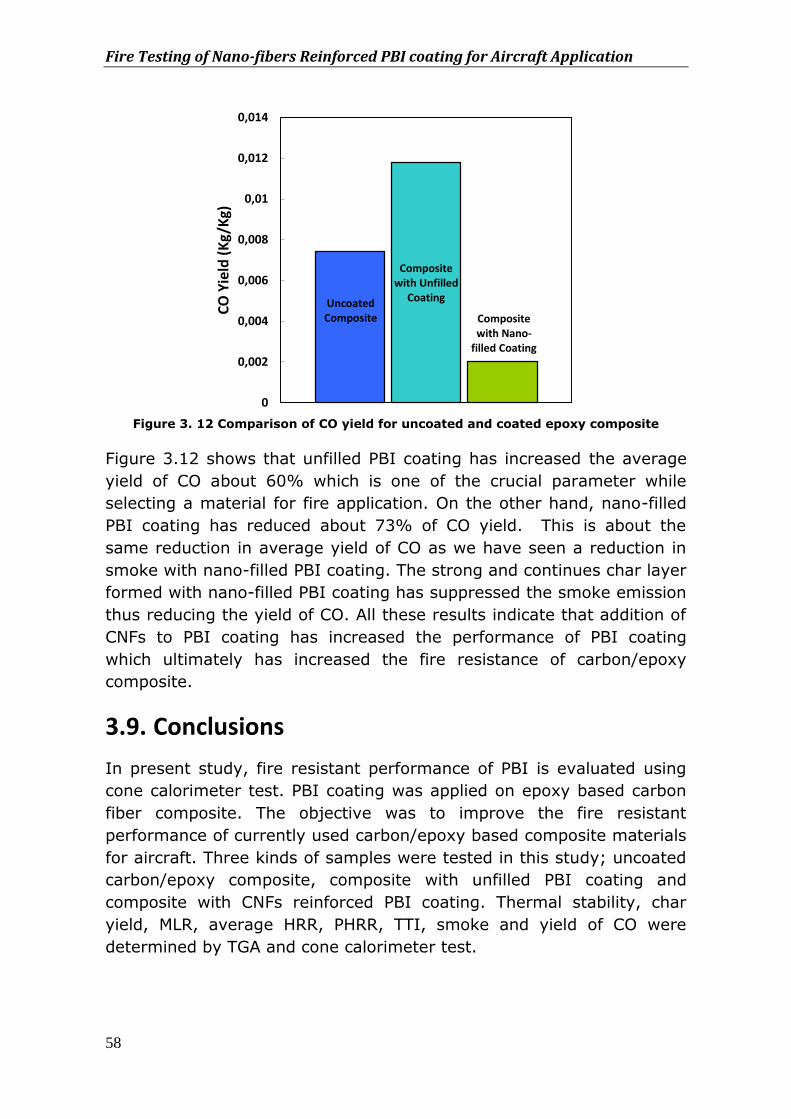
Fire Testing of Nano-fibers Reinforced PBI coating for Aircraft Application
58
Figure 3. 12 Comparison of CO yield for uncoated and coated epoxy composite
Figure 3.12 shows that unfilled PBI coating has increased the average
yield of CO about 60% which is one of the crucial parameter while
selecting a material for fire application. On the other hand, nano-filled
PBI coating has reduced about 73% of CO yield. This is about the
same reduction in average yield of CO as we have seen a reduction in
smoke with nano-filled PBI coating. The strong and continues char layer
formed with nano-filled PBI coating has suppressed the smoke emission
thus reducing the yield of CO. All these results indicate that addition of
CNFs to PBI coating has increased the performance of PBI coating
which ultimately has increased the fire resistance of carbon/epoxy
composite.
3.9. Conclusions
In present study, fire resistant performance of PBI is evaluated using
cone calorimeter test. PBI coating was applied on epoxy based carbon
fiber composite. The objective was to improve the fire resistant
performance of currently used carbon/epoxy based composite materials
for aircraft. Three kinds of samples were tested in this study; uncoated
carbon/epoxy composite, composite with unfilled PBI coating and
composite with CNFs reinforced PBI coating. Thermal stability, char
yield, MLR, average HRR, PHRR, TTI, smoke and yield of CO were
determined by TGA and cone calorimeter test.
Uncoated Composite
Composite with Unfilled
Coating
Composite with Nano-
filled Coating
0
0,002
0,004
0,006
0,008
0,01
0,012
0,014
CO
Yie
ld (
Kg/
Kg)
Chapter 3
59
TGA results show that both unfilled PBI and nano-filled PBI have shown
better thermal stability as compare to the thermal stability of
carbon/epoxy composite. Epoxy based carbon fiber composite has
shown a large decrease in weight around a temperature of 400oC and
epoxy resin is totally decomposed around a temperature of 550oC. On
the other hand, both unfilled and nano-filled PBI have shown thermal
stability even up to a temperature of 575oC and only 10% weight loss
occurred up to this temperature. A high thermal stability is an
important requirement for fire resistant materials.
Results obtained from cone calorimeter test show that unfilled PBI
coating could not improve the fire resistant performance of
carbon/epoxy composite in term of Average HRR, peak HRR, gas
emission. Contrary to the unfilled PBI coating; CNFs reinforced PBI
coating has shown a significant improvement in the fire resistant
properties of carbon/epoxy composite. Nano-filled PBI coating has
reduced the average HRR300 of carbon/epoxy composite from 27 KW/m2
to 1 KW/m2; a remarkable reduction in average HRR. Nano-filled PBI
coating has also reduced the peak HRR from 87 KW/m2 to 53 KW/m2; a
reduction of about 40% in peak HRR. Average HRR and peak HRR are
two important parameters which are used to evaluate the fire resistant
of a material. These two parameters give an indication about fire
growth rate. Hence, the performance of carbon/epoxy composite with
PBI nano-filled coating is improved significantly. Smoke and CO are of
concern too during a fire in the aircraft as most of the deaths during a
fire in aircraft occurred due to the reduced visibility and inhalation of
toxic gases. Nano-filled PBI coating has also reduced the smoke and CO
emission up to 73% as compare to the uncoated carbon/epoxy
composite and this is another important outcome of current study. It is
also worth mentioning here that such kind of improvement in the fire
resistant properties of coating with CNFs is never achieved in the past.
One of the reason of not having an improvement to such an extent that
most of the fire resistant studies with CNFs or CNTs are performed
using commodity plastics which are not inherently flame retardant. A
strong outcome of this work is that CNFs even in very small quantity
can be more effective to improve the fire resistant performance of
inherently flame retardant material. Another important outcome is that
with this low coating thickness such an improvement in fire resistant
properties is quite remarkable.
Fire Testing of Nano-fibers Reinforced PBI coating for Aircraft Application
60
3.10. References
1- Baker, Alan; Dutton, Stuart; Kelly, Donald, Composite materials for aircraft structures, 2nd edition, 2004
2- A.P. Mouritz, E. Gellert, P. Burchill, K. Challis, Review of advanced composite structures for naval ships and submarines, Composite structures 53 (2001)
3- A.P.Mouritz and A.G.Gibson, Fire Properties of polymer composite materials,
Solid Mechanics and its applications, Volume 143, 2006, ISBN-13 978-1-4020-5356-6
4- Mouritz, AP, Fire safety of advanced composites for aircraft, B2004/0046,
April 2006
5- AP Mouritz, Fire resistance of aircraft composite laminates, Journal of Material Science Letters, 22, (2203), pp. 1507-1509
6- Sanjeev Gandhi, Postcrash Health Hazards from Burning Aircraft Composites,
Galaxy Scientific Corporation, Fire Safety Section, AAR-422, Federal Aviation Administration
7- Jinfeng Zhuge, Jihua Gou, Ruey-Hung Chen, Ali Gordon, Jayanta Kapat, Dustin
Hart, Christopher Ibeh, Fire Retardant Evaluation of Carbon Nanofiber/Graphite Nanoplatelets Nanopaper-Based Coating under Different Heat Fluxes, Composites: Part B (2012)
8- S. Feih and A. P. Mouritz, Z. Mathys and A.G. Gibson, Fire Structural Modeling of Polymer Composites with Passive Thermal Barrier, Journal of Fire Sciences, Vol. 28 – March 2010
9- Usman sorathia, Materials and fire threat, SAMPE journal, Vol.32, No.3, 8-15,
1996
10- Final report 2, DOT/FAA/AR-05/14, Polymer flammability, may 2005
11- Takashi Kashiwagi, Polymer Combustion and Flammability-Role of Condensed Phase, 25th Symposium On Combustion, 1994, Pp 1423-1437
12- Final report, September 2004, Fire safe polymer and polymer composite,
DOT/FAA/AR-04/11
13- S. Chapple and R. Anandjiwala, Flammability of Natural Fiber-reinforced Composites and Strategies for Fire Retardancy: A Review, Journal of Thermoplastic Composite Materials, Vol. 23 (2010)
Chapter 3
61
14- Craig L. Beyler and Marcelo M. Hirschler, The SFPE handbook of Fire protection Engineering, 3rd edition, Thermal decomposition of polymers (Chapter 7)
15- Richard E. Loyn, Fire response of Geopolymer Structural Composite, DOT/FAA/AR-TN95/22, jan 1996
16- A.P. Mouritz, Z. Mathys, A.G. Gibson, Heat release of polymer composites in fire, Composites: Part A 37 (2006) 1040–1054
17- G. L. Nelson, 1 P. L. Kinson, and C. B. Quinn, Fire Retardant Polymers, Annual Review of Materials Science, 1974, pp. 391-414
18- Yong Tanga, Jinfeng Zhugea, Jihua Goua, Ruey-Hung Chena, Christopher Ibehb and Yuan Huc Morphology, thermal stability, and flammability of polymer matrix composites coated with hybrid nanopapers, polymers for advanced technologies, Vol. 22, 2009
19- Zhongfu Zhao and Jan Gou, Improved fire retardancy of thermoset composites modified with carbon nanofibers, Sci. Technol. Adv. Mater. 10 (2009)
20- Takashi Kashiwagi, Eric Grulke, Jenny Hilding, Richard Harris, Walid Awad,Jack Douglas Thermal Degradation and Flammability Properties of Poly(propylene)/Carbon Nanotube Composites, Macromolecular Rapid Communications, ( 2002)
21- Takashi Kashiwagi1, Fangming Du, Jack F. Douglas3, Karen I. Winey, Richard H. Harris Jr and John R. Shields, Nanoparticle networks reduce the flammability of polymer nanocomposites, nature materials, (2005)
22- Alexander B. Morgan, and Weidong Liu, Flammability of thermoplastic carbon nanofiber nanocomposites, Fire and Materials, Fire Mater. 2011
23- Zhongfu Zhao and Jan Gou, Improved fire retardancy of thermoset composites modified with carbon nanofibers, Sci. Technol. Adv. Mater. 10 (2009)
24- S. C. Lao, C. Wu,1 T. J. Moon, J. H. Koo, A. Morgan, L. Pilato, And G. Wissler, Flame-retardant Polyamide 11 and 12, Nanocomposites: Thermal and Flammability Properties, Journal of Composite Materials, 2009
25- A.H. Frazer, High temperature resistant polymers, SBN 470-276509
26- Xiang Fu, Chuck Zhang, Tao Liu, Richard Liang and BenWang, Carbon nanotube buckypaper to improve fire retardancy of high-temperature/high-performance polymer composites, Nanotechnology 21 (2010)
27- T. Richard Hull, Anna A. Stec, and Shonali Nazare, Fire Retardant Effects of, Polymer Nanocomposites, Journal of Nanoscience and Nanotechnology, Vol.9, (2009)
Fire Testing of Nano-fibers Reinforced PBI coating for Aircraft Application
62
28- J. Rotheiser, Joining of Plastics; handbook for designers and engineers, 3rd Ed. Hanser publisher, (1999).
29- J. W. Chin and J. P. Wightman, Surface characterization and adhesive bonding
of toughened bismaleimide composite, Composites Part A, (1996);27(06):419-428
30- Thomas J. Ohlemiller, John R. Shields, The effect of surface coating on fire growth over composite material in a corner configuration, Fire safety Journal (32), (1999)
31- M. J. Scudamore, Fire Performance Studies on Glass-reinforced Plastic Laminates, Fire and Materials, (1994)
32- M. J. Scudamore, P. J. Briggs and F. H. Prager, Cone Calorimetry- A Review of Tests Carried out on Plastics for the Association of Plastic Manufacturers in Europe, Fire and Materials, (1991)
63
CHAPTER 4
Performance Evaluation of Polybenzimidazole in Simulated Low Earth Orbit Environment
This chapter mainly deals with the exposure of unfilled PBI
and PBI nano-composite to simulated Low Earth Orbit
environmental conditions. Performance of unfilled and nano-
filled PBI is presented in term of erosion yield and mechanical
properties. The surfaces of exposed samples are also analyzed
using scanning electron microscope and atomic force
microscope and the results are presented.
4.1. Introduction
Polymers are extensively used as construction materials in space
systems due to their high strength-to-weight ratio and a variety of
mechanical, thermal, electrical and optical properties [1]. Typically,
polymers are used as multi-layer insulations, matrix in the substrate for
solar panels, adhesives, thermal control coatings for spacecraft and
insulation for electrical wiring [2, 3]. The commonly used polymers for
space applications are silicones, epoxies, polyurethanes, polyesters,
polyamides, polyimide, and Teflon FEP (fluorinated ethylene
propylene). Polyimide (Kapton) and Teflon FEP are the most commonly
used spacecraft materials because of their desirable properties such as
flexibility, low density, thermal and optical properties [1, 4]. However,
these materials when exposed to low earth space orbit (LEO) are
affected by various environmental conditions. The LEO space
environment consists of ultra high vacuum, thermal cycling, UV
radiations and atomic oxygen. These LEO environmental conditions
significantly degrade the properties of polymers [1, 3 and 4].
Therefore, research is continued to develop new polymers which can
survive under these space environmental conditions for longer duration
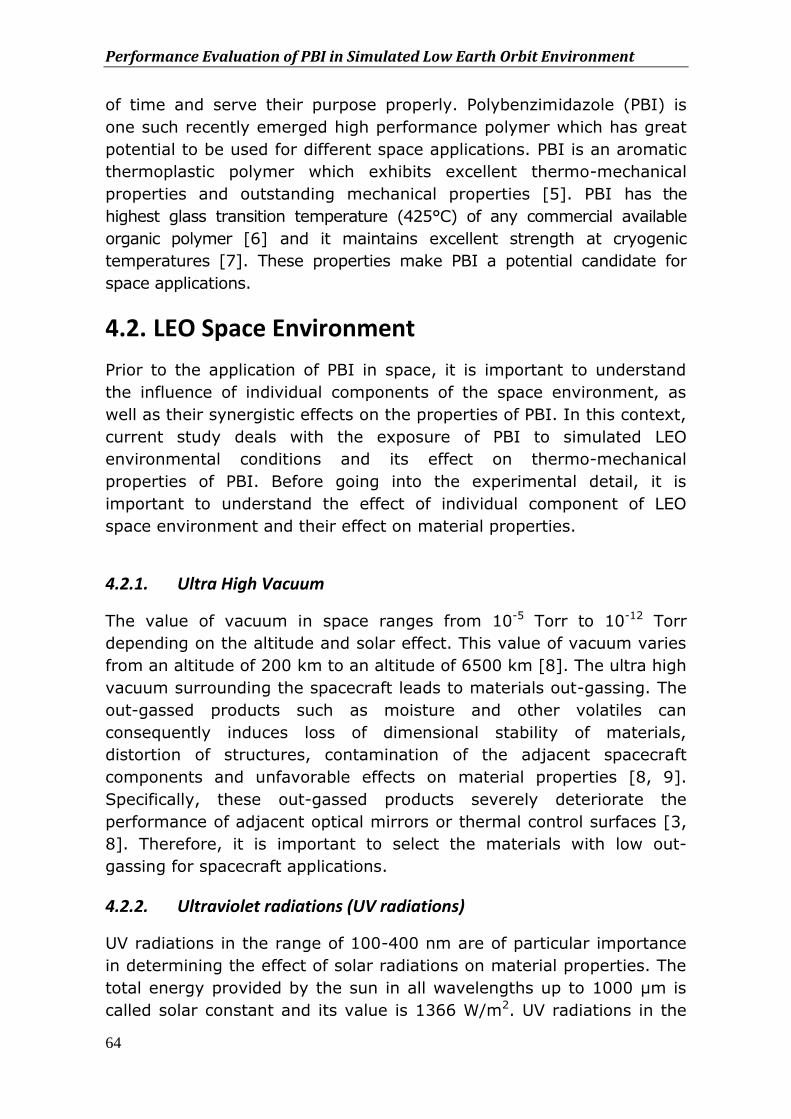
Performance Evaluation of PBI in Simulated Low Earth Orbit Environment
64
of time and serve their purpose properly. Polybenzimidazole (PBI) is
one such recently emerged high performance polymer which has great
potential to be used for different space applications. PBI is an aromatic
thermoplastic polymer which exhibits excellent thermo-mechanical
properties and outstanding mechanical properties [5]. PBI has the
highest glass transition temperature (425°C) of any commercial available
organic polymer [6] and it maintains excellent strength at cryogenic
temperatures [7]. These properties make PBI a potential candidate for
space applications.
4.2. LEO Space Environment
Prior to the application of PBI in space, it is important to understand
the influence of individual components of the space environment, as
well as their synergistic effects on the properties of PBI. In this context,
current study deals with the exposure of PBI to simulated LEO
environmental conditions and its effect on thermo-mechanical
properties of PBI. Before going into the experimental detail, it is
important to understand the effect of individual component of LEO
space environment and their effect on material properties.
4.2.1. Ultra High Vacuum
The value of vacuum in space ranges from 10-5 Torr to 10-12 Torr
depending on the altitude and solar effect. This value of vacuum varies
from an altitude of 200 km to an altitude of 6500 km [8]. The ultra high
vacuum surrounding the spacecraft leads to materials out-gassing. The
out-gassed products such as moisture and other volatiles can
consequently induces loss of dimensional stability of materials,
distortion of structures, contamination of the adjacent spacecraft
components and unfavorable effects on material properties [8, 9].
Specifically, these out-gassed products severely deteriorate the
performance of adjacent optical mirrors or thermal control surfaces [3,
8]. Therefore, it is important to select the materials with low out-
gassing for spacecraft applications.
4.2.2. Ultraviolet radiations (UV radiations)
UV radiations in the range of 100-400 nm are of particular importance
in determining the effect of solar radiations on material properties. The
total energy provided by the sun in all wavelengths up to 1000 µm is
called solar constant and its value is 1366 W/m2. UV radiations in the
Chapter 4
65
range of 100 to 400 nm are about 8% of the solar constant [1, 3].
While orbiting the Earth’s atmosphere, spacecraft is exposed to these
UV radiations which have enough energy to break different molecular
bonds in polymer (e.g. C–C, C–O) and other functional groups [1, 3 and
8]. Figure 4.1 gives an idea about the energy required to break
different bonds that may be present in the chemical structure of
different polymers [3].
4. 1 Wavelength requirement to break various polymeric bonds [adapted from 3]
Solar UV radiations can induce the cross-linking or chain scissioning in
the polymer. Cross-linking results in the embitterment which ultimately
leads towards surface cracking of polymer films [3, 8]. Chain scission
reactions leads towards the creation of volatiles (mass loss take place)
which ultimately decrease the mechanical properties of polymers [1, 3
and 8].
4.2.3. Thermal Cycling
During the operation, spacecraft orbiting the Earth experiences severe
thermal difference between the surface exposed to solar rays and the
surface remains unexposed. Thermal cycling due to the period of solar
eclipse and sun illumination can induce micro-cracking in resin and
degrade the mechanical properties through thermal stresses [8, 9].
Also, the thermal cycling generates a mismatch in the coefficients of
thermal expansion (CTE) of different materials intact with each other
hence initiates micro cracks in the materials [3, 8].
Performance Evaluation of PBI in Simulated Low Earth Orbit Environment
66
4.2.4. Atomic Oxygen (AO)
Atomic oxygen (AO) is formed by photo dissociation of molecular
oxygen caused by UV radiations in the upper atmosphere. AO is the
most hazardous constituent for polymeric materials in LEO
environment. Atomic oxygen provides an aggressive environment for
materials due to its high chemical activity. The ability of AO to react
with spacecraft materials is further enhanced in the presence of solar
UV radiations which energize molecular bonds and makes AO reaction
easier [3]. The AO flux is determined by different parameters such as
altitude, orbital inclination, solar activity and time of day [1]. At an
altitude of about 300 km, the densities of AO during minimum and
maximum solar activities are approximately 2x10⁹ and 8x10⁹
atoms/cm3, respectively. The front surface of spacecraft interacts with
the atomic oxygen at a relative velocity of 8 km/sec which corresponds
to a kinetic energy of 5ev [8]. Therefore, AO interacts with spacecraft
materials with a kinetic energy of about 5 eV and the nominal AO flux
approximately ranging from 1014 to 1015 atoms/cm2-sec [3, 8]. The
Collision of AO with materials results in surface erosion, change in
surface morphology, mass loss, degradation of mechanical, thermal and
optical properties, and changes in chemical compositions of polymers
[8, 10]. One of effects of atomic oxygen in LEO environment is the
occurrence of glow phenomenon. Glow phenomenon occurs when
atomic oxygen reacts with nitrogen atoms on the spacecraft surfaces to
form nitrous oxide. This nitrous oxide in the excited state emits visible
radiations near the surfaces of spacecraft [11, 12]. As many spacecraft
sensing systems are light based, spacecraft glow can be a serious
problem for optical sensor systems [3, 8 and 13]. Therefore, it is
important to study the influence of AO on the properties of PBI
beforehand in order to determine its potential for space applications in
LEO environment. In present study, the performance of both unfilled
PBI and PBI nano-composite is evaluated under simulated LEO
environmental conditions. Carbon nano-fibers (CNFs) and Titanium
Dioxide (TiO2) are the two nano-fillers used in this study to
manufacture PBI nano-composite. TiO2 was added to PBI due to its
capability to stop UV radiations. TiO2 provides good UV protection by
reflecting or scattering most of the UV-rays below the wavelength of
400 nm through its high refractive index [14]. UV radiation blocking
ability of TiO2 can be effectively used for the protection of coated
polymeric substrate.
Chapter 4
67
4.3. Experimental
4.3.1. Materials
Solution of PBI in DMAc (with 26% concentration of PBI) was supplied
by CELAZOLE. 99% concentrated DMAc is purchased from Aldrich
chemicals. CNFs were supplied by Pyrograf Products, Inc. with diameter
ranging from 70 nm to 200 nm and length 50 μm to 200 μm. Titanium
dioxide (TiO2) was supplied by DuPont with a diameter of around 200
nm.
4.3.2. Solution casting of Unfilled PBI Film
The as-received solution of PBI in DMAc was highly viscous and
therefore, DMAc was added to the solution to dilute it. The solution of
PBI in DMAc was then stirred mechanically at 60°C for 15 minutes to
get a uniform mixture of PBI in DMAc. The mixture was then used to
produce 80 µm thick films of PBI. The complete detail of PBI film
manufacturing is presented in chapter 2.
4.3.3. Solution casting of nano-filled PBI films
To fabricate the CNFs reinforced film, pre-calculated amount of CNFs
was carefully weighed and then added to the DMAc solvent. These
nano-fibers are dispersed in DMAc by ultrasonic mixing for 30 minutes
at 60°C. After ultrasonic mixing of CNFs, they were added to PBI
solution. The ultrasonic process in combination with mechanical stirring
was continued for next 15 minutes. The mixture was then used to cast
the film on the glass plate. The nano-composite films were prepared
with 2 wt% of CNFs. Film reinforced with TiO2 (2 and 5 weight percent)
nano-fillers were prepared by making a paste of TiO2 in DMAc followed
by the mixing of TiO2 paste into the diluted PBI solution. Afterwards,
films were manufactured in the same way as the film manufactured
with CNFs.
4.3.4. Exposure to LEO Environment
Unfilled PBI and nano-filled PBI films were exposed to AO alone and in
combination with other LEO components (UV, thermal cycling and
Vacuum) in order to evaluate the performance of PBI in simulated LEO
environment.
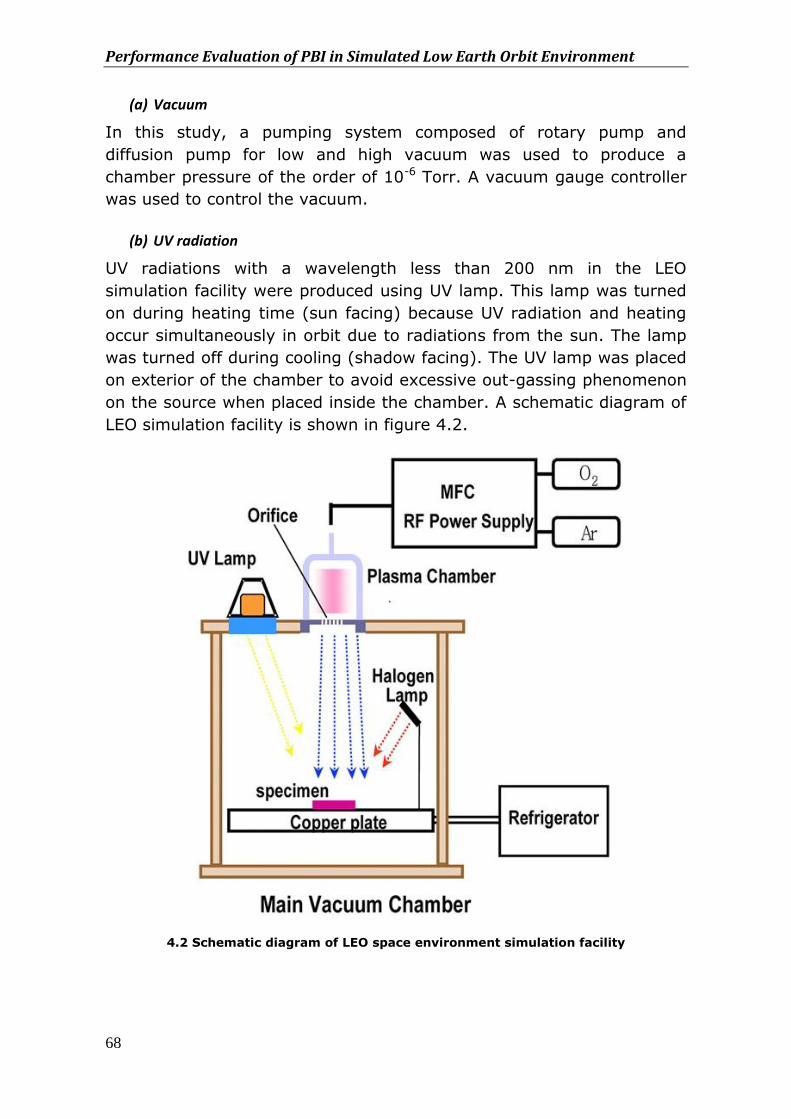
Performance Evaluation of PBI in Simulated Low Earth Orbit Environment
68
(a) Vacuum
In this study, a pumping system composed of rotary pump and
diffusion pump for low and high vacuum was used to produce a
chamber pressure of the order of 10-6 Torr. A vacuum gauge controller
was used to control the vacuum.
(b) UV radiation
UV radiations with a wavelength less than 200 nm in the LEO
simulation facility were produced using UV lamp. This lamp was turned
on during heating time (sun facing) because UV radiation and heating
occur simultaneously in orbit due to radiations from the sun. The lamp
was turned off during cooling (shadow facing). The UV lamp was placed
on exterior of the chamber to avoid excessive out-gassing phenomenon
on the source when placed inside the chamber. A schematic diagram of
LEO simulation facility is shown in figure 4.2.
4.2 Schematic diagram of LEO space environment simulation facility
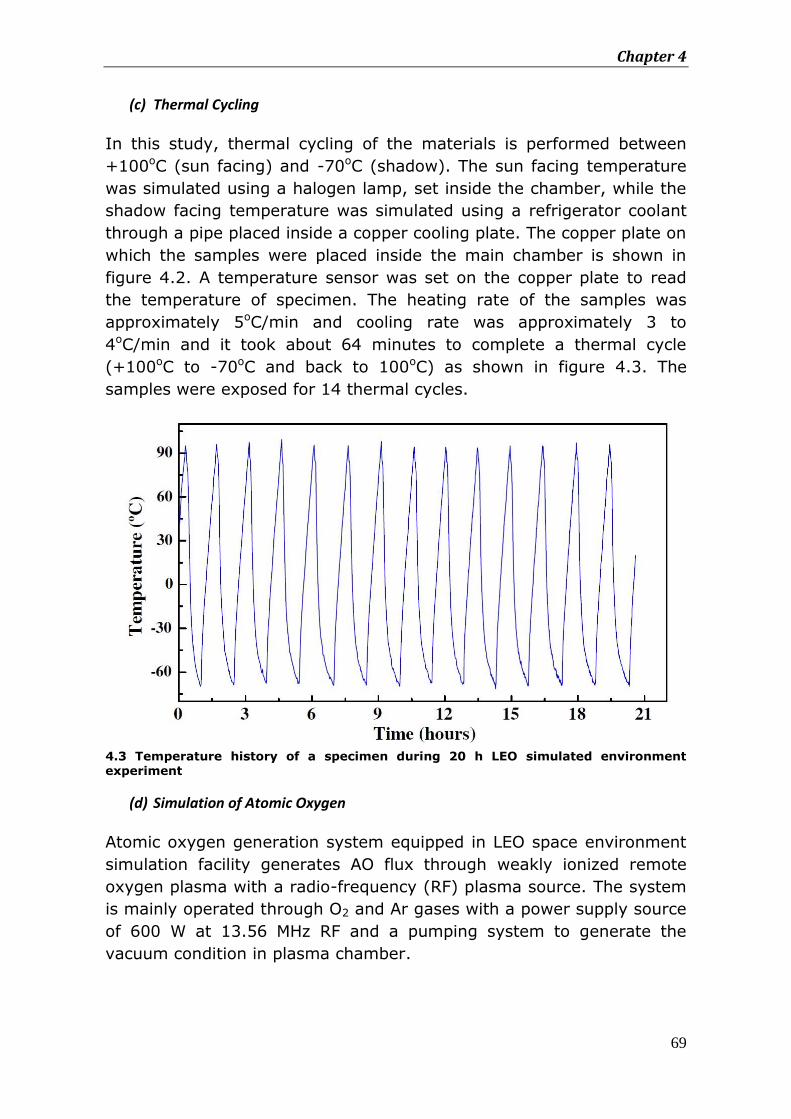
Chapter 4
69
(c) Thermal Cycling
In this study, thermal cycling of the materials is performed between
+100oC (sun facing) and -70oC (shadow). The sun facing temperature
was simulated using a halogen lamp, set inside the chamber, while the
shadow facing temperature was simulated using a refrigerator coolant
through a pipe placed inside a copper cooling plate. The copper plate on
which the samples were placed inside the main chamber is shown in
figure 4.2. A temperature sensor was set on the copper plate to read
the temperature of specimen. The heating rate of the samples was
approximately 5oC/min and cooling rate was approximately 3 to
4oC/min and it took about 64 minutes to complete a thermal cycle
(+100oC to -70oC and back to 100oC) as shown in figure 4.3. The
samples were exposed for 14 thermal cycles.
4.3 Temperature history of a specimen during 20 h LEO simulated environment experiment
(d) Simulation of Atomic Oxygen
Atomic oxygen generation system equipped in LEO space environment
simulation facility generates AO flux through weakly ionized remote
oxygen plasma with a radio-frequency (RF) plasma source. The system
is mainly operated through O2 and Ar gases with a power supply source
of 600 W at 13.56 MHz RF and a pumping system to generate the
vacuum condition in plasma chamber.

Performance Evaluation of PBI in Simulated Low Earth Orbit Environment
70
4.3.5. Tensile Testing
Tensile testing of unexposed and exposed samples of unfilled and nano-
filled PBI films was carried out using Zwick Tensile machine at a test
speed of 2 mm/min. Rectangular specimens of (80x6x0.06) mm3 were
cut from the films. An extensometer was also used to determine the
Young’s Modulus and strain values. Five specimens for each material
were tested for reproducibility of the results.
4.3.6. Scanning Electron Microscopy (SEM)
Scanning electron microscopy was carried out to study the surface
morphology of unexposed samples and samples exposed to simulated
LEO environment. Images were obtained using JOEL JSM-7500 field
emission scanning electron microscope (FE-SEM) which operates at
30kV accelerating voltage. Surface of each sample was coated with a
thin layer of gold to minimize sample charging effects.
4.3.7. Atomic Force Microscopy (AFM)
Atomic force microscopy (AFM) was performed to study the change in
surface roughness of PBI samples after exposure to AO. Analysis was
performed using scanning probe microscope supplied by NT-MDT
Corporation. The AFM was used in the "tapping" mode and all
measurements were performed in air.
4.4. Results and Discussion
4.4.1. Mass Loss and Erosion Yield Measurements of exposed samples
Erosion of polymers by AO in LEO environment is a serious threat to
spacecraft performance and durability. It is therefore essential to
determine the AO erosion yield (the volume loss of material per
incident oxygen atom) for spacecraft applications. A common technique
for determining the erosion yield (Ey) of materials is based on mass loss
and is calculated by taking the mass of material before and after
exposure to AO. Therefore, in this context, mass loss of the samples
exposed to AO alone and in combination with UV radiations and thermal
cycling was measured. A comparison of mass loss for different
materials is shown in figure 4.4. Figure 4.4 shows that under the
influence of AO alone, unfilled PBI and PBI filled with 5 wt. % of TiO2
have shown higher mass loss per unit area as compare to the PBI
reinforced with 2 wt. % of CNFs and PBI reinforced with 2 wt. % of
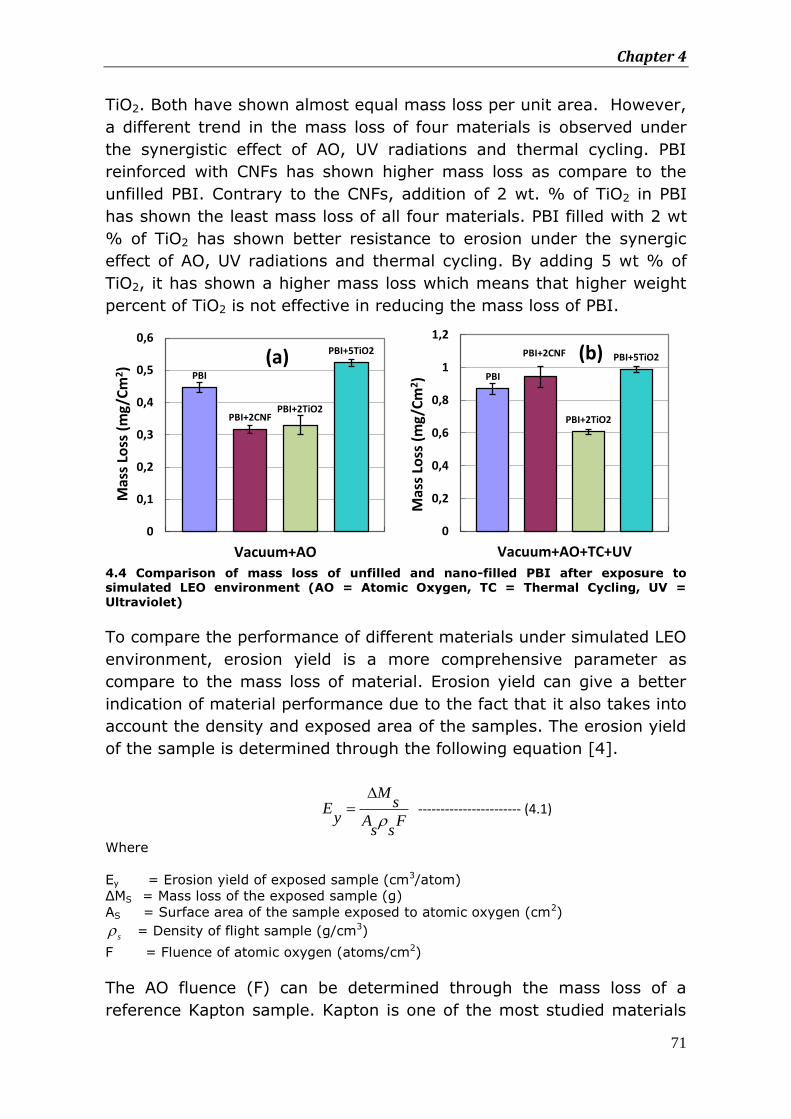
Chapter 4
71
TiO2. Both have shown almost equal mass loss per unit area. However,
a different trend in the mass loss of four materials is observed under
the synergistic effect of AO, UV radiations and thermal cycling. PBI
reinforced with CNFs has shown higher mass loss as compare to the
unfilled PBI. Contrary to the CNFs, addition of 2 wt. % of TiO2 in PBI
has shown the least mass loss of all four materials. PBI filled with 2 wt
% of TiO2 has shown better resistance to erosion under the synergic
effect of AO, UV radiations and thermal cycling. By adding 5 wt % of
TiO2, it has shown a higher mass loss which means that higher weight
percent of TiO2 is not effective in reducing the mass loss of PBI.
4.4 Comparison of mass loss of unfilled and nano-filled PBI after exposure to simulated LEO environment (AO = Atomic Oxygen, TC = Thermal Cycling, UV = Ultraviolet)
To compare the performance of different materials under simulated LEO
environment, erosion yield is a more comprehensive parameter as
compare to the mass loss of material. Erosion yield can give a better
indication of material performance due to the fact that it also takes into
account the density and exposed area of the samples. The erosion yield
of the sample is determined through the following equation [4].
M
sEy A F
s s
----------------------- (4.1)
Where
Ey = Erosion yield of exposed sample (cm3/atom)
ΔMS = Mass loss of the exposed sample (g)
AS = Surface area of the sample exposed to atomic oxygen (cm2)
s = Density of flight sample (g/cm3)
F = Fluence of atomic oxygen (atoms/cm2)
The AO fluence (F) can be determined through the mass loss of a
reference Kapton sample. Kapton is one of the most studied materials
PBI
PBI+2CNF PBI+2TiO2
PBI+5TiO2
0
0,1
0,2
0,3
0,4
0,5
0,6
Vacuum+AO
Mas
s Lo
ss (
mg/
Cm
2)
(a) PBI
PBI+2CNF
PBI+2TiO2
PBI+5TiO2
0
0,2
0,4
0,6
0,8
1
1,2
Vacuum+AO+TC+UV
Mas
s Lo
ss (
mg/
Cm
2)
(b)
Performance Evaluation of PBI in Simulated Low Earth Orbit Environment
72
susceptible to AO degradation in the LEO environment. Therefore,
Kapton is considered as a reference standard for comparison between
ground simulation laboratory tests and flight experiments. It has a well
characterized erosion yield (3.0×10⁻²⁴ cm3/atom) in the LEO
environment. Therefore, the AO fluence (AO flow rate) can be
calculated using the following equation:
k
k k k
MF
A E
------------------------- (4.2)
Where
F = Low earth orbit atomic oxygen fluence (atoms/cm3)
kM = Mass loss of kapton H witness sample (g)
kA = Surface area of kapton H witness sample exposed to atomic oxygen (cm2)
k = Density of kapton H witness sample (1.42 g/cm3)
kE = Erosion yield of kapton H witness sample (3 x 10-24 cm3/atom)
Thus erosion yield of the exposed sample can be calculated by using
the following equation.
s k ky K
k s s
M AE E
M A
---------------------- (4.3)
In this study, 3 cm x 3 cm Kapton films were used as reference
samples. These kapton films were aged in the testing facility for 8
hours under simulated LEO conditions. High vacuum, AO, UV radiations
and thermal cycling were simultaneously applied. After aging, the mass
loss of the Kapton films was measured and the equivalent AO flow rate
was calculated by using equation 4.2. Based on mass loss
measurements for reference kapton samples, the calculated equivalent
AO flow rate was 9.15x10¹⁴ atoms/cm2-sec. This value was used to
calculate the experimental duration in order to achieve a total dose
value during the ground experiment which should be equivalent to total
AO dose during space shuttle mission (STS-4). The duration of
experiment was determined based on total exposed AO quantity
because AO is the most severe condition among the LEO environmental
factors. During an STS-4 mission, the total AO quantity directed at the
space shuttle during operation was 0.65x10²⁰ atoms/cm2 [4]. By using
the calculated AO flow rate, the total AO dose was achieved in the
duration of 20 hours.
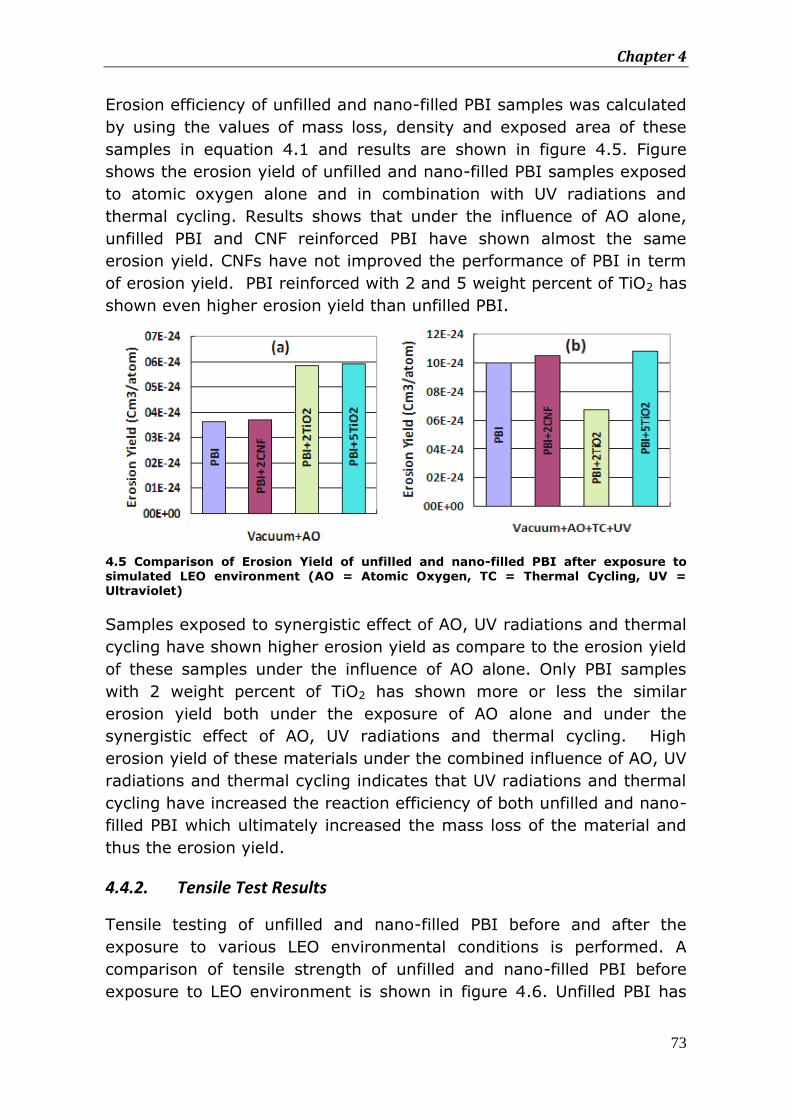
Chapter 4
73
Erosion efficiency of unfilled and nano-filled PBI samples was calculated
by using the values of mass loss, density and exposed area of these
samples in equation 4.1 and results are shown in figure 4.5. Figure
shows the erosion yield of unfilled and nano-filled PBI samples exposed
to atomic oxygen alone and in combination with UV radiations and
thermal cycling. Results shows that under the influence of AO alone,
unfilled PBI and CNF reinforced PBI have shown almost the same
erosion yield. CNFs have not improved the performance of PBI in term
of erosion yield. PBI reinforced with 2 and 5 weight percent of TiO2 has
shown even higher erosion yield than unfilled PBI.
4.5 Comparison of Erosion Yield of unfilled and nano-filled PBI after exposure to
simulated LEO environment (AO = Atomic Oxygen, TC = Thermal Cycling, UV = Ultraviolet)
Samples exposed to synergistic effect of AO, UV radiations and thermal
cycling have shown higher erosion yield as compare to the erosion yield
of these samples under the influence of AO alone. Only PBI samples
with 2 weight percent of TiO2 has shown more or less the similar
erosion yield both under the exposure of AO alone and under the
synergistic effect of AO, UV radiations and thermal cycling. High
erosion yield of these materials under the combined influence of AO, UV
radiations and thermal cycling indicates that UV radiations and thermal
cycling have increased the reaction efficiency of both unfilled and nano-
filled PBI which ultimately increased the mass loss of the material and
thus the erosion yield.
4.4.2. Tensile Test Results
Tensile testing of unfilled and nano-filled PBI before and after the
exposure to various LEO environmental conditions is performed. A
comparison of tensile strength of unfilled and nano-filled PBI before
exposure to LEO environment is shown in figure 4.6. Unfilled PBI has
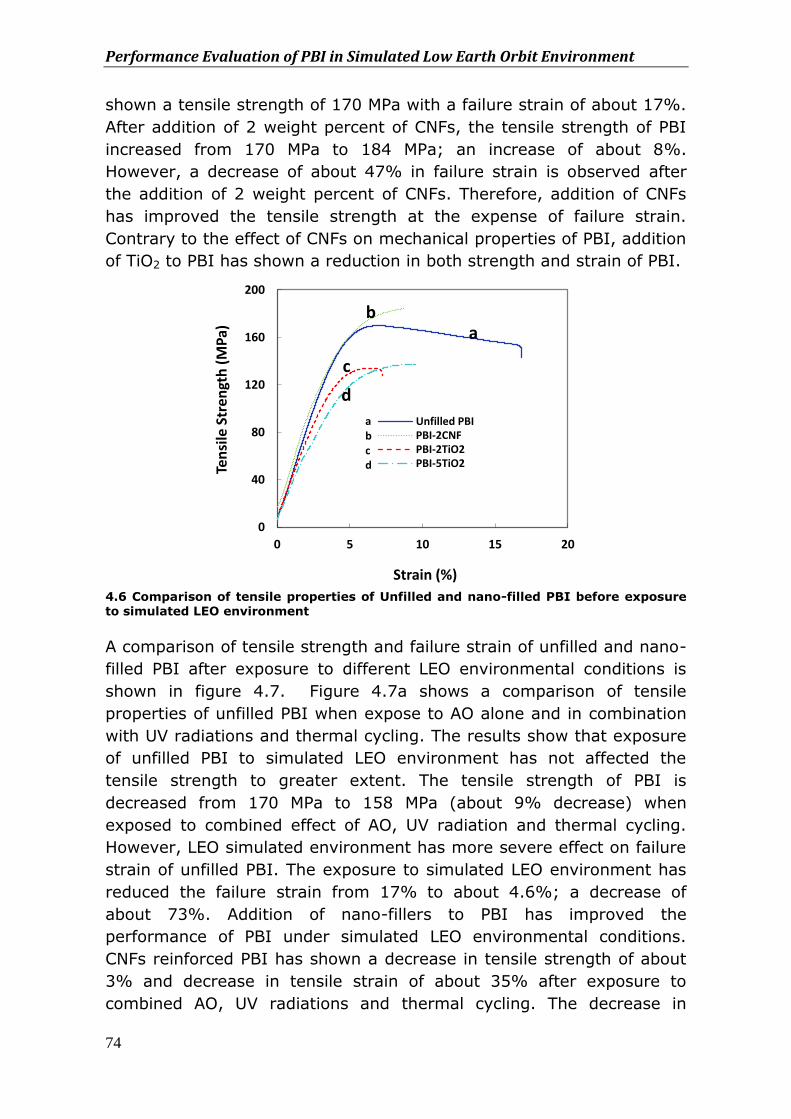
Performance Evaluation of PBI in Simulated Low Earth Orbit Environment
74
shown a tensile strength of 170 MPa with a failure strain of about 17%.
After addition of 2 weight percent of CNFs, the tensile strength of PBI
increased from 170 MPa to 184 MPa; an increase of about 8%.
However, a decrease of about 47% in failure strain is observed after
the addition of 2 weight percent of CNFs. Therefore, addition of CNFs
has improved the tensile strength at the expense of failure strain.
Contrary to the effect of CNFs on mechanical properties of PBI, addition
of TiO2 to PBI has shown a reduction in both strength and strain of PBI.
4.6 Comparison of tensile properties of Unfilled and nano-filled PBI before exposure to simulated LEO environment
A comparison of tensile strength and failure strain of unfilled and nano-
filled PBI after exposure to different LEO environmental conditions is
shown in figure 4.7. Figure 4.7a shows a comparison of tensile
properties of unfilled PBI when expose to AO alone and in combination
with UV radiations and thermal cycling. The results show that exposure
of unfilled PBI to simulated LEO environment has not affected the
tensile strength to greater extent. The tensile strength of PBI is
decreased from 170 MPa to 158 MPa (about 9% decrease) when
exposed to combined effect of AO, UV radiation and thermal cycling.
However, LEO simulated environment has more severe effect on failure
strain of unfilled PBI. The exposure to simulated LEO environment has
reduced the failure strain from 17% to about 4.6%; a decrease of
about 73%. Addition of nano-fillers to PBI has improved the
performance of PBI under simulated LEO environmental conditions.
CNFs reinforced PBI has shown a decrease in tensile strength of about
3% and decrease in tensile strain of about 35% after exposure to
combined AO, UV radiations and thermal cycling. The decrease in
0
40
80
120
160
200
0 5 10 15 20
Ten
sile
Str
engt
h (
MP
a)
Strain (%)
Unfilled PBIPBI-2CNFPBI-2TiO2PBI-5TiO2
a
c
b
d
a b c d
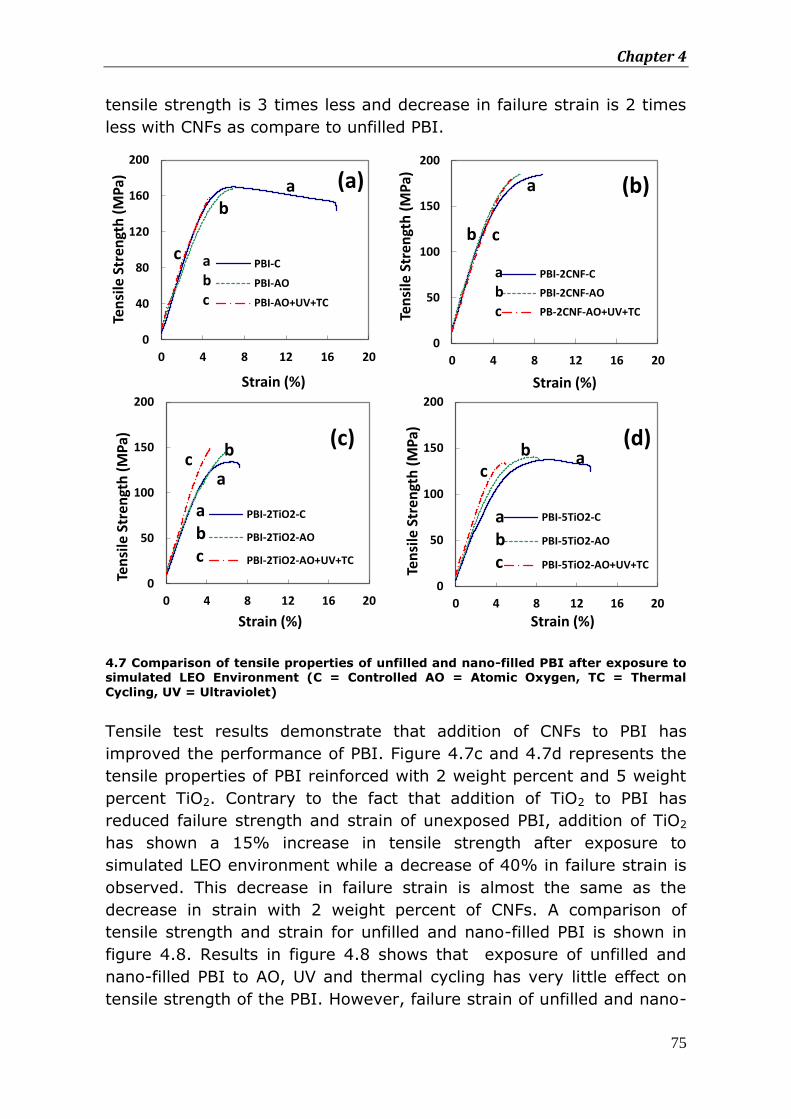
Chapter 4
75
tensile strength is 3 times less and decrease in failure strain is 2 times
less with CNFs as compare to unfilled PBI.
4.7 Comparison of tensile properties of unfilled and nano-filled PBI after exposure to simulated LEO Environment (C = Controlled AO = Atomic Oxygen, TC = Thermal
Cycling, UV = Ultraviolet)
Tensile test results demonstrate that addition of CNFs to PBI has
improved the performance of PBI. Figure 4.7c and 4.7d represents the
tensile properties of PBI reinforced with 2 weight percent and 5 weight
percent TiO2. Contrary to the fact that addition of TiO2 to PBI has
reduced failure strength and strain of unexposed PBI, addition of TiO2
has shown a 15% increase in tensile strength after exposure to
simulated LEO environment while a decrease of 40% in failure strain is
observed. This decrease in failure strain is almost the same as the
decrease in strain with 2 weight percent of CNFs. A comparison of
tensile strength and strain for unfilled and nano-filled PBI is shown in
figure 4.8. Results in figure 4.8 shows that exposure of unfilled and
nano-filled PBI to AO, UV and thermal cycling has very little effect on
tensile strength of the PBI. However, failure strain of unfilled and nano-
0
40
80
120
160
200
0 4 8 12 16 20
Ten
sile
Str
engt
h (
MP
a)
Strain (%)
PBI-C
PBI-AO
PBI-AO+UV+TC
a b
c a b c
(a)
0
50
100
150
200
0 4 8 12 16 20
Ten
sile
Str
engt
h (
MP
a)
Strain (%)
PBI-2CNF-C
PBI-2CNF-AO
PB-2CNF-AO+UV+TC
c b
a
a b c
(b)
0
50
100
150
200
0 4 8 12 16 20
Ten
sile
Str
engt
h (
MP
a)
Strain (%)
PBI-2TiO2-C
PBI-2TiO2-AO
PBI-2TiO2-AO+UV+TC
c b
a
a b c
(c)
0
50
100
150
200
0 4 8 12 16 20
Ten
sile
Str
engt
h (
MP
a)
Strain (%)
PBI-5TiO2-C
PBI-5TiO2-AO
PBI-5TiO2-AO+UV+TC
c b a
a b c
(d)
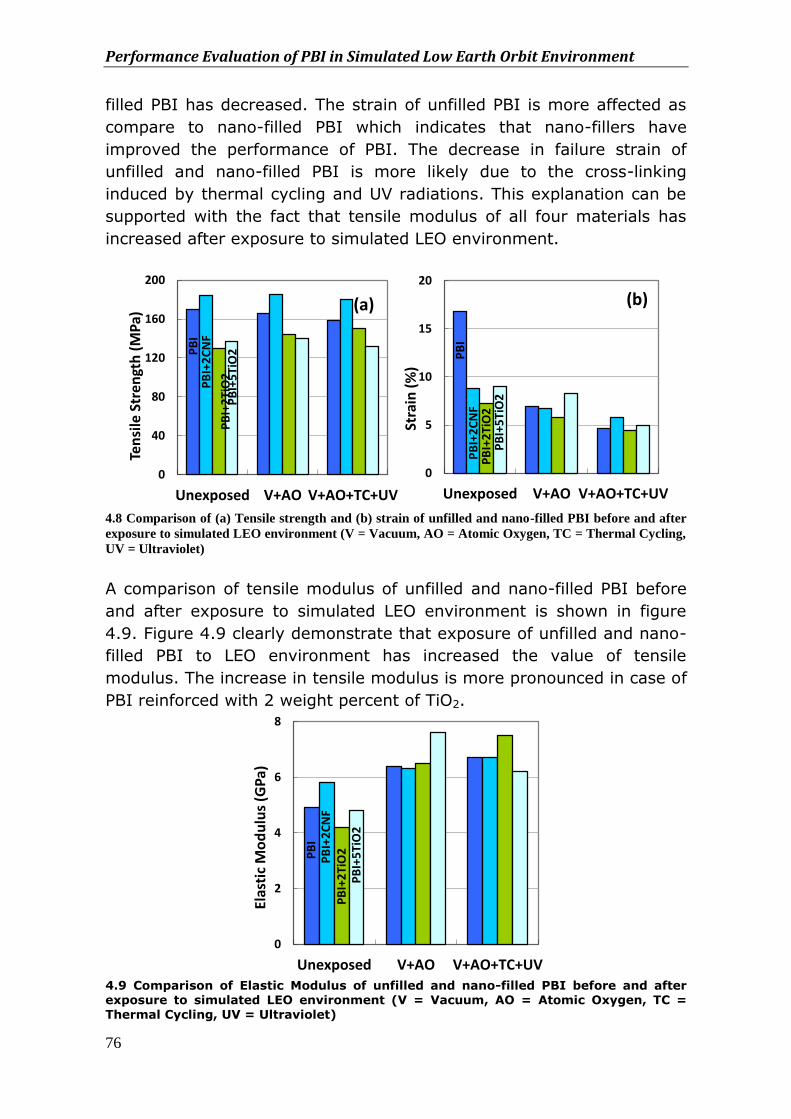
Performance Evaluation of PBI in Simulated Low Earth Orbit Environment
76
filled PBI has decreased. The strain of unfilled PBI is more affected as
compare to nano-filled PBI which indicates that nano-fillers have
improved the performance of PBI. The decrease in failure strain of
unfilled and nano-filled PBI is more likely due to the cross-linking
induced by thermal cycling and UV radiations. This explanation can be
supported with the fact that tensile modulus of all four materials has
increased after exposure to simulated LEO environment.
4.8 Comparison of (a) Tensile strength and (b) strain of unfilled and nano-filled PBI before and after
exposure to simulated LEO environment (V = Vacuum, AO = Atomic Oxygen, TC = Thermal Cycling,
UV = Ultraviolet)
A comparison of tensile modulus of unfilled and nano-filled PBI before
and after exposure to simulated LEO environment is shown in figure
4.9. Figure 4.9 clearly demonstrate that exposure of unfilled and nano-
filled PBI to LEO environment has increased the value of tensile
modulus. The increase in tensile modulus is more pronounced in case of
PBI reinforced with 2 weight percent of TiO2.
4.9 Comparison of Elastic Modulus of unfilled and nano-filled PBI before and after exposure to simulated LEO environment (V = Vacuum, AO = Atomic Oxygen, TC = Thermal Cycling, UV = Ultraviolet)
PB
I P
BI+
2C
NF
PB
I+2
TiO
2
PB
I+5
TiO
2
0
40
80
120
160
200
Unexposed V+AO V+AO+TC+UV
Ten
sile
Str
engt
h (
MP
a) (a)
PB
I P
BI+
2C
NF
PB
I+2
TiO
2
PB
I+5
TiO
2
0
5
10
15
20
Unexposed V+AO V+AO+TC+UV
Stra
in (
%)
(b) P
BI
PB
I+2
CN
F P
BI+
2Ti
O2
P
BI+
5Ti
O2
0
2
4
6
8
Unexposed V+AO V+AO+TC+UV
Elas
tic
Mo
du
lus
(GP
a)
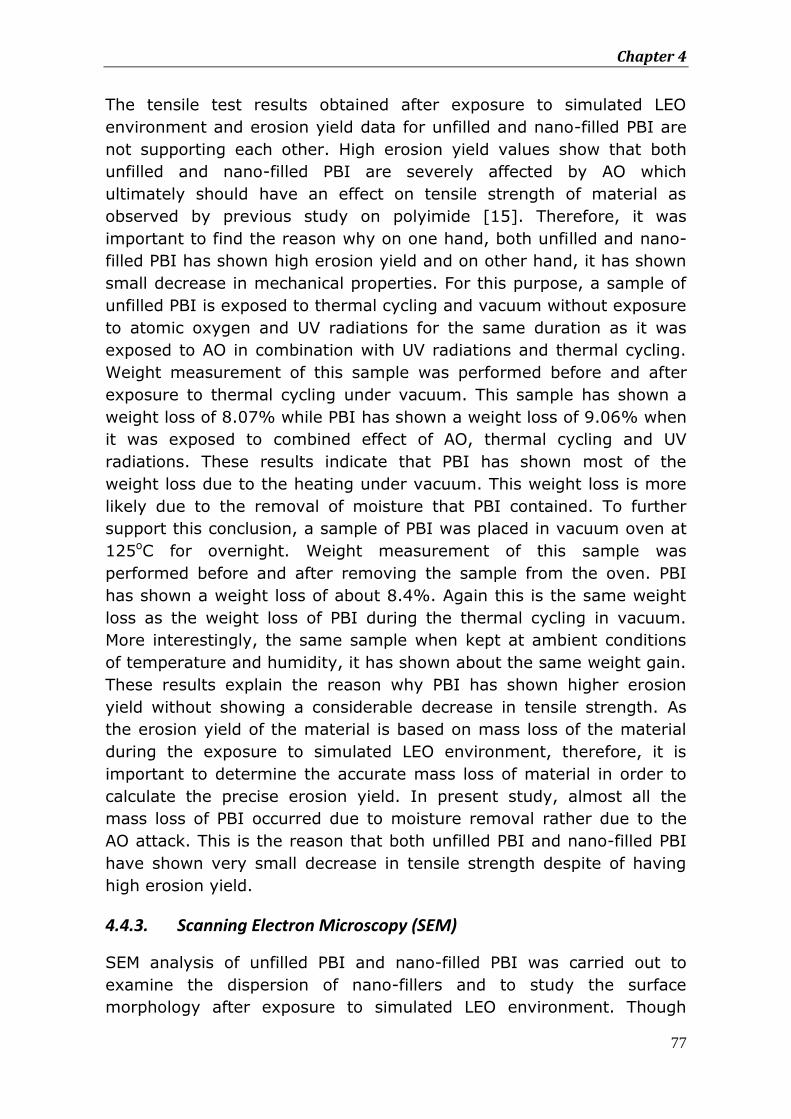
Chapter 4
77
The tensile test results obtained after exposure to simulated LEO
environment and erosion yield data for unfilled and nano-filled PBI are
not supporting each other. High erosion yield values show that both
unfilled and nano-filled PBI are severely affected by AO which
ultimately should have an effect on tensile strength of material as
observed by previous study on polyimide [15]. Therefore, it was
important to find the reason why on one hand, both unfilled and nano-
filled PBI has shown high erosion yield and on other hand, it has shown
small decrease in mechanical properties. For this purpose, a sample of
unfilled PBI is exposed to thermal cycling and vacuum without exposure
to atomic oxygen and UV radiations for the same duration as it was
exposed to AO in combination with UV radiations and thermal cycling.
Weight measurement of this sample was performed before and after
exposure to thermal cycling under vacuum. This sample has shown a
weight loss of 8.07% while PBI has shown a weight loss of 9.06% when
it was exposed to combined effect of AO, thermal cycling and UV
radiations. These results indicate that PBI has shown most of the
weight loss due to the heating under vacuum. This weight loss is more
likely due to the removal of moisture that PBI contained. To further
support this conclusion, a sample of PBI was placed in vacuum oven at
125oC for overnight. Weight measurement of this sample was
performed before and after removing the sample from the oven. PBI
has shown a weight loss of about 8.4%. Again this is the same weight
loss as the weight loss of PBI during the thermal cycling in vacuum.
More interestingly, the same sample when kept at ambient conditions
of temperature and humidity, it has shown about the same weight gain.
These results explain the reason why PBI has shown higher erosion
yield without showing a considerable decrease in tensile strength. As
the erosion yield of the material is based on mass loss of the material
during the exposure to simulated LEO environment, therefore, it is
important to determine the accurate mass loss of material in order to
calculate the precise erosion yield. In present study, almost all the
mass loss of PBI occurred due to moisture removal rather due to the
AO attack. This is the reason that both unfilled PBI and nano-filled PBI
have shown very small decrease in tensile strength despite of having
high erosion yield.
4.4.3. Scanning Electron Microscopy (SEM)
SEM analysis of unfilled PBI and nano-filled PBI was carried out to
examine the dispersion of nano-fillers and to study the surface
morphology after exposure to simulated LEO environment. Though
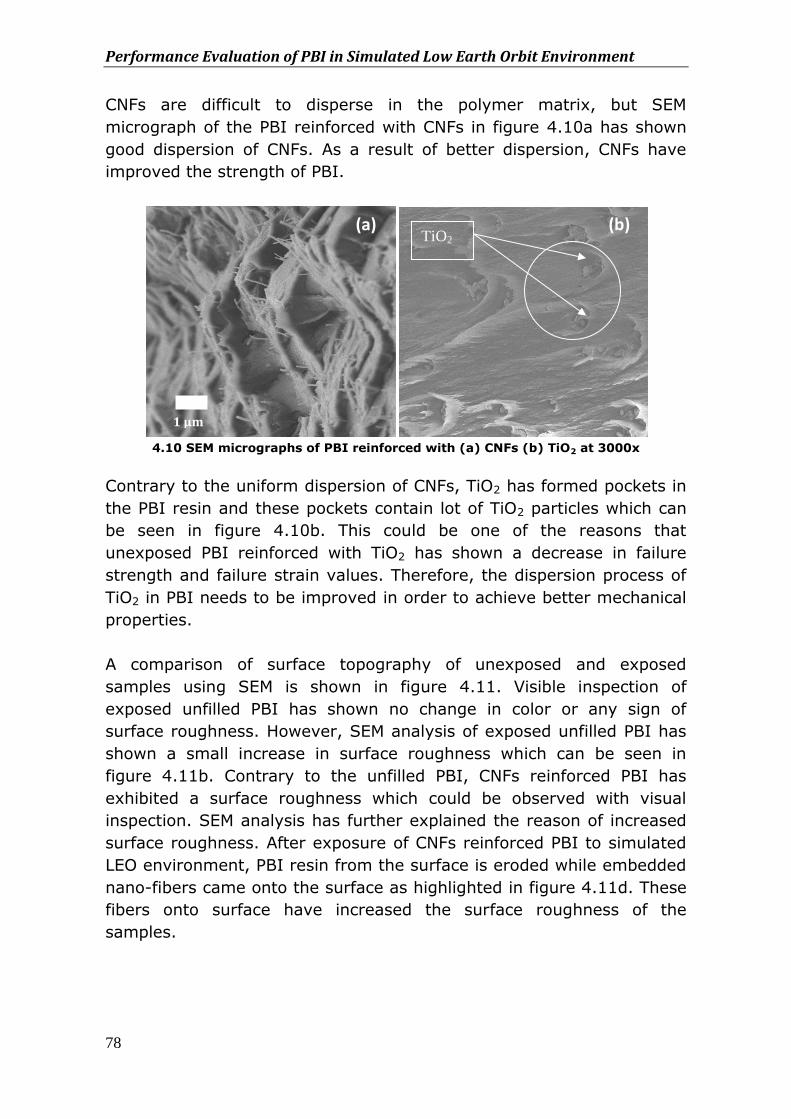
Performance Evaluation of PBI in Simulated Low Earth Orbit Environment
78
CNFs are difficult to disperse in the polymer matrix, but SEM
micrograph of the PBI reinforced with CNFs in figure 4.10a has shown
good dispersion of CNFs. As a result of better dispersion, CNFs have
improved the strength of PBI.
4.10 SEM micrographs of PBI reinforced with (a) CNFs (b) TiO2 at 3000x
Contrary to the uniform dispersion of CNFs, TiO2 has formed pockets in
the PBI resin and these pockets contain lot of TiO2 particles which can
be seen in figure 4.10b. This could be one of the reasons that
unexposed PBI reinforced with TiO2 has shown a decrease in failure
strength and failure strain values. Therefore, the dispersion process of
TiO2 in PBI needs to be improved in order to achieve better mechanical
properties.
A comparison of surface topography of unexposed and exposed
samples using SEM is shown in figure 4.11. Visible inspection of
exposed unfilled PBI has shown no change in color or any sign of
surface roughness. However, SEM analysis of exposed unfilled PBI has
shown a small increase in surface roughness which can be seen in
figure 4.11b. Contrary to the unfilled PBI, CNFs reinforced PBI has
exhibited a surface roughness which could be observed with visual
inspection. SEM analysis has further explained the reason of increased
surface roughness. After exposure of CNFs reinforced PBI to simulated
LEO environment, PBI resin from the surface is eroded while embedded
nano-fibers came onto the surface as highlighted in figure 4.11d. These
fibers onto surface have increased the surface roughness of the
samples.
100 μm
1 μm
TiO2 (a) (b)
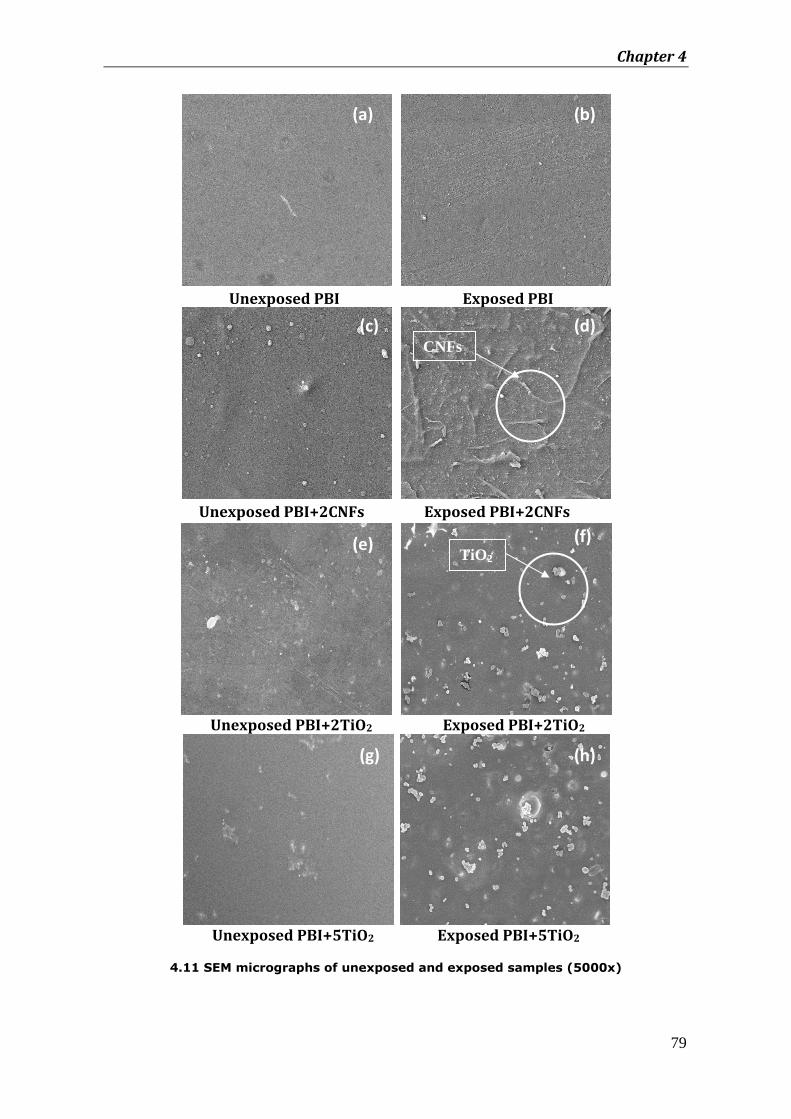
Chapter 4
79
Unexposed PBI Exposed PBI
Unexposed PBI+2CNFs Exposed PBI+2CNFs
Unexposed PBI+2TiO2 Exposed PBI+2TiO2
Unexposed PBI+5TiO2 Exposed PBI+5TiO2
4.11 SEM micrographs of unexposed and exposed samples (5000x)
CNFs
TiO2
(a) (b)
(c) (d)
(e) (f)
(g) (h)
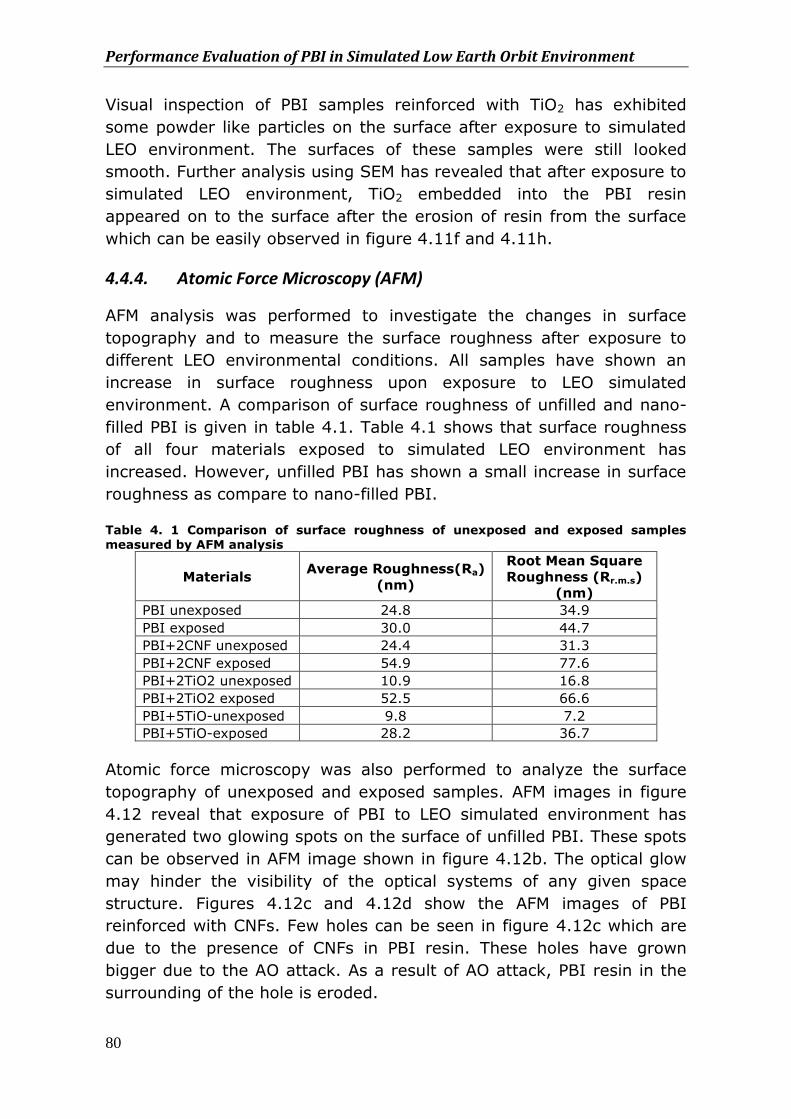
Performance Evaluation of PBI in Simulated Low Earth Orbit Environment
80
Visual inspection of PBI samples reinforced with TiO2 has exhibited
some powder like particles on the surface after exposure to simulated
LEO environment. The surfaces of these samples were still looked
smooth. Further analysis using SEM has revealed that after exposure to
simulated LEO environment, TiO2 embedded into the PBI resin
appeared on to the surface after the erosion of resin from the surface
which can be easily observed in figure 4.11f and 4.11h.
4.4.4. Atomic Force Microscopy (AFM)
AFM analysis was performed to investigate the changes in surface
topography and to measure the surface roughness after exposure to
different LEO environmental conditions. All samples have shown an
increase in surface roughness upon exposure to LEO simulated
environment. A comparison of surface roughness of unfilled and nano-
filled PBI is given in table 4.1. Table 4.1 shows that surface roughness
of all four materials exposed to simulated LEO environment has
increased. However, unfilled PBI has shown a small increase in surface
roughness as compare to nano-filled PBI. Table 4. 1 Comparison of surface roughness of unexposed and exposed samples measured by AFM analysis
Materials Average Roughness(Ra)
(nm)
Root Mean Square
Roughness (Rr.m.s)
(nm)
PBI unexposed 24.8 34.9
PBI exposed 30.0 44.7
PBI+2CNF unexposed 24.4 31.3
PBI+2CNF exposed 54.9 77.6
PBI+2TiO2 unexposed 10.9 16.8
PBI+2TiO2 exposed 52.5 66.6
PBI+5TiO-unexposed 9.8 7.2
PBI+5TiO-exposed 28.2 36.7
Atomic force microscopy was also performed to analyze the surface
topography of unexposed and exposed samples. AFM images in figure
4.12 reveal that exposure of PBI to LEO simulated environment has
generated two glowing spots on the surface of unfilled PBI. These spots
can be observed in AFM image shown in figure 4.12b. The optical glow
may hinder the visibility of the optical systems of any given space
structure. Figures 4.12c and 4.12d show the AFM images of PBI
reinforced with CNFs. Few holes can be seen in figure 4.12c which are
due to the presence of CNFs in PBI resin. These holes have grown
bigger due to the AO attack. As a result of AO attack, PBI resin in the
surrounding of the hole is eroded.
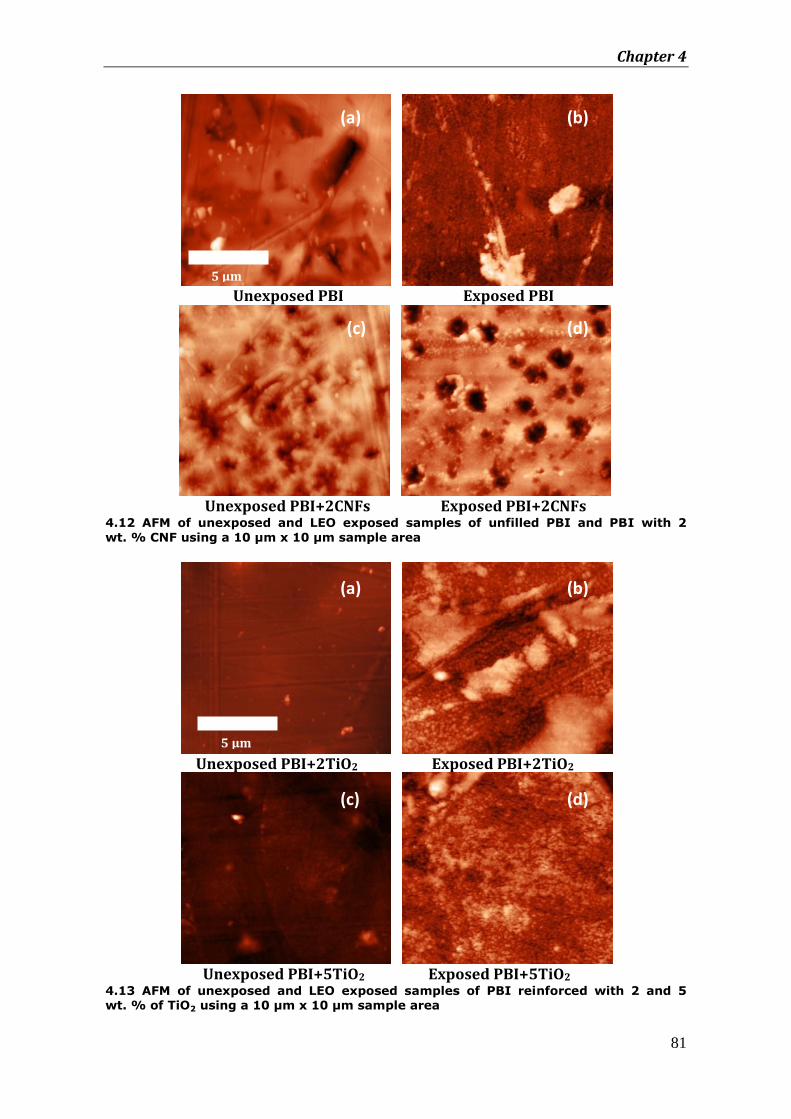
Chapter 4
81
Unexposed PBI Exposed PBI
Unexposed PBI+2CNFs Exposed PBI+2CNFs 4.12 AFM of unexposed and LEO exposed samples of unfilled PBI and PBI with 2
wt. % CNF using a 10 µm x 10 µm sample area
Unexposed PBI+2TiO2 Exposed PBI+2TiO2
Unexposed PBI+5TiO2 Exposed PBI+5TiO2 4.13 AFM of unexposed and LEO exposed samples of PBI reinforced with 2 and 5 wt. % of TiO2 using a 10 µm x 10 µm sample area
100 μm
5 μm
100 μm
5 μm
(a) (b)
(c) (d)
(a) (b)
(c) (d)
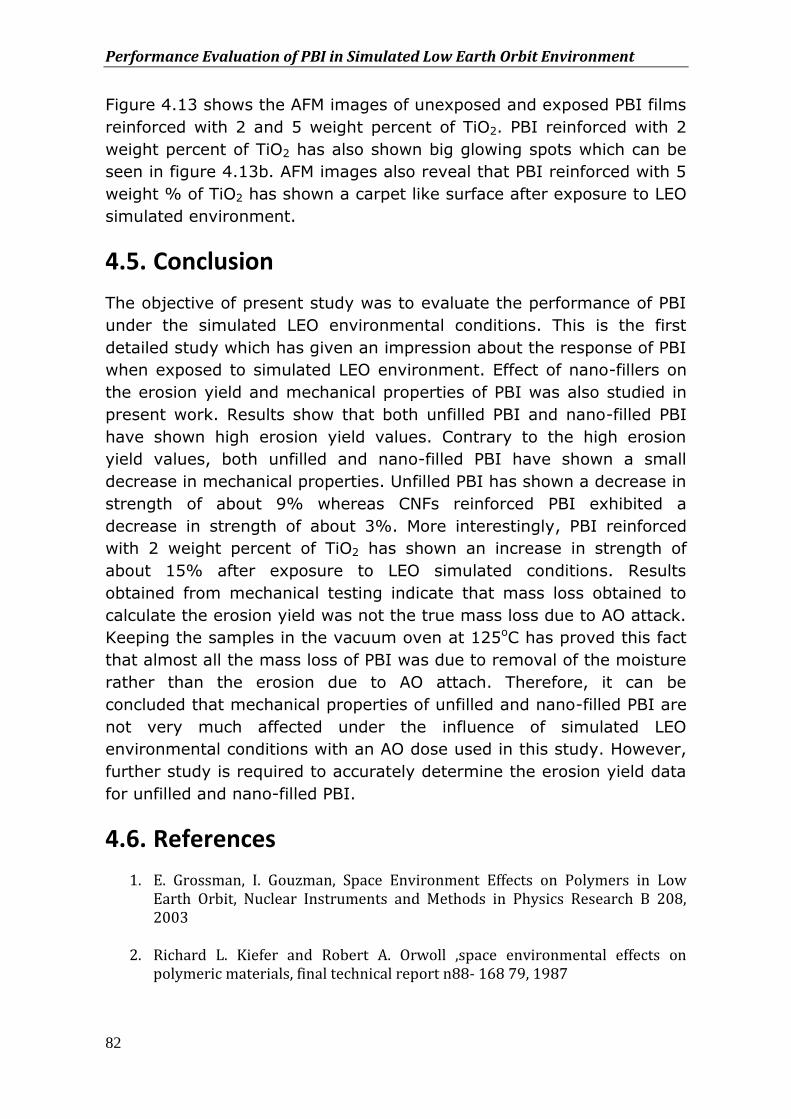
Performance Evaluation of PBI in Simulated Low Earth Orbit Environment
82
Figure 4.13 shows the AFM images of unexposed and exposed PBI films
reinforced with 2 and 5 weight percent of TiO2. PBI reinforced with 2
weight percent of TiO2 has also shown big glowing spots which can be
seen in figure 4.13b. AFM images also reveal that PBI reinforced with 5
weight % of TiO2 has shown a carpet like surface after exposure to LEO
simulated environment.
4.5. Conclusion
The objective of present study was to evaluate the performance of PBI
under the simulated LEO environmental conditions. This is the first
detailed study which has given an impression about the response of PBI
when exposed to simulated LEO environment. Effect of nano-fillers on
the erosion yield and mechanical properties of PBI was also studied in
present work. Results show that both unfilled PBI and nano-filled PBI
have shown high erosion yield values. Contrary to the high erosion
yield values, both unfilled and nano-filled PBI have shown a small
decrease in mechanical properties. Unfilled PBI has shown a decrease in
strength of about 9% whereas CNFs reinforced PBI exhibited a
decrease in strength of about 3%. More interestingly, PBI reinforced
with 2 weight percent of TiO2 has shown an increase in strength of
about 15% after exposure to LEO simulated conditions. Results
obtained from mechanical testing indicate that mass loss obtained to
calculate the erosion yield was not the true mass loss due to AO attack.
Keeping the samples in the vacuum oven at 125oC has proved this fact
that almost all the mass loss of PBI was due to removal of the moisture
rather than the erosion due to AO attach. Therefore, it can be
concluded that mechanical properties of unfilled and nano-filled PBI are
not very much affected under the influence of simulated LEO
environmental conditions with an AO dose used in this study. However,
further study is required to accurately determine the erosion yield data
for unfilled and nano-filled PBI.
4.6. References
1. E. Grossman, I. Gouzman, Space Environment Effects on Polymers in Low Earth Orbit, Nuclear Instruments and Methods in Physics Research B 208, 2003
2. Richard L. Kiefer and Robert A. Orwoll ,space environmental effects on
polymeric materials, final technical report n88- 168 79, 1987
Chapter 4
83
3. Edward M. Silverman, Space Environmental Effects on Spacecraft: LEO Materials Selection Guide, NASA Contractor Report 4661, Part 2
4. Kim K. de Groh and Bruce A. Banks, MISSE PEACE Polymers Atomic Oxygen
Erosion Results, NASA/TM—2006-214482
5. Paul A. Steinerand Robert Sandor, “Polybenzimidazole Prepreg: Improved Elevated Temperature Properties with Autoclave Processability, “High performance polymers, Vol. 3, 1991
6. D.J.Kemmish, High performance engineering plastics, Rapra review reports,
Vol. 8, Report 86, 1995
7. S. Bhowmik, H. W. Bonin, V. T. Bui, R. D. Weir, Modification of High-Performance Polymer Composite Through High-Energy Radiation and Low-Pressure Plasma for Aerospace and Space Applications, Jouranl of Applied Polymer Science, Vol. 102, 2006
8. Joo-Hyun Han, Chun-Gon Kim, Low Earth Orbit Space Environment Simulation
and its Effects On Graphite/Epoxy Composites, Composite Structures vol. 72, 2006
9. Kwang-Bok Shina, Chun-Gon Kima, Chang-Sun Honga, Ho-Hyung Leeb,
Prediction of Failure Thermal Cycles in Graphite/Epoxy Composite Materials Under Simulated Low Earth Orbit Environments, Composites: Part B, Vol. 31, 2000
10. Zhao Wei, Li Weiping, Liu Huicong, Zhu Liqun, Erosion of a Polyimide Material
Exposed to Simulated Atomic Oxygen Environment, Chinese Journal of Aeronautics, Vol. 23, 2010
11. M. Raja Reddy, Review effect of low earth orbit atomic oxygen on spacecraft materials, J. Mat. Sci. 30 (1995) 281-307
12. Myer Kutz, Handbook of Environmental Degradation of Materials
13. Alexander Barrie, A report on Spacecraft Interactions in a LEO Environment, , December 2004
14. Hongying Yang, Sukang Zhu, Ning Pan, Studying the Mechanisms of Titanium Dioxide as Ultraviolet-Blocking Additive for Films and Fabrics by an Improved Scheme, J. App. Poly. Sci. Vol. 92, 2004, 3201-3210
15. Hiroyuki Shimamura and Takashi Nakamura, Effects of Atomic Oxygen on
Mechanical Properties of Polyimide Films, AIP conf. proceeding, 2009

85
CHAPTER 5
Performance Evaluation of Polybenzimidazole under High Energy Radiations Environment
This chapter mainly deals with the exposure of unfilled PBI
and PBI nano-composite to different kind of high energy
radiations. Characteristic behavior of unfilled and nano-filled
PBI after exposure to various radiations is presented in term
of thermal, mechanical and optical properties.
5.1. Introduction
Polymeric materials are widely used in spacecraft for load bearing
structures, antennas, fuel tank, electrical insulation, sealant, thermal
control coating and many other applications. These materials are ideally
suited for space applications due to their light weight, flexibility in use,
good thermal and electrical insulation properties, and ease in
manufacturing [1-5]. Depending on the applications, materials are
exposed to high vacuum, thermal cycling, high energy UV radiations,
atomic oxygen and high-energy electrons, protons and heavy ions.
Over a design lifetime of 20 years, a satellite in geosynchronous earth
orbit (GEO) could be exposed to a high-energy radiation dose of about
15–20 MGy, or possibly more in some circumstances [4, 6]. These high
energy radiations in GEO environment is one of the main concerns
regarding the thermal, mechanical and optical properties of these
materials. Therefore, it is important to understand the effect of these
high energy radiations on polymeric materials.
Performance Evaluation of PBI under High Energy Radiations Environment
86
5.2. Effect of Ionizing Radiations on Polymeric Materials
Polymeric materials exhibit a wide variety of radiation effects. Physical
mechanisms of radiation effects on polymeric materials depend on the
type and energy of radiation, the type of irradiated material and
radiation conditions including the total radiation dose, dose rate,
temperature of the material and some other factors as well [7]. The
formation of new chemical bonds after irradiation usually results in
irreversible effects. Generally, these effects can be visible as change in
appearance and change in mechanical, electrical, and thermal
properties [4, 5, and 8]. Irradiated polymers generally undergo cross
linking and chain scission reactions. Cross-linking reaction results in
formation of chemical bonds between two adjacent polymer molecules.
This reaction increases the molecular weight of the polymer until the
material is eventually bound into an insoluble three-dimensional
network. Chain scission decreases the molecular weight and increases
solubility. Both reactions can significantly alter the physical and
chemical properties of a polymer. In general, chain scission leads
towards a decreased Young’s modulus, increased elongation, decreased
hardness, and decreased elasticity. Cross linking generally has the
opposite effect on polymer properties [9].
The radiation stability of a polymer depends on the chemical structure
of the material. Addition of energy-absorbing aromatic rings to the
chemical structure significantly increases the radiation stability of some
polymers by aiding in the redistribution of the excitation energy
throughout the material. It is established in previous studies that
aromatic compounds are more resistant to radiations compared to
aliphatic compounds [10, 11]. The increased radiation resistance of
aromatic compounds is due to the fact that the phenyl ring in the
aromatic compounds can absorb energy by going to an excited state
and can dissipate this energy without disrupting the molecule [6, 10].
Kapton is the best known of the polyimides which displays an excellent
resistance towards degradation and loss of material properties when it
is exposed to high energy radiations. This resistance of kapton towards
high-energy radiation arises because the polymer contains a high
concentration of aromatic groups which can dissipate the absorbed
energy to heat through the vibration states associated with these
groups. For this reason, Kapton has found many space applications
Chapter 5
87
where resistance to high-energy radiation is important.
Polybenzimidazole (PBI) is another high performance polymer with high
concentration of aromatic groups. PBI with high concentration of
aromatic groups combined with high thermal and mechanical properties
has the real potential for different space applications under high energy
radiation environment. However, performance of PBI under high energy
radiation environment has not been evaluated till date. In this context,
efforts are made in present work to study the effects of different
radiations on thermal, mechanical and optical properties of PBI.
5.3. Experimental
5.3.1. Materials
26% concentrated solution of Polybenzimidazole (PBI) in
Dimethyleacetamide (DMAc) was supplied by CELAZOLE, PBI
performance products. 99% concentrated DMAc is purchased from
Aldrich chemicals. Carbon nano-fibres (CNFs) were supplied by Pyrograf
Products, Inc. with diameter ranging from 70 nm to 200 nm and length
ranging from 50 μm to 200 μm.
5.3.2. Preparation of Unfilled PBI and Nano-filled PBI Film
Unfilled and nano-filled PBI films were obtained using solution casting
method. The detail of preparation of these films is already given in
section 2.3.3 and 2.3.4. These films were used for the exposure to
different high energy radiations.
5.3.3. Exposure to Electron radiations and Gamma radiations
Unfilled and nano-filled PBI samples were irradiated at LEONI Studer
Hard AG, Switzelands. The samples were exposed to electron and
gamma radiations with energy of 1 MeV. The samples were irradiated
with gamma radiations and electron radiations for a total dose of 300
KGy and 1000 KGy respectively. The dose rate at the sample positions
was 4 kGy/sec.
5.3.4. Exposure to Mixed radiations
Unfilled and nano-filled PBI samples were irradiated with mixed
radiations in the pool of SLOWPOKE-2 nuclear reactor located at Royal
Military College of Canada. The pool is fixed in this reactor and
produces a mixed field of thermal and epithermal neutrons, energetic
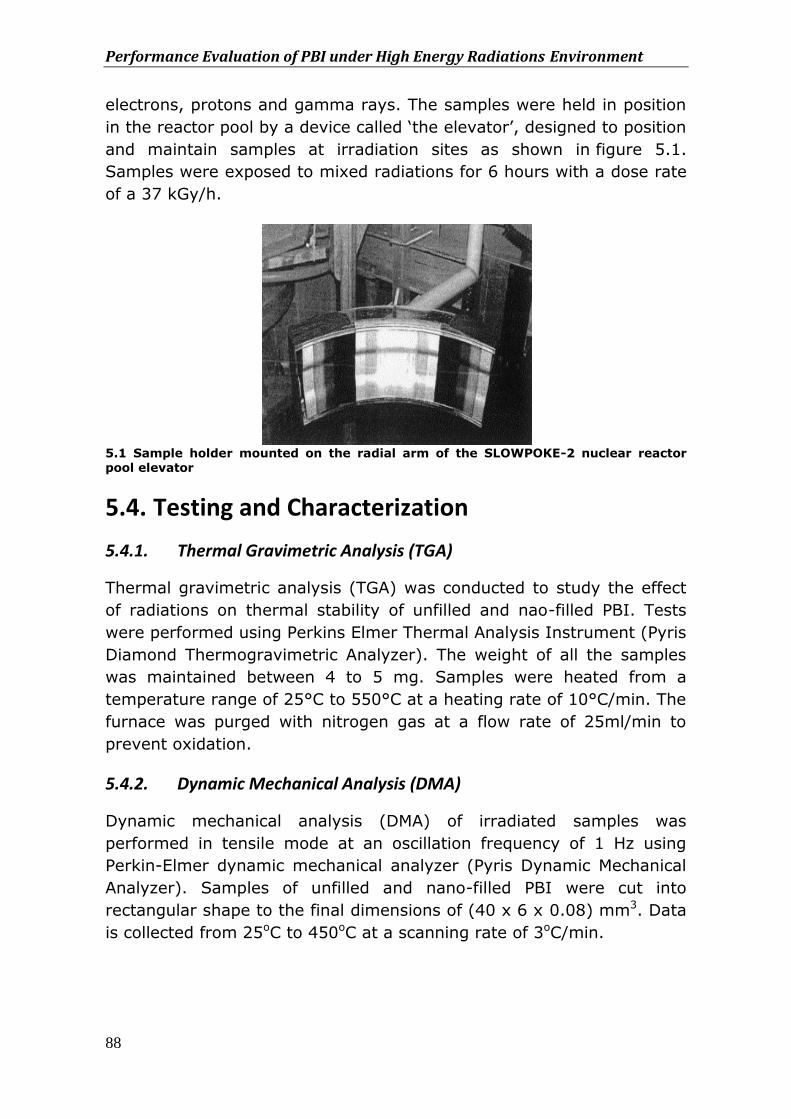
Performance Evaluation of PBI under High Energy Radiations Environment
88
electrons, protons and gamma rays. The samples were held in position
in the reactor pool by a device called ‘the elevator’, designed to position
and maintain samples at irradiation sites as shown in figure 5.1.
Samples were exposed to mixed radiations for 6 hours with a dose rate
of a 37 kGy/h.
5.1 Sample holder mounted on the radial arm of the SLOWPOKE-2 nuclear reactor pool elevator
5.4. Testing and Characterization
5.4.1. Thermal Gravimetric Analysis (TGA)
Thermal gravimetric analysis (TGA) was conducted to study the effect
of radiations on thermal stability of unfilled and nao-filled PBI. Tests
were performed using Perkins Elmer Thermal Analysis Instrument (Pyris
Diamond Thermogravimetric Analyzer). The weight of all the samples
was maintained between 4 to 5 mg. Samples were heated from a
temperature range of 25°C to 550°C at a heating rate of 10°C/min. The
furnace was purged with nitrogen gas at a flow rate of 25ml/min to
prevent oxidation.
5.4.2. Dynamic Mechanical Analysis (DMA)
Dynamic mechanical analysis (DMA) of irradiated samples was
performed in tensile mode at an oscillation frequency of 1 Hz using
Perkin-Elmer dynamic mechanical analyzer (Pyris Dynamic Mechanical
Analyzer). Samples of unfilled and nano-filled PBI were cut into
rectangular shape to the final dimensions of (40 x 6 x 0.08) mm3. Data
is collected from 25oC to 450oC at a scanning rate of 3oC/min.
Chapter 5
89
5.4.3. Tensile Testing
Tensile testing of irradiated unfilled and nano-filled PBI films was
carried out using Zwick tensile machine at a test speed of 2 mm/min.
Rectangular specimens of (80x6x0.08) mm3 were cut from unexposed
and irradiated samples. An extensometer was also used to determine
the Young’s Modulus and strain values. Five specimens for each
material were tested for the reproducibility of the results.
5.4.4. UV/VIS Spectroscopy
UV/VIS Spectroscopy was performed to study the effect of radiation on
transmittance and absorbance behavior of unfilled and nano-filler PBI.
The spectra were recorded on a Perkin Elmer Lambda 2 spectrometer
using a scan speed of 120 nm min-1 over the range of 200 to 800 nm
at room temperature. A baseline was recorded on an air reference prior
to measurement of each film. The thicknesses of the film samples were
measured using a micrometer screw and were taken as the average of
three measurements.
5.4.5. Surface morphology
Scanning electron microscopy was carried out to study the surface
morphology of controlled and irradiated samples. Images were obtained
using JOEL-7500 field emission scanning electron microscope (FE-SEM)
which operates at 30kV accelerating voltage. Surface of each sample
was coated with a thin layer of gold to minimize sample charging
effects.
5.5. Results and Discussion
5.5.1. Thermal gravimetric analysis (TGA)
TGA of unexposed samples and samples exposed to electron, gamma
and mixed radiations was performed to determine the effect of these
radiations on thermal stability of PBI. Thermal stability of material can
be considered in two ways; physical thermal stability and chemical
thermal stability [12]. Physical thermal stability is the mechanical
characteristics which can be represented as a function of temperature
such as storage modulus and glass transition temperature. The
chemical thermal stability is the change in the characteristics which can
be represented as a function of temperature and time, such as thermal
decomposition and thermal degradation [12]. TGA is an important tool
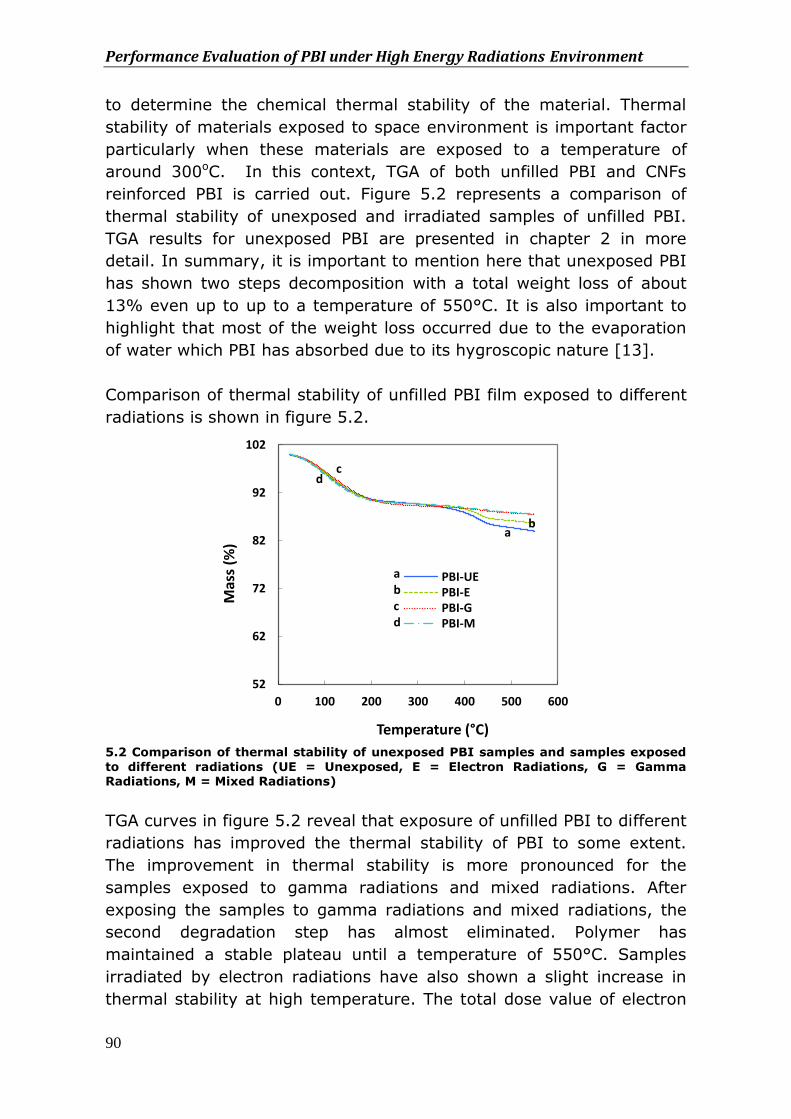
Performance Evaluation of PBI under High Energy Radiations Environment
90
to determine the chemical thermal stability of the material. Thermal
stability of materials exposed to space environment is important factor
particularly when these materials are exposed to a temperature of
around 300oC. In this context, TGA of both unfilled PBI and CNFs
reinforced PBI is carried out. Figure 5.2 represents a comparison of
thermal stability of unexposed and irradiated samples of unfilled PBI.
TGA results for unexposed PBI are presented in chapter 2 in more
detail. In summary, it is important to mention here that unexposed PBI
has shown two steps decomposition with a total weight loss of about
13% even up to up to a temperature of 550°C. It is also important to
highlight that most of the weight loss occurred due to the evaporation
of water which PBI has absorbed due to its hygroscopic nature [13].
Comparison of thermal stability of unfilled PBI film exposed to different
radiations is shown in figure 5.2.
5.2 Comparison of thermal stability of unexposed PBI samples and samples exposed
to different radiations (UE = Unexposed, E = Electron Radiations, G = Gamma Radiations, M = Mixed Radiations)
TGA curves in figure 5.2 reveal that exposure of unfilled PBI to different
radiations has improved the thermal stability of PBI to some extent.
The improvement in thermal stability is more pronounced for the
samples exposed to gamma radiations and mixed radiations. After
exposing the samples to gamma radiations and mixed radiations, the
second degradation step has almost eliminated. Polymer has
maintained a stable plateau until a temperature of 550°C. Samples
irradiated by electron radiations have also shown a slight increase in
thermal stability at high temperature. The total dose value of electron
52
62
72
82
92
102
0 100 200 300 400 500 600
Mas
s (%
)
Temperature (°C)
PBI-UEPBI-EPBI-GPBI-M
a b c d
a b
d c
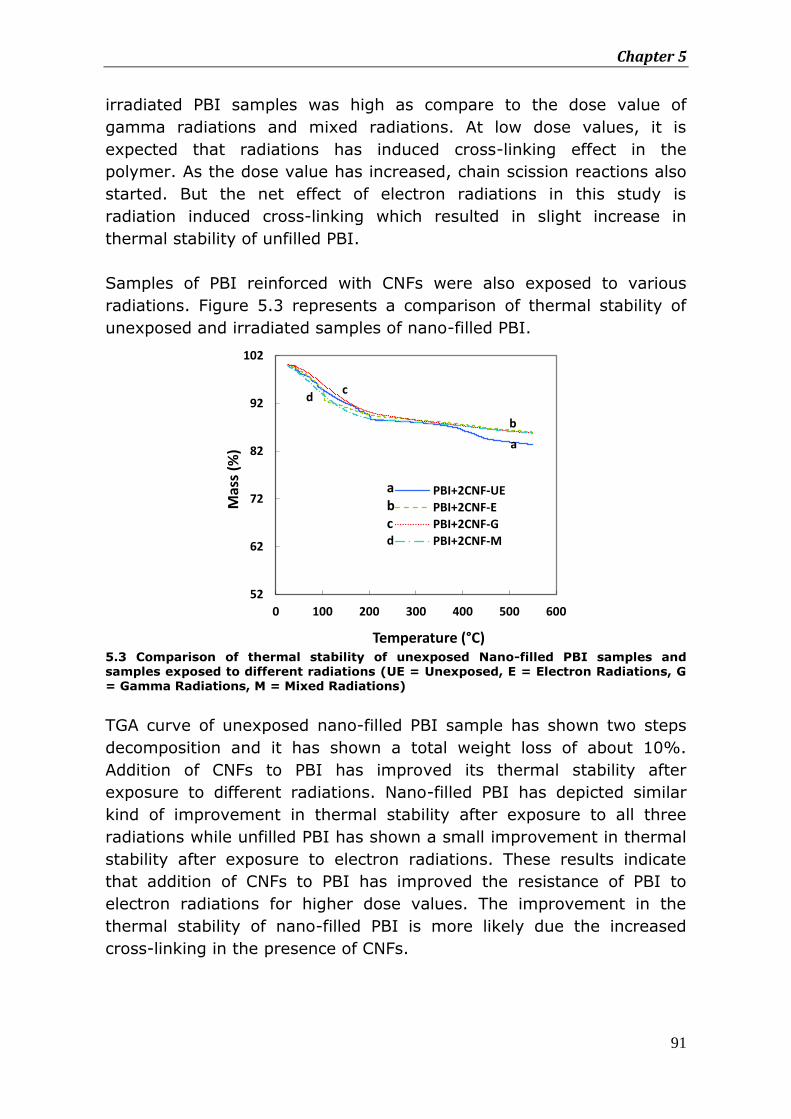
Chapter 5
91
irradiated PBI samples was high as compare to the dose value of
gamma radiations and mixed radiations. At low dose values, it is
expected that radiations has induced cross-linking effect in the
polymer. As the dose value has increased, chain scission reactions also
started. But the net effect of electron radiations in this study is
radiation induced cross-linking which resulted in slight increase in
thermal stability of unfilled PBI.
Samples of PBI reinforced with CNFs were also exposed to various
radiations. Figure 5.3 represents a comparison of thermal stability of
unexposed and irradiated samples of nano-filled PBI.
5.3 Comparison of thermal stability of unexposed Nano-filled PBI samples and samples exposed to different radiations (UE = Unexposed, E = Electron Radiations, G = Gamma Radiations, M = Mixed Radiations)
TGA curve of unexposed nano-filled PBI sample has shown two steps
decomposition and it has shown a total weight loss of about 10%.
Addition of CNFs to PBI has improved its thermal stability after
exposure to different radiations. Nano-filled PBI has depicted similar
kind of improvement in thermal stability after exposure to all three
radiations while unfilled PBI has shown a small improvement in thermal
stability after exposure to electron radiations. These results indicate
that addition of CNFs to PBI has improved the resistance of PBI to
electron radiations for higher dose values. The improvement in the
thermal stability of nano-filled PBI is more likely due the increased
cross-linking in the presence of CNFs.
52
62
72
82
92
102
0 100 200 300 400 500 600
Mas
s (%
)
Temperature (°C)
PBI+2CNF-UE
PBI+2CNF-E
PBI+2CNF-G
PBI+2CNF-M
a b c d
a
b
c d
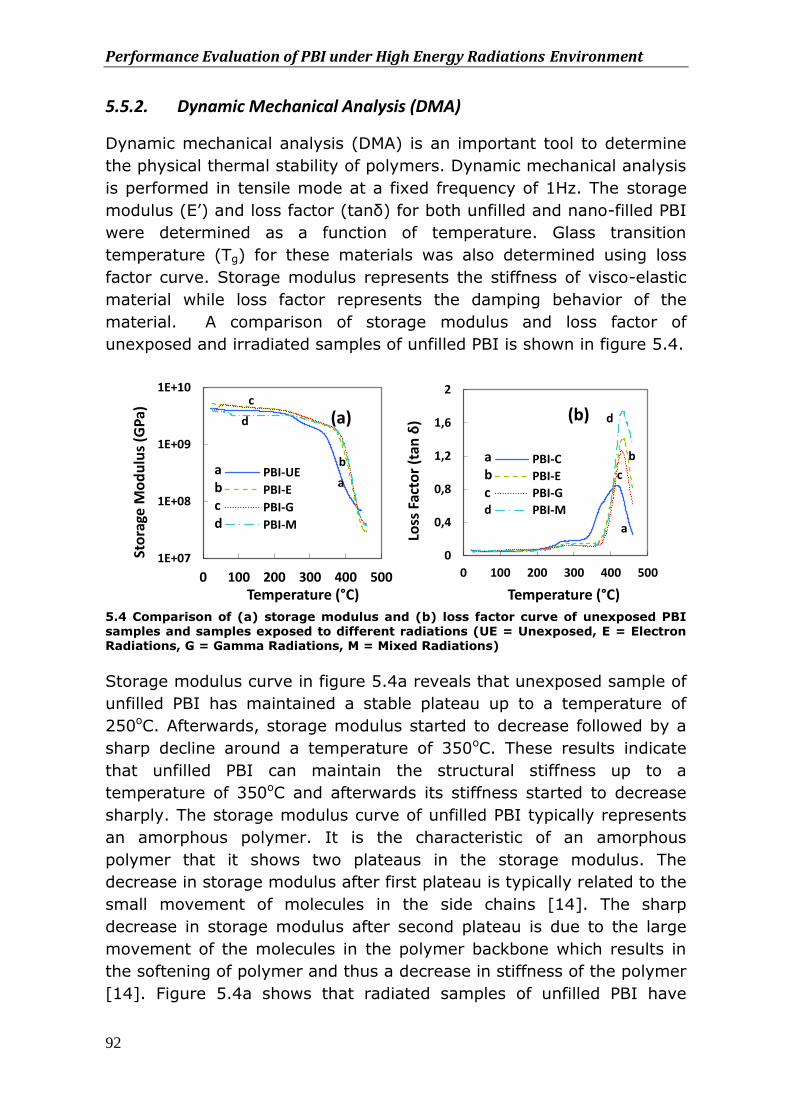
Performance Evaluation of PBI under High Energy Radiations Environment
92
5.5.2. Dynamic Mechanical Analysis (DMA)
Dynamic mechanical analysis (DMA) is an important tool to determine
the physical thermal stability of polymers. Dynamic mechanical analysis
is performed in tensile mode at a fixed frequency of 1Hz. The storage
modulus (E’) and loss factor (tanδ) for both unfilled and nano-filled PBI
were determined as a function of temperature. Glass transition
temperature (Tg) for these materials was also determined using loss
factor curve. Storage modulus represents the stiffness of visco-elastic
material while loss factor represents the damping behavior of the
material. A comparison of storage modulus and loss factor of
unexposed and irradiated samples of unfilled PBI is shown in figure 5.4.
5.4 Comparison of (a) storage modulus and (b) loss factor curve of unexposed PBI samples and samples exposed to different radiations (UE = Unexposed, E = Electron Radiations, G = Gamma Radiations, M = Mixed Radiations)
Storage modulus curve in figure 5.4a reveals that unexposed sample of
unfilled PBI has maintained a stable plateau up to a temperature of
250oC. Afterwards, storage modulus started to decrease followed by a
sharp decline around a temperature of 350oC. These results indicate
that unfilled PBI can maintain the structural stiffness up to a
temperature of 350oC and afterwards its stiffness started to decrease
sharply. The storage modulus curve of unfilled PBI typically represents
an amorphous polymer. It is the characteristic of an amorphous
polymer that it shows two plateaus in the storage modulus. The
decrease in storage modulus after first plateau is typically related to the
small movement of molecules in the side chains [14]. The sharp
decrease in storage modulus after second plateau is due to the large
movement of the molecules in the polymer backbone which results in
the softening of polymer and thus a decrease in stiffness of the polymer
[14]. Figure 5.4a shows that radiated samples of unfilled PBI have
1E+07
1E+08
1E+09
1E+10
0 100 200 300 400 500
Sto
rage
Mo
du
lus
(GP
a)
Temperature (°C)
PBI-UE
PBI-E
PBI-G
PBI-M
a b c d
a
b
c
d (a)
0
0,4
0,8
1,2
1,6
2
0 100 200 300 400 500
Loss
Fac
tor
(tan
δ)
Temperature (°C)
PBI-C
PBI-E
PBI-G
PBI-M
a b c d
a
b
c
d (b)
Chapter 5
93
exhibited an improvement in storage modulus. Unexposed PBI sample
has shown a sharp decrease in storage modulus around 350oC whereas
irradiated samples have maintained a stable storage modulus until a
temperature of 390oC. These results indicate that exposure of unfilled
PBI to different radiations has no detrimental effect on thermo-
mechanical properties of PBI. Instead, these radiations have improved
the storage modulus of unfilled PBI. The increase in storage modulus is
more likely due to the increase in cross-link densities of the exposed
samples.
A comparison of loss factor of unexposed and radiated samples of
unfilled PBI is presented in figure 5.4b. Two peaks at different
temperatures can be observed in the loss factor curve of unfilled PBI.
Essentially, it is the characteristic of all amorphous polymers that they
possess at least two relaxation processes namely “α” relaxation and “β”
relaxation. “α” relaxation occurred due to the movement of molecules
in the backbone of the polymeric structure and is associated with a
substantial fall in material stiffness [14]. The temperature corresponds
to this relaxation in the loss factor curve represents the glass transition
temperature (Tg) of the polymer. Tg of unexposed sample of unfilled
PBI as determined from the peak of tanδ curve is 417oC. Before
reaching to the Tg, amorphous polymers exhibit at least one additional
relaxation process “β” relaxation. This relaxation arises due to the
rotation or oscillation of side groups in the polymeric structure [14].
PBI has also exhibited this peak which can be observed in the tanδ
curve around a temperature of 280oC. In the present study, PBI has
depicted the highest glass transition temperature of any commercially
available polymer. Glass transition temperature gives an idea about the
operational temperature of a polymer used in structural components.
Figure 5.4b shows that the irradiated samples of unfilled PBI have
shown high tanδ peaks as compare to unexposed sample. The peaks
are also narrowed and shifted towards higher temperature. The
narrowing of tanδ curve indicates that after exposure of PBI to different
radiations, cross-lnking among the polymeric chains has increased
which restricted the molecular motions. The increased resistance to
molecular motion results in increased Tg of polymer. Tg has increased
from 417oC to 432oC after exposure of PBI to different radiations.
Irradiation of PBI samples has also shifted the β-transition towards high
temperature. The β-transition temperature has increased from 275oC to
297oC which indicates that radiation induced cross-linking in unfilled
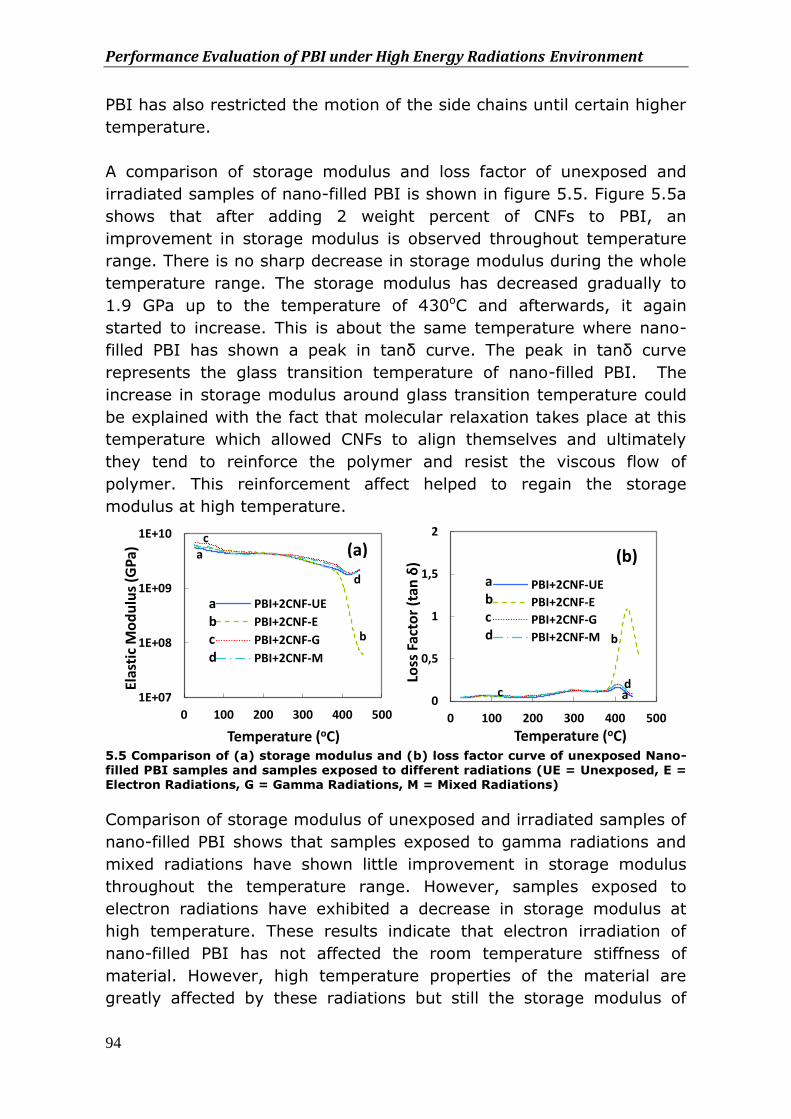
Performance Evaluation of PBI under High Energy Radiations Environment
94
PBI has also restricted the motion of the side chains until certain higher
temperature.
A comparison of storage modulus and loss factor of unexposed and
irradiated samples of nano-filled PBI is shown in figure 5.5. Figure 5.5a
shows that after adding 2 weight percent of CNFs to PBI, an
improvement in storage modulus is observed throughout temperature
range. There is no sharp decrease in storage modulus during the whole
temperature range. The storage modulus has decreased gradually to
1.9 GPa up to the temperature of 430oC and afterwards, it again
started to increase. This is about the same temperature where nano-
filled PBI has shown a peak in tanδ curve. The peak in tanδ curve
represents the glass transition temperature of nano-filled PBI. The
increase in storage modulus around glass transition temperature could
be explained with the fact that molecular relaxation takes place at this
temperature which allowed CNFs to align themselves and ultimately
they tend to reinforce the polymer and resist the viscous flow of
polymer. This reinforcement affect helped to regain the storage
modulus at high temperature.
5.5 Comparison of (a) storage modulus and (b) loss factor curve of unexposed Nano-filled PBI samples and samples exposed to different radiations (UE = Unexposed, E = Electron Radiations, G = Gamma Radiations, M = Mixed Radiations)
Comparison of storage modulus of unexposed and irradiated samples of
nano-filled PBI shows that samples exposed to gamma radiations and
mixed radiations have shown little improvement in storage modulus
throughout the temperature range. However, samples exposed to
electron radiations have exhibited a decrease in storage modulus at
high temperature. These results indicate that electron irradiation of
nano-filled PBI has not affected the room temperature stiffness of
material. However, high temperature properties of the material are
greatly affected by these radiations but still the storage modulus of
1E+07
1E+08
1E+09
1E+10
0 100 200 300 400 500
Elas
tic
Mo
du
lus
(GP
a)
Temperature (oC)
PBI+2CNF-UE
PBI+2CNF-E
PBI+2CNF-G
PBI+2CNF-M
(a)
a b c d
a
d
c
b
0
0,5
1
1,5
2
0 100 200 300 400 500
Loss
Fac
tor
(tan
δ)
Temperature (oC)
PBI+2CNF-UE
PBI+2CNF-E
PBI+2CNF-G
PBI+2CNF-M
(b)
a b c d
a d
b
c
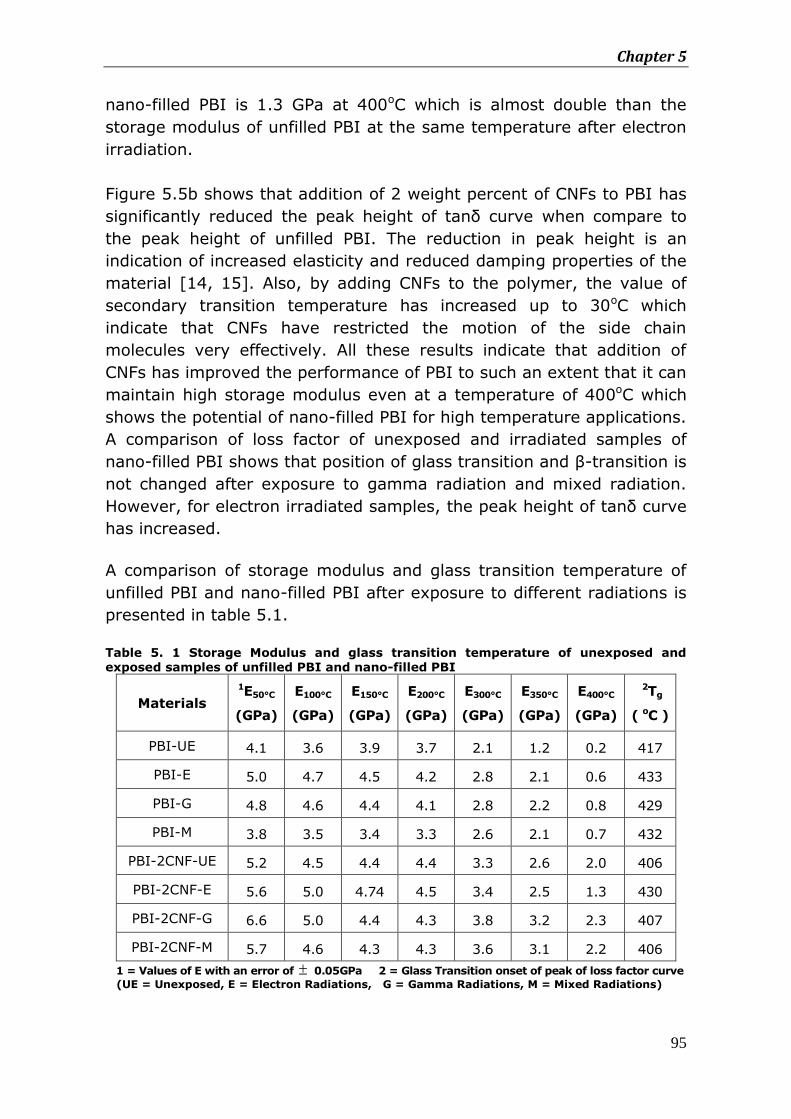
Chapter 5
95
nano-filled PBI is 1.3 GPa at 400oC which is almost double than the
storage modulus of unfilled PBI at the same temperature after electron
irradiation.
Figure 5.5b shows that addition of 2 weight percent of CNFs to PBI has
significantly reduced the peak height of tanδ curve when compare to
the peak height of unfilled PBI. The reduction in peak height is an
indication of increased elasticity and reduced damping properties of the
material [14, 15]. Also, by adding CNFs to the polymer, the value of
secondary transition temperature has increased up to 30oC which
indicate that CNFs have restricted the motion of the side chain
molecules very effectively. All these results indicate that addition of
CNFs has improved the performance of PBI to such an extent that it can
maintain high storage modulus even at a temperature of 400oC which
shows the potential of nano-filled PBI for high temperature applications.
A comparison of loss factor of unexposed and irradiated samples of
nano-filled PBI shows that position of glass transition and β-transition is
not changed after exposure to gamma radiation and mixed radiation.
However, for electron irradiated samples, the peak height of tanδ curve
has increased.
A comparison of storage modulus and glass transition temperature of
unfilled PBI and nano-filled PBI after exposure to different radiations is
presented in table 5.1.
Table 5. 1 Storage Modulus and glass transition temperature of unexposed and exposed samples of unfilled PBI and nano-filled PBI
Materials
1E50°C
(GPa)
E100°C
(GPa)
E150°C
(GPa)
E200°C
(GPa)
E300°C
(GPa)
E350°C
(GPa)
E400°C
(GPa)
2Tg
( oC )
PBI-UE 4.1 3.6 3.9 3.7 2.1 1.2 0.2 417
PBI-E 5.0 4.7 4.5 4.2 2.8 2.1 0.6 433
PBI-G 4.8 4.6 4.4 4.1 2.8 2.2 0.8 429
PBI-M 3.8 3.5 3.4 3.3 2.6 2.1 0.7 432
PBI-2CNF-UE 5.2 4.5 4.4 4.4 3.3 2.6 2.0 406
PBI-2CNF-E 5.6 5.0 4.74 4.5 3.4 2.5 1.3 430
PBI-2CNF-G 6.6 5.0 4.4 4.3 3.8 3.2 2.3 407
PBI-2CNF-M 5.7 4.6 4.3 4.3 3.6 3.1 2.2 406
1 = Values of E with an error of 0.05GPa 2 = Glass Transition onset of peak of loss factor curve
(UE = Unexposed, E = Electron Radiations, G = Gamma Radiations, M = Mixed Radiations)
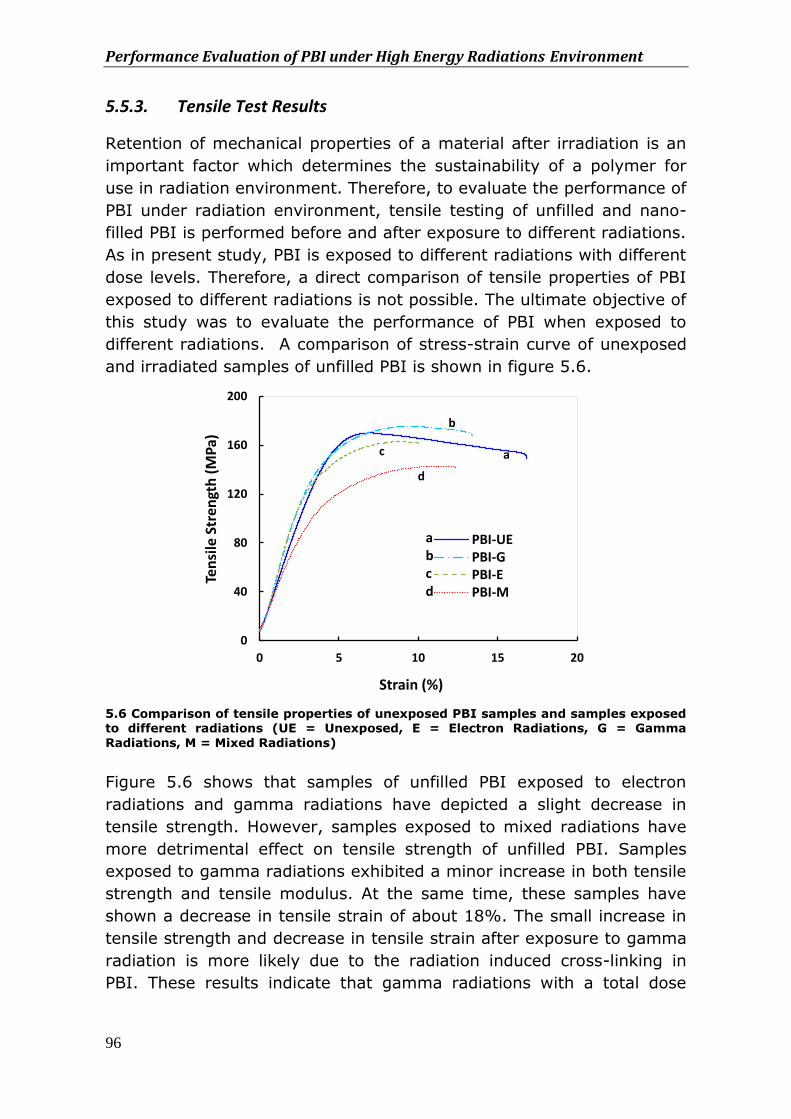
Performance Evaluation of PBI under High Energy Radiations Environment
96
5.5.3. Tensile Test Results
Retention of mechanical properties of a material after irradiation is an
important factor which determines the sustainability of a polymer for
use in radiation environment. Therefore, to evaluate the performance of
PBI under radiation environment, tensile testing of unfilled and nano-
filled PBI is performed before and after exposure to different radiations.
As in present study, PBI is exposed to different radiations with different
dose levels. Therefore, a direct comparison of tensile properties of PBI
exposed to different radiations is not possible. The ultimate objective of
this study was to evaluate the performance of PBI when exposed to
different radiations. A comparison of stress-strain curve of unexposed
and irradiated samples of unfilled PBI is shown in figure 5.6.
5.6 Comparison of tensile properties of unexposed PBI samples and samples exposed to different radiations (UE = Unexposed, E = Electron Radiations, G = Gamma
Radiations, M = Mixed Radiations)
Figure 5.6 shows that samples of unfilled PBI exposed to electron
radiations and gamma radiations have depicted a slight decrease in
tensile strength. However, samples exposed to mixed radiations have
more detrimental effect on tensile strength of unfilled PBI. Samples
exposed to gamma radiations exhibited a minor increase in both tensile
strength and tensile modulus. At the same time, these samples have
shown a decrease in tensile strain of about 18%. The small increase in
tensile strength and decrease in tensile strain after exposure to gamma
radiation is more likely due to the radiation induced cross-linking in
PBI. These results indicate that gamma radiations with a total dose
0
40
80
120
160
200
0 5 10 15 20
Ten
sile
Str
engt
h (
MP
a)
Strain (%)
PBI-UEPBI-GPBI-EPBI-M
a b c d
a
b
c
d
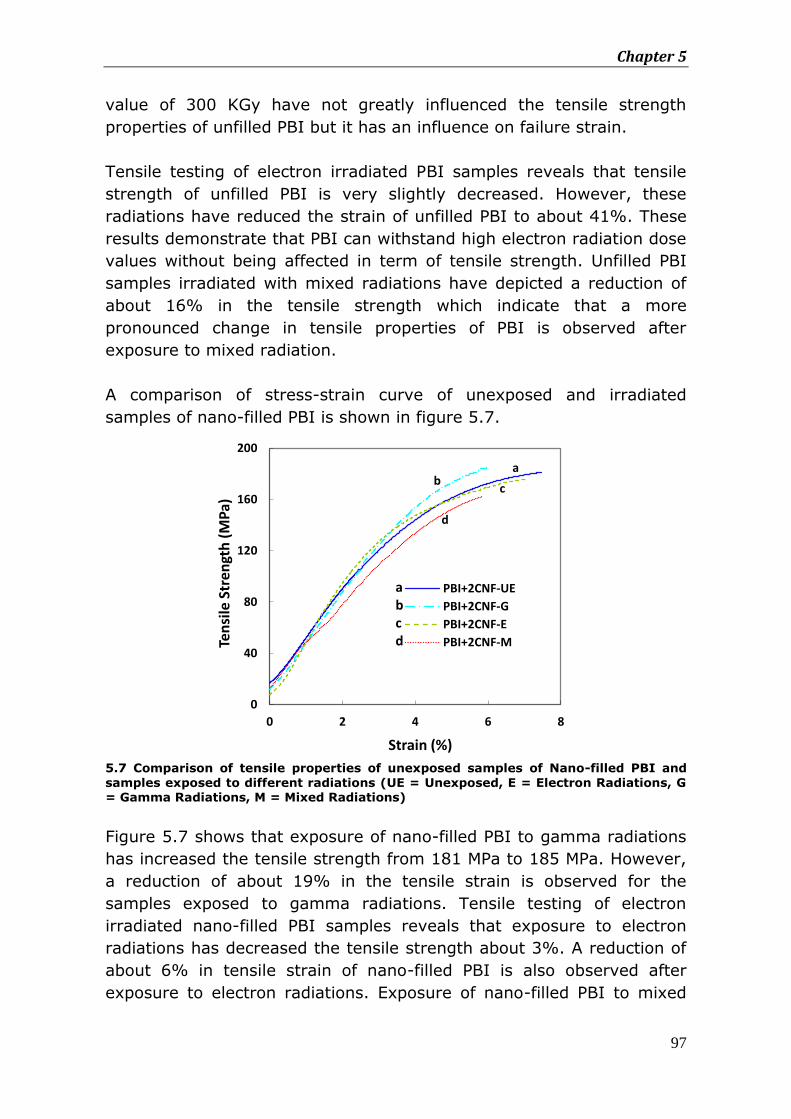
Chapter 5
97
value of 300 KGy have not greatly influenced the tensile strength
properties of unfilled PBI but it has an influence on failure strain.
Tensile testing of electron irradiated PBI samples reveals that tensile
strength of unfilled PBI is very slightly decreased. However, these
radiations have reduced the strain of unfilled PBI to about 41%. These
results demonstrate that PBI can withstand high electron radiation dose
values without being affected in term of tensile strength. Unfilled PBI
samples irradiated with mixed radiations have depicted a reduction of
about 16% in the tensile strength which indicate that a more
pronounced change in tensile properties of PBI is observed after
exposure to mixed radiation.
A comparison of stress-strain curve of unexposed and irradiated
samples of nano-filled PBI is shown in figure 5.7.
5.7 Comparison of tensile properties of unexposed samples of Nano-filled PBI and
samples exposed to different radiations (UE = Unexposed, E = Electron Radiations, G
= Gamma Radiations, M = Mixed Radiations)
Figure 5.7 shows that exposure of nano-filled PBI to gamma radiations
has increased the tensile strength from 181 MPa to 185 MPa. However,
a reduction of about 19% in the tensile strain is observed for the
samples exposed to gamma radiations. Tensile testing of electron
irradiated nano-filled PBI samples reveals that exposure to electron
radiations has decreased the tensile strength about 3%. A reduction of
about 6% in tensile strain of nano-filled PBI is also observed after
exposure to electron radiations. Exposure of nano-filled PBI to mixed
0
40
80
120
160
200
0 2 4 6 8
Ten
sile
Str
engt
h (
MP
a)
Strain (%)
PBI+2CNF-UE
PBI+2CNF-G
PBI+2CNF-E
PBI+2CNF-M
a b c d
a
c
d
b
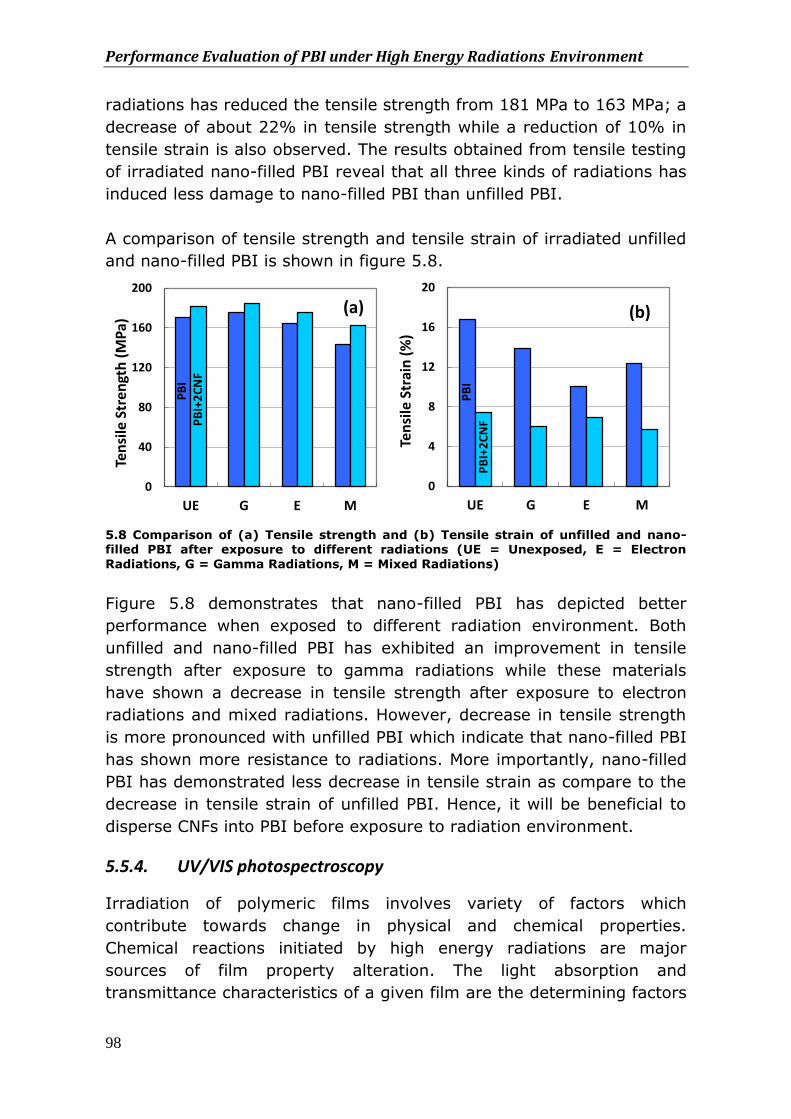
Performance Evaluation of PBI under High Energy Radiations Environment
98
radiations has reduced the tensile strength from 181 MPa to 163 MPa; a
decrease of about 22% in tensile strength while a reduction of 10% in
tensile strain is also observed. The results obtained from tensile testing
of irradiated nano-filled PBI reveal that all three kinds of radiations has
induced less damage to nano-filled PBI than unfilled PBI.
A comparison of tensile strength and tensile strain of irradiated unfilled
and nano-filled PBI is shown in figure 5.8.
5.8 Comparison of (a) Tensile strength and (b) Tensile strain of unfilled and nano-filled PBI after exposure to different radiations (UE = Unexposed, E = Electron
Radiations, G = Gamma Radiations, M = Mixed Radiations)
Figure 5.8 demonstrates that nano-filled PBI has depicted better
performance when exposed to different radiation environment. Both
unfilled and nano-filled PBI has exhibited an improvement in tensile
strength after exposure to gamma radiations while these materials
have shown a decrease in tensile strength after exposure to electron
radiations and mixed radiations. However, decrease in tensile strength
is more pronounced with unfilled PBI which indicate that nano-filled PBI
has shown more resistance to radiations. More importantly, nano-filled
PBI has demonstrated less decrease in tensile strain as compare to the
decrease in tensile strain of unfilled PBI. Hence, it will be beneficial to
disperse CNFs into PBI before exposure to radiation environment.
5.5.4. UV/VIS photospectroscopy
Irradiation of polymeric films involves variety of factors which
contribute towards change in physical and chemical properties.
Chemical reactions initiated by high energy radiations are major
sources of film property alteration. The light absorption and
transmittance characteristics of a given film are the determining factors
PB
I P
BI+
2C
NF
0
40
80
120
160
200
UE G E M
Ten
sile
Str
engt
h (
MP
a) (a)
PB
I
PB
I+2
CN
F 0
4
8
12
16
20
UE G E M
Ten
sile
Str
ain
(%
)
(b)
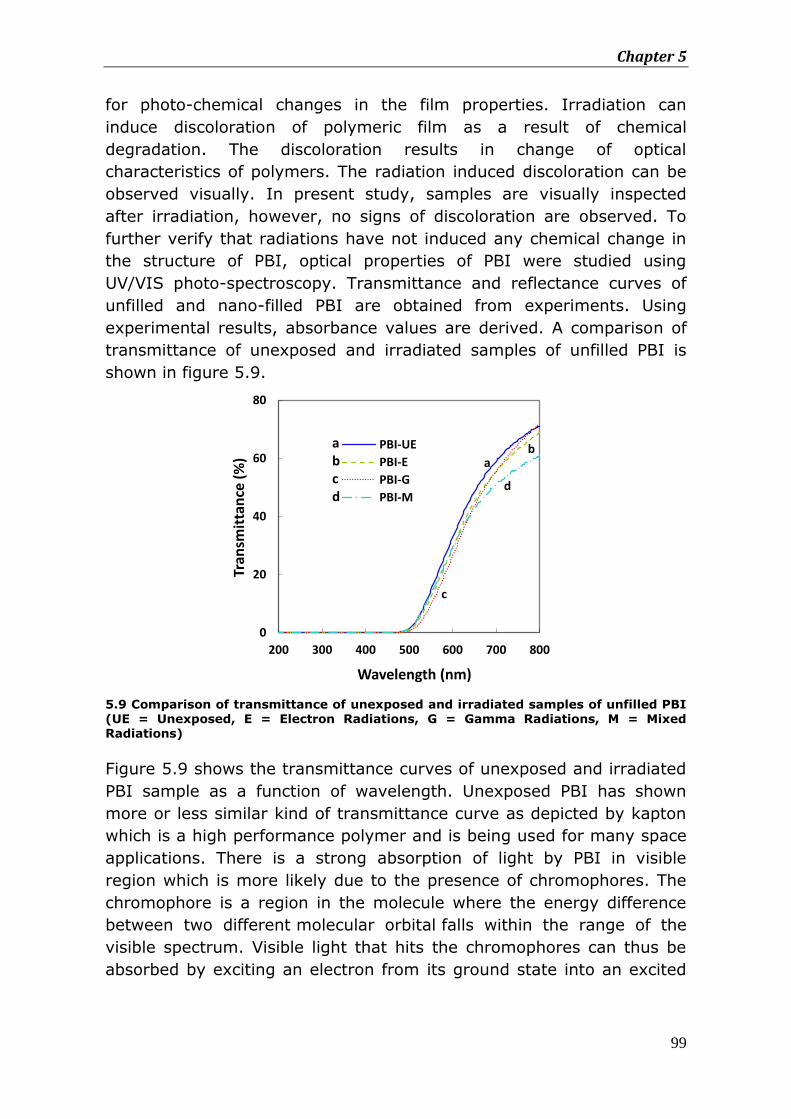
Chapter 5
99
for photo-chemical changes in the film properties. Irradiation can
induce discoloration of polymeric film as a result of chemical
degradation. The discoloration results in change of optical
characteristics of polymers. The radiation induced discoloration can be
observed visually. In present study, samples are visually inspected
after irradiation, however, no signs of discoloration are observed. To
further verify that radiations have not induced any chemical change in
the structure of PBI, optical properties of PBI were studied using
UV/VIS photo-spectroscopy. Transmittance and reflectance curves of
unfilled and nano-filled PBI are obtained from experiments. Using
experimental results, absorbance values are derived. A comparison of
transmittance of unexposed and irradiated samples of unfilled PBI is
shown in figure 5.9.
5.9 Comparison of transmittance of unexposed and irradiated samples of unfilled PBI (UE = Unexposed, E = Electron Radiations, G = Gamma Radiations, M = Mixed Radiations)
Figure 5.9 shows the transmittance curves of unexposed and irradiated
PBI sample as a function of wavelength. Unexposed PBI has shown
more or less similar kind of transmittance curve as depicted by kapton
which is a high performance polymer and is being used for many space
applications. There is a strong absorption of light by PBI in visible
region which is more likely due to the presence of chromophores. The
chromophore is a region in the molecule where the energy difference
between two different molecular orbital falls within the range of the
visible spectrum. Visible light that hits the chromophores can thus be
absorbed by exciting an electron from its ground state into an excited
0
20
40
60
80
200 300 400 500 600 700 800
Tran
smit
tan
ce (
%)
Wavelength (nm)
PBI-UE
PBI-E
PBI-G
PBI-M
a b c d
a b
c
d
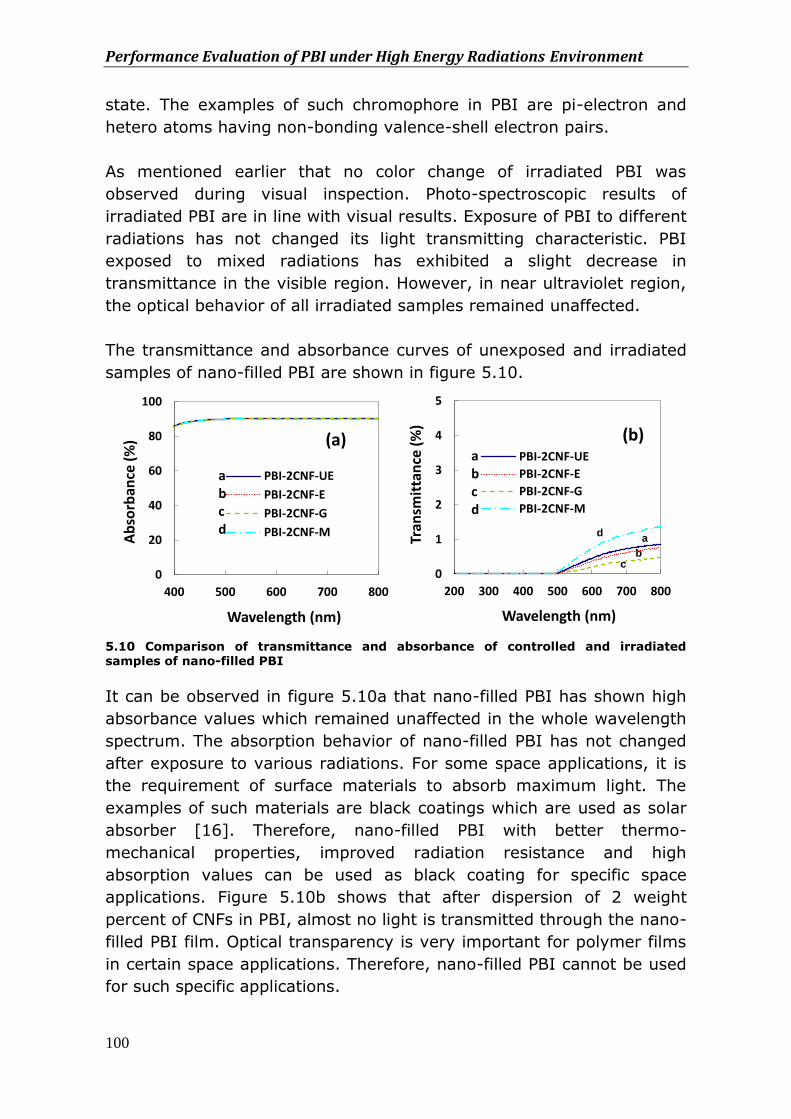
Performance Evaluation of PBI under High Energy Radiations Environment
100
state. The examples of such chromophore in PBI are pi-electron and
hetero atoms having non-bonding valence-shell electron pairs.
As mentioned earlier that no color change of irradiated PBI was
observed during visual inspection. Photo-spectroscopic results of
irradiated PBI are in line with visual results. Exposure of PBI to different
radiations has not changed its light transmitting characteristic. PBI
exposed to mixed radiations has exhibited a slight decrease in
transmittance in the visible region. However, in near ultraviolet region,
the optical behavior of all irradiated samples remained unaffected.
The transmittance and absorbance curves of unexposed and irradiated
samples of nano-filled PBI are shown in figure 5.10.
5.10 Comparison of transmittance and absorbance of controlled and irradiated samples of nano-filled PBI
It can be observed in figure 5.10a that nano-filled PBI has shown high
absorbance values which remained unaffected in the whole wavelength
spectrum. The absorption behavior of nano-filled PBI has not changed
after exposure to various radiations. For some space applications, it is
the requirement of surface materials to absorb maximum light. The
examples of such materials are black coatings which are used as solar
absorber [16]. Therefore, nano-filled PBI with better thermo-
mechanical properties, improved radiation resistance and high
absorption values can be used as black coating for specific space
applications. Figure 5.10b shows that after dispersion of 2 weight
percent of CNFs in PBI, almost no light is transmitted through the nano-
filled PBI film. Optical transparency is very important for polymer films
in certain space applications. Therefore, nano-filled PBI cannot be used
for such specific applications.
0
20
40
60
80
100
400 500 600 700 800
Ab
sorb
ance
(%
)
Wavelength (nm)
PBI-2CNF-UE
PBI-2CNF-E
PBI-2CNF-G
PBI-2CNF-M
(a)
a b c d
0
1
2
3
4
5
200 300 400 500 600 700 800
Tran
smit
tan
ce (
%)
Wavelength (nm)
PBI-2CNF-UE
PBI-2CNF-E
PBI-2CNF-G
PBI-2CNF-M
a b c d
(b)
a d
c b
Chapter 5
101
5.5.5. Surface morphology
SEM analysis was performed to study the surface morphology of
unfilled and nano-filled PBI after exposure to different radiations. The
purpose of studying surface morphology of radiated samples was to
determine if there is any blistering effect induced on the surface.
Blistering is the plastic deformation of irradiated surface layer due to
the evolution of different gases near the surface region. Research
conducted on gamma irradiated and electron irradiated aromatic
polymers reveal that production of different volatile gases including CO,
CO2, N2 and H2 induce undesirable effects on material properties [11,
17 and 18]. This ultimately leads to premature failure of the material
due to degradation in mechanical properties and thus limiting the
service life. Although aromaticity in polymeric structures generally
promotes high stability in term of thermal and mechanical properties
under the influence of radiation, yet the properties of these materials
are affected by the production of different gases upon irradiation. A
recent study performed on kapton under the influence of high energy
gamma radiation shows that exposure of kapton to high energy gamma
radiations resulted in evolution of different gases [18].The gas
evolution caused the bubbles nucleation which continued to grow on
further exposure to these radiations. Ultimately at certain higher
pressure of the evolved gases, these bubbles collapse and plastically
deformed [18]. Therefore, present work has also included the study of
surface morphology of irradiated unfilled and nano-filled PBI. Figure
5.11 and 5.12 shows the surface morphology of unexposed and
irradiated samples of unfilled PBI and nano-filled PBI respectively.
Figure 5.11 and 5.12 shows that irradiation of both unfilled and nano-
filled PBI has changed the surface topography of exposed samples. All
three kinds of radiations have increased the surface roughness of the
exposed samples. However, no sign of bubbling or blistering is
observed. There is also possibility that during the irradiation process,
the bubbles due to gas evolution are nucleated and collapsed which
ultimately induced a change in surface topography of exposed samples
as shown in figure 5.11 and 5.12. However, no conclusive statement
can be made about any gas evolution or bubble formation during the
irradiation of the PBI exposed sample.
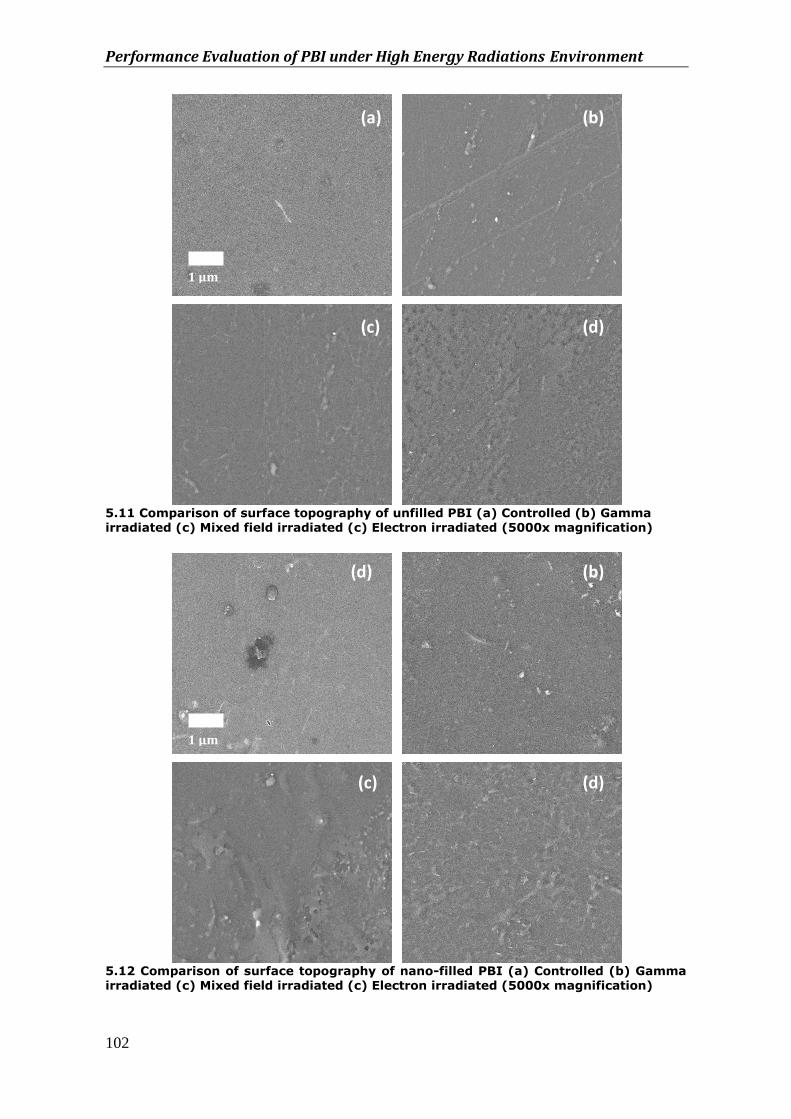
Performance Evaluation of PBI under High Energy Radiations Environment
102
5.11 Comparison of surface topography of unfilled PBI (a) Controlled (b) Gamma irradiated (c) Mixed field irradiated (c) Electron irradiated (5000x magnification)
5.12 Comparison of surface topography of nano-filled PBI (a) Controlled (b) Gamma irradiated (c) Mixed field irradiated (c) Electron irradiated (5000x magnification)
(a) (b)
(d)
100 μm
1 μm
(c) (d)
(b)
(c) (d)
100 μm
1 μm
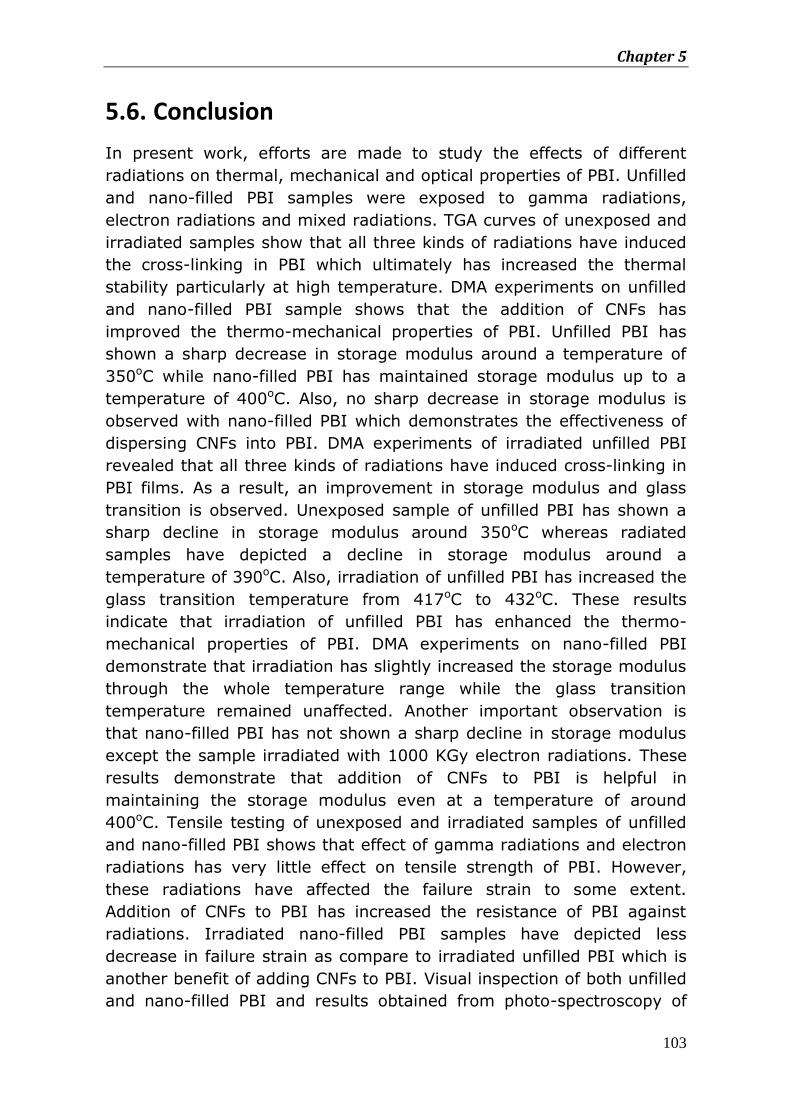
Chapter 5
103
5.6. Conclusion
In present work, efforts are made to study the effects of different
radiations on thermal, mechanical and optical properties of PBI. Unfilled
and nano-filled PBI samples were exposed to gamma radiations,
electron radiations and mixed radiations. TGA curves of unexposed and
irradiated samples show that all three kinds of radiations have induced
the cross-linking in PBI which ultimately has increased the thermal
stability particularly at high temperature. DMA experiments on unfilled
and nano-filled PBI sample shows that the addition of CNFs has
improved the thermo-mechanical properties of PBI. Unfilled PBI has
shown a sharp decrease in storage modulus around a temperature of
350oC while nano-filled PBI has maintained storage modulus up to a
temperature of 400oC. Also, no sharp decrease in storage modulus is
observed with nano-filled PBI which demonstrates the effectiveness of
dispersing CNFs into PBI. DMA experiments of irradiated unfilled PBI
revealed that all three kinds of radiations have induced cross-linking in
PBI films. As a result, an improvement in storage modulus and glass
transition is observed. Unexposed sample of unfilled PBI has shown a
sharp decline in storage modulus around 350oC whereas radiated
samples have depicted a decline in storage modulus around a
temperature of 390oC. Also, irradiation of unfilled PBI has increased the
glass transition temperature from 417oC to 432oC. These results
indicate that irradiation of unfilled PBI has enhanced the thermo-
mechanical properties of PBI. DMA experiments on nano-filled PBI
demonstrate that irradiation has slightly increased the storage modulus
through the whole temperature range while the glass transition
temperature remained unaffected. Another important observation is
that nano-filled PBI has not shown a sharp decline in storage modulus
except the sample irradiated with 1000 KGy electron radiations. These
results demonstrate that addition of CNFs to PBI is helpful in
maintaining the storage modulus even at a temperature of around
400oC. Tensile testing of unexposed and irradiated samples of unfilled
and nano-filled PBI shows that effect of gamma radiations and electron
radiations has very little effect on tensile strength of PBI. However,
these radiations have affected the failure strain to some extent.
Addition of CNFs to PBI has increased the resistance of PBI against
radiations. Irradiated nano-filled PBI samples have depicted less
decrease in failure strain as compare to irradiated unfilled PBI which is
another benefit of adding CNFs to PBI. Visual inspection of both unfilled
and nano-filled PBI and results obtained from photo-spectroscopy of
Performance Evaluation of PBI under High Energy Radiations Environment
104
these samples has not revealed any kind of degradation in chemical
structure. Results obtained during this study are quite encouraging and
further studies can be performed on PBI using higher dose values to
evaluate its performance. Also, irradiation under vacuum and thermal
cycling environment will give more realistic idea about the performance
of PBI.
5.7. References
1. Kresten L.C. Nielsen, David J.T. Hill, Kent A. Watson, John W. Connell, Shigetoshi Ikeda, Hisaaki Kudo, Andrew K. Whittaker The radiation degradation of a nano tube polyimide nanocomposite, Polymer Degradation and Stability 93 (2008)
2. T. Rohr, M. van Eesbeek, Polymer Materials in the Space Environment, 8th
Proceeding of Polymers for Advanced Technologies International Symposium, Budapest, Hungary, (2005)
3. Xianqiang Pei, Yan Li, Qihua Wang, Xiaojun Sun, Effects of atomic oxygen
irradiation on the surface properties of phenolphthalein poly(ether sulfone), Applied Surface Science 255 (2009)
4. Sheila Devasahayam, David J. T. Hill and John W. Connell, Effect of Electron
Beam Radiolysis on Mechanical Properties of High Performance Polyimides. A Comparative Study of Transparent Polymer Films, High Performance Polymers (2005)
5. Phil-Hyun Kang , Young-Kyou Jeon, Joon-Pyo Jeun, Jin-Wook Shin, Young-
Chang Nho, Effect of electron beam irradiation on polyimide film Journal of Industrial and Engineering Chemistry 14 (2008)
6. A.N. Netravali And A. Manji, Effect of Gamma Radiation on the Mechanical
Properties of Epoxy Blends and Epoxy-Graphite Fiber Interface, Polymer Composites, Vol. 12, (1997)
7. B.A. Briskman, E.R. Klinshpont, V.F. Stepanov, Dose Rate Effects in Polymer
Materials Irradiated in Vacuum, Protection Of Materials And Structures From Space Environment, Space Technology Proceeding, vol. 5, (2004)
8. J. Chen, M. Czayka, Roberto M. Uribe, Effects of electron beam irradiations on
the structure and mechanical properties of polycarbonate, Radiation Physics and Chemistry 74 (2005)
9. Nuclear and Space Radiation Effects on Materials, NASA Report SP -8053,
(1970)
Chapter 5
105
10. J.D. Memory, R.E. Fornes and R.D. Gilbert,Radiation Effects on Graphite Fiber Reinforced Composites Journal of Reinforced Plastics and Composites, Vol. 7 (1988)
11. El-Sayed A. Hegazy, T. Sasuga, M. Nishii and T. Seguchi, Irradiation affects on
aromatic polymers: Gas evolution during electron beam irradiation, Polymer, Volume 33, (1992)
12. Hiroshi Inoue, Hidemasa Okamoto, Yukio Hiraoka, Effect of the chemical
structure of acid dianhydride in the skeleton on the thermal property and radiation resistance of polyimide, Int. J Radiat Appli & Inst. Par C, Vol. 29 (1987) pp. 282-288
13. Tai-Shung Chung, A Critical Review of Polybenzimidazoles, Journal of
Macromolecular Science, Part C: Polymer Reviews, (1997)
14. Kevin P. Menard, Dynamic Mechanical Analysis: A practical Introduction, ISBN 0-8493-8688-8, (1999)
15. Elsa Reichmanis, James H. O’Donnell, The effect of radiations on high
technology polymers, ACS Symposium Series 381, (1989)
16. K. Ramaseshan, M. Viswanathan and G. K. M. Thutupalli, Optical Black Coating for Space Application, Bull Mater. Sci. Vol. 8, (1986)
17. El-Sayed A. Hegazy, T. Sasuga, M. Nishii and T. Seguchi, Irradiation affects on
aromatic polymers: Gas evolution during gamma irradiation, Polymer, Volume 33, (1992)
18. Siddhartha, Suveda Aarya, Monika Mishra, A. K. Srivastava,M. A. Wahab,
Formation of Blisters in Kapton Polymer by the Effect of 1.25 MeV Gamma Irradiation, Journal of Applied Polymer Science, Vol. 120, (2011)

107
CHAPTER 6
Performance Evaluation of Polybenzimidazole as an Adhesive for Aerospace Applications
This chapter highlights the important aspects of adhesive
bonding process. In the first part, process optimization of PBI
as an adhesive is presented. Characteristics behaviour of PBI
adhesive after exposure to various environmental conditions
is discussed in the second part of this chapter. Scanning
electron microscopic analysis of failed joints is also presented
in detail.
6.1. Introduction
The use of polymer-based composite materials is becoming significantly
popular due to their high strength to weight ratio, excellent corrosion
resistance, outstanding thermal insulation and low thermal expansion.
They have an impressive and diverse range of applications in
automotive, aviation, spacecraft, civil infrastructure and sports
industries [1-4]. Metallic materials are joined by riveting, bolting,
welding, soldering and other methods. These are mature technologies
for joining metallic materials. In contrast to the metallic materials,
composite materials are often joined by adhesive bonding to form
structural components. Though mechanical fastening is also being used
for composite materials to some extent but adhesive bonding is given
more preference over mechanical fastening because of some
advantages. Adhesive bonding provides uniform stress distribution over
the entire bond line while mechanical fastening create large stress
concentration around the drilled holes [5, 6]. Also, adhesive bonding
Performance Evaluation of PBI as an Adhesive for Aerospace Applications
108
technique provides more design flexibility compared to the mechanical
fastening [7-9].
Despite all the advantages of adhesive bonding, the use of adhesive
bonding for aerospace applications is becoming more challenging. The
main reason is that adhesive bonding has limitation of being used at
elevated temperature and under thermal cycling conditions. For some
adhesives, oxidative degradation occurs at high temperatures whereas
some adhesives show brittleness at low temperatures [10]. In contrast
to the adhesive bonding, mechanical fasteners rarely limit the end use
temperature of the composite materials and perhaps this is one of the
primary reasons that mechanical joining is still being used extensively
for composite joining.
The increased usage of high-temperature resistant resins for composite
materials has necessitated the development of compatible and equally
thermally stable adhesive systems. Epoxy adhesives are commonly
used to bond epoxy based composites because of the compatibility
between resin and adhesive. However, prolonged exposure or even
short-term exposure of these adhesive to elevated temperatures often
produces irreversible chemical and physical changes within adhesives.
Thermal and mechanical properties of these adhesives are degraded
which ultimately degrade the performance of bonded joints.
Consequently, these adhesives cannot be used at very high
temperature [11-12]. Therefore, for high temperature applications, it is
important to select an adhesive which can maintain its thermal and
mechanical properties at high temperature. In order to meet the
demands of aerospace industry, emphasis is being given on the
development of high performance adhesives which can perform well
both at elevated temperature and under thermal cycling conditions.
Polybenizimidazole (PBI) is one such high performance polymer which
has gained great attraction in recent years. Polybenzimidazole (PBI) is
a thermoplastic polymer which has the highest glass transition temperature
Tg (425°C) of any commercial available organic polymer [13]. It has high
decomposition temperatures (500°C-600°C), good oxidation resistance and
it maintains excellent strength at cryogenic temperatures [14]. Due to its
high thermo-mechanical properties, it has great potential to be used as
an adhesive for high temperature applications. Therefore, the objective
of present work is to optimize the bonding process of PBI and to
evaluate its performance under various environmental conditions and at
elevated temperature.
Chapter 6
109
Another important aspect of adhesive bonding of composite materials is
the surface preparation of these materials prior to bonding. For
successful application of composite materials to form structural parts
using adhesive bonding, they need to have special surface properties
such as hydrophilicity and roughness [15, 16]. Very often, these
materials do not possess the surface properties needed to form bonded
parts. For these reasons, surface modification techniques are used
which can improve the adhesion properties of composite materials to
such an extent that failure should be cohesive (failure within the
adhesive or substrate) rather than adhesive (failure at the interface).
Surface modification improves the bond performance by introducing the
polar functional groups onto the surface which ultimately react with the
adhesive to form strong bonds [17]. Also, surface modification imparts
roughness which resulted in increased mechanical interlocking and
hence increased bond strength [17].
6.2. Selection of the surface treatment
Various surface treatment methods are used to improve the surface
energy of polymer based composite materials. Typical composite
surface treatments include traditional abrasion and solvent cleaning,
acid etching, grit blasting, peel-ply, corona discharge treatment,
Vacuum plasma and atmospheric pressure plasma treatment (APPT).
These treatments increased the adhesion properties by changing the
surface chemistry or surface morphology of composite materials. Each
of these treatment methods has its own advantages and drawbacks.
Detail about these surface treatment methods is given in the previous
studies [17, 18]. Due to the environmental hazards of chemical
treatment methods, dry surface treatments like corona and plasma
treatment are the most commonly used methods. Plasma treatment not
only transforms the inherent surface chemistry to improve wetting
characteristic of polymer but also increases the surface roughness at
the same time [19, 20]. The objective of present work is to study the
affect of plasma treatment on the adhesion properties of two aerospace
grade epoxy based carbon fiber composites. Other objective of this
work is to optimize the bonding process of high performance
polybenzimidazole (PBI) and to evaluate its performance under
different environmental conditions. A detail of plasma treatment is
presented in the following section followed by the experimental detail of
adhesive bonding process of PBI.
Performance Evaluation of PBI as an Adhesive for Aerospace Applications
110
6.2.1. Atmospheric Pressure Plasma Treatment (APPT)
Atmospheric pressure Plasma treatment (APPT) has become a very
popular treatment for small to medium size parts. APPT introduce polar
chemical groups onto the surface which further react with the adhesive
to form strong bonds [18, 20]. Another important aspect of using APPT
is the increased surface roughness of the treated samples. In one of
our previous studies on PPS/glass fiber bonded joints, it was
highlighted that plasma treatment increased the surface roughness of
these materials [21]. However, the reason of this increase in surface
roughness was not known. According to author’s knowledge, the only
recent study about the plasma treatment of Poly(methyl methacrylate)
has pointed out that increased surface roughness and formation of the
cracks on the surface of plasma treated samples was due to the
increase in surface temperature to above 200oC [22]. This high
temperature could result in local melting of the exposed resin on the
surface. The rapid heating and cooling in the air could generate the
residual stresses in the treated samples which ultimately lead towards
crack formation and increased surface roughness. The high
temperature can also degrade the mechanical properties of the
composite material itself [23]. Despite this fact, still the APPT can be an
important tool to treat different composite surfaces. In the context of
above discussion, it was decided to study the effect of APPT on surface
energy and surface morphology of two aerospace grade epoxy based
composite. Surfaces of these materials were also prepared using hand
sanding. The objective was to compare the surface morphology and
adhesion properties of these materials after having different surface
treatments. Bonded joints of these materials were formed using PBI
adhesive.
6.3. Experimental
6.3.1. Materials
26% concentrated solution of PBI in Dimethyleacetamide (DMAc) was
supplied by CELAZOLE, PBI performance products. M21 and DT120
epoxy based Unidirectional (UD) carbon fiber prepregs were supplied by
Hexcel and Delta Tech respectively. In the following sections, these
composites will be named as M21/carbon composite and DT120/carbon
composite. Composite laminates were prepared by stacking up a
number of pre-impregnated layers to achieve a cured laminate
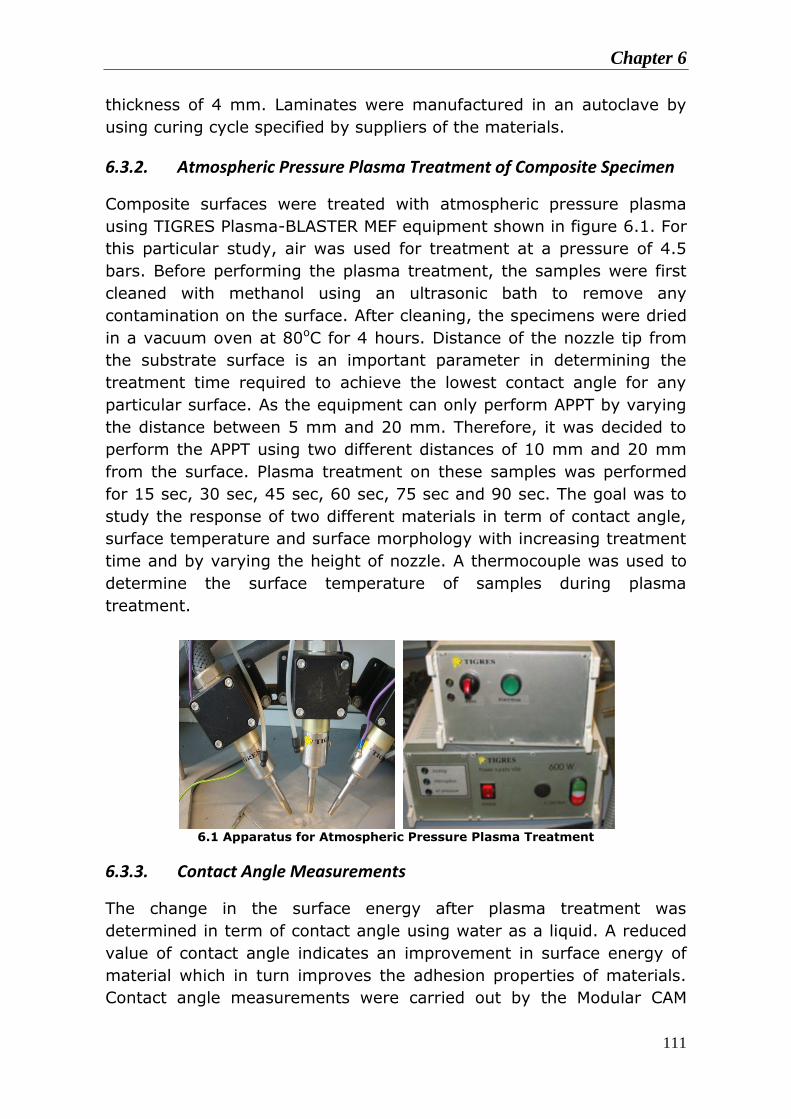
Chapter 6
111
thickness of 4 mm. Laminates were manufactured in an autoclave by
using curing cycle specified by suppliers of the materials.
6.3.2. Atmospheric Pressure Plasma Treatment of Composite Specimen
Composite surfaces were treated with atmospheric pressure plasma
using TIGRES Plasma-BLASTER MEF equipment shown in figure 6.1. For
this particular study, air was used for treatment at a pressure of 4.5
bars. Before performing the plasma treatment, the samples were first
cleaned with methanol using an ultrasonic bath to remove any
contamination on the surface. After cleaning, the specimens were dried
in a vacuum oven at 80oC for 4 hours. Distance of the nozzle tip from
the substrate surface is an important parameter in determining the
treatment time required to achieve the lowest contact angle for any
particular surface. As the equipment can only perform APPT by varying
the distance between 5 mm and 20 mm. Therefore, it was decided to
perform the APPT using two different distances of 10 mm and 20 mm
from the surface. Plasma treatment on these samples was performed
for 15 sec, 30 sec, 45 sec, 60 sec, 75 sec and 90 sec. The goal was to
study the response of two different materials in term of contact angle,
surface temperature and surface morphology with increasing treatment
time and by varying the height of nozzle. A thermocouple was used to
determine the surface temperature of samples during plasma
treatment.
6.1 Apparatus for Atmospheric Pressure Plasma Treatment
6.3.3. Contact Angle Measurements
The change in the surface energy after plasma treatment was
determined in term of contact angle using water as a liquid. A reduced
value of contact angle indicates an improvement in surface energy of
material which in turn improves the adhesion properties of materials.
Contact angle measurements were carried out by the Modular CAM
Performance Evaluation of PBI as an Adhesive for Aerospace Applications
112
200–Optical Contact Angle and Surface Tension Meter from KSV
Instruments.
6.3.4. Specimen Preparation for Lap Shear Testing
PBI adhesive bonded joints of M21/carbon composite and
DT120/carbon composite were prepared after performing APPT. Bonded
joints of these materials were also prepared after treating the surface
using hand sanding. The purpose was to compare the effect of two
different treatment methods on lap shear strength of bonded joints.
Specimens for lap shear testing were cut to the dimensions of (100 x
25 x 4) mm3 and they were adhesively bonded for single lap shear
tensile tests. Prior to the preparation of an adhesive joint, degassing of
the adhesive was carried out for 10 min. The lap shear tensile
specimens were prepared by applying PBI adhesive. Pressure was
applied to the lap joint during the curing cycle by two standard clips.
Bonded joints were formed using different curing temperature for PBI
adhesive in order to attain an optimum joint strength.
6.3.5. Environmental Conditioning of Specimens
Bonded joints of both types of composite materials were prepared for
environmental conditioning. The purpose was to evaluate the influence
of temperature and humidity on the bonded joint strength. Joints were
conditioned for 1000 hours at 80oC and 95% relative humidity. The
bonded joints were removed from the climate chamber after 1000
hours and immediately tested for lap shear strength. PBI adhesive
bonded joints of M21/carbon composite and DT120/carbon composite
were also formed to perform the lap shear testing at 80oC. The purpose
was to evaluate the performance of PBI at high temperature.
6.3.6. Specimen Preparation for Lap Shear Testing
A summary of the specimens prepared for lap shear testing during this
study is given below. Lap shear testing was carried out at ambient
conditions unless mentioned otherwise.
a. Bonded joints of M21 and DT120 epoxy based carbon fiber
composite specimens with untreated surfaces
b. Composite bonded joints with a surface preparation using
atmospheric pressure plasma treatment (APPT) prior to bonding
Chapter 6
113
c. Composite bonded joints with a surface preparation using hand
sanding prior to bonding
d. Composite bonded joints with a surface preparation using both
atmospheric pressure plasma treatment and hand sanding prior
to bonding (hand sanding followed by APPT)
e. Composite bonded joints with a surface preparation using
atmospheric pressure plasma treatment prior to bonding followed
by environmental conditioning for 1000 hours at 80oC and 95%
relative humidity
f. Composite bonded joints with a surface preparation using
atmospheric pressure plasma treatment prior to bonding followed
by lap shear testing at 80oC
Lap shear tests were carried out using a computer-controlled ZWICK
tensile testing machine using a load cell of 50 KN. The samples were
loaded in tension at a test speed of 5 mm/min at room temperature.
Five specimens were used for each condition for reproducibility of the
results.
6.3.7. Scanning Electron Microscopy (SEM)
Scanning electron microscopy was carried out to study the surface
topography of samples prior to and after surface treatment. SEM
analysis was also performed to study the fractured surfaces in order to
determine the failure modes after lap shear testing. Images were
obtained using JOEL 7500 field emission scanning electron microscope
(FE-SEM). Surface of each sample was gold sputtered to minimize
sample charging effects.
6.4. Results and Discussion
6.4.1. Atmospheric Pressure Plasma Treatment
Atmospheric pressure plasma treatment (APPT) was performed on
M21/carbon fiber composite and DT120/carbon fiber composite. A
recent study conducted on plasma treatment of polymer based
composite have revealed that during APPT, surface temperature raised
to above 200oC [22]. However, the effect of this increase in surface
temperature on surface topography and surface energy of polymeric
based materials has not been included. Therefore, one of the objectives
of this work is to perform a sequential study to determine the thermal
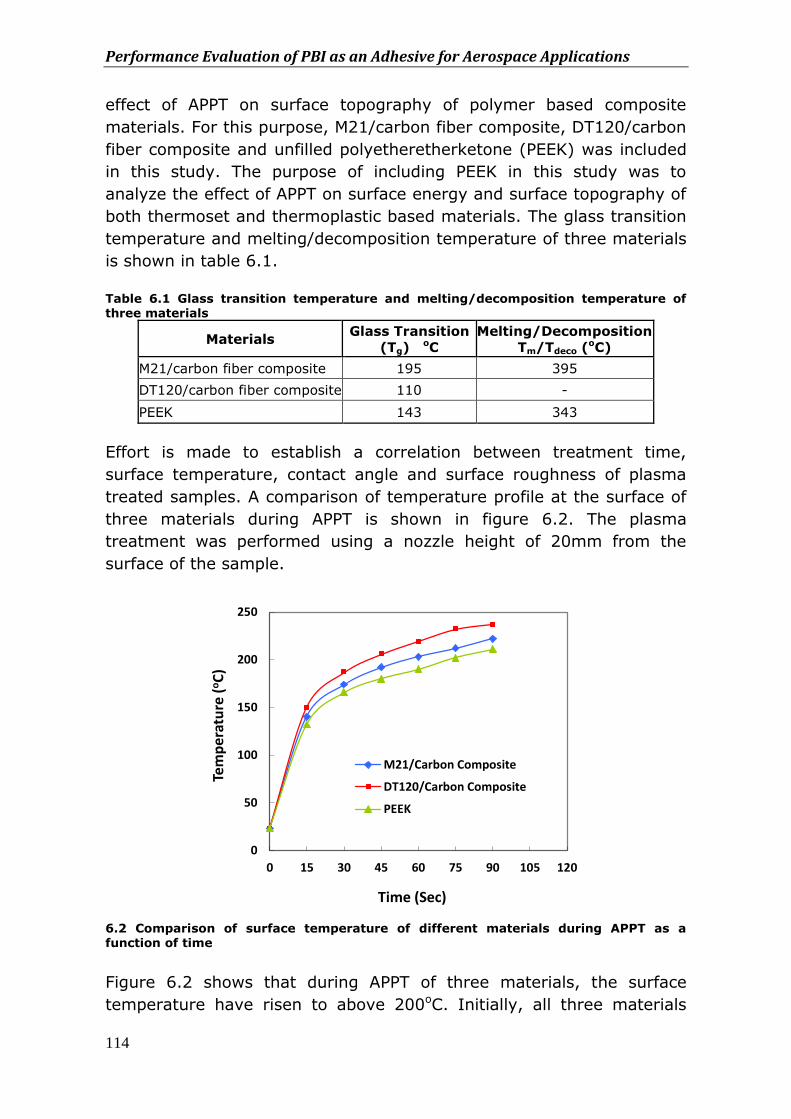
Performance Evaluation of PBI as an Adhesive for Aerospace Applications
114
effect of APPT on surface topography of polymer based composite
materials. For this purpose, M21/carbon fiber composite, DT120/carbon
fiber composite and unfilled polyetheretherketone (PEEK) was included
in this study. The purpose of including PEEK in this study was to
analyze the effect of APPT on surface energy and surface topography of
both thermoset and thermoplastic based materials. The glass transition
temperature and melting/decomposition temperature of three materials
is shown in table 6.1.
Table 6.1 Glass transition temperature and melting/decomposition temperature of three materials
Materials Glass Transition
(Tg) oC
Melting/Decomposition
Tm/Tdeco (oC)
M21/carbon fiber composite 195 395
DT120/carbon fiber composite 110 -
PEEK 143 343
Effort is made to establish a correlation between treatment time,
surface temperature, contact angle and surface roughness of plasma
treated samples. A comparison of temperature profile at the surface of
three materials during APPT is shown in figure 6.2. The plasma
treatment was performed using a nozzle height of 20mm from the
surface of the sample.
6.2 Comparison of surface temperature of different materials during APPT as a function of time
Figure 6.2 shows that during APPT of three materials, the surface
temperature have risen to above 200oC. Initially, all three materials
0
50
100
150
200
250
0 15 30 45 60 75 90 105 120
Tem
per
atu
re (
oC
)
Time (Sec)
M21/Carbon Composite
DT120/Carbon Composite
PEEK
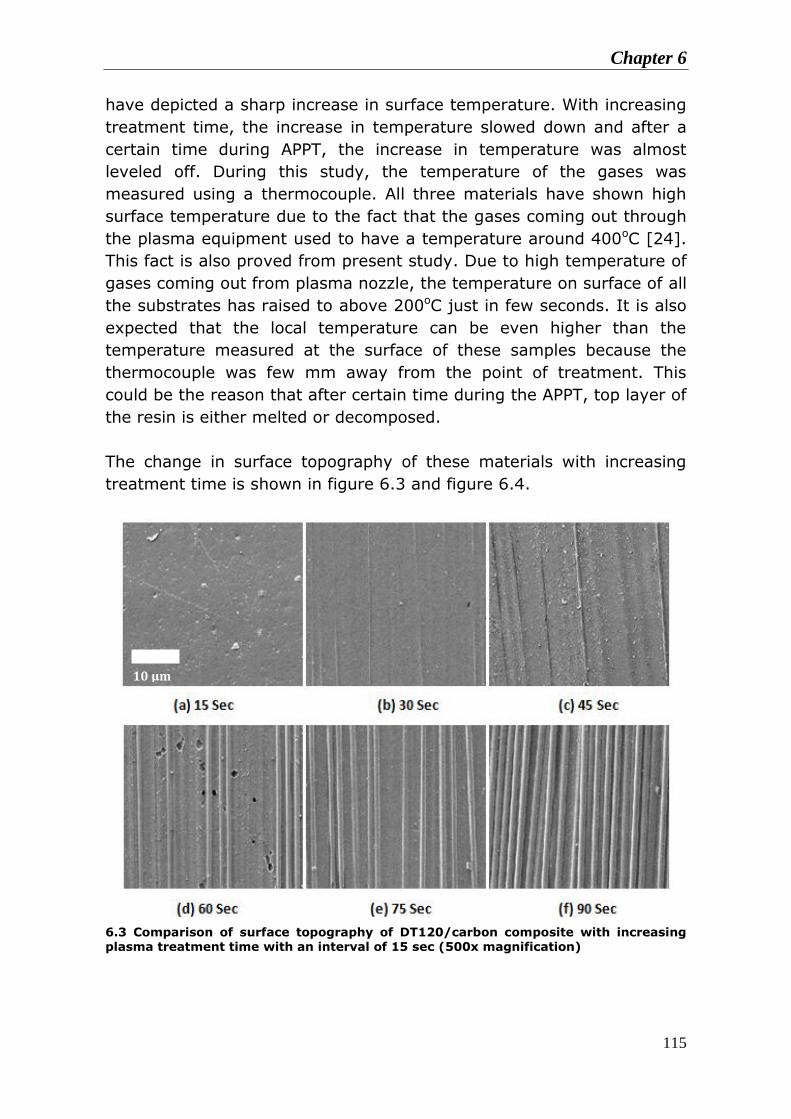
Chapter 6
115
have depicted a sharp increase in surface temperature. With increasing
treatment time, the increase in temperature slowed down and after a
certain time during APPT, the increase in temperature was almost
leveled off. During this study, the temperature of the gases was
measured using a thermocouple. All three materials have shown high
surface temperature due to the fact that the gases coming out through
the plasma equipment used to have a temperature around 400oC [24].
This fact is also proved from present study. Due to high temperature of
gases coming out from plasma nozzle, the temperature on surface of all
the substrates has raised to above 200oC just in few seconds. It is also
expected that the local temperature can be even higher than the
temperature measured at the surface of these samples because the
thermocouple was few mm away from the point of treatment. This
could be the reason that after certain time during the APPT, top layer of
the resin is either melted or decomposed.
The change in surface topography of these materials with increasing
treatment time is shown in figure 6.3 and figure 6.4.
6.3 Comparison of surface topography of DT120/carbon composite with increasing plasma treatment time with an interval of 15 sec (500x magnification)
100 μm 10 μm
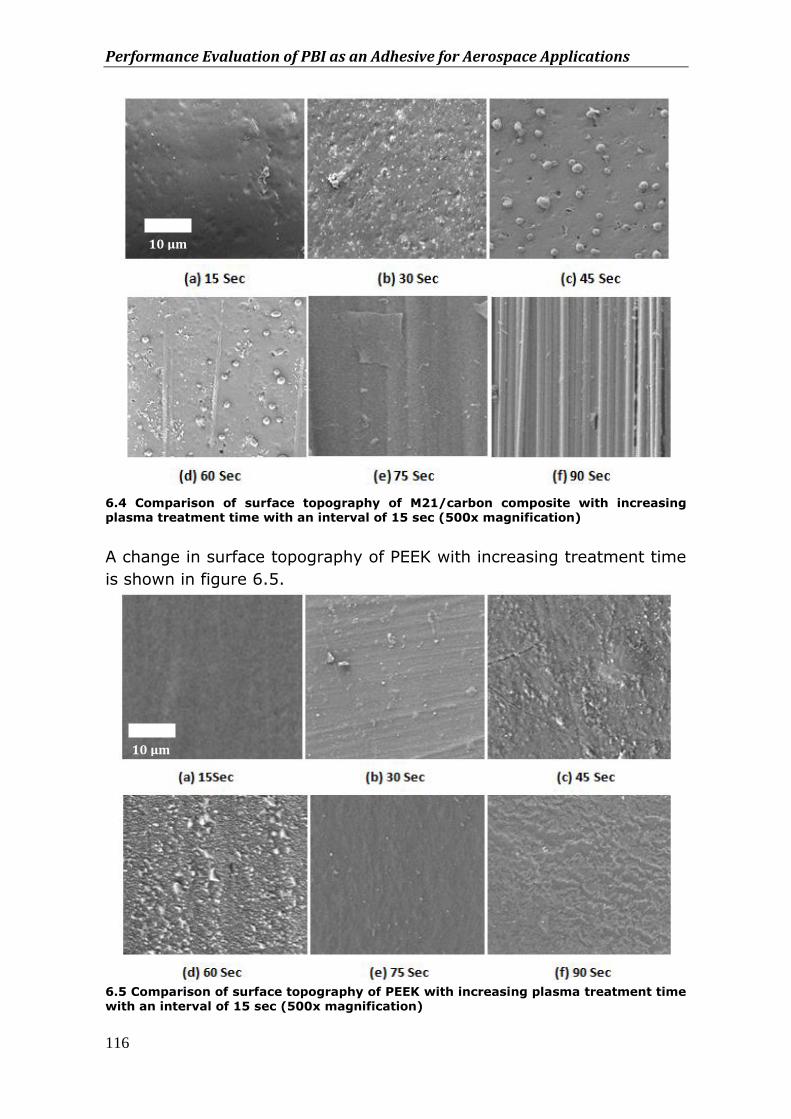
Performance Evaluation of PBI as an Adhesive for Aerospace Applications
116
6.4 Comparison of surface topography of M21/carbon composite with increasing plasma treatment time with an interval of 15 sec (500x magnification)
A change in surface topography of PEEK with increasing treatment time
is shown in figure 6.5.
6.5 Comparison of surface topography of PEEK with increasing plasma treatment time with an interval of 15 sec (500x magnification)
100 μm 10 μm
10 μm
100 μm
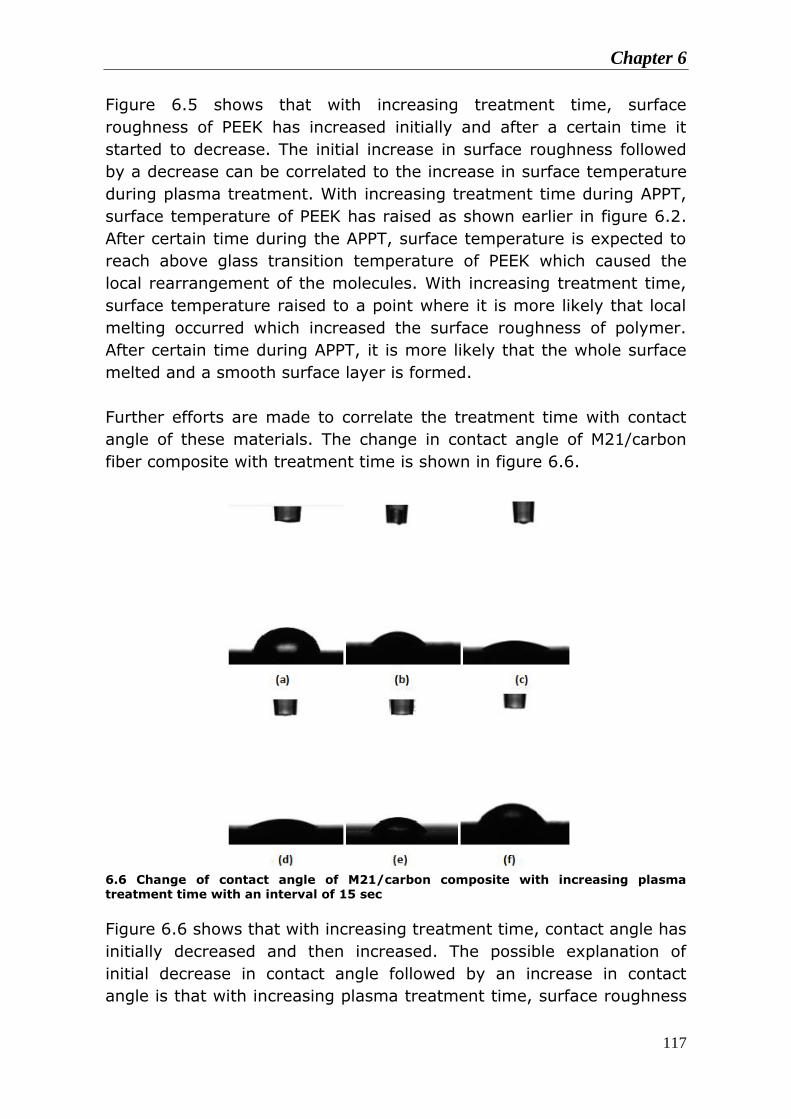
Chapter 6
117
Figure 6.5 shows that with increasing treatment time, surface
roughness of PEEK has increased initially and after a certain time it
started to decrease. The initial increase in surface roughness followed
by a decrease can be correlated to the increase in surface temperature
during plasma treatment. With increasing treatment time during APPT,
surface temperature of PEEK has raised as shown earlier in figure 6.2.
After certain time during the APPT, surface temperature is expected to
reach above glass transition temperature of PEEK which caused the
local rearrangement of the molecules. With increasing treatment time,
surface temperature raised to a point where it is more likely that local
melting occurred which increased the surface roughness of polymer.
After certain time during APPT, it is more likely that the whole surface
melted and a smooth surface layer is formed.
Further efforts are made to correlate the treatment time with contact
angle of these materials. The change in contact angle of M21/carbon
fiber composite with treatment time is shown in figure 6.6.
6.6 Change of contact angle of M21/carbon composite with increasing plasma treatment time with an interval of 15 sec
Figure 6.6 shows that with increasing treatment time, contact angle has
initially decreased and then increased. The possible explanation of
initial decrease in contact angle followed by an increase in contact
angle is that with increasing plasma treatment time, surface roughness
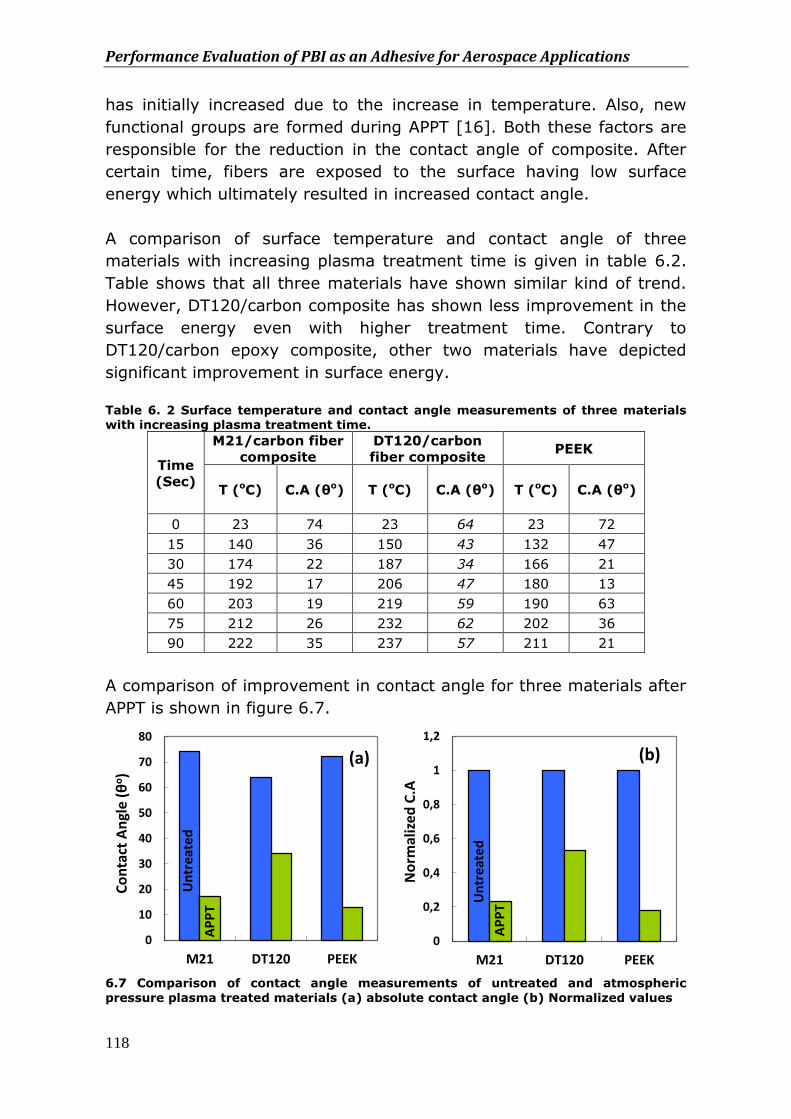
Performance Evaluation of PBI as an Adhesive for Aerospace Applications
118
has initially increased due to the increase in temperature. Also, new
functional groups are formed during APPT [16]. Both these factors are
responsible for the reduction in the contact angle of composite. After
certain time, fibers are exposed to the surface having low surface
energy which ultimately resulted in increased contact angle.
A comparison of surface temperature and contact angle of three
materials with increasing plasma treatment time is given in table 6.2.
Table shows that all three materials have shown similar kind of trend.
However, DT120/carbon composite has shown less improvement in the
surface energy even with higher treatment time. Contrary to
DT120/carbon epoxy composite, other two materials have depicted
significant improvement in surface energy.
Table 6. 2 Surface temperature and contact angle measurements of three materials with increasing plasma treatment time.
Time
(Sec)
M21/carbon fiber
composite
DT120/carbon
fiber composite PEEK
T (oC)
C.A (θo)
T (oC)
C.A (θo)
T (oC)
C.A (θo)
0 23 74 23 64 23 72
15 140 36 150 43 132 47
30 174 22 187 34 166 21
45 192 17 206 47 180 13
60 203 19 219 59 190 63
75 212 26 232 62 202 36
90 222 35 237 57 211 21
A comparison of improvement in contact angle for three materials after
APPT is shown in figure 6.7.
6.7 Comparison of contact angle measurements of untreated and atmospheric
pressure plasma treated materials (a) absolute contact angle (b) Normalized values
Un
trea
ted
AP
PT
0
10
20
30
40
50
60
70
80
M21 DT120 PEEK
Co
nta
ct A
ngl
e (θ
o)
(a)
Un
trea
ted
AP
PT
0
0,2
0,4
0,6
0,8
1
1,2
M21 DT120 PEEK
No
rmal
ized
C.A
(b)
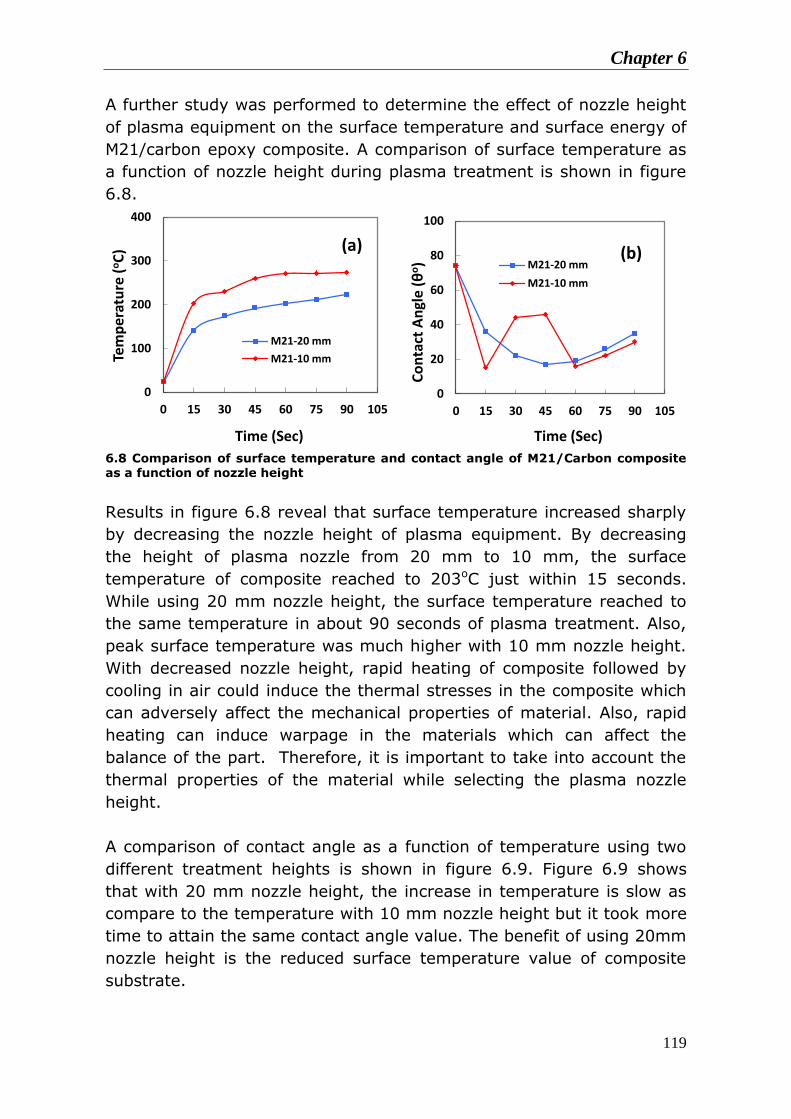
Chapter 6
119
A further study was performed to determine the effect of nozzle height
of plasma equipment on the surface temperature and surface energy of
M21/carbon epoxy composite. A comparison of surface temperature as
a function of nozzle height during plasma treatment is shown in figure
6.8.
6.8 Comparison of surface temperature and contact angle of M21/Carbon composite as a function of nozzle height
Results in figure 6.8 reveal that surface temperature increased sharply
by decreasing the nozzle height of plasma equipment. By decreasing
the height of plasma nozzle from 20 mm to 10 mm, the surface
temperature of composite reached to 203oC just within 15 seconds.
While using 20 mm nozzle height, the surface temperature reached to
the same temperature in about 90 seconds of plasma treatment. Also,
peak surface temperature was much higher with 10 mm nozzle height.
With decreased nozzle height, rapid heating of composite followed by
cooling in air could induce the thermal stresses in the composite which
can adversely affect the mechanical properties of material. Also, rapid
heating can induce warpage in the materials which can affect the
balance of the part. Therefore, it is important to take into account the
thermal properties of the material while selecting the plasma nozzle
height.
A comparison of contact angle as a function of temperature using two
different treatment heights is shown in figure 6.9. Figure 6.9 shows
that with 20 mm nozzle height, the increase in temperature is slow as
compare to the temperature with 10 mm nozzle height but it took more
time to attain the same contact angle value. The benefit of using 20mm
nozzle height is the reduced surface temperature value of composite
substrate.
0
100
200
300
400
0 15 30 45 60 75 90 105
Tem
per
atu
re (
oC
)
Time (Sec)
M21-20 mm
M21-10 mm
(a)
0
20
40
60
80
100
0 15 30 45 60 75 90 105C
on
tact
An
gle
(θo)
Time (Sec)
M21-20 mm
M21-10 mm
(b)
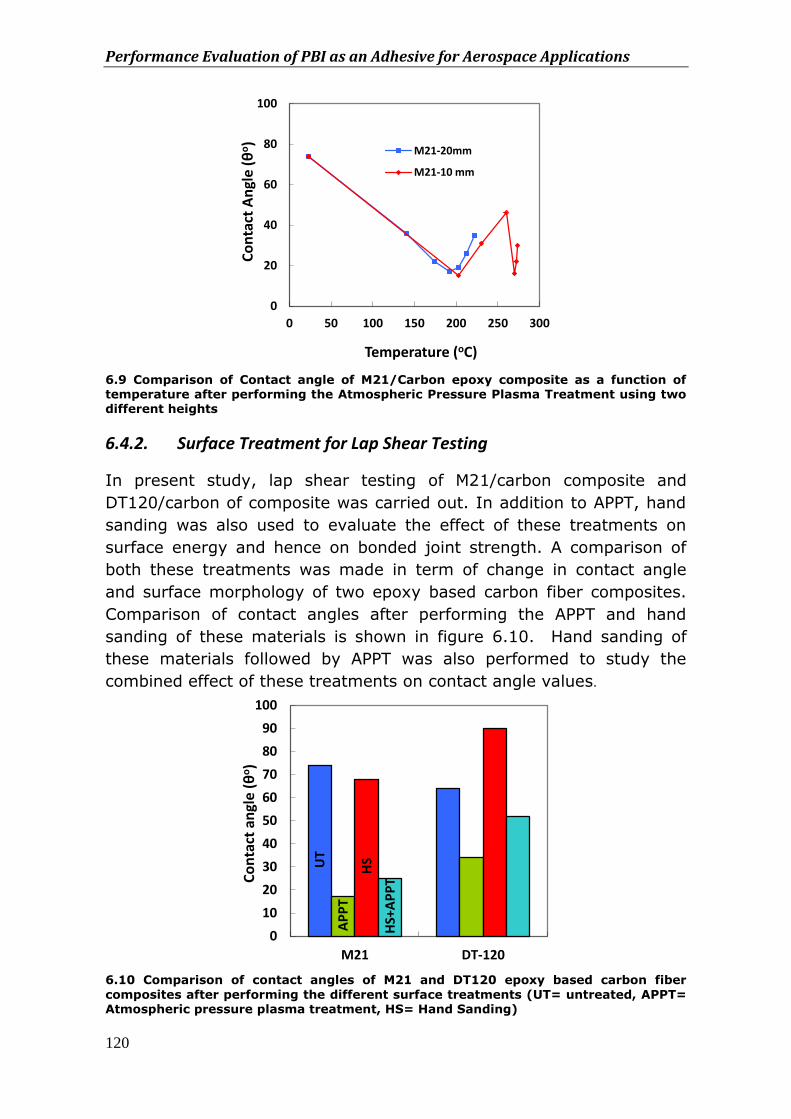
Performance Evaluation of PBI as an Adhesive for Aerospace Applications
120
6.9 Comparison of Contact angle of M21/Carbon epoxy composite as a function of temperature after performing the Atmospheric Pressure Plasma Treatment using two different heights
6.4.2. Surface Treatment for Lap Shear Testing
In present study, lap shear testing of M21/carbon composite and
DT120/carbon of composite was carried out. In addition to APPT, hand
sanding was also used to evaluate the effect of these treatments on
surface energy and hence on bonded joint strength. A comparison of
both these treatments was made in term of change in contact angle
and surface morphology of two epoxy based carbon fiber composites.
Comparison of contact angles after performing the APPT and hand
sanding of these materials is shown in figure 6.10. Hand sanding of
these materials followed by APPT was also performed to study the
combined effect of these treatments on contact angle values.
6.10 Comparison of contact angles of M21 and DT120 epoxy based carbon fiber
composites after performing the different surface treatments (UT= untreated, APPT= Atmospheric pressure plasma treatment, HS= Hand Sanding)
0
20
40
60
80
100
0 50 100 150 200 250 300
Co
nta
ct A
ngl
e (θ
o)
Temperature (oC)
M21-20mm
M21-10 mm
UT
AP
PT
HS
HS+
AP
PT
0
10
20
30
40
50
60
70
80
90
100
M21 DT-120
Co
nta
ct a
ngl
e (θ
o)
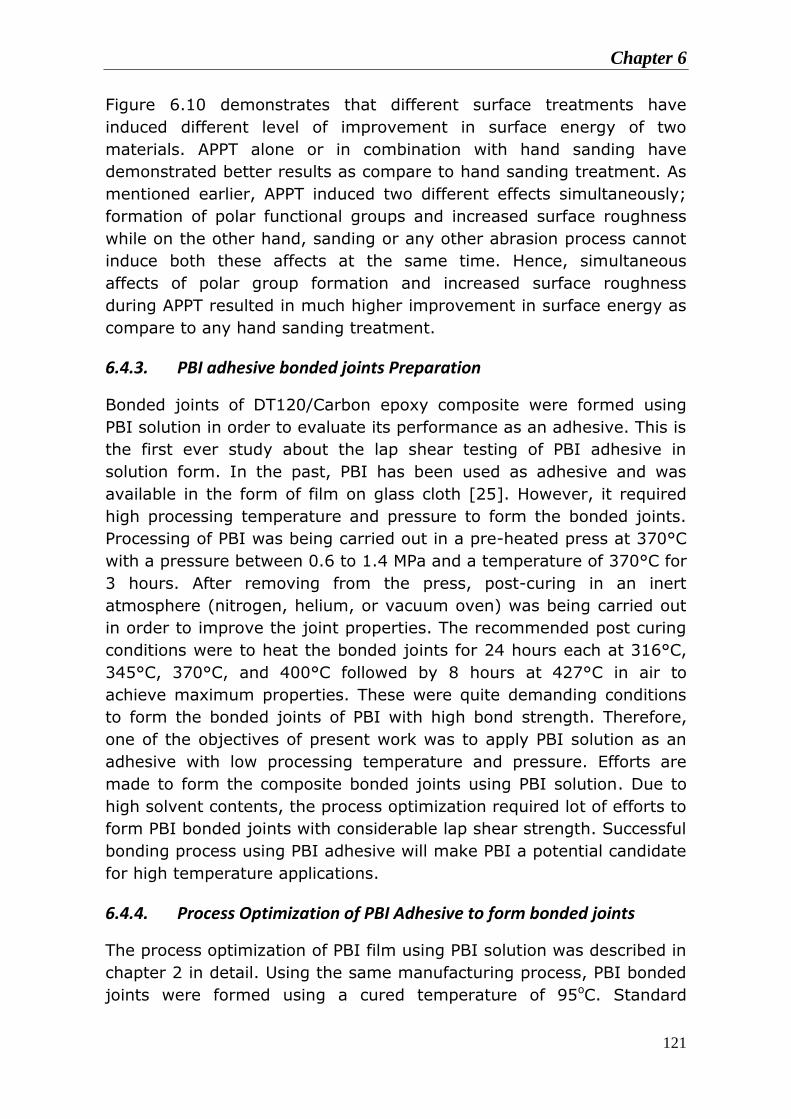
Chapter 6
121
Figure 6.10 demonstrates that different surface treatments have
induced different level of improvement in surface energy of two
materials. APPT alone or in combination with hand sanding have
demonstrated better results as compare to hand sanding treatment. As
mentioned earlier, APPT induced two different effects simultaneously;
formation of polar functional groups and increased surface roughness
while on the other hand, sanding or any other abrasion process cannot
induce both these affects at the same time. Hence, simultaneous
affects of polar group formation and increased surface roughness
during APPT resulted in much higher improvement in surface energy as
compare to any hand sanding treatment.
6.4.3. PBI adhesive bonded joints Preparation
Bonded joints of DT120/Carbon epoxy composite were formed using
PBI solution in order to evaluate its performance as an adhesive. This is
the first ever study about the lap shear testing of PBI adhesive in
solution form. In the past, PBI has been used as adhesive and was
available in the form of film on glass cloth [25]. However, it required
high processing temperature and pressure to form the bonded joints.
Processing of PBI was being carried out in a pre-heated press at 370°C
with a pressure between 0.6 to 1.4 MPa and a temperature of 370°C for
3 hours. After removing from the press, post-curing in an inert
atmosphere (nitrogen, helium, or vacuum oven) was being carried out
in order to improve the joint properties. The recommended post curing
conditions were to heat the bonded joints for 24 hours each at 316°C,
345°C, 370°C, and 400°C followed by 8 hours at 427°C in air to
achieve maximum properties. These were quite demanding conditions
to form the bonded joints of PBI with high bond strength. Therefore,
one of the objectives of present work was to apply PBI solution as an
adhesive with low processing temperature and pressure. Efforts are
made to form the composite bonded joints using PBI solution. Due to
high solvent contents, the process optimization required lot of efforts to
form PBI bonded joints with considerable lap shear strength. Successful
bonding process using PBI adhesive will make PBI a potential candidate
for high temperature applications.
6.4.4. Process Optimization of PBI Adhesive to form bonded joints
The process optimization of PBI film using PBI solution was described in
chapter 2 in detail. Using the same manufacturing process, PBI bonded
joints were formed using a cured temperature of 95oC. Standard
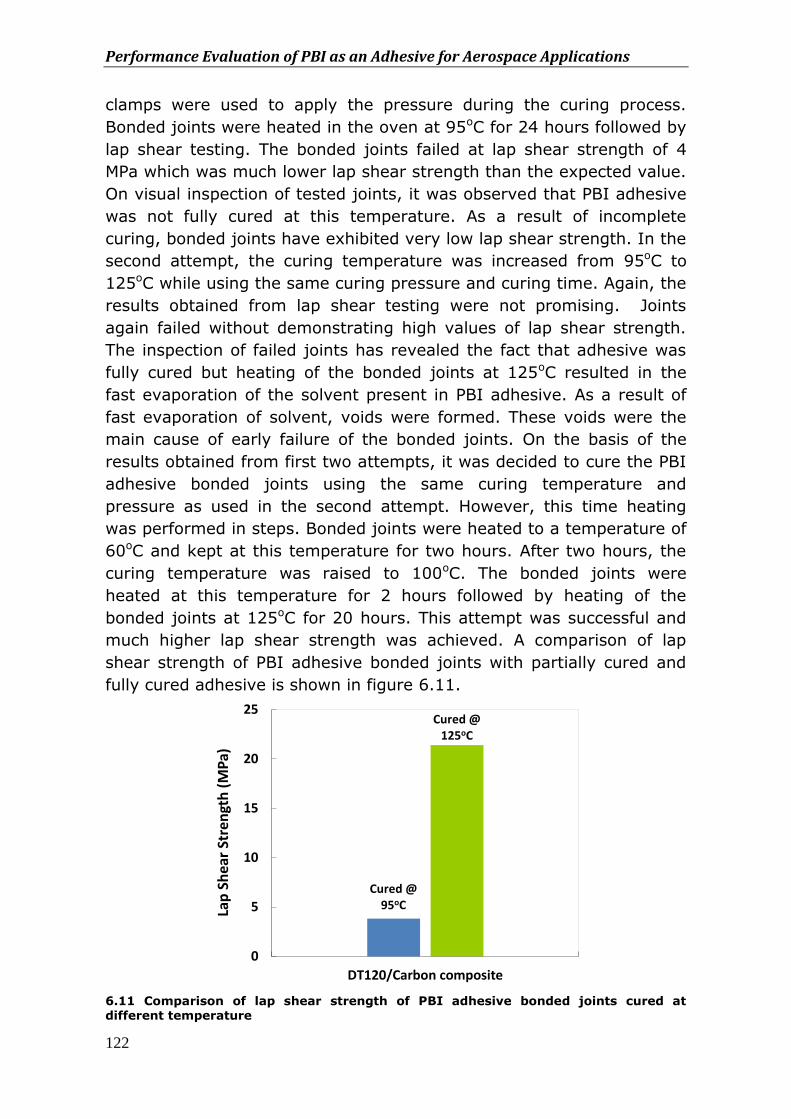
Performance Evaluation of PBI as an Adhesive for Aerospace Applications
122
clamps were used to apply the pressure during the curing process.
Bonded joints were heated in the oven at 95oC for 24 hours followed by
lap shear testing. The bonded joints failed at lap shear strength of 4
MPa which was much lower lap shear strength than the expected value.
On visual inspection of tested joints, it was observed that PBI adhesive
was not fully cured at this temperature. As a result of incomplete
curing, bonded joints have exhibited very low lap shear strength. In the
second attempt, the curing temperature was increased from 95oC to
125oC while using the same curing pressure and curing time. Again, the
results obtained from lap shear testing were not promising. Joints
again failed without demonstrating high values of lap shear strength.
The inspection of failed joints has revealed the fact that adhesive was
fully cured but heating of the bonded joints at 125oC resulted in the
fast evaporation of the solvent present in PBI adhesive. As a result of
fast evaporation of solvent, voids were formed. These voids were the
main cause of early failure of the bonded joints. On the basis of the
results obtained from first two attempts, it was decided to cure the PBI
adhesive bonded joints using the same curing temperature and
pressure as used in the second attempt. However, this time heating
was performed in steps. Bonded joints were heated to a temperature of
60oC and kept at this temperature for two hours. After two hours, the
curing temperature was raised to 100oC. The bonded joints were
heated at this temperature for 2 hours followed by heating of the
bonded joints at 125oC for 20 hours. This attempt was successful and
much higher lap shear strength was achieved. A comparison of lap
shear strength of PBI adhesive bonded joints with partially cured and
fully cured adhesive is shown in figure 6.11.
6.11 Comparison of lap shear strength of PBI adhesive bonded joints cured at different temperature
Cured @ 95oC
Cured @ 125oC
0
5
10
15
20
25
DT120/Carbon composite
Lap
Sh
ear
Stre
ngt
h (
MP
a)
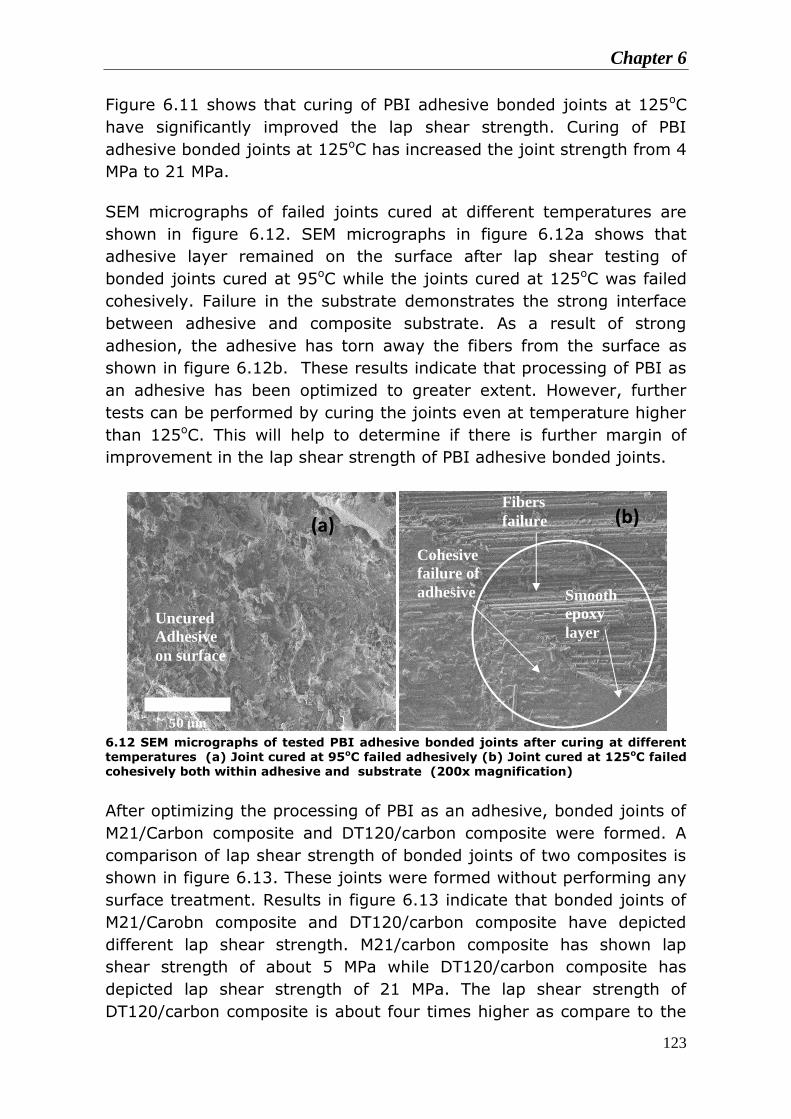
Chapter 6
123
Figure 6.11 shows that curing of PBI adhesive bonded joints at 125oC
have significantly improved the lap shear strength. Curing of PBI
adhesive bonded joints at 125oC has increased the joint strength from 4
MPa to 21 MPa.
SEM micrographs of failed joints cured at different temperatures are
shown in figure 6.12. SEM micrographs in figure 6.12a shows that
adhesive layer remained on the surface after lap shear testing of
bonded joints cured at 95oC while the joints cured at 125oC was failed
cohesively. Failure in the substrate demonstrates the strong interface
between adhesive and composite substrate. As a result of strong
adhesion, the adhesive has torn away the fibers from the surface as
shown in figure 6.12b. These results indicate that processing of PBI as
an adhesive has been optimized to greater extent. However, further
tests can be performed by curing the joints even at temperature higher
than 125oC. This will help to determine if there is further margin of
improvement in the lap shear strength of PBI adhesive bonded joints.
6.12 SEM micrographs of tested PBI adhesive bonded joints after curing at different temperatures (a) Joint cured at 95oC failed adhesively (b) Joint cured at 125oC failed cohesively both within adhesive and substrate (200x magnification)
After optimizing the processing of PBI as an adhesive, bonded joints of
M21/Carbon composite and DT120/carbon composite were formed. A
comparison of lap shear strength of bonded joints of two composites is
shown in figure 6.13. These joints were formed without performing any
surface treatment. Results in figure 6.13 indicate that bonded joints of
M21/Carobn composite and DT120/carbon composite have depicted
different lap shear strength. M21/carbon composite has shown lap
shear strength of about 5 MPa while DT120/carbon composite has
depicted lap shear strength of 21 MPa. The lap shear strength of
DT120/carbon composite is about four times higher as compare to the
(b) (a)
Uncured
Adhesive
on surface
Cohesive
failure of
adhesive
Fibers
failure
Smooth
epoxy
layer
100 μm
50 μm
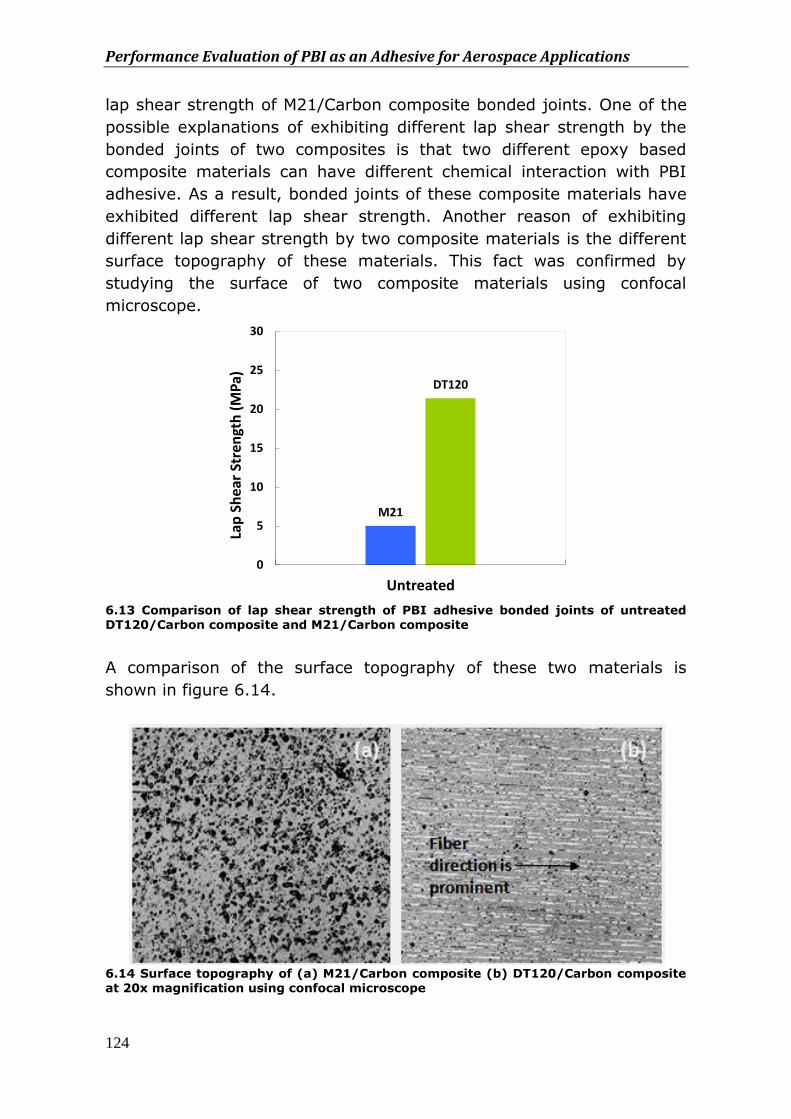
Performance Evaluation of PBI as an Adhesive for Aerospace Applications
124
lap shear strength of M21/Carbon composite bonded joints. One of the
possible explanations of exhibiting different lap shear strength by the
bonded joints of two composites is that two different epoxy based
composite materials can have different chemical interaction with PBI
adhesive. As a result, bonded joints of these composite materials have
exhibited different lap shear strength. Another reason of exhibiting
different lap shear strength by two composite materials is the different
surface topography of these materials. This fact was confirmed by
studying the surface of two composite materials using confocal
microscope.
6.13 Comparison of lap shear strength of PBI adhesive bonded joints of untreated DT120/Carbon composite and M21/Carbon composite
A comparison of the surface topography of these two materials is
shown in figure 6.14.
6.14 Surface topography of (a) M21/Carbon composite (b) DT120/Carbon composite at 20x magnification using confocal microscope
M21
DT120
0
5
10
15
20
25
30
Untreated
Lap
Sh
ear
Str
engt
h (
MP
a)
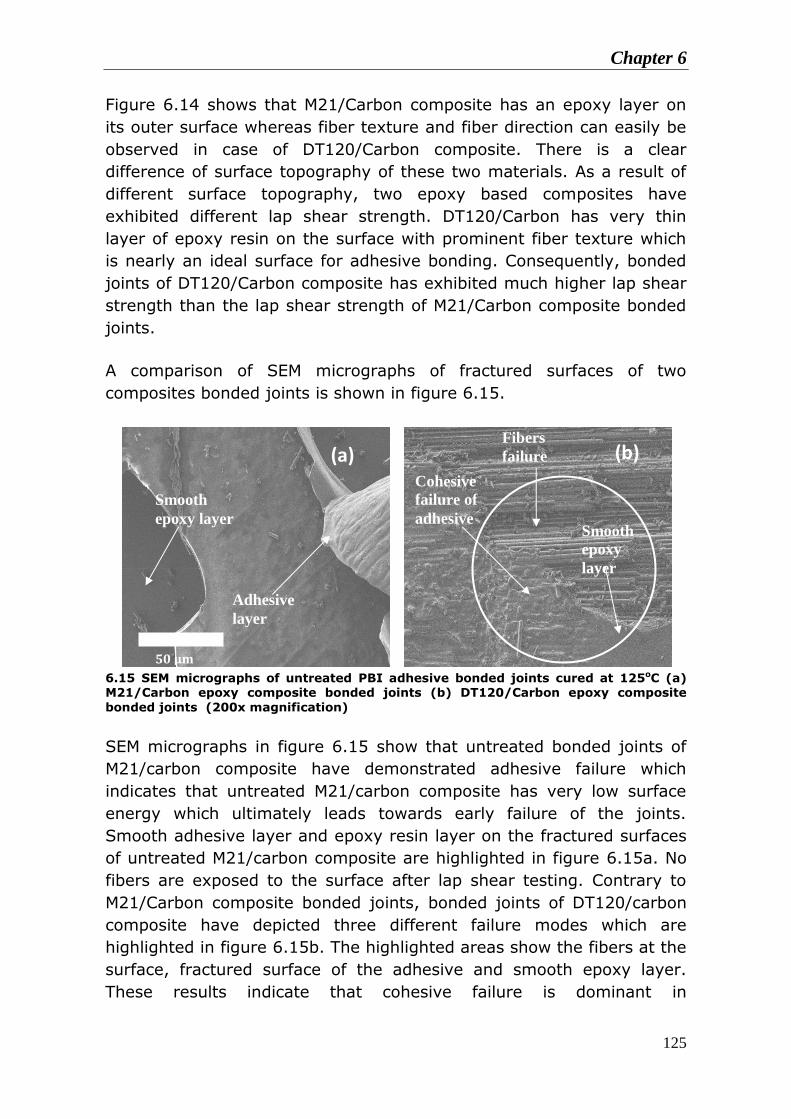
Chapter 6
125
Figure 6.14 shows that M21/Carbon composite has an epoxy layer on
its outer surface whereas fiber texture and fiber direction can easily be
observed in case of DT120/Carbon composite. There is a clear
difference of surface topography of these two materials. As a result of
different surface topography, two epoxy based composites have
exhibited different lap shear strength. DT120/Carbon has very thin
layer of epoxy resin on the surface with prominent fiber texture which
is nearly an ideal surface for adhesive bonding. Consequently, bonded
joints of DT120/Carbon composite has exhibited much higher lap shear
strength than the lap shear strength of M21/Carbon composite bonded
joints.
A comparison of SEM micrographs of fractured surfaces of two
composites bonded joints is shown in figure 6.15.
6.15 SEM micrographs of untreated PBI adhesive bonded joints cured at 125oC (a) M21/Carbon epoxy composite bonded joints (b) DT120/Carbon epoxy composite
bonded joints (200x magnification)
SEM micrographs in figure 6.15 show that untreated bonded joints of
M21/carbon composite have demonstrated adhesive failure which
indicates that untreated M21/carbon composite has very low surface
energy which ultimately leads towards early failure of the joints.
Smooth adhesive layer and epoxy resin layer on the fractured surfaces
of untreated M21/carbon composite are highlighted in figure 6.15a. No
fibers are exposed to the surface after lap shear testing. Contrary to
M21/Carbon composite bonded joints, bonded joints of DT120/carbon
composite have depicted three different failure modes which are
highlighted in figure 6.15b. The highlighted areas show the fibers at the
surface, fractured surface of the adhesive and smooth epoxy layer.
These results indicate that cohesive failure is dominant in
(b) (a)
Smooth
epoxy layer
Cohesive
failure of
adhesive
Fibers
failure
Smooth
epoxy
layer
Adhesive
layer
100 μm
50 μm
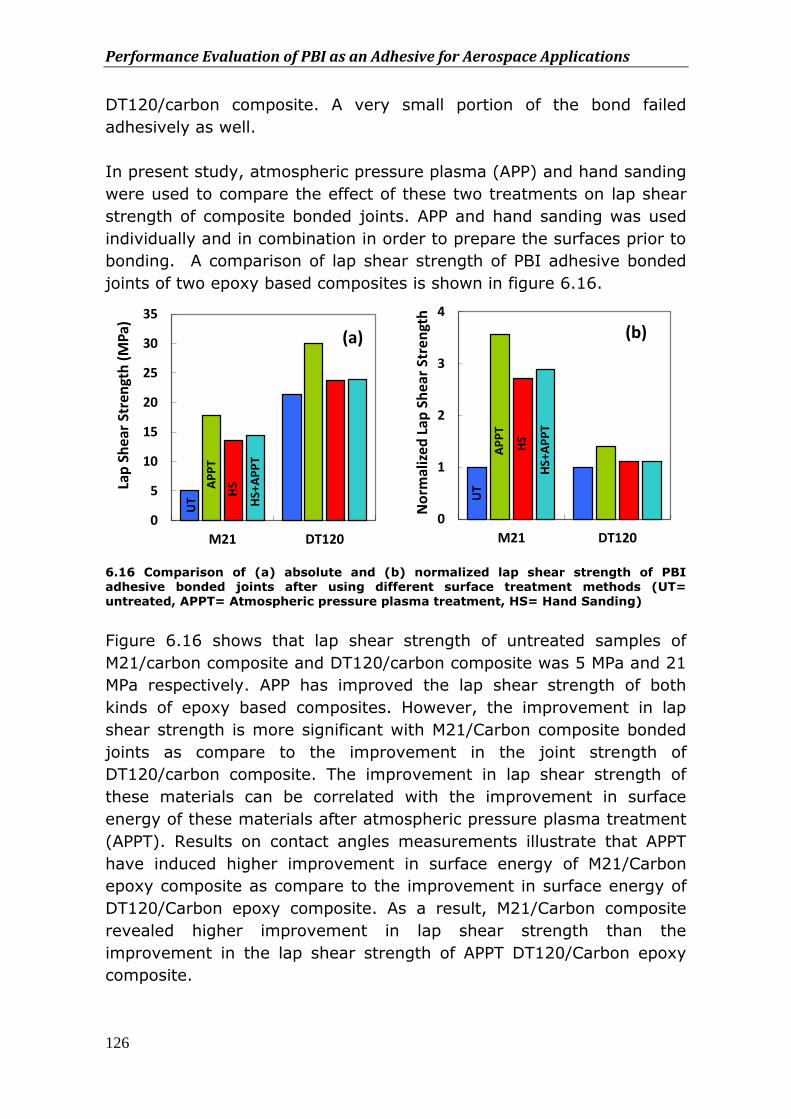
Performance Evaluation of PBI as an Adhesive for Aerospace Applications
126
DT120/carbon composite. A very small portion of the bond failed
adhesively as well.
In present study, atmospheric pressure plasma (APP) and hand sanding
were used to compare the effect of these two treatments on lap shear
strength of composite bonded joints. APP and hand sanding was used
individually and in combination in order to prepare the surfaces prior to
bonding. A comparison of lap shear strength of PBI adhesive bonded
joints of two epoxy based composites is shown in figure 6.16.
6.16 Comparison of (a) absolute and (b) normalized lap shear strength of PBI adhesive bonded joints after using different surface treatment methods (UT= untreated, APPT= Atmospheric pressure plasma treatment, HS= Hand Sanding)
Figure 6.16 shows that lap shear strength of untreated samples of
M21/carbon composite and DT120/carbon composite was 5 MPa and 21
MPa respectively. APP has improved the lap shear strength of both
kinds of epoxy based composites. However, the improvement in lap
shear strength is more significant with M21/Carbon composite bonded
joints as compare to the improvement in the joint strength of
DT120/carbon composite. The improvement in lap shear strength of
these materials can be correlated with the improvement in surface
energy of these materials after atmospheric pressure plasma treatment
(APPT). Results on contact angles measurements illustrate that APPT
have induced higher improvement in surface energy of M21/Carbon
epoxy composite as compare to the improvement in surface energy of
DT120/Carbon epoxy composite. As a result, M21/Carbon composite
revealed higher improvement in lap shear strength than the
improvement in the lap shear strength of APPT DT120/Carbon epoxy
composite.
UT
AP
PT
HS
HS+
AP
PT
0
5
10
15
20
25
30
35
M21 DT120
Lap
Sh
ear
Str
engt
h (
MP
a)
(a)
UT
AP
PT
HS
HS+
AP
PT
0
1
2
3
4
M21 DT120
No
rmal
ized
Lap
Sh
ear
Stre
ngt
h
(b)
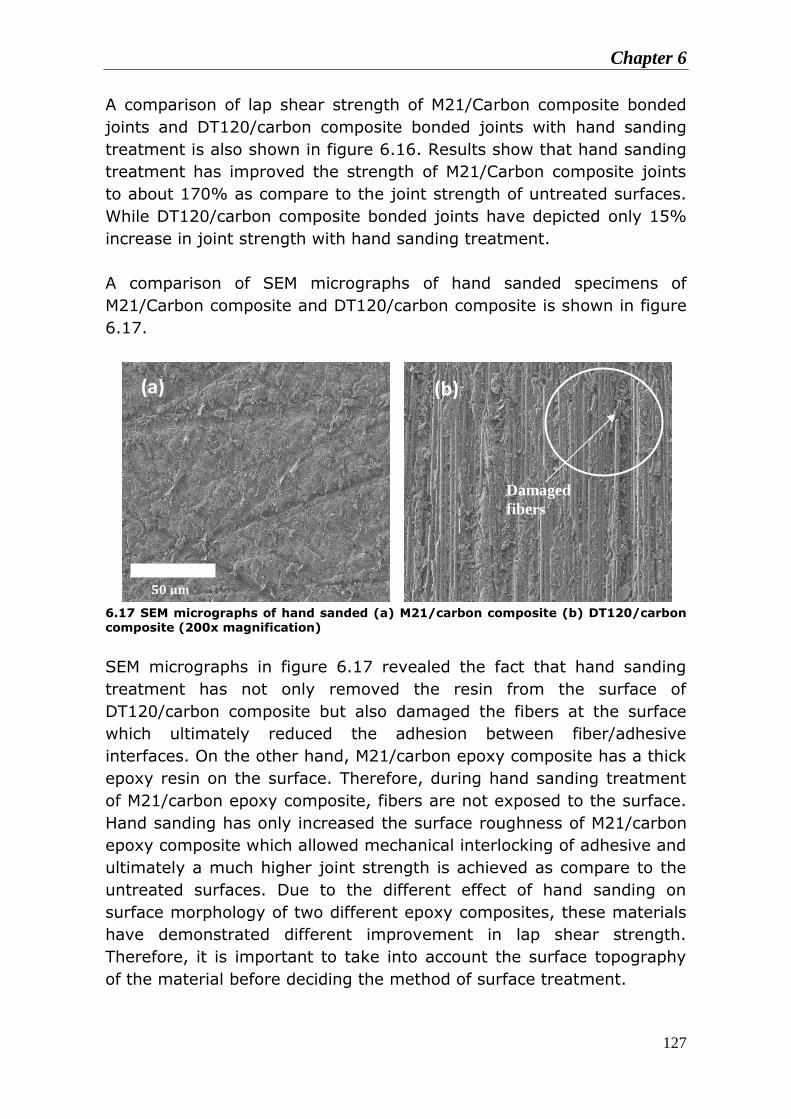
Chapter 6
127
A comparison of lap shear strength of M21/Carbon composite bonded
joints and DT120/carbon composite bonded joints with hand sanding
treatment is also shown in figure 6.16. Results show that hand sanding
treatment has improved the strength of M21/Carbon composite joints
to about 170% as compare to the joint strength of untreated surfaces.
While DT120/carbon composite bonded joints have depicted only 15%
increase in joint strength with hand sanding treatment.
A comparison of SEM micrographs of hand sanded specimens of
M21/Carbon composite and DT120/carbon composite is shown in figure
6.17.
6.17 SEM micrographs of hand sanded (a) M21/carbon composite (b) DT120/carbon composite (200x magnification)
SEM micrographs in figure 6.17 revealed the fact that hand sanding
treatment has not only removed the resin from the surface of
DT120/carbon composite but also damaged the fibers at the surface
which ultimately reduced the adhesion between fiber/adhesive
interfaces. On the other hand, M21/carbon epoxy composite has a thick
epoxy resin on the surface. Therefore, during hand sanding treatment
of M21/carbon epoxy composite, fibers are not exposed to the surface.
Hand sanding has only increased the surface roughness of M21/carbon
epoxy composite which allowed mechanical interlocking of adhesive and
ultimately a much higher joint strength is achieved as compare to the
untreated surfaces. Due to the different effect of hand sanding on
surface morphology of two different epoxy composites, these materials
have demonstrated different improvement in lap shear strength.
Therefore, it is important to take into account the surface topography
of the material before deciding the method of surface treatment.
Damaged
fibers
(a) (b)
100 μm
50 μm
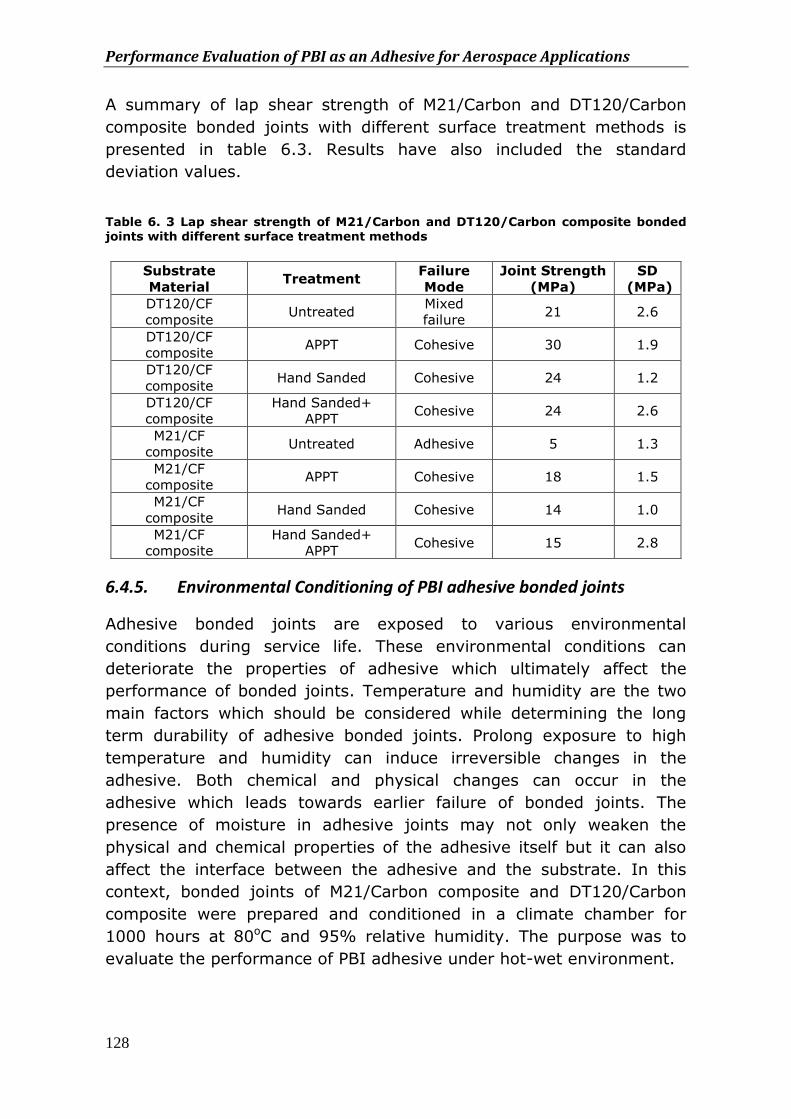
Performance Evaluation of PBI as an Adhesive for Aerospace Applications
128
A summary of lap shear strength of M21/Carbon and DT120/Carbon
composite bonded joints with different surface treatment methods is
presented in table 6.3. Results have also included the standard
deviation values.
Table 6. 3 Lap shear strength of M21/Carbon and DT120/Carbon composite bonded joints with different surface treatment methods
Substrate
Material Treatment
Failure
Mode
Joint Strength
(MPa)
SD
(MPa)
DT120/CF
composite Untreated
Mixed
failure 21 2.6
DT120/CF
composite APPT Cohesive 30 1.9
DT120/CF
composite Hand Sanded Cohesive 24 1.2
DT120/CF
composite
Hand Sanded+
APPT Cohesive 24 2.6
M21/CF
composite Untreated Adhesive 5 1.3
M21/CF
composite APPT Cohesive 18 1.5
M21/CF
composite Hand Sanded Cohesive 14 1.0
M21/CF
composite
Hand Sanded+
APPT Cohesive 15 2.8
6.4.5. Environmental Conditioning of PBI adhesive bonded joints
Adhesive bonded joints are exposed to various environmental
conditions during service life. These environmental conditions can
deteriorate the properties of adhesive which ultimately affect the
performance of bonded joints. Temperature and humidity are the two
main factors which should be considered while determining the long
term durability of adhesive bonded joints. Prolong exposure to high
temperature and humidity can induce irreversible changes in the
adhesive. Both chemical and physical changes can occur in the
adhesive which leads towards earlier failure of bonded joints. The
presence of moisture in adhesive joints may not only weaken the
physical and chemical properties of the adhesive itself but it can also
affect the interface between the adhesive and the substrate. In this
context, bonded joints of M21/Carbon composite and DT120/Carbon
composite were prepared and conditioned in a climate chamber for
1000 hours at 80oC and 95% relative humidity. The purpose was to
evaluate the performance of PBI adhesive under hot-wet environment.
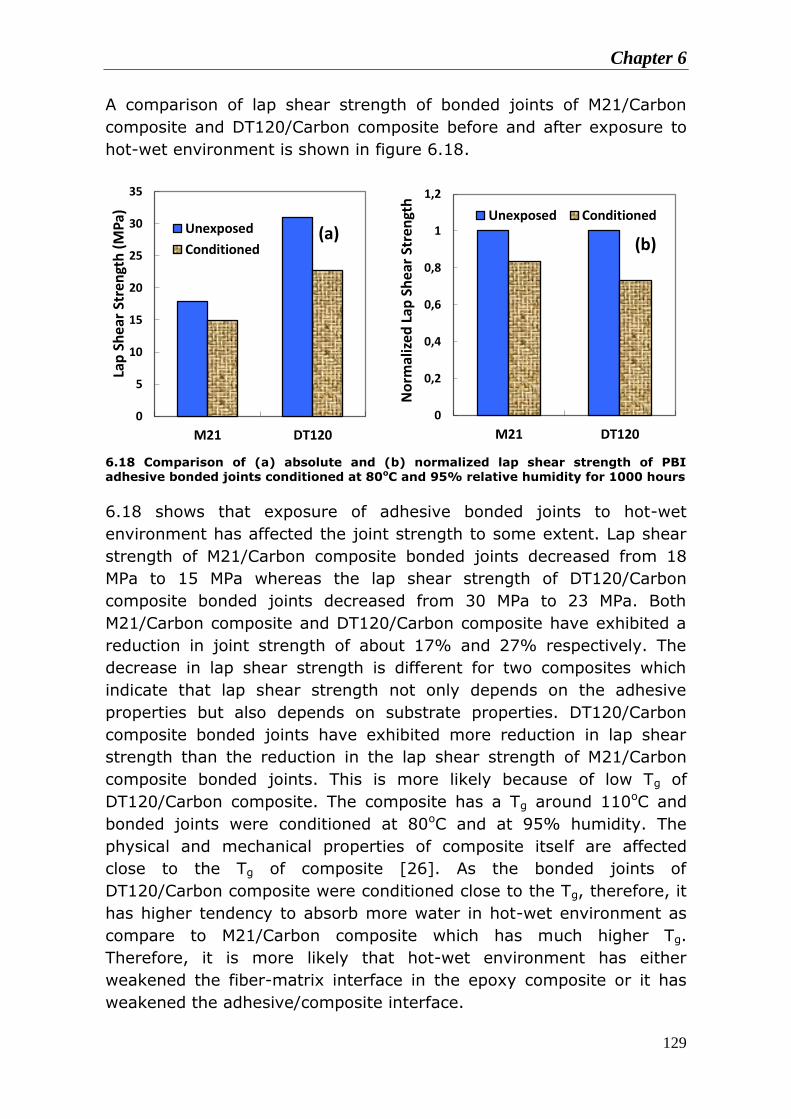
Chapter 6
129
A comparison of lap shear strength of bonded joints of M21/Carbon
composite and DT120/Carbon composite before and after exposure to
hot-wet environment is shown in figure 6.18.
6.18 Comparison of (a) absolute and (b) normalized lap shear strength of PBI adhesive bonded joints conditioned at 80oC and 95% relative humidity for 1000 hours
6.18 shows that exposure of adhesive bonded joints to hot-wet
environment has affected the joint strength to some extent. Lap shear
strength of M21/Carbon composite bonded joints decreased from 18
MPa to 15 MPa whereas the lap shear strength of DT120/Carbon
composite bonded joints decreased from 30 MPa to 23 MPa. Both
M21/Carbon composite and DT120/Carbon composite have exhibited a
reduction in joint strength of about 17% and 27% respectively. The
decrease in lap shear strength is different for two composites which
indicate that lap shear strength not only depends on the adhesive
properties but also depends on substrate properties. DT120/Carbon
composite bonded joints have exhibited more reduction in lap shear
strength than the reduction in the lap shear strength of M21/Carbon
composite bonded joints. This is more likely because of low Tg of
DT120/Carbon composite. The composite has a Tg around 110oC and
bonded joints were conditioned at 80oC and at 95% humidity. The
physical and mechanical properties of composite itself are affected
close to the Tg of composite [26]. As the bonded joints of
DT120/Carbon composite were conditioned close to the Tg, therefore, it
has higher tendency to absorb more water in hot-wet environment as
compare to M21/Carbon composite which has much higher Tg.
Therefore, it is more likely that hot-wet environment has either
weakened the fiber-matrix interface in the epoxy composite or it has
weakened the adhesive/composite interface.
0
5
10
15
20
25
30
35
M21 DT120
Lap
Sh
ear
Stre
ngt
h (
MP
a)
Unexposed
Conditioned(a)
0
0,2
0,4
0,6
0,8
1
1,2
M21 DT120
No
rmal
ized
Lap
Sh
ear
Stre
ngt
h
Unexposed Conditioned
(b)
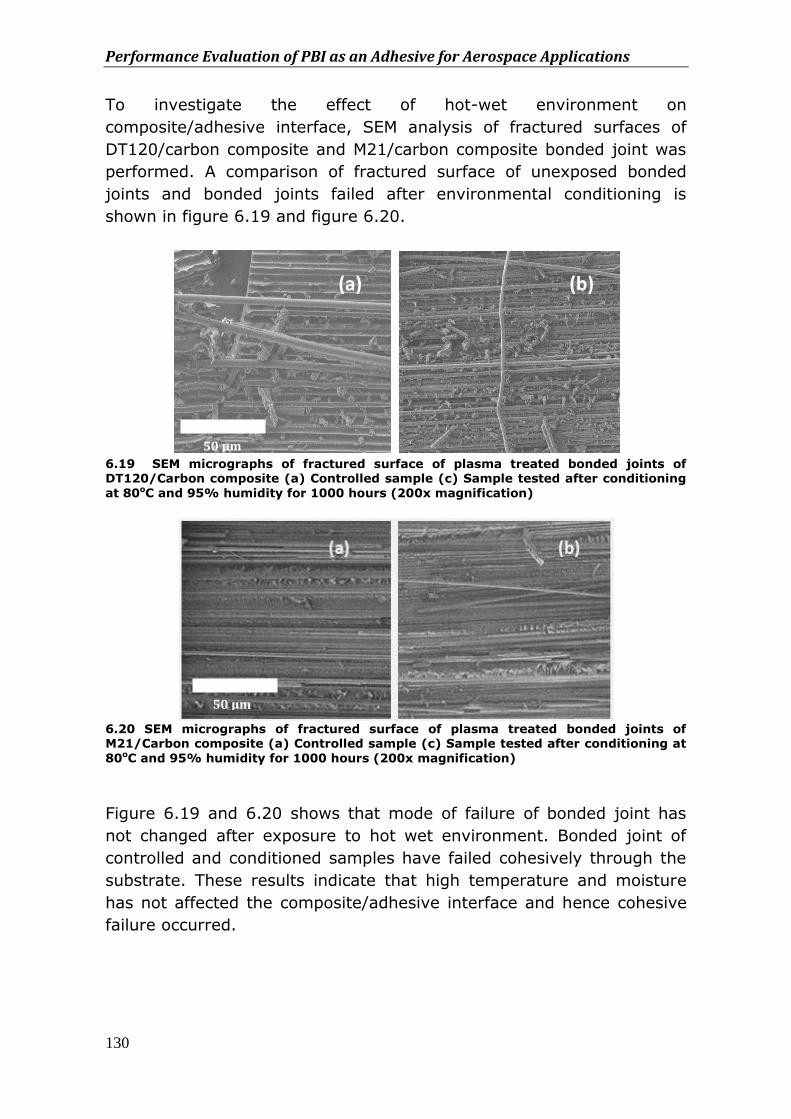
Performance Evaluation of PBI as an Adhesive for Aerospace Applications
130
To investigate the effect of hot-wet environment on
composite/adhesive interface, SEM analysis of fractured surfaces of
DT120/carbon composite and M21/carbon composite bonded joint was
performed. A comparison of fractured surface of unexposed bonded
joints and bonded joints failed after environmental conditioning is
shown in figure 6.19 and figure 6.20.
6.19 SEM micrographs of fractured surface of plasma treated bonded joints of DT120/Carbon composite (a) Controlled sample (c) Sample tested after conditioning
at 80oC and 95% humidity for 1000 hours (200x magnification)
6.20 SEM micrographs of fractured surface of plasma treated bonded joints of M21/Carbon composite (a) Controlled sample (c) Sample tested after conditioning at
80oC and 95% humidity for 1000 hours (200x magnification)
Figure 6.19 and 6.20 shows that mode of failure of bonded joint has
not changed after exposure to hot wet environment. Bonded joint of
controlled and conditioned samples have failed cohesively through the
substrate. These results indicate that high temperature and moisture
has not affected the composite/adhesive interface and hence cohesive
failure occurred.
(a) (b)
100 μm
100 μm
50 μm
50 μm
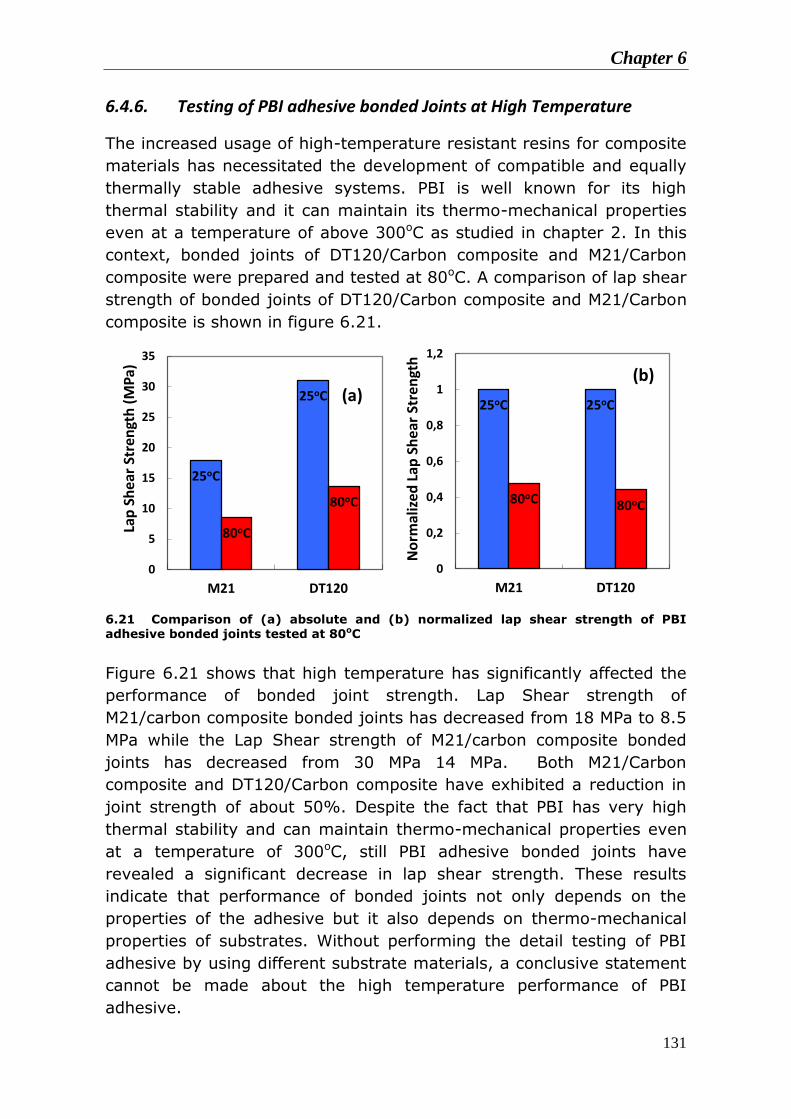
Chapter 6
131
6.4.6. Testing of PBI adhesive bonded Joints at High Temperature
The increased usage of high-temperature resistant resins for composite
materials has necessitated the development of compatible and equally
thermally stable adhesive systems. PBI is well known for its high
thermal stability and it can maintain its thermo-mechanical properties
even at a temperature of above 300oC as studied in chapter 2. In this
context, bonded joints of DT120/Carbon composite and M21/Carbon
composite were prepared and tested at 80oC. A comparison of lap shear
strength of bonded joints of DT120/Carbon composite and M21/Carbon
composite is shown in figure 6.21.
6.21 Comparison of (a) absolute and (b) normalized lap shear strength of PBI adhesive bonded joints tested at 80oC
Figure 6.21 shows that high temperature has significantly affected the
performance of bonded joint strength. Lap Shear strength of
M21/carbon composite bonded joints has decreased from 18 MPa to 8.5
MPa while the Lap Shear strength of M21/carbon composite bonded
joints has decreased from 30 MPa 14 MPa. Both M21/Carbon
composite and DT120/Carbon composite have exhibited a reduction in
joint strength of about 50%. Despite the fact that PBI has very high
thermal stability and can maintain thermo-mechanical properties even
at a temperature of 300oC, still PBI adhesive bonded joints have
revealed a significant decrease in lap shear strength. These results
indicate that performance of bonded joints not only depends on the
properties of the adhesive but it also depends on thermo-mechanical
properties of substrates. Without performing the detail testing of PBI
adhesive by using different substrate materials, a conclusive statement
cannot be made about the high temperature performance of PBI
adhesive.
25oC
25oC
80oC
80oC
0
5
10
15
20
25
30
35
M21 DT120
Lap
Sh
ear
Str
engt
h (
MP
a)
(a) 25oC 25oC
80oC 80oC
0
0,2
0,4
0,6
0,8
1
1,2
M21 DT120
No
rmal
ized
Lap
Sh
ear
Stre
ngt
h
(b)
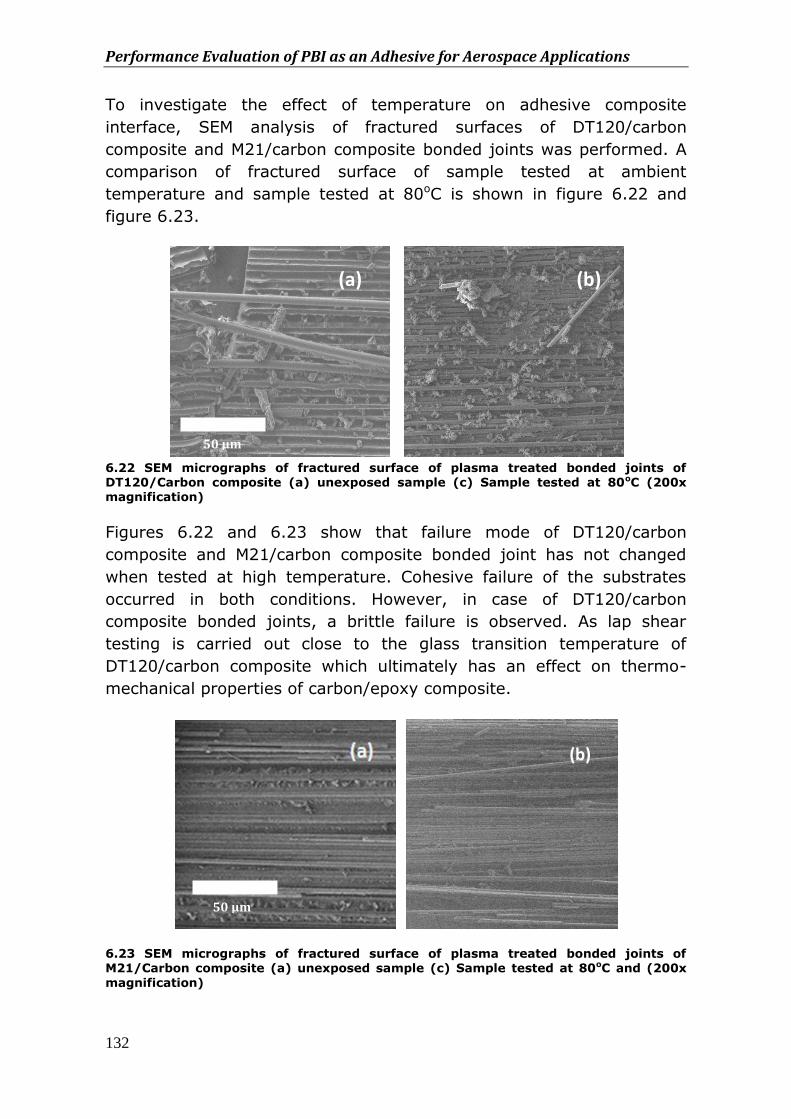
Performance Evaluation of PBI as an Adhesive for Aerospace Applications
132
To investigate the effect of temperature on adhesive composite
interface, SEM analysis of fractured surfaces of DT120/carbon
composite and M21/carbon composite bonded joints was performed. A
comparison of fractured surface of sample tested at ambient
temperature and sample tested at 80oC is shown in figure 6.22 and
figure 6.23.
6.22 SEM micrographs of fractured surface of plasma treated bonded joints of DT120/Carbon composite (a) unexposed sample (c) Sample tested at 80oC (200x magnification)
Figures 6.22 and 6.23 show that failure mode of DT120/carbon
composite and M21/carbon composite bonded joint has not changed
when tested at high temperature. Cohesive failure of the substrates
occurred in both conditions. However, in case of DT120/carbon
composite bonded joints, a brittle failure is observed. As lap shear
testing is carried out close to the glass transition temperature of
DT120/carbon composite which ultimately has an effect on thermo-
mechanical properties of carbon/epoxy composite.
6.23 SEM micrographs of fractured surface of plasma treated bonded joints of M21/Carbon composite (a) unexposed sample (c) Sample tested at 80oC and (200x
magnification)
(a) (b)
(b)
100 μm
100 μm
50 μm
50 μm
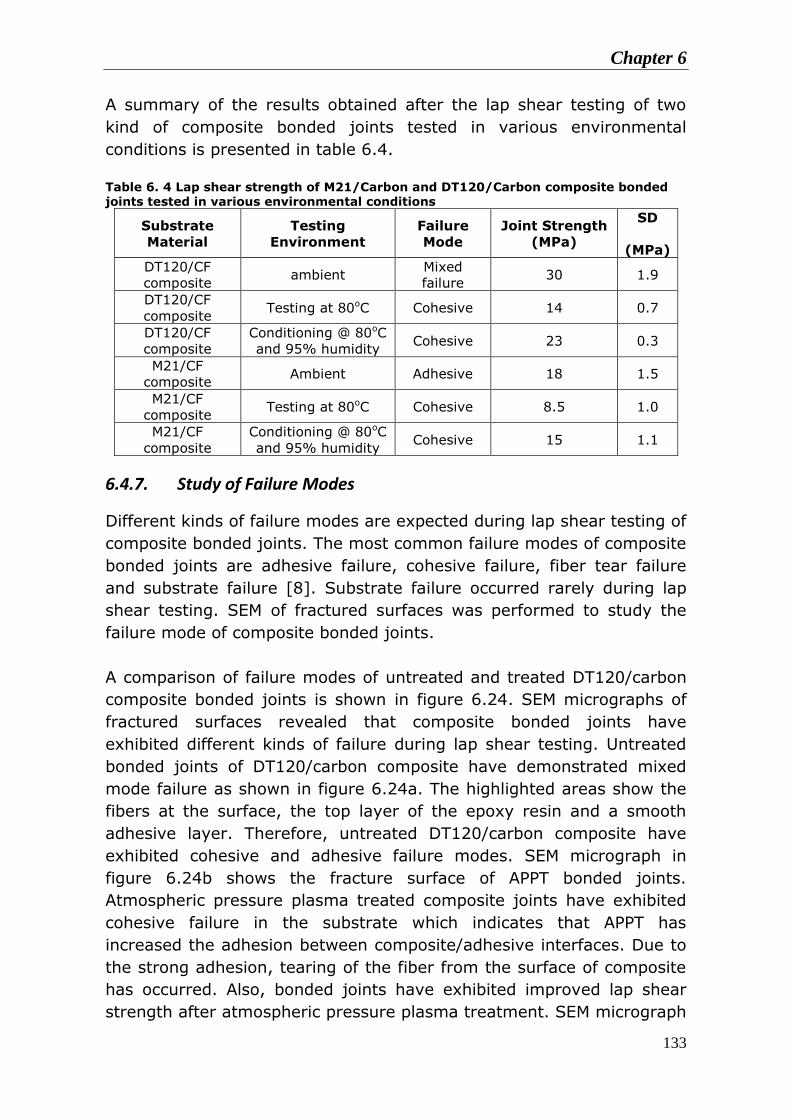
Chapter 6
133
A summary of the results obtained after the lap shear testing of two
kind of composite bonded joints tested in various environmental
conditions is presented in table 6.4.
Table 6. 4 Lap shear strength of M21/Carbon and DT120/Carbon composite bonded joints tested in various environmental conditions
Substrate
Material
Testing
Environment
Failure
Mode
Joint Strength
(MPa)
SD
(MPa)
DT120/CF
composite ambient
Mixed
failure 30 1.9
DT120/CF
composite Testing at 80oC Cohesive 14 0.7
DT120/CF
composite
Conditioning @ 80oC
and 95% humidity Cohesive 23 0.3
M21/CF
composite Ambient Adhesive 18 1.5
M21/CF
composite Testing at 80oC Cohesive 8.5 1.0
M21/CF
composite
Conditioning @ 80oC
and 95% humidity Cohesive 15 1.1
6.4.7. Study of Failure Modes
Different kinds of failure modes are expected during lap shear testing of
composite bonded joints. The most common failure modes of composite
bonded joints are adhesive failure, cohesive failure, fiber tear failure
and substrate failure [8]. Substrate failure occurred rarely during lap
shear testing. SEM of fractured surfaces was performed to study the
failure mode of composite bonded joints.
A comparison of failure modes of untreated and treated DT120/carbon
composite bonded joints is shown in figure 6.24. SEM micrographs of
fractured surfaces revealed that composite bonded joints have
exhibited different kinds of failure during lap shear testing. Untreated
bonded joints of DT120/carbon composite have demonstrated mixed
mode failure as shown in figure 6.24a. The highlighted areas show the
fibers at the surface, the top layer of the epoxy resin and a smooth
adhesive layer. Therefore, untreated DT120/carbon composite have
exhibited cohesive and adhesive failure modes. SEM micrograph in
figure 6.24b shows the fracture surface of APPT bonded joints.
Atmospheric pressure plasma treated composite joints have exhibited
cohesive failure in the substrate which indicates that APPT has
increased the adhesion between composite/adhesive interfaces. Due to
the strong adhesion, tearing of the fiber from the surface of composite
has occurred. Also, bonded joints have exhibited improved lap shear
strength after atmospheric pressure plasma treatment. SEM micrograph
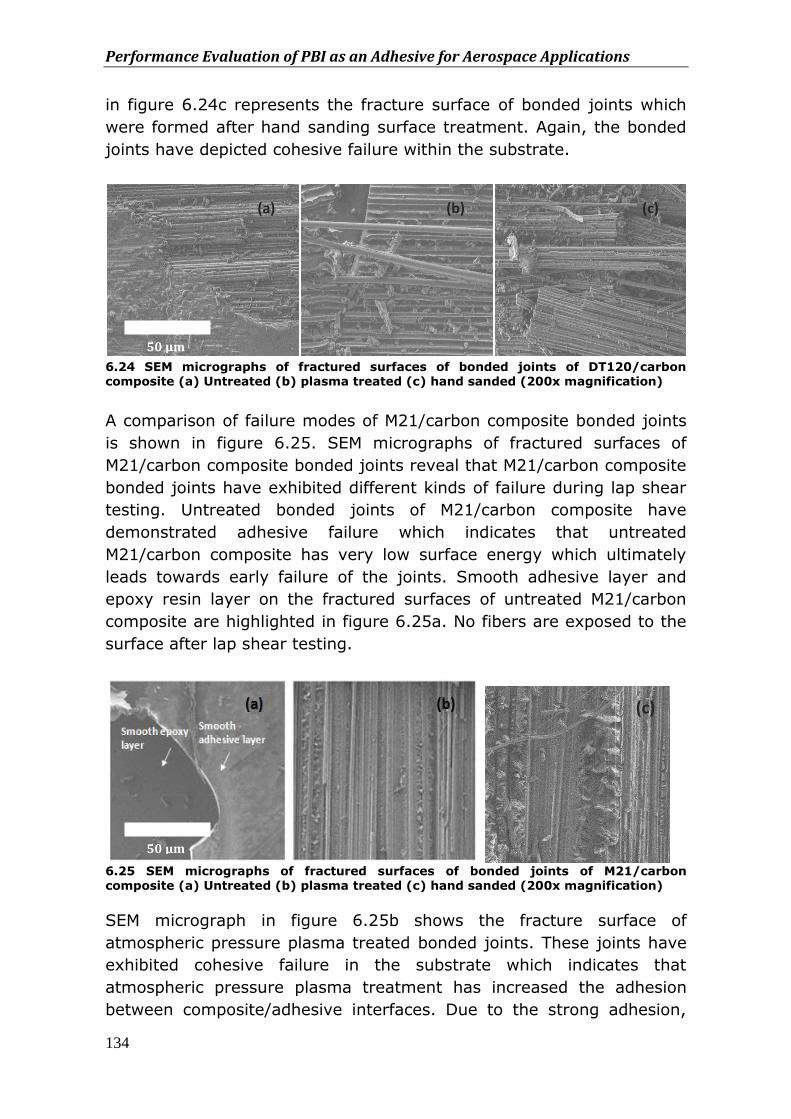
Performance Evaluation of PBI as an Adhesive for Aerospace Applications
134
in figure 6.24c represents the fracture surface of bonded joints which
were formed after hand sanding surface treatment. Again, the bonded
joints have depicted cohesive failure within the substrate.
6.24 SEM micrographs of fractured surfaces of bonded joints of DT120/carbon composite (a) Untreated (b) plasma treated (c) hand sanded (200x magnification)
A comparison of failure modes of M21/carbon composite bonded joints
is shown in figure 6.25. SEM micrographs of fractured surfaces of
M21/carbon composite bonded joints reveal that M21/carbon composite
bonded joints have exhibited different kinds of failure during lap shear
testing. Untreated bonded joints of M21/carbon composite have
demonstrated adhesive failure which indicates that untreated
M21/carbon composite has very low surface energy which ultimately
leads towards early failure of the joints. Smooth adhesive layer and
epoxy resin layer on the fractured surfaces of untreated M21/carbon
composite are highlighted in figure 6.25a. No fibers are exposed to the
surface after lap shear testing.
6.25 SEM micrographs of fractured surfaces of bonded joints of M21/carbon composite (a) Untreated (b) plasma treated (c) hand sanded (200x magnification)
SEM micrograph in figure 6.25b shows the fracture surface of
atmospheric pressure plasma treated bonded joints. These joints have
exhibited cohesive failure in the substrate which indicates that
atmospheric pressure plasma treatment has increased the adhesion
between composite/adhesive interfaces. Due to the strong adhesion,
(a) (b) (c)
(c)
100 μm
100 μm
50 μm
50 μm
Chapter 6
135
tearing of the fiber from the surface of composite has occurred. Also,
bonded joints have exhibited improved lap shear strength after APPT.
SEM micrograph in figure 6.25c represents the fracture surface of
bonded joints which were formed after hand sanding surface treatment.
Again, the bonded joints have depicted cohesive failure in the
substrate.
6.5. Conclusions
In present study, PBI has been evaluated as an adhesive after exposure
to various environmental conditions. The main objective of this study
was to optimize the adhesive bonding process of PBI in order to
evaluate its performance as an adhesive for aerospace applications.
Bonded joints of DT120/Carbon composite and M21/Carbon composite
were formed using PBI adhesive. Atmospheric pressure plasma
treatment (APPT) was performed to improve the adhesion properties of
composite substrates prior to the formation of bonded joints. Though,
APPT improves the surface energy of these materials in short duration
of time. However, it can induce the thermal stresses in the composite
materials because of the high temperature generated during the
surface treatment. Current work shows that during APPT, surface
temperature of composite materials have raised to above 200oC in very
short duration of time and this temperature was well above glass
transition temperature of composites used in this study. This high
temperature can induce residual thermal stresses and also have an
impact on mechanical properties. Therefore, one of the important
conclusions of this study is that thermal properties of polymer based
composite materials should always be considered before performing
APPT. APPT can significantly damage the surface as well as bulk
properties of the materials. Therefore, it is important to optimize the
height of the plasma nozzle from composite surface and plasma
treatment time. By increasing the height of the plasma nozzle from
composite, the temperature generated at the surface can be reduced
which ultimately would have less affect on bulk properties of the
materials.
Results obtained from contact angle measurement after APPT shows
that APPT have improved the wetting properties of two kinds of epoxy
composite. A higher improvement in the surface energy of M21/Carbon
composite is observed as compare to the improvement in the surface
energy of DT120/Carbon composite. However, DT120/Carbon
Performance Evaluation of PBI as an Adhesive for Aerospace Applications
136
composite bonded joints have exhibited 75% higher lap shear strength
than the lap shear strength of M21/Carbon composite. Therefore,
another important conclusion of this study is that there are factors
other than the surface energy which can affect the joint strength.
Surface topography of composite is very crucial factor to achieve high
bond strength. Surface topography of composite materials was studied
sequentially with increasing plasma treatment time. With increasing
treatment time, surface roughness of composites has increased. This
increase in surface roughness is correlated with the increase in surface
temperature during APPT. Surface temperature during APPT reached
above glass transition temperature of polymer and polymer based
composite. This increase in surface temperature caused local
rearrangement of molecules and in case of unfilled PEEK, local melting
is observed which ultimately led towards increased surface roughness.
Bonded joints of DT120/Carbon composite and M21/Carbon composite
were conditioned at 80oC and 95% humidity. Exposure of both kinds of
composite bonded joints to hot-wet environment for 1000 hours
resulted in a reduction of lap shear strength of 17% and 27% for
DT120/Carbon composite and M21/Carbon composite respectively.
These results indicate that hot-wet environment has not significantly
deteriorated the properties of PBI adhesive even after 1000 hours of
conditioning. However, testing of PBI adhesive bonded composite joints
at 80oC has reduced the lap shear strength to about 50%. Despite the
fact that PBI has very high thermal stability and can maintain thermo-
mechanical properties even at a temperature of 300oC, still PBI
adhesive bonded joints have revealed about 50% decrease in lap shear
strength. These results indicate that performance of bonded joints not
only depends on the properties of the adhesive but it also depends on
thermo-mechanical properties of substrates. Without performing the
detail testing of PBI adhesive using different substrate materials, a
conclusive statement cannot be made about the high temperature
performance of PBI adhesive.
6.6. References
1- Baker, Alan; Dutton, Stuart; Kelly, Donald, Composite materials for aircraft structures, 2nd edition, 2004
2- A.P. Mouritz, E. Gellert, P. Burchill, K. Challis, Review of advanced composite structures for naval ships and submarines, Composite structures, (2001)
Chapter 6
137
3- A.P.Mouritz and A.G.Gibson, Fire Properties of polymer composite materials, Solid Mechanics and its applications, Volume 143, 2006, ISBN-13 978-1-4020-5356-6
4- Mouritz, AP, Fire safety of advanced composites for aircraft, B2004/0046,
April 2006
5- Jack R. Vinson, Adhesive Bonding of Polymer Composites, Polymer Engineering and Science, Vol. 29, No. 19 (1989)
6- Urena A, Gude R. M, Prolongo S. G. , Carbon nanofibers reinforced adhesives for joining carbon fiber epoxy composites.13th European conference on composite materials, (2008)
7- M. D. Banea and L. F M da Silva, Adhesively bonded joints in composite materials: An overview, Proceedings of the Institution of Mechanical Engineers, Part L: Journal of Materials Design and Applications, (2009)
8- Bowditch M. R., Shaw S. J., Adhesive bonding for high performance materials
Adv. Perform Mater, Vol. 3, (1996)
9- Shenton M.J, Lovell-Hoare M. C, Stevens G. C. Adhesion enhancement of polymer surfaces by atmospheric plasma treatment, J. Phys D:Appl. Phys Vol. 34, (2001)
10- Handbook of Plastics Joining (Second Edition), A Practical Guide
11- Shields J. , Adhesive bonding, London:Oxford Universiy Press, (1974)
12- Leahy W,Barron V,Buggy M,Young T,Mas A,Schue F,.Plasma surface treatment of aerospace materials for enhanced adhesive bonding.J Adhes, vol. 77, (2001)
13- Steinerand, P. A., and Sandor, R., “Polybenzimidazole Prepreg: Improved Elevated Temperature Properties with Autoclave Processability,” High Performance Polymers,Vol. 3, No. 3, 1991, pp. 139–150.
14- Bhowmik, S., Bonin, H.W., Bui, V. T., and Weir, R. D., “Modification of High-Performance Polymer Composite through High-Energy Radiation and Low-Pressure Plasma for Aerospace and Space Applications,” Journal of Applied Polymer Science, Vol. 102, Jan. 2006, pp. 1959–1967.
15- Chan C-M, KoT-M, Hiraoka H., Polymer surface modification by plasma and
photons Surf Sci Rep, Vol. 24, (1996)
16- Michael Noeske, Jost Degenhardt, Silke Strudthoff, Uwe Lommatzsch, Plasma jet treatment of five polymers at atmospheric pressure: surface modifications and the relevance for adhesion, Int. J. Adhes. Adhes. Vol. 24, (2004)
Performance Evaluation of PBI as an Adhesive for Aerospace Applications
138
17- J.R.J Wingfield Treatment of composite surfaces for adhesive bonding, int. J. Adh. & Adh. Vol. 13 (1993)
18- P. Molitor, V. Barron_, T. Young, Surface treatment of titanium for adhesive
bonding to polymer composites: a review, International Journal of Adhesion & Adhesives, vol. 21 (2001)
19- Petrie E.M.,The fundamentals of adhesive joint design and construction, Metal Finishing, Vol. 106, (2008)
20- Rotheiser J. Joining of plastics: handbook for designers and engineers. Munich:
Hanser; 1999.
21- H.M.S. Iqbal,S.Bhowmik n, R.Benedictus, Surface modification of high performance polymers by atmospheric pressure plasma and failure mechanism of adhesive bonded joints, International Journal of Adhesion & Adhesives, Vol. 30 (2010)
22- Shen Tang and Ho Suk Choi, Comparison of Low- and Atmospheric-Pressure
Radio Frequency Plasma Treatments on the Surface Modification of Poly(methyl methacrylate) Plates, J. Phys. Chem. C, Vol. 112, (2008)
23- Jin Kook Kim, Hak Sung Kim And Dai Gil Lee, Investigation of optimal surface
treatments for carbon/epoxy composite adhesive joints, J. Adhesion Sci. Technol., Vol. 17, No. 3, pp. 329–352 (2003)
24- Vijay Nehra, Ashok Kumar and H K Dwivedi, Atmospheric non-thermal plasma sources, Int. J. of Engineering, vol. 2
25- Sina Ebnesajjad , Handbook of Adhesives and Surface
Preparation: Technology, Applications and Manufacturing, ISBN-10-1437744613, (2010)
26- Roger Vodicka, Accelerated Environmental Testing of Composite Materials,
Report DSTO-TR-0657
139
CHAPTER 7
Performance Evaluation of Polybenzimidazole coating for Aircraft Application
In this chapter, characteristic behavior of PBI as a protective
coating for epoxy based carbon fiber composite for aircraft
application is presented. Response of PBI is described after
exposure to hot wet environment and liquid immersion.
Critical properties including hardness, scratch resistance and
adhesion of PBI coating are assessed and results are
presented.
7.1. Introduction
Polymer based composite materials are gaining wide attraction for
aerospace applications due to their high strength to weight ratio,
excellent corrosion resistance, outstanding thermal insulation and low
thermal expansion. However, there are some disadvantages of
composite materials and these include low through thickness
mechanical properties and poor impact damage [1]. Under flight service
environment of aircraft, composite materials are exposed to different
environmental conditions of temperature, humidity, particle erosion and
ultraviolet radiations [2]. All these conditions play a part in minimizing
the integrity of composites. Most of properties of composite materials
are matrix dependent and matrix resins are more sensitive to above
mentioned environmental conditions. One of the main concerns
regarding the durability of composite material is their poor performance
against particle erosion [3]. Composite materials used for aircraft are
very susceptible to erosion due to the brittle nature of the matrix
material. Durability of composite materials can be improved either by
using a high performance matrix resin which have better resistance to
Performance Evaluation of PBI Coating for Aerospace Applications
140
erosion and other environmental conditions or by applying a high
performance coating material which can protect these materials from
flight service environment. Currently, different multi-component
protective coatings are being used for the protection of composite
aircraft. There are also some other questions which are raised about
the performance of these coatings in terms of their application process,
cost and durability. The coating systems currently used for aircraft
protection consist of an epoxy primer and a polyurethane top coat [4].
Most of the times, an intermediate coat is also applied to get some
desired function. More than one component is required to achieve the
desired functions from a coating system. The total dry thickness of the
multi-coat system ranges between 200 μm to 380 μm [4]. Application
of using two to three different coats to get the desired performance,
ultimately, increase the time of application and add considerable weight
to the aircraft. Also, some pigments and additives are added to these
coatings to improve their performance against environmental service
conditions. Addition of pigments in the coating material causes the
problem of chalking which ultimately affect the performance of the
coating material [5].
Based on the above discussion, the objective of this work is to develop
a coating material which can be applied directly to the composite
substrate without using any primer and it should also perform the
desired functionality. Elimination of the primer coat will help to reduce
the application time and weight which in turn can save the cost of
material, manpower and in flight service cost. In this context,
Polybenzimidazole (PBI) coating will be tested and evaluated for its
performance after exposure to various environmental conditions. Based
on the properties of PBI, it is expected that the material will
demonstrate properties which will be helpful to retain the properties of
composite substrate against particle erosion.
7.2. Experimental
7.2.1. Materials
26% concentrated solution of Polybenzimidazole (PBI) in
Dimethyleacetamide (DMAc) was supplied by CELAZOLE, PBI
performance products. M21 epoxy based unidirectional (UD) carbon
fiber prepregs were supplied by Hexcel. Composite laminates were
prepared by stacking up a number of pre-impregnated layers to achieve
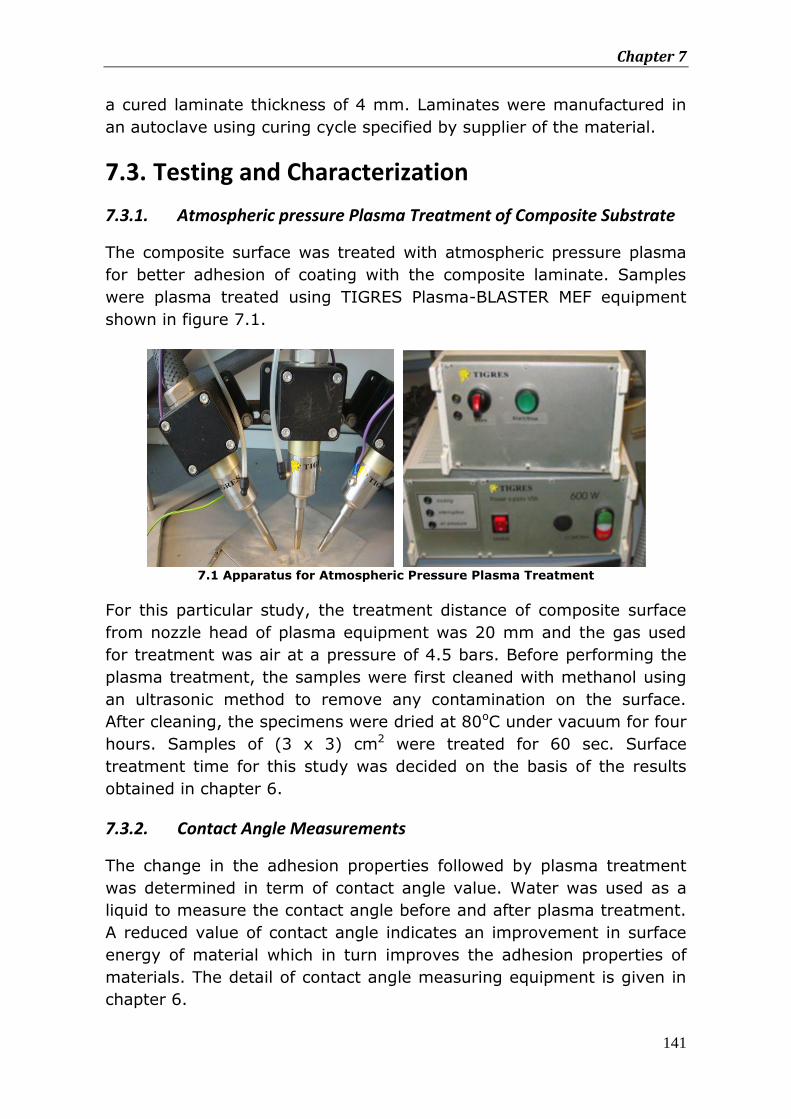
Chapter 7
141
a cured laminate thickness of 4 mm. Laminates were manufactured in
an autoclave using curing cycle specified by supplier of the material.
7.3. Testing and Characterization
7.3.1. Atmospheric pressure Plasma Treatment of Composite Substrate
The composite surface was treated with atmospheric pressure plasma
for better adhesion of coating with the composite laminate. Samples
were plasma treated using TIGRES Plasma-BLASTER MEF equipment
shown in figure 7.1.
7.1 Apparatus for Atmospheric Pressure Plasma Treatment
For this particular study, the treatment distance of composite surface
from nozzle head of plasma equipment was 20 mm and the gas used
for treatment was air at a pressure of 4.5 bars. Before performing the
plasma treatment, the samples were first cleaned with methanol using
an ultrasonic method to remove any contamination on the surface.
After cleaning, the specimens were dried at 80oC under vacuum for four
hours. Samples of (3 x 3) cm2 were treated for 60 sec. Surface
treatment time for this study was decided on the basis of the results
obtained in chapter 6.
7.3.2. Contact Angle Measurements
The change in the adhesion properties followed by plasma treatment
was determined in term of contact angle value. Water was used as a
liquid to measure the contact angle before and after plasma treatment.
A reduced value of contact angle indicates an improvement in surface
energy of material which in turn improves the adhesion properties of
materials. The detail of contact angle measuring equipment is given in
chapter 6.
Performance Evaluation of PBI Coating for Aerospace Applications
142
7.3.3. Application of Coating
The as-received 26% concentrated solution of PBI in DMAc was highly
viscous and therefore it was essential to dilute the solution for proper
processing. DMAc was added to the PBI solution to dilute the solution
down to the 17%. The solution was stirred mechanically at 60°C for 15
minutes to get a uniform mixture of PBI in DMAc. The mixture was then
used as a coating for composite laminate to produce a coating
thickness of about 100-120 µm. The coating was applied on composite
laminates using an adjustable doctor blade which allows controlling the
thickness of the coating. The coating was allowed to dry in the vacuum
oven at 80°C for 2 hours. Afterwards, the coated samples were further
dried in vacuum oven at 125°C for overnight.
7.3.4. Adhesion Testing of PBI coating
For this particular study, lap shear test is used in order to determine
the coating adhesion. Lap shear test provides both quantitative as well
as qualitative information about coating adhesion. Single lap shear
joints of carbon/epoxy composite were prepared with an overlap length
of 12 mm x 25 mm. Joints with both untreated surfaces and
atmospheric pressure plasma treated surfaces were prepared in order
to study the effect of surface treatment on adhesion of PBI coating. The
detail of joint preparation for lap shear testing is given in chapter 6.
7.4. Environmental Resistance of PBI coating
7.4.1. Conditioning of PBI coated Panels at high Temperature and Humidity
Coated panels were prepared and exposed to high temperature and
humidity environment. The purpose was to evaluate the influence of
temperature and humidity on the coating performance. Coated coupons
of 30 mm by 30 mm were prepared and conditioned at 80°C with a
95% relative humidity (RH) for 1000 hours. Resistance of PBI coating
to hot-wet environment was evaluated through scratch test and nano-
indentation test.
7.4.2. Liquid Immersion of PBI Coated Panels
Resistance of the coating to water and Skydrol is also examined by full
immersion test. Skydrol is a harsh solvent used in aerospace industry.
Therefore coating resistance is examined against this solvent. Coated
Chapter 7
143
coupons of 30 mm by 30 mm were immersed in water and Skydrol for
1000 hours at ambient conditions. After 1000 hours, the panels were
visually inspected for any sign of blistering or delamination. Resistance
of the coating was evaluated through scratch test and nano-indentation
test.
7.4.3. Adhesion testing of Conditioned Samples
Coating adhesion was evaluated both before and after exposure to hot-
wet environment using lap shear test. The purpose was to evaluate the
influence of temperature and humidity on the bonded joint strength.
Joints were conditioned in a climate chamber for 1000 hours at 80oC
and 95% relative humidity.
7.4.4. Scratch testing of PBI Coated panels after exposure to Various Environmental Conditions
Scratch tests on unexposed PBI coated panels and the panels exposed
to various environmental conditions were performed. The purpose was
to evaluate the scratch resistance of PBI coating after having exposed
to different environmental conditions. Scratch test is a quantitative
technique in which critical loads are used to compare the cohesive or
adhesive properties of coating material. Critical loads are the load at
which different failures appears in the coating. Scratch test can be
performed by applying a progressive load or constant load. In a
progressive load scratch test, load increases linearly over the length of
the scratch. In present study, scratch tests were conducted using a
Micro scratch tester by CSM instruments. Rockwell diamond tip with
radius of 100 μm was used to generate the scratch. A progressive load
from 0.03N to 15N was used over a scratch length of 10 mm. Scratch
tests on unexposed PBI coated panels were performed using loading
rate of 15N/min, 30 N/min and 60 N/min. The purpose was to study the
effect of loading rate on failure mechanism of PBI coating. Different
parameters including depth of penetration, residual depth and acoustic
emission (AE) are measured during the scratch test to evaluate the
performance of coating.
7.4.5. Nano-indentation testing of PBI Coated panels after exposure to Various Environmental Conditions
Nano-indentation test was performed to study the hardness of PBI
coating before and after exposure to various environmental conditions.
Nano-indentation is getting a popular method for measuring the elastic
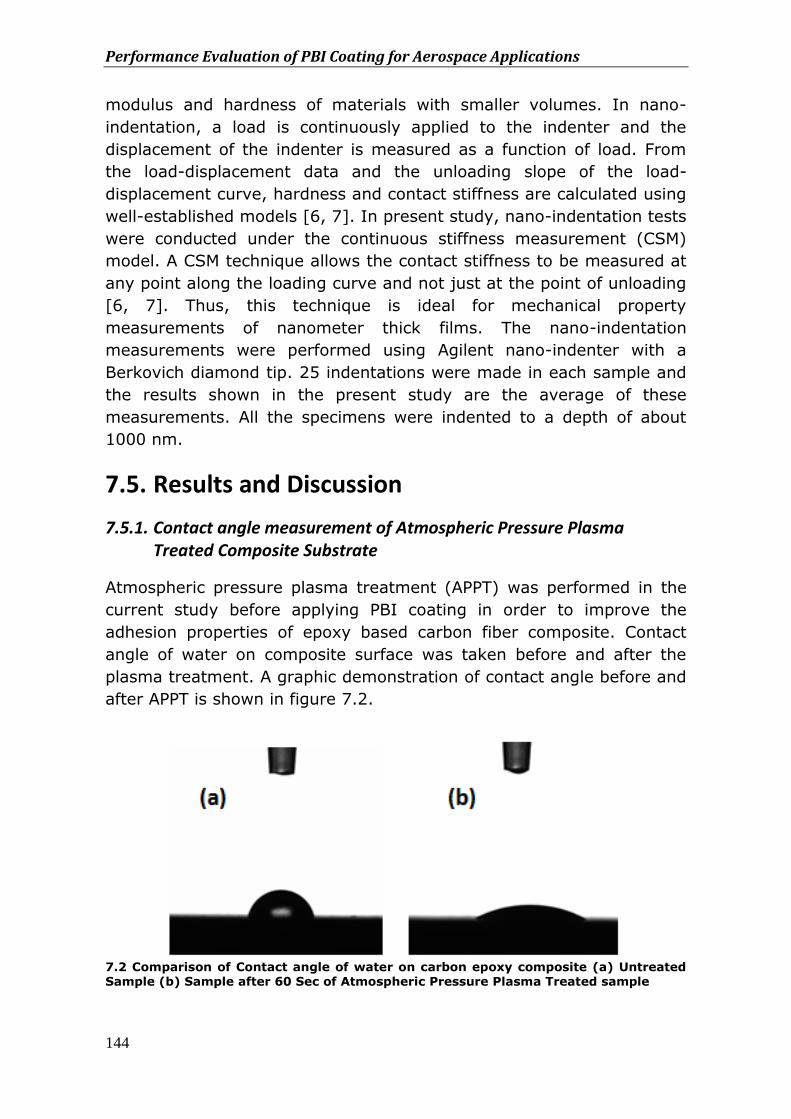
Performance Evaluation of PBI Coating for Aerospace Applications
144
modulus and hardness of materials with smaller volumes. In nano-
indentation, a load is continuously applied to the indenter and the
displacement of the indenter is measured as a function of load. From
the load-displacement data and the unloading slope of the load-
displacement curve, hardness and contact stiffness are calculated using
well-established models [6, 7]. In present study, nano-indentation tests
were conducted under the continuous stiffness measurement (CSM)
model. A CSM technique allows the contact stiffness to be measured at
any point along the loading curve and not just at the point of unloading
[6, 7]. Thus, this technique is ideal for mechanical property
measurements of nanometer thick films. The nano-indentation
measurements were performed using Agilent nano-indenter with a
Berkovich diamond tip. 25 indentations were made in each sample and
the results shown in the present study are the average of these
measurements. All the specimens were indented to a depth of about
1000 nm.
7.5. Results and Discussion
7.5.1. Contact angle measurement of Atmospheric Pressure Plasma Treated Composite Substrate
Atmospheric pressure plasma treatment (APPT) was performed in the
current study before applying PBI coating in order to improve the
adhesion properties of epoxy based carbon fiber composite. Contact
angle of water on composite surface was taken before and after the
plasma treatment. A graphic demonstration of contact angle before and
after APPT is shown in figure 7.2.
7.2 Comparison of Contact angle of water on carbon epoxy composite (a) Untreated Sample (b) Sample after 60 Sec of Atmospheric Pressure Plasma Treated sample
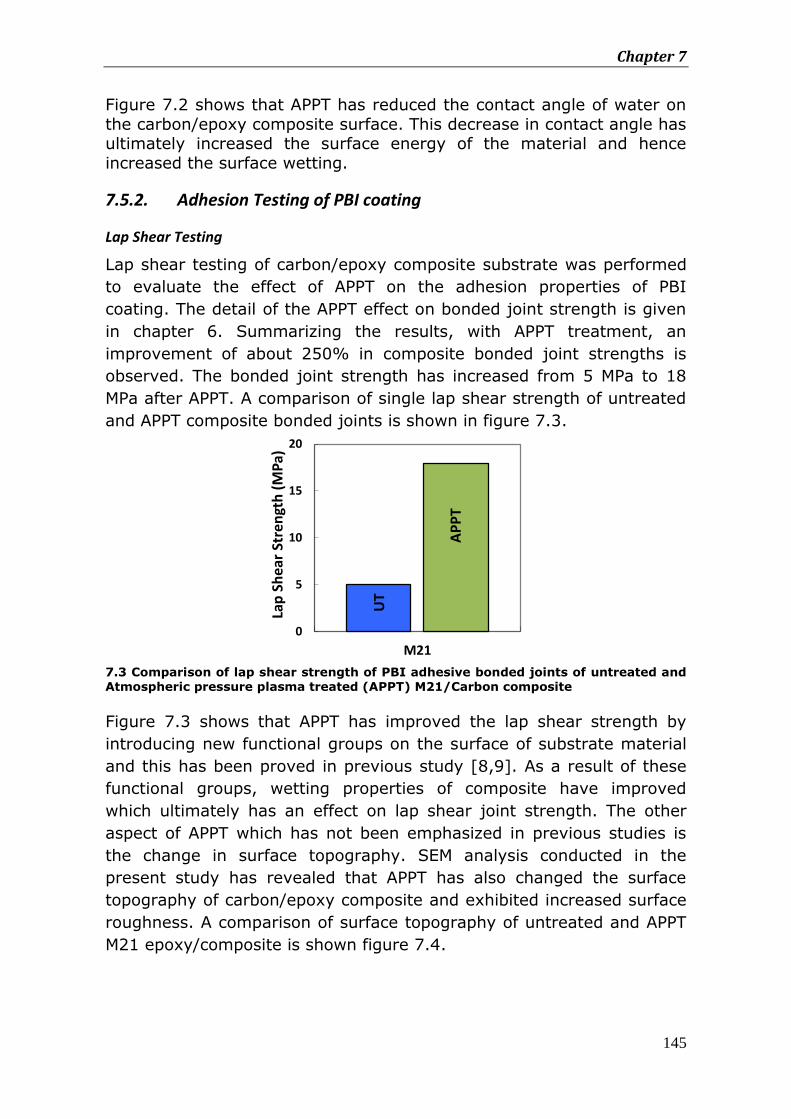
Chapter 7
145
Figure 7.2 shows that APPT has reduced the contact angle of water on
the carbon/epoxy composite surface. This decrease in contact angle has ultimately increased the surface energy of the material and hence
increased the surface wetting.
7.5.2. Adhesion Testing of PBI coating
Lap Shear Testing
Lap shear testing of carbon/epoxy composite substrate was performed
to evaluate the effect of APPT on the adhesion properties of PBI
coating. The detail of the APPT effect on bonded joint strength is given
in chapter 6. Summarizing the results, with APPT treatment, an
improvement of about 250% in composite bonded joint strengths is
observed. The bonded joint strength has increased from 5 MPa to 18
MPa after APPT. A comparison of single lap shear strength of untreated
and APPT composite bonded joints is shown in figure 7.3.
7.3 Comparison of lap shear strength of PBI adhesive bonded joints of untreated and Atmospheric pressure plasma treated (APPT) M21/Carbon composite
Figure 7.3 shows that APPT has improved the lap shear strength by
introducing new functional groups on the surface of substrate material
and this has been proved in previous study [8,9]. As a result of these
functional groups, wetting properties of composite have improved
which ultimately has an effect on lap shear joint strength. The other
aspect of APPT which has not been emphasized in previous studies is
the change in surface topography. SEM analysis conducted in the
present study has revealed that APPT has also changed the surface
topography of carbon/epoxy composite and exhibited increased surface
roughness. A comparison of surface topography of untreated and APPT
M21 epoxy/composite is shown figure 7.4.
UT
AP
PT
0
5
10
15
20
M21
Lap
Sh
ear
Stre
ngt
h (
MP
a)
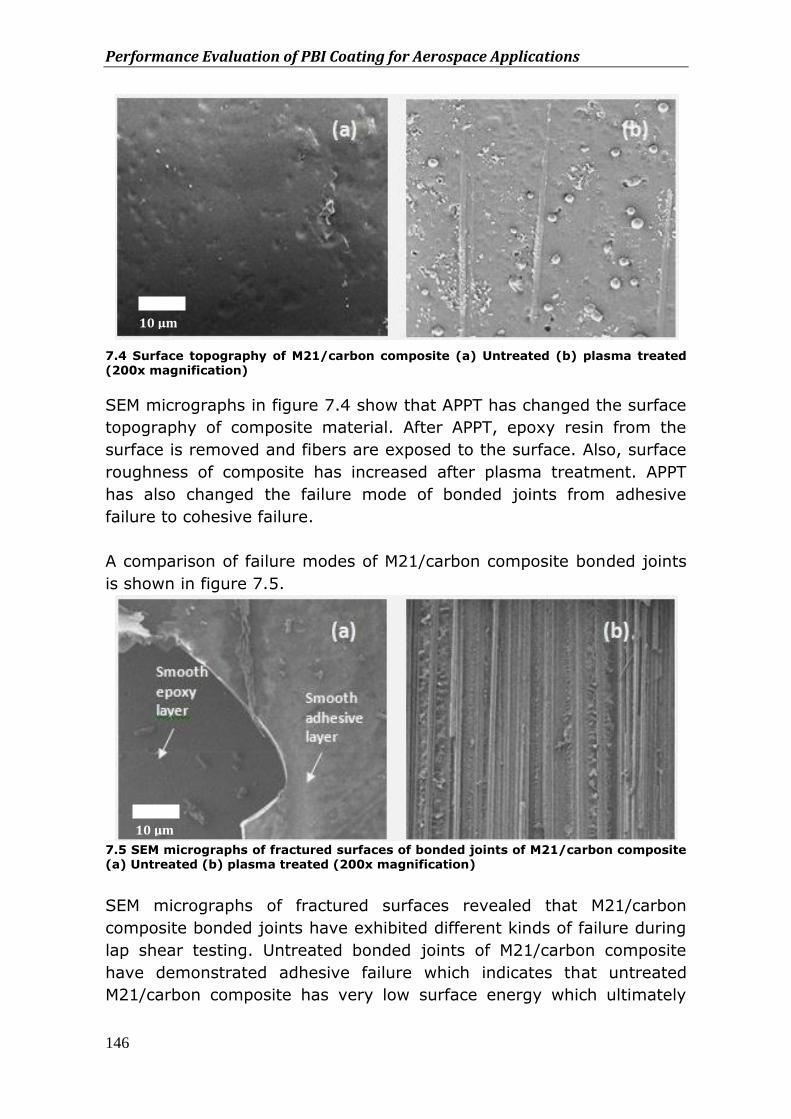
Performance Evaluation of PBI Coating for Aerospace Applications
146
7.4 Surface topography of M21/carbon composite (a) Untreated (b) plasma treated (200x magnification)
SEM micrographs in figure 7.4 show that APPT has changed the surface
topography of composite material. After APPT, epoxy resin from the
surface is removed and fibers are exposed to the surface. Also, surface
roughness of composite has increased after plasma treatment. APPT
has also changed the failure mode of bonded joints from adhesive
failure to cohesive failure.
A comparison of failure modes of M21/carbon composite bonded joints
is shown in figure 7.5.
7.5 SEM micrographs of fractured surfaces of bonded joints of M21/carbon composite (a) Untreated (b) plasma treated (200x magnification)
SEM micrographs of fractured surfaces revealed that M21/carbon
composite bonded joints have exhibited different kinds of failure during
lap shear testing. Untreated bonded joints of M21/carbon composite
have demonstrated adhesive failure which indicates that untreated
M21/carbon composite has very low surface energy which ultimately
100 μm
100 μm 10 μm
10 μm
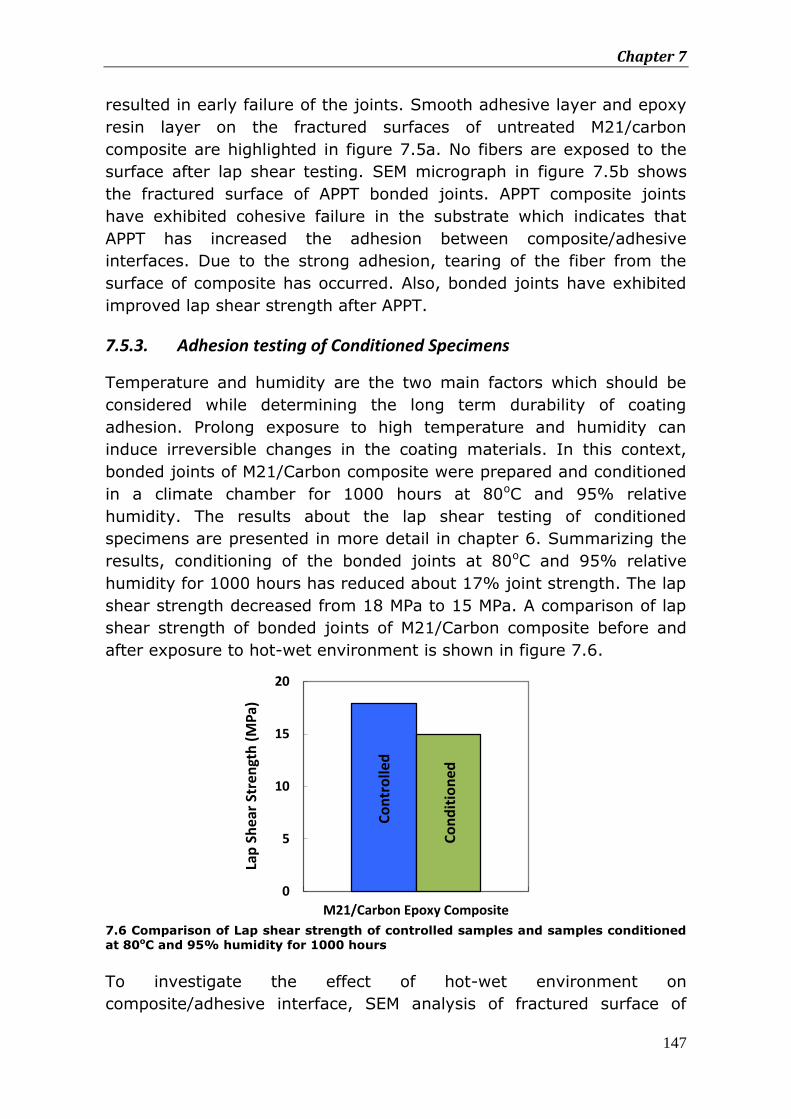
Chapter 7
147
resulted in early failure of the joints. Smooth adhesive layer and epoxy
resin layer on the fractured surfaces of untreated M21/carbon
composite are highlighted in figure 7.5a. No fibers are exposed to the
surface after lap shear testing. SEM micrograph in figure 7.5b shows
the fractured surface of APPT bonded joints. APPT composite joints
have exhibited cohesive failure in the substrate which indicates that
APPT has increased the adhesion between composite/adhesive
interfaces. Due to the strong adhesion, tearing of the fiber from the
surface of composite has occurred. Also, bonded joints have exhibited
improved lap shear strength after APPT.
7.5.3. Adhesion testing of Conditioned Specimens
Temperature and humidity are the two main factors which should be
considered while determining the long term durability of coating
adhesion. Prolong exposure to high temperature and humidity can
induce irreversible changes in the coating materials. In this context,
bonded joints of M21/Carbon composite were prepared and conditioned
in a climate chamber for 1000 hours at 80oC and 95% relative
humidity. The results about the lap shear testing of conditioned
specimens are presented in more detail in chapter 6. Summarizing the
results, conditioning of the bonded joints at 80oC and 95% relative
humidity for 1000 hours has reduced about 17% joint strength. The lap
shear strength decreased from 18 MPa to 15 MPa. A comparison of lap
shear strength of bonded joints of M21/Carbon composite before and
after exposure to hot-wet environment is shown in figure 7.6.
7.6 Comparison of Lap shear strength of controlled samples and samples conditioned at 80oC and 95% humidity for 1000 hours
To investigate the effect of hot-wet environment on
composite/adhesive interface, SEM analysis of fractured surface of
Co
ntr
olle
d
Co
nd
itio
ned
0
5
10
15
20
M21/Carbon Epoxy Composite
Lap
Sh
ear
Stre
ngt
h (
MP
a)
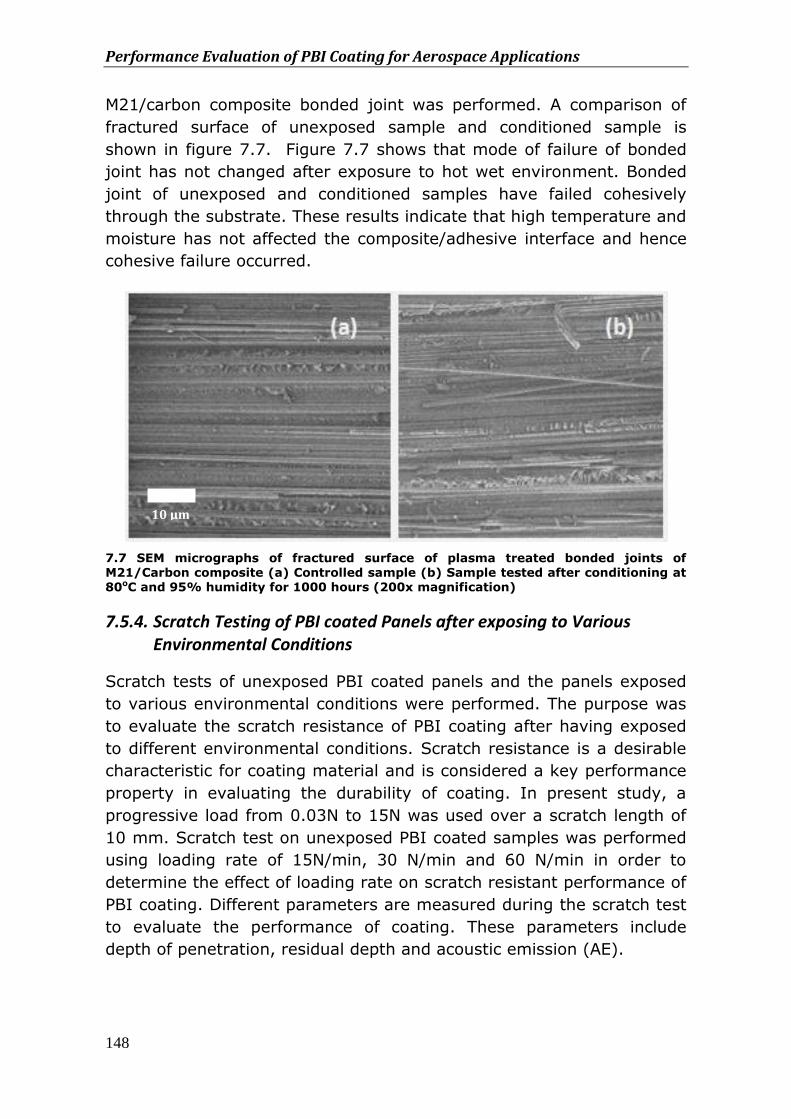
Performance Evaluation of PBI Coating for Aerospace Applications
148
M21/carbon composite bonded joint was performed. A comparison of
fractured surface of unexposed sample and conditioned sample is
shown in figure 7.7. Figure 7.7 shows that mode of failure of bonded
joint has not changed after exposure to hot wet environment. Bonded
joint of unexposed and conditioned samples have failed cohesively
through the substrate. These results indicate that high temperature and
moisture has not affected the composite/adhesive interface and hence
cohesive failure occurred.
7.7 SEM micrographs of fractured surface of plasma treated bonded joints of
M21/Carbon composite (a) Controlled sample (b) Sample tested after conditioning at 80oC and 95% humidity for 1000 hours (200x magnification)
7.5.4. Scratch Testing of PBI coated Panels after exposing to Various Environmental Conditions
Scratch tests of unexposed PBI coated panels and the panels exposed
to various environmental conditions were performed. The purpose was
to evaluate the scratch resistance of PBI coating after having exposed
to different environmental conditions. Scratch resistance is a desirable
characteristic for coating material and is considered a key performance
property in evaluating the durability of coating. In present study, a
progressive load from 0.03N to 15N was used over a scratch length of
10 mm. Scratch test on unexposed PBI coated samples was performed
using loading rate of 15N/min, 30 N/min and 60 N/min in order to
determine the effect of loading rate on scratch resistant performance of
PBI coating. Different parameters are measured during the scratch test
to evaluate the performance of coating. These parameters include
depth of penetration, residual depth and acoustic emission (AE).
100 μm 10 μm
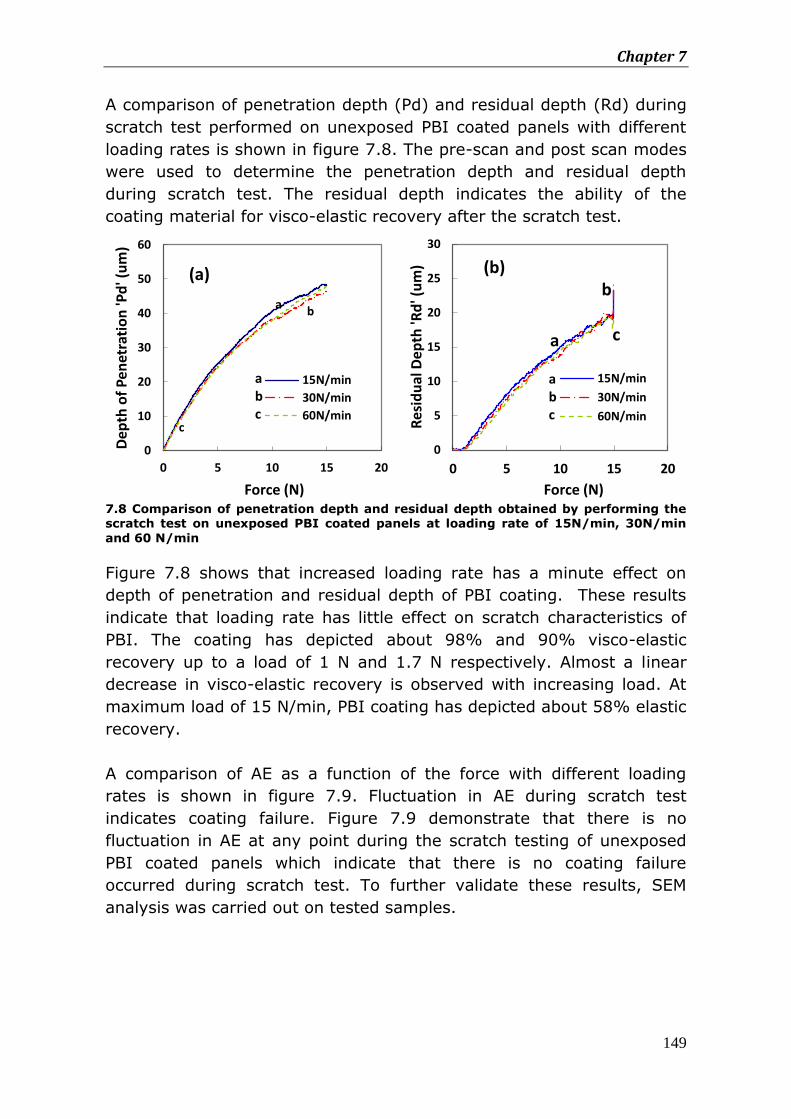
Chapter 7
149
A comparison of penetration depth (Pd) and residual depth (Rd) during
scratch test performed on unexposed PBI coated panels with different
loading rates is shown in figure 7.8. The pre-scan and post scan modes
were used to determine the penetration depth and residual depth
during scratch test. The residual depth indicates the ability of the
coating material for visco-elastic recovery after the scratch test.
7.8 Comparison of penetration depth and residual depth obtained by performing the scratch test on unexposed PBI coated panels at loading rate of 15N/min, 30N/min
and 60 N/min
Figure 7.8 shows that increased loading rate has a minute effect on
depth of penetration and residual depth of PBI coating. These results
indicate that loading rate has little effect on scratch characteristics of
PBI. The coating has depicted about 98% and 90% visco-elastic
recovery up to a load of 1 N and 1.7 N respectively. Almost a linear
decrease in visco-elastic recovery is observed with increasing load. At
maximum load of 15 N/min, PBI coating has depicted about 58% elastic
recovery.
A comparison of AE as a function of the force with different loading
rates is shown in figure 7.9. Fluctuation in AE during scratch test
indicates coating failure. Figure 7.9 demonstrate that there is no
fluctuation in AE at any point during the scratch testing of unexposed
PBI coated panels which indicate that there is no coating failure
occurred during scratch test. To further validate these results, SEM
analysis was carried out on tested samples.
0
10
20
30
40
50
60
0 5 10 15 20
Dep
th o
f P
enet
rati
on
'Pd
' (u
m)
Force (N)
15N/min
30N/min
60N/min
a b c
a b
c
(a)
0
5
10
15
20
25
30
0 5 10 15 20
Res
idu
al D
epth
'Rd
' (u
m)
Force (N)
15N/min
30N/min
60N/min
a b c
a
b
c
(b)
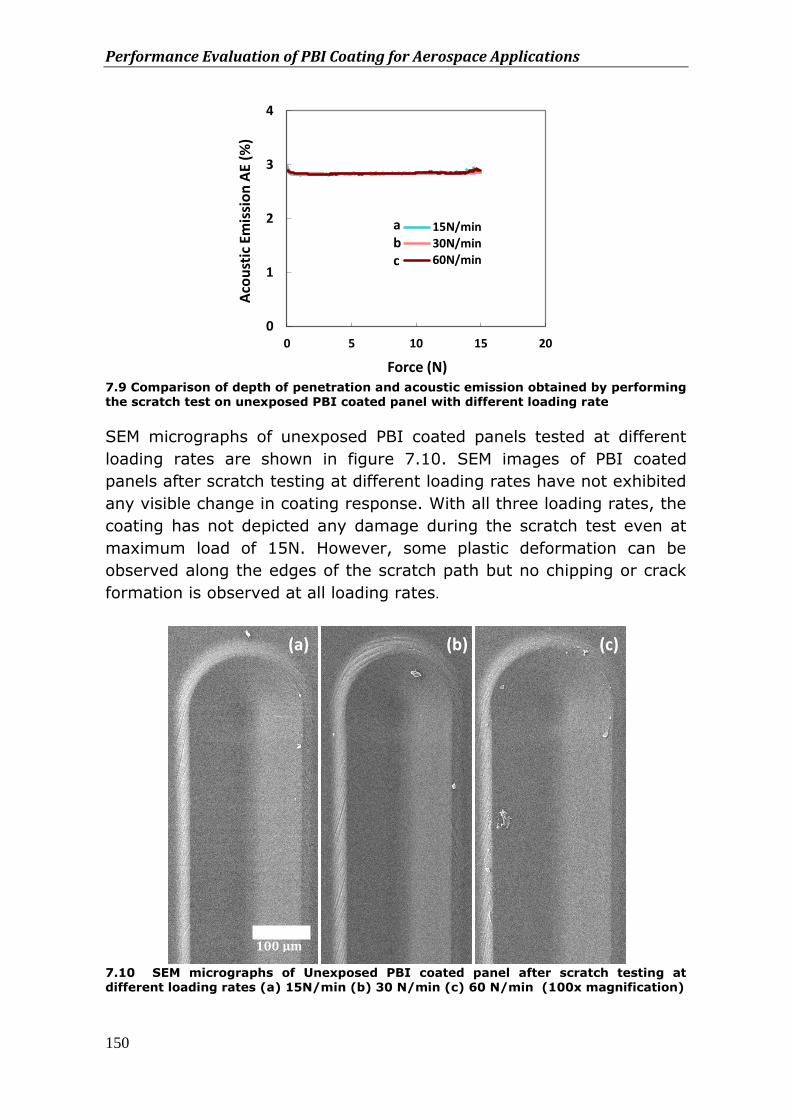
Performance Evaluation of PBI Coating for Aerospace Applications
150
7.9 Comparison of depth of penetration and acoustic emission obtained by performing the scratch test on unexposed PBI coated panel with different loading rate
SEM micrographs of unexposed PBI coated panels tested at different
loading rates are shown in figure 7.10. SEM images of PBI coated
panels after scratch testing at different loading rates have not exhibited
any visible change in coating response. With all three loading rates, the
coating has not depicted any damage during the scratch test even at
maximum load of 15N. However, some plastic deformation can be
observed along the edges of the scratch path but no chipping or crack
formation is observed at all loading rates.
7.10 SEM micrographs of Unexposed PBI coated panel after scratch testing at different loading rates (a) 15N/min (b) 30 N/min (c) 60 N/min (100x magnification)
0
1
2
3
4
0 5 10 15 20
Aco
ust
ic E
mis
sio
n A
E (%
)
Force (N)
15N/min30N/min60N/min
a b c
100 μm 100 μm μm
(a) (b) (c)
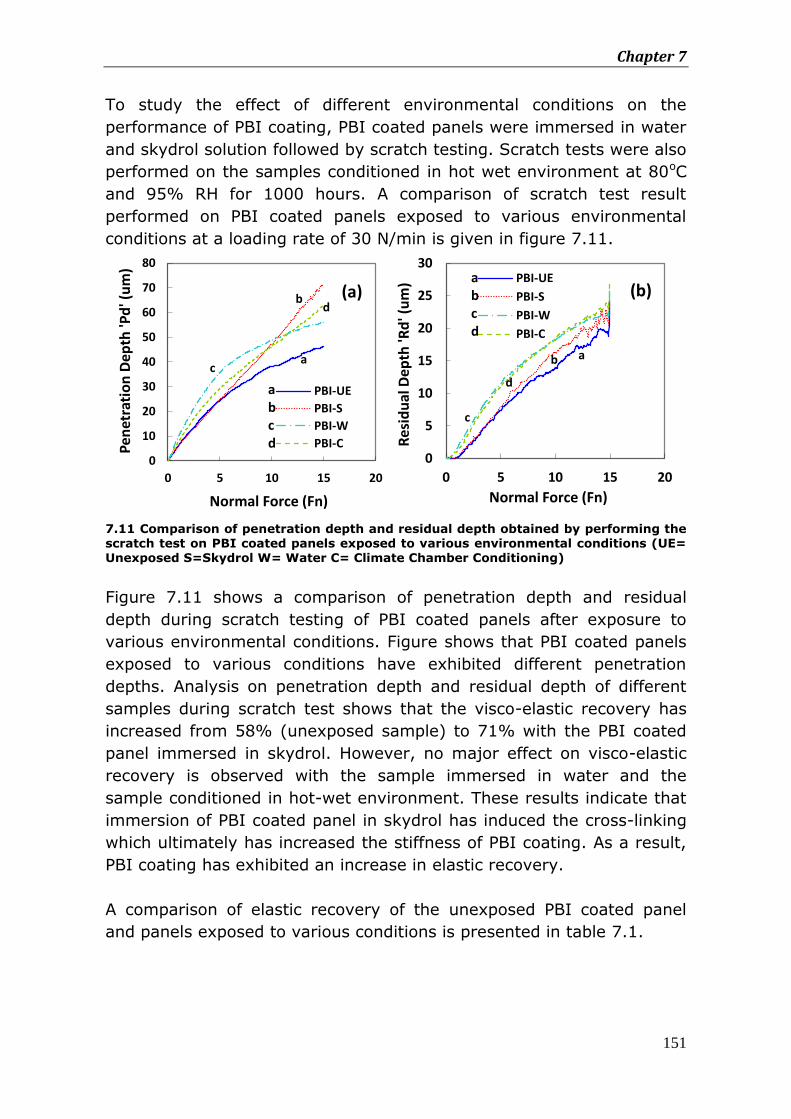
Chapter 7
151
To study the effect of different environmental conditions on the
performance of PBI coating, PBI coated panels were immersed in water
and skydrol solution followed by scratch testing. Scratch tests were also
performed on the samples conditioned in hot wet environment at 80oC
and 95% RH for 1000 hours. A comparison of scratch test result
performed on PBI coated panels exposed to various environmental
conditions at a loading rate of 30 N/min is given in figure 7.11.
7.11 Comparison of penetration depth and residual depth obtained by performing the scratch test on PBI coated panels exposed to various environmental conditions (UE= Unexposed S=Skydrol W= Water C= Climate Chamber Conditioning)
Figure 7.11 shows a comparison of penetration depth and residual
depth during scratch testing of PBI coated panels after exposure to
various environmental conditions. Figure shows that PBI coated panels
exposed to various conditions have exhibited different penetration
depths. Analysis on penetration depth and residual depth of different
samples during scratch test shows that the visco-elastic recovery has
increased from 58% (unexposed sample) to 71% with the PBI coated
panel immersed in skydrol. However, no major effect on visco-elastic
recovery is observed with the sample immersed in water and the
sample conditioned in hot-wet environment. These results indicate that
immersion of PBI coated panel in skydrol has induced the cross-linking
which ultimately has increased the stiffness of PBI coating. As a result,
PBI coating has exhibited an increase in elastic recovery.
A comparison of elastic recovery of the unexposed PBI coated panel
and panels exposed to various conditions is presented in table 7.1.
0
10
20
30
40
50
60
70
80
0 5 10 15 20
Pen
etra
tio
n D
epth
'Pd
' (u
m)
Normal Force (Fn)
PBI-UE
PBI-S
PBI-W
PBI-C
a b c d
(a)
a
b
c
d
0
5
10
15
20
25
30
0 5 10 15 20
Res
idu
al D
epth
'Rd
' (u
m)
Normal Force (Fn)
PBI-UE
PBI-S
PBI-W
PBI-C
a b c d
(b)
a b
d
c
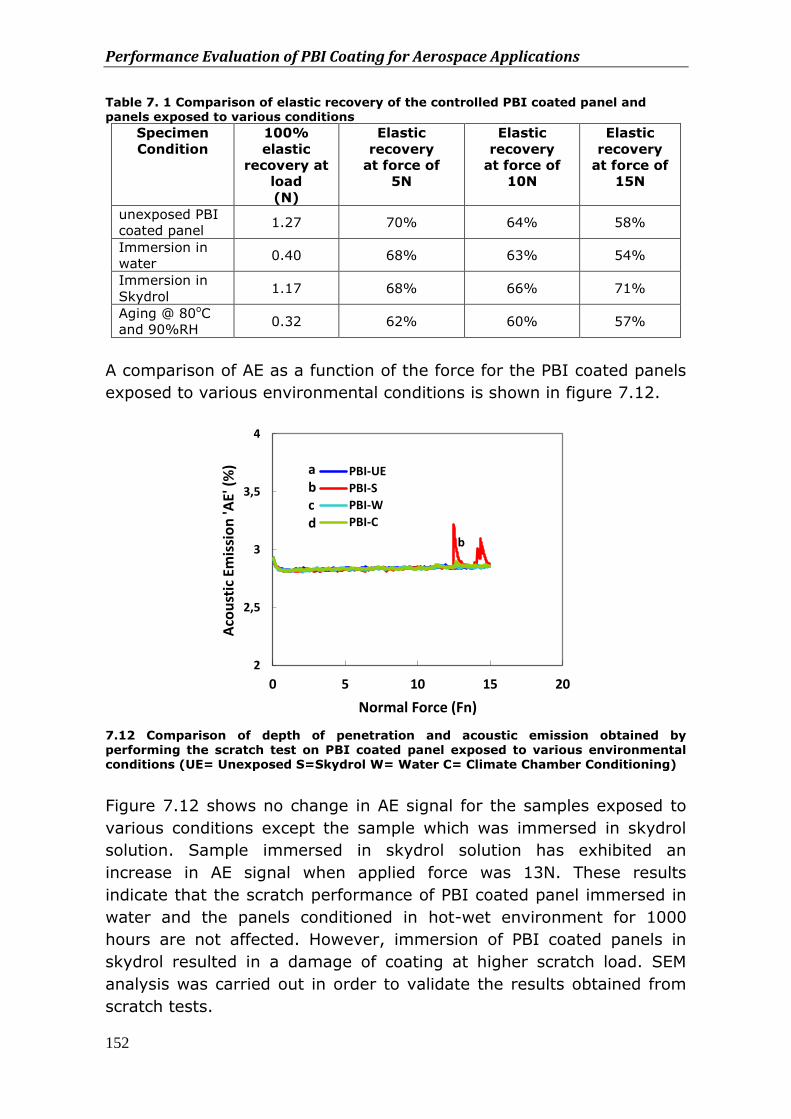
Performance Evaluation of PBI Coating for Aerospace Applications
152
Table 7. 1 Comparison of elastic recovery of the controlled PBI coated panel and
panels exposed to various conditions
Specimen
Condition
100%
elastic
recovery at
load
(N)
Elastic
recovery
at force of
5N
Elastic
recovery
at force of
10N
Elastic
recovery
at force of
15N
unexposed PBI
coated panel 1.27 70% 64% 58%
Immersion in
water 0.40 68% 63% 54%
Immersion in
Skydrol 1.17 68% 66% 71%
Aging @ 80oC
and 90%RH 0.32 62% 60% 57%
A comparison of AE as a function of the force for the PBI coated panels
exposed to various environmental conditions is shown in figure 7.12.
7.12 Comparison of depth of penetration and acoustic emission obtained by performing the scratch test on PBI coated panel exposed to various environmental conditions (UE= Unexposed S=Skydrol W= Water C= Climate Chamber Conditioning)
Figure 7.12 shows no change in AE signal for the samples exposed to
various conditions except the sample which was immersed in skydrol
solution. Sample immersed in skydrol solution has exhibited an
increase in AE signal when applied force was 13N. These results
indicate that the scratch performance of PBI coated panel immersed in
water and the panels conditioned in hot-wet environment for 1000
hours are not affected. However, immersion of PBI coated panels in
skydrol resulted in a damage of coating at higher scratch load. SEM
analysis was carried out in order to validate the results obtained from
scratch tests.
2
2,5
3
3,5
4
0 5 10 15 20
Aco
ust
ic E
mis
sio
n 'A
E' (
%)
Normal Force (Fn)
PBI-UE
PBI-S
PBI-W
PBI-C
a b c d
b
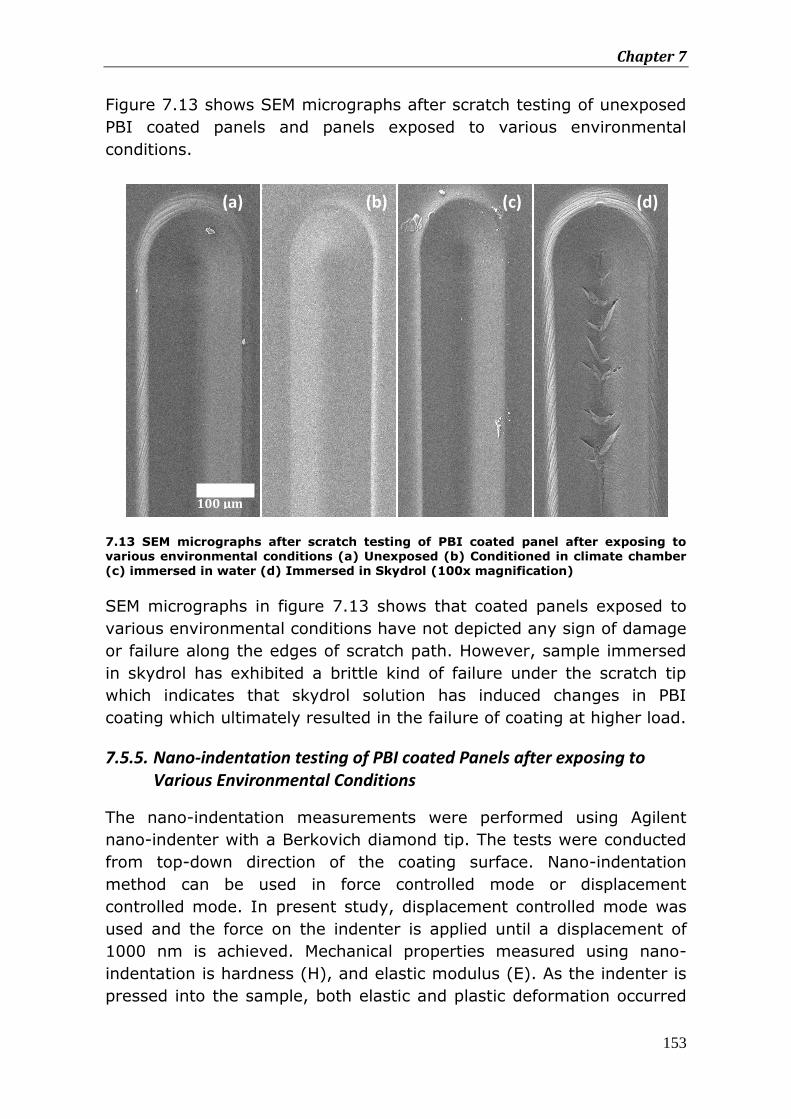
Chapter 7
153
Figure 7.13 shows SEM micrographs after scratch testing of unexposed
PBI coated panels and panels exposed to various environmental
conditions.
7.13 SEM micrographs after scratch testing of PBI coated panel after exposing to various environmental conditions (a) Unexposed (b) Conditioned in climate chamber
(c) immersed in water (d) Immersed in Skydrol (100x magnification)
SEM micrographs in figure 7.13 shows that coated panels exposed to
various environmental conditions have not depicted any sign of damage
or failure along the edges of scratch path. However, sample immersed
in skydrol has exhibited a brittle kind of failure under the scratch tip
which indicates that skydrol solution has induced changes in PBI
coating which ultimately resulted in the failure of coating at higher load.
7.5.5. Nano-indentation testing of PBI coated Panels after exposing to Various Environmental Conditions
The nano-indentation measurements were performed using Agilent
nano-indenter with a Berkovich diamond tip. The tests were conducted
from top-down direction of the coating surface. Nano-indentation
method can be used in force controlled mode or displacement
controlled mode. In present study, displacement controlled mode was
used and the force on the indenter is applied until a displacement of
1000 nm is achieved. Mechanical properties measured using nano-
indentation is hardness (H), and elastic modulus (E). As the indenter is
pressed into the sample, both elastic and plastic deformation occurred
100 μm
100 μm μm
100 μm 100 μm μm
(a) (b) (c) (d)
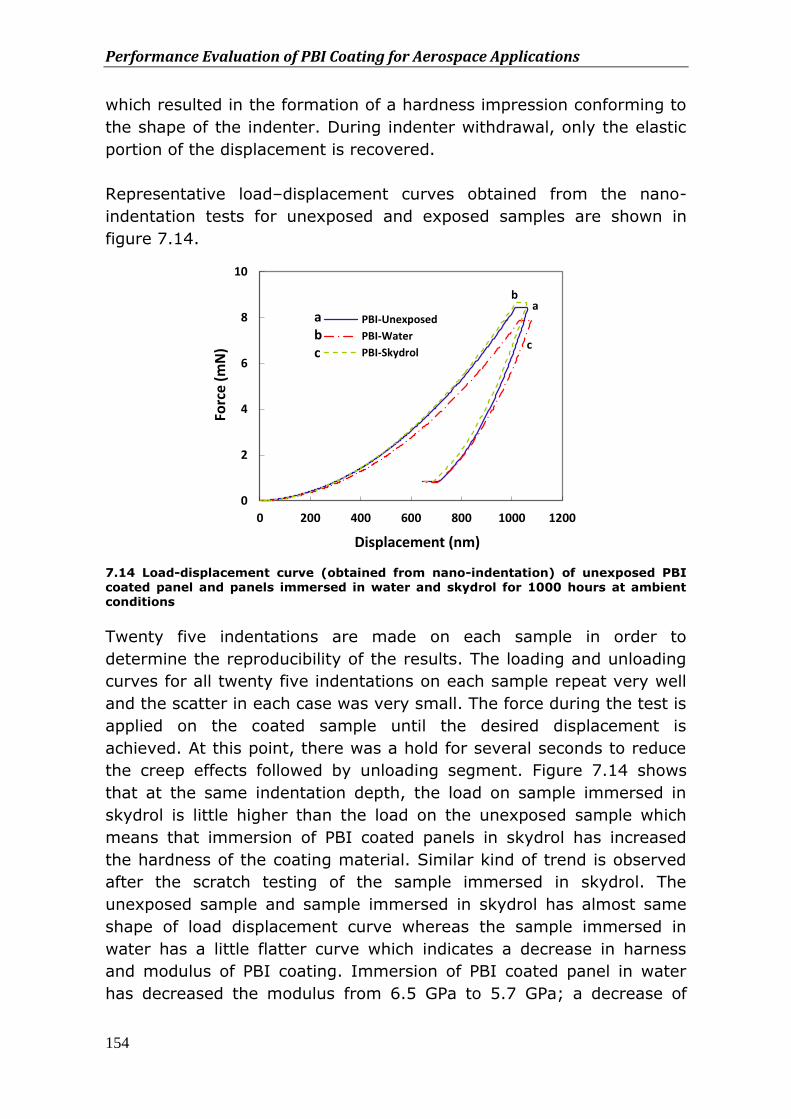
Performance Evaluation of PBI Coating for Aerospace Applications
154
which resulted in the formation of a hardness impression conforming to
the shape of the indenter. During indenter withdrawal, only the elastic
portion of the displacement is recovered.
Representative load–displacement curves obtained from the nano-
indentation tests for unexposed and exposed samples are shown in
figure 7.14.
7.14 Load-displacement curve (obtained from nano-indentation) of unexposed PBI coated panel and panels immersed in water and skydrol for 1000 hours at ambient conditions
Twenty five indentations are made on each sample in order to
determine the reproducibility of the results. The loading and unloading
curves for all twenty five indentations on each sample repeat very well
and the scatter in each case was very small. The force during the test is
applied on the coated sample until the desired displacement is
achieved. At this point, there was a hold for several seconds to reduce
the creep effects followed by unloading segment. Figure 7.14 shows
that at the same indentation depth, the load on sample immersed in
skydrol is little higher than the load on the unexposed sample which
means that immersion of PBI coated panels in skydrol has increased
the hardness of the coating material. Similar kind of trend is observed
after the scratch testing of the sample immersed in skydrol. The
unexposed sample and sample immersed in skydrol has almost same
shape of load displacement curve whereas the sample immersed in
water has a little flatter curve which indicates a decrease in harness
and modulus of PBI coating. Immersion of PBI coated panel in water
has decreased the modulus from 6.5 GPa to 5.7 GPa; a decrease of
0
2
4
6
8
10
0 200 400 600 800 1000 1200
Forc
e (
mN
)
Displacement (nm)
PBI-Unexposed
PBI-Water
PBI-Skydrol
a b c
a b
c
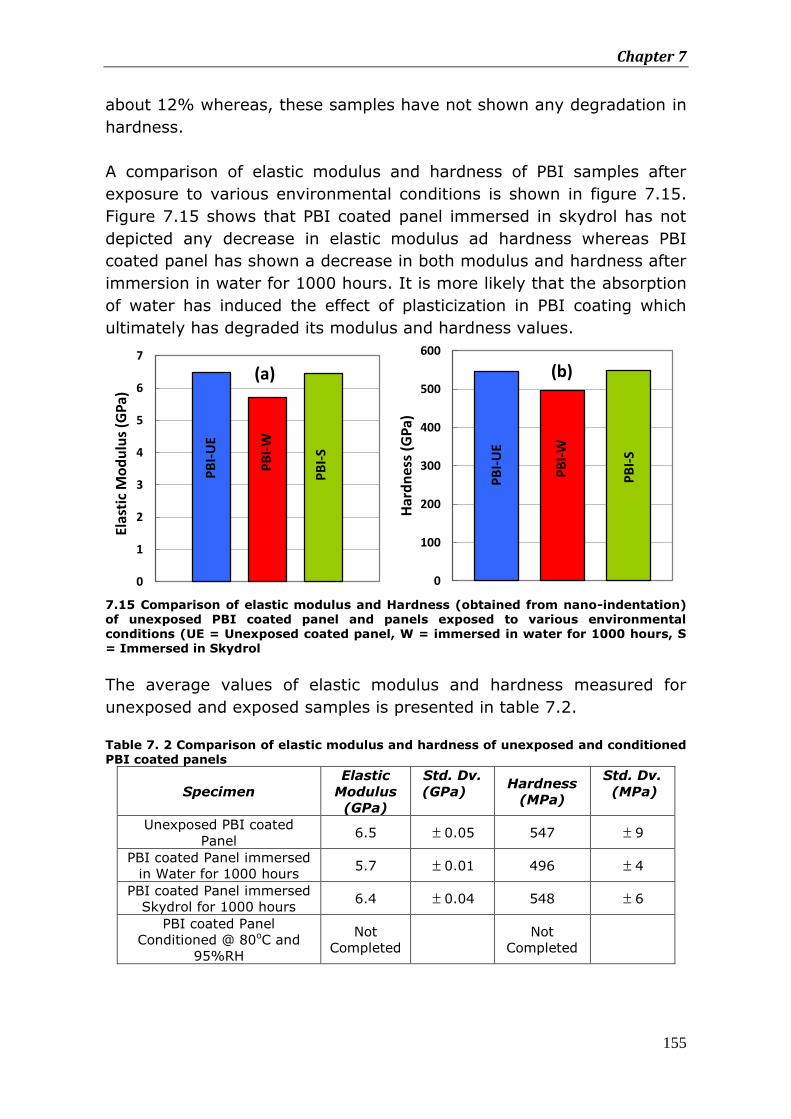
Chapter 7
155
about 12% whereas, these samples have not shown any degradation in
hardness.
A comparison of elastic modulus and hardness of PBI samples after
exposure to various environmental conditions is shown in figure 7.15.
Figure 7.15 shows that PBI coated panel immersed in skydrol has not
depicted any decrease in elastic modulus ad hardness whereas PBI
coated panel has shown a decrease in both modulus and hardness after
immersion in water for 1000 hours. It is more likely that the absorption
of water has induced the effect of plasticization in PBI coating which
ultimately has degraded its modulus and hardness values.
7.15 Comparison of elastic modulus and Hardness (obtained from nano-indentation) of unexposed PBI coated panel and panels exposed to various environmental conditions (UE = Unexposed coated panel, W = immersed in water for 1000 hours, S = Immersed in Skydrol
The average values of elastic modulus and hardness measured for
unexposed and exposed samples is presented in table 7.2.
Table 7. 2 Comparison of elastic modulus and hardness of unexposed and conditioned PBI coated panels
Specimen
Elastic
Modulus
(GPa)
Std. Dv.
(GPa) Hardness
(MPa)
Std. Dv.
(MPa)
Unexposed PBI coated
Panel 6.5 0.05 547 9
PBI coated Panel immersed
in Water for 1000 hours 5.7 0.01 496 4
PBI coated Panel immersed
Skydrol for 1000 hours 6.4 0.04 548 6
PBI coated Panel
Conditioned @ 80oC and
95%RH
Not
Completed
Not
Completed
PB
I-U
E
PB
I-W
PB
I-S
0
1
2
3
4
5
6
7
Elas
tic
Mo
du
lus
(GP
a)
(a)
PB
I-U
E
PB
I-W
PB
I-S
0
100
200
300
400
500
600
Har
dn
ess
(GP
a)
(b)
Performance Evaluation of PBI Coating for Aerospace Applications
156
7.6. Conclusions
The purpose of this study was to improve the performance of epoxy
based carbon fiber composite under the flight service environment.
Particle erosion is one of the major factors which degrade the
mechanical properties of carbon/epoxy composite. PBI coating was
applied on M21/Carbon epoxy composite and its performance was
evaluated after exposing the coated panels to various environmental
conditions. Adhesion of the coating to the substrate is evaluated by
using single lap shear test. Results obtained from lap shear testing
indicate that composite bonded joints have retained about 83% of the
joint strength even after 1000 hours of conditioning in hot-wet
environment. These results indicate that PBI adhesive has
demonstrated better resistance against moisture and humidity which
ultimately helped in maintaining the higher joints strength.
Performance of the PBI coating was evaluated by exposing the panels
to different environmental conditions. PBI coated panels were
immersed in water and skydrol for 1000 hours. Coated panels were also
conditioned in hot-wet environment at 80oC and 95% for 1000 hours.
The performance of PBI coated panels was evaluated by using scratch
test and nano-indentation test. Scratch test on unexposed PBI coated
panels show that response of the PBI coating remains unchanged when
tested at different scratch velocities. No damage is observed along the
scratch path during the scratch testing of PBI coated panels at different
scratch velocities. PBI coated panels have exhibited similar depth of
penetration and residual depth at three different scratch velocities.
Residual depth gives an indication about elastic recovery of PBI coating.
At maximum load of 15 N, PBI coating has depicted about 58% elastic
recovery.
Scratch test performed on the conditioned panels show that PBI coated
panel immersed in water and PBI coated panel exposed to hot-wet
environment has increased the depth of penetration during the scratch
test which indicates the decreased hardness of PBI coating. However,
these panels have exhibited same elastic recovery as depicted by
unexposed PBI coated panel at a maximum load of 15 N. Contrary, PBI
coated panel immersed in skydrol has depicted an increase in elastic
recovery at maximum load which indicates that immersion of PBI
coated panel in skydrol has increased the cross-linking of PBI which
ultimately has increased the elastic modulus of PBI coating. However,
Chapter 7
157
PBI coated panel immersed in skydrol has exhibited a brittle kind of
failure along the scratch path at higher load of 13 N.
Nano-indentation tests on PBI coated panels were performed to study
the effect of different environmental conditions on the hardness and
modulus of PBI coating. Results obtained from nano-indentation
indicate that immersion of PBI coated panels in water for 1000 hours
resulted in a decrease of hardness and elastic modulus about 12% and
10% respectively. However, immersion of PBI coated panel in skydrol
has exhibited a very slight increase in hardness of the coating while the
elastic modulus of the coating after immersion in the skydrol for 1000
hours remained unchanged. Results obtained from different tests
conducted on PBI coating indicate that PBI coating has retained most of
its properties even after exposure to various environmental conditions
for 1000 hours. However, further testing is required for complete
evaluation of coating.
7.7. References
1. A.P. Mouritz and A.G.Gibson, Fire Properties of polymer composite materials, Solid Mechanics and its applications, Volume 143, (2006)
2. Roger Vodika, “Accelerated Environmental Testing of Composite Materials”
DSTO-TR-0657
3. Jozeph Zahavi, “Solid Particle Erosion of Reinforced Composite Materials” Wear, 71 (1981)
4. Hegedus, Charles R., Green, William J. (Clementon, NJ), “US Patent Patent
488532” (1989)
5. Juergen H. Braun, “Titanium Dioxide’s Contribution to the Durability of Paint Films” Progress in Organic Coatings, 15 (1987)
6. Xiaodong Li, Bharat Bhushan, A review of nano-indentation continuous stiffness measurement technique and its applications, Materials Characterization, 48 (2002)
7. Tao Wen, Jianghong Gong, Zhijian Peng, Danyu Jiang, Chengbiao Wang, Zhiqiang Fu, Hezhuo Miao, Analysis of continuous stiffness data measured during nanoindentation of titanium films on glass substrate, Materials Chemistry and Physics 125 (2011)
Performance Evaluation of PBI Coating for Aerospace Applications
158
8. Michael Noeske, Jost Degenhardt, Silke Strudthoff, Uwe Lommatzsch, Plasma jet treatment of five polymers at atmospheric pressure: surface modifications and the relevance for adhesion, Int. J. Adhes. Adhes. Vol. 24, (2004)
9. J.R.J Wingfield Treatment of composite surfaces for adhesive bonding, int. J. Adh. & Adh. Vol. 13 (1993)
159
CHAPTER 8
Conclusions and Recommendations for Future Work
With the increasing use of polymer based composite materials, there is
an increasing demand of polymer resins with high glass transition
temperature (Tg), high thermal stability and excellent mechanical
properties at high temperature. Polybenzimidazole (PBI) is a recently
emerged high performance polymer. Due to its excellent thermal and
mechanical properties, PBI has great potential to be used for many high
temperature applications. However, in powder form, it has very high
melt viscosity which is too high to allow its processing by conventional
manufacturing techniques. Therefore, the processing of PBI itself is a
real challenge. Most of the PBI applications are found in the form of
molded parts. Due to high processing temperature and pressure
requirement, PBI has not won the attraction for many applications.
However, recently, PBI is also available in solution form but its
performance has not been explored for potential applications. Due to its
high thermal stability and mechanical properties, PBI has great
potential to be used for many high temperature applications. Therefore,
objective of this work was to optimize the processing of PBI using PBI
solution and to evaluate its performance for potential aerospace
applications. Based on the results obtained I this work, following
conclusions are made.
8.1. Conclusions
8.1.1. Compression Molding of PBI
In present study, compression molding process was used to form the
molded parts of PBI. Efforts were made to enhance the processability of
the polymer by varying different parameters during processing.
Compression molding process was performed by heating and pressing
Conclusions and Recommendations for Future Work
160
the PBI powder by heating the polymer at 440°C and by varying the
pressure between 10 MPa and 50 MPa. Heating of pre-dried PBI resin
close to its glass transition temperature for 30 minutes followed by
pressing the PBI resin at a pressure of 50 MPa was the most optimum
method which has formed compression molded parts of PBI with
desired tensile properties. Due to high processing temperature and
pressure requirement, the initial idea of manufacturing the CNFs
reinforced PBI molded parts was postponed. Due to amorphous nature
of PBI, it was not possible to melt PBI powder in order to disperse
nano-fibers. Therefore, dry mixing was the only way to mix the nano-
fibers into the PBI resin. It was expected that dry mixing of CNFs would
result in poor interfacial adhesion which would ultimately led towards
poor mechanical properties of PBI nano-composite. At this point, it was
concluded that manufacturing of PBI nano-composite using
compression molding process will not be a feasible and economical way
to form PBI parts for aerospace application.
8.1.2. Solution Casting of PBI film
Due to high processing temperature and pressure requirement for
compression molding PBI, we started to rethink about other methods to
manufacture PBI nano-composite and to explore its potential for
different aerospace applications. Due to its excellent thermal properties
and superior non-flammability, PBI has been used for firefighters’
protective clothing and high-temperature gloves. However,
performance of PBI in the form of film, coating or adhesive has not
been explored for potential aerospace applications. Also, nano-
composite of PBI has not been manufactured till date. Therefore, the
main objective of this study was to optimize the processing of unfilled
and CNFs reinforced PBI film with high thermal and mechanical
properties. Furthermore, the potential of PBI was explored for different
aerospace applications as a film and coating material. The nano-
composite PBI films using PBI solution were prepared with CNFs
contents of 0.5 wt%, 1 wt% and 2 wt%. SEM was carried out to
examine the dispersion of CNFs in PBI films. SEM analysis has revealed
that sample prepared by direct mixing of CNFs into PBI has shown large
agglomeration Whereas, samples manufactured using bath sonication
followed by mechanical mixing have revealed uniform dispersion of
CNFs with all fiber loadings. Therefore, in conclusion, bath sonication
followed by mechanical stirring seems to be an effective technique for
the dispersion of CNFs into PBI.
Chapter 8
161
8.1.3. Thermal and Mechanical Properties of PBI
Thermal and mechanical properties of compression molded PBI, unfilled
PBI film and nano-composite films were investigated using TGA, DMA
and tensile testing. TGA analysis shows that both compression molded
PBI and PBI film has depicted high thermal stability even up to a
temperature of 550oC. TGA curve of PBI has shown two steps
decomposition both in the molded form and in the form of film.
Compression molded PBI has shown only 5% weight loss up to the
temperature of 545°C. This weight loss is significantly low when
compared to other polymers. However, PBI film has revealed a higher
weight loss as compare to the weight loss of compression molded PBI.
It has shown a weight loss of about 8% up to a temperature of 150°C.
The higher weight loss of PBI film up to this temperature is due to the
fact that PBI film exhibits higher tendency to absorb moisture from
surrounding. Due to higher moisture absorption, PBI film has depicted
higher weight loss in the first degradation step. After the first
degradation step, PBI film has shown thermal stability and it only
exhibited 4% weight loss from a temperature of 150°C to a
temperature of 550°C. PBI film has shown a total weight loss of about
12% up to a temperature of 550°C.
DMA studies indicate that both compression molded PBI and PBI neat
film exhibited a storage modulus of 3.81 GPa and 3.12 GPa even at a
temperature of 250oC. Addition of 2 weight percent CNFs has improved
storage modulus of PBI film about 48% at a temperature of 250oC.
Also, no sharp decrease in storage modulus is observed with nano-filled
PBI which demonstrates the effectiveness of dispersing CNFs in PBI.
Mechanical testing shows that both compression molded PBI and PBI
film exhibited highest ultimate tensile strength compared to any unfilled
polymer. These results end up with the conclusion that PBI with high
thermal and mechanical properties can be an excellent candidate for
different high temperature applications. Furthermore, addition of CNFs
in the PBI polymer has improved both thermal and mechanical
properties of PBI which will be beneficial for different high temperature
applications of polymer.
8.1.4. Testing in LEO Simulated Environment
The performance of PBI under the simulated LEO environmental
conditions was evaluated. Effect of CNFs on the erosion yield and
Conclusions and Recommendations for Future Work
162
mechanical properties of PBI was also studied in present work. Results
show that both unfilled PBI and nano-filled PBI have shown high
erosion yield values. Contrary to the high erosion yield values, both
unfilled and nano-filled PBI have shown very slight decrease in
mechanical properties. Unfilled PBI has shown a decrease in tensile
strength of about 9% whereas, CNFs reinforced PBI exhibited a
decrease in tensile strength of about 3% when exposed to total AO
dose values of 0.65x10²⁰ atoms/cm2 with energy of 0.04eV. Results
obtained from mechanical testing of LEO exposed samples indicate that
mass loss obtained during the exposure to simulated LEO
environmental conditions could be a misleading value. Keeping the
samples in the vacuum oven at 125oC has proved this fact that almost
all the mass loss of PBI was due to the removal of the moisture rather
than the erosion due to AO attack. Therefore, it is concluded that
mechanical properties of unfilled and nano-filled PBI are not very much
affected under the influence of simulated LEO environmental conditions
with an AO dose used in this study. Furthermore, nano-fillers have
improved the performance of PBI as compared to the unfilled PBI.
However, further study is required to accurately determine the erosion
yield data for unfilled and nano-filled PBI.
8.1.5. Radiation Testing
Unfilled and nano-filled PBI samples were exposed to gamma
radiations, electron radiations and mixed radiations. TGA shows that all
three kinds of radiations have induced cross-linking in PBI which
ultimately has increased the thermal stability particularly at high
temperature. DMA experiments performed on unfilled PBI after
irradiation revealed an improvement in storage modulus and glass
transition temperature. These results indicate that irradiation of unfilled
PBI has enhanced the thermo-mechanical properties of PBI. DMA
experiments performed on nano-filled PBI demonstrate that irradiation
has slightly increased the storage modulus through the whole
temperature range whereas, glass transition temperature remained
unaffected. These results demonstrate that addition of CNFs to PBI is
helpful in maintaining the storage modulus even at a temperature of
around 300oC. Tensile testing of controlled and irradiated samples of
unfilled and nano-filled PBI shows that gamma radiations and electron
radiations has very slightly degraded the tensile strength of unfilled
PBI. However, these radiations have affected the failure strain to some
extent. Results obtained during this study are quite encouraging and
Chapter 8
163
further studies could be performed by using higher radiation dose and
higher temperature values to evaluate the performance of PBI.
8.1.6. Fire Testing of PBI Coating
The purpose of this study was to improve the fire performance of epoxy
based carbon fiber composite with unfilled and nano-filled PBI coating.
Cone calorimeter results show that the unfilled PBI coating did not
improve the fire retardancy of the carbon/epoxy composite in terms of
average HRR, peak HRR and CO yield. Contrary to the unfilled PBI
coating; CNFs PBI coating has shown a significant improvement in the
fire retardant properties of the carbon/epoxy composite. About 60%
reduction in average HRR and 40% reduction in PHRR of carbon/epoxy
composite is observed with nano-filled PBI coating. Smoke and CO are
also of concern during a fire in an aircraft as most deaths during a fire
occur due to reduced visibility and the inhalation of toxic gases. Nano-
filled PBI coating has reduced the smoke and CO emissions up to 73%
when compared to the uncoated carbon/epoxy composite. A significant
outcome of this work is that CNFs, even when present in very small
quantities, can be more effective in improving the fire performance of
an inherently flame retardant material. With a low coating thickness,
such an improvement in fire properties is quite remarkable.
8.1.7. Lap Shear Testing of PBI
In present study, performance of PBI as an adhesive was evaluated for
aerospace applications. Bonded joints of epoxy based carbon fiber
composite were formed using PBI adhesive. Atmospheric pressure
plasma treatment (APPT) was used to improve the adhesion properties
of composite materials. Results obtained from contact angle
measurement after APPT shows that APPT has improved the wetting
properties of epoxy based carbon fiber composite. Current work shows
that during APPT, surface temperature of composite materials have
raised to above 200oC in very short duration of time and this
temperature was well above glass transition temperature of composites
used in this study. This high temperature can induce residual thermal
stresses and also have an impact on mechanical properties. Therefore,
one of the important conclusions of this study is that thermal properties
of polymer based composite materials should always be considered
before performing APPT. APPT can significantly damage the surface as
well as bulk properties of the materials. Therefore, it is important to
optimize the height of the plasma nozzle from composite surface and
Conclusions and Recommendations for Future Work
164
plasma treatment time. By increasing the height of the plasma nozzle
from composite, the temperature generated at the surface can be
reduced which would have less affect on bulk properties of the
materials. Another important observation of this study is that surface
topography of composite is another crucial factor to achieve high bond
strength. Surface topography of composite material was studied
sequentially with increasing plasma treatment time. With increasing
treatment time, surface roughness of composites has increased. The
increase in surface roughness is correlated with the increase in surface
temperature during APPT. Surface temperature during APPT reached
above glass transition temperature of polymer and polymer based
composite. This increase in surface temperature caused local
rearrangement of molecules and in case of unfilled PEEK, local melting
is observed which ultimately resulted in increased surface roughness.
Bonded joints of epoxy based composite were conditioned at 80oC and
95% humidity. Exposure of bonded joints to hot-wet environment for
1000 hours has reduced the lap shear strength of about 17%. These
results indicate that hot-wet environment has not significantly
deteriorated the performance of PBI adhesive even after 1000 hours of
conditioning. However, testing of PBI adhesive bonded composite joints
at 80oC has reduced the lap shear strength to about 50%. Despite of
the fact that PBI has very high thermal stability and can maintain
thermo-mechanical properties even at a temperature of 300oC, still PBI
adhesive bonded joints have revealed a significant decrease in lap
shear strength. These results indicate that performance of bonded
joints not only depends on the properties of the adhesive but it also
depends on thermo-mechanical properties of substrates. Without
performing the detail testing of PBI adhesive using different substrate
materials, a conclusive statement cannot be made about the high
temperature performance of PBI adhesive.
8.1.8. Testing for Aircraft Application
Performance of PBI was also evaluated as coating material to protect
the epoxy based carbon fiber composite under the aircraft flight service
environment. PBI coating was applied on M21/Carbon epoxy composite
and its performance was evaluated after exposing the coated panels to
various environmental conditions. PBI coated panels were immersed in
water and skydrol for 1000 hours. Coated panels were also conditioned
in hot-wet environment at 80oC and 95% for 1000 hours. The
performance of PBI coated panels was evaluated by using scratch test
Chapter 8
165
and nano-indentation test. Scratch test performed on the conditioned
panels revealed that depth of penetration during the scratch test has
increased after immersion of PBI coated panel in water and also after
exposure of coated panels to hot-wet environment. These results
indicate that exposure of PBI coating to these environmental conditions
has reduced its hardness. However, these panels have not exhibited
any change in elastic recovery up to a maximum load of 15 N. On the
other hand, PBI coated panel immersed in skydrol has depicted an
increase in elastic recovery at maximum load which indicates that
immersion of PBI coated panel in skydrol has increased the cross-
linking of PBI which ultimately has increased the elastic modulus of PBI
coating. However, PBI coated panel immersed in skydrol has exhibited
a brittle kind of failure along the scratch path at a load of 13 N.
Nano-indentation tests on PBI coated panels were performed to study
the effect of different environmental conditions on the hardness and
modulus of PBI coating. Results obtained from nano-indentation
indicate that immersion of PBI coated panels in water for 1000 hours
resulted in a decrease of hardness and elastic modulus of about 12%
and 10% respectively. However, immersion of PBI coated panel in
skydrol has exhibited a very slight increase in hardness of the coating
whereas the elastic modulus of the coating after immersion in the
skydrol for 1000 hours remained unchanged. Results obtained from
different tests conducted on PBI coating indicate that PBI coating has
retained most of its properties even after 1000 hours exposure to
various environmental conditions.
8.2. Recommendations for future work
1. The manufacturing process of unfilled and CNFs reinforced PBI
film was optimized and material has exhibited high thermal and
mechanical properties. However, PBI film has depicted higher
mass loss between the temperature of 50oC and 150oC as
compare to the mass loss of compression molded PBI. It was
proposed that this loss in weight was due to the loss of water or
DMAc present in the film. However, the exact reason of this
weight loss could not be determined. Therefore, it is
recommended that thermo-gravimetric analysis along with mass
spectroscopy should be performed. A more realistic reason of
higher mass loss between the temperature of 50oC and 150oC can
Conclusions and Recommendations for Future Work
166
be determined when TGA will be performed along with mass
spectroscopy.
2. PBI film was manufactured by solution casting followed by
immersion of film in hot water for about an hour in order to
remove the DMAc solvent. Afterwards, the film was hot pressed
at a temperature of 225oC in order to further remove the water
and solvent contents. It is more likely that due to the immersion
of film in hot water after removing from the glass plate,
mechanical properties of the film are affected. It is expected that
immersion of film in hot water resulted in decreased tensile
strength and increased tensile strain due to the effect of
plasticization. The purpose of keeping the film in hot water was to
remove the maximum solvent contained by the film. It is
recommended for future work that mechanical testing of PBI
should be performed without keeping the film in hot water for
longer time. This will help in determining the effect of long term
water exposure on thermal and mechanical properties of PBI.
3. The performance of PBI under the simulated LEO environmental
conditions was evaluated. Both unfilled PBI and nano-filled PBI
have shown high erosion yield values when exposed to atomic
oxygen. Contrary to the high erosion yield values, mechanical
properties of both unfilled and nano-filled PBI are very little
affected. Unfilled PBI has shown a decrease in strength of about
9% while CNFs reinforced PBI exhibited a decrease in strength of
about 3% when exposed to total dose values 0.65x10²⁰
atoms/cm2. High erosion yield and low affect on mechanical
properties after exposure of PBI film to atomic oxygen are two
contradictory results. Therefore, it is recommended that before
exposure of PBI film to the atomic oxygen, it should be dried in a
vacuum oven at 150oC. Afterwards, it should be immediately
transferred to LEO simulated facility to expose the film to atomic
oxygen. After removing from the LEO simulation facility, the
weight of the film should be taken immediately. This procedure
will give a better idea about the erosion yield of PBI and it will
also give a more accurate indication about the potential of PBI to
be used in LEO environment.
Chapter 8
167
4. PBI film was exposed to atomic oxygen for a dose value of
0.65x10²⁰ atoms/cm2 with energy of 0.04eV. In real space
environment, AO strikes the material with energy of 5eV which is
much higher than the energy used in this study. Therefore, it is
recommended that performance of PBI should also be evaluated
by using high energy atomic oxygen with higher dose values.
5. Unfilled and nano-filled PBI films were exposed to gamma
radiations, electron radiations and mixed radiations. PBI was
exposed to different radiations in air environment at ambient
temperature. Results obtained under these conditions are quite
encouraging. However, space environment consist of ultra high
vacuum and thermal cycling. Therefore, further studies should be
performed on PBI by irradiating the material under vacuum and
thermal cycling environment. Material should also be tested at
higher dose values. These steps will give more realistic idea about
the potential of PBI for space application.
6. PBI was used as a coating to improve the fire resistance
performance of epoxy based carbon fiber composite used for
structural application in aircraft. Results obtained from cone
calorimeter test indicated that unfilled PBI coating could not
improve the fire retardant performance of carbon/epoxy
composite. However, CNFs reinforced PBI coating have shown a
significant improvement in the fire retardant properties of the
carbon/epoxy composite. In present study, only two weight
percent of CNFs was dispersed in PBI coating which has
significantly improved the performance of PBI. Further study can
be performed by increasing the contents of CNFs. Increased
quantity of CNFs can help in further improving the quality of the
carbonaceous layer which will ultimately reduce the ingress of the
heat down towards the structural part.
7. In present study, the cone calorimeter test was run for about 15
minutes while using nano-filled PBI coating. There are some
specific requirement from FAA for structural materials after 2
minutes and 5 minutes fire testing. Therefore, while performing
the cone calorimeter test, test should be stop at 2 minutes and 5
minutes and then flexure properties of carbon/epoxy composite
Conclusions and Recommendations for Future Work
168
8. should be determined in order to evaluate the effect of fire on
mechanical properties of structural composite.
9. Testing of PBI adhesive bonded joints of carbon/epoxy composite
at 80oC has reduced the lap shear strength to about 50%.
Despite of the fact that PBI has very high thermal stability and
can maintain thermo-mechanical properties even above 300oC,
still PBI adhesive bonded joints have revealed a significant
decrease in lap shear strength. These results indicate that
performance of bonded joints not only depends on the properties
of the adhesive but it also depends on thermo-mechanical
properties of substrates. Therefore, it is important to evaluate the
performance of PBI adhesive by using substrate materials with
different glass transition temperatures and different coefficient of
thermal expansions. Testing of PBI adhesive with different
substrate materials will give a clear indication about the high
temperature performance of PBI adhesive.
10. PBI was also used as a coating to improve the performance
of epoxy based carbon fiber composite under the flight service
environment of aircraft. Performance of the PBI coating was
evaluated by exposing the PBI coated panels to different
environmental conditions. PBI coated panels were immersed in
water and skydrol for 1000 hours. Coated panels were also
conditioned in hot-wet environment at 80oC and 95% for 1000
hours. PBI coating has depicted better performance under these
conditions. However, during the actual flight service environment,
the coating is also exposed to UV radiations which could severely
degrade the coating properties in the presence of temperature
and humidity. Therefore, it is important to evaluate the
performance of the coating after exposing the coating panel to UV
radiations along with high temperature and humidity. This will
give a real indication about potential of PBI coating for aircraft
application.

169
CURRICULUM VITAE
170
CURRICULUM VITAE
The first day of the New Year bring the happiness as the author was
born on January 01, 1980. The author has completed his B.Sc
Mechanical Engineering from University of Engineering and Technology
Lahore in 2005. After graduating, he joined Dynamic Equipment &
Control and worked there for one year as a project engineer. In 2005,
he joined institute of space technology (IST) and worked there as a
researcher for one year. The Author was awarded a scholarship for
M.Sc studies by Institute of Space Technology. After searching different
universities, the author’s ultimate destination was Delft University of
Technology. He obtained his Master of Science degree in Aerospace
Engineering in 2008.
After completing his M.Sc, the author was given an opportunity to
pursue his PhD at Aerospace Department in the group of Aerospace
Materials. He started his PhD in September 2008 under the supervision
of Prof. Dr. Rinze Benedictus and Dr. Shantanu Bhowmik. He worked on
the thesis entitled “Performance Evaluation of Polybenzimidazole for
Potential Aerospace Applications”. During his PhD research, he has
communicated his work in various reputed international journals and
conferences.
LIST OF PUBLICATIONS
171
LIST OF PUBLICATIONS
Journal Publications:
1. H.M.S.Iqbal, S.Bhowmik and R.Benedictus, Process Optimization
of Polybenzimidazole Adhesive for High Temperature Applications,
International Journal of Adhesion and Adhesives, Vol. 48 (2014).
2. H.M.S.Iqbal, S.Bhowmik and R.Benedictus, Study of the fire
resistant behavior of unfilled and carbon nanofibers reinforced
polybenzimidazole coating for structural applications, Polymers
for Advanced Technologies, (2013)
3. Adhesion Characteristics of High Temperature Resistant Polymer,
Journal of Adhesion Science and Technology, Vol. (2012)
4. H.M.S.Iqbal, S.Bhowmik and R.Benedictus, Processing and
Characterization of Space durable High Performance Polymeric
Nano-composite, AIAA journal of Thermo-Physics and Heat
Transfer, Vol. (2011)
5. H.M.S. Iqbal, S.Bhowmik and R. Benedictus, Surface Modification
of PEEK by Atmospheric Pressure Plasma and failure mechanism
of Adhesive bonded Joint, International Journal of Adhesion and
Adhesives, Vol. (2010)
6. H.M.S. Iqbal, S.Bhowmik and R. Benedictus, Modification of High
Performance Nano Adhesive Bonding of Glass fiber reinforced and
Carbon Fiber reinforced Polyphenylene Sulfide using Plasma
treatment and high energy Radiations, Journal of Polymer
Engineering and Science, Vol. (2010)
LIST OF PUBLICATIONS
172
7. Experimental Investigation into The Effect of Adhesion Properties
of PEEK modified by Atmosheric Pressure Plasma and Low
Pressure Plasma, Vol. (2010)
List of Conference Publications:
1. H.M.S. Iqbal, S.Bhowmik and R. Benedictus, Development of
Nanofibers Reinforced polymer composite for space application,
17TH International Conference on Composite Materials, 27th –
31st July 2009
2. H.M.S. Iqbal, M.I.Faraz, S.Bhowmik and R. Benedictus,
Comparative Study of Adhesion Properties of High Performance
Polymer Modified by Atmospheric Pressure Plasma and Low
Pressure Plasma, 25th International Symposium SWISS
BONDING, 11th-13th May, 2009, Switzerland.
3. H.M.S. Iqbal, S.Bhowmik and R. Benedictus, Thermo-mechanical
Characteristics of Space Durable Adhesive Joint of High
Performance Polymer, 50th AIAA/ASME/ASCE/ASC Structural
Dynamics, and Materials Conference, 4th – 7th May, 2009, Palm
spring, California.
4. S. Bhowmik, R. Benedictus, H.M.S.Iqbal and M.I.Faraz,
Application of Polymeric Nano-Composites at Low Earth Orbit and
Geosynchronous Earth Orbit, 13th European Conference on
Composite Materials, June 2-5 2008 Stockholm, Sweden
Articles to be communicated:
1. Study the thermal Effects of Atmospheric Pressure Plasma
Treatment on surface topography and surface energy of
Unidirectional Epoxy based Carbon Fiber Composite,
communicated to International Journal of Adhesion and Adhesives
2. H.M.S. Iqbal, S.Bhowmik and R. Benedictus, Study the Effect of
Simulated Low Earth Orbit on thermal and mechanical properties
of Polybenzimidazole, to be communicated to AIAA journal
LIST OF PUBLICATIONS
173
3. H.M.S. Iqbal, S.Bhowmik and R. Benedictus, Comparitive study
on Thermo-Mechanical Properties of Unfilled and Nano-filler
Reinforced Polybenzimidazole in Simulated Low Earth Orbit
conditions, to be communicated to AIAA journal
4. H.M.S. Iqbal, S.Bhowmik and R. Benedictus, Study the Effect of
High Energy Radiations on thermal and mechanical properties of
Polybenzimidazole, to be communicated to AIAA journal
5. Performance Evaluation of Polybenzimidazole Adhesive under
Various Environmental Conditions, to be communicated to
International Journal of Adhesion and Adhesives
6. Performance Evaluation of Polybenzimidazole Coating for Aircraft
Application, to be communicated to Journal “Progress in Organic
Coatings”
ACKNOWLEDGEMENT
174
ACKNOWLEDGEMENT
Many people have made contribution to this thesis in a direct or indirect
way. First of all, I would like to thank my promoter Rinze Benedictus
and my daily supervisor Shantanu Bhowmik for their guidance and
supervision during my PhD work.
Financial resources are very important for any project. Doing research
on any idea sometime becomes impossible due to financial limitations
and same was the case with me. I had an idea to work on but no
financial resources. Under these circumstances, my promoter Rinze
Benedictus did his efforts to get some money from first money stream
in order to start working on proposed project. I am especially thankful
to Rinze for his efforts under difficult financial conditions. Also special
thanks to my daily supervisor Shantanu Bhowmik who convinced Rinze
to generate the financial resources for my PhD research work.
I would like to thank my group secretary Gemma for her help and
support to handle all kind of administrative matters during my PhD. I
would like to extend my thanks to my friends and colleagues Amir,
Gustavo, Sharif, Ricaardo, Shafqat, Ping Liu, Rafi, Chris, Akram,
Iftikhar, Greg , Milan, Mina and Jesus. Thank you all of you guys for
having good time with me. I would like to thank Santiago and Maruti
for useful technical discussions and suggestions. I especially appreciate
the support of Maruti for performing my experiments on TGA and DMA
equipments.
I would like to thank to Dr. Jansen from mechanical engineering
department for performing moisture absorption study and Dr. Erik from
Civil engineering department for performing nano-indentation tests.
I would like to thank Bob, Frans, serge and Fred from Delft Aerospace
Laboratory for their help and support to perform the experimental
ACKNOWLEDGEMENT
175
work. I would also like to thank to Bus from Chemical engineering
department for his help to perform AFM equipment.
I owe my special thanks to my parents for their support and
encouragement throughout my career. Their prayers have been a
source of motivation and strength for me. I am also greatly thankful to
my younger brother Naeem for taking care of all the family members
back to home in my absence. Without his support, it would almost
impossible for me to accomplish my PhD. I would like to extend my
thanks to my parents-in-law for their prayers and support during my
PhD.
Last but not least, a special thanks to my wife for her support during
my PhD. I appreciate her patience during my long working hours. Her
patience during the days of her serious illness is admirable. Without her
understanding and patience, I would not be able to complete this
research work.