Key words: Internal audit, organizational performance and performance measurement.
Upload
khangminh22Category
view
3download
0
1
Performance Measurement and Evaluation
Performance Pyramid
Q1: Which of the following statements about the performance pyramid (developed
by Lynch and cross) are true?
(i) The pyramid focues on a range of objectives for external effectiveness and internal
efficiency.
(ii) The pyramid encourages organizations to look at performance measures in relation
to a wide range of stakeholder groups, such as customers, employees and suppliers.
(iii) The hierarchical levels for the pyramid encourage operational performance
measures to be linked to strategic goals.
(i) (i) And (ii) only
(ii) (i) and (iii) only
(iii) (ii) and (iii) only
(iv) (i), (ii) and (iii)
Practical Questions on Economic value added (EVA)
Q2:Which of the following statement about EVA is/are correct:
(i) EVA is equal to the net operating profit after tax (NOPAT) less a capital charge,
where the capital charge is the weighted average cost of capital multiplied by net
assets.
(ii) EVA is based on economic profit which is derived by making a series of
adjustments to accounting profits.
(iii) EVA is an absolute measure, as compared to a relative one such as ROCE.
(i), (ii) and (iii)
(i) and (ii) only
(ii) and (iii) only
(ii) only
Answer:- (ii) and (iii) only
Q3: An investment centre has reported operating profits of $21 million. This was after charging $4
million for the development and launch costs of a new product that is expected to generate profits for 4
years. Taxation is paid at the rate of 25% of the operating profit.
The company has a risk adjusted weighted average cost of capital of 12% per annum and is paying
interest at 9% per annum on a substantial long term loan.
The investment centre’s non-current asset value is $50 million and the current assets have a value of $22
million. The replacement cost of the noncurrent assets is estimated to be $64 million.
2
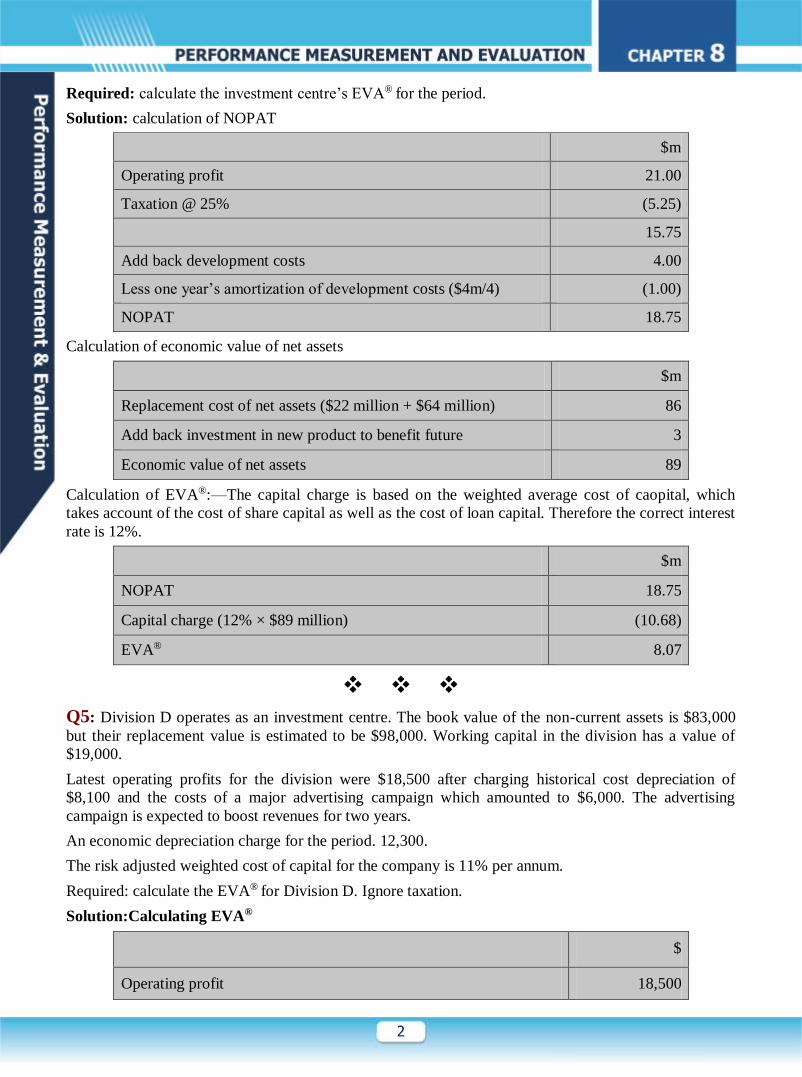
Required: calculate the investment centre’s EVA® for the period.
Solution: calculation of NOPAT
$m
Operating profit 21.00
Taxation @ 25% (5.25)
15.75
Add back development costs 4.00
Less one year’s amortization of development costs ($4m/4) (1.00)
NOPAT 18.75
Calculation of economic value of net assets
$m
Replacement cost of net assets ($22 million + $64 million) 86
Add back investment in new product to benefit future 3
Economic value of net assets 89
Calculation of EVA®:—The capital charge is based on the weighted average cost of caopital, which
takes account of the cost of share capital as well as the cost of loan capital. Therefore the correct interest
rate is 12%.
$m
NOPAT 18.75
Capital charge (12% × $89 million) (10.68)
EVA® 8.07
Q5: Division D operates as an investment centre. The book value of the non-current assets is $83,000
but their replacement value is estimated to be $98,000. Working capital in the division has a value of
$19,000.
Latest operating profits for the division were $18,500 after charging historical cost depreciation of
$8,100 and the costs of a major advertising campaign which amounted to $6,000. The advertising
campaign is expected to boost revenues for two years.
An economic depreciation charge for the period. 12,300.
The risk adjusted weighted cost of capital for the company is 11% per annum.
Required: calculate the EVA® for Division D. Ignore taxation.
Solution:Calculating EVA®
$
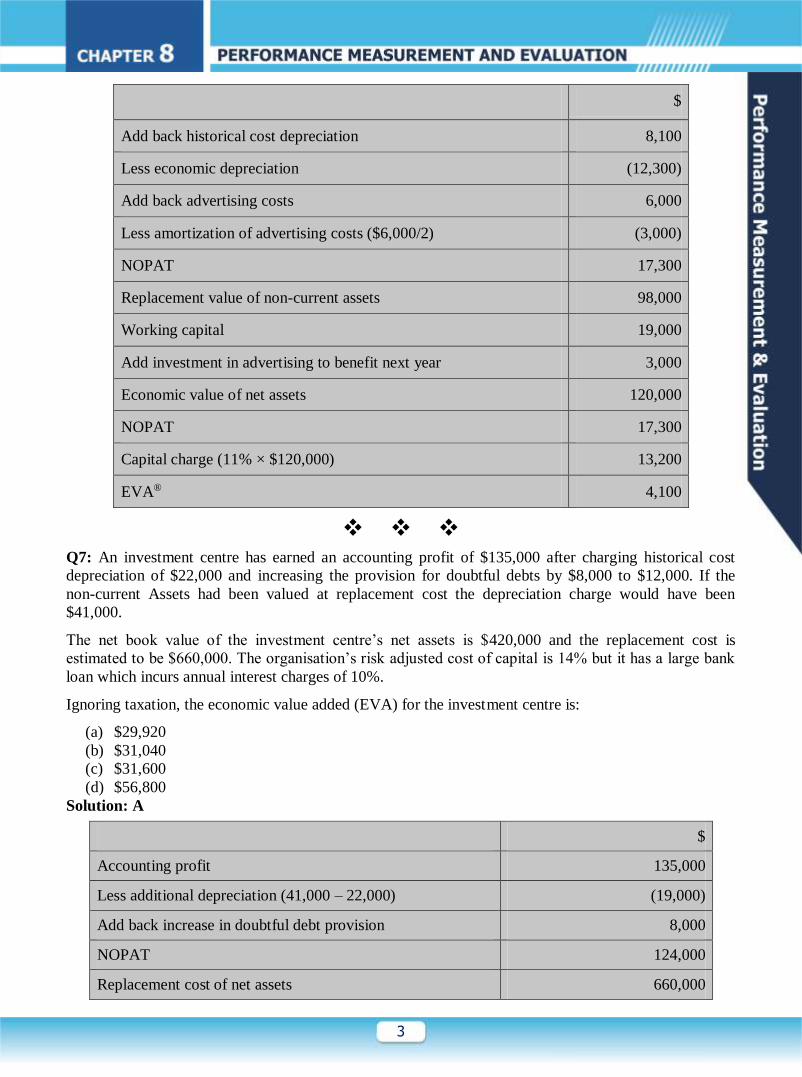
Operating profit 18,500
3
$
Add back historical cost depreciation 8,100
Less economic depreciation (12,300)
Add back advertising costs 6,000
Less amortization of advertising costs ($6,000/2) (3,000)
NOPAT 17,300
Replacement value of non-current assets 98,000
Working capital 19,000
Add investment in advertising to benefit next year 3,000
Economic value of net assets 120,000
NOPAT 17,300
Capital charge (11% × $120,000) 13,200
EVA® 4,100
Q7: An investment centre has earned an accounting profit of $135,000 after charging historical cost
depreciation of $22,000 and increasing the provision for doubtful debts by $8,000 to $12,000. If the
non-current Assets had been valued at replacement cost the depreciation charge would have been
$41,000.
The net book value of the investment centre’s net assets is $420,000 and the replacement cost is
estimated to be $660,000. The organisation’s risk adjusted cost of capital is 14% but it has a large bank
loan which incurs annual interest charges of 10%.
Ignoring taxation, the economic value added (EVA) for the investment centre is:
(a) $29,920
(b) $31,040
(c) $31,600
(d) $56,800
Solution: A
$
Accounting profit 135,000
Less additional depreciation (41,000 – 22,000) (19,000)
Add back increase in doubtful debt provision 8,000
NOPAT 124,000
Replacement cost of net assets 660,000

4
$
Add provision for doubtful debts 12,000
Economic value of capital employed 672,000
Cost of capital X 14%
Capital charge 94,080
NOPAT 124,000
Capital charge 94,080
EVA 29,920
Q8: Division G has reported annual operating profits of $20.2 million. This was after charging $3
million for the full cost of launching a new product that is expected to last three years.
Division G has a risk adjusted cost of capital of 11% and is paying interest on a substantial bank loan at
8%. The historical cost of the assets in Division G, as shown on its balance sheet, is $60 million, and the
replacement cost has been estimated at $84 million.
Ignore the effects of taxation.
What would be the EVA for Division G?
(a) $15.4 million
(b) $11.48 million
(c) $10.6 million
(d) $12.74 million
Solution: D
$ million
Operating profit 20.2
Add back launch costs 3.0
Less amortization of launch costs (1.0)
22.2
Replacement cost of assets 84.0
Add increase in capitalized launch costs 2.0
86.0
Cost of capital X 11%
Capital charge 9.46
EVA = $(22.2 – 9.46) million = $12.74 million
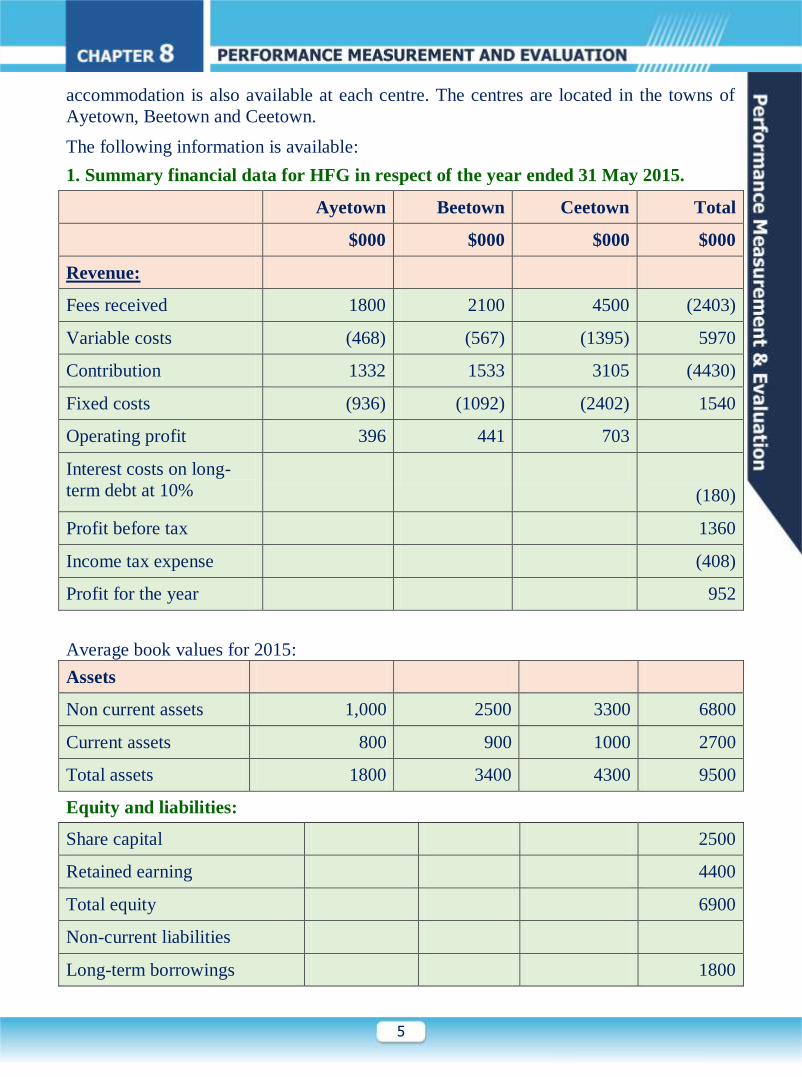
Q9:The Health and Fitness group (HFG), which is privately owned, operates three
centres in the country of Mayland. Each centers offers dietary plans and fitness
programmes to clients under the supervision of dieticians and fitness trainers. Residential
5
accommodation is also available at each centre. The centres are located in the towns of
Ayetown, Beetown and Ceetown.
The following information is available:
1. Summary financial data for HFG in respect of the year ended 31 May 2015.
Ayetown Beetown Ceetown Total
$000 $000 $000 $000
Revenue:
Fees received 1800 2100 4500 (2403)
Variable costs (468) (567) (1395) 5970
Contribution 1332 1533 3105 (4430)
Fixed costs (936) (1092) (2402) 1540
Operating profit 396 441 703
Interest costs on long-
term debt at 10%
(180)
Profit before tax 1360
Income tax expense (408)
Profit for the year 952
Average book values for 2015:
Assets
Non current assets 1,000 2500 3300 6800
Current assets 800 900 1000 2700
Total assets 1800 3400 4300 9500
Equity and liabilities:
Share capital 2500
Retained earning 4400
Total equity 6900
Non-current liabilities
Long-term borrowings 1800
6
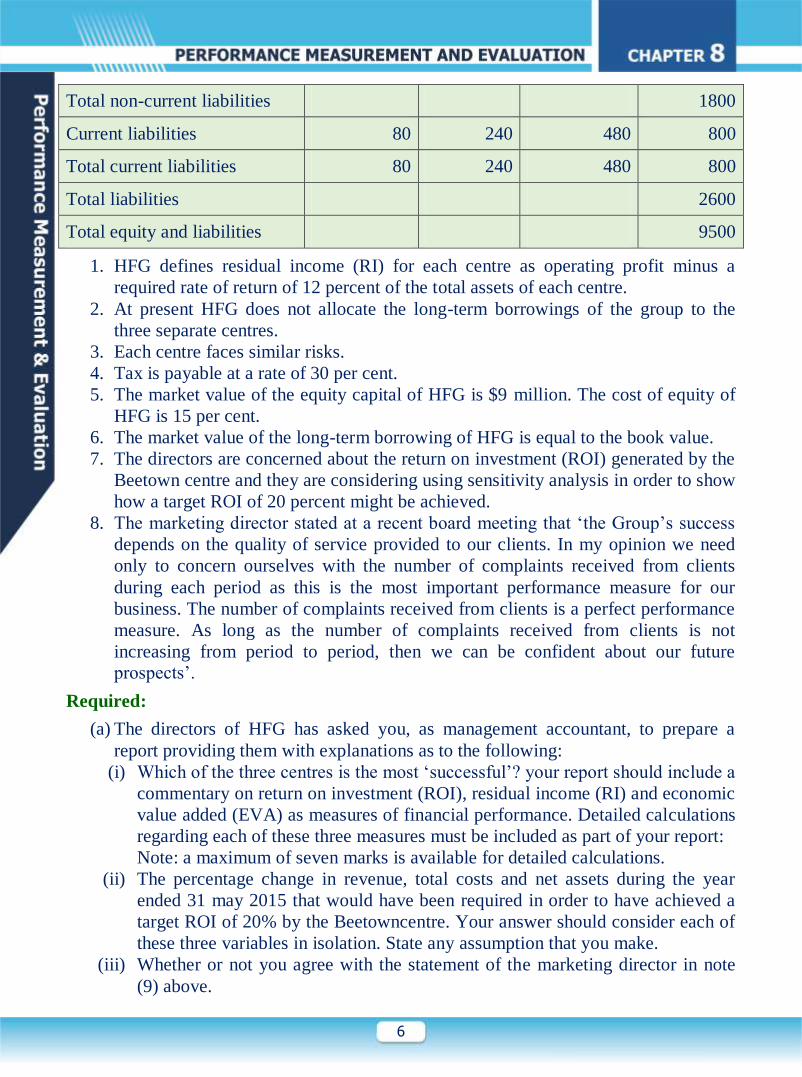
Total non-current liabilities 1800
Current liabilities 80 240 480 800
Total current liabilities 80 240 480 800
Total liabilities 2600
Total equity and liabilities 9500
1. HFG defines residual income (RI) for each centre as operating profit minus a
required rate of return of 12 percent of the total assets of each centre.
2. At present HFG does not allocate the long-term borrowings of the group to the
three separate centres.
3. Each centre faces similar risks.
4. Tax is payable at a rate of 30 per cent.
5. The market value of the equity capital of HFG is $9 million. The cost of equity of
HFG is 15 per cent.
6. The market value of the long-term borrowing of HFG is equal to the book value.
7. The directors are concerned about the return on investment (ROI) generated by the
Beetown centre and they are considering using sensitivity analysis in order to show
how a target ROI of 20 percent might be achieved.
8. The marketing director stated at a recent board meeting that ‘the Group’s success
depends on the quality of service provided to our clients. In my opinion we need
only to concern ourselves with the number of complaints received from clients
during each period as this is the most important performance measure for our
business. The number of complaints received from clients is a perfect performance
measure. As long as the number of complaints received from clients is not
increasing from period to period, then we can be confident about our future
prospects’.
Required:
(a) The directors of HFG has asked you, as management accountant, to prepare a
report providing them with explanations as to the following:
(i) Which of the three centres is the most ‘successful’? your report should include a
commentary on return on investment (ROI), residual income (RI) and economic
value added (EVA) as measures of financial performance. Detailed calculations
regarding each of these three measures must be included as part of your report:
Note: a maximum of seven marks is available for detailed calculations.
(ii) The percentage change in revenue, total costs and net assets during the year
ended 31 may 2015 that would have been required in order to have achieved a
target ROI of 20% by the Beetowncentre. Your answer should consider each of
these three variables in isolation. State any assumption that you make.
(iii) Whether or not you agree with the statement of the marketing director in note
(9) above.
7
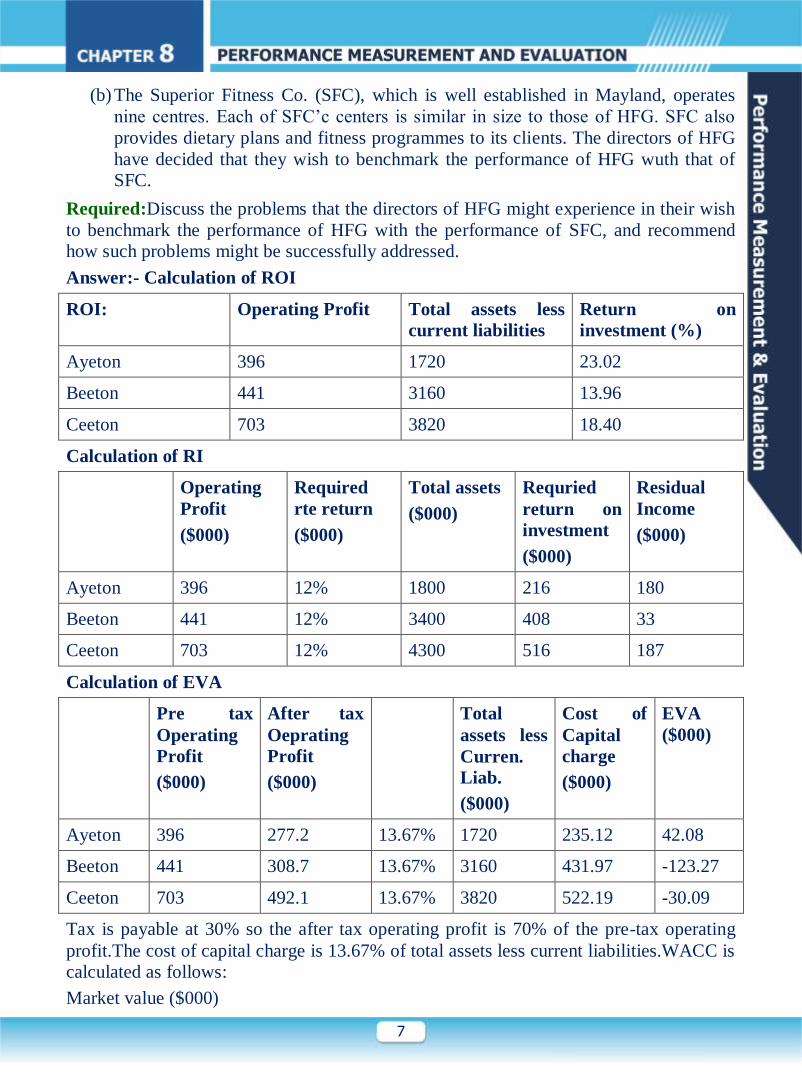
(b) The Superior Fitness Co. (SFC), which is well established in Mayland, operates
nine centres. Each of SFC’c centers is similar in size to those of HFG. SFC also
provides dietary plans and fitness programmes to its clients. The directors of HFG
have decided that they wish to benchmark the performance of HFG wuth that of
SFC.
Required:Discuss the problems that the directors of HFG might experience in their wish
to benchmark the performance of HFG with the performance of SFC, and recommend
how such problems might be successfully addressed.
Answer:- Calculation of ROI
ROI: Operating Profit Total assets less
current liabilities
Return on
investment (%)
Ayeton 396 1720 23.02
Beeton 441 3160 13.96
Ceeton 703 3820 18.40
Calculation of RI
Operating
Profit
($000)
Required
rte return
($000)
Total assets
($000)
Requried
return on
investment
($000)
Residual
Income
($000)
Ayeton 396 12% 1800 216 180
Beeton 441 12% 3400 408 33
Ceeton 703 12% 4300 516 187
Calculation of EVA
Pre tax
Operating
Profit
($000)
After tax
Oeprating
Profit
($000)
Total
assets less
Curren.
Liab.
($000)
Cost of
Capital
charge
($000)
EVA
($000)
Ayeton 396 277.2 13.67% 1720 235.12 42.08
Beeton 441 308.7 13.67% 3160 431.97 -123.27
Ceeton 703 492.1 13.67% 3820 522.19 -30.09
Tax is payable at 30% so the after tax operating profit is 70% of the pre-tax operating
profit.The cost of capital charge is 13.67% of total assets less current liabilities.WACC is
calculated as follows:
Market value ($000)
8
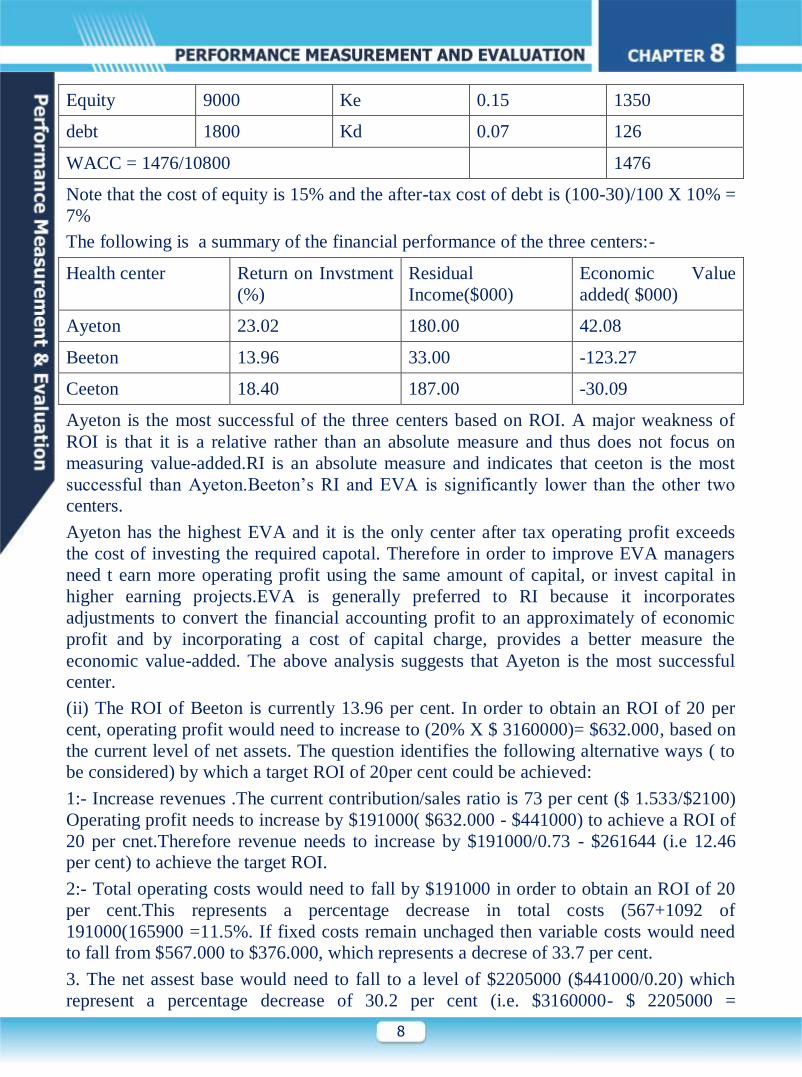
Equity 9000 Ke 0.15 1350
debt 1800 Kd 0.07 126
WACC = 1476/10800 1476
Note that the cost of equity is 15% and the after-tax cost of debt is (100-30)/100 X 10% =
7%
The following is a summary of the financial performance of the three centers:-
Health center Return on Invstment
(%)
Residual
Income($000)
Economic Value
added( $000)
Ayeton 23.02 180.00 42.08
Beeton 13.96 33.00 -123.27
Ceeton 18.40 187.00 -30.09
Ayeton is the most successful of the three centers based on ROI. A major weakness of
ROI is that it is a relative rather than an absolute measure and thus does not focus on
measuring value-added.RI is an absolute measure and indicates that ceeton is the most
successful than Ayeton.Beeton’s RI and EVA is significantly lower than the other two
centers.
Ayeton has the highest EVA and it is the only center after tax operating profit exceeds
the cost of investing the required capotal. Therefore in order to improve EVA managers
need t earn more operating profit using the same amount of capital, or invest capital in
higher earning projects.EVA is generally preferred to RI because it incorporates
adjustments to convert the financial accounting profit to an approximately of economic
profit and by incorporating a cost of capital charge, provides a better measure the
economic value-added. The above analysis suggests that Ayeton is the most successful
center.
(ii) The ROI of Beeton is currently 13.96 per cent. In order to obtain an ROI of 20 per
cent, operating profit would need to increase to (20% X $ 3160000)= $632.000, based on
the current level of net assets. The question identifies the following alternative ways ( to
be considered) by which a target ROI of 20per cent could be achieved:
1:- Increase revenues .The current contribution/sales ratio is 73 per cent ($ 1.533/$2100)
Operating profit needs to increase by $191000( $632.000 - $441000) to achieve a ROI of
20 per cnet.Therefore revenue needs to increase by $191000/0.73 - $261644 (i.e 12.46
per cent) to achieve the target ROI.
2:- Total operating costs would need to fall by $191000 in order to obtain an ROI of 20
per cent.This represents a percentage decrease in total costs (567+1092 of
191000(165900 =11.5%. If fixed costs remain unchaged then variable costs would need
to fall from $567.000 to $376.000, which represents a decrese of 33.7 per cent.
3. The net assest base would need to fall to a level of $2205000 ($441000/0.20) which
represent a percentage decrease of 30.2 per cent (i.e. $3160000- $ 2205000 =
9
955000/3160000 = 30.2%)
(iii) The marketing director is correct in recognizing that success is dependent on levels
of service quality provided but this is only one element of success. IF the number of
complaints is incorporated into the performance measurement system the comparison of
the three centers should be based on a relative measure such as the number of complaints
per 1000 client days. The answer should draw attention to the fact that a balanced
scorecard approach should be used that incorporate a range of financial and non-financial
performance measures that are linked to strategy .The answer should also draw attention
to the fact that the number of complaints is a lagging measure of future profits and there
is a need for a performance measurement system to incorporate both lagging and leading
measures.
(b) It is assumed that HFG is unrelated to SFO so a major problem is why should SFO
share information with a potential future competitor? Many organizations are
reluctant to reveal confident information to competitors. To ensure the full
cooperation of SFO it will be necessary for HFG to provide sound arguments that
this process will also e beneficial to SFO. A further problem is that nebchmarking
could have an adverse motivated impact on the staff of HFG since they may
consider that top management are not confident that they have the ability to change
existing business processes and activities.Also staff may result in teir jobs being
and working conditions under threat. Finally, benchmarking is costly so
management must be assured that there is a high probability that the benefits will
exceed the costs.
Q10: Stillwater Services (SS) is a listed water utility company providing water and sewage services to
the public and businesses of a region of Teenland. The company was formed when the government-
owned Public water company of Teenland was broken up into regional utility companies (one of which
was SS) and sold into private ownership over four year ago.
As a vital utility for the economy of Teeland, water services are a government-regulated industry. The
regulator is principally concerned that SS does not abuse its monopoly position in the regional market to
unjustifiably increase price. The majority of services (80 per cent) are controlled by the regulator who
sets acceptable returns on capital employed (ROCE) level and ensures that the pricing of SS within these
areas does not breach this level. The remaining services, such as a bottled water operation and a contract
repairs service are unregulated and SS can charge a market rate for these. The regulator calculates its
ROCE figure based on its own valuation of the capital assets being used in regulated services and the
operating profit from those regulated services.
The target pre tax ROCE set by the regulator is 6 per cent. If SS were to breach the figure, then the
regulator could find the company. In the past, other such companies have been fines amounting to
millions of dollars.
The board of SS is trying to drive the performance for the benefit of the shareholders. This is a new
experience for many at SS, having been in the public sector until four years ago. In order to try to better
communicate the objective of maximizing shareholder wealth, the board have decided to introduce
economic value added (EVATM) as the key performance indicator.
10
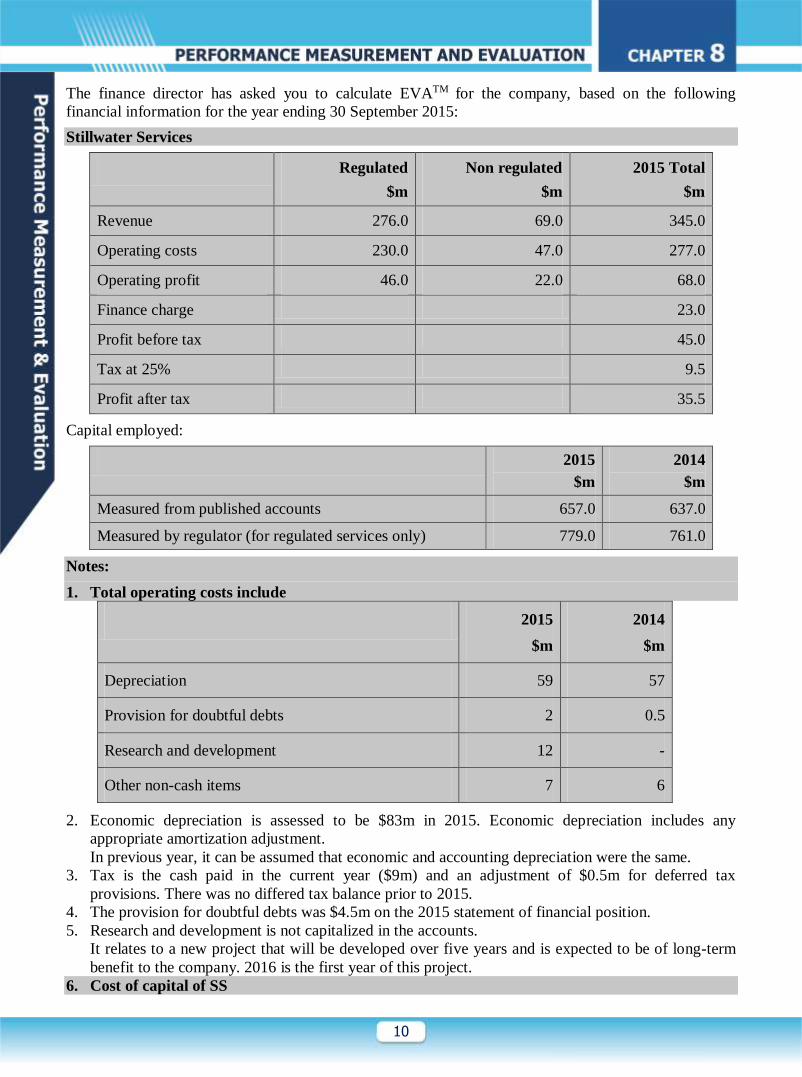
The finance director has asked you to calculate EVATM for the company, based on the following
financial information for the year ending 30 September 2015:
Stillwater Services
Regulated
$m
Non regulated
$m
2015 Total
$m
Revenue 276.0 69.0 345.0
Operating costs 230.0 47.0 277.0
Operating profit 46.0 22.0 68.0
Finance charge 23.0
Profit before tax 45.0
Tax at 25% 9.5
Profit after tax 35.5
Capital employed:
2015
$m
2014
$m
Measured from published accounts 657.0 637.0
Measured by regulator (for regulated services only) 779.0 761.0
Notes:
1. Total operating costs include
2015
$m
2014
$m
Depreciation 59 57
Provision for doubtful debts 2 0.5
Research and development 12 -
Other non-cash items 7 6
2. Economic depreciation is assessed to be $83m in 2015. Economic depreciation includes any
appropriate amortization adjustment.
In previous year, it can be assumed that economic and accounting depreciation were the same.
3. Tax is the cash paid in the current year ($9m) and an adjustment of $0.5m for deferred tax
provisions. There was no differed tax balance prior to 2015.
4. The provision for doubtful debts was $4.5m on the 2015 statement of financial position.
5. Research and development is not capitalized in the accounts.
It relates to a new project that will be developed over five years and is expected to be of long-term
benefit to the company. 2016 is the first year of this project.
6. Cost of capital of SS
11
Equity 16%
Debt (pre-tax) 5%
7. Gearing of SS 40% Equity
60% Debt
Required: evaluate the performance of SS using EVA(TM)
Solution: (a) the computation of EVATM shown below requires that adjustments are made to the
financial accounting reported profits. EVATM attempts to approximate economic profit/cash flow so non-
cash expenses (e.g. provision for doubtful debts and depreciation) are added back to the operating profit.
Adjustments are also required to convert financial accounting depreciation to economic depreciation.
Research and development expenditure is added back because it represents an investment that will yield
future benefits. Therefore it should be capitalized and allocated to future periods based on the benefits
received in the particular period. In this situation, all of the benefit from the current year expenditure of
$12m are obtained in future years so the full amount is added back. To approximate cash flow cash
taxes, rather than tax provisions, must be deducted from operating profit. Financing charges/net interest
are not included in the adjusted profit because the returns required by the providers of funds are
reflected in the cost of capital adjustment in the EVATM computation.
Given that operating profit is before financing charges there is no need to add back this item to operating
profit. The cost of capital deduction in the EVATM calculation incorporates the taxation benefits arising
from debt financing so the tax payment should be adjusted to show what the tax payment would have
been without any interest/financing charges. Therefore the tax saving of $5.75m ($23m financing
charges x 25% tax rate) on interest paid is added back to the tax payment to indicate what the tax
payment would have been without the interest/financing charges. The calculation of EVATM for each
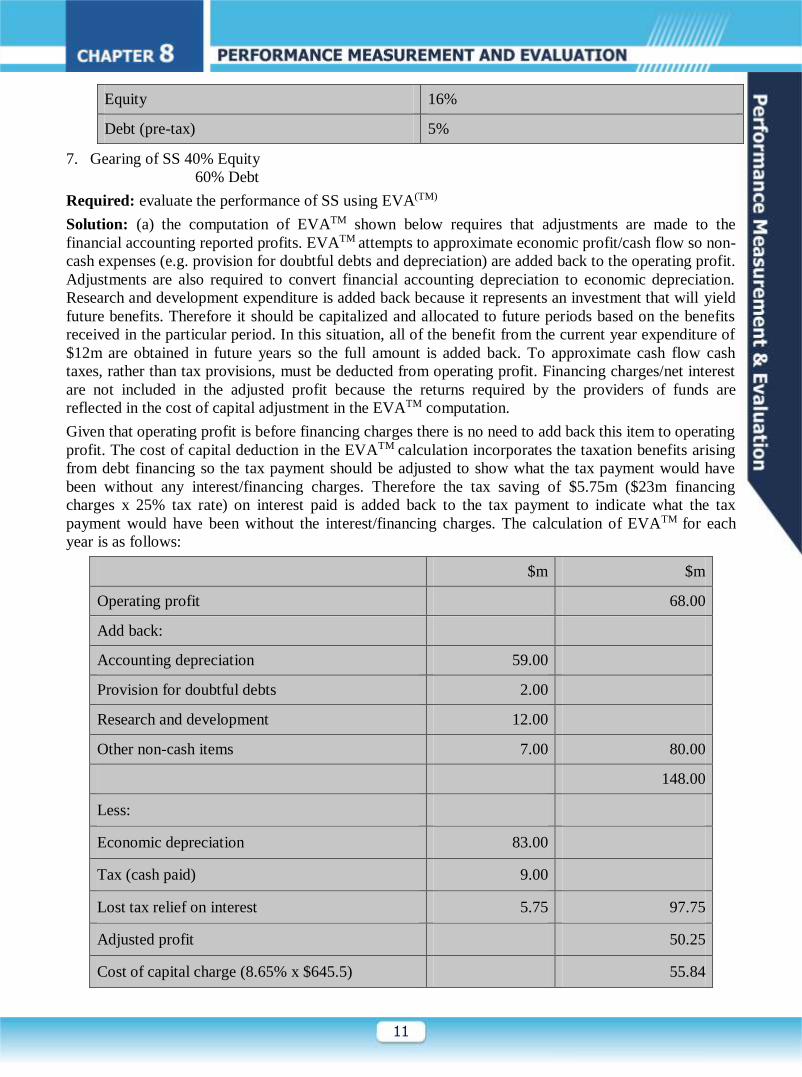
year is as follows:
$m $m
Operating profit 68.00
Add back:
Accounting depreciation 59.00
Provision for doubtful debts 2.00
Research and development 12.00
Other non-cash items 7.00 80.00
148.00
Less:
Economic depreciation 83.00
Tax (cash paid) 9.00
Lost tax relief on interest 5.75 97.75
Adjusted profit 50.25
Cost of capital charge (8.65% x $645.5) 55.84
12
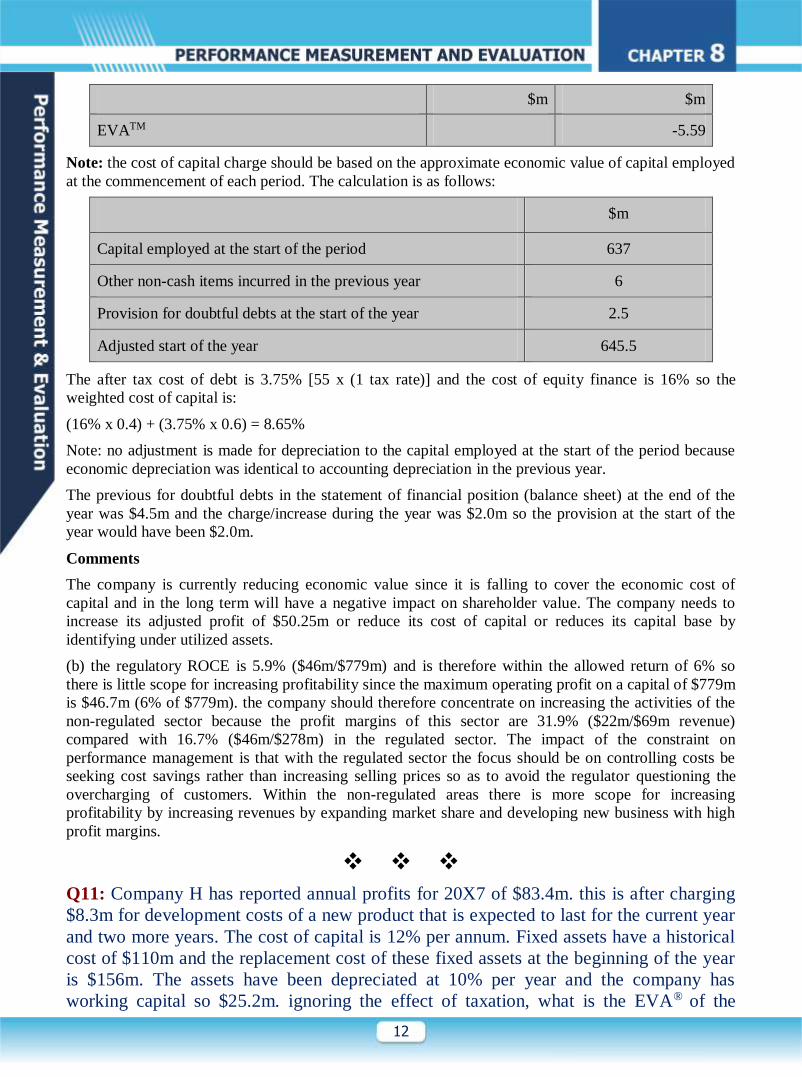
$m $m
EVATM -5.59
Note: the cost of capital charge should be based on the approximate economic value of capital employed
at the commencement of each period. The calculation is as follows:
$m
Capital employed at the start of the period 637
Other non-cash items incurred in the previous year 6
Provision for doubtful debts at the start of the year 2.5
Adjusted start of the year 645.5
The after tax cost of debt is 3.75% [55 x (1 tax rate)] and the cost of equity finance is 16% so the
weighted cost of capital is:
(16% x 0.4) + (3.75% x 0.6) = 8.65%
Note: no adjustment is made for depreciation to the capital employed at the start of the period because
economic depreciation was identical to accounting depreciation in the previous year.
The previous for doubtful debts in the statement of financial position (balance sheet) at the end of the
year was $4.5m and the charge/increase during the year was $2.0m so the provision at the start of the
year would have been $2.0m.
Comments
The company is currently reducing economic value since it is falling to cover the economic cost of
capital and in the long term will have a negative impact on shareholder value. The company needs to
increase its adjusted profit of $50.25m or reduce its cost of capital or reduces its capital base by
identifying under utilized assets.
(b) the regulatory ROCE is 5.9% ($46m/$779m) and is therefore within the allowed return of 6% so
there is little scope for increasing profitability since the maximum operating profit on a capital of $779m
is $46.7m (6% of $779m). the company should therefore concentrate on increasing the activities of the
non-regulated sector because the profit margins of this sector are 31.9% ($22m/$69m revenue)
compared with 16.7% ($46m/$278m) in the regulated sector. The impact of the constraint on
performance management is that with the regulated sector the focus should be on controlling costs be
seeking cost savings rather than increasing selling prices so as to avoid the regulator questioning the
overcharging of customers. Within the non-regulated areas there is more scope for increasing
profitability by increasing revenues by expanding market share and developing new business with high
profit margins.
Q11: Company H has reported annual profits for 20X7 of $83.4m. this is after charging
$8.3m for development costs of a new product that is expected to last for the current year
and two more years. The cost of capital is 12% per annum. Fixed assets have a historical
cost of $110m and the replacement cost of these fixed assets at the beginning of the year
is $156m. The assets have been depreciated at 10% per year and the company has
working capital so $25.2m. ignoring the effect of taxation, what is the EVA® of the
13
company?
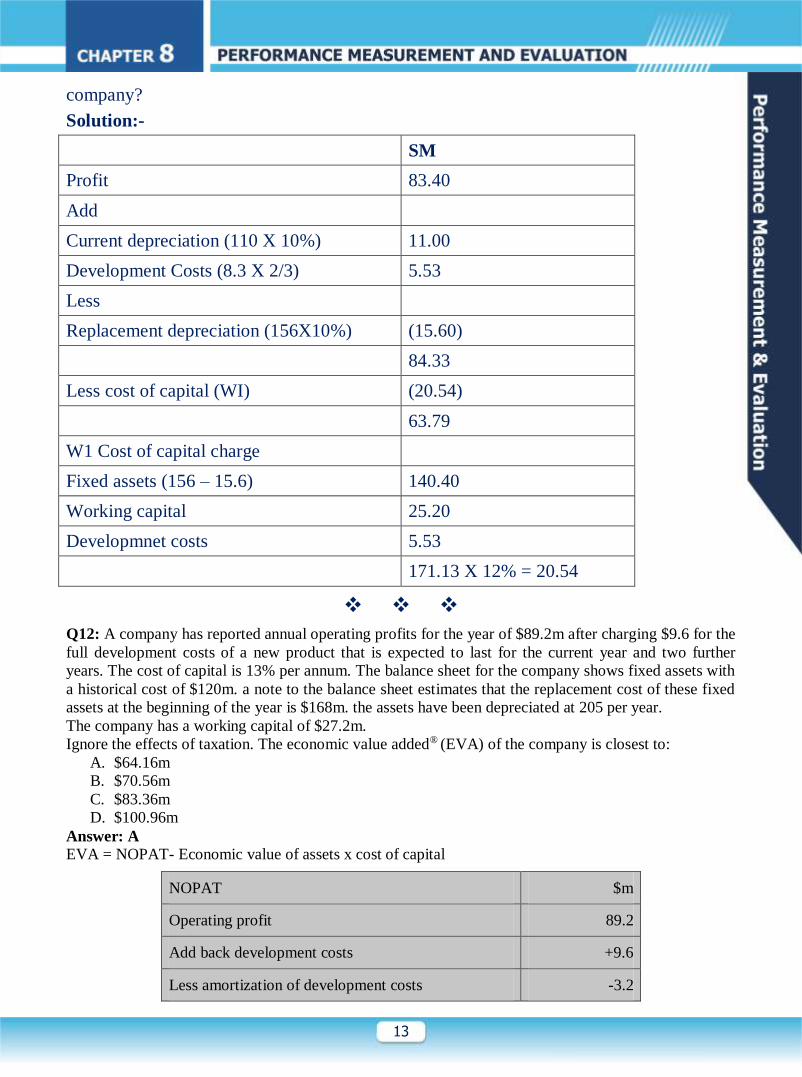
Solution:-
SM
Profit 83.40
Add
Current depreciation (110 X 10%) 11.00
Development Costs (8.3 X 2/3) 5.53
Less
Replacement depreciation (156X10%) (15.60)
84.33
Less cost of capital (WI) (20.54)
63.79
W1 Cost of capital charge
Fixed assets (156 – 15.6) 140.40
Working capital 25.20
Developmnet costs 5.53
171.13 X 12% = 20.54
Q12: A company has reported annual operating profits for the year of $89.2m after charging $9.6 for the
full development costs of a new product that is expected to last for the current year and two further
years. The cost of capital is 13% per annum. The balance sheet for the company shows fixed assets with
a historical cost of $120m. a note to the balance sheet estimates that the replacement cost of these fixed
assets at the beginning of the year is $168m. the assets have been depreciated at 205 per year.
The company has a working capital of $27.2m.
Ignore the effects of taxation. The economic value added® (EVA) of the company is closest to:
A. $64.16m
B. $70.56m
C. $83.36m
D. $100.96m
Answer: A
EVA = NOPAT- Economic value of assets x cost of capital
NOPAT $m
Operating profit 89.2
Add back development costs +9.6
Less amortization of development costs -3.2

14
Add back accounting depreciation +24
Less economic depreciation -33.6
86
Economic value of assets $m
Replacement cost of assets 168
Less economic depreciation -33.6
Add net increase in development costs +6.4
Add working capital +27.2
168
EVA = 86 – 13% × 168 = $64.16m
Q14: The managers of Toutplut Inc were surprised at a recent newspaper article which suggested that
the company’s performance in the last two years had been poor. The CEO commented that turnover had
increased by nearly 17% and pre-tax profit by 25% between the last two financial years, and that the
company well with others in the same industry.
Profit and loss account extracts for the year
$ million
2014 2015
Turnover 326 380
Pre-tax accounting profit 67 84
Taxation 23 29
Profit after tax 44 55
Dividends 15 18
Retained earnings 29 37
Balance sheet extracts for the year ending
2014 2015
Fixed assets 120 156
Net current assets 130 160
250 316
Financed by:
Shareholders’ firm 195 236
15
Medium and long-term bank loans 55 80
250 316
*After deduction of the economic depreciation of the company’s fixed assets. This is also the
depreciation used for tax purposes.
Other information:
(i) Toutplut had non-capitalized leases valued at $10 million in each year 2013-2015.
(ii) Balance sheet capital employed at the end of 2013 was $223 million.
(iii) The company’s pre-tax cost of debt was estimated to be 9 % in 2014 and 10% in 2015.
(iv) Co. Cost of capital was 15% in 2014 & 17% in 2015
(v) The target capital structure is 60% equity, 40% debt.
(vi) The effective tax rate was 35% in both 2014 and 2015.
(vii) Economic depreciation was $30 million in 2014 and $35 million in 2015.
(viii) Other non-cash expenses were $10 million per year in both 2014 and 2015 & 2013.
(ix) Interest expense was $4 million in 2014 and $6 million in 2015.
Required:
(a) Estimate the economic value added (EVA) for Toutplut Inc for both 2014 and 2015. State clearly
any assumption that you make. Comment upon the performance of the company.
(b) Explain the relationship between economic value added and net present value.
(c) Briefly discuss the advantage and disadvantage of EVA.
Solution:
(a) To compute EVA. Adjustment must be made to the conventional after tax proft measures of
$44m and $55m shown in the question. Normally an adjustment is made to convert conventional
financial accounting depreciation to an estimate of economic depreciation, but the question
indicates that profits have already been computed using economic depreciation. Non cash
expenses are added back since the adjusted profit attempts to approximate cash flow after taking
into account economic depreciation. Net interest is also added back because interest will have
been allowed as an expense in determining the taxation payment.
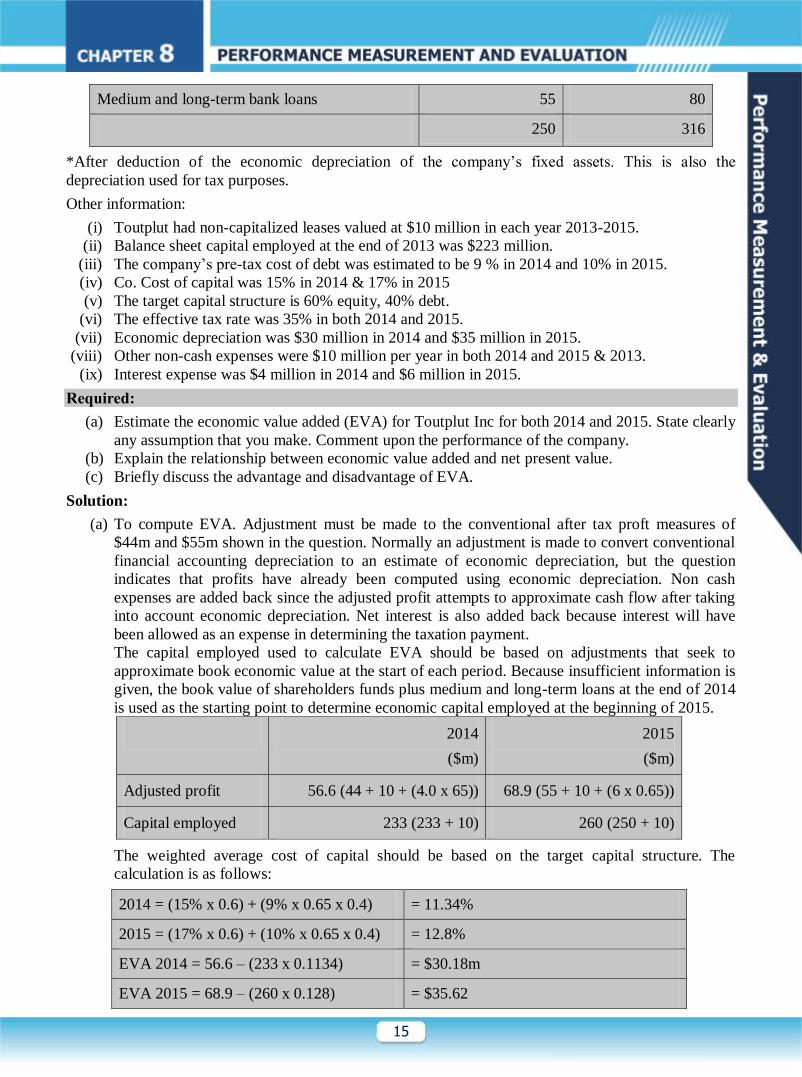
The capital employed used to calculate EVA should be based on adjustments that seek to
approximate book economic value at the start of each period. Because insufficient information is
given, the book value of shareholders funds plus medium and long-term loans at the end of 2014
is used as the starting point to determine economic capital employed at the beginning of 2015.
2014
($m)
2015
($m)
Adjusted profit 56.6 (44 + 10 + (4.0 x 65)) 68.9 (55 + 10 + (6 x 0.65))
Capital employed 233 (233 + 10) 260 (250 + 10)
The weighted average cost of capital should be based on the target capital structure. The
calculation is as follows:
2014 = (15% x 0.6) + (9% x 0.65 x 0.4) = 11.34%
2015 = (17% x 0.6) + (10% x 0.65 x 0.4) = 12.8%
EVA 2014 = 56.6 – (233 x 0.1134) = $30.18m
EVA 2015 = 68.9 – (260 x 0.128) = $35.62
16
The EVA measures indicate that the company has added significant value in both years and
achieved a satisfactory level of performance.
(b) The present value of Eva from an investment approximates the NPV of the investment. For an
explanation of this point you should refer to “the effect of performance measurement on capital
investment on capital investment decisions’ in chapter 19.
(c) Advantages of EVA include:
(1) Because some discretionary expenses are capitalized the harmful side-effects of financial
measures described in chapter 16 and 19 are reduced.
(2) EVA is consistent with maximizing shareholder funds.
(3) EVA is easily understood by managers.
(4) Eva can also be linked to managerial bonus scheme and motivate managers to take decision
that increase shareholder value.
Disadvantage of EVA include:
(1) The EVA computation can be complicated when many adjustments are required.
(2) EVA is difficult to use for inter-firm and inter-divisional comparison because it is not a ratio
measure.
(3) If economic depreciation is not used, the short-term measure can conflict with the long-term
measure.
(4) Economic depreciation is difficult to estimate and conflicts with generally accepted
accounting principles which may hinder its acceptance by financial mangers.
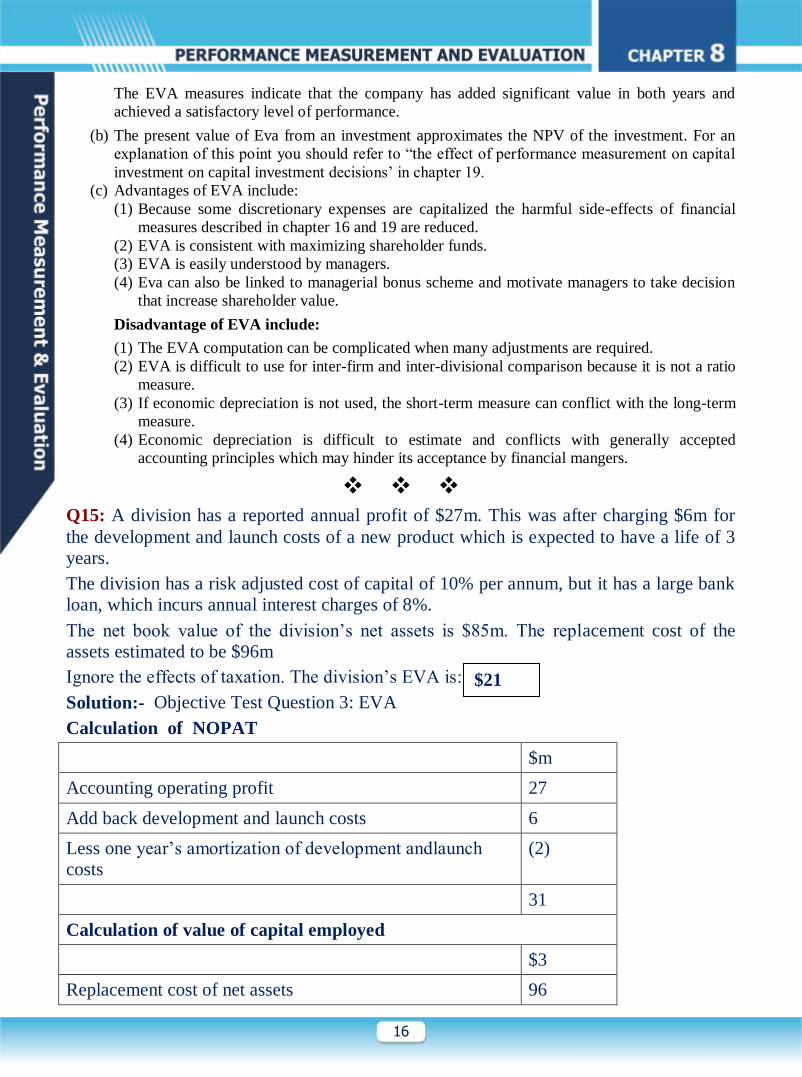
Q15: A division has a reported annual profit of $27m. This was after charging $6m for
the development and launch costs of a new product which is expected to have a life of 3
years.
The division has a risk adjusted cost of capital of 10% per annum, but it has a large bank
loan, which incurs annual interest charges of 8%.
The net book value of the division’s net assets is $85m. The replacement cost of the
assets estimated to be $96m
Ignore the effects of taxation. The division’s EVA is:
Solution:- Objective Test Question 3: EVA
Calculation of NOPAT
$m
Accounting operating profit 27
Add back development and launch costs 6
Less one year’s amortization of development andlaunch
costs
(2)
31
Calculation of value of capital employed
$3
Replacement cost of net assets 96
$21
17
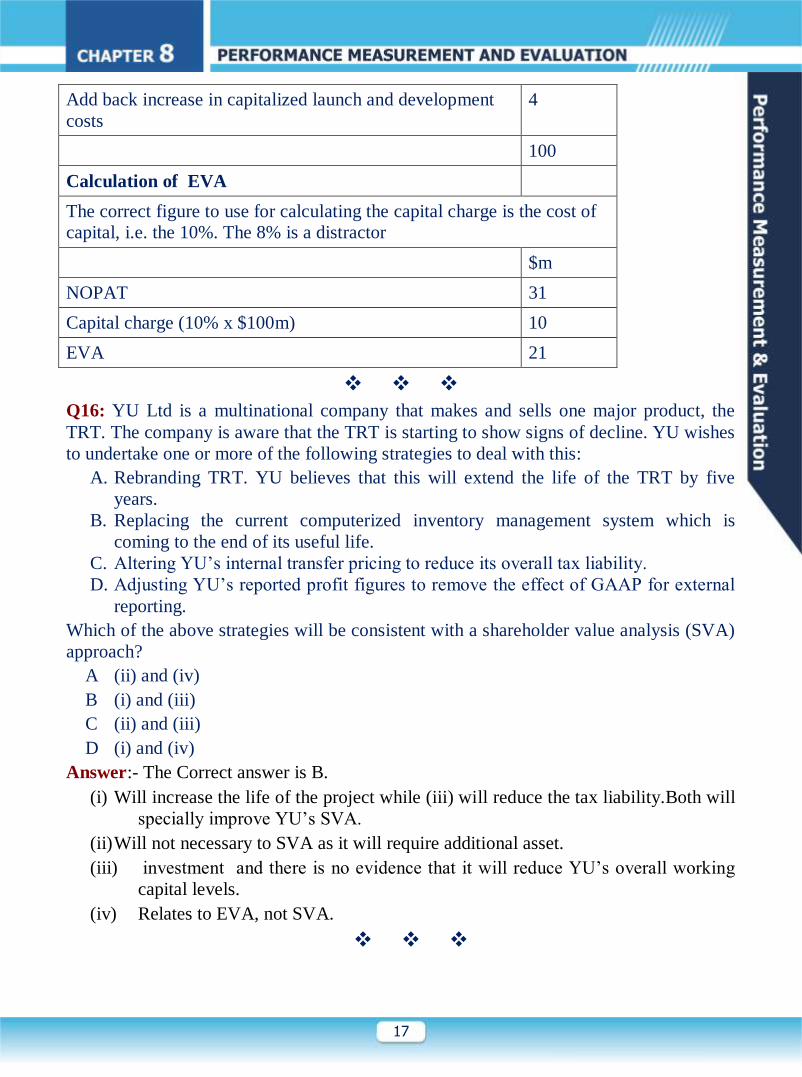
Add back increase in capitalized launch and development
costs
4
100
Calculation of EVA
The correct figure to use for calculating the capital charge is the cost of
capital, i.e. the 10%. The 8% is a distractor
$m
NOPAT 31
Capital charge (10% x $100m) 10
EVA 21
Q16: YU Ltd is a multinational company that makes and sells one major product, the
TRT. The company is aware that the TRT is starting to show signs of decline. YU wishes
to undertake one or more of the following strategies to deal with this:
A. Rebranding TRT. YU believes that this will extend the life of the TRT by five
years.
B. Replacing the current computerized inventory management system which is
coming to the end of its useful life.
C. Altering YU’s internal transfer pricing to reduce its overall tax liability.
D. Adjusting YU’s reported profit figures to remove the effect of GAAP for external
reporting.
Which of the above strategies will be consistent with a shareholder value analysis (SVA)
approach?
A (ii) and (iv)
B (i) and (iii)
C (ii) and (iii)
D (i) and (iv)
Answer:- The Correct answer is B.
(i) Will increase the life of the project while (iii) will reduce the tax liability.Both will
specially improve YU’s SVA.
(ii) Will not necessary to SVA as it will require additional asset.
(iii) investment and there is no evidence that it will reduce YU’s overall working
capital levels.
(iv) Relates to EVA, not SVA.
18
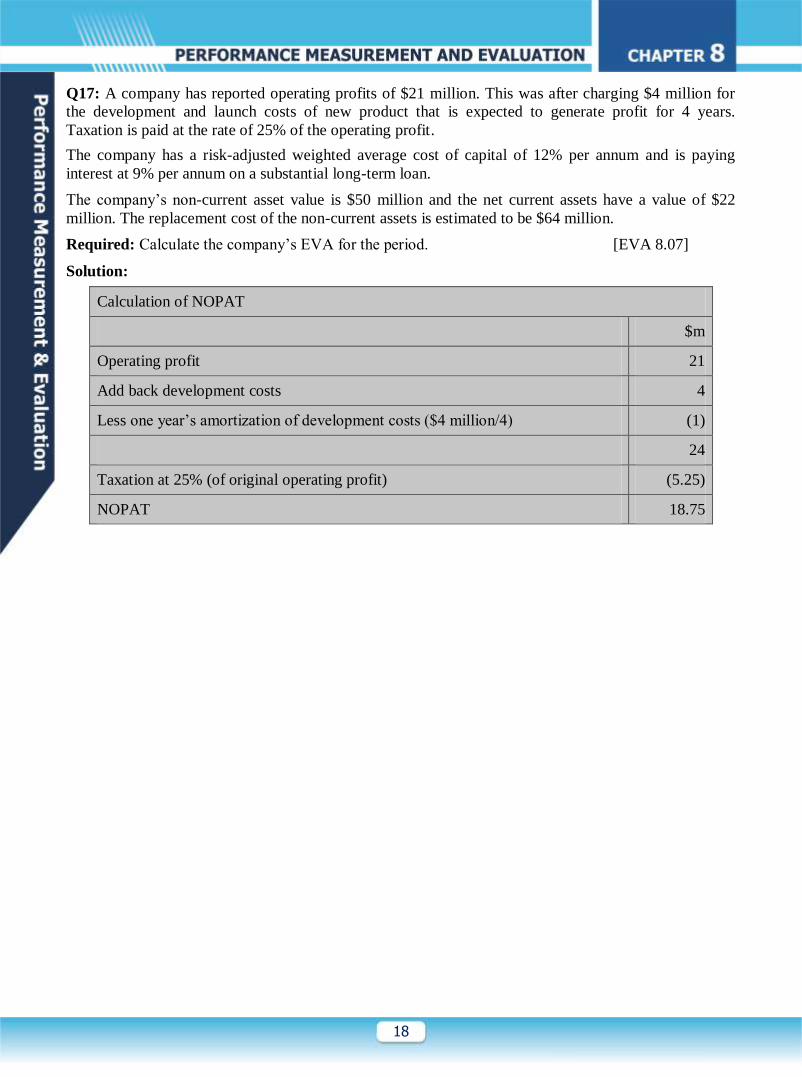
Q17: A company has reported operating profits of $21 million. This was after charging $4 million for
the development and launch costs of new product that is expected to generate profit for 4 years.
Taxation is paid at the rate of 25% of the operating profit.
The company has a risk-adjusted weighted average cost of capital of 12% per annum and is paying
interest at 9% per annum on a substantial long-term loan.
The company’s non-current asset value is $50 million and the net current assets have a value of $22
million. The replacement cost of the non-current assets is estimated to be $64 million.
Required: Calculate the company’s EVA for the period. [EVA 8.07]
Solution:
Calculation of NOPAT
$m
Operating profit 21
Add back development costs 4
Less one year’s amortization of development costs ($4 million/4) (1)
24
Taxation at 25% (of original operating profit) (5.25)
NOPAT 18.75
19
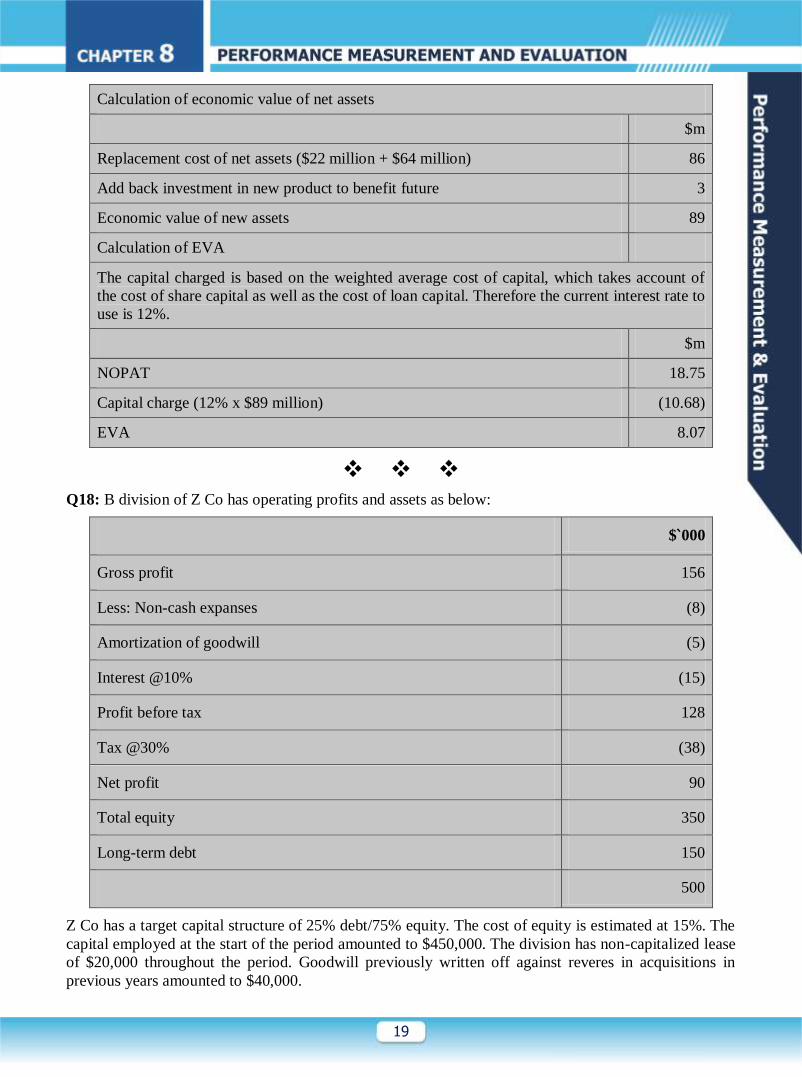
Calculation of economic value of net assets
$m
Replacement cost of net assets ($22 million + $64 million) 86
Add back investment in new product to benefit future 3
Economic value of new assets 89
Calculation of EVA
The capital charged is based on the weighted average cost of capital, which takes account of
the cost of share capital as well as the cost of loan capital. Therefore the current interest rate to
use is 12%.
$m
NOPAT 18.75
Capital charge (12% x $89 million) (10.68)
EVA 8.07
Q18: B division of Z Co has operating profits and assets as below:
$`000
Gross profit 156
Less: Non-cash expanses (8)
Amortization of goodwill (5)
Interest @10% (15)
Profit before tax 128
Tax @30% (38)
Net profit 90
Total equity 350
Long-term debt 150
500
Z Co has a target capital structure of 25% debt/75% equity. The cost of equity is estimated at 15%. The
capital employed at the start of the period amounted to $450,000. The division has non-capitalized lease
of $20,000 throughout the period. Goodwill previously written off against reveres in acquisitions in
previous years amounted to $40,000.
20
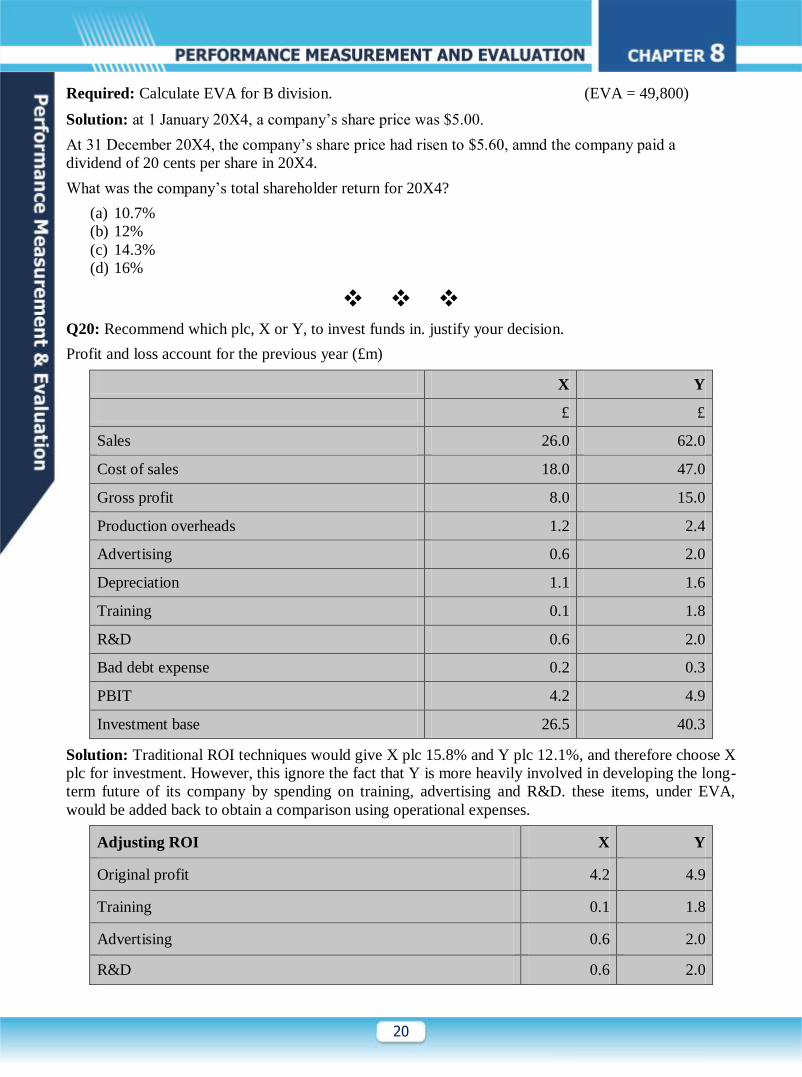
Required: Calculate EVA for B division. (EVA = 49,800)
Solution: at 1 January 20X4, a company’s share price was $5.00.
At 31 December 20X4, the company’s share price had risen to $5.60, amnd the company paid a
dividend of 20 cents per share in 20X4.
What was the company’s total shareholder return for 20X4?
(a) 10.7%
(b) 12%
(c) 14.3%
(d) 16%
Q20: Recommend which plc, X or Y, to invest funds in. justify your decision.
Profit and loss account for the previous year (£m)
X Y
£ £
Sales 26.0 62.0
Cost of sales 18.0 47.0
Gross profit 8.0 15.0
Production overheads 1.2 2.4
Advertising 0.6 2.0
Depreciation 1.1 1.6
Training 0.1 1.8
R&D 0.6 2.0
Bad debt expense 0.2 0.3
PBIT 4.2 4.9
Investment base 26.5 40.3
Solution: Traditional ROI techniques would give X plc 15.8% and Y plc 12.1%, and therefore choose X
plc for investment. However, this ignore the fact that Y is more heavily involved in developing the long-
term future of its company by spending on training, advertising and R&D. these items, under EVA,
would be added back to obtain a comparison using operational expenses.
Adjusting ROI X Y
Original profit 4.2 4.9
Training 0.1 1.8
Advertising 0.6 2.0
R&D 0.6 2.0
21
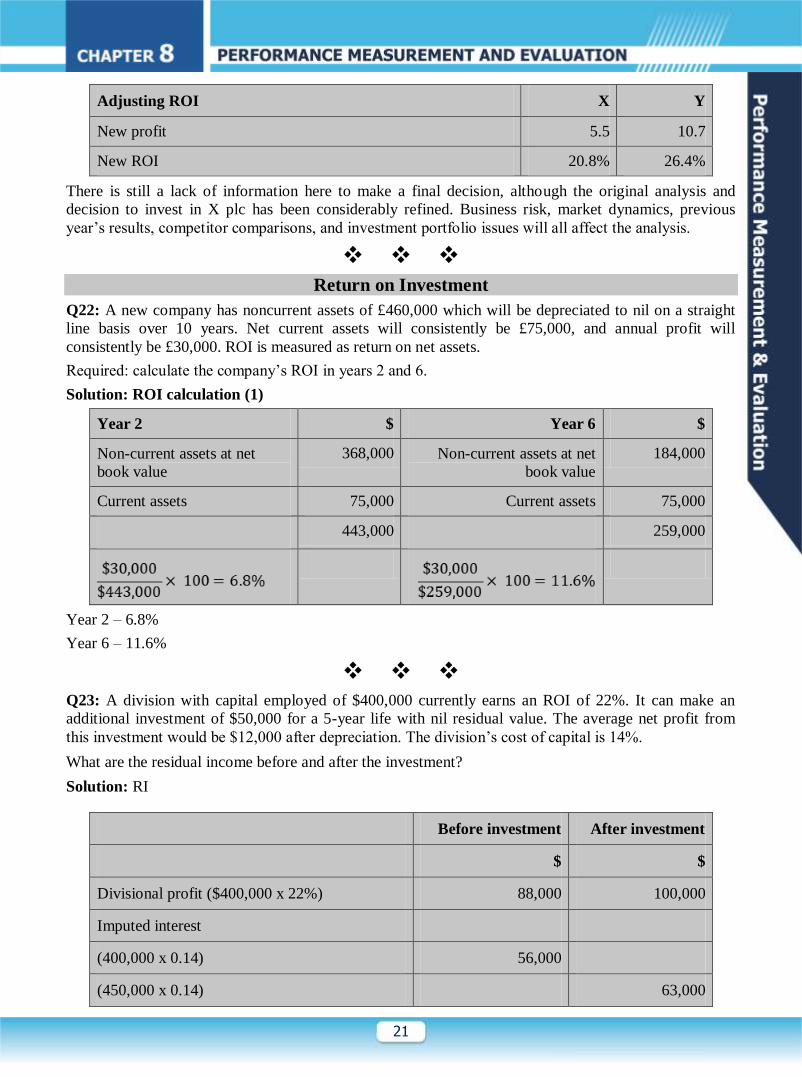
Adjusting ROI X Y
New profit 5.5 10.7
New ROI 20.8% 26.4%
There is still a lack of information here to make a final decision, although the original analysis and
decision to invest in X plc has been considerably refined. Business risk, market dynamics, previous
year’s results, competitor comparisons, and investment portfolio issues will all affect the analysis.
Return on Investment
Q22: A new company has noncurrent assets of £460,000 which will be depreciated to nil on a straight
line basis over 10 years. Net current assets will consistently be £75,000, and annual profit will
consistently be £30,000. ROI is measured as return on net assets.
Required: calculate the company’s ROI in years 2 and 6.
Solution: ROI calculation (1)
Year 2 $ Year 6 $
Non-current assets at net
book value
368,000 Non-current assets at net
book value
184,000
Current assets 75,000 Current assets 75,000
443,000 259,000
Year 2 – 6.8%
Year 6 – 11.6%
Q23: A division with capital employed of $400,000 currently earns an ROI of 22%. It can make an
additional investment of $50,000 for a 5-year life with nil residual value. The average net profit from
this investment would be $12,000 after depreciation. The division’s cost of capital is 14%.
What are the residual income before and after the investment?
Solution: RI
Before investment After investment
$ $
Divisional profit ($400,000 x 22%) 88,000 100,000
Imputed interest
(400,000 x 0.14) 56,000
(450,000 x 0.14) 63,000
22
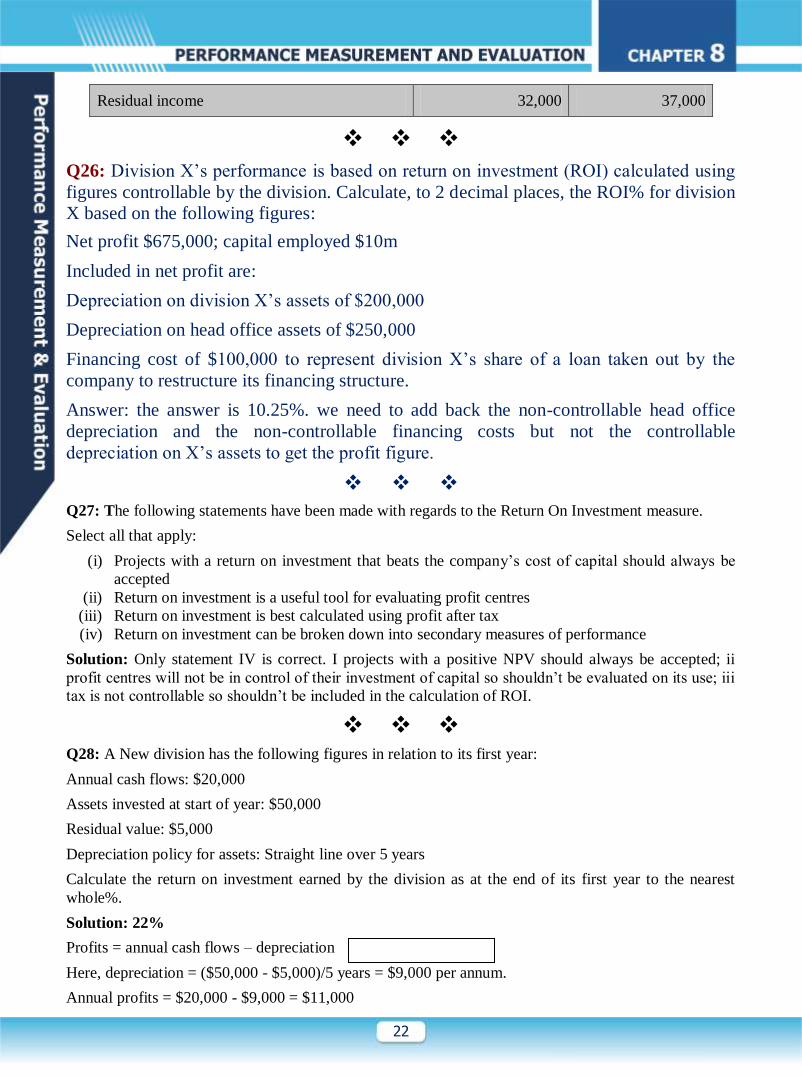
Residual income 32,000 37,000
Q26: Division X’s performance is based on return on investment (ROI) calculated using
figures controllable by the division. Calculate, to 2 decimal places, the ROI% for division
X based on the following figures:
Net profit $675,000; capital employed $10m
Included in net profit are:
Depreciation on division X’s assets of $200,000
Depreciation on head office assets of $250,000
Financing cost of $100,000 to represent division X’s share of a loan taken out by the
company to restructure its financing structure.
Answer: the answer is 10.25%. we need to add back the non-controllable head office
depreciation and the non-controllable financing costs but not the controllable
depreciation on X’s assets to get the profit figure.
Q27: The following statements have been made with regards to the Return On Investment measure.
Select all that apply:
(i) Projects with a return on investment that beats the company’s cost of capital should always be
accepted
(ii) Return on investment is a useful tool for evaluating profit centres
(iii) Return on investment is best calculated using profit after tax
(iv) Return on investment can be broken down into secondary measures of performance
Solution: Only statement IV is correct. I projects with a positive NPV should always be accepted; ii
profit centres will not be in control of their investment of capital so shouldn’t be evaluated on its use; iii
tax is not controllable so shouldn’t be included in the calculation of ROI.
Q28: A New division has the following figures in relation to its first year:
Annual cash flows: $20,000
Assets invested at start of year: $50,000
Residual value: $5,000
Depreciation policy for assets: Straight line over 5 years
Calculate the return on investment earned by the division as at the end of its first year to the nearest
whole%.
Solution: 22%
Profits = annual cash flows – depreciation
Here, depreciation = ($50,000 - $5,000)/5 years = $9,000 per annum.
Annual profits = $20,000 - $9,000 = $11,000
23
ROI = annual profits/ Capital employed
ROI = ($11,000/$50,000) x 100%
ROI = 22%
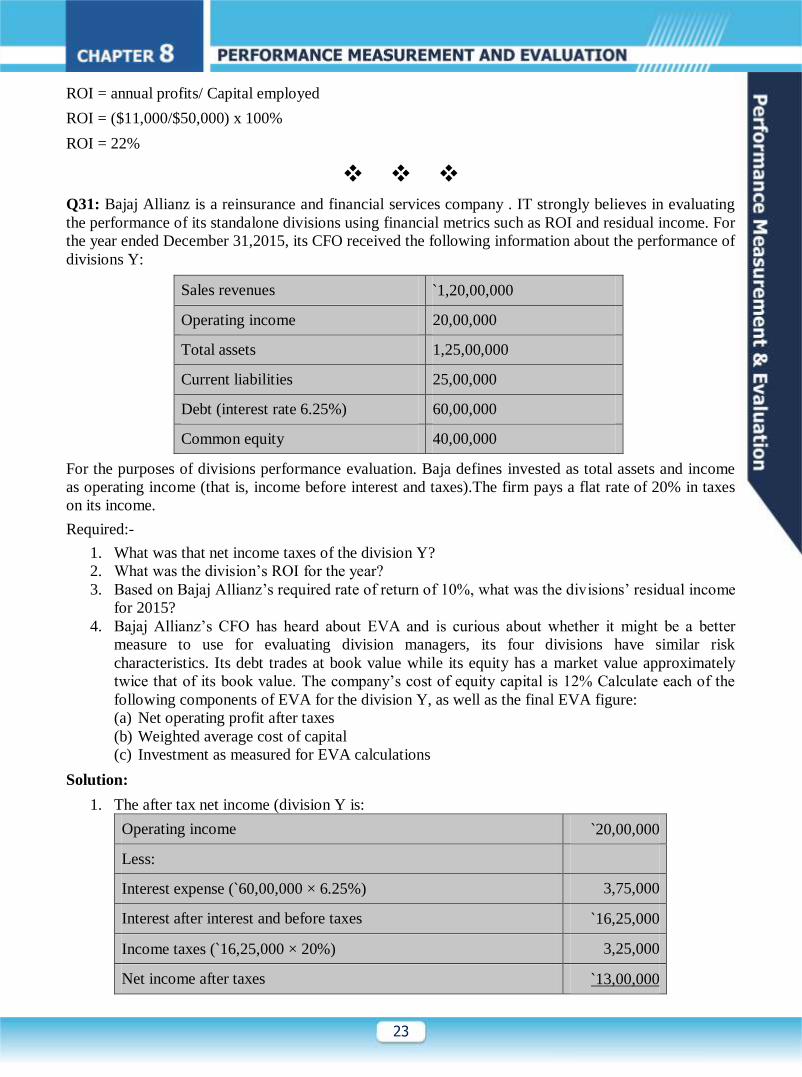
Q31: Bajaj Allianz is a reinsurance and financial services company . IT strongly believes in evaluating
the performance of its standalone divisions using financial metrics such as ROI and residual income. For
the year ended December 31,2015, its CFO received the following information about the performance of
divisions Y:
Sales revenues `1,20,00,000
Operating income 20,00,000
Total assets 1,25,00,000
Current liabilities 25,00,000
Debt (interest rate 6.25%) 60,00,000
Common equity 40,00,000
For the purposes of divisions performance evaluation. Baja defines invested as total assets and income
as operating income (that is, income before interest and taxes).The firm pays a flat rate of 20% in taxes
on its income.
Required:-
1. What was that net income taxes of the division Y?
2. What was the division’s ROI for the year?
3. Based on Bajaj Allianz’s required rate of return of 10%, what was the divisions’ residual income
for 2015?
4. Bajaj Allianz’s CFO has heard about EVA and is curious about whether it might be a better
measure to use for evaluating division managers, its four divisions have similar risk
characteristics. Its debt trades at book value while its equity has a market value approximately
twice that of its book value. The company’s cost of equity capital is 12% Calculate each of the
following components of EVA for the division Y, as well as the final EVA figure:
(a) Net operating profit after taxes
(b) Weighted average cost of capital
(c) Investment as measured for EVA calculations
Solution:
1. The after tax net income (division Y is:
Operating income `20,00,000
Less:
Interest expense (`60,00,000 × 6.25%) 3,75,000
Interest after interest and before taxes `16,25,000
Income taxes (`16,25,000 × 20%) 3,25,000
Net income after taxes `13,00,000

24
2. Investment = Total assets = ` 1,25,00,000
Income = Operating income = ``20,00,000
3. Income = Operating income = ` 20,00,000
Imputed cost of investment = Investment ( `1,25,00,000) × Required rate of return (10%)
= `12,50,000
Residual income = income – imputed cost of investment
= `20,00,000 - `12,50,000
= `7,50,000
4. A. Net operating profit after taxes = Operating income × (1 – Tax rate)
= `20,00,000 × ( 1 – 02)
= `16,00,000
B. Market value of debt = ` 60,00,000
After –tax cost of debt = 6.25% × (1 – Tax rate) = 6.25% × 80% = 5%
Market value of equity = ` 40,00,000 X 2 = ` 80,00,000
Cost of equity capital = 12%
C.Investment=TotalAssets–CurrentLiabilities=`1,25,00,000-`25,00,000=`1,00,00,000
Therefore EVA = `16,00,000 – 9% × `1,00,00,000 = `7,00,000
Q32: ROI Leading to Sub-Optimal Decision Making and Lack of Goal Congruence
BYD Alloy Ltd. first opened its door in 1990 for business and now it is a major supplier of metals
supporting over a dozen different industries and employs experts to support each industry. These include
Wood & Panel Products Manufacturing, Hearth Products, Site Furnishings, Commercial and Residential
Construction etc. It has grown through devotion to its customers, dedication to customer service and
commitment to quality products. The company has two divisions: Division ‘Y’ and Division ‘D’. Each
division work as an investment centre separately. Salary of each divisional manager is ` 720,000 per
annum with the addition of an annual performance related bonus based on divisional return on
investment (ROI). A minimum ROI of 12% p.a. is expected to be achieved by each divisional manager.
If a manager only achieves the 12% target, he will not be rewarded a bonus. However, for every whole
1% point above 12% which the division achieves for the year, a bonus equal to 3% of annual salary will
be paid subject to a maximum bonus of 20% of annual salary. The figures belonging to the year ended
31 March 2018 are given below:
Division ‘Y’ (‘000) Division ‘D’ (‘000)
Revenue 29,000 17,400
Profit 5,290 3,940
Less: Head Office Cost (2,530) (1,368)
25
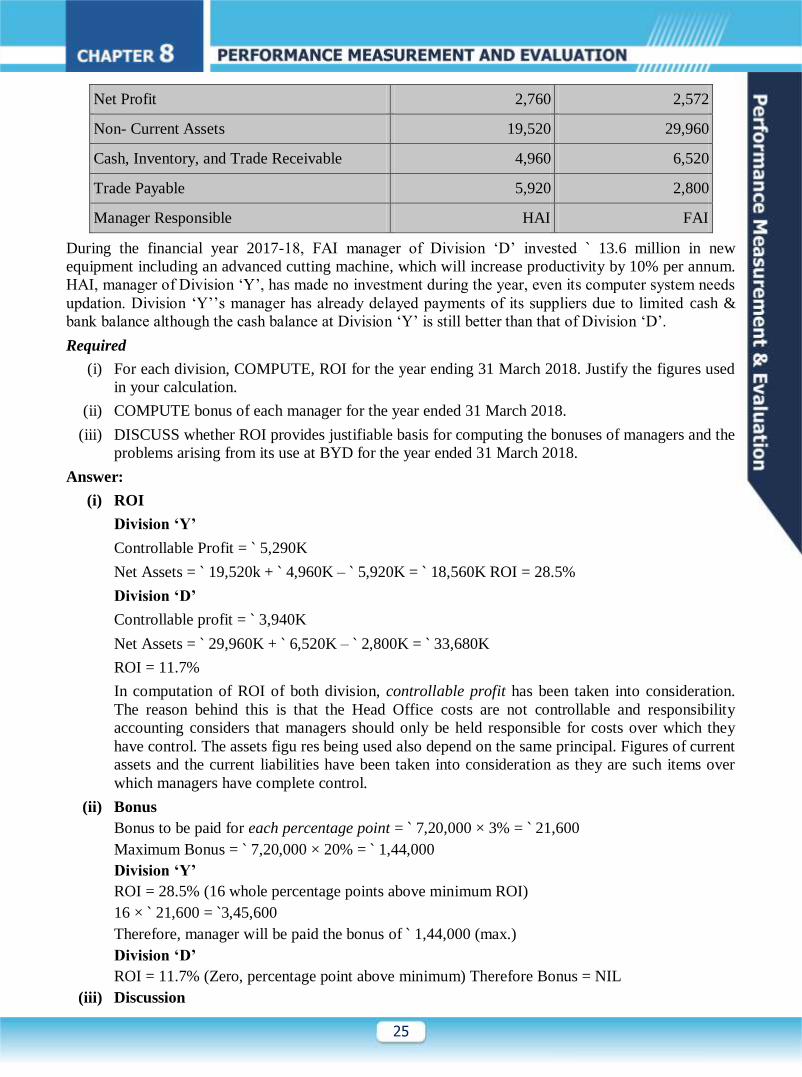
Net Profit 2,760 2,572
Non- Current Assets 19,520 29,960
Cash, Inventory, and Trade Receivable 4,960 6,520
Trade Payable 5,920 2,800
Manager Responsible HAI FAI
During the financial year 2017-18, FAI manager of Division ‘D’ invested ` 13.6 million in new
equipment including an advanced cutting machine, which will increase productivity by 10% per annum.
HAI, manager of Division ‘Y’, has made no investment during the year, even its computer system needs
updation. Division ‘Y’’s manager has already delayed payments of its suppliers due to limited cash &
bank balance although the cash balance at Division ‘Y’ is still better than that of Division ‘D’.
Required
(i) For each division, COMPUTE, ROI for the year ending 31 March 2018. Justify the figures used
in your calculation.
(ii) COMPUTE bonus of each manager for the year ended 31 March 2018.
(iii) DISCUSS whether ROI provides justifiable basis for computing the bonuses of managers and the
problems arising from its use at BYD for the year ended 31 March 2018.
Answer:
(i) ROI
Division ‘Y’
Controllable Profit = ` 5,290K
Net Assets = ` 19,520k + ` 4,960K – ` 5,920K = ` 18,560K ROI = 28.5%
Division ‘D’
Controllable profit = ` 3,940K
Net Assets = ` 29,960K + ` 6,520K – ` 2,800K = ` 33,680K
ROI = 11.7%
In computation of ROI of both division, controllable profit has been taken into consideration.
The reason behind this is that the Head Office costs are not controllable and responsibility
accounting considers that managers should only be held responsible for costs over which they
have control. The assets figu res being used also depend on the same principal. Figures of current
assets and the current liabilities have been taken into consideration as they are such items over
which managers have complete control.
(ii) Bonus
Bonus to be paid for each percentage point = ` 7,20,000 × 3% = ` 21,600
Maximum Bonus = ` 7,20,000 × 20% = ` 1,44,000
Division ‘Y’
ROI = 28.5% (16 whole percentage points above minimum ROI)
16 × ` 21,600 = `3,45,600
Therefore, manager will be paid the bonus of ` 1,44,000 (max.)
Division ‘D’
ROI = 11.7% (Zero, percentage point above minimum) Therefore Bonus = NIL
(iii) Discussion
26
FAI will not receive any bonus since he has not earned any point above minimum percentage.
This is due to the large asset base on which the ROI figure has been computed. Total assets of
Division ‘D’ are almost double the total assets of Division ‘Y’. The major reason behind this is
that Division ‘D’ invested ` 13.6 million in new equipment during the year. If this investment
were not made, net assets would have been only ` 20.08 million and the ROI for Division ‘D’
would have been 19.62% resulting in payment of a bonus `1,44,000 (7 × ` 21, 600 = ` 1,51,200;
subject to maximum of ` 1,44,000) rather than the nothing. FAI is being penalized for making
decisions which are in the best interests of his division. It is very surprising that he decided to
invest where he knew that he would receive lesser bonus subsequently. He acted in the best
interests of the BYD altogether. On the other hand, HAI has taken benefit from the fact that he
has not invested anything even though it was needed for computer system updation. This is an
example of sub -optimal decision making.
Further, Division ‘Y’’s trade payables are over double those of Division ‘D’. In part, one would
expect this due to higher sales (almost 66% more than Division ‘D’) and low cash levels at
Division ‘Y’. Higher trade payable leads to reduction in net assets figures. The fact that BYD is
rewarding HAI with bonus, even though relationships with suppliers may be badly affected, is
again a case of sub -optimal decision making.
If the profit margin (excluding head office cost) as percentage of sales is calculated, it comes to
18.24% for Division ‘Y’ and 22.64% for Division ‘D’. Therefore it can be seen that Division
‘D’ is performing better if capital employed is ignored. ROI is simply making the division ‘D’’s
performance worse.
FAI might feel extremely disappointed by getting nothing and in the future, he may opt to
postpone the investment to increase the bonus. Non - investing in new technology and
equipment will mean that the BYD will not be kept updated with industry changes and its
overall future competitiveness will be affected.
Briefly, the use of ROI is resulting in sub -optimal decision making and a lack of goa l
congruence i.e. what is good for the managers is not good for the company and vice versa.
Fortunately, Division ‘D’’s manager still seems to be acting for the benefit of the BYD but the
other manager is not. The fact that one manager is receiving a much bigger bonus than the other
is not justifiable here and may result in conflict in long run. This is disappointing for the
company especially in the situation when the divisions need to work in unison.
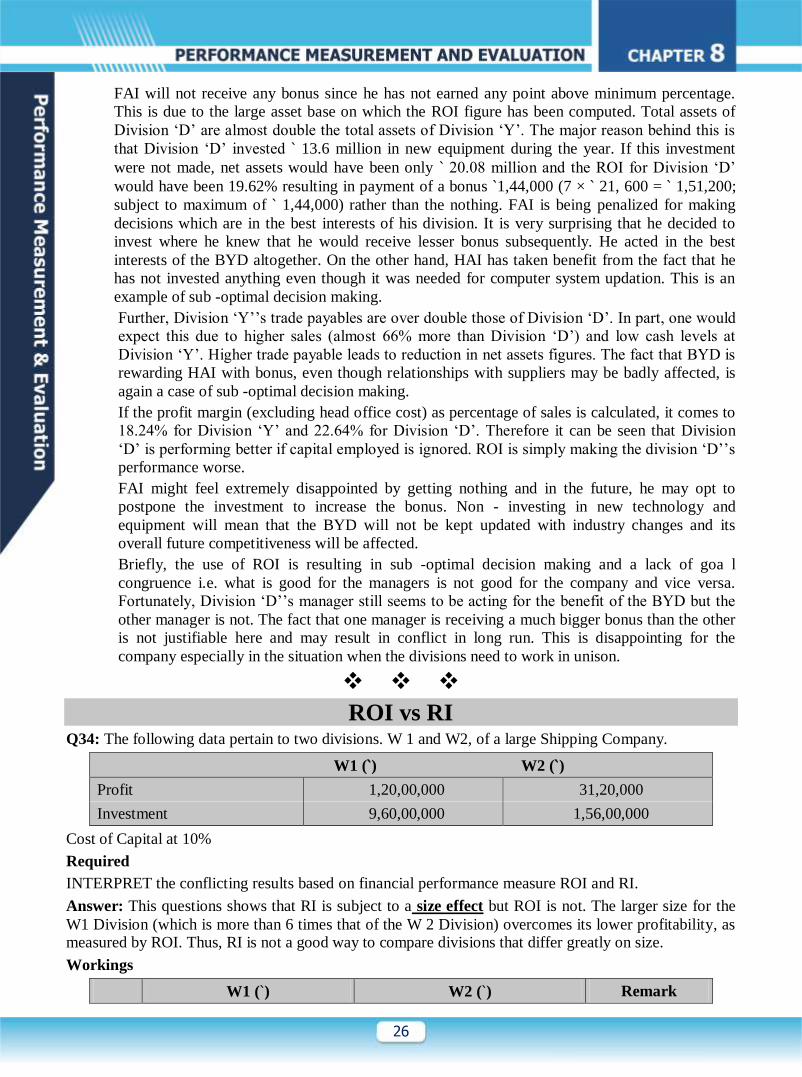
ROI vs RI Q34: The following data pertain to two divisions. W 1 and W2, of a large Shipping Company.
W1 (`) W2 (`)
Profit 1,20,00,000 31,20,000
Investment 9,60,00,000 1,56,00,000
Cost of Capital at 10%
Required
INTERPRET the conflicting results based on financial performance measure ROI and RI.
Answer: This questions shows that RI is subject to a size effect but ROI is not. The larger size for the
W1 Division (which is more than 6 times that of the W 2 Division) overcomes its lower profitability, as measured by ROI. Thus, RI is not a good way to compare divisions that differ greatly on size.
Workings
W1 (`) W2 (`) Remark
27
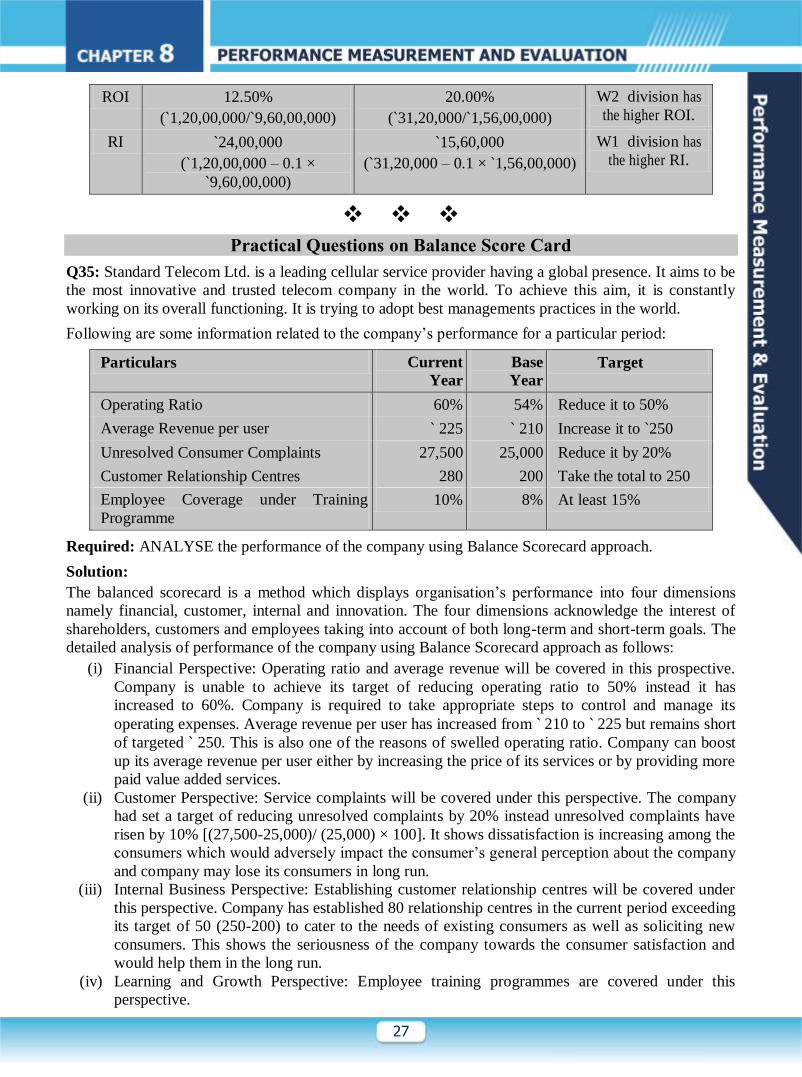
ROI 12.50%
(`1,20,00,000/`9,60,00,000)
20.00%
(`31,20,000/`1,56,00,000)
W2 division has
the higher ROI.
RI `24,00,000
(`1,20,00,000 – 0.1 ×
`9,60,00,000)
`15,60,000
(`31,20,000 – 0.1 × `1,56,00,000)
W1 division has
the higher RI.
Practical Questions on Balance Score Card
Q35: Standard Telecom Ltd. is a leading cellular service provider having a global presence. It aims to be
the most innovative and trusted telecom company in the world. To achieve this aim, it is constantly
working on its overall functioning. It is trying to adopt best managements practices in the world.
Following are some information related to the company’s performance for a particular period:
Particulars Current
Year
Base
Year
Target
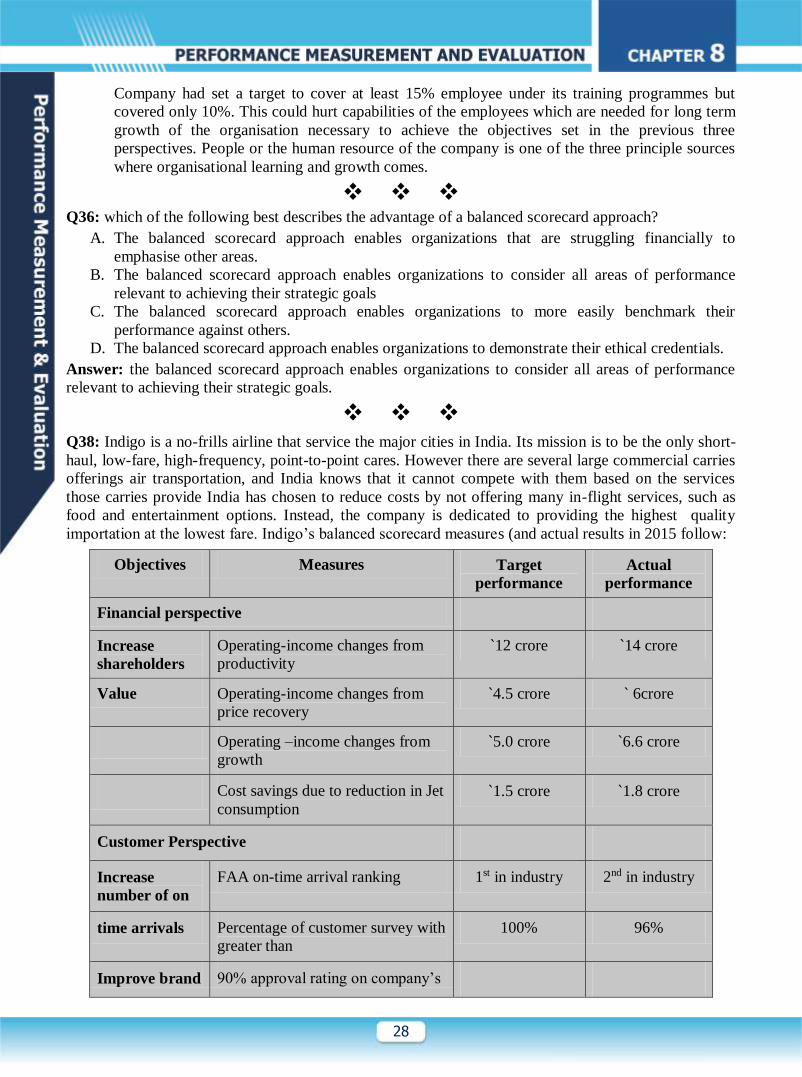
Operating Ratio 60% 54% Reduce it to 50%
Average Revenue per user ` 225 ` 210 Increase it to `250
Unresolved Consumer Complaints 27,500 25,000 Reduce it by 20%
Customer Relationship Centres 280 200 Take the total to 250
Employee Coverage under Training
Programme
10% 8% At least 15%
Required: ANALYSE the performance of the company using Balance Scorecard approach.
Solution:
The balanced scorecard is a method which displays organisation’s performance into four dimensions
namely financial, customer, internal and innovation. The four dimensions acknowledge the interest of
shareholders, customers and employees taking into account of both long-term and short-term goals. The
detailed analysis of performance of the company using Balance Scorecard approach as follows:
(i) Financial Perspective: Operating ratio and average revenue will be covered in this prospective.
Company is unable to achieve its target of reducing operating ratio to 50% instead it has
increased to 60%. Company is required to take appropriate steps to control and manage its
operating expenses. Average revenue per user has increased from ` 210 to ` 225 but remains short
of targeted ` 250. This is also one of the reasons of swelled operating ratio. Company can boost
up its average revenue per user either by increasing the price of its services or by providing more
paid value added services.
(ii) Customer Perspective: Service complaints will be covered under this perspective. The company
had set a target of reducing unresolved complaints by 20% instead unresolved complaints have
risen by 10% [(27,500-25,000)/ (25,000) × 100]. It shows dissatisfaction is increasing among the
consumers which would adversely impact the consumer’s general perception about the company
and company may lose its consumers in long run.
(iii) Internal Business Perspective: Establishing customer relationship centres will be covered under
this perspective. Company has established 80 relationship centres in the current period exceeding
its target of 50 (250-200) to cater to the needs of existing consumers as well as soliciting new
consumers. This shows the seriousness of the company towards the consumer satisfaction and
would help them in the long run.
(iv) Learning and Growth Perspective: Employee training programmes are covered under this
perspective.
28
Company had set a target to cover at least 15% employee under its training programmes but
covered only 10%. This could hurt capabilities of the employees which are needed for long term
growth of the organisation necessary to achieve the objectives set in the previous three
perspectives. People or the human resource of the company is one of the three principle sources
where organisational learning and growth comes.
Q36: which of the following best describes the advantage of a balanced scorecard approach?
A. The balanced scorecard approach enables organizations that are struggling financially to
emphasise other areas.
B. The balanced scorecard approach enables organizations to consider all areas of performance
relevant to achieving their strategic goals
C. The balanced scorecard approach enables organizations to more easily benchmark their
performance against others.
D. The balanced scorecard approach enables organizations to demonstrate their ethical credentials.
Answer: the balanced scorecard approach enables organizations to consider all areas of performance
relevant to achieving their strategic goals.
Q38: Indigo is a no-frills airline that service the major cities in India. Its mission is to be the only short-
haul, low-fare, high-frequency, point-to-point cares. However there are several large commercial carries
offerings air transportation, and India knows that it cannot compete with them based on the services
those carries provide India has chosen to reduce costs by not offering many in-flight services, such as
food and entertainment options. Instead, the company is dedicated to providing the highest quality
importation at the lowest fare. Indigo’s balanced scorecard measures (and actual results in 2015 follow:
Objectives Measures Target
performance
Actual
performance
Financial perspective
Increase
shareholders
Operating-income changes from
productivity
`12 crore `14 crore
Value Operating-income changes from
price recovery
`4.5 crore ` 6crore
Operating –income changes from
growth
`5.0 crore `6.6 crore
Cost savings due to reduction in Jet
consumption
`1.5 crore `1.8 crore
Customer Perspective
Increase
number of on
FAA on-time arrival ranking 1st in industry 2nd in industry
time arrivals Percentage of customer survey with
greater than
100% 96%
Improve brand 90% approval rating on company’s
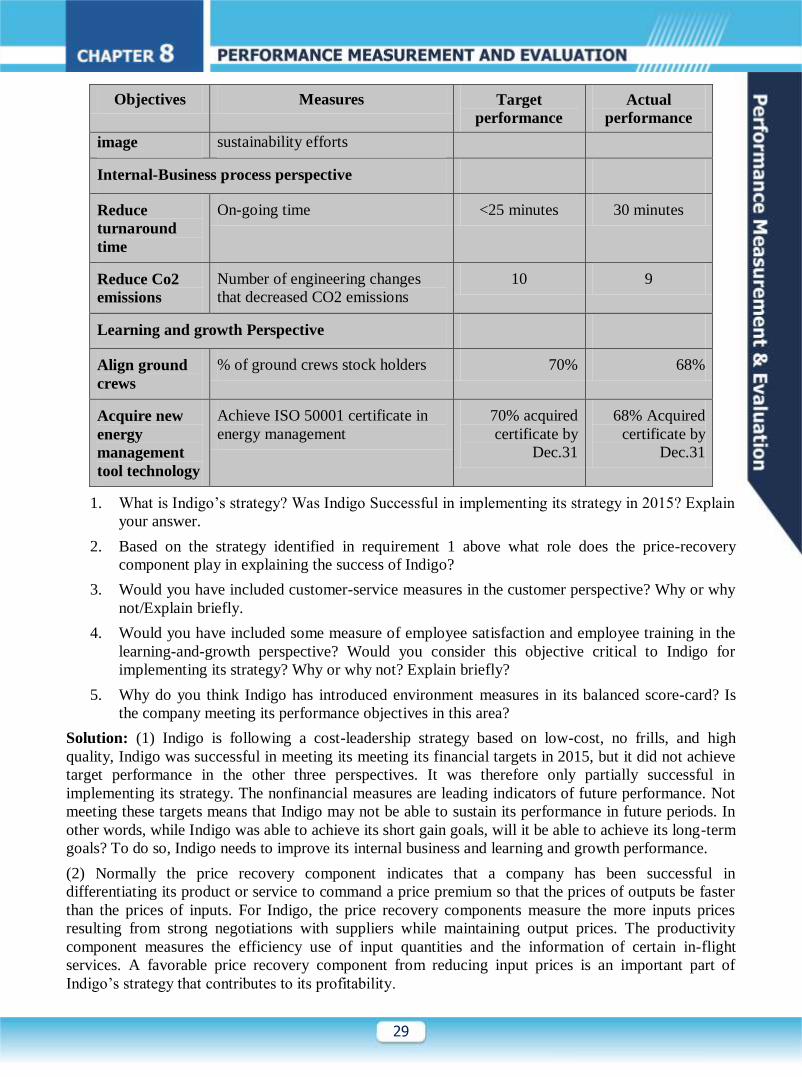
29
Objectives Measures Target
performance
Actual
performance
image sustainability efforts
Internal-Business process perspective
Reduce
turnaround
time
On-going time <25 minutes 30 minutes
Reduce Co2
emissions
Number of engineering changes
that decreased CO2 emissions
10 9
Learning and growth Perspective
Align ground
crews
% of ground crews stock holders 70% 68%
Acquire new
energy
management
tool technology
Achieve ISO 50001 certificate in
energy management
70% acquired
certificate by
Dec.31
68% Acquired
certificate by
Dec.31
1. What is Indigo’s strategy? Was Indigo Successful in implementing its strategy in 2015? Explain
your answer.
2. Based on the strategy identified in requirement 1 above what role does the price-recovery
component play in explaining the success of Indigo?
3. Would you have included customer-service measures in the customer perspective? Why or why
not/Explain briefly.
4. Would you have included some measure of employee satisfaction and employee training in the
learning-and-growth perspective? Would you consider this objective critical to Indigo for
implementing its strategy? Why or why not? Explain briefly?
5. Why do you think Indigo has introduced environment measures in its balanced score-card? Is
the company meeting its performance objectives in this area?
Solution: (1) Indigo is following a cost-leadership strategy based on low-cost, no frills, and high
quality, Indigo was successful in meeting its meeting its financial targets in 2015, but it did not achieve
target performance in the other three perspectives. It was therefore only partially successful in
implementing its strategy. The nonfinancial measures are leading indicators of future performance. Not
meeting these targets means that Indigo may not be able to sustain its performance in future periods. In
other words, while Indigo was able to achieve its short gain goals, will it be able to achieve its long-term
goals? To do so, Indigo needs to improve its internal business and learning and growth performance.
(2) Normally the price recovery component indicates that a company has been successful in
differentiating its product or service to command a price premium so that the prices of outputs be faster
than the prices of inputs. For Indigo, the price recovery components measure the more inputs prices
resulting from strong negotiations with suppliers while maintaining output prices. The productivity
component measures the efficiency use of input quantities and the information of certain in-flight
services. A favorable price recovery component from reducing input prices is an important part of
Indigo’s strategy that contributes to its profitability.
30
(3) It would not have included customer-service measures in Indigo’s customer perspective because it is
not part of Indigo strategy. Indigo does not compete with other carries on the basis of its services. In
fact, it does not offer in-flight services such as food and entertainment options. It is no-frills airline,
whose strategy is to eliminate services in order to reduced elements. We are not debating the merits of
the strategy. Only that given the strategy measures to customer service should not appear on the
scorecard.
(4) Yes, Indigo should include some measure of employee satisfaction and employee training the
learning and growth perspective. Indigo’s low-cost strategy is based on efficiency the way to good, fast,
and friendly customer service is well trained and satisfied employees. Untrained and dissatisfied
employees have poor interactions with customers and other employees and cause the strategy to fail.
Hence, training and employee satisfaction are very important for Indigo to implement its strategy. These
measures are, therefore, leading indicators of whether Indigo will be able to successfully implement its
strategy over the long term and should be measured on the balanced scorecard.
(5) Indigo included social and environmental performance measures in its balanced score-card because it
believes strong environment and social performance gives it a competitive advantage by (1) attracting
and inspiring outstanding employees (2) enhancing its reputation with socially conscious customers,
investors and analysis, and (3) boosting its image with governments and citizens, all of which contribute
to long-run financial performance. Indigo also believes that focusing on environmental and social
performance in addition to financial performance helps it to innovate in technologies, processes,
products and business models to reduce the trade-offs between financial and sustainability goals and
build international leadership and change capabilities to implement these “triple bottom line” changes.
Following the concept of shared value, Indigo includes social and Environmental measures together
with business goals and measures in its balanced scorecard to evaluate how well it is doing toward
achieving its social and environmental initiatives are by and large succeeding. Indigo has successfully
obtained ISO 50001 certification in energy management .This focus has helped it to implement
engineering changes that decrease CO2 emissions. It was to implement 10 such changes, but is made
only 9.) As it made these changes, customer surveys indicated that 96% of customers approved of
Indigo’s sustainability efforts, slights lower than the 100% of customers that Indigo had targeted. In
turn, these actions resulted to cost savings in Jet fuel consumption that exceeded targets. Indigo may
need to make some small changes in its sustainability and environmental performance measures and
targets but by and large it is helping Indigo meet its long-term financial and sustainability goals. Not all
companies believe in implementing sustainability goals, but those that do find the balanced scorecard to
be a useful tool to simultaneously implement both financial and sustainability goals.
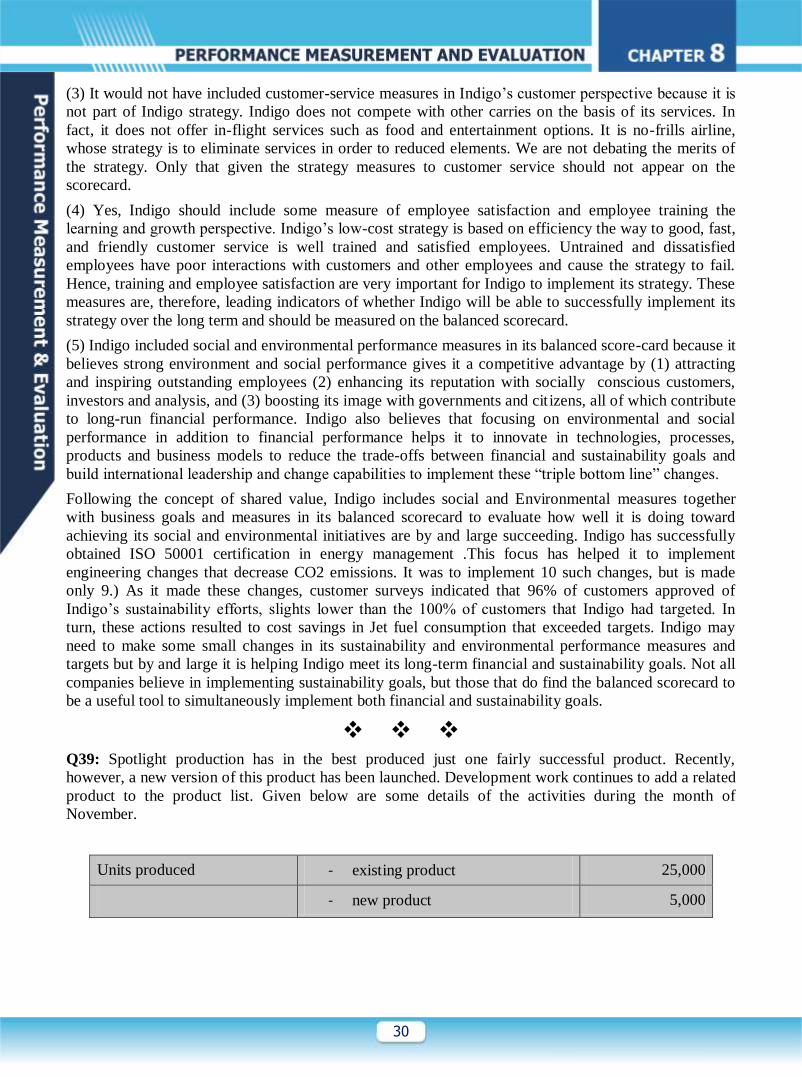
Q39: Spotlight production has in the best produced just one fairly successful product. Recently,
however, a new version of this product has been launched. Development work continues to add a related
product to the product list. Given below are some details of the activities during the month of
November.
Units produced - existing product 25,000
- new product 5,000
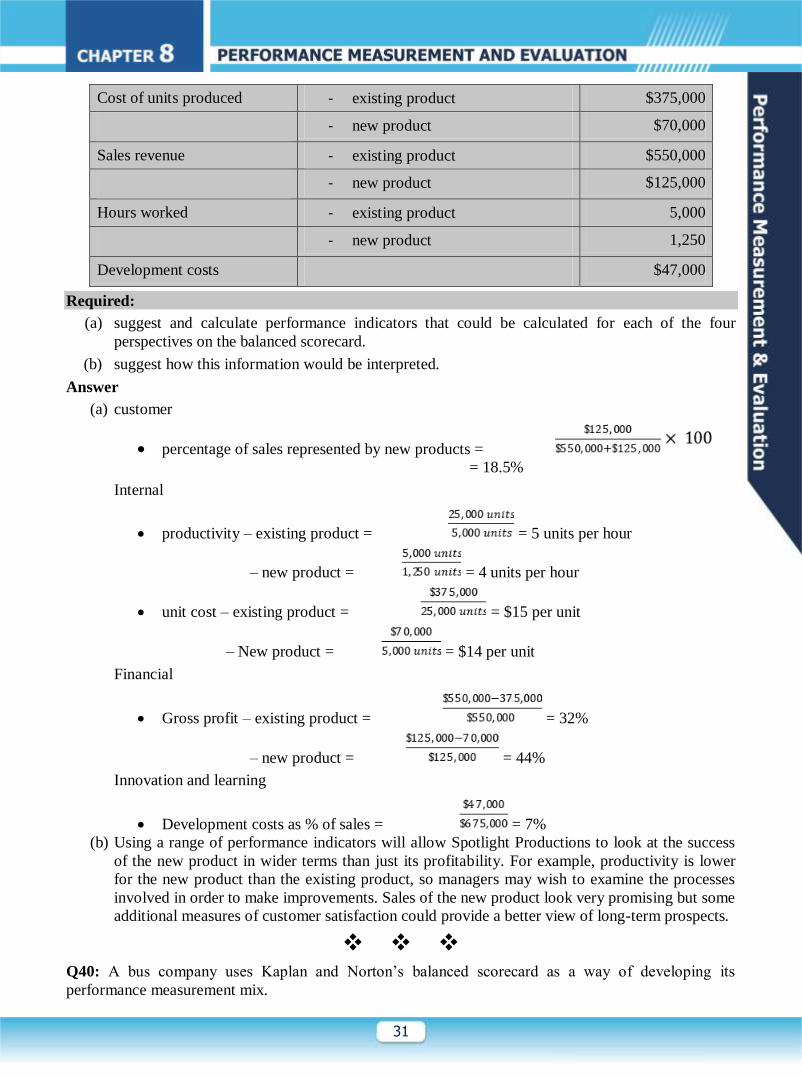
31
Cost of units produced - existing product $375,000
- new product $70,000
Sales revenue - existing product $550,000
- new product $125,000
Hours worked - existing product 5,000
- new product 1,250
Development costs $47,000
Required:
(a) suggest and calculate performance indicators that could be calculated for each of the four
perspectives on the balanced scorecard.
(b) suggest how this information would be interpreted.
Answer
(a) customer
percentage of sales represented by new products = = 18.5%
Internal
productivity – existing product = = 5 units per hour
– new product = = 4 units per hour
unit cost – existing product = = $15 per unit
– New product = = $14 per unit
Financial
Gross profit – existing product = = 32%
– new product = = 44%
Innovation and learning
Development costs as % of sales = = 7%
(b) Using a range of performance indicators will allow Spotlight Productions to look at the success
of the new product in wider terms than just its profitability. For example, productivity is lower
for the new product than the existing product, so managers may wish to examine the processes
involved in order to make improvements. Sales of the new product look very promising but some
additional measures of customer satisfaction could provide a better view of long-term prospects.
Q40: A bus company uses Kaplan and Norton’s balanced scorecard as a way of developing its
performance measurement mix.
32
One of the measures it has chosen to use is the number of days of driver training each year. The
company feels that this will reduce the number of accidents and casualties due to more skilled and
motivated drivers.
Which one of the balanced scorecard perspectives would this measure relate to?
A. Learning and growth
B. Internal business processes
C. Customer perspective
D. Financial perspective
Answer:-The correct answer is A
Learning and growth relates to both innovation and training for staff though this could also have a
positive effect on both customers and service quality.
Q41: Jamair is one of a growing number of low-cost airlines in the country of Shania. Jamair’s strategy
is to operate as a low-cost, high efficiency airline.
The airline was given an ‘on time arrival’ ranking of seventh best by the country’s aviation authority,
who rank all 50 of the country’s airlines based on the number of flights which arrive on time at their
destinations.
The average ‘ground turnaround time’ for airlines in Shania is 50 minutes, meaning that, on average,
planes are on the ground for cleaning, refueling, etc for 50 minutes before departing again.
The number of passengers carried by the airline has grown from 300,000 passengers on a total of 3,428
flights in 2007 to 920,000 passengers on 7,650 flights in 2013.
The overall growth of the airline has been helped by the limited route licensing policy of the Shanian
government, which has given Jamair almost monopoly status on some of its routes. However, the
government is now set to change this policy with almost immediate effect, and it has become more
important than ever to monitor performance effectively.
Required:—
(i) The _______ perspective considers whether the management in Jamair meets the expectations of
its shareholder and how it creates value for them.
Which of the following words is missing from the above statement?
(a) Customer
(b) Internal business
(c) Innovation and learning
(d) Financial
(ii) The following performance measure has been suggested for Jamair:
Improve on the ‘on time arrival’ ranking of seventh best in the country’s aviation authority
ratings.
To which perspective of the balanced scorecard does this measure belong?
(a) Customer perspective
(b) Internal business perspective
(c) Innovation and learning perspective
(d) Financial perspective
(iii) The following performance objective has been suggested for Jamair:
Improve the turnaround time on the ground
To which perspective of the balanced scorecard does this objective belong?
(a) Customer perspective
33
(b) Internal business perspective
(c) Innovation and learning perspective
(d) Financial perspective
(iv) The following performance objective has been suggested for Jamair:
Increase seat revenue per plane
To which perspective of the balanced scorecard does this objective belong?
(a) Customer perspective
(b) Internal business perspective
(c) Innovation and learning perspective
(d) Financial perspective
(v) The following statement have been made about Jamair’s performance measurement system.
(1) When performance is not quantified, it si difficult to target and monitor.
(2) Jamair is more likely to have reliable and comprehensive system for collecting data about
qualitative aspects of performance than a well established system for measuring quantitative
data.
Which of the above statements is/are correct?
(a) 1 only
(b) 2 only
(c) Both 1 and 2
(d) Neither 1 nor 2
Solution: D. Financial
The financial perspective considers whether the management in Jamair meets the expectations of its
shareholders and how it creates value for them.
(i) A. customer perspective
The customer perspective consider how new and existing customer view Jamair. The objective is
to ensure that flights land on time.
(ii) B. Internal business perspective
The internal business perspective makes Jamair consider what processes it must excel at in order
to achieve financial and customer objectives. The measures may be: reduction in ‘on the ground’
time from 50 minutes.
(iii) D. financial perspective
The measure could be ‘revenue per available passenger mile’. The financial perspective
considers whether the management in Jamair meets the expectations of its shareholders and how
it creates value for them.
(iv) A. 1 only
Statement 1 is true. By its very nature, qualitative data is no quantified. At best, qualitative
measures are converted into quantitative measures using a subjective scoring system.
Statement 2 is false. An organization is much more likely to have a well-established system for
measuring quantitative data, especially in the areas of accounting and sales statistics.
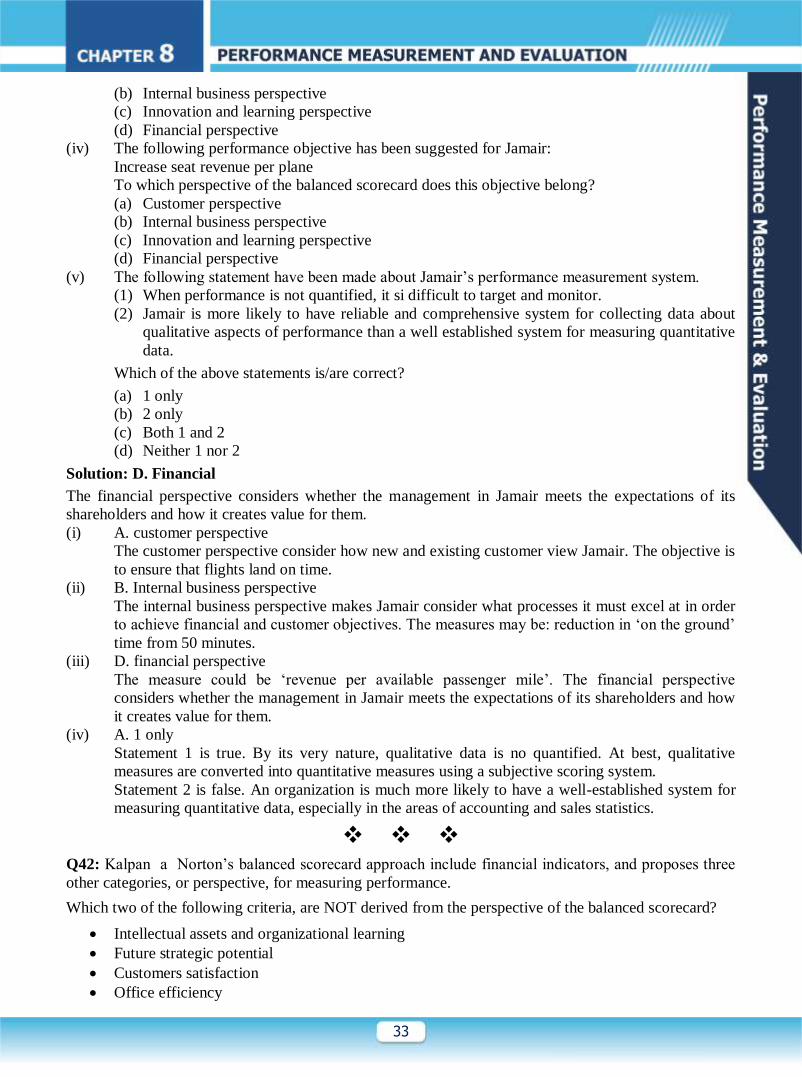
Q42: Kalpan a Norton’s balanced scorecard approach include financial indicators, and proposes three
other categories, or perspective, for measuring performance.
Which two of the following criteria, are NOT derived from the perspective of the balanced scorecard?
Intellectual assets and organizational learning
Future strategic potential
Customers satisfaction
Office efficiency

34
Present competitive position
Answer: The correct answer is: Innovation and learning.
One of the key aspects of the innovation and learning perspective (also known as Learning and growth)
is the number of new products developed.
The Customers perspective may also look at the proportion of sales from new products ( to see how
attractive new products are to customers) but new product development is most explicitly related to the
innovation and learning perspective.
Q43: In order to regain a competitive position the Managing Director of MCG plc. A divisionalised
business has been advised to reduce the range of products and the product lines by about 20% to
increase profits by at least 40%. To implement such a product divestment strategy could, he fears,
alienate customers. He needs to know which products need to be removed and which products are
important to the survival of the company. He is unhappy about the overall performance of his
company’s activities. Benchmarking has been recommended as a method of assessing how his
company’s performance compares with that of his competitors.
Select all that apply:
Internal bench-marking can compare different divisions within Mcg; some centres may be more
profitable than others.
Internal benchmarking could result in a transfer of knowledge and skills and could be beneficial
to the group as a whole
Competitive benchmarking attempts to compare products, processes and results and show where
the company is failing with reference to those of competitors.
Customer benchmarking attempts to compare corporate performance with the performance
expected by customers.
Answers: All statements apply.
Q44: Explain briefly the major components of a Balanced Scorecard?
Solution: An ideal Balanced Scorecard combines financial measures of past performance with measures
of the Firm’s drivers of future performance. The following perspective are evaluated:
1. Customer Perspective-Measures of Price/Delivery/Quality/Support
2. Internal Perspective-Measures of efficiency/Sales Penetration and New product introduction.
3. Innovation and Learning Perspective-Measures of Technology/Cost Leadership
4. Financial Perspective-Sales/Cost of sales/Return on capital Employed etc.
Q45:Classify the following measures under appropriate categories in a Balanced Scorecard for a
banking company which excels in its home loan products.
1. A new product related to life insurance is being considered for a tie up with the successful
housing loan disbursements.
e.g. every housing loan applicant to be advised to take a life policy or compelled to take a fire insurance policy.
2. How different sectors of housing loans with different interest rates have been sanctioned their
volumes of growth in the past 4 quarters.
35
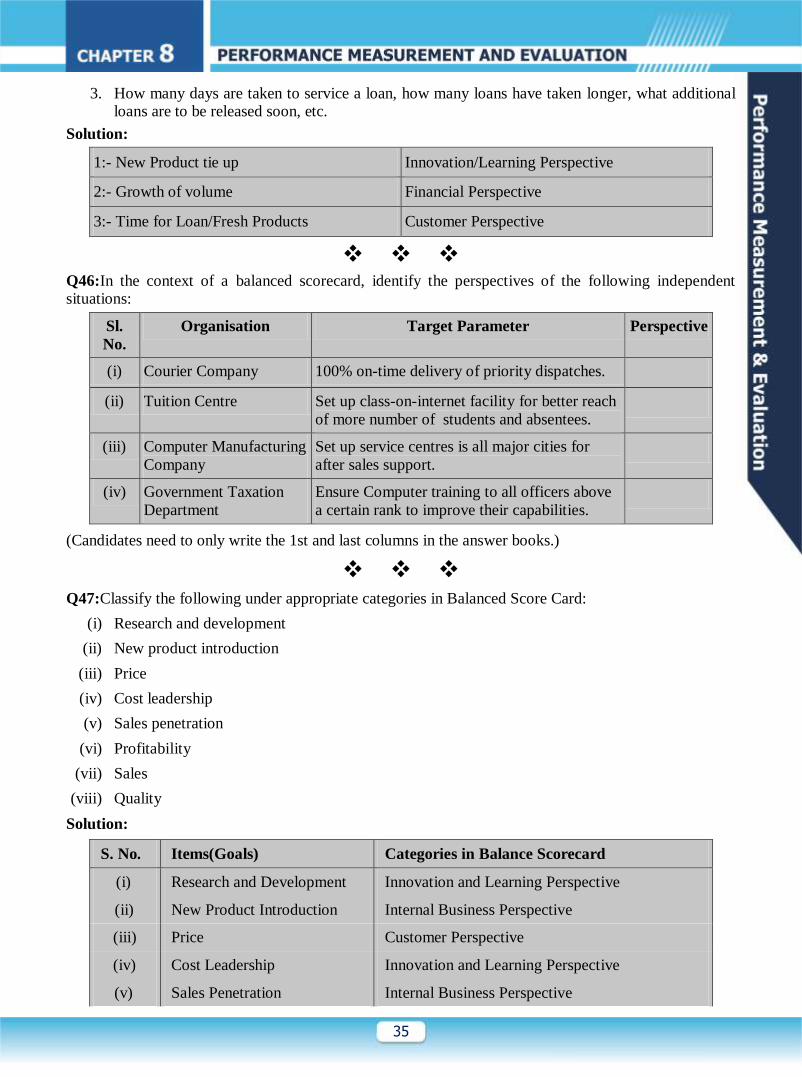
3. How many days are taken to service a loan, how many loans have taken longer, what additional loans are to be released soon, etc.
Solution:
1:- New Product tie up Innovation/Learning Perspective
2:- Growth of volume Financial Perspective
3:- Time for Loan/Fresh Products Customer Perspective
Q46:In the context of a balanced scorecard, identify the perspectives of the following independent situations:
Sl.
No.
Organisation Target Parameter Perspective
(i) Courier Company 100% on-time delivery of priority dispatches.
(ii) Tuition Centre Set up class-on-internet facility for better reach
of more number of students and absentees.
(iii) Computer Manufacturing
Company
Set up service centres is all major cities for
after sales support.
(iv) Government Taxation
Department
Ensure Computer training to all officers above
a certain rank to improve their capabilities.
(Candidates need to only write the 1st and last columns in the answer books.)
Q47:Classify the following under appropriate categories in Balanced Score Card:
(i) Research and development
(ii) New product introduction
(iii) Price
(iv) Cost leadership
(v) Sales penetration
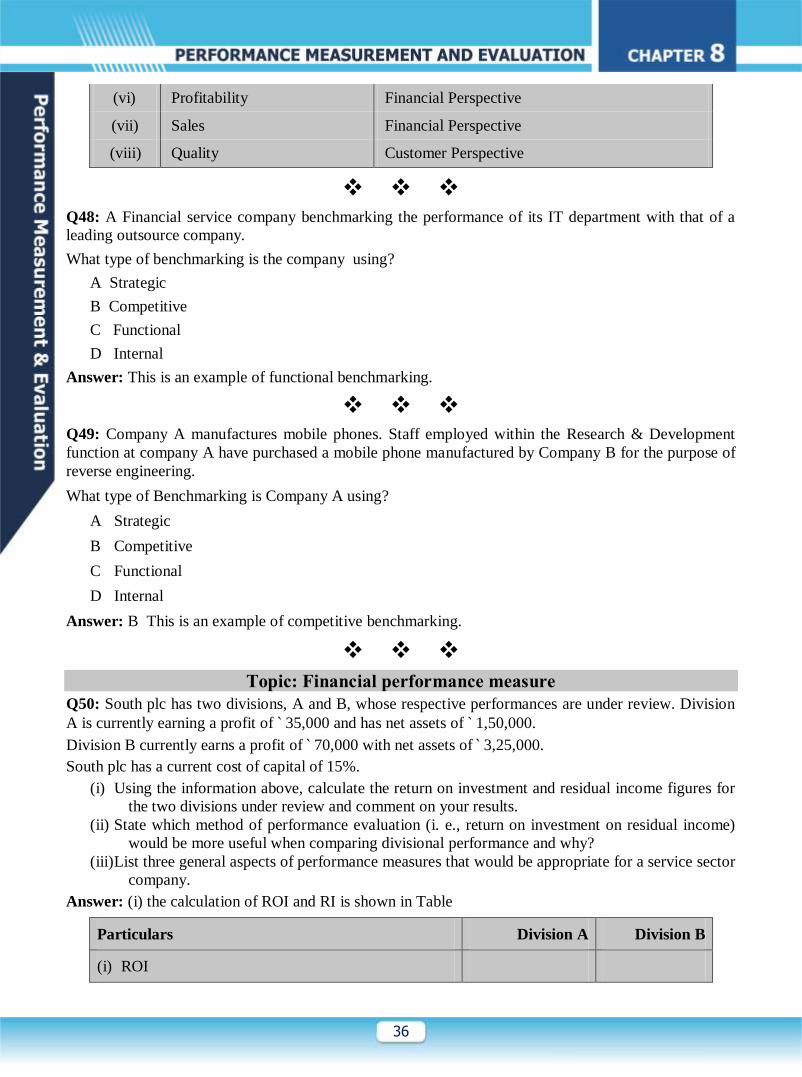
(vi) Profitability
(vii) Sales
(viii) Quality
Solution:
S. No. Items(Goals) Categories in Balance Scorecard
(i) Research and Development Innovation and Learning Perspective
(ii) New Product Introduction Internal Business Perspective
(iii) Price Customer Perspective
(iv) Cost Leadership Innovation and Learning Perspective
(v) Sales Penetration Internal Business Perspective
36
(vi) Profitability Financial Perspective
(vii) Sales Financial Perspective
(viii) Quality Customer Perspective
Q48: A Financial service company benchmarking the performance of its IT department with that of a
leading outsource company.
What type of benchmarking is the company using?
A Strategic
B Competitive
C Functional
D Internal
Answer: This is an example of functional benchmarking.
Q49: Company A manufactures mobile phones. Staff employed within the Research & Development
function at company A have purchased a mobile phone manufactured by Company B for the purpose of
reverse engineering.
What type of Benchmarking is Company A using?
A Strategic
B Competitive
C Functional
D Internal
Answer: B This is an example of competitive benchmarking.
Topic: Financial performance measure
Q50: South plc has two divisions, A and B, whose respective performances are under review. Division
A is currently earning a profit of ` 35,000 and has net assets of ` 1,50,000.
Division B currently earns a profit of ` 70,000 with net assets of ` 3,25,000.
South plc has a current cost of capital of 15%.
(i) Using the information above, calculate the return on investment and residual income figures for
the two divisions under review and comment on your results.
(ii) State which method of performance evaluation (i. e., return on investment on residual income)
would be more useful when comparing divisional performance and why?
(iii)List three general aspects of performance measures that would be appropriate for a service sector
company.
Answer: (i) the calculation of ROI and RI is shown in Table
Particulars Division A Division B
(i) ROI
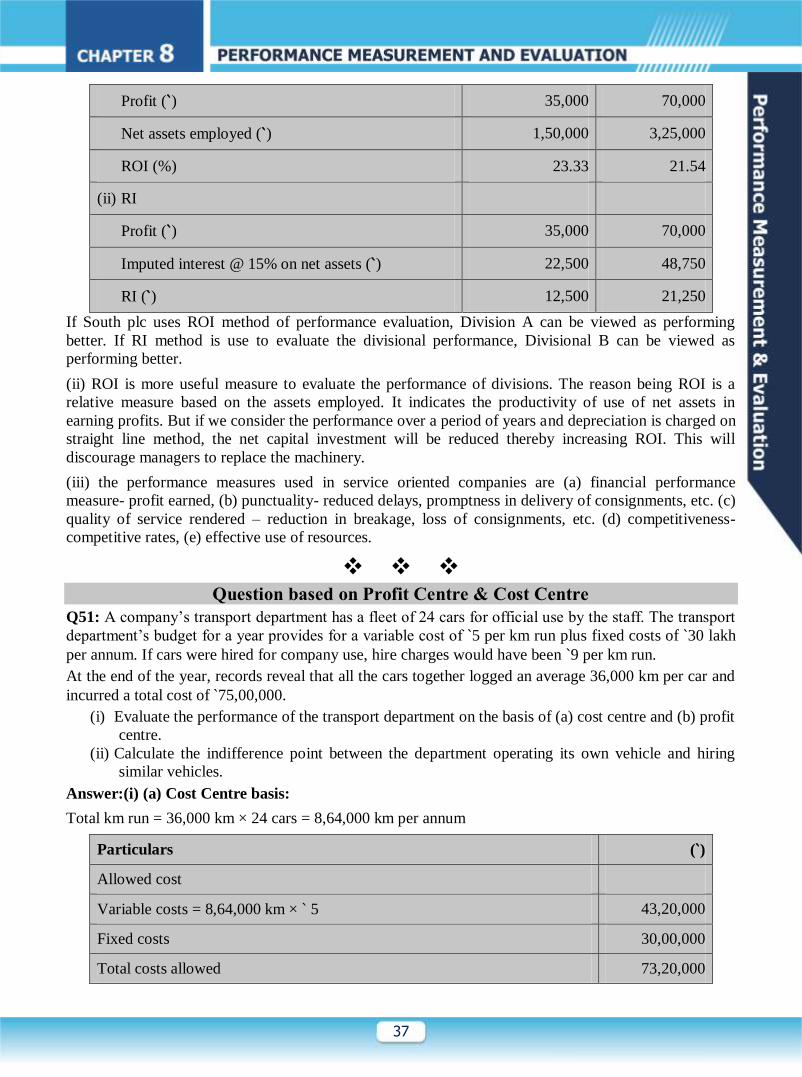
37
Profit (`) 35,000 70,000
Net assets employed (`) 1,50,000 3,25,000
ROI (%) 23.33 21.54
(ii) RI
Profit (`) 35,000 70,000
Imputed interest @ 15% on net assets (`) 22,500 48,750
RI (`) 12,500 21,250
If South plc uses ROI method of performance evaluation, Division A can be viewed as performing
better. If RI method is use to evaluate the divisional performance, Divisional B can be viewed as
performing better.
(ii) ROI is more useful measure to evaluate the performance of divisions. The reason being ROI is a
relative measure based on the assets employed. It indicates the productivity of use of net assets in
earning profits. But if we consider the performance over a period of years and depreciation is charged on
straight line method, the net capital investment will be reduced thereby increasing ROI. This will
discourage managers to replace the machinery.
(iii) the performance measures used in service oriented companies are (a) financial performance
measure- profit earned, (b) punctuality- reduced delays, promptness in delivery of consignments, etc. (c)
quality of service rendered – reduction in breakage, loss of consignments, etc. (d) competitiveness-
competitive rates, (e) effective use of resources.
Question based on Profit Centre & Cost Centre
Q51: A company’s transport department has a fleet of 24 cars for official use by the staff. The transport
department’s budget for a year provides for a variable cost of `5 per km run plus fixed costs of `30 lakh
per annum. If cars were hired for company use, hire charges would have been `9 per km run.
At the end of the year, records reveal that all the cars together logged an average 36,000 km per car and
incurred a total cost of `75,00,000.
(i) Evaluate the performance of the transport department on the basis of (a) cost centre and (b) profit
centre.
(ii) Calculate the indifference point between the department operating its own vehicle and hiring
similar vehicles.
Answer:(i) (a) Cost Centre basis:
Total km run = 36,000 km × 24 cars = 8,64,000 km per annum
Particulars (`)
Allowed cost
Variable costs = 8,64,000 km × ` 5 43,20,000
Fixed costs 30,00,000
Total costs allowed 73,20,000
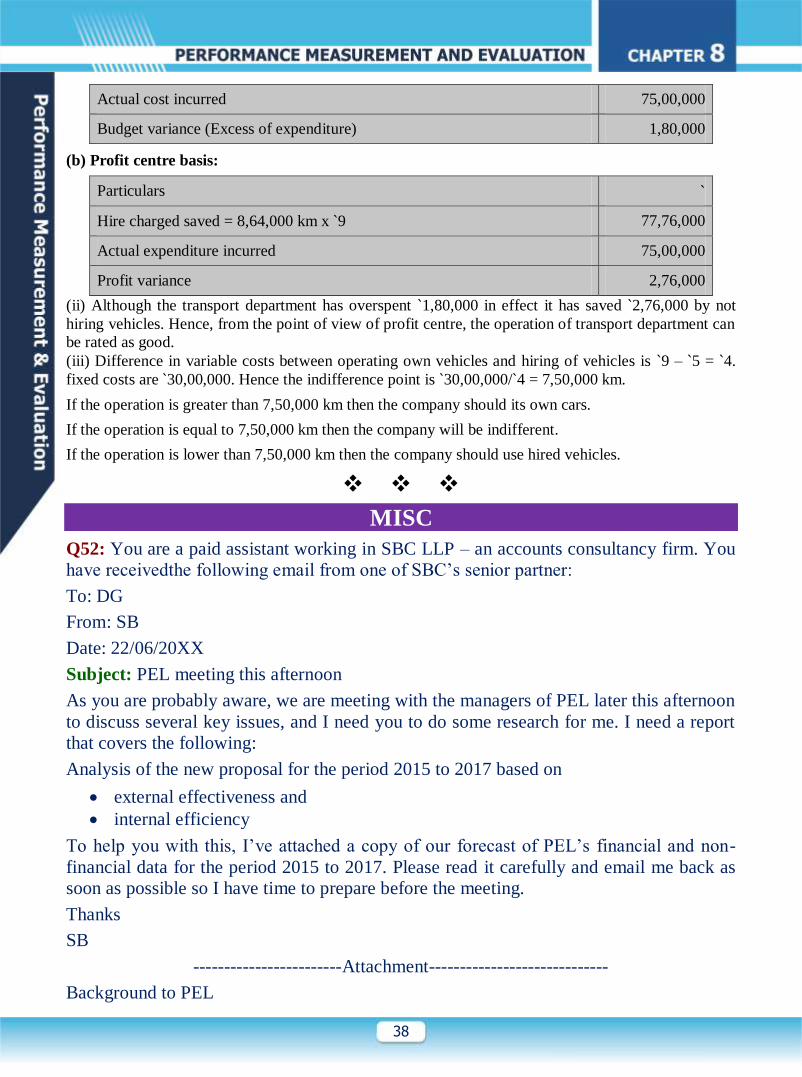
38
Actual cost incurred 75,00,000
Budget variance (Excess of expenditure) 1,80,000
(b) Profit centre basis:
Particulars `
Hire charged saved = 8,64,000 km x `9 77,76,000
Actual expenditure incurred 75,00,000
Profit variance 2,76,000
(ii) Although the transport department has overspent `1,80,000 in effect it has saved `2,76,000 by not
hiring vehicles. Hence, from the point of view of profit centre, the operation of transport department can
be rated as good.
(iii) Difference in variable costs between operating own vehicles and hiring of vehicles is `9 – `5 = `4.
fixed costs are `30,00,000. Hence the indifference point is `30,00,000/`4 = 7,50,000 km.
If the operation is greater than 7,50,000 km then the company should its own cars.
If the operation is equal to 7,50,000 km then the company will be indifferent.
If the operation is lower than 7,50,000 km then the company should use hired vehicles.
MISC
Q52: You are a paid assistant working in SBC LLP – an accounts consultancy firm. You
have receivedthe following email from one of SBC’s senior partner:
To: DG
From: SB
Date: 22/06/20XX
Subject: PEL meeting this afternoon
As you are probably aware, we are meeting with the managers of PEL later this afternoon
to discuss several key issues, and I need you to do some research for me. I need a report
that covers the following:
Analysis of the new proposal for the period 2015 to 2017 based on
external effectiveness and
internal efficiency
To help you with this, I’ve attached a copy of our forecast of PEL’s financial and non-
financial data for the period 2015 to 2017. Please read it carefully and email me back as
soon as possible so I have time to prepare before the meeting.
Thanks
SB
------------------------Attachment-----------------------------
Background to PEL
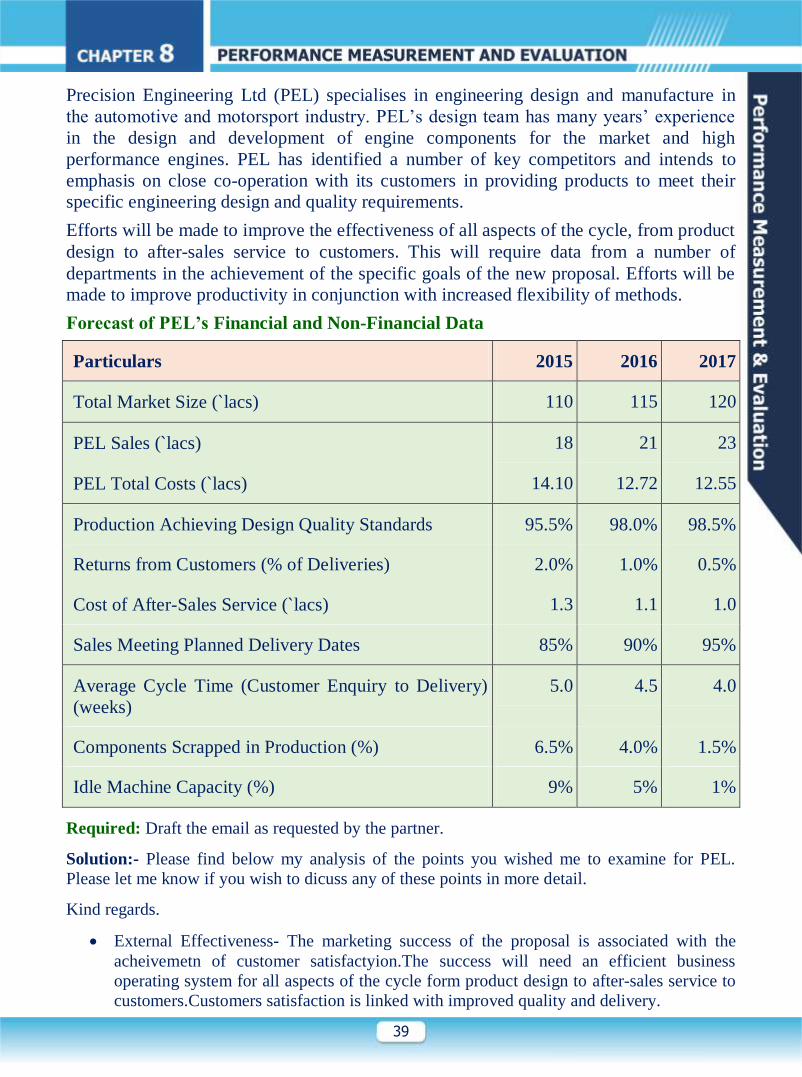
39
Precision Engineering Ltd (PEL) specialises in engineering design and manufacture in
the automotive and motorsport industry. PEL’s design team has many years’ experience
in the design and development of engine components for the market and high
performance engines. PEL has identified a number of key competitors and intends to
emphasis on close co-operation with its customers in providing products to meet their
specific engineering design and quality requirements.
Efforts will be made to improve the effectiveness of all aspects of the cycle, from product
design to after-sales service to customers. This will require data from a number of
departments in the achievement of the specific goals of the new proposal. Efforts will be
made to improve productivity in conjunction with increased flexibility of methods.
Forecast of PEL’s Financial and Non-Financial Data
Particulars 2015 2016 2017
Total Market Size (`lacs) 110 115 120
PEL Sales (`lacs) 18 21 23
PEL Total Costs (`lacs) 14.10 12.72 12.55
Production Achieving Design Quality Standards 95.5% 98.0% 98.5%
Returns from Customers (% of Deliveries) 2.0% 1.0% 0.5%
Cost of After-Sales Service (`lacs) 1.3 1.1 1.0
Sales Meeting Planned Delivery Dates 85% 90% 95%
Average Cycle Time (Customer Enquiry to Delivery)
(weeks)
5.0 4.5 4.0
Components Scrapped in Production (%) 6.5% 4.0% 1.5%
Idle Machine Capacity (%) 9% 5% 1%
Required: Draft the email as requested by the partner.
Solution:- Please find below my analysis of the points you wished me to examine for PEL.
Please let me know if you wish to dicuss any of these points in more detail.
Kind regards.
External Effectiveness- The marketing success of the proposal is associated with the
acheivemetn of customer satisfactyion.The success will need an efficient business
operating system for all aspects of the cycle form product design to after-sales service to
customers.Customers satisfaction is linked with improved quality and delivery.
40
Quantitative measures of these factors are as follows:-
Quality is expected to improve.The percentage of production achieving design quality
standard is expected to increase from 95.5% to 98.5% between 2017 and 2019. In the
same period, returns from customers for replacement of rectification should drop from
2% to 0.5% and the cost of after sales service should drop from Rs. 1.3 lacs to Rs. 1.0
lacs.
Delivery efficiency improvement that is expected may be measured in terms of the rise in
the percentage of goods acheioving the planned delivery date. This percentage rises from
85% in 2017 to 95% 2019.
Internal Efficiency – The financial success of the proposal is linked to the achievement of
high productivity.This should be helped through reduced cycle time and decreased levels
of waste.
Quantitative measures of these factors are as follows:-
The average total cycle time from customer enquiry to delivery should drop from 5
weeks in 2017 to 4 weeks in 2019.
Waste in the form of idle machine capacity is expected to drop from 9% to 1% between
2019 and 2019. Also, component production scrap is expected to drop from 6.5% in 2019
to 1.5% in 2019.
Q53:The town of Silver Sands is located along the coast of the Caribbean Sea. Known
for its beautiful coastline and pleasant weather, the town attracts a lot of tourists from all
around the world. The town has two beaches that are maintained by the local government
and can be used by the general public. In order to preserve the natural ecosystem, other
beaches on the coastline are not accessible to the general public. Tourism is the main
source of livelihood for its residents. Consequently, cleanliness of beaches is of
paramount importance in order to sustain and develop this industry.
The local government has recently employed a contractor to clean up the beaches using
beach cleaning machines. The contractor has been selected through a competitive
tendering/bidding process. The contractor uses sand cleaning machines that are pulled by
tractors. Sand is scooped onto a conveyor or screening belt. It is either raked through
(combed using prongs) or sifted through (filtered), in order to separate the waste from the
sand. The cleaned sand is left behind on the beach while the waste is removed. Majority
of the litter comprises of plastic waste (bags, bottles etc.) while some portion also
includes sea weed, glass, aluminum cans, paper, timber, and cardboard. A detailed log is
kept by the contractor about the stretch of beach that has been cleaned, time taken for the
clean-up, number of tractors used etc. This log is also checked and signed by a local
government official. This record is used to process payments at the end of the month.
In addition to contracting with the vendor to clean machines, the local government has
also placed bins at various locations on the beach for the public to dispose their waste.
41
The town’s municipality workers clean these bins every morning. Again, detailed logs of
the man power and other resources employed is kept by the responsible department. In
addition, the government has opened a mobile messaging system, whereby the public can
message the government department if they find litter anywhere in the beach. Depending
on whether it is from overflowing bins or buried debris in the sand, the municipality
workers or the contractor will take action to clear it within 24 hours. A detailed log of
these operations is also maintained. Patrons can also suggest measures for improving
cleanliness on the beaches.
Due to its importance to the economy, the local government has allotted substantial
budget for these operations. At the same time, it is essential to know if this is sufficient
for the purpose of keeping the beaches clean. Therefore, the government wants to assess
whether the town is getting “good value for money” from this expenditure. The “value
for money” concept can be looked at from three perspectives: (i) economy, (ii) efficiency
and (iii) effectiveness. The Internal Audit (IA) department that has been requested to
undertake this study, has requested for guidelines on whether the audit should focus on
economy and efficiency of the beach cleaning operations or on effectiveness of the same.
Economy and efficiency audit assess whether the same level of service can be procured at
lower cost or resources while effectiveness audit assess whether better service can be
procured at same cost.
Depending on the outcome of the audits, if required, policy decisions like requesting for
additional funding from the state government, alternate policy measures like levying
penalty for littering etc. can be taken.
Required
Prepare a letter addressed to the IA department.
(i) RECOMMEND guidelines to assess economy and efficiency of beach cleaning
operations.
(ii) RECOMMEND guidelines to assess effectiveness of beach cleaning operations.
(iii) IDENTIFY challenges involved in assessment of effectiveness ?
(iv) RECOMMEND general guidelines, how the audit team may conclude the audit
based on the combined outcomes of economy, efficiency, and effectiveness ?
Solution:-
Date 30 July-2018
Dear Sirs,
Re: The economy, efficiency and effectiveness of beach cleaning activities
(i) Economy and efficiency audit of an operation focuses on the consumption of
resources and the output achieved. Economy assesses the financial aspects of
the activity i.e. are the objectives of the activity being achieved at reasonable
cost. Efficiency assesses the volume of input consumed to derive the desired
output i.e. are the resources and funds being consumed to get maximum
output?
(ii) (To look at Economy of operations cleaning expenses need to the bifurcated
42
into payment made to the contractor and the expenses of emptying waste,
from bins.Any further subcategories of these expenses, like labour, matteiral
disposal van expenses etc. also need to be collated from the accounting or cost
records.These then have to be compared to the busdgets that were approved
by the government of Silver sands. The competitive tendering process can be
reviewed to ensure that contractor getting the order is offering the required
quality of service at the lowest price. If the quality of cleaning has been
achieved, by staying within budget, the operation is economical. However if
the actual exceed the budget, the government has to compare them with cost
of similar cleaning activities carried by neighbouring towns. On comparison,
if Silver Sands operations are expensive compared to other towns. It indicated
that not only are the operations uneconomical they may not be efficient either.
(iii) Efficiency of operations can be determined by cjecking the log records
maintained for beach cleaning bythe contractor and municipality
workers.These would have detailed of activities carried out and the resources
utilized for each of them.For each of these services (beach cleaning and
emptying out bins), the cost drivers can be identified and certain metrics can
be developed for analysis. For example, the cost of running the tractors can be
divided by the total number of tractors operated to get the cost of operations
per tractor or laternatively, by the kilometers of beach cleaned to arrive at a
tractor-kilometre rate. While analysisng these activities, certain operational
considerations have t be given. For example certain stretches of the beaches
may take more time or resources to clean due to issues like rocks ro soft sand.
Therefore if resources for operations disproportionate for certain parts of the
beaches, the cost of maintaining those stretches need to be worked out. Data
to get this information will depend on the extent of detailed maintained in the
logs. This information has to be tracked over some period of time in order to
understand trends in operations and related expenses.
The data collected from the mobile messaging system should also be
investigated. How often and in what stretches of the beach are complaints
frequent or maximum? Reasons for these lapses need to be taken from the
contractor(for beach cleaning operations) and the concerned department (for
emptying bins) in order to find out whether resources are being employed
properly.
On the basis, deviations and expectation should be investigated.The local
government can then decide if there can be alternative sites along the coastline
that may be more economical and efficient to operate.
(ii) An audit about Effectiveness of Operations would focus how the actual
cleanliness of beaches compares with the desired level as laid out in the policy
initiative.To assess whether performance has been met, clear guidance and
metrics have to be defined during policy implementation.
To begin with, it should be clear as to what constitutes litter.From an
operational angle. It wold be difficult to clean out every bit of paper lying on
43
the beach. However it is possible to pick up every soft drink aluminum can.
Hence the government authorities must be cleared within exception (example
food refuse, animal droppings, glass bottles, tin cans, trash bins etc.) and
tolerance level for certain other types of litter (e.g. Paper, seaweed etc.) that
may get left behind even after cleaning .Quantity of waste collected would be
the indicator to make the above assessment.
Certain other parameters like safety standards can also be defined.Safety
problems could be cuts from sharp objects like glass incidents of vector borne
diseases in the area or health problems from polluted sea water.Assessment
has to be made whether these standards have been met.
For this the primary source of information about cleanliness would be
feedback from the beach patrons. These could be in the form of complaints
received directly or those through the mobile messaging system would
provide data to work out the matrics.This would be an indicator of”Customers
satisfaction”. Other inputs could also be the suggestions given by the patrons
about ways to improve cleanliness on the beach.
Observation by making surprise visits to inspect the beaches immediately
after the cleaning operations would also provide sufficient evidence about the
effectiveness of operations
(iv) Challenges Involved in assessment of effectiveness would be:
(a) Defining standard about what constitutes litter and acceptable level o
cleanliness? These are subjective guidelines, the perception of which may
differ from person to person.
(b) Beach patrons also play an important role in making this initiative
effective.There has to be a conscious civic sense of duty not to litter,
failing which this initiative will most likely be ineffective.Therefore, while
measuring performance for effectiveness. Collection of more litter does not
necessarily indicate effective operations. More litter requires more
cleaning and more resources, therefore is actually not a positive indicator
of effectiveness. On the contrary, in the long run, lesser litter collected to
maintain desired level of cleanliness would be a good indicator of
effectiveness.
(v) The outcome of the audits can indicate achievement any or none of the three
parameters of economy, efficiency and effectiveness of the beach cleaning
operation.TO form an integrated conclusion based on the different outcomes
of individuals audits, the audit team may consider the following guideline:
(a) Has the objective of the cleaning operation been achieved as per the
guideline in the relevant policy? i.e. have the operations been effective?
(b) If the answer to (a) is yes. Are the expenses within budget. If so , then the
operations are economical and efficient.Given that the operations have
been effective at the same time economy and efficiency have been
achieved, the team can conclude that the cleaning operations policy has
been a success.

44
A Cost-over run can also be justified if the operations have been effective. In that
case, the audit team has to conclude whether all expenses incurred are indeed
justified and that the resources have been put to the best possible use , if not, can
the operations be made more economical or efficient?
(c ) If the answer to (a) is no, the operation has not been effective then is the
difference from the target marginal or huge? If the operations have not been
entirely effective, but only by marginal gap say 95% success, then analysis of
expenses can be made similar to the point (b) mentioned above. However if the
operations have been ineffective to a larger extent, then the cleaning drive
initiative has been ineffective. The government has to look at alternate solutions of
tracking the problem.These could include imposing heavy penalty for littering
requesting for more funding from the state government to employ better resources
etc.
Therefore , it can be seen that achievement of one objective does not auto-
matically lead to achievement of other objectives.A holistic approach would be
needed to draw conclusion about the performance of the cleaning operations.
Should you have any further queries, please do not hesitate to ask.
Yours Faithfully
Management Accountant.
Q60: Beta Control (BC) is a global leader in manufacturing of commercial building
control systems with over 250 distributors and many thousands of installations in more
than 50 countries. Control systems involve air conditioning systems, facility management
energy and water management access control and security controls etc. At BC,
manufacturing is done at a number of factory sites where some products are easy and
largely produced and have a long life while other products are intricated and have a short
life due to changing technologies. BC’s mission statement is “to keep you ahead through
control systems that improve productivity and save energy.
A newly appointed Chief executive officer (CEO) is anxious about declining share price
of BC in the last two years. She identified that the business has grown through
acquisition and senior management have focused on making corporate deals but not on
making control systems. She announced that the BC’s focus must be on optimization and
upgradation of its value generation rather than just getting bigger through acquisitions.
Assuming yourself as a performance management expert of BC, the CEO has asked you
to aid her in her improvement programme. Firstly she wants your views on the use of
EVA as the key performance metric at BC. You are given the current EVA computation
(Annexture1) but there is some suspicion about whether the assistant who has done this
work is sufficiently well trained about this method. So, she required you to examine his
accuracy and the assumptions forming part of the calculation.
Required
Write a report to the chief executive officer to EVALUATE the accuracy of the EVA
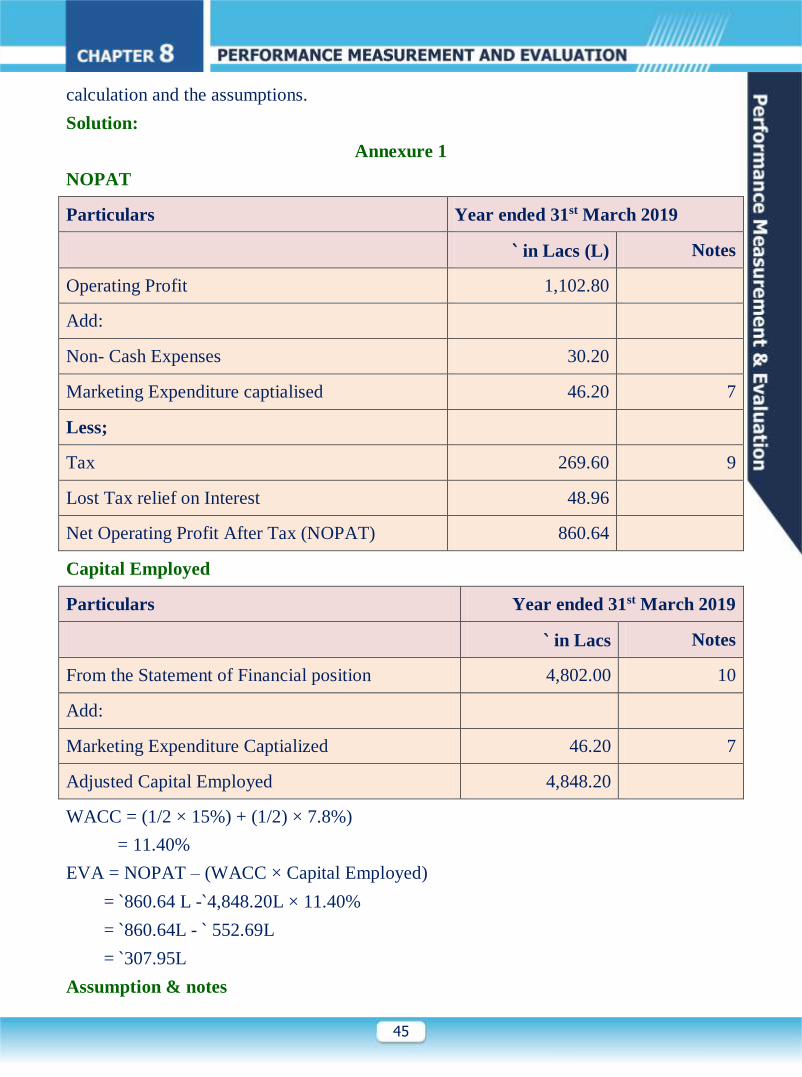
45
calculation and the assumptions.
Solution:
Annexure 1
NOPAT
Particulars Year ended 31st March 2019
` in Lacs (L) Notes
Operating Profit 1,102.80
Add:
Non- Cash Expenses 30.20
Marketing Expenditure captialised 46.20 7
Less;
Tax 269.60 9
Lost Tax relief on Interest 48.96
Net Operating Profit After Tax (NOPAT) 860.64
Capital Employed
Particulars Year ended 31st March 2019
` in Lacs Notes
From the Statement of Financial position 4,802.00 10
Add:
Marketing Expenditure Captialized 46.20 7
Adjusted Capital Employed 4,848.20
WACC = (1/2 × 15%) + (1/2) × 7.8%)
= 11.40%
EVA = NOPAT – (WACC × Capital Employed)
= `860.64 L -`4,848.20L × 11.40%
= `860.64L - ` 552.69L
= `307.95L
Assumption & notes
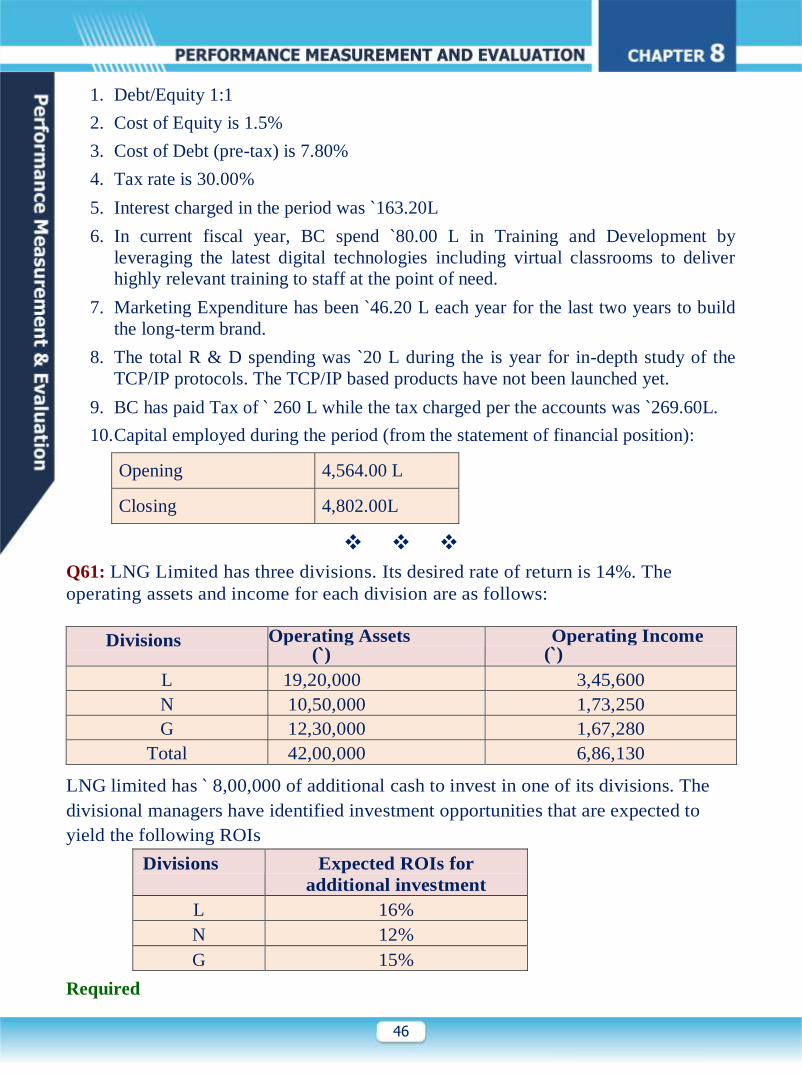
46
1. Debt/Equity 1:1
2. Cost of Equity is 1.5%
3. Cost of Debt (pre-tax) is 7.80%
4. Tax rate is 30.00%
5. Interest charged in the period was `163.20L
6. In current fiscal year, BC spend `80.00 L in Training and Development by
leveraging the latest digital technologies including virtual classrooms to deliver
highly relevant training to staff at the point of need.
7. Marketing Expenditure has been `46.20 L each year for the last two years to build
the long-term brand.
8. The total R & D spending was `20 L during the is year for in-depth study of the
TCP/IP protocols. The TCP/IP based products have not been launched yet.
9. BC has paid Tax of ` 260 L while the tax charged per the accounts was `269.60L.
10. Capital employed during the period (from the statement of financial position):
Opening 4,564.00 L
Closing 4,802.00L
Q61: LNG Limited has three divisions. Its desired rate of return is 14%. The
operating assets and income for each division are as follows:
Divisions Operating Assets (`)
Operating Income (`)
L 19,20,000 3,45,600
N 10,50,000 1,73,250
G 12,30,000 1,67,280
Total 42,00,000 6,86,130
LNG limited has ` 8,00,000 of additional cash to invest in one of its divisions. The
divisional managers have identified investment opportunities that are expected to
yield the following ROIs
Divisions Expected ROIs for
additional investment
L 16%
N 12%
G 15%
Required
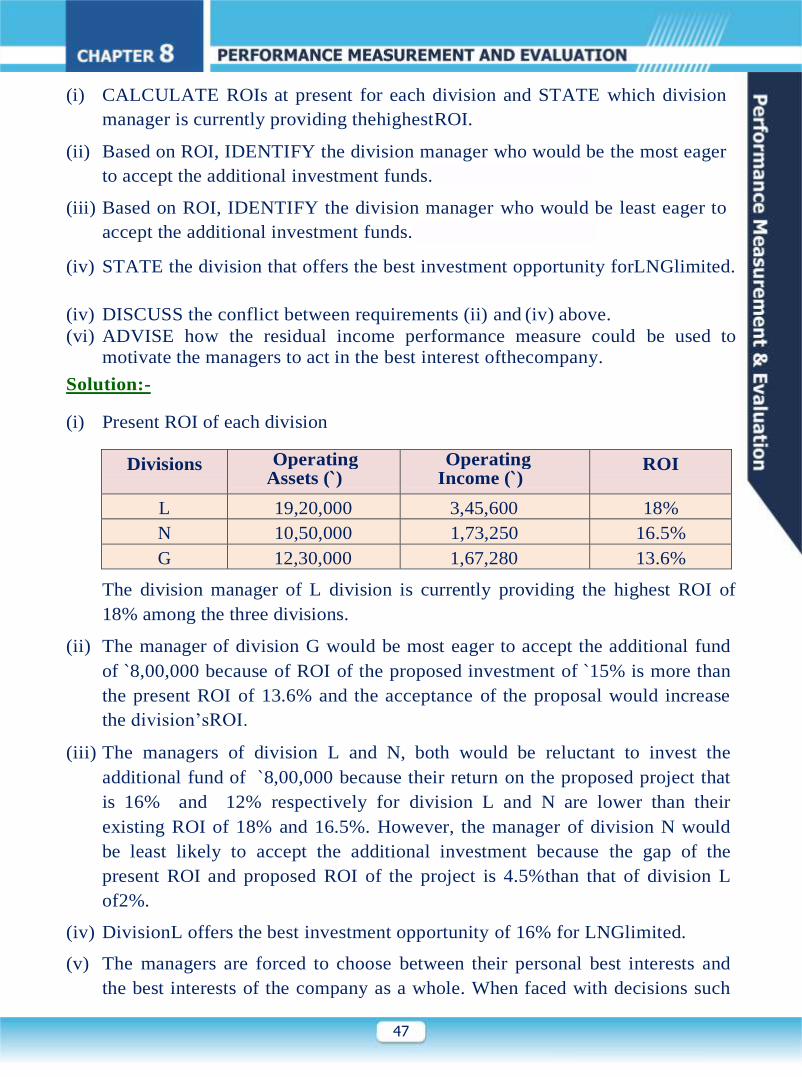
47
(i) CALCULATE ROIs at present for each division and STATE which division
manager is currently providing thehighestROI.
(ii) Based on ROI, IDENTIFY the division manager who would be the most eager
to accept the additional investment funds.
(iii) Based on ROI, IDENTIFY the division manager who would be least eager to
accept the additional investment funds.
(iv) STATE the division that offers the best investment opportunity forLNGlimited.
(iv) DISCUSS the conflict between requirements (ii) and (iv) above.
(vi) ADVISE how the residual income performance measure could be used to
motivate the managers to act in the best interest ofthecompany.
Solution:-
(i) Present ROI of each division
Divisions Operating Assets (`)
Operating Income (`)
ROI
L 19,20,000 3,45,600 18%
N 10,50,000 1,73,250 16.5%
G 12,30,000 1,67,280 13.6%
The division manager of L division is currently providing the highest ROI of
18% among the three divisions.
(ii) The manager of division G would be most eager to accept the additional fund
of `8,00,000 because of ROI of the proposed investment of `15% is more than
the present ROI of 13.6% and the acceptance of the proposal would increase
the division’sROI.
(iii) The managers of division L and N, both would be reluctant to invest the
additional fund of `8,00,000 because their return on the proposed project that
is 16% and 12% respectively for division L and N are lower than their
existing ROI of 18% and 16.5%. However, the manager of division N would
be least likely to accept the additional investment because the gap of the
present ROI and proposed ROI of the project is 4.5%than that of division L
of2%.
(iv) DivisionL offers the best investment opportunity of 16% for LNGlimited.
(v) The managers are forced to choose between their personal best interests and
the best interests of the company as a whole. When faced with decisions such

48
as these, many managers choose to benefit themselves at the expense of their
company, a condition described as suboptimisation.
(vi) Toavoid sub optimisation, the divisional performance measure be based on
Residual Income (RI). If RI is used to measure the performance, there is
greater probability that managers will be encouraged, when acting in their own
best interests, also to act in the best interests of the company. Since, the use of
RI does not penalise investment in projects with lower returns than current
projectreturns.
In general, when RI is used as a performance measure, managers are willing to
invest in any projects with returns equal to or greater than the required rate of
return. However, RI suffers from the disadvantages of being an absolute
measure, which means that it is difficult to compare the performance of a
division with that of other divisions of a different size.
Q62: Faster Pasta is an Italian fast food restaurant that specializes in high quality,
moderately priced authentic Italian pasta dishes and pizzaz. The restaurant has recently
decided to implement a balanced scorecard approach and has established the following
relevant goals for each perspective:
Perspective Goal
Customer perspective To increase the number of new and returning
customers
To reduce the % of customer complaints
Internal To reduce the time taken between taking a
customer’s order and delivering the meal to the
customer.
To reduce staff turnover
Innovation and learning To increase the proportion of revenue from new
dishes
To increase the % of staff time spent on training
Financial To increase spend per customer
To increase gross profit margin
The following information is also available for the year just ended and for the
previous year.
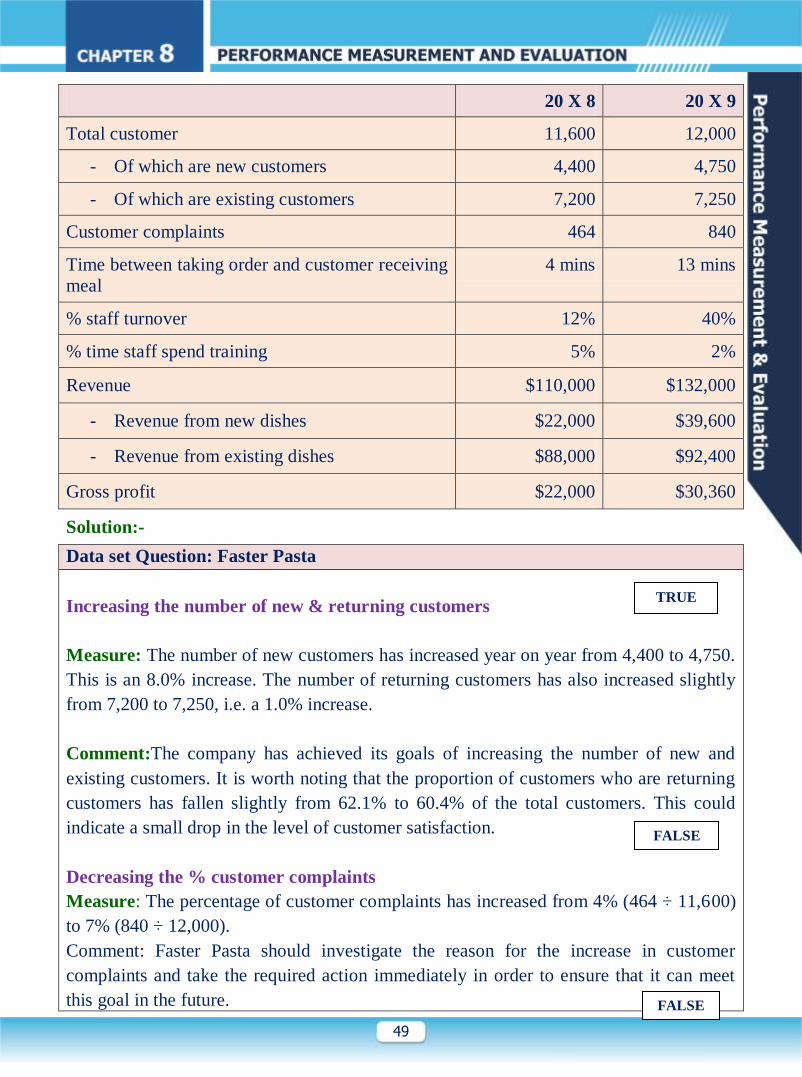
49
20 X 8 20 X 9
Total customer 11,600 12,000
- Of which are new customers 4,400 4,750
- Of which are existing customers 7,200 7,250
Customer complaints 464 840
Time between taking order and customer receiving
meal
4 mins 13 mins
% staff turnover 12% 40%
% time staff spend training 5% 2%
Revenue $110,000 $132,000
- Revenue from new dishes $22,000 $39,600
- Revenue from existing dishes $88,000 $92,400
Gross profit $22,000 $30,360
Solution:-
Data set Question: Faster Pasta
Increasing the number of new & returning customers
Measure: The number of new customers has increased year on year from 4,400 to 4,750.
This is an 8.0% increase. The number of returning customers has also increased slightly
from 7,200 to 7,250, i.e. a 1.0% increase.
Comment:The company has achieved its goals of increasing the number of new and
existing customers. It is worth noting that the proportion of customers who are returning
customers has fallen slightly from 62.1% to 60.4% of the total customers. This could
indicate a small drop in the level of customer satisfaction.
Decreasing the % customer complaints
Measure: The percentage of customer complaints has increased from 4% (464 ÷ 11,600)
to 7% (840 ÷ 12,000).
Comment: Faster Pasta should investigate the reason for the increase in customer
complaints and take the required action immediately in order to ensure that it can meet
this goal in the future.
TRUE
FALSE
FALSE
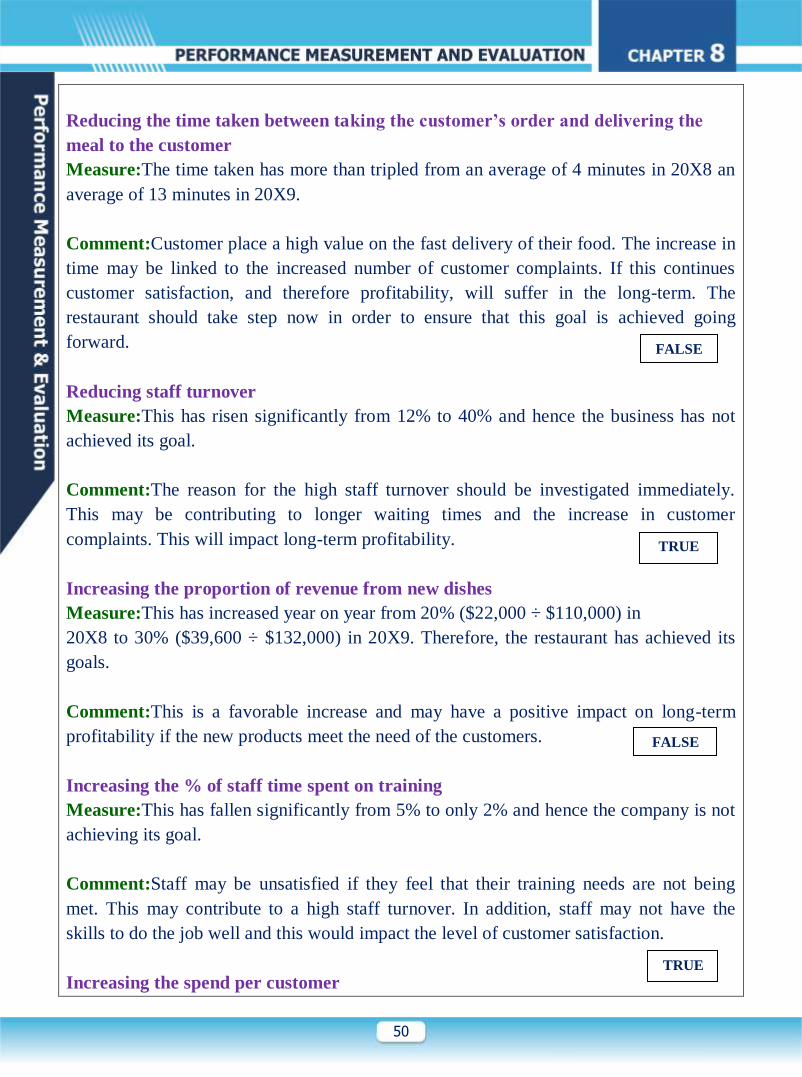
50
Reducing the time taken between taking the customer’s order and delivering the
meal to the customer
Measure:The time taken has more than tripled from an average of 4 minutes in 20X8 an
average of 13 minutes in 20X9.
Comment:Customer place a high value on the fast delivery of their food. The increase in
time may be linked to the increased number of customer complaints. If this continues
customer satisfaction, and therefore profitability, will suffer in the long-term. The
restaurant should take step now in order to ensure that this goal is achieved going
forward.
Reducing staff turnover
Measure:This has risen significantly from 12% to 40% and hence the business has not
achieved its goal.
Comment:The reason for the high staff turnover should be investigated immediately.
This may be contributing to longer waiting times and the increase in customer
complaints. This will impact long-term profitability.
Increasing the proportion of revenue from new dishes
Measure:This has increased year on year from 20% ($22,000 ÷ $110,000) in
20X8 to 30% ($39,600 ÷ $132,000) in 20X9. Therefore, the restaurant has achieved its
goals.
Comment:This is a favorable increase and may have a positive impact on long-term
profitability if the new products meet the need of the customers.
Increasing the % of staff time spent on training
Measure:This has fallen significantly from 5% to only 2% and hence the company is not
achieving its goal.
Comment:Staff may be unsatisfied if they feel that their training needs are not being
met. This may contribute to a high staff turnover. In addition, staff may not have the
skills to do the job well and this would impact the level of customer satisfaction.
Increasing the spend per customer
FALSE
TRUE
FALSE
TRUE

51
Measure:Spend per customer has increased from $9.48 ($110,000 ÷ 11,600) to $11.00
($132,000 ÷ 12,000), i.e. a 16.0% increase.
Comment:This is a favorable increase. However, the issues discussed above must be
addressed in order to ensure that this trend continues.
Increasing gross profit margin
Measure:The gross profit margin has increased year on year from 20% ($22,000 ÷
$110,000) to 23% ($30,360 ÷ $132,000).
Comment:This is a favorable increase. However, the issues discussed above must be
addressed in order to ensure that this trend continues.
Q63: Nestle India Ltd makes custom labeled, high quality, specialty candy bars for
special events and advertising purposes. The company employees several chocolatiers
who were trained in Switzerland. The company offers many verities of chocolate,
including milk, semi-sweet, white, and dark chocolate. It also offers a variety of
ingredients, such as coffee, berries and fresh mint. The real appeal for the company’s
product, however, is its custom labeling. Customers can order labels for special occasion
(for example, business card labels). The company’s balance scorecard for 2015 follows.
For brevity, the initiatives taken under each objective are omitted.
Objectives Measures Target
performance
Actual
performance
Financial
perspective
Increase shareholders
values
Operating-income changes
from price recovery `5,00,000 `7,50,000
Operating-income changes
from price growth `1,00,000 `1,25,000
Cost saving due to reduced
packaging size `20,000 `25,000
Customer
perspective
Increase market share Market share of overall candy 8% 7.8%
TRUE
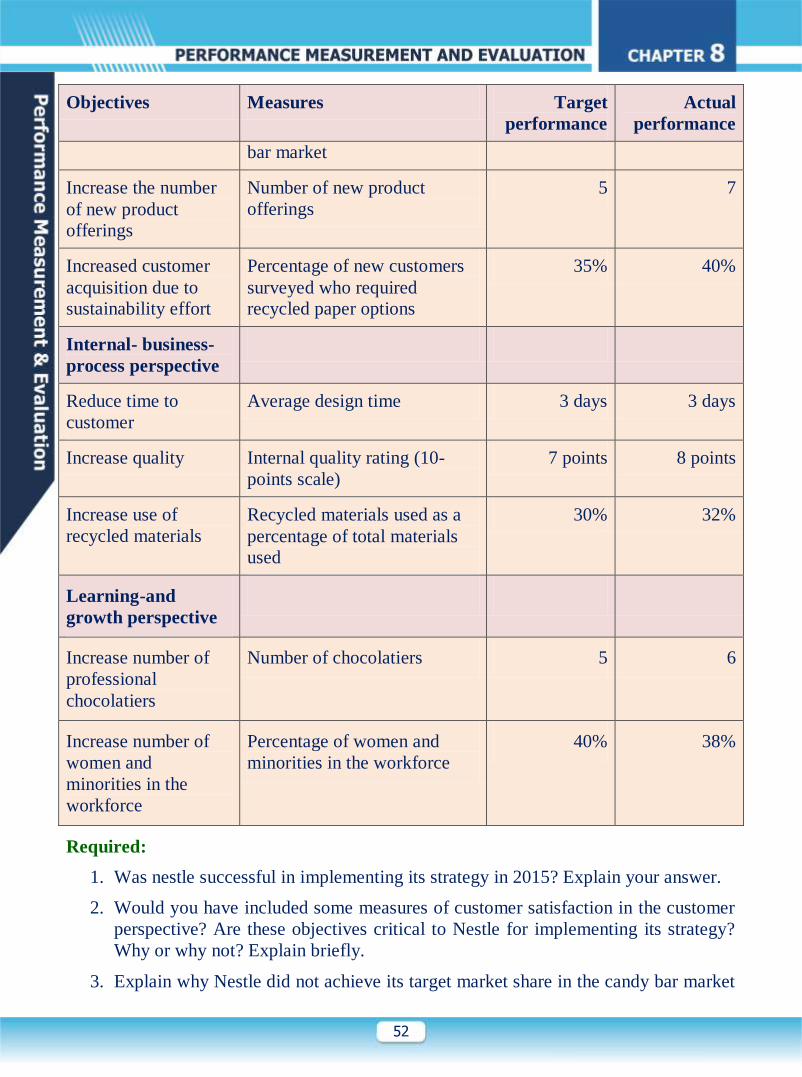
52
Objectives Measures Target
performance
Actual
performance
bar market
Increase the number
of new product
offerings
Number of new product
offerings
5 7
Increased customer
acquisition due to
sustainability effort
Percentage of new customers
surveyed who required
recycled paper options
35% 40%
Internal- business-
process perspective
Reduce time to
customer
Average design time 3 days 3 days
Increase quality Internal quality rating (10-
points scale)
7 points 8 points
Increase use of
recycled materials
Recycled materials used as a
percentage of total materials
used
30% 32%
Learning-and
growth perspective
Increase number of
professional
chocolatiers
Number of chocolatiers 5 6
Increase number of
women and
minorities in the
workforce
Percentage of women and
minorities in the workforce
40% 38%
Required:
1. Was nestle successful in implementing its strategy in 2015? Explain your answer.
2. Would you have included some measures of customer satisfaction in the customer
perspective? Are these objectives critical to Nestle for implementing its strategy?
Why or why not? Explain briefly.
3. Explain why Nestle did not achieve its target market share in the candy bar market
53
but still exceeded its financial targets. Is “market share of overall candy bar
market” a good measure of market share for Nestle? Explain briefly.
4. Do you agree with Nestle’s decision not to include measures of changes in
operating income from productivity improvements under the financial perspective
of the balanced scorecard? Explain briefly.
5. Why did Nestle include balanced scorecard standards relating to environment and
social performance? Is the company meeting its performance objectives in these
areas?
Solution
1. Nestle‘s strategy is to focus on “service-oriented customers” who are willing to pay a
higher price for services. Even though candy bars are largely a commodity product,
Nestle wants to differentiate itself through the service it provides with its custom
labeling and high- quality product.
Does the scorecard represent Nestle’s strategy? By and large it does. The focus of the
scorecard is on measures of process improvement, quality, market share, and financial
success from product differentiation and charging higher prices for customer service.
There are some deficiencies that the subsequent assignment question raises, but
abstracting from these concern for the moment, the scorecard does focus on
implementing a product differentiation strategy.
Based on the scorecard being reasonably well designed, how has Nestle performed
relative to its strategy in 2115? It appears from the scorecard that Nestle was
successful in implementing its strategy in 2015. It achieved all targets in the financial,
internal business, and learning and growth perspective (other than women and
minorities in the workplace). The only target it missed was the market share target in
the customer perspective. At this stage, students may raise some questions about
whether this is a good scorecard measure. Requirement 3 gets at this issue in more
detail. The bottom line is that measuring “market share in the overall candy market”
rather than in the “Specialty candy” market segment is not a good scorecard measure,
so not achieving this target may not be as big a miss as it may seem at first.
2. Yes, Nestle should include some measure of customer satisfaction in the customer-
perspective. Nestle differentiation strategy and ability to charge a premium price is
based on meeting and/or exceeding customer expectations, especially in the custom
design of the labels. Unsatisfied customers will not be loyal or will be unlikely to
recommend the company’s product. hence, customer satisfaction is very important to
Nestle for implementing its strategy. These measures are leading indicators of whether
Nestle will be able to increase its strategy. These measures are leading indicators of

54
whether Nestle will be able to increase its market share in the specialty candy market
and should be measured on the balanced scorecard.
3. To evaluate if it has been successful in implementing its strategy, Nestle needs to
measure its market share in its targeted market segment, not its market share in the
overall market. Given Nestle’s strategy, it should not be concerned if its market share
in the candy bar segment declines. In fact, charging premium prices will probably
cause its market share in this segment to decline. Nestle should replace “market share
in overall candy bar market” with “market share in the specialty food/candy segment”
in its balanced scorecard customer measure. If Nestle is successfully implementing its
strategy, its market share in the specialty candy segment should increase.
4. Nestle is correct in not measuring changes in operating income from productivity
improvements on its scorecard under the financial perspective. Nestle’s strategy is to
grow by charging premium prices for customer service. The scorecard measures focus
on Nestle’s success in implementing this strategy. Productivity gains per se are not
critical to Nestle’s strategy and therefore, should not be measured on the scorecard.
5. Nestle included social and environmental performance measures in its balanced
scorecard because it believes strong environmental and social performance gives it a
competitive advantage by (1) attracting and inspiring outstanding employees, (2)
enhancing its reputation with socially conscious customers, investors and analysts and
(3) boosting its image with governments and citizens, all of which contribute to long-
run financial performance. Nestle also believes that focusing on environmental and
social performance in addition to financial performance helps it to innovate in
technologies, processes, products, and business models to reduce the trade-offs
between financial and sustainability goals and build transformational leadership and
change capabilities to implement these “triple bottom line” strategies.
6. Following the concept of shared value, Nestle includes social and environmental
measures (together with business goals and measures) in its balanced scorecard to
evaluate how well it is doing toward achieving its social and environmental goals. The
balanced scorecard indicates that Nestle’s social and environmental initiatives are
having an effect. Nestle’s increased use of recycled materials as a percentage of total
material used has resulted in attracting customers for whom using recycled materials
matters, creating long-term financial benefit. Similarly, increasing the number of
women and minorities employed will allow Nestle to target a larger number of
talented individuals. Reducing the size of packing both increase income and reduce
waste, achieving both financial and sustainability objectives.
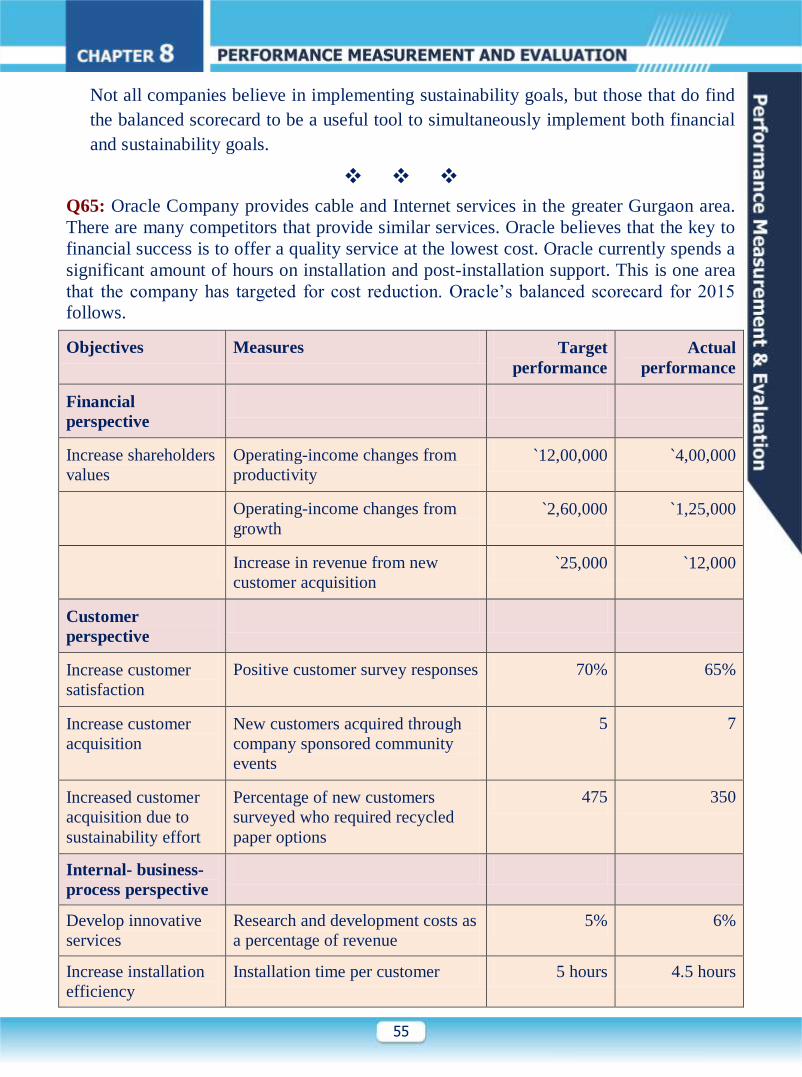
55
Not all companies believe in implementing sustainability goals, but those that do find
the balanced scorecard to be a useful tool to simultaneously implement both financial
and sustainability goals.
Q65: Oracle Company provides cable and Internet services in the greater Gurgaon area.
There are many competitors that provide similar services. Oracle believes that the key to
financial success is to offer a quality service at the lowest cost. Oracle currently spends a
significant amount of hours on installation and post-installation support. This is one area
that the company has targeted for cost reduction. Oracle’s balanced scorecard for 2015
follows.
Objectives Measures Target
performance
Actual
performance
Financial
perspective
Increase shareholders
values
Operating-income changes from
productivity `12,00,000 `4,00,000
Operating-income changes from
growth
`2,60,000 `1,25,000
Increase in revenue from new
customer acquisition `25,000 `12,000
Customer
perspective
Increase customer
satisfaction
Positive customer survey responses 70% 65%
Increase customer
acquisition
New customers acquired through
company sponsored community
events
5 7
Increased customer
acquisition due to
sustainability effort
Percentage of new customers
surveyed who required recycled
paper options
475 350
Internal- business-
process perspective
Develop innovative
services
Research and development costs as
a percentage of revenue
5% 6%
Increase installation
efficiency
Installation time per customer 5 hours 4.5 hours

56
Objectives Measures Target
performance
Actual
performance
Increase community
involvement
Number of new programs with
community organization;
12 15
Decrease workplace
injuries
Number of employees injured in
the workplace
<3 7
Learning-and
growth perspective
Increase employee
competence
Number of annual training-hours
per employee
10 11
Increase leadership
skills
Number of leadership workshops
offered
2 1
Increase employee
safety awareness
Percent of employees who have
completed safety certification
training
100% 95%
Required:
1. Was Oracle successful in implementing its strategy in 2015? Explain.
2. Do you agree with Oracle’s decision to include measures of developing innovative
services (research and development costs) in the internal-business-process
perspective of the balanced score-card? Explain briefly.
3. is there a cause-and-effect linkage between the measures in the internal-business-
process perspective and the customer perspective? That is, would you add other
measures to the internal-business-process perspective or the customer perspective?
Why or why not? Explain briefly.
4. Why do you think Oracle included balanced scorecard measures relating to
employee safety and community engagement? How well is the company doing on
these measures?
Solution:-
1. The market for cable and internet provider is competitive. Oracle’s strategy follows a
cost leadership strategy--- providing quality service at low cost by being efficient, and
effective.
The scorecard correctly measures and evaluates oracle’s strategy of growth through
productive gains and cost leadership. There are however some deficiencies that
subsequent assignment questions will consider.
It appears from the scorecard that Oracle was not successful in implementing its
strategy in 2015. Although it achieved targeted performance in most of the learning
and growth and internal business process perspective, it significantly missed it targets
57
in the customer and financial perspective. Oracle has not had the success it targeted in
the market and has not been able to improve efficiency in order to reduce costs.
Oracle’s scorecard does not provide an explanation of why the target customer
satisfaction measure was not met in 2015. Was it due to poor quality? Higher prices?
Poor post sale service? Aggressive competitors? the scorecard is not helpful for
understanding the reasons underlying the poor customer satisfaction.
2. Oracle should not include R&D cost in its internal business process perspective. It
should not focus on developing innovative services because it is not following a
product differentiation strategy. It needs to cut these costs and focus instead of
providing customer a quality service at the lowest costs, and faster and more efficient
installation, consistent with its low-cost strategy.
3. There is cause-and-effect relationship between the installation time per customer and
customer satisfaction but not between money spent in R&D and customer satisfaction.
As discussed in requirement 2 above, I would drop the R&D measures. I would then
add measures for the quality of the installation service to the internal business process
perspective. How much time does it take to schedule an appointment after the
customer calls? Does the service work flawlessly after it has been installed? Do
customers call Oracle to fix problems? How much time it spent on post-installation
support? The point is to add more measures to the internal business process
perspective so that Oracle can get a better understanding of the reasons underlying
increases and decreases in customer satisfaction.
In the customer perspective, I would add measures to track Oracle’s market share in
Gurgaon area. Do increases in customer satisfaction translate into higher market
shares? Is Oracle correctly identifying the factors that customer care deeply about ad
making improvements in those area faster than its competitors?
Although not required by the question, the instructor could ask the class what else
Oracle might want to include in the learning and growth perspective to support the
customer and internal business process perspectives. The learning and growth
measures would then serves as leading indicators (based on cause-and-effect
relationships) for the internal-business processes and customer satisfaction. For
example, Oracle could include a measure related to employee satisfaction or retention.
For example, higher employee satisfaction would lead to greater ownership of
employees in providing a quality service. This is critical for Oracle to successfully
implement its strategy.
4. Oracle included social and environmental performance measure in its balanced
scorecard because it believes strong environmental and social performance gives it a
competitive advantage by (1) attracting and inspiring outstanding employees, (2)
58
enhancing its reputation with socially conscious customers, investor and analysts, and
(3) boosting its image with government and citizens, all of which contribute to the
long run financial performance. Oracle also believes that focusing on environmental
and social performance in addition to financial performance helps it to innovate in
technologies, processes products and business models to reduce the tradeoff between
financial and sustainability goals and build transformational leadership and change
capabilities to implement these “triple bottom line” strategies.
Following the shared value, Oracle includes social and environmental measures
(together with business goals and measures) in its balanced scorecard to evaluate how
well it is doing toward archiving its social and environmental goals. The balanced
scorecard indicates that Oracle’s social and environmental initiatives are having
mixed results. Oracle’s focus on safety certification training aims to decrease
workplace injuries and to reduce overall costs. So far, the safety certification goals
have not been met and workplace injuries have not been reduced to their target levels.
Oracle would need to consider if the safety certification training has been as effective
as it was intended. Similarly, increasing the number of new programs with community
organizations aims to increase the number of new customers acquired as a result of
these initiatives and in turn to increase revenue from new customers. Even though the
number of new programs started exceeded the target revenue from new customers.
Oracle would need to reevaluate the kinds of new programs it is implementing.
Not all companies believe in implementing sustainability goals, but those that do find
the balanced scorecard to be a useful tool to simultaneously implement both financial
and sustainability goals.
Q66:- B. Steels is a leading manufacturer of flat and long products and have
state-of the-art plants. These plants manufacture value added products covering
entire steel value chain right from coal mining to manufacturing Pig Iron,
Billets, HR Coils, Black Pipe/GI Pipe, Cable Tapes etc. conforming to
international standards. The rock-solid foundation combined with nonstop
upgradation and innovation has enabled the B. Steels to surpass its goals
constantly. Its vision and values for sustainable growth is balancing economic
prosperity and social equality while caring for the planet. It is preparing its
balanced scorecard for the year 2018-19. It has identified the following specific
objectives for the fourperspectives.
Improve post-sales
service
Improve employee
morale
Improve employee
job satisfaction

59
Increase gross margin Increase number of
customers
Increase profitability
of core productline
Increase plantsafety Increase customer
retention
B. Steels has collected Key Performance Indicators (KPIs) to measure progress
towards achieving its specific objectives. The KPIs and corresponding data
collected for the year 2018-19 are as follows:
Key Performance Indicator Goal Actual
Average replacement time (number of days) 2 1.5
Gross margin growth percentage 15% 16%
Number of customers 15,000 15,600
Number of plant accidents 0 2
Percentage of repeat customers 83% 81%
Core product line profit as a percentage of core-product line
sales
5% 4.4%
Employee turnover rate (number of employees leaving/
Average number of total employees) 2% 3%
Employees satisfaction rating (1-5, with 1 being the most
satisfied)
1 1.2
For preparation of Balanced Scorecard report, the following format has been
developed:
B. Steels Balanced ScorecardReport
For the year ended March 31, 2019
Perspective Objective KPI Goal Actual Goal Achieved (Yes
or No)
Financial × × × × ×
Customer × × × × ×
Internal Business Process × × × × ×
Learning and Growth × × × × ×
Required
(i) PREPARE a balanced scorecard report using the above-
mentioned format. Place objective under the appropriate perspective
heading in the report. Select a KPI from the list of KPIs that would be
appropriate to measure progress towards each objective.
(ii) B. Steels desires to integrate sustainability and corporate social
responsibility related KPIs in their balance scorecard to adhere vision and
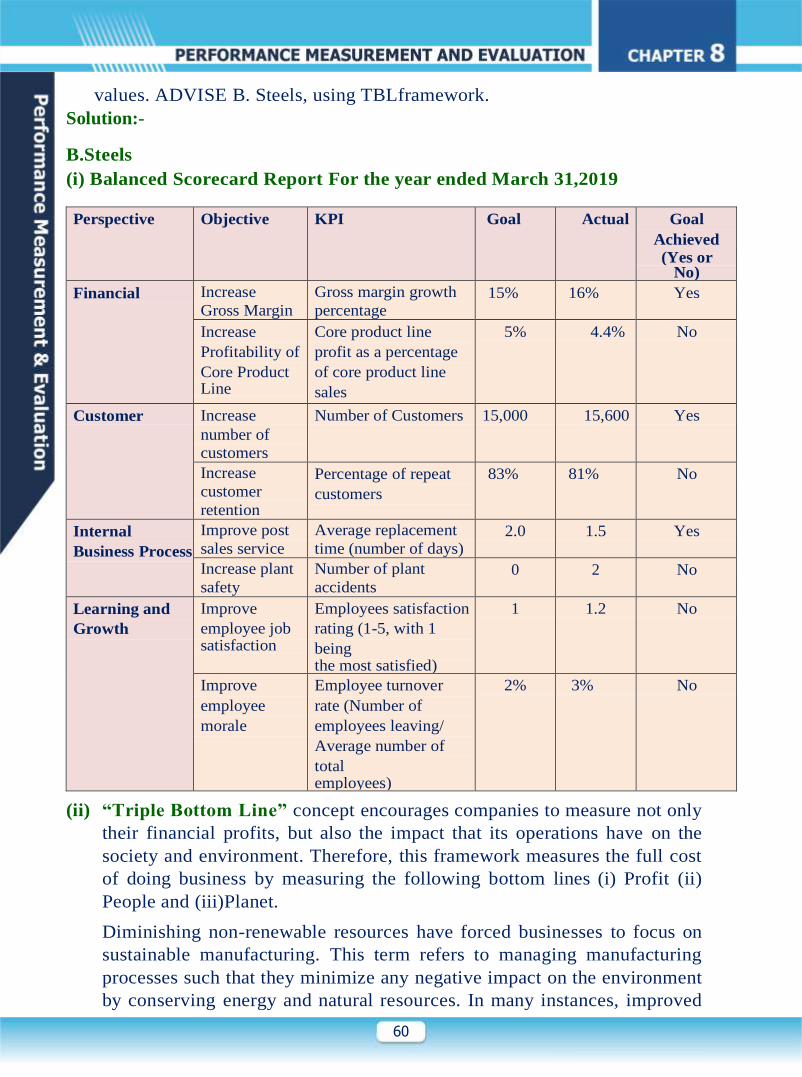
60
values. ADVISE B. Steels, using TBLframework.
Solution:-
B.Steels
(i) Balanced Scorecard Report For the year ended March 31,2019
Perspective Objective KPI Goal Actual Goal
Achieved
(Yes or No)
Financial Increase
Gross Margin
Gross margin growth
percentage 15% 16% Yes
Increase
Profitability of
Core Product Line
Core product line
profit as a percentage
of core product line
sales
5% 4.4% No
Customer Increase
number of
customers
Number of Customers 15,000 15,600 Yes
Increase
customer
retention
Percentage of repeat
customers
83% 81% No
Internal
Business Process
Improve post
sales service
Average replacement
time (number of days) 2.0 1.5 Yes
Increase plant
safety
Number of plant
accidents 0 2 No
Learning and
Growth
Improve
employee job satisfaction
Employees satisfaction
rating (1-5, with 1
being the most satisfied)
1 1.2 No
Improve
employee
morale
Employee turnover
rate (Number of
employees leaving/
Average number of
total employees)
2% 3% No
(ii) “Triple Bottom Line” concept encourages companies to measure not only
their financial profits, but also the impact that its operations have on the
society and environment. Therefore, this framework measures the full cost
of doing business by measuring the following bottom lines (i) Profit (ii)
People and (iii)Planet.
Diminishing non-renewable resources have forced businesses to focus on
sustainable manufacturing. This term refers to managing manufacturing
processes such that they minimize any negative impact on the environment
by conserving energy and natural resources. In many instances, improved
61
operational efficiency not only reduces waste (thereby costs) but also
improves product safety, it
strengthensthebrand’sreputationandbuildspublic’strustaboutthecompany.As
a long- term strategy, this improves business viability and provides a
competitive edge to the company. This concept is the “Planet Bottom
Line” within the Triple Bottom Line framework. Metrics on the following
aspects may be investigated to find out the environment impact of business
operations:
Material consumption
Energy consumption
Water utilization
Emissions, treatment of effluents and waste (include
emissions affecting air, water, and land)
Fuel consumption by tracking freight and transportation costs
Land utilization
Recyclability and disposal of product
“Corporate Social Responsibility” enables the company to become
conscious of the impact its operations has on the society. CSR programs,
through philanthropy and volunteer efforts can forge a stronger bond
between itself, its employees, and the wider community. Again, this
improves both the brand image as well as builds public’s trust about the
company. This concept is the “People Bottom Line” of the Triple Bottom
Line framework. Metrics on the following aspects maybe investigated to
find out the social impact of business operations:
Work place environment and labour relations
Occupational health and safety, accident rates
Human rights practices – child labour, employee work-place
security policies
Training and education
Equal opportunity employer – diversity of workforce and
opportunities available for employees’ growth
Suppliers – local sourcing versus sourcing from external markets
Philanthropy and volunteer programs organized
Product safety in terms of customer health and safety
Pricing of essential products to enable wider reach within the
society
Transparent and ethical business practices
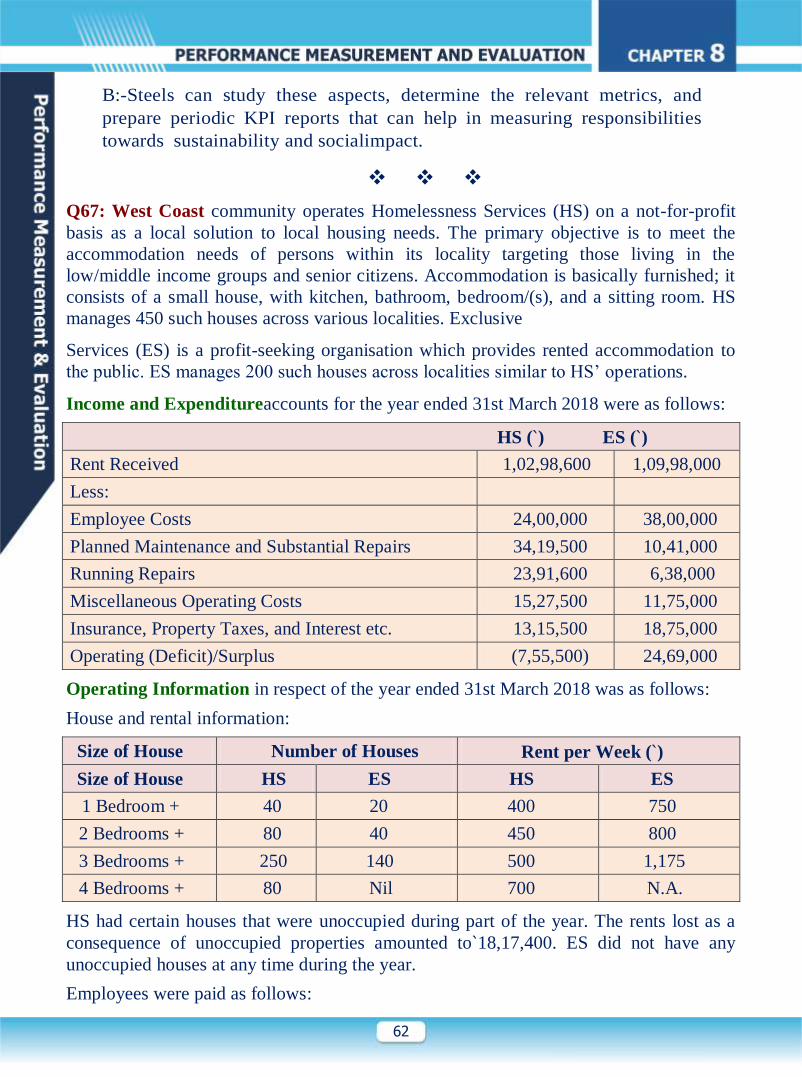
62
B:-Steels can study these aspects, determine the relevant metrics, and
prepare periodic KPI reports that can help in measuring responsibilities
towards sustainability and socialimpact.
Q67: West Coast community operates Homelessness Services (HS) on a not-for-profit
basis as a local solution to local housing needs. The primary objective is to meet the
accommodation needs of persons within its locality targeting those living in the
low/middle income groups and senior citizens. Accommodation is basically furnished; it
consists of a small house, with kitchen, bathroom, bedroom/(s), and a sitting room. HS
manages 450 such houses across various localities. Exclusive
Services (ES) is a profit-seeking organisation which provides rented accommodation to
the public. ES manages 200 such houses across localities similar to HS’ operations.
Income and Expenditureaccounts for the year ended 31st March 2018 were as follows:
HS (`) ES (`)
Rent Received 1,02,98,600 1,09,98,000
Less:
Employee Costs 24,00,000 38,00,000
Planned Maintenance and Substantial Repairs 34,19,500 10,41,000
Running Repairs 23,91,600 6,38,000
Miscellaneous Operating Costs 15,27,500 11,75,000
Insurance, Property Taxes, and Interest etc. 13,15,500 18,75,000
Operating (Deficit)/Surplus (7,55,500) 24,69,000
Operating Information in respect of the year ended 31st March 2018 was as follows:
House and rental information:
Size of House Number of Houses Rent per Week (`)
Size of House HS ES HS ES
1 Bedroom + 40 20 400 750
2 Bedrooms + 80 40 450 800
3 Bedrooms + 250 140 500 1,175
4 Bedrooms + 80 Nil 700 N.A.
HS had certain houses that were unoccupied during part of the year. The rents lost as a
consequence of unoccupied properties amounted to`18,17,400. ES did not have any
unoccupied houses at any time during the year.
Employees were paid as follows:
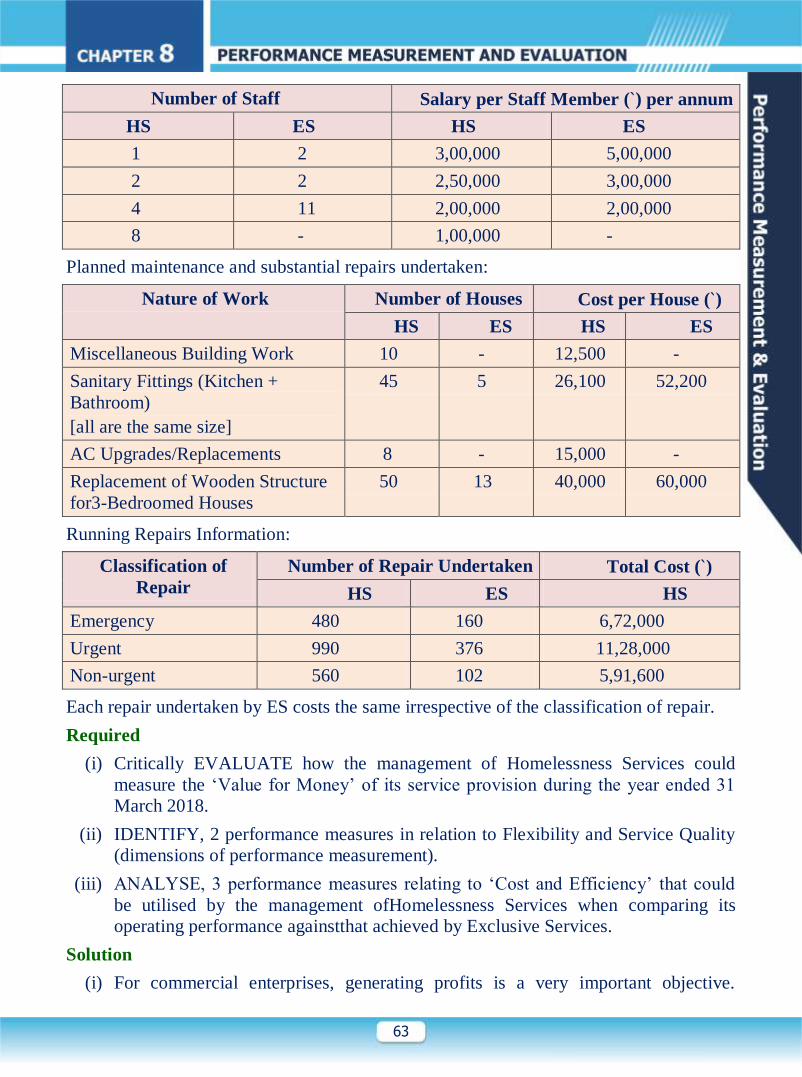
63
Number of Staff Salary per Staff Member (`) per annum
HS ES HS ES
1 2 3,00,000 5,00,000
2 2 2,50,000 3,00,000
4 11 2,00,000 2,00,000
8 - 1,00,000 -
Planned maintenance and substantial repairs undertaken:
Nature of Work Number of Houses Cost per House (`)
HS ES HS ES
Miscellaneous Building Work 10 - 12,500 -
Sanitary Fittings (Kitchen +
Bathroom)
[all are the same size]
45 5 26,100 52,200
AC Upgrades/Replacements 8 - 15,000 -
Replacement of Wooden Structure
for3-Bedroomed Houses
50 13 40,000 60,000
Running Repairs Information:
Classification of
Repair
Number of Repair Undertaken Total Cost (`)
HS ES HS
Emergency 480 160 6,72,000
Urgent 990 376 11,28,000
Non-urgent 560 102 5,91,600
Each repair undertaken by ES costs the same irrespective of the classification of repair.
Required
(i) Critically EVALUATE how the management of Homelessness Services could
measure the ‘Value for Money’ of its service provision during the year ended 31
March 2018.
(ii) IDENTIFY, 2 performance measures in relation to Flexibility and Service Quality
(dimensions of performance measurement).
(iii) ANALYSE, 3 performance measures relating to ‘Cost and Efficiency’ that could
be utilised by the management ofHomelessness Services when comparing its
operating performance againstthat achieved by Exclusive Services.
Solution
(i) For commercial enterprises, generating profits is a very important objective.
64
Likewise, not-for- profit enterprises have certain cultural, social or educational
objectives for which they are created. Regardless of the type of organization, it is
important to know whether the internal operations meet certain performance
benchmarks that will ensure that the organization achieves its objectives in a better
manner. Moreover, even if the organization does not operate for profits, it is
important for it to be “cost effective”. Resources (including money) should be used
optimally to achieve intended outcomes. For example, HS can use this
benchmarking tool to look into the following questions:
(a) Does the organization function in an efficient and cost effective manner?
(b) Does the estate management make best use of the buildings to achieve the
objectives of the organization?
(c) Does the estate management function manage upkeep of buildings in terms of
repairs and improvements in an effective manner?
(d) Are the tenants satisfied with the service provided by the estate management
and the suitability of the accommodation for their needs?
“Value for Money (VFM)” is an assessment made based on the criteria of economy,
efficiency and effectiveness.
Economy involves minimising resource consumption while meeting specified
requirements of quality and quantity. Minimize the cost of resources/required inputs
(implies to spend less) while ensuring that the desired quality of service is achieved. For
HS, inputs could be purchases made for maintenance and repair work like sanitary
fittings, AC, wooden structure for the houses etc., while resources could be the labour
employed to carry out these services. HS should aim at purchasing required quality of
inputs at the least possible price. Skilled labour needed for this job should be procured at
the lowest pay scale possible. Procuring these at lower cost leads to savings for HS. At
the same time, HS should ensure that cost cutting/saving does not come at the cost of
quality. Lower quality, implies inferior service levels, which ultimately will compromise
HS’ social commitment to provide quality housing to needy members of its community.
Efficiency involvesmaximising the ratio between resources (input) and the output of
goods, services or other results.
The focus of efficiency is on the process of rendering service. The objective of efficient
operations is to maximize output using minimum resources. Improved productivity
means that resources procured are used in an optimal way (implies spending well).
In the case of HS, one of the resources is the labour employed for repair and maintenance
work. Efficiency (productivity) measured would be the relationship between the
employees available and the repair work performed by them. If the pool of employees
does more repair work than the benchmark set, productivity is higher. This also closely
ties up with economy (cost) of operations. If the given pool of employees (resources),
who are paid optimum salary (cost), cater to more repair and maintenance work,
economy of operations is achieved due to higher productivity of operations. In case these
65
activities are outsourced, efficiency and economy can be achieved by calling for tenders.
Select the tender that provides maximum work for least cost.
In addition, HS may explore options for efficiencies from business process
improvements, shared services as well as further efficiencies with in assets management.
Effectiveness involves ensuring that the outcome achieves the desired policy aims and
objectives. Have the objectives been achieved, how does the impact of the actual
output/service compare with its intended impact? (implies to spend money wisely to
achieve desired objectives). In the case of HS, effectiveness could be assessed based on
the following questions
(a) Are the housing needs of the targeted community members met?
(b) Are the tenants satisfied with the accommodation?
(c) Given its social cause, are the staff friendly, courteous and hospitable to the
customers?
(d) Do the housing accommodations comply with safety standards and other legal
requirements?
Each measure is inter linked with the other. For example, HS has replaced sanitary
fittings in the kitchen and bathroom in 45 houses for `26,100 each, costing a total of
`11,74,500. Compared to ES that has spent `52,200 on each house for sanitary fitting
replacement. For the cost of `11,74,500 ES could have replaced fittings in only 22 houses
(`11,74,500/52,000) as compared to HS’ ability to replace fittings in 45 houses.
Therefore, HS’ decision has been economical, getting more work done for same cost. At
the same time, this does not indicate whether the fittings replaced by HS are of similar or
better quality as compared to ES. ES could have used better quality fittings that last
longer, enhance customer experience, safety etc. The spending by ES could have been
more effective than HS because it helps achieve the desired objective of customer
satisfaction, safety and lesser running cost for maintenance. Therefore, to achieve
economy, HS may have compromised on effectiveness.
Benchmarking is a good method of measuring performance it enables a comparison of
the process, costs etc. with those of a close competitor. Services will be expected to use
benchmarking information to learn from best practice, change procedures and processes
to achieve enhanced methods of working, and reduce unnecessary expenditure.
However, benchmarking of performance against ES is not ideal. The performance of HS
can be better measured by adopting benchmarking against similar charities whose
primary objective is the provision of accommodation to the communities in which they
operate.
Thus, HS must have permanent membership of the House Benchmarking Organisations,
which helps social housing property-owners to compare the costs of service delivery,
resources, and key performance indicators across all areas of the business. For example,
the management of HS can enquire about a norm in respect of the repair charges, sanitary
charges or wood structure replacement charges etc. of similar non-profit seeking

66
organisations. Further, benchmarking should be conducted annually to analyse all areas
of the business and is used to identify high performing, low cost services. Using the
annual benchmarking exercise results, the HS can plan to target those areas that are low
performing and high cost.
Overall,HS should have strong commitment to value for money, which needs to be
reflected in the business plan and in service-delivery plans. By applying these principles
HS would be able to achieve the optimum utilisation of resources, which will in turn lead
to extra capacity and allow HS to provide better services.
(ii) The Building Block Modelproposed by Fitzgerald and Moon, gives six
dimensions of performance measurement including service quality and flexibility.
Service Quality
Service quality is the measurement of how well a delivered service conforms to the
customer’s expectations. As a not for profit organization, HS provides housing services
to cater to the needs of lower and middle income groups as well as senior citizens in the
local community. Although service is provided at a concessional rate compared to its
commercial peer ES, quality of HS’ service needs to be judged based on certain
parameters that were promised by the organization to its tenants. These could be used as
parameters to assess service quality. Some of them could be:
Behaviour, attitude, proactivity of staff employed by HS.
Quality of basic amenities provided.
Availability of on-site service for the residents
Safety within and around the residential unit
Data for assessment of quality can be collected from feedback of tenants, analysing the
number and nature of complaints made by tenants, tenant retention rate/loyalty etc.
Feedback form tenants can be taken on specific issues or could be general in nature.
Flexibility
Flexibility is the ability of the organization to adapt to customers’ requirements. This can
be measured through service delivery time, promptness in responding to customer
requests, ability of employees to perform different kinds of work etc. In the case of HS,
the following performance measures can be used to assess the flexibility:
The average waiting time for a tenant for a house to become available. Lower
the wait time better the flexibility as it indicates that there are sufficient housing
units available for rental accommodation.
Following change in requirements, ability to meet the tenant’s request for
another house of a different size. This indicates whether the range of housing
units offered is sufficient (flexible) to cater to the tenants’ changing demand.
Waiting time for undertaking repairs of an emergency nature, once notified by a
tenant.
Lower the waiting time during emergencies indicates the availability of appropriate
personnel to carry of the repairs on short notice.

67
(iii) The management of HS could use the following performance measures
An organization should aim at achieving results with maximum efficiency at the least
possible cost. Efficiency measures the relationship between the input resources utilized
and the output service achieved. Few of the measures that HS could use to compare
performance with ES are:
The Average Employee Cost per week per house
Here, the resource (input) are the employees, which is 15 in case of both HS and ES. The
employees at HS cater to 450 houses as compared to 200 houses catered by ES.
Therefore, HS is more efficient as compared to ES.
Likewise, cost of resources to HS is the employee cost, for which the pay structure and
remuneration policies are different in both the organizations. HS has the ability to hire
most of its resource at an annual salary of `100,000, which is the least level in the pay
structure.
Comparatively, ES also hires cheaper labour but at a slightly higher pay level of `200,000
annual salary. Therefore, the total cost of labour is higher by `14,00,000 (58%) for ES as
compared to HS.
To compare the figures on a common factor, the employee cost can be calculated per
week per house.
HS ES
The Average Employee Cost per week per house
[`24,00,000/(450@ × 52)] and [`38,00,000*/
(200@ × 52)]
^ Employee cost from the income and expenditure table
@Number of houses (given): HS = 450; ES = 200
`102.56 `365.38
The average employee cost per week per house of ES is `365.38 (2.46 times) more than
of HS. It can be concluded that HS is both efficient, in terms of being able to cater more
houses with same number of employees, as well as cost effective due to the use of
cheaper labour.
The Average Day to Day Repair Cost per week per house
Here, the resource (input) is measured in terms of the cost spent on repairs to maintain
the rental houses. Running repairs are generally do not add much value to the rental
houses. Therefore, lesser the repairs, higher the efficiency. From the income and
expenditure table, it can be seen that HS has spent `23,91,600 as running repair cost for
450 houses versus ES that has spent `6,38,000 for 200 houses. To compare them on a
common factor, the average repair cost per week per house has been calculated.
HS ES
68
The Average Day-to-Day Repair Cost per week per house
[`23,91,600/(450@ × 52)] and [`6,38,000/
(200@ × 52)]
^ Running repair cost from the income and expenditure table
@Number of houses (given): HS = 450; ES = 200
`102.21 `61.35
The average day to day repair cost per week per house for ES is `40.86 less than that of
HS (-40%). This may be due to the fewer repairs required and the fact that there is no
extra cost required for emergency and urgent repairs. The cost of repairs whether
emergency, urgent or non-urgent to ES is the same, `1,000 [`6,38,000/ (160 + 376 + 102)]
whereas the cost of emergency repairs to HS is `1,400 (`6,72,000/480), urgent `1,139
(`11,28,000/990) and for non-urgent repairs it is `1,056 (`5,91,600/560).
ES’s low cost of repairs (which is identical for all types of repairs – emergency, urgent
and non- urgent) may have been achieved through entering into a contractual agreement
for repairs. HS should also think of entering into such contracts in order to save money.
Percentage of Rent Lost
Occupancy of rental houses indicate whether the capacity (in terms of houses rented) is
being optimally utilized. Lesser the vacancy better the efficiency in terms of capacity
utilization. This represents opportunity cost of not letting out the property.
HS ES
Percentage of Rent Lost (= Rent Lost/Gross Rent)
[(`18,17,400/`1,21,16,000]
Gross Rent = Rent Earned + Rent Lost
= `1,02,98,600 + `18,17,400 = `1,21,16,000
15% —
ES did not have any unoccupied properties at any time during the year; it has 100%
occupancy.
This shows that ES’s properties are in high demand. On the other hand, HS has lost rent
worth `18,17,400 through un occupied properties; this is about 15% of the gross rent
receivable.
The management of HS should identify the reasons why the houses remained unoccupied
when the occupancy rate is 100% for an organisation like ES, a peer organisation should
be used to benchmark the performance.
Q68: Your bank Ltd, was established on the 30th September, 1940 under the provision of
Co-operative Societies Act by the eminent professionals to encourage self-help, thrift,
cooperation among members, Bank was issued Banking Business License under Banking
Regulation Act, 1949 on October 25, 1986 to carry out the Banking Business within the
69
national capital and since then the Bank has been growing continuously. At present, Bank
has large number of membership of individuals from different sections. The bank has 12
branches in the NCT of Delhi, Bank offers traditional counter service. Opening hours are
designed to coincide with local market days.
Board of Directors wasworried from growing popularly of new style banks. These banks
offer diverse range of services such as direct access to executive management, a single
point of contact to co-ordinate all banking needs appointment banking to save time, free
online banking services 24/7, free unlimited ATM access etc.
It has now been decided that the bank will focus on “What Customers want” and will use
a balanced scorecard to achieve this goal.
Required:
PRODUCE for each of the three non-financial perspective of a “Balanced Scorecard”, an
objective and a performance measure that the bank could use with appropriate reason.
Solution:-Internal Business Process Perspective
Objective: Cross-sell Products
Measure:Products Purchased per Customer
Reason:Cross-Selling, or encouragement customers to purchase additional products e.g.
insurance, forex etc. is a measure of customer satisfaction. Only if a service is perceived
as highly satisfactory the service would be repeated/additional products or services would
be accepted.
Learning and Growth Persepective
Objective:Increase the Number of New Products or Services sold
Measure:Number of Customers Buying the New Products/New Services
Reason:Long term financial success requires bank to create new products/services (e.g.
internet banking, ATM access) that will meet emerging needs of current/future customers
such as 24/7 banking.
Customer Perspective
Objective:Increase Customer Loyality
Measure:Number of Accounts closed or closure Request Received
Reason:Customer loyality describes the extent to which bank maintains durable relations
to its customers.The share of existing customers should have a high importance as it
indicates about image and reputation, Closure request is not a good sign for bank.Bank
should investigate reasons for the same and take appropriate actions to improve services
offered to retain customers.

70
Q69:-Audio Tech is a company that designs, develops and sells audio equipments.
Audio Tech is best known for its home audio systems and speakers, noise cancelling
headphones, professional audio systems and automobile audio systems.
Audio Tech sells audio equipments to consumers through its large network of retail
outlets in its home country and via the company's website.
Audio Tech purchases the materials and components that it needs to manufacture audio
equipments from a number of different suppliers. All of the purchases are delivered to a
company's godown at its factory and are held there until they are needed for production
and assembling.
Finished products are transported from the factory to Audio Tech's retail outlets by
company's own trucks. The trucks follow the same schedule each week irrespective of
the load they are carrying. Audio equipments that are required for sale via the company's
website are transported to Audio Tech's distribution centre.
The company believes that it can attract more customers by offering quality products at
reasonable prices. Each unit is tested for quality with a real time analyzer ipad app and a
calibrated microphone to measure how consistently each sound system reproduced
various frequencies. A bass-test sweep tone allows checking how well the subwoofer
managed low-end frequencies.
Finally, they drive each in cars briefly to see how sound quality changes while on the
move.
The company aims to build customer loyalty also through high level of customer
services and value chain analysis. The customers can return the product if quality
specifications are not met. There is a separate department to handle such complaints.
Audio Tech had implemented Balanced Scorecard as a performance measurement and
management system. Company has been doing great on financial parameters and
customer satisfaction parameters. Market capitalization of the company has been
increased considerably over the years.
Of late, the company has witnessed high employee turnover ratio. Though the company
has a formal exit interview process for the resigning employees, the input received from
these interviews is rarely considered in improving HR practices. One of the common
feedbacks from employees was that working hours are too long and they have to
frequently work on weekends also and there is so much pressure to improve customer

71
service without adequate support of system and processes. Also the truck drivers have
been on strike thrice in the last one year demanding better pay, retirement benefits and
good working conditions.
Audio Tech is keen to address the above issues and recently held a meeting to discuss
the performance of the company. The Management Accountant suggested to the
Managing Director to use an alternative performance measurement mechanism which
considers all the stakeholders instead of just shareholders and customers. The Managing
Director is skeptical of the Management Accountant's suggestions and is unclear as to
whether they are suitable for the company or not. Therefore, the company seeks your
assistance.
Required
(i) IDENTIFY and EXPLAIN the various primary activities of Audio Tech in
its value chain.
Also SUGGEST, if there is any scope for cost reduction in these activities.
(ii) RECOMMEND an alternative performance measurement mechanism
which considers all stakeholders instead of just shareholders and customers. Also
INDICATE the performance measures as applicable to the situations of Audio Tech
in the alternative mechanismsuggested by you.
Answer:-
(i) The Various Primary Activities of Audio Tech in its Value Chain Analysis
Michael Porter describes the value chain as “internal processes or activities a
company performs to design, produce, market, deliver and support its product.”
Rather than looking at costs as per accounting cost pools, the value chain model
focuses on the work flow of an organization in the form of discrete set of activities
that are linked to each other. The value chain model is a generic model that examines
activities as Primary Activities and Secondary Activities. Passing through each
activity, the product or service gains some value. The idea is to (a) eliminate non-
value adding activities and (b) identify product differentiating or cost leadership
opportunities among the value adding activities.
Individual activities reflect the company’s strategy, implementation of its strategy and
underlying economics of the activities themselves.
Profit margin for the company = Value created less the cost of creating that value
72
Primary activities are those activities that enable inputs (raw material) to be transformed
into output (finished goods) or in the provision of service. Primary activities as per
Porter’s model are:
Inbound Logistics
Activities related to receiving, storing and distributing the inputs (raw materials) to the
production process.
Audio Tech has its materials and components needed to manufacture audio equipment
delivered to its godown at the factory premises. These materials are stored until needed
for production and assembling at the factory. These are the inbound logistics related
activities.
Operations
Activities involved in transforming raw materials into final products. These would
include machining, packaging, testing and equipment maintenance.
Audio Tech’s work flow activities related to manufacturing of the audio equipment and
components need to be considered here. In addition, the testing of equipment using ipad
application, bass sweep test as also sound quality check after assembly into the car, are
operations related activities.
Outbound Logistics
Activities involved in collecting, storing and distributing the products from the assembly
line to the end user customers. This includes finished goods warehousing, delivery
vehicle operation, order processing and scheduling.
Some of the activities that would be classified here are:
(a) Storage of Audio Tech’s finished goods within factory premises and at
its distribution centre.
(b) Scheduling and dispatch of goods using trucks to retail outlets and
distribution centres.
(c) Activities related to order taking from retail outlets as well as direct
orders on the company’s website.
Marketing and Sales
73
Activities such as advertising, promotion, distribution channel selection, sales force
management, pricing policy and such other activities that make the customer aware of the
product would be listed here.
All of Audio Tech’s activities that relate to the above list of activities whereby it aims to
spread customer awareness would be classified here. It aims to build customer loyalty by
offering quality products.
Service
Activities related to after sales service such as installation, repair and part replacement
would be classified here.
Audio Tech has a separate department to handle customer complaints. Customers can
return the product if quality specifications are not met. Also, any activity relating to after
sale service would be classified here.
(i) Below are certain measures that Audio Tech can implement to Reduce Costs
(a) Just in Time raw material procurement system: Procure input materials and
components only when needed for production and handling. This would reduce
inventory holding costs. Less inventory on hand could also result in savings in
storage and material insurance costs. Before implementation, the company needs to
consider the risk of loss incurred on account of stock-outs. It needs to develop close
relationships with its suppliers to ensure streamlined delivery of inputs. At the same
time inputs should meet the required quality standards.
(b) Company’s trucks deliver the finished goods to retail outlets as per a fixed schedule
each week, irrespective of the load they carry. This indicates that there may be
possibilities of dis-economies of cost. If there is a pile up of inventory due to lesser
number of truck delivery runs, it could lead to high inventory holding cost.
Conversely, if delivery runs are scheduled even if the trucks are not loaded to full
capacity, dis-economies of delivery cost would creep in. Therefore, the production
and truck delivery schedule should be streamlined efficiently and economically.
(c) Audio Tech lays importance in the quality of the product to ensure customer
satisfaction. Lower the defects higher the customer satisfaction. It has extensive
testing and inspection processes in place. This preventive step should be assessed to
find out if it is effective in reducing the cost of poor quality – internal failure cost as
well as external failure costs. Internal failure costs (repair, scrap, rework) are
associated with defects found after the production but before delivery to the
74
customer. This can be avoided, if quality inspection is done throughout the
production work-flow rather than just at the end of production. External failure costs
(repairs and servicing, sale returns, warranty claims, complaints) are incurred when
the customer finds the product defective and returns it. External failure costs can
severely impact customer loyalty and should be minimized.
Therefore, Audio Tech should invest in preventive and appraisal costs to ensure good
quality in order to balance out the cost of poor quality. Preventive costs would
include quality planning and assurance, error proofing quality improvements,
education and training. Appraisal costs could be inspection, quality audits, supplier
rating etc. Total Quality Management (TQM) and Six Sigma could be effective tools
to ensure efficient good quality production that would minimize cost of poor quality.
(ii) Alternate Performance Measurement Mechanism considering all Stakeholders
Audio Tech uses Balanced Scorecard to measure performance. Balanced Scorecard
focuses on the financial, customer, business, and innovation perspectives. It is given that
the company is doing well on financial and customer satisfaction parameters. Market
capitalization has also increased over the years, the company is on a growth trajectory.
However, the company is facing issues in the form of high employee turnover and
dissatisfaction among truck drivers who deliver the goods.
An alternate performance measurement mechanism can be Performance Prism. This is a
second-generation performance management framework conceptualized by Andy Neely
and Chris Adams. The reasons why it would be an effective replacement for models like
Balanced Scorecard are:
(a) Balanced scorecard focuses on just two of the stakeholders – Investors
and Customers. Performance measurement of other stakeholders like employees,
suppliers, government etc. has not been considered. The other stakeholders play an
important role in the growth of the company’s business. Hence, performance
measures are needed to monitor both their contribution to the company as well as
their overall satisfaction with the company.
(b) Most of the performance measurement models do not focus on the
changes that need to be made to strategies and processes. Balanced Scorecard
assumes that once the strategies are implemented, measuring a relevant set of metrics
of performance will ensure that the rest of the business also functions properly.
However, this is not true. In the case of Audio Tech, both customers and shareholders
are happy with the company’s performance. Yet even in a growing business, the
drivers of growth, namely other stakeholders like employees and suppliers are not

75
satisfied. Neither is their contribution nor their satisfaction is captured under the
Balanced Scorecard performance measurement.
(a) A company has a “Quid Pro Quo” relationship with all its stakeholders.
Stakeholders contribute to the company’s business while they also derive benefits
from it. For example, employees perform their functions well, this is their
contribution to Audio Tech’s growth. In return, employees would want good working
condition and pay to remain motivated and loyal to the company.
Therefore, Performance Prism can be an alternate performance measurement mechanism
that considers metrics related to a broader set of stakeholders of an organization, not
limited to just customers and shareholders alone.
Five Interrelated Facets of the Performance Prism
Stakeholder Satisfaction“Identify the organizations set of stakeholders and their needs”
Unlike a balanced scorecard, the performance prism focuses on all the stakeholders of a
company. Audio Tech has satisfied investors and customers, but dissatisfied employees
and truck operators. The company must likewise identify all its stakeholders and
determine the relative importance of each of the stakeholders. It can use Mendelow’s
Matrix to identify key shareholders in terms of power and interest of stakeholders. A
stakeholder group with higher power and high interest (say a trade union) must be kept
satisfied.
The main stakeholders of a company are:Investors - They want return on investment.
Customers - They want good quality products at reasonable prices. Suppliers - They want
better price for procurements or service.
Government - They want revenues and development. Society at large - They want
employment opportunities.
After identification of the stakeholders, the company must identify the requirement of
each of the stakeholder group. What must the company do to ensure stakeholder
satisfaction?
Audio Tech has to ensure that it improves employee satisfaction in order to reduce its
employee turnover. It should also address the issues faced by truck drivers and involve
them in a dialogue. If they are not satisfied, the company might suffer financially in the
longer run.

76
Performance Measure: Employee turnover ratio,average employment duration of
employees, number of strikes by truck drivers etc.
Stakeholder Contribution
“What the organization expect the stakeholders to contribute and deliver?”
In the second facet, the company has to identify the contribution required from each
stakeholder group and must define ways to measure contribution of stakeholders. In turn
the company will have something to offer the stakeholders. This is the “Quid Pro Quo”
relationship. For example, Audio Tech provides quality products to its customers. The
customers in turn contribute towards the profits of the company, they pay a price for the
value Audio Tech offers.
Audio Tech should provide for better working conditions to its employees. Motivated
employees will perform better and remain loyal to the company. They would drive the
growth of the company. Similarly, dialogue with truck drivers would be needed to
provide better pay, retirement benefits and good working conditions. Truck drivers in
turn need to ensure timely and safe delivery of goods to retail outlets.
Performance Measure: Efficiency of employees, productivity, on time delivery by truck
drivers.
Strategies
“What strategies should an organization adopt that derives stakeholder contribution while
reciprocating by ensuring their satisfaction?”
The organization should identify strategies that ensure that:
The wants and needs of the stakeholders are satisfied. Stakeholders contribute to the
organizations objectives.
Performance measures must be put in place to confirm that the strategies are working.
Effective implementation depends on appropriate communication of strategies,
implementation by managers and continuous evaluation of appropriateness of strategies.
Audio Tech has to roll out strategies to retain employees by means of better pay, working
conditions and growth opportunities within the company. The strategy will be effective
when the employee turnover is reduced following these initiatives. Similarly, the issues
faced by truck drivers need to be addressed by taking appropriate strategic decisions. The
absence of strikes will indicate that these decisions have been effective.
Performance Measures: Employee turnover after implementation of new strategy,
efficiency of deliveries after issues with truck drivers have been resolved.
77
Processes
“What are the necessary processes to satisfy the above strategies?”
Processes ensure successful implementation of strategies. Each process could have sub-
process. Process owners have to be identified to assign responsibility of functioning of
the process.
Processes require continuous evaluation. Instead of evaluating all at once, the company
has to identify important processes that are critical to the business. Porter’s Value Chain
Analysis can be used to identify and evaluate various processes in the organization.
Audio Tech should have well defined processes to hire appropriately skilled personnel
for the job, transparent pay structure etc. This process may be owned by the Human
Resource Manager. The working condition of truck drivers can be improved by providing
sufficient training and better working conditions.
Performance Measures: Number of personnel hired at various skill levels, average payout
for each of these skilled groups, hours of employee training, maintenance log of trucks
etc.
Capabilities
“What resources should an organization need to effectively operate these processes?”
The company must have the right capabilities in order to support the process. Capabilities
could include resources, technology, and infrastructure for a particular process to work.
Audio Tech may decide to increase pay/salaries, however it should have sufficient
financial resources to make these payments.
Performance Measures: Amount spent of new recruitments and training etc.
Conclusion
“Manage these interlinked facets to cater to all stakeholders”
While meeting targets as defined by performance measures should be emphasized, the
performance measurement system should be dynamic and flexible to allow the
stakeholders to voice their opinions and expectations as well. Taking their requirements
into consideration, along with managing capabilities and processes, Audio Tech can
implement effective strategies that will cater to the needs of all stakeholders.
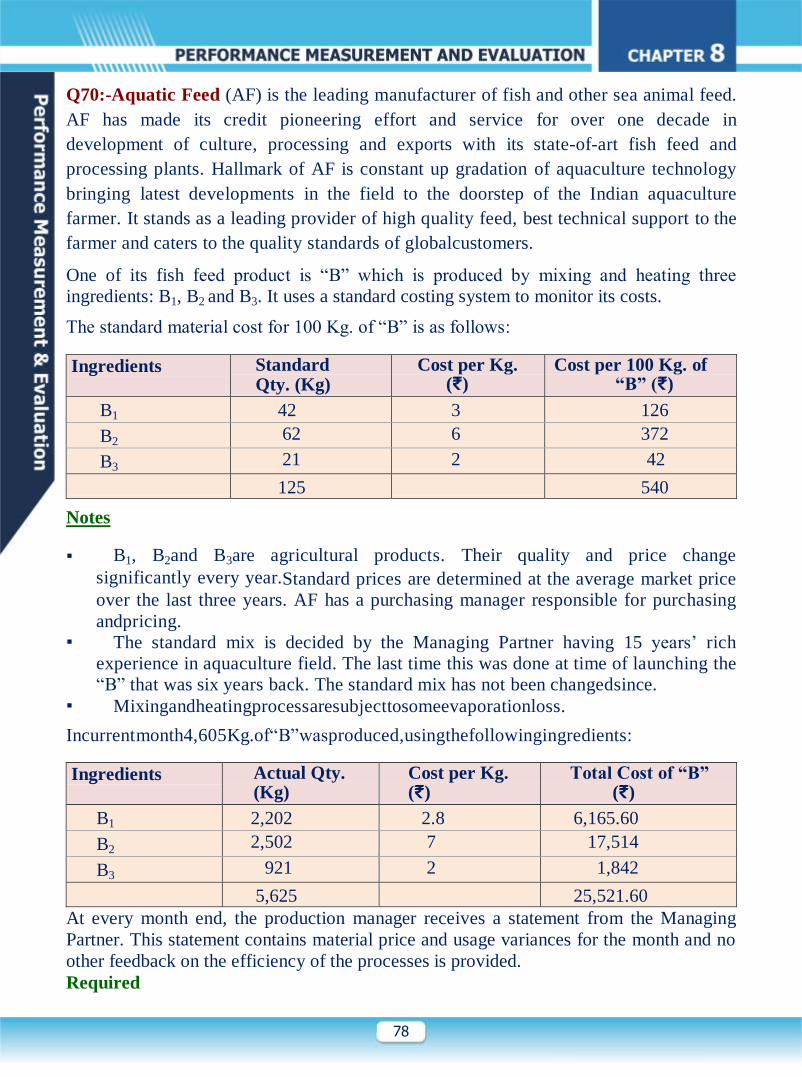
78
Q70:-Aquatic Feed (AF) is the leading manufacturer of fish and other sea animal feed.
AF has made its credit pioneering effort and service for over one decade in
development of culture, processing and exports with its state-of-art fish feed and
processing plants. Hallmark of AF is constant up gradation of aquaculture technology
bringing latest developments in the field to the doorstep of the Indian aquaculture
farmer. It stands as a leading provider of high quality feed, best technical support to the
farmer and caters to the quality standards of globalcustomers.
One of its fish feed product is “B” which is produced by mixing and heating three
ingredients: B1, B2 and B3. It uses a standard costing system to monitor its costs.
The standard material cost for 100 Kg. of “B” is as follows:
Ingredients Standard Qty. (Kg)
Cost per Kg. (₹)
Cost per 100 Kg. of “B” (₹)
B1 42 3 126
B2 62 6 372
B3 21 2 42
125 540
Notes
B1, B2and B3are agricultural products. Their quality and price change
significantly every year.Standard prices are determined at the average market price
over the last three years. AF has a purchasing manager responsible for purchasing
andpricing. The standard mix is decided by the Managing Partner having 15 years’ rich
experience in aquaculture field. The last time this was done at time of launching the
“B” that was six years back. The standard mix has not been changedsince. Mixingandheatingprocessaresubjecttosomeevaporationloss.
Incurrentmonth4,605Kg.of“B”wasproduced,usingthefollowingingredients:
Ingredients Actual Qty. (Kg)
Cost per Kg. (₹)
Total Cost of “B” (₹)
B1 2,202 2.8 6,165.60
B2 2,502 7 17,514
B3 921 2 1,842
5,625 25,521.60
At every month end, the production manager receives a statement from the Managing
Partner. This statement contains material price and usage variances for the month and no
other feedback on the efficiency of the processes is provided.
Required
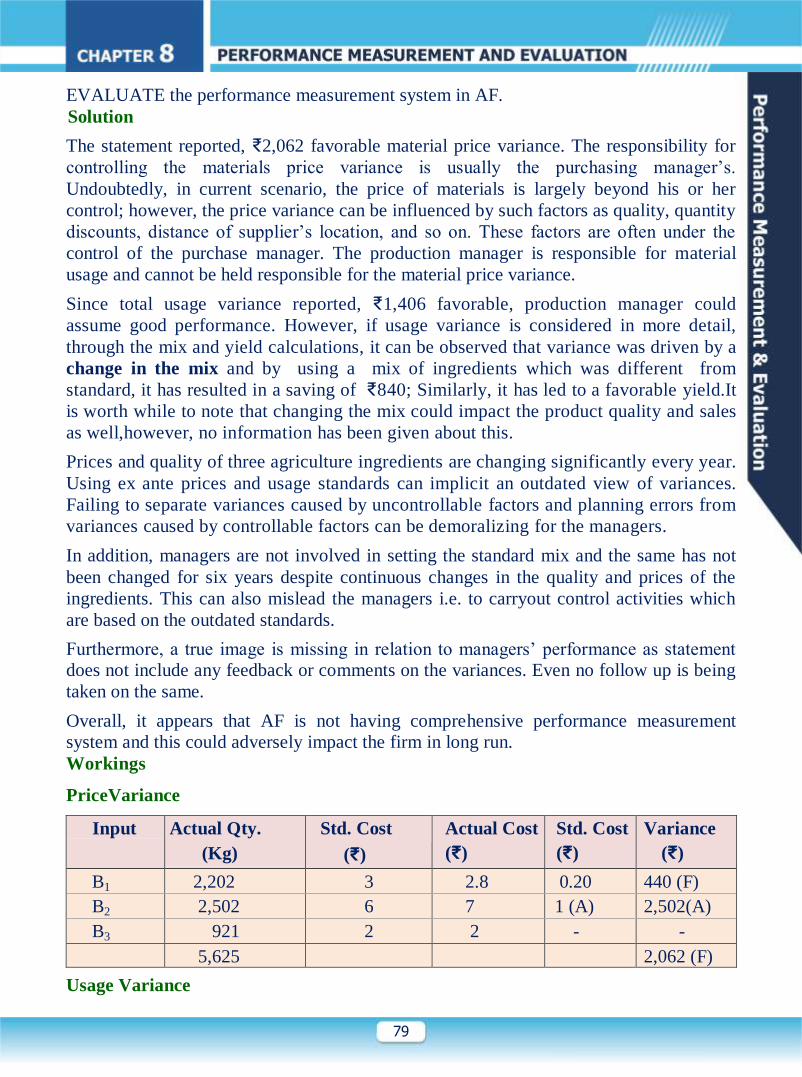
79
EVALUATE the performance measurement system in AF.
Solution
The statement reported, ₹2,062 favorable material price variance. The responsibility for
controlling the materials price variance is usually the purchasing manager’s.
Undoubtedly, in current scenario, the price of materials is largely beyond his or her
control; however, the price variance can be influenced by such factors as quality, quantity
discounts, distance of supplier’s location, and so on. These factors are often under the
control of the purchase manager. The production manager is responsible for material
usage and cannot be held responsible for the material price variance.
Since total usage variance reported, ₹1,406 favorable, production manager could
assume good performance. However, if usage variance is considered in more detail,
through the mix and yield calculations, it can be observed that variance was driven by a
change in the mix and by using a mix of ingredients which was different from
standard, it has resulted in a saving of ₹840; Similarly, it has led to a favorable yield.It
is worth while to note that changing the mix could impact the product quality and sales
as well,however, no information has been given about this.
Prices and quality of three agriculture ingredients are changing significantly every year.
Using ex ante prices and usage standards can implicit an outdated view of variances.
Failing to separate variances caused by uncontrollable factors and planning errors from
variances caused by controllable factors can be demoralizing for the managers.
In addition, managers are not involved in setting the standard mix and the same has not
been changed for six years despite continuous changes in the quality and prices of the
ingredients. This can also mislead the managers i.e. to carryout control activities which
are based on the outdated standards.
Furthermore, a true image is missing in relation to managers’ performance as statement
does not include any feedback or comments on the variances. Even no follow up is being
taken on the same.
Overall, it appears that AF is not having comprehensive performance measurement
system and this could adversely impact the firm in long run.
Workings
PriceVariance
Input Actual Qty.
(Kg)
Std. Cost
(₹)
Actual Cost
(₹)
Std. Cost
(₹)
Variance
(₹)
B1 2,202 3 2.8 0.20 440 (F)
B2 2,502 6 7 1 (A) 2,502(A)
B3 921 2 2 - -
5,625 2,062 (F)
Usage Variance
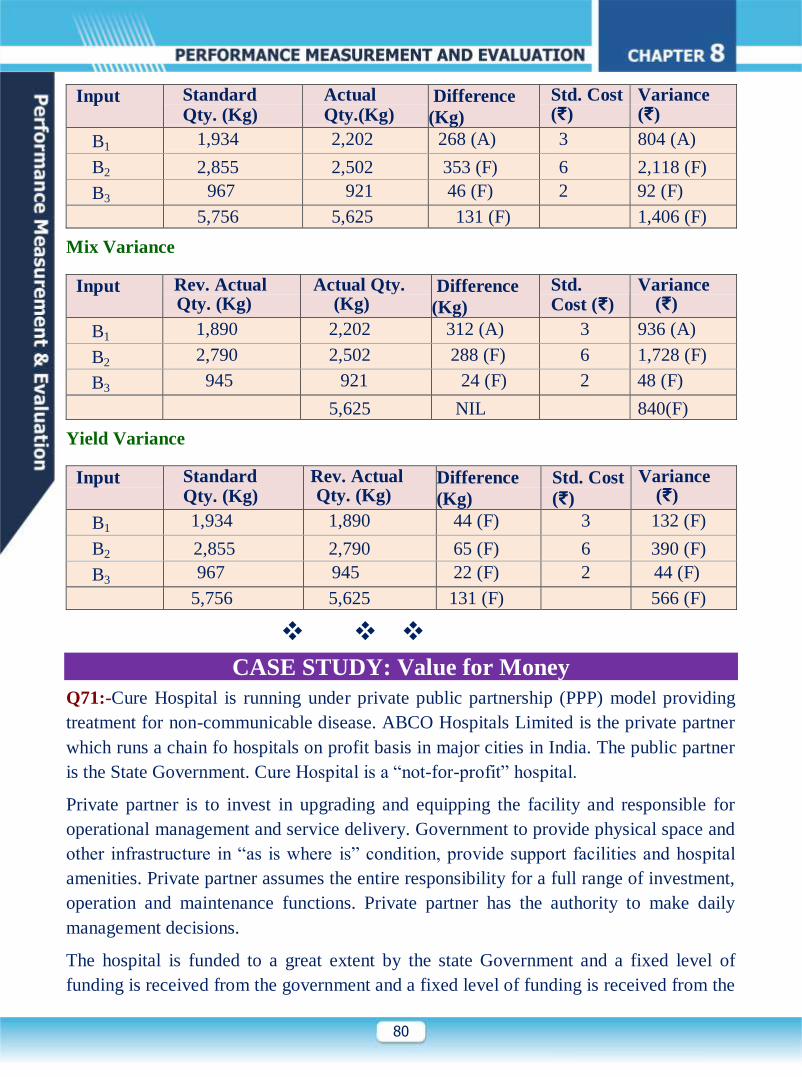
80
Input Standard Qty. (Kg)
Actual Qty.(Kg)
Difference
(Kg)
Std. Cost (₹)
Variance (₹)
B1 1,934 2,202 268 (A) 3 804 (A)
B2 2,855 2,502 353 (F) 6 2,118 (F)
B3 967 921 46 (F) 2 92 (F)
5,756 5,625 131 (F) 1,406 (F)
Mix Variance
Input Rev. Actual Qty. (Kg)
Actual Qty. (Kg)
Difference
(Kg)
Std. Cost (₹)
Variance (₹)
B1 1,890 2,202 312 (A) 3 936 (A)
B2 2,790 2,502 288 (F) 6 1,728 (F)
B3 945 921 24 (F) 2 48 (F)
5,625 NIL 840(F)
Yield Variance
Input Standard Qty. (Kg)
Rev. Actual Qty. (Kg)
Difference
(Kg)
Std. Cost
(₹)
Variance (₹)
B1 1,934 1,890 44 (F) 3 132 (F)
B2 2,855 2,790 65 (F) 6 390 (F)
B3 967 945 22 (F) 2 44 (F)
5,756 5,625 131 (F) 566 (F)
CASE STUDY: Value for Money
Q71:-Cure Hospital is running under private public partnership (PPP) model providing
treatment for non-communicable disease. ABCO Hospitals Limited is the private partner
which runs a chain fo hospitals on profit basis in major cities in India. The public partner
is the State Government. Cure Hospital is a “not-for-profit” hospital.
Private partner is to invest in upgrading and equipping the facility and responsible for
operational management and service delivery. Government to provide physical space and
other infrastructure in “as is where is” condition, provide support facilities and hospital
amenities. Private partner assumes the entire responsibility for a full range of investment,
operation and maintenance functions. Private partner has the authority to make daily
management decisions.
The hospital is funded to a great extent by the state Government and a fixed level of
funding is received from the government and a fixed level of funding is received from the
81
government each year out of the State budgetary allocation. It is up to the hospital to
allocate this fund to different areas such as doctors and other staff salaries, medicines and
all other costs required to run a hospital.
Cure Hospital’s objectives are:
to give prompt access to high quality medical treatment for patients.
to provide free treatment to poor patients in line with government policy of
inclusive development.
to provide value for money for the taxpayer –measured by the 3 Es framework of
Economy, Efficiency and Effectiveness.
to contribute to medical science by developing innovative ways to deliver
treatment to patients.
Except select surgeries, all services are free for poor patients that are below poverty line
(BPL) card holders 40% beds are reserved for poor patients. Free out patients department
(OPD) services to poor. CT Scan and MRI diagnostics are free for poor patients,
subscribed rates for others. Cure Hospital also runs a generic medicine shop inside the
hospital premises which sells medicines to all patients at discount ranging from 40% to
56% - the only shop of this kind in the city.
WHO has agreed to provide financial and technical support to the neonatal care unit. The
hospital enabled it to obtain five accreditation certificates from various leading
authorities on different aspects of hospital management.
Feedback is taken from each in –patient about the quality of service provided by the
hospital and the satisfaction level is taken in 1 to 10 point scale. 1 being the least satisfied
and 10 represents totally satisfied.
In a recent meeting of the managing committee of the hospital, discussions were held
about inadequate performance measurement systems in place to assess whether the
hospital is achieving its objectives and that insufficient attention is given to the
importance of non-financial performance indicators. A four member team consisting of a
performance management expert and three senior doctors was created to give their advice
in these aspects.
The four member team met with doctors, staff and other stakeholders at length and
breadth. Some of the conversations were as below:
Doctor A:I think the hospital always delivers value for money .We have always achieved
out total financial budgets.
Doctor B:We work here much longer hours than doctors in other hospitals, often without
being paid for working overtime.

82
Doctor C:There is not enough government and private partner funding to recruit more
doctors and paramedical staff.
Doctor D:Number of out-patients has increased considerably. Earlier an out-patient has
to wait for an average period of 2 hours 20 minutes and now the same has increased to 3
hours.
Senior Doctor K:I do not know how much time we spend developing innovative ways to
deliver treatment to patients though, as most of the performance data we doctors receive
relates to financial targets.
In-patient H: Incompetent paramedic staff, poor quality of food and bed, linen.
Staff M:Management undermines out role in running the hospital.
Recent performance data of the hospital vis-à-vis national average are as follows:
Cure
Hospital
National average of
other PPP run
hospitals
Number of doctors 80 76
Average doctors salaries per month including
overtime.
` 1,20,000 ` 1,60,000
Average doctors salaries including overtime as
per budget
` 1,20,000 ` 1,25,000
Number of in-patients treated 8,360 6,369
Average satisfaction rating of in-patients 6 9
Number of patients readmitted for treatment of
the same ailment within short period of time
after discharge from the hospital.
627 128
Average staff satisfaction rating (0% represents
totally dissatisfied and 100% represents totally
satisfied.)
16% 86%
Number of out-patients treated. 76,212 63,318
Required:
(a) Explain why non-financial performance indicators are particularly important to
measure the performance of “not-for-profit” organsiations such as Cure Hospitals.
(b) Evaluate whether Cure Hospital is delivering value for money for each of the
components of the value for money framework.

83
(c) The CEO of the hospital intents to introduce a nominal fee for out-patient
treatment given to poor patient and remove subsidized rate of CT scan and MRI
diagnostic for other patients in order to achieve its objectives in a better way.
Evaluate the proposal of the CEO.
Solution:- Cure Hospital has been formed in a public- private partnership to provide
quality healthcare to the public, with focus on the poorer sections of the society.
Healthcare service is provided for free, except for select surgeries.A sufficient portion of
its capacity (hospital beds) is reserved entirely for Below Poverty Line (BPL)
patients.Generic medicines are provided at a discounted price, to make them more
affordable.World Health Organisation (WHO) has decided to fund its neo-natal unit.
With all this information , it can be summarized that Cure Hospital has been formed not-
for-profit’ objective, attending to a social cause of providing quality healthcare to the
economically poorer sections of the society.
Cure Hospital has been formed in partnership with ABCO Hospitals Ltd. And the State
Government.The State Government has provided physical space, infrastructural, other
Support facilities and hospital amenties ABCO Hospital the private partner has the entire
responsibility of taking care of allocation of funds, investment operations and
maintenance functions.Daily management decisions are also handled by the private
partner.
Since the Government has provided substantial funding and facilities to Cure Hospital, it
owes a fiduciary responsibility of reporting the financial measures to its stakeholders, the
government in this case. At the same time, financial measures to this stakeholders, the
government in this case,. At the same time, financial measures alone are not enough to
assess the performance of not-for-profit organizations.Due to its objective of public
service, measurement of appropriate non-financial metrics are equally important.The
reasons are:
(i) Benefits cannot be quantified:- Cure hospital essential provides public healthcare
service to the economically weaker sections of the society.Due to political,
legal and social reasons, not-for-profit organizations like cure Hospital cannot
be shut down merely for not being economically/financially viable.Therefore
financial measures are less relevant.Due to its non-financial objective,
appropriate non-financial measures become more important.For example the
benefits of saving lives cannot be quantified in financial terms.
(ii) Benefits may accrue over long term: The expenditure incurred in one year may
yield benefits over several years. For example the investment in an intensive
care unit(ICU) facility may accrue of multiple years. Neonatal care unit have
84
been given financial and technical support from WHO which will give long
term benefits to hospital.
(iii) Measurement of utilization of funds and expenditure: In the case of cure
Hospitals, amny hospital services are free, allocation of capacity is aimed at
providing free sservice to the BPL section of the society, medicines are
provided at discounted rates.Therefore Cure Hospital does not have a
substantial revenue stream to earn from its patients. It gets a fixed budget
allocation from the State Government while ADCO Hospital allocates these
funds for various investments and expenditure.The assessment whether the
spending have been appropriate is a key challenge Defining cost per unit would
be subjective since it cold be cost of patients arriving at teh hospital or cost of
patients successfully treated at the hospital.Either figure could be treaked to
make it seem that the objectives are being met. The management may resort to
rampant spending simply to meet the expenditure targets.Therefore non-
financial measures need to be put in place help stakeholders scrutinize whether
the objectives for which funds have been given are being met.
(iv) Multiple objectives: Not-for-profit organization have multiple objectives, it
may be unclear which are the most important.Cure Hospital aims at providing
high quality treatment to its patients while also developing innovative ways to
deliver treatment to its patients. Both objectives are equally important and inter-
related . Non-financial measures provide better information about how each of
these objectives have been met.
The benefits of organizations like Cure Hospital are non-financial in nature.Except for
providing fiduciary information to the stakeholders, all other objectives of Cure
Hospital can be measure only using non-financial measures.
(b ) Value for money for cure Hospital would comprise of the 3Es : Economy ,
Efficiency and Effectiveness.
(i) Economy: HAs the desired output (and Quality of Service) been achieved at the
lowest cost?
The Medical resources at Cure Hospital in terms of doctors is 80, higher than the national
average of 76 at other centers.Doctor’s salances would be a significant expenditure for
Cure Hospital.The average doctor’s salary at Cure Hospital (including overtime) is
₹120,000 per month, this is within the budget figure as pointed out by Doctor A.The
salary is lower than the national average at other PPP run hospitals where doctors earn
₹160,000 per month.Therefore, economy of money is being achieved at Cure Hospital.
The relatively lower levels of salary could be due to differences in levels of expence or
that the doctors at Cure Hospital work overtime without getting paid (as pointed out by

85
Doctor B). This may be one of the reason why staff satisfaction is only 16% compared to
86% in other centers.
(ii) Efficiency: Has maximum output been achieved with the minimum resources?
Treating patients is the key objectives of Cure Hospitals while doctors are the main
resource to deliver it. The number of patients treated per year is a good measure of
efficiency achieved.
Cure Hospital treats 84,572 patients (in house patient 8,360 + Outpatients 76,212)
while the national average at other centers is only 69,687 ( in house patient 6,369+
outpatient 63,318). Cure Hospital has 80 doctors as compared to 76 national
average.Therefore, each doctor at Cure Hospital treats 1,057 patients (84,572
patients/80 doctors) as compared to 917 patients (69,687 patients /67 doctors) at other
centers.Resource utilization of its pool of doctors is higher in Cure Hospital.
Doctor C mentions that there is not enough funding to hire more doctors and
paramedic staff.Therefore there is a constraint on the limited resources of doctors and
support staff.This might be the reason, why each doctor at Cure Hospital works longer
than colleagues at to her centers.
Therefor, while efficiency in terms of number of patients treated by each doctor is
high, there are other hidden costs that need to be taken into account. Few such costs
could be low employee morale, higher waiting time of patients to receive
treatment.This impacts the effectiveness of service provided.
(iii) Effectiveness: Has Cure Hospital has the objective of providing high quality
medical service to its patients. Better quality of treatment would ensure that re-
admission for treatment of the same ailment within a short span of time would be
minimal.Number of such re-admitted patients in much higher at 627 at Cure Hospital
as compared to 128 at other centers.Assuming all such re-admission to be in-house
patients, this return of patients for medical care for the same ailment within a short
span of time is 7.50% compared to the national average of 2.01%
Prompt medical treatment can also be questioned since the waiting time of patient to
receive treatment has increased from 2 hours 20 minutes to 3 hours.
Senior Doctor K points out the time spent on delivering innovative care to patients
may be limited due to financial constraints and overwork staff.
All this would have resulted in dissatisfaction among patinets, whose survey indicates
a score of 6 against a national average of 9. This shows that objective of Cure Hospital
is not being met effectively.
To summarize, Cure Hospital is achieving economy by maintaining lower salaries, for
doctors. Out reach to patients is also high as compared to national average. However
due to limited availability of resources, doctors and staff are overworked.While it does
86
well on the efficiency aspect, it comes with a hidden cost in terms of dissatisfaction
among patients and employees and low quality of medical care. Therefore medical
treatment is not effective, which is an important aspect in the value for money
framework.
(c ) Proposal to introduce nominal fee for out-patient treatment given to poor people
and remove subsidized rate of CT scan and MRI for other patients.
Cure Hospital is a not-for-profit organization that aims at providing quality health care
to the economically weaker sections of the society. It gets its primary funding from
the State Government , it does not generate and is not aimed at generating substantial
revenue from its patients. The CEO has proposed to introduce nominal fee for out-
patient treatment given to poor people and remove subsidized rate of CT scan and
MRI for other patients. However , this would not help Cure Hospital achieve its
objective.
The given problem seems to suggest severe constraint in the resources available to
meet its objectives thus impacting effectiveness of treatment.Each doctors treats 1,057
patients in a month as compared to the national average of 917 in a month. Number of
patients especially the out-patients is much more than national average. Overworked
doctors combined with limited staff resources is the main hurdle that Cure Hospital
faces in effectively achieving its objectives.
Cure Hospital is a not-for-profit organization.Therefore, generating nominal fees to
achieve its objectives would not help its purpose. Instead, it can apply for higher
budget allocation from the government.This can help it procure good quality resources
such as experienced doctors by paying them higher salaries including overtime.Better
qualified doctors can help provide not just better treatment but also innovative ways of
treatment to patients. Improved/enhanced facilities could reduce the waiting time for
medical care, enabling prompt medical service.
Improved service would result in better treatment, lowering the cases for re-admission
for same ailment within a short span of time. This improves the effectiveness of
medical care provided at Cure Hospital. Better service would improve patient
satisfaction. Quality medical care would provide a better case of Cure Hospital to
sustain its operations in the long-run.The State Government may also more favouraly
consider any justifiable future budgetary increments.
Overall the management of the hospital seems to be indifferent to the opinion and
needs of the staff.The CEO’s decision has a very short term outlook that does not co-
relate with the organizations objectives.By trying to off-set a limited revenue stream
to achieve its objectives shows that the management’s style of working needs
improvement.

87
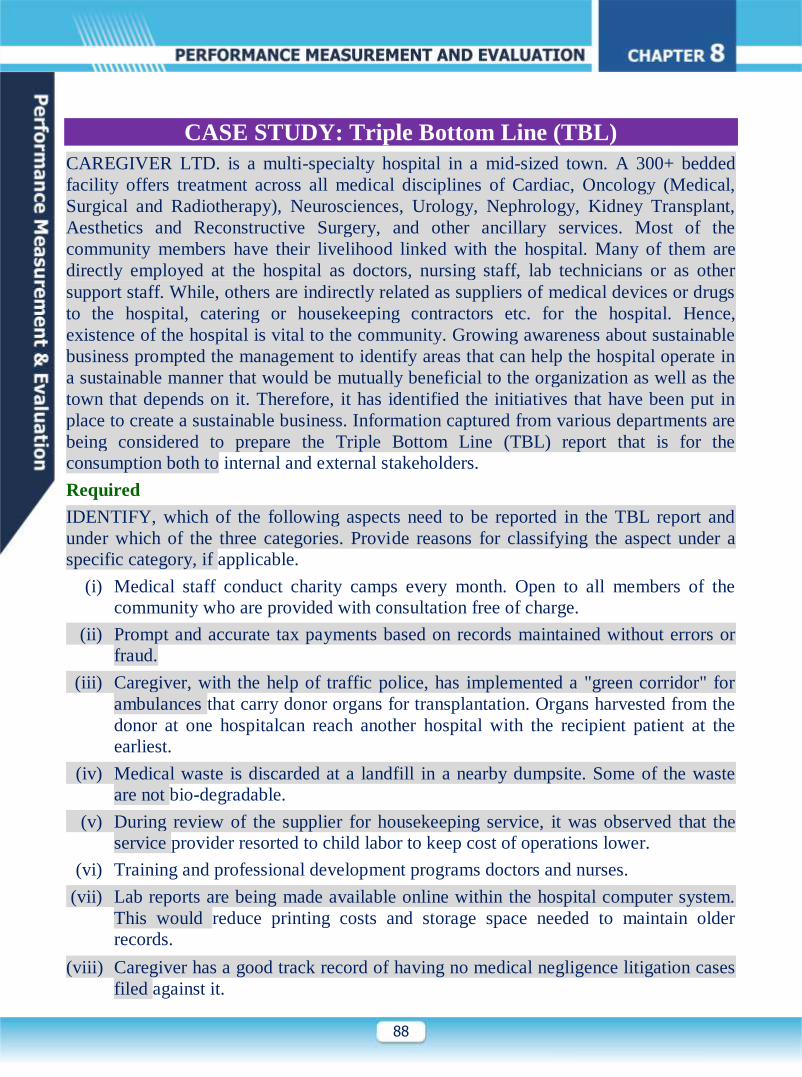
88
CASE STUDY: Triple Bottom Line (TBL)
CAREGIVER LTD. is a multi-specialty hospital in a mid-sized town. A 300+ bedded
facility offers treatment across all medical disciplines of Cardiac, Oncology (Medical,
Surgical and Radiotherapy), Neurosciences, Urology, Nephrology, Kidney Transplant,
Aesthetics and Reconstructive Surgery, and other ancillary services. Most of the
community members have their livelihood linked with the hospital. Many of them are
directly employed at the hospital as doctors, nursing staff, lab technicians or as other
support staff. While, others are indirectly related as suppliers of medical devices or drugs
to the hospital, catering or housekeeping contractors etc. for the hospital. Hence,
existence of the hospital is vital to the community. Growing awareness about sustainable
business prompted the management to identify areas that can help the hospital operate in
a sustainable manner that would be mutually beneficial to the organization as well as the
town that depends on it. Therefore, it has identified the initiatives that have been put in
place to create a sustainable business. Information captured from various departments are
being considered to prepare the Triple Bottom Line (TBL) report that is for the
consumption both to internal and external stakeholders.
Required
IDENTIFY, which of the following aspects need to be reported in the TBL report and
under which of the three categories. Provide reasons for classifying the aspect under a
specific category, if applicable.
(i) Medical staff conduct charity camps every month. Open to all members of the
community who are provided with consultation free of charge.
(ii) Prompt and accurate tax payments based on records maintained without errors or
fraud.
(iii) Caregiver, with the help of traffic police, has implemented a "green corridor" for
ambulances that carry donor organs for transplantation. Organs harvested from the
donor at one hospitalcan reach another hospital with the recipient patient at the
earliest.
(iv) Medical waste is discarded at a landfill in a nearby dumpsite. Some of the waste
are not bio-degradable.
(v) During review of the supplier for housekeeping service, it was observed that the
service provider resorted to child labor to keep cost of operations lower.
(vi) Training and professional development programs doctors and nurses.
(vii) Lab reports are being made available online within the hospital computer system.
This would reduce printing costs and storage space needed to maintain older
records.
(viii) Caregiver has a good track record of having no medical negligence litigation cases
filed against it.
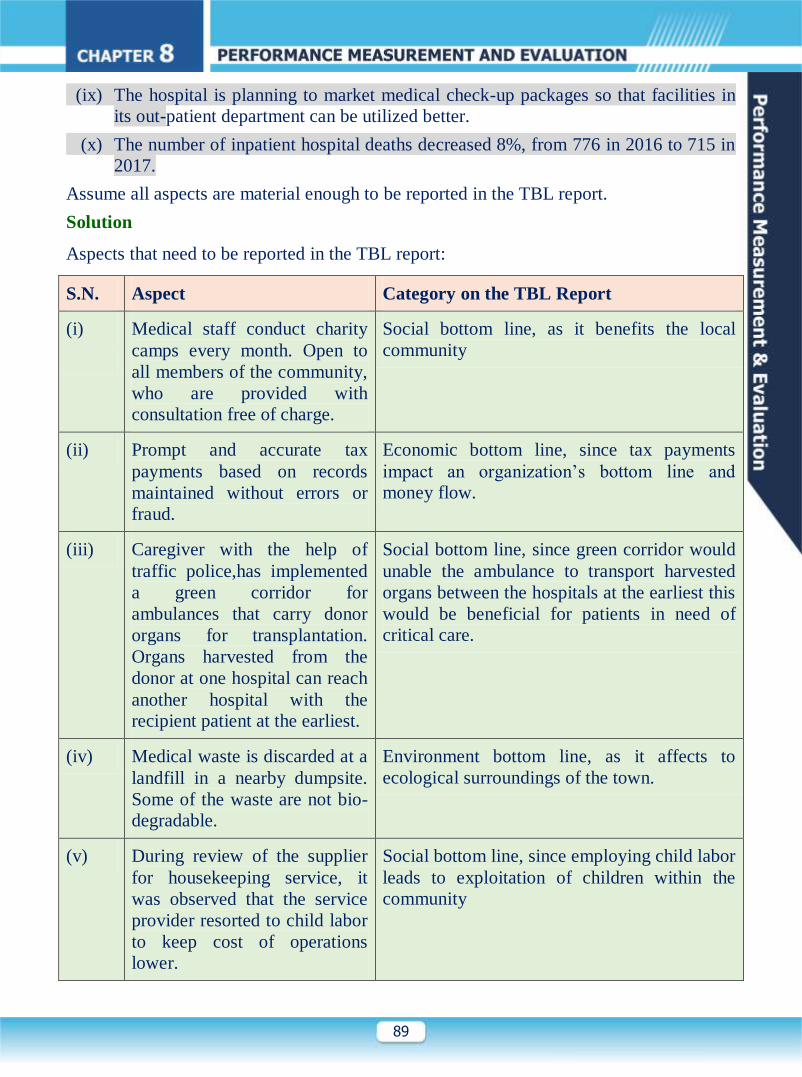
89
(ix) The hospital is planning to market medical check-up packages so that facilities in
its out-patient department can be utilized better.
(x) The number of inpatient hospital deaths decreased 8%, from 776 in 2016 to 715 in
2017.
Assume all aspects are material enough to be reported in the TBL report.
Solution
Aspects that need to be reported in the TBL report:
S.N. Aspect Category on the TBL Report
(i)
Medical staff conduct charity
camps every month. Open to
all members of the community,
who are provided with
consultation free of charge.
Social bottom line, as it benefits the local
community
(ii) Prompt and accurate tax
payments based on records
maintained without errors or
fraud.
Economic bottom line, since tax payments
impact an organization’s bottom line and
money flow.
(iii) Caregiver with the help of
traffic police,has implemented
a green corridor for
ambulances that carry donor
organs for transplantation.
Organs harvested from the
donor at one hospital can reach
another hospital with the
recipient patient at the earliest.
Social bottom line, since green corridor would
unable the ambulance to transport harvested
organs between the hospitals at the earliest this
would be beneficial for patients in need of
critical care.
(iv) Medical waste is discarded at a
landfill in a nearby dumpsite.
Some of the waste are not bio-
degradable.
Environment bottom line, as it affects to
ecological surroundings of the town.
(v) During review of the supplier
for housekeeping service, it
was observed that the service
provider resorted to child labor
to keep cost of operations
lower.
Social bottom line, since employing child labor
leads to exploitation of children within the
community
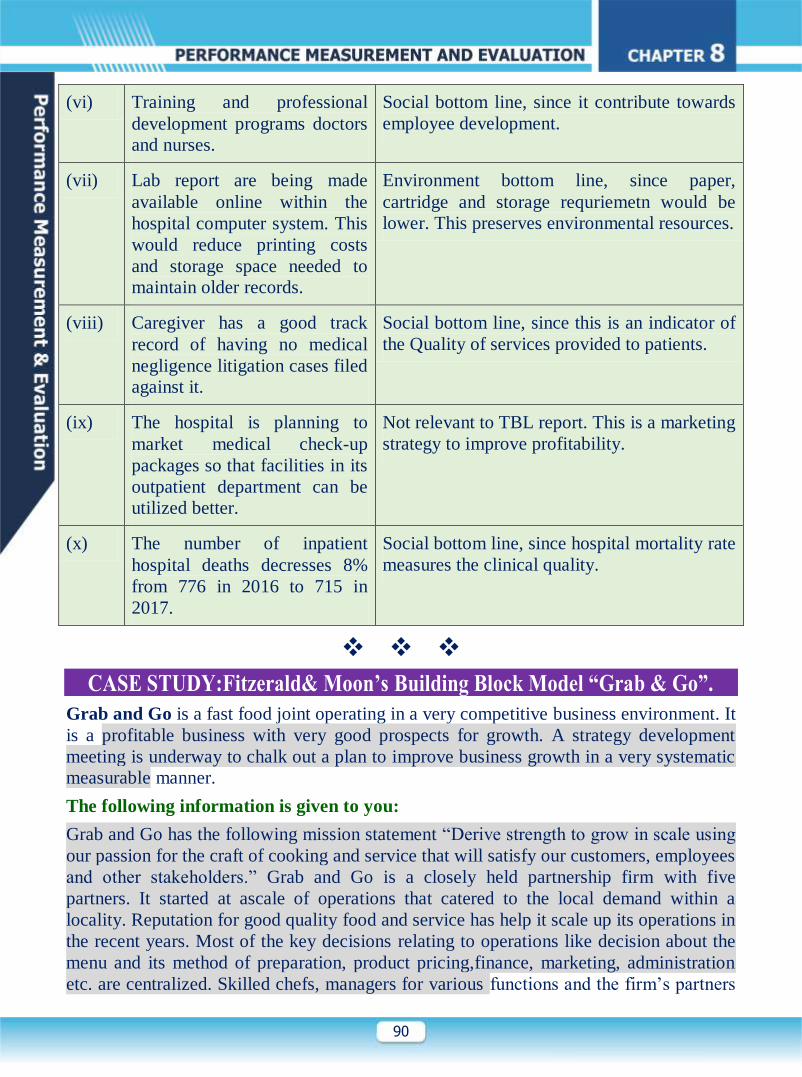
90
(vi) Training and professional
development programs doctors
and nurses.
Social bottom line, since it contribute towards
employee development.
(vii) Lab report are being made
available online within the
hospital computer system. This
would reduce printing costs
and storage space needed to
maintain older records.
Environment bottom line, since paper,
cartridge and storage requriemetn would be
lower. This preserves environmental resources.
(viii) Caregiver has a good track
record of having no medical
negligence litigation cases filed
against it.
Social bottom line, since this is an indicator of
the Quality of services provided to patients.
(ix) The hospital is planning to
market medical check-up
packages so that facilities in its
outpatient department can be
utilized better.
Not relevant to TBL report. This is a marketing
strategy to improve profitability.
(x) The number of inpatient
hospital deaths decresses 8%
from 776 in 2016 to 715 in
2017.
Social bottom line, since hospital mortality rate
measures the clinical quality.
CASE STUDY:Fitzerald& Moon’s Building Block Model “Grab & Go”.
Grab and Go is a fast food joint operating in a very competitive business environment. It
is a profitable business with very good prospects for growth. A strategy development
meeting is underway to chalk out a plan to improve business growth in a very systematic
measurable manner.
The following information is given to you:
Grab and Go has the following mission statement “Derive strength to grow in scale using
our passion for the craft of cooking and service that will satisfy our customers, employees
and other stakeholders.” Grab and Go is a closely held partnership firm with five
partners. It started at ascale of operations that catered to the local demand within a
locality. Reputation for good quality food and service has help it scale up its operations in
the recent years. Most of the key decisions relating to operations like decision about the
menu and its method of preparation, product pricing,finance, marketing, administration
etc. are centralized. Skilled chefs, managers for various functions and the firm’s partners

91
are part of this core team.
A general survey published in a food trade magazine highlighted people’s perception
about fast food diet. Predominant opinion was that the current food platter available in
food joints across the town was not healthy option. People want healthier choices in the
menu when they dine out. At the same time, they do not want to compromise on taste or
presentation of the food item. The other focal point for improvement was the order taking
system. In most food joints, the current system is manual where the order taking staff
note down a customer’s order on paper, send it to the kitchen and then delivers the order
on intimation from the kitchen, which is also done manually by the kitchen staff. This
system has problems like errors in taking down orders, most times delivery staff are
unaware of the content in an item or its availability, delays in delivery leading to
customers complaining about food served cold etc. This problem takes away the pleasure
of dining out and is leaving customers dissatisfied. Another scope for improvement is
that customers want more payment options other than cash to settle their bills. With the
advent of plastic money and mobile e wallet payments carrying cash around has become
cumbersome for most of them.
The partners have decided to use this as an opportunity to develop Grab and Go as the
niche food joint addressing the customer’s concerns, while managing to remain
profitable. Consequently, Grab and Go plans to expand by providing more choices along
with its regular menu to health-conscious customers. Also, revamping its ordering,
delivery and payment system would improve customer experience. A reasonable return at
the overall firm level would be a return on equity (Net Income/Total Partnership Capital)
of 25% each year. Capital structure will remain unchanged. The partners are not
interested in diluting their share by bringing in new partners or take external funding with
ownership stake. They may however utilize bank financing for expansion, but only if
required.
Expansion of business will entail opening new branches in other localities as well as
forging franchise with other stakeholders. However, Grab and Go is not clear how to
measure market share since the fast food industry market is not entirely an organized
sector. There is no clear information about the overall revenue of the whole sector.
In the past, it was quality of its products that drove growth. The management wishes to
maintain high quality standards across branches and franchisee. Therefore, an internal
quality control department may be established to look into the same. External
certifications from government food inspectors and other recognized agencies would also
be required to be met. Quality refers to both product quality and service quality, in this
case, service being an inherent part of customer experience.
The staff at Grab and Go are also excited at this opportunity. Expansion of the food joint
would present a more dynamic work culture. Chefs would have the opportunity to
enhance their skill by trying out various ways to cater to the consumer’s palate. Ordering
and delivery staff would have the opportunity to enhance their people management skills.
This learning opportunity would definitely be an impetus for their career growth. With
92
expansion chances of promotion within the organization increase. Financially, better
business leads to the expectation of better pay and reward system.
Consequently, the management is intent on developing a performance management
system that tracks performance across the organization. Among the different models, the
Building Block Model is being considered.
Required
ADVISE the partners how the Building Block Model at Grab and Go could be
implemented.
Solution
Performance management using the Building Block Model poses three questions based
on which the performance measurement system is developed:What dimensions of
performance should the company measure?
Dimensions are the goals that the company wants to achieve based on its overall strategy,
those goals that define its success.
How to set the standards (benchmarks) for those measures?
What are the rewards needed to motivate employees to achieve these standards?
Dimensions
Dimensions (goals) include financial and non-financial goals. Dimensions are further
categorized as into results and determinants. Results are tracked as (a) financial
performance and (b) competitive performance. Determinants are tracked as (a) quality,
(b) flexibility, (c) innovation, and (d) resource utilization. Determinants influence results.
Results
(a) Financial Performance: Grab and Go is a closely held partnership with 5 partners.
Partners are interested in earning profits that have been benchmarked at an overall
return on equity of 25% each year. This can be derived from periodic financial
statements that get prepared as part of the accounting function. Partners want to
retain the current capital structure. This implies that they do not have any plans to go
public or have other external funding with ownership stake. They may take loans
from banks for funding their expansion.
Consequently, if they want to expand, the firm has to make sufficient profits that will

93
yield ample cash reserves. Therefore, Grab and Go’s financial performance
dimensions should also include profitability ratios like gross profit ratio, net profit
ratio, operating margin, return of capital employed (if bank loans are taken) etc. Cash
profit and changes in cash reserves may also be included as dimensions of
performance. These measures should be tracked at the firm’s overall level as well at
the individual branch/franchisee level.
(b) Competitive Performance: Grab and Go was to be a niche joint in a highly
competitive segment. However, to measure how it compares with its peers there is a
limitation in terms of availability of information due to the unorganized nature of the
fast food industry. All the same, one of the measures that can be helpful are the
number of branches / franchisees the firm is able to open.
Grab and Go is also likely to have a competitive edge because it is foraying into
providing healthier food choices along with its regular menu. Since this is unique
among its segment, it will retain a competitive edge until its peers start replicating the
same. Therefore, one other measure for competitive performance could be the spread
and uniqueness of Grab and Go’s menu as compared to its peers. Information for this
could be gathered from published / researched sources like trade magazines as well as
informal sources like customer feedback / word of mouth.
Determinants
(a) Quality: Quality drove past performance and it will continue to drive performance
even after expansion. For product quality, the management should track if internal
quality checks and external certifications are met periodically. Quality control should
cover all branches and franchisees. Non-compliance may require immediate attention
of the management. For service quality, periodic training programs can be initiated to
educate the staff with people management skills. Therefore, Grab and Go should
determine parameters that the management would be interested in ensuring that
quality standards are met and how non- compliance should be reviewed.
(b) Innovation: Innovation involves experimenting with the appropriate inputs which
make them healthy. At the same time, the healthier option should satisfy the taste and
94
presentation preference of customers. This requires innovative efforts from qualified
and skilled chefs.
This will give the competitive edge to Grab and Go. Innovation has to be constant
and not a onetime exercise. Therefore, management may review the number of new
variants that have been introduced in the menu, regularity of these introductions and
customer feedback of the same.
(c) Flexibility: Growth in scale of operations combined with a competitive business
environment implies that Grab and Go should have some flexibility in its operations.
This could mean ability to hire staff quickly, cater to seasonal surges in customer’s
demand etc.
(d) Resource utilization: Better utilization of resources help business function efficiently.
Revamping the order, delivery and payment system would improve the way
resources (kitchen, ordering and delivery staff) operate. Lesser errors and delays
would increase capacity utilization, freeing up time to cater to more customers.
Consequently, pressure on resources decreases. Therefore, some indicators to be
tracked can be overtime / idle time of kitchen, ordering and delivery staff, turnaround
time in these functions, table occupancy rate, breakage, or wastage of material etc.
Again here, the management should chart out the appropriate dimensions that will
help them track resource utilization.
Standards
Standards are the benchmarks or targets related to the performance metric that is being
tracked under each dimension. To be useful, standards should have the following
characteristics:
(a) Ownership:It is important to establish who in the organization structure is
responsible for achievement which performance metric. Grab and Go has to consider
this very carefully. As explained in the problem, many key management functions
like decisions about the menu and its preparation are determined by a core team.
Similarly, the centralized core team is handling finance and marketing. However, at
the branch level, managers of various operational functions can be held accountable
95
for performance of that specific process. For example, the chief at a particular branch
can be held accountable for the quality of food prepared in that branch (Dimension:
Quality). Similarly, the head of the order taking staff at a particular branch can be
held accountable for the overtime that the staff at putting in at that branch
(Dimension: Resource utilization).
(b) Achievability: Benchmarks and targets will be useful only if they are achievable.
The managers who have ownership for the achievement of performance metric have
to be involved in setting benchmarks or targets. They should be clearly defined,
preferably quantifiable. At the same time, they should be in line with the firm’s
overall strategy. If the target is set very high staff can get de-motivated. If set too
low, will not raise the bar for performance. If not in line with the firm’s overall
strategy, there will be discord or gap between the firm’s performance and what it
wants to achieve.
(c) Equity: Benchmarks should be equally challenging for all parts of the business. Grab
and Go should customize its performance measure for each function like kitchen
staff, order and delivery staff, finance staff, advertising staff etc. For example, while
turnaround time to meet a customer’s order would be relevant metric to the kitchen,
ordering and delivery staff, popularity of the advertisement jingle for Grab and Go
would be the relevant metric for the advertisement department. The rigor of the target
should be uniform across departments. Otherwise the staff would view the
benchmark system as being biased towards select functions within the firm.
Rewards
This relates to the reward structure within the firm that includes compensation package,
bonus, rewards, awards, facilities provided to employees etc. Proper reward system is
required for achievement of standards while maintaining costs at optimum levels. Grab
and Go should have a well-defined HR policy for compensation, bonus, promotion and
reward. A good system should have the following characteristics:
(a) Motivation: Does the reward system drive the people to achieve targets and
standards? A low reward system would not induce staff to work towards the goal.

96
Goal clarity and participation in target/benchmark setting can motivate staff to
achieve standards.
While some part of compensation may be fixed, other parts can be made variable. For
example, bonus of the advertising staff can be aligned to the sales generated, Chefs
can be rewarded bonus based on sales as well quality measures etc. Better job
prospects in a growing environment would also be a good motivator. Grab and Go’s
management should track various metric in this regard. Some of them could be
percentage of bonus paid to the overall compensation package categorized staff
cadre, attrition rate, internal promotions, cross training programs etc.
(b) Clarity:The reward package should be clearly communicated to the staff. It should
be understood by the staff concerned. They should be told what kind of performance
will be rewarded and how their performance will be measured. Grab and Go may
consider having a dedicated HR team for this purpose.
(c) Controllability:Unlike the traditional understanding, rewards need not be based only
on the financial element that the staff can control. There may be other non-financial
elements for which rewards can be given. Both aspects however need to be
controllable by the staff concerned. For example, the chef can come up with a
popular menu. If the pricing of the product, managed by the central core team, is such
that it results in a loss to Grab and Go, the chef may not get the much-deserved
bonus. This is not a good reward system and might lead to attrition.
Grab and Go can design its performance measurement system along the above lines.
CASE STUDY:TraditionalAccoutning Framework vs. TBL
Framework “PSL”.
PAPER SOLUTIONS LTD. (PSL)is a paper mill producing excellent quality writing
and printing paper. It is located in a small town where eucalyptus, acacia and casuarina
trees grow in plenty, which are required in the paper production process. It sources its
raw material from pulp-wood plantations that grow the above-mentioned trees. These
plantations are located in degraded agrarian land surrounding the factory site, which was
previously wasteland. Their owners are subsistence farmers, who have been encouraged
to grow these trees to source raw material for the paper mill. The mill’s local
97
procurement policy has thus provided a source of livelihood for this community.
Moreover, almost 40% of the staff working at the mill are from the local community.
Most of the mill’s labour force lives in residential areas near the factory site. Catering to
the mill employees’ livelihood needs like food, clothing, education etc. has given the
town alternate sources of income and thus has benefited the town. The plant managers at
the mill have been working on various projects in order to build a sustainable business.
This includes, reducing waste during the manufacturing process, imparting knowledge to
local farmers at the pulp-wood plantations to improve the quality of wood through
breeding and seed improvement techniques.
Operations at the mill have yielded substantial profits over the last 15 years since
inception.
You are the chief accounting officer of PSL taking care of all the reporting (internal and
external) needs of the company. Recently, you read about the Triple Bottom Line (TBL)
reporting that many other companies are following. You feel the need to introduce TBL
reporting because:
The vital role played by the mill towards the development of the town. This can be
highlighted in the TBL report. This will enhance the company’s goodwill. At the same
time, you feel the need for transparency of operations and balancing the need of various
stakeholders involved. All this can be addressed by publishing the TBL report
periodically.
The mill’s operations are driven by the resources available in the environment. What the
mill takes should be returned in equal if not in a higher measure. TBL reporting can help
identify opportunities of giving back to the environment.
You have an appointment with the Chief Executive Officer to discuss this reporting
framework. During a preliminary discussion, the CEO was sceptical of the need for
additional reporting. “Weare here to do business, profit should be the sole parameter for
measuring our success.
Shareholders are our only stakeholders. Annual reports would provide sufficient
information to others who are interested in our operations.”
Required
To convince the CEO, you need bring out the differences traditional accounting
framework and the triple bottom line framework. Draft an e-mail on this subject that you
need to send to the CEO for discussion at the meeting.
Solution
Performance management using the Building Block Model poses three questions based
on which the performance measurement system is developed: What dimensions of
performance should the company measure?
Dimensions are the goals that the company wants to achieve based on its overall strategy,

98
those goals that define its success.
How to set the standards (benchmarks) for those measures?
What are the rewards needed to motivate employees to achieve these standards?
Dimensions
Dimensions (goals) include financial and non-financial goals. Dimensions are further
categorized as into results and determinants. Results are tracked as (a) financial
performance and (b) competitive performance. Determinants are tracked as (a) quality,(b)
flexibility, (c) innovation, and (d) resource utilization. Determinants influence results.
Results
(a) Financial Performance: Grab and Go is a closely held partnership with 5 partners.
Partners are interested in earning profits that have been benchmarked at an overall
return on equity of 25% each year. This can be derived from periodic financial
statements that get prepared as part of the accounting function. Partners want to
retain the current capital structure. This implies that they do not have any plans to go
public or have other external funding with ownership stake. They may take loans
from banks for funding their expansion.
Consequently, if they want to expand, the firm has to make sufficient profits that will
yield ample cash reserves. Therefore, Grab and Go’s financial performance
dimensions should also include profitability ratios like gross profit ratio, net profit
ratio, operating margin, return of capital employed (if bank loans are taken) etc. Cash
profit and changes in cash reserves may also be included as dimensions of
performance. These measures should be tracked at the firm’s overall level as well at
the individual branch/franchisee level.
(b) Competitive Performance: Grab and Go was to be a niche joint in a highly
competitive segment. However, to measure how it compares with its peers there is a
limitation in terms of availability of information due to the unorganized nature of the
fast food industry. All the same, one of the measures that can be helpful are the
number of branches / franchisees the firm is able to open.
Grab and Go is also likely to have a competitive edge because it is foraying into

99
providing healthier food choices along with its regular menu. Since this is unique
among its segment, it will retain a competitive edge until its peers start replicating the
same. Therefore, one other measure for competitive performance could be the spread
and uniqueness of Grab and Go’s menu as compared to its peers. Information for this
could be gathered from published / researched sources like trade magazines as well as
informal sources like customer feedback / word of mouth.
Determinants
(a) Quality: Quality drove past performance and it will continue to drive performance
even after expansion. For product quality, the management should track if internal
quality checks and external certifications are met periodically. Quality control should
cover all branches and franchisees. Non-compliance may require immediate attention
of the management. For service quality, periodic training programs can be initiated to
educate the staff with people management skills. Therefore, Grab and Go should
determine parameters that the management would be interested in ensuring that
quality standards are met and how non- compliance should be reviewed.
(b) Innovation: Innovation involves experimenting with the appropriate inputs which
make them healthy. At the same time, the healthier option should satisfy the taste and
presentation preference of customers. This requires innovative efforts from qualified
and skilled chefs.
This will give the competitive edge to Grab and Go. Innovation has to be constant
and not a onetime exercise. Therefore, management may review the number of new
variants that have been introduced in the menu, regularity of these introductions and
customer feedback of the same.
(c) Flexibility: Growth in scale of operations combined with a competitive business
environment implies that Grab and Go should have some flexibility in its operations.
This could mean ability to hire staff quickly, cater to seasonal surges in customer’s
demand etc.
(d) Resource utilization: Better utilization of resources help business function
efficiently.
100
Revamping the order, delivery and payment system would improve the way
resources (kitchen, ordering and delivery staff) operate. Lesser errors and delays
would increase capacity utilization, freeing up time to cater to more customers.
Consequently, pressure on resources decreases. Therefore, some indicators to be
tracked can be overtime / idle time of kitchen, ordering and delivery staff, turnaround
time in these functions, table occupancy rate, breakage, or wastage of material etc.
Again here, the management should chart out the appropriate dimensions that will
help them track resource utilization.
Standards
Standards are the benchmarks or targets related to the performance metric that is being
tracked under each dimension. To be useful, standards should have the following
characteristics:
(a) Ownership:It is important to establish who in the organization structure is
responsible for achievement which performance metric. Grab and Go has to consider
this very carefully. As explained in the problem, many key management functions
like decisions about the menu and its preparation are determined by a core team.
Similarly, the centralized core team is handling finance and marketing. However, at
the branch level, managers of various operational functions can be held accountable
for performance of that specific process. For example, the chief at a particular branch
can be held accountable for the quality of food prepared in that branch (Dimension:
Quality). Similarly, the head of the order taking staff at a particular branch can be
held accountable for the overtime that the staff at putting in at that branch
(Dimension: Resource utilization).
(b) Achievability: Benchmarks and targets will be useful only if they are achievable.
The managers who have ownership for the achievement of performance metric have
to be involved in setting benchmarks or targets. They should be clearly defined,
preferably quantifiable. At the same time, they should be in line with the firm’s
overall strategy. If the target is set very high staff can get de-motivated. If set too
low, will not raise the bar for performance. If not in line with the firm’s overall
101
strategy, there will be discord or gap between the firm’s performance and what it
wants to achieve.
(c) Equity:Benchmarks should be equally challenging for all parts of the business. Grab
and Go should customize its performance measure for each function like kitchen
staff, order and delivery staff, finance staff, advertising staff etc. For example, while
turnaround time to meet a customer’s order would be relevant metric to the kitchen,
ordering and delivery staff, popularity of the advertisement jingle for Grab and Go
would be the relevant metric for the advertisement department. The rigor of the target
should be uniform across departments. Otherwise the staff would view the
benchmark system as being biased towards select functions within the firm.
Rewards
This relates to the reward structure within the firm that includes compensation package,
bonus, rewards, awards, facilities provided to employees etc. Proper reward system is
required for achievement of standards while maintaining costs at optimum levels. Grab
and Go should have a well-defined HR policy for compensation, bonus, promotion and
reward. A good system should have the following characteristics:
(a) Motivation: Does the reward system drive the people to achieve targets and
standards? A low reward system would not induce staff to work towards the goal.
Goal clarity and participation in target/benchmark setting can motivate staff to
achieve standards.
While some part of compensation may be fixed, other parts can be made variable. For
example, bonus of the advertising staff can be aligned to the sales generated, Chefs
can be rewarded bonus based on sales as well quality measures etc. Better job
prospects in a growing environment would also be a good motivator. Grab and Go’s
management should track various metric in this regard. Some of them could be
percentage of bonus paid to the overall compensation package categorized staff
cadre, attrition rate, internal promotions, cross training programs etc.
(b) Clarity: The reward package should be clearly communicated to the staff. It should
be understood by the staff concerned. They should be told what kind of performance

102
will be rewarded and how their performance will be measured. Grab and Go may
consider having a dedicated HR team for this purpose.
(c) Controllability: Unlike the traditional understanding, rewards need not be based
only on the financial element that the staff can control. There may be other non-
financial elements for which rewards can be given. Both aspects however need to be
controllable by the staff concerned. For example, the chef can come up with a
popular menu. If the pricing of the product, managed by the central core team, is such
that it results in a loss to Grab and Go, the chef may not get the much-deserved
bonus. This is not a good reward system and might lead to attrition.
Grab and Go can design its performance measurement system along the above lines.
CASE STUDY: PERFORMANCE PRISM
Galaxy Limitedis in the business of logistics and distribution. In 2002, Galaxy limited
had implemented Balance Scorecard as a performance measurement & management
system. The balanced scorecard measures performance across Financial, Customer,
Business and Innovation perspective. The implementation of Balanced Scorecard had the
following impact —
The company’s financial performance improved substantially.
The complaints from customers regarding poor service reduced.
The company has pioneered in innovation in the field of door to door delivery of
goods.
All these led to improvement in profitability of the company. The share prices are trading
at life time highs. Since the ultimate objective of a commercial organisation is to
maximise shareholder’s wealth, the CEO of the company is extremely pleased with the
affairs at the company.
Of late, the company has witnessed high employee turnover ratio. Though the company
has a formal exit interview process for the resigning employees, theinputs received from
these interview is rarely considered in improving the HR practices. One of the common
feedback from employees who left the company was that there is too much pressure to
perform and improve customer service without adequate support of systems and
processes.
Also, the truck drivers who move consignment from one city to another have been on
strike thrice in the last one year demanding better pay and working conditions. These
drivers are generally hired on contractual basis. They are not entitled to any retirement
benefits. The drivers have been insisting that they be taken as permanent employee and
103
are given benefits applicable to employees of the company.
The above two issues were discussed in one of the board meetings. The directors
wondered if they had the right performance measurement mechanism to address the
issues. The company is doing great financially but must also ensure that the employees
and other stakeholders are taken care of apart from shareholders. The board is also
concerned that they have too much of data and reports to look at on performance
management as the current measurement is done on a monthly basis. However, the
alignment of such reports to the overall strategy of the company is missing.
Required
RECOMMEND an alternative performance measurement mechanism which considers all
stakeholders instead of just shareholders and employees
Solution
Issue
Galaxy limited use Balance Scorecard to measure performance. Balance scorecard
focuses on the financial, customer, business and innovation perspectives. The company
has been doing great on financial parameters and customer satisfaction parameters.
However, of late the company has been facing issues related to high employee turnover
and dissatisfaction of the truck drivers.
The board of directors is also concerned about the volume of performance measurement
data and alignment of performance measurement with the strategy of the company. An
alternate performance measurement mechanism is Performance Prism.
Performance Prism
Performance Prism is considered to be a second-generation performance management
framework conceptualized by Andy Neely and Chris Adams. The following are the
factors which make Performance prism should replace the models like Balanced
Scorecard –
Organisations cannot afford to focus on just two stakeholder group - Investors and
Customers. Other stakeholders group like employees, suppliers, government etc.
should not be forgotten. This is important for sustainable growth of companies
both profit oriented and non-profit oriented.
Most of the performance measurement models do not focus on changes that could
be made to the strategies and processes. The underlying assumption is that if right
things are measured, the rest will fall into place automatically.
Stakeholders expect some things from the organisation. The organisation also must
expect contribution from the stakeholders. There is a ‘Quid Pro Quo’ relationship
between the stakeholders and organisation.
Another problem highlighted by Andy Neely and Chris Adams was that management are
measuring too many things. They believe that in doing so they are controlling the
104
organisations well. The problem with increased measurement is that the management
starts micro-managing things and lose sight of the strategic direction. This negatively
impacts the organisation in the longer run.
The performance Prism aims to measure performance of an organisation from five
different facets listed below:
Stakeholder Satisfaction
Stakeholder’s Contribution
Strategies
Processes
Capabilities
Stakeholder Satisfaction
The first facet of prism focuses on stakeholder’s satisfaction. Though balanced scorecard
also focuses on stakeholder’s satisfaction, it is primarily concerned with the shareholders
and customers and ignores other stakeholders. This is precisely the issue at Galaxy
limited where the shareholders and customers are happy with the company, other
stakeholders are not.
The company must identify all stakeholders and determine relative importance of each of
the stakeholders. The company can use Mendelow’s matrix to identify key shareholders
in terms of power and interest of stakeholders. A stakeholder group which has high
power and high interest (say a trade union) must be kept satisfied. The key stakeholders
for a company are:
Investors - They want return on investment.
Customers - They want good quality products at cheap prices.
Suppliers - They want better price for products.
Government - They want revenues and development.
Society at large - They want employment opportunities.
Each of the stakeholders group exercise different level of power/influence on the
company. The interest of each stakeholder group in the company also differs. Based on
the power and interest of the stakeholders, the company must appropriately perform
activities for stakeholder’s satisfaction.
After identification of the stakeholders, the company must identify the requirements of
each of the stakeholders group. What must the company do to ensure stakeholder
satisfaction?
Galaxy limited must ensure satisfaction of the two stakeholders highlighted above. The
company must take steps to improve employee satisfaction and reduce the employee
turnover. The company must also address the issues related to truck drivers and involve
them in a dialogue. The impact of not keeping these stakeholders group satisfied is that
the company might suffer financially in the longer run.

105
Performance measure - Employee Turnover Ratio, Average employment duration of
employees, Number of strikes by truck drivers etc.
Stakeholders Contribution
In the second facet of Performance Prism, the organisations identify the contribution
required from the stakeholders. The organisations must then define ways to measure the
contribution of stakeholders. This aspect is different from traditional measures where the
organisations were just concerned with what they could contribute to the stakeholders.
The company would take steps to provide better service to its customers. In return the
customers must contribute in terms of profits and revenues to the company. There is a
‘Quid Pro Quo’ relationship as described earlier.
In case of Galaxy limited, the company could improve the employee satisfaction with
better pay, training and growth opportunities. In turn, the employees must perform better
to contribute to the company as a whole. Similarly, the drivers must be given better
working conditions and in turn, they should contribute towards improving efficiency and
on-time deliveries.
Performance Measure - Efficiency of Employees, Productivity, On Time deliveries by
Truck drivers.
Strategies
In the strategies facet of the Prism, the organisation should identify those strategies which
the organisation would adopt to ensure that –
The wants and needs of the stakeholders are satisfied
The organisation own requirements are satisfied by the stakeholders.
After the company identifies strategies, the performance measures must be put in place to
confirm that the strategies are working. The various aspects to be considered appropriate
communication of strategies, implementation of strategies by managers and continuous
evaluation of appropriateness of strategies.
Galaxy limited might come out with a strategy of to retain employees by means of better
pay and growth opportunities within the company. This strategy can be called successful
if the higher pay ensures that employee’s turnover is reduced. As a strategy, the company
can start to hire drivers on the payrolls of the company.
Performance Measure - Number of employees leaving the organisation after getting pay
hike, Efficiency of deliveries after Truck drivers are put on employment of company.
Processes
After identifying the strategies, organisations need to find out if they have the correct
business processes to support the strategy. The various business processes can have sub-
processes. Each process will have a process owner who is responsible for functioning of
the process.
106
The organisations must develop measures to evaluate the how well the processes are
working. The management must be careful to evaluate most important processes instead
of evaluating all the processes. Porter’s Value Chain analysis can be used to identify and
evaluate various processes in the organisation.
Galaxy limited could devise a recruitment process which results in transparency in hiring
and pay of employees. The process could be owned by the Human Resources Manager.
The working condition of drivers can be improved by providing structured training and
working conditions.
Capabilities
Capabilities refer to the resources, practices, technology and infrastructure required for a
particular process to work. The company must have right capabilities in order to support
the processes. The company must identify performance measures to set how well the
capabilities are being performed.
While Galaxy limited might choose to increase the salaries of employees, an important
question to answer is whether the company has financial capability to do so.
Conclusion
The facets of Performance Prism are interlinked and must support each other. The
company must first identify the stakeholder wants and what the company wants from
those stakeholders. The required strategies for these are identified and the processes to
achieve the strategy followed by identifying the capabilities to perform these processes.
CS-: Building Block Model on KTR Fast Food
KTR is a fast food joint operating in a very competitive business environment. It is a
profitable business with very good prospects for growth. A strategy development meeting
is underway to chalk out a plan to improve business growth in a very systematic
measurable manner.
The following information is given to you:
KTR has the following mission statement “Derive strength to grow in scale using our
passion for the craft of cooking and service that will satisfy our customers, employees
and other stakeholders.” KTR is aclosely held partnership firm with five partners. It
started at a scale of operations that catered to the localdemand within a locality.
Reputation for good quality food and service has help it scale up its operationsin the
recent years. Most of the key decisions relating to operations like decision about the
menu andits method of preparation, product pricing, finance, marketing, administration
etc. are centralized. Skilledchefs, managers for various functions and the firm’s partners
are part of this core team.
A general survey published in a food trade magazine highlighted people’s perception
107
about fast food Predominant opinion was that the current food platter available in food
joints across the town was not healthy option. People want healthier choices in the menu
when they dine out. At the same time, they do not want to compromise on taste or
presentation of the food item. The other focal point for improvement was the order taking
system. In most food joints, the current system is manual where the order taking staff
note down a customer’s order on paper, send it to the kitchen and then delivers the order
on intimation from the kitchen, which is also done manually by the kitchen staff. This
system has problems like errors in taking down orders, most times delivery staff are
unaware of the content in an item or its availability, delays in delivery leading to
customers complaining about food served cold etc.
This problem takes away the pleasure of dining out and is leaving customers dissatisfied.
Another scope for improvement is that customers want more payment options other than
cash to settle their bills. Withthe advent of plastic money and mobile e wallet payments
carrying cash around has becomecumbersome for most of them.
The partners have decided to use this as an opportunity to develop KTR as the niche food
jointaddressing the customer’s concerns, while managing to remain profitable.
Consequently, KTR plans to expand by providing more choices along with its regular
menu to health -conscious customers. Also, revamping its ordering, delivery and payment
system would improve customer experience. A reasonable return at the overall firm level
would be a return on equity (Net Income/Total Partnership Capital) of 25% each year.
Capital structure will remain unchanged. The partners are not interested in diluting their
share by bringing in new partners or take external funding with ownership stake. They
may however utilize bank financing for expansion, but only if required.
Expansion of business will entail opening new branches in other localities as well as
forging franchise with other stakeholders. However, KTR is not clear how to measure
market share since the fast food industry market is not entirely an organized sector. There
is no clear information about the overall revenue of the whole sector.
In the past, it was quality of its products that drove growth. The management wishes to
maintain high quality standards across branches and franchisee. Therefore, an internal
quality control department may be established to look into the same. External
certifications from government food inspectors and other recognized agencies would also
be required to be met. Quality refers to both product quality and service quality, in this
case, service being an inherent part of customer experience.
The staff at KTR is also excited at this opportunity. Expansion of the food joint would
present a more dynamic work culture. Chefs would have the opportunity to enhance their
skill by trying out various ways to cater to the consumer’s palate. Ordering and delivery
staff would have the opportunity to enhance their people management skills. This
learning opportunity would definitely be an impetus for their career growth. With
expansion chances of promotion within the organization increase. Financially, better
business leads to the expectation of better pay and reward system. Consequently, the
management is intent on developing a performance management system that tracks
108
performance across the organization. Among the different models, the Building Block
Model is being considered.
Required
ADVISE the partners how the Building Block Model at KTR could be implemented.
Solution:-
1. Performance management using the Building Block Model poses three questions
based on which t heperformance measurement system isdeveloped:
What dimensions of performance should the company measure?
Dimensions are the goals that the company wants to achieve based on its overall
strategy, those goals that define its success.
How to set the standards (benchmarks) for those measures?
What are the rewards needed to motivate employees to achieve these standards?
Dimensions
Dimensions (goals) include financial and non-financial goals. Dimensions are further
categorized as into results and determinants. Results are tracked as (a) financial
performance and (b) competitive performance. Determinants are tracked as (a)
quality, (b) flexibility, (c) innovation, and (d) resource utilization. Determinants
influenceresults.
Results
(a) Financial Performance:KTR is a closely held partnership with 5 partners.
Partners are interested in earning profits that have been benchmarked at an overall
return on equity of 25% each year. This can be derived from periodic financial
statements that get prepared as part of the accounting function. Partners want to
retain the current capital structure. This implies that they do not have any plans to
go public or have other external funding with ownership stake. They may take
loans from banks for funding theirexpansion.
Consequently, if they want to expand, the firm has to make sufficient profits that
will yield ample cash reserves. Therefore, KTR’s financial performance
dimensions should also include profitability ratios like gross profit ratio, net
profit ratio, operating margin, return of capital employed (if bank loans are
taken) etc. Cash profit and changes in cash reserves may also be included as
dimensions of performance. These measures should be tracked at the firm’s
overall level as well at the individual branch/franchiseelevel.
(b) Competitive Performance:KTR was to be a niche joint in a highly
competitive segment. However, to measure how it compares with its peers there is
a limitation in terms of availability of information due to the unorganized nature of
the fast food industry. All the same, one of the
109
measuresthatcanbehelpfularethenumberofbranches/franchiseesthefirmisabletoopen.
KTR is also likely to have a competitive edge because it is foraying into providing
healthier food choices along with its regular menu. Since this is unique among its
segment, it will retain a competitive edge until its peers start replicating the same.
Therefore, one other measure for competitive performance could be the spread and
uniqueness of KTR’s menu as compared to its peers. Information for this could be
gathered from published / researched sources like trade magazines as well as
informal sources like customer feedback / word of mouth.
Determinants
Quality:Quality drove past performance and it will continue to drive performance
even after expansion. For product quality, the management should track if internal
quality checks and external certifications are met periodically. Quality control should
cover all branchesand franchisees. Non-compliance may require immediate attention of
the management. For service quality, periodic training programs can be initiated to
educate the staff with people management skills. Therefore, KTR should determine
parameters that the management would be interested i n ensuring that quality standards
are met and how non-compliance should be reviewed.
(a) Innovation:Innovation involves experimenting with the appropriate inputs
which make them healthy. At the same time, the healthier option should satisfy the
taste and presentation preference of customers.This requires innovative efforts
from qualified and skilled chefs. This will give the competitive edge to KTR.
Innovation has to be constant and not a onetime exercise. Therefore, management
may review the number of new variants that have been introduced in the
menu,regularityoftheseintroductionsandcustomerfeedbackofthesame.
(b) Flexibility:Growth in scale of operations combined with a competitive
business environment implies that KTR should have some flexibility in its
operations. This could mean ability to hire staff quickly, cater to seasonal surges in
customer’s demandetc.
(c) Resource utilization:Better utilization of resources help business function
efficiently. Revamping the order, delivery and payment system would improve the
way resources (kitchen, ordering and delivery staff) operate. Lesser errors and
delays would increase capacity utilization, freeing up timeto cater to more
customers. Consequently, pressure on resources decreases. Therefore, some
indicators to be tracked can be overtime / idle time of kitchen, ordering and
delivery staff, turnaround time in these functions, table occupancy rate, breakage,
or wastage of material etc. Again here, the management should chart out the
appropriate dimensions that will help them track resourceutilization.
Standards
Standards are the benchmarks or targets related to the performance metric that is being
110
tracked under each dimension. To be useful, standards should have the following
characteristics:
(a) Ownership:It is important to establish who in the organization structure is
responsible for achievement which performance metric. KTR has to consider this
very carefully. As explained in the problem, many key management functions like
decisions about the menu and its preparation are determined by a core team.
Similarly, the centralized core team is handling finance and marketing. However,
at the branch level, managers of various operational functions can be held
accountable for performance of that specific process. For example, the Chief at a
particular branch can be held accountable for the quality of food prepared in that
branch (Dimension: Quality). Similarly, the head of the order taking staff at a
particular branch can be held accountable for the overtime that the staff at putting
in at that branch (Dimension: Resource utilization).
(b) Achievability:Benchmarks and targets will be useful only if they are
achievable. The managers who have ownership for the achievement of
performance metric have to be involved in setting benchmarks or targets. They
should be clearly defined, preferably quantifiable. At the same time, they should be
in line with the firm’s overall strategy. If the target is set very high staff can get de
- motivated. If set too low, will not raise the bar for performance. If not in line with
the firm’s overall strategy, there will be discord or gap between the firm’s
performance and what it wants to achieve.
(d) Equity:Benchmarks should be equally challenging for all parts of the
business. KTR should customize its performance measure for each function like
kitchen staff, order and delivery staff, finance staff, advertising staff etc. For
example, while turnaround time to meet a customer’s order would be relevant
metric to the kitchen, ordering and delivery staff, Popularity of the advertisement
jingle for KTR would be the relevant metric for the advertisement department. The
rigor of the target should be uniform across departments. Otherwise the staff would
view the benchmark system as being biased towards select functions within
thefirm.
Rewards
This relates to the reward structure within the firm that includes compensation
package, bonus, rewards, awards, facilities provided to employees etc. Proper reward
system is required for achievement of standards while maintaining costs at optimum
levels. KTR should have a well-defined HR policy for compensation, bonus,
promotion and reward. A good system should have the following characteristics:
(a) Motivation:Does the reward system drive the people to achieve targets and
standards? A low reward system would not induce staff to work towards the goal.
Goal clarity and participation in target/benchmark setting can motivate staff to
achievestandards.

111
While some part of compensation may be fixed, other parts can be made variable.
For example, bonus of the advertising staff can be aligned to the sales generated,
Chefs can be rewarded bonus based on sales as well quality measures etc. Better
job prospects in a growing environment would also be a good motivator. KTR’s
management should track various metric in this regard. Some of them could be
percentage of bonus paid to the overall compensation
packagecategorizedstaffcadre,attritionrate,internalpromotions,crosstrainingprogra
msetc.
(b) Clarity:The reward package should be clearly communicated to the staff. It
should be understood by the staff concerned. They should be told what kind of
performance will be rewarded and how their performance will be measured. KTR
may consider having a dedicated HR team for this purpose.
(c) Controllability:Unlike the traditional understanding, rewards need not be
based only on the financial element that the staff can control. There may be other
non-financial elements for which rewards can be given. Both aspects however need
to be controllable by the staff concerned. For example, the chef can come up with a
popular menu. If the pricing of the product, managed by the central core team, is
such that it results in a loss to KTR, the chef may not get the much-
deservedbonus.Thisisnotagoodrewardsystemandmightleadtoattrition.
KTR can design its performance measurement system along the above lines.
CS- Business Process Reengineering (BRR) OF SB
SB is a government-owned bank. The Bank has over 2,500 branches in country ‘A’
spread over all states/union territories including specialized branches. These branches are
controlled through 27 Zonal Offices and 4 NBG Offices. As a government owned bank it
has usually been the first preference for customers while choosing a bank. In the last six
years, the Government has permitted a number of foreign banks to operate within the
country in order to solve the problem of foreign exchange shortage and open up foreign
trade as an instrument to promote economic development. These foreign banks offer
diverse range of services such as direct access to executive management, a single point of
contact to coordinate all banking needs, appointment banking to save time, free online
banking services 24/7, free unlimited ATM access etc. In contrast, SB has very
elementary information systems, covering only for internal transaction handling and
accounting activities. Customers have to visit banks to carry out transactions like -
checking bank balance, cash deposit and withdrawals, transferring money from one
account to another in operational hours. Often customers complain about the amount of
time as the employees and clerical staff of the bank can attend only few customers at a
time. Customer service evaluation has never been undertaken by SB. Other processes,
new account applications, are complex, requiring completion of many documents
formalities. Board of Directors was worried from growing popularity of new style banks.
112
The Board of Directors of SB has recently held meeting to discuss the shortfalls in its
current services and the need to re-engineer the SB’s business processes.
Required
ADVISE how Business Process Reengineering (BPR) can be used to improve SB’s
current processes.
Solution:-
(a) BPR is the fundamental rethinking and radical redesignof business processes to
achieve dramatic improvement in critical contemporary measures of performance,
such as cost, quality, service and speed. In other words, BPR is concerned with the
result of the process (i.e., with those activities that add value to the process). To
implement BPR, firstly, each business process of SB needs to be divided into a
series of processes. Then each business process requires be documenting and
analysingto find out whether it is essential, whether it provides support to other
valuable processes and whether it is adding value. Any process which does not add
value or does not provide essential support to the value adding activities must be
removed. Those processes that remain require beingre-engineered/re-structured so
that can be as efficient as possible. For SB, new technology should be introduced
to improve these processes. However, SB must ensure that the statutory
compliance sregarding these processes are not undermined.
SB is facing a hyper-competitive marketplace where customers expect a superior
experience. BPR activities would help SB in understanding those processes which
SB’s customers value the most and remove those that are not valued. Foreign
banks are offering diverse range of services such as direct access to executive
management, a single point of contact to co-ordinate all banking needs,
appointment banking to save time, free online banking services 24/7,free
Unlimited ATM access etc. Clearly these are valuable business processes valued
by the customer. SB should incorporate all these facilities in their banking
processes to enhance customer satisfaction and service level.
Opening of new accounts in SB is complex processes since it requires multiple
forms to be complied with. Through BPR, SB would analyse the whole process and
identify the need for only one form that contain all of the necessary customer
information. Further, it is also possible to initiate opening of new account through
the development of an online application form on SB’s website. Online entry
would remove the possibility of forms being lost or incorrect, again enhancing
customer satisfaction since customers need not to visit SB’s branch to open
account. There should also be online processing authentications/ validations as to
ensure that data fields are correctly filled by customers that would result in error
reduction. This would also remove unnecessary staff activities in checking and re-

113
processingforms.
It is likely that BPR may increase costs in short-term as investment in technology.
However, this would also reduce substantial levels of manual activities and
processes thereby providing speedy services to customers. In long term, this would
result in high levels of efficiency, profitability and better levels of customer
satisfaction and retention.
(b) There are potential advantages and disadvantages of the involvement of staff in the
preparation of the budget.
Potential advantages include:
Senior staff may agree to accept the targets because they would take
ownership of it as their budget.
Senior staff may have a better understanding of what results can be
achieved and at what costs. For example, they may have a better knowledge of
individual courses and how they may be delivered more efficiently and cost
effectively.
Senior staff cannot blame unrealistic goals as an excuse for not achieving
budget expectations.
Senior staff would feel that they are being appreciated for the value that
their experience brings to the running of the management school.
Senior staff may get the opportunity to discuss organisational issues, in
which an exchange of information and ideas can help to solve problems and agree
futureactions.
Potential disadvantages include:
Senior staff may be excellent academically but could lack the practical
knowledge required to formulate their budget.
Seniorstaffmaylimitthebenefitsofparticipationduetopersonalitytraitsofpartici
pants.
Senior staff may consume a great deal of time arguing with each other (and
with the school director).
Senior staff may decide among themselves to artificially inflate the
proposed budget so that itiseasierforthemtoattainthecosttargetstheyhaveset.
Copyright © 2022 FDOKUMEN