Performance Measurement Systems in Quick Service ...
16
Journal of Economics, Finance and Management Studies ISSN(print): 2644-0490, ISSN(online): 2644-0504 Volume 3 Issue 01 January 2020 Page No.- 01-16 JEFMS, Volume 3 Issue 01 Jan. 2020 www.ijefm.co.in Page 1 Performance Measurement Systems in Quick Service Restaurant Chains Dr. Muhammad abd elmonem ebrahem abdelsalam 1 , Remon Samir Fouad 2 1 Associate Professor, Faculty of Tourism and Hotels, Minia University, Egypt 2 Ph.D. Student, Faculty of Tourism and Hotels, Minia University, Egypt. Abstract: Measuring performance becomes a key issue in both academia and business, as organizations are challenged to obtain efficient and effective outcomes. This research explores the effectiveness of current PMSs in QSR chains. This research also identifies best practices and proposes a set of recommendations for QSR chains enabling them to enhance their management practices towards the proper use of PMSs to achieve their strategic plan and accomplish their objectives. To achieve this aim a self-administrated questionnaire was directed to a random sample of restaurant managers in the investigated QSR chains. A number of 200 forms was distributed, among them 124 forms (62%) were completed and valid for analysis. The major findings showed that the BSC and the KPIs systems are widely used by QSR chains and those were classified as systems that can be easily adapted to service organizations. Moreover, the results showed that the major barrier for implementing the PMS in QSR chains is the lack of employee and management support. Keywords: Performance measurement systems (PMSs), performance measurement (PM), quick service restaurants (QSRs), balanced scorecard (BSC). Introduction The quick service restaurant industry QSR is an important element of the hospitality industry (Ashakiran and Deepthi, 2012). QSR must be viewed as providing adequate value for customers (Al-Saad, 2016). To do this, restaurants first need to focus on its performance. The concept of QSR is to provide quick and suitability eating experiences at a relatively low cost (Mason et al., 2013). Donthi and Madhav (2019) stated that QSRs have special characteristics, such as they are everywhere as well as limited menus, inexpensive prices, very high sales volume, existence of unqualified labor and expert management. Hence, QSRs should have proper performance measurement system (PMS) to measure the progress towards the strategic plan and accomplish organizational objectives (Jamil and Mohamed., 2013). Hospitality industry is lagging behind the level of PMS understanding, but they realize the importance of PMS for the organization (Alboushraet al., 2015). Performance measurement (PM) is basically regarded as a component of the planning and controlling series that captures performance information, enables control and feedback as well as effects work behavior and track strategy development (Arena and Arnaboldi., 2014). Traditional PMS mainly supported by financial indicators (Persdotteret al., 2019). However, the role of financial KPIs became insufficient for the current competiveness due to many reasons e.g., needs for flexibility, shortened product cycle and accelerated changes in technology (Kaplan and Norton, 1996). Gradually, Performance Measurement Systems (PMSs) began to settle the use of financial and nonfinancial KPIs, e.g. integrated PM (Nanni et al., 1992; Arena and Arnaboldi, 2014) and the balanced scorecard (BSC) which consider customer, process and people measures in addition to financial measures (Valmohammadi and Servati., 2011). Jamil and Mohamed (2013) found that hospitality organizations rely only on financial approaches to measure its performance and the value of non-financial measures was ignored. In addition, the gap between what are wanted to be assessed and what can be assessed is the key factor for performance measurement and is a challenging task for the top management (Carlyle, 2013). This research explores the effectiveness of current PMSs in QSR chains. The research identifies best practices and proposes a set of recommendations for QSR chains enabling them to enhance their management practices towards the proper use of PMSs to achieve their strategic plan and accomplish their objectives. Literature Review 1- The concept of performance measurement system (PMS)
-
Upload
khangminh22 -
Category
Documents
-
view
0 -
download
0
Transcript of Performance Measurement Systems in Quick Service ...
Journal of Economics, Finance and Management Studies
ISSN(print): 2644-0490, ISSN(online): 2644-0504
Volume 3 Issue 01 January 2020
Page No.- 01-16
JEFMS, Volume 3 Issue 01 Jan. 2020 www.ijefm.co.in Page 1
Performance Measurement Systems in Quick Service Restaurant Chains
Dr. Muhammad abd elmonem ebrahem abdelsalam1, Remon Samir Fouad2
1 Associate Professor, Faculty of Tourism and Hotels, Minia University, Egypt 2
Ph.D. Student, Faculty of Tourism and Hotels, Minia University, Egypt.
Abstract: Measuring performance becomes a key issue in both academia and business, as organizations are challenged to
obtain efficient and effective outcomes. This research explores the effectiveness of current PMSs in QSR chains. This research
also identifies best practices and proposes a set of recommendations for QSR chains enabling them to enhance their
management practices towards the proper use of PMSs to achieve their strategic plan and accomplish their objectives. To
achieve this aim a self-administrated questionnaire was directed to a random sample of restaurant managers in the
investigated QSR chains. A number of 200 forms was distributed, among them 124 forms (62%) were completed and valid for
analysis. The major findings showed that the BSC and the KPIs systems are widely used by QSR chains and those were classified
as systems that can be easily adapted to service organizations. Moreover, the results showed that the major barrier for
implementing the PMS in QSR chains is the lack of employee and management support.
Keywords: Performance measurement systems (PMSs), performance measurement (PM), quick service restaurants (QSRs),
balanced scorecard (BSC).
Introduction
The quick service restaurant industry QSR is an important element of the hospitality industry (Ashakiran and Deepthi, 2012).
QSR must be viewed as providing adequate value for customers (Al-Saad, 2016). To do this, restaurants first need to focus on its
performance. The concept of QSR is to provide quick and suitability eating experiences at a relatively low cost (Mason et al.,
2013). Donthi and Madhav (2019) stated that QSRs have special characteristics, such as they are everywhere as well as limited
menus, inexpensive prices, very high sales volume, existence of unqualified labor and expert management. Hence, QSRs should
have proper performance measurement system (PMS) to measure the progress towards the strategic plan and accomplish
organizational objectives (Jamil and Mohamed., 2013).
Hospitality industry is lagging behind the level of PMS understanding, but they realize the importance of PMS for the
organization (Alboushraet al., 2015). Performance measurement (PM) is basically regarded as a component of the planning and
controlling series that captures performance information, enables control and feedback as well as effects work behavior and
track strategy development (Arena and Arnaboldi., 2014). Traditional PMS mainly supported by financial indicators
(Persdotteret al., 2019). However, the role of financial KPIs became insufficient for the current competiveness due to many
reasons e.g., needs for flexibility, shortened product cycle and accelerated changes in technology (Kaplan and Norton, 1996).
Gradually, Performance Measurement Systems (PMSs) began to settle the use of financial and nonfinancial KPIs, e.g. integrated
PM (Nanni et al., 1992; Arena and Arnaboldi, 2014) and the balanced scorecard (BSC) which consider customer, process and
people measures in addition to financial measures (Valmohammadi and Servati., 2011).
Jamil and Mohamed (2013) found that hospitality organizations rely only on financial approaches to measure its performance
and the value of non-financial measures was ignored. In addition, the gap between what are wanted to be assessed and what
can be assessed is the key factor for performance measurement and is a challenging task for the top management (Carlyle,
2013). This research explores the effectiveness of current PMSs in QSR chains. The research identifies best practices and
proposes a set of recommendations for QSR chains enabling them to enhance their management practices towards the proper
use of PMSs to achieve their strategic plan and accomplish their objectives.
Literature Review
1- The concept of performance measurement system (PMS)
Performance Measurement Systems in Quick Service Restaurant Chains
JEFMS, Volume 3 Issue 01 Jan. 2020 www.ijefm.co.in Page 2
PMS can be defined as set of key performance indicators (KPIs) and processes that used for quantification of efficiency and
effectiveness of historical actions to support decision making (Stříteská and Svoboda 2012). “Efficiency” can be descriped as the
concept of doing things right, “Effectiveness” refers to the concept of do the right things (Carlyle, 2013). Such KPIs would
present the strategic aspects and provide a balanced view of performance (Khatoon and Farooq, 2014).
2- The Development of PMSs
One of the difficulties of developing PM awareness is that researchers are not willing to cross their respective practical
boundaries; observing that by reviewing the researches in the PMS field you will find references mainly of the accountants’
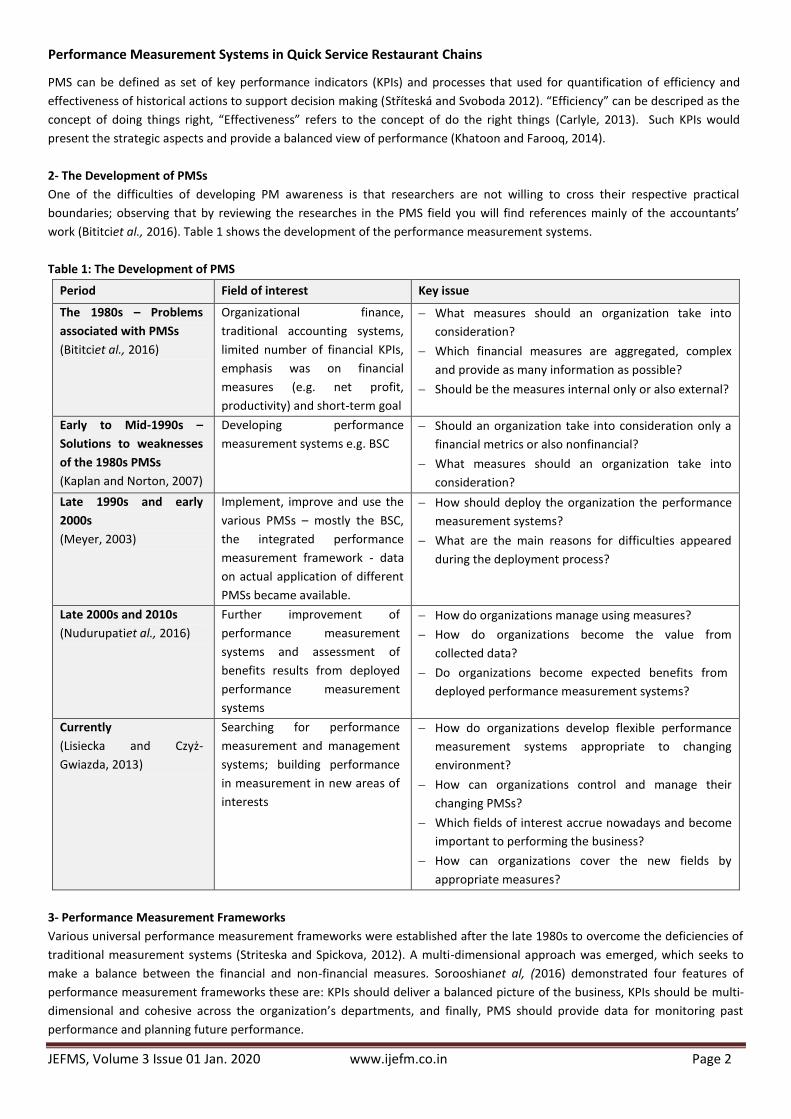
work (Bititciet al., 2016). Table 1 shows the development of the performance measurement systems.
Table 1: The Development of PMS
Period Field of interest Key issue
The 1980s – Problems
associated with PMSs
(Bititciet al., 2016)
Organizational finance,
traditional accounting systems,
limited number of financial KPIs,
emphasis was on financial
measures (e.g. net profit,
productivity) and short-term goal
What measures should an organization take into
consideration?
Which financial measures are aggregated, complex
and provide as many information as possible?
Should be the measures internal only or also external?
Early to Mid-1990s –
Solutions to weaknesses
of the 1980s PMSs
(Kaplan and Norton, 2007)
Developing performance
measurement systems e.g. BSC
Should an organization take into consideration only a
financial metrics or also nonfinancial?
What measures should an organization take into
consideration?
Late 1990s and early
2000s
(Meyer, 2003)
Implement, improve and use the
various PMSs – mostly the BSC,
the integrated performance
measurement framework - data
on actual application of different
PMSs became available.
How should deploy the organization the performance
measurement systems?
What are the main reasons for difficulties appeared
during the deployment process?
Late 2000s and 2010s
(Nudurupatiet al., 2016)
Further improvement of
performance measurement
systems and assessment of
benefits results from deployed
performance measurement
systems
How do organizations manage using measures?
How do organizations become the value from
collected data?
Do organizations become expected benefits from
deployed performance measurement systems?
Currently
(Lisiecka and Czyż-
Gwiazda, 2013)
Searching for performance
measurement and management
systems; building performance
in measurement in new areas of
interests
How do organizations develop flexible performance
measurement systems appropriate to changing
environment?
How can organizations control and manage their
changing PMSs?
Which fields of interest accrue nowadays and become
important to performing the business?
How can organizations cover the new fields by
appropriate measures?
3- Performance Measurement Frameworks
Various universal performance measurement frameworks were established after the late 1980s to overcome the deficiencies of
traditional measurement systems (Striteska and Spickova, 2012). A multi-dimensional approach was emerged, which seeks to
make a balance between the financial and non-financial measures. Sorooshianet al, (2016) demonstrated four features of
performance measurement frameworks these are: KPIs should deliver a balanced picture of the business, KPIs should be multi-
dimensional and cohesive across the organization’s departments, and finally, PMS should provide data for monitoring past
performance and planning future performance.
Performance Measurement Systems in Quick Service Restaurant Chains
JEFMS, Volume 3 Issue 01 Jan. 2020 www.ijefm.co.in Page 3
Balanced Scorecard (BSC)
BSC defined as a strategic planning and management system that used by organizations to communicate what they are
attempting to achieve (Wu, 2013). BSC is the most known, important, and widely PMS used 20th century management theory
that produced to overcomes the weakness of traditional frameworks, BSC also considered the most applicable framework that
used by restaurants (James, 2009). BSC integrates financial and non-financial KPIs in one framework (Thananchayana and
Gooneratne, 2018). BSC does not only review present performance, but also find data related to the application of the
organization in the future (Sorooshianet al., 2016). According to Thananchayana and Gooneratne (2018)
BSC offers managers the ability to monitor results in four dimensions, providing them with answers to four questions these are:
how do customers see us? (e.g. quality, and service measures), what must we excel at? (e.g. operational excellence measures,
quality, productivity), can we continue to improve and create value? (e.g. employee turnover), and how do we look to
shareholders? (e.g. net profit growth).
Integrated Performance Measurement System IPMS
Integrated refer to the development of a cohesive set of KPIs which support business objectives (Alfaro et al., 2007). There are
two considerations concerning to the structure of the IPMS: integrity of the system and deployment. Integrity can be described
as the ability of PMS to enhance cohesion between different areas of the business. Deployment describes the ability to organize
business goals and policies throughout an organization by using consistent KPIs (Bititciet al., 2016). The IPMS model is made up
of four stages: - corporate, business units, processes and activities, at each level 5 key factors are considered, these are: -
stakeholders, control criteria, external measures, improvement goals and internal measures (Harihayatiet al., 2018). The
reference model emphasizes the development, transition and attenuation of performance goals between these stages (Bititciet
al., 2016).
Performance Measurement Questionnaire (PMQ)
PMQ aims to provide a tool for organizations to express its development needs, evaluate the current set of KPIs to identify any
improvements, , and set an agenda for enhancing KPIs in order to support improvements (Harihayati et al., 2018). The PMQ
helps the organization to classify areas for development, to decide the effectiveness of current KPIs and to improve the
performance measures, PMQ included four parts, these are:- gathers data about the company and the respondent,
rate the value of business areas that need to be strengthened relative to the efficacy of current performance measures, perform
ance indicators and the final part invite respondents to recommend performance measures that better assess their own perform
ance (Jayant, 2017).
The SMART Pyramid
The strategic measurement analysis and reporting technique (SMART) pyramid also known as performance pyramid, the primary
goal of the performance pyramid is to communicate with operations through the organization’s strategy by translating KPIs from
the bottom up and goals from the top down (Sorooshianet al., 2016). This model builds of four stages, first stage is an
explanation of the business vision, second stage reveals short-term goals of cash flow and profitability and long-term goals of
growth and market position, the third stage is operating systems which contain customer service, flexibility and efficiency, the
final stage is the business unit which includes KPIs i.e. cycle time, quality, delivery, and waste (Watts and McNair-Connolly,
2012). The SMART pyramid is a holistic model that tests the satisfaction of stakeholder (Striteska and Spickova, 2012).
Performance Measurement Matrix PMM
PMM assumed that KPIs must be extracted from strategy and converted downwards via an organization; these KPIs need to be
followed by specific functional measures that can be developed throughout the process (Keegan et al., 1989). The strength of
the performance measurement matrix lies in the way it seeks to integrate various classes of internal and external business
performance, and cost and non-cost (Khan and Shah, 2011).
Result and Determinants Framework (RDF)
RDF was developed for service industries, it’s a adapted system of the performance measurement matrix to address the matrix
criticism that is not as well packaged as the BSC and does not clearly connect the various aspects of business performance,
which is one of the greatest strengths of Kaplan and Norton's balanced scorecard (Ivankovičel al. 2010). The framework classifies
measures into two categories as mentioned by (Dewangan and Godse, 2014):
1. Results: - (Financial performance e.g. profitability - Competitiveness performance e.g. market share)
2. Determinants: - (Use of resource e.g. productivity - service Quality e.g. kindliness, comfort - Innovation e.g.
Performance of the innovation process - Flexibility e.g. specifications or volume flexibility).
Performance Measurement Systems in Quick Service Restaurant Chains
JEFMS, Volume 3 Issue 01 Jan. 2020 www.ijefm.co.in Page 4
European Foundation for Quality Management (EFQM)
The EFQM model of excellence is a non- prescriptive framework that helps guide an organization’s success. According to Suárez
et al. (2017) the model is based on eight basic concepts of excellence: (Results orientation - Customer focus, leadership and
constancy of purpose - Management by processes and facts - People engagements- Continuous development - Innovation and
growth - Partnership development - Corporate social responsibility CSR)
Performance Prism (PP)
PP was developed based on the strengths of existing PMSs, PP focuses on value for shareholders (Neely et al., 2002). The PP
metrics serve four purposes: track strategies execution, communicate the strategies, encourage the implementation of strategy,
and finally make it possible to evaluate the effectiveness of strategies (Neely, 2008).
According to Striteska and Spickova (2012) The PP consists of five perspectives of performance that pose specific important
questions about:
1. Satisfaction of the stakeholder: who are the stakeholders and what do they want and need?
2. Strategies: the starting point must be to define stakeholders and their needs, and only then can strategies be
formulated to meet those requirements.
3. Processes: what processes do we need to set up to allow our strategies to be delivered? such processes are typically
cross-functional, and it is necessary to identify specific measures for each process.
4. Capabilities: this identifies the capabilities needed to operate the systems inside or outside the company. Measures
must be implemented to ensure the right skills are in place.
5. Stakeholder influence: this describes the commitment of stakeholders to the company. The company and its
stakeholders have mutual commitment that these need to be assessed.
Kanji’s Business Excellence Measurement System (KBEMS)
KBEMS consists of two parts, part one includes ten items (leadership, management by fact, process improvement, people-based
management, people performance, continuous improvement, continuous improvement culture, performance excellence,
customer satisfaction, and customer centricity,) and four items in part two (stakeholders satisfaction, organizational core values,
process quality, and performance excellence) (Kanji, 2008).
According to Wu (2013) KBEMS has the following characteristics:
The entire system is guided by the values of leadership and organization.
The evaluation process includes both internal and external stakeholders.
Promotes a balanced view of performance assessment.
It highlights communication issues and highlights the need for information sharing and collaboration between various
stakeholders.
It is value-based, long-term driven, and dynamic in nature.
4- PMS in the hospitality industry
Hotels and restaurants still resist using the non-financial KPIs and insist to measure its performance using only financial
measures which reflects their limit use of balanced approach that include financial and non-financial attitudes (Haktanir and
Harris, 2005; Wadongo et al., 2010). Kala and Bagri (2014) indicated that majority of managers track financial performance solely
and pay limited attention to non-financial performance (e.g. customer obsession, people, innovativeness, and process).
PMS provids managers with two functions: first, to promote and organize communication among all departments (i.e.
individuals, teams, processes, and functions); second, collecting and providing information on people's performance, behaviors,
processes, and products (Phillips and Louvieris, 2005). Traditional PMSs were mainly profit based, short-term, unbalanced,
unsatisfactory for competitive advantages, and past based (Lin and Lin, 2010). Therefore, the reliance on traditional KPIs is no
longer the most suitable tool due to the growing competition among QSR chains. Hence, there is a growing need for balanced
and integrated PMSs that consider financial and non-financial dimensions (Parizad, 2013). Limited research has been found
about PMSs in QSRs.
5- Key performance indicators for the hospitality industry
KPIs can be described as measures used to calculate an action’s efficiency and/or effectiveness (Shackleton, 2006). Kleijnen and
Smits (2003) arguing that KPIs are a series of metrics that focus on those dimensions of organizational performance that are the
most important to the organization's current and future success. KPIs should reflect performance reality and quality (Srivastava
Performance Measurement Systems in Quick Service Restaurant Chains
JEFMS, Volume 3 Issue 01 Jan. 2020 www.ijefm.co.in Page 5
and Maitra, 2016). KPIs can be either financial or non-financial, quantitative or qualitative, internal or external, and lagging or
leading as described by Rajnoha and Lesníková (2016), they added that KPIs should be linked to strategy.
The hospitality industry uses a series of standard KPIs to track and measure performance (Failte, 2013). The purpose of KPIs is
to provide decision makers in hospitality industry with data for judging their performance and for measuring the achieved
objectives (Lai and Choi, 2015). The development and use of KPIs should be the basis for the analysis of the current
performance of an organization, its future requirements and the improvement of strategies necessary for continued success
(Bergin-Seers and Jago 2007).
Critical KPI dimensions for hospitality performance measurement are employees, customers and finance (Komlósi and Gyurácz-
Németh, 2014). Previously, Zigan and Zeglat (2010) highlighted the main performance dimensions for hotels and restaurants
such as, competitiveness, service quality, and external environment. Organizational learning, innovation and creativity
performance dimensions are essential for any organization irrespective of their operating situation and industry segment (Tung
et al., 2011). As business priorities change, KPIs should also be changed, especially in restaurant industry there is variety of
products; however, quantitative indicators are most commonly used (Kosaret al., 2016). Srivastava and Maitra (2016)
concluded that organizations should establish KPI in reference to market forces and how the competition is carried out. This
means that an understanding of standards is essential to make KPI's valuable to the organization.
6- Barriers of PMS Implementation
The implementation of PMS as a tool for organizational development still presents many challenges. Several causes have been
detected, such as the absence of managers’ commitment to the PMS process, lack of recognition for outstanding performance,
lack of management support in terms of training, highly administrative management systems, and weak information system (De
Waal and Counet, 2009). Resistance to PM is seen as another challenge of PMS implementation, the resistance to any new PMS
may come from the lack of knowledge, training, and, personal risk fear (Karuhangaand Werner, 2013). In addition, Alboushraet
al. (2015) highlighted other obstacle facing PMS implementation, such as unclear strategy, lack of a PM culture, and the low
PMS priority.
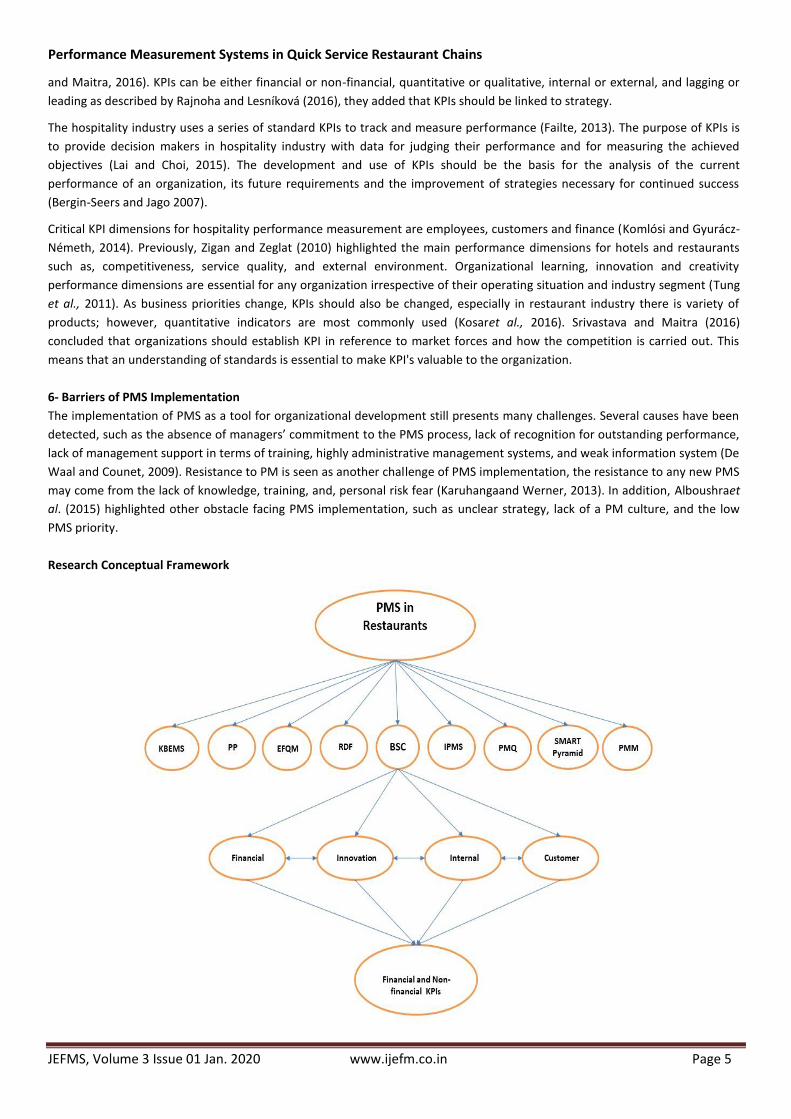
Research Conceptual Framework
Performance Measurement Systems in Quick Service Restaurant Chains
JEFMS, Volume 3 Issue 01 Jan. 2020 www.ijefm.co.in Page 6
Based upon the literature review on PMSs which has been discussed above i.e. KBEMS, PP, EFQM, RDF, BSC, IPMS, PMQ, SMART
Pyramid, PMM.
The most applicable framework to be used in restaurants is BSC (James, 2009). Hence, BSC has considered as a major part of the
conceptual framework for current research (See Figure 1). BSC consists of four main aspects of a business to be measured:
customers, finance, learning and development, and internal processes. This research focuses on the financial and non-financial
KPIs of the QSRs.
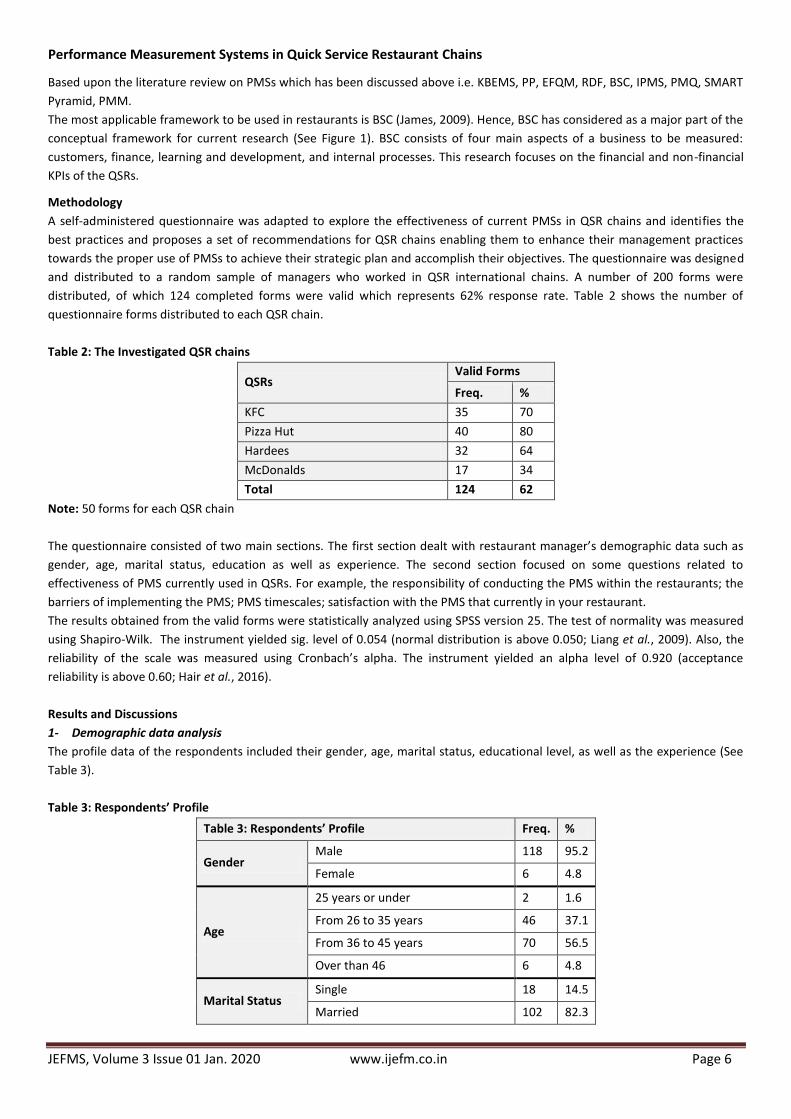
Methodology
A self-administered questionnaire was adapted to explore the effectiveness of current PMSs in QSR chains and identifies the
best practices and proposes a set of recommendations for QSR chains enabling them to enhance their management practices
towards the proper use of PMSs to achieve their strategic plan and accomplish their objectives. The questionnaire was designed
and distributed to a random sample of managers who worked in QSR international chains. A number of 200 forms were
distributed, of which 124 completed forms were valid which represents 62% response rate. Table 2 shows the number of
questionnaire forms distributed to each QSR chain.
Table 2: The Investigated QSR chains
QSRs Valid Forms
Freq. %
KFC 35 70
Pizza Hut 40 80
Hardees 32 64
McDonalds 17 34
Total 124 62
Note: 50 forms for each QSR chain
The questionnaire consisted of two main sections. The first section dealt with restaurant manager’s demographic data such as
gender, age, marital status, education as well as experience. The second section focused on some questions related to
effectiveness of PMS currently used in QSRs. For example, the responsibility of conducting the PMS within the restaurants; the
barriers of implementing the PMS; PMS timescales; satisfaction with the PMS that currently in your restaurant.
The results obtained from the valid forms were statistically analyzed using SPSS version 25. The test of normality was measured
using Shapiro-Wilk. The instrument yielded sig. level of 0.050 (normal distribution is above 0.050; Liang et al., 2009). Also, the
reliability of the scale was measured using Cronbach’s alpha. The instrument yielded an alpha level of 0.920 (acceptance
reliability is above 0.60; Hair et al., 2016).
Results and Discussions
1- Demographic data analysis
The profile data of the respondents included their gender, age, marital status, educational level, as well as the experience (See
Table 3).
Table 3: Respondents’ Profile
Table 3: Respondents’ Profile Freq. %
Gender Male 118 95.2
Female 6 4.8
Age
25 years or under 2 1.6
From 26 to 35 years 46 37.1
From 36 to 45 years 70 56.5
Over than 46 6 4.8
Marital Status Single 18 14.5
Married 102 82.3

Performance Measurement Systems in Quick Service Restaurant Chains
JEFMS, Volume 3 Issue 01 Jan. 2020 www.ijefm.co.in Page 7
Table 3: Respondents’ Profile Freq. %
Divorced 2 1.6
Other 2 1.6
Educational level
Secondary school 4 3.2
Institute Graduate 28 22.6
Bachelor’s degree or the equivalent 82 66.1
Postgraduate studies 10 8.1
Experience
Less than 5 2 1.6
From 6 to 10 years 24 19.4
From 11 to 15 years 44 35.5
From 16 to 20 years 36 29
Over than 21 18 14.5
Table 3 shows that 95.2% of the respondents were males and only 4.8% were females, which reflect that males prefer to work in
QSRs than females. This could be explained in terms of the fact that the work in such premises is noticeably hard as well as the
night shifts are not allowed for females.
In terms of age, 56.5% of respondents aged between 36 to 45 years, followed by 37.1% between 26 to 35 years, 4.8% over 45
years, and only, 1.6% at 25 years or under. This result reflects that restaurant managers are rational and experienced.
As for marital status, it was found that 32.8% of respondents were married, and, 14.5% were single. On the other hand, 1.6% of
respondents were divorced and 1.6% had others marital status. Moreover, it is noticed that 66.1% of the respondents were
university or high institute graduates, 22.6% were institute graduates, 8.1% were at the postgraduate level, and only 3.2% had
high school or diploma.
Concerning the experience, 35.5% of respondents had 11-15 years, 29.0% between 16 to 20 years, and 19.04% between 6-10
years. Respondents working more than 21 years have been noticed i.e., 14.5%, while a very small ratio i.e., 1.6% had an
experience less than 5 years. This reflects high employee retention rate and loyalty.
2- Existence of the performance measurement system
All the respondents i.e. 100% confirmed that the PMS is existing and applied in their organizations; this may because the
selected QSR chains were international chains. This is not surprisingly because any international QSRs in the highly current
competitive market should have its own PMS. The performance measurement system in organizations is an integral part of
managerial success by measuring key performance indicators and identifying the success of achieving the pre-determined goals.
The existence of a performance measurement system is an important indicator that leads to organization sustainability.
Measurement of organizations is more like a medical examination of the health of organizations. This result concurs with Mura
et al., (2019) who concluded that the performance measurement may increase the organizational performance.
3- The performance measurement model or tools used by QSRs.
The result shows that the BSC and the KPIs systems are widely used by QSR chains. The BSC system is used by 63.2% and the
KPIs system is used by 36.8%. Those were classified as systems that can be easily adapted to service organizations. It is obvious
from the literature review that service organizations need a tailored PMS that matches its rapid changes environment (Hudson
et al., 2001). This result is agreed with Dolasinskiet al. (2019) who stated that almost all service organizations may be using the
BSC.
4- Clarity of performance measurement system
Measurement system should be clear, concise, and easy to understand (Shackleton, 2006; Brazet al., 2011). Therefore, this
question was designed to illustrate the respondents’ opinions toward the clarity of PMS that currently used. The results showed
that 67.7% of managers confirmed that the PMS used is clear. On the other hand, 19.4% stated that the PMS was difficult to
understand, while 12.9% were neutral concerning the clarity of the PMS. It can be noticed from the previous findings that most
managers have been well trained on the PMS, also the top management support the PMS regarding to training. This finding
meshes with Kaplan and Norton (2007) who implied that PMS should focus on clarity and usefulness of its measures to evaluate
Performance Measurement Systems in Quick Service Restaurant Chains
JEFMS, Volume 3 Issue 01 Jan. 2020 www.ijefm.co.in Page 8
the organization effectiveness. Briefly, when the concept of measurement is unclear, measurement is unclear as well (Micheli
and Mari, 2014). Previously, Nanniet al. (1992) mentioned that PMS should provide KPIs that allow all employees to know how
they affect positively the overall business. Recently, Baird (2017) concluded that PMS must meet the needs of the operations
and should be easy to recognize and execute.
5- Aligning individual objectives with the organizational objectives.
The results showed that top management was not able to align individual objectives with organizational objectives (mean 3.27).
This meshes Bourne et al. (2003) who indicated that one of the most observed shortcomings of PMSs is lack of connection with
organization’s mission and strategy. In this essence, David and Jenson (2010) implied that PMS process should link strategy to
department, team and individual goals. In the hospitality industry, KPIs should provide employees with clear goals assigned with
an understanding of how they support the overall success of the organization (Srivastava and Maitra, 2016).
6- Responsibility of conducting the PMS within the restaurants.
The data obtained showed that 44.3% of the investigated managers confirmed that the operation department takes the
responsibility of conducting the PMS. On the other hands, 31.1% stated that the training and human resources department is
responsible for conducting the PMS. Moreover, 17.1% confirmed that the quality department is responsible for conducting the
PMS. However,, only 7.5% stated that a third party can conduct the PMS. In summary, the operation and training and human
resources departments within restaurants should be fully aware of the requirements of PMS to conduct and implement it
successfully.
7- PMS Timescales.
PMS process should follow timeframes (Hudson et al., 2001; Pun and White 2005). The results show that 51.6% of respondents
confirmed that the PMS is conducted twice a year, 01.9% four times a year, 6.5% once a year. This finding concurs with Stříteská
and Svoboda (2012) who implied that PMS may periodically measure and review the organizational performance. Moreover,
Kolibáčová (2015) stated that the evaluation of performance may be done quarterly. Therefore, QSRs should set and follow
timescales for PMS.
8- The overlap and integration between PMSs.
The data shows that 60.3% of respondents confirmed that there is integration between the PMSs applied in their restaurants.
On the other hand, 21.0% of them stated that there is no integration between the various PMSs, while 17.7% of the respondents
stated that the relationship between the PMSs may exist. This finding consents with Bititciet al. (2016) who indicated that the
integration of PMSs should exist, and therefore the relationships between various KPI are understood. Hence, QSRs should
ensure having a high degree of integration between various PMSs to produce successful results, i.e. the mystery shopper report
used in the BSC as a KPI for the customer dimension in the PMS system.
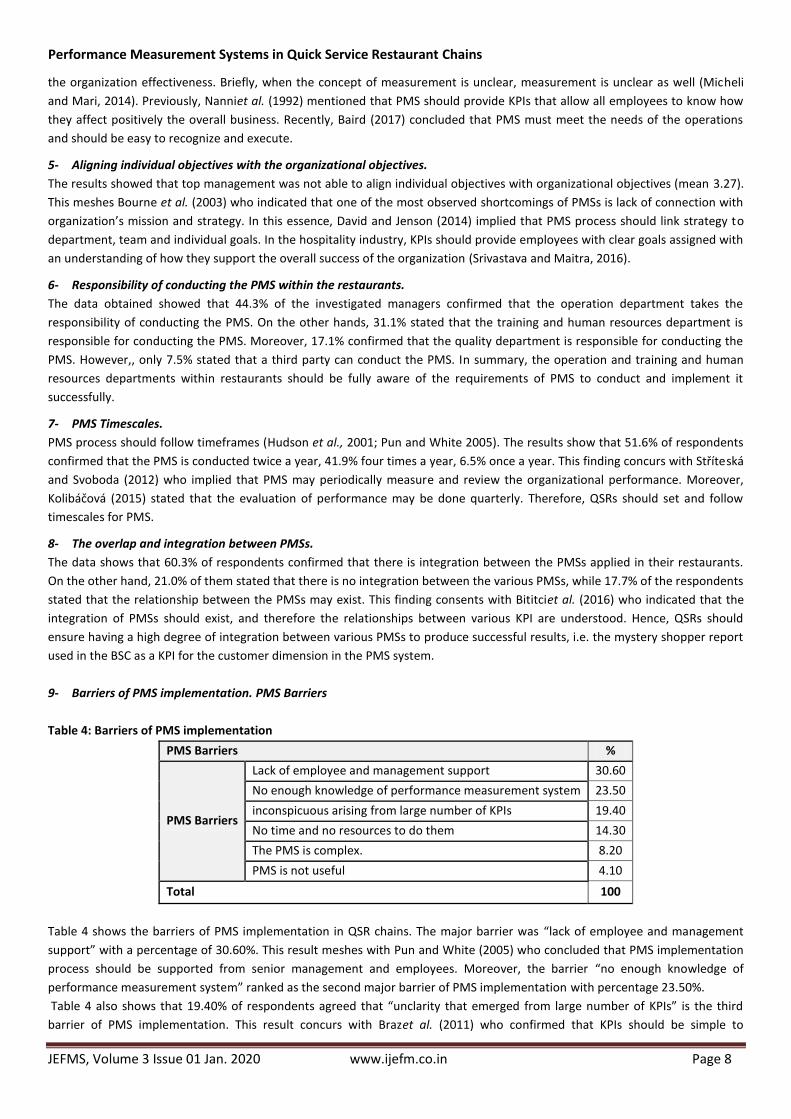
9- Barriers of PMS implementation. PMS Barriers
Table 4: Barriers of PMS implementation
PMS Barriers %
BarriersPMS
Lack of employee and management support 30.60
No enough knowledge of performance measurement system 23.50
inconspicuous arising from large number of KPIs 19.40
No time and no resources to do them 14.30
The PMS is complex. 8.20
PMS is not useful 4.10
Total 100
Table 4 shows the barriers of PMS implementation in QSR chains. The major barrier was “lack of employee and management
support” with a percentage of 30.60%. This result meshes with Pun and White (2005) who concluded that PMS implementation
process should be supported from senior management and employees. Moreover, the barrier “no enough knowledge of
performance measurement system” ranked as the second major barrier of PMS implementation with percentage 23.50%.
Table 0 also shows that 19.00% of respondents agreed that “unclarity that emerged from large number of KPIs” is the third
barrier of PMS implementation. This result concurs with Brazet al. (2011) who confirmed that KPIs should be simple to
Performance Measurement Systems in Quick Service Restaurant Chains
JEFMS, Volume 3 Issue 01 Jan. 2020 www.ijefm.co.in Page 9
understand. Hence, it is important to re-assess and discard the KPIs that not related to the business. Finally, it is necessary to
carefully select KPIs because of the variety of the hospitality products, and services.
The respondents ranked the barrier “no time and no resource to do the PMS” as the fourth barrier of PMS implementation with
a percentage of 14.30%. Hence, top management should support employees in terms of time and other resources needed to
implement the PMS. This barrier can be also avoided during the design stage of the PMS by making the system simple as much
as possible. Moreover, “performance measurement tools or models are complex” was found to be another PMS barrier that was
considered by 8.20% of respondents. This finding agrees with Srivastava and Maitra (2016) who implied that KPIs should be
designed to be as accurate as possible and easy to understand. Nevertheless, the minor barrier was “PMS is not useful” with a
percentage of 4.10%.
In conclusion, for a successful application of PMS, the management support is very important especially for the long-term
performance, PMS should be cascaded to all employees and should be clear, KPIs should be business related and to be designed
as accurate as possible and easy to understand.
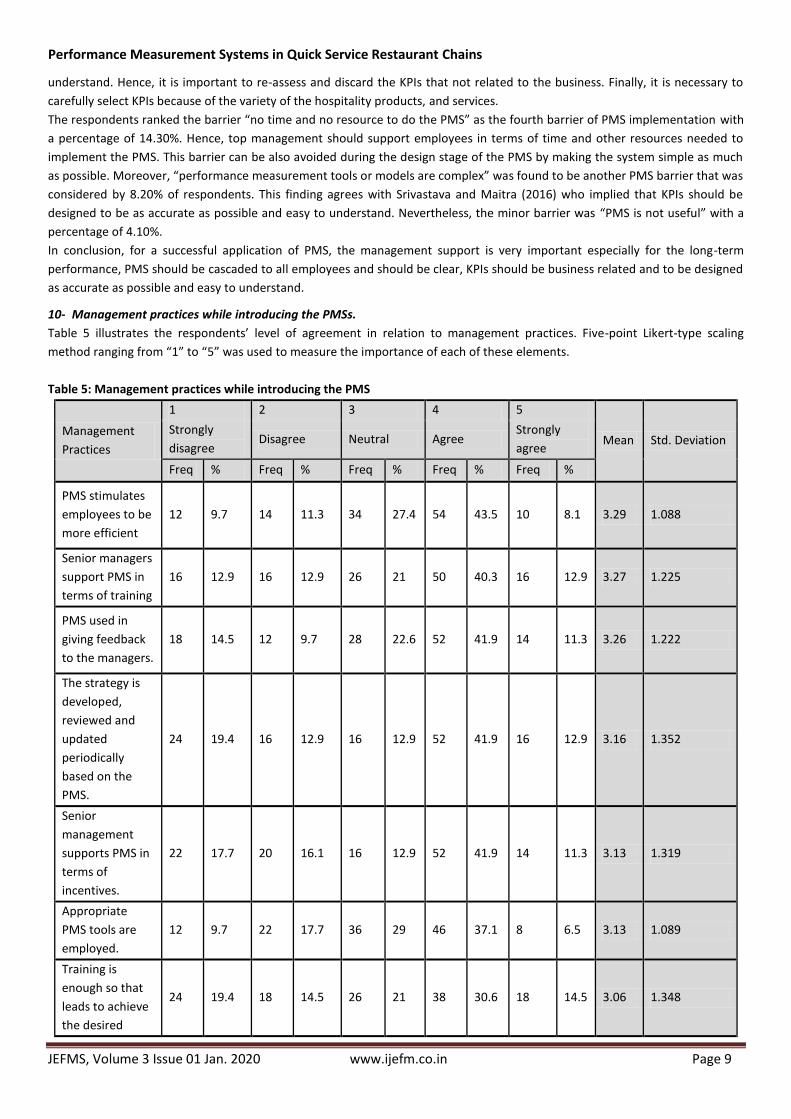
10- Management practices while introducing the PMSs.
Table 5 illustrates the respondents’ level of agreement in relation to management practices. Five-point Likert-type scaling
method ranging from “1” to “5” was used to measure the importance of each of these elements.
Table 5: Management practices while introducing the PMS
Management
Practices
1 2 3 4 5
Mean Std. Deviation Strongly
disagree Disagree Neutral Agree
Strongly
agree
Freq % Freq % Freq % Freq % Freq %
PMS stimulates
employees to be
more efficient
12 9.7 14 11.3 34 27.4 54 43.5 10 8.1 3.29 1.088
Senior managers
support PMS in
terms of training
16 12.9 16 12.9 26 21 50 40.3 16 12.9 3.27 1.225
PMS used in
giving feedback
to the managers.
18 14.5 12 9.7 28 22.6 52 41.9 14 11.3 3.26 1.222
The strategy is
developed,
reviewed and
updated
periodically
based on the
PMS.
24 19.4 16 12.9 16 12.9 52 41.9 16 12.9 3.16 1.352
Senior
management
supports PMS in
terms of
incentives.
22 17.7 20 16.1 16 12.9 52 41.9 14 11.3 3.13 1.319
Appropriate
PMS tools are
employed.
12 9.7 22 17.7 36 29 46 37.1 8 6.5 3.13 1.089
Training is
enough so that
leads to achieve
the desired
24 19.4 18 14.5 26 21 38 30.6 18 14.5 3.06 1.348
Performance Measurement Systems in Quick Service Restaurant Chains
JEFMS, Volume 3 Issue 01 Jan. 2020 www.ijefm.co.in Page 10
result from the
PMS.
Restaurants
managers are
involved in
selecting KPIs.
28 22.6 26 21 18 14.5 30 24.2 22 17.7 2.94 1.441
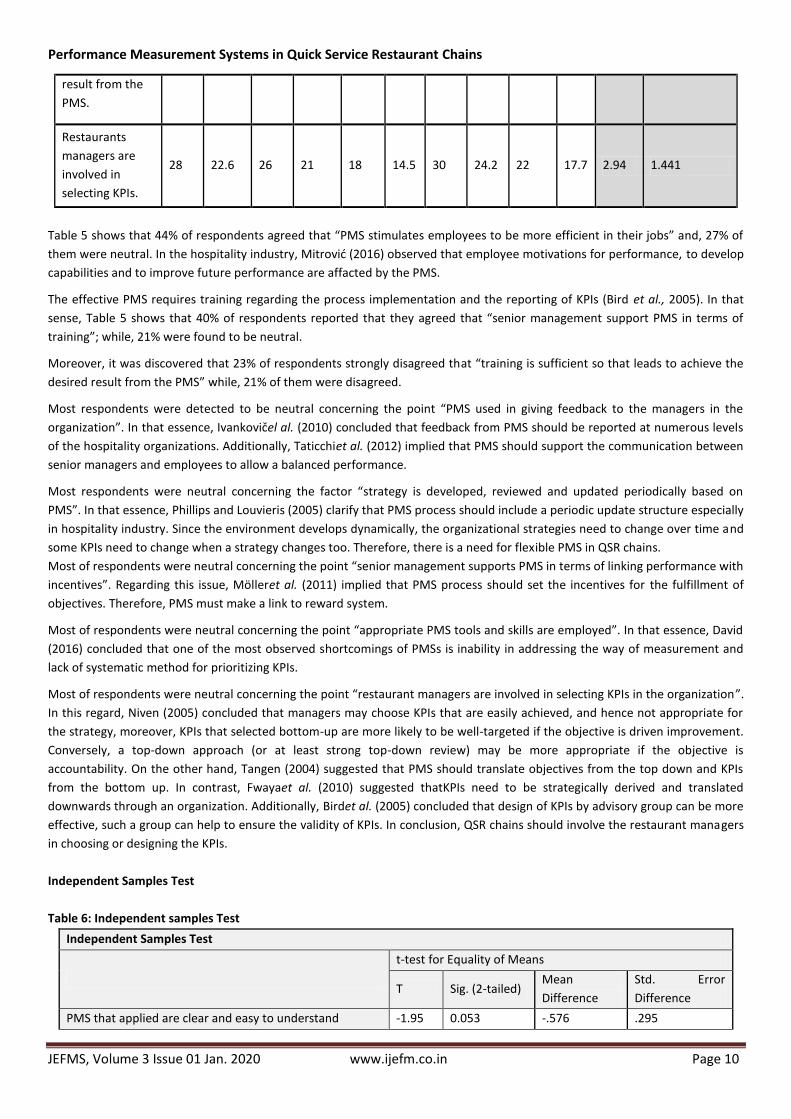
Table 5 shows that 00% of respondents agreed that “PMS stimulates employees to be more efficient in their jobs” and, 27% of
them were neutral. In the hospitality industry, Mitrović (2016) observed that employee motivations for performance, to develop
capabilities and to improve future performance are affacted by the PMS.
The effective PMS requires training regarding the process implementation and the reporting of KPIs (Bird et al., 2005). In that
sense, Table 5 shows that 00% of respondents reported that they agreed that “senior management support PMS in terms of
training”; while, 21% were found to be neutral.
Moreover, it was discovered that 23% of respondents strongly disagreed that “training is sufficient so that leads to achieve the
desired result from the PMS” while, 21% of them were disagreed.
Most respondents were detected to be neutral concerning the point “PMS used in giving feedback to the managers in the
organization”. In that essence, Ivankovičel al. (2010) concluded that feedback from PMS should be reported at numerous levels
of the hospitality organizations. Additionally, Taticchiet al. (2012) implied that PMS should support the communication between
senior managers and employees to allow a balanced performance.
Most respondents were neutral concerning the factor “strategy is developed, reviewed and updated periodically based on
PMS”. In that essence, Phillips and Louvieris (2005) clarify that PMS process should include a periodic update structure especially
in hospitality industry. Since the environment develops dynamically, the organizational strategies need to change over time and
some KPIs need to change when a strategy changes too. Therefore, there is a need for flexible PMS in QSR chains.
Most of respondents were neutral concerning the point “senior management supports PMS in terms of linking performance with
incentives”. Regarding this issue, Mölleret al. (2011) implied that PMS process should set the incentives for the fulfillment of
objectives. Therefore, PMS must make a link to reward system.
Most of respondents were neutral concerning the point “appropriate PMS tools and skills are employed”. In that essence, David
(2016) concluded that one of the most observed shortcomings of PMSs is inability in addressing the way of measurement and
lack of systematic method for prioritizing KPIs.
Most of respondents were neutral concerning the point “restaurant managers are involved in selecting KPIs in the organization”.
In this regard, Niven (2005) concluded that managers may choose KPIs that are easily achieved, and hence not appropriate for
the strategy, moreover, KPIs that selected bottom-up are more likely to be well-targeted if the objective is driven improvement.
Conversely, a top-down approach (or at least strong top-down review) may be more appropriate if the objective is
accountability. On the other hand, Tangen (2004) suggested that PMS should translate objectives from the top down and KPIs
from the bottom up. In contrast, Fwayaet al. (2010) suggested thatKPIs need to be strategically derived and translated
downwards through an organization. Additionally, Birdet al. (2005) concluded that design of KPIs by advisory group can be more
effective, such a group can help to ensure the validity of KPIs. In conclusion, QSR chains should involve the restaurant managers
in choosing or designing the KPIs.
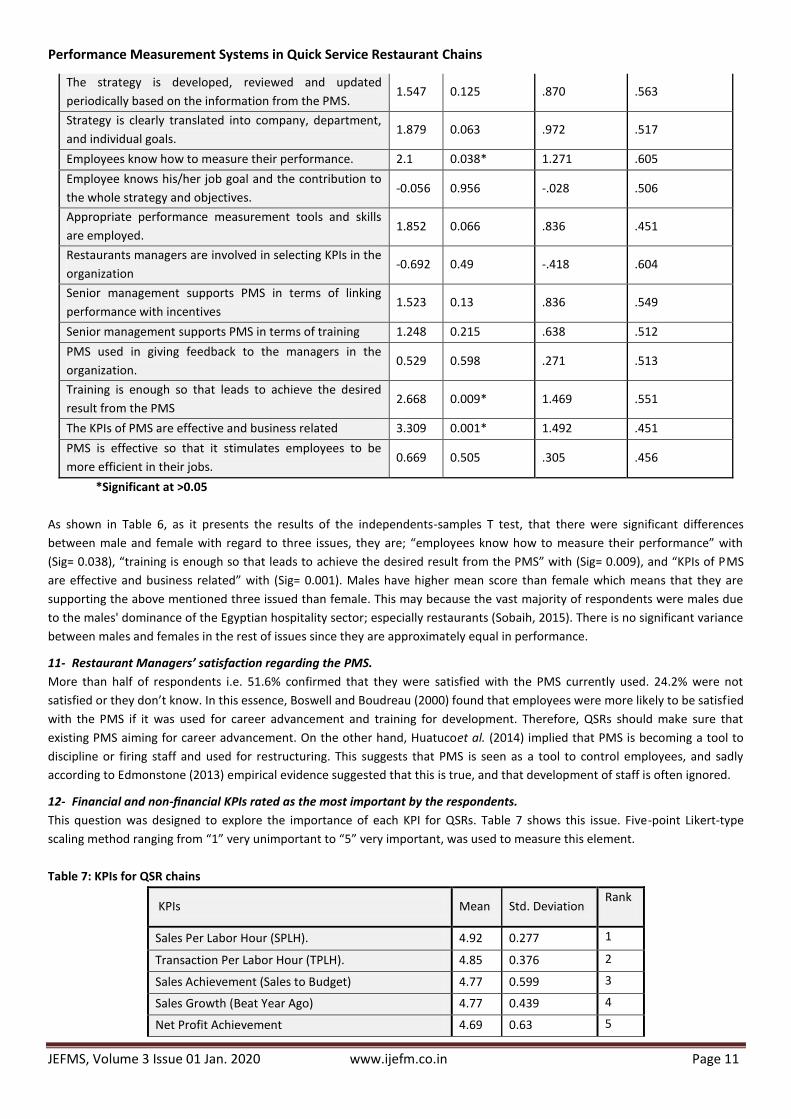
Independent Samples Test
Table 6: Independent samples Test
Independent Samples Test
t-test for Equality of Means
T Sig. (2-tailed) Mean
Difference
Std. Error
Difference
PMS that applied are clear and easy to understand -1.95 0.053 -.576 .295
Performance Measurement Systems in Quick Service Restaurant Chains
JEFMS, Volume 3 Issue 01 Jan. 2020 www.ijefm.co.in Page 11
The strategy is developed, reviewed and updated
periodically based on the information from the PMS. 1.547 0.125 .870 .563
Strategy is clearly translated into company, department,
and individual goals. 1.879 0.063 .972 .517
Employees know how to measure their performance. 2.1 0.038* 1.271 .605
Employee knows his/her job goal and the contribution to
the whole strategy and objectives. -0.056 0.956 -.028 .506
Appropriate performance measurement tools and skills
are employed. 1.852 0.066 .836 .451
Restaurants managers are involved in selecting KPIs in the
organization -0.692 0.49 -.418 .604
Senior management supports PMS in terms of linking
performance with incentives 1.523 0.13 .836 .549
Senior management supports PMS in terms of training 1.248 0.215 .638 .512
PMS used in giving feedback to the managers in the
organization. 0.529 0.598 .271 .513
Training is enough so that leads to achieve the desired
result from the PMS 2.668 0.009* 1.469 .551
The KPIs of PMS are effective and business related 3.309 0.001* 1.492 .451
PMS is effective so that it stimulates employees to be
more efficient in their jobs. 0.669 0.505 .305 .456
*Significant at >0.05
As shown in Table 6, as it presents the results of the independents-samples T test, that there were significant differences
between male and female with regard to three issues, they are; “employees know how to measure their performance” with
(Sig= 0.083), “training is enough so that leads to achieve the desired result from the PMS” with (Sig= 0.009), and “KPIs of PMS
are effective and business related” with (Sig= 0.001). Males have higher mean score than female which means that they are
supporting the above mentioned three issued than female. This may because the vast majority of respondents were males due
to the males' dominance of the Egyptian hospitality sector; especially restaurants (Sobaih, 2015). There is no significant variance
between males and females in the rest of issues since they are approximately equal in performance.
11- Restaurant Managers’ satisfaction regarding the PMS.
More than half of respondents i.e. 51.6% confirmed that they were satisfied with the PMS currently used. 24.2% were not
satisfied or they don’t know. In this essence, Boswell and Boudreau (2000) found that employees were more likely to be satisfied
with the PMS if it was used for career advancement and training for development. Therefore, QSRs should make sure that
existing PMS aiming for career advancement. On the other hand, Huatucoet al. (2014) implied that PMS is becoming a tool to
discipline or firing staff and used for restructuring. This suggests that PMS is seen as a tool to control employees, and sadly
according to Edmonstone (2013) empirical evidence suggested that this is true, and that development of staff is often ignored.
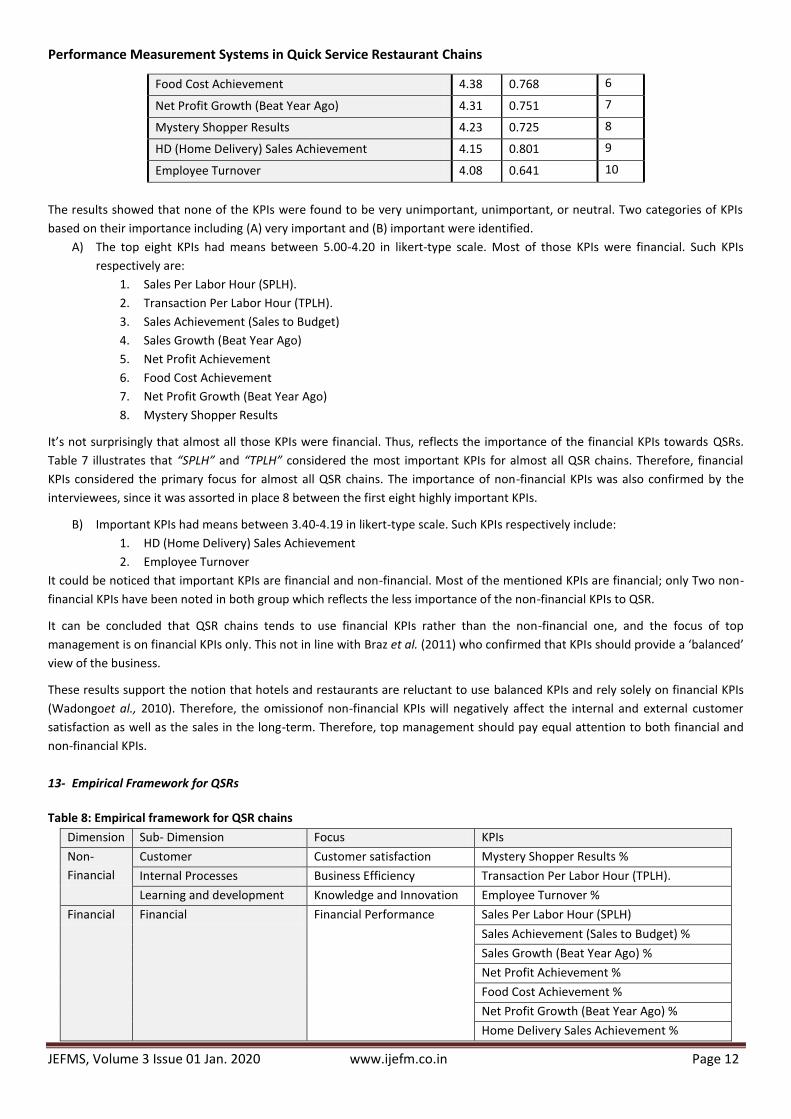
12- Financial and non-financial KPIs rated as the most important by the respondents.
This question was designed to explore the importance of each KPI for QSRs. Table 7 shows this issue. Five-point Likert-type
scaling method ranging from “1” very unimportant to “5” very important, was used to measure this element.
Table 7: KPIs for QSR chains
KPIs Mean Std. Deviation Rank
Sales Per Labor Hour (SPLH). 4.92 0.277 1
Transaction Per Labor Hour (TPLH). 4.85 0.376 2
Sales Achievement (Sales to Budget) 4.77 0.599 3
Sales Growth (Beat Year Ago) 4.77 0.439 4
Net Profit Achievement 4.69 0.63 5
Performance Measurement Systems in Quick Service Restaurant Chains
JEFMS, Volume 3 Issue 01 Jan. 2020 www.ijefm.co.in Page 12
Food Cost Achievement 4.38 0.768 6
Net Profit Growth (Beat Year Ago) 4.31 0.751 7
Mystery Shopper Results 4.23 0.725 8
HD (Home Delivery) Sales Achievement 4.15 0.801 9
Employee Turnover 4.08 0.641 10
The results showed that none of the KPIs were found to be very unimportant, unimportant, or neutral. Two categories of KPIs
based on their importance including (A) very important and (B) important were identified.
A) The top eight KPIs had means between 5.00-4.20 in likert-type scale. Most of those KPIs were financial. Such KPIs
respectively are:
1. Sales Per Labor Hour (SPLH).
2. Transaction Per Labor Hour (TPLH).
3. Sales Achievement (Sales to Budget)
4. Sales Growth (Beat Year Ago)
5. Net Profit Achievement
6. Food Cost Achievement
7. Net Profit Growth (Beat Year Ago)
8. Mystery Shopper Results
It’s not surprisingly that almost all those KPIs were financial. Thus, reflects the importance of the financial KPIs towards QSRs.
Table 7 illustrates that “SPLH” and “TPLH” considered the most important KPIs for almost all QSR chains. Therefore, financial
KPIs considered the primary focus for almost all QSR chains. The importance of non-financial KPIs was also confirmed by the
interviewees, since it was assorted in place 8 between the first eight highly important KPIs.
B) Important KPIs had means between 3.40-4.19 in likert-type scale. Such KPIs respectively include:
1. HD (Home Delivery) Sales Achievement
2. Employee Turnover
It could be noticed that important KPIs are financial and non-financial. Most of the mentioned KPIs are financial; only Two non-
financial KPIs have been noted in both group which reflects the less importance of the non-financial KPIs to QSR.
It can be concluded that QSR chains tends to use financial KPIs rather than the non-financial one, and the focus of top
management is on financial KPIs only. This not in line with Braz et al. (2011) who confirmed that KPIs should provide a ‘balanced’
view of the business.
These results support the notion that hotels and restaurants are reluctant to use balanced KPIs and rely solely on financial KPIs
(Wadongoet al., 2010). Therefore, the omissionof non-financial KPIs will negatively affect the internal and external customer
satisfaction as well as the sales in the long-term. Therefore, top management should pay equal attention to both financial and
non-financial KPIs.
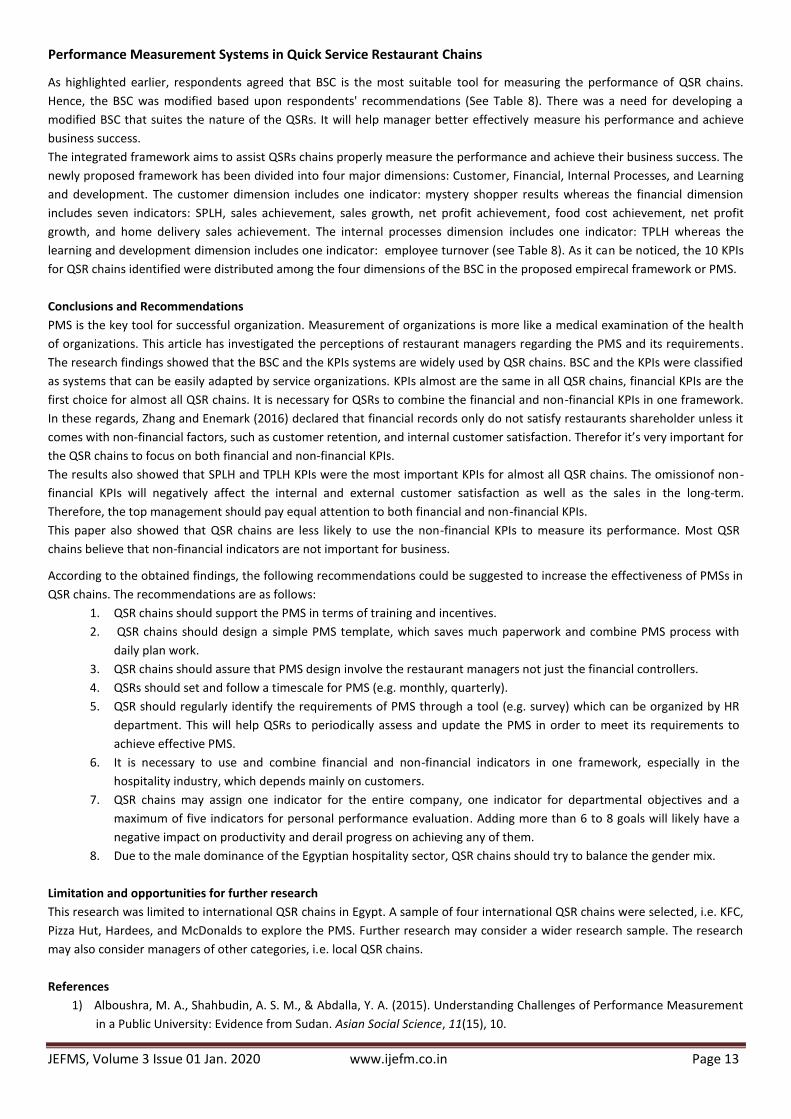
13- Empirical Framework for QSRs
Table 8: Empirical framework for QSR chains
Dimension Sub- Dimension Focus KPIs
Non-
Financial
Customer Customer satisfaction Mystery Shopper Results %
Internal Processes Business Efficiency Transaction Per Labor Hour (TPLH).
Learning and development Knowledge and Innovation Employee Turnover %
Financial Financial Financial Performance Sales Per Labor Hour (SPLH)
Sales Achievement (Sales to Budget) %
Sales Growth (Beat Year Ago) %
Net Profit Achievement %
Food Cost Achievement %
Net Profit Growth (Beat Year Ago) %
Home Delivery Sales Achievement %
Performance Measurement Systems in Quick Service Restaurant Chains
JEFMS, Volume 3 Issue 01 Jan. 2020 www.ijefm.co.in Page 13
As highlighted earlier, respondents agreed that BSC is the most suitable tool for measuring the performance of QSR chains.
Hence, the BSC was modified based upon respondents' recommendations (See Table 8). There was a need for developing a
modified BSC that suites the nature of the QSRs. It will help manager better effectively measure his performance and achieve
business success.
The integrated framework aims to assist QSRs chains properly measure the performance and achieve their business success. The
newly proposed framework has been divided into four major dimensions: Customer, Financial, Internal Processes, and Learning
and development. The customer dimension includes one indicator: mystery shopper results whereas the financial dimension
includes seven indicators: SPLH, sales achievement, sales growth, net profit achievement, food cost achievement, net profit
growth, and home delivery sales achievement. The internal processes dimension includes one indicator: TPLH whereas the
learning and development dimension includes one indicator: employee turnover (see Table 8). As it can be noticed, the 10 KPIs
for QSR chains identified were distributed among the four dimensions of the BSC in the proposed empirecal framework or PMS.
Conclusions and Recommendations
PMS is the key tool for successful organization. Measurement of organizations is more like a medical examination of the health
of organizations. This article has investigated the perceptions of restaurant managers regarding the PMS and its requirements.
The research findings showed that the BSC and the KPIs systems are widely used by QSR chains. BSC and the KPIs were classified
as systems that can be easily adapted by service organizations. KPIs almost are the same in all QSR chains, financial KPIs are the
first choice for almost all QSR chains. It is necessary for QSRs to combine the financial and non-financial KPIs in one framework.
In these regards, Zhang and Enemark (2016) declared that financial records only do not satisfy restaurants shareholder unless it
comes with non-financial factors, such as customer retention, and internal customer satisfaction. Therefor it’s very important for
the QSR chains to focus on both financial and non-financial KPIs.
The results also showed that SPLH and TPLH KPIs were the most important KPIs for almost all QSR chains. The omissionof non-
financial KPIs will negatively affect the internal and external customer satisfaction as well as the sales in the long-term.
Therefore, the top management should pay equal attention to both financial and non-financial KPIs.
This paper also showed that QSR chains are less likely to use the non-financial KPIs to measure its performance. Most QSR
chains believe that non-financial indicators are not important for business.
According to the obtained findings, the following recommendations could be suggested to increase the effectiveness of PMSs in
QSR chains. The recommendations are as follows:
1. QSR chains should support the PMS in terms of training and incentives.
2. QSR chains should design a simple PMS template, which saves much paperwork and combine PMS process with
daily plan work.
3. QSR chains should assure that PMS design involve the restaurant managers not just the financial controllers.
4. QSRs should set and follow a timescale for PMS (e.g. monthly, quarterly).
5. QSR should regularly identify the requirements of PMS through a tool (e.g. survey) which can be organized by HR
department. This will help QSRs to periodically assess and update the PMS in order to meet its requirements to
achieve effective PMS.
6. It is necessary to use and combine financial and non-financial indicators in one framework, especially in the
hospitality industry, which depends mainly on customers.
7. QSR chains may assign one indicator for the entire company, one indicator for departmental objectives and a
maximum of five indicators for personal performance evaluation. Adding more than 6 to 8 goals will likely have a
negative impact on productivity and derail progress on achieving any of them.
8. Due to the male dominance of the Egyptian hospitality sector, QSR chains should try to balance the gender mix.
Limitation and opportunities for further research
This research was limited to international QSR chains in Egypt. A sample of four international QSR chains were selected, i.e. KFC,
Pizza Hut, Hardees, and McDonalds to explore the PMS. Further research may consider a wider research sample. The research
may also consider managers of other categories, i.e. local QSR chains.
References
1) Alboushra, M. A., Shahbudin, A. S. M., & Abdalla, Y. A. (2015). Understanding Challenges of Performance Measurement
in a Public University: Evidence from Sudan. Asian Social Science, 11(15), 10.

Performance Measurement Systems in Quick Service Restaurant Chains
JEFMS, Volume 3 Issue 01 Jan. 2020 www.ijefm.co.in Page 14
2) Alfaro, J., Ortiz, A., &Poler, R. (2007). Performance measurement system for business processes. Production Planning
and Control, 18(8), 641-654.
3) Al-Saad, E. (2016). Causes and effects of fast food. Biomed J Sci Tech Res, 5, 279-80.
4) Arena, M., &Arnaboldi, M. (2014). Risk and performance management: are they easy partners?. Management Research
Review, 37(2), 152-166.
5) Ashakiran, D. R., & Deepthi, R. (2012). Fast foods and their impact on health. JKIMSU, 1(2), 7-15.
6) Baird, K. (2017). The effectiveness of strategic performance measurement systems. International journal of productivity
and performance management, 66(1), 3-21.
7) Bergin-Seers, S., &Jago, L. (2007). Performance Measurement in Small Motels in Australia:(Funded by the Sustainable
Tourism Co-operative Research Centre). Tourism and hospitality Research, 7(2), 144-155.
8) Bird, S. M., Sir David, C., Farewell, V. T., Tim, H., & Peter C, S. (2005). Performance indicators: good, bad, and
ugly. Journal of the Royal Statistical Society: Series A (Statistics in Society), 168(1), 1-27.
9) Bititci, U., Cocca, P., &Ates, A. (2016). Impact of visual performance management systems on the performance
management practices of organisations. International Journal of Production Research, 54(6), 1571-1593.
10) Boswell, W. R., & Boudreau, J. W. (2000). Employee satisfaction with performance appraisals and appraisers: The role of
perceived appraisal use. Human Resource Development Quarterly, 11(3), 283-299.
11) Bourne, M., Neely, A., Mills, J., & Platts, K. (2003). Implementing performance measurement systems: a literature
review. International Journal of Business Performance Management, 5(1), 1-24.
12) Braz, R. G. F., Scavarda, L. F., & Martins, R. A. (2011). Reviewing and improving performance measurement systems: An
action research. International Journal of Production Economics, 133(2), 751-760.
13) Carlyle, P. E. (2013). Business performance measurement use in a small-to-medium enterprise: a case study: a thesis
presented in partial fulfillment of the requirements for the degree of Doctor of Business and Administration at Massey
University, New Zealand (Doctoral dissertation, Massey University).
14) David, P. (2016). Key Performance Indicators (KPI)-Developing, Implementing, and Using Winning KPIs.
15) David, R., & Jenson Joseph, E. (2014). Study on performance measurement systems–Measures and
Metrics. International Journal of Scientific and Research Publications, 577.
16) De Waal, A. A., & Counet, H. (2009). Lessons learned from performance management systems
implementations. International Journal of Productivity and Performance Management, 58(4), 367-390.
17) Dewangan, V., & Godse, M. (2014). Towards a holistic enterprise innovation performance measurement
system. Technovation, 34(9), 536-545.
18) Dolasinski, M. J., Roberts, C., & Zheng, T. (2019). Measuring hotel channel mix: A Dea-BSC model. Journal of Hospitality
& Tourism Research, 43(2), 188-209.
19) Donthi, V., & Madhav, K. K. (2019). A Study of Consumers Perception about Quick Service Restaurants. ITIHAS-The
Journal of Indian Management, 9(1).
20) Edmonstone, J. (2013). Healthcare leadership: learning from evaluation. Leadership in Health Services, 26(2), 148-158.
21) Failte. (2013, October 29). Key Performance Indicators. Ireland
22) Fwaya, E. O., Edwin, O., Ouma, K. O., & Lucas, O. O. (2010). Performance Measurement and Hotel Industry in Kenya-A
Review. International Journal of Hospitality and Tourism Systems, 3(1).
23) Hair Jr, J. F., Hult, G. T. M., Ringle, C., &Sarstedt, M. (2016). A primer on partial least squares structural equation
modeling (PLS-SEM). Sage publications.
24) Haktanir, M., & Harris, P. (2005). Performance measurement practice in an independent hotel context: A case study
approach. International Journal of Contemporary Hospitality Management, 17(1), 39-50.
25) Harihayati, T., Lubis, R., Atin, S., &Widianti, U. D. (2013, August). The company’s performance assessment using
balanced scorecard. In IOP Conference Series: Materials Science and Engineering (Vol. 407, No. 1, p. 012067). IOP
Publishing.
26) Huatuco, L. D. H., Moxham, C., Burt, E., & Al-Tabbaa, O. (2014). Understanding third sector performance measurement
system design: a literature review. International Journal of Productivity and Performance Management.
27) Hudson, M., Smart, A., & Bourne, M. (2001). Theory and practice in SME performance measurement
systems. International journal of operations & production management, 21(8), 1096-1115.
28) Ivankovič, G., Jankovič, S., &Peršič, S. (2010). Framework for performance measurement in hospitality industry–case
study Slovenia. Economic research-Ekonomskaistraživanja, 23(3), 12-23.
Performance Measurement Systems in Quick Service Restaurant Chains
JEFMS, Volume 3 Issue 01 Jan. 2020 www.ijefm.co.in Page 15
29) James, A. M. (2009). Measuring Performance in the Hospitality Industry: An evaluation of the Balanced Scorecard
approach in the UK’s Licensed Retail Sector (Doctoral dissertation, University of Huddersfield).
30) Jamil, C. Z. M., & Mohamed, R. (2013). The effect of management control system on performance measurement system
at small medium hotel in Malaysia. International Journal of Trade, Economics and Finance, 4(4), 202.
31) Jayant, Dr. Arvind. (2017). Development of performance measurement framework for SMEs. International Journal of
Advanced in Management, Technology and Engineering Sciences. 7. 304-313.
32) Kala, D., & Bagri, S. C. (2014). Key performance indicators for hospitality industry: a study from the tourist state of
Uttarakhandm, Indian. Tourismos: an International Multidisciplinaray Journal of Tourism, 9(1), 187-206.
33) Kanji, G. K. (2008). Architecture of business excellence in the public and service sectors. Total Quality
Management, 19(4), 399-415.
34) Kaplan, R. S., & Norton, D. P. (1996). Using the balanced scorecard as a strategic management system.
35) Kaplan, R. S., & Norton, D. P. (2007). Balanced scorecard. In Das Summa Summarum des Management (pp. 137-148).
Gabler.
36) Karuhanga, B., & Werner, A. (2013). Challenges impacting performance management implementation in public
universities: A case of Uganda. African Journal of Economic and Management Studies, 4(2), 223-243.
37) Keegan, D. P., Eiler, R. G., & Jones, C. R. (1989). Are your performance measures obsolete?. Strategic Finance, 70(12),
45.
38) Khan, K., & Shah, A. (2011). Understanding performance measurement through the literature. African Journal of
Business Management, 5(35), 13410-13418.
39) Khatoon, S., & Farooq, A. (2014). Organizational change: a case based study. International Journal of Research in Social
Sciences, 4(4), 675.
40) Kleijnen, J. P., & Smits, M. T. (2003). Performance metrics in supply chain management. Journal of the operational
research society, 54(5), 507-514.
41) Kolibáčová, G. (2015). The relationship between competency and performance. Acta Universitatis Agriculturae et
SilviculturaeMendelianaeBrunensis, 62(6), 1315-1327.
42) Komlósi, E., &Gyurácz-Németh, P. (2014). Standardised and customised key performance indicators and critical success
factors in Hungarian hotels. Tourismos, 9(1).
43) Kosar, L., Rašeta, S. &Kosar, N. (2016). Key performance indicators in the hotel industry. 192-198. 10.15308/Sitcon-
2016-192-198.
44) Lai, J. H., & Choi, E. C. (2015). Performance measurement for teaching hotels: a hierarchical system incorporating
facilities management. Journal of Hospitality, Leisure, Sport & Tourism Education, 16, 48-58.
45) Liang, J., Tang, M. L., & Chan, P. S. (2009). A generalized Shapiro–Wilk W statistic for testing high-dimensional
normality. Computational Statistics & Data Analysis, 53(11), 3883-3891.
46) Lin, S. Y., & Lin, H. L. (2010). Organizational performance measurement system and international tourist hotels: a new
conceptual framework. Journal of Testing and Evaluation, 39(2), 269-277.
47) Lisiecka, K., &Czyż-Gwiazda, E. (2013). Performance Measurement Models–Comparative Review. In 57th EOQ Congress:
Quality Renaissance-Co-creating a Viable Future, Tallinn, Estonia.
48) Mason, K., Jones, S., Benefield, M., & Walton, J. (2013). Quick service restaurant success factors. J Int Bus Econ, 13(4),
109
49) Meyer, M. W. (2003). Rethinking performance measurement: Beyond the balanced scorecard. Cambridge University
Press.
50) Micheli, P., & Mari, L. (2014). The theory and practice of performance measurement. Management accounting
research, 25(2), 147-156.
51) Mitrović, M. (2016, January). Hotel Performance measurement: literature review. In SITCON 2016.
52) Möller, K., Drees, A., &Schläfke, M. (2011). Performance Management zurSteuerung von Geschäftsmodellen.
In Innovative Geschäftsmodelle (pp. 213-227). Springer, Berlin, Heidelberg.
53) Mura, M., Micheli, P. G., & Longo, M. (2019, July). The effects of performance measurement uses on organizational
ambidexterity and company performance. In Academy of Management Proceedings (Vol. 2019, No. 1, p. 15010).
Briarcliff Manor, NY 10510: Academy of Management.
54) Nanni, A. J., Dixon, J. R., &Vollmann, T. E. (1992). Integrated performance measurement: management accounting to
support the new manufacturing realities. Journal of Management Accounting Research, 4(1), 1-19.
55) Neely, A. (2008). Does the balance scorecard work: an empirical investigation.
Performance Measurement Systems in Quick Service Restaurant Chains
JEFMS, Volume 3 Issue 01 Jan. 2020 www.ijefm.co.in Page 16
56) Neely, A. D., Adams, C., &Kennerley, M. (2002). The performance prism: The scorecard for measuring and managing
business success. London: Prentice Hall Financial Times.
57) Niven, P. R. (2005). Balanced scorecard diagnostics: Maintaining maximum performance. John Wiley & Sons.
58) Nudurupati, S. S., Lascelles, D., Wright, G., & Yip, N. (2016). Eight challenges of servitisation for the configuration,
measurement and management of organisations. Journal of Service Theory and Practice, 26(6), 745-763.
59) Parizad, A. (2013, November). Dynamic stability analysis for Damavand power plant considering PMS functions by
DIgSILENT software. In 2013 13th International Conference on Environment and Electrical Engineering (EEEIC) (pp. 145-
155). IEEE.
60) Persdotter Isaksson, M., Hulthén, H., &Forslund, H. (2019). Environmentally Sustainable Logistics Performance
Management Process Integration between Buyers and 3PLs. Sustainability, 11(11), 3061.
61) Phillips, P., &Louvieris, P. (2005). Performance measurement systems in tourism, hospitality, and leisure small medium-
sized enterprises: a balanced scorecard perspective. Journal of Travel Research, 44(2), 201-211.
62) Pun, K. F., & White, A. S. (2005). A performance measurement paradigm for integrating strategy formulation: A review
of systems and frameworks. International journal of management reviews, 7(1), 49-71.
63) Rajnoha, R., &Lesníková, P. (2016). Strategic performance management system and corporate sustainability concept-
specific parametres in Slovak Enterprises. Journal of Competitiveness.
64) Shackleton, C. (2006). Developing key performance indicators for corporate communication in the information
technology industry (Doctoral dissertation, University of Pretoria).
65) Sobaih, A. E. E. (2015). Hospitality employment issues in developing countries: The case of Egypt. Journal of Human
Resources in Hospitality & Tourism, 14(3), 221-243.
66) Sorooshian, S., Aziz, N. F., Ahmad, A., Jubidin, S. N., & Mustapha, N. M. (2016). Review on performance measurement
systems. Mediterranean Journal of Social Sciences, 7(1), 123.
67) Srivastava, N., & Maitra, R. (2016). Key performance indicators (KPI) in hospitality industry: an emphasis on
accommodation business of 5 star hotels of national capital region. International Journal of Research in Tourism and
Hospitality, 2(1), 34-14.
68) Striteska, M., &Spickova, M. (2012). Review and comparison of performance measurement systems. Journal of
Organizational Management Studies, 2012, 1.
69) Stříteská, M., & Svoboda, O. (2012). Survey of performance measurement systems in Czech companies.
70) Suárez, E., Calvo-Mora, A., Roldán, J. L., &Periáñez-Cristóbal, R. (2017). Quantitative research on the EFQM excellence
model: A systematic literature review (1991–2015). European Research on Management and Business Economics, 23(3),
147-156.
71) Tangen, S. (2004). Performance measurement: from philosophy to practice. International journal of productivity and
performance management, 53(8), 726-737.
72) Taticchi, P., Balachandran, K., & Tonelli, F. (2012). Performance measurement and management systems: state of the
art, guidelines for design and challenges. Measuring Business Excellence, 16(2), 41-54.
73) Thananchayana, K., & Gooneratne, T. (2018). Successful Implementation of the Balanced Scorecard in a
Telecommunications Firm: An Institutional Theory Analysis.
74) Tung, A., Baird, K., & Schoch, H. P. (2011). Factors influencing the effectiveness of performance measurement
systems. International Journal of Operations & Production Management, 31(12), 1287-1310.
75) Valmohammadi, C., &Servati, A. (2011). Performance measurement system implementation using Balanced Scorecard
and statistical methods. International Journal of Productivity and Performance Management, 60(5), 493-511.
76) Wadongo, B., Odhuno, E., Kambona, O., &Othuon, L. (2010). Key performance indicators in the Kenyan hospitality
industry: a managerial perspective. Benchmarking: An international journal, 17(6), 858-875.
77) Watts, T., & McNair-Connolly, C. J. (2012). New performance measurement and management control systems. Journal
of Applied Accounting Research, 13(3), 226-241.
78) Wu, H. C. (2013). An empirical study of the effects of service quality, perceived value, corporate image, and customer
satisfaction on behavioral intentions in the Taiwan quick service restaurant industry. Journal of Quality Assurance in
Hospitality & Tourism, 14(4), 364-390.
79) Zhang, J., &Enemark, A. E. (2016). Factors influencing business performance in hotels and restaurants.
80) Zigan, K., &Zeglat, D. (2010). Intangible resources in performance measurement systems of the hotel
industry. Facilities, 28(13/14), 597-610.