Towards a Performance Measurement System to Control Disaster Response
Upload
khangminh22Category
view
1download
0
Veera Pesonen
Development and Analysis of Performance Measurement Indicators Utilized by Third Party
Logistics Service Providers
Vaasa 2021
School of Technology and Innovations Master’s thesis in Industrial Management Master of Science in Economics and Business Administration

2
UNIVERSITY OF VAASA School of Technology and Innovations Author: Veera Pesonen Title of the Thesis: Development and Analysis of Performance Measurement Indi-cators Utilized by Third Party Logistics Service Providers Degree: Master of Science in Economics and Business Administration Programme: Industrial Management Supervisor: Assistant Professor Emmanuel Ndzibah Year: 2021 Pages: 81
ABSTRACT: Performance is important part of a company’s operations as it describes how well company is fulfilling its goals. Supply chain and logistics connect the product to a consumer from the man-ufacturer via different actions and actors. Transportation is required from sourcing of raw ma-terial through production to the delivering of finished products to end users, as also seen in reverse logistics. This thesis combines these two aspects related to performance and its meas-urement in third-party logistics transportations. Performance and its measurement have been researched a lot but most of the time research are related to financial point of view. Environmental performance is usually used to measure performance in green logistics. Logistics performance together with environmental perfor-mance has not been research specially in third-party logistics. The focus in this thesis is to re-search performance from environmental and logistics point of view and especially have third-party logistics service providers as a main research area. Research question of this thesis is: What are the key performance indicators utilized by third-party logistics service providers in measurements? The objectives for this research question are to find out what performance indicators and key performance indicators third-party logistics service providers use in their transportations environmental and logistics measurements. In addition, objectives include to finding out why are these indicators chosen. Last objective is to develop and propose alternative solutions for performance measurement and indicators. This research is based on qualitative interview with an open-ended questionnaire as the data collection method. The interview has been built around theoretical framework what has been formed from central findings of the literature review. Literature review is consisted of three parts which cover the main topics of the study which are third-party logistics service providers, performance measurement and performance indicators. The interview was conducted with one company, so the sample size is 1 as questions were answered from a company-wide perspective. The results showed that the significance of company goals is major in performance measurement and indicators as company goals guides indicators selection. Instead importance of performance measurement system in indicators selection can be stated to be quite minor. Results also pointed out environmental performance to be highlighted in performance measurement and especially in performance indicators.
Keywords: third-party logistics, performance measurement, performance indicators

3
VAASAN YLIOPISTO Teknologian ja innovaatiojohtamisen yksikkö Tekijä: Veera Pesonen Tutkielman nimi: Kolmannen osapuolen logistiikkapalvelujen tarjoajien käyttä-mien suorituskyvyn indikaattoreiden kehittäminen ja analysointi Tutkinto: Kauppatieteiden maisteri Oppiaine: Tuotantotalous Työn ohjaaja: Apulaisprofessori Emmanuel Ndzibah Valmistumisvuosi: 2021 Sivumäärä: 81
TIIVISTELMÄ: Suorituskyky on tärkeä osa yritysten toimintaa, sillä se kuvaa kykyä suoriutua tavoitteiden to-teuttamisessa. Toimitusketju ja logistiikka yhdistävät tuotteen valmistajalta kuluttajalle eri toi-mijoiden ja toimintojen avulla. Kuljetuksilla on avainrooli toimitusketjussa ja logistiikassa sillä kuljetuksia tarvitaan useisiin eri toimintoihin tuotannon alusta aina tuotteen toimittamiseen loppuasiakkaalle kuin myös paluulogistiikkaan. Tämä tutkimus yhdistää nämä kaksi aspektia ja tutkii tekijöitä, jotka liittyvät suorituskykyyn ja sen mittaamiseen kolmannen osapuolen logistii-kan kuljetuksissa.
Suorituskykyä ja sen mittaamista on tutkittu paljon, mutta useimmiten tutkimukset ovat olleet talouden näkökulmasta. Ympäristön suorituskyvyn mittaukset ovat yleensä kohdistuneet vihre-ään logistiikkaan. Logistista suorituskykyä yhdessä ympäristön suorituskyvyn kanssa ei ole tut-kittu erityisesti kolmannen osapuolen logistiikassa. Tämän vuoksi tutkimuksen pääpaino on suorituskyvyn mittaaminen erityisesti ympäristön ja logistiikan näkökulmasta ja keskittyen eri-tyisesti kolmannen osapuolen logistiikan palveluntarjoajiin.
Tämän tutkimuksen tutkimuskysymys on: Mitkä ovat tärkeimmät suorituskykyindikaattorit, joita kolmannen osapuolen logistiikkapalvelujen tarjoajat käyttävät mittauksissa? Kysymyksen tavoitteena on saada selville mitä ympäristön ja logistiikan suorituskyvyn indikaattoreita kol-mannen osapuolen logistiikkapalvelujen tarjoajat käyttävät ja mitkä niistä ovat avainindikaatto-reita. Lisäksi tavoitteena on selvittää, miksi nämä indikaattorit on valittu sekä tehdä kehityseh-dotuksia suorituskyvyn mittaamiseen ja indikaattoreihin.
Tämä tutkimus on laadullinen tutkimus, jossa datankeräysmetodina on avoimia kysymyksiä sisältävä haastattelu. Haastattelu on rakennettu teoreettisen viitekehyksen ympärille, joka taas on muodostettu kirjallisuuskatsauksen keskeisimmistä löydöksistä. Kirjallisuuskatsaus koostuu kolmesta osasta, jotka kattavat tutkimuksen pääaiheet. Nämä osat ovat kolmannen osapuolen logistiikan palveluntarjoajat, suorituskyvyn mittaaminen ja suorituskyvyn indikaattorit. Haastattelu toteutettiin yhden yrityksen kanssa ja kysymyksiin vastasi yksi työntekijä koko yrityksen näkökulmasta, joten tutkimuksen otoskoko on 1. Tutkimuksen tulokset osoittavat, että yrityksen tavoitteiden merkitys on suuri suorituskyvyn mittaamisessa ja indikaattoreissa, sillä nämä tavoitteet ohjaavat indikaattoreiden valintaa. Sen sijaan suorituskyvyn mittausjärjestelmien merkitys indikaattoreiden valinnassa jäi hieman epä-selväksi. Lisäksi tulokset osoittivat ympäristön suorituskyvyn korostuvan suorituskyvyn mittaa-misessa logistiseen suorituskykyyn nähden.
Avainsanat: kolmannen osapuolen logistiikka, suorituskyvyn mittaaminen, suorituskyvyn indikaattorit

4
Contents
1 Introduction 8
1.1 Background and purpose 8
1.2 Research gap, question, and objectives 9
1.3 Definitions and limitations 10
1.3.1 Third-party logistics 10
1.3.2 Performance measurement 11
1.3.3 Performance indicators 11
1.4 Structure of the thesis 12
2 Overview of transportation sector 14
2.1 Transportation challenges 15
2.2 Transportation modes 16
3 Literature review 20
3.1 Third-party logistics service providers 20
3.1.1 Environmental goals 21
3.1.2 Logistics goals 23
3.2 Performance measurement 24
3.2.1 Environmental performance measurement systems and frameworks 25
3.2.2 Developing Environmental performance measurement system 27
3.2.3 Logistics performance measurement systems and frameworks 30
3.2.4 Performance analysis 33
3.3 Performance indicators 34
3.3.1 Indicators’ selection and significance for company 34
3.3.2 Environmental performance indicators 35
3.3.3 Logistics performance indicators 36
3.4 Theoretical framework 38
3.4.1 Challenges of performance measurement and performance indicators 38
3.4.2 Selection of indicators 40
3.4.3 Analysis and development of indicators 41
4 Research methodology 43

5
4.1 Data Collection 47
4.2 Data Analysis 48
5 Results and analysis 49
5.1 Analysis about company’s goals 51
5.2 Analysis about performance measurement systems 54
5.3 Analysis about performance indicators 55
5.4 Analysis about KPIs 60
5.5 Analysis about indicators overall 62
5.6 Discussion about possible development ideas 63
5.7 Reliability and validity of the study 65
5.7.1 Reliability 65
5.7.2 Validity 66
6 Summary and conclusion 69
6.1 Summary of the research 69
6.2 Managerial Implications 72
6.3 Future research suggestions 73
References 75
Appendices 81
Appendix 1. Interview questions for environmental and logistics performance 81

6
Figures Figure 1 Structure of the thesis 13
Figure 2 Supply chain with transportation and information flow (adapted from Tseng et
al. 2005). 14
Figure 3 Characteristics of different mode of transportation (adapted from Fulzele,
Shankar Choudhary, 2019). 18
Figure 4 Greenhouse gas emissions in Finland by sector and greenhouse gas emissions
distribution in Finland at energy sector. 21
Figure 5 Key design principles for creating an EPMS framework. 29
Figure 6 Research onion (adapted from Saunders et al., 2007, p. 102) 44
Figure 7 Research process of the study. 46
Figure 8 PIs and KPIs used by the case company. 58
Tables Table 1 Performance indicators 37
Table 2 Answers from the interview 50
Table 3 KPIs and goals they are related to. 61
Abbreviations
3pl Third-party logistics
3plsp Third-party logistics service providers
CSR Corporate Social Responsibility
EPM Environmental Performance Measurement
EPMS Environmental performance measurement system
ESL Environmentally sustainable logistics
ESLPM Environmentally sustainable logistics performance management
KPI Key performance indicator
LPI Logistics performance indicator
LSS Lean Six Sigma

7
PI Performance indicator
PMS Performance measurement system
SCOR Supply Chain Operation References
UN United Nations

8
1 Introduction
This chapter shortly introduce main aspects of this thesis. In chapter 1.1. the back-
ground for thesis topic and purpose of this thesis are presented. Chapter 1.2. covers
the identified research gap and thesis research question and its objectives. Chapter 1.3
include keywords definitions and tells how the keywords are limited in this research.
Thesis structure and short descriptions of every chapter of this thesis are presented in
chapter 1.4.
1.1 Background and purpose
Performance is important for companies to succeed. It is an integral part of a compa-
nies’ operations as it describes the how well company is fulfilling its goals (Domingues,
Reis & Macário, 2015). Thesis subject is selected based on interests but also for suc-
cessful factors for business environment. Performance is reflected from effectiveness
of actions and systems. Logistics and supply chain are also important parts for company
as they connect the product to a customer via different actions and actors. This thesis
combines these two aspects related to performance and its measurement in third-
party logistics.
The aim of this research is to provide third-party logistics service providers (3plsp) a
general guideline how to select their performance measurement indicators in an effi-
cient way. By improving these indicators companies can achieve more accurate data
from its action and company success. This will help them to improve their performance.
Purpose of this thesis is to study performance measurement indicators and their selec-
tion from different point of views and recognize key concepts for indicators selection.
Thesis will provide information about environmental and logistics performance meas-
urement in third-party logistics (3pl) transportation activities. The purpose is to provide
useful information on the selection of performance measurement indicators and the
factors that has an effect to these indicators.

9
1.2 Research gap, question, and objectives
Performance and its measurement have been researched a lot but most of the time
research are related to financial point of view. Environmental performance is usually
used to measure performance in green logistics. Logistics performance together with
environmental performance has not been research specially in third-party logistics.
That is why the focus in this thesis is to research performance from environmental and
logistics point of view and especially have third-party logistics service providers as a
main research area. Environmental and logistics performance together may also sup-
port and provide information to each other and thus are also good combination to
study.
This thesis focusses on transportation as very often 3pl actions are considered as a one
big wholeness so previous research has focused on that. Transportation includes many
different sub-areas and modes but, in this thesis, transportation is handled as a whole
and received results work as a common guideline. Even though research related to lo-
gistics performance and environmental performance are available, have most of the
research left out one of the most important things – How to be better? Development
and analysis to find out how to perform better and choose more efficient indicators
have been left out from previous studies. Based on this information one detailed re-
search question and three objectives for that question are created for the research:
RQ: What are the key performance indicators (KPI) utilized by third-party logistics
service providers in measurements?
a) What performance indicators (PI) and key performance indicators third-party
logistics service providers use in their transportation’s environmental meas-
urements and logistics measurements?
b) Why are these indicators chosen? Analyse the effectiveness and efficiency of
such performance indicators.

10
c) Develop and propose alternative solutions for performance measurement and
indicators.
Hypotheses for this research are also created. First hypothesis for this research is that
performance indicators selection is based on company’s goals. Second hypothesis is
that more value is given on environmental indicators than logistics indicators. Third
hypothesis is that performance indicators are strongly guided by performance meas-
urement system or frameworks.
1.3 Definitions and limitations
1.3.1 Third-party logistics
According to Domingues et al. (2015) logistics is important part of supply chain which
ensure to get the right product into right place. Logistics is mainly linked into produc-
tion sector, but it has remarkable role in other areas like in retailers’ sector. It consists
multiple actors and multiple activities including transport, warehousing, and customer
service for example. Third-party logistics is one of the main actors of logistics. Jazairy,
Lenhardt and von Haartman (2017) tell 3pl to be an actor to whom other companies
have outsourced their logistics activities which are usually related to warehousing, dis-
tribution, and transportation.
In this research focus is on third-party logistics service providers (3pl). As activities of-
fered by these providers are broad, only transportation activities are considered in this
research. Transportation modes are not limited whereas research focus on handling
transportations overall. However, short introduction and main aspects of transporta-
tion modes are told in second chapter.

11
1.3.2 Performance measurement
Performance measurement is strongly related to performance management. Perfor-
mance management is overall management of different parts of performance like set-
ting goals and monitor these goals (U. S. Department of Health and Human Services
Health Resources and Services Administration, 2011). Domingues et al. (2015) state
performance measurement to be a tool for company to get information about its ac-
tions successfulness and to know if it is fulfilling its objectives and reaching goals. Per-
formance should be measured to avoid failures and to improve efficiency according to
Jazairy et al. (2017). Performance can be measured both from financial and non-
financial perspectives. Can be identified for example logistics performance, environ-
mental performance, social performance, financial performance, and customer per-
formance (Kucukaltan, Irani & Aktas, 2016).
Wudhikarn, Chakpitak and Neubert (2018) state logistics performance to describe effi-
ciency of logistics activities. These logistics performance measures help companies to
improve its logistics activities. Environmental performance measures assist companies
to monitor their waste and emissions and thus receive important information about
the sustainability of the companies’ operations Tung, Baird and Schoch (2018) stated.
In this research the focus is on environmental performance and logistics performance.
In this research transportation performance is measured from environmental and logis-
tics view. Logistics performance in this case refers all the operational matters of trans-
portations.
1.3.3 Performance indicators
Domingues et al. (2015) and Kucukaltan et al. (2016) tell performance indicators to be
part of performance measurements. Companies base their performance measurement
in these indicators and thus pursue to comprehensive measure. As performance indica-
tors are base to performance measurement there are also indicators in several differ-

12
ent areas. Khan, Jian, Zhang, Golpîra, Kumar and Sharif (2018) point that environmental
performance indicators are mostly related to different wastes and emissions. Also, en-
vironmental sustainability and usage of different energies are usually considered. In
addition, Kucukaltan et al. (2016) highlight that environmental performance indicators
can also be related to people like environmental education, environmental awareness,
and satisfaction. For logistics performance indicators Rezaei, van Roekel and Tavasszy
(2018) express five core components: customs, infrastructure, services, timeliness and
tracking and tracing international shipments. All these components include different
indicators which measure that component.
This research will focus on logistics performance indicators which give data about
transportation. These indicators are strongly related to infrastructure, services, and
timeliness components. In environmental performance indicators the focus is on indi-
cators which will provide data related to waste and emissions as they are strongly re-
lated to transportation. Also, other indicators from environmental side will be used if
they are seen to have impact on transportation.
1.4 Structure of the thesis
This thesis consists of six chapters. In figure 1 structure and progress of the research is
presented more clearly but focusing on main aspects. Introduction and background are
presented first and then research gap, question, objectives, and limitations for the re-
search are told. These are all included in first chapter which is an introduction chapter
where thesis topic, purpose, are presented and relevant concepts defined. Second
chapter is an overview of transportation sector where different transportation modes
are presented, and challenges related to transportation handled. Third chapter is litera-
ture review which consist of presenting relevant theories of third-party logistics, per-
formance measurement and performance indicators. Theoretical framework is includ-
ed at the end of the literature review and consist of creating theoretical framework
based on literature review. Fourth chapter is about methodology where research

13
method and research process are clearly presented. Research method presenting in-
cludes that data collection method and data analysis method are told. Fifth chapter is
results and analysis chapter which contains results and discussion part based on the
interview of case company. Last chapter is a summary and conclusion where whole
thesis is shortly summarized, drawn conclusions presented and future suggestions
stated.
Figure 1 Structure of the thesis

14
2 Overview of transportation sector
This chapter present a deeper overview to transportation including different transpor-
tation modes and challenges what 3plsp may face. Transportation has key role in logis-
tics and supply chain according to Tseng, Yue, and Taylor (2005). Transportation is
needed in many different procedures from the start of production to the delivery to
final customer. However reverse logistics also plays main role in transportations. Re-
verse logistics is logistics where product leaves from consumer and end up to producer.
Term reverse logistics is used in touch with recycling as with reverse logistics can make
sure that product is disposed correctly. In Figure 2 the role of transportation in supply
chain is described.
Figure 2 Supply chain with transportation and information flow (adapted from Tseng et al. 2005).
In normal logistics the chain is starting from supplier and moving to manufacturer then
to distributor from where it goes to retailer and ending up to consumer. In reverse lo-

15
gistics chain start from consumer and go backwards the normal logistics route ending
up in supplier. In addition, this figure shows the information flow between different
procedures and can be seen that information is moving between every part of the sup-
ply chain. From supplier to distributor, from consumer to manufacturer, from retailer to
consumer and so on.
Transportation is a link between different parts of supply chain which connects these
parts into one smooth chain tells Tseng, Yue, and Taylor (2005). That is why a lot of co-
operation between different operators, like supplier, manufacturer, retailer, and dis-
tributor is needed to maximize the outcome. Transportation also has major impact to
customer and consumer and their experiences. Due to role of transportation, it is im-
portant to pay attention at transportation performance. Good transportation perfor-
mance can have big impact to company’s competitiveness so transportation’s role in
company’s business is remarkable.
2.1 Transportation challenges
When planning transportations and deliveries must be considered financial, logistical,
and social matters. Different transportation modes are air, maritime, road, rail, and
intermodal. These modes are discussed more closely in chapter 2.2.
First need to be considered what freight requires from the transportation according to
Tripathi, Hudnurkar, and Ambekar (2021). Service price is a key factor considering what
would be cheapest mode or most cost efficiency mode. What would be the most
reliable transportation mode and what mode would fit best for the situation and for
the freight need to be taken into account. Time related issues are also very important
as when thinking of transportation schedule needs to be considered what is the fastest
and what would be the most accurate transportation mode. They also regocnize the
congestion factor which is strongly related to road transportation. Punakivi and Hinkka
(2006) presents that for short routes road transportation is usually the best option

16
whereas air transportation is used for deliveries where the freight must be delivered
soonest possible. Kiesmüller, de Kok, and Fransoo (2005) also higlight the importance
on warehousing when selection the appropriate transportation mode. Where the
possible intermediate inventories are located to and what would be the most
reasonable option from that point of view.
Kengpol, Tuammee, and Tuominen (2014) identifies in different categories possible
risks what should be considered when selection the transportation mode. First one is
freight damaged risks which include damaged freight, damaged form transportation,
damaged from delivery at warehouse and amaged from delivery to customer. It also
consider loss of freight during the transportation. Second risks are infrastructure and
equipment risks which refers to capacity of port and railroad traffic and equipment
material handling’s facility. This also includes risk related to tunnels, capacity of bridges
and slope and the width of roads. Also weather conditions like rainy seasons and
tropical storms and accident rates are included in this category.
Third categorie is political and legislatorial risks which are related directly to laws and
different political risks. Traffic rules and customs are also included in this. Fourth
category includes operational risk which refers to employees skills and different
problems related to documents like standardization and interpretation. Fifth risks
relates to macro risks like financial crisis, unattractive markets and fierce competition in
the transportation sector. Last category is environmental risks. These risks include
climate change, toxic waste and appearance of route or building. (Kengpol et al., 2014).
2.2 Transportation modes
Air freight logistics is used for value of freight is high and need for fast delivery accord-
ing to Tseng, Yue, and Taylor (2005). Via air freight can be moved fast and with lower
risk of damage. Air freight is flexible and usually provides a good accessibility and fre-
quency for most common destinations. Air freight disadvantage is high fees of delivery

17
but is still more dependable than maritime transportation according to Wood, Barone,
Murphy (2002) as it is much unlikely early or late at the departure or arrival place.
Maritime is mostly used for international freight as it relatively cheap transportation
mode and carrying capacity is high according to Tseng, Yue, and Taylor (2005). Mari-
time transportation problem is long transportation time compared to air freight which
is also used for international freight. Maritime transportation is also dependent on
weather factors. Three different types of operation can be identified in maritime trans-
portation. First one is liner shipping where operation is happening between same
routes, same price, same ship and regularly happening transportations. Second one is
tramp shipping which is quite opposite of liner shipping. In this mode route, price and
schedule may vary greatly. Third operation mode is industry shipping which aim is to
ensure the supply of raw materials. In industry shipping also need to take care of pos-
sible special needs like high-pressure containers for natural gas.
In road freight transportation advantages are its high accessibility, mobility, and availa-
bility according to Tseng, Yue, and Taylor (2005). Road freight also has cheaper invest-
ment funds. However, road freight has relatively low capacity, slow speed, and lower
safety. Tripathi et al. (2021) tell road transportation main advantage is that booking is
easy compared to other modes and there is available many options for different types
of freights. Road transportation still suffer from many problems like traffic congestion
and crashes. Delivery of freight in time is very important part of transportation so traf-
fic congestion is very difficult problem as it takes multiple different steps to avoid the
congestion and reduce the delivery time. Another problem is energy consuming and
pollution as road transportation consumes a lot of energy and thus cause a lot of pollu-
tion so even though it is very flexible and easily available transportation mode it is not
very sustainable mode.
Railway transport carrying capacity is high and it is not influenced by weather as much
as maritime for example according to Tseng, Yue, and Taylor (2005). Railway transpor-

18
tation also use a lot of less energy compared to road transportation. Railway transpor-
tation has relatively many disadvantages as essential facilities have usually very high
cost and maintenance of vehicles and different equipment is difficult and expensive.
Railway transport is not very good option for urgent demands as it lacks elasticity as it
is very time consuming to organize railway carriages and that is why it is sometime
hard to provide transportation frequency as per the customer requirement according
to Tripathi et al. (2021). They also identify that railway transportation is cheaper option
than road transportation if there is enough volume for the rail.
In addition to use only one transportation mode can be used a multimodal freight
transportation which combines to or more different transportation modes according to
Kengpol et al. (2014). With multimodal transportation possibilities to transportation
routes and times is broad as different modes can be combined in many ways. In figure
3 is presented characteristics of different mode of transportation where can be noticed
differences between transportation modes more clearly.
Figure 3 Characteristics of different mode of transportation (adapted from Fulzele, Shankar Choudhary, 2019).
Maritime transportation is located on right which mean that it is slowest and cheapest
one and least time-sensitive, but it is not that reliable and visible. With maritime trans-
portation high weights for freight are possible and this transportation mode is usually

19
used for freights with lower value. Air transportation is from the other end and located
on left which means more agile but expensive and highest time-sensitive transporta-
tion mode. In air transportation reliability and visibility is much higher. Air transporta-
tion freight has lowest weight, but they have usually highest value. Rail and road trans-
portation belong to the middle where rail transportation is left from the maritime
transportation and road transportation right from the air transportation.

20
3 Literature review
This chapter present literature of different sub-areas related to topic. First 3plsp’ envi-
ronmental and logistical goals are told. Second sub-chapter deals with performance
measurement and different measurement systems and framework what can be used to
performance measurement in environmental side and in logistics side. Third sub-
chapter is about performance indicators where different indicators for environmental
performance and logistics performance are presented. Last sub-chapter is theoretical
framework where key concepts of this literature review are linked to each other.
3.1 Third-party logistics service providers
Setting goals is important because they also influence 3plsp’s other decisions. Isaksson,
Hulthén and Forslund (2019) highlight that even though company make its own deci-
sions about goals are these decisions usually guided by customers wishes and require-
ments. Being close with customer can help 3plsp to understand customer needs and
wishes better. This will help company to improve its business process and make it more
efficient. Goals need to be well defined and set for a specific time frame.
According to Arababadi, Moslehi, El Asmar, Haavaldsen and Parrish (2017) company
should have long-term goals, medium-term goals, and short-term goals to increase the
success of company business. Long-term goals are for strategic level and are usually
very broad goals which may not include any specific intention. Tactical level has short-
term procedures and plans to achieve the strategic level goals. Operational level pro-
vides daily activities to achieve the tactical goals and it is very focussed on short-term
goals. Leal and Azevedo (2016) identifies in their research that correlation between
long-term goals and short or medium-term goals is very high and if these goals for dif-
ferent time frames are not linked to each other the main goal may not be achieved.
Gencer and Ackere (2021) support this point of view and they conclude in their re-

21
search that company should set some intermediate goals in addition to long-term goals
as smaller and more shorter-term goals will help to achieve the main goal.
3.1.1 Environmental goals
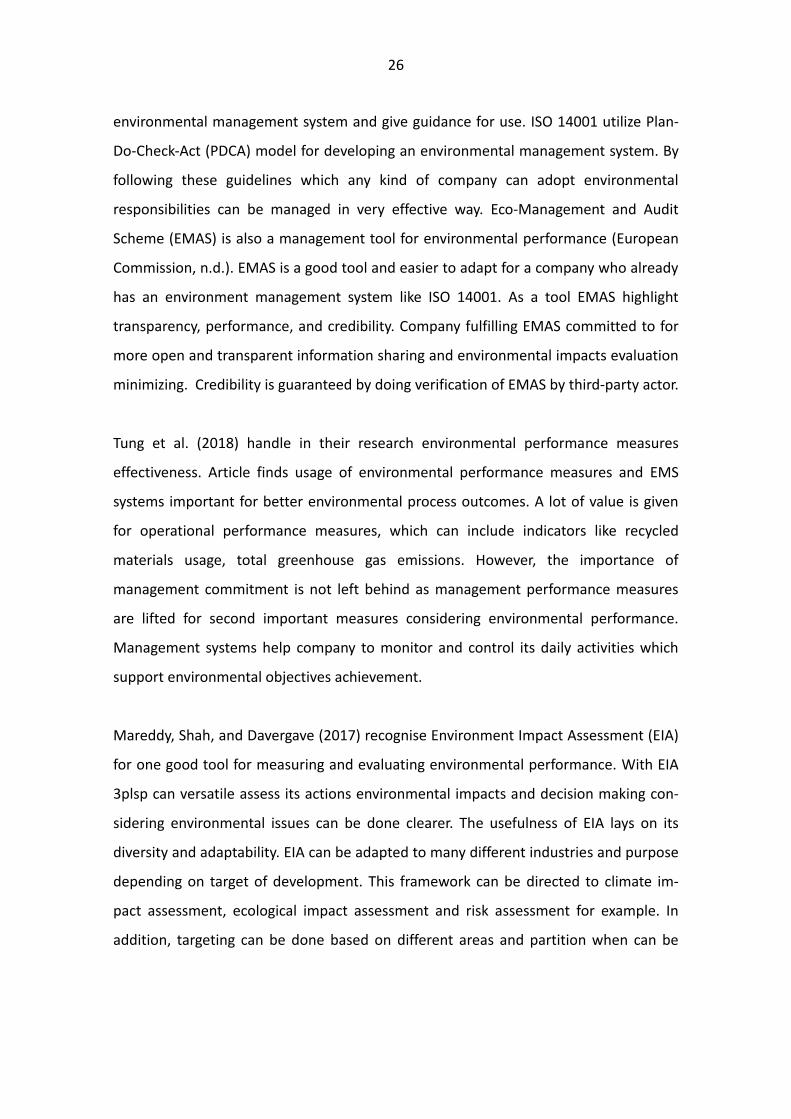
Transportation is one of the biggest sources of pollution in Finland (Statistics Finland,
2020). Energy sector produces biggest part of greenhouse gas emissions in Finland and
as transportation is part of energy sector it produces about fifth of greenhouse gas
emissions (Statistics Finland, 2020). Figure 4 shows how greenhouse gas emissions are
divided in different sectors and inside the energy sector based on Statistics Finland
data. Energy sector produces about 74 % of all greenhouse gas emissions where inside
the energy sector transportations part of emissions is 29 %. Transportation includes
cargo transportation but also private motoring. Passenger cars use most energy in
transportation but the energy what delivery vans and trucks use are almost as big as
private cars (Liikennefakta, 2021). In addition to greenhouse gasses there is also noise
emissions which are not directly causing damage to environment but irritating humans,
so it is adequate reason to pay attention to them (Jacyna, Wasiak, Lewczuk & Karoń,
2017). All these prove how important it is to pay attention to environmental goals.
Figure 4 Greenhouse gas emissions in Finland by sector and greenhouse gas emissions distribu-tion in Finland at energy sector.

22
Environmental goals 3plsp made are strongly guided by different regulations and
norms what different corporations and societies have defined. While environmental
matters are continuously more important and spoken thing among companies, and
especially among logistics companies, are they nearly obliged to take these regulations
into account. Corporate Social Responsibility (CSR) is seen a common guideline and
basement for business ethics. According to Rendtorff (2019) by following CSR compa-
nies can do ethically and responsible actions not only for themself but also for whole
society. It is important for companies to recognize in addition to its rights but also its
duties and take responsibility about its own actions for successful business. This is not
only environmental matter according to Rendtorff, but also social side need to be cov-
ered to achieve economic growth in ethically way.
In addition, Agenda2030 which is sustainable development program created by United
Nations (UN) gives guideline for more sustainable environment. Agenda2030 include
17 different goals to quarantine sustainable development. Related to environment and
environmental goal settled by 3plsp, goals 9, 12, 13, 14 & 15 should be considered.
Goal number 9 is not directly to environmental matter, but it advocates for building
resilient and sustainable industrialization and infrastructure which can be reflected to
have sustainable vehicles. Goal number 12 is for responsible consumption which aim is
to reduce waste by reusing and recycling. Companies should also adopt sustainable
practises and use natural resources in an efficient way. Goal number 13 is strongly re-
lated to goal number 12 as it requires urgent action to fight against climate change and
its impacts. This includes improving knowledge and awareness about climate change
and adding climate change measures and actions into national strategies and politics.
Goals number 14 and 15 aims to protect underwater life and terrestrial life. Underwa-
ter life should be protected by reducing marine pollution and minimizing the ocean
acidification among other things. Protecting terrestrial life is very broad goal but it in-
cludes protecting ecosystems, sustainable usage of forests, to combat against desertifi-
cation and to stop land degradation and biodiversity loss. (kestavakehitys.fi 2015)

23
These act as a strong guideline for 3plsp and help and guide them to set goals to sup-
port these regulations and companies own business. Tung, Baird, and Schoch (2018)
recognise that 3plsp environmental goals are mainly to reduce waste emissions and air
emissions which include for example greenhouse gas emission and carbon emissions.
They further state that to achieve these broad goals, it is almost necessary to adopt
smaller goals and activities. They deal mostly with social activities like training and rais-
ing awareness of environment and creating culture which enhance environmentally
friendly actions. This can be noticed from 3plsp side also as many providers have other
smaller goals or commitments to support the main goal. For example, Posti (A, n.d.)
retell Agenda2030 and it has launched its aim to be zero emission until 2030. To sup-
port this goal Posti has committed to Science Based Targets initiative climate initiative
and advance International Post Corporation’s sustainable development goals. Post-
nord’s (A, n.d.) environmental goal is to reduce carbon dioxide emissions by 40% from
2009 to 2020. DB Schenker’s (n.d.) goal is very similar but with smaller amount in
shorter time zone. Its goal is to reduce carbon dioxide emissions by 30% from 2006 to
2020. Company’s aim is to be leading provider of green logistics services worldwide.
These companies show that goals are very identical but only modified to fit for the
companies’ other goals and actions.
3.1.2 Logistics goals
When considering logistics goals, there are no similar regulations or commitments that
should be considered like in environmental goals. There is usually one clear goal when
speaking about logistics performance and goals. It is to get right product into right
place and in right time (Jazairy, Lenhardt, & von Haartman, 2017). This goal is usually
for entire supply chain and as third-party logistics is one actor in supply chain other
actor have their responsibility also. Jazairy et al. (2017) highlights that to achieve the
big goal cooperation between different actors and actions is needed. Taking care only
transportation, warehousing and packaging is not enough but also supporting activities
like communication, customer service and managing information technology should be

24
considered (Domingues et al., 2015). 3plsp are providing logistics services for compa-
nies so one of the most important goals for service providers is to fulfil customer re-
quests. This goal can be strongly linked to getting product in right place in right time
and with right way as doing things right depends on what customer has asked for.
This goal is very broad and universal so 3plsp have divided it into smaller goals which
aim together is to reach the main goal. Domingues et al. (2015) recognize the im-
portance to secure components and actions efficiency. One of the smaller goals can be
successful communication. Information flow between company and its stakeholders is
important but so is information flow between company and the customer. It is espe-
cially important to communicate with customers to be able to fulfil customers’ needs.
For example, Posti’s (B, n.d.) goal is to build a great customer focused service both for
physical and online service. In addition, Posti aims to be trustful partner for its stake-
holders and highlight the importance of partnership and collaboration for creating a
good customer experience. Improving routing and vehicle planning are things compa-
ny should focus on and set as a goal to achieve the main goal (Jazairy et al., 2017). That
is why 3plsp usually set these to be their goals as they know it will help them to get the
right product into right place in right time (Domingues et al., 2015).
3.2 Performance measurement
Performance measurement is a process which includes many steps. Company can
choose a performance measurement system or framework what it can follow and exe-
cute performance measurement as the system or framework guides. Choosing indica-
tors is also one of the main steps of performance measurement. Also choosing a data
analysation tool to analyse the data received from indicators is important. With proper
tool company can analyse data but also create reports about the results. This will also
help company to get feedback about how its indicators are getting through. (Isaksson
et al., 2019). This research focusses on transportation so this part concentrate on

25
measurement systems which serve this area of logistics. Performance indicators and
their selection is a broad subject, so it is handled as an own chapter.
3.2.1 Environmental performance measurement systems and frameworks
With environmental performance measurement 3plsp can evaluate its action success-
fulness and improve it. There are multiple different indicators 3plsp can use so it is im-
portant to choose the right ones. Environmental performance measurement systems
(EPMS) can guide and help these service providers to work towards its goals. For ex-
ample, choosing performance indicators can be done with help of EPMS. Environmen-
tal performance measurement includes many other things which help company to per-
form more efficiently. (Pham, Sutton, Brown, & Brown, 2020).
First and maybe most important matter is that with environmental performance meas-
urement 3plsp can recognize a possible environmental risk and thus give a chance to
react soon enough to reduce the risks with correct actions Tung et al. (2018) points out.
Environmental performance measurement also provides more transparent communi-
cation about environmental matter inside the company. This enables better infor-
mation flow and increase the knowledge about processes. Measuring not only advance
companies inside actions and processes but also improve relationships with stakehold-
ers. It is important for 3plsp to provide information via annual reports to stakeholder to
show them their meaning. Purpose is also to support and brush up public image which
is very remarkable issue on today’s business environment.
International Organization for Standardization ISO (n.d.) has Environmental
Management family ISO 14000 which provide frameworks, guidelines, and systems to
use for better environmental outcome. Its purpose is to advance and support
sustainable development goals. ISO 14000 family consists of multiple different
standards where ISO 14001 is the most common standard. International Organization
for Standardization (2015a) emphasize that ISO 14001 set requirements for
26
environmental management system and give guidance for use. ISO 14001 utilize Plan-
Do-Check-Act (PDCA) model for developing an environmental management system. By
following these guidelines which any kind of company can adopt environmental
responsibilities can be managed in very effective way. Eco-Management and Audit
Scheme (EMAS) is also a management tool for environmental performance (European
Commission, n.d.). EMAS is a good tool and easier to adapt for a company who already
has an environment management system like ISO 14001. As a tool EMAS highlight
transparency, performance, and credibility. Company fulfilling EMAS committed to for
more open and transparent information sharing and environmental impacts evaluation
minimizing. Credibility is guaranteed by doing verification of EMAS by third-party actor.
Tung et al. (2018) handle in their research environmental performance measures
effectiveness. Article finds usage of environmental performance measures and EMS
systems important for better environmental process outcomes. A lot of value is given
for operational performance measures, which can include indicators like recycled
materials usage, total greenhouse gas emissions. However, the importance of
management commitment is not left behind as management performance measures
are lifted for second important measures considering environmental performance.
Management systems help company to monitor and control its daily activities which
support environmental objectives achievement.
Mareddy, Shah, and Davergave (2017) recognise Environment Impact Assessment (EIA)
for one good tool for measuring and evaluating environmental performance. With EIA
3plsp can versatile assess its actions environmental impacts and decision making con-
sidering environmental issues can be done clearer. The usefulness of EIA lays on its
diversity and adaptability. EIA can be adapted to many different industries and purpose
depending on target of development. This framework can be directed to climate im-
pact assessment, ecological impact assessment and risk assessment for example. In
addition, targeting can be done based on different areas and partition when can be

27
identified regional EIA, sectoral EIA, project-level EIA, strategic EIA, and Life Cycle As-
sessment (LCA).
Taşkın and Demir (2020) presented Life Cycle assessment possibilities as LCA can be
adapted for product, process, or a system so it is one of the EIA frameworks that can be
utilized for measuring environmental performance in logistics and especially in trans-
portation. Because LCA is usually used for total picture instead of only one part of pro-
cess can 3plsp utilize this framework for also other actions it may do for customer and
evaluate all actions environmental impacts together. In this case LCA’s goal is to evalu-
ate transportation process environmental impact through its whole life cycle from
planning and design to phase where customer receive the product. Process for as-
sessing the environmental impacts includes four steps: goal and scope, inventory anal-
ysis, impact assessment and interpretation. In first step goal and scope should be de-
fined and necessary assumption together with system lifetime and boundary handled.
Second step takes most of the time in this process as it includes data gathering which
will be done based on first phase definitions. Third step is impact assessment itself
where impact assessment methodology is used to transform input to environmental
impacts. In last step results are interpreted and in first step defined goals are consid-
ered together with results. Taşkın and Demir (2020) utilize this this tool as a help for
municipal solid waste management to evaluate environmental impacts to achieve more
sustainable energy usage. In addition, also ISO calls for the LCA principles adopting so it
is an effective tool for environment perspective (International Organization for Stand-
ardization, 2015).
3.2.2 Developing Environmental performance measurement system
Company can develop its own EPMS if it cannot find suitable system for performance
measurement. Environmental performance measurement systems (EPMS) can be seen
as a part of environmental management system as EPMS help companies to focus on
environmental sustainability. Pham et al. (2020) identify six different principles for cre-

28
ating a general EPMS framework which can be adapt to specific industry if needed. Two
of them are general principles and the other four are contextual principles. First princi-
ple is a strong sustainability-based view of the organization. It is important to recognize
the importance of natural capital and separate renewable and non-renewable matters
to guarantee sustainability. Second principle is that data quality, variable specificity and
relationship clarity are required for quality decisions. This principle highlights that in
addition to high quality data company should also specify the meaning of different
variables and define the relationship between the variables.
Third principle is first contextual principle Pham et al. (2020) present and it states that
systems architecture of the organization in relation to flows of natural resources must
be understood. Principle’s name basically says it all, it is important to realise renewable
and non-renewable resources and understood different costs and wastes. Fourth
principle is the development of a valid summary environmental and economic
sustainability measure. This means developing a ratio between economic sustainability
parameter and parameter which describes company's use of natural resources from
the point of view of environmental sustainability. A common ratio-based summary
measure is eco-efficiency, defined as the economic return (i.e., operating profit) on
quantity of environmental resources used. Pham et al. (2020) state profit to resource
cost ratio to be a good measure for this. It is operation profit relation to total resource
cost. Other popular measure for this purpose is seen to be eco-efficiency. Fifth
principle is parsimonious causal model establishes causal links between the summary
sustainability measure and sustainability drivers. To ensure the efficiency of production
decisions and operations, a causal model should be used to define the path to the flow
of information within the system. This causal model provide multiple advantages of
which most important and remarkable is that with this model can be provided good
information about EPMS’s key variables relationships. This will also upgrade decision
quality and thus second principle. Last principle is accurate, complete and forward-
looking measurement providing information with accessibility and integrity. EMPS
should be able to provide accurate information about environment and economic

29
outcomes. Sustainability factors must not only lie within parsimonious model but also
have adequate and reliable meanings to measure the value. In figure 5 all these
principles are categorised for general design principles and contextual design principles
and shortly presented the main aspects of each principle.
Figure 5 Key design principles for creating an EPMS framework.
In addition, there is a framework for creating a good environmentally sustainable logis-
tics performance management process (ESLPMP). According to Isaksson et al. (2019)
this framework includes five steps the first of which is selecting environmentally sus-
tainable logistics (ESL) performance variables. Selection is based for strategic priorities
and 3plsp need to satisfy customer and fulfil its requirements from environmentally
sustainable point of view. There are multiple different variables but fill rate, fuel type,
transportation, emissions, pollution, energy consumption and logistics system design
are most relevant examples for this case. Second step is defining ESL performance met-

30
ric. Coordinating and communication between 3plsp and customers is important for
choosing right metrics. Metrics can be chosen from many different sectors like energy,
3pl’s environmental assessment, fleet compositions, emissions, congestion, and mode
of transportation.
Isaksson et al. (2019) describes third step to be setting environmentally sustainable
goals. In previous step defined metrics need to be find suitable goals which drives ESL
interests. Customer-oriented operations consider the customer's requirements as well
as government regulations. Framework identifies multiple different types of goals like
quantitative goals, absolute goals, intensity goals, top-down goals, and bottom-up
goals. These goals can be settled as an average or a specific goal. For example, for CO2
metric quantitative goal could be to reduce use of non-renewable resources by a cer-
tain percentage or intensity target could be the reduction of CO2 per square meter.
Fourth step is to measure ESL performance metrics. This involves regularly collecting
data and reporting the feedback to inside the company and to the customer if needed.
This can be done directly via systems or indirectly by using spreadsheets. Last step is
analysis and action of ESL performance metrics. This step aims to analyse performance
outcome in relation to company’s strategies to see the current situation.
3.2.3 Logistics performance measurement systems and frameworks
Logistics performance measurement help companies to understand their logistics per-
formance and get good data about the logistics activities. In logistics time and flexibility
are key factors so continuous improvement to increase competitiveness and perfor-
mance is needed (Jazairy et al., 2017). Logistics is crucial part of company so making it
as efficient as possible should be ensured (Domingues et al., 2015). To be able to make
powerful decision related to performance, should the performance metrics and indica-
tors be chosen carefully.

31
There is not as good selection of performance measurement systems for logistics as for
environment. For overall logistics which includes financial and social side there is many
models and systems which can be utilized but only for transportation and activities
related to it available systems run short. That is why companies can use models and
systems which are indirectly linked to transportation. There is no separate standard for
logistics but ISO 9000 Quality Management family and previously mentioned ISO 14000
Environmental Management family both can give 3plsp a good guideline for successful
activities and good performance and its measurement. ISO 9000 Quality Management
family’s best known and only standard which can be certified to is ISO 9001 (Interna-
tional Organization for Standardization, 2015b). This standard provides requirements
for quality management system so company can fulfil customer requirements and
guarantee customer satisfaction. International Organization for Standardization (2018)
ISO 45001 Occupational health and safety standard provide good guidelines for em-
ployee’s safety working conditions which can be useful when creating logistics man-
agement or measurement system. Balanced Scorecard or Performance Pyramid System
or Performance Prism are supporting goal management and can be used as a tool but
should be noticed that these are not specialized in logistics or transportation (Irfani,
Wibisono & Basri, 2019).
Lean Six Sigma (LSS) is one framework which can be utilized for logistics sector. Accord-
ing to Gutierrez-Gutierrez, de Leeuw and Dubbers (2016) this framework can be used
to manage logistics performance. Alone Six Sigma is usually developed for total quality
management. Whereas Lean philosophy aims for performance improvements like
shorter lead and delivery times and better quality. So these can be utilized separately
but to achieve best outcome should these integrate into one big wholeness. With LSS
company can improve customer satisfaction, shorter lead times and reduce costs. In
addition, Irfani et al. (2019) Identifies Supply Chain Operation References (SCOR) and
Logistics Performance Index (LPI) which can be used as a tool for performance meas-
urement. SCOR is designed for supply chain operations, and it split these supply chain
processes into five different processes: planning process, procurement process, pro-

32
duction process, delivery process and return process. With SCOR company can figure
out how these processes interact and perform (Ntabe, LeBel, Munson, & Santa-Eulalia,
2015). Rezaei et al. (2018) tells LPI to be a tool to measure logistics performance and to
find out possible challenges and opportunities performance can face. Purpose of LPI is
to weight six components from poor performance (1) to excellent performance (5).
These components are customs, infrastructure, services, timeliness, tracking & tracing
and international shipments. LPI score is calculated by using normalized scores of each
component multiplied by their corresponding components loadings.
Domingues et al. (2015) present a common performance measurement system for lo-
gistics where logistics activities are categorized in three dimensions. First dimension is
activities which include logistics activities like transportation, warehousing, and infor-
mation and communication. Second dimension is actors who include different actors
related to logistics like third-party logistics providers, manufacturers, and consumers.
Last dimension is decision level dimension which include three different levels: opera-
tional, tactical, and strategic. Operational level measures low level managers’ activities,
tactical level mid-level management decisions and strategic level concern top level
management decisions. In this way, the functions can be divided into basic elements,
which help by improving only one dimension can get different indicators. For example,
if improving actor dimensions like third-party logistics provider, we receive indicators
which are result from the combination of activities and levels of decision for the third-
party logistics provider.
Sometimes it is just better to develop own system to make sure it serves 3plsp needs.
Irfani et al. (2019) recognize six phases for developing a performance measurement
system for logistics sector. First phase is selecting the case which mean identifying and
selecting companies which have multiple roles. Second phase is defining the problem.
This includes gathering the data form stakeholder to be able to identify the problem.
Third phase is performance indicators selection. Indicators are selected based on com-
pany’s documents and information provided by stakeholders. These identified perfor-

33
mance indicators are divided into three categories: strategic resources, performance
drivers and performance output. When performance indicators are identified is time to
identify most relevant indicators to be key performance indicators. Fourth phase is
building a system dynamics model. With this model and involved tools it is easier for
company to understand systems dynamics. Fifth phase is to validate the model by es-
tablishing a base case. In fourth phase developed model should be validate in this
phase with help of different procedures like comparing components behaviour, doing
some testing and analysis, and having some built-in dimension checking routines. Last
phase is conducting policy and strategy experiments. This can be done with different
tools like simulation tool and snenario analysis.
3.2.4 Performance analysis
Data analysis is a relevant part of performance measurement and management. Data
analysis gives company a feedback about its actions and selections performance. With
help of analysis company can more easily make decisions and get better solutions for
its problems. Choosing a correct analysing tool can be difficult as there are multiple
tools which fit for different purposes, industries, and companies. (Isaksson et al., 2019).
This chapter present few analytics tools. In addition to presented tools company can
use other tools also.
Stitch (n.d.) present top 25 different data analysing tools where first is Microsoft Power
BI tool for data analysis. It is a very broad and comprehensive tool which support many
different data sources. With Power BI company can make reports and dashboards and
combine them for one to get simplified view. Second tool is SAP BusinessObjects tool
which allows company to analyse data and make reports. This tool is designed less
technical companies, but it can still perform some complicated analysis. Third tool is
SAS Business Intelligence analytics tools which provides inclusive and flexible platform
for self-service analytics. This tool is more expensive than some of its competitors, but
price can be explained with its diversity and good features. IBM SPSS Statistics tool is

34
versatile tool with many different features to use for data analysis (International Busi-
ness Machines Corporation, n.d.). With this tool company can easily analyse data with
developed statistical methods.
3.3 Performance indicators
Performance indicators are tools for measuring performance. With these indicators
company get data about its actions and their successfulness. With this information
company can evaluate its decisions effectiveness and help management to do decisions
and create transparency inside company. Kucukaltan et al. (2016) and Parmenter (2015,
p.4) present performance indicators selection to be important to get accurate infor-
mation, but selection of key performance indicators to be even more important as KPIs
provide even more detailed knowledge for better performance. KPIs are indicators
which measure most relevant parts of performance for the company to succeed.
Badawy, El-Aziz, Idress, Hefny and Hossam (2016) tells that in addition to PI and KPI can
be identify fine result indicators and key result indicators which are not handled in this
thesis. Usually, all these indicators are described as onion where KPI is the core of the
onion which provide most information and PI is next layer after that. Result indicators
and key results indicators are top layers which present information for big picture.
3.3.1 Indicators’ selection and significance for company
CO2 emissions like many other indicators can be measured different ways. To know the
correct way Parmenter (2015, p. 107–118) identifies seven foundation stones which
are the base for successful KPIs. These first stone include creating partnership which
requires seamless collaboration between customers, management, employees, and
other possible stakeholders. Second stone is transferring power to front line workers
requires training, communication, responsibility transferring to company employees.
Third stone highlights importance of developing framework for performance to know

35
how to measure and report results. Fourth stone state that companies should choose
their KPIs among their critical success factors whereas fifth stone emphasize the need
for abandonment to show that they understand what initiatives work and what does
not. Sixth stone highlights measurement approach which includes trained staff, coun-
selling and supporting staff and management partnership. Last stone is understanding
the meaning on KPI. Definition of KPI should be clear to management and staff to en-
sure successfulness.
3.3.2 Environmental performance indicators
There is multiple different indicators 3plsp can use to measure environmental perfor-
mance. Companies can choose direct environmental indicators which measure the per-
formance or indirect indicators which are more related to companies’ business deci-
sions (Oršič, Rosi & Jereb 2019). Environmental indicators related to business decisions
are success of environmental standard use, reduction of energy consumption, reduc-
tion of the scope of recycling and reduction of environmental incident. Success of envi-
ronmental standard use indicator shows 3plsp commitment to environmental actions
from performance standard, like ISO 14000, point of view. Reduction of energy con-
sumption indicator shows commitment to environmental policy by doing energy effi-
cient decisions. Reduction of the scope of recycling aims to indicate companies’ waste
recycling management successfulness. By reduction of environmental incident indica-
tor company can show its awareness of logistics activities possible causing incidents
and minimize these incidents with this indicator. To measure directly environmental
performance company can use the following indicators: Measuring and reporting on
environmental performance, reduction of emissions into the air, reduction of water
pollution and consumption and reduction of solid waste. With measuring and reporting
on environmental performance can get information from environmental situation and
actively work towards a better environment. Indicator of reduction emission into the
air is very crucial indicator to use as transport produce a huge amount of pollution into
air. This indicator is almost necessary not only due to multiple government guidelines

36
and legal requirements but also common environment program which are important
for company’s reputation. Reduction of water pollution and consumption indicator is
important for 3plsp as in addition to air, logistics activities have an influence on water
resources. By indicating reduction of solid waste help to manage solid waste produced
by logistical activities.
These indicators may also be supplemented by those presented by Isaksson et al.
(2019). Energy use can be measured with fuel use indicator and total fuel consumption
from non-renewable sources indicator. Carbon dioxide (CO2) emissions are good indi-
cator to measure for reducing emissions. The fuel use multiplied by heating value and
emission factor is one way to calculate CO2 emissions. Also, distance travelled multi-
plied by emission factor is one way to express CO2 emissions and average fleet CO2
emission per unit driven another way. Article also present interesting indicator related
to 3plsp environmental assessment. It is the percentage of new suppliers using envi-
ronmental criteria. This helps to see the interest of other companies in environmental
issues.
3.3.3 Logistics performance indicators
3plsp can choose their indicators for measuring logistics performance from multiple
different indicators. Most popular indicators are on-time delivery and logistics cost
which both stand out almost in every literature where logistics performance indicators
are talked about. Also Domingues et al. (2015) recognize these indicators and mention
that on-time delivery describes right goods delivery at right time and in agreed condi-
tions and logistics cost in this situation refers to transportation costs (Domingues et al.,
2015). In addition, truckload utilization and vehicle routing are seen efficient indicators
for logistics performance according to Wong, Tai, and Zhou (2018). In truckload utiliza-
tion 3plsp can consider factors like time, distance, speed, capacity, and vehicle emis-
sions to make a successful plan. Vehicle routing includes planning as effective route as
possible to avoid congestion, improve delivery time and reduce the volume of carbon

37
emission. As can be noticed, these logistics performance factors may not only provide
information from logistics performance but they also help to improve environmental
matters. Many of these indicators serve both sides which make these indicators very
efficient and important for company. These indicators are very powerful to choose for
both environmental and logistics performance measurements.
Along with these Isaksson et al. (2019) identifies many other indicators which compa-
nies can use to measure its logistics performance. Congestion is one of the main ques-
tions and challenges in logistics as it can have huge impact to transportation success-
fulness. Off-peak distribution indicator can be used to figure out transportation made
outside the off-peak and percentage of delivery by modes of alternative transportation
indicators be used to find out how many deliveries are replaced by another transporta-
tion mode due to congestion. Fleet compositions can be indicated with vehicle type,
average fuel consumption and total number and age of fleet. To measure the mode of
transportation can be used indicator which counts the number of freight deliveries by
mode per unit of time. All environmental and logistics PIs are presented in table 1.
Table 1 Performance indicators
PERFORMANCE INDICATORS REFERENCE
Environment
Success of environmental standard use Oršič, Rosi & Jereb, 2019
Reduction of energy consumption Oršič, Rosi & Jereb, 2019
Reduction of the scope of recycling Oršič, Rosi & Jereb, 2019
Reduction of environmental incident Oršič, Rosi & Jereb, 2019
Measuring and reporting on environmen-tal performance
Oršič, Rosi & Jereb, 2019
Reduction of emissions into the air Oršič, Rosi & Jereb, 2019
Reduction of water pollution Oršič, Rosi & Jereb, 2019
Consumption of solid waste Oršič, Rosi & Jereb, 2019
Reduction of solid waste Oršič, Rosi & Jereb, 2019
Fuel use Isaksson, Hulthén & Forslund, 2019
Total fuel consumption from non-renewable sources
Isaksson, Hulthén & Forslund, 2019
Percentage of new suppliers using envi- Isaksson, Hulthén & Forslund, 2019

38
ronmental criteria
Carbon dioxide Isaksson, Hulthén & Forslund, 2019
Logistics
On-time delivery Domingues, Reis & Macário, 2015
Logistics cost Domingues, Reis & Macário, 2015
Truckload utilization Wong, Tai & Zhou, 2018
Vehicle routing Wong, Tai & Zhou, 2018
Congestion Isaksson, Hulthén & Forslund, 2019
Off-peak distribution Isaksson, Hulthén & Forslund, 2019
Percentage of delivery by modes of alter-native transportation
Isaksson, Hulthén & Forslund, 2019
Fleet compositions Isaksson, Hulthén & Forslund, 2019
Mode of transportation Isaksson, Hulthén & Forslund, 2019
3.4 Theoretical framework
This sub-chapter forms theoretical framework for this research based on information
provided on literature review. Theoretical framework builds a theoretical base for the
research and for the process of performance measurement. The chapter includes chal-
lenges what 3plsp may face during the whole process of building performance
measures. What indicators to choose and how to monitor, analyse and develop the
indicators are also considered.
3.4.1 Challenges of performance measurement and performance indicators
Companies can face multiple challenges during different phases of developing perfor-
mance measures. Time and many decisions are needed to find successful performance
indicators. Choosing goals, measuring systems, management systems, indicators, ana-
lyse tools, and development methods are all important questions what needs to be
take care of. Literature review shows that performance measurement requires a lot of
things to consider where the first one is setting the company goals both for environ-
mental and logistics side.

39
Goals are the base for everything else and they guide the whole process, so it is im-
portant they are formatted clearly. Environmental goals are strongly guided by different
environmental regulations and programs like Agenda2030. In addition to Agenda2030,
company should follow CSR guidelines to ensure its ethical and responsible business.
Environmental goals company usually have considers mainly emissions like greenhouse
gases or carbon emissions. Logistics usually have one main goal which is to get the right
product in right time in right place. This is goals which can be linked to different parts
of supply chain. Logistics goals of transportation can thus be this one or then some else
goal which related to whole transportation process. To get the product from produc-
tion process to consumer is a complex process where different parts of the process
need to work together. In addition to transportation other operators are also needed
for the process and due to nature of this main goal and the complex process, smaller
goals and actions are needed to fulfil the main goal. Significance of smaller goals is re-
markable as they ensure that it is possible to achieve the main goal like Gencer and
Ackere (2021) stated. Even though this study of Gencer and Ackere was executed for
energy sector are goals creation very similar for other industries also and that is why
this study can be utilize for logistics side performance and goals in addition to envi-
ronmental one. Leal and Azevedo (2016) also recognize the importance of creating
goals for different time frames and different levels which supports other theories.
Tung et al. (2018) discover measurement system as an effective tool for performance
measurement so choosing the most appropriate and effective system for company’s
use is a big challenge. Company can always develop its own system if suitable system
cannot be found. Performance management and measurement systems are necessary
for company to keep it business up to date. Measurement systems and management
systems usually give directions what indicators companies should choose but final deci-
sion is always companies’ own. Indicators’ selection is a biggest challenge as companies
must consider how many indicators should be chosen, which are the KPIs and which
normal PIs.

40
Usually, companies face challenges considering effectiveness of indicators and how to
analyse and develop the indicators. How analysing and data gathering should be done
to get good information about indicators successfulness is important question. Indica-
tors’ development is based on results achieved from analyse it is very important to do
analyse in proper way to maximize indicators development. Doing small changes can
bring very remarkable changes so it is challenged to realise how big changes are really
needed. Even though there are own challenges in every step of performance measure
selection process there are still universal challenges which should be considered in
every step of the process. Transparency is important both for company and for cus-
tomer and usually even required by the systems like EMAS. Reliability, validity, credibil-
ity is also factoring what should be considered during the whole process.
3.4.2 Selection of indicators
Indicators’ selections are in a key position when measuring performance. Choosing
correct indicators is difficult and there are multiple issues affecting to decision making
but decision need to be made. Parmenter (2015, p. 26–27) highlights that it is im-
portant company just do not choose every possible indicator and hope to get some
useful information. Indicators need to be selected carefully and recognising KPIs and
PIs is important. KPIs should bring more and deeper information whereas PIs are giving
basic information and acting as a supporting indicator. Parmenter (2015, p. 4) stated PIs
tell management what they are doing but KPIs tell how company is performing with
their most critical factors. It is important to spend enough time to recognise the indica-
tors correct so in analysis phase the achieved data is accurate enough. Parmenter’s
(2015, p. 107–118) seven foundation stones is a useful framework to use at KPIs selec-
tion. This framework helps to handle the KPIs more deeply and gain better understand-
ing of what is required of KPI.

41
Indicators’ selection should be based on company goals. Company goals presents what
company wants to achieve and performance measurement investigates company’s suc-
cess in specific area, so it is natural to base indicators’ selection to company goals. In
addition, different standards, or programs what company follows guide the indicators
selection. ISO 14001 is common standard which many 3plsp follow and it can give
company valuable information about environmental indicators and environmental per-
formance measurement overall. Whole ISO 14000 series is a useful tool for company to
focus on its environmental performance and even achieve financial benefits.
Indicators’ selection is only one part of performance measurement. Performance
measurement is important part of company and its successfulness so own systems for
performance management and measurement are needed. Performance management
system is needed to manage overall performance and especially for company goals.
Performance measurement system whereas is needed so company can measure its
action performance and provide information for the goals. Isaksson et al. (2019) ESLPM
is a good framework to use as it focusses on whole performance measurement process
from choosing the variables to analysis of results. In addition to that framework to
evaluate environmental impact like LCA should be adapted. For logistics performance
the systems are best to assemble with company itself by adapting different frameworks
to the systems. Lean and Six Sigma are effective tools for overall performance meas-
urement so they can be utilised also for logistics performance measurement alone or
together. ISO 9001 and ISO 45001 are useful standard for company but not necessary
only for logistics and transportation performance as they are designed to be used as an
overall tool for whole company.
3.4.3 Analysis and development of indicators
Indicators analysing has remarkable part in performance metrics effectiveness. It is
important to analyse indicators regularly to know if indicators are producing needed
information. Analysis includes data gathering, reporting the information, and giving

42
feedback (Isaksson et al. 2019). By analysing and measuring indicators it is easier to
improve indicators which help to measure performance more effective way. Analysis
helps to identify if KPIs and PIs are fulfilling their positions and providing the infor-
mation they are supposed to provide. However, it is not specified how often data
should be gathered and analysed so that is every company’s own decision and depend
on their needs.
Every company has its own way to analyse the indicators and do the data gathering.
Many questions should be considered when analysing indicators. Isaksson et al. (2019)
state that company should consider how often data is gathered and if reports are gen-
erated from system or indirectly via spreadsheets. Data can be gathered and analysed
daily, weekly, monthly, or whatever company decide. Company should also decide if
metrics measuring, and analysing is average or specific measurement and how the
feedback is given. Use of different tools is possible and very desirable because they can
help to achieve wanted outcome. For example, Power BI, SPSS, SAS, and SAP Busi-
nessObjects are tools what company can use as its data analysis tool. Measurement
systems, management systems and different certificates guides this analysing phase as
these systems usually have clear instructions what kind of measures should be used
and how to gather and analyse the data.
Metrics development is last part of performance measurement process. Development
is based on results of analysis as it is hard to improve actions if information about cur-
rent situation is missing. Then cannot be sure how big and what kind of changes are
needed. Should the indicator be changed, or does it just need some small fixing or
maybe the system is the worst problem? All these decisions are based on results of
analysis so focusing on analysis is important and will guide the whole development
process.

43
4 Research methodology
This chapter introduces research methodology of this thesis starting with the research
onion. Research process is also presented in this chapter step by step. This chapter
goes through the data collection method which specify how the information is collect-
ed. This chapter ends with data analysis method which represents how results are in-
terpreted.
This research is exploratory research which aims to answer question what KPIs 3plsp
utilize in their transportations environmental and logistics measures. Purpose is to ana-
lyse these KPIs and other decisions 3plsp’s use in their performance measurements and
thus provide some development ideas. Exploratory research fit for this usage as this
research focus on transportation in general at 3plsp’s. This research can help to identify
if there is need to study further and focus on specific transportation mode. This explor-
atory research features to show if there is potential to go further with the research
(Saunders, Lewis, & Thornhill, 2007). Saunders et al. (2007) also describe exploratory
research flexible research as received results guide the direction of the research. This
means that the further the research proceed the narrower the focus is.
Research onion framework is used to create methodology. Saunders et al. (2007) pre-
sent research onion which contain six different layers where outermost layers are for
more general information and innermost layers for more specific techniques. Layers
from outer layer to inner layer are Research philosophy, Research approach, Research
strategy, Research choice, Research time horizon and Research techniques and
procedures. Research onion for this research is presented in figure 6.

44
Figure 6 Research onion (adapted from Saunders et al., 2007, p. 102)
Starting from outer layer, the philosophy of this research is critical realism. Critical real-
ist handle things as he sees it (Saunders et al., 2007 p. 105). This means that critical
realist believes we are not experiencing things directly whereas sensations and images
of the things. In business life critical realist identifies the significance of different levels
and believes all these levels have capacity to make difference. Different levels can be
for example the individual, the group, and the organization. Approach of this research
is deductive which is theory testing approach. In this approach theory is first identified
and after that it is time to operationalize, make observations and test the theory and
last change the theory if needed according to Saunders et al. (2007 p. 117).
Research strategy for this research is survey which is very common choice for deduc-
tive study according to Saunders et al. (2007 p. 138–140). Survey can include many
types of questions like what, where, who, how much and how many. Survey is chosen
for this study as a research strategy because of this suitability and adaptability. Survey
enables the use of different questions which is needed for this study. There are multi-
ple different data collection techniques for survey method but in this study the tech-

45
nique is online interview with open-ended questionnaire. Research choice is mono
method. Term mono-method refers that study is only using one data collection method
and analysing methods related to it (Saunders et al., 2007 p. 145–146). In this study
one qualitative data collection technique and qualitative data analysis methods is used.
In this study data collection technique is online interview and data analysis method is
pattern matching.
This study has cross-sectional time horizon. According to Saunders et al. (2007 p. 148)
cross-sectional time horizon usually includes survey which also match for this study.
Cross-sectional studies focus on certain phenomena in certain time. This study focuses
on to find out how things are currently. In this case the phenomenon is environmental
and logistics indicators at 3plsp at transportation sector. Last layer is techniques and
procedures which refers to data collection and data analysis. Data collection is handled
deeper in sub-chapter 4.1 and data analysis in sub-chapter 4.2.
Research process of this study presented in Figure 7. First step of this research process
is to identify research objectives and question and to form the hypotheses. Research
objectives and question are directly based on the research idea and hypotheses are
relationship between two concepts or variables that can be tested. In this study there
is one research question which has three research objectives. There are also three hy-
potheses to be tested which are based on research objectives and main aspects of this
research. First hypothesis is that performance indicators selection is based on compa-
ny’s goals. This hypothesis requires finding out what are company’s goals and what
performance indicators it has chosen. Purpose of this hypothesis is to find out how
settled goals are reflected in the company’s operations. Second hypothesis is that more
value is given on environmental indicators than logistics indicators. In its simplicity, the
purpose of this is to find out what the company values in its operations. This second
hypothesis requires the information of performance indicators company use and what
of those indicators are chosen for KPIs. Third hypothesis is that performance indicators
are strongly guided by performance measurement system and frameworks. This hy-

46
pothesis tries to identify where indicators action is based on and if performance meas-
urement systems or frameworks are having great impact on indicators.
Figure 7 Research process of the study.
Second step is contacting potential companies. This step includes finding potential
companies and sending them email to figure out if they are interested to participate or
not. Some examples of interview questions were also provided to companies who were
interested to participate so they could get clearer vision what kind of research this is.
Third step is literature review which includes theories which are relevant to this study
considering research objectives and question. There are three main themes which are
strongly related to this study: third-party logistics, performance measurement systems
and performance measurement indicators. After literature review can be frame a the-
oretical framework for this research. Theoretical framework is kind of summary of lit-
erature review where most relevant theories and framework for study have picked up
to form a theory what to test for. Fifth step is creating an interview form. The interview
questionnaire consists of different questions which are based on literature review and
theoretical framework. These questions are formed in a way that information from
different views is received for the research question and objectives.
Last step is data collection and data analysis process. Data collection process including
data collection method is clearly presented in next sub-chapter. After the data has
been collected next sub-chapter presents data analysis. This focusses on different
aspects related to data analysis including data analysis method and results transcibing.
Results are presented and analysed in own chapter to in order to clearly distinguish
methodology and results. Suggestion how case company could develop its actions are

47
also included to results part. Last sub-chapter in results chapter is reliability and
validity chapter which focus on to discuss research findings credibility.
4.1 Data Collection
Finding case companies was first phase in data collection. Finding case companies was
difficult as some companies did not even answer back. Few answered back, where one
answer was refusing and two were corroborative. However, other of these companies
cancelled later so one company remain for the research. Data for this research is gath-
ered from the case company which is a Finnish logistics company which provides dif-
ferent transportation solutions for its customers. This company is a good case company
as it provides transportation in multiple different modes. Sample size is 1 as one re-
spondent from the case company answered the questions on behalf of the company.
Interview used for this research is semi-structured interview which is non-standardised
interview, and these are usually used for qualitative research (Saunders et al., 2007 p.
312). Interview was fulfilled via email and questionnaire were sent to respondent.
Open-ended question was used at this interview as they allow respondent to describe
the situation and provide broad answer according to Saunders et al. (2007 p. 329).
Open-ended questions are preferred in this research also before multiple choice ques-
tions as latter may have guided company’s answers too much. Interview consisted of
12 open-ended questions and company was supposed to answer each question both
from environmental performance view and logistics performance view excluding two
first questions which were indicated either one. Respondent answered to all the ques-
tions but for one question the answer was incomplete. Interview questions were con-
structed to same order as this study. This is study is organised the way that the subject
area goes deeper chapter by chapter. Interview questions are formulated with same
way to ensure the chronological order and understandability. First three questions fo-
cus on goals and their monitoring. Fourth question focus on performance measure-
ment systems. Rest of the questions are focusing on performance indicators and com-

48
pany’s experience about using the indicators. Interview questions can be found from
Appendix 1.
Interview includes questions from company goals, performance indicators and perfor-
mance measurement systems and tools. Questions are chosen based on identified the-
ory and chosen the way which give as comprehensive image from case company’s ac-
tions related to performance measurement as possible. Questions were answered by
case company’s traffic manager and his team. Fulfilling with email raise up a chance for
misunderstandings from both sides. Respondent was asked few times to specify its
answers as some questions were not answered or answers were short.
4.2 Data Analysis
Received answers are unwrapped and transcribed to written text for narrative mode
from short answer written with bullet points. This study use pattern matching as data
analysis method which is deductively based procedure (Saunders et al., 2007 p. 490).
First variation of pattern matching is referring to dependent and independent variables
and them relationship. This variation is used in this research and performance indica-
tors are dependent variables and independent variables consists of company goals and
performance systems and frameworks.
Theoretical framework is used to evaluate and explain company’s answers. At the same
time theoretical framework can be tested and make conclusions about its validity. Re-
sults are case company’s answers to interview questions and all the information pre-
sented in result section is received from the company. In results section all these an-
swers are presented, unwrapped, and explained. After presenting the results can dis-
cussion and analysis be made about the results. Discussion section considers more
deeply the meaning of results and what are reasons for these results. Discussion sec-
tion also aims to find the relation between results and theoretical framework that con-
clusions related to research question can be drawn in next chapter.

49
5 Results and analysis
Results are presented and discussed in analysis section and also some development
ideas are given at the end of analysis section. This chapter is concluded with the
evaluation of research validity and reliability.
Interview started with defining company’s short-term, mid-term and long-term goals
for transportations environmental performance and logistics performance. Company
defines its environmental goal between years 2020 and 2025 to be reducing emissions
and increase commissioning of alternative fuels. Goal for logistics performance is to
maximize production rate. This goal aims to increase load size and improving mileage
of vehicles. Goal will be reached by investing as diverse vehicles and equipment as pos-
sible that are suitable for the tasks of as many customers as possible. Company moni-
tors these goals yearly and update the goals for present if needed.
Company measures its transportations environmental performance with CO2 per tonne
km, NOX per tonne km, the percentage of alternative fuels in total kilometres and Euro
emission classes for engines. CO2 refers to carbon dioxide and NOX refers to nitrogen
oxide. Euro classes are linked to a harmful emission maximum limit to the health of
vehicles and these classes are legislated in European Union according to Autotuojat
(n.d.). To measure transportations logistics performance company has chosen to meas-
ure load balance, output, reliability of pick-up, reliability of delivery, loading time, un-
loading time, retrieved on time, delivered on time and load distribution daily. In addi-
tion, company also use idle transitions, idle driving percent and idle driving percent by
segment. From all these indicators company has chosen Euro classes, CO2 per tonne
km, NOX per tonne km, the share of alternative fuels in total kilometres, idle driving
percent and idle driving percent by segment for its KPIs.
Company has based its indicators selection to effectiveness which means it has chosen
metrics which measure things what company see it can affect by itself. In addition, cus-
tomer needs and requirements are affecting company’s decisions about indicators.

50
Data from these indicators are collected and analysed weekly. This collected data is
utilized by Power BI analytics which is reporting and analysis tool to combine and visu-
alize data. Power BI reports are viewed once a month. Information and data received
from indicators has been experienced very useful as for example investments has been
able to justify with concerned values. None of the indicators has not been experienced
useless and all indicators have provided information what was expected.
In addition to Power BI tool other used tools, systems or frameworks weren’t reported.
The person who responded to the interview did not know if company use some other
tools, frameworks or measuring systems for environmental performance and logistics
performance like Lean, Six Sigma, EIA or LCA. However the company has been awarded
with ISO 9001:2015 Quality management system, ISO 14001:2015 Environmental
management system and ISO 45001:2018 Occupational healt and safety system. From
table 2 all the questions and answers all presented. Questions are also included to
appendix 1 where they are presented more clearly and divided into groups.
Table 2 Answers from the interview
Question Answer
What are company’s short-term, medium-term, and long-term goals for environ-mental performance?
Reducing emissions and increase commis-sioning of alternative fuels during 2020-2025
What are company’s short-term, medium-term, and long-term goals for logistics performance?
Maximize production rate
How often are the targets reviewed and updated?
Yearly
What performance measurement sys-tems, frameworks or standards company have?
ISO 9001:2015, ISO 14001:2015 and ISO 45001:2018
What performance measurement indica-tors company use and for what purpose?
CO2 per tonne km, NOX per tonne km, the share of alternative fuels in total kil-ometres, Euro emission classes, Load bal-ance, Output, Reliability of pick-up, Relia-bility of delivery, loading time, unloading time, retrieved on time, delivered on time, load distribution daily, idle transi-

51
tions, idle driving percent & idle driving percent by segment
What are the key performance indicators among your performance indicators?
Euro classes, CO2 per tonne km, NOX per tonne km, the share of alternative fuels in total kilometres, idle driving percent & idle driving percent by segment
For what the selection of these indicators are based on?
Customer needs and requirements and to what company see it can affect by itself
How often is data collected and analysed from indicators?
Weekly
Has company managed to improve per-formance significantly? In other words, has the information obtained from the indicators been useful?
Information and data received from indi-cators has been experienced very useful as for example investments has been able to justify with concerned values
Which indicators the company may have found to be irrelevant or useless?
None of the indicators has not been expe-rienced useless
How often efficiency of indicators is moni-tored?
Once a month
How are these indicators measured? Power BI tool
5.1 Analysis about company’s goals
Case company’s environmental goals is very similar than other 3plsp environmental
goals are. However, one thing that make a difference are a percentage. Posti and Post-
nord have published specific percentage to decrease their emissions whereas case
company does not tell any specific percentage but only state the goal to be reducing
emissions. Even though these goals sound very similar a clear difference in their mean-
ing can be spotted. Goal with specific percentage make the goal more determined and
realistic. It also shows that company has familiarize itself with different aspects of envi-
ronmental goal and thus knows how much it can decrease its emissions. Setting precise
percentage for decreasing emissions may create pressure for achieving goal but on the
other hand it can motivate to push harder to reach the goal. Tolerating pressure is any-
how needed in business life so company should also be able to tolerate pressure about
goals.

52
Other matter that caught attention is environmental goals scope. Short-term, mid-term
and long-term environmental goals were asked but answer was received only for a
long-term goal. Case company did not highlight it was a long-term goal but as the goal
was made for five years, can be assumed the goal to be long-term goal as usually long-
term goals are set for several years. Changes in environment can take time and thus
reducing emissions and commissioning alternative fuels are not happening in fast
schedule so that may be the reason for missing short-term and mid-term goals. On the
other hand, case company environmental goal can include smaller goals for shorter
time frame and these goals are not mentioned because they have same aspects but for
shorter time frame. This idea would be much more probable if case company has spe-
cific percentage by which emissions are to be reduced. Then it would be easier to set
short-term goals for smaller percentage than long-term goal. However, settled goals for
environmental performance are very broad and that is why they are probably long-
term goals, as these are strategic level goals and usually very broad. No short-term or
mid-term goals is presented which can decrease the likelihood for success as these
intermediate goals are stated to help to receive the main goal.
It is also interesting that case company did not specify what emission its goal includes.
Usually, emissions are linked to CO2 emissions and in some cases NOX emission and
probably this is the answer for this also as company have indicators for NOX and CO2.
Emission can however include noise emissions, which are part of transportations. Oth-
er 3plsp’s did not mentioned about these noise emissions at their websites so accurate
information is not available. However, it may be that company want to focus on CO2
and NOX emissions first and after these have been brought under control company can
focus on less dangerous emissions like noise. Anyhow case company has clearly under-
stood the importance of reducing emissions and want to work for common good. Case
company’s environmental goals are following Agenda2030 regulations and especially
goals 12 and 13 which are focusing on fighting against climate change and enhance
responsible consumption.

53
Case company’s logistics goal is to maximize production rate. This goal does not have
time target, but it can still be seen valid all the time as maximizing refers to continuous
improvement and purpose is always to make sure that production rate is maximized.
However, this maximization of production rate is certainly planned for the longer term
as it is very broad goal, and these kinds of changes are not happening in short notice.
Company have settled smaller goals which intention is to help company to maximize
production rate. For example, in short-term can be focused to increase load size and
improving mileage of vehicles which in long-term can be seen as improved production
rate.
Compared to other 3plsp’s goals can be noticed that logistics goals are very common
but may be disguised different ways. This means that companies can pursue for same
goal but with different actions and smaller goals. For example, case company and other
3plsp’s did not highlighted that their goal is getting right product in right place, but the
focus was on different aspects like fulfilling customers’ requests and being trustful
partner. This shows that to get the right product in right place in right time is more like
prerequisite for companies and they create different goals which support this right
product in right place in right time mentality.
Related to second hypothesis the way both goals are presented not yet reveals if com-
pany highlights either one more. Environmental goals have time gap, but they are miss-
ing some shorter-term goals. Logistics goals has one bigger goal which includes some
smaller goals, but the time is missing from the goals. Case company monitor both envi-
ronmental and logistics goals yearly which is a good interval in this situation. In one
year enough has happen and can be seen some changes and development already. If
company had some short-term goals, would it be good to monitor them more often.
However now when have been stated logistics goals to be long-term goal and environ-
mental goals are clearly long-term goals, one year gap between monitoring is long
enough but not too short. There is still time to make chances in actions if case compa-
ny notices that goal is already achieved or may even be impossible to achieve.

54
5.2 Analysis about performance measurement systems
Respondent was not sure what kind of frameworks case company use for its perfor-
mance measurement and performance management. Company was asked if it uses
Lean, Six Sigma, EIA or LCA but respondent did not know if these are utilized in compa-
ny’s performance measurement. This was very crucial part of this thesis as the purpose
is to find out why some indicators are chosen and how systems or frameworks guide
indicators selection. As there is not precise knowledge if company use any of these
systems it is much harder to understand company’s decisions and what is the real situ-
ation with PMS’s. Company’s response does not support that hypothesis that PMS has
a great impact on indicators selection. Rather can be concluded that indicators selec-
tion is based on different things and PMS is only playing a background role in this part.
In total performance management PMS can have a huge and remarkable role but it
does not reach to indicators selection. That is why this answer from company does not
support the theoretical framework about PMS systems importance in performance
measurement so cannot fully agree with Tung et al. that PMS role in performance
measurement is very important. It can be important for overall performance but for
indicators selection PMS does not give straight guideline.
However, company has ISO 9001, ISO 14001 and ISO 45001 so can be stated that com-
pany follows these certificates’ regulations and guidelines. ISO 14001 includes basic
elements for environment management system and highlight the use of PDCA for cre-
ating the system. It is very likely that company has developed its own system and use
ISO 14001 guidelines for that. There is also chance that company utilize some previous
mentioned frameworks, but the respondent just was not aware about them. It is very
unlikely that company have no environmental management system or EPMS as bene-
fits received from these systems are invaluable.
Company has probably created own system for measuring and managing logistics per-
formance. One reason why it might have been easier to company to plan its own sys-

55
tem is its status at Finnish logistics sector. Company has ISO 9001 and ISO 45001 certifi-
cates, so it is very likely utilizing guidelines these two certificates are providing. Even
though these certificates can provide good guidelines for logistics systems these certifi-
cates alone do not provide enough to create system for logistics as these certificates
are eventually focusing on overall quality and occupational health and safety. Therefore,
it is reasonable to believe that company do utilize some other frameworks for logistics
measurement or management systems, but respondent just were not aware what
frameworks. Other potential chance is that company has no logistics measurement or
management systems, but it is fused in some other system.
It was surprising that respondent was not able to answer the questions about perfor-
mance measurement frameworks and systems. It is understandable that employees
have their own specialties and there is no need-to-know every part of the company,
but still raises a question why this specific question was not guided to person who does
know about it. Reason might be that company did not want to put too much time for
this, so they were not ready to recycle these questions from person to person. Re-
spondent did know about performance indicators, for what indicators are based on and
what analysis tools company is using. That is why it is weird that respondent did not
know about measurement systems. These systems are after all base for performance
indicators or at least guiding how to choose the indicators effectively.
5.3 Analysis about performance indicators
Company has environmental indicators and logistics indicators, and selection was not
very surprising. CO2 per tonne km and NOX per tonne km are common and clear indi-
cators for company as carbon dioxide emissions and nitrogen oxide emissions are topi-
cal emissions at transportation sector due to pollution produced by vehicles. These
indicators also help company to monitor its environmental goal achievement related to
pollution. The percentage of alternative fuels in total kilometres indicator is directly
related to company goal to commission alternative fuels. This indicator tells straight

56
how well company has managed in its goal. Together with these three indicators com-
pany can find environmentally efficient solution and see concretely how use of alterna-
tive fuels is affecting to count of emissions. However, company did not have any indica-
tors related to noise and vibration emissions and most probable reason is that these
emissions were not included in company’s environmental goal. Euro classes was totally
new indicator for me, and it was not even represented in literature review as no other
research presented or mentioned it. Euro classes is set out in European Union, so emis-
sions need to monitor carefully. This indicator help company to better understand its
situation with alternative fuels. Euro classes indicator also fulfil company’s CO2, NOX,
and the percentage of alternative fuels in total kilometres in indicators and these indi-
cators together help company to understand its actions effectiveness linked to compa-
ny’s vehicles. Chosen environmental performance indicators shows company’s desire to
achieve its environmental goals and act as Agenda2030 guides for better environment.
Idle transitions, idle driving percent and idle driving percent by segment are three cru-
cial indicators for logistics performance and it is good to have different point of views.
This allows to identify in where segments idle driving percent is biggest and put it into
perspective with big picture with idle transitions and idle driving percent. Idle driving
percent by segment also make it easier to figure out how it should improve route plan-
ning and delivery planning. Idle driving percent by segment is a useful indicator by it-
self but maybe the benefit could be even better if company have other indicators with
segment focus. For example, if delivery time or reliability of delivery also have delivery
time by segment and reliability of delivery by segment company could figure out if idle
driving percent at specific segment have an impact on delivery time at that certain
segment. Company did not classify what is meant by a segment in their case as seg-
ment can be many different things like customers, location, vehicles. This has an effect
to selection of what kind of indicators should be chosen with segment focus.
Another good example about company’s comprehensive actions for logistics perfor-
mance is deliveries and pick-up’s measurement. Company has chosen retrieved on time

57
and delivered on time which may seem similar with reliability of pick-up and delivery.
Difference is that retrieved on time and delivered on time are focusing only for time
where reliability of pick-up and reliability of delivery are focus on time and other things
like right product and right place. This shows that it is important for company to fulfil
customer request and to identify what is causing possible problems. For example, if
product is delivered on time but reliability of delivery is still not good it is easier to
identify what can be done better. In addition, loading time and unloading time shows
that company wants to focus on time handling which is necessary part of good logistics
performance. All these together support company’s goal to maximize production rate.
Indicators diversity like focusing on different point of views in measurements and the
focus on whole transportation process ensure that versatile information is received to
evaluate performance.
Other logistics indicators like load balance, output and load distribution daily support
these other indicators also and provide useful information for logistics performance
and goal achievement. For example, with load distribution daily can be figure out is day
of week has some impact on load distribution or if load distribution can be linked to
delivery or pick-up reliability. Indicator focusing on congestion transportation somehow
would have been a good indicator to supplement other indicators. With congestion
driving indicator company could better explain other indicators’ results like why deliv-
ery time is bad or pick-up reliability frail. This could help company to improve its action
and make more precise plans. From figure 8 can be seen all PIs company use divided to
environmental and logistics indicators and KPIs company has chosen among them.

58
Figure 8 PIs and KPIs used by the case company.
Indicators company has chosen are strongly related to company’s goals. Company aims
to reduce its emission and has chosen its indicators to CO2 per tonne km and NOX per
tonne km which directly refers to emissions. This same can be noticed from the alter-
native fuels side as increase of alternative fuels commissioning is company’s goal and it
use the percentage of alternative fuels in total kilometres as its indicator to measure
environmental performance. Connection between company goals and performance
indicators can be noticed from logistics side also as company name maximizing of pro-
duction rate as its logistics performance goal. Indicators for logistics performance are
not as clearly linked to goal as in environmental performance but the connection can
still be noticed. All the indicators company use for measuring logistics performance
describe company’s ability to manage its transportations. To maximize the production
rate, company need to monitor these indicators and make decisions based on the in-
formation received from the indicators. Thanks to these points the first hypothesis can
be accepted and stated to be true.

59
However, company tells to choose indicators based on customer requirements and
things they fell they can have an impact on, so it is interesting to find this strong link
between company goals and indicators selection. The key thing in this case is that ef-
fectiveness and customer requirements are also linked to company goals. When com-
pany is setting its goals, it should think what customer requires from the company and
base the goal at least partly for that. In 3pl customers and their requirements plays a
big role as without happy customers there is not a successful business. This also fits for
effectiveness as it is very likely to set goals which company feels they can reach so they
will make changes on things they feel they can affect. Even though company would
choose their performance indicators based on company goals but also on effectiveness
and customer requirements first hypothesis can still be accepted as there is not limited
that selection should be only based on company goals. Combination between all these
three would probably be the most effective as then is ensured that both customer re-
quirements and company own needs and desires are fulfilled.
Third hypothesis is that performance indicators are strongly guided by performance
measurement system and frameworks. Testing this hypothesis was not that easy as
company’s answer related to performance measurement systems and framework re-
mained quite unclear. ISO 14001 has very likely guided company its issues related to
environmental performance but the link between environmental performance indica-
tors and ISO 14001 is not very strong. Situation is same at logistics performance meas-
urement but there the link between ISO 9001 and ISO 45001 is even smaller as either
standard is not directly for logistics and its performance measurement. These frame-
works are more likely related to comprehensive performance measurement than di-
rectly to performance indicators. Even though it is very likely that company has devel-
oped its own systems for performance measurement, there is not any proofs and that
is why cannot be acted like the case company have a system for that. That is why the
truthfulness of third hypothesis remains unclear and as there is not enough links which
proves that performance indicators are strongly guided by performance measurement

60
system or frameworks and hypothesis need to be rejected. Needs to be noticed that
this does not mean that performance measurement systems and framework can guide
performance indicators. They still can guide but the significance is not that strong.
5.4 Analysis about KPIs
Can be clearly seen that company’s KPIs are more focused on environment than logis-
tics. Company has chosen CO2 per tonne km, NOX per tonne km, Euro emission classes
and the percentage of alternative fuels from environmental indicators for KPIs which
means that all environmental indicators company have are also KPIs. From logistics
indicators company has chosen idle driving percent and idle driving percent by seg-
ment which is only two indicators out of 12. These two logistics indicators selected to
KPIs are also indicators which brings information to evaluate environmental perfor-
mance and interpret environmental indicators. With idle driving percent company can
help to explain its CO2 and NOX emissions as idle driving increase unnecessary emis-
sions. Idle transitions were one of the PIs and it can be seen as a helping indicator for
environmental measurement, but it has not selected as a KPI. There are also many oth-
er logistics indicators what company did not select for KPIs. Delivery time and reliability
of delivery are both very important things for performance but as an individual indica-
tor they may not bring as much and deep information for company as KPIs should.
These other indicators are still good indicators to give supportive information for the
KPIs even though they are not selected for KPIs.
Considering KPIs regarding to company goals can be clearly seen that those environ-
mental goals achievement is supported more than logistics goals. Selected indicators
are more focused to monitor environmental matters and logistics goal is paid a much
less attention. Environmental indicators are strongly related to company’s environmen-
tal goals as CO2 per tonne km and NOX per tonne km are linked to reducing emissions.
Euro classes also refers to emissions reducing and share of alternative fuels in total
kilometres is related to increase commissioning of alternative fuels. Supporting logis-

61
tics goals achievement is very small part of KPIs and now company is monitoring its
logistics goal only with idle driving percent and idle driving percent by segment. Still
the chosen logistics indicators are supporting logistics goal achievement, so indicators
are chosen well. Table 3 shows all KPIs and the goal each KPI is referring in one table.
These are both very crucial part of production rate maximization as idle driving is very
worthless for the company and thus by minimizing idle driving can company improve
performance and maximize its production rate. These two are very effective indicators
but still adding one more indicator would complete KPIs selection and bring more logis-
tics focus on KPIs. Developing an indicator which measures on-time deliveries or relia-
bility of deliveries by segment would be an effective indicator to add among other KPIs.
It would give information about in which segment the delivery or delivery time is most
reliable and would give a much more information than just on-time delivery or reliabil-
ity of delivery.
Table 3 KPIs and goals they are related to.
Key Performance Indicator Performance goal
CO2 per tonne km Emissions reduce
NOX per tonne km Emissions reduce
Euro classes Emissions reduce
Share of alternative fuels in total kilome-
tres
Increase commissioning of alternative
fuels
Idle driving percent Production rate maximization
Idle driving percent by segment Production rate maximization
Second hypothesis is that more value is given on environmental indicators than logis-
tics indicators. The difference between quantities of performance indicators and logis-
tics indicators is remarkable as there is much more logistics indicators than perfor-
mance indicators. However, situation is not that unambiguous as quantity is not the
only thing what matters. If we look at KPIs we can notice that company has chosen all

62
its environmental indicators to be as KPIs and only two logistics indicators. These two
logistics indicators are also indicators which support environmental indicators as they
can explain some results what environmental indicators give. Thus, can be noticed that
company values more environmental indicators than logistics indicators and second
hypothesis is accepted.
These KPI selections shows that company values environment and it want to focus on
environmental performance especially. This is not only typical for case company but
also many other research highlighted environmental performance importance and
chose it before anything else. Today is also very common that environmental matters
overpower other things like logistics. Things that have previous been thought from lo-
gistics side have now also environmental point of view. If company earlier based its
vehicle selection only to logistics side now it focuses to choose correct vehicle from
environmental side also. Vehicles need to be able to utilize alternative fuels which do
not produce as much emissions as normal fuels. Environmental matters are very visible
in today’s business life so 3plsp’s need to focus on environmental problems first and
then solve other issues in a way that support environmental solutions.
5.5 Analysis about indicators overall
Company has a very realistic vision how to choose indicators and what are the suitable
indicators for the company. Company realise that it is reasonable to focus on things
what you can have an influence on and do what you can instead of focusing on issues
that are independent of company. Another thing affecting to indicators selection is
customer and its requests’. It is great to notice that customer has an impact on compa-
ny’s actions but same time it is necessary as in this industry it is very important to fulfil
customer requests. Unsatisfied customer will find another company which provide ser-
vices it needs. There can be things what company cannot provide for its customer like
correct vehicle but if problems are placed to delivery and pick-up times and reliability
of delivery and pick-up it can be a sign to a company that something should be im-
proved.

63
Company did not highlight that if they monitor how indicators work together like if
they support each other and help to interpret other indicators results. Now company
seem to have indicators which support each other and help company to better realise
what should be improved. For this reason, the indicators used by the company are cer-
tainly compatible. This argument is also strengthened by the fact that company has not
experienced any of its indicators to be useless. In this case every indicator seems to
provide something useful to other indicators as well as being informative enough by
themselves. This also shows company to succeed in indicators selection as there are
not involved any indicators which provide useless information for company but only
indicators which information is helpful and guide company onward. Company has been
able to justify investments with concerned values which also points out successful se-
lection of indicators.
Company is collecting and analysing data weekly which sound very reasonable as a lot
of data is accumulated in short time when you have many indicators. Analysation is
done by Power BI tool which is for sure a good tool for company as it is broad tool with
versatile features. In addition, with Power BI there is a possibility to create visual re-
ports which is very needed feature and help to understand the results. Report created
with Power BI are going through once a month. This is adequate time as in month
company can already see some changes and fluctuations clearer than if reports were
going through every week. Time gap between reports could be longer like every quar-
ter year as company’s goals are long-term goals but with one month gap company can
react quickly if something urgent appears.
5.6 Discussion about possible development ideas
Company’s performance decisions considering environmental and logistics perfor-
mance have overall quite well condition. However, clarity to company goals should be
increased. It remains unclear if company has settled environmental goals for shorter

64
time zone and if logistics goals even have specific time zone when they supposed to
achieve. By settling smaller goals for shorter time zone as they would work as an in-
termediate goal for main goals and help to achieve it. Logistics goals has one bigger
goal which is maximising production rate and other logistics goals are smaller goals
which help to achieve the main goal and drive towards it. This should be done for envi-
ronmental goals also and one theme what was completely left out from the goals and
indicators is employees’ know-how and education. Employees’ actions have great im-
portance, and they can bring company a major benefit for performance but also for
other matters like costs. Well-trained employees know how to act correctly in situa-
tions and help the company to develop. For example, by adding employee’s environ-
mental awareness employee can learn better route planning, vehicle handling and non-
idling policy.
Performance indicators are also something to develop. Isaksson et al. (2019) use at its
environmentally sustainable logistics performance management process targets for
performance indicators. This ideology could be utilized for company’s action also as
giving goals for performance indicators can help company to more easily find out how
useful some indicator is and if the indicators has provided what was expected. This can
prevent company to become “blind” about good and effective some indicator really is.
Even though company have not yet fell any indicator to be useless but so far, the indi-
cator may have brought information it is assumed to be very useful indicator. By setting
every indicator an own goal can find out how specific information it really provides and
if there is another indicator which could provide better and more relevant information.
This would allow a better development for indicators.
Company could also develop some congestion indicator to complete its other indica-
tors. Congestion indicator could measure ingestions by segment where the segment
could be vehicles or different areas or both. Then indicator would provide information
about what kind of vehicles are most likely to get stuck on congestion and what areas
have biggest congestions. Even though company’s indicators seem reasonable, and

65
company is satisfied with its own decisions in future it could focus more on indicators
which provide information multiple things. Idle driving indicators what company al-
ready use provide information about idle driving but at the same time they give infor-
mation how well company has planned its deliveries and routes for example. Adding
segments to different indicators can provide more value to indicators if indicators
quantity in otherwise stays reasonable. After all it is important that there are not too
many indicators whereas indicators should be carefully selected and suitable for com-
pany itself.
5.7 Reliability and validity of the study
5.7.1 Reliability
Reliability refers to how consistent findings used data collection methods and analysis
methods can provide (Saunders et al., 2007 p. 149). Reliability in qualitative study is
referring to if other researchers have reach same kind of observations (Saunders et al.,
2007 p.318). This study is very universal study for whole transportation sector so re-
sults would have not differed considerably if this same study were done by different
researcher. Of course, there is always a chance for different opinions and ways to inter-
pret achieved results so conclusions could have been different. If other researcher uses
different companies, then there is a great chance for major differences. It is important
to notice that there is only one company participating in interview. Even though the
results received from this company are informative and they support theoretical
framework cannot be abandoned the fact that with more respondent the results can
be different. This means that now this study has one company which happens to sup-
port the theory but if there would have been ten different companies the result could
have been totally different.
Saunders et al. (2007 p. 149–150) also identify different threats to reliability which
overcome can raise the reliability. First one is subject or participant error which refers

66
to choosing proper date and time for the interview. Neutral time would be the best
option for date and time according to Saunders et al. (2007 p. 149–150). Friday and
Monday are dates which are not so neutrals as on Friday people are looking forward on
weekend and on Monday the work week has just started. Interview questions were
sent to company on Monday afternoon which means that company have probably seen
email about interview questions at Tuesday morning. The company was given two
weeks to answer to interview questions to maximize that they can choose the best
possible time for themselves to answer the questions. Company sent their answer back
at on Monday. It necessarily does not mean that they have answered them on Monday
morning but very likely this is the case. That is why can be identify a small participant
error for this study.
Second threat is subject or participant bias (Saunders et al. 2007 p. 149–150). This is
referring to fact if respondents say something what boss wants, or they think boss
wants them to say. Interview questions was fulfilled online via email, so it is hard to
identify if there is something what sound like coming from other person mouth than
respondent. Therefore, this bias cannot be acknowledged but also not deny. Third
threat is observer error which is about different researcher have different ways to ex-
press the survey questions during the interview (Saunders et al. 2007 p. 149–150). This
study has only one researcher so observer error should not exist. However, this raises a
question about way of asking questions in this research. Have the way been proper or
is there some else way which would have fit better for the respondent? Last threat is
observer bias which refers to different ways to interpret results according to Saunders
et al. (2007 p. 149–150).
5.7.2 Validity
Validity is referring to finding’s appearance and if the findings really are about what
they are showing up according to Saunders et al. (2007 p. 150). Like in reliability there
is also threats to validity which are concerning research process comprehensively. First

67
threat this study faced was mortality as at the beginning of the study one company left
out of this research. This caused problems with participants as study was conducted
with one company. Even though this one company gave informative answers and con-
clusions could be drawn but the validity of these findings should be questioning.
After all, one company is very small part of whole 3pl industry so with multiple partici-
pants findings could have been totally different. Not to take all the validity out from
this study is important to consider that findings of this study strongly support the theo-
retical framework and they are very similar compared to other studies. This research is
supposed to be a general description for all 3plsp at transportation sector. This re-
search is very likely to work well for transportation sector for different transportation
modes but due to small number of participants cannot straight generalise the findings
for all other organisations, but small questioning is needed. Research does not classify
the indicators for some specific transportation mode, so it is easy to adapt this study
for different transport modes from this point of view also.
Interview as a data collection method for this kind of research is very common method
(Saunders et al., 2007 p. 138–140). Interview as a data collection method was a good
choice and fit well for this research. Interview was fulfilled via email so there was not
any face to face or video contact with respondent. This may cause some issues as via
email it is very important to form the questions so they are understood correctly, and
no multiple emails related to what some question might mean is needed. In this study
questions were understood quite well, only one question was problematic and it was
clarified to respondent once. Respondent still was not able to answer this question
properly, but the reason is probably the fact that it was not his speciality. Problems
with answering interview questions were tried to avoid by sending themes of questions
before the interview and provide enough time to answer the questions.
In this type of interview, it is also hard to notice if something said is coming from re-
spondent’s mouth or if it is something what someone else wants him to say. Interpreta-

68
tion of the data can also cause some validity problems and in this study only interpreta-
tion problem related to questions number four which is the questions which was clari-
fied to respondent once. Answer for these questions can be interpret in two ways: ei-
ther company does not use any performance measurement systems or then the re-
spondent just was not aware of them. This study ended up in the latter one as it is un-
likely that company have no performance measurement system.
Despite the problems this research was fulfilled in valid and reliable way. Research
would be more valid if there were more companies involved. Considering this situation
one company is enough and better than no companies involved. Even though compa-
ny’s answers were short, but they still told most relevant things and only what was
asked for. Company’s answer can be seen reliable as traffic manager answered for
questions. Results need to be interpreted in rational way and not draw too much and
too strict conclusions. Based on achieved results cannot crush any theories but will get
good directional results.
For this type of research there are multiple sources and previous research to utilize.
Most research are not directly linked to transportation or 3pl but as in different supply
chains actions and actors can have very close connection to each other. This allows to
use research which are linked to transportation but may not be executed by 3plsp or
research which are executed by 3plsp, but focus might be also in other actions in addi-
tion to transportation. Also, from 3plsp websites can found useful information which
can use to support case company’s answers or opposite.

69
6 Summary and conclusion
6.1 Summary of the research
Objectives of this study was to find out what PIs and KPIs 3plsp use in their
transportations environmental and logistics measurements and clarify why are these
indicators chosen. In addition, objectives include to finding out why are these
indicators chosen and analysing the effectiveness and efficiency of such performance
indicators and developing and proposing alternative solutions for performance
measurement and indicators. Performance describes how well company is fullfilling its
goals. That’s why performance is very important and crucial part of company’s business
and as performance indicators are strongly related to performance itself should these
indicators pay attention to. By focusing on these indicators’ improvement and
efficiency maximization can be ensured that the needed information which help
company to improve its business is received.
This study includes three hypotheses which were chosen based on main aspects of this
research : performance indicators, enviromental performance and logistical
perforamnce. First hypothesis for this research is that performance indicators selection
is based on company’s goals. Second hypothesis is that more value is given on
environmental indicators than logistics indicators. Third hypothesis is that performance
indicators are strongly guided by performance measurement system or frameworks.
The researh was a deductive study which includes survey as a data collection method.
Survey was fullfilled as an interview which was conducted via e-mail using open-ended
questions. This research has one company as a participant for the interview and
company’s traffic manager answered the questions on behalf of the entire company.
Answers were interpreted as well as analysed and results were compared to theory.
Depent variables for this case were performance indicators and independent variables
consists of company goals and performance systems and performance frameworks.
Purpose was to figure out the relation between different variables and thus investigate

70
from what variable and variables performance indicators are dependent on. For open
questions respondent has possibility to explain issue clearly and give answer by own
words but this chance was not utilized in this research. Answers received from
company were adequate but not broad and they did not gave a any groundbreaking
information.
Company choose indicators related to emission and alternative fuel usage but also a lot
indicators related to transportations times and reliability. KPIs consists only of
environmental indicators like CO2 per tonne km, NOX per tonne km, Euro emission
classes and the percentage of alternative fuels. These questions helped to answer on
second hypothesis like did company goals which in environmental performance are
focus on reducing emissions and increase commissioning of alternative fuels and in
logistics performance is to maximize production rate. PIs, KPIs and company goals also
strongly guided the first hypothesis and its outcome. All these selected indicators
seemed to fit together and support each other. Can be stated that chosen indicators
really hit it right as every indicator can tell something by its own but also be used to
explain other indicators’ results. Results from PIs, KPIs and company goals had the lead
role where other questions and answers supported these and provided more precise
information.
Results showed that indicators selection is strongly based on company goals like stated
in theoretical framework. However it is not the only source as customer requirements
can have an impact too but it is the strongest one. Result also showed that company
invest a lot more on transportations environmental performance measurement before
logistics performance. This can be seen from KPIs for example as all KPIs were
environmental indicators. Even though this was one of the hypothesis of this study it
still surprised how big the gap between environmental performance and logistics
performance were. These allow first and second hypotheses to be accepted.

71
Question about performance measurement systems and frameworks was directed to
third hypothesis to figure out is performance measurement systems or frameworks
guides indicators selection. Unfortunately, in this research the benefit from that ques-
tion was kind of small due to incomplete answer. However, the answer showed that
PMS importance in performance selection is not that huge as was expected and high-
lighted in theoretical framework. That is why third hypothesis is not accepted. Other
questions about performance indicators and analysis related to indicators like, how
often data is both collected and analysed, and what analysis tool is used turned out
very needed also as they helped to strengthen the theory and helped to receive re-
search objectives.
Based on the results few development ideas were given to company. These mainly
focus on goals as company should focus to divide goals on different time period and
include both shorter and longer term goals on its business. Goals should be taken into
account at indicators also as adding every indicator a own goal whould help to identify
how well indicator is fullfilling its purpose.
The aim of this study was to provide information to 3plsp general guideline how to
select their performance measurement inficators and give useful information on the
selection of performance measurement indicators and the factors that has an effect to
these indicators. Research succeed to provide a relatively good guideline despite the
challenges in data gathering. However research was able to answer in main research
question and fullfilled research objectives. To summarize the final answer to the main
research question of this study “What are the key performance indicators (KPI) utilized
by third-party logistics in measurements? “, can be stated that KPIs used to measure
transportations performance are more likely environmental indicators which specially
focus to monitor different emissions.
72
6.2 Managerial Implications
The managerial implications are recommendations developed for the case company’s
people who are responsible on managing. The recommendations are based on findings
and development ideas presented in chapter 4. In this study used theory about
performance measurement and indicators selection was testes via case company and it
finded out to be a good common guideline for performance indicators among 3plsp.
Company has a very good situation with its performance measurement indicators in
environmental and logistics performance. However there is some small things what
should be pay attention to. One of the key findings of this research was company goals
significance in performance indicators. That is why goals should be specified and
expressed more clearly from the time and scope point of view. This means that goals
would be good to divide on short-term, mid-term and long term goals and specify what
goals are the main goals and what kind of smaller goals it may include.
Another implication for company is setting goals for performance measurement
indicators. Every chosen indicator should have it own goal as then it is possible to
follow up how indicators work for the company and if employees really have a right
idea about what every indicator can be used for. Focusing on these two aspects could
clarify company actions and functions to company employees and help to realise the
current situation better. Company could also make sure that performance indicators
really are up to date and serve what they are meant to serve. When goals are specified
clearly it is easier to select indicators which make it much more likely that selected
indicators are effective. By adding goals for every indicator can increase the
consciousness about indicators efficiency and use but also help to understand the
information indicator is providing.

73
6.3 Future research suggestions
Topic of this research is very universal, and this research aims to provide an overview
for whole 3plps transportations. Most natural research suggestion for the future is to
focus on specific transportation mode. Focusing on specific transportation mode ena-
bles to gain much deeper information about performance indicators and measurement
systems. Different transportation modes have different requirements and challenges so
more deeper conclusions and more explanations for different variables can be made.
Another way which this research can be guided to is 3plsp other actions. 3plsp can pro-
vide their services in different areas like distribution, packaging, warehousing etc. so
this study could be adapted to those. Environmental and logistics performance are sim-
ilarly measurable in other areas and very needed part of the business. Even though
environmental performance is very suitable for transportation due to its environmental
impacts there is environmental issues related to packaging materials for example. In
warehousing warehouse location and operational issues of warehouse are important
issues for successful business.
Future research topics are now suggested for different transportation modes and dif-
ferent actions 3plsp do. What is not yet discussed or proposed is the logistics without a
3plsp. This study focusses on 3plsp their transportations which they do for their cus-
tomer which is usually another company. Doing this research for company’s internal
logistics transportation which mean to focus on transportation which happen inside
the company.
Significance of economy is usually major as all decision have some affection to the
company financial issues. This research is about non-financial performance so one of
the future research topics could be about financial performance. Finding out what
transportations’ performance measurement indicators 3plsp have for financial perfor-
mance would give a whole new view for transportations performance indicators. In
future could be also studying performance indicators and their selection from the

74
economy point of view and what is the significance of economy when selecting per-
formance indicators for environmental or logistics performance. Also linking competi-
tive advantage to indicators and to how achieve competitive advantage with indicators
or their selection is one very potential option for future research.
One very potential way for future research is to do this same research but reassessing
theory or framework or changing research method. Involving more participants would
be one future research topic as then results of different companies could be compared.
This research showed that company goals have great impact in performance measure-
ment so another idea would be to focus mainly on goals affection and significance on
performance and built the theory around them.

75
References
Arababadi, R., Moslehi, S., El Asmar, M., Haavaldsen, T. & Parrish, K. (2017). Energy pol-
icy assessment at strategic, tactical, and operational levels: Case studies of EU
20-20-20 and U.S. executive order 13514. Energy Policy, 109, 530–538.
https://doi.org/10.1016/j.enpol.2017.07.042
Autotuojat (n.d.). Pakokaasupäästöjä koskevat normit EU:ssa. Retrieved 11.8.2021 from
https://www.autotuojat.fi/uutishuone/autoalan_termistoa/euro-paastoluokat
Badawy, M., El-Aziz, A. A. A., Idress, A. M., Hefny, H. & Hossam, S. (2016). A survey on
exploring key performance indicators. Future Computing and Informatics Jour-
nal, 1(1), 47–52. https://doi.org/10.1016/j.fcij.2016.04.001
DB Schenker. (n.d.). Ympäristö. Retrieved 14.1.2021 from
https://www.dbschenker.com/fi-fi/tietoja-meista/kestaevae-
kehitys/ympaeristoe
Domingues, M. L., Reis, V., & Macário, R. (2015). A comprehensive framework for
measuring performance in a third-party logistics provider. Transportation Re-
search Procedia, 10, 662–672. https://doi.org/10.1016/j.trpro.2015.09.020
European Commission. (n.d.). What is EMAS? Retrieved 19.2.2021 from
https://ec.europa.eu/environment/emas/index_en.htm
Fulzele, V., Shankar, R. & Choudhary, D. (2019). A model for the selection of transporta-
tion modes in the context of sustainable freight transportation. Industrial Man-
agement & Data Systems, 119(8), 1764–1784. DOI 10.1108/IMDS-03-2019-0169
Gencer, B. & van Ackere, A. (2021). Achieving long-term renewable energy goals: Do
intermediate targets matter? Utilities Policy, 71, 101243.
https://doi.org/10.1016/j.jup.2021.101243
Gutierrez-Gutierrez, L., de Leeuw, S. & Dubbers, R. (2016). Logistics services and Lean
Six Sigma implementation: a case study. International Journal of Lean Six Sigma,
7(3), 324–342. https://doi.org/10.1108/IJLSS-05-2015-0019
International Business Machines Corporation. (n.d.). Why IBM SPSS Statistics? Re-
trieved 29.3.2021 from https://www.ibm.com/products/spss-statistics

76
International Organization for Standardization (n.d.). ISO 14000 family Environmental
Management. Retrieved 19.2.2021 from https://www.iso.org/iso-14001-
environmental-management.html
International Organization for Standardization. (2015a). Environmental management
systems — Requirements with guidance for use (ISO Standard No. 14000:2015).
https://www.iso.org/obp/ui/#iso:std:iso:14001:ed-3:v1:en
International Organization for Standardization. (2015b). Quality management systems
— Requirements (ISO Standard No. 9001:2015).
https://www.iso.org/standard/62085.html
International Organization for Standardization. (2018). Occupational health and safety
management systems—Requirements with guidance for use (ISO Standard No.
45001:2018). https://www.iso.org/standard/63787.html
Irfani, D.P., Wibisono, D. & Basri, M.H. (2019). Design of a logistics performance man-
agement system based on the system dynamics model. Measuring Business Ex-
cellence, 23(3), 269–291. https://doi.org/10.1108/MBE-01-2019-0008
Isaksson, M. P., Hulthén, H. & Forslund, H. (2019). Environmentally Sustainable Logistics
Performance Management Process Integration between Buyers and 3PLs. Sus-
tainability, 11(11). https://doi.org/10.3390/su11113061
Jacyna, M., Wasiak, M., Lewczuk, K. & Karoń G. (2017). Noise and environmental pollu-
tion from transport: decisive problems in developing ecologically efficient
transport systems. Journal of Vibroengineering, 19(7), 5639–5655.
https://doi.org/10.21595/jve.2017.19371
Jazairy, A., Lenhardt, J. & von Haartman, R. (2017). Improving logistics performance in
cross-border 3PL relationships. International Journal of Logistics Research and
Applications, 20(5), 491–513. https://doi.org/10.1080/13675567.2017.1306036
Kengpol, A., Tuammee, S. & Tuominen, M. (2014). The development of a framework for
route selection in multimodal transportation. The International Journal of Logis-
tics Management, 25(3), 581–610.
Kestävä kehitys. (n.d.). 2030 Agenda for Sustainable Development. Retrieved 14.1.2021
from https://kestavakehitys.fi/en/agenda2030.

77
Khan, S. A. R., Jian, C., Zhang, Y., Golpîra, H., Kumar, A. & Sharif, A. (2019). Environmen-
tal, social, and economic growth indicators spur logistics performance: From the
perspective of South Asian association for Regional Cooperation countries.
Journal of Cleaner Production, 214, 1011–1023.
https://doi.org/10.1016/j.jclepro.2018.12.322
Kiesmüller, G. P., de Kok, A. G. & Fransoo, J. C. (2005). Transportation mode selection
with positive manufacturing lead time. Transportation Research Part E: Logistics
and Transportation Review, 41(6), 511–530.
https://doi.org/10.1016/j.tre.2005.07.003
Kucukaltan, B., Irani, Z. & Aktas, E. (2016). A decision support model for identification
and prioritization of key performance indicators in the logistics industry. Com-
puters in Human Behavior, 65, 346–358.
https://doi.org/10.1016/j.chb.2016.08.045
Leal, V. M. S., & Azevedo, I. (2016). Setting targets for local energy planning: Critical
assessment and a new approach. Sustainable Cities and Society, 26, 421–428.
https://doi.org/10.1016/j.scs.2016.04.010
Liikennefakta. (2021). Liikenteen kasvihuonekaasupäästöt ja energiankulutus.
https://liikennefakta.fi/fi/ymparisto/liikenteen-kasvihuonekaasupaastot-ja-
energiankulutus
Mareddy, A. R., Shah, A. & Davergave, N. (2017). Environmental impact assessment:
Theory and practice. Elsevier Science & Technology.
Ntabe, E. N., LeBel, L., Munson, A. D. & Santa-Eulalia, L. A. (2015). A systematic litera-
ture review of the supply chain operations reference (SCOR) model application
with special attention to environmental issues. International Journal of Produc-
tion Economics, 169, 310–332. https://doi.org/10.1016/j.ijpe.2015.08.008
Oršič, J., Rosi, B. & Jereb, B. (2019). Measuring Sustainable Performance among Logistic
Service Providers in Supply Chains. Tehnički vjesnik, 26(5), 1478–1485.
https://doi.org/10.17559/TV-20180607112607
Parmenter, D. (2015). Key performance indicators: Developing, implementing, and using
winning KPIs. Somerset: John Wiley & Sons, Incorporated.

78
Pham, H., Sutton, B. G., Brown, P. J., & Brown, D. A. (2020). Moving towards sustainabil-
ity: A theoretical design of environmental performance measurement systems.
Journal of Cleaner Production, 269.
https://doi.org/10.1016/j.jclepro.2020.122273
Posti A. (n.d.). Vastuullisuus Postissa. Retrieved 14.1.2021 from
https://www.posti.com/vastuullisuus/vastuullisuus-postissa/
Posti B. (n.d.). Postin strategia 2020–2022. Retrieved 14.1.2021 from
https://www.posti.com/posti-
yrityksena/strategia/#_ga=2.243666438.2040336852.1612359921-
1249378727.1612359921
Postnord. (n.d.). PostNord – vastuullinen valinta. Retrieved 14.1.2021 from
https://www.postnord.fi/tietoa-postnordista/yritys/vastuullisuus
Punakivi, M. & Hinkka, V (2006) Selection Criteria of Transportation Mode: A Case
Study in Four Finnish Industry Sectors. Transport Reviews, 26(2), 207–219.
https://doi.org/10.1080/01441640500191638
Rendtorff, J. D. (2019). Corporate social responsibility,
sustainability, and stakeholder
management. Philosophy of management and sustainability: Rethinking busi-
ness ethics and social responsibility in sustainable development, 43–52.
https://doi.org/10.1108/978-1-78973-453-920191004
Rezaei, J., van Roekel, W. S., & Tavasszy, L. (2018). Measuring the relative importance of
the logistics performance index indicators using best worst method. Transport
Policy, 68, 158–169. https://doi.org/10.1016/j.tranpol.2018.05.007
Saunders, M., Lewis, P. & Thornhill, A. (2007). Research methods for business students.
(3rd ed.). Pearson Education UK.
Statistics Finland. (2020). Greenhouse gas emissions fell in 2019, emission reduction
targets for 2013 to 2020 attainable [online publication].
https://www.stat.fi/til/khki/2019/khki_2019_2020-12-21_tie_001_fi.html

79
Stitch. (n.d.). Top 25 tools for data analysis and how to decide between them. Re-
trieved 29.3.2021 from https://www.stitchdata.com/resources/data-analysis-
tools/
Taşkın, A. & Demir, N. (2020). Life cycle environmental and energy impact assessment
of sustainable urban municipal solid waste collection and transportation strate-
gies. Sustainable Cities and Society, 61.
https://doi.org/10.1016/j.scs.2020.102339
Tripathi, S., Hudnurkar, M. & Ambekar, S. S. (2021). Selection of mode of transport for
freight movement. International Journal of Innovation Science, 13(3), 268–285.
DOI 10.1108/IJIS-09-2020-0173
Tseng, Y., Yue, W. L. & Taylor, M. A. P. (2005). The role of transportation in logistics chain.
Proceedings of the Eastern Asia Society for Transportation Studies, 5, 1657–
1672. Retrieved 13.6.2021 from
http://truck.ifco.ir/en/images/kamion/TRANSPORTATION%20IN%20LOGISTICS%
20CHAIN.pdf
Tung, A., Baird, K. & Schoch, H. (2018). The effectiveness of using environmental per-
formance measures. Australasian Journal of Environmental Management, 25(4),
459–474. https://doi.org/10.1080/14486563.2018.1506366
U. S. Department of Health and Human Services Health Resources and Services Admin-
istration (2011). Performance management and measurement. Retrieved
24.6.2021 from
https://www.hrsa.gov/sites/default/files/quality/toolbox/508pdfs/performance
managementandmeasurement.pdf
Wong, E. Y. C., Tai, A. H. & Zhou, E. (2018). Optimising truckload operations in third-
party logistics: A carbon footprint perspective in volatile supply chain. Transpor-
tation Research Part D: Transport and Environment, 63, 649–661.
https://doi.org/10.1016/j.trd.2018.06.009
Wood, D. F., Barone, A. & Murphy, P. (2002). International logistics. Amacom.
Wudhikarn, R., Chakpitak, N. & Neubert, G. (2018). A literature review on performance
measures of logistics management: An intellectual capital perspective. Interna-

80
tional Journal of Production Research, 56(13), 4490–4520.
https://doi.org/10.1080/00207543.2018.1431414

81
Appendices
Appendix 1. Interview questions for environmental and logistics perfor-
mance
Company goals
1. What are company’s short-term, medium-term, and long-term goals for envi-
ronmental performance?
2. What are company’s short-term, medium-term, and long-term goals for logistics
performance?
3. How often are the targets reviewed and updated?
Performance measurement systems
4. What performance measurement systems, frameworks or standards company
have?
Performance indicators
5. What performance measurement indicators company use and for what purpose?
6. What are the key performance indicators among your performance indicators?
7. For what the selection of these indicators are based on? Are indicators selection
based on goals or are goals built around selected indicators?
8. How often is data collected and analysed from indicators?
9. Have company managed to improve performance significantly? In other words,
has the information obtained from the indicators been useful?
10. Which indicators the company may have found to be irrelevant or useless?
11. How often efficiency of indicators is monitored?
12. How are these indicators measured?
Copyright © 2022 FDOKUMEN