mempertimbangkan perspektif service-dominant logic sebagai ...

A
Ssvorafifi©
K
lLpiu2slwiL
lm
h0
Journal of Retailing 91 (1, 2015) 89–108
Service-Dominant Orientation: Measurement and Impact on PerformanceOutcomes
Ingo O. Karpen a,∗, Liliana L. Bove b, Bryan A. Lukas b,c, Michael J. Zyphur b
a School of Economics, Finance and Marketing, RMIT University, Building 80, Level 11, 445 Swanston St, Melbourne, VIC 3000, Australiab Department of Management and Marketing, University of Melbourne, Level 10, 198 Berkley St, VIC 3010, Australia
c Department of Marketing, Lancaster University, Lancaster LA1 4YX, United Kingdom
bstract
A firm’s ability to offer better service and to co-create valuable customer experiences is critically important to achieving competitive advantage.ervice-dominant (S-D) logic, along with resource and capability perspectives, provides the underlying theoretical reasoning for the relevance ofuch capabilities. However, despite researchers’ recent contributions to marketing theory, empirical support for S-D logic and its implications isery limited at the strategic level. An open question, therefore, is what empirically constitutes a value co-creation capability, and what is its impactn important performance outcomes. Building on the conceptualization of an S-D orientation as a portfolio of value co-creation capabilities, thisesearch first operationalizes and validates an S-D orientation measure through a multi-study approach across different contexts. The authors thenpply the measurement instrument to an automotive retail setting to investigate the outcomes of S-D orientation in terms of both customer- andrm-related performance metrics. Results provide the first empirical demonstration of the importance of S-D capabilities, and thus S-D logic, forrms.
2014 New York University. Published by Elsevier Inc. All rights reserved.
eywords: Service-dominant logic; Service-dominant orientation; Value co-creation; Service capabilities; Value co-creation capabilities
atsa2bt
c
Service is central to firms’ competitive advantage, particu-arly in retail and manufacturing industries (Karmarkar 2004;usch, Vargo, and O’Brien 2007). Customers tend to developreferences for firms that are better at facilitating their resourcentegration activities, enabling pleasurable interactions, efficientse processes, and achievement of desired outcomes (Grönroos,006; Zeithaml, Berry, and Parasuraman 1996), and betterervice can enhance these valued experiences. Theoretically, theiterature has conceptualized this process as value co-creation,
hereby market actors depend on and benefit from the abil-ty to serve each other when integrating resources (Vargo andusch 2008). With this interdependence in mind, managers
∗ Corresponding author. Tel.: +61 3 9925 5877.E-mail addresses: [email protected] (I.O. Karpen),
[email protected] (L.L. Bove), [email protected] (B.A. Lukas),[email protected] (M.J. Zyphur).
ttpiacDmS
ttp://dx.doi.org/10.1016/j.jretai.2014.10.002022-4359/© 2014 New York University. Published by Elsevier Inc. All rights reserv
nd scholars seek to determine critical service capabilities andheir potential contributions to mutual betterment. In particular,ervice-dominant (S-D) logic (Vargo and Lusch 2004, 2008)nd co-creation frameworks (e.g., Payne, Storbacka, and Frow008; Prahalad and Ramaswamy 2004) challenge traditionalusiness thinking, requiring strategy researchers to reconsiderhe relevance of service capabilities.
Karpen, Bove, and Lukas (2012) recently introduced theoncept of S-D orientation, conceptualizing for the first timehe capabilities that enact S-D logic by enabling organizationso co-create value through service exchanges with networkartners. Six service-driving capabilities (relational, ethical,ndividuated, empowered, developmental, and concerted inter-ction) constitute this higher-order competence and enable valueo-creation practices. While this conceptualization of the S-
orientation represents an important step toward developingiddle-range theory of co-creation capabilities in the context of-D logic (Brodie, Saren, and Pels 2011), its validation requires a
ed.
9 of Ret
mif
ctwoetdemp(tr
Stdvpsskarrc
osmaes
T
roWvrscrvtatr
(nafieelsd
cafiIrheptt2q
wistpH1f
mtccbliripat
SC
fodT
0 I.O. Karpen et al. / Journal
easurement instrument. Moreover, without a measurementnstrument the strategic implications for managers that may ariserom an S-D orientation also remain speculative.
This paper empirically investigates S-D orientation and itso-creation capabilities by examining the construct’s opera-ional nature and nomological interdependencies. To this end,e develop and validate a hierarchical index to measure S-Drientation. In so doing, we focus on retail contexts, as retail-rs vary widely in how they prioritize and strategically leverageheir service capabilities. To operationalize S-D orientation, weraw on a procedure from prior research in this journal (Brocatot al. 2012) and execute five stages of measurement develop-ent and validation with fresh discrete samples. Avoiding a
otentially myopic, intra-organizational view of S-D orientationHarris 2002), we capture customers’ perceptions of S-D orien-ation in the context of a broader theoretically and manageriallyelevant nomological network.
The growing body of literature attesting to the importance of-D logic and the need for its operationalization remains mainly
heoretical. With this study, we advance marketing theory byemonstrating empirically for the first time the strategic rele-ance of S-D orientation and, therefore, S-D logic for businesserformance. Using dyadic data obtained in a retail setting, wehow that S-D orientation is an important driver of not onlyuperior firm-related performance, such as financial and mar-et performance, but also customer-related performance, suchs perceived value, satisfaction, affective commitment, trust,epurchase intentions, and positive word-of-mouth. Overall, ouresults indicate that firms, especially retail firms, can signifi-antly benefit from implementing an S-D orientation.
The paper is organized as follows. We first review the S-Drientation concept and its components. We then describe fivetages of data collection designed to assemble and validate aeasure of S-D orientation that we subsequently apply to an
utomotive retail context to test its strategic implications. Wend with a discussion of the implications and limitations of thetudy and suggest avenues for future research.
Conceptual Background
he Transition from S-D Logic to S-D Orientation
The introduction of S-D logic into the marketing literature haseinforced an emerging shift in marketing thought. On the basisf its evolving foundational premises (Vargo and Lusch 2008;illiams and Aitken 2011), S-D logic provides a service-based
iew of marketing phenomena that regards service as the coreeason for exchange, enabled primarily by operant resourcesuch as knowledge and capabilities and actualized through valueo-creation processes. Market actors interact with and combineesources interdependently while individually determining thealue of the associated experiences in terms of personal bet-
erment. For instance, customers engage with car dealershipsnd purchase vehicles for the services the cars provide, such asransportation, social status, and emotional and sensory expe-iences. During any interaction with firm-provided resourcesbsn
ailing 91 (1, 2015) 89–108
e.g., employees, websites, and products), customers, asetwork partners, co-create their own experiences by integratingnd potentially amplifying resources into valuable outcomes. Arm’s role is to facilitate and enhance these experiences (Karpent al. 2012; Payne et al. 2008) and subsequently benefit, forxample, in the form of knowledge and financial returns. S-Dogic accordingly represents a cognitive framework for mutualervice provision with the potential to guide marketing theoryevelopment and practice (Lusch and Vargo 2006).
Although managers might also adopt S-D logic and its prin-iples as part of their personal mindset, they would profit fromctionable guidance beyond a cognitive framework to help theirrm execute, and benefit from, S-D logic and S-D practices.n particular, firms “may successfully compete by integratingesources and developing superior competences to co-createigh value” (Andreu, Sánchez, and Mele 2010, p. 242). How-ver, the question arises as to which capabilities a firm shouldrioritize to facilitate and enhance value co-creation. In line withhe definition of S-D orientation as a set of strategic capabilitieshat enable value co-creation in service exchanges (Karpen et al.012), we argue that an S-D orientation can help to answer thisuestion.
Being better at co-creating valuable experiences with net-ork partners (any actors in the service system) is a strategic
mperative for firms to achieve competitive advantage, andervice-driving capabilities foster the transition from servicehinking to service practice. Based on resource and capabilityerspectives (Barney 1991; Day 1994; Day and Moorman 2010;unt and Morgan 1995; Peteraf 1993; Teece, Pisano, and Shuen997), and in line with S-D logic, such capabilities build theoundation for competing on service.
On the basis of an in-depth literature review and the involve-ent of 21 leading S-D logic experts based in universities around
he world, Karpen et al. (2012) propose a set of six strategicapabilities that, in combination, form a higher-order co-creationapability. Building on the conceptual understanding introducedy Karpen et al. (2012), we view S-D orientation as a portfo-io of organizational capabilities that facilitate and enhance thenterdependent integration of resources through individuated,elational, ethical, developmental, empowered, and concertednteraction. These capabilities are manifested in organizationalractices and support reciprocal value creation through mutu-lly service-driving resource deployments. We briefly describehese capabilities in the following discussion.
-D Orientation Components and Measurementonsiderations
Each of the six capabilities proposed by Karpen et al. (2012)acilitates and/or enhances collaboration with customers (andther network partners) to better integrate resources and inter-ependently create value (Vargo and Lusch 2008) as outlined inable 1.
The capabilities in Table 1 constitute an S-D orientation anduild a conceptual foundation in terms of executing and mea-uring S-D capabilities. To date, insights into its nomologicaletwork are based solely on conceptual grounds.

I.O. Karpen et al. / Journal of Retailing 91 (1, 2015) 89–108 91
Table 1S-D orientation capabilities and underlying reasoning.
Label of (sub-) construct Definition of (sub-)construct and reasoning
Individuated interaction capability An organization’s ability to understand the resource integration processes, contexts, and desired outcomes of individualactors within the service system.This capability enables organizations to better anticipate and sense the unique partners’ circumstances and desiredexperiences. Value co-creation is thus facilitated and/or enhanced as solutions can subsequently be offered that better fiteach partner’s idiosyncratic conditions.
Relational interaction capability An organization’s ability to enhance the connection of social and emotional links with individual actors within the servicesystem.The skill of connecting with and relating to partners supports an environment conducive to relationship building. Valueco-creation is thus facilitated and enhanced, as feelings such as bonding and belonging are fostered and social interactionprocesses are eased.
Ethical interaction capability An organization’s ability to act in a fair and non-opportunistic way toward individual actors within the service system.Ethical interaction manifests the organization’s ability to instill confidence in its partners that it will act in their best interestrather than at their expense. Value co-creation is thus facilitated and/or enhanced, as organizations interact with partners inless intimidating, exploitative, and deceiving ways, resulting in mutual benefit.
Empowered interaction capability An organization’s ability to enable individual actors within the service system to shape the nature and content of exchange.Empowered interaction addresses the involvement of partners in organizational processes so that they can shape resourcesand experiences in their favor. Value co-creation is thus facilitated and/or enhanced, as partners have a greater and moredirect say in the actualized outcomes.
Developmental interaction capability An organization’s ability to assist individual actors’ own knowledge and competence development within the service system.Developmental interaction represents the organization’s ability to educate partners and help them to become more skilled.Value co-creation is thus facilitated and/or enhanced, as more knowledgeable partners can make more informed decisionsand make better use of resources.
Concerted interaction capability An organization’s ability to facilitate coordinated and integrated service processes with individual actors within the servicesystem.The ability to synchronize service processes between partners is manifested in concerted interaction. Value co-creation isthus supported, as service system partners work together seamlessly to avoid value drains (e.g., time, effort, anxiety) thatnegatively affect their own experience or experiences of their partners.
O d enhem.
atSctfmsboeStc(
sscdoaidHom
cwnaesfiow
oyWpraOpgj
verall S-D orientation An organization’s ability to facilitate anindividual actors within the service syst
Generally, the selection of a measurement model should be conceptual choice that is theoretically driven and relates tohe conceptualization of the construct (Diamantopoulos andiguaw 2006). In the case of S-D orientation, a higher-orderonstruct is theoretically meaningful and provides, for example,he advantage of parsimony as a representation of the variousacets (e.g., Law, Wong, and Mobley 1998). A higher-orderodel also lends itself to a formative model specification (at the
econd-order level) with regard to the decision criteria offeredy Jarvis, MacKenzie, and Podsakoff (2003). For example, anrganization might prioritize certain capabilities of the S-D ori-ntation portfolio while achieving minimum levels for the other-D orientation capabilities. Consequently, the components of
he higher-order S-D orientation construct do not necessarilyo-vary and may have differing antecedents and consequencesKarpen et al. 2012).
In accordance with prior research (Jarvis et al. 2003), thistudy proposes a Type II construct, consisting of formativeecond-order and reflective first-order S-D orientation indi-ators. Although the latter indicators might capture slightlyifferent facets of a construct, they have a relatively high degreef interchangeability. Dropping an item in this case does notlter the domain of the construct it is measuring. Rather, thetems are merely different and imperfect realizations (havingifferent levels of accuracy) of their construct (Wong, Law, and
uang 2008). In contrast, dropping a capability from the higher-rder S-D orientation portfolio would significantly change theeaning of the construct (Karpen et al. 2012).tm
p
ance mutually beneficial interaction and resource integration processes with
Consistent with the requirements of a latent model and inontrast to the higher-order level, we assume that all itemsithin the specified components share a similar nomologicaletwork. For example, the indicators of ethical interaction, suchs not deceiving, exploiting, or misleading customers, would bexpected to be positively associated with management’s empha-is on a service-oriented perspective and customers’ trust in therm (Homburg, Fassnacht, and Guenther 2003). Having set theperational frame for the measurement of an S-D orientation,e now turn to the actual process of developing the instrument.
Measure Development
Our operationalization, validation, and investigation of S-Drientation consists of five stages of data collection and anal-ses involving academic, customer, and manager perceptions.e follow an in-depth development procedure consistent with
revious approaches (e.g., Brocato et al. 2012) and establishedesearch guidelines (e.g., Churchill 1979; Diamantopoulosnd Winklhofer 2001; Gerbing and Anderson 1988; Wetzels,dekerken-Schröder, and van Oppen 2009). The multiple sam-les collected for this study form the basis for a valid andeneralizable measure of S-D orientation, which is then sub-ected to validity and hypotheses testing. Fig. 1 summarizes
he stages of data collection and provides a description of theultiple samples.While the literature offers guidelines for developing eitherurely reflective (e.g., Churchill 1979; Gerbing and Anderson

92 I.O. Karpen et al. / Journal of Ret
1Wsaolsc
S
rtoeiitm
iicLteiacbb
iDsili
dhsf
S
fSedtpafipi
ecteabiwltc
d6wtcrp
S
D
tirpustbdStudent perceptions of the university and its staff are particularly
Fig. 1. Stages of measure development.
988) or purely formative constructs (e.g., Diamantopoulos andinklhofer 2001), both types are relevant to S-D orientation
ince it is a Type II construct consisting of reflective first-ordernd formative second-order indicators. In line with the benefitsf PLS path modeling (Hair et al. 2012), we follow the guide-ines (Becker, Klein, and Wetzels 2012; Wetzels et al. 2009) andpecifically the application for specifying formative hierarchicalonstruct models (Wilden et al. 2013).
tage 1: Item Generation
The development of formative and reflective measuresequires a domain specification that delineates the content ofhe new concept. Clear construct definitions specify the scopef the overall S-D orientation index and its components (Karpent al. 2012). We developed an initial comprehensive pool of 75tems to address the content of the sub-constructs by reviewing,n depth, the literature of S-D logic, service marketing, rela-ionship marketing, business marketing, marketing strategy, andanagement.In developing the items, we focused on organizational behav-
ors that customers would be able to assess after multiplenteractions with the organization. Given customers’ value-ontribution role in resource integration processes (Vargo andusch 2004, 2008), we argue that, as key network partners, cus-
omers are in a meaningful position to assess their interactionxperiences with the organization and reflect on whether suchnteractions have advanced their circumstances. For example,
retail salesperson may have sufficient training in service andustomer interaction, but unless this capability translates intoehaviors customers can observe, an internal perspective mighte biased or self-serving.
As a check of the content and face validity of our initialtem battery, we conducted ten face-to-face interviews with S-
logic experts in the U.S., New Zealand, and Australia. Weelected these experts because they had participated in a special
ssue of Marketing Theory (2006, Volume 6, Issue 3) on S-Dogic. During the interviews, we screened and adjusted exist-ng items and labels for clarity, readability, and relevance. TossL
ailing 91 (1, 2015) 89–108
etect item omissions and/or reword items to improve compre-ension, we also pre-tested the item battery with a convenienceample of twenty consumers and followed up with face-to-faceeedback.
tage 2: Item Evaluation
We submitted the resulting 66 measurement items to a dif-erent sample of 11 academics who were very familiar with-D logic through their own published research. We asked thesexperts to rate the representativeness of each item vis-à-vis theefinition of the S-D orientation components. The key item dele-ion/retention criteria were (1) conceptual relevance and (2) a 70ercent average score on a five-point rating scale (Lytle, Hom,nd Mokwa 1998). Participants also had the option of providingeedback to justify their ratings and list alternative or omittedtems. On the basis of this feedback, we modified or replacedoorly performing items. The net result was a refinement of thenitial 66 items with 11 manifestations per component.
Expert evaluations are necessary for formative constructs tonsure the relevance of the proposed construct indicators oromponents (Diamantopoulos and Winklhofer 2001). Hence,he eleven experts also evaluated the perceived importance ofach capability in terms of defining the S-D orientation constructnd indicated whether any theoretically relevant component hadeen omitted. On a five-point rating scale, the lowest meanmportance score was 3.70 (ethical interaction) and the highestas 4.44 (relational interaction). All components thus reached at
east 70 percent of the maximum importance score, confirmingheir individual relevance. The experts suggested no additionalomponents.
In a final round of expert evaluations, we asked an indepen-ent sample of 20 marketing faculty to match the remaining6 items to the most appropriate dimension. As our aim hereas to further consolidate the item battery, we retained items if
hey were grouped into the same category in at least 60 per-ent of the cases (Allison 1978). Through this process, weetained 42 of the 66 items for subsequent exploration andurification.
tage 3: Item Purification
ata collectionAs argued previously, customers are in a meaningful posi-
ion to judge an organization’s S-D orientation because of theirnvolvement in value creation processes. In line with prioresearch (Brocato et al. 2012), data for our item purificationrocess were gathered through a convenience sample of 222ndergraduate students from a large Australian university. Theample was representative of the demographic characteristics ofhe student cohort, as the typical student was female (56 percent),etween 20 and 35 years of age (68 percent). We asked respon-ents to evaluate the university with regard to its S-D orientation.
tudy-relevant because many internationally competing univer-ities define themselves as service institutions (Hennig-Thurau,anger, and Hansen 2001). Given their frequent interactions

of Ret
we
I
natowOau(watiicst3
SI
D
cfe(IDwlwt
I
(wTismpi
rrt(aw
ctctCasioi
vc1epcr1i1
Io
rHcilW
(starff(Vicnm
E
mwi
I.O. Karpen et al. / Journal
ith university staff, students are in an excellent position tovaluate co-creation processes and experiences.
tem purificationWe individually discussed the 42 items with a conve-
ience sample of five students, which resulted in some minordjustments. Subsequently, we performed an exploratory fac-or analysis as a preliminary evaluation of the dimensionalityf S-D orientation. We used a principal axis factoring approachith a promax rotation (Russell 2002). Both the Kaiser-Mayer-lkin test and Bartlett’s test of sphericity indicated that a factor
nalysis was appropriate. Six factors emerged with eigenval-es >1 that correspond with the a priori specified componentsKarpen et al. 2012). Following Steenkamp and van Trijp (1991),e subsequently analyzed each component individually and
ssessed its psychometric properties and unidimensionality. Inhe interest of achieving a parsimonious measure, we purified thetems according to several criteria, including within-dimensiontem-to-total correlations, reliability contribution (Cronbach’soefficient alpha), nature of item loadings (without specifying atringent cut-off at this exploratory stage), and unique concep-ual indicator contribution. Of the initial 42 items, we retained0 (five for each of the S-D orientation components).
tage 4: Item Finalization, Model Comparisons, andntra-Construct Validation
ata collectionTo assess the psychometric properties of the S-D orientation
onstruct and further purify the new measure, we collected datarom a second convenience sample of 301 students from a differ-nt large Australian university. The typical student was female56 percent) and between 20 and 35 years of age (67 percent).n this case, we asked the respondents to assess their bank’s S-
orientation. To ensure that subjects had sufficient interactionith their bank, we measured both the number of visits and the
ength of the relationship. The average length of a relationshipas 6.8 years and on average respondents visited branches 9.4
imes per year.
tem purification and evaluation of the latent structureUsing confirmatory factor analysis (CFA) with AMOS 20
Arbuckle 2011), we evaluated our remaining 30 items furtherith an iterative CFA item-deletion process (Steenkamp and vanrijp 1991). For example, an item was considered for deletion
f it had a combination of an unsatisfactory standardized regres-ion weight, a large standardized residual (>2.58) and/or largeodification indices, and a factor loading below .60. Four items
er S-D component were retained. Table 2 indicates the finaltems and factor loadings.
In terms of model fit, the factor structure reported in Table 2epresents the data well. We assessed fit along commonlyeported goodness of fit indices, such as the χ2/df, the compara-
ive fit index (CFI), the root mean square error of approximationRMSEA), the standardized root mean square residual (SRMR),nd the incremental fit index (IFI). As shown in Table 3,e assessed four competing models, selected on the basis ofr2at
ailing 91 (1, 2015) 89–108 93
onceptual relatedness and empirical correlations. We mergedhose components that showed the highest correlations whileonsidering conceptual implications of the merger. In additiono the goodness-of-fit metrics, we included Akaike’s Informationriterion (AIC) (Akaike 1987), which assesses both model fitnd the number of constraints required and which is particularlyuited for such model comparisons. The six-factor model, whichs in line with the conceptualization by Karpen et al. (2012),ffered superior model fit on the basis of all commonly reportedndices.
A construct possesses discriminant validity if its averageariance extracted (AVE) exceeds the shared variance (squaredorrelation) between any pair of constructs (Fornell and Larcker981). As Table 4 shows, in each case, the AVE (diagonal)xceeds the squared correlation (below diagonal) between com-onents. Further, as the composite reliabilities (CR) for eachomponent exceed 0.8, and the AVE scores exceed 0.5, theesults support convergent validity (Gerbing and Anderson988). In combination with our model fit statistics, these resultsndicate adequate unidimensionality (Gerbing and Anderson988; Steenkamp and van Trijp 1991).
nter-Construct Validity Tests: Multicollinearity Assessmentf S-D Orientation Components
So far, results have established the necessary psychomet-ic properties for the six reflective first-order components.owever, as these components themselves form the hierarchi-
al, second-order S-D orientation construct, our measurementnstrument needs to comply with index construction guide-ines (Diamantopoulos and Winklhofer 2001; Jarvis et al. 2003;
etzels et al. 2009).In line with recommendations from prior research
Diamantopoulos and Winklhofer 2001), we followed a multi-tep index construction process. The first two stages, referredo as content specification and indicator specification, we havelready addressed. The third step requires an indicator collinea-ity assessment. Multicollinearity among the six S-D orientationacets does not seem to pose a problem, as the variance inflationactors (VIF) are well below the common cut-off threshold of 10Kleinbaum, Kupper, and Muller 1988). The highest identifiedIF through SPSS 20 (Arbuckle 2011) is linked to individuated
nteraction capability (2.14), and the lowest to ethical interactionapability (1.34), as Table 4 shows. Consequently, no compo-ent of our S-D orientation construct needs to be eliminated orerged with another.
xternal/Nomological Validity Test
Index validation concludes with an external validity assess-ent (Diamantopoulos and Winklhofer 2001). In this study,e assessed external validity in terms of nomological valid-
ty, by linking the newly constructed instrument to theoretically
elevant outcome variables (Diamantopoulos and Winklhofer001). For this purpose, we chose two theoretical outcome vari-bles: customer satisfaction and positive word-of-mouth. Givenhat an organization adopting an S-D orientation focuses on
94 I.O. Karpen et al. / Journal of Retailing 91 (1, 2015) 89–108
Table 2CFA of S-D orientation in a retail banking context (AMOS-based).
n = 301 This bank and its representatives . . . RelationalInteraction(RI)
EthicalInteraction(EI)
IndividuatedInteraction (II)
EmpoweredInteraction(EMI)
ConcertedInteraction(CI)
DevelopmentalInteraction(DI)
RI1 make me feel at ease during our dealings. .688RI2 try to establish rapport with me. .789RI3 encourage two-way communication with me. .819RI4 show genuine interest in engaging me. .842
EI1 do not try to take advantage of me. .764EI2 do not pressure me in any way. .811EI3 do not mislead me in any way. .845EI4 do not try to manipulate me. .764
II1 make an effort to understand my individualneeds.
.859
II2 are sensitive to my individual situation. .856II3 make an effort to find out what kind of
offering is most helpful to me..761
II4 seek to identify my personal expectations. .795
EMI1 invite me to provide ideas or suggestions. .799EMI2 encourage me to shape the service I receive. .862EMI3 provide me with control over my
experiences..783
EMI4 let me interact with them in my preferredway.
.716
CI1 work together seamlessly in serving to me. .831CI2 act as one unit when dealing with me. .847CI3 provide messages to me that are consistent
with each other..771
CI4 ensure they have smooth procedures forinteracting with me.
.781
DI1 share useful information with me. .776DI2 help me become more knowledgeable. .862DI3 provide me with the advice I need to use
their offerings successfully..797
D
fsp
Wotip
ab
wdna
TI
n
6541
I4 offer expertise that I can learn from.
acilitating and enhancing customer experiences, this focushould translate into higher levels of customer satisfaction andositive word-of-mouth.
We analyzed the relationships with SmartPLS (Ringle,ende, and Will 2005), since PLS enables the construction
f formative hierarchical models through an indicator replica-ion approach (Wetzels et al. 2009; Wilden et al. 2013). Table 4ncludes customer satisfaction and positive word-of-mouth forurposes of discriminant validity analysis.
Table 5 shows the standardized estimates and supports thergument that S-D orientation is positively associated withoth customer satisfaction (β = 0.761, p < .01) and positive
vsA
able 3llustrative model fit comparisons (AMOS-based).
= 301, Model CMIN/DF CFI RMSEA SRMR
Factor 1.899 .955 .055 .0465
Factor 2.709 .917 .075 .0516
Factor 3.110 .910 .084 .0558
Factor 7.594 .647 .148 .1004
.775
ord-of-mouth (β = 0.558, p < .01). Having demonstrated theevelopment of a valid and reliable S-D orientation measure, weow turn to application studies to test the role of S-D orientations an important driver of business performance.
Proposed Framework and Hypotheses Development forMeasure Application
Fig. 2 depicts the structural model. We chose the outcomeariables on the basis of their strategic relevance for a firm’success (Homburg and Pflesser 2000; Vorhies, Morgan, andutry 2009). Given the expected superior customer experiences
AIC Merged Components for Comparative Model Testing
576.156 –707.916 Individuated and Relational Interaction602.062 Individuated, Relational and Developmental Interaction
2009.770 All

I.O. Karpen et al. / Journal of Retailing 91 (1, 2015) 89–108 95
Table 4Discriminant validity (PLS-based); collinearity and descriptive statistics (SPSS-based); average variances extracted (diagonal) and squared correlations (belowdiagonal).
n = 301 II CI EI EMI RI DI CS PositiveWOM
Overall S-Dorientation
Varianceinflation factor
Cronbach’salpha
IndividuatedInteraction (II)
0.752 2.138 0.890
Concerted Interaction(CI)
0.346 0.740 2.037 0.882
Ethical Interaction(EI)
0.170 0.211 0.762 1.343 0.896
EmpoweredInteraction (EMI)
0.310 0.339 0.174 0.717 1.782 0.868
Relational Interaction(RI)
0.379 0.325 0.143 0.227 0.712 1.909 0.864
DevelopmentalInteraction (DI)
0.382 0.340 0.132 0.283 0.328 0.732 1.985 0.878
Customer satisfaction(CS)
0.320 0.432 0.318 0.307 0.319 0.383 0.867 – 0.924
Positiveword-of-mouth(WOM)
0.220 0.164 0.134 0.185 0.189 0.228 0.310 0.783 – 0.931
Overall S-Dorientation
0.479 0.461 0.219 0.486 0.381 0.441 0.475 0.242 0.794 – 0.944
Mean 4.493 4.663 5.031 4.157 4.850 4.513 5.169 3.962 4.648 – –Standard Deviation 1.241 1.180 1.282 1.326 1.169 1.225 1.276 1.658 1.216 – –
Table 5Nomological validity analysis (PLS-based; higher-order index model; n = 301).
Independent variable Dependent variable Standardized estimate; (t-values) R2
S-D orientation Satisfaction .761*** (29.775) .579Positive word-of-mouth .558*** (13.346) .311
*** p < .001
Fig. 2. Research framework.
wcrprc
LA
vetmastraoP
hen interacting with S-D-oriented organizations, we capturedustomer perceptions of value, trust, affective commitment, andepurchase intentions. We also captured market and financialerformance from the organization’s perspective. To test theseelationships, we collected matched data in an automotive retailontext.
inking S-D Orientation to Perceived Value, Trust, andffective Commitment
Our expectations, outlined in Fig. 2, related to perceivedalue, trust, and affective commitment and are based on socialxchange theory. Co-creating valuable experiences with cus-omers is a cornerstone of service-based strategy. Customers
ake value assessments based on those experiences (includingny touch point such as service departments, products, web-ites, employees) while factoring in benefits and sacrifices alongheir experience processes and outcomes. Perceived value thus
epresents an overall assessment of the trade-off or net benefitssociated with customers’ experiences “based on perceptionsf what is received and what is given” (Zeithaml 1988, p. 4).erceived value, which has been identified as one of the main
9 of Ret
ro
dan(bspirrer
ad(roaiurkc2tca2
a(tkpeirm
pimg(ptapoC
fi
rest(itptwaap
rpa1eSpa
cairRt(aHit
ioetqeaasePrYaah
H
6 I.O. Karpen et al. / Journal
easons a customer engages with an organization, is critical torganizational success (Homburg and Pflesser 2000).
Trust is understood as “existing when one party has confi-ence in an exchange partner’s reliability and integrity” (Morgannd Hunt 1994, p. 23), and thus indicates a customer’s willing-ess to accept vulnerability in a relationship with an organizationMoorman, Deshpandé, and Zaltman 1993). The current rise ofusiness ethics as a topic in public debate and the increasing con-umer mistrust of organizations (Sheth and Sisodia 2005, 2006)ut further pressure on organizations to provide reliable andntegrative service that customers have confidence in. Trust thuseduces exchange uncertainty, allowing the customer to formeliable expectations of the retailer. Strategically, trust is a pow-rful organizational asset and is a necessary basis for long-termelationships (Morgan and Hunt 1994).
Affective commitment represents a customer’s emotionalttachment to an exchange partner (Fullerton 2003) and engen-ers “an enduring desire to maintain a valued relationship”Moorman, Zaltman, and Deshpandé 1992, p. 316). Whileesearchers have identified various types of commitment to therganization related to affective, continuance, and normativespects (Allen and Meyer 1990), we are particularly interestedn affective commitment owing to the concept’s notion of a vol-ntary desire to stay in a relationship. A voluntary emotionalesponse is strategically important, as it has been shown to be aey driver of positive word-of-mouth, repurchase intentions, andustomer loyalty among a set of relational constructs (Jones et al.007; Palmatier et al. 2006). In combination, perceived value,rust, and affective commitment lead to central customer out-omes for retailers as they positively contribute to repurchasend loyalty intentions (e.g., Jones et al. 2007; Palmatier et al.006).
A concern for reciprocal benefits and co-created value is core characteristic of S-D logic and respective frameworksVargo and Lusch 2008). By implication, S-D-oriented firmshus emphasize interactions and integrating resources (e.g.,nowledge and capabilities) as a continuous and interdependentrocess for the mutual benefit of all involved parties (Karpent al. 2012). From a strategic perspective, the quality of thenteractions and the perceptions of benefits strengthen customerelationships, which are defined in terms of trust and commit-ent (Palmatier et al. 2006).Social exchange theory (SET) provides a theoretical under-
inning for this assumption. “One of the basic tenets of SETs that relationships evolve over time into trusting, loyal, and
utual commitments” if the involved parties comply with theuidelines and expectations associated with exchange contextsCropanzano and Mitchell 2005, p. 875). The notion of reci-rocity (or repayment in kind) represents such a guideline inhat the exchange parties expect benefits for their contributionsnd efforts (Cropanzano and Mitchell 2005). Indeed, “when onearty provides another with a valued and beneficial resource, anbligation is generated to return a beneficial resource” (Mitchell,
ropanzano, and Quisenberry 2012, p. 99).Thus, SET holds that if a firm creates resource conditions forair and advantageous interaction processes and outcomes forts partners such as customers, the partners are likely to return
c
Hc
ailing 91 (1, 2015) 89–108
esources in the form of positive attitudes, knowledge-sharingfforts, and future commitments. That is, if customers view theervice provider as acting in their best interest (caring aboutheir wellbeing and desired outcomes) and as being supportiveoffering meaningful resources), they are more likely to respondn kind, and in doing so contribute resources and commit tohe exchange relationship. To this end, customers, as exchangeartners, are expected to be unaccepting of one-sided and oppor-unistic self-interest on the part of the firm and to seek interactionith another firm that offers mutual benefit. Likewise, any dis-
dvantaged or exploited party in a relationship will withdraw, ort least reduce, relational commitment commensurate with theerceived deficiency in reciprocity.
Social exchange theory further explains that interactions oneciprocally beneficial terms are likely to lead the involvedarties to not only perceive what is exchanged as valuable, butlso place trust in the exchange partner (Thibaut and Kelly959). On the basis of SET, and to the extent that S-D ori-ntation emphasizes mutual benefit, we therefore predict that-D-oriented organizations are likely to create high levels oferceived value, build trust, and instill affective commitmentmong their customers.
On the other hand, in line with a co-creation perspective,onsumer culture theory and experiential consumption liter-ture in marketing argue that rather than being embeddedn resources, customer value emerges from interaction withesources (e.g., Arnould and Thompson 2005; Prahalad andamaswamy 2004; Vargo and Lusch 2008). Accordingly, cus-
omers can realize value through goal or resource achievementsutilitarian value) and/or through enjoying the processes of inter-cting with resources (experiential value) (e.g., Holbrook andirschmann 1982). Participation in, and contribution to resource
ntegration processes can thus have a positive impact on cus-omer perceptions.
A firm’s S-D orientation emphasizes both participation andntegration aspects. First, an S-D orientation fosters the ideaf value co-creation through understanding, responding to, andmpowering individual customers and their resource integra-ion processes. This activity in turn supports customers in theiruest for effective resources and solutions. Second, an S-D ori-ntation underlines the quality of the interaction process itselfnd aims to facilitate enjoyable human relationships, morallycceptable behavior, and pleasurable touch points. This empha-is in turn contributes to customers’ participatory enjoyment inxchange processes beyond a utilitarian resource perspective.revious literature highlights the positive impact of such expe-iences on customer satisfaction and repurchase intentions (e.g.,im, Chan, and Lam 2012). In combination, effective outcomesnd pleasurable processes, in line with mutually beneficial inter-ctions proposed by SET, lay the foundation for the followingypotheses:
1. An organization’s S-D orientation has a positive effect on
ustomers’ perceived value.2. An organization’s S-D orientation has a positive effect onustomers’ trust.

of Ret
Hc
siamvJhttmwdmf
Htm
L
mtDtan2om(boRfitfiraaRgc
pSatuzVa(
tstr
wlssvlrcctcieaicearecfosr
roozmscpacgwpeastntlpt
I.O. Karpen et al. / Journal
3. An organization’s S-D orientation has a positive effect onustomers’ affective commitment.
The outcome of customer perceived value has furthertrategic relevance for an S-D-oriented organization. Empir-cal evidence suggests that perceived value functions as anntecedent of trust and affective commitment. For instance, aeta-analysis by Palmatier et al. (2006) shows that perceived
alue positively affects customers’ trust in a service provider.ohnson, Herrmann, and Huber (2006) show that perceived valueas a positive effect on affective commitment that grows overime as a customer’s experience accumulates. We hence predicthat the impact of S-D orientation on trust and affective com-
itment is partially mediated by perceived value. Specifically,hen perceived value is included as a mediator, we expect theirect impact of S-D orientation on trust and affective commit-ent to weaken, but to remain significant given its importance
or superior customer experiences. Therefore:
4. The effect of an organization’s service-dominant orienta-ion on customers’ trust and affective commitment is partially
ediated by customers’ perceived value.
inking S-D Orientation to Market Performance
Our hypothesized effect of S-D orientation on market perfor-ance is based on theoretical discussions in the literature about
he internal sources of competitive advantage (e.g., Barney 1991;ay 2006). Resource-based theory (RBT) and resource advan-
age (RA) theory provide important frameworks in managementnd marketing research for explaining and predicting orga-izational performance (Kozlenkova, Samaha, and Palmatier014). In brief, RBT suggests that heterogeneity and superi-rity in resources and capabilities provide the foundation forore efficient and effective value creation relative to competitors
e.g., Barney 1991). Research in this literature regards capa-ilities as subsets of resources that enable the deployment ofther resources (Kozlenkova et al. 2014). Paralleling S-D logic,BT argues that firms are resource integrators and that eachrm draws on a specific bundle or constellation of resources
o accomplish its goals. Similarly, RA theory proposes thatrms are “combiners of heterogeneous and imperfectly mobileesources,” whereby the idiosyncratic constellation of resourcesnd a firm’s ability to use it efficiently and effectively set the firmpart from its competitors (Hunt 2002, p. 277). Consequently,BT and RA theory both suggest that sustained resource hetero-eneity and superiority, coupled with the ability to exploit theseonditions, are central to outperforming rivals.
While differences in resource constellations among com-etitors are important, not all resources are equally relevant.-D logic proposes, for example, that operant resources suchs knowledge and dynamic capabilities are particularly impor-ant because they enable improvement of action and resourcese over time. RBT argues that the importance of organi-
ational resources depends on four criteria, referred to asRIO conditions: the degree to which resources are valu-ble, rare, imperfectly mobile, and organizationally exploitableBarney and Hesterly 2012). Resource-based logic reasons
catp
ailing 91 (1, 2015) 89–108 97
hat the more resources with such qualities a firm pos-esses, has access to, and is able to exploit, the more likelyhe firm can leverage these resources into outperformingivals.
On the basis of resource logic (Barney 1991; Hunt 2002),e argue that a firm’s S-D orientation—specified as a portfo-
io of co-creation capabilities (Karpen et al. 2012)—contributesignificantly to firm performance. To illustrate this relation-hip, we draw on the VRIO criteria. Generally, a resource isaluable if it enables an organization to pursue strategies toower its costs (efficiency outcomes) and/or increase its netevenues (effectiveness outcomes) (Barney 1991). The latterase assumes that resources are meaningful to the extent thatustomers value a firm’s offerings and touch points such thathey develop a preference for a particular resource provider andontribute to the firm’s revenue streams. An S-D orientations valuable in that this capability portfolio enables retailers tongage in service-driving interactions that customers appreciatend desire (Karpen et al. 2012). An S-D orientation is valuablen meaningfully differentiating a firm from competitors, sinceustomers prize superior solution- and relationship-supportingfforts. For example, through its focus on collaborating withnd supporting customers directly, an S-D orientation enhanceselationship building, resource access and exchange, and knowl-dge gains, thus contributing to firm revenues by strengtheningustomer interest and spending. Accordingly, an S-D orientationacilitates value co-creation processes and fosters achievementf value co-creation objectives. RBT and RA theory hold thatuch increased effectiveness leads to better market positions andevenue streams.
The second VRIO criterion refers to the rarity of a particularesource. That is, the resource “is controlled by a small numberf competing firms” (Kozlenkova et al. 2014, p. 3). The adoptionf an S-D orientation remains relatively uncommon, as organi-ations are only gradually developing S-D capabilities. Evenore, only a few companies within an industry are expected to
imultaneously excel in S-D orientation and its six constitutingapabilities. For example, a recent study of marketing managers’erceptions of value co-creation priorities and practices across
range of industries showed that while the notion of value co-reation resonates with managers and its relevance is expected torow among them, most of the represented firms were operatingith traditional marketing priorities (e.g., focusing on marketingropaganda and transactional exchange capabilities) (Cassidyt al. 2013). The development of S-D oriented capabilities suchs customer integration, relationship building, and knowledgeharing was not a priority. While acknowledging the contex-ual limitation of the seven countries studied, the researchersoted that a reasonable expectation is that this finding extendso other contexts, as firms “find it difficult to break away fromong-standing habits” (Cassidy et al. 2013, p. 13). S-D orientedriorities and practices are consequently argued to require timeo embrace (Vargo and Lusch 2008), particularly given their
omplex constellation of co-creation capabilities. The result ispotential advantage of rarity for those firms that are able toransform and excel at an S-D orientation and leverage its fullotential.

9 of Ret
taHfiicpiainoiItepsmftceociir
taDeconcStwpwocp
vwtuocdcei
Os
rcttotatrhi
rie(aifi
Hp
He
D
civoctotof
dfdpmimcc
8 I.O. Karpen et al. / Journal
The third VRIO criterion—imperfect imitability—relates tohe degree to which resources are substantially costly to obtainnd/or difficult to develop, copy, or substitute (Barney andesterly 2012). We argue that an S-D orientation is indeed dif-cult to imitate because of its overall complexity owing to its
nclusion of several components, its causal ambiguity, and itsontextual conditions (path dependencies). Causal ambiguityoints to the intangible nature of the S-D orientation, whichs more difficult for external market actors to fully understandnd implement compared to, for example, analyzing and imitat-ng a competitor’s physical products. Causal ambiguity relatesot only to the S-D orientation itself but also to the expertisef how to best develop and organize these capabilities in thediosyncratic context of a focal firm and its network partners.n particular, intangible resources such as capabilities providehe potential for a meaningful resource advantage (Kozlenkovat al. 2014). For instance, an S-D orientation as a capabilityortfolio requires a commitment to investment and can takeignificant time (e.g., for employee training, systems imple-entation, or cultural change) for its constituent elements to
unction smoothly as an overall aligned organizational compe-ence. Firms are also constrained by their remaining resourceonstellations and past decisions in their historic contexts, whilemployees for example may need to unlearn previous practicesr routines. Copying an S-D orientation and its interconnectedapability set is thus difficult for rivals and might not suit theirndividual context without further adaptation (Day 2006), lend-ng support for the S-D orientation as an imperfectly imitableesource bundle.
The “O” as the final VRIO criterion stands for “organiza-ion” and refers to a firm’s potential to exploit its resourcesnd capabilities (Barney and Hesterly 2012). By itself, the S-
orientation represents a bundle of intangible capabilities thatnable the exploitation, transformation, amplification, and syn-hronization of other organizational resources. While access tor possession of VRI resources is important (as a necessary butot sufficient condition), acting on and deploying resources isritical (Ketchen, Hult, and Slater 2007), for instance through-D capabilities. For example, an S-D orientation leverages cus-
omer knowledge and competence outside-in as strategic actions,hile emphasizing synchronized efforts between the involvedarties for mutually beneficial outcomes. This collaborationith and potential integration of external actors add a degreef dynamism, and like dynamic capabilities, an S-D orientationhallenges the firm to discern necessary changes and adapt itsrocesses or procedures to seize outside-in opportunities.
Moreover, an S-D orientation’s emphasis on consistentlyaluable experiences and mutual benefit demands that a firm beell organized when deploying its resources to ensure that cus-
omers, other stakeholders, and the firm itself are not sufferingnnecessarily from value drains owing to inefficient processesr procedures. An S-D orientation thus requires and signifi-antly contributes to an organized internal and external resource
eployment. On the other hand, firms that make the strategichoice to invest in the development of an S-D orientation arexpected to carefully design organizational conditions that facil-tate the operation and exploitation of co-creation capabilities.seti
ailing 91 (1, 2015) 89–108
therwise, the strategic investment would be rather short-ighted and most likely ineffective.
However, the organizational perspective is not a strictlyesource-related condition compared to the other three VRIriteria. Rather, it relates more to the organizational context inerms of enabling or limiting an organization’s resource poten-ial (Kozlenkova et al. 2014). As the implementation of an S-Drientation represents a more strategic decision (e.g., owingo financial and time requirements), managers naturally have
vested interest in considering optimal organizational condi-ions that allow the most efficient and effective leveraging ofesources and capabilities, such that the deployment of theireterogeneous and idiosyncratic bundles of resources translatesnto desired performance outcomes.
Overall, we propose that the S-D orientation is strategicallyelevant in terms of being a valuable, rare, and imperfectlymitable capability portfolio that, if exploited, facilitates moreffective service-oriented strategic action and collaborationresource deployments) by the organization. On the basis of RBTnd RA theory, we therefore expect S-D orientation to lead tomproved market performance, which in turn results in improvednancial performance. More formally:
5a. An organization’s service-dominant orientation has aositive effect on its market performance.
5b. An organization’s market performance has a positiveffect on its financial performance.
Methodology
ata Collection and Samples
An S-D orientation represents an organization-level co-reation capability. As we have argued, given their involvementn interdependent resource integration processes, customers asalue network partners are in a meaningful position to judge anrganization’s S-D orientation. For example, automotive retailustomers are able to perceive dealerships’ interaction capabili-ies since they integrate and mobilize resources of the firm as partf their purchasing activities. Automotive retail represents a par-icularly suitable environment for applying and re-testing an S-Drientation measure because of its conventional goods-dominantocus, yet high co-creation potential.
Traditionally, the automotive industry has employed firm-riven mass production with a relatively strong push approachrom manufacturers through to the retail network. Given thisownward pressure, the image of car salespeople is not sur-risingly generally poor, as they are often perceived to useanipulative sales tactics. However, the automotive industry
s presently undergoing substantial change. With the benefit ofodern technology, European car manufacturers such as BMW
an now produce on demand, allowing customers to simulate andonfigure their preferred car. Similarly, some car dealerships,
uch as select Subaru dealerships, have begun to emphasizenjoyable retail-experience environments along with open andransparent communication. Thus, given the potential variancen customer experience and the increasing competitive pressure
of Ret
tu
wpaaTe(rgd
icrwrtR
stTwar
siti2b(d(ap(cd
M
ambfsCuTfw
dlimdfWaomfaa
tompbtcaatGG6MwA
leWmmw2gc(ifchteβ
a
tbf
I.O. Karpen et al. / Journal
o provide better service, the automotive retail context offers anique opportunity for studying S-D efforts and outcomes.
In collaboration with an established Australian online panel,e conducted a web-based survey. Panel members qualified forarticipation if they had purchased their new or used vehiclet an authorized Australian dealership and had had it servicedt the same dealership at least once within the past 12 months.hese screening criteria ensured that consumers had sufficientxperience with multiple contact points of the car dealershipe.g., both the sales and service center) within a timeframe thateduced recall bias. To avoid multiple survey completions, weave panel members a unique ID and asked them to identify theealership and its location.
Participants could leave the survey at any time and finisht at a later stage. We obtained usable responses from 412onsumers after excluding those who dropped out during theesponse process (navigating away from the website) or thosehose responses did not meet data quality checks such as
esponse time, pattern, confidence, or test-retest congruence, orhat reflected a careless response to open-ended questions (e.g.,ichey, Tokman, and Dalela 2011).
From the customer sample, we identified 276 unique dealer-hips. We contacted these dealerships by telephone to identifyhe principal or financial officer and set up a telephone interview.his procedure ensured that we interviewed only key informantsho were in a position to assess dealership performance. Over
five-week period, we achieved a response rate of 41 percent,esulting in 105 matched cases.
An important aspect of our data is that in some cases a dealer-hip had multiple respondents. Although in such cases comput-ng averages is not uncommon (e.g., Ramani and Kumar 2008),hese averages suffer from unreliability that causes bias andnefficiency in parameter estimates (Croon and van Veldhoven007). This unreliability is usually corrected for through a com-ination of precision weighting and empirical Bayes estimationLindley and Smith 1972; Smith 1973). Indeed, this proce-ure is the major benefit of multilevel modeling techniquesRaudenbush and Bryk 2002). As we describe below, we use
partial least squares (PLS) technique to analyze our data,recluding use of a traditional multilevel modeling approachPreacher, Zyphur, and Zhang 2010). To ensure reliability, weomputed the precision-weighted, empirical Bayes estimatesirectly for each dealership for use in our PLS analyses.
easures and Analyses
Measures were taken from or based on published sourcesnd adapted to the car dealership context (see Appendix). Weeasured customers’ perceived value by a six-item instrument
ased on Keh and Sun (2008) and Ruiz et al. (2008). Theour-item measure of affective commitment to the car dealer-hip was adapted from Fullerton (2005) and Jones et al. (2007).ustomers’ perceived trust in the car dealership was measured
sing a seven-item scale from Kingshott and Pecotich (2007).o assess customer repurchase intentions, we adapted a measurerom Ruiz et al. (2008). The dealership’s market performanceas measured using subjective, self-reported measures, as carsmct
ailing 91 (1, 2015) 89–108 99
ealerships in our sample are not publicly listed and do not pub-ish their performance results. For this purpose, we used a keynformant approach, ensuring that either the principal or finance
anager reported on dealership performance. Past research hasemonstrated the reliability and validity of such subjective per-ormance data compared to objective performance data (e.g.,
all et al. 2007). We used a four-item scale based on Homburgnd Pflesser (2000) to capture both sales and market share devel-pments. Items within the financial category of business perfor-ance asked the key informants to assess their dealership’s per-
ormance on cash flow, as cash flow is less susceptible to “accrualccounting methods and may be less sensitive to commonly usedccounting manipulations” (Vorhies et al. 2009, p. 1316).
Dealership brand of passenger vehicle was used as a con-rol variable as authorized dealerships often have to implementr adhere to specific service standards defined by the brandanufacturer. Controlling for brand provides insights into the
roposed S-D orientation relationship with market performanceeyond any brand-specific dealership standards, thus ensuringhat our results are not confounded by a potential brand effect. Asonsumer respondents identified 21 unique brands, we groupednd dummy coded these brands into a statistically more manage-ble set of brands. We used the official brand market share at theime of data collection based on national retail sales (Australianovernment 2009) to code the brands into six groups, leading to
− 1 dummy variables (where G = the number of brands above.5 percent market share, and including Toyota, Holden, Ford,azda, Hyundai, and one remaining other group). All scalesere tested for their psychometric properties using CFA withMOS 20 (Arbuckle 2011) and were purified where necessary.Having applied covariance-based SEM at the measurement
evel, we carried out a component-based SEM, or PLS path mod-ling, with SmartPLS 2 (Ringle et al. 2005) at the structural level.e based this decision on the advantage of PLS to combine for-ative and reflective elements at both the single- and multi-levelodel structures, as well as its suitability for small sample sizesith predictive objectives (Chin and Newsted 1999; Hair et al.012). The procedure was conducted in line with recently sug-ested guidelines and applications for specifying hierarchicalonstructs in PLS by way of an indicator replication approachWilden et al. 2013). The higher-order S-D orientation constructs thereby established through the repeated use of all mani-est variables of the underlying lower-order indicators. The pathoefficients for each of the six formative components toward theigher-order S-D orientation are as follows: relational interac-ion: β = 0.18, p < .001; concerted interaction: β = 0.21, p < .001;mpowered interaction: β = 0.20, p < .001; ethical interaction:
= 0.19, p < .001; individuated interaction: β = 0.22, p < .001;nd developmental interaction: β = 0.22, p < .001.
Since we gathered customer-based measures with one ques-ionnaire, we evaluated the potential threat of common methodias (CMB). We followed a CFA approach to Harman’s one-actor test (Kandemir, Attila, and Tamer Cavusgil 2006). The
pecification of a single latent factor accounting for all relevantanifest variables produced an unacceptable model fit acrossommonly applied indices (see Table 6). This result suggestshat “one general factor did not account for the majority of
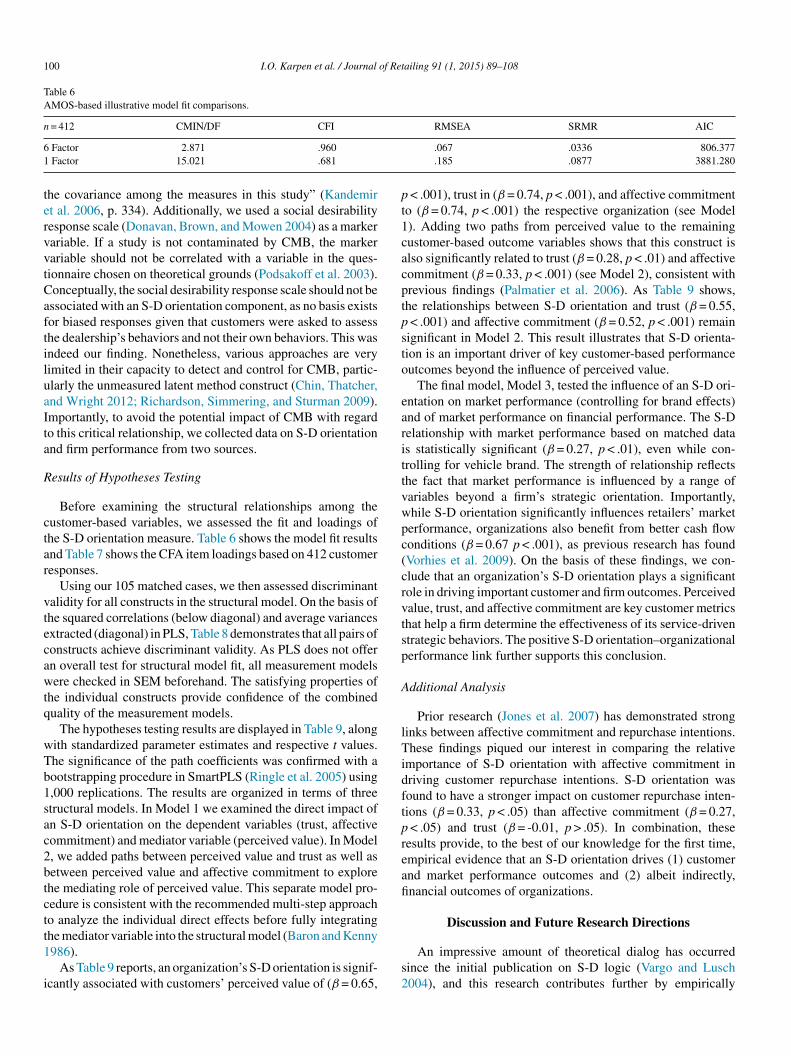
100 I.O. Karpen et al. / Journal of Retailing 91 (1, 2015) 89–108
Table 6AMOS-based illustrative model fit comparisons.
n = 412 CMIN/DF CFI RMSEA SRMR AIC
61
tervvtCaftiluaIta
R
ctar
vtecawtq
wTb1sac2btctt1
i
pt1cacptpsto
earittvwpc(crvtsp
A
lTidftpreafi
Factor 2.871 .960
Factor 15.021 .681
he covariance among the measures in this study” (Kandemirt al. 2006, p. 334). Additionally, we used a social desirabilityesponse scale (Donavan, Brown, and Mowen 2004) as a markerariable. If a study is not contaminated by CMB, the markerariable should not be correlated with a variable in the ques-ionnaire chosen on theoretical grounds (Podsakoff et al. 2003).onceptually, the social desirability response scale should not bessociated with an S-D orientation component, as no basis existsor biased responses given that customers were asked to assesshe dealership’s behaviors and not their own behaviors. This wasndeed our finding. Nonetheless, various approaches are veryimited in their capacity to detect and control for CMB, partic-larly the unmeasured latent method construct (Chin, Thatcher,nd Wright 2012; Richardson, Simmering, and Sturman 2009).mportantly, to avoid the potential impact of CMB with regardo this critical relationship, we collected data on S-D orientationnd firm performance from two sources.
esults of Hypotheses Testing
Before examining the structural relationships among theustomer-based variables, we assessed the fit and loadings ofhe S-D orientation measure. Table 6 shows the model fit resultsnd Table 7 shows the CFA item loadings based on 412 customeresponses.
Using our 105 matched cases, we then assessed discriminantalidity for all constructs in the structural model. On the basis ofhe squared correlations (below diagonal) and average variancesxtracted (diagonal) in PLS, Table 8 demonstrates that all pairs ofonstructs achieve discriminant validity. As PLS does not offern overall test for structural model fit, all measurement modelsere checked in SEM beforehand. The satisfying properties of
he individual constructs provide confidence of the combineduality of the measurement models.
The hypotheses testing results are displayed in Table 9, alongith standardized parameter estimates and respective t values.he significance of the path coefficients was confirmed with aootstrapping procedure in SmartPLS (Ringle et al. 2005) using,000 replications. The results are organized in terms of threetructural models. In Model 1 we examined the direct impact ofn S-D orientation on the dependent variables (trust, affectiveommitment) and mediator variable (perceived value). In Model, we added paths between perceived value and trust as well asetween perceived value and affective commitment to explorehe mediating role of perceived value. This separate model pro-edure is consistent with the recommended multi-step approacho analyze the individual direct effects before fully integrating
he mediator variable into the structural model (Baron and Kenny986).As Table 9 reports, an organization’s S-D orientation is signif-cantly associated with customers’ perceived value of (β = 0.65,
s2
.067 .0336 806.377
.185 .0877 3881.280
< .001), trust in (β = 0.74, p < .001), and affective commitmento (β = 0.74, p < .001) the respective organization (see Model). Adding two paths from perceived value to the remainingustomer-based outcome variables shows that this construct islso significantly related to trust (β = 0.28, p < .01) and affectiveommitment (β = 0.33, p < .001) (see Model 2), consistent withrevious findings (Palmatier et al. 2006). As Table 9 shows,he relationships between S-D orientation and trust (β = 0.55,
< .001) and affective commitment (β = 0.52, p < .001) remainignificant in Model 2. This result illustrates that S-D orienta-ion is an important driver of key customer-based performanceutcomes beyond the influence of perceived value.
The final model, Model 3, tested the influence of an S-D ori-ntation on market performance (controlling for brand effects)nd of market performance on financial performance. The S-Delationship with market performance based on matched datas statistically significant (β = 0.27, p < .01), even while con-rolling for vehicle brand. The strength of relationship reflectshe fact that market performance is influenced by a range ofariables beyond a firm’s strategic orientation. Importantly,hile S-D orientation significantly influences retailers’ marketerformance, organizations also benefit from better cash flowonditions (β = 0.67 p < .001), as previous research has foundVorhies et al. 2009). On the basis of these findings, we con-lude that an organization’s S-D orientation plays a significantole in driving important customer and firm outcomes. Perceivedalue, trust, and affective commitment are key customer metricshat help a firm determine the effectiveness of its service-driventrategic behaviors. The positive S-D orientation–organizationalerformance link further supports this conclusion.
dditional Analysis
Prior research (Jones et al. 2007) has demonstrated stronginks between affective commitment and repurchase intentions.hese findings piqued our interest in comparing the relative
mportance of S-D orientation with affective commitment inriving customer repurchase intentions. S-D orientation wasound to have a stronger impact on customer repurchase inten-ions (β = 0.33, p < .05) than affective commitment (β = 0.27,
< .05) and trust (β = -0.01, p > .05). In combination, theseesults provide, to the best of our knowledge for the first time,mpirical evidence that an S-D orientation drives (1) customernd market performance outcomes and (2) albeit indirectly,nancial outcomes of organizations.
Discussion and Future Research Directions
An impressive amount of theoretical dialog has occurredince the initial publication on S-D logic (Vargo and Lusch004), and this research contributes further by empirically

I.O. Karpen et al. / Journal of Retailing 91 (1, 2015) 89–108 101
Table 7CFA of S-D orientation in an automotive retail context.
n = 412 This car dealership and its representatives. . . RelationalInteraction(RI)
EthicalInteraction(EI)
IndividuatedInteraction (II)
EmpoweredInteraction(EMI)
ConcertedInteraction(CI)
DevelopmentalInteraction(DI)
RI1 make me feel at ease during our dealings. .915RI2 try to establish rapport with me. .821RI3 encourage two-way communication with me. .936RI4 show genuine interest in engaging me. .910
EI1 do not try to take advantage of me. .797EI2 do not pressure me in any way. .893EI3 do not mislead me in any way. .859EI4 do not try to manipulate me. .951
II1 make an effort to understand my individualneeds.
.906
II2 are sensitive to my individual situation. .928II3 make an effort to find out what kind of
offering is most helpful to me..919
II4 seek to identify my personal expectations. .934
EMI1 invite me to provide ideas or suggestions. .827EMI2 encourage me to shape the service I receive. .885EMI3 provide me with control over my
experiences..910
EMI4 let me interact with them in my preferredway.
.842
CI1 work together seamlessly in serving to me. .865CI2 act as one unit when dealing with me. .875CI3 provide messages to me that are consistent
with each other..899
CI4 ensure they have smooth procedures forinteracting with me.
.861
DI1 share useful information with me. .893DI2 help me become more knowledgeable. .937DI3 provide me with the advice I need to use
their offerings successfully..915
DI4 offer expertise that I can learn from. .889
Table 8Discriminant and convergent validity of full structural model (PLS output based on Bayes estimates); squared correlations (below diagonal) and average variancesextracted (diagonal).
n = 105 dyads AC CI CFP DI EI EMI II PV RI RPI MP T Cronbach’salpha
Affective commitment (AC) 0.804 0.918Concerted interaction (CI) 0.404 0.753 0.891Cash Flow performance (CFP) 0.046 0.038 0.852 0.826Developmental interaction (DI) 0.400 0.558 0.014 0.796 0.914Ethical interaction (EI) 0.239 0.244 0.034 0.285 0.787 0.910Empowered interaction (EMI) 0.441 0.462 0.015 0.560 0.176 0.744 0.886Individuated interaction (II) 0.330 0.400 0.044 0.445 0.412 0.440 0.789 0.911Perceived value (PV) 0.442 0.324 0.066 0.303 0.155 0.298 0.355 0.775 0.902Relational interaction (RI) 0.352 0.246 0.067 0.210 0.291 0.259 0.428 0.250 0.751 0.889Repurchase intentions (RPI) 0.353 0.277 0.018 0.299 0.229 0.283 0.271 0.257 0.294 0.788 0.910Market performance (MP) 0.069 0.085 0.450 0.076 0.047 0.062 0.069 0.080 0.027 0.010 0.752 0.890Trust (T) 0.471 0.408 0.017 0.386 0.335 0.352 0.427 0.412 0.256 0.259 0.053 0.832 0.950Mean 3.932 5.194 5.434 5.096 5.176 4.863 5.113 4.896 5.652 5.163 5.329 4.877 –Standard Deviation 0.329 0.142 1.176 0.193 0.171 0.158 0.136 0.370 0.076 0.236 1.218 0.182 –

102 I.O. Karpen et al. / Journal of Ret
Table 9Results of hypotheses testing.
Independentvariable
Dependent variable Standardizedestimate; (t-value)
Structural Model 1: S-D orientation on customer outcomes (n = 105)Service-dominantorientation
Trust .74*** (17.94)
Perceived value .65*** (11.09)Affective commitment .74*** (18.67)
Structural Model 2: S-D orientation on customer outcomes withmediation (n = 105)Service-dominantorientation
Trust .55*** (7.02)
Affective commitment .52*** (7.27)
Perceivedvalue
Trust .28** (3.19)
Affective commitment .33*** (4.12)
Structural Model 3: S-D orientation on firm outcomes (n = 105)Service-dominantorientation
Market performance .27** (2.82)
Marketperformance
Financial performance .67***(10.19)
*
dptfio2bttvSmas
R
ntfHttcrlwve
kocia
ibtrpsSutwci
miaditrSmSib
attdwrooaiOtwums
senbterms of their resource and capability bundles is essential for
** p < .01.** p < .001
emonstrating the relevance of S-D logic’s underlying princi-les in the form of an S-D orientation. This study responds tohe call for a stronger contribution of marketing to the strategyeld (Varadarajan 2010) and links the response to the identifiedpportunities surrounding a co-creation capability (Karpen et al.012; Madhavaram and Hunt 2008). Resource- and capability-ased perspectives in particular have recently gained substantialraction in the marketing and management literature, to whichhis research makes an important contribution, as this paper pro-ides empirical evidence for the nature and centrality of the-D orientation construct. We specifically shed theoretical andanagerial light on the conceptual foundations, measurement
pproach, and potential benefits for retailers when implementingervice-driving capabilities.
esearch and Managerial Implications
This research facilitates the transition from positive toormative theorizing. S-D logic has been characterized as a rela-ively abstract framework with the potential to build a foundationor a theory of markets and marketing (Vargo and Lusch 2008).owever, the abstract nature of S-D logic presents a challenge
o empirical testing and to assessing the explanatory power ofhe S-D world view (Brodie et al. 2011). Importantly, this paperontributes to resolving this dilemma by developing middle-ange theory in the context of S-D logic that supports the formu-ation, investigation, and interpretation of theoretical inquiries
ith normative implications. Such middle-range theory helpserify underlying assumptions associated with S-D logic (Brodiet al. 2011). Indeed, this paper assists in building a body ofskk
ailing 91 (1, 2015) 89–108
nowledge that empirically tests and demonstrates the relevancef more specific S-D considerations or phenomena in a particularontext, thereby connecting (1) observable reality and normativensights from a managerial point of view, and (2) explanatorynd predictive capacities from a theoretical point of view.
To enable middle-range theorizing, we develop and test annstrument measuring the concept of S-D orientation introducedy Karpen et al. (2012). We validate the hierarchical measurehrough a multi-stage analysis process, including, for instance,etail banking and automotive retailing contexts. The rigorousrocess and the results show that this study provides a valid mea-ure for researchers and practitioners to assess an organization’s-D orientation. The instrument also enables managers to betternderstand the underlying capabilities that form an S-D orienta-ion, and to assess which capabilities need further developmentithin their own firm. Such insights offer the basis for specific
apability development programs and investment decisions tomprove business efficiency and effectiveness.
Theoretically, S-D logic as a cognitive framework providesanagers with a mindset that guides strategic decision mak-
ng. However, this research takes the position that as customersre not likely to be aware of the organizational thinking behindecision making (Homburg and Bucerius 2005), they form opin-ons about a firm’s efforts to operate in a market primarily fromheir interactions with the firm. While we drew on customers asespondents in this study to capture their perceptions of the firm’s-D orientation, the proposed measure can be adapted to surveyanagers, employees, or other external network partners. The-D measurement instrument thus enables the formulation and
nvestigation of a comprehensive research agenda, as discussedelow.
Our findings further show that, in both retail banking andutomotive contexts, firms benefit from co-creation capabili-ies. We thus demonstrate that an S-D orientation is relevant inraditional service environments such as retail banking that areominated by intangible offerings, and in goods environmentshere tangible offerings such as cars play a central exchange
ole. Specifically, we find that firms with high levels of S-Drientation are those with more effective capabilities in termsf individuated, relational, ethical, empowered, developmental,nd concerted interaction. These capabilities in turn positivelynfluence important market and financial performance outcomes.verall, given the demonstrated pay-offs of an S-D orienta-
ion in these contexts—beyond any brand effects associatedith dealerships, for example—we conclude that a worthwhilendertaking for managers is to strategically prioritize, and com-it to, the cultivation of an S-D orientation with its associated
ervice-driving capabilities.S-D logic emphasizes the importance of operant resources
uch as capabilities, which enable the application andxploitation of other (e.g., operand) resources for a firm’s andetwork partner’s success. Similarly, resource- and capability-ased theories argue that heterogeneity among competitors in
uperior market positions (Leiblein 2011). However, “little mar-eting research verifies the underlying resource requirementsey to RBT’s performance predictions” (Kozlenkova et al. 2014,
of Ret
przeac(cic
“emaoctttctwd
[oaiipciitvnit
opLdorWtaCctbctto
itverdscmFcfttp
pntdbd
pcWpotFo(taolicsw
L
cccrooo
I.O. Karpen et al. / Journal
. 2). This research lends empirical support to the theoreticalelevance of valuable, rare, imperfectly imitable, and organi-ational conditions of resources and capabilities that permitfficient and effective value creation. Indeed, the S-D orientations a capability portfolio has the potential to leverage value co-reation through idiosyncratic operant resource configurationsdifferent performance levels among the six S-D orientationomponents) that provide unique benefits to the focal firm andts interaction partners. We thus make an important theoreticalontribution to the RBT–S-D logic interface.
From a strategic marketing perspective, we also advance theorientation” research stream. Prior literature demonstrates, forxample, the importance of orienting an organization towardarket- or interaction-driven business imperatives (e.g., Kohli
nd Jaworski 1990; Ramani and Kumar 2008). An interactionrientation represents the “ability to interact with its individualustomers and to take advantage of information obtained fromhem through successive interactions to achieve profitable cus-omer relationships” (Ramani and Kumar 2008, p. 27). Whilehis orientation also belongs to the capability stream (vs. theultural orientation stream, which is dominated by market orien-ation), it is limited in several ways with respect to its consistencyith S-D logic and its comprehensiveness in terms of its service-riving capability portfolio.
Despite the view that “firms cannot think and act unilaterallyand] that the consumer and the firm co-create value at vari-us points of interaction” (Ramani and Kumar 2008, p. 28),nd despite its label of “interaction orientation,” the constitut-ng components of this orientation only marginally manifestnteraction- and service-centric capabilities from an S-D logicerspective. Indeed, only two components (interaction responseapacity and customer empowerment) relate directly to facilitat-ng value co-creation. In contrast, the S-D orientation proposedn this paper comprises six components representing a holis-ic interaction and value co-creation approach. For example, asalue co-creation requires customers to be able to engage inecessary interaction efforts, the S-D orientation outlines andncludes the importance of helping customers become smarterhrough developmental interaction capability.
Moreover, the interaction orientation is based conceptuallyn a narrower and less integrative theoretical framework (com-ared to S-D logic), called the “customer concept” (Hoekstra,eeflang, and Wittink 1999). The customer concept is alsoirectly represented in the form of a dimension of the interactionrientation and defined as a “belief” that individual customersather than customer segments are the necessary unit of analysis.
hile we agree with this assumption, the construct mixes atti-udinal and capability-based elements, even though it is defineds an organizational “ability” (Hoekstra et al. 1999, p. 27).onceptually, we believe such elements are more meaningfullyonsidered as antecedents to developing capabilities. In sum,he S-D orientation enriches the strategic marketing literaturey providing a more comprehensive, internally (in terms of its
omponents) and externally (with reference to S-D logic) consis-ent strategic approach that focuses on co-creation capabilitieshrough actionable insights and mutually beneficial performanceutcomes.fias
ailing 91 (1, 2015) 89–108 103
From a managerial perspective, the findings have criticalmplications for retail managers. S-D logic rests on the assump-ion that experiences are central to customer value, but customeralue is not embedded in resources or capabilities. Rather, valuemerges through the interaction experiences with the firm’sesources and capabilities (Vargo and Lusch 2008). Our resultsemonstrate that retail organizations and their customers benefitignificantly from interaction experiences enabled by superioro-creation capabilities. Indeed, key customer and firm perfor-ance indicators benefit from higher levels of S-D orientation.or example, in today’s complex and competitive environment,ustomer trust and affective commitment are critical variablesor retail stores’ success. The co-creation capabilities tested inhis study significantly contribute to the development of bothrust and commitment while also driving market and financialerformance outcomes indicative of mutual value creation.
Given that our measure captures overall, cumulative S-Derceptions, an important implication is that retail managerseed to ensure consistent levels of interaction experiences acrossime and touch points. This need for consistency extends to theesign and integration of online and offline experiences, whichoth benefit from relational, ethical, individuated, empowered,evelopmental, and concerted interaction considerations.
Meanwhile, as the S-D orientation comprises several com-onents, we urge retail managers to critically reflect on theontextual leverage of each of the six co-creation capabilities.
hile our results show the overall importance of the capabilityortfolio, managers might factor in context specificities in termsf which S-D orientation components have significant differen-iation potential and which are simply a competitive necessity.inally, current marketing research demonstrates the importancef implementing a systematic performance measurement systemMintz and Currim 2013). In this paper we provide an importantool that helps retail managers implement and/or complement
strategic performance management system. The applicationf the S-D orientation measure helps managers establish theevel of their co-creation capability at a specific time and trackts progress in parallel to specific investments in resources andapability development. We thus encourage retail managers totrategically manage and cultivate their co-creation capabilitiesith an eye to marketing’s contribution to the firm’s bottom line.
imitations and Future Research
While this paper provides a rigorous approach to indexonstruction, several limitations warrant further research con-erning the S-D orientation construct. First, we have focused onustomers as the most important value network partner. Futureesearch might investigate to what extent customers’ assessmentf the focal firm’s S-D orientation is consistent with that ofther value network partners, such as suppliers, intermediaries,r particularly employees.
Second, researchers could explore potential antecedents to
urther expand and comprehensively understand the nomolog-cal network of the S-D orientation construct. For example,n organizational design or configuration theory perspectiveuggests that organizational elements such as mindset, culture,
1 of Ret
lmoi
ficmttfiSapazd
bvsuoatmtttpc
mc2omossit
so
reatioc
ipn
eiatt
iancapse1uolaouc
aamse(sbacipt
tmtSttoi
dwFaamt
04 I.O. Karpen et al. / Journal
eadership style, and rewards would support or hinder the imple-entation of an S-D orientation. In the following, we briefly
utline the relevance of these four antecedent categories for themplementation of an S-D orientation.
An organization’s mindset, or way of thinking, represents therm’s business logic that determines organizational members’ore assumptions (Prahalad and Bettis 1986). An organizationalindset accordingly frames the understanding of an organiza-
ion’s purpose, policies, priorities, and practices with respecto value creation. A mindset therefore governs and aligns arm’s diverse business efforts, and the development of an-D orientation as a capability portfolio would benefit fromn organizational mindset that embraces collaboration, reci-rocity, mutual development, and a long-term focus (Prahaladnd Ramaswamy 2004). As a cognitive orientation, an organi-ational mindset acts as a filter for information processing andecision making (Lampel and Shamsie 2000).
The management literature provides insights into a mindsetased on the notion of stewardship that seems particularly rele-ant and fitting in this context. Stewardship refers to “an ongoingense of obligation or duty to others based on the intention tophold the covenantal relationship [and] act in protection ofthers’ long-term welfare” (Hernandez 2012, p. 174). A stew-rdship mindset thus reflects an organization-wide concern forhe welfare of others that, as business logic, guides both decision
aking (resource allocation) and actions (resource integration)oward ensuring reciprocal benefit. Accordingly, managers’ (andhus the organization’s) mindset or “cognitive processes are athe head of a chain of causality” (Sanchez and Heene 1997,. 308) that may reshape the strategic approach and strategicapabilities an organization emphasizes.
This view of mutually beneficial interactions and improve-ent of the wellbeing of the involved actors is congruent with the
o-creation principles underlying S-D logic (Vargo and Lusch008), and particularly supports the development of an S-Drientation. We thus propose a stewardship mindset as a comple-entary organizational element that acts as a significant driver
f an S-D orientation. Organizations with a stewardship mindsetee their purpose as being aligned with the wellbeing of serviceystem members and hence prioritize service-driving capabil-ties and practices that enhance the mutual benefit in the longerm.
We also suggest that an organization’s culture and leader-hip style play a significant role in the development of an S-Drientation, as summarized in the following statement:
Reinventing the firm as a service organization using S-D logicequires the organization’s culture and its leadership style to treatmployees as operant resources.. . . The role of the leader is to be
servant-leader who is there to serve the employees, rather thanhe employees serving the manager. Hence, employee–managernteraction comprises conversation and dialog and the devel-pment of norms of relational behavior such as trust, openommunication, and solidarity (Lusch et al. 2007, p. 15).
Organizational culture refers to the shared beliefs and valuesn an organization (Deshpandé, Farley, and Webster 1993). Itrovides a binding element that encourages particular rituals,orms, or expectations of behavior. For example, a firm might
ents
ailing 91 (1, 2015) 89–108
mphasize a service-driven culture and in doing so place greatmportance on notions of collaboration, open communication,nd customer care. Such a cultural orientation in turn encourageshe development of service-enabling capabilities and facilitateshe implementation of an S-D orientation.
Similarly, an organization’s leadership style determines, fornstance, which organizational behaviors are acceptable or desir-ble and thereby has the potential to promote capabilitiesecessary for service behaviors and value co-creation. In thisontext, a servant leadership style in particular will encour-ge the development of capabilities that enable better servicerovision and thus an S-D orientation, as this type of leader-hip “stresses personal integrity and serving others, includingmployees, customers, and communities” (Liden et al. 2008, p.61). While leadership style represents a tendency of individ-al service members in powerful or superordinate positions, anrganizational mindset and the firm’s culture operate at the col-ective organizational level. We argue that the implementation ofn S-D orientation benefits from a holistic and complementaryrganizational configuration that stretches across both individ-al (e.g., leadership style) and collective (e.g., organizationalulture) elements.
Moreover, from a motivation perspective, researchers couldlso study the relevance of reward or compensation systemss structural elements that support an organization’s imple-entation of an S-D orientation. Rewarding co-creation or
ervice behaviors should encourage employees to develop rel-vant service capabilities and engage in related behaviorsHomburg et al. 2003). The literature currently debates whetheruch antecedents of hierarchical formative constructs shoulde modeled at the higher-order or component level (Cadogannd Lee 2013; Rigdon 2014). As each interaction capabilityontributes uniquely to the S-D orientation construct, directlynvestigating the impact of drivers on the S-D orientation com-onents might yield more fine-grained managerial insights intohe development of respective co-creation capabilities.
Third, while self-reported performance data have been showno be reliable and strongly correlated with objective perfor-
ance data (e.g., Wall et al. 2007), more research is neededo investigate objective performance relationships through an-D logic lens and to consider respective boundary condi-
ions. For instance, understanding under which circumstanceshe S-D orientation–performance relationship becomes strongerr weaker would provide valuable theoretical and managerialnsights.
Fourth, although our S-D orientation measure has beeneveloped and applied in retail contexts, research and practiceould benefit from construct validation in additional contexts.or example, to corroborate and extend the current findings,n interesting comparison would be that of the strength ofssociation between an S-D orientation and firm performanceetrics across differing industries, business-to-business con-
exts, and partner perspectives (including those of customers,
mployees, and intermediaries). The various value network part-ers of a focal firm will plausibly differ in their perceptions ofhe status of the S-D orientation. By overcoming internal bias,uch multi-perspective investigations could help managers better
of Ret
urtsmv
tnbwa
JsDf
STR
E
I
E
C
D
PTTTTTO
TTTTTTTI
AIITI
RAdIyII
MTTTTc
CPTT
*
A
A
A
A
A
A
A
I.O. Karpen et al. / Journal
nderstand and respond to perceptual capability gaps. Suchesearch would also enable rich theoretical discussions fromhe perspectives of RBT and S-D logic with respect to under-tanding under which conditions resources or capabilities areost valuable and how perception gaps might threaten their
alue.Finally, future research might also examine longitudinal data
o determine the dynamic effects of an S-D orientation on orga-izational performance. The introduction of the S-D orientationy Karpen et al. (2012) offers a meaningful research agenda,hile in this paper we shed important light on the measurement
nd relevance of the S-D orientation.
Acknowledgments
We thank Steve Vargo, Christian Homburg, Jan B. Heide,odie Conduit and Brad Wilson for comments on previous ver-ions of this manuscript. We also thank the International Caristribution Program Australia (ICDPA) for financial support
or this research project.
Appendix. Construct items of final structural model
-D orientation (newly developed)his car dealership and its representatives:elational Interaction (RI)RI1 make me feel at ease during our dealings.RI2 try to establish rapport with me.RI3 encourage two-way communication with me.RI4 show genuine interest in engaging me.
thical Interaction (EI)EI1 do not try to take advantage of me.EI2 do not pressure me in any way.EI3 do not mislead me in any way.EI4 do not try to manipulate me.
ndividuated Interaction (II)II1 make an effort to understand my individual needs.II2 are sensitive to my individual situation.II3 make an effort to find out what kind of offering is most
helpful to me.II4 seek to identify my personal expectations.
mpowered Interaction (EI)EI1 invite me to provide ideas or suggestions.EI2 encourage me to shape the service I receive.EI3 provide me with control over my experiences.EI4 let me interact with them in my preferred way.
oncerted Interaction (CI)CI1 work together seamlessly in serving to me.CI2 act as one unit when dealing with me.CI3 provide messages to me that are consistent with each other.CI4 ensure they have smooth procedures for interacting with me.
evelopmental Interaction (DI)DI1 share useful information with me.DI2 help me become more knowledgeable.
DI3 provide me with the advice I need to use their offeringssuccessfully.DI4 offer me expertise that I can learn from.
B
ailing 91 (1, 2015) 89–108 105
erceived Value (adapted from Keh and Sun 2008; Ruiz et al. 2008)his car dealership offers good value for the price I pay.his car dealership offers good value for the effort I make.his car dealership offers good value for the time I invest.his car dealership offers experiences that make me feel good.his car dealership’s offerings are reasonably priced.*
verall experience (1 = extremely poor, 7 = extremely good)*
rust (adapted from Kingshott and Pecotich 2007)his car dealership cannot be trusted at times. (R)*
his car dealership is perfectly honest and truthful.*
his car dealership can be trusted completely.his car dealership can be counted on to do what is right.his car dealership is always faithful.his car dealership has high integrity.
have great confidence in this car dealership.
ffective Commitment (adapted from Fullerton, 2005; Jones et al., 2007) use this car dealership because I really like it. feel emotionally attached to this car dealership.his car dealership has a great deal of personal meaning for me.
feel a strong sense of identification with this car dealership.
epurchase Intentions (based on Ruiz et al. 2008)s long as the present service continues, I doubt that I would switch carealerships.
intend to continue doing business with this car dealership over the nextears.
don’t seriously consider changing car dealerships. will choose this car dealership next time I need this service.
arket Performance (based on Homburg and Pflesser 2000)he sales growth of this dealership met expectations.he sales growth of this dealership exceeded that of our major competitors.he market share growth of this dealership met expectations.he market share growth of this dealership exceeded that of our majorompetitors.
ash Flow Performance (based on Vorhies et al. 2009; Homburg andflesser 2000)he cash flow of this dealership met expectations.he cash flow of this dealership exceeded that of our major competitors.
Item was deleted during reliability and validity checks.
References
kaike, Hirotugu (1987), “Factor Analysis and Aic,” Psychometrika, 52 (3),317–32.
llen, Natalie J. and John P. Meyer (1990), “The Measurement and Antecedentsof Affective, Continuance and Normative Commitment to the Organization,”Journal of Occupational Psychology, 63 (1), 1–18.
llison, Neil K. (1978), “A Psychometric Development of a Test for ConsumerAlienation from the Marketplace,” Journal of Marketing Research, 15 (4),565–75.
ndreu, Luisa, Isabel Sánchez and Cristina Mele (2010), “Value Co-Creationamong Retailers and Consumers: New Insights into the Furniture Market,”Journal of Retailing and Consumer Services, 17 (4), 241–50.
rbuckle, James L. (2011), IBM SPSS Amos 20 User’s Guide, Chicago, IL:SPSS Inc.
rnould, Eric J. and Craig J. Thompson (2005), “Consumer Culture Theory(CCT): Twenty Years of Research,” Journal of Consumer Research, 31 (4),868–82.
ustralian Government (2009), Key Automotive Statistics, Commonwealth
Department of Innovation Industry, Science and Research, Table 2,, 17.arney Jay, B. (1991), “Firm Resources and Sustained Competitive Advantage,”Journal of Management, 17 (1), 99–121.

1 of Ret
B
B
B
B
B
C
C
C
C
C
C
C
D
D
D
D
D
D
F
F
G
G
H
H
H
H
H
H
H
H
H
H
H
J
J
J
K
K
K
K
K
K
K
06 I.O. Karpen et al. / Journal
arney, Jay B. and William S. Hesterly (2012), Strategic Management andCompetitive Advantage: Concepts and Cases, New Jersey: Pearson.
aron, Reuben M. and David A. Kenny (1986), “The Moderator-Mediator Vari-able Distinction in Social Psychological Research: Conceptual, Strategic,and Statistical Considerations,” Journal of Personality and Social Psychol-ogy, 51 (6), 1173–82.
ecker, Jan-Michael, Kristina Klein and Martin Wetzels (2012), “HierarchicalLatent Variable Models in PLS-SEM: Guidelines for Using Reflective-Formative Type Models,” Long Range Planning, 45 (5–6), 359–94.
rocato, E., Deanne, Clay M. Voorhees and Julie Baker (2012), “Understandingthe Influence of Cues from Other Customers in the Service Experi-ence: A Scale Development and Validation,” Journal of Retailing, 88 (3),384–98.
rodie, Roderick J., Michael Saren and Jaqueline Pels (2011), “TheorizingAbout the Service Dominant Logic: The Bridging Role of Middle RangeTheory,” Marketing Theory, 11 (1), 75–91.
adogan, John W. and Nick Lee (2013), “Improper Use of Endogenous Forma-tive Variables,” Journal of Business Research, 66 (2), 233–41.
assidy, Kim, Steve Baron, Dominic Elliott and George Efstathiadis (2013),“Marketing Managers’ Perceptions of Value Cocreation,” Service Science,5 (1), 4–16.
hin, Wynne W. and Peter R. Newsted (1999), “Structural Equation ModelingAnalysis with Small Samples Using Partial Least Squares,” in StatisticalStrategies for Small Sample Research, Rick Hoyle ed. Thousand Oaks, CA:Sage Publications, 307–41.
hin, Wynne, Jason Bennett Thatcher and Ryan T. Wright (2012), “AssessingCommon Method Bias: Problems with the Ulmc Technique,” ManagementInformation Systems Quarterly, 36 (3), 1003–19.
hurchill, Gilbert A. Jr. (1979), “A Paradigm for Developing Better Measuresof Marketing Constructs,” Journal of Marketing Research, 16 (1), 64–8.
ropanzano, Russell and Marie S. Mitchell (2005), “Social Exchange The-ory: An Interdisciplinary Review,” Journal of Management, 31 (6),874–900.
roon, Marcel A. and Marc J.P.M. van Veldhoven (2007), “Predicting Group-Level Outcome Variables from Variables Measured at the Individual Level:A Latent Variable Multilevel Model,” Psychologica Methods, 12 (1), 45–57.
ay, George S. (2006), “Achieving Advantage with a Service-Dominant Logic,”in The Service-Dominant Logic of Marketing: Dialog, Debate, and Direc-tions, Vargo Stephen L. and Lusch Robert F., eds. Armonk: M. E. Sharpe,85–90.
(1994), “The Capabilities of Market-Driven Organiza-tions,” Journal of Marketing, 58 (4), 37–52.
ay, George S. and Christine Moorman (2010), “Strategy from the Outside,” inProfiting from Customer Value New York: McGraw-Hill.
eshpandé, Rohit, John U. Farley and Frederick E. Webster Jr. (1993), “Corpo-rate Culture, Customer Orientation, and Innovativeness in Japanese Firms:A Quadrad Analysis,” Journal of Marketing, 57 (1), 23–37.
iamantopoulos, Adamantios and Judy A. Siguaw (2006), “Formative VersusReflective Indicators in Organizational Measure Development: A Compar-ison and Empirical Illustration,” British Journal of Management, 17 (4),263–82.
iamantopoulos, Adamantios and Heidi M. Winklhofer (2001), “Index Con-struction with Formative Indicators: An Alternative to Scale Development,”Journal of Marketing Research, 38 (2), 269–77.
onavan, D. Todd, Tom J. Brown and John C. Mowen (2004), “Internal Benefitsof Service-Worker Customer Orientation: Job Satisfaction, Commitment,and Organizational Citizenship Behaviors,” Journal of Marketing, 68 (1),128–46.
ornell, Claes and David F. Larcker (1981), “Evaluating Structural EquationModels with Unobservable Variables and Measurement Error: Algebra andStatistics,” Journal of Marketing Research, 18 (1), 39–50.
ullerton, Gordon (2005), “How Commitment Both Enables and UnderminesMarketing Relationships,” European Journal of Marketing, 39 (11/12).
(2003), “When Does Commitment Lead to Loyalty?,”
Journal of Service Research, 5 (4), 333–44.erbing, David W. and James C. Anderson (1988), “An Updated Paradigm forScale Development Incorporating Unidimensionality and Its Assessment,”Journal of Marketing Research, 25 (2), 186–92.
K
ailing 91 (1, 2015) 89–108
rönroos, Christian (2006), “Adopting a Service Logic for Marketing,” Market-ing Theory, 6 (3), 317–33.
air, Joe F., Marko Sarstedt, Christian M. Ringle and Jeannette A. Mena (2012),“An Assessment of the Use of Partial Least Squares Structural EquationModeling in Marketing Research,” Journal of the Academy of MarketingScience, 40 (3), 414–33.
arris, Lloyd C. (2002), “Measuring Market Orientation: Exploring a Mar-ket Oriented Approach,” Journal of Market-Focused Management, 5 (3),239–70.
ennig-Thurau, Thorsten, Markus F. Langer and Ursula Hansen (2001), “Mod-eling and Managing Student Loyalty,” Journal of Service Research, 3 (4),331–44.
ernandez, Morela (2012), “Toward an Understanding of the Psychology ofStewardship,” Academy of Management Review, 37 (2), 172–93.
oekstra, Janny C., Peter S.H. Leeflang and Dick R. Wittink (1999), “TheCustomer Concept: The Basis for a New Marketing Paradigm,” Journalof Market-Focused Management, 4 (1), 43–76.
olbrook, Morris B. and Elizabeth C. Hirschmann (1982), “The ExperientialAspects of Consumption: Consumer Fantasies, Feelings, and Fun,” Journalof Consumer Research, 9 (2), 132–40.
omburg, Christian and Matthias Bucerius (2005), “A Marketing Perspective onMergers and Acquisitions: How Marketing Integration Affects PostmergerPerformance,” Journal of Marketing, 69 (1), 95–113.
omburg, Christian and Christian Pflesser (2000), “A Multiple-Layer Model ofMarket-Oriented Organizational Culture: Measurement Issues and Perfor-mance Outcomes,” Journal of Marketing Research, 37 (4), 449–62.
omburg, Christian, Martin Fassnacht and Christof Guenther (2003), “The Roleof Soft Factors in Implementing a Service-Oriented Strategy in IndustrialMarketing Companies,” Journal of Business-to-Business Marketing, 10 (2),23–48.
unt, Shelby D. (2002), Foundations of Marketing Theory: Toward a GeneralTheory of Marketing, New York: M. E. Sharpe.
unt, Shelby D. and Robert M. Morgan (1995), “The Comparative AdvantageTheory of Competition,” Journal of Marketing, 59 (2), 1–15.
arvis, C.B., S.B. MacKenzie and P.M. Podsakoff (2003), “A Critical Reviewof Construct Indicators and Measurement Model Misspecification in Mar-keting and Consumer Research,” Journal of Consumer Research, 30 (2),199–218.
ohnson, Michael D., Andreas Herrmann and Frank Huber (2006), “The Evolu-tion of Loyalty Intentions,” Journal of Marketing, 70 (2), 122–32.
ones, Michael A., Kristy E. Reynolds, David L. Mothersbaugh and Sharon E.Beatty (2007), “The Positive and Negative Effects of Switching Costs onRelational Outcomes,” Journal of Service Research, 9 (4), 335–55.
andemir, Destan, Yaprak Attila and S. Tamer Cavusgil (2006), “AllianceOrientation: Conceptualization, Measurement, and Impact on MarketPerformance,” Journal of the Academy of Marketing Science, 34 (3),324–40.
armarkar, Uday (2004), “Will You Survive the Services Revolution?,” HarvardBusiness Review, 82 (6), 100–7.
arpen, Ingo O., Liliana L. Bove and Bryan A. Lukas (2012), “Linking Service-Dominant Logic and Strategic Business Practice: A Conceptual Modelof a Service-Dominant Orientation,” Journal of Service Research, 15 (1),21–38.
eh, Hean Tat and Jin Sun (2008), “The Complexities of Perceived Risk inCross-Cultural Services Marketing,” Journal of International Marketing, 16(1), 120–46.
etchen, David J. Jr., Tomas G. Hult and Stanley F. Slater (2007), “TowardGreater Understanding of Market Orientation and the Resource-BasedView,” Strategic Management Journal, 28 (9), 961–4.
ingshott, Russel P.J. and Anthony Pecotich (2007), “The Impact of Psy-chological Contracts on Trust and Commitment in Supplier-DistributorRelationships,” European Journal of Marketing, 41 (9/10).
leinbaum, David G., Lawrence L. Kupper and Keith E. Muller (1988), AppliedRegression Analysis and Other Multivariate Methods, Boston, MA: PWS-
Kent.ohli, Ajay K. and Bernard J. Jaworski (1990), “Market Orientation: The Con-struct, Research Propositions, and Managerial Implications,” Journal ofMarketing, 54 (1), 1–18.
of Ret
K
L
L
L
L
L
L
L
L
M
M
M
M
M
P
P
P
P
P
P
P
R
R
R
R
R
R
R
R
S
S
S
S
T
T
V
V
V
W
W
I.O. Karpen et al. / Journal
ozlenkova, Irina V., Stephen A. Samaha and Robert W. Palmatier (2014),“Resource-Based Theory in Marketing,” Journal of the Academy of Mar-keting Science, 42 (1), 1–21.
ampel, Joseph and Jamal Shamsie (2000), “Probing the Unobtrusive Link:Dominant Logic and the Design of Joint Ventures at General Electric,”Strategic Management Journal, 21 (5), 593–602.
aw, Kenneth S., Chi-Sum Wong and William H. Mobley (1998), “Towarda Taxonomy of Multidimensional Constructs,” Academy of ManagementReview, 23 (4), 741–55.
eiblein, Michael J. (2011), “What Do Resource- and Capability-Based TheoriesPropose?,” Journal of Management, 37 (4), 909–32.
iden, Robert C., Sandy J. Wayne, Hao Zhao and David Henderson (2008),“Servant Leadership: Development of a Multidimensional Measure andMulti-Level Assessment,” The Leadership Quarterly, 19 (2), 161–77.
indley, D.V. and A.F.M. Smith (1972), “Bayes Estimates for the Linear Model,”Journal of the Royal Statistical Society. Series B (Methodological), 34 (1),1–41.
usch, Robert F. and Stephen L. Vargo (2006), “Service-Dominant Logic as aFoundation for a General Theory,” in The Service-Dominant Logic of Mar-keting: Dialog, Debate, and Directions, Lusch Robert F. and Vargo StephenL., eds. Armonk: M. E. Sharpe, 406–19.
usch, Robert F., Stephen L. Vargo and Matthew O’Brien (2007), “Compet-ing through Service: Insights from Service-Dominant Logic,” Journal ofRetailing, 83 (1), 5–18.
ytle, Richard S., Peter W. Hom and Michael P. Mokwa (1998), “Serv*Or:A Managerial Measure of Organizational Service-Orientation,” Journal ofRetailing, 74 (4), 455–89.
adhavaram, Sreedhar and Shelby D. Hunt (2008), “The Service-DominantLogic and a Hierarchy of Operant Resources: Developing Masterful OperantResources and Implications for Marketing Strategy,” Journal of the Academyof Marketing Science, 36 (1), 67–82.
intz, Ofer and Imran S. Currim (2013), “What Drives Managerial Useof Marketing and Financial Metrics and Does Metric Use Affect Per-formance of Marketing-Mix Activities?,” Journal of Marketing, 77 (2),17–40.
itchell, Marie S., Russell S. Cropanzano and David M. Quisenberry (2012),“Social Exchange Theory, Exchange Resources, and Interpersonal Rela-tionships: A Modest Resolution of Theoretical Difficulties,” in Handbook ofSocial Resource Theory: Theoretical Extensions, Empirical Insights, andSocial Applications, Kjell Törnblom and Ali Kazemi , eds. New York:Springer.
oorman, Christine, Rohit Deshpandé and Gerald Zaltman (1993), “FactorsAffecting Trust in Market Relationships,” Journal of Marketing, 57 (1),81–101.
, Gerald Zaltman and Rohit Deshpandé (1992), “Rela-tionships between Providers and Users of Market Research: The Dynamicsof Trust within and between Organizations,” Journal of Marketing Research,29 (August), 314–29.
organ, Robert M. and Shelby D. Hunt (1994), “The Commitment-Trust Theoryof Relationship Marketing,” Journal of Marketing, 58 (3), 20–38.
almatier, Robert W., Rajiv P. Dant, Dhruv Grewal and Kenneth R. Evans (2006),“Factors Influencing the Effectiveness of Relationship Marketing: A Meta-Analysis,” Journal of Marketing, 70 (July), 136–53.
ayne, Adrian F., Kaj Storbacka and Pennie Frow (2008), “Managing the Co-Creation of Value,” Journal of the Academy of Marketing Science, 36 (1),83–96.
eteraf, Margaret (1993), “The Cornerstones of Competitive Advantage:Resource-Based View,” Strategic Management Journal, 14 (3), 179–91.
odsakoff, Philip M., Scott B. MacKenzie, Jeong-Yeon Lee and Nathan P. Pod-sakoff (2003), “Common Method Biases in Behavioral Research: A CriticalReview of the Literature and Recommended Remedies,” Journal of AppliedPsychology, 88 (5), 879–903.
rahalad, C.K. and Richard A. Bettis (1986), “The Dominant Logic: A NewLinkage between Diversity and Performance,” Strategic Management Jour-
nal, 7 (6), 485–501.rahalad, C.K. and Venkat Ramaswamy (2004), The Future of Competition: Co-Creating Unique Value with Customers., Boston: Harvard Business SchoolPress.
W
ailing 91 (1, 2015) 89–108 107
reacher, Kristopher J., Michael J. Zyphur and Zhen Zhang (2010), “A GeneralMultilevel Sem Framework for Assessing Multilevel Mediation,” Psycho-logical Methods, 15 (3), 209–33.
amani, Girish and V. Kumar (2008), “Interaction Orientation and Firm Perfor-mance,” Journal of Marketing, 72 (1), 27–45.
audenbush, Stephen W. and Anthony S. Bryk (2002), Hierarchical LinearModeling: Applications and Data Analysis Methods, Thousand Oaks: Sage.
ichardson, Hettie A., Marcia J. Simmering and Michael C. Sturman (2009), “ATale of Three Perspectives Examining Post Hoc Statistical Techniques forDetection and Correction of Common Method Variance,” OrganizationalResearch Methods, 12 (4), 762–800.
ichey, R. Glenn Jr., Mert Tokman and Vivek Dalela (2011), “ExaminingCollaborative Supply Chain Service Technologies: A Study of Intensity,Relationships, and Resources,” Journal of the Academy of Marketing Sci-ence, 38 (1), 71–89.
igdon, Edward E. (2014), “Comment on Improper Use of Endogenous Forma-tive Variables,” Journal of Business Research, 67 (1), 2800–2.
ingle, Christian M., Sven Wende and Alexander Will (2005), SmartPLS 2.0(M3) Beta Hamburg, [Retrieved December 10, 2008 from www.smartpls.de]
uiz, David Martín, Dwayne D. Gremler, Judith H. Washburn and GabrielCepeda Carrión (2008), “Service Value Revisited: Specifying a Higher-Order, Formative Measure,” Journal of Business Research, 61 (12),1278–91.
ussell, Daniel W. (2002), “In Search of Underlying Dimensions: The Use (andAbuse) of Factor Analysis in Personality and Social Psychology Bulletin,”Personality and Social Psychology Bulletin, 28 (12), 1629–46.
anchez, Ron and Aimé Heene (1997), “Reinventing Strategic Management:New Theory and Practice for Competence-Based Competition,” EuropeanManagement Journal, 15 (3), 303–17.
heth, Jagdish N. and Rajendra S. Sisodia (2005), “A Dangerous Divergence:Marketing and Society,” Journal of Public Policy & Marketing, 24 (1),160–2.
and (2006), Does MarketingNeed Reform? in Does Marketing Need Reform?, Sheth Jagdish N. andSisodia Rajendra S., eds. Armonk: M. E. Sharpe, 3–11.
mith, Adrian F.M. (1973), “A General Bayesian Linear Model,” Journal of theRoyal Statistical Society. Series B (Methodological), 35 (1), 67–75.
teenkamp, Jan-Benedict E.M. and Hans C.M. van Trijp (1991), “The Use of Lis-rel in Validating Marketing Constructs,” International Journal of Researchin Marketing, 8 (4), 283–99.
eece, David J., Gary Pisano and Amy Shuen (1997), “Dynamic Capabili-ties and Strategic Management,” Strategic Management Journal, 18 (7),509–33.
hibaut, J.W. and H.H. Kelly (1959), The Social Psychology of Groups, NewYork, NY: Wiley.
aradarajan, Rajan (2010), “Strategic Marketing and Marketing Strategy:Domain, Definition, Fundamental Issues, and Foundational Premises,” Jour-nal of the Academy of Marketing Science, 38 (2), 119–40.
argo, Stephen L. and Robert F. Lusch (2004), “Evolving to a New DominantLogic for Marketing,” Journal of Marketing, 68 (1), 1–17.
and (2008), “Service-DominantLogic: Continuing the Evolution,” Journal of the Academy of MarketingScience, 36 (1), 1–10.
orhies, Douglas W., Robert E. Morgan and Chad W. Autry (2009), “Product-Market Strategy and the Marketing Capabilities of the Firm: Imapct onMarket Effectiveness and Cash Flow Performance,” Strategic ManagementJournal, 30 (12), 1310–34.
all, Toby D., Jonathan Michie, Malcolm Patterson, Stephen J. Wood, MauraSheehan, Chris W. Clegg and Michael West (2007), “On the Validity ofSubjective Measures of Company Performance,” Personnel Psychology, 57(1), 95–118.
etzels, Martin, Gaby Odekerken-Schröder and Claudia van Oppen (2009),“Using PLS Path Modeling for Assessing Hierarchical Construct Mod-els: Guidelines and Empirical Illustration,” MIS Quarterly, 33 (1),
177–95.ilden, Ralf, Siegfried Gudergan, Bo Nielsen and Ian Lings (2013), “DynamicCapabilities and Performance: Strategy, Structure and Environment,” LongRange Planning, 46 (1–2), 72–96.

1 of Ret
W
W
Y
Z
08 I.O. Karpen et al. / Journal
illiams, John and Robert Aitken (2011), “The Service-Dominant Logic of Mar-keting and Marketing Ethics,” Journal of Business Ethics, 102 (3), 439–54.
ong, Chi-Sum, Kenneth S. Law and Guo-hua Huang (2008), “On theImportance of Conducting Construct-Level Analysis for Multidimensional
Constructs in Theory Development and Testing,” Journal of Management,34 (4), 744–64.im, Chi Kin (Bennett), Kimmy Wa Chan and Simon S.K. Lam(2012), “Do Customers and Employees Enjoy Service Participation?
Z
ailing 91 (1, 2015) 89–108
Synergistic Effects of Self- and Other-Efficacy,” Journal of Marketing, 76(6), 121–40.
eithaml, Valarie A. (1988), “Consumer Perceptions of Price, Quality and Value:A Means-End Model and Synthesis of Evidence,” Journal of Marketing, 52
(3), 2–22.eithaml, Valarie A., Leonard L. Berry and A. Parasuraman (1996), “TheBehavioral Consequences of Service Quality,” Journal of Marketing, 60 (2),31–46.
Copyright © 2022 FDOKUMEN