FINAL PERFORMANCE EVALUATION OF THE KENYA ...
173
1 July 2013 This publication was produced at the request of the United States Agency for International Development. It was prepared by Tom Easterling, Felix M’mboyi, and Management Systems International. FINAL PERFORMANCE EVALUATION OF THE KENYA DAIRY SECTOR COMPETITIVENESS PROGRAM
-
Upload
khangminh22 -
Category
Documents
-
view
4 -
download
0
Transcript of FINAL PERFORMANCE EVALUATION OF THE KENYA ...

1
July 2013
This publication was produced at the request of the United States Agency for International Development. It was prepared by Tom Easterling, Felix M’mboyi, and Management Systems International.
FINAL PERFORMANCE EVALUATION OF THE KENYA DAIRY SECTOR COMPETITIVENESS PROGRAM

FINAL PERFORMANCE EVALUATION OF THE KENYA DAIRY SECTOR COMPETITIVENESS PROGRAM USAID SUPPORT TO KENYA’S DAIRY INDUSTRY FOR A FIVE-YEAR PERIOD FROM MAY 2008 UNTIL APRIL 2013 July 10, 2013 Contracted under No. AID–623–I–12–00001 (Task Order No. AID–623–TO–13– 00015) Kenya Support Program DISCLAIMER This evaluation was made possible by the support of the American People through the United States Agency for International Development (USAID).The contents of this evaluation are the sole responsibility of Tom Easterling and Felix M’mboyi of Management Systems International and do not necessarily reflect the views of USAID or the United States Government.
Front cover:
Mrs. Lydia Waruguru at her quarter-acre zero-grazing dairy farm at Icugu, near Nyeri. Also featured is “Melissa,” the offspring of Mrs. Waruguru’s Friesian foundation cow, whose successive generations will be prolific milk producers. After three more generations, Melissa’s successive offspring can be registered as high-value, pedigreed dairy animals.

i
CONTENTS ACRONYMS ................................................................................................................................................ II EXECUTIVE SUMMARY ............................................................................................................................ 1 EVALUATION PURPOSE AND EVALUATION QUESTIONS ............................................................. 4 PROJECT BACKGROUND ........................................................................................................................ 5 EVALUATION METHODS AND LIMITATIONS .................................................................................... 7 FINDINGS AND CONCLUSIONS ............................................................................................................ 9 RECOMMENDATIONS ............................................................................................................................ 25 ANNEX A. TABLES AND FIGURES ....................................................................................................... 28 \ANNEX B. EVALUATION TEAM MEMBERS AND DESIGNATED TASKS ..................................... 47 ANNEX C. FARMER SURVEY: TECHNICAL REPORT ........................................................................ 50 ANNEX D.1 FOCUS GROUP DISCUSSION TOOLS .......................................................................... 59 ANNEX D.2 QUALITATIVE INTERVIEW GUIDES ............................................................................. 64 ANNEX E. REFERENCES ......................................................................................................................... 75 ANNEX F. STATEMENT OF WORK...................................................................................................... 79 ANNEX G. WORK SCHEDULE OF FARMER SURVEY ....................................................................... 92 ANNEX H. WORK SCHEDULE OF THE EVALUATION TEAM ........................................................ 95 ANNEX I. KEY INFORMANTS INTERIEWED ...................................................................................... 99 ANNEX J. CONFLICT OF INTEREST STATEMENTS BY TEAM MEMBERS .................................. 112 ANNEX K. FINDINGS, CONCLUSIONS, AND RECOMMENDATIONS (F/C/R)............................ 115

ii
ACRONYMS
AI Artificial insemination
BDS Business Development Services
CFR Code of Federal Regulations
ESADA Eastern and Southern Africa Dairy Association
FGD focus group discussion
FtF Feed the Future Initiative
GDP
GOK
Gross Domestic Product
Government of Kenya
KAVES Kenya Agricultural Value Chain Enterprises Support
KDDP Kenya Dairy Development Program
KDSCP Kenya Dairy Sector Competitiveness Program
KENDBIP Kenya National Domestic Biogas Program
KLIFT
Ksh
Kenya Livestock Finance Trust
Kenya shilling (currency)
MSI Management Systems International
NDPA National Dairy Processors’ Association
NDTF National Dairy Task Force
PERSUAP Pesticides Evaluation Reports and Safe Use Action Plans
PMP Performance Management Plan
SACCO Savings and Credit Cooperative
SBO Smallholder Business Organization
SO Strategic Objective
SOW statement of work
TNS TNS Research International
USAID United States Agency for International Development
WTO World Trade Organization

1
EXECUTIVE SUMMARY This is an independent, final evaluation of the Kenya Dairy Sector Competitiveness Program (KDSCP), which was implemented by Land O’Lakes International Development. Management Systems International carried out the evaluation between April and June 2013, under the Kenya Program Support Project. Its purpose was to a) document the degree to which project interventions achieved their planned results; b) determine the extent to which the project strengthened the dairy sector; c) identify best practices, lessons learned, and areas of improvement for future programs; and d) make recommendations for future USAID programs under the Feed the Future (FtF) Initiative with particular emphasis on its Kenya Agriculture Value Chain Enterprises Support (KAVES) project. KDSCP ran from May 1, 2008, until April 30, 2013, with a $9 million budget. It worked in eight locations across the Central and Rift Valley provinces. The program’s goals were to 1) increase smallholder household incomes through the sale of quality milk and 2) help transform the Kenyan dairy industry into a globally competitive and regional market leader. KDSCP sought to improve the competitiveness of Kenya’s dairy industry while increasing economic benefits throughout the entire dairy value chain, with particular emphasis on smallholder farmers. The evaluation consisted of two main activities: 1) a quantitative evaluation component based on survey of 402 smallholder dairy farmers in the eight sites and 2) a qualitative component based on focus group discussions (FGDs) with leaders of smallholder business organization (SBOs) and separate groups of male and female dairy farmers, as well as open-ended interviews with dairy value chain operators and key informants. EVALUATION QUESTIONS The evaluation responded to five questions forming the core evaluation requirement: 1. To what extent did KDSCP meet the intended goals? If the goal was not achieved, why not? 2. What were the internal and external enabling factors that contributed to meeting or not meeting
the intended goals? 3. What is the evidence concerning the sustainability of the end results produced by the program? 4. To what extent did the program employ new approaches? 5. To what extent were environmental compliance mitigation measures identified at the beginning of
the project effectively implemented, including Pesticides Evaluation Reports and Safe Use Action Plans (PERSUAP)?
The evaluation also reviewed KDSCP activities in support of gender and youth, and provided recommendations for future FtF programs such as KAVES. MAJOR FINDINGS, CONCLUSIONS, AND RECOMMENDATIONS Question 1. Goal Achievement The project helped increase household income by increasing productivity and reducing production costs. This was reinforced by a general increase in market prices for fresh milk over the life of the project. The project also worked to improve milk quality throughout the dairy value chain and helped stabilize seasonal shifts in milk production volume by introducing better animal feeding methods to small farmers. Survey data reveals that the project achieved the first goal: increasing smallholder household incomes. Although the project helped to make the dairy market more competitive, it did not achieve the secondary goal of helping Kenya’s dairy industry to become an internationally competitive and regional market leader. Milk supplies are inconsistent and vary throughout the year, making it difficult to establish a suitable marketing program to supply domestic and regional customers. Furthermore, milk

2
produced in Kenya does not generally meet stringent international quality standards. Presently, the Kenyan dairy industry does not have the capability to meet international quality standards that require milk to be chilled within two hours after milking, particularly by small farmers in rural areas. Recommendations. 1. Future USAID dairy projects should support and encourage cold chain milk development between
small farmers and milk processors. 2. Future USAID projects should include regional initiatives to harmonize quality standards in dairy. Question 2. Enabling Factors There are three main internal factors that contributed to the meeting of KDSCP goals: 1) the linkages created by the project between smallholder farmers and SBOs, and between farmers and their commercial service providers; 2) smallholder farmers’ training facilitated by KDSCP, particularly demonstrations and observation visits; and 3) KDSCP–facilitated credit to smallholder farmers and their associated SBOs. All three activities were carried out under Land O’Lakes’ Business Development Services approach. There were four main external factors that affected the achievement of project goals: 1) considerable seasonal variations in milk production between Kenya’s rainy and dry seasons caused market disruption and swings in producer prices that deterred planning and investment; 2) the increased competition for milk produced by smallholder farmers over the life of the project benefited smallholder farmers; 3) the lack of a milk “cold chain” between farmers and milk processors has a major, negative impact on milk quality and producer incomes; and, 4) the economic policy of the Government of Kenya (GOK) over the five-year life of the project has been generally positive and favorable to the dairy industry. Recommendations. 1. Future USAID dairy support projects that involve smallholder training should, to the greatest extent
possible, combine lectures with demonstrations and make use of observation visits to see farmers in other locations.
2. Future USAID support to the dairy industry should focus on activities that potentially mitigate the effect of cyclical milk production, including emphasizing the increased production and preservation of fodder as a source of animal feed during the dry season, along with better methods for water harvesting and storage.
Question 3. Sustainability Evaluators reviewed the sustainability of the program’s end results from the perspective of organizations supported, smallholder linkages, and use of technology. The project strengthened 135 SBOs, including self-help groups, limited companies, and producer cooperatives. Institutional strengthening has included management training and capacity development for business and strategic planning (typically two trainings per year per SBO). The sustainability of the SBOs will depend largely on their management capabilities. The linkages between smallholder farmers and the 135 SBOs have enabled farmers to consolidate (“bulk”) their milk production for joint marketing, contributing to an increase in milk prices from a base of Ksh 18 per liter in 2008 to Ksh 34 per liter presently (June 2013). The linkages between smallholder farmers and value chain actors who provide products and services to them are based on commercial transactions. These linkages are mutually beneficial and profitable for both parties, and are sustainable.

3
The PMP results state that by the end of the project, 184,586 dairy producers were using improved technologies. Current technologies in use are sustainable. However, the main restraint on technology acquisition and its use by smallholder farmers and SBOs is their lack of financial resources, and the high costs of credit financing. Recommendations. 1. Future USAID dairy programs should continue to support and strengthen the management
capabilities of SBO leaders. 2. The USAID infrastructure fund for the KAVES project should provide a low-cost, rotating credit
fund, managed by local financial institutions, for the adoption of technology by smallholder farmers, the acquisition of milk cooling equipment for SBOs, and the purchase of dairy animals by women and youth.
Question 4. New Approaches KDSCP has also made available 31 new technologies and management practices. The most important on-farm technologies that were transferred to stakeholders were artificial insemination (AI) and breed improvements, and silage/feed making with the use of animal shelters and modern dairy sheds. SBO leaders ranked cooling as the most important technology in use by farmer organizations. Farmers and SBOs in the Central Region have a greater use and understanding of dairy technology than those in the Rift Valley. Recommendations 1. Future USAID dairy projects should continue to support the use of the most important technologies
through information, demonstration, training, and affordable financing. Of particular importance is the continued support to AI technology and breed improvement.
Question 5. Environmental Protection The project’s June 2008 publication of the Pesticides Evaluation Reports and Safe Use Action Plans (PERSUAP) included USAID’s pesticide procedures, which are embodied in the Agency's Code of Federal Regulations. The project encouraged the safe use of pesticides and demonstrated environmentally sustainable dairy feed crop production practices. However, the KDSCP project team did not comply with quarterly environmental reporting requirements as defined by the PERSUAP, which was not enforced by USAID. Producing biogas from animal waste provides substantial environmental benefits and saves considerable expenses in energy and labor. Biogas production is an extremely important byproduct of the dairy value chain; it has positive environmental impacts and saves labor for females. However, its use by smallholder dairy farmers is limited because of the relatively high cost of constructing biogas extraction units and the lack of affordable credit. Recommendations. 1. Future dairy projects should continue to provide training and demonstrations for smallholder dairy
farmers in environmentally friendly farming practices for on-farm production of animal feed. 2. Future USAID dairy projects should fully integrate biogas production into project implementation.

4
EVALUATION PURPOSE AND EVALUATION QUESTIONS EVALUATION PURPOSE This is an independent, final evaluation of the Kenya Dairy Sector Competitiveness Program (KDSCP) implemented by Land O’Lakes International Development. Management Systems International (MSI) carried out the evaluation under the Kenya Program Support Project. The evaluation was conducted April through June 2013 by a two-person team consisting of an international agribusiness consultant and a Kenyan agricultural economist with experience in Kenya’s dairy subsector. The MSI office in Nairobi supported the team logistically and administratively. The Kenyan social research firm TNS Research International (TNS) was engaged to 1) survey individual, smallholder KDSCP beneficiaries within the program area and 2) assist evaluation consultants in organizing and conducting focus group discussions (FGDs) with other program beneficiaries at specified milksheds within the intervention area. Annex B provides background on the evaluation team members and TNS and describes their designated tasks. The purpose of the evaluation was to a) document the degree to which USAID–funded KDSCP interventions through Land O’Lakes achieved their planned results; b) determine to what extent KDSCP helped strengthen the dairy sector; c) identify best practices, lessons learned, and areas of improvement for future programs; and d) recommend ways to optimize the effectiveness of future programming in Kenya’s agricultural sector, especially the Kenya Agriculture Value Chain Enterprises Support (KAVES) project recently initiated under USAID/Kenya’s Feed the Future (FtF) Initiative. The KDSCP evaluation will inform the strengthening of the dairy sector under the new KAVES program, implemented by Fintrac. Relevant lessons from this evaluation will be applied to work planning and the development of the new program. Annex A, Figure A.5, provides the evaluation team’s suggested approach for KAVES dairy support based on what was learned during the evaluation. The primary audience of this evaluation is the USAID/Kenya Agriculture, Business and Environment Office; USAID/Washington; key dairy stakeholders, including the Ministry of Agriculture, private sector dairy operators, and service providers; relevant partners, including Fintrac and the Kenya Agriculture Research Institute; and the Agricultural and Rural Donor Group. EVALUATION QUESTIONS The evaluation team was required to respond specifically to five questions posed by USAID in the evaluation statement of work (SOW). The questions are listed below and in the SOW found in Annex F, and are discussed throughout the report.
1. To what extent did KDSCP meet the intended goals? If the goal was not achieved, why not? 2. What were the internal and external enabling factors that contributed to meeting or not
meeting the intended goals? 3. What is the evidence concerning the sustainability of the end results produced by the program? 4. To what extent did the program employ new approaches? 5. To what extent were environmental compliance mitigation measures identified at the beginning
of the project effectively implemented, including Pesticides Evaluation Reports and Safe Use Action Plans?
The evaluation team also considered gender and youth as a crosscutting theme in its analysis. Findings, conclusions and recommendations on gender and youth issues are in Annex A, Figure A.7.

5
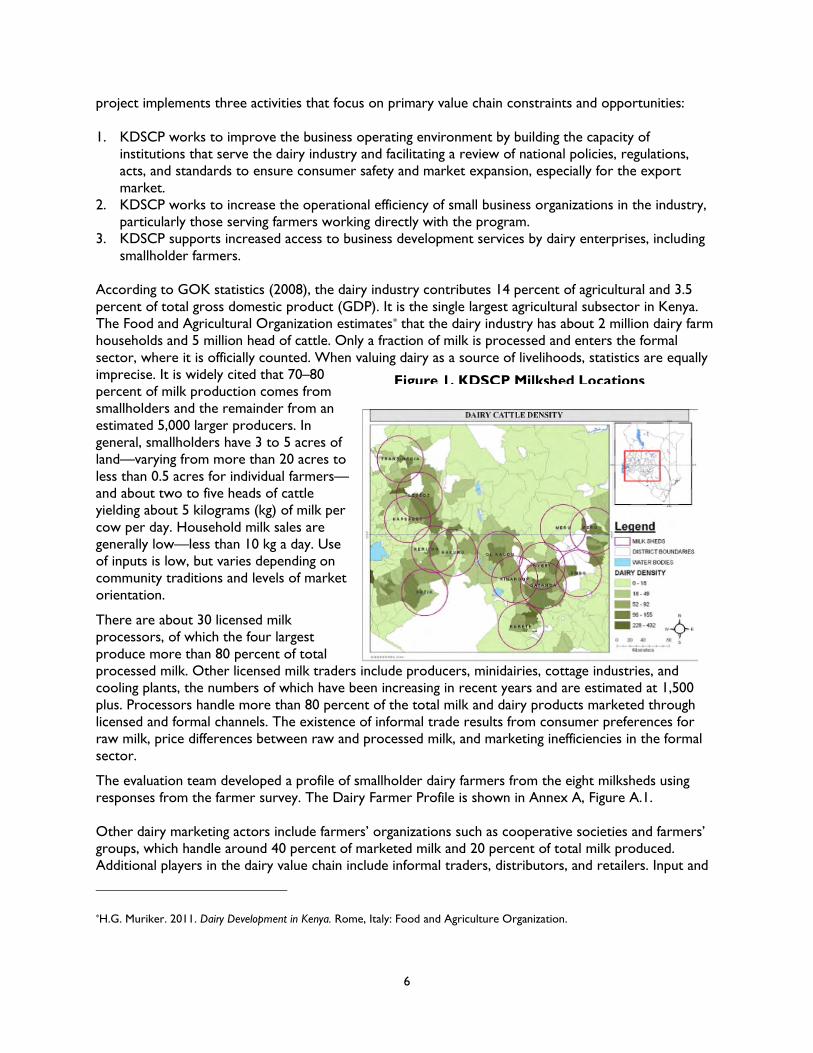
PROJECT BACKGROUND KDSCP operated from May 1, 2008, until April 30, 2013, with a $9 million budget. It worked in eight milkshed locations* across the Central and Rift Valley provinces. The program’s primary goal was to increase smallholder household incomes through the sale of quality milk. Its secondary goal was to help transform the Kenyan dairy industry into a globally competitive and regional market leader by eliminating inefficiencies and lowering production and processing costs throughout the dairy value chain, while working to ensure that Kenyan milk met domestic and international quality standards. Thus, the program aimed to improve the competitiveness of Kenya’s dairy industry and increase economic benefits to stakeholders throughout the entire dairy value chain, with an emphasis on smallholder farmers. It also integrated the crosscutting themes of gender and youth and sustainable resource management and utilization. The project built on the experiences and achievements of the USAID Kenya Dairy Development Program (KDDP) that was implemented from September 2002 through April 2008. KDDP focused on productivity and markets, market development and trade, business development services, and producer/trade organizations. KDSCP was designed to fill gaps in KDDP by emphasizing milk quality throughout the dairy value chain to increase smallholder household incomes in the dairy subsector. KDSCP also was designed to support USAID/Kenya’s Strategic Objective (SO) 7, “Increased Rural Household Incomes.” When USAID began its Feed the Future (FtF) multiyear strategy in fiscal year 2011, the Mission opted to keep the strategic framework for KDSCP within (SO) 7. Otherwise, the changes in geographic focus and rural beneficiaries through the merging of KDSCP into the FtF strategy would have caused considerable disruption in project implementation. In any event, KDSCP supported all three intermediate results that have been incorporated into USAID/Kenya’s FtF Strategic Objective, which is “Inclusive Agricultural Sector Growth.” USAID/Kenya’s “theory of change” for transforming agriculture and reducing poverty and hunger through its FtF strategy will require the improved competitiveness of select high-potential value chains (including dairy) with multiplier effects that facilitate employment opportunities. KDSCP further applies the development theory that strengthening the nodes of the dairy sector value chain will lead to an increase in smallholder household incomes from the sale of quality milk. KDSCP is entirely aligned with the GOK’s development priorities. Kenya’s Agricultural Sector Development Strategy identifies livestock, including dairy, as one of its 15 priority areas. Furthermore, the program is supportive of the Kenya National Dairy Master Plan, which is a key component of Kenya’s Vision 2030 development goals. The country’s development goals call for Kenya to become a globally competitive and prosperous nation with a high quality of life by 2030. The map in Figure 1 identifies the 14 original milksheds that KDSCP had planned for implementation. The original 14 locations were later consolidated into eight milksheds within the same general area. The
*In KDSCP terminology, a milkshed is a geographical area centered on a municipality with a radius of roughly 35 kilometers. KDSCP criteria for selecting milkshed locations included a production capability of around 50,000 to 100,000 liters of raw milk per day, along with the availability of adequate roads to permit the transport of the milk to locations where it could be processed and marketed. Eight milksheds were located in the Rift Valley and Central Province, in areas known as Gatanga (Thika), Kabete, Kericho, Kinangop, Lessos, Nakuru, Nyeri, and Trans Nzoia.
6
project implements three activities that focus on primary value chain constraints and opportunities: 1. KDSCP works to improve the business operating environment by building the capacity of
institutions that serve the dairy industry and facilitating a review of national policies, regulations, acts, and standards to ensure consumer safety and market expansion, especially for the export market.
2. KDSCP works to increase the operational efficiency of small business organizations in the industry, particularly those serving farmers working directly with the program.
3. KDSCP supports increased access to business development services by dairy enterprises, including smallholder farmers.
According to GOK statistics (2008), the dairy industry contributes 14 percent of agricultural and 3.5 percent of total gross domestic product (GDP). It is the single largest agricultural subsector in Kenya. The Food and Agricultural Organization estimates* that the dairy industry has about 2 million dairy farm households and 5 million head of cattle. Only a fraction of milk is processed and enters the formal sector, where it is officially counted. When valuing dairy as a source of livelihoods, statistics are equally imprecise. It is widely cited that 70–80 percent of milk production comes from smallholders and the remainder from an estimated 5,000 larger producers. In general, smallholders have 3 to 5 acres of land—varying from more than 20 acres to less than 0.5 acres for individual farmers—and about two to five heads of cattle yielding about 5 kilograms (kg) of milk per cow per day. Household milk sales are generally low—less than 10 kg a day. Use of inputs is low, but varies depending on community traditions and levels of market orientation. There are about 30 licensed milk processors, of which the four largest produce more than 80 percent of total processed milk. Other licensed milk traders include producers, minidairies, cottage industries, and cooling plants, the numbers of which have been increasing in recent years and are estimated at 1,500 plus. Processors handle more than 80 percent of the total milk and dairy products marketed through licensed and formal channels. The existence of informal trade results from consumer preferences for raw milk, price differences between raw and processed milk, and marketing inefficiencies in the formal sector.
The evaluation team developed a profile of smallholder dairy farmers from the eight milksheds using responses from the farmer survey. The Dairy Farmer Profile is shown in Annex A, Figure A.1. Other dairy marketing actors include farmers’ organizations such as cooperative societies and farmers’ groups, which handle around 40 percent of marketed milk and 20 percent of total milk produced. Additional players in the dairy value chain include informal traders, distributors, and retailers. Input and
*H.G. Muriker. 2011. Dairy Development in Kenya. Rome, Italy: Food and Agriculture Organization.
Figure 1. KDSCP Milkshed Locations

7
service providers include agrovet and other shops, breeding service providers, suppliers of breeding stock, dairy recording and stud book service providers, veterinary service providers, and extension and advisory service providers.
EVALUATION METHODS AND LIMITATIONS EVALUATION METHODS The evaluation consisted of two main activities: 1) a quantitative survey of smallholder dairy farmers within the eight milkshed areas, and 2) a qualitative component based on information from open-ended interviews with dairy value chain operators and key informants, as well as focus group discussions (FGDs) with leaders of smallholder business organization (SBOs) and men and women dairy farmers located in four3 of the eight milkshed locations. The farmer survey was carried out by TNS under contract with MSI, while open-ended interviews and FGDs were conducted by evaluation team members. MSI provided oversight and quality assurance to the survey design and implementation, while analysis of both qualitative and quantitative data was carried out by the MSI evaluation team. Over the course of the evaluation, the survey team interviewed a random sample of 402 farmers, providing a 90 to 95 percent confidence level in the total number of beneficiary farmers at the eight milksheds.4 A minimum of 50 farmers were surveyed in each milkshed, while the team leader and agricultural economist conducted 60 open-ended interviews. Those interviewed included previous Land O’Lakes project officials; dairy value chain operators; dairy service providers and input suppliers; Kenyan government agencies; and relevant donors, nongovernmental organizations, and other stakeholders. Evaluation team members also held FGDs with 12 groups, ranging from 8 to 12 members, across four specified milksheds with a combined total of 120 participants. Three different focus groups were organized at each milkshed, composed of the following participants: 1) leaders of different SBOs at each milkshed, 2) female KDSCP smallholder beneficiaries, and 3) male KDSCP smallholder beneficiaries. Information derived from the farmer survey, open-ended interviews, and FGDs were used to inform the evaluation team’s findings, conclusions, and recommendations related to the evaluation questions and crosscutting issues. The FGDs with male and female beneficiary groups were also designed to probe the impact of the project on gender attitudes and gender equality. Moreover, the evaluation team made a special effort to include young farmers in the FGDs and interviews to explore their perceptions on business and employment opportunities in the dairy subsector. The methodology for the farmer survey is in Annex C, and the methodology for the qualitative evaluation, including open-ended interviews and FGDs, are in Annex D. EVALUATION LIMITATIONS
3The four milksheds selected for qualitative evaluation included Gatanga, Nyeri, Nakuru, and Lessos, as per the SOW. These sites were selected based on criteria that included a) geography, b) distance from markets, c) productivity potential, and d) the impact of postelection violence. 4The Life of Project Results provided by Land O’Lakes show the total number of project beneficiaries as 338,210.

8
The main limitations experienced by the evaluation team are summarized as follows: • A few key informants (International Fund for Agricultural Development, Brookside Dairies, other
service providers) were unavailable for interviews because of conflicting schedules, travel, or “donor fatigue.” Their perspectives would have been helpful, but the team does not feel its conclusions and recommendations would differ substantially had this information been available.
• Numerical data collected by the team from farmers in the FGDs were estimated values (at best) in view of their limited record-keeping. Data on productivity and production tended to be crude estimates, as there was a lack of accurate information regarding the amount of milk produced and sold. Some respondents’ recall of pre-project information was likely inaccurate.
• The KDSCP project ended April 30, 2013, shortly after the evaluation work began. The team was unable to contact the previous Land O’Lakes project staff during the last two weeks of the in-country evaluation work (late May and early June 2013) to clarify some of the final PMP results for the project. Thus, stated results were accepted. Furthermore, the final PMP results provided to the evaluation team by the project staff did not include findings from the final survey (KDSCP Final Farm Level Survey 2013) that was conducted by Land O’ Lakes shortly before the project ended to assess the extent to which the program achieved its objectives over the five-year life of the project.
• The following limitations were experienced by TNS in data collection:
— Survey participants were difficult to contact because their actual contact information was different from that found in project records. In many cases, after the survey team made initial contact with smallholders, they became unresponsive and unwilling to participate in the survey.
— Extreme weather conditions in some rural locations caused daylong rains and flooding that affected the movements of the survey team.
— Participating farmers had high expectations for monetary gains and many were reluctant to participate in the survey without compensation.

9
FINDINGS AND CONCLUSIONS QUESTION 1. TO WHAT EXTENT DID KDSCP MEET THE INTENDED GOALS? IF THE GOAL WAS NOT ACHIEVED, WHY NOT? The primary goal of the project was to increase smallholder household incomes through the sale of quality milk. KDSCP’s secondary goal was to help transform the Kenyan dairy industry into a globally competitive and regional market leader by eliminating inefficiencies and lowering production and processing costs in the dairy value chain, while ensuring that Kenyan milk could meet domestic, regional, and international quality standards. Findings Increase in Smallholder Household Incomes. Based on life of project results from the KDSCP PMP (hereafter the PMP), smallholder household incomes from dairy increased by 208 percent from a baseline of Ksh 2,043/month to a final amount of Ksh 6,299/month. The comparison of KDSCP life of program targets with actual program results is shown in Annex A, Table A.7 for all program indicators. The estimated amount of average dairy household income per month calculated from the evaluation household survey was approximately Ksh 8,352 per month (Annex A, Table A.1), which was higher than the Ksh 6,299/month reported by the PMP. Respondents to the household survey reported only a range of income values so it was not possible to determine the exact amount of dairy income from the survey; however, it was possible to reasonably calculate accurate estimates of these values. A previous survey of KDSCP beneficiary households conducted by Tegemeo Institute5 during August–September 2010 reported that the average annual value of milk production by targeted households was Ksh 112,733 (or Ksh 9,394.41 per month). This is nearly 50 percent greater than the amount reported by the PMP, and is 12 percent higher than the average income calculated from the evaluation survey. The team’s calculations from the evaluation farmer survey showed that in the eight milkshed areas, total average household income was approximately Ksh 24,106 per month. Of this total amount, dairy income (Ksh 8,352 per month) was 34.6 percent of total income (Annex A, Table A.1). Monthly household income ranged from Ksh 18,920 in Kinangop to 32,516 in Trans Nzoia. In comparison, dairy income ranged from Ksh 6,327 per month in Kabete to Ksh 10,750 per month in Nkuru. In comparison, the 2010 Tegemeo survey reported that the average annual household income for the KDSCP targeted group was Ksh 392,828 (or Ksh 32,735 per month). Annex A, Table A.2 provides a comparison of average monthly incomes from dairy by gender (male and female), as well as by age (youth and adult). This table shows that male respondents had greater monthly 5Tegemeo Institute for Agricultural Policy and Development. 2011. USAID Household Indicator Survey 2010. Nairobi, Kenya: Egerton University. Through this and earlier surveys, the Tegemeo Institute tracked progress made toward achieving USAID’s (SO) 7 by monitoring changes in selected indicators related to household income, agricultural productivity, adoption level of farming technology, and agricultural marketing. The 2010 survey covered 688 households (349 participating and 339 nonparticipating) in (SO) 7 projects—including KDSCP—related to maize, horticulture, and dairy.

10
dairy earnings than female respondents (Ksh 8,876 compared to Ksh 7,292), and that adult respondents had slightly more monthly income than youth respondents (Ksh 8,425 compared to Ksh 8,021 per month). For all four categories of respondents (male, female, youth, adult), average monthly dairy income was approximately one-third of total monthly household income. During the evaluation, USAID also requested how the percentage of smallholder milk production sold to SBOs varied geographically and by size of operation, since this information could help in future project design and implementation. As shown in Annex A, Table A.4, the average amount of milk sold through formal channels (SBOs and milk processors) within the different milksheds ranges from 75–98 percent of the total amount of milk sold by the surveyed farmers. Similar results were obtained when data were disaggregated by size of dairy operation (Annex A, Table A.5), showing that the average amount of milk sold through formal channels ranges from 78–96 percent of the entire amount of milk sold. Not surprisingly, Table A.5 shows that larger dairy farmers do not sell through milk vendors (hawkers); instead, they sell through formal marketing channels or directly to larger clients. Factors that contributed to the reported increase in household incomes from milk sales included the following: • The market price for milk (Ksh per liter) produced by small farmers increased by 89 percent over
the project life from about Ksh 18 in 2008 to around Ksh 34 in 2013, as reported by Lessos milkshed SBO leaders who participated in the team’s FGDs.6 In comparison, the farmgate price per liter reported by the 2010 Tegemeo survey was Ksh 20 per liter.
• The PMP shows a reduction in milk production cost from a baseline amount of Ksh 14.20 per liter in 2008 to Ksh 11.14 per liter in 2013—a cost reduction of 21.5 percent. The Land O’Lakes attributed the reduction to the shift by smallholder farmers from buying commercial animal feed to feed that was largely produced on farm, and mixed with purchased feed supplements. However, the on-farm production of animal feed seems to be somewhat limited: Only 25 percent of surveyed farmers use fodder trees, and no more than 16 percent have planted pasture or produce silage, and only 14 percent produce hay (Annex A, Table A.8).
• The team’s calculations show that without the increase in milk prices over the life of KDSCP,7 household incomes would still have increased by approximately 79 percent (from Ksh 2,043 per month to around Ksh 3,657 per month). This calculation is shown in Annex A, Figure A.4.
6 The evaluation team observed during FGDs with SBO leaders and field visits to dairy cooperatives that nearly all the SBO leaders have a “trade union” mentality: they see their primarily role as squeezing higher milk prices from the milk processors who buy their milk. This, of course, leads to higher consumer prices. However, knowledgeable observers such as the CEO of the Eastern and Southern Africa Dairy Association – ESADA – and the Regional Manager of the East Africa Dairy Development Project (Heifer International) warn that high retail milk prices in Kenya resulting from inefficient production by Kenya’s dairy farmers can encourage stiff competition in domestic markets from international milk suppliers, even with high protective tariffs on imported milk products into Kenya. Moreover, high milk prices paid by processors increases the costs of production, leading to the non-competitiveness of Kenyan milk in regional markets. For these reasons, the practice of merely seeking higher milk prices without increased efficiency and greater competitiveness is seen as a long-term threat to Kenya’s dairy industry. 7While KDSCP certainly contributed to increased milk prices within its milkshed areas over the five years of the project, the price increases cannot be attributed to the work of KDSCP. Milk prices are primarily related to economic factors of milk supply and demand, and the level of competition among buyers for milk produced by small farmers. As confirmed by the FGDs with the SBO leaders and small farmers, the practice of milk bulking by smallholders at milk cooperatives facilitates joint marketing with reduced transaction costs, and enables SBOs to deliver greater milk quantities to the processor for higher prices. In fact, all the processors the team interviewed confirmed that they pay higher prices for greater amounts of milk delivered to the factory, as a means to stimulate increased milk deliveries. Further, FGDs revealed that individual dairy farmers who sell small quantities of milk directly to processors without going through SBOs are penalized by a reduction in milk prices per liter that ranges from 20 percent to 35 percent.

11
• A total of 72 percent of households surveyed (289 out of 402) rely on dairy as their main source of livelihood. Of the remaining 28 percent of households (112 out of 402) for which dairy is not the primary occupation, 97 percent (108/112) of households have other family members who are engaged in dairy as their main source of income.
Based on the life of project results report, the number of people that directly benefited from the project in the eight milkshed areas where KDSCP operated is 338,210 (Target: 300,000).8 The primary project goal of increased household incomes had no targeted level of achievement—it only called for an increase in incomes, without specifying any particular amount. Globally Competitive Regional Market Leader. The achievement of the project’s secondary goal of international competitiveness in Kenya’s dairy industry required: 1) production efficiency, 2) consistent milk supplies to enable suppliers to consistently serve markets, and 3) a quality product. The KDSCP project helped smallholder project beneficiaries achieve greater production efficiency through increased milk productivity (average liters produced per cow per day) and reduced per-unit milk production costs. The results from the PMP (Annex A, Table A.7) shows that milk productivity at the end of the project had reached 9.85 liters against a target of 15.0 liters. By comparison, the 2010 Tegemeo survey shows that average annual milk productivity per cow was 2,459 liters. This translates into a daily productivity of 8.06 liters (assuming an average lactation period of 10 months, or 305 days per year). The project results also show that the average cost of milk production was reduced by 21.5 percent over the life of project. KDSCP further worked to institute a national policy framework for milk quality and supported International Standards Organization certification and quality standards for two leading dairy processors. The project also supported SBOs in developing their capabilities to carry out quality testing on the milk they collected. KDSCP attempted to institute an industry-wide system for milk payment based on quality, but without success. KDSCP and the Eastern and Southern Africa Dairy Association (ESADA), a regional organization based in Nairobi, collaborated to conduct a market survey to establish the willingness of Kenyan consumers to pay for milk quality. The study confirmed that consumers valued milk for its color, taste, and “thickness” (i.e., butterfat content) with visible cream on top of the milk, whereas processors use bacteria counts and other parameters such as improved sanitation and lack of adulteration to define quality. Consumers were unwilling to pay more for milk quality as defined by the processors; consequently, the processors were unwilling to fund the additional cost of the quality payments so the payment system has not yet gone into effect. To achieve international quality standards for raw, fresh milk, the bacteria count must not exceed the industry standard of 200,000 colony-forming units of bacteria per milliliter. The team’s interview with the New Kenya Cooperative Creameries Production Manager in Eldoret revealed that much of the milk received at the processing plant contained a bacteria count of over 1 million—far beyond the 8In preparing the farmer survey, MSI used the electronic database of beneficiaries maintained by Land O’Lakes to determine the names and contact information of all project smallholder beneficiaries. After the database was cleaned of duplicates, the total number of beneficiaries listed was 86,824, which was a considerably lower number than what was reported in the life of project results in the PMP. Additionally, many beneficiary entries lacked critical information such as last names or contact information. Land O’Lakes explained that the low number of beneficiaries recorded in the database was because the project staff had insufficient time before the close of the project to electronically input all the beneficiary data that was obtained in hard copy.

12
internationally acceptable standard. Eighty percent of SBOs and dairy farmers (96 out of 120) who participated in the FGDs indicated that milk deliveries to SBOs by small farmers required five to seven hours, which compromises milk quality because of the high buildup of bacteria. All SBO leaders (100 percent, or 40 out of 40 participants) in the FGDs affirmed that the lack of cooling facilities was the biggest constraint to achieving internationally acceptable milk quality standards. In interviews the Kenya Bureau of Standards and ESADA said that a few countries within the region, particularly Zambia and Tanzania, use milk quality standards (that are comparable with strict South African and New Zealand dairy industry standards) as a nontariff barrier to restrict imports of milk from Kenya. Based on data from the International Trade Center at the World Trade Organization (WTO), the trade balance between Kenya and WTO countries for dairy products has steadily declined since 2007 until it became negative (–$5,588,000) in 2011 (Annex A, Table A.6). The primary milk product exported from Kenya to regional countries is ultra-high-temperature long-life milk, whose high-temperature treatment during processing sterilizes the milk and thereby overcomes quality concerns related to elevated bacteria levels. Conclusions The project achieved its primary goal of increased smallholder household incomes. Since dairy is the primary means of smallholders’ livelihoods in the KDSCP project area, the increase in monthly incomes from dairy is extremely important for smallholder families. International competitiveness requires competitive production costs, consistent supplies to serve markets, and quality products. While the project helped to make Kenya's dairy subsector more competitive, it did not achieve the secondary goal of helping Kenya’s dairy industry become an internationally competitive and regional market leader. Milk supplies are inconsistent and vary throughout the year, making it difficult to establish a suitable marketing program to supply domestic and regional customers. Furthermore, milk produced in Kenya does not meet stringent international quality standards, which are based on highly developed production standards such as those used in South Africa and New Zealand. Additionally, the practice of neighboring countries in East Africa of using milk quality standards as nontariff trade barriers limits their imports of milk from Kenya, exacerbating the problem of milk quality from Kenya's milk exporters. Kenya’s declining trade balance with WTO countries and its status as a net importer of milk products in 2011 further indicates that the country is not internationally competitive. Presently, the Kenyan dairy industry does not have the capability to meet international quality standards that require milk to be chilled within two hours after milking, particularly by small farmers in rural areas.
QUESTION 2. WHAT WERE THE INTERNAL AND EXTERNAL ENABLING FACTORS THAT CONTRIBUTED TO MEETING OR NOT MEETING THE INTENDED GOALS? Findings The evaluation team found three main internal factors that contributed to the meeting of KDSCP goals: 1) the network of linkages created by the project between smallholder farmers and their SBOs, and between farmers and their commercial service providers; 2) smallholder farmer trainings facilitated by KDSCP; and 3) KDSCP–facilitated credit to smallholder farmers and their associated SBOs. All three activities were carried out by the project under the Land O’Lakes’ Business Development Services (BDS) approach, which is described in a later section. Internal Factors

13
Smallholder Farmer Linkages. KDSCP created linkages between farmers and SBOs for joint milk marketing and between farmers and service providers for training, technology transfer, and input supplies. The life of project results stated that smallholder farmer beneficiaries were linked with 135 SBOs strengthened by the project, and that 1,042 firms worked to provide new business services to smallholder farmers. According to FGDs, all 40 (or 100 percent) SBO officials indicated that their organizations have all been linked to service providers and were actively engaged in business. KDSCP worked with farmer groups to form SBOs that initially operated as self-help groups. With continued support from KDSCP and the Ministry of Cooperatives, nearly all of these have been registered as cooperatives. The project helped SBOs to enter into contracts and create sustainable business linkages with services suppliers. Under a demand-driven program, KDSCP also engaged subcontractors to help SBOs to develop their business plans. KDSCP worked to create supporting networks by linking smallholder farmers and their associated SBOs with commercial service providers. The project also worked to strengthen the capacity of service providers; for example, in 2011, the program worked to build the capacity of suppliers of dairy livestock genetics. A subcontractor was engaged to develop accreditation standards for artificial insemination (AI) service providers; link service providers with educational institutions that offered refresher courses; train service providers in communicating the benefits of animal registration to farmers; identify sources of finance available to providers of AI services; and formulate farmer action plans to improve dairy breeding performance. KDSCP activities have focused on the provision of “embedded” (permanently available) services to enhance the quality and availability of services to farmers and to increase sales volumes and revenues for service providers. All the service providers that worked with the program provided farmer extension as an embedded service. The creation and strengthening of 135 SBOs enabled smallholder dairy producers to bulk their milk, leading to a higher negotiated price per liter from key milk processors. Training. KDSCP facilitated dairy farmer training on topics such as feed and fodder production, appropriate feeding regimes, feed conservation and formulation, modern breeding techniques, AI practices, and milk handling hygiene. Results from the PMP shows that the number of producers receiving short-term training was 154,101, which was slightly above target for the project. Based on interviews with previous KDSCP field coordinators, project-facilitated farmer training was conducted through lectures (65 percent), livestock farmer field schools (20 percent), and visits to demonstration farms or observational travel (15 percent). In most cases, training was provided by commercial service providers, such as agrovets, and feed manufacturers through lectures at farmers meetings hosted by SBOs. Based on feedback received from smallholder farmers through FGDs, training through demonstration was most effective for their needs. Training through demonstrations had a 90 percent preference level (72 out of 80 participants) and was considered to be the most effective method in improving smallholders’ understanding of dairying as an enterprise. Eighty-six percent of dairy farmers in the FGDs (69 out of 80 participants) proposed that future projects combine training lectures with demonstrations and observation visits to farmers in other locations. Training interventions in which farmers decided on the topic covered was seen by KDSCP field coordinators and farmers attending the FGDs, to be extremely beneficial as a training practice. KDSCP team leaders were strong proponents of training through livestock farmer field schools developed by the Food and Agricultural Organization and refined by the International Livestock

14
Research Institute. Under this methodology, the farmers themselves chose a weekly training program from a menu of choices, such as disease control, calf care, and breed improvement. KDSCP trained farmers in 14 key dairy practices. Farmers reported that training had considerable impacts on dairy productivity and output, but coverage was low based on survey findings—each of the 14 training topics had coverage ranging from 20 percent to 60 percent, or a range from 79 out of 399 to 239 out of 399 participants.9 However, the survey showed farmers' approval ratings for trainings was high—with 80 percent expressing satisfaction or higher (on a scale of 100). Interviews with KDSCP implementation team members confirmed that skills training for women were of great importance since they are the primary caretakers for dairy animals. However, for maximum attendance and training benefits, these interventions needed to be carefully scheduled at times when women are less likely to be occupied with household responsibilities and farm work. Credit. Results from the PMP shows that a total number of 58,581 dairy farmers received loans from financial service providers, with 37 percent being female recipients. KDSCP facilitated credit to dairy stakeholders through three methods: 1) The project facilitated the attendance of financial service providers at SBO meetings, where they conducted a “show and tell” of their financial products. After the SBOs completed their business planning exercise (as part of their KDSCP development training), individual farmers were able to receive bank credits facilitated by the SBOs. The SBO gave bank references (not guarantees) for individual borrowers, which streamlined their access to credit. 2) The project facilitated credit for service providers by linking them with financial institutions to enable the financing of service requirements, such as motorbikes to visit farming customers. 3) The project brought financial institutions and SBOs together to arrange for the financing of cooperative assets such as small trucks, computers, and digital scales. KDSCP linked smallholder farmers and SBOs with a broad range of financial institutions and Savings and Credit Cooperatives (SACCOs). Based on interviews with senior managers at the Kenya Livestock Finance Trust (KLIFT), this financial institution is emerging as a specialized and trusted dairy farmer-based organization in the country. Another source of farmer credit were SBOs that bought input supplies in bulk and then sold them to farmers on credit. Farmers repaid by having their payments retained for milk purchases at the end of each month, a process known as a “check-off” system.
9The survey question was “Have you received any extension training in [name of topic] during the past four years?” There were 399 respondents to this question, and “yes” and “no” answers were recorded for each training topic.
Case of Livestock Credit Financing by the Kenya Livestock Finance Trust The Kenya Livestock Finance Trust (KLIFT) is a private organization established in 1994 as an offshoot of the Kenya Veterinary Association at DVS Kabete. It received initial funding from the European Union to extend financial credit to vets retrenched in the structural adjustment programs of the 1990s, and later started offering loan credit to livestock farmers and livestock service providers in 2009. The organization is unique and offers loans at low interest rates to dairy farmers for the purchase of pedigree cows and construction of infrastructure. Farmers applied for loans through their respective dairy cooperatives or self-help groups and agreed to make repayments through a check-off system. KLIFT partnered with KDSCP and Land O’Lakes to provide financial credit to farmers to improve dairy sector performance. During interviews with the evaluation team, KLIFT agreed to extend loans at low interest rates of up to 8 percent if USAID/KAVES accepted it as a grantee and enabled part of the grant to be used for onward lending to farmers through KLIFT. The evaluation team considers KLIFT to be a potentially valuable partner for the KAVES project.

15
However, based on observations and discussions with SBO leaders, the proportion of SBOs providing this service is quite limited. SBO officials mentioned during FGDs that some cooperative organizations provide short-term cash advances to cover urgent household needs, which are repaid by the farmers through the check-off system (however, none of those SBOs participating in the discussions provide this service). Also, some of the more progressive SBOs have created member-owned SACCOs, while other SBOs have linked their members with external SACCOs that provide financial services directly to SBO members. The farmer survey found that 30 percent (120 out of 399 responses) of dairy farmers have sought loans from various financial institutions. Of those seeking loans, dairy investment was the reason for 49 percent of applicants (59 out of 120 responses). Of the farmers who sought loans, 97 percent (116 out of 120 responses) received the requested loan. The remaining 3 percent of applicants were turned down for two primary reasons: 1) their income was too low to receive a loan, or 2) the family had other pending debts that needed to be repaid. Eighty-nine percent (or 69 out of 78) of dairy farmers that received financial services training, facilitated by KDSCP, were satisfied with the training they received. Fifty percent (60 out of 120) of farmers surveyed believe their participation in KDSCP training made it easier for them to obtain loans, while 71 percent (85 out of 120) were satisfied with the level of assistance from KDSCP in obtaining their dairy business loans. All 80 (100 percent) dairy farmers and 40 (100 percent) SBO leaders in the FGDs complained that extremely high interest rates, between 18 percent to 27 percent, offered by financial institutions were a severe constraint that limited their investments. USAID has recently established a separate, standalone investment fund mechanism for infrastructure development with a budget of U.S. $16 million to complement KAVES project. This funding mechanism was conceived for facilities such as pack houses and product cold chains. External Factors Seasonal Variation. During Kenya’s rainy season—a period of heavy milk supply—milk processors are unable to absorb the volume of milk produced by farmers, leading to the non-collection of milk, low milk prices, and delayed farmer payments. SBO leaders believe that during these periods, some processors tend to strictly enforce quality standards to increase the amount of milk rejected. By declaring the milk to be of substandard quality, processors can avoid requirements to purchase milk for which they have no market, thereby transferring the loss to SBOs. In most cases, during periods of oversupply, processors impose a severe price reduction on producers that provide milk to them without supply contracts, or entirely stop purchases from suppliers without contracts. To protect smallholders from arbitrary price changes or limited purchases by processors, KDSCP encouraged the use of supply contracts between SBOs and milk processors. However, even with supply contracts, most processors require producer prices to be renegotiated every three months, enabling them to negotiate lower prices during periods of high production. Conversely, Kenya’s dry season causes a decline in milk supplies as the lack of natural rainfall reduces the production of animal feed. Of farmers surveyed, 89 percent (357 out of 402) indicated that milk production per cow per day during the dry season was reduced by an amount ranging from 25 percent 39 percent because of limited feed and inadequate supplies of water. With limited production, milk prices tended to increase.

16
Competition. SBO leaders and other smallholder farmers in FGDs said there has been increased competition for milk produced by smallholder farmers over the life of the project. Competition is driven by an increase in per-capita milk consumption by Kenyan consumers, serviced by an increasing network of milk distributors and retailers. There has been a proliferation of retail milk outlets such as milk bars, alongside the expanded capacity of milk processors and continuing presence of small-scale informal milk traders. SBOs must compete with informal traders for milk produced by small farmers, and in some cases, with direct purchases from small farmers by large milk processors. Cooling. Based on observations and interviews with SBO leaders and milk processors, lack of a milk “cold chain” between farmers and milk processors negatively impacts milk quality and producer incomes. Few SBOs have the capability to cool milk supplied by their affiliated farmers before sending it on to the milk processor. In remote locations where milk delivery times between the farmer and SBO is greater than two hours, the team observed that “satellite” milk coolers could serve milk-producing communities. Infrastructure. Based on observations and FGDs with smallholder farmers, poor farm-to-market roads in many rural locations greatly increase the cost of milk delivery, the time milk remains unrefrigerated, and its quality. Policy environment. Based on interviews with KDSCP’s Chief of Party and the director of the National Dairy Processors’ Association (NDPA), national institutions created and supported by KDSCP, such as the National Dairy Task Force (NDTF) and NDPA, have had a highly positive impact on project implementation. The NDTF provides a high-level forum for dialogue and coordination among stakeholders, while the NDPA provides a national voice for large and small dairy processors. The economic policy of the GOK over the life of the project has been generally positive and favorable to the dairy industry. Economic growth has been strong, and inflation relatively well controlled. Conclusions Organizing milk farmers into groups for milk bulking and joint marketing results in reduced transaction costs and greater efficiencies in milk collection and delivery, and also increases the bargaining power of the farmer organizations that sell milk to processors. These elements have led to higher prices paid to dairy farmers. Increased per-capita milk consumption, along with increased competition among buyers, has also contributed to increasing milk prices. This general upward price movement has been further stimulated by milk bulking and joint marketing by SBOs, leading to greater negotiating strength and higher milk prices from processors. Private service provider networks created through the BDS approach enhance the capability of small farmers through capacity building, technology transfer, and the provision of input supplies and services. Seasonal variations in milk supply have had a negative impact on milk sales, distribution, and price stability. Farmers can mitigate these effects through the use of drought-resistant crops and feed preparation and storage methods such as silage. Demonstration methods using livestock farmer field school techniques are the most effective training method for small farmers with its “learn by doing” approach through participatory learning techniques. However, the percentage of farmers reached by the project’s training program is too low to ensure a sufficient transfer of skills for substantial improvements in dairy sector competitiveness.

17
The sponsorship of credit for small farmers by producer cooperatives and the “check-off” system of loan repayment helped to facilitate credit to smallholders. The involvement of cooperative organizations simplified the credit process for small farmers and financial institutions. Near-impassable roads are a stumbling block for dairy production, increasing the time required and the cost of milk collection and transport. Conversely, good road conditions lead reduced transport costs and improvements in milk quality due to faster refrigeration. As well, a dairy cold chain linking small farmers with processors is a requirement for good quality milk production. The USAID standalone investment fund provides an opportunity for future projects such as KAVES to create new funding mechanisms that can provide additional support to project beneficiaries through direct credit that is managed by existing financial institutions such as KLIFT and SACCOS.
QUESTION 3. WHAT IS THE EVIDENCE CONCERNING THE SUSTAINABILITY OF THE END RESULTS PRODUCED BY THE PROGRAM? Findings The evaluation team considered the sustainability of the end results of the program from the perspective of the organizations supported, smallholder linkages established, and technology used. According to the farmer survey, 89 percent (355 out of 399) of dairy farmers would likely be in the dairy business in the next five years, while only 29 percent (116 out of 399) of farmers were likely to hand over the business to another family member in the next five years. These are both broad indicators of sustainability. Organizations Supported. Based on results shown in the PMP, the project has strengthened 135 SBOs, including self-help groups, limited companies, and producer cooperatives. Institutional strengthening has included management training and capacity development for business and strategic planning (approximately two trainings per year per SBO). Training is a continual requirement, in view of the frequent turnover in SBO leadership and management. Leadership and management training, including financial management, is particularly important in developing the capabilities of SBO directors and committee heads. A general rule of thumb for cooperative development is that support is necessary for a 10-year period to fully strengthen a producer cooperative—a view shared by three KDSCP milk coordinators and three team leaders interviewed. The Land O’Lakes project team believes all135 SBOs to be sustainable. This belief was reflected by the observation of the Land O’Lakes acting Chief of Party that all SBOs buy milk from their members and sell to their processors. No problems, financial or otherwise, have been reported that would cause them to cease operations in the foreseeable future. The KDSCP project staff was unable to monitor the financial reports of the SBOs, however, since this information was not provided to them. Thus, the view of the project team is that since there is no evidence to the contrary, the SBOs must be doing well. This view was confirmed in FGDs with SBO leaders, interviews with previous Land O’Lakes milkshed coordinators, and in field visits to several producer cooperatives in various milkshed areas. However, the team did see a need for the additional training of SBO leaders in business/strategy planning and financial management to help them achieve their goals for their respective organizations. KDSCP worked to strengthen several public and private institutions that serve the dairy sector:
• KDSCP helped to create the National Dairy Task Force and its coordinating role will continue under the leadership of Dairy Boards at the national, regional, and county levels.
• KDSCP helped to establish and build the capacity of the Livestock Genetic Society East Africa by bringing together genetic companies to train and supply AI services to small-scale farmers.

18
• KDSCP worked to build the capacity of the Kenya Livestock Breeders Organization. Land O’Lakes reported that KDSCP brought together all the breed societies, supported development of common services, and helped to recruit and train 45 Inspectors countrywide to improve AI services for farmers.
Dairy farming supports other smallholder family enterprises from the cash flow it generates and the byproducts it produces. Cash flow from dairy provides investment capital for other crops and farm improvements. Dairy byproduct, in the form of animal waste, provides fertilizer for other cash crops including coffee, vegetables, and bananas, and can also support the organic production of food crops. Furthermore, dairy is a springboard for the creation of other enterprises such as the production and sale of breeding cattle. As shown in Tables A.1 and A.2 (Annex A) dairy income accounts for around one-third of total household incomes. Local media reports indicate that leading milk processors are expanding production capacity and investments to capitalize on the growth of the dairy industry. Brookside Dairies recently reported the completion of a new facility that will expand its production capacity for milk powder by 300,000 liters per day.10 Interviews with the Director of New Kenya Cooperative Creameries, a milk processor, indicated an increased processing capacity for fresh milk while Githunguri Dairies, the third-largest dairy processor, has expanded its production base to include five additional locations and plans to invest in a cheese factory.11 FGDs with 40 SBO leaders and visits to dairy cooperatives revealed that SBO leaders see increased vertical integration—moving the SBOs they lead into milk processing and the production of consumer products such as yoghurt and cheese—as the path to greater prosperity for their organizations and members. Moreover, discussions with four dairy processors revealed that processing, marketing and sale of dairy products are highly competitive, requiring considerable capital investment and good management. They see the minimum break-even production capacity for processed milk products to be 80,000 liters daily, which requires considerable financial strength. The proliferation of processed milk products manufactured by small-scale processors could exacerbate a highly fragmented industry, and hinder economies of scale. Instead of vertical integration, dairy processors see a more appropriate role for SBOs in horizontal integration—to expand their membership base and provide added value through the efficient collection, bulking, cooling, storage, and transport of large quantities of milk from small farmers to dairy processors. Linkages Established. Based on KDSCP progress reports and interviews with project officers, the project has helped to establish linkages between smallholder farmers from project-supported SBOs with other value chain operators and service providers. The number of producers accessing, receiving, and utilizing BDS services, inputs, technologies, and management practices is reported to be 239,778 according to the PMP. The number of firms providing new business services to smallholder farmers is reported to be 1,042. The linkages between smallholder farmers and SBOs have made it possible to consolidate milk production for joint marketing. This has contributed to an increase in milk prices from Ksh 18 per liter in 2008 to Ksh 34 per liter presently. Similarly, FGDs revealed that dairy farmers who sell small quantities of milk directly to processors without going through the SBOs are paid a price per liter that
10The People Weekend. 2011, “Brookside Dairy in Expansion Drive,” Business, 31. 11efeedlink. 2013. Kenya’s Githunguri Dairy Boosts Milk Production. http://www.efeedlink.com/, May 23.

19
ranges from 20 to 35 percent below that paid to the SBOs. Eighty-three percent (99 out of 120) of FGD participants support the view that linkages between farmers and SBOs and between farmers and value chain operators are commercially viable and sustainable over the long run. Technology Used. Based on KDSCP progress reports and interviews with project officers, the project supported the transfer of technology to smallholder farmers and the SBOs. The PMP results state that KDSCP has made available 31 new technologies and management practices for transfer to project beneficiaries. By the end of the project, 184,586 dairy producers were using improved technologies. As described in the following section, smallholder farmers and SBOs alike have adopted a considerable number of these available technologies. In FGDs, SBO leaders emphasized that milk cooling technology is an important factor in the services they provide to their members and is, furthermore, a key element of their sustainability. Unfortunately, few SBOs have this capability. Furthermore, investments in milk cooling increases the revenue of SBOs from milk sales since chilled milk can be sold to dairy processors at a premium price (Ksh 1–2 per liter) over nonrefrigerated milk. Also, milk cooling capability makes it possible for SBOs to buy milk produced in the afternoons by smallholder farmers, which is not normally purchased by SBOs in view of the nonavailability of refrigerated storage at bulking stations. The ability to sell afternoon milk to SBOs would also benefit women, who traditionally control the use and the sale of this milk through informal traders. Annex A, Figure A.2 shows the team’s calculation of the financial benefits a typical SBO could derive from its investment in milk cooling, which provides an internal rate of return of 38 percent. Conclusions Sustainability of SBOs will depend largely on their management capabilities. To ensure future growth and development, SBOs will need continued external support in institutional strengthening. On the other hand, even if an SBO fails as a business, the milk produced by its members will not disappear. The SBO can be revived under new management and even operate as a different entity such as a private company. This view is supported by the example of two cooperative societies, observed during field visits by the evaluation team, which had successfully restructured as limited liability companies. New investments in the capacity and expansion of product lines by milk processors confirm their confidence in a dairy industry that is predominately supplied by small farmers.12 These investments provide strong evidence that Kenya’s dairy industry is viable and sustainable. Linkages between smallholder farmers and those who provide products and services to them are entirely commercial. As long as these transactions are mutually beneficial and profitable for both parties, they are sustainable. Even if established commercial ties do not continue between two parties, other service providers will continue to be available to the user. Farmers and SBOs appreciate the benefits of technology and do not wish to give up these important benefits. Technologies now in use are considered sustainable, since they provide benefits that are highly appreciated by the users. However, technology acquisition and its use by small farmers and SBOs are restrained by the lack of financial resources and high costs of credit.
12The Food and Agriculture Organization estimates that more than 1 million Kenyan smallholders produce 70 percent of the gross farm milk production that is marketed in Kenya.

20
Milk bulking increases marketing efficiency and provides greater bargaining power to the SBOs in their negotiations of milk selling prices with dairy processors. An important factor for the long-term viability and sustainability of SBOs is high milk prices, which provide greater incomes for the organization and its members, and reinforces linkages between SBOs and their smallholder farmers. It is the opinion of the evaluation team that the general increase in milk prices over the project life is primarily related to economic factors of milk supply and demand and the level of competition among buyers for milk produced by small farmers. However, within the general movement of market prices, milk bulking and joint marketing have had a considerable positive effect on smallholder milk prices. Investments in cooling plants by SBOs is an important element of their sustainability since it provides increased financial returns to smallholder farmers, and also ensures better milk quality. These cooling facilities are an essential part of the cold chain for fresh milk, and will help to ensure the long-term viability of SBOs. While efforts were made by KDSCP to encourage and promote cooling plants, unfortunately, few SBOs actually have cooling plants. The installation of cooling plants would therefore contribute to sustainability. SBOs can bolster opportunities for economic growth by expanding their production base and increasing membership through strategic alliances with other SBOs. Vertical integration into milk processing and distribution is not a viable option for a poorly capitalized, small-scale SBO in the highly competitive environment of milk processing. QUESTION 4. TO WHAT EXTENT DID THE PROGRAM EMPLOY NEW APPROACHES? Findings Business Development Services Approach. Land O’Lakes used a BDS approach for project implementation that created a network of private service providers to supply a range of commercial services (e.g., input supplies, financial services, and veterinary services) to smallholder farmers and their SBOs. After strengthening the capacity of service providers, they were enlisted by the project to provide training and technical assistance to smallholder farmers and SBOs as part of their portfolio of commercial services. Private service providers were the main source of technical assistance and training. The project’s considerable efforts in technical assistance, technology transfer, and training was carried out primarily by private service providers. In comparison, other projects and approaches for providing business development services tend to incorporate a smaller network of service providers that are not enlisted as partners with the project to provide extensive training and technical assistance for the development of project beneficiaries. The demand-driven, for-profit approach of providing smallholder services ensures its sustainability. Thus, KDSCP employed a new approach to solving the problem of providing business services. Technology Transfer. The results reported by the PMP shows that KDSCP made 31 new technologies and management practices (e.g., mastitis test kits) available to project beneficiaries and stakeholders. Of these 31 technologies, the 10 most useful technologies mentioned by smallholder farmers and SBO leaders in FGDs were genetic advances (AI and breed improvement), feed management (chaff cutters, multipurpose feed mixers, and silage making), animal husbandry (zero grazing and agrovet services), energy use (biogas), milk quality control by SBOs, and information management through the use of computers and software. Of the 10 important technologies identified, 100 percent (10 out of 10) of them are commonly used in the Central Region and 40 percent (4 out of 10) are commonly used in the Rift Valley. The 10 technologies commonly used in Central Region are listed above while those commonly used in Rift

21
Valley include AI and breeding, feed management (silage making), agrovet and animal health, and information management. Based on FGDs and the survey (Annex A, Table A.7), farmers and SBOs in the Central Region have a greater understanding and use of dairy technology than farmers in the Rift Valley. Among all technologies considered, 85 percent (74 out of 88) of FGD participants agreed that the most important on-farm technology was AI and breeding, followed by silage and feed making, and the use of animal shelters and modern dairy sheds. All SBO leaders ranked cooling as the most important technology used by farmer organizations. As shown by the PMP, 184,586 additional farmers are using improved technologies. The life of project results report further show a marked increase in the proportion of farmers using AI (97.4 percent) compared with a baseline of 39.9 percent. However, it was reported in the farmer survey that 88 percent (308 of 351) of dairy farmers used AI services in the past four years. Of AI services users, 82 percent (252 of 308) of farmers were satisfied with the practice and are likely to continue using the technology in the long run. The reason given was that 85 percent of the farmers were either satisfied or very satisfied with the reliability of the AI supplier. In comparison, the 2010 survey by Tegemeo Institute reported the use of AI services by KDSCP beneficiaries at 69 percent. Other most-used technologies by households were animal health at 66 percent (232 out of 351), organic farming at 48 percent (170 out of 351), and breed selection at 44 percent (154 out of 351). Based on KDSCP reports, observations during smallholder farm visits, and FGDs with SBO leaders and small farmers, KDSCP worked extensively to improve on-farm production and storage of animal feed primarily through silage-making technology. However, in view of the use of this technology by FGD participants (30 percent, or 24 out of 80 participants) the adoption rate appears low. Similarly, the farmer survey (Annex A, Table A.8) shows an average adoption rate at only 18 percent. This could be explained by the limited number of households that own a chaff cutter, which is used for preparing silage as animal feed. The survey found that 27 percent (111 out of 399) of dairy farmers owned a chaff cutter. The study also found that the average cost of a chaff cutter (Ksh 29,544) is prohibitive for most smallholder farmers. Results from the 2010 Tegemo survey similarly found that 20 percent of KDSCP beneficiaries practiced silage making. Comparable results were seen for hay making: The survey found that hay making was practiced by 14 percent of the surveyed farmers (Annex A, Table A.7), whereas the 2010 Tegemo survey reported 12 percent of smallholder beneficiaries preserved hay as feed. FGDs with SBO leaders and other smallholder farmers indicated that a major limiting factor in technology adoption is cost and the limited availability of affordable credit. Technologies that require equipment purchases are not used by farmers and SBOs because of their high costs (chaff cutters, milk coolers, feed mixers, biogas, information and communications technology, and computers). For example, the average cost of a biogas plant in the primary survey was found to be Ksh 124,764, which is far beyond the means of smallholder farmers. Ninety percent (108 out of 120) of participating farmers and SBO leaders affirmed that they would access low-cost credit (between 5 percent to 8 percent interest) to obtain new technologies for dairy farming, if it were available. Based on FGDs and field visits, the use of cow sheds is a requisite for zero grazing and improved animal husbandry. Since very small farms predominate in the Central Region, zero grazing is the primary means of animal husbandry. Moreover, in the Rift Valley, cattle range more freely and dairy farmers consider cow sheds essential for improved animal care. Conclusions

22
The BDS approach was a creative strategy used by KDSCP to enlist the support of private service providers to provide training and technical assistance to small farmer project beneficiaries. The BDS approach is an effective tool for value chain strengthening. Farmers recognize AI and breed improvement as important technologies in upgrading the dairy herd and increasing milk production in successive generations of dairy cattle. AI technology also enables farmers to produce extremely valuable purebred (pedigreed) dairy animals after four successive generations. The capability for milk production in Kenya’s dairy industry is generally constrained by poor feeding practices and animal care. Consequently, project support for improved feed rations and feeding practices along with appropriate animal husbandry is needed to quickly increase milk productivity per animal and result in lower per-unit milk production costs (per reports by smallholder dairy farmers, SBO leaders, and KDSCP project staff). Smallholder dairy farmers are aware of the benefits of technologies such as chaff cutters, feed mixers, and biogas, but do not have resources available to acquire and use these technologies. QUESTION 5. TO WHAT EXTENT WERE ENVIRONMENTAL COMPLIANCE MITIGATION MEASURES IDENTIFIED AT THE BEGINNING OF THE PROJECT EFFECTIVELY IMPLEMENTED, INCLUDING PESTICIDES EVALUATION REPORTS AND SAFE USE ACTION PLANS? Findings USAID regulations required Land O'Lakes to assess the environmental effects of its actions before program funds were committed and adopt appropriate environmental safeguards to ensure that significant environmental harm was avoided. Land O’Lakes was required to review and screen all proposed activities carried out under KDSCP at the work planning stage to identify potential environmental hazards. A mitigation report had to accompany the work plan. In compliance with this requirement, Land O’Lakes published the KDSCP Pesticide Evaluation Report and Safer Use Action Plan (PERSUAP) in June 2008. The PERSUAP enabled the project to comply with the requirements of USAID's pesticide procedures embodied in the Agency's Code of Federal Regulations (CFR) No. 22CFR216.3 (b). The PERSUAP guided the program's livestock protection activities and implement them in an environmentally conscious manner for the benefit of smallholder rural farmers. USAID environmental regulations required that each pesticide authorized for use by the project be analyzed according to comprehensive evaluation criteria. In addition, USAID's pesticide procedures require that any proposed use of pesticides be limited to products that are registered for general use (without restrictions) in the U.S. by the Environmental Protection Agency. However, in cases where pesticide control procedures are considered adequate in a country served by USAID, restricted use pesticides may be approved under certain conditions.
The KDSCP did not directly support the use of pesticides by dairy value chain actors, instead advocated for best practices in their use. The project emphasized improved schemes to regulate pesticide usage, facilitated pesticide-use trainings, and proposed integrated pest management and other alternatives to the use of pesticides. While KDSCP did not promote the use of pesticides, increased pesticide use was a natural result of its activities to help the dairy industry become more competitive.
The PERSUAP required that KDSCP implement a pesticide activities monitoring plan to be incorporated into its general monitoring program in liaison with participating stakeholders such as the Kenya Pest

23
Control Product Board, the Agrochemicals Association of Kenya, and the Ministry of Livestock Development. The PERSUAP required quarterly monitoring of the following indicators: • Number of pesticide safer use trainings (field days) • Number of farmers and agrochemical dealers trained • Number of farmers adopting safe use practices with pesticides, such as the use of protective clothing
and safety recommendations such as washing, storage, container disposal, and environmental considerations
• Number of disease incidences to indicate the efficacy of pesticides and integrated pest management methods being used
• Registration status of recommended dairy pesticides There was a misunderstanding by the KDSCP Chief of Party and senior project managers on the reporting requirements spelled out by PERSUAP. They were not aware that formal quarterly reports were required; instead they thought the submission of routine quarterly reports with a general description of project activities related to environmental protection was sufficient. According to survey results, only 39 percent (155 out of 399) of dairy farmers received training on the safe use of chemicals including its handling, use, and disposal, while 29 percent (115 out of 399) were trained on integrated pest management. In addition to supporting and encouraging safe use of pesticides, KDSCP promoted environmentally sustainable dairy production by introducing leguminous fodder crops to improve feeds and protect soil, silage to reduce overgrazing, metal cans for hygienic transportation of milk, safe handling and disposal of agrochemicals and pharmaceuticals, and biogas energy for family use to reduce deforestation. KDSCP trained farmers on basic environmental management practices. Eight FGDs with 80 male and female farmers revealed that farmers use fodder as a means for terracing, reducing soil erosion, and producing feed for livestock. They also use animal waste as a source of fertilizer. In FGDs held in the Central Region, 95 percent (38 out of 40) of participants indicated that they use fodder for terracing, whereas all (40 out of 40) participants used cow manure for crop production. In FGDs held in the Rift Valley, 65 percent (26 out of 40) of participants indicated that they plant trees as shade and boundaries for livestock paddocking and environmental conservation, and 75 percent (30 out of 40) used manure for crop production and the fertilization of garden plots. FDGs with 120 SBO leaders and other smallholder farmers indicated that 69 percent (82 out of 120) of participants are aware of Kenya’s National Environment Management Authority and its requirements for environmental conservation by farmers. Twelve FGDs with120 SBO leaders and other smallholder farmers indicated that 81 percent (97 out of 120) of farmers are aware of safe use of chemicals, the need to use protective clothing, and safe disposal of chemical containers. However, 90 percent (108 out of 120 participants) do not use protective clothing because they are an unaffordable expense. Seventeen percent (20 out of 120) participants indicated that they would normally drink milk after applying pesticides as a means to counteract/neutralize the effects of chemicals they apply. FGDs with 120 SBO leaders and smallholder farmers, and interviews with management at the Visionary Empowerment Program for biogas in Thika and the senior field technician with KENDBIP in Nakuru revealed that biogas production is extremely beneficial for the environment. Biogas collection chambers effectively trap the methane gas produced by dairy cattle waste, thereby preventing release into the atmosphere. Methane gas is a substantial contributor to global warming. The use of biogas by dairy households replaces fuelwood or charcoal for cooking and lighting, which reduces the need to harvest trees. Reduced need for fuelwood by the dairy household also provides a substantial benefit to females,

24
since it is normally females who are responsible for the collection of firewood for meal preparation. Thus, biogas production also provides substantial labor-saving benefit for women in dairy households. FGDs revealed that farmers are aware that biogas production is good for the environment and that use reduces the need for firewood and charcoal. They also recognize that it reduces the cost of household energy for cooking and lighting. FGDs found that 10 percent (8 out of 80 participants) of households owned a biogas plant. Meanwhile, 38 percent (30 out of 80) of participants are aware of biogas as a means for environmental protection, and the energy benefits it provides for dairy households. Only 5 percent (20 out of 399 responses) of the households surveyed have biogas production capability. Calculations and discussions with KENDBIP show that it would be possible for smallholder dairy farmers to save up to Ksh 75,000 annually on energy costs if they used biogas as an alternative energy source for cooking, lighting, and powering farm equipment (Annex A, Figure A.3). This corresponds to a return on the investment in approximately 1.6 years. Based on visits to SBO bulking centers and milk processors along with interviews with senior managers at these installations, it was found that facilities disposed of waste water in an environmentally responsible manner. A summary table showing waste water disposal at locations the team visited is shown in Annex A, Figure A.6. Conclusions The PERSUAP report published by Land O’Lakes in June 2008 enabled KDSCP to ensure that the environmental consequences of USAID–financed activities were identified and considered, and that appropriate environmental safeguards were adopted prior to a final decision to proceed. However, the KDSCP project team did not fully comply with the environmental reporting requirements as defined by the PERSUAP, nor was this requirement enforced by USAID. FGDs indicate that farmers are conscious of the importance of protecting the environment, and they follow environmental protection and good natural resource management procedures. Biogas production is an extremely important byproduct of the dairy value chain. Its environmental impact is highly positive through the reduction of methane gas (a contributor to the depletion of the ozone layer and global warming) and the harvesting of trees for fuel. However, its use by smallholder dairy farmers is limited because of its relatively high cost and the lack of affordable credit.

25
RECOMMENDATIONS The following is a compilation of the recommendations to USAID related to the different evaluation questions. The recommendations are directly applicable to the KAVES project, with the possible exception of points 4 (harmonization of quality standards)13 and 11 (nonsupport for milk processing by SBOs). ACHIEVEMENT OF PROJECT GOALS 1. Future USAID projects should set a threshold level of achievement for main project goals and
objectives. 2. Future USAID dairy projects should continue to support the on-farm production and storage of
nutritious animal feed supplies to reduce seasonal variations in milk production. 3. Future USAID dairy projects should support and encourage the development of milk cold chains
between small farmers and milk processors. 4. Future USAID projects should include regional initiatives to harmonize dairy quality standards and
reduce nontariff barriers within the East African Community.
ENABLING FACTORS 5. Future USAID dairy projects involving smallholder farmer training should combine training lectures
with demonstrations and make liberal use of observation visits to see farmers in other locations. 6. Future USAID dairy support projects should strive to achieve greater coverage with farmer training.
Actual coverage results should be determined by the project monitoring system. 7. USAID should encourage GOK to assess road conditions in dairy-producing areas and prioritize
their upgrade in light of the economic benefits that could be derived from improved transportation. 8. To mitigate the effects of cyclical milk production, future USAID support to the dairy industry
should emphasize increased production and preservation of fodder as a source of animal feed during the dry season, along with better methods of water harvesting and storage. Furthermore, future projects should support the production of drought-resistant fodder crops such as sorghum and Sudan grass.
SUSTAINABILITY 9. Future USAID dairy programs should continue to support and strengthen the management
capabilities of SBO leaders, especially in the development of strategic and business plans to provide a guide for business activities.
13The KAVES project is being implemented under USAID’s Feed the Future Initiative. Based on the team’s interview with the KAVES Deputy Chief of Party, the team understands that the dairy component of the project will include many of Kenya’s food-insecure regions that are not necessarily recognized as dairy producing areas, particularly for commercial dairy production. Many of the KAVES targeted locations will likely encompass regions classified as arid- and semiarid lands in Eastern and Northern Kenya. In these food insecure areas, commercial marketing channels tend to be very short, with limited processing or added value by other means for. Milk cooling, processing, packaging, and distribution through commercial retail outlets in these remote locations are extremely limited. Most milk is marketed by informal traders who purchase raw milk at farm gate and distribute the milk to consumers in nearby towns and villages. Food safety is ensured by individual consumers who boil the milk they consume. As such, milk will likely be sold into local markets only. None of the milk is likely to be sold in urban or cross-border markets. Should USAID insist that the KAVES project continue the work of KDSCP to harmonize Kenya’s milk standards and regulations in the East African Community, this would likely be a considerable distraction to the KAVES project team and would contribute little to the achievement of the project’s primary objectives.

26
10. USAID should provide a rotating fund for the KAVES project, managed by local financial institutions such as KLIFT and SACCOs, to provide low-cost credit (5 percent to 8 percent interest rates) to smallholder farmers for technology adoption. The fund should provide low-cost, intermediate-term rotating credit for SBOs to install milk cooling equipment and facilities such as standby generators and the installation of water and electricity, and low-cost rotating credit for women and youth to purchase dairy animals.14
11. In view of increasing competition within the milk processing subsector, it is recommended that future projects not support the expansion of SBOs into milk processing. Instead, projects should look to expand the supply base of smallholder farmers.15
NEW APPROACHES 12. Future USAID dairy projects should continue to support the use of these important technologies
through information, demonstration, training, and affordable financing. It is particularly important to continue to support AI technology and breed improvement.
ENVIRONMENTAL COMPLIANCE 13. Future dairy projects should continue to provide training and demonstrations for smallholder dairy
farmers in environmentally friendly farming practices for on-farm production of animal feed. Training should include methods such as fodder terracing, pasture rotation, and planting fodder trees.
14. Future USAID dairy projects should fully integrate biogas production into project implementation. They should also help to finance biogas production through a rotating credit fund managed by local financial institutions, with the financing program linked to technical assistance provided by an experienced organization such as the KENDBIP.
14The team envisions that USAID, through the KAVES project, would provide competitively awarded grants to select SACCOs, banks, and microfinance institutions to create a rotating credit fund at each selected organization. The credit facility would be managed by the respective financial organization, with general oversight provided by KAVES, or possibly by a third party. Credit would finance technology adoption by smallholder dairy farmers and milk cooling facilities by SBOs, with part of the credit fund financing the purchase of dairy animals by women and youths. Loan repayments and interest charges would be used for further lending to project beneficiaries. The general terms and conditions of the credit fund would have to be negotiated between the KAVES project team and the respective financial organization, and be subjected to USAID approval. On completion of the KAVES project, the financial organizations would continue to administer the fund as usual. Direct grants to local financial organizations would be easier to manage than a loan portfolio guarantee fund. Further, requirements to make a final disposition of a loan guarantee fund at the end of the KAVES project would unduly complicate and likely disrupt the process of providing credit to smallholders. Conversely, a rotating credit fund created by a USAID grant, with good management, could continue indefinitely. 15The reason for this strong recommendation is that milk processing and the distribution of value-added products is quite complicated and competitive as well as capital intensive. The number of SBOs that have the management capability and the financial strength to compete in the market for value-added consumer dairy products is extremely limited. While a few SBOs such as the Githunguri SBS (founded in 1961) have achieved success as milk processors and distributors, these organizations are exceptions that have overcome limitations that presently constrain SBOs. This recommendation does not relate to the sale of chilled raw milk by SBOs to local milk bars, or direct milk sales to consumers from the SBO collection center. In sum, it would be a great disservice to SBOs should USAID or other donors support or encourage their entry into milk processing and the distribution of dairy products.

27
LESSONS LEARNED The following are lessons learned from the implementation of KDSCP and the project evaluation:
• Artificial insemination is an excellent means for small dairy farmers to progressively improve the genetic foundation of their dairy herd to increase milk production and create greater market value for their dairy cattle.
• Providing adequate quantities of nutritious feed and water to dairy cattle throughout the dry
season will mitigate the effects of seasonal declines in milk production.
• On-farm silage making is a low-cost means for preparing and storing animal feed by small farmers.
• To better collect information, USAID evaluations should be conducted before the project is
completed.

28
ANNEX A. TABLES AND FIGURES

29
TABLE A.1. HOUSEHOLD AND DAIRY INCOMES BY MILKSHED
Comparison of Average Monthly Household Incomes
With Average Dairy Income per Month by Milkshed Location
Location Household
Income (Ksh) Dairy Income
(Ksh) Percent from
Dairy Gatanga 19,770.83 6326.53 32.0
Kabete 24,317.71 10441.18 42.9
Kinangop 18,920.00 7700.00 40.7
Nyeri 22,903.06 6550.00 28.6
Central Region 21,569.59 7974.36 37.0
Kericho 23,952.13 6822.92 28.5
Lessos 21,602.94 8284.31 38.3
Nakuru 29,265.63 10750.00 36.7
Trans-Nzoia 32,515.63 9800.00 30.1
Rift Valley 26,768.04 9162.37 34.2
Total 24,106.68 8352.13 34.6
Source: Calculated values from farmer survey results TABLE A.2. HOUSEHOLD AND DAIRY INCOMES BY AGE AND GENDER
Comparison of Average Monthly Household Income with Average Dairy
Income per Month by Age and Gender
Gender/Age Household
Income (Ksh) Dairy Income
(Ksh) Percent from
Dairy Male 25,168.58 8,876.40 35.3
Female 21,941.41 7,291.67 33.2
Average 24,106.68 8,352.13 34.6
Youth 22,875.00 8,020.83 35.1
Adult 24,367.60 8,425.08 34.6
Average 24,106.68 8,352.13 34.6
Source: Calculated values from farmer survey results Note: The values shown in these two tables are calculated from the farmer survey data. The survey data reported a range of income values for the different respondents, not actual incomes. These calculations were made assuming that all incomes fell at the midpoint of their respective range. The calculated values are estimates, but they are reasonably accurate.

30
TABLE A.3. COMPARISON OF MONTHLY HOUSEHOLD INCOMES, DAIRY INCOMES, AND HERD SIZES (COWS, HEIFERS, FEMALE CALVES) FOR SURVEYED HOUSEHOLDS
Relationship between Household Ownership of Cattle (Cows, Heifers, and Female Calves) and Incomes
Herd size no. cattle
(cows/heifers) per
household
No. households
corresponding to herd size
Cumulative % of
respondents
Average monthly
household Income
(Ksh/Month)
Cumulative percent of
total monthly income of all
389 respondents
Average monthly
dairy Income
(Ksh/Month)
Cumulative percent of monthly
dairy income of
all 389 respondents
Cumulative percent of
total number of
cattle owned by all
389 respondents
0 2 0.5 11250 0.2 2500 0.2 0.0 1 30 8.2 19308 6.4 4516 4.4 1.7 2 98 33.4 17737 25.0 5975 22.3 12.9 3 81 54.2 17772 40.3 6790 38.8 26.4 4 60 69.7 23088 55.1 8852 55.0 40.0 5 44 81.0 24739 66.7 9468 68.3 53.0 6 16 85.1 20313 70.1 11618 74.3 58.7 7 16 89.2 35781 76.3 11406 79.7 64.9 8 9 91.5 33917 79.5 8889 82.1 68.9 9 4 92.5 46875 81.5 13750 83.8 71.0 10 7 94.3 36964 84.3 13125 86.9 75.4
11-15 11 97.2 10383 88.7 14583 92.2 84.5 16-20 5 98.5 47583 94.9 20500 95.3 89.8 >20 6 100.0 80417 100.0 26250 100.0 100.0
Avg. 4.52 Total 389
Avg. 24107
Avg. 8352 Note: this table shows the relationship between the size of the household dairy herd, the average monthly household income, and average monthly dairy
income. The number of dairy cattle per household includes cows, heifers, and female calves (no bulls or steers) since these are the milk producing animals. The average incomes weres calculated from the farmer survey, using the midpoint of the range of incomes as described in tables A.1 and A.2. All data shown in the table were calculated from the results of the farmer survey. This was close to the results of the 2010 Tegemeo survey that showed the average number of cattle owned by KDSCP beneficiaries to be 5.2 per household. Over the course of the evaluation, USAID wanted to know the scale (small or large) of dairy farmer operations that benefited most from KDSCP. As shown (Annex A, Table A.3), the smallest dairy farmers in the group surveyed (five head of cattle or less) were 81 percent of the population of farmers surveyed. These farmers accounted for 67 percent of the entire amount of household income and 68 percent of dairy income earned by the entire population of surveyed

31
farmers. They were owners of 53 percent of the total amount of cattle owned by all the surveyed farmers. Accounting for smallholder farmers with 10 head of cattle or less, smallholders made up 94 percent of the survey population of 389 farmers with 84 percent of the total income earned and 75 percent of the cattle (Table A.3). As shown, it is clear that small-scale farmers were the primary project beneficiaries.
TABLE A.4. COMPARISON OF AMOUNTS OF MILK SOLD THROUGH DIFFERENT MARKETING CHANNELS IN DIFFERENT MILKSHEDS, MONTH OF APRIL 2013
Average Amount (Liters) of Milk Sold by Surveyed Household at the Different Milksheds through Different Marketing Channels During the Month of April 2013
Milk Sold to
Milkshed Location Dairy
Cooperative Milk
Processors
Subtotal Formal
Channels Direct to
Customers Milk
Vendors
Subtotal Informal Channels
Total Liters Sold
Percent Formal
Channels
No. Respondents 399 399
399 399
No. HH Selling Milk 297 29 94 38
Gatanga 258.9 4.3 263.2 10.8 4.0 14.8 277.9 94.7
Kabete 213.9 91.2 305.0 14.0 31.5 45.5 350.6 87.0
Kinangop 379.9 15.0 394.9 19.0 22.2 41.2 436.1 90.6
Nyeri 198.3 0.4 198.7 3.9 0.6 4.5 203.2 97.8
Central Region 262.7 27.7 290.5 11.9 14.6 26.5 317.0 91.6
Kericho 214.0 30.6 244.6 19.1 10.0 29.1 273.8 89.4
Lessos 142.2 22.7 165.0 38.0 15.9 53.9 218.9 75.4
Nakuru 348.7 0.0 348.7 34.4 9.0 43.4 392.1 88.9
Trans-Nzoia 170.3 2.0 172.3 21.8 5.3 27.1 199.4 86.4
Rift Valley 218.8 13.9 232.7 28.3 10.1 38.4 271.0 85.8
Average liters sold 240.6 21.0 261.6 20.2 12.4 32.6 294.2 88.9 Note: The data contained in this table were extracted from the farmer survey. The numbers correspond to the average amount (liters) of milk sold per surveyed household.
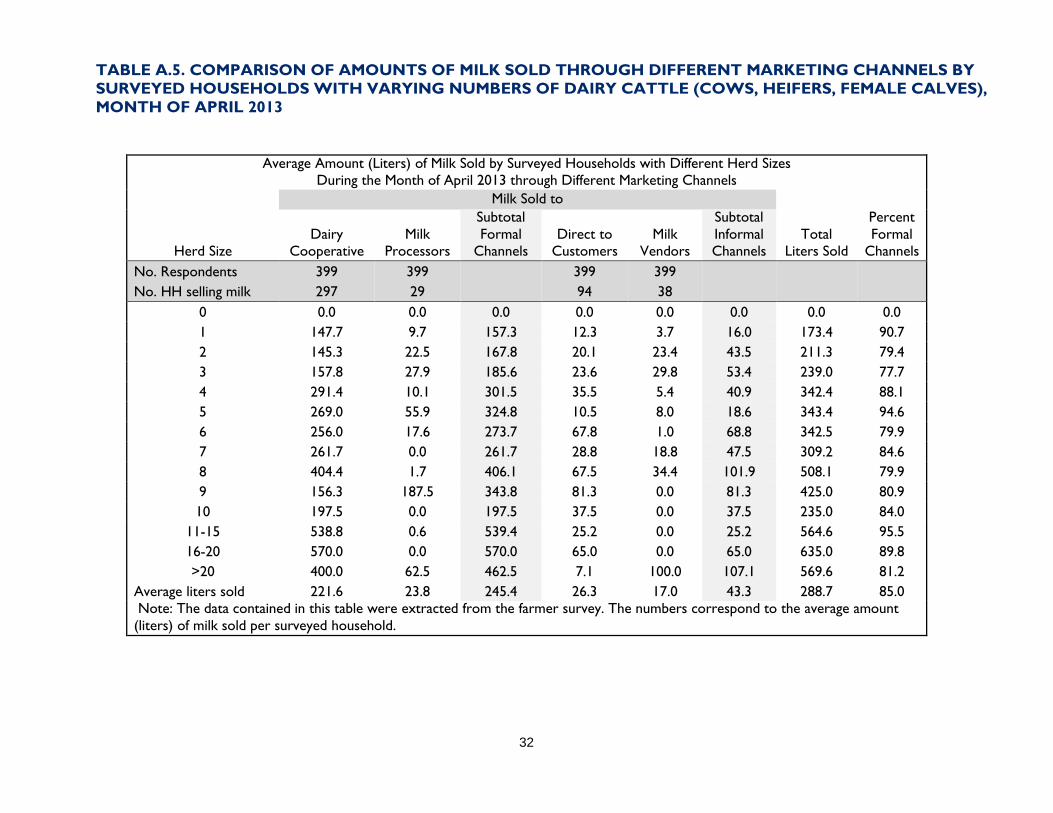
32
TABLE A.5. COMPARISON OF AMOUNTS OF MILK SOLD THROUGH DIFFERENT MARKETING CHANNELS BY SURVEYED HOUSEHOLDS WITH VARYING NUMBERS OF DAIRY CATTLE (COWS, HEIFERS, FEMALE CALVES), MONTH OF APRIL 2013
Average Amount (Liters) of Milk Sold by Surveyed Households with Different Herd Sizes
During the Month of April 2013 through Different Marketing Channels Milk Sold to
Herd Size Dairy
Cooperative Milk
Processors
Subtotal Formal
Channels Direct to
Customers Milk
Vendors
Subtotal Informal Channels
Total Liters Sold
Percent Formal
Channels No. Respondents 399 399 399 399 No. HH selling milk 297 29 94 38
0 0.0 0.0 0.0 0.0 0.0 0.0 0.0 0.0 1 147.7 9.7 157.3 12.3 3.7 16.0 173.4 90.7 2 145.3 22.5 167.8 20.1 23.4 43.5 211.3 79.4 3 157.8 27.9 185.6 23.6 29.8 53.4 239.0 77.7 4 291.4 10.1 301.5 35.5 5.4 40.9 342.4 88.1 5 269.0 55.9 324.8 10.5 8.0 18.6 343.4 94.6 6 256.0 17.6 273.7 67.8 1.0 68.8 342.5 79.9 7 261.7 0.0 261.7 28.8 18.8 47.5 309.2 84.6 8 404.4 1.7 406.1 67.5 34.4 101.9 508.1 79.9 9 156.3 187.5 343.8 81.3 0.0 81.3 425.0 80.9 10 197.5 0.0 197.5 37.5 0.0 37.5 235.0 84.0
11-15 538.8 0.6 539.4 25.2 0.0 25.2 564.6 95.5 16-20 570.0 0.0 570.0 65.0 0.0 65.0 635.0 89.8 >20 400.0 62.5 462.5 7.1 100.0 107.1 569.6 81.2
Average liters sold 221.6 23.8 245.4 26.3 17.0 43.3 288.7 85.0 Note: The data contained in this table were extracted from the farmer survey. The numbers correspond to the average amount (liters) of milk sold per surveyed household.

33
TABLE A.6. TRADE BALANCE BETWEEN KENYA AND THE WORLD TRADE ORGANIZATION
Product code
Product label
Trade Balance between Kenya and World Trade Organization (WTO) Balance in value in 2001
Balance in value in 2002
Balance in value in 2003
Balance in value in 2004
Balance in value in 2005
Balance in value in 2006
Balance in value in 2007
Balance in value in 2008
Balance in value in 2009
Balance in value in 2010
Balance in value in 2011
'0405
Butter and other fats and oils derived from milk -710 -256 -192 -157 -253 10 262 892 440 882 2343
'0401
Milk and cream, not concentrated nor sweetened -35 -30 758 580 1989 1766 2154 3561 4971 1624 1132
'0403
Buttermilk and yogurt -125 -45 -13 21 1305 1058 1584 1064 778 624 419
'0404
Whey and natural milk products nes -34 17 2 -39 -20 -3 168 -237 -143 -76 -75
'0406 Cheese and curd -646 -636 -371 -281 -299 -294 -277 -305 -449 -483 -449

34
'0402
Milk and cream, concentrated or sweetened -6909 -1809 -493 -2304 -807 48 4594 3195 -3753 -2182 -8958
-8459 -2759 -309 -2180 1915 2585 8485 8170 1844 389 -5588

35
TABLE A.7. SUMMARY OF LIFE OF PROJECT TARGETS
Comparison of KDSCP Life of Program Targets with Actual Program Results Indicator LOP Target
4/30/2013 Actual Results
4/30/2013 Percent Increase in smallholder household income (%) 80 208 No. of rural households benefited 300,000 338,210 Amount of milk purchased from smallholders (MT ) 360,980.3 779,211 Value of milk purchased from smallholders (US $ ) $95.4 M $292.2 M Exports to regional and international markets (MT) 23,500 N/A Amount of milk sold conforming to quality standards 90 140 Increase in amount of milk products sold by processors (%) 15 38 Increase in value of milk products sold by processors (%) 15 36 No. jobs created in the value chain 36,000 36,450 No. farmers provided BDS services; inputs and technology 220,000 239,778 No. farmers using improved technology 180,000 184,586 Milk productivity per cow per day (liters) 15.0 9.85 Increase in farmer’s gross margin per liter of milk (%) 40 160 Change in volume of milk conforming to quality standards increased (%) 90 140 Total value of milk conforming to quality standards increased (%) 90 140
Number of industry policies improved/enacted 3 22
Number of quality certification frameworks (milk product, animal feeds) developed, implemented/enforced 2 5
Reduction in farmer’s cost of production at farm gate (%) 25 21.54 Increase in liters of milk sold by SBOs under quality pricing 50 N/A Increase in kg feed marketed under new quality standards 60 67 Total Value of non-project resources leveraged (US$) 25 27.54 Increased revenue collected by KDB (%) 30 37.5 No. SBOs and MBCs considered sustainable 120 135 Number of SBOs/MBCs with HACCP and/or national certification 40 69 Number of firms providing new business services to producers (number) 500 1042 No. farmers receiving loans from formal financial sector 45,000 58,581 No. dairy farmers trained 153,000 154,101 Note: LOP Targets were taken from the 2008 work plan, whereas actual results were taken from the Life of Project results from the PMP. There appears to be discrepancies between the targets in these two documents. Also, there are apparent inconsistencies between the units of measure for target and actual results. Need to confirm if the actual results correspond to total results, or do the actual results correspond to increased results. No actual data for liters of milk sold under quality pricing standards. No actual data for kg feed sold under quality standards. Eliminated?

36
TABLE A.8. REGIONAL DIFFERENCE IN TECHNOLOGY USE FROM FARMER SURVEY
Regional Differences in Technology Use Total Central Region Rift Valley Number of households 351 199 152 Has your household used artificial insemination? (Yes) 88% 97% 75% Has your household used animal health services? (Yes) 66% 86% 39% Has your household used organic farming? (Yes) 48% 63% 29% Has your household used breed Selection? (Yes) 44% 63% 19% Has your household used milk testing? (Yes) 43% 62% 18% Has your household used silage making? (Yes) 16% 19% 13% Has your household used hay making? (Yes) 14% 13% 14% Establishment of pastures 16% 27% 6% Use of fodder trees 25% 41% 9%

37
FIGURE A.1. DAIRY FARMER PROFILE
The farmer survey provided data for following smallholder farmer profile: 1. The population of smallholder dairy farmers interviewed by the survey team was 67 percent male and 33
percent female. Those interviewed included 18 percent youth (up to 35 years old) and 82 percent adult farmers.
2. Dairy farming is the primary occupation of 72 percent of those surveyed. Teachers accounted for 3 percent, civil servants 4 percent, and “other” was 20 percent (numbers do not add to100 perent due to rounding error). Additional sources of income (non-dairy) for the surveyed households included crop production (96 percent of households), livestock (43 percent), poultry (42 percent), and trading (23 percent).
3. The highest levels of education attained by those interviewed were: no formal education (4 percent), some primary school (10 percent), completed primary school (24 percent), partial secondary school level (10 percent), completed secondary level (32 percent), vocational level (15 percent), and degree level (5 percent).
4. The average head of household age in the project area was 50.8 years. The average distance from the household to the dairy cooperative was 4.98 kilometers.
5. In 75 percent of households, males were the owners of dairy cattle while in 24 percent, the owners were females. In the remaining 1 percent of the households, cattle were owned by “others.”
6. In 62 percent of the households the dairy enterprise was managed by males, whereas in 37 percent of the households the enterprise was managed by females. The remaining 1 percent was categorized as “other owners.”
7. In 68 percent of the households, the family member who belonged to the dairy cooperative was male, while in 29 percent of the households the member was female, and 3 percent was categorized as “others.”
8. Of the population of dairy farmers interviewed, 37 percent earned a monthly dairy income of less than Ksh 5,000; 42 percent earned between Ksh 5,000 and 10,000; 14 percent earned between Ksh 10,000 and 20,000; and 7 percent earned more than Ksh 20,000 per month.
9. The average amount of land owned by those surveyed was 5.7 acres. However, in terms of the size of the farm plots used for dairy activities (within the entire farm area), the average plot size was 2.5 acres.
Based on the results of the farmer survey, youths were represented in family dairy enterprises to a considerable extent, and are described as follows: • Of the respondents in the survey, youth farmers constituted 18 percent (72/402) of the survey population • Of the 18 percent (72/402) of youths involved in the dairy industry, 74 percent (53/72) rely on dairy as their
main source of income • Of the youths who own dairy animals, 68 percent are males and 32 percent are females • Of the youths who are members of cooperative societies, 56 percent are males and 44 percent are females • Fifty-four percent of the youth in the surveyed households have at least a secondary education (secondary,
vocational, or university)

38
FIGURE A.2. CASH FLOW CALCULATION FOR PURCHASE OF 5,000 LITER MILK COOLER BY SBO
Assumptions An SBO processes 3,000 liters of fresh milk per day during the dry season (four months) and 6,500 liters of fresh milk per day during the rainy season (eight months). The SBO processes morning milk only. Initial cash outlay for the purchase and installation cost of a 5,000 liter milk cooler: Ksh 6,000,000 After cash outlay for cooler purchase, six months will be required for delivery and installation. After the cooler has been installed, the SBO will receive an additional income of Ksh 1.00 per liter from the sale of chilled milk to the processor. After the cooler has been installed, the SBO will receive afternoon milk in the amount of 1,000 liters per day, which will be sold at a price of Ksh 28 per liter. The SBO will receive a commission on the sale of the additional milk amounting to 18 percent of the selling price, or Ksh 5.04 per liter. The cash flow projections are as follows.
Year 0 1 2 3 4 5 Cash Flow (Ksh 000) -6,000 3,037 5,654 5,654 5,654 5,654 Internal Rate of Return 38.12%

39
FIGURE A.3. SMALLHOLDER DAIRY FARMER ANNUAL NET SAVING ON ENERGY COSTS THROUGH ADOPTION OF BIOGAS UNIT
REVENUE AND COST BENEFITS OF USING BIOGAS Energy Savings The team’s KENFAP’s calculations show that it would be possible for smallholder dairy farmers to save up to Ksh 75,000 annually on energy costs if they install and use biogas as an alternative energy in cooking, lighting, and powering chuff cutters. Assuming a typical rural home with eight household members, the energy (electricity and gas) cost at standard prices using economic survey values is as follows:
a) Lighting @ Ksh 1,350 monthly * 12 months = Ksh16,200 b) Cooking 13kg gas cylinder @ Ksh 3,150monthly * 12 month = Ksh 37,800 c) Operating chaff cutter/feed mixers @ Ksh 1,500 monthly * 12 months = Ksh 18,000 d) Firewood for boiling bathing water and water to clean dairy cow udder before milking:
@ Ksh 250 monthly * 12 months = Ksh 3,000 e) TOTAL ANNUAL HOUSEHOLD ENERGY COST SAVINGS (a+b+c+d) = Ksh 75,000
Subsidiary Farm Incomes Income calculations from other subsidiary enterprises from biogas assuming a biogas unit of 12 cubic centimeters of gas plant:
a) Slurry as organic manure quarterly sales @ Ksh 3,500 *4 = 14,000 b) Weekly sale of organic vegetables @ Ksh 300*40 weeks = 12,000 c) Back yard banana production @ Ksh 200*10*4 quarterly for 4 quarters = 8,000 d) Cereals and pulses ½ acre incremental yield multiplication factor of 0.45 @ 15,000
twice a year which comes to 30,000*0.45 = 13,500 e) Cash crop/coffee/pyrethrum 1 acre incremental yield multiplication factor of 0.25
@75,000 which comes to 75,000*0.25 = 18,750 f) Total Annual Income for subsidiary farm enterprises (based on Central Kenya estimates
is = (a+b+c+d+e) = Ksh 66,250

40
FIGURE A.4. CALCULATION OF THE AMOUNT OF INCREASE IN SMALL FARMER MONTHLY INCOMES OVER THE PROJECT LIFE WITHOUT MILK PRICE INCREASE
Assumptions a. Baseline income was Ksh 2,043 per month (from KDSCP baseline survey) b. End-of-project income (including price increase) was Ksh 6,299 per month (from LOP
Results PMP) c. Baseline milk price was Ksh 18 per liter (from the focus group discussion with Lessos SBO
leaders) d. Baseline volume (a/b) was 113.5 liters sold per month e. Baseline production cost was Ksh 14.2 per liter, which was reduced to Ksh 11.4 over the
project life for a total reduction of Ksh 3.06 per liter
Calculations f. Dairy cow productivity increased by 53 percent over the project life (from LOP Results
PMP), which increased the volume shown in (d) by 53 percent and amounted to 173.7 liters per month.
g. Had there been no change in selling prices, revenues per month from milk sales at the end of the project would have been 173.7 liters multiplied by the price of Ksh 18 per liter for a total of Ksh 3,125 per month.
h. The income benefit from the reduction in milk production cost (item e) is Ksh 3.06 per liter. This amount is calculated from cost savings multiplied by milk production (item f) of 173.7 liters per month, or Ksh 531 per month.
i. With no increase in milk prices, the total amount of income at the end of the project would have been (g) plus (h), or a total amount of Ksh 3,656.
j. This corresponds to a percentage increase over baseline in the amount of 79 percent.

41
FIGURE A.5. POSSIBLE APPROACH FOR KAVES DAIRY SUPPORT
Introduction USAID/Nairobi requested that the KDSCP evaluation team provide recommendations on the implementation of the USAID-funded KAVES project that will provide continuing USAID support to Kenya’s dairy subsector. The KAVES project began operating a few weeks before the KDSCP project ended, and will continue for a period of five years until January 2018. The team has prepared the foregoing comments based on what the team members have learned from the KDSCP evaluation, and in light of findings, conclusions, and recommendations the team considers relevant to KAVES. KAVES will operate in locations targeted for support by the USAID Feed the Future initiative, which encompass many of Kenya’s food-insecure areas that are not necessarily recognized as dairy producing areas, particularly for commercial dairy production. Many of the KAVES targeted locations will likely encompass regions classified as arid- and semiarid in Eastern and Northern Kenya. In some of these locations, livestock production is based on seminomadic practices where animals range for great distances to find food, particularly during periods when rainfall is limited. The situation under which the KAVES project will support dairy development in many of the nontraditional dairy producing areas is described below. Considerations Fresh milk supplies are produced primarily by local breeds of dairy cattle, with supplemental milk production from goats and camels. Dairy cattle are normally given free range for grazing but confined to pens for feeding, milking, watering, disease prevention, and treatment. Separate, permanent shelters are rarely used for the care of dairy cattle. Zero grazing is rarely practiced. The use of AI technology has limited use in these locations, since most farmers prefer to use a limited number of bulls they own to provide breeding services for their entire herd of animals. Furthermore, the breeding process is generally not controlled and inbreeding is common, resulting in the very low development of the genetic base underlying the herd’s production capability. The practice of allowing dairy cattle to range over great distances increases the animal’s exposure to parasites and infections, and causes a greater incidence of infectious disease. Furthermore, range cattle tend to have lower milk productivity (liters/cow/day) than confined cattle. In these food-insecure areas, commercial marketing channels tend to be very short, with limited processing or other means for added value. Milk cooling, processing, packaging, and distribution through commercial retail outlets are extremely limited. Most milk is marketed by informal traders who purchase raw milk at farmgate and distribute the milk to consumers in nearby towns and villages. Food safety is ensured by the boiling of milk by individual consumers. Milk is sold into local markets, general, and sales in large urban markets are extremely rare. None of the milk is sold in crossborder markets. Milk cooling is rarely practiced because of short supply chains, the limit availability and erratic supply of electricity, and the cost of purchasing and operating milk coolers. There is considerable local knowledge for making milk by-products at the village level, including cheese, butter, yogurt, and ghee. Despite the semiarid climate in these locations, seasonal rains make it possible to produce short-cycle crops that can be used for on-farm production of animal feed, including legume crops such as soybeans and feed grains such as yellow maize. The growing season can also be extended through the use of drought-resistant drops such as sorghum and Sudan grass. An important contributing factor to dairy production in the KAVES project area is that the prices of dairy products tend to be higher in areas where milk production is low. These locations are net importers of dairy products. The organization of small farmers into producer associations will be an important element of the KAVES project to provide milk bulking in support of joint marketing for greater efficiencies. Conclusions Dairy production can be an important contribution to smallholder household incomes even in the nontraditional dairy areas where the KAVES project will operate. USAID support for dairy development under KAVES should generally follow the same conceptual framework as that used by the KDSCP project. The following specific programs will be required:

42
Improved breeding practices through AI will lead to a stronger genetic base of the dairy herd in these locations. Improved dairy animal genetics will provide increased milk productivity and eventually, dairy animals that have a considerably higher market value. Project support will be required to help small farmers produce and store nutritious animal feed at their farm, which will make it possible to feed their animals during the dry season for continued milk production. Close collaboration will be required by the project with county government officials, particularly with the Director of Livestock and the Department of Veterinary Services. These government organizations provide services in all counties, even when private services are limited. A network of service providers will be needed to support small dairy farmers under KAVES, as was the case for the KDSCP project. In light of the relatively limited knowledge base and technical skills in dairy production by smallholder farmers in KAVES project locations, training interventions of greater intensity and coverage will be required by the new project than was provided by KDSCP. Technology transfer will be an important element of KAVES support, particularly for milk cooling in remote areas. For example, evaporative cooling technology that uses the mineral zeolite for water absorption, which is regenerated through the use of renewable energy from sources such as solar power or biogas, to remove the evaporated water is being tested in Uganda. In locations where natural heat and climate conditions make dairy production from dairy cows extremely difficult, milk production by dairy goats should be considered as an alternative to commercial milk production in food-insecure areas. Recommendations Fintrac, the implementing partner of the KAVES project should use the findings of the KDSCP evaluation report to inform its implementation strategy for the dairy component of this new project. KAVES should employ similar concepts for breed improvement, feed supply, and the creation of farmer support networks that was used by the KDSCP project. KAVES should provide for stronger service delivery of farmer training than was provided by the KDSCP project. Strong support should be provided by KAVES for technology transfer and adoption by small farmers and their producer organizations, especially for cooling technology.

43
FIGURE A.6. WASTE WATER DISPOSAL BY DAIRY ORGANIZATIONS
WASTE WATER DISPOSAL BY DAIRY ORGANIZATIONS ORGANIZATION MEANS OF DISPOSAL
Wakulima Dairy Farmers’ Company, Mkuruei-ini, Nyeri Milkshed
This SBO has dug a settling pit where polluted water is deposited. The Nyeri municipal council then occasionally uses a tractor tanker to extract the waste water and deposit it into the sewer.
Kiplombe Farmers Cooperative Society, Elda Maravine, Nalukuru Milkshed
The waste water is drained into an underground pit and accumulates until it is collected up by the Nyeri Municipal Council officers for disposal.
KCC, Eldoret New KCC has elaborate systems for waste disposal whereby its waste run-offs are connected to the town’s main sewer system for disposal.
Eldoville Dairies, Karen, Nairobi Eldoville deposits all its waste water in the Nairobi sewerage company drainage pipe for onward disposal by the city.
Elso Farm, Hillside, Eldoret Elso farm in Eldoret deposits all its waste water in a drainage pit from where it is pumped to pasture lands and used to fodder crop plantations.

44
FIGURE A.7. GENDER AND YOUTH ISSUES
Gender Findings KDSCP supported gender equality, and promoted female participation and leadership within the 135 SBOs that it supported. Aligned with the new constitution in Kenya, the project team supported the integration of women and youth into the management affairs of SBOs. The survey revealed at least four significant findings on women’s role in the dairy industry: • Twelve percent (48 out of 402) of households were headed by women. • Of the small farmer households in the eight milkshed locations, women manage the family dairy
enterprises in 37 percent of the households (147 out of 399 responses). • Only 28 percent (111 out of 399) of women control proceeds from overall milk sales, although FGDs
found that 95 percent of afternoon milk is controlled by women. Afternoon milk is not normally sold through the SBOs.
• In terms of membership in farmer organizations, women constitute 29 percent (115 out of 399 responses) of SBO members.
Based on FGDs with 40 SBO leaders, SBO members prefer that women hold elected positions where money is involved (e.g., treasurer) since women are thought to be more accountable and reliable than men in financial matters. FGDs with 80 male and female dairy farmers indicated that 88 percent (70 out of 80 participants) believed that using chaff cutters substantially reduced the time women spent preparing livestock feed, perhaps as much as five hours per day. Similarly, 54 percent (14 out of 26 participants) of FGD participants from both male and female groups believed that biogas capability can save women four hours a day in labor time that they would otherwise spend searching for fuel and preparing food. Furthermore, in male FGDs, 42 percent (10 out of 24) of participants indicated that with biogas they would be willing to help prepare food in the kitchen because of the “easy workload” and “pleasant surroundings.” Female involvement in the Central Region’s dairy industry is prominent and advanced. The project has helped to advance women’s participation and leadership in producer organizations, and women play a substantial role in decision-making and receive a greater share of the income from the family dairy enterprise. The project impact in terms of women’s empowerment is greater in the Central Region than in the Rift Valley. Gender Focus on the Rift Valley Focus group discussions (FGDs) with 40 SBO leaders in four milksheds indicated that females occupy 30 percent of the permanent positions within SBO management committees, and participate in decision making for these organizations. However, there are regional differences in the representation of women in SBO organizations. Based on the FGDs, females in the Central Region hold around 40 percent of the positions, whereas in Rift Valley their representation is around 20 percent. The explanation given to the evaluation team was that in Central Kenya, women’s rights are assured and women are more literate and aware of their rights than in the Rift Valley. Furthermore, in the Rift Valley where women are considered less literate and more repressed, SBOs have been “forced” to adopt the one-third gender rule owing to the requirements of the new Kenyan constitution. In the Rift Valley, FGDs revealed that dairy animals normally belong to men whereas women are merely workers who tend to the animals with little income sharing from the dairy business. While there has been progress in women’s participation and leadership in farmer organizations in the Rift Valley Region, it is largely the result of social changes required by the government. The new constitution stipulates a one-third (33 percent) gender rule for all elective and representative positions. During FGDs with female dairy farmers in this location, 90 percent (18 out of 20) of participants expressed deep concerns over their lack of empowerment and their limited access to and control over resources. In sum, in the Rift Valley, females are generally less empowered than in the Central Region.

45
In the Rift Valley, discussions with male farmers and SBO leaders revealed that the society is male denominated, conservative, and that change is relatively slow. Women are members of SBOs and hold some leadership positions, but their role in decision making is not as pronounced as in the Central Region. Men and women alike recognize the disproportionate sharing of resources in dairy farming, which is particularly acute in the Rift Valley. Both female and male groups agree that ownership of dairy animals acquired independently by women would not only be a means to create wealth, but also empower women as family breadwinners. Participants in FGDs believe that women’s control over resources increased during the KDSCP project. In Central Kenya, 41 percent of women affirmed this (36 out of 90 responses), but less progress was seen by the evaluation team in Rift Valley (10 percent or 9 out of 90 responses) because of sociocultural factors. Based on FGDs with SBO leaders and other smallholders, 95 percent (114 out of 120) of participants agreed that women controlled the use of afternoon milk. In the absence of milk cooling capacities by most SBOs, afternoon milk is not normally sold through formal channels. Instead, it is either consumed by the household or sold to neighbors, and occasionally sold to informal traders. Income from afternoon milk sales are controlled by women and used mainly for household consumption. The dialogue between the evaluation team and separate FGDs composed of male and female farmers led to the conclusion that in the Rift Valley, men are unaware of women’s inequality as manifest in the disproportionate sharing of household resources and workload for dairy farming. Further, women find it difficult to communicate their concerns to men because of the latter’s dominant social position as the head of household, indicating that joint sensitivity training would increase the awareness of men and women on the need for gender equality. GENDER AND YOUTH 1. Future USAID dairy support projects should provide targeted training to women in SBO leadership
positions, including financial management. 2. Future USAID projects should proactively support female empowerment and youth employment
through quotas and affirmative action. 3. Females and males should be jointly informed and educated on the need for gender mainstreaming,
female empowerment, and the rights of women vis-à-vis men in sharing resources and responsibilities. 4. Future USAID projects should encourage SBO officials to employ youth to manage new technology
applications and provide dairy support services such as transportation.
Youth Findings It was revealed that of the 402 households surveyed, 11 percent (43 out of 402) of households were headed by youth. Based on FGDs with SBO leaders and other smallholder farmers and the team’s observations, youth participation in the dairy enterprise is as follows:
• Youths are involved as milk transporters using motorcycles, bicycles, and manual push carts.
• Youth are involved in operating IT hardware and software in the SBOs and according to the Land O’Lakes end of project assessment report, 64 SBOs out of 135 (47.4 percent) had purchased information and communications technology equipment and employed youths in its operation.
• Milk bars in key urban centers in Nyeri, Thika, Nakuru, and Eldoret are operated mostly by
youths.
• Youths are employed as operators of chaff cutters and feed mixers and/or purchase mobile chaff cutter units for rent to dairy farmers.
• According to discussions with KENDBIP, over 85 percent of technical personnel in the
construction of biogas plant units are youths.

46
• The farmer survey indicated that 18 percent (72 out of 399) of dairy farms were owned by
youths.
• FGDs with 40 SBO officials indicated that youths have been employed as technical managers and constitute, on average, 25 percent of the SBO workforce.
• Observations at SBOs during field visits and in FGDs with SBO leaders indicated that smallholder
dairy farms are an important source of livelihood for youths. Conclusions Gender equality could be supported through capacity building for women to help them achieve leadership positions in farmer organizations. Capacity building would enhance the skills of women who hold leadership positions (or help them gain leadership positions), and empower them. A starting point for greater gender equality would be to build upon the custom whereby women control the use of and income from the sale of evening milk. In view of their household duties and the wide range of farm labor they perform, females derive considerable benefits from labor-saving technologies, particularly zero grazing practices, chaff cutters, and biogas production. Zero grazing reduces the workload of herding animals; chaff cutters reduce the labor needed to chop fodder for animal feed; and biogas reduces the time needed to search for fuel wood and prepare meals. Since these are tasks performed predominately by women, these particular technologies are especially important for them. Women and youths would be empowered and be able to sustain their livelihoods through the independent ownership of dairy animals. Youth involvement in the dairy enterprise is important because they have a great capacity to manage emerging technologies.

47
ANNEX B. EVALUATION TEAM MEMBERS AND DESIGNATED TASKS

48
Evaluation Team Members and Designated Tasks Tom Easterling, Team Leader, will be responsible for team organization, scheduling, and primary liaison with the USAID Mission staff regarding technical aspects of the evaluation. He will have overall responsibility for the preparation and submission of the final report with substantial input from the other team members. The other team members will report to him on evaluation issues. The team leader will take the lead in preparing the project schedule and work plan, and will work closely with the other team members to determine information requirements, develop key questions, conduct interviews, and gather other relevant information. He will also lead the team’s effort to prepare and deliver a presentation on the team’s response to the evaluation questions, as well as the findings, conclusions, and recommendations for future action at the team’s final meeting with USAID/Kenya. Mr. Easterling will also supervise the preparation of the final report, and will ensure the quality of its contents. Upon receiving USAID’s comments on the final draft report, he will be responsible for making any final corrections and improvements and the submission of the final version to USAID. Felix M’mboyi, Ph.D, Agricultural Economist, a Kenyan citizen with a Ph.D in Sustainable Development from Atlantic International University in the United States, has qualifications in Management Focused Monitoring and Evaluation from the World Bank Institute in Washington D.C., and also data processing qualifications using SPSS from Michigan State University in the USA. Dr. M’mboyi has over 14 years’ experience in research, agriculture and development policy analysis, and development management. He has key competencies in institutional surveys; participatory monitoring and evaluation process; Sub-Saharan development policy frameworks; economic research design and field excursions; program and project management skills; interdisciplinary/stakeholder development analysis; economic analysis of development data; and survey design and report editing/technical writing. He has worked extensively as an agricultural economist in Kenya’s agricultural sector and specifically, in its dairy sector. He has demonstrated experience in value chain analysis, data collection and analysis, and monitoring and evaluation. He and the team leader will work closely to organize, schedule, and conduct the open-ended interviews; he will lead the focus group discussions, and he will have shared responsibility for drafting the field notes after each interview. He will also be responsible for drafting specific sections of the final report. TNS RMS: MSI has contracted with the Kenyan firm, TNS RMS to conduct the farmer survey and to document the results. This firm will also provide administrative support to the evaluation team to help organize the FGDs and to record the meeting notes from these discussions. TNS RMS is the longest standing and largest research agency in Africa. Its main areas of social research focus is needs understanding, benchmark and baseline studies, impact assessment and M&E and innovation applied to social or public aims, combining both qualitative and quantitative methods. This project will be managed by a project management team in Nairobi comprising of managers of different departments. At TNS we have a specialist qualitative research team who will manage the qualitative aspects of the study headed by an Associate research director, Joseph Ogeto. Joseph and the qualitative research team will be working under the guidance of the overall project director Geoffrey Kimani. Nkatha Mutiga who will be project manager will manage the quantitative aspect of the study and provide guidance and support for the qualitative phase as well.
The day-to-day contact of project management is handled by Purity Mwaura. She has over four years of research experience managed over 10 projects in various African markets which span across sectors of Governance, Social and Economic Development, Global Attitudes, Education, Religion, and Retail Auditing. She has particularly well-honed quantitative and qualitative research experience and excellent interpersonal communication skills. Some of the clients she has worked for include Globescan, Gallup, PSRAI, PSI, Crossindexcorp-Japan, NOKIA Finland, Tetra Pak Kenya, and Interconsumer Products Limited Kenya. She will be the overall project coordinator overseeing day-to-day project management.

49
The project is guided by Nkatha Mutiga, Research manager, who has seven years of experience in project management and community development. She has managed research projects in Australia, Kenya, Uganda, Tanzania, and Mozambique. Geoffrey Kimani, Director of Research and Insights, supported the team with technical guidance. Geoffrey has over 15 years of experience in managing research projects in Africa covering diverse topics such as behaviour change research, programme monitoring and evaluation, impact assessment, communication development, innovation, and product development

50
ANNEX C. FARMER SURVEY: TECHNICAL REPORT

51
General Description of the Survey and its Objective USAID/Kenya pioneered a program called Kenya Dairy Sector Competitiveness Program (KDSCP). The program, which began in May 2008 to April 2013, was implemented by Land O’Lakes and operated in eight milksheds across the Central and Rift Valley regions. The overall purpose of KDSCP was to increase smallholder household income through the sale of quality milk. It also aimed to integrate gender equity, sustainable resource management and utilization, and youth among the cross-cutting themes. USAID/Kenya through Management Systems International (MSI) commissioned TNS RMS East Africa Limited to conduct a final performance evaluation of the Kenya Dairy Sector Competitiveness Program (KDSCP). The objective of the study was to:
• Document the degree to which USAID-funded KDSCP interventions through Land O’Lakes achieved its planned "results"
• Determine to what extent KDSCP added value to strengthening the dairy sector • Identify best practices, lessons learned, and areas of improvement for future program • Provide objective recommendations on strategic areas for follow up interventions in the
Feed the Future (FtF) Initiative’s, Kenya Agriculture Value Chain Enterprises (KAVES), and other FtF programs
Survey Methodology
The research design applied both quantitative and qualitative research methodologies. Quantitative: Face-to-face interviews were carried out among KDSCP beneficiaries in eight selected milksheds. These milksheds were located in the following areas:
• Gatanga • Lessos • Kabete • Nakuru • Kericho • Nyeri • Kinangop • Trans Nzoia
Qualitative: Focus group discussions were carried out in four milkshed areas: Nyeri, Nakuru, Lessos, and Gatanga.

52
Table 1. Quantitative Sample Frame Milksheds Sample KABETE 50 GATANGA 50 KINANGOP 50 NAKURU 50 KERICHO 50 LESSOS 50 TRANS – NZOI 50 NYERI 50 TOTAL 400 Table 2. Qualitative Sample Frame
Milksheds Number of FGDs
SBO Chairpersons Male Farmers Female Farmers GATANGA 1 1 1 NAKURU 1 1 1 LESSOS 1 1 1 NYERI 1 1 1 TOTAL 4 4 4 Sampling Technique Quantitative The target respondents for the evaluation exercise were farmers who had benefited from the KDSCP project. Approximately 400 interviews were completed for this survey; 50 interviews per milkshed. Land O’Lakes provided a parent list of farmers for each milkshed. A milkshed covered more than one SBO within an area. The list, therefore, included names and contacts of farmers who are members of different SBOs. To obtain a sample list, three to four SBOs were randomly selected in each milkshed. The total sample of 50 was then spread equally across the selected SBOs. For example, if four SBOs were selected, then approximately 13 interviews would be conducted in each of the four SBOs. From the selected SBOs, two random samples were derived: sample A and sample B. In case a selected farmer from sample A was unavailable for the interview, a substitute would be picked from sample B. Before embarking on data collection in any SBO, the team arranged to meet with the SBOs’ officials first. The team leader introduced the members and explained the purpose of their visit. The team then gained consent to interview sampled members of the SBO from the officials. In most cases, team leaders also asked officials to provide their team with the contact details and residential location of sampled farmers. Enumerators would then contact the farmers and arrange for an interview with farmers. Three attempts were made before substituting a farmer with another from the second sample list. Qualitative

53
There were three target respondents for the qualitative focus group discussions, namely:
• SBO chairpersons • Male dairy farmers • Female dairy farmers
TNS’ role was to recruit the participants while MSI moderateed the group discussions. For the SBO FGDs, we looked for the chairmen (or alternate official if the chairman was unavailable). For the Men and Women FGDs, the following recruitment criteria were considered:
• Direct beneficiaries of KDSCP • Active in the SBO • 20 percent of FGD participants had to be youths 35 years and under • Mixed in proximity to center of milkshed (i.e., we did not recruit two neighbors right next to the
center) • Members of different SBOs within a particular milkshed
Household Survey A structured household survey was implemented within the milkshed area in which KDSCP was implemented. Although the sample lists had members of SBOs within milkshed areas where the program was implemented, there was a possibility that some of those farmers were not aware of the program or participated in its activities. We therefore used two questions in the survey tool as a screening procedure to identify farmers who 1) are dairy farmers (even if this is practiced to support other income sources and not as the main occupation), and 2) are aware of the program. If the answer to both questions was “yes,” the enumerator proceeded with the interview if the respondent consented to participating in the study. If not, s/he was eliminated from the parent population. Four hundred and two interviews were successfully completed. Table 3. Sample Breakdown Milkshed Male Female Youth (18-35) Adults (>35) Frequency Frequency % Frequency % Frequency % Frequency % Gatanga 51 23 45 28 55 7 14 44 86 Kabete 51 31 61 20 39 6 12 45 88 Kericho 49 41 84 8 16 5 10 44 90 Kinangop 50 39 78 11 22 17 34 33 66 Lessos 51 34 67 17 33 10 20 41 80 Nakuru 50 40 80 10 20 13 26 37 74 Nyeri 50 26 52 24 48 5 10 45 90 Trans-Nzoia 50 34 68 16 32 9 18 41 82 Total Responses 402 268 134 72 330
Project Implementation The survey began with inception meetings between TNS, MSI, Land O’Lakes, and the USAID research team. Some of the topics we covered were:

54
• Overview of strategic focus areas • Agreement on key measures • Confirmation of sampling • Project logistics • Questionnaire design • Proposed timing schedule
Questionnaire Pretest 4 pretest interviews were conducted in Kabete milkshed to test the questionnaire across a range of contexts. Questionnaire pretesting covered the following components:
• The “readability” of the questions • Are all respondents able to answer all questions both in terms of relevance to them and
questionnaire design (this is especially important because the sample will comprise of children and young people who require special care when interviewing)
• Questionnaire flow (skips, etc.), is anything missed out? • Check on interviewer instructions: are they 100 pecent there? Anything missed out? • Closed ended answers: are respondents able to answer according to the code list • Other issues: respondents are given an opportunity to raise any other answers/issues that may
be pertinent to improving the questionnaire • Length/monotony of the questionnaire • Sensitive questions: how are respondents reacting? • Difficult questions to administer and best way of going about them
Recommendations on the questionnaire and way forward were given at the end of the pretest. Set Up The following was done during the set up stage:
• Obtain lists of potential survey respondents • Develop, translate, and script survey questionnaires and other related instruments • Training manual and schedule • Telephone script (for booking appointments) • Interviewer introduction letters from TNS
Training The trainings were facilitated by TNS project staff assisted by Fred Opundo from MSI. A three-day central training for the entire project team was carried out at TNS’ office in Nairobi. The training began on April 24, 2013 and ended on April 26, 2013. A total of 32 field personnel and an additional four personnel from the quality control team were in attendance. Table 4. Training schedule
23rd Regional Teams Travel to Nairobi
DA
Y 1
Wed
24t
h A
pril
13 09h00 9h30 Opening: Introductions and Logistics of Training
9h30 10h00 Confidentiality and Signing Pledge of Confidentiality with TNS 10h00 10h30 Tea Break 10h30 11h15 Introduction to the KDSCP Evaluation Survey: survey design and methodology 11h15 11h45 Survey Read Around: Module 1

55
11h45 12h00 Ice breaker 12h00 13h00 Survey Read Around: Module 2
13h00 14h00 Lunch Break 14h00 15h00 Survey Read Around: Module 3 15h00 15h15 Tea Break
15h00 16h00 Survey Read Around: Module 4
17h00 Day Break
DA
Y 2
Thu
rs 2
5th
Apr
il 13
09h00 09h15 Ice Breaker Exercise 09h15 10h00 Whole Group – Role Play 10h00 10h30 Tea Break 10h30 12h00 Whole Group – Role Play 12h00 12h15 Ice Breaker 12h15 13h00 Exercises and Role Playing - Partner 13h00 14h00 Lunch Break 14h00 15h45 Exercises and Role Playing - Partner 15h45 16h15 Tea Break 16h15 17h00 Questions and Answers
17h00 Day Break
DA
Y 3
Fri 2
6th
Apr
il 13
09h00 12h00 Dummy Interviews 12h00 12h15 Ice Breaker 12h15 13h00 Team Feedback (Experience, Challenges, etc.) 13h00 14h00 Lunch Break
14h00 15h45 Teams’ Feedback (Survey Instrument), Recommendations
15h45 16h15 Tea Break
16h15 17h00 Questions and Answers, Discussion Logistics
17h00 Day Break Pilot Study The pilot was conducted on April 29, 2013, in all milksheds. Outcomes of the pilot include:
• Despite some issues with the script, generally the questionnaire had a good flow and respondents were able to follow through and comprehend the content and subject matter.
• Translation issues were picked up and later corrected. • There were challenges in picking up GPS coordinates in areas with limited ror unreliable
networks. • A challenge that stood out in all of the regions is the fact that a majority of respondents were
not willing to be interviewed unless they had prior information from their SBO leaders about the survey.Based on this experience, we decided that we would first contact the leaders and allow time for the leaders to communicate the purposes of the survey and visits to SBO members. The leaders would then inform us when the appropriate date and time would be to schedule interviews.
• Rescheduling of appointments by respondents. • Some respondents had their phones switched off. This made it impossible to locate them for
interview.

56
The outcomes of this exercise informed the questionnaire and show cards. The refinement of the survey was based on the interview length and relevance of questions to overall survey objectives in light of target respondents’ characteristics. Field Work Field work officially commenced on April 30, 2013, in all milk-sheds. The field team breakdown is given below. Table 5. Team Breakdown Number of Enumerators 20 Number of Team Leaders 6 Number of Supervisors 3 Number of Quality Control Clerks 4
Enumerators The enumerators carried out the actual interviews with farmers across sampled SBOs. Team Leaders A team leader was in charge of a team of four enumerators. The duties of the team leader included:
• Give out daily assignments to enumerators and ensure that daily data collection activities ran smoothly
• Track and report on field issues and progress of fieldwork to central office • Accompany 5 percent of interviews per interviewer to ensure that quality protocols were
adhered to Supervisor The supervisors were in charge of specific regions. The duties of the supervisor were:
• Conducting field validation checks (back-checks) on team leaders • Tracking and reporting on field issues and progress of fieldwork to central office • Meeting with team leaders on a regular basis to discuss their performance
Quality Control Clerks Conduct independent back-checks and accompaniments that constitute 10 percent of all work in the regions. The interviews were conducted face-to-face and data was collected using Computer Aided Personal Interviewing (CAPI).The PDA usage formed part of the interviewer training and covered gadget use, synchronizing, and mock interviews. Use of PDAs eliminated the need for data entry as the data is entered directly and sent to the TNS server. Using CAPI also ensured that the correct skip patterns were followed during the interview, which is also a quality control mechanism. Quality Control Table 6. Quality Control Breakdown Number of interviews back checked physically and accompaniments 60
Correct interviews (interviews with no issues) 57

57
Sum of incorrect interviews 3 In the course of a typical accompaniment, the quality control clerk listened in and keyed responses on her PDA. She/he ensured the right responses were captured, checked that all questions were asked and in the right way, and skip patterns adhered to. The clerk would correct any anomalies instantly before the data is synchronized. The interviewer would be advised on what they are doing right and wrong and how to do things better. In a typical back check, the quality control clerk would receive the contact information of respondents who have already been interviewed as well as part of the responses given by a particular respondent. Whether it is telephonic or in person, the quality control clerk would ask a few questions to the respondents to confirm that the interview did indeed happen, and that the responses marked in the data match with what was given by the respondent. In the three cases (see Table 6) where anomalies were discovered in the back-checks, the following was applied:
• The information collected was inadequate, survey was redone and added to existing data • The interviewer needed re-training; this was done by the team leader and supported by the
regional supervisor. Other than physical back-checks and accompaniments, debriefings were also used for quality control. Debriefing: The team leaders held debriefing sessions with their teams every morning before embarking on any data collection. They communicated any problems and areas for clarification to the field enumerators. The data review feedback was also discussed and the team leader ensured that each interviewer responded to this feedback in the course of the day. If any anomalies were discovered, the entire team working on the project was informed as soon as possible. Field Challenges Encountered There was a sense of apprehension from some respondents who feared that the survey was another of the many scams they had experienced or heard of. Those who were reluctant to participate were given time to consult with their leaders and gain confidence in the evaluation team and the purpose of the survey. The team had challenges contacting some of the respondents due to phone numbers not going through, wrong numbers (i.e., the listed number does not belong to the intended person), or calls not being answered (even after at least three attempts). Some of the appointments arranged did not materialize into successful interviews. In some cases, respondents switched off phones on the day of the interview and could not be located whereas a few directly refused to participate. There were high expectations from the farmers. Most of them expected monetary rewards before participating as they had been waiting for financial rewards from various organizations. Extreme weather conditions, flooding and all day rains, affected movement in some rural locations. In focus group discussions, it was a challenge to locate and secure interviews and invite SBO leaders for group discussions because many of them were engaged in various economic activities.

58
Conclusion The survey was extraordinary and exposed the team to new and challenging methods of data collection. This has improved our skills and built new levels of confidence among the teams. A key lesson was the value of consistent and timely communications about all aspects of the study. Communication between field and project management in TNS and between TNS and MSI proved to be very effective in problem solving. It was through such communication that issues were solved in a timely manner to ensure the flow of the study.
Most of the respondents could not remember in detail events that took place 3–4 years ago. Although we used our probing skills to help them, a majority could only estimate figures/amounts. This should be taken into consideration during analysis.

59
ANNEX D.1 FOCUS GROUP DISCUSSION TOOLS

60
KENYA DAIRY SECTOR COMPETITIVENESS PROGRAM PROGRAM EVALUATION QUESTIONS, SMALLHOLDER GENDER GROUPS
1. Identification and Contact Information • Name and location of group • Name and contact information of affiliated organization [cell phone, email] • Name and contact information of individuals attending [cell phone, email] • How were the individuals selected to attend the focus group meetings?
2. Background Information • Are you aware of the KDSCP and its support to dairy farmers (Y/N)? If so, what does the project do? • What is your relationship of your group with the KDSCP project? • How did the relationship begin? • How long were you provided assistance? • What did the project do for you? How did it help the members of your group?
3. Gender Roles and Responsibilities • Have men and women benefited differently from KDSCP (Y/N)? If so, how? • Please describe how the family dairy business was generally carried out before KDSCP, compared to
the present situation. What was the normal involvement of family members in the business? Did men and women have different roles and responsibilities?
• Who was responsible for the animals? How were the animals fed and tended? • Who handled the money earned from dairy production (M/F/Both)? • Who makes the decisions related to dairy farming investments (M/F/Both)? • Who do service providers deal with when they visit the farm (M/F/Both)? Do they provide their
services equally for men and women farmers? • How are decisions made in your organization/cooperative? What is the role of women? Are there
women officers? Which positions? • If the male head of household should die, what would happen to the dairy farming business? • What percent of the members of your SBO is female? Have there been any changes as a result of
KDSCP? • What percent of the SBO leaders is female? Have there been any changes as a result of KDSCP?
4. Family Income and Production • Before KDSCP, how much family income per month did you receive for milk sales? How much do
you receive now? If changed, to what do you attribute the change? Be specific. • What is the dairy income normally used for at the household level (school fees, health, food, etc)? • How many dairy animals did you own before? How many do you own now? Who is the owner of the
animals (M/F/Both)? • How much milk did your farm produce (liters per day) wet season? Dry season? How much now? If
changed, to what do you attribute the change? Be specific. • How much was the average production per animal then and now (liters per day)? If changed, to what
do you attribute the change? Be specific. • Where did you sell your milk before KDSCP, and now? Of the total amount produced, how much
was sold? How much do you produce and sell now (liters per day)? If changed, to what do you attribute the change? Be specific.
• Before KDSCP were you able to sell all your surplus milk? How were prices set? What is the situation now? Have your prices increased after KDSCP began?
• What were the different sources of family income before KDSCP? What are the sources now? 5. Changes in Production Technology
• Have you used new farming technology or farm practices as a result of KDSCP? • What are the three most beneficial practices that you have adopted? • Have males and females benefited differently from this technology? How, examples. • Have you shared what you learned with others? • How important is the technology you adopted (scale of 1–10)? Have men and women farmers adopted
new technology at about the same level, or are there different adoption levels based on gender? Explain.

61
• Has access to support services changed since the beginning of the program (AI, agrovet, etc)? How and why?
6. Training • Have any of your family members received training in dairy production of milk handling as a result of
KDSCP (Y/ N)? • What training have you received? List. • Have males and females had equal access to training? Explain. • Which training was the most helpful to you and why? • How important was the training you received (scale of 1–10)?
7. Sustainability • If the project were to end, would you continue to practice what you learned? If not, why not? • If the project were to end, would you continue to operate as a dairy farmer (Y/N)? If yes, at what level:
less than now, about the same, more than now. 8. Environmental Practices
• As a result of KDSCP, have you made any changes to better protect the environment in your dairy farming activities (Y/N)?
• What changes in environmental practices have you made? What has been the effect? List. • How important are these changes in terms of environmental protection (scale of 1–10)? • As a result of KDSCP, have you incorporated measures related to the use of acaricides or fertilizer, over
grazing, control of milk-borne diseases, or fuel wood use? • Do you believe that the effect of the KDSCP project on Kenya’s environment is positive, negative, or null? • Within your community, are women and youth involved in handling, spraying, or other use of farm
chemicals? • If so, do they employ safety methods including protective clothing, masks, and gloves?
9. Implementation Issues • What have been the main benefits your group members and your families have received from KDSCP
support? • Have there been any negative results from your group’s experience with KDSCP (Y/N)? • If so, what were they? List. • How could the project improve its performance? What was missing? • Have you benefited from other projects in addition to the KDSCP project? What did the other project(s)
provide? • Does the KDSCP project provide any benefits to the community at large, in addition to benefits provided
to you and other farm families (Y/N)? What are they? List.

62
KENYA DAIRY SECTOR COMPETITIVENESS PROGRAM PROJECT EVALUATION QUESTIONS, MILKSHED COORDINATORS
1. Introduction • Please provide contact information for you, and for your organization/phone, email, address, location. • How knowledgeable are you of the KDSCP on a scale of 1–10 (10 highest)? • Can you please provide a brief description of your functions and your relationship to KDSCP? • How did your relationship with KDSCP evolve?
2. Achievement of Project Goals • The primary goal of the KDSCP is to increase the household incomes of smallholder dairy farmers
through the sale of quality milk. The secondary goal is to help transform the Kenyan dairy agro-industry into a globally competitive regional market leader. How well do you believe the KDSCP project has achieved these two goals?
• To the extent possible, can you please quantify the impact of KDSCP on milk production and animal productivity (liters/day) in your milkshed area by comparing the performance today with its performance before the program was initiated? Can you quantify any of these results?
• Are there other important benefits that your milkshed has have received from KDSCP support that you can mention, even if they cannot be quantified? List.
3. External Factors • In your opinion/view, what external factors (e.g., business environment, external support) have helped
contribute most to project achievements? • In your view, what external factors do you see as having been the most detrimental to project
implementation? 4. Technology Transfer and Innovation
• How innovative has the KDSCP project been in terms of the introduction of new and better dairy practices and technology? How would you rate the project in terms of innovation on a scale of 1–10 (10 highest)?
• What, in your opinion, are the main innovative practices supported and encouraged by KDSCP throughout the dairy value chain? List.
• What will be their lasting impact? What benefits will they provide? • How effective has been the project training to dairy value chain operators and service providers?
5. Sustainability • In your opinion, how sustainable are the innovations that have been introduced by the project? In your
view, do you think these innovations will continue without continued project support and encouragement? What will likely happen with regard to the continued use of these innovations after the project ends?
• How sustainable do you believe to be the producer cooperatives/ groups and business enterprises that were supported by the project? How viable are they?
• Will the linkages that have been created between small farmers and service providers, milk buyers, and farmer cooperatives continue after the project ends? How strong are these linkages?
• Do you know of any producer cooperatives/groups that would not likely survive without continued support from the project/s?
• What will likely happen after the project ends in terms of the quantity, quality, and value of the milk sold by project beneficiaries?
6. Gender • Are you aware of any activities carried out by KDSCP that promotes gender equality and gender
mainstreaming? Can these be disaggregated by men, women and youth? • If so, can you describe the results achieved from these efforts by the project? • What percent of the members of the SBOs within your milkshed is female? Have there been any changes
as a result of KDSCP? • What percent of the leaders of the SBOs within your milkshed is female? Have there been any changes as
a result of KDSCP?

63
• What, in your opinion could future projects do within the Kenyan social environment to support gender equality and gender mainstreaming?
7. Rural and/or Agricultural Finance • Are you aware of any activities carried out by KDSCP to help its beneficiaries obtain financing? • If so, what institutions were involved in the farmer financing arrangements? • If so, can you describe the results achieved from these project efforts? • What, in your opinion could future projects do to stimulate rural and agricultural lending by the formal
financial sector in Kenya? 8. Environmental Protection
• Are you aware of any environmental standards that the KDSCP employed during the course of project implementation?
• Were farmers in your milkshed area provided training in pesticide handling or other means for environmental protection?
• Are you aware of any other activities carried out by KDSCP to help protect Kenya’s environment? • If so, can you describe the results achieved from these project efforts? • How is waste water from milk processors, coolers, and consolidators handled in the milkshed area? Have
there been any changes as a result of KDSCP initiatives? • What, in your opinion could future projects in Kenya do to help protect Kenya’s environment?
9. Quality Standards and Certification 1. As a result of the KDSCP, have you incorporated quality standards into your business
(Y/N)? 2. What quality standards have you incorporated? List. 3. Do you sell your products under a graded payment system based on quality? 4. Have you received any type of quality certification in your into your business (Y/N)? 5. If so, what have you received? List. 6. How satisfied are you with the outcome of this effort (scale of 1–10)?
10. Project Implementation Issues • What, in your opinion, are the KDSCP project’s main accomplishments? List them. • What, in your opinion will be the KDSCP project’s legacy? What significant/great achievement will it leave
behind? • Is there anything that the project should have done differently? • In your opinion, how effective was the KDSCP staff during project implementation? • What is your overall rating of the KDSCP project on a scale of 1–10 (10 highest)?
64
ANNEX D.2 QUALITATIVE INTERVIEW GUIDES

65
KENYA DAIRY SECTOR COMPETITIVENESS PROGRAM PROJECT EVALUATION QUESTIONS, IMPLEMENTING PARTNER
1. Background • Can you please provide a brief background summary and overview of project
implementation? • Can you please provide an overlay map of the KDSCP program area?
2. Achievement of Project Goals and Objectives • How well do you feel that the project has achieved its primary goals? Can you quantify
the results for the whole span of the project (2008-2013)? • Can you please provide final qualitative and quantitative data on the the extent to which
the project has achieved its objectives under its PMP? • For the PMP targets that may not have been achieved, can you please provide the
reasons why they were not achieved? • For the PMP targets that may have been over-achieved, can you please provide the
reasons why they were overachieved?
3. External Support and Reinforcement • Has the project benefited from support and reinforcement to project implementation
activities from external organizations including as international donors, NGOs, CBOs, private sector or the GOK, or their program(s)? Examples?
• Conversely, has project implementation been unduly hampered by external policies, programs, or organizations? If so, please describe the most severe problems and their impact on project implementation.
• Were project implementation sites affected by political instability and or any other impeding factors? (I have in mind post-election violence of 2007/2008). Examples?
4. Support to Small Farmers • How many beneficiary smallholder farmers directly benefited from the project? How
many others indirectly benefited from the project? Examples of direct and indirect beneficiaries? How do you define and count direct and indirect beneficiaries?
• What is the range of support services the project has provided to smallholder dairy farmers?
• What results have been achieved in terms of increased household production output, sales, productivity, quality, employment, women and youth participation and income by the beneficiaries? Can you provide numerical data to quantify these changes?
5. Technology Transfer and Innovation • What range of new technologies has the project supported for implementation by dairy
farmers, SBOs, producer cooperatives, processors, and BDS providers? • Were the technologies adopted by smallholder farmers generated nationally or sourced
externally? • What are the main results achieved? • How well did the smallholder farmer category (the elderly, women, and youths)
respond to technology transfer and applications? Examples? Challenges? Successes? • What do you think the long term impact of your efforts will be?
6. Facilitating Linkages Between Small Farmers and Supporting Organizations

66
• Has the KDSCP project helped to create linkages between smallholder farmers and supporting organizations, such as FBOs, service providers, markets, agribusinesses, and providers of research and extension services? How? Examples?
• Which groups and organizations has the project primarily worked with? • What were the most important results achieved? Why were they the most important? • What will likely be the long term impact?
7. Sustainability • What support do you provide to your assisted groups, organizations, or beneficiaries?
How sustainable are their activities? What do you expect will happen after the project ends?
• What are the results of your institutional capacity building and strengthening activities with these organizations?
• What are the results of project support for innovative practices and technology transfer?
• How sustainable are the results/changes made? What will happen after the project ends?
8. Gender • Was gender incorporated into the design of KDSCP? How? • Does your project results data/information reflect gender disaggregation in all respects?
If not, where does it not and why not? • What role do gender considerations play in project implementation? • What are the results achieved, with regard to project support to female equality? • Were there any gender mainstreaming impediments (social or cultural) to the project?
9. Coordination and Harmonization with Other Entities • To what extent has your project coordinated with other development initiatives and
entities? Examples? • What common areas did you coordinate with these initiatives? Place name the other
development initiatives you coordinated with? • What results have been achieved?
10. Rural and/or Agricultural Finance • Has your project worked to facilitate rural/agricultural finance to micro, small, and
medium borrowers? If so, who were the providers of these microfinance products? • What were the results achieved? • What will likely be the long term impact? • Can you provide any data on the relationships between a) individual loan amounts and
b) product sales, c) household income, d) employment, or d) productivity? Do you have any evidence that improved access to credit (or loan amounts) affected product sales, household income, employment, or productivity? If so, elaborate.
11. Environmental Protection • What are the primary requirements of KDSCP regarding compliance with U.S.
government environmental regulations? • How difficult was the compliance process? How well do you feel these requirements
were addressed by the project?

67
• What were the awareness levels of the smallholder farmers with environmental protection and compliance issues before and after the project?
• Do you believe that environmental protection is better managed now in the project area than it was before the project began? Explain.
• What are the main achievements of KDSCP activities for environmental protection? • In your opinion, do you think the costs of environmental protection were greater or
less than the benefits?
12. Project Implementation • Over the course of project implementation, did you make any changes in the
implementation strategy or the method used to implement the project? What changes and why?
• If you were starting the project anew, would you make any changes in the way you implemented activities? What changes and why?
• What were the major problems that had to be overcome during project implementation?
• Conversely, what were the main factors that supported and facilitated project implementation?
• What are the main lessons learned from your implementation experience (good, as well as bad).
• What advice would you give USAID on the design of similar projects in the future?
13. Overall Project Assessment • In your own view, do you think the overall project goal was achieved? If so, to what
extent?

68
KENYA DAIRY SECTOR COMPETITIVENESS PROGRAM PROJECT EVALUATION QUESTIONS, VALUE CHAIN OPERATORS
AND SERVICE PROVIDERS 1. Introduction
• Please provide contact information for you, and for your organization/phone, email, address, location. • How knowledgeable are you of the KDSCP on a scale of 1–10 (10 highest)? • Can you please provide a brief description of your organization and its relationship to KDSCP? • How did your relationship with KDSCP evolve?
2. Achievement of Project Goals • The primary goal of the KDSCP is to increase the household incomes of smallholder dairy farmers
through the sale of quality milk. The secondary goal is to help transform the Kenyan dairy agro-industry into a globally competitive regional market leader. How well do you believe the KDSCP project has achieved these two goals? How has it contributed to these goals?
• Can you quantify any of these results? 3. External Factors
• In your opinion/view, what external factors (e.g. business environment; external support) have helped contribute most to project achievements?
• In your view, what external factors do you see as having been the most detrimental to project implementation? Explain.
4. Technology Transfer and Innovation • How innovative has the KDSCP project been in terms of the introduction of new and better dairy
practices and technology? How would you rate the project in terms of innovation on a scale of 1–10 (10 highest)?
• What, in your opinion, are the main innovative practices supported and encouraged by KDSCP throughout the dairy value chain? List them
• What will be their lasting impact? What benefits will they provide? • How effective has been the project training to dairy value chain operators and service providers?
5. Sustainability • In your opinion, how sustainable are the innovations that have been introduced by the project? In your
view, do you think these innovations will continue without continued project support and encouragement? What will likely happen with regard to the continued use of these innovations after the project ends?
• How sustainable do you believe to be the producer cooperatives/ groups and business enterprises that were supported by the project? How viable are they? If not sustainable/viable, why not?
• Do you know of any producer cooperatives/groups that would not likely survive without continued support from the project/s?
• What will likely happen after the project ends in terms of the quantity, quality, and value of the milk sold by project beneficiaries? Why?
6. Gender
• Are you aware of any activities carried out by KDSCP that promotes gender equality and gender mainstreaming? Can these be disaggregated by men, women and youth? Examples?
• If so, can you describe the results achieved from these efforts by the project? • What, in your opinion could future projects do within the Kenyan social environment to support gender
equality and gender mainstreaming? 7. Rural and/or Agricultural Finance
• Are you aware of any activities carried out by KDSCP to help its beneficiaries obtain financing? • If so, what institutions were involved in the farmer financing arrangements? • If so, can you describe the results achieved from these project efforts? • What, in your opinion could future projects do to stimulate rural and agricultural lending by the formal
financial sector in Kenya?

69
8. Environmental Protection • Are you aware of any environmental standards that the KDSCP employed during the course of project
implementation? Examples? • Are you aware of any other activities carried out by KDSCP to help protect Kenya’s environment within
the milkshed areas? Examples? • If so, can you describe the results achieved from these project efforts? • In relation to the KDSCP program, what could future projects in Kenya do to help protect Kenya’s
environment? 9. Project Implementation Issues
• What, in your opinion are the KDSCP project’s main accomplishments? List them. • What, in your opinion will be the KDSCP project’s legacy? What, if any, significant/great achievement will
it leave behind? • Is there anything that in your opinion the project could have done differently to enhance results? Explain. • In your opinion, how effective was the KDSCP staff during project implementation? • What is your overall rating of the KDSCP project on a scale of 1–10 (10 highest)?

70
KENYA DAIRY SECTOR COMPETITIVENESS PROGRAM PROJECT EVALUATION QUESTIONS, KEY INFORMANTS
1. Introduction • Please provide contact information for you, and for your organization/phone, email, address, location. • How knowledgeable are you of the KDSCP on a scale 1–10 (10 highest)? • Can you please provide a brief description of your organization and its relationship to KDSCP? • How did your relationship with KDSCP evolve?
2. Achievement of Project Goals • The primary goal of the KDSCP is to increase the household incomes of smallholder dairy farmers
through the sale of quality milk. The secondary goal is to help transform the Kenyan dairy agro-industry into a globally competitive regional market leader. How well do you believe the KDSCP project has achieved these two goals?
• Can you quantify any of these results? 3. External Factors
• In your opinion/view, what external factors (e.g., business environment, external support) have helped contribute most to project achievements?
• In your view, what external factors do you see as having been the most detrimental to project implementation?
4. Technology Transfer and Innovation • How innovative has the KDSCP project been in terms of the introduction of new and better dairy
practices and technology? How would you rate the project in terms of innovation on a scale of 1–10 (10 highest)?
• What, in your opinion, are the main innovative practices supported and encouraged by KDSCP throughout the dairy value chain? List them
• What will be their lasting impact? What benefits will they provide? • How effective has been the project training to dairy value chain operators and service providers?
5. Sustainability • In your opinion, how sustainable are the innovations that have been introduced by the project? In your
view, do you think these innovations will continue without continued project support and encouragement? What will likely happen with regard to the continued use of these innovations after the project ends?
• How sustainable do you believe to be the producer cooperatives/ groups and business enterprises that were supported by the project? How viable are they?
• Do you know of any producer cooperatives/groups that would not likely survive without continued support from the project/s?
• What will likely happen after the project ends in terms of the quantity, quality, and value of the milk sold by project beneficiaries?
6. Gender • Are you aware of any activities carried out by KDSCP that promotes gender equality and gender
mainstreaming? Can these be disaggregated by men, women and youth? • If so, can you describe the results achieved from these efforts by the project? • What, in your opinion could future projects do within the Kenyan social environment to support gender
equality and gender mainstreaming? 7. Rural and/or Agricultural Finance
• Are you aware of any activities carried out by KDSCP to help its beneficiaries obtain financing? • If so, what institutions were involved in the farmer financing arrangements? • If so, can you describe the results achieved from these project efforts? • What, in your opinion could future projects do to stimulate rural and agricultural lending by the formal
financial sector in Kenya? 8. Environmental Protection
• Are you aware of any environmental standards that the KDSCP employed during the course of project implementation?
71
• Are you aware of any other activities carried out by KDSCP to help protect Kenya’s environment within the milkshed areas?
• Are you aware of any training sponsored by KDSCP on pesticide management and the safe use and handling of pesticides? Explain.
• If so, can you describe the results achieved from these project efforts? • What, in your opinion could future projects in Kenya do to help protect Kenya’s environment?
9. Project Implementation Issues • What, in your opinion are the KDSCP project’s main accomplishments? List them • What, in your opinion will be the KDSCP project’s legacy? What significant/great achievement will it leave
behind? • Is there anything that in your opinion the project should have done differently? • In your opinion, how effective was the KDSCP staff during project implementation? • What is your overall rating of the KDSCP project on a scale of 1–10 (10 highest)?

72
KENYA DAIRY SECTOR COMPETITIVENESS PROGRAM PROJECT EVALUATION QUESTIONS, SBO FOCUS GROUP DISCUSSIONS
1. Background and Relationship with KDSCP
1. Name of organization and region; contact information of attendees 2. What is the nature of your business? 3. Can you please provide a brief description, and a summary of your activities? 4. What is the relationship between your organization and KDSCP? 5. How did the relationship develop? 6. What support has your organization received from the project? 7. How long has the support been provided? 8. How did it start?
2. Program Impact 1. To the extent possible, can you please quantify the impact of KDSCP on your
organization by comparing your performance today with your performance before the program was initiated?
Item Before KDSCP Project
After KDSCP Project
Average total revenue per month in Ksh Average gross margin per month (revenue minus costs) in Ksh Number of FTE employees Average daily production throughput for processing unit in Lts Total amount of product sold per month in Lts Amount of formal credit received in Ksh Average selling price per unit in Ksh Other (indicate)
2. Are there other important benefits you have received from KDSCP support that you can mention, even if they cannot be quantified? List.
3. What is the most important project benefit that you have received or gained? List.
3. Innovation 1. Have you incorporated new, innovative business practices, production practices or
processing, handling, and marketing practices as a result of the KDSCP project (Y/N)? 2. If yes, what are the innovative practices you now use? List. 3. How important are these new practices on your business (scale of 1–10)?
Explain/examples.
4. Sustainability 1. Do you plan to continue to use all of these innovative practices after the KDSCP
project ends (Y/N)? 2. If not, which practices will you stop using? 3. What are your reasons for suspending the practices? 4. Is your business sustainable? Will you continue your business activity after the KDSCP
project ends (Y/N)? 5. If not, why not? List. 6. If yes, at what level do you plan to continue (much less, less, no change, more, much
more)

73
5. External Factors that Affect the KDSCP Project 1. Since the KDSCP project began, have there been problems or difficulties from external
sources (outside the project) that have negatively affected your business activity (Y/N)? 2. If so, what were they? List. 3. How severe was their effect on your business (scale of 1–10)? Explain/examples. 4. Conversely, has there been external support, assistance, or events (outside the project)
that have positively affected your business? 5. If so, what were they? List. 6. How severe was their effect on your business (scale of 1–10)? Explain/examples.
6. Credit 1. Have you ever obtained formal credit (Y/N)? 2. Has the KDSCP facilitated formal credit for you (Y/N)? 3. What were the main problems and difficulties encountered? List. 4. How satisfied were you with the credit process and the results received (scale of 1–10) 5. What could KDSCP and other projects do to improve credit for enterprises such as
yours? List.
7. Environmental Protection 1. Have you instituted any measures to protect the environment from harmful crop
farming, dairy farming, or milk handling, storage, and transport practices as a result of the KDSCP project (Y/N)?
2. If so, what practices have you instituted? List. 3. How do you dispose of waste products at your collection or cooling center? 4. Are you aware of any training sponsored by KDSCP on pesticide management and the
safe use and handling of pesticides? Explain. 5. What chemicals and pesticides are primarily being used/applied by your members? 6. What is the normal disposition of waste chemicals and pesticides within your area? 7. Does your organization provide farm chemicals and pesticides to smallholders on credit,
which are collected by deducting from milk payments? 8. Gender
1. As a result of the KDSCP has there been any change in the role that females play in your business (Y/N)?
2. If so, what changes have you made and why? List. What effect, if any, has it had on your business?
3. What is the current role of females in your business? List. 4. Who makes purchasing decisions for the business (M/F/Both)? 5. What is the proportion of male and female members of your SBO? What changes have
been made as a result of KDSCP? 6. What is the proportion of male and female leaders of your SBO? What changes have
been made as a result of KDSCP?
9. Quality Standards and Certification 7. As a result of the KDSCP, have you incorporated quality standards into your business
(Y/N)? 8. What quality standards have you incorporated? List. 9. Do you sell your products under a graded payment system based on quality? 10. Have you received any type of quality certification in your into your business (Y/N)? 11. If so, what have you received? List.

74
12. How satisfied are you with the outcome of this effort (scale of 1–10)?
10. Training 1. Have you received technical or business training as a result of the KDSCP (Y/N)? 2. What training have you received? List. 3. What were the results of the training? What changes did you make in your business
operations? List. What was the effect of these changes? 4. How would you rate the training received (scale of 1–10)?
11. Implementation Issues 1. What assistance has the KDSCP project provided you? List. 2. Was the support relevant (Y/N)? Why or why not? 3. Was the support timely (Y/N)? Why or why not? Examples? 4. Was the support sufficient (Y/N)? Why or why not? 5. How satisfied are you with the support provided (scale of 1–10)? 6. Have there been problems that the project was not able to overcome (Y/N)? 7. If so, what are they? List. 8. Is there anything about the project that should have been done differently? List.

75
ANNEX E. REFERENCES

76
References 1. United States Agency for International Development and Land O’Lakes, Inc. 2010.
USAID Kenya Dairy Sector Competitiveness Program, Annual Progress Report, October 2009 Through September 2010.
2. United States Government. 2011. Report to the People the U.S.–Kenya Partnership Report. 3. United States Agency for International Development, Land O’Lakes, Inc., and
Development & Training Services, Inc. (dTS). 2012. Compendium Report Multi-Stakeholder Evaluation of Agriculture and Livestock Value Chain Activities in Kenya, March 29.
4. United States Agency for International Development and Land O’Lakes, Inc. USAID Kenya Dairy Sector Competitiveness Program Annual Progress Report, June 2008 Through September 2008.
5. United States Agency for International Development and Land O’Lakes, Inc. USAID Kenya Dairy Sector Competitiveness Program Annual Progress Report, October 2008 Through September 2009.
6. United States Agency for International Development and Land O’Lakes, Inc. USAID Kenya Dairy Sector Competitiveness Program Annual Progress Report, October 2009 Through September 2010.
7. United States Agency for International Development and Land O’Lakes, Inc. USAID Kenya Dairy Sector Competitiveness Program Annual Progress Report, October 2010 Through September 2011.
8. Government of Kenya, Ministry of Livestock Development. 2010. Kenya National Dairy Master Plan Volume I: A situational Analysis of the Dairy Sector and Volume II: Action Plan and Implementation Strategy.
9. United States Agency for International Development and Land O’Lakes, Inc. USAID Kenya Dairy Sector Competitiveness Program Quarterly Progress Report, October 2012 Through December 2012.
10. United States Agency for International Development, Land O’Lakes, Inc., and Justin K. Miano (of Sustainability [Kenya] Ltd.). 2008. USAID Kenya Dairy Sector Competitiveness Program Pesticide Evaluation Report and Safer Use Action Plan (PERSUAP), June 23.
11. United States Agency for International Development, Land O’Lakes, Inc., and SBA Consulting Strategic Business Advisors. USAID Kenya Dairy Sector Competitiveness Program Rapid Assessment and Categorization of Dairy Subsector Associations.
12. United States Government. 2011. Kenya FY 2011–2015 Multi–Year Strategy. 13. United States Agency for International Development and Land O’Lakes, Inc. USAID
Kenya Dairy Sector Competitiveness Program Fact Sheet. 14. United States Agency for International Development, Land O’Lakes, Inc., and Fibec
Limited Bomas of Kenya. 2008. USAID Kenya Dairy Sector Competitiveness Program Milk Shed Assessment and Small Business Organizations Needs Analysis.
15. Government of Kenya, Ministry of Livestock Development, Kenya Dairy Sector Competitiveness Program. 2012. Dairy Farmers Training Manual.

77
16. United States Agency for International Development, Land O’Lakes, Inc., and Publix Ltd. 2009. USAID Kenya Dairy Sector Competitiveness Program BDS Market Diagnostic, BDS Needs Analysis, and Intervention Design Final Report.
17. United States Agency for International Development, Land O’Lakes, Inc., and Publix Ltd. 2009. BDS Market Diagnostic, BDS Needs Analysis, And Intervention Design For Lessos, Trans Nzoia, and Nyeri Milksheds Final Report.
18. United States Agency for International Development and Egerton University Tegemeo Institute of Agricultural Policy and Development. 2011. USAID Household Indicator Survey 2010 Draft Report for Comments.
19. United States Agency for International Development, Land O’Lakes, Inc., and Strategic Business Advisors. Dairy Value Chain Competitiveness Assessment and Action Plan Development Final Report.
20. United States Agency for International Development, Land O’Lakes, Inc., and Spantrack Consultants. Cooperatives Performance Assessment and Action Planning.
21. United States Agency for International Development, Land O’Lakes, Inc., and Strategic Business Advisors Ltd. Rapid Assessment and Categorization of Dairy Subsector Associations.
22. United States Agency for International Development, Land O’Lakes, Inc., and Strategic Business Advisors Ltd. Market Survey on Milk And Milk Related Products.
23. United States Agency for International Development and Land O’Lakes, Inc. 2010. Consumer Milk Quality Perception/Preferences and an Assessment Of Willingness To Pay For Quality.
24. United States Agency for International Development, Land O’Lakes, Inc., and Analysis Fibec Ltd. 2008. Milkshed Assessment and Small Business Organizations Needs.
25. United States Agency for International Development and Land O’Lakes, Inc. 2010. Financial Facilitation and Financial Product Development with Family Bank’s Financial Products and Services in Lessos Milkshed.
26. United States Agency for International Development and Land O’Lakes, Inc. 2010. Market Survey on Milk and Milk Related Products Focus Group Discussions.
27. United States Agency for International Development and Land O’Lakes, Inc. 2010. Market Survey on Milk and Milk Related Products Retail Audit.
28. United States Agency for International Development, Land O’Lakes, Inc., and DevInsight Consultants. 2010. Annual Survey Final Report.
29. United States Agency for International Development, Land O’Lakes, Inc., and Development Services Ltd. (SMAED Services Ltd.). 2012. Farm Level Survey to Determine the Level of Attainment of Program Goals Final Report.
30. United States Agency for International Development and Land O’Lakes, Inc. 2008. Baseline Assessment Report.
31. United States Agency for International Development, Land O’Lakes, Inc., and Davina and Qualispess Consultancy. Annual Survey Final Report.

78
32. United States Agency for International Development and Land O’Lakes, Inc. 2008. Kenya Dairy Sector Competitiveness Program Performance Management Plan (PMP).
33. United States Agency for International Development and Land O’Lakes, Inc. 2012. Kenya Dairy Sector Competitiveness Program Performance Management Plan (PMP).
34. United States Government. 2011. Feed the Future Kenya Multi–Year Strategy 2011-2015. 35. United States Agency for International Development and Development & Training
Services, Inc. 2012. Compendium Report Multi–Stakeholder Evaluation of Agriculture and Livestock Value Chain Activities in Kenya.
36. United States Agency for International Development and Agland Investment Services, Inc. 2005. Strategic Objective 7 Evaluation Synthesis Report.

79
ANNEX F. STATEMENT OF WORK

80
EXECUTIVE SUMMARY
This performance evaluation will examine the Kenya Dairy Sector Competitiveness Program (KDSCP), which is implemented by Land O'Lakes from May, 2008, to April, 2013, with a budget of $9 million in the Central and Rift Valley. Under USAID Strategic Objective 7, the program aims to increase smallholder household income through the sale of quality milk. It also integrates gender equity, sustainable resource management and utilization, and youth among the cross-cutting themes. A final performance evaluation will be conducted by Management Systems International (MSI) that will examine performance from May 1, 2008, to date. Relevant lessons learned from this evaluation will be applied to work planning and development of the new Kenya Agriculture Value Enterprises (KAVES) project. The primary audience of the evaluation is USAID, as well as key dairy stakeholders (Ministry of Agriculture, private sector, partners, and service providers), relevant partners, and the Agricultural Donor Working Group. The evaluation seeks to answer the following questions:
1) To what extent did KDSCP meet the intended goal? If the goal was not achieved, why not?
2) What were the internal and external enabling factors that contributed to meeting (or not meeting) the intended goal?
3) What is the evidence concerning the sustainability of the end results produced by this program?
4) To what extent did the program employ new approaches?
5) To what extent were environmental compliance mitigation measures identified at the commencement of the project, including practical the recommendations of the Pesticides Evaluation Reports and Safe Use Action Plans (PERSUAPs), effectively implemented?
The data collection and analysis uses a mix of quantitative and qualitative methods to answer the questions. Data collection methods include: desk review, survey of randomly selected farmer beneficiaries of the eight milksheds, key stakeholder interviews, focus group discussions, and site visits to four milksheds. Data analysis will employ various techniques including contribution analysis, comparison and trend analysis, frequency distributions and cross tabulations, as appropriate for the data collected. The two-person evaluation team consists of one international Evaluation Technical Expert as the team leader and one national Sectoral Expert. A research firm will serve to conduct the survey and support the focus group discussions. The evaluation will begin April 15, 2013, and the final report is expected by July 8, 2013.

81
1. BACKGROUND INFORMATION AND DEVELOPMENT HYPOTHESIS
IDENTIFYING INFORMATION
1. Program: Economic Growth
2. Project: Kenya Dairy Sector Competitiveness Program (KDSCP)
3. Award Number: 623–C–00–08–00020–00
4. Award Dates: May 1, 2008, to April 30, 2013
5. Funding: $9,000,000
6. Implementing Organization: Land O’Lakes
7. Contracting Officer’s Representative (COR): Julius Kilungo
8. Type of Evaluation: Final Performance Evaluation
9. Period to be evaluated: May 1, 2008, to date
DEVELOPMENT CONTEXT
PROBLEM OR OPPORTUNITY ADDRESSED
KDSCP builds on the experiences and achievements of the USAID Kenya Dairy Development Program (KDDP: 2001–07) and the recommendations of the USAID/Kenya-supported dairy assessment exercise undertaken in November 2005 and further refined in 2006.§§§§ The KDDP focused on productivity and markets, market development and trade, business development services, and producer/trade organizations. According to USAID, KDSCP attempts to build on the gaps in the KDDP by addressing the process and provision of quality milk along the production line and value chain in order to increase smallholder household income in the dairy sector. TARGET AREAS AND GROUPS
KDSCP has been implemented in eight milksheds in Central and Rift Valley, which account for an estimate 80 percent of all processed milk in Kenya. Project reports indicate that these eight milksheds can competitively deliver 50, 0000–100,000 liters of quality milk per day of quality milk to processors. As of February 2012, Land O'Lakes stated that they have benefited 327,000 rural households over the course of the project.
§§§§ Strategic Objective 7: Evaluation Synthesis Report, Contract 623-O-00-05-003000-00, July 2005.

82
Figure 1: Map of KDSCP Project Sites
INTENDED RESULTS
KDSCP falls under the USAID/Kenya’s Economic Growth program, which is part of three larger U.S. government initiatives: the Initiative to End Hunger in Africa (IEHA), the African Global Competitiveness Initiative (AGCI), and the Feed the Future (FtF) initiative. Under FtF, USAID/Kenya’s agricultural program has focused on market-led, value chain development targeting maize and other selected staples, dairy (including KDSCP), and horticulture. It also integrates gender equity, sustainable resource management and utilization, and youth among the cross-cutting themes. KDSCP has three objectives: • Increase competitiveness of the Kenyan dairy sector through collaboration among sector stakeholders and
increased capacity of public sector agencies to serve the needs of the sector. • Increase marketing of milk meeting quality standards by producer-owned milk bulking/cooling businesses. • Enhance access to market-linked business development services and technologies by male and female dairy
farmers and processors producing dairy-related inputs.
Achievement of the project's objectives was expected to feed into the program’s larger goal: increase smallholder household income from the sale of quality milk. APPROACH AND IMPLEMENTATION
According to USAID, KDSCP follows a value chain approach, focused on competitiveness—that is, improving productivity without additional cost to the farmer in order to increase household incomes. The program seeks to improve links in the value chain and professionalize and formalize the industry. As such, KDSCP applies the development theory that strengthening the nodes of the dairy sector value chain will lead to an increase in smallholder household incomes by the sale of quality milk.
Milkshed sites visited by evaluation team
Non-visited Milkshed sites

83
Program documentation states that the program pays particular attention to environmental and gender concerns, taking into account the varying roles, assets, knowledge, and skills that men, women, and youth bring to dairy farming. In doing so, KDSCP attempted to facilitate opportunities for integrating youth and family members into dairy value chain economic activities. The program includes three components and their related "deliverables" and "outcomes," listed below. These activities have been organized by Land O'Lakes into a casual model that is found in Annex D. Component 1: Enhanced Capacity for Milk and Production Input Quality Certification and Market Promotion Deliverables include:
• Increased smallholder household income • Increased use of technology • Improve and enact industry policies and acts that enhance competitiveness • Develop and implement/enforce quality certification frameworks and work towards a graded payment
system • Dairy enterprises achieve national/international certifications and enforcing quality regulations on suppliers • Increase feed marketed under new quality standards
Component 2: Dairy Smallholder Business Organization (SBO) Development The key deliverables are:
• Producer organizations strengthened • Increased number of SBOs with national/international certifications (modified to Increased number of milk
bulking centers (MBC) with Hazard Analysis and Critical Control Points (HACCP) and/or SBOs with national certifications in 2010 and 2011)
• Increased gross revenue of milk bulking/cooling businesses from sale of inputs and services other than milk (added in 2010 and 2011)
• Increased raw milk sales by SBOs under agreements that pay premium for quality • Increased number of SBOs transformed into sustainable businesses • Increased number of cooling units installed/rehabilitated by SBOs
Component 3: Availability of Dairy Business Development Services Outcomes are:
• Enhanced range of business services to producers • Increased value of services/inputs provided by business service providers • Increased number of smallholders purchasing private sector services at full commercial rates • New technologies or management practices made available for transfer • Increased number of dairy farmers receiving loans from financial service providers • Increased number of smallholders engaged in new, diversified dairy-related enterprises • Increased number of dairy farmers receiving short-term training
EXISTING DATA
The following is a list of collected documentation shared by USAID and Land O'Lakes and can be found online. This should not be considered exhaustive for the purposes of the document review of the evaluation.
• Annual Workplans: 2009–2010, 2010–2011, 2011–2012, 2012–2013 • Annual Progress Reports: June–Sept 2008, Oct 2008–Sept 2009, Oct 2010–Sept 2011 • Project Proposal • SO7 Activity Approval Document • KDSCP Baseline Assessment, November 2008 • Amendments: March 2009; Dec 2009 (increase 2 mil - 5 mil); May 2011 (increase 6.5 mil to 8 mil); May
2012 (8 mil to 9 mil) • Business Development Services (BDS) Market Diagnostic, BDS Needs Analysis and Intervention Design
for Lessos, Trans Nzoia and Nyeri Milksheds, May 2009 (Land O'Lakes) • BDS Market Diagnostic, BDS Needs Analysis and Intervention Design, March 2009 (Land O'Lakes) • Ministry of Livestock Development: Dairy Farmers Training Manual, January 2012

84
• Kenya National Dairy Master Plan: Volume I: A Situation Analysis of the Dairy Subsector; Volume II: Action Plan and Implementation Strategy, August 2010
• Farm-level Survey to determine the level of attainment of Program Goals, April 2011 (2012) (SMAED Services)
• Cooperatives Performance Assessment and Action Planning (date?) (Spantrack Consultants) • Feed the Future: Kenya, FY 2010 Implementation Plan, USG Working Document • Feed the Future: Kenya, Multi-year strategy 2011-2015 • Modified Acquisition and assistance Request Document, April 15, 2011 • Modified Acquisition and assistance Request Document, November 30, 2009 • Market Survey on Milk and Milk Related Products (Strategic Business Advisors) • Consumer Milk Quality Perception/Preferences and an assessment of willingness to pay for quality, 2010
(ESADA) • Multi-stakeholder evaluation of agriculture and livestock value chain activities in Kenya, March 2012 (dTS)
and WO Proposal • Land O'Lakes Performance Management Plan, July 2012 • Quarterly Progress Report, Jan 2012–March 2012 • Milkshed Assessment and Small Business Organization Needs Analysis, Oct 2008 (Finbec) • RFP Financial Facilitation, Financial Product Development with Family Bank's Financial Products and
Services in Lessos Milkshed, March 2010 • Market Survey on Milk and Milk Related Products: Focus Group Discussions, 2010 (SBA) • Market Survey on Milk and Milk Related Products: Retail Audit, 2010 (SBA) • SO7 Evaluation Synthesis Report, July 2005 (Agland Investment Services) • Rapid Assessment and Categorization of Dairy Subsector Associations, 2009 (SBA) • Pesticide Evaluation Report & Safer Use Action Plan, June 2008 (Sustainability Ltd.) • Dairy Value Chain Competitive Assessment and Action Plan Development, (SBA) • Performance Management Plan June 2008 • TAGEMEO, Household Indicator Survey, 2010 • Performance Indicator Reference Sheets: 2009, 2010 • M&E Plan PowerPoint Presentation
2. EVALUATION RATIONALE
2.1 EVALUATION PURPOSE
MSI shall conduct a required final performance evaluation of the Kenya Dairy Sector Competitiveness Program which is in its final year and ends on 30th April, 2013. The period to be evaluated is from May 1, 2008, to date. Strengthening the dairy sector is a component of the new KAVES program, implemented by Fintrac. Relevant lessons learned from this evaluation will be applied to work planning and development of the new program. Recommendations should target USAID, with consideration of the new partnership with Fintrac. 2.2 AUDIENCE AND INTENDED USE
The primary audience of the evaluation is USAID (ABEO and Washington), as well as key dairy stakeholders (Ministry of Agriculture, private sector, partners, service providers), relevant partners (Fintrac, KARI), and the Agricultural Donor Working Group. 2.3 EVALUATION QUESTIONS
The evaluation will answer the following overarching questions: 1. To what extent did KDSCP meet the intended goal? If the goal was not achieved, why not?

85
2. What were the internal and external enabling factors that contributed to meeting (or not meeting) the intended goal?
3. What is the evidence concerning the sustainability of the end results produced by this program?
4. To what extent did the program employ new approaches?
5. To what extent were environmental compliance mitigation measures identified at the commencement of the project, including practical the recommendations of the Pesticides Evaluation Reports and Safe Use Action Plans (PERSUAPs), effectively implemented?
Gender will be viewed as a cross-cutting theme to be explored where appropriate throughout answering the evaluation questions (particularly, question 1, 2, 3, and 4). The evaluation team is expected to be responsive to USAID's dual expectations for treating gender appropriately: a) gathering sex disaggregated data and b) identifying gender differential participation in/benefits from aspects of the program where differences on this basis are possible. In answering the questions, the evaluation team will put attention towards highlighting relevant lessons for the future KAVES project. Towards that end, the evaluation team will review the initial KAVES project documents and interview USAID and Fintrac to better understand the relevancy of lessons for KAVES. 3. EVALUATION DESIGN AND METHODOLOGY
3.1 EVALUATION DESIGN
The evaluation is expected to gather and use evidence to both answer the evaluation questions above and: 1. Document the degree to which USAID-funded KDSCP interventions through Land O’Lakes achieved its
planned "results" 2. Determine to what extent KDSCP added value to strengthening the dairy sector 3. Identify best practices, lessons learned, and areas of improvement for future program 4. Provide objective recommendations on strategic areas for follow up interventions in the Feed the Future
(FtF) Initiative’s Kenya Agriculture Value Chain Enterprises (KAVES), Resilience and Economic Growth in Arid Lands-Accelerated Growth (REGAL-AG), and other FtF programs.
It should be understood that the four elements above are not additional questions but should rather guide the evaluation team with respect to expectations about the kinds of information to include in answers to evaluation questions and in other sections of the report, for example, recommendations, lessons learned. The evaluation team is expected to use well-developed data collection and analysis methods to address each of USAID’s evaluation questions. A preliminary version of a matrix for associating data collection and analysis methods with evaluations questions (Getting to Answers) provided in Annex C shares with the evaluation team the initial thinking about appropriate methodological choices. The evaluation team is expected to review and refine this methodology, or suggest higher quality alternatives that could be employed at no additional cost beyond what USAID has allotted for this evaluation. Details the evaluation team adds to this preliminary plan for gathering and analyzing data on each evaluation question should be submitted to USAID for review/approval as part of the evaluation team’s Methodology and Workplan (Section 4.1). To expound on the evaluation questions: For question 1 and 2, the evaluation will be examining whether and how KDSCP was able to meet the overall goal by considering the stated outcome (by component) and impact as described in the project causal model. While the evaluation will need to review delivery of outputs and activities as part of the evaluation process, the focus in the report will be on outcomes and achievement of the goal. For question 3, USAID considers sustainability of the project as capacity built (institutional and farmer level) due to the program and whether the achievements of the program in relation to strengthening the value chain will be ongoing after the program comes to its completion.

86
Greater clarity and definition of the terms will occur during the team planning meeting at the beginning of the evaluation. 3.2 DATA COLLECTION METHODS
Some key aspects of the data collection are the following: Survey
• USAID expressed interest in verify the baseline assessment because it was conducted by Land O'Lakes. After review of the baseline report, it was found to too challenging to verify data collected by revisiting respondents because information, such as 2008 sales data, reported by a farmer would be difficult to recall now. It may be possible to review of existence of any independent data from that period that could be used to verify the baseline as the baseline does draw on some external data. Because a verification process will not be entirely possible, additionally questions will be added to the survey to gauge change over time.
• The survey will include a random sampling of 320 farmers (the sample size of the original baseline, 90–95 percent confidence level) in the eight selected milksheds. The number of farmers randomly selected per milkshed will follow probability proportional to size of the number of farmers associated with that milkshed (i.e. if a certain milkshed has a larger number of beneficiaries, than a larger pool of farmers will be sampled in that milkshed). Conduct of the survey will begin prior and run concurrently with the data collection and site visits of the evaluation team.
• Survey data will be analyzed primarily using descriptive statistics (frequency distributions, cross tabulations – of the demographic data against the substantive data to determine if any characteristics are statistically significant.
Focus Group Discussions (FDGs)
• FDGs will provide qualitative data to enhance the quantitative data collected in the survey. The FDGs will attempt to tease out the context and help answer the "why" for how results were achieved. A FGD transcript is required for each focus group and will be completed. Three different FDGs are planned:
• FGD of the eight Milkshed Coordinators: all Milkshed Coordinators/Facilitators will come to Nairobi to participate in the FDG lead by the evaluation team. This FGD should occur early in the data collection phase.
• FGD of SBO Chairmen for each of the visited milksheds (four FGDs total): representation from at least five SBOs required for each milkshed.
• FGD of men and women farmers for each visited milkshed (four FDGs total): farmers (50 percent men and 50 percent women) will be randomly selected from the list of milkshed beneficiaries. The FGD will divide the farmers by gender in order to discuss and probe on program outcomes on gender dynamics and relationships.
Key Informant Interviews
• The evaluation team will interview a purposively selected set of key stakeholders, including USAID, Land O'Lakes, Government of Kenya, Diary Board, service providers, associations, breeder associations, and other partners. A semistructured interview tool will be developed to ensure adequacy of questions and comparability across interviews.
Data Mining • The evaluation team will gather secondary data sources on dairy productivity, sales, milk quality, etc. from
Land O'Lakes and other independent sources to verify and triangulate findings emerging from primary data collection in the data analysis phase.
Site Visits • The evaluation team will visit four of the eight milksheds as part of its qualitative data collection. Sample
selection is described below. The site visits will allow for the evaluation to interview milkshed staff,

87
farmers who specialize in demos, A/I or other technologies, and conduct focus groups with Small Business Organizations (SBO) leaders.
Observation • The team will have the opportunity to observe milkshed functions during site visits. Observation will also
be used to complete the environmental compliance checklist tool to be developed.
Sample Selection of Milksheds • The Statement of Objectives called for visiting four milksheds. Because the data collected will not be
looking at the entire population engaged in the project, findings and conclusions drawn from the four sites cannot be fully generalized, but rather serve as illustrative of the project. The evaluation will use a combination purposeful sampling of the milksheds that considers maximum variation and examines a specific set of relevant parameters, including: geography, productivity potential and proximity to markets. Also, a sample of one milkshed affected by post-election violence shall be included. Based on these criteria, MSI has selected the following milksheds*****:
Geography Proximity to
Markets Productivity
Potential Affected by
PEV Nyeri Central Close High No Nakuru S. Rift Valley Close Medium No Lessos N. Rift Valley Far High Yes Gatanga Central Close Medium No
***** The milkshed characteristics were provided by Land O'Lakes by the request of MSI. The selection of the criteria and the final selection of milksheds were completed by MSI without the input of Land O'Lakes.

88
3.3 DATA ANALYSIS METHODS
Contribution Analysis
• Given the multiplicity of factors and other operating actors, impact attribution—even while examining outcome and impact level indicators—will be difficult, especially when the program is not experimental. Contribution analysis will be particularly important for answering questions one and two. This method of analysis will serve to better understand the role KDSCP played in achieving (or not achieving) the desired outcomes and meeting the goal.* The evaluation team will systematically review information gathered in the course of the evaluation, and sometimes supplement it through late-in-study interviews, concerning factors in the operating environment that may also have contributed to change.
Content Analysis
• Qualitative data will be used to examine for patterns so that comparisons can be made between respondents and sites. This will involve broad patterns and a more detailed examination of how different respondents answered the same question, for example, among different service providers (farm level and business level) and government stakeholders. As the numbers of individuals and sites involved in this evaluation is relatively small, MSI will not use qualitative analysis software but will instead review interview notes by hand to code patterns of response across individuals or groups.
Comparison
• The evaluation team will document trends and break segments of the project timeline for “before and after” comparisons to gather how the program has changed and/or impacted the dairy sector and rural households involved in the dairy sector over time.
Stakeholder Workshop • The stakeholder workshop will take place towards the end of the data collection and analysis phase. It will
serve as an opportunity to validate emerging findings, provide clarifications to data gaps, and explore jointly potential recommendations to be included in the evaluation report. Participants in the stakeholder workshop include: USAID, Land O'Lakes, Fintrac, and possibly KDSCP beneficiaries (who are close in proximity).
3.4 METHODOLOGICAL STRENGTHS AND LIMITATIONS
The evaluation benefits from using mixed methods for both data collection and analysis. The collection of primary data at the beneficiary, milkshed, service provider, and partner level enables the evaluation team to more accurately capture the results of program implementation over time. The data will serve to help the team better
*Causality is inferred from the following evidence: 1) the program is based on a reasoned theory of change: the assumptions behind why the program is expected to work are sound, are plausible, and are agreed upon by at least some of the key players; 2) The activities of the program were implemented; 3) The theory of change is verified by evidence: the chain of expected results occurred; 4) Other factors influencing the program were assessed and were either shown not to have made a significant contribution or, if they did, the relative contribution was recognized." Mayne, John, ILAC Brief 16, May 2008

89
understand and extrapolate the contribution of the program to meeting outcome and impact level indicators. Secondary data will also help triangulate and validate the findings emerging from the primary data collection. MSI has learned that the baseline was conducted prior to the 2007–08 post-election violence. The violence affected two of milksheds, whereby the baseline assessment does not accurately capture the actual situation of when the program initiated. This has implications for the accuracy and relevancy of assessing pre- and post- data. The survey will try to capture change over time which will help mitigate this limitation. Land O'Lakes collects data against their PMP twice a year in August and February. This maintains consistency across years in the dry season for the level of productivity. The farm-level survey, which is planned for April/May, will be conducted during a different part of the season, affecting the levels of productivity. This will have implications for comparison to baseline and midline assessments, and will need to be considered during analysis. The distance between farmers in the milkshed areas may cause some logistical challenges and extra effort and time will be required to ensure proper coordination and best use of time during the site visits. MSI will coordinate as much as possible with Land O'Lakes and the milkshed coordinators to be as efficient and economical in planning the data collection. 4. EVALUATION PRODUCTS
4.1 DELIVERABLES
Assuming the start date stated in the SOW, the evaluation team will be responsible for delivering on time and of quality the following products:
April 22-25 Team Planning Meeting (TPM): The four-day TPM will be held in MSI offices once the evaluation team is in country. It is expected that USAID and Land O'Lakes will be engaged with this process. The outcomes of this meeting include:
• Clarify team members' roles and responsibilities; • Establish a team atmosphere, share individual working styles, and agree on
procedures for resolving differences of opinion; • Review the final evaluation questions; • Review and finalize the assignment timeline and share with USAID; • Develop data collection methods, instruments, tools, and guidelines; • Review and clarify any logistical and administrative procedures for the
assignment; • Develop a preliminary draft outline of the team's report; and • Assign drafting responsibilities for the final report.
April 26 Workplan and Methodology: During the TPM, the team will prepare a detailed work plan
which will include the methodologies (evaluation design, tools) and operational workplan to be used in the evaluation. This will be discussed with USAID prior to submission and implementation.
June 4 Presentation with USAID and Partners: The evaluation team will present the major
findings of the evaluation to USAID and partners in a PowerPoint presentation. The presentation will follow a similar structure to the final report and present major findings, conclusions, and recommendations. USAID and partners will have an opportunity to comment and provide input as part of the presentation. The team will consider the comments and revise the draft report accordingly, as appropriate.
June 13 Draft Evaluation Report: A draft report will be submitted to MSI prior to team leader
departure. The written report should clearly describe findings, conclusions, and recommendations, fully supported by triangulated evidence. USAID will provide comments on the draft report within two weeks of submission.

90
July 8 Final Evaluation Report: The team will submit the final report that incorporates the team responses to Mission comments and suggestions. The format will adhere to the standard reporting guidelines listed in 4.2. The team shall provide to USAID a weekly report of ongoing activities during the course of the evaluation describing the process, any issues encountered, and relevant emerging findings. The evaluation report will adhere to USAID Evaluation Policy and as such all raw quantitative data will need to be shared with USAID. Qualitative data will also be shared, if specifically requested by USAID. 4.2 REPORTING GUIDELINES
The format for the evaluation report shall be as follows, and the report should be a maximum of 25 pages not including annexes. The report format should be restricted to Microsoft products and 12-point font should be used throughout the body of the report, with 1” page margins. Four bound hard copies shall be submitted, and an electronic copy in MS Word. In addition, all data collected by the evaluation shall be provided to USAID in an electronic file in an easily readable format; organized and fully documented for use by those not fully familiar with the project or the evaluation. If the report contains any potentially procurement sensitive information, a second version report excluding this information shall be submitted (also electronically, in English).
a. Executive Summary—concisely state the most salient findings and recommendations (3 pgs.); b. Table of Contents (1 pg.) c. Evaluation Purpose and Evaluation Questions—purpose, audience, and synopsis of task (1 pg.) d. Project Background—brief overview of development problem, USAID project strategy and activities
implemented to address the problem, and purpose of the evaluation (2-3 pgs.) e. Evaluation Questions, Design, Methods, Limitations—describe evaluation methods, including
constraints and gaps (1 pg.) f. Findings/Conclusions/Recommendations—for each evaluation question (10-15 pgs.) g. Lessons Learned—any pertinent lessons for the overall purpose and audience of the evaluation (1-2
pgs.) h. Annexes that document the evaluation methods, schedules, interview lists and tables should be succinct,
pertinent and readable. These include references to bibliographical documentation, meetings, interviews, and focus group discussions.
5. TEAM COMPOSITION
The evaluation team will be composed of two evaluators along with an independent survey firm to undertake the survey and support the group discussions in the field. The following qualifications are sought for the evaluators: International Evaluation Team Leader
• 10+ years of USAID evaluation experience and leading evaluation teams • Advanced degree (Ph.D, MSs or equivalent) in relevant field • Demonstrated evaluation design experience, including the selection of appropriate data collection and
analysis methods (both qualitative and quantitative) on a question specific basis and development of a detailed data analysis plan
• Experience with and ability to apply a range of data collection and analysis methodologies (qualitative and quantitative) covered by USAID TIPS
• Strong understanding of USG Agriculture initiatives, including experience with the Feed the Future Strategy
• Demonstrated management and leadership skills • East Africa experience also a plus
National or Regional Agricultural Economics Expert
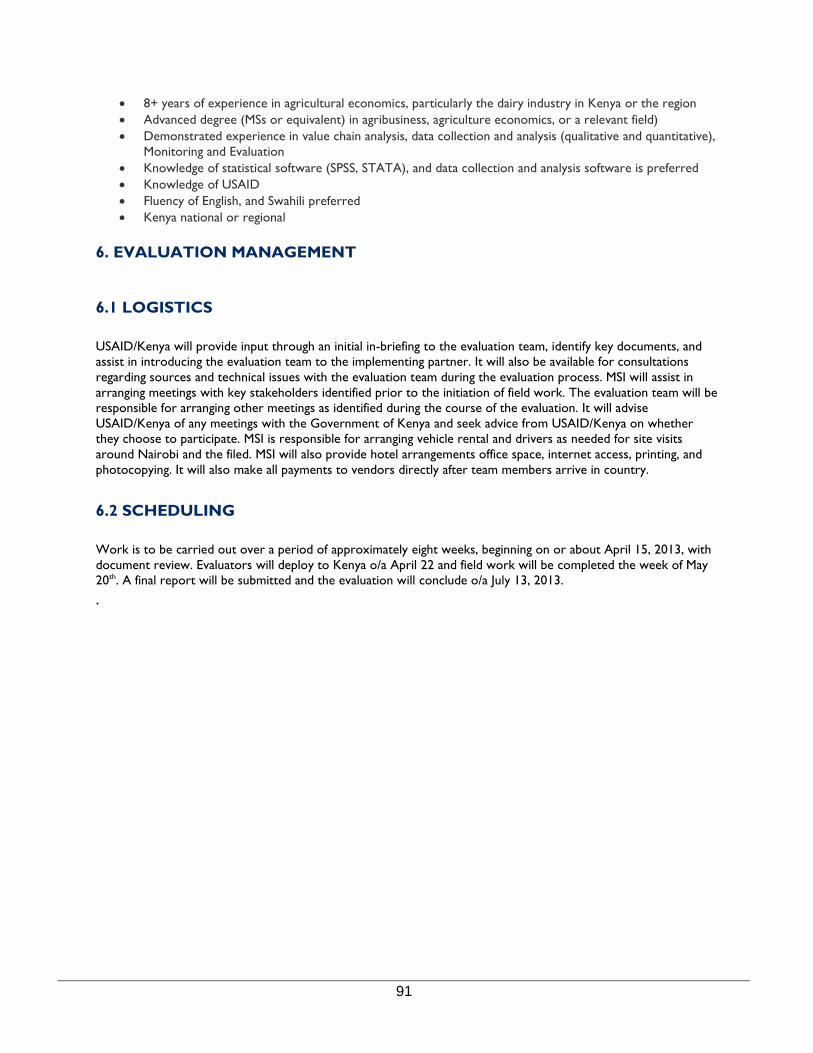
91
• 8+ years of experience in agricultural economics, particularly the dairy industry in Kenya or the region • Advanced degree (MSs or equivalent) in agribusiness, agriculture economics, or a relevant field) • Demonstrated experience in value chain analysis, data collection and analysis (qualitative and quantitative),
Monitoring and Evaluation • Knowledge of statistical software (SPSS, STATA), and data collection and analysis software is preferred • Knowledge of USAID • Fluency of English, and Swahili preferred • Kenya national or regional
6. EVALUATION MANAGEMENT
6.1 LOGISTICS
USAID/Kenya will provide input through an initial in-briefing to the evaluation team, identify key documents, and assist in introducing the evaluation team to the implementing partner. It will also be available for consultations regarding sources and technical issues with the evaluation team during the evaluation process. MSI will assist in arranging meetings with key stakeholders identified prior to the initiation of field work. The evaluation team will be responsible for arranging other meetings as identified during the course of the evaluation. It will advise USAID/Kenya of any meetings with the Government of Kenya and seek advice from USAID/Kenya on whether they choose to participate. MSI is responsible for arranging vehicle rental and drivers as needed for site visits around Nairobi and the filed. MSI will also provide hotel arrangements office space, internet access, printing, and photocopying. It will also make all payments to vendors directly after team members arrive in country.
6.2 SCHEDULING
Work is to be carried out over a period of approximately eight weeks, beginning on or about April 15, 2013, with document review. Evaluators will deploy to Kenya o/a April 22 and field work will be completed the week of May 20th. A final report will be submitted and the evaluation will conclude o/a July 13, 2013.
.

92
ANNEX G. WORK SCHEDULE OF FARMER SURVEY

93
April 2013
SUNDAY MONDAY TUESDAY WEDNESDAY THURSDAY FRIDAY SATURDAY
31 1 2 3 4 Contracting and commissioning
5 Inception meeting 6
TNS/MSI TNS/MSI/LOL
7 8 Inception meeting 9 Develop quant data
collection instrument
10 Develop quant
data collection instrument
11 submit draft
survey instrument to MSI
Submit detailed work plan
12 Submit draft
survey instrument 13
TNS/MSI/USAID
14 15 Receive feedback
and finalize survey instrument
16 Submit final
survey instrument
Approval of final document
17 18 Pretest survey.
Finalize instrument based on pretest feedback
19 survey approved
by MSI.
Scripting of survey (Eng),
Translation of survey to
20
21 22 Scripting of
survey. Developing Show cards and training materials. Confirming training venue.
Participate in team planning meeting
23 finalizing and
testing script. Printing of relevant materials for training. Regional teams arrive in Nairobi.
Participate in team
24 Interviewer
training – study Introduction, survey read around; question by question.
Participate in team planning meeting
25 Interviewer
training; exercises and role- playing (partners), using PDA.
26 Interviewer
training – pilots in the morning. (Kabete Milkshed)
Afternoon; debrief Discuss logistics with team leaders.
27 Teams travel back
to regions.
28 29 Quant; Meeting
SBO chairpersons, data collection begins in all 8 milksheds. Qual; briefing of recruiters
30 Quant; data
collection.
Qual; recruitment
1 Holiday – May 1 2 Quant; data
collection.
Qual; recruitment
3 Quant; data
collection.
Qual; recruitment
4 Quant; data
collection.
Qual; recruitment
May 2013

94
SUNDAY MONDAY TUESDAY WEDNESDAY THURSDAY FRIDAY SATURDAY
5 6 Quant; data
collection.
Qual; FGDs
7 Quant; data
collection.
Q l it t
8 Quant; data
collection.
Q l it t
9 Quant; data
collection.
Q al it t
10 Quant; data
collection.
Qual; recruitment, translation and transcription of discussions
11 Quant; data
collection.
Qual; recruitment, translation and transcription of discussions
12 13 Quant; data
collection.
Qual; recruitment, translation and
14 Quant; data
collection.
Qual; recruitment, translation and
15 Quant; data
collection.
Qual; recruitment, translation and
16 Quant; data
collection.
Qual; recruitment, translation and
17 Quant; data
collection.
Qual; recruitment, translation and
18 Quant; data
collection.
Qual; recruitment, translation and
19 20 Quant; data
collection.
Qual; recruitment, translation and transcription of
21 Quant; data
collection.
Qual; recruitment, translation and transcription of
22 Quant; data
cleaning and tabulation.
Qual; translation and transcription of discussions
23 Quant; data
cleaning and tabulation.
Qual; translation and transcription of discussions
24 Quant; data
cleaning and tabulation.
Q l t l ti d
25 Quant; data
cleaning and tabulation.
Qual; translation and transcription of discussions
26 27 Submit raw data,
final data processing report, and final field technical report
28 Qual; translation
and transcription of discussions
29 Qual; submit final
transcripts 30 31 1

95
ANNEX H. WORK SCHEDULE OF THE EVALUATION TEAM

WORK SCHEDULE TEAM LEADER AND AGRICULTURAL ECONOMIST – OPEN-ENDED INTERVIEWS AND FOCUS GROUP DISCUSSIONS
96
April 2013
SUNDAY MONDAY TUESDAY WEDNESDAY THURSDAY FRIDAY SATURDAY
31 1 2 3 4 5 6
7 8 9 10 11 12 13
14 15 Review
background material 16 Review
background material 17 Review
background material 18 Review
background material 19 Review
background material 20 Team Leader
travels to Nairobi
Home Travel Travel Nairobi Nairobi Nairobi
21 Team Leader
travels to Nairobi
22 Team planning
meeting; meet with USAID
23 Team planning
meeting; meet with TNS
24 Team planning;
develop methodology and work plan
25 Meeting w/LOL;
finalize data collection instruments; Submit work plan
26 Out-briefing with
USAID and MSI 27 submit final
inception report
Nairobi Nairobi Nairobi Nairobi Nairobi Nairobi Nairobi
28 29 Open-ended
interviews Nairobi 30 Open-ended
interviews Nairobi; meet milkshed group
1 2 3 4
Nairobi Nairobi Nairobi
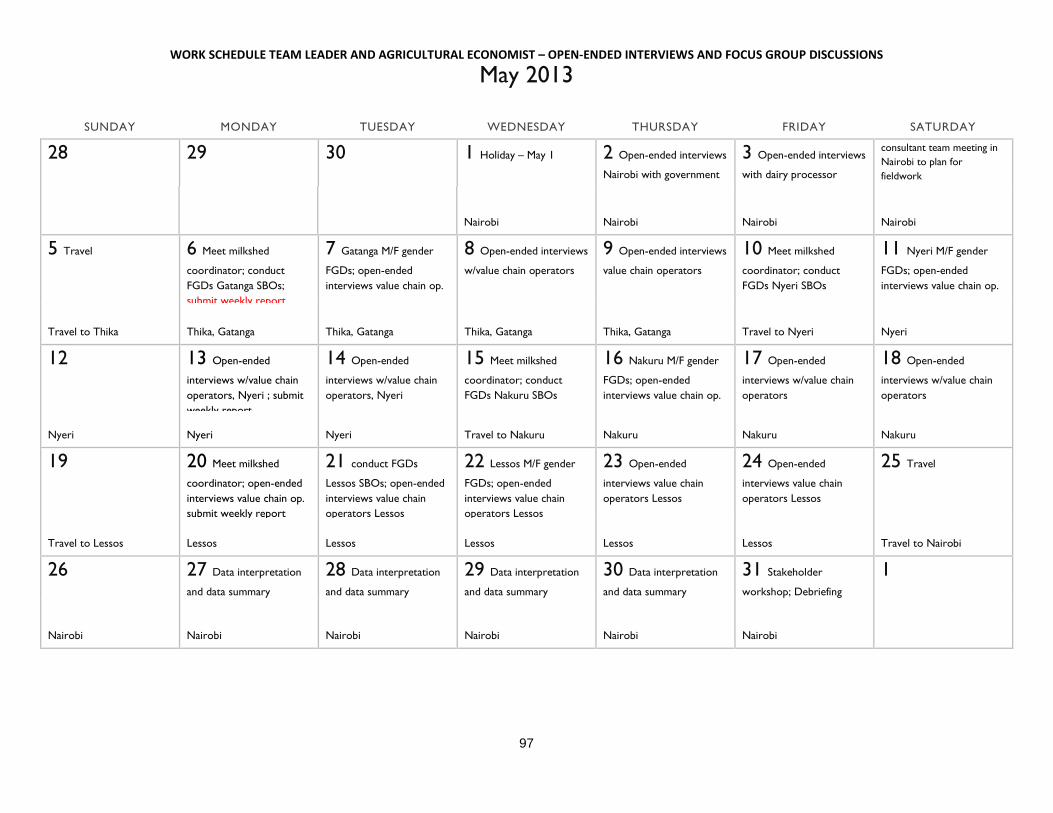
WORK SCHEDULE TEAM LEADER AND AGRICULTURAL ECONOMIST – OPEN-ENDED INTERVIEWS AND FOCUS GROUP DISCUSSIONS
97
May 2013
SUNDAY MONDAY TUESDAY WEDNESDAY THURSDAY FRIDAY SATURDAY
28 29 30 1 Holiday – May 1 2 Open-ended interviews
Nairobi with government 3 Open-ended interviews
with dairy processor consultant team meeting in Nairobi to plan for fieldwork
Nairobi Nairobi Nairobi Nairobi
5 Travel 6 Meet milkshed
coordinator; conduct FGDs Gatanga SBOs; submit weekly report
7 Gatanga M/F gender
FGDs; open-ended interviews value chain op.
8 Open-ended interviews
w/value chain operators
9 Open-ended interviews
value chain operators 10 Meet milkshed
coordinator; conduct FGDs Nyeri SBOs
11 Nyeri M/F gender
FGDs; open-ended interviews value chain op.
Travel to Thika Thika, Gatanga Thika, Gatanga Thika, Gatanga Thika, Gatanga Travel to Nyeri Nyeri
12 13 Open-ended
interviews w/value chain operators, Nyeri ; submit weekly report
14 Open-ended
interviews w/value chain operators, Nyeri
15 Meet milkshed
coordinator; conduct FGDs Nakuru SBOs
16 Nakuru M/F gender
FGDs; open-ended interviews value chain op.
17 Open-ended
interviews w/value chain operators
18 Open-ended
interviews w/value chain operators
Nyeri Nyeri Nyeri Travel to Nakuru Nakuru Nakuru Nakuru
19 20 Meet milkshed
coordinator; open-ended interviews value chain op. submit weekly report
21 conduct FGDs
Lessos SBOs; open-ended interviews value chain operators Lessos
22 Lessos M/F gender
FGDs; open-ended interviews value chain operators Lessos
23 Open-ended
interviews value chain operators Lessos
24 Open-ended
interviews value chain operators Lessos
25 Travel
Travel to Lessos Lessos Lessos Lessos Lessos Lessos Travel to Nairobi
26 27 Data interpretation
and data summary 28 Data interpretation
and data summary 29 Data interpretation
and data summary 30 Data interpretation
and data summary 31 Stakeholder
workshop; Debriefing 1
Nairobi Nairobi Nairobi Nairobi Nairobi Nairobi

WORK SCHEDULE TEAM LEADER AND AGRICULTURAL ECONOMIST – OPEN-ENDED INTERVIEWS AND FOCUS GROUP DISCUSSION
98
June 2013
SUNDAY MONDAY TUESDAY WEDNESDAY THURSDAY FRIDAY SATURDAY
1 Prepare Debriefing
Nairobi
2 3 MSI Debriefing
Power Point Presentation dry run
4 refining the USAID
debriefing PowerPoint with MSI team
5 USAID Debriefing
Power Point Presentation
6 Write draft report 7 Write draft report 8 Write draft report
Nairobi Nairobi Nairobi Nairobi Nairobi Nairobi Nairobi
9 Team Leader
departs Kenya - submit draft report to MSI
10 Team Leader
arrives home 11 12 13 14 15
16 17 submit final draft
report to MSI 18 19 20 21 22
23 24 25 26 27 28 29
30 1 Team receives
USAID comments on draft report
2 Write final report 3 Write final report 4 Write final report 5 Write final report 6 Submit final report
Home Home Home Home Home Home

99
ANNEX I. KEY INFORMANTS INTERIEWED
PLACE OF INTERVIEW
NAIROBI
USAID/Kenya Joseph N. Mwangi, Ph.D Agricultural Development Officer, Agricultural, Business and Environment Office
USAID, US Embassy Complex Annex United Nations Avenue, Gigiri P.O. Box 629, Village Market 00621, Nairobi, Kenya
Tel. 254 (0) 20 862 2000; Fax 254 (0) 20 862 2680/1 Direct : 254 (0) 20 862 2337 Mob. 254 (0) 712 234 287 Email : [email protected]
Samson Okumu Food Aid Specialist, Agricultural, Business and Environment Office
USAID, US Embassy Complex Annex United Nations Avenue, Gigiri P.O. Box 629, Village Market 00621, Nairobi, Kenya
Tel. 254 (0) 20 862 2000; Fax 254 (0) 20 862 2680/1 Direct : 254 (0) 20 862 2702 Mob. 254 (0) 723 376 645 Email : [email protected]
Julius Kilungo, Ph.D. Program Specialist/Economist Agricultural, Business and Environment Office
USAID, US Embassy Complex Annex United Nations Avenue, Gigiri P.O. Box 629, Village Market 00621, Nairobi, Kenya
Tel. 254 (0) 20 862 2000; Fax 254 (0) 20 862 2680/1 Direct : 254 (0) 20 862 2215 Mob. 254 (0) 713 765 570; 254 (0) 734 968 404 Email : [email protected]
Charles Mandivenyi Project Officer, M&E and Learning
USAID, US Embassy Complex Annex United Nations Avenue, Gigiri P.O. Box 629, Village Market 00621, Nairobi, Kenya
Tel. 254 (0) 20 862 2000; Fax 254 (0) 20 862 2680/1 [email protected]
Patrick Boro Administrative Officer Agricultural, Business and Environment Office
USAID, US Embassy Complex Annex United Nations Avenue, Gigiri P.O. Box 629, Village Market 00621, Nairobi, Kenya
Tel. 254 (0) 20 862 2000; Fax 254 (0) 20 862 2680/1 [email protected]
Land O’Lakes International Development
Mary Munene Chief of Party
Peponi Plaza, Block A, 2nd Floor Off Peponi Road, Westlands P.O. Box 45006 00100 Nairobi, Kenya
Tel. +254 (0) 20 374 8526 ; +254 (0) 20 374 8685 (M) +254 (0) 722 809 709 [email protected]
Geophrey Sikey M&E Specialist
Peponi Plaza, Block A, 2nd Floor Off Peponi Road, Westlands P.O. Box 45006 00100 Nairobi, Kenya
Tel. +254 (0) 20 374 8526 ; +254 (0) 20 374 8685 (M) +254 (0) 721 171 586 ; (M) +254 (0) 722 517 149 [email protected]
TNS RMS East Africa Ltd.
Ms. Nkatha Mutiga Account Manager, Research and Insights
P.O. Box 72951-00200 Mpaka Road Westlands, Nairobi, Kenya
Tel. +254 (0) 20 4280 000 ; Fax +254 (0) 20 4280 888 DL +254 (0) 20 4280 376 ; Mob. +254 (0) 708 574 567 [email protected]

100
Ms. Purity Mwara Research Executive
P.O. Box 72951-00200 Mpaka Road Westlands, Nairobi, Kenya
Tel. +254 (0) 20 4280 000 ; Fax +254 (0)20 4280 888 DL +254 (0) 20 4280 372 ; Mob. +254 (0) 725 839 075 [email protected]
Management Systems International
Jino Meri Program Information Officer Kenya Program Support Project
Fedha Plaza, 5th Floor, Mpaka Road, Westlands, P.O. Box 2073-00606 Nairobi, Kenya
Mob. +254 (0) 731 033 247; +254 (0) 731 522 255 [email protected] www.msiworldwide.com
OPEN-ENDED INTERVIEWS
NAIROBI
Date: May 03, 2013 Interviewed by: Tom Easterling and Felix M’mboyi
Location: Warai Road, Karen, Nairobi
Name and Position Address Telephone and Email Contact Lucy Karuga, Managing Director P.O. Box 24390-00502, Nairobi 0723-279-627/020-883-431 Fax : 020-884540
[email protected] Date: May 6, 2013 Interviewed by: Tom Easterling and
Felix M’mboyoi Location: Office, North American Sires, Nairobi
Name and Position Address Telephone and Email Contact Mr. Joshua Odhiambo KDSCP Team Leader and CEO, World Wide Sires E.A. Ltd.
Longonot Place, Ground Floor Kijare Street Nairobi, Kenya
(M) +254 (0) 0722 452 173 ; (M) +254 (0) 0733 716 037 [email protected] [email protected]
Date: April 29, 2013 Interviewed by: Tom Easterling and Felix M’mboyi
Location: KDB Head Office, 10th Floor, NSSF Building, Nairobi
Name and Position Address Telephone and Email Contact Machira Gichohi, Managing Director P.O. Box 30406-00100, Nairobi, Kenya
Tel : +254 20 31 05 50/273 38 40 Cell : +254 722 573 432 Email : [email protected]
Paul Ndung’u Dairy Technologist
P.O. Box 30406-00100, Nairobi, Kenya
Tel : +254 20 31 05 50/273 38 40 Cell : +254 722 573 432 Email : [email protected]
Date: April 29, 2013 Interviewed by: Tom Easterling and Felix M’mboyi
Location: KDPA Offices, New KCC Office Building, Nairobi
Name and Position Address Telephone and Email Contact Dr. Kipkirui Arap Lang’at, Chairman, KDPA
P.O. Box 30131-00100 Nairobi, Kenya
Tel. +254 (0) 20 398 0271 (M) +254 (0) 720 014 628 ; +254 (0) 733 414 628 [email protected] Website : www.newkcc.co.ke
Date: 2nd May, 2013 Interviewed by: Tom Easterling and Felix M’mboyi
Location: DVS, Kabete, Nairobi
Name and Position Address Telephone and Email Contact Dr Stephen Kiniiya, Chief Executive Officer
P.O. Box 66717-00800 Westlands, Nairobi Kenya
0728-416048/0734-148-717/020-249-6915 [email protected] [email protected]
Name and Position Address Telephone and Email Contact Dr Samuel Makumi, Administrator, KVA
P.O. Box 29089 – 00625, Kabete, Nairobi, Kenya
0720-923-250/0727-680-022 [email protected] [email protected]
Name and Position Address Telephone and Email Contact Emillie Mugeni P.O. Box 30131-00100 Tel. +254 (0) 20 398 0271

101
Head of Quality Assurance
Nairobi, Kenya (M) +254 (0) 720 014 628 ; +254 (0) 733 414 628 [email protected] Website : www.newkcc.co.ke
Dominic Menjo Head of Milk Supply & Extension
P.O. Box 30131-00100 Nairobi, Kenya
Tel. +254 (0) 20 398 0273 ((M) +254 (0) 723 777 502 [email protected]
Name and Position Address Telephone and Email Contact Lilian Kirimi, Ph.D, Research Fellow
Kindaruma Lane, Off Ngong Road. P.O. Box 20498-00200, Nairobi, Kenya
0714-575288/020-2717818 Fax.020-2717819 [email protected]
Raphael Gitau, Rsearch Fellow/Agricultural Economist
Kindaruma Lane, Off Ngong Road. P.O. Box 20498-00200, Nairobi, Kenya
0714-575288/020-2717818 Fax.020-2717819 [email protected]
Name and Position Address Telephone and Email Contact Dr. Millie Gadbois, Senior Agricultural Advisor
USAID Kenya P.O. Box 629 Village Market 00621 Nairobi, Kenya
Tel: 254-20-862-2000/254-20-862-2000 Fax: 254-20-862-2680 / 2682 Cell: 0713765570 [email protected]
Date: May 3, 2013 Interviewed by: Tom Easterling Location: Southern Sun Hotel, Nairobi Name and Position Address Telephone and Email Contact
Mr. Gerald Mutinda Regional Manager, Dairy Productivity, Gender & Youth East Africa Dairy Development Project
P.O. Box 74388 – 00200 Regional Office, Kilimani Estate, Likoni Lane, off Denis Pritt Road Nairobi, Kenya
Tel. +254 (0) 20 261 4877 Tel. +254 (0) 20 260 8503 (M) +254 (0) 0733 489 534 [email protected] Website : www.eadairy.org
Date: May 3, 2013 Interviewed by: Tom Easterling Location: Land O’Lakes Office, Peponi Plaza, Nairobi
Name and Position Address Telephone and Email Contact Mr. Peter M. Ngarulya Executive Director Eastern and Southern Africa Dairy Association
EDASA Secretariat P.O. Box 195 Sanit Center 00606 Peponi Plaza 3d Floor, Peponi Rd. Nairobi, Kenya
Tel. +254 (0) 20 374 4065 (M) +254 (0) 0721 266 481 [email protected] Website : www.dairyafrica.com
Name and Position Address Telephone and Email Contact David Miano Mwangi (Ph.D) Assistant Director Animal Production Research
KARI Headquarters P.O. Box 57811-00200 Nairobi, Kenya
Tel. +254 (0) 20 418 3301-20 Ext. 2335 (M) +254 (0) 727 781 127 [email protected]; [email protected] Website : www.kari.org
Jayne Gathii Program Manager/Finance and Administration
KARI Headquarters P.O. Box 57811-00200 Nairobi, Kenya
Tel. +254 (0) 20 418 3301-20 (M) +254 (0) 722 788 669 [email protected]
Date: May 2, 2013 Interviewed by: Tom Easterling Location: KAVES office Name and Position Address Telephone and Email Contact
Mr. Mulange Mukumbu Deputy Chief of Party Kenya Agricultural Value Chain Enterprises Project (KAVES)
Karen Office Park, Baobob Building, Second Floor, Suite H Langata Road, Karen Nairobi, Kenya
Tel. +254 (0) 20 Tel. +254 (0) 20 (M) +254 (0) 0722 703 602 @usaidkaves.org Website www.usaidkaves.org
Date: May 6, 2013 Interviewed by: Tom Easterling and Felix M’mboyoi
Location: Office, North American Sires, Nairobi
Name and Position Address Telephone and Email Contact Mr. Joshua Odhiambo KDSCP Team Leader and CEO, World Wide Sires E.A. Ltd.
Longonot Place, Ground Floor Kijare Street Nairobi, Kenya
(M) +254 (0) 0722 452 173 ; (M) +254 (0) 0733 716 037 [email protected] [email protected]
Date: April 30, 2013 Interviewed by: Tom Easterling and Fred Opundo
Location: KEBS Headquarters, Nairobi
Name and Position Address Telephone and Email Contact Ms. Immaculate Odwori Manager, Agro-chemical Department
National Quality Institute Complex Popo Road, off Mombasa Road, South C
Tel. +254 (20) 605490 or 605634 or 6948000 (M) +254 (0) 722 36 77 35

102
Area P.O. Box 54974-00200 Nairobi, Kenya
[email protected] Website : www.kebs.org
Date: May 3, 2013 Interviewed by: Tom Easterling Location: KEBS Headquarters, Nairobi Name and Position Address Telephone and Email Contact
Mr. Paul Kimeto Assistant Manager, Food and Agriculture Department
National Quality Institute Complex Popo Road, off Mombasa Road, South C Area P.O. Box 54974-00200 Nairobi, Kenya
Tel. +254 (0) 20 605 490 or 605 506 (M) +254 (0) 722 86 8467 Direct : +254 (0) 20 694 82411 [email protected] Website : www.kebs.org
Date: May 3, 2013 Interviewed by: Tom Easterling Location: Nairobi International Trade Fair, Livestock Pavillion, Nairobi
Name and Position Address Telephone and Email Contact Mr. Teuri Van Helden Chairman, Kenyan Holstein Friesian Cattle Society and Chairman – Livestock, Nairobi International Trade Fair
Jahmuri Park P.O. Box 21340-00505 Nairobi, Kenya
Tel. +254 (0) 20 264 106 (M) +254 (0) 0723 736 797 [email protected]; [email protected] Website : www.nitf.ask.co.ke
Date: April 30, 2013 Interviewed by: Tom Easterling and Fred Opundo
Location: Campus of the Kenya Veterinary Vaccines Production Institute, Nairobi
Name and Position Address Telephone and Email Contact Dr. Geoffrey K. Muttai National Chairman The Kenya Veterinary Association
P.O. Box 29089 - 00625 Kagemi Nairobi, Kenya
Tel. (M) +254 (0) 722 743 520 ; +254 (0) 738 615 139 Tel. (M) +254 (0) 771 637 373 [email protected]; [email protected]; [email protected]; www.vetkenya.co.ke
Name and Position Address Telephone and Email Contact Mary Munene Chief of Party Land O’Lakes International Development
Peponi Plaza, Block A, 2nd Floor Off Peponi Road, Westlands P.O. Box 45006 00100 Nairobi, Kenya
Tel. +254 (0) 20 374 8526 ; +254 (0) 20 374 8685 (M) +254 (0) 722 809 709 [email protected]
Date: April 29, 2013 Interviewed by: Tom Easterling and Felix M’mboyi
Location: Ministry of Livestock Development Office, Nairobi
Name and Position Address Telephone and Email Contact Julius Kiptarus Director of Livestock Production
P.O. Box 34188 Hill Plaza Nairobi, Kenya
Tel. +254 (0) 20 2722 637 / 2722 601 (DL) +254 (0) 20 2721 003 [email protected]
Date: April 29, 2013 Interviewed by: Tom Easterling and Felix M’mboyi
Location: New KCC Office, Nairobi
Name and Position Address Telephone and Email Contact Emillie Mugeni Head of Quality Assurance
P.O. Box 30131-00100 Nairobi, Kenya
Tel. +254 (0) 20 398 0271 (M) +254 (0) 720 014 628 ; +254 (0) 733 414 628 [email protected] Website : www.newkcc.co.ke
Dominic Menjo Head of Milk Supply & Extension
P.O. Box 30131-00100 Nairobi, Kenya
Tel.. +254 (0) 20 398 0273 ((M) +254 (0) 723 777 502 [email protected]
PLACE OF INTERVIEW
GATANGA MILKSHED
Date: May 9, 2013 Interviewed by: Tom Easterling and Felix M’mboyi
Location: Ministry of Lands Building, Muranga
Name and Position Address Telephone and Email Contact Mr. Francis Karani, County Coordinator, ASDSP
Ministry of Lands Complex Muranga, Kenya
M: +254 (0)
Date: May 9, 2013 Interviewed by: Tom Easterling and Felix M’mboyi
Location: DALEO Office, Muranga

103
Name and Position Address Telephone and Email Contact Efrain Kathuya District Livestock Production Officer
Ministry of Livestock Development Muranga, Kenya
M: +254 (0) 722 605 778 [email protected]
Stephen Waithaka District Animal Production Officer
Ministry of Livestock Development Muranga, Kenya
M: +254 (0) 724 330 256 [email protected] [email protected]
Date: May 9, 2013 Interviewed by: Tom Easterling and Felix M’mboyi
Location: Ministry of Agriculture, Muranga
Name and Position Address Telephone and Email Contact Ms Mary Chege District Agricultural Officer Muranga District
Ministry of Agriculture Complex Muranga, Kenya
M: +254 (0) 720 926 372 [email protected] [email protected]
Date: May 8, 2013 Interviewed by: Tom Easterling and Felix M’mboyi
Location: Ministry of Agriculture Offices, Muranga
Name and Position Address Telephone and Email Contact Dr. Priscilla Waitiki DVD Muranga East
Ministry of Agriculture Muranga, Kenya
M: +254 (0) 721 223 399 [email protected]
Date: May 8, 2013 Interviewed by: Tom Easterling and Felix M’mboyi
Location: Fina Bank Offices,Thika
Name and Position Address Telephone and Email Contact Charity Mwaura Relationship Manager Business Banking
Fina Bank Ltd. Thika Branch P.O. Box 4103 – 10002 Thika, Kenya
Tel. 067 20186/87/88 DL 020 238 4278 M: +254 (0) 721 438 189 [email protected] www.finabank.com
Date: May 9, 2013 Interviewed by: Tom Easterling and Felix M’mboyi
Location: Blue Post Hotel, Thika
Name and Position Address Telephone and Email Contact John Ajathi Previous Milkshed Coordinator, Gatanga
Thika, Kenya
M: +254 (0) 722 929 301 [email protected]
Date: May 8, 2013 Interviewed by: Tom Easterling and Felix M’mboyi
Location: Kaitheri Shopping Center, Muranga
Name and Position Address Telephone and Email Contact Mr. Joseph Muchiri Karagu, Assistant Manager, Umoja Dairy
Kaitheri Shopping Center P.O. Box 520, Muranga, Kenya
M: +254 (0) 712 034 999 [email protected]
Date: May 8, 2013 Interviewed by: Tom Easterling and Felix M’mboyi
Location: VEP Office, Thika
Name and Position Address Telephone and Email Contact Bernard Kananja Ndungu Director General, Empowered and Motivated Community for Poverty Alleviation
Steadview Apartment opposite Dec Hotel Commercial Street P.O. Box 6851-00100 Thika, Kenya
(M) +254 (0) 722 317 119 [email protected]; [email protected] Website : www.vep.co.ke
Purity Wanjira Ndereba Marketing Manager, Empowered and Motivated Community for Poverty Alleviation
Steadview Apartment opposite Dec Hotel Commercial Street P.O. Box 6851-00100 Thika, Kenya
(M) +254 (0) 721 326 346 [email protected] [email protected] Website : www.vep.co.ke
Grace Muringi Mwangi Finance Manager, Empowered and Motivated Community for Poverty Alleviation
Steadview Apartment opposite Dec Hotel Commercial Street P.O. Box 6851-00100 Thika, Kenya
(M) +254 (0) 731 386 014 [email protected]; [email protected] Website : www.vep.co.ke

104
Name and Position Address Telephone and Email Contact Efrain Kathuya District Livestock Production Officer
Ministry of Livestock Development Muranga, Kenya
M: +254 (0) 722 605 778 [email protected]
Stephen Waithaka District Animal Production Officer
Ministry of Livestock Development Muranga, Kenya
M: +254 (0) 724 330 256 [email protected] [email protected]
PLACE OF INTERVIEW
NYERI MILKSHED
Date: May 13, 2013 Interviewed by: Tom Easterling Location: White Rhino Hotel, Nyeri
Name and Position Address Telephone and Email Contact Mr. David Gitonga Previous Coordinator Nyeri Milkshed
Nyeri, Kenya M: +254 (0) 733 918 004 [email protected]
Date: May 14, 2013 Interviewed by: Tom Easterling and Felix M’mboyi
Location: DLPO Office, Nyeri Town
Name and Position Address Telephone and Email Contact Francis Njiiri, District Livestock production Officer, DLPO
P.O. BOX Private Bag, Nyeri
0720-615600
Date: May 14, 2013 Interviewed by: Tom Easterling and Felix M’mboyi
Location: DVO Office, Nyeri Town
Name and Position Address Telephone and Email Contact Peter M, Kamau, District Veterinary Officer, Tetu
DVO Office, Nyeri Town, next to Ministry of Agriculture DAO Office
0710-676169 [email protected]
Name and Position Address Telephone and Email Contact Ephantuo Gichohi, Chariman Charles Kromo, Honorable Secretary
Gakindu Dairy Cooperative Society Ltd. P.O. Box 5710111 Gakindu, Kenya
Mr. Gichoi : +254 (0) 722 764 566 Mr. Kromo : +254 (0) 723 591 172 [email protected]
Date: May 13, 2013 Interviewed by: Tom Easterling and Felix M’mboyi
Location: KDB, Nyeri Town
Name and Position Address Telephone and Email Contact Charles Mwaniki KDB, Nyeri Regional Offices, Nyeri
town, inside MOA compound 0723-446454 [email protected]
Date: May 14, 2013 Interviewed by: Tom Easterling and Felix M’mboyi
Location: MOA Office, Nyeri Town
Name and Position Address Telephone and Email Contact Alice N. Thenya P.O. BOX Private Bag,
Nyeri
0721-622981 [email protected] [email protected]
Date: May 13, 2013 Interviewed by: Tom Easterling, Felix M’mboyi
Location: Residence of Ms. Kagema
Name and Position Address Telephone and Email Contact Ms. Lydia Kagema Chairperson SSDFA
Nyeri, Kenya M: +254 (0) 721 344 479 [email protected]
Date: May 17, 2013 Interviewed by: Tom Easterling and Felix M’mboyi
Location: Skype call from Nakuru
Name and Position Address Telephone and Email Contact Mr. Jimmie Gikonyo Nairobi, Kenya M: +254 (0) 722 521 343

105
Previous Team Leader Nyeri and Gatanga Milksheds
PLACE OF INTERVIEW
NAKURU MILKSHED
Date: May 17, 2013 Interviewed by: Tom Easterling and Felix M’mboyi
Location: Cooperative Bank, Nakuru
Name and Position Address Telephone and Email Contact Mr. Timothey Keli Branch Manager
The Cooperative Bank of Kenya Nakuru East Branch P.O. Box 3125-20100 Nakuru, Kenya
M: +254 (0) 714 052 559; +254 (0) 732 327 610 M: +254 (0) 721 710 365 [email protected]
Mr. Mugo Maina Cooperative Relationship Manager
The Cooperative Bank of Kenya Nakuru East Branch P.O. Box 3125-20100 Nakuru, Kenya
M: +254 (0) 714 052 559; +254 (0) 732 327 610 M: +254 (0) 720 836 869 [email protected]
Date: May 18, 2013 Interviewed by: Tom Easterling and Felix M’mboyi
Location: Happy Cow Office, Nakuru town
Name and Position Address Telephone and Email Contact Gerald Oosterwijk, Director P.O. Box 558 - 20100
Nakuru, Kenya Cell : 0721-352101 Tel : 020-2313998 [email protected]
Date: May 18, 2013 Interviewed by: Tom Easterling and Felix M’mboyi
Location: Mid Land Hotel, Nakuru Town
Name and Position Address Telephone and Email Contact Laban Mwaniki
P.O. BOX 43148-00100, Family Health Plaza, Langata/Mai Mahiu Road, Nairobi
0722-318590 [email protected] [email protected]
Date: May 18, 2013 Interviewed by: Tom Easterling and Felix M’mboyi
Location: Mid Land Hotel, Nakuru Town
Name and Position Address Telephone and Email Contact Laban Mwaniki
P.O. BOX 43148-00100, Family Health Plaza, Langata/Mai Mahiu Road, Nairobi
0722-318590 [email protected] [email protected]
Date: May 17, 2013 Interviewed by: Tom Easterling and Felix M’mboyi
Location: Kiplombe Primary School Area, farmer démonstration field
Name and Position Address Telephone and Email Contact Mr. Leboo Kiptoo Manager, Kiplombe FCS
Kiplombe FCS, Limited Muserechi Dairy P.O. Box 143, Eldama Ravine
M: +254 (0) 724 849 849 [email protected]
Mr. Joseph Kurgat Treasurer, Kiplombe FCS
Kiplombe FCS, Limited Muserechi Dairy P.O. Box 143, Eldama Ravine
M: +254 (0) 722 341 601
Date: May 17, 2013 Interviewed by: Tom Easterling and Felix M’mboyi
Location: Cooperative offices, Muserechi
Name and Position Address Telephone and Email Contact Mr. Leboo Kiptoo Manager, Kiplombe FCS
Kiplombe FCS, Limited Muserechi Dairy P.O. Box 143, Eldama Ravine
M: +254 (0) 724 849 849 [email protected]
Mr. Joseph Kurgat Treasurer, Kiplombe FCS
Kiplombe FCS, Limited Muserechi Dairy
M: +254 (0) 722 341 601

106
P.O. Box 143, Eldama Ravine Date: May 18, 2013 Interviewed by: Tom Easterling and Felix
M’mboyi Location: Skype call from Nakuru
Name and Position Address Telephone and Email Contact Ms. Lucy Nguru Previous Team Leader Nakuru and Lessos Milksheds
Nairobi, Kenya M: +254 (0) 722 832 198 [email protected] [email protected]
PLACE OF INTERVIEW
LESSOS MILKSHED
Date: May 20, 2013 Interviewed by: Tom Easterling and Felix M’mboyi
Location: Ministry of Agriculture Offices, Country Commissionner Offices, Eldoret Town, Kenya
Name and Position Address Telephone and Email Contact Mr. Peter Shitoka, M&E Officer, ASDSP
Ministry of Agriculture Offices, Country Commissionner Offices, Eldoret Town, Kenya
M: +254 (0) 712-382833 Email: [email protected]
Ms. Elizabeth Yegon, Institutional Capacity Building Officer, ASDSP
Ministry of Agriculture Offices, Country Commissionner Offices, Eldoret Town, Kenya
M: +254 (0) 720-133479 Email: [email protected]
Date: May 21, 2013 Interviewed by: Tom Easterling and Felix M’mboyi
Location: DLPO Office, Eldoret
Name and Position Address Telephone and Email Contact Josephat Kutoi, District Livestock production Officer, DLPO
Ministry of Agriculture Building, Eldoret
(M) +254 (0) 722 292247 [email protected]
Famuel A. Anjelpi Dairy Officer
Ministry of Agriculture Building, Eldoret
(M) +254 (0) 722 484 596 [email protected]
Simon Langot County Director of Agriculture
Ministry of Agriculture Building, Eldoret
(M) +254 (0) 720 792 058 [email protected]
Joseph K. Chaboi District Agricultural Officer Eldoret
Ministry of Agriculture Building, Eldoret
(M) +254 (0) 722 292 247 [email protected]
Date: May 21, 2013 Interviewed by: Tom Easterling and Felix M’mboyi
Location: KDB Office, KVDA Plaza, Eldoret
Name and Position Address Telephone and Email Contact Mr. Pius Cheserek KDB Branch Manager
Kenya Dairy Board Eldoret Regional Office, P.O. Box 1173 KVDA Plaza, Eldoret, Kenya
(M) +254 (0) 717 997 420 (M) +254 (0) 717 997 420 [email protected]
Date : May 24, 2013 Interviewed by : Tom Easterling and Felix M’mboyi
Location : Hillside, Eldoret Town
Name and Position Address Telephone and Email Contact Mr. P. Rotich, Farm Manager
Elso Farm, Hillside, Eldoret town (M) +254 (0) 721-368-651
Date : May 23, 2013 Interviewed by : Tom Easterling and Felix M’mboyi
Location : North Rift Dairy Farmers Cooperative Union Offices, Watergates Plaza, Second Floor, Room 02, Eldoret town
Name and Position Address Telephone and Email Contact Ms Julian Tuwei, Milkshed North Rift Dairy Farmers Cooperative (M) +254 (0) 720 461 310
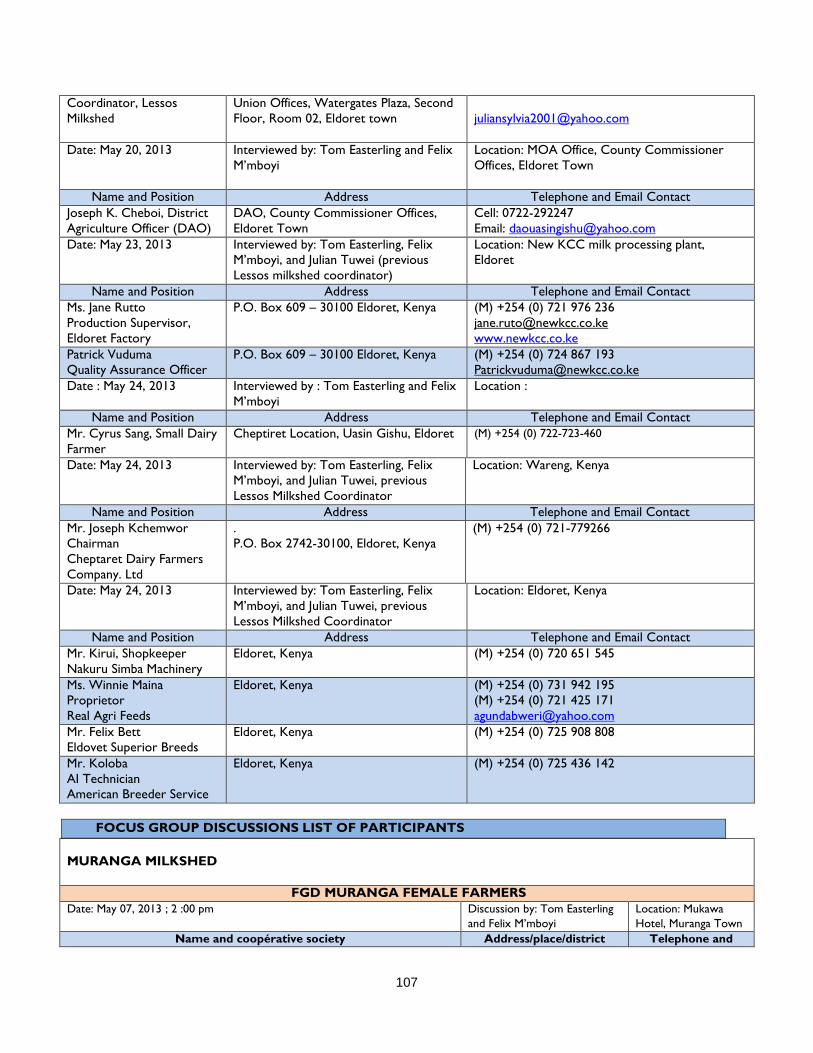
107
Coordinator, Lessos Milkshed
Union Offices, Watergates Plaza, Second Floor, Room 02, Eldoret town
Date: May 20, 2013 Interviewed by: Tom Easterling and Felix M’mboyi
Location: MOA Office, County Commissioner Offices, Eldoret Town
Name and Position Address Telephone and Email Contact Joseph K. Cheboi, District Agriculture Officer (DAO)
DAO, County Commissioner Offices, Eldoret Town
Cell: 0722-292247 Email: [email protected]
Date: May 23, 2013 Interviewed by: Tom Easterling, Felix M’mboyi, and Julian Tuwei (previous Lessos milkshed coordinator)
Location: New KCC milk processing plant, Eldoret
Name and Position Address Telephone and Email Contact Ms. Jane Rutto Production Supervisor, Eldoret Factory
P.O. Box 609 – 30100 Eldoret, Kenya
(M) +254 (0) 721 976 236 [email protected] www.newkcc.co.ke
Patrick Vuduma Quality Assurance Officer
P.O. Box 609 – 30100 Eldoret, Kenya
(M) +254 (0) 724 867 193 [email protected]
Date : May 24, 2013 Interviewed by : Tom Easterling and Felix M’mboyi
Location :
Name and Position Address Telephone and Email Contact Mr. Cyrus Sang, Small Dairy Farmer
Cheptiret Location, Uasin Gishu, Eldoret (M) +254 (0) 722-723-460
Date: May 24, 2013 Interviewed by: Tom Easterling, Felix M’mboyi, and Julian Tuwei, previous Lessos Milkshed Coordinator
Location: Wareng, Kenya
Name and Position Address Telephone and Email Contact Mr. Joseph Kchemwor Chairman Cheptaret Dairy Farmers Company. Ltd
. P.O. Box 2742-30100, Eldoret, Kenya
(M) +254 (0) 721-779266
Date: May 24, 2013 Interviewed by: Tom Easterling, Felix M’mboyi, and Julian Tuwei, previous Lessos Milkshed Coordinator
Location: Eldoret, Kenya
Name and Position Address Telephone and Email Contact Mr. Kirui, Shopkeeper Nakuru Simba Machinery
Eldoret, Kenya
(M) +254 (0) 720 651 545
Ms. Winnie Maina Proprietor Real Agri Feeds
Eldoret, Kenya
(M) +254 (0) 731 942 195 (M) +254 (0) 721 425 171 [email protected]
Mr. Felix Bett Eldovet Superior Breeds
Eldoret, Kenya
(M) +254 (0) 725 908 808
Mr. Koloba AI Technician American Breeder Service
Eldoret, Kenya
(M) +254 (0) 725 436 142
FOCUS GROUP DISCUSSIONS LIST OF PARTICIPANTS
MURANGA MILKSHED
FGD MURANGA FEMALE FARMERS
Date: May 07, 2013 ; 2 :00 pm Discussion by: Tom Easterling and Felix M’mboyi
Location: Mukawa Hotel, Muranga Town
Name and coopérative society Address/place/district Telephone and

108
Email Contact 1. Anne Wanjiku, Wanjegi Dairy Cooperative Muranga 0727-101227 2. Hannah Njeri, Arbadere East Dairy Cooperative Kangema 0721-901419 3. Damaris Wahu, Umoja Dairy Cooperative Gaturi 0722-590685 4. Florence Njeri, Kahuro Breeders Gatundu 0716-051621 5. Florence Wambui, New Ngida Cooperative Maragwa 0724-014145 6. Lilian Njanja N., Arbadere East Dairy Cooprtaive Kangema 0712-647812 7. Regina Kaburaki, Wanjegi Dairy Cooperative Wanjegi 0715-009969 8. Margaret Nyambura, Umoja Dairy Cooperatuive Gaturi 0713-261273 9. Jane Gituto, Kahuro Breeders Mugoiri 0701-1722390
FGD MURANGA MALE FARMERS Date: May 07, 2013 ; 10 :00 am Discussion by: Tom Easterling
and Felix M’mboyi Location: Mukawa Hotel, Muranga Town
Name and coopérative society Address/place/district Telephone and Email Contact
1. David m. mabure, wanjegi farmers self-help cooperative society kahuro 0722-847551 2. Thomas mombo, abardares east farmers cooperative kahuro 0712-581883 3. James wachira nduruku, kangema 0722-798630 4. James kimani muchori, wanjegi dairy farmers cooperative society kangema 0724-562097 5. Peter muturi njogo, kahuro breeders kahuro 0722-977466 6. Stanley nduhe nganga, kahuro breeders kahuro 0720-631493 7. Stanley kabera mugo, umoja dairy cooperative socity mathioya 0725-775060 8. Elias maina mwangi, umoja dairy cooperatuve soeity kiharu 0723-313712
FGD MURANGA SBO Date: May 06, 2013 ; 2 :00 pm Discussion by: Tom Easterling
and Felix M’mboyi Location: Mukawa Hotel, Muranga Town
Name, Position and SBO Address Telephone and Email Contact
1. John Macharia Kariuki, Chairman, Aberdare East Dairy Coopérative Society
Kihoya Location 0725-342772
2. John Ezias Thuo, Vice Chairman, Aberdare East Dairy Coopérative Society
Kihoya Location 0721-935411
3. Peter M. Muhoro, Secretary, Kahuro Livestock Breeder Cooperative And Ltd
Kahuro 0715-505788
4. Joseph M. Gakinya, Member Of Board, Kahuro Livestock Breeder Cooperative And Ltd
Kahuro 0702-168424
5. Laurence R. Mwangi, Hon. Secretary, Wanjengi Dairy Cooperative Society
Wanjengi 0722-337084
6. Julius K. Ruthi, Chairman, Wanjengi Dairy Cooperative Society Wanjengi 0726-419940 7. Samson K. Kiragu, Secretary Manager, Wanjengi Dairy Cooperative
Society Kahuro 0714-242361
8. Samuel N. Wamburu, Chairman, Sagawa Dairy Cooprratuve Society Mathioya 0722-772689 9. Nancy N. Kimondo, Treasurer, Umoja Dairy Cooperative Society Muranga East, Gafura Kiharu 0728-349527 10. Edward Mwangi M., Vice Chairman, Umoja Dairy Cooperative
Society Muranga East, Gafura Kiharu 0726-104154
11. David Irungu Gitau, Manager, New Nginda, Nginda/Maragwa 0726-715872 12. Kamau Njiba C., Secretary, New Nginda, Nginda/Maragwa 0722-606492
NYERI MILKSHED
FGD NYERI FEMALE FARMERS
Date: May 11, 2013 ; 2 :00 pm Discussion by: Tom Easterling and Felix M’mboyi
Location: IPIS Hotel, Nyeri Town
Name and coopérative society Address/place/district Telephone • Esther muthoni ndiritu, new Tetu Karundu 0724-419511

109
• Winnie wambui wachira, new Tetu Karundu 0726-402549 • Alice wangechi murage, new Tetu Tetu 0724-567939 • Hozen wangui gichuki, ihururu Tetu 0724-738192 • Monicah nyanbura waigwa, kerichu Kerichu 0723-221266 • Winfred wambui chege, ihururu Tetu 0720-516789 • Lydiah waruguru muriuki, MIK Karatina 0729-038499 • Jane muthoni kamunyo, wakulima Mukurue-ini 0720-484270 • Catherine w. mwangi, wakulima Mukurue-ini 0722-908519 • Ruth nyambura, Tetu Tetu 0738554915 • Alice wangui, Tetu Tetu 0720-577208
FGD NYERI MALE FARMERS Date: May 11, 2013 ; 10 :00 am Discussion by: Tom
Easterling and Felix M’mboyi
Location: IPIS Hotel, Nyeri Town
Name and coopérative society Address/place/district Telephone Contact 1. Samuel Waithaka, Wakulima Dairy Mukurue-Ini 0725-941507 2. Jacob Mwangi, Kiricho Dairy Municipality 0718-031217 3. Melkizedeck Wangondu, Tetu Dairy Tetu 0724-789497 4. Stallow W. Kangara, Wakulima Dairy Mukurue-Ini 0725-505208 5. James K. Kaniaru, Tetu Dairy Tetu 0711-108431 6. Christopher N. Mwangi, Mathira MIK Mathira 0723-774987 7. Samuel Wangombe Karingithi, MIK Mathira 0720-597611 8. Daniel Wambugu Njoroge, Mathingira Dairy Mathingira 0701-361123 9. Peter Muya Ndegwa, Tetu Dairy Tetu 0721-580061 10. Joseph Kiambo Ndirangu, Wakulima Dairy Mukurue-Ini 0712-882405
FGD NYERI SBO Date: May 10, 2013 ; 2 :00 pm Discussion by: Tom Easterling and Felix M’mboyi Location: IPIS Hotel,
Nyeri Town Name, & Position SBO Telephone and
Email Contact 1. Simon M. Kanyi, Chairman M.I.K 0720-588773 2. James N. Gachanja New United Tetu Dairy Cooperative 0720-365304 3. Stephen Muthaga Nyambura, Manager New United Tetu Dairy Cooperative 0722-418157 4. Mary M. Muthane, Treasurer Tetu Dairy Cooperative 0725-704954 5. Josphat N. Gitau, Chairman Othaya Dairy Cooperatuve Society 0722-980372 6. Monicah M. Ndirangu, Committee Member Ihururu Dairy 0721-800792 7. Rahab M. Moses, Secretary Tetu Dairy Cooperative 0727-386050 8. Rose M. Maina, Secretary Kirichu Dairy Cooperative 0723-731901 9. John M. Kairu, Committee Memebr Wakulima Dairy 0725-668479 10. Gerald Kariuki, Group Coordinator Wakulima Dairy 0722-396334 11. Ephantus Gichohi, Chairman Gakindu Dairy 0722-764566 12. Mubea E. Muchemi, Secretary, Supervisory
Comittee Ihururu Dairy 0722-665777
NAKURU MILKSHED
FGD NAKURU MILKSHED FEMALE FARMERS
Date: May 16, 2013 ; 2:00 pm Discussion by: Tom Easterling and Felix M’mboyi
Location: Champai Springs Hotel, Eldama Ravine Town
Name And Coopérative Society Address/Place/District Telephone 1. Jane Cheruyot, Dominion Dairy S.H.G Mauche Center 0721-582780 2. Margaret Rutor, Dominion Dairy S.H.G Mauche Center 0723-179470 3. Irene Kigen, Kiplombe DAF Society Kiplombe Cetre 0725-944872 4. Emilly J. Chesang, Mumberes AFC society Mlango Moja Center 0717-627511

110
5. Teresa N. Chirchir, Mumberes AFC society Mlango Moja Center 0713-989151 6. Lornah J. Ronoh, Kiplombe F. Society Muserechi Center 0720-885507 7. Dinah Chebor, Mogotio F. Society Kipsogon Center 0718-225006 8. Rosebella Ngetich, Mogotio F. Society Kipsogon Center 0724-776183 9. Norah Jepkoech, Kiptoium F. Society Esageri Center 0715-699691 10. Flossy Jepchomba, Kiptoium F. Society Esageri Center 0725-215996
FGD NAKURU MALE FARMERS Date: May 16, 2013 ; 10 :00 am Discussion by: Tom Easterling
and Felix M’mboyi Location: Champai Springs Hotel, Eldama Ravine Town
Name and Coopérative Society Address/Place/District Telephone Contact • Gideon Komen Esageri 0727-492623 • Gideon K. Chepkengoo Kipsogon 0722-684675 • Joseph K. Langat Mauche 0701-920215 • Patrick Kipkato Kiplombe 0722-987134 • Julius Langat Kiptoim 0727-534300 • Emmanuel Kosegem Mumberes 0714-545216 • Symon Kigen Mumberes 0726-621197 • Daniel Lagat Kiptoim 0729-544171 • Kipkirir Koltios Kiptoim 0729-045781
FGD ELDAMA RAVINE SBO Date: May 15, 2013 ; 2 :00 pm Discussion by: Tom Easterling and Felix M’mboyi Location: Champai Springs
Hotel, Eldama Ravive Town Name SBO and Location Telephone
1. Eunice Chepkirui Dominion Dairy, Mauche, Njoro 0722-644184 2. Lily Rator Dominion Dairy, Mauche, Njoro 0722-577329 3. John K. Tallam Mumberes Society, Mumberes, Eldama Ravine 0720-613314 4. Caleb K. Biwott Mumberes Society, Mumberes, Eldama Ravine 0725-499812 5. Lucy Kamwaro BAMSCOS, Eldama Ravine 0721-381979 6. Alfred Koech Mogotio FCS, Mogotio 0723-294390 7. Wilson Cheruiuot Mogotio FCS, Mogotio 0722-323772 8. Joseph Kurgat Kiplombe FCS, Kiplombe 0722-341601 9. Felix Koech Kiplombe FCS, Kiplombe 0729-629018 10. Kiptanui Ayabei Kiptoim FCS Ltd, Kiptoium 0725-527473 11. Francis Kogei Kiptoim Dairy, Kiptoim 0714-297601
LESSOS MILKSHED
FGDs FEMALE FARMERS, LESSOS MILKSHED
Date: May 22, 2013 ; 2:00pm Discussion by: Tom Easterling and Felix M’mboyi
Location: Royalton Hotel, Eldoret
Name and Coopérative Society Address/Place/District Telephone Contact 1. Christine Bingo, KIPEP Kipchemo Kipchamo 0724-530650 2. Christine Birech , KIPEP Kipchamo 0721-346666 3. Elizabeth Sang, Founder, KIPEP Kipchamo 0723-710112 4. Norah Mutai, KIPEP Kipchamo 0723-023986 5. Hellen Birech, Tjiinue Kwa Bidii Dairies Kesses 0724-648553 6. Faith Chepchirchir Kitur, Kipsamoo CBO Kipsamoo 0717-035061 7. Tecla J. Kemboi, Kipsamoo CBO Kipsamoo 0718-301917 8. Chatherine Bitek, Cheptiret Dairies Cheptiret 0720-739103 9. Anne Jelagat, Cheptiret Dairies Cheptiret 0717-691457 10. Sarah J. Too, Bidii Cooperative Momoniat 0715-059765
FGDs MALE FARMERS, LESSOS MILKSHED

111
Date: May 22, 2013 ; 10:00am Discussion by: Tom Easterling and Felix M’mboyi
Location: Royalton Hotel, Eldoret
Name and Coopérative Society Address/Place/District Telephone Contact 1. Wislson K. Talam, Kipchemo KIPEP Kipchamo 0710-569577 2. Jonathan Leting, KIPEP Kipchamo 0726-591311 3. Samuel K. Ngeno, Bidii Tujiinue Cooperative Soeity Keregut 0719-664360 4. John Bitok, Kipsamo Cooperative Ngeria 0721-159554 5. Daniel Korir, Biddi Tujiinue Cooperative Society Keses 0720-566947 6. Richard Koech, Cheptiret Dairies Chepteret 0728-141485 7. Hillary Kiprop Yego, Kipsamo Cooperative Society Ngeria 0733-734188 8. David Cheruiyot, KIPEP (Kipchamo) Kipchamo 0726-734108 9. Eliud K. Sum, Cheptiret Dairies Cheptiret 0725-268957 10. Daudi K. Rono, Cheptiret Dairies Cheptiret 0711-134603
FGD LESSOS SBOs, ELDORET Date: May 21, 2013 ; 2 :00 pm Discussion by: Tom Easterling and Felix M’mboyi Location: Rayalton Hotel,
Eldoret Name SBO and Location Telephone
1. Irene Some, Secretary Kipchamo CBO, Kipchamo 0726-597422 2. Michael Songoroh, Secretary Moiben Dairies, Moiben 0722-760117 3. Philip Boit, Chairman Progressive Co, Karona 0722-644653 4. Paul Tiony, Vice Secretary Kipsamoo CBO, Ngeria 0720-140363 5. Zipporah Kisorio, Secretary Kipsamo CBO, Ngeria 0701-393981 6. Isaac Rono, Secretary Tujiinue Kwa Bidii, Moi University Main Campus 0722-546206 7. Henry Birgon, Chairman Tuiyo Farms CPP, Kapseret 0723-645894 8. Vibian Jemutai, Treasurer Kipsamoo CBO, Kapsaret 0720-373908 9. Henry Keter, Secretary Ainabkoi Farmers, Ainabkoi 0721-561090 10. Joseph Kchemwor, Chairman Cheptoret Dairies, Kesses 0721-779266

112
ANNEX J. CONFLICT OF INTEREST STATEMENTS BY TEAM MEMBERS

113

114

115
ANNEX K. FINDINGS, CONCLUSIONS, AND
RECOMMENDATIONS (F/C/R)

116
KENYA DAIRY SECTOR COMPETITIVENESS PROGRAM EVALUATION
FINDINGS, CONCLUSIONS, AND RECOMMENDATIONS
Evaluation Questions by
Topic
Findings Conclusions Recommendations
1a. To what extent did KDSCP meet the intended goals?
Primary Goal The KDSCP project met the goal of increased smallholder household income from the sale of quality milk by those smallholder dairy farmers who benefited from the project. Based on the Life of Project results from the KDSCP PMP report, the smallholder household income increased by 208 percent over the project life (from a baseline of Ksh 2043/month to Ksh 6299/month).
Contributing factors:
• Milk price increased by approximately 89 percent from Ksh 18/liter in 2008 to Ksh 34/liter in 2013 (based on the team’s focus group discussions with SBOs and dairy farmers)
• A reduction in milk production cost by 21.5 percent (from Ksh 14.20/liter to Ksh 11.40/liter) over the project life
• An increase in dairy productivity (liters/cow/day) by 53 percent (from 6.40 liters to 9.85 liters) over the project life
• Without the increase in milk prices over the
The project achieved the primary goal of increased smallholder household income.

117
KDSCP life, household income would have increased by approximately 79 percent (from Ksh 2043/ month to Ksh 3657/ month)
The method for coming up with above increase in HH income:
a) Baseline income = Ksh 2,043/month
b) Baseline price = Ksh 18/liter (lessos FGDs)
c) Baseline volume [a/b] = 113.5 liters/month
d) Animal productivity increased by 53 percent over life of project = 173.5 liters/month
e) Production cost reduced from Ksh 14.2/liter to Ksh 11.4/liter over project life which leads to reduction of Ksh 3.06/liter
f) Revenue per month provided from milk sales at end of project = 173.655* Ksh 18 = 3,125.79
g) Revenue per month resulting from cost reduction at end of project = 173.655 * Ksh 3.06 = Ksh 531.38
h) Total revenue at end of project [f+g] = 3,657.17
i) Percentage increase= [3,657.17-2,043.00/2043.00] = 79.0 percent
The income increase from dairy has a significant effect on the communities within the milksheds where the survey took place. A total of 72 percent of HH heads surveyed (289/402) rely on dairy as their main occupation. However, of the remaining 28 percent of households (112/402) for which dairy is not the primary occupation, 97 percent (108/112) of these non-dairy households have
Dairy is the primary means of smallholder livelihood in the KDSCP area.

118
other family members who are engaged in dairy as their main income activity.
Based on the Life of Project results from the KDSCP PMP report, the number of rural households that benefited from the project in the eight milkshed areas where the KDSCP operated is 338,210.
It is notable that the primary project goal of “increased smallholder household income from the sale of quality milk” had no threshold level to be achieved during the project.
Future USAID projects should set a threshold level for the main project goals and objectives.
Secondary Goal The secondary project goal of KDSCP was to convert the Kenyan dairy industry into a globally competitive regional market leader.
The KDSCP project helped to increase the dairy productivity (liters per cow per day) from an average of 6.4 liters in 2008 to 9.85 liters in 2013, corresponding to an increase of 53% over the project life (project monitoring report), although less than the project objective of 15 liters per cow per day.
The KDSCP project helped to cost of milk production from Ksh 14.20 per liter in 2008 to Ksh 11.14 per liter in 2013, which is equivalent to a cost reduction of 21.5% (project monitoring report). This cost reduction was attributed by the Land O’Lakes project implementation team to the shift by small farmers from buying commercial feed to using animal feed that was largely produced on-farm, and mixed with a limited quantity of
The KDSCP project worked to enhance the competitiveness Kenya’s dairy industry through project activities that increased the productivity of dairy animals, reduced the cost of milk production, and improved the quality of milk that was produced by small farmers and collected by their SBO organizations.
Future USAID dairy support projects should work to achieve the industry standard of 15 liters per cow per day.
Future USAID dairy support projects should continue to support on-farm production/storage of nutritious feed.

119
purchased feed supplements.
Based on the focus group discussions, 30% (24/80 response from FGDs) of smallholder dairy farmers have achieved the shift to on-farm production of animal feed.
As reported by the project’s annual progress reports, KDSCP further worked to institute a national policy framework for milk quality, and further supported international ISO certification for the two largest dairy processors in Kenya. The project also supported SBO organizations to develop their capabilities to carry out milk quality testing on the milk they collected from the small farmers.
Furthermore, the KDSCP attempted to institute an industry-wide system for milk payment based on quality, but without success. Based on the team’s interviews with the East and Southern Africa Dairy Association (ESADA) and confirmed by the project’s annual progress reports, KDSCP and ESADA collaborated to conduct a market survey to establish the willingness of Kenya milk consumers to pay for milk quality. The study confirmed that consumers value milk for its color, taste and “thickness” (i.e. butterfat content) with visible cream on top of the milk; whereas processors use bacteria counts and other parameters such as improved sanitation and lack of adulteration to define quality. Consumers were found to be unwilling to pay more for milk quality as defined by the processors, and the quality
Payment systems in Kenya based on milk quality are more applicable for niche markets such as baby food where industry standards for food safety and food quality have paramount importance.

120
payment system did not go into effect.
It attempted to institute milk quality payment system without much success though the process is ongoing at New KCC Ltd who are partnering with Nesle Foods International Ltd for delivery of high grade milk to manufacture baby foods.
KDSCP helped institute a National Policy Framework for milk quality
The Project offered technical and resource support for ISO certification of dairy products exporters e.g. Happy Cow Dairies Ltd in Nakuru and Eldoville Dairies in Nairobi
KDSCP worked to reduce the seasonal decline in milk production with better feed supply and feed storage. On-farm production/storage of nutritious feed was only achieved at 30 percent (36/120 response from FGDs) by smallholder dairy farmers and SBO officals.
Based on data from the World Trade Organization's International Trade Center, the trade balance for milk products between Kenya and WTO countries has steadily declined from 2007 until 2011, when it became negative. Kenya’s trade balance for dairy products has shown the following amounts from 2007 – 2011: (US $000): 2007 – 8,485; 2008 - $8,170; 2009 - $1,844; 2010 - $389; 2011 – ($5,588) .
Kenya’s declining trade balance with WTO countries indicates that the country is not internationally competitive. It was a net importer of milk products in 2011.
The KDSCP project did not achieve its secondary project goal of converting the Kenyan
Future development projects that support Kenya’s dairy sector should continue the work to increase the competitiveness of Kenya’s dairy industry as exporters to regional markets.

121
dairy industry into a globally competitive regional market leader.
To achieve international quality standards for raw, fresh milk, the bacteria count must not exceed the industry standard of 200,000 CFU/mL (colony-forming units of bacteria per milliliter).
All the 40 SBO leaders that participated in the focus groups affirmed that the lack of milk cooling equipment is the key constraint to the quality of milk produced by smallholders.
Eighty percent of the SBO leaders (32/40) that participated in the focus group discussions stated that the milk received by their SBOs requires a minimum period of 5 hours to be delivered to their respective collection center from their small-scale suppliers. The time delay compromises milk quality due to its resulting high bacteria count, known as its “bacteria load”.
80 percent of SBOs and dairy farmers interviewed (96/120) during FGDs indicated that milk delivery to cooperative take between 5-7 hours which compromises milk quality due to high bacteria count load.
The team’s interview with the New KCC Production Manager in Eldoret revealed that much of the milk received at the processing plant contains over 1,000,000 bacteria, which is far beyond the international acceptable standard.
All the SBOs (100 percent of 40/40 responses)
To become internationally competitive in terms of product quality, Kenya’s dairy industry must have the capability to chill milk to 5 degrees centigrade less than within two hours after milking and to maintain that temperature throughout the value chain. The Kenya dairy industry does not presently have the capability to chill milk produced by small farmers in rural areas within two hours after milking.
Future USAID dairy value chain projects should support and encourage milk cold chain development by making available a rotating credit fund for the purchase of milk coolers, which would be administered by local financial institutions. This recommendation is particularly relevant to the USAID/KAVES Project.

122
interviewed during the FGDs affirmed that lack of cooling facilities was the biggest constraint in achieving internationally accepted milk quality standards.
Interviews with the Lessos Milkshed Coordinator and the manager of Elso Farm a large scale dairy farm, indicated that some farmers who have cooling facilities have recorded an impressive bacteria load count of just 20,000.
The previous KDSCP Acting COP advised the team that the only price premium that processors pay in Kenya is for chilled milk, and for increased volumes of raw milk. Two of the leading processors pay an additional Ksh 1.00 – 2.00 per liter of chilled milled delivered by cooperatives. Producers do not receive any premiums for fat content, while the processors benefit from producing value added products such as cheese and butter. KDSCP attempted to institute a milk payment system based on quality.
However, New KCC is working out an arrangement with Nelse Foods International to supply high grade milk at premium price of between Ksh 40-50 per liter.
A quality bonus scheme would not be effective without a milk chilling facility and a dairy cold chain that can ensure milk quality. Another limiting factor is that small milk volumes are mixed together when milk supplies are consolidated as they move up the value chain, making traceability extremely difficult. Consequently, deficient milk quality by one farmer can contaminate milk produced by another farmer, making it difficult to reward an individual farmer for higher milk quality.
KDSCP attempted to
Priority should be given to providing milk cooling and cold chain development, before embarking on a quality bonus payment scheme.

123
institute a milk payment system based on quality but it was not successful because the processors concluded that Kenyan consumers were not willing to pay a premium for milk that meets international quality standards.
Two milk processors interviewed in Nakuru and Lessos milksheds during the field visits informed the evaluation team that Kenya has approximately 30 percent shortage of milk for national markets supplies during the dry season when there is a seasonal decline in milk supply.
To be internationally competitive in regional markets, Kenya must have relatively stable production during the entire year. Otherwise when there is a domestic milk shortage it is not feasible to develop a consistent, reliable, export market.
Future USAID development projects that support Kenya’s dairy sector should facilitate the production and storage of low-cost animal feed for use during the dry season as a means to minimize the decline in milk production during the dry season.
Through its FGDs with dairy producers (80), and interviews with dairy value chain operators (10), and Land O’Lakes previous project staff (9), the team learned that adequate supplies of nutritious animal feed and sufficient water during the dry season will offset the normal decline (of 35 percent) in milk production during the dry season.
The evaluation team learned through its interviews with KEBS and ESADA with that some countries
Work is needed to harmonize standards and
USAID should provide regional support to eliminate

124
within the region, particularly Zambia and Tanzania use milk quality standards (while comparing with South Africa dairy industry standards) as a non-tariff barrier to restrict imports of milk from Kenya.
to remove non-tariff barriers for exports to countries within the region.
non-tariff barriers that are inherit in EAC countries on milk imports from Kenya, and to support harmonization of quality standards within the region to enable access to regional markets.
1b. If the goal was not achieved, why not?
Interviews with the acting COP for KDSCP revealed that one project target – average productivity per cow of 15 liters per day by the end of the KDSCP – was considerably overstated as a result of the optimistic results that were reported at the end of the earlier KDDP project. KDSCP now reports an average baseline productivity of 6.4 liters per day, instead of approximately 8.5 liters per day that was provided by KDDP
This average was confirmed by evaluation team through interview of 90 dairy farmers ( on 50:50 gender basis) who reported a collective average of 7.0 and 5.5 for Central Kenya and Rift Valley respectively before project commencement in 2007/2008 season)
According to Ms. Munene of LOL, if farmers employ good feeding and husbandry practices, it is possible to double daily milk production per cow. However, to obtain benefits from improved animal genetics, a time of 4-5 years is required for an additional 50 percent increase in productivity, corresponding to four generations of successively improved offspring. Therefore, it was not possible for the project to achieve the targeted
The KDSCP inadvertently fixed an ambitious baseline/benchmark of liters per cow per day that was not based actual productivity before the beginning of the KDSCP
Future dairy projects should obtain accurate baseline/benchmark values of productivity in liters per cow per day as a basis for setting project targets

125
productivity of 15 liters/cow/day by the end of the project on April 31, 2013.
The acting KDSCP COP informed the team that another key project indicator was to improve the availability of quality animal feed provided through commercial markets for Kenya’s dairy farmers (not on-farm feed mixes). Soon after the beginning of KDSCP, the National Dairy Task Force (NDTF) assigned the responsibility of resolving the policy issues related to animal feed quality to IFAD, but little progress was made. Although considerable preparatory work has now been done, the legislative framework has lagged, and action by the National Assembly has not taken place.
The evaluation team has concluded that the comments of the acting KDSCP COP are valid.
This target was not met by the project.
USAID should advocate to the National Dairy Task Force to expedite the finalization of the legislative framework and policy issues related to animal feed quality.
2. What were the internal and external enabling factors that contributed to meeting or not meeting the intended goals?
a. BDS approach
The Land O’Lakes implementing partner instituted a “BDS approach” to KDSCP implementation. As described in project progress reports, its main features included developing a network of service providers containing multiple partners who provided a range of commercial services to small farmers and SBOs at each milkshed location. KDSCP activities were targeted on enhancing the capacity of suppliers of business development
The “BDS approach” was a creative means for enlisting the support of private service providers as a development tool to provide training and technical assistance to small farmer project
The “BDS approach” should be duplicated as an example for future USAID dairy development projects to follow.

126
services. The project helped to strengthen the service providers and linked them with their potential small farmer clients and their SBOs, and further enlisted the service providers to provide training and technical assistance to the farmers as part of their portfolio of commercial services. A key aspect of this approach was that it did not provide allowances to beneficiaries if they attended sessions such as project training activities that were provided for their benefit.
beneficiaries.
The “BDS approach” is an effective tool for value chain strengthening.
b. Farmer linkages
The KDSCP worked to form farmer groups into smallholder business organizations (SBOs) that were initially operated as self-help groups. With continued support from KDSCP and with the assistance of the Ministry of Cooperatives, nearly all of these have been registered as cooperatives. The Life of Project results from the KDSCP Performance Monitoring Plan indicates that a total number of producer organizations strengthened by the project is 135, without distinguishing how many of these have achieved the status of Cooperative organization. Of the total number of 135 organizations, the PMP report declares that all are sustainable business entities, since “All SBOs working with the program operate profitably, according to the official audit reports and the profit and loss accounts that are done on a monthly basis”. The main KDSCP support activity to these FBOs was to help them enter into contracts, and to help create sustainable business linkage with networks of business services suppliers. The KDSCP staff determined that some cooperatives needed business plans. Under a
Organizing farmers into SBOs for milk bulking results in a reduced cost and greater convenience of milk collection and delivery to the processor, and also increases the bargaining power for milk pricing held by the farmer organization that sells the milk to the processor.

127
demand-driven program, KDSCP engaged a subcontractor to help the cooperatives develop their business plans.
The creation and strengthening of the 135 SBOs enabled the smallholder dairy producers to bulk their milk leading to a better negotiated price/liter from the key milk processors.
By linking small farmers and their SBOs with commercial service providers the project effectively created support networks around the smallholder dairy farmers. The project also worked to strengthen the capacity of the service providers to help them deliver improved, professional services. For example, in 2011 the program embarked on building the capacity of livestock genetics suppliers for the dairy sector. A subcontractor was engaged to develop the standards for accreditation of AI service providers; link the service providers with educational institutions that offered refresher courses for them; train the service providers to better communicate the benefits of animal registration to farmers; identify sources of finance available to AI service providers, and to help formulate farmer action plans to improve performance of dairy breeding.
The network of private service providers created around the small farmers and their SBOs serve to reinforce the production capabilities of small farmers through capacity building, technology transfer, and the provision of required input supplies and services.
The creation of smallholder linkage with private service providers was considered to be a major project activity, and will undoubtedly be one of the main legacies of the KDSCP project.
KDSCP activities have focused on the provision of “embedded” (permanently available) services to enhance the quality and availability of services to
The continuous availability of services through a supply

128
the farmers, and to increase the sales volume and revenues for the service providers. All the service providers that worked with the program provided farmer extension services as an embedded service.
network of competing service providers enhances the quality of the services provided, and provides for long-term sustainability of service delivery.
Life of Project results reported by the PMP show that a total of 1042 firms providing new business services were linked to producers and their SBOs, compared to a target of 500 firms. This represents an increase of 108 percent over the life of project target.
The project target for the number of linkages created between smallholder dairy farmers and their service providers was considerably exceeded.
c. Training Through its outreach efforts, KDSC facilitated capacity building and training of dairy farmers. Farmer training forums focused on topics such as feed/fodder production, appropriate feeding regimes, feed conservation and formulation, modern breeding techniques, AI adoption and milk handling hygiene. The KDSCP Life of Project Results from the PMP show the number of producers receiving short-term training was 154,101, compared to a target of 153,000 producers trained. Actual training exceeded the target by slightly less than one percent.
The training target for the project was achieved.
The team’s interview with the KDSCP Acting COP revealed that capacity building was a major element of the project’s support to small farmers. The project held training seminars (with no payment made to those attending) and invited

129
private service providers to conduct training and to demonstrate their products and services. The project held seminars in hotels to provide business development training for SBO leaders including topics such as human resource management.
Based on the team’s interviews with previous KDSCP Coordinators (Nyeri, Gatanga and Lessos), and 30 SBO representatives in Nakuru, Lessos and Nyeri, the project facilitated farmer training through lectures (65 percent), livestock farmer field schools (20 percent), and demo farm visits or observational travel (15 percent). In most cases, training was provided by commercial service providers, such as agrovets and feed manufacturers through lectures at SBO farmers meetings. Based on the feedback the evaluation team received from smallholder farmers through the FGDs, training through demonstration is the most relevant to their needs. Demonstrations had 90 percent preference level (72/80 responses) and was voted as the most relevant to smallholder farmers understanding of dairying enterprise – also referred to as “seeing-is-believing”
87 percent of dairy farmers (69/80 responses) proposed that future projects should combine training lectures with demonstration and also use observation visits to see farmers in other locations.
Training interventions in which the farmers, themselves, decided on the topic of training to be covered were also found to be extremely effective
The livestock farmer field school (LFFS) methodology that was developed by the FAO and applied by ILRI has proven to be an excellent method for farmer training for KDSCP smallholders.
The evaluation team considers demonstration methods using LFFS techniques as the preferred group-based training method for small farmers, since its approach is “learn by doing” through participatory learning techniques.
Future USAID dairy support projects should to the greatest extent possible combine training lectures with demonstration and should also make liberal use of observation visits to see farmers in other locations.
The LFFS is the recommended field training methodology for small farmers.

130
training methods.
Based on interviews with 3 KDSCP team leaders, the main project benefit to small farmers was the training provided through farmer field schools. The farmers themselves chose a weekly training program from a menu of choices, such as disease control, calf care, and breed improvement. The SBOs organized weekly meetings for the benefit of their cooperative members. The project also supported farmer-to-farmer learning through observation visits to other dairy producers that were structured to provide skills development. The training was supplemented by attending events such as the National Breeders Show presented every two years at the Nyeri showgrounds by Brookside Dairies.
Information provided by the KDSCP implementation team revealed that the process of empowering the farmers through training has helped to enhance the sustainability of the small farmer support network within the value chains. Previously, for example, the service providers for animal disease control were more interested in making a quick sale of veterinary products than for conducting the required analysis and providing for long-term animal care. Now, the service providers charge the users a reasonable amount for their services they provide, but they are also willing to provide information and training to the farmers so that farmers are better able to utilize their veterinary services. This collaboration strengthens the value chains, and creates an environment
The process of developing longer-term relations between service providers and small farmers enhances the sustainability of the support networks for small farmers.

131
where customers are treated fairly with mutual respect.
Interviews with by the KDSCP implementation team members confirmed that dairy skills training for females is of great importance, since women are the primary caregiver for dairy animals. However, for maximum female attendance and training benefit, these interventions must be carefully scheduled at times when females are less likely to be occupied with their household responsibilities and farm work.
Farmers were trained in 14 key dairy practices. The farmer survey revealed the following percentages of farmers were trained in the different topics, ranging between 20–60 percent penetration (79/399 and 239/399 respectively), which shows a significant variance.
The percentage of farmers reached by the project’s training program is considered to be too low to ensure a sufficient transfer of skills for substantial improvement in dairy sector competitiveness.
Future USAID dairy support projects should strive to achieve a greater coverage with farmer training. A training penetration of at least 75% of project beneficiaries is recommended, with actual results to be determined by the project monitoring system.
AI/Breeding - 56%
Feeds and feeding - 56%
Animal health - 60%
Milk handling /quality -58%
Animal nutrition - 46%
Fodder establishment - 38%
Record keeping - 30%;
Financial services - 20%
Dairy as a business - 29%
Milk marketing - 21%;
Disposal of chemicals - 39%;
Integrated pest

132
Biogas - 20% management - 29%
Other – 2%
One milkshed coordinator (Nakuru) informed the evaluation team that a reason for the low percentage of farmers trained over the course of the project in that area was because the leaders of many SBOs did not fully embrace farmer training, and that some of the farmers did not realize its importance.
This finding on low turnout for farmer training indicates that initial training of SBO leaders is needed to ensure their understanding and support of the training process as an important means for improving the competitiveness of the dairy industry.
Future USAID dairy support projects should work to gain the unqualified support of SBO leaders before initiating the process of farmer training.
As described by KDSCP progress reports, the project successfully facilitated the development of the Dairy Farmers Training Manual, as a resource provided for dairy farmers to enhance their competitiveness and address productivity related challenges. The manual targeted smallholder dairy farmers and key stakeholders in the dairy subsector in the country. The manual was provided to help smallholder dairy farmers in their day-to-day management activities not only to produce milk efficiently for higher returns but also to produce milk sustainably in a clean environment.
Due to a lack of data, the team was unable to determine the impact of the training manual on dairy farmers.
As part of a campaign by the KLBO to require livestock inspectors to receive training and register with the respective Breeder Societies before being allowed to officially register animals,
The training and registration process has proven to be an important element of the

133
KDSCP provided training to 50 livestock inspectors. Based on the team’s interview with the previous Kenya Veterinary Association (KVA) Chairman, this support was instrumental in advancing the livestock registration process in Kenya.
livestock breed and registration process in Kenya.
As described by KDSCP project reports, the project facilitated training in international ISO standards and Quality Management Systems for technical staff in four leading dairy processors in Kenya (New KCC, Brookside, Happy Cow and Eldoville Dairies).
Processor staff training enhanced the competitiveness of four important dairy processors.
d. Credit The KDSCP PMP Life of Project results shows that a total number of 58,581 dairy farmers received loans from financial service providers, with female recipients amounting to about 37 percent of the total number. This number of loan recipients exceeded the project target of 45,000 loans by 30 percent. No data was given on the amount of loan financing provided to the recipients.
The dairy farmer survey found that 30 percent (119/399 responses) of dairy farmers had sought loans from various financial institutions for various uses of which dairy was the key reason for the loan at 49 percent (59/120 responses) followed by school/college fees (32 percent (38/120 responses) and by other business reasons by 29 percent (35/120 responses). These figures compare closely with the FGDs which found that of the 80 male and female farmers interviewed, 53 percent (42/80 responses) had sought dairy business credit from various financial sources. According to the farmer
The team has determined that financial institutions considered the reliable income received by smallholder farmers from dairy farming with repayment assured through a checkoff scheme implemented by the farmer cooperatives

134
survey, of the farmers who sought loans, 97 percent (116/120 responses) received while the remaining 3 percent were turned down due to mainly two reasons: 1) their HH was too low to receive a loan; 2) the HH had other pending debts to be repaid.
Based on the team’s discussions with previous KDSCP project staff, the project worked at three levels: 1) KDSCP facilitated the attendance of financial service providers at the farmer field school meetings, where they conducted a “show and tell” of their financial products. Once the SBOs had completed their business plans (as part of their development training), its members were able to receive bank credit facilitated by the cooperative. The cooperatives gave bank references for individual borrowers (not guarantees), which streamlined credit access. 2) The project linked farmers to service providers (SPs) who had obtained financing for their service requirements, such as motorbikes they used to visit their farming customers. 3) At the cooperative level, the project brought financial institutions (FIs) and cooperatives together where the two parties arranged financing for cooperative assets such as small trucks, computers, and digital scales.
KDSCP activities linked small farmers and their SBOs with financial institutions including Faulu Equity, Family Finance, SACCOS, Cooperative Bank, Equity Bank, Family Bank, and microfinance institutions such as ECLOF and Kenya Women
as a relatively low risk loan placement. This facilitated the availability of credit, and by working through the cooperatives, simplified the credit process for small farmers and also the bank.
Although smallholder credit is becoming increasingly available in Kenya’s rural areas, particularly for dairy farmers, it remains prohibitively expensive for most small farmers. Furthermore, their aversion to risk also limits the amount of credit they are willing to assume. Consequently, small farmers tend to limit their borrowing to urgent family needs, such as payment of school fees, medical payments, or very important social obligations.
While SBO leaders are generally familiar with the credit process and

135
Microfinance. Another source of farmer credit was through some SBOs that bought input supplies in bulk and sold on credit to farmers, which was repaid by the farmer from milk purchase payments at the end of the month.
According to the farmer survey, 89 percent (69/78 responses) of the dairy farmers who received training on financial services by the KDSCP were satisfied. The FGDs found that 95 percent (114/120 responses) of the dairy farmers and SBOs were aware of the financial services available after receiving training from the project team.
Also, 50 percent (60/120 responses) of the farmers in the primary survey believed that their participation in the KDSCP training had made it easier for them to obtain their loans, while 71 percent (85/120 responses) of the farmers were satisfied with the level of assistance they got from KDSCP in obtaining their dairy business loans.
During the project life, one SBO, the Kitiri Cooperative sponsored a rotating fund provided by the International Labor Organization that provided credit to young people for the purchase of a dairy cow. During the evaluation team’s focus group discussions with 40 SBO officials, it was mentioned that some cooperative organizations provide short-term cash advances to cover urgent household needs, although none of the SBOs that participated in the discussions actually provided this service to their members . These FGDs also revealed that some of the more advanced SBOs have created SACCOs for their members; while
the need for credit to finance investments, they lack the analytical capability to determine the affordability of investment finance. For example, the team saw an investment opportunity in a cooling plant by an SBO that could provide a financial return of nearly 50 percent per annum, but the SBO leaders were reluctant to assume a bank loan at an annual interest rate of 18 percent to finance the purchase of the cooling plant.

136
other SBOs have established a business relationship with SACCOs that were created by third party cooperative organizations, which provide financial services to the SBO members as well. For example, the evaluation team visited the Kiplombe Farmers’ Cooperative Society in Eldama Ravine (Nakuru milkshed area) that had a “guest” SACCO operating from its office that paid the affiliated farmers their monthly milk liquidation amounts. Wakulima SACCO in Mukurue-ini in Nyeri milkshed provided one of the most classic examples of what a dairy enterprise could achieve. Farmers in this SACCO obtained various loans ranging from dairy enterprise expansion; university and college fees loans; HH consumption loans; feeds and chemicals for livestock loans etc. the SACCO also had established a home ‘depot’ superstore where dairy farmers would obtain consumption goods on credit ranging from food stuffs, and other kitchen item. The loans were obtained at just 12 percent interested rate on declining balance. The SACCO is also in the process of outsourcing ‘offshore’ loans in order to begin lending to farmers at between 6-8 percent per annum.
The primary survey of dairy farmers revealed that various institutions were available to offer various financial services to dairy farmers as follows: SACCOs and MFI took the bulk of the share at 58 percent (70/120 responses), while banks had a share of 38 percent (47/120 responses) while self-help groups and NGOs had 8 percent (9/120 responses) and 2 percent (2/120 responses)

137
respectively. The popularity of SACCOs amongst the financial institutions was due to the fact that they offered loans at an interest rate that ranged from 10-12 percent per annum, while banks offered loans at higher rates of between 16-27 percent and NGOs offered loans at a very high rate of between 25-60 percent.
However, all the 80 (100 percent) dairy farmers and 40 (100 percent) SBO leaders that participated in the FGDs complained that extremely high interest rates by banks as well as SACCOS are a severe credit constraint that works to limit investments by individual farmers and SBOs. None of the farmers involved in these discussions mentioned that they had taken significant loans. 92 percent (37/40 responses) of the SBO leaders suggested that they need to be supported with a grant whereby they can offer farmers revolving credit at an interest of between 5-8 percent per annum.
During the discussion with the FGDs with 80 male and female farmers and 40 SBOs, various interest rate ranges acceptable to farmers and SBOs were discussed: when interest rate for loans was between 5-8 percent, 100 percent (120/120 responses) from the farmers and SBOs was affirmed with all the members agreeing to take loans. When interest rate increased to 9 percent, up to 85 percent (102/120 responses) of the farmers and SBOs showed interest in taking up loans. when interest was between 10-12 percent, 75 percent (90/120 responses) of the farmers and

138
SBOs were willing to take loans, and when interest moved beyond 13 percent, 0 percent (0/120 responses) of the farmers declined to take any loan.
The evaluation team came across a ‘sad’ case in Nyeri milkshed in Karatina area, where a young dairy farmer (29 yrs old) had taken a loan of Ksh 200,000 from a leading financial institutions that extends loans to farmers for purchase of 3 cross breed cows, but became unable to service the loan, and in the process was forced by the bank to sell off his cows to repay the loan, and the balance to be paid in installments for 2 years. The bitter experience left the young farmer ‘income poor’ and unable to meet HH needs. He informed the team that he would never again in future contemplate to take any further loan from a financial institution. By the time the evaluation team had a discussion with the young farmer, he had managed to pay a total of Ksh 260,000 in principal plus interest and yet was remaining with another 7 grueling months to complete the loan which he was servicing at a rate of Ksh 6,000 per month!
Based on the team’s interviews with Cooperative Bank in Nakuru, the bank charges interest rates ranging from 18 percent - 24 percent on its term loans to SBOs and individual borrowers, while the Taifa SACCO Bank provides loans to individual farmers as well as cooperative societies, based on their cash flow projections. It lends up to ½ the amount of cash flow projected for the length of

139
the loan, for up to a period three years. The interest rate for individual loans is 18 percent on the declining balance, with loan repayment starting immediately. Taifa provides loans to cooperatives for the installation of cooling plants, on the basis of a 10 percent capital ratio. Loans are provided up to 5 years, with the loan secured by the title to the plant. The interest rate for these loans is 10 percent on the declining balance. In addition to the interest payments, loan fees also add to the cost of borrowing. For example, if Taifa lends money to a farmer to buy a cow, the farmer must purchase (life) insurance on the cow while the loan is in effect. The borrower must also have life insurance. For loans to members of a cooperative, the cooperative officials must provide a “comfort letter” attesting to the good reputation and standing of the member. Personal guarantees from two other cooperative members are also required. Milk payments to the borrowing farmer are passed through the cooperative to Taifa. Taifa then deducts the farmers’ loan repayment and deposits the net amount into the borrowers account.
Three of the previous KDSCP milkshed coordinators interviewed expressed their belief that rural credit has become increasingly available over the life of the KDSCP project, primarily the result of increased competition. They observed that more and more microfinance institutions and commercial banks are promoting credit to groups and individuals.
The primary farmer survey had revealed that

140
KDSCP was the most important source of information on ‘sources of financial services’ that was provided to farmers at 67 percent (52/78 responses) while other information was provided by the MOLD (17 percent); private company (9 percent) and own farmer visits (9 percent) and lastly by vets (8 percent). KDSCP was therefore instrumental in making farmers aware about sources of finances and how to obtain them to improve their dairy enterprise.
The KDSCP managed a Business Innovation Grant Fund that was used almost exclusively to provide sub-awards to local consulting companies and other service providers to conduct studies and to implement program-related activities. The grant fund was not used for infrastructure investments or technology transfer.
USAID has recently established a separate, stand-alone Investment Fund mechanism with a budget of US $16 million that was created for infrastructure development to complement the KAVES project. This funding mechanism was conceived for facilities such as pack houses and product cold chains.
The stand-alone Investment Fund provides an opportunity to future projects such as KAVES to create new funding mechanisms that can provide substantial additional support to project beneficiaries through directed credit funds managed by existing financial institutions such as SACCOS.
In terms of its support to the dairy sector, part of the Investment Fund should be used to create a rotating fund managed by local financial institutions that would facilitate low-cost financing (5-8 percent interest rate) for smallholder investments in technology applications, such as chaff cutters and supplies needed for making on-farm silage, and particularly, for on-farm biogas production units.
Part of the Investment Fund would be used to provide credit for biogas installation led by KENFAP, the current principal actor. This would also be a low-cost rotating credit facility (5 percent - 8 percent interest) that would

141
be managed by a local financial institution with technical support from KENFAP and oversight by the USAID project implementation partner.
Part of the Investment Fund should be used to establish a rotating fund managed by local financial institutions to facilitate low-cost financing (5-8 percent interest) for SBOs to install milk coolers and peripheral services such as a stand-by electric generator and a water supply to serve the SBO milk collection facility and AI mobile units.
e. External factors
During periods of heavy supply, milk processors (5 responses) are unable to absorb the entire volume of milk produced by farmers, leading to non-collection of milk in some cases, low milk prices and delayed farmer payments.
During these periods, some processors tend to increase the amount of milk rejected due to more stringent quality standards (in pretext). In other cases, during these periods some processors impose a severe price reduction on producers that provide milk without supply contracts. (KDSCP
This situation reinforces the importance of having supply contracts. In light of the seasonal predictability of weather cycles, farmers can mitigate the effect of weather by producing drought-resistant crops such as sorghum, Sudan grass etc.
To mitigate the effect of cyclical milk production, future USAID support to the dairy industry should emphasize increased production and preservation of fodder as a source of animal feed during the dry season, along with better methods of water harvest and storage. Furthermore, future projects should support

142
Annual Progress Report October 2011– September 2012, October 30, 2012. p 40)
Based on the team’s interviews with the acting KDSCP COP, the project encouraged and promoted supply contracts between SBOs and milk processors to mitigate the effect of price changes by the processors.
production of drought-resistant crops such as sorghum and Sudan grass.
Conversely, based on numerous farmer interviews (75 responses) the team learned that Kenya’s dry season causes a decline in milk supplies. This is the result of reduced production of animal feed from natural rainfall. With a limited supply, milk prices tend to increase.
Of the farmers interviewed in the primary survey, 89 percent (357/402 responses) indicated that milk production per cow per day in the dry season reduces by between 25–39 percent because of limited availability of feed and adequate water. During the focus group discussions, 93 percent (111/120 responses) of the dairy farmers and SBOs indicated that milk production reduces by 41 percent during the dry season due to unavailability of adequate feed.
Kenya’s dairy industry is weather-driven, and a cyclical variation in milk supplies cause price variation and makes it difficult to serve both internal and external markets.
Based on the team’s observations and FGDs with 80 male and female dairy farmers and 40 SBOs, in some locations farm to market roads are extremely poor and become impassable after a heavy rainfall. Roads in the catchment area for Kiplombe Dairy near Eldama Ravine (Lessos milkshed) are particularly rough (In one section, which was barely 7 kms to the cooperative cooling
Impassable roads are a stumbling block for dairy production, since this increases the time required and the cost of transport and milk collection. Bad road conditions are also
USAID should encourage GOK to assess road conditions in the dairy producing areas and to prioritize those for upgrading in terms of the economic benefits that could be derived.

143
plant, it takes between 5-7 hours to move milk from farmers to the dairy cooperative), as are those serving Gakundi Dairy near Makurue-Ini town (Nyeri milkshed) and those serving dairy farmers in Tetu (SHAMA Dairies) in Nyeri.
detrimental to milk quality since this increases the length of time before the milk can be refrigerated.
In some parts of the Central Region the evaluation team visited, there have been notable improvements in road conditions based on reports of 11 local resident dairy farmers whom the team visited. For example, rural areas supplying the Wakulima Dairy at Mukurue-Ini (near the home of a family member of a previous Kenyan President) even rural roads are in excellent condition and milk collected from farmers there requires only two hours to be delivered to the dairy collection center where it is cooled.
Conversely, good roads lead to economic progress and substantial improvement in community living standards. They also lead to a per unit cost reduction per liter of transported milk and an improvement in milk quality.
The main challenge during FY 2011 was an outbreak of foot-and-mouth disease in 3 program milksheds, which caused the suspension of several events, especially livestock farmer field days. The program linked dairy cooperatives associated with the milkshed to agro-vets to facilitate the vaccination of their animals against foot- and-mouth disease. (KDSCP USAID Kenya Dairy Sector Competitiveness Program, Annual Progress Report October 2011– September 2012, October 30, 2012
The disease outbreak caused a reduction in the number of farmer field day events including farm demonstrations, reduced the number of trainings which translated into redundancy in farmer training and knowledge diffusion
USAID dairy projects should incorporate disease surveillance support mechanisms and make provision for a support component to partner with the DVS to counter disease outbreak threats
The Government of Kenya has reviewed some aspects of the Law (Cooperative act of 2003 and Cooperative rules of 2004) and formulated new policies (Cooperative policy paper 2004) to promote revival and better management and
Over the project period, revitalized government policy and a favorable operating environment favored the KDSCP in

144
profitability in cooperatives. Besides amendment of the cooperative act in 2004, the government has also developed strategies to create wealth and reduce unemployment (Economic Recovery Strategy of June 2003) and revitalize agriculture (Strategy for revitalizing Agriculture of March 2004). Part of these strategies involved revival of cooperative sector by promoting policies friendly to the marketing cooperatives. As a result of these interventions, cooperatives have had a turnaround effect and recorded a commendable growth in the recent past. (KDSCP USAID Kenya Dairy Sector Competitiveness Program, Cooperatives Performance Assessment and Action Planning, Undated, p 14)
the dairy industry’s turnaround and improved performance
The evaluation team has observed that Kenya’s macro-economic stability as a result of short-to-medium-term economic policies and its good control over inflation have created a presently favorable business climate for the dairy industry.
Based on the team’s focus group discussions with 40 SBO leaders and 80 farmers, there has been increased competition for milk produced by small farmers over the life of the KDSCP. SBOs must compete with informal traders for milk produced by small farmers; SBOs have the option to sell to different milk processors, and in all the milkshed locations the team visited there are direct milk outlets such as milk bars or dispensers that buy milk from SBOs or informal traders.
Increased competition among milk buyers has led to an upward movement in prices over the life of the KDSCP project. For example, the average farmgate milk price has increased from approximately Ksh 18 per liter in 2008 to around Ksh 34 per liter in 2013 in most

145
locations. This corresponds to an increase of 89 percent.
The predominant consequence of the post-election violence that occurred in 2008 was a substantial increase in the cost of production, as reported in the KDSCP baseline survey. It also led to loss of 20 percent of dairy livestock and displacement of dairy farmers, mostly in the Rift Valley. Of the loss in livestock, Rift Valley bore the greatest brunt with 80 percent loss while Central lost just a few animals. The post - election violence also had the effect of significantly exacerbating the effects of drought during the 2008-2009 fiscal year, which caused significantly lower yields as compared to the Kenya Dairy Development Program’s (KDDP’s) final yield levels as well as the baseline value especially in the Rift Valley Province. Those interviewed for the baseline survey cited increase in cost of both animal feed and mineral supplements and disease management as the major problems faced after the PEV – both due to limited supply (both products and services) and increased transport cost. ( KDSCP Annual Progress Report October 2008 – September 2009, P11, p38)
Based on the team's interviews with officials at ESADA, KEBS, and KDPA, the Regional EAC market access for dairy products is limited by trade barriers erected by neighboring countries and the lack of harmonization of quality standards within the trading community.
Lack of harmonization and trade barriers limits Kenya’s exports to EAC countries, as well as to other trade blocs such as SADC.
USAID should provide regional support to eliminate non-tariff barriers on milk that are inherent in EAC countries and to harmonize quality standards to enable access to

146
regional markets.
Interviews with the KDSCP Acting COP revealed that the National Dairy Task Force (NDTF) was created early in the KDSCP project life with the support of the project team. The KDSCP project team leader has served as the co-chairperson (with the National Dairy Board) of NDTF over the life of the project. The NTDF provides a forum for all the development partners engaged in Kenya’s dairy development.
A positive factor on project implementation was the industry leadership provided by the NDTF. The NTDF provides a means for coordination of dairy development activities in the country.
Future USAID dairy support projects in Kenya should participate in the NDTF.
4. What is the evidence concerning the sustainability of the end results produced by the program?
Based on the KDSCP Performance Monitoring Plan (PMP), the project has strengthened 135 self-help groups, limited companies and producer cooperatives. Institutional strengthening has included management training and capacity development for business and strategic planning (approximately 2 trainings per year per SBO). Training is a continuing requirement, in view of the frequent turnover of SBO leadership and SBO management, with the election of new leaders who assume management positions. A general rule of thumb for cooperative development is that support for 10 years is required to fully strengthen
The sustainability of the SBOs will largely depends on their management capabilities. With good management, the SBOs will most likely survive. However, even if a given SBO fails as a business, the milk produced by its members will not disappear. The SBO organization can be revived under new
Future projects should continue to support management training and development within the SBOs. Support should also be provided for the development of strategic and business plans to provide a guide for their business activities.

147
a producer cooperative (view expressed by 3 milk coordinators and 3 team leaders in the KDSCP).
management, even as a different operating entity such as a private company (2 successful cases reported).
For assured future growth and development, the SBOs will need continued external support for institutional strengthening.
The PMP indicates that KDSCP has linked all the 135 farmer groups with service providers in the 8 milksheds. Based on KDSCP progress reports and the team’s interviews with project officers, the project has helped to establish linkages between small farmers that are associated with the assisted SBOs, and other value chain operators including service providers. The number of producers accessing/ receiving/ utilizing BDS services, inputs, technologies, and management practices is reported to be 239,778 by the PMP.
The linkages between small farmers and those who provide products and services to them are based on commercial transactions. As long as these commercial transactions are mutually beneficial and profitable for both parties, they are sustainable. Even if some of the established commercial ties do not continue between two parties, the networks themselves will continue.
Based on KDSCP progress reports (2011, 2012, and 2013) and the team’s interviews with 9 project
The farmers and value chain operators
Part of the Infrastructure Fund provided by USAID that is

148
officials, the project has supported the transfer of technology to small farmers who are associated with the assisted SBOs, and also to the supported SBO organizations themselves. The PMP reports that at the end of the project, 184,586 dairy producers are using improved technology.
More than 10 duplicable dairy technologies utilized by farmers and SBOs has been documented
• AI/breeding/genetic improvement • Feed management/production/storage • Modern Cow shed construction • Milk coolers • Digital milk weighing machine • Chaff cutters • Feed mixers/multipurpose machine • Biogas production for clean energy has been
adopted by some farmers • Use of milk cans/aluminum has been enhanced • Milk testing using lactometers has been
introduced • Spraying to protect animals from pest has been
introduced
appreciate and enjoy the benefits of technology. None of those interviewed wants to turn back the clock and give up the benefits gained from technology advances.
The greatest constraint to the use of technology by small farmers is the cost of the innovation, and the limited availability of affordable finance.
available to the KAVES project should be used to create a rotating fund managed by local financial institutions that would provide low-cost credit (5–8 percent) to small farmers to support technology adoption.
Project support to 135 SBOs and their practice of milk bulking has resulted in increased milk prices to small farmers from a low of Ksh 18 per liter in 2008 to a high of 34 per liter in 2013.
Dairy farmers selling directly to processors and not through cooperatives have reported a reduction in milk price per liter by between 20–35 percent
The innovation of milk bulking increases marketing efficiency and also provides greater bargaining power to the SBOs in their negotiations of milk selling prices with dairy processors. An

149
Average milk price per liter movements during project life was:
Before the project, the price of milk in 2008 was 18 Ksh/liter and during the project, the prices increased as follows: 2009: 20Ksh/lt: 2010: 22-24Ksh/lt: 2011: 24Ksh/lt: 2012: 25-27Ksh/lt: 2013: 34ksh/lt
Single dairy farmers selling directly to processors and not through cooperatives have reported a reduction in milk price per liter by between 20–35 percent
important factor for the long-term viability and sustainability of SBO is high milk prices, which provide greater income for the organization and its members, and reinforces the linkages between the SBOs and their associated small farmers.
Dairy farming supports other family enterprises, through the cash flow it generates and the by-products that it produces. Cash flow from dairy provides investment capital for other crops and farm investments. The dairy by-product, animal waste, provides fertilizer for other cash crops including coffee, vegetables, and bananas, and can also support organic production of food crops. Furthermore, dairy is a springboard for the creation of other enterprises, such as the production and sale of breeding cattle.
Some dairy farmers (35 responses) reported an additional income ranging between 35 percent and 57 percent from dairy enterprise subsidiaries
The economic importance of dairy farming to family income and livelihood is a strong indicator of its sustainability.
Media reports indicate that dairy processors are expanding their capacity. Brookside is expanding its production capacity for milk powder by 300,000 liters per day (new facility ready for commissioning). New KCC has also increased its capacity and Kithunguri, the third-largest dairy
These investments provide strong evidence that Kenya’s dairy industry, whose production base is predominantly small
In view of the increasing competition within the milk processing subsector, it is recommended that future projects should NOT support the expansion of SBOs into
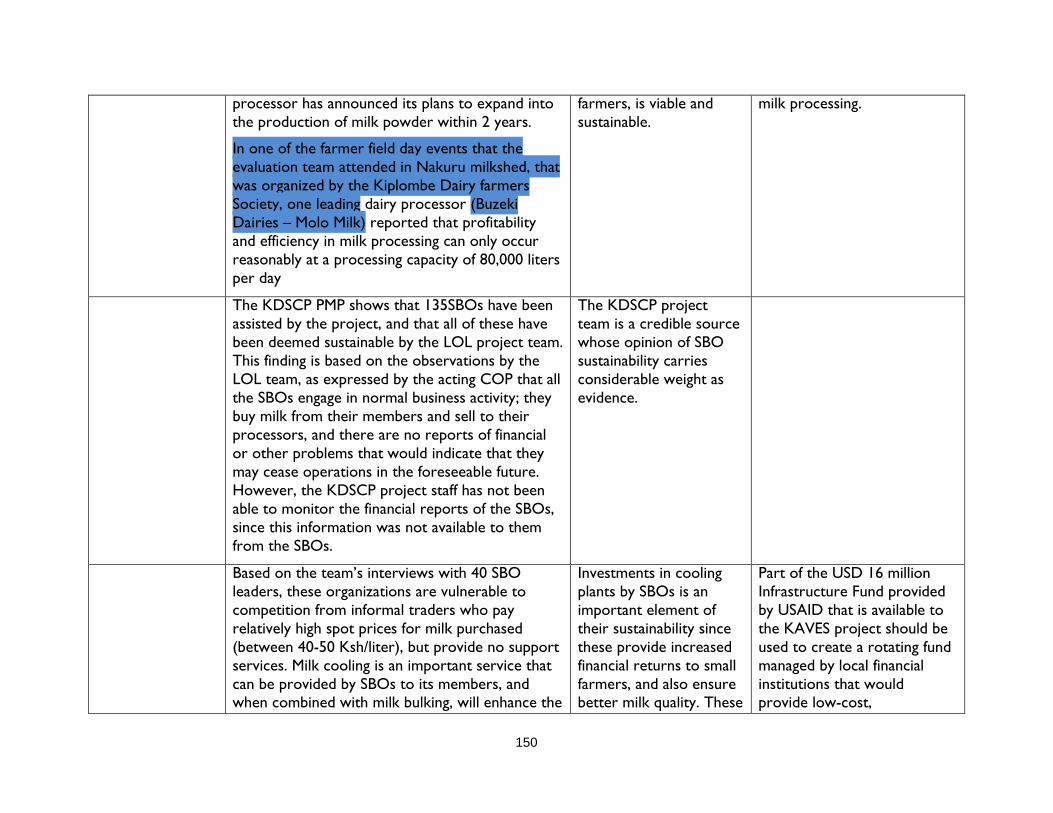
150
processor has announced its plans to expand into the production of milk powder within 2 years.
In one of the farmer field day events that the evaluation team attended in Nakuru milkshed, that was organized by the Kiplombe Dairy farmers Society, one leading dairy processor (Buzeki Dairies – Molo Milk) reported that profitability and efficiency in milk processing can only occur reasonably at a processing capacity of 80,000 liters per day
farmers, is viable and sustainable.
milk processing.
The KDSCP PMP shows that 135SBOs have been assisted by the project, and that all of these have been deemed sustainable by the LOL project team. This finding is based on the observations by the LOL team, as expressed by the acting COP that all the SBOs engage in normal business activity; they buy milk from their members and sell to their processors, and there are no reports of financial or other problems that would indicate that they may cease operations in the foreseeable future. However, the KDSCP project staff has not been able to monitor the financial reports of the SBOs, since this information was not available to them from the SBOs.
The KDSCP project team is a credible source whose opinion of SBO sustainability carries considerable weight as evidence.
Based on the team’s interviews with 40 SBO leaders, these organizations are vulnerable to competition from informal traders who pay relatively high spot prices for milk purchased (between 40-50 Ksh/liter), but provide no support services. Milk cooling is an important service that can be provided by SBOs to its members, and when combined with milk bulking, will enhance the
Investments in cooling plants by SBOs is an important element of their sustainability since these provide increased financial returns to small farmers, and also ensure better milk quality. These
Part of the USD 16 million Infrastructure Fund provided by USAID that is available to the KAVES project should be used to create a rotating fund managed by local financial institutions that would provide low-cost,

151
competitiveness of SBOs (can earn an additional Ksh 2 per liter and later benefit from the milk grade pricing regime when it becomes operational).
cooling facilities are an essential part of the cold chain for fresh milk, and will help to ensure the long-term viability of the SBOs. The installation of cooling plants will therefore be a contributing factor to the sustainability of SBO organizations.
intermediate term credit (5–8 percent) for SBOs to support the installation of milk cooling units and their peripheral equipment, including services such as electricity and water.
5. To what extent did the program employ new approaches?
a. BDS approach
The Land O’Lakes implementing partner instituted a “BDS approach” to KDSCP implementation. As described in project progress reports, its main features included developing a network of service providers containing multiple partners who provided a range of commercial services to small farmers and SBOs at each milkshed location. KDSCP activities were targeted on enhancing the capacity of suppliers of business development services. The project helped to strengthen the service providers and linked them with their potential small farmer clients and their SBOs, and further enlisted the service providers to provide training and technical assistance to the farmers as part of their portfolio of commercial services. A
The “BDS approach” was a creative means for enlisting the support of private service providers as a development tool to provide training and technical assistance to small farmer project beneficiaries.
The “BDS approach” is an effective tool for value chain strengthening.
The “BDS approach” should be duplicated as an example for future USAID dairy development projects to follow.

152
key aspect of this approach was that it did not provide allowances to beneficiaries if they attended sessions such as project training activities that were provided for their benefit.
b. Technology transfer
The KDSCP Life of Project Results reported by its PMP shows that over the project life, KDSCP made 31 new technologies/management practices available for transfer to project beneficiaries and stakeholders. Of these 31 technologies provided by KDSCP, ten technologies that were mentioned most frequently by small farmers and SBO leaders in the focus group discussions were technology transfer for genetic improvement (artificial insemination and breed improvement); feed management (chaff cutters; multipurpose feed mixers; silage making); animal husbandry (zero grazing, agrovet services); energy use (biogas); milk quality control by SBOs, and information management.
Of the ten technologies that were mentioned during the FGDs, the one considered to be most important was artificial insemination (AI).
Of the 88 farmers that were polled during the focus group discussions, 85% (74/88 responses) ranked by priority the most important technologies as being AI/breeding, followed by silage/feed making, and then the use of modern dairy sheds as animal shelters.
Also based on the focus group discussions, of the ten important technologies that were identified, 100% of those are being used in the Central
Farmers recognize AI/breeding as being important technology because it upgrades the dairy herd and increases milk production by successive generations of dairy cattle. AI technology also enables farmers to produce extremely valuable purebred (pedigreed) dairy animals after controlling the breeding for four generations of offspring. Silage making is critical to ensuring feed supplies and ensuring milk production during the dry season. The use of cow sheds is a requisite for zero grazing and improved animal husbandry. Since very small farm sizes predominate in the Central Region, zero grazing is the primary means of animal
Future projects should continue to emphasize and support the use of these most important technologies through information, demonstration and training.
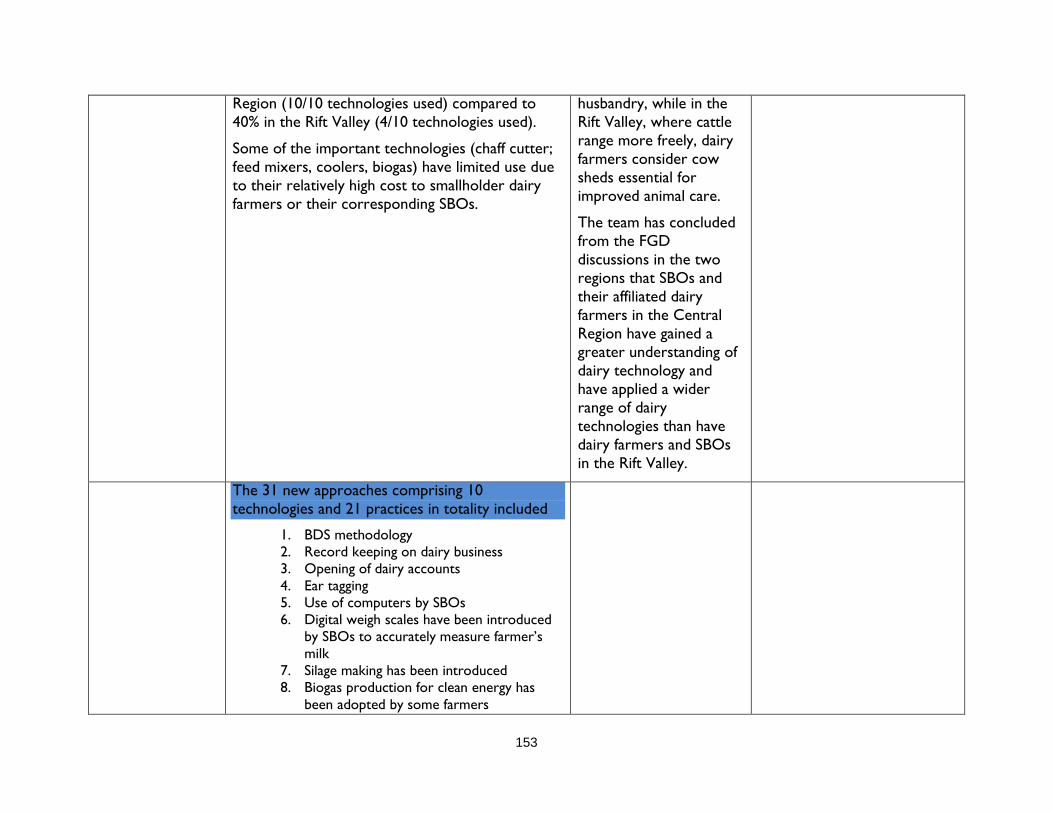
153
Region (10/10 technologies used) compared to 40% in the Rift Valley (4/10 technologies used).
Some of the important technologies (chaff cutter; feed mixers, coolers, biogas) have limited use due to their relatively high cost to smallholder dairy farmers or their corresponding SBOs.
husbandry, while in the Rift Valley, where cattle range more freely, dairy farmers consider cow sheds essential for improved animal care.
The team has concluded from the FGD discussions in the two regions that SBOs and their affiliated dairy farmers in the Central Region have gained a greater understanding of dairy technology and have applied a wider range of dairy technologies than have dairy farmers and SBOs in the Rift Valley.
The 31 new approaches comprising 10 technologies and 21 practices in totality included
1. BDS methodology 2. Record keeping on dairy business 3. Opening of dairy accounts 4. Ear tagging 5. Use of computers by SBOs 6. Digital weigh scales have been introduced
by SBOs to accurately measure farmer’s milk
7. Silage making has been introduced 8. Biogas production for clean energy has
been adopted by some farmers

154
9. Fodder management has been enhanced 10. Breeding/AI 11. Sexed semen AI 12. Embryo transfer 13. Pedigree production stages/upgrading 14. Registration of livestock breeding records
with KLBO 15. Chuff cutter machines have been
introduced 16. Feed mixers/grinders/ration machines 17. Use of agro-vet services 18. Zero grazing units have been established 19. Rotational grazing 20. Farmer field schools, demonstrations and
tour visits 21. Semi zero grazing 22. Milk testing using lactometers has been
introduced 23. Spraying to protect animals from pest has
been introduced 24. Use of milk cans/aluminum has been
enhanced 25. Value addition to milk has been introduced 26. Cooling and chilling has been introduced by
SBOs 27. Use of concentrates for lactating cows 28. Use of mineral elements to boost milk
production 29. Easy to manage veterinary services 30. Water harvesting in semi dry areas and
during dry seasons 31. Modern milk transport trucks uses by
some SBOs
Based on the KDSCP Life of Project Results, The impact of AI and AI technology should continue

155
184,586 additional farmers are using improved technology. The KDSCP report further states that program data shows a marked increase in the proportion of farmers using AI (97.36 percent) compared to the baseline proportion (39.9 percent).
Based on the farmer survey conducted during the evaluation, the percentage of farmers using AI was found to be 56 percent (223/399).
improved breeds on dairy farmers that have received support from KDSCP has been substantial.
to be supported by future dairy development projects.
Future dairy projects should further emphasize animal feed production and feeding practices, and general animal husbandry to realize the full benefits of the genetic improvements that have already taken place in the dairy industry.
Based on observations during the evaluation team’s visits to smallholder farms, and the team’s focus group discussions with 40 SBO leaders and 80 small farmers, the KDSCP worked extensively to improve on-farm production and storage of animal feed. However, the project achieved only 30 percent (24/80 affirmative responses) penetration.
Project support to on-farm production of animal feed and the use of balanced feed rations resulted in increased milk productivity per animal and lower milk production cost.
However, the penetration of this technology with small farmers was limited.
Improved feed rations for smallholder dairy farmers should be a key component of future dairy development projects in Kenya.
Smallholder focus group discussions with 80 dairy farmers and 40 SBOs revealed that a major limiting factor in technology adoption is the cost, and the limited availability of affordable credit to acquire the technology and equipment.
Seventy-five percent (6/8) of the technologies requiring equipment purchases are not fully utilized to potential by farmers and SBOs due to
Farmers are aware of the benefits of technologies such as chaff cutters and biogas, but do not have the available resources to adopt them.
USAID should conduct a rapid survey of viable rural financing programs in Kenya to inform the development of a financing scheme for small dairy farmers and SBOs that could be used to finance technological innovations, including chaff

156
their high cost expense (chaff cutters, coolers, mixers, biogas, ICT/computers.
90 percent (108/120) of farmers and SBOs interviewed prefer to access low cost credit of between 5-8 percent interest rate to use new technologies.
Ninety percent (108/120) of farmers and SBO leaders in the focus group discussions would be willing to purchase new technologies if low cost credit of between 5-8 percent interest rate was accessible to them from financial institutions that lend money.
cutters, biogas units, and milk cooling units. An example of one credit facility that could be considered is the GOK-supported Women Enterprise Fund that is available through Cooperative Bank, Family Bank, Taifa SACCO and others. Based on the findings of the study, future dairy projects should create a revolving fund managed by financial institutions/SACCOs to provide low-cost credit (5 percent - 8 percent interest rate range) for affordable access to new technologies by SBOs and farmers.
7. To what extent were environmental compliance mitigation measures identified at the beginning of the project effectively implemented, including Pesticides Evaluation Reports and
Environmental compliance mitigation measures were identified at the beginning of the project through the KDSCP Pesticide Evaluation Report and Safer Use Action Plan (PERSUAP).
USAID policy is to ensure that the environmental consequences of USAID-financed activities are identified and considered by the Agency and the host country prior to a final decision to proceed, and that appropriate environmental safeguards are adopted. USAID policy also requires that developing countries be assisted to strengthen their capabilities to evaluate the potential environmental effects of proposed development strategies and projects, and to implement and
The KDSCP did not comply with the environmental reporting requirements as defined by the PERSUAP.
The team has concluded that there appears to have been a considerable misunderstanding by the KDSCP COP and senior project management on the requirements spelled out by the PERSUAP.
Land O’Lakes carried out
Future projects should provide greater clarity to the implementing partner with regard to the requirements under PERSUAP for environmental monitoring and reporting.
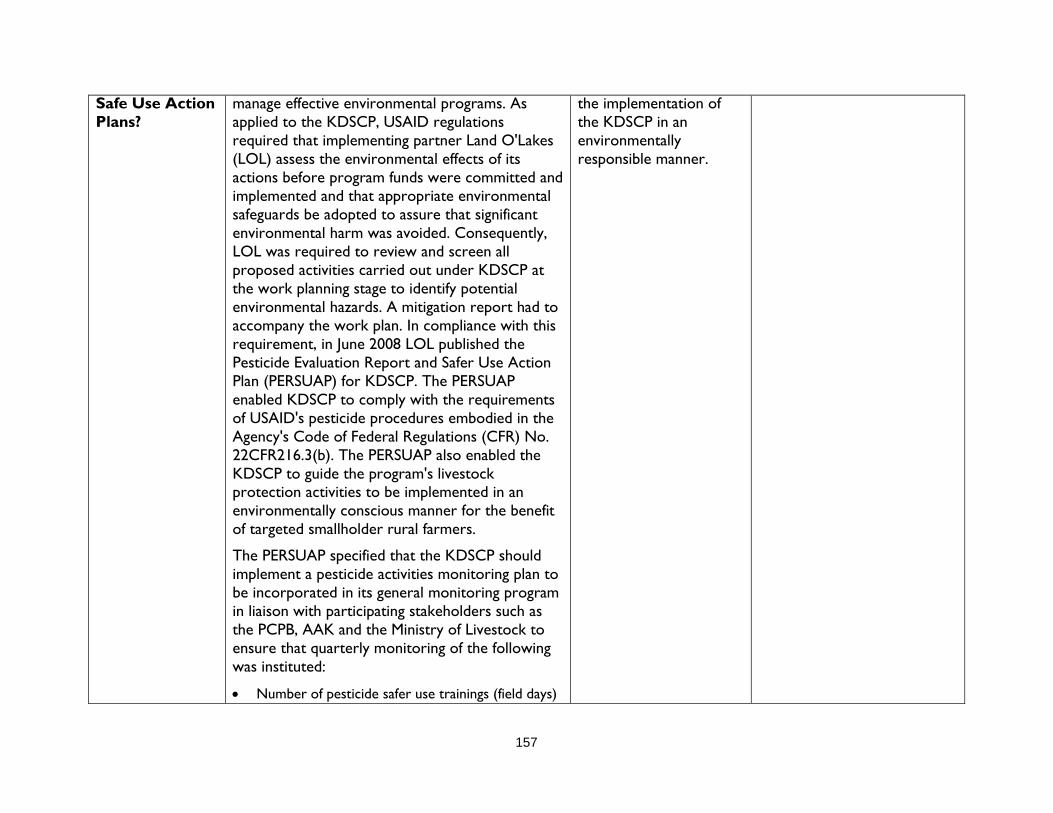
157
Safe Use Action Plans?
manage effective environmental programs. As applied to the KDSCP, USAID regulations required that implementing partner Land O'Lakes (LOL) assess the environmental effects of its actions before program funds were committed and implemented and that appropriate environmental safeguards be adopted to assure that significant environmental harm was avoided. Consequently, LOL was required to review and screen all proposed activities carried out under KDSCP at the work planning stage to identify potential environmental hazards. A mitigation report had to accompany the work plan. In compliance with this requirement, in June 2008 LOL published the Pesticide Evaluation Report and Safer Use Action Plan (PERSUAP) for KDSCP. The PERSUAP enabled KDSCP to comply with the requirements of USAID's pesticide procedures embodied in the Agency's Code of Federal Regulations (CFR) No. 22CFR216.3(b). The PERSUAP also enabled the KDSCP to guide the program's livestock protection activities to be implemented in an environmentally conscious manner for the benefit of targeted smallholder rural farmers.
The PERSUAP specified that the KDSCP should implement a pesticide activities monitoring plan to be incorporated in its general monitoring program in liaison with participating stakeholders such as the PCPB, AAK and the Ministry of Livestock to ensure that quarterly monitoring of the following was instituted:
• Number of pesticide safer use trainings (field days)
the implementation of the KDSCP in an environmentally responsible manner.

158
• Number of farmers and agro-chemical dealers trained
• Number of farmers adopting safe use practices of pesticide use, such as the use of protective clothing and following other safety recommendations such as washing, storage, container disposal and environmental considerations
• Number of disease incidence to indicate the efficacy of pesticides and IMP methods being used
• Registration status of recommended dairy pesticides.
In addition to supporting and encouraging the safe use of pesticides, KDSCP demonstrated sustainable dairy production by introducing leguminous fodder crops to improve feeds and protect the soil; silage to reduce overgrazing; metal cans for hygienic transport of milk; the safe handling and disposal of agrochemicals and pharmaceuticals, and biogas energy for family use to reduce deforestation.
KDSCP progress reports reports and FGDs with smallholder dairy farmers and their affiliate SBOs indicated that KDSCP developed a PERSUAP pesticide use plan; trained farmers on environmentally-friendly feed production, and promoted biogas generation.
The KDSCP trained farmers through field days on basic environmental management as part of its farmer training. Eight focus group discussions comprising 80 male and female farmers revealed that farmers are generally aware of, and practice environmentally-friendly farming through the use of fodder as a means for terracing, for reducing
The team has concluded that farmers are conscious of the importance of protecting the environment. They follow environmental protection and natural
Future dairy projects should continue to provide training and demonstration for smallholder dairy farmers in environmentally-friendly farming practices for on-farm production of animal feed.

159
soil erosion, and for producing feed for livestock. They are also aware of, and practice the use of animal waste as a source of fertilizer.
• In the Central Kenya region, 95 percent (38/40 responses) of dairy farmers use fodder for terracing sloppy land
• In the Rift Valley, 65 percent (26/40 responses) planted trees as shade and boundaries for livestock paddocking and environmental conservation
• In Central Kenya 100 percent (40/40 responses) of dairy farmers used cow dung as manure for crops
• In the Rift Valley, 75 percent (30/40) used manure for crop production and fertilization of paddocks
• Of the 40 SBOs in the FGDs, 78 percent (31/40) indicated that they informed the members of the need to preserve the environment
• Discussions in the FGD with the 80 farmers and 40 SBOs revealed that 69 percent (82/120 responses) knew about NEMA and its requirements on environmental conservation on the farm by farmers
resource management. Training should include methods such as fodder terracing, pasture rotation, and planting fodder trees.
12 Focus group discussions comprising of 80 farmers and 40 SBO officials revealed that 81 percent (97/120 responses) farmers are aware of the means to ensure the safe use of chemicals, of the need to use protective clothing, and for the safe disposal of chemical containers. However, 90 percent (108/120 responses) do not use protective clothing because they are an expense item which they cannot afford. 17 percent (20/120 responses) of the farmers in the focus groups reported that they would normally drink milk after applying pesticides as a means to counter/neutralize the effects of the chemicals
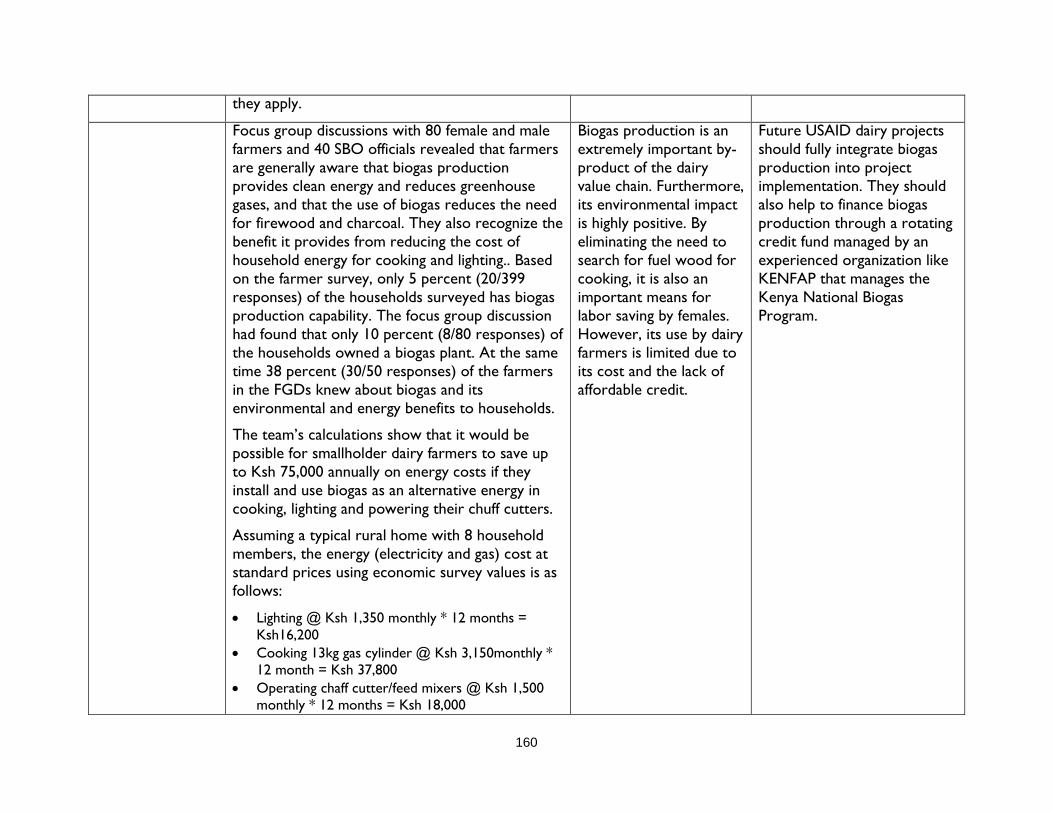
160
they apply.
Focus group discussions with 80 female and male farmers and 40 SBO officials revealed that farmers are generally aware that biogas production provides clean energy and reduces greenhouse gases, and that the use of biogas reduces the need for firewood and charcoal. They also recognize the benefit it provides from reducing the cost of household energy for cooking and lighting.. Based on the farmer survey, only 5 percent (20/399 responses) of the households surveyed has biogas production capability. The focus group discussion had found that only 10 percent (8/80 responses) of the households owned a biogas plant. At the same time 38 percent (30/50 responses) of the farmers in the FGDs knew about biogas and its environmental and energy benefits to households.
The team’s calculations show that it would be possible for smallholder dairy farmers to save up to Ksh 75,000 annually on energy costs if they install and use biogas as an alternative energy in cooking, lighting and powering their chuff cutters.
Assuming a typical rural home with 8 household members, the energy (electricity and gas) cost at standard prices using economic survey values is as follows:
• Lighting @ Ksh 1,350 monthly * 12 months = Ksh16,200
• Cooking 13kg gas cylinder @ Ksh 3,150monthly * 12 month = Ksh 37,800
• Operating chaff cutter/feed mixers @ Ksh 1,500 monthly * 12 months = Ksh 18,000
Biogas production is an extremely important by-product of the dairy value chain. Furthermore, its environmental impact is highly positive. By eliminating the need to search for fuel wood for cooking, it is also an important means for labor saving by females. However, its use by dairy farmers is limited due to its cost and the lack of affordable credit.
Future USAID dairy projects should fully integrate biogas production into project implementation. They should also help to finance biogas production through a rotating credit fund managed by an experienced organization like KENFAP that manages the Kenya National Biogas Program.

161
• Firewood for boiling bathing water and water to clean dairy cow udder before milking: @ Ksh 250 monthly * 12 months = Ksh 3,000
TOTAL ANNUAL HOUSEHOLD ENERGY COST =Ksh 75,000
Income from other Subsidiary enterprises from biogas by-product assuming a biogas unit of 12 cubic centimeters of gas plant:
• Slurry as organic manure quarterly sales @ Ksh 3,500 *4 = 14,000
• Weekly sale of organic vegetables @ Ksh 300*40 weeks = 12,000
• Back yard Banana production @ Ksh 200*10*4 quarterly for 4 quarters = 8,000
• Cereals and pulses ½ acre incremental yield multiplication factor of 0.45 @ 15,000 twice a year which comes to 30,000*0.45 = 13,500
• Cash crop/coffee/pyrethrum 1 acre incremental yield multiplication factor of 0.25 @75,000 which comes to 75,000*0.25 = 18,750
Based on the evaluation team’s interview with the KENFAP biogas technician in Nakuru, his calculations show that it would be possible for smallholder dairy farmers to save up to Ksh 75,000 annually on energy costs with an 8 cubic meter biogas unit that would be suitable for a normal size family with three dairy cows. The cost of the unit would be Ksh 80,000 – 90,000, which corresponds to a payback period of slightly more than one year. Biogas could provide an energy source for cooking, lighting and powering machinery such as chaff cutters.

162
6. Gender considerations
Based on KDSCP progress reports and interviews with 9 project management teams, KDSCP “mainstreamed” support for gender equality, and promoted female participation and leadership in the SBOs that it supported. Aligned with the new constitution in Kenya, the project was able to integrate women and the youth in the management affairs of SBOs.
KDSCP “mainstreamed” gender equality. Of the total number of dairy farms surveyed, women managed 37 percent of them (147/399 responses)
Discussions with 40 SBOs showed that females now fill 30 percent of the positions for Management Committee Officials for SBOs representing an average 30 percent (3/10 responses) in decision-making levels. However, regional representation was more pronounced with Central Kenya having a women representation of 40 percent (4/10 responses) and Rift Valley having a women representation index of 20 percent (2/10 responses) in the management committees of SBOs. Explanation given was that in Central Kenya, women’s rights are advocated as a default and women are more literate and aware of their rights than in the Rift Valley, where the SBOs have been ‘forced’ to adopt the 1/3 gender rule due to the requirements of the new Kenyan constitution, and similarly, women in the region are less literate and more suppressed with
An approach to supporting gender equality in future projects would be to provide capacity building for females to help them achieve positions of financial leadership in farmer organizations.
Future USAID dairy support projects should provide targeted training to females in SBO leadership positions, including those for financial management.

163
sociocultural norms that favor men in society.
In terms of membership in cooperative societies, women constitute 29 percent (115/399 responses) of members of SBOs.
Based on the FGDs with the SBO leaders, there is a preference for females by SBO members in elective positions (treasurer) where money is involved, since females are considered to be more accountable and reliable than males in financial matters.
In view of their household duties and the wide range of farm labor they perform, females derive considerable benefit from labor-saving technologies, particularly from zero grazing practices, chaff cutters, and biogas production.
During the FGDs with 80 male and female dairy farmers, it was reported by 87 percent (70/80 responses) of the farmers that the use of chaff cutters had significantly saved on the amount of hours that women spend feeding livestock by between 4-5 hrs in a day. Similarly, it was reported by 61 percent (14/26 responses) of farmers who owned a biogas plant that women had reduced the amount of hours spend on preparing food by 4 hrs/day. Furthermore, 43 percent (10/24 responses) of the responding males said they had started helping women to prepare food in the kitchen due to the easy workload from the use of biogas unlike the firewood with its associated risks from fire and smoke.
Zero grazing reduces the female workload from herding animals; chaff cutters reduce the labor of grinding and cutting fodder as animal feed, and biogas reduces the time required for searching for fuelwood and for preparing meals.
Future USAID dairy projects should provide a low-cost rotating credit (5-8 percent interest rate) fund to support the purchase of technology and equipment, with greatest emphasis on technologies most useful for females.

164
Female control over resources has increased during KDSCP project, (41 percent in Central Kenya – 36/90 responses) but less progress was seen by the evaluation team in Rift Valley (less that 11 percent - 9/90 responses) due to sociocultural factors.
In Central Kenya, 60 percent (239/399 responses) of women farmers have been empowered through income generation and property ownership (but <5 percent in Rift Valley – 19/399 responses)
In the Rift Valley, discussions with male farmers and SBO leaders revealed that culturally, the society is male denominated, more conservative, and change is relatively slow. Females are members of SBOs and hold some leadership positions, but their role in decision making is not as pronounced as in the Central Region.
Female involvement in the dairy industry in the Central Region is prominent and advanced. The project has helped to advance women’s participation and leadership in producer organizations, and women play a substantial role in decision making and the sharing of income from the family dairy enterprise.
The project impact in terms of female empowerment is greater in the Central Region than in the Rift Valley.
In the Rift Valley, females are generally less empowered than in the Central Region.
Future USAID projects should proactively support female empowerment through quotas and affirmative action.
In the Rift Valley, six focus group discussions comprising 40 male and female farmers and 20 SBOs revealed that dairy animals normally belong to males whereas females are merely workers who tend the animals, with little sharing of income from the dairy business. While there has been progress in women’s participation and leadership in farmer organizations in Rift Valley Region, it is largely the result of social changes required by
In the Rift Valley, male heads of household do not appear to be aware of female concerns of inequality manifest by the disproportionate sharing of household resources and workload for dairy farming. Females find it
Females and males should be jointly informed and educated on the need for gender mainstreaming and female empowerment, as well as the rights of females vis-à-vis males for sharing resources and responsibilities. The goal should be a full acceptance by

165
government. The new constitution stipulates a 1/3 (33 percent) gender rule for all elective/representative positions. During the focus group discussions with female dairy farmers in this location, 90 percent (18/20 responses) of the females expressed their deep concerns over their lack of empowerment and their limited access to resources.
According to combined responses/counts from both the farmer survey and the FGDs, in the Central Region, 98 percent (413/422 responses) of the women controlled the use and sale of the afternoon milk (that is not normally sold to the FBOs) whereas in the Rift Valley Region, 81 percent (341/422 responses) controlled the afternoon milk.
difficult to communicate their concerns to males due to the latter’s dominant social position as the head of household.
both men and women of female equality. USAID should incorporate an agenda for female empowerment through education in future programs.
Males and females alike recognize the generally disproportionate sharing of resources in dairy farming, which is particularly acute in the Rift Valley. Both female and male groups agree that ownership of dairy animals acquired independent by females would not only be a means to create wealth but would also empower females as a breadwinner for the family.
According to results of the focus group discussions, in the Central Kenya region, 43 percent (21/50 responses) of the women owned the dairy cows while in the Rift Valley, only 5 percent (2/45 responses) owned the dairy cows.
Females as well as youth would be empowered and would also be able to create personal wealth through their independent ownership of dairy animals.
Future projects should create a low-cost rotating credit fund (5-8 percent interest rate range) managed by financial institutions linked to SBOs to facilitate ownership of dairy animals by females and youth.
7. Future direction

166
a. Government relations
KDSCP counterpart organization within government were KDB and to a lesser extent, the Ministry of Livestock Development. The emphasis of the project was private sector support, not support to government.
At the local (milkshed) level, relations with government officials were generally good. However, local officials complained to the evaluation team of limited contact and information from the project, and the lack of project support to facilitate their participation in project activities
The team has seen that Government officers are generally well qualified and capable of providing valuable technical support and training services to development projects, and their presence at project-sponsored events serves as an endorsement for the project with smallholder dairy farmer beneficiaries
Future dairy support projects should consider providing fuel and/or a vehicle allowance and meal allowance to government officials in exchange for support services. Agreement can be formalized through a MOU
b. Structure of farmer organizations
The project worked to organize smallholder dairy farmers into SBO groups and to support and strengthen these groups to help them become formal organizations and eventually dairy cooperatives.
Some of these organizations have been reorganized as limited liability companies with smallholder dairy farmers who supply their milk as shareholders.
The companies are fully capable of providing similar services to smallholder dairy farmers as did the previous cooperative organizations.
Future dairy support projects should reinforce the linkages and the supply chains between smallholder dairy farmers and private companies, as well between smallholder dairy farmers and dairy cooperatives.
c. Small farmers linked to large farmers as outgrowers
The KDSCP worked exclusively with smallholder dairy farmers linked to and supported both parties within this business linkage network. In the North Rift Valley there are an estimated 200 large dairy farmers that could be linked to smallholder dairy farmers through contract grower schemes, which
The anchor farm – outgrower scheme could provide a viable alternative to smallholder development through
Future dairy support programs should consider outgrower schemes between smallholder dairy farmers and large, “anchor” dairy farmers as a development model in

167
could be used as an alternative development model to smallholder support through SBOs.
Similar outgrower models have been used in development programs funded by USAID as well as other donors in many countries, particularly in West Africa.
SBOs. those locations where the large farms exist.
e. Coordination with other development initiatives
SIDA and GOK are funding the Agricultural Sector Development Support Program (ASDSP) that began earlier this year, which is operating in all 47 counties in Kenya. The program runs parallel to KAVES for 5 years.
Program components include prioritized value chain development and institutional capacity development for each county and 3 key value chains will be selected in each county to be supported by the project.
ASDSP is the primary means for implementing Kenya’s Agricultural Sector Strategy, which supports CAADP of the NEPAD.
Coordinating units (CUs) have been created in each County under a County Steering Committee (CSC) to coordinate all development activities within the respective County.
Discussions with some of the offices coordinating the County units indicated that they were willing to partner with USAID in complementing development initiatives at the County level to reduce resource leakages and to mitigate duplication of activities.
The ASDSP program provides an opportunity for collaboration and a means to avoid duplication of efforts in those locations where USAID programs operate.
Future USAID programs should participate in the CSCs and coordinate its activities with the CUs in the counties where they operate.
f. Impact of Kenyans overwhelmingly supported the new Devolution provides an Future dairy development

168
devolution on local milk trade and transport
constitution and its call for devolution of authority/resources and control from central government to local, county governments.
Those local officials interviewed are generally upbeat, positive and highly supportive of the devolution process. They further believe that the movement of goods, services and people will continue unrestricted under devolution, and that taxes on intra- and inter-county will be streamlined and minimal due to the elaborate structures established by the law.
opportunity to partner for dairy development with County officials, led by the County Governor.
projects should seek collaborative relationships with County leaders for funding and technical support to dairy development within the respective Counties.
The County Steering Committee office should be the first stop for future USAID dairy projects for ease of development coordination and government collaboration and support.

U.S. Agency for International Development 1300 Pennsylvania Avenue, NW
Washington, DC 20523