Diversity and Collaboration? Diversity Pathfinders Evaluation: Final Report
185
Diversity and Collaboration? Diversity Pathfinders Evaluation Final Report Professor Philip A Woods University of Aberdeen Professor Rosalind Levacic, Jennifer Evans, Frances Castle Institute of Education, University of London Professor Ron Glatter, Deborah Cooper The Open University Research Report RR826 R ESEARCH
Transcript of Diversity and Collaboration? Diversity Pathfinders Evaluation: Final Report

Diversity and Collaboration?Diversity Pathfinders EvaluationFinal Report
Professor Philip A WoodsUniversity of Aberdeen
Professor Rosalind Levacic, Jennifer Evans, Frances CastleInstitute of Education, University of London
Professor Ron Glatter, Deborah CooperThe Open University
Research Report RR826
RESEARCH
Diversity and Collaboration?Diversity Pathfinders Evaluation
Final Report
Professor Philip A WoodsUniversity of Aberdeen
Professor Rosalind Leva i , Jennifer Evans, Frances CastleInstitute of Education, University of London
Professor Ron Glatter, Deborah CooperThe Open University
The views expressed in this report are the authors’ and do not necessarily reflect those of the Department forEducation and Skills.
© Institute of Education, University of London 2006ISBN 978 1 84478 882 8
Research ReportNo 826
1
CONTENTS
1. EXECUTIVE SUMMARY
2. INTRODUCTION2.1 Background2.2 The Evaluation
3. METHODOLOGY3.1 Overview3.2 Measurement of Change against Baseline Data3.3 Sources of Data
3.3.1 Nationally available school-level data3.3.2 Student surveys3.3.3 Middle leader surveys3.3.4 Options booklets3.3.5 Financial data on DP activities3.3.6 Interviews and observations; collection of documentary data
4. THE DIVERSITY PATHFINDER PROJECTS4.1 Chaucer4.2 Pepys4.3 Nisbet4.4 Hardy4.5 Byron: Byron Collegiate4.6 Tennyson4.7 The importance of context
4.7.1 Competition4.7.2 Hierarchy4.7.3 Geography4.7.4 External challenge4.7.5 Advocacy/facilitation4.7.6 LEA support4.7.7 ‘Take-off’ capacity
5. COLLABORATION AND DIVERSITY5.1 Organisation
5.1.1 Social integration5.1.2 Internal control5.1.3 Sustained capacity, including within-school capacities,
infrastructure and flexibility5.1.4 Strategic vision5.1.5 Engagement of interests
5.2 Resources5.2.1 Funding5.2.2 Teacher time spent on collaborative activities5.2.3 Leverage and synergy
5.3 Diversification5.3.1 Specialist status5.3.2 Other forms of diversification
5.4 Professional Processes5.4.1 Professional development, sharing resources and mutual
institutional support5.4.2 e-communities
5.5 Provision5.5.1 Teaching, learning and the curriculum5.5.2 Staffing (recruitment and retention)5.5.3 Inclusion

2
6. EDUCATIONAL EFFECTS6.1 Students’ experience and opportunities6.2 Attainment6.3 Inclusion
7. CONCLUSIONS7.1 Innovation7.2 Factors sustaining and hindering partnership7.3 Costs7.4 The Diversification/Collaboration Nexus
8. LESSONS FOR FUTURE POLICY AND PRACTICE
Bibliography
Appendix A: Case Study Reports of DP ProjectsAppendix B: Research InstrumentsAppendix C: Pupil Survey AnalysisAppendix D: Analysis of Exam ResultsAppendix E: Analysis of Head of Department Proformas

3
1. EXECUTIVE SUMMARY
Diversity Pathfinders Projects
The Diversity Pathfinders (DP) Project, involved six local education authorities (LEAs1),which set up projects with Department for Education and Skills (DfES)/LEA funding toencourage groups of secondary schools to collaborate and to diversify and develop asspecialist schools. The aims of the DP Project were to:
• increase numbers of specialist schools and the range of specialisms, and developspecialisation in accord with the vision of diversity policy;
• develop collaborative working so thato schools’ individual strengths and specialist expertise benefit each other;o all students in the area of collaborating schools benefit (by improving
teaching and learning and increasing educational opportunities so enablingeducation more tailored to individual needs and preferences);standards throughout secondary education are raised.
The aims of the evaluation
The research team was commissioned by the DfES to evaluate the DP Project,commencing on 1st April 2002. The funded period of the evaluation came to an end on 31st
March 2006.
The evaluation’s aims were:
1. to evaluate the effectiveness of the DP projects in terms of their:a) impacts on diversity and collaborationb) educational effectsc) differential effects (impacting on inclusion)d) effects on schools’ use of resourcese) overall cost effectivenessf) own specific aims and objectives
2. to suggest conclusions and lessons for future policy and practice with respect tocollaboration and diversity.
Evaluation Methodology
All six LEAs involved in the pilot were included in the evaluation. They were2:
• Chaucer - a large, mainly rural county, with 31 secondary schools.• Pepys - a compact city, having only ten secondary schools.• Nisbet - an LEA with an ethnically diverse, highly mobile and growing population. The
LEA has 15 secondary schools.• Hardy - a large county with 76 secondary schools representing a wide range of
categories including community comprehensives, foundation schools and in someareas, selective grammar schools.
• Byron - a large city LEA, with 76 secondary schools. The focus of the evaluation wasone collegiate of 6 (later 10) schools.
• Tennyson - a geographically compact small unitary authority near a major city. It has atotal of eleven secondary schools all of which now have specialist status.
1 LEAs became Local authorities (LAs) in 2005, but for the purposes of this report they will bereferred to as LEAs as this was the term used during fieldwork.2 LEAs were given pseudonyms to protect as far as possible the confidentiality of participants.
4
Each LEA or DP area was treated as a case study. Quantitative and qualitative data werecollected from DfES, LEA and school sources (including student surveys) on: students’intermediate and final outcomes (exam results, curriculum diversity, satisfaction with schooland participation in post-16 education); financial and time costs of collaboration; and, otherrelevant data. Interview and observation data were collected on: the extent of DP schools’collaboration in relation to a number of areas including, the curriculum; professionaldevelopment; sharing staff, courses and specialist equipment, use of ICT; factorspromoting or hindering school collaboration; impact on teaching and learning.
Findings
1. ContextThe prior context of each DP area was an important influence on the ways in which the sixpathfinders developed. Key variables were: prior competition and hierarchy betweenschools, which inhibited collaboration; geographical spread, which made it difficult forschools to work together effectively; external challenge (such as demographic trends, lossof pupils to schools outside the area or designation as a failing school), which stimulatedsupport amongst schools in the group; advocacy and facilitation (from the LEA, a leadheadteacher or external consultants), which promoted and sustained collaborative activity;and take-off capacity, in the form of funding and prior experience of collaboration.
2. OrganisationWithin the scope of ‘organisation’ were a range of institutional, social and cultural variables- covering leadership, management and support, vision and strategies, modes of resourcemanagement and generation, relationships, and so on - which constituted the way the DPproject was run and governed as an ongoing initiative. These included:• Social integration - the degree to which there were positive feelings, group cohesion
and absence of conflict amongst members of the collaborative group. Two aspects ofthis - trust and group/area identity - were found to be particularly important concerningthe organisation of DP projects;
• Internal control - the relative autonomy of DP projects meant that the locus of controlwas shifted more to players internal to the project and less towards external direction.Authorship (or ownership) - the ability to create and shape the priorities and processesof projects - was in the hands of local actors such as headteachers.
• Sustained capacity - A number of the collaborations have been sustained and continueto develop despite changes of personnel, which indicated that they have becomereasonably well embedded. Factors that made up sustained capacity included within-school capacities, infrastructure and flexibility.
• Strategic vision - Some articulation of being on a collective journey, which aspires tomove beyond temporary collaborative arrangements, was important. In other words,some kind of strategic vision was needed. The content of this vision varied betweencollaboratives. Some were focused purely on educational outcomes; others alsofocused on student participation and democracy and a wider socio-economic agenda.
• Engagement of interests - Fundamental to the viability of collaboratives is theengagement of interests. This refers to the need to recognise the institutional interestsof schools and to ensure they are given a place in the development of the collaborative.
3. Use of ResourcesThe original funding for DP (between £250K and £400K per LEA), was disbursed differentlyin each LEA. In the two large county LEAs, it was spread across all schools, so eachreceived a small sum of money (around £3K). In one area, the funding was focused on six(later 10) schools in a collegiate. In other areas, some money was spent centrally, andsome given to schools to foster collaboration. There was evidence of leverage and synergyin all the DP LEAs. Leverage refers to using DP to raise additional funding and synergy tocombining DP with resources from other projects to increase the total benefits.
5
4. DiversificationThere is evidence in each of the areas, of progress towards specialisation in terms ofspecialist status. Four of the DP LEAs had a faster growth than the national average in thenumber of specialist schools. Increasing diversity in other ways (other than specialiststatus) was also apparent in some areas. Schools in two LEAs became training schoolsand several had forged close links with FE colleges.
5. Professional ProcessesThere were a number of ways in which schools used opportunities to collaborate in order toenable their teachers to share expertise within a group of schools. These included: theshared deployment and funding of Advanced Skills Teachers (ASTs) or ‘lead teachers’;releasing teachers to support partner schools, especially those in challengingcircumstances; shared collaborative CPD; and the development of electronic environmentsand use of ICT.
6. ProvisionProvision covers a range of areas that directly impact on the range and quality of students’educational experience, including initiatives that directly bring about change in teaching,learning and the curriculum, effects on staffing (recruitment and retention) and the role ofand opportunities for student voice.
Curriculum development - there were a number of initiatives related to this, includingshared curriculum development, the introduction of innovative vocational courses and area-wide subject network meetings.
Extending curriculum choice - there has been some development in this area, includingjoint provision of subjects outside the National curriculum and movement of students acrossschools to extend choice of subjects.
Strategies, activities and events for students - there has been a focus on ‘student voice’ insome areas, with cross-school events and conferences.
Staff recruitment and retention - some of the DP projects had a specific focus on this andhave taken steps to provide joint training and other incentives to recruit and retain staff.
Inclusion - although not a specific focus, attention has been paid to the needs of sociallydisadvantaged and disaffected students by shared provision of courses and links withtraining providers in the wider community.
7. Educational Effects
Students’ experience and opportunitiesData from the student survey indicates that there is no evidence of increased curriculumchoice in DP schools between 2002/3 and 2005/6 in terms of the availability of the subjectsthat they wished to take. No significant improvement in each of the indicators of schoolsatisfaction was found. On the contrary, students were more likely to rate the overall qualityof maths, quality of facilities, and satisfaction with using the computers lower in 2005/6 thanin 2002/3.
Students’ attitudes to collaborative work with students from other schools and theirexperiences of working with students from other schools did not improve significantlybetween 2002/3 and 2005/6. While more lessons and activities with students from otherschools were reported in 2005/6 than in 2002/3, students’ perceptions that these helpedtheir learning had declined. With regard to post-16 intentions, students from DP case-studyschools in 2005/6 were more likely to be unsure about their future plans than those in2002/3, holding other things constant.
6
AttainmentDP LEAs as a group improved overall GCSE results (the best 8 subjects) in 2005compared to 2002 by about 1 grade more than LEAs nationally when these are comparedas two groups. They did not improve English or maths results relative to other LEAs.However, not all DP LEAs contributed to this group improvement. When the effects ofindividual LEAs were measured, only two LEAs improved GCSE results between 2002 and2005. One improved the total GCSE score and the other improved both English and mathsscores against a national downward trend in these two subjects.
These two LEAs were also the most effective in the proportion of schools improving GCSEscores using value-added measures, comparing scores in 2002 with those in 2005. NesbitLEA stands out as particularly effective, as 11 out of 15 schools had positive scores (i.e.they improved in at least one of the three GCSE measures). The schools in the collegiateacademy in Byron LEA also performed well as four out of five had positive scores.
8. Conclusions and Lessons for Policy and Practice
SustainabilityCollaboration should be viewed as a dynamic process not an event, with sustainability akey criterion of success. This requires a strategic vision for the collaborative venture, adurable organisational structure and sufficient capacity in terms of staff time and skills tosupport the project both at the outset and at subsequent stages. Flexibility and reflexivity -the capacity to adapt the aims and strategy in the light of new developments and changingcircumstances - are also very important for achieving partnerships that last.
Key implication. Collaborative ventures require strong organisational structures andadequate capacity, including adaptive skills.
LeadershipSuccessful collaborations require determined leadership to supply the drive, advocacy,energy and consistent facilitation to enable the impetus to be maintained. This includesboth strategic leadership, notably from the local authority and key professional figures inthe locality, and operational leadership from a partnership co-ordinator with specific timeand resource to undertake the task.
Key implication. Both strategic and operational leadership are needed forsuccessful and sustainable partnerships.
ValuesAlthough collaborative ventures should seek to bring demonstrable benefits to each of thepartner institutions, they also raise questions about the perceived scope of school leaders’responsibilities. A recent publication from the Association of School and College Leaders(ASCL) suggests that: “School leaders want a clear message that freedom for individualschools should function within a framework of shared responsibility for all schools” (Hill,2006, p. 84). If this is an accurate assessment of most school leaders’ preferences, theprospects for collaboration seem strong because the more successful cases in ourevaluation exhibited a values base of this kind.
Key implication. Collaborative schemes must seek to foster and maintain valuesconcerning group identity and shared responsibility for all students.
IncentivesCurrently attention by school staff to the individual interests of their schools is reinforced bythe national accountability system, which focuses on the performance and inspection ofindividual schools. While this situation persists it will continue to act as a constraint on thedevelopment of collaborative arrangements.

7
Key implication. For a climate of collaboration to become widespread, appropriateincentives that counter-balance those focusing on individual schools need to beintroduced.
FundingThere is evidence from both our quantitative and qualitative work that cost-effective,sustainable collaboration requires a focusing or targeting of funds on a limited number ofschools rather than dispersing a given amount of resource over a large number of schools.If funds are concentrated in this way, greater possibilities are created for what we havecalled ‘leverage and synergy’, the capacity to sustain, enhance and make best use offunding.
Key implication. Concentration of funding brings better outcomes than the widedispersal of equivalent resources.
RelationshipsCollaboration is fundamentally concerned with human relationships. In particular it dependson the degree of trust that exists between the partners at the start of the venture, how trustis developed and maintained and on whether it survives the inevitable turnover ofpersonnel and the challenges that arise. Trust is affected by many factors, includingpersonalities and the contextual factors we have highlighted such as the steepness of anyhierarchy of esteem among participating schools and the extent of competitive relationsbetween them.
Key implication. Trust and the quality of human relationships in general are keyfactors in the development of successful school partnerships.
DiversityThe central focus of the DP pilots was intended to be collaboration within a context ofdiversification, especially but not exclusively in relation to the development of specialistschools. We did find examples of diversity being managed creatively to enhance provisionand support professional development. The projects that focused first and foremost ondeveloping a collaborative vision of local needs and strategies had the greater success interms of both process and measured outcomes.
Key implication. The aim of diversification is better subsumed within and subject toa collaborative vision of local needs and strategies than viewed as a centralobjective for a collaborative group.
TechnologyThere is evidence of attempts to learn from experience and tackle the challenges, butcurrently it appears that personal and local communication provide a stronger base forsuccessful collaboration than virtual communication. This may however be due to the waythe electronic environments have been conceived and developed, sometimes emphasisingbroader public relations objectives more than serving the needs of the partnership and itsstudents.
Key implication. Further pilot and evaluative activity is needed to understand howelectronic environments can be productively incorporated into school partnerships.
StudentsThe findings from our student survey are disappointing in relation to Diversity Pathfinders’aims of increasing curriculum choice, improving teaching and learning as perceived bystudents and encouraging increased participation in post-16 education. Also although therewas an increase in the proportion of students who have experienced lessons or activitieswith students from other schools, the proportion of students rating that as unhelpful to their
8
learning also increased. The opinions of students who become involved in schoolcollaborative schemes are rarely canvassed so these findings need to be taken seriously.
Key implication. Attention needs to be given to finding effective ways of improvingthe student experience through school collaborative schemes as well asestablishing how these schemes are actually being experienced by students.
InclusionOur findings on inclusion are somewhat equivocal. On the one hand three of the LEAssucceeded in widening inclusion by improving the GCSE results of socially disadvantagedstudents more than the national trend, and these were also the three that emerged from DPwith the strongest forms of collaboration. On the other hand there is no clear evidence fromthe student survey of improved satisfaction among disadvantaged groups of students.However there were concrete examples in our case studies in which partnerships decidedto redistribute resources towards schools in difficulty, and others in which the collaborationenabled better opportunities to be created for all students including the less advantaged.
Key implication. Inclusion can be enhanced through a committed and focusedapproach to school collaboration.
9
2. INTRODUCTION
2.1 Background
Government policy in England is aiming to develop innovative forms of educational diversityand collaboration that make positive and significant contributions to the standards agenda(DfES 2003a/b, 2005a/b). To do this, practical ways of overcoming or moving beyond anumber of tensions or challenges need to be tried and systematically evaluated. Tensionsinclude those between: diversity and inclusion; benefits and costs of collaboration; schoolautonomy and the wider community and public interest; competition and collaboration;curricular specialisation and breadth (raising issues of accessibility and distribution ofopportunities amongst students); local democracy and central control.
In 2001, the Department for Education and Skills (DfES) decided, in order to “develop anddemonstrate the benefits of greater secondary specialisation and diversity”, to “establish asmall number of areas to act as pathfinders for the policy, so that their experiences caninform the policy as it develops” (DfES 2001: para 5.35). The DfES put this into action asthe Diversity Pathfinders (DP) Project, in which six local education authorities (LEAs) set uptheir own projects with DfES/LEA funding to encourage groups of secondary schools tocollaborate and to diversify and develop as specialist schools. The aims of the DP Projectwere to:
• increase numbers of specialist schools and the range of specialisms, and developspecialisation in accord with the vision of diversity policy;
• develop collaborative working so that:o schools’ individual strengths and specialist expertise benefit each other;o all students in the area of collaborating schools benefit (by improving
teaching and learning and increasing educational opportunities so enablingeducation more tailored to individual needs and preferences);
o standards throughout secondary education are raised.
In addition to these, local DP projects had their own aims (see case study reports inAppendix A).
Three features are particularly distinctive about the DP Project. Firstly, it was an explicitattempt to combine enhanced diversity amongst schools with sustained, active andextensive collaborative inter-school relationships. Secondly, it did not require local projectsto follow a blueprint, but encouraged and facilitated innovative and locally responsive waysof achieving the broad aims. Thirdly, local initiatives were subjected to systematic researchevaluation over a period of over three years, which is described in this report.
2.2 The Evaluation: timescale and aims
The research team was commissioned by the DfES to evaluate the DP Project,commencing on 1st April 2002. The funded period of the evaluation came to an end on 31st
March 2006.
The evaluation’s aims were:
1. to evaluate the effectiveness of the DP projects in terms of their:a) impacts on diversity and collaborationb) educational effectsc) differential effects (impacting on inclusion)d) effects on schools’ use of resourcese) overall cost effectivenessf) own specific aims and objectives

10
2. to suggest conclusions and lessons for future policy and practice with respect tocollaboration and diversity.
11
3. METHODOLOGY
3.1 Overview
The research design combined qualitative and quantitative research methods to assess theimpact on student outcomes and educational opportunities and experiences, the responsesof students and schools to the experience of collaboration, and the processes and costsinvolved in forging and sustaining collaboration and in enhancing diversity.
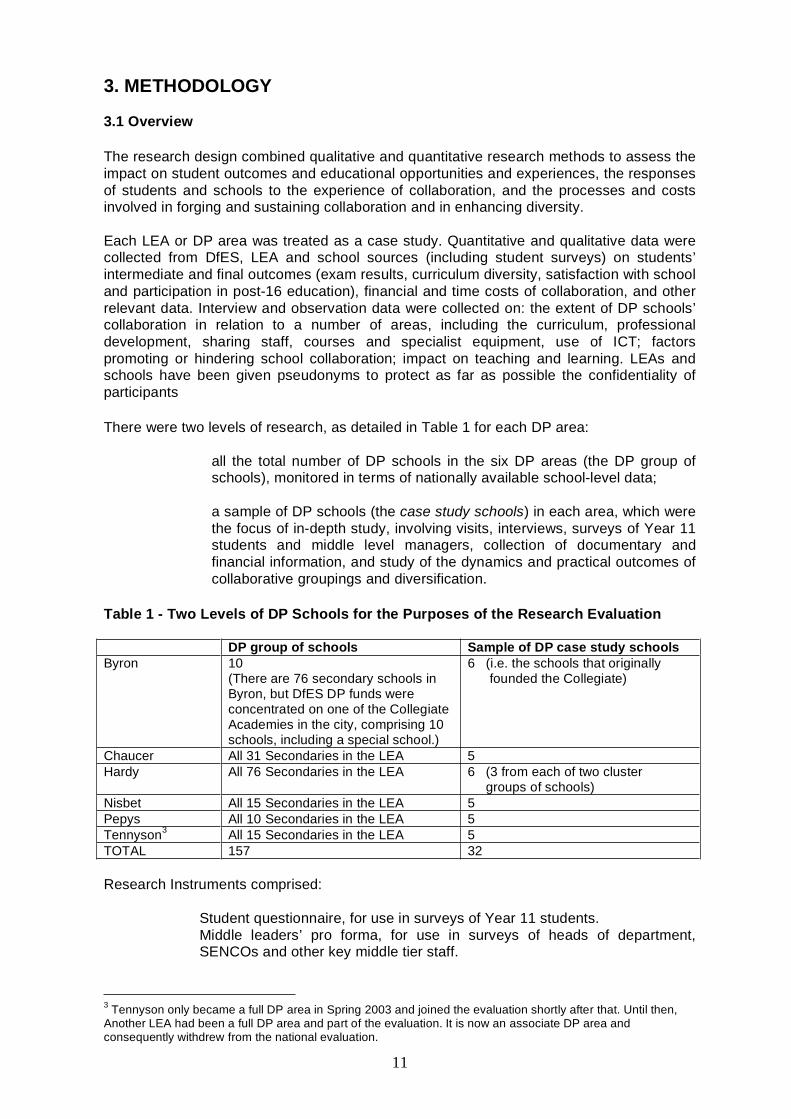
Each LEA or DP area was treated as a case study. Quantitative and qualitative data werecollected from DfES, LEA and school sources (including student surveys) on students’intermediate and final outcomes (exam results, curriculum diversity, satisfaction with schooland participation in post-16 education), financial and time costs of collaboration, and otherrelevant data. Interview and observation data were collected on: the extent of DP schools’collaboration in relation to a number of areas, including the curriculum, professionaldevelopment, sharing staff, courses and specialist equipment, use of ICT; factorspromoting or hindering school collaboration; impact on teaching and learning. LEAs andschools have been given pseudonyms to protect as far as possible the confidentiality ofparticipants
There were two levels of research, as detailed in Table 1 for each DP area:
• all the total number of DP schools in the six DP areas (the DP group ofschools), monitored in terms of nationally available school-level data;
• a sample of DP schools (the case study schools) in each area, which werethe focus of in-depth study, involving visits, interviews, surveys of Year 11students and middle level managers, collection of documentary andfinancial information, and study of the dynamics and practical outcomes ofcollaborative groupings and diversification.
Table 1 - Two Levels of DP Schools for the Purposes of the Research Evaluation
DP group of schools Sample of DP case study schoolsByron 10
(There are 76 secondary schools inByron, but DfES DP funds wereconcentrated on one of the CollegiateAcademies in the city, comprising 10schools, including a special school.)
6 (i.e. the schools that originallyfounded the Collegiate)
Chaucer All 31 Secondaries in the LEA 5Hardy All 76 Secondaries in the LEA 6 (3 from each of two cluster
groups of schools)Nisbet All 15 Secondaries in the LEA 5Pepys All 10 Secondaries in the LEA 5Tennyson3 All 15 Secondaries in the LEA 5TOTAL 157 32
Research Instruments comprised:
• Student questionnaire, for use in surveys of Year 11 students.• Middle leaders’ pro forma, for use in surveys of heads of department,
SENCOs and other key middle tier staff.
3 Tennyson only became a full DP area in Spring 2003 and joined the evaluation shortly after that. Until then,Another LEA had been a full DP area and part of the evaluation. It is now an associate DP area andconsequently withdrew from the national evaluation.
12
• Interview schedules, which varied in detail according to interviewee, timing,immediate focus, and other factors.
Examples of these can be found in Appendix B.
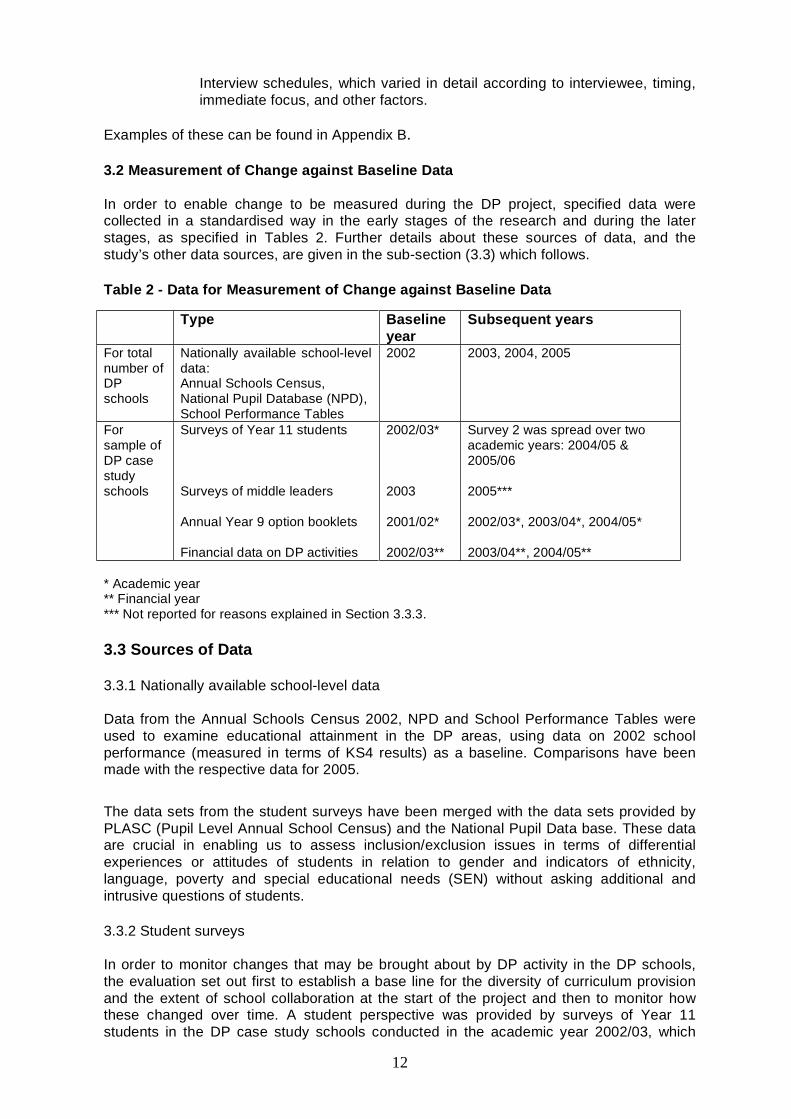
3.2 Measurement of Change against Baseline Data
In order to enable change to be measured during the DP project, specified data werecollected in a standardised way in the early stages of the research and during the laterstages, as specified in Tables 2. Further details about these sources of data, and thestudy’s other data sources, are given in the sub-section (3.3) which follows.
Table 2 - Data for Measurement of Change against Baseline Data
Type Baselineyear
Subsequent years
For totalnumber ofDPschools
Nationally available school-leveldata:Annual Schools Census,National Pupil Database (NPD),School Performance Tables
2002 2003, 2004, 2005
Forsample ofDP casestudyschools
Surveys of Year 11 students
Surveys of middle leaders
Annual Year 9 option booklets
Financial data on DP activities
2002/03*
2003
2001/02*
2002/03**
Survey 2 was spread over twoacademic years: 2004/05 &2005/06
2005***
2002/03*, 2003/04*, 2004/05*
2003/04**, 2004/05**
* Academic year** Financial year*** Not reported for reasons explained in Section 3.3.3.
3.3 Sources of Data
3.3.1 Nationally available school-level data
Data from the Annual Schools Census 2002, NPD and School Performance Tables wereused to examine educational attainment in the DP areas, using data on 2002 schoolperformance (measured in terms of KS4 results) as a baseline. Comparisons have beenmade with the respective data for 2005.
The data sets from the student surveys have been merged with the data sets provided byPLASC (Pupil Level Annual School Census) and the National Pupil Data base. These dataare crucial in enabling us to assess inclusion/exclusion issues in terms of differentialexperiences or attitudes of students in relation to gender and indicators of ethnicity,language, poverty and special educational needs (SEN) without asking additional andintrusive questions of students.
3.3.2 Student surveys
In order to monitor changes that may be brought about by DP activity in the DP schools,the evaluation set out first to establish a base line for the diversity of curriculum provisionand the extent of school collaboration at the start of the project and then to monitor howthese changed over time. A student perspective was provided by surveys of Year 11students in the DP case study schools conducted in the academic year 2002/03, which
13
generated data on students’ satisfaction with school and the diversity of curriculum choiceand their experiences of collaboration.
The questionnaire was a web-based form. Each student was given a unique identifier toenable him or her to be linked with student-level NPD data. A great advantage of the on-line survey was that the questionnaire was programmed to alert the respondent toinconsistent or incomplete answers as well as eliminating the task of keying of data byresearchers.
In 2003 the student survey was administered via the web to the 31 DP case-study schools4.A mixed ability group of 20-30 students in each school was selected for responding to thesurvey. In the first administration of the survey 26 schools and a total of 624 Year 11 pupilsresponded. A fully clean data set of 624 cases with no missing variables was obtained.
This was followed up by a survey of Year 11 in 2005/6, which had a lower response rate of261 students in 14 of the Diversity Pathfinder case study schools, which is equivalent toaround 42% of the original sample collected in 2002/3. Thirteen schools responded to thesurvey in both years. Despite being approached several times over half of the schools didnot respond in 2005/6 and this was especially marked in less engaged LEAs such asHardy, where no schools responded to the second survey. However, the characteristics ofthe students responding to both surveys were similar in terms of average prior attainment,and percentage eligible for free school meals and from ethnic minorities.
3.3.3 Middle leader surveys
Surveys of middle leaders (heads of department, SENCOs and other key middle tier staff)at DP case study schools were conducted in 2003 and repeated in 2005, using a pro formadistributed to the schools. Data from these enabled changes in teachers’ and students’participation in DP activities to be tracked and an estimate made of the teachers’ timeinvolved in administering collaboration.
In the first administration of the survey in 2003, middle leaders from 24 schools completedpro formas5 in the Autumn and Spring terms, giving a combined sample of 372. In thesecond administration, only 8 schools completed pro formas, which was insufficient toenable a valid comparison to be made with data from the first survey. As a result, data fromthe second survey are not reported.
4 The student surveys took place in spring 2003, except for Tennyson, where, because of its later admission tothe national evaluation, its 5 case study schools were asked to administer the student questionnaires in autumn2003. During the first administration in spring 2003, two schools were unable to access the on-line surveybecause of the security bars to student access to external sites and three were unable to complete the survey inthe period allocated for the first survey administration. These five schools, in addition to the Tennyson schools,were invited to administer the survey in autumn 2003.5 This includes data for Tennyson which was obtained in 2004
14
3.3.4 Options booklets
It was planned to collect and analyse schools’ options booklets for each year from 2002 to2005 as one of the means by which to assess changes to the curriculum offered in DPschools. However, responses to requests for booklets produced a limited collection ofbooklets, with many years omitted. The data, therefore, were too patchy to make analysisworthwhile. As a result, and recognising that data have been collected on the curriculum(through interviews for example), the booklets analysis was abandoned.
3.3.5 Financial data on DP activities
These were collected from LEAs and collaborative groupings, through interviews andrelevant documentation. However, it was not possible to trace a direct link between DPmoney and DP activities. One reason for this was that schools combined funds fromseveral sources to resource DP activities. Another is that schools did not identify all theircollaborative activities as DP activities, especially when they were engaged in a number ofrelated collaborative activities. A further reason is that school financial records do notusually link expenditures on specific items to specific school objectives such ascollaborative activities. Consequently the data for a standard cost-effectiveness analysiscould not be collected and broader qualitative judgements about the cost-effectiveness ofdifferent DP resourcing strategies have been made instead.
3.3.6 Interviews and observations; collection of documentary data
Interviews and observations enabled in-depth and context-sensitive data, from multipleperspectives, concerning:
• degree, nature and range of collaboration between schools and the extent towhich it is increasing as a result of DP initiatives;
• processes involved in increasing and maintaining collaboration and diversity.;• effects of collaboration and diversity;• costs involved in increasing and sustaining collaboration and diversity.
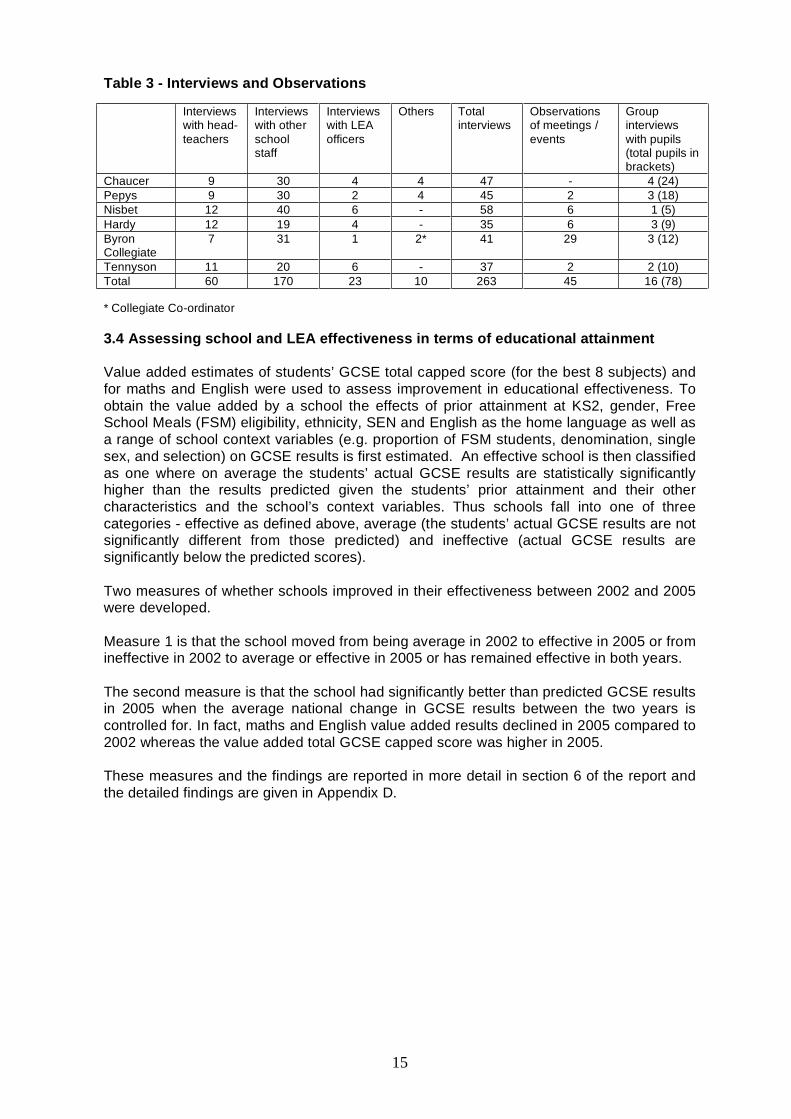
A summary of interviews and observations undertaken is presented in Table 3.Interviewees included headteachers of the DP case study schools and key LEArepresentatives. Repeat interviews were undertaken in a number of cases. A range ofschool staff were selected for interview in order to include perspectives from differing levelswithin schools (from senior leaders to classroom level). ‘Other’ interviewees included ByronCollegiate’s co-ordinator, a seconded headteacher who acted as the co-ordinator forChaucer’s DP activities and a senior LEA officer in Nisbet who was responsible for a rangeof collaborative activities in that LEA. Groups of Year 10 and Year 11 pupils wereinterviewed from a range of DP case study schools. Events and meetings for observationwere selected according to the local organisation and activities of the individual DPprojects. These included meetings of Nisbet’s Secondary Heads Association, LEA-levelmeetings and cluster group meetings of schools in Hardy, Byron Collegiate’s Boardmeetings, and collaborative training and other events throughout the DP projects.
A range of documentation was collected from the case study schools, theclusters/collegiate and the LEAs.
15
Table 3 - Interviews and Observations
Interviewswith head-teachers
Interviewswith otherschoolstaff
Interviewswith LEAofficers
Others Totalinterviews
Observationsof meetings /events
Groupinterviewswith pupils(total pupils inbrackets)
Chaucer 9 30 4 4 47 - 4 (24)Pepys 9 30 2 4 45 2 3 (18)Nisbet 12 40 6 - 58 6 1 (5)Hardy 12 19 4 - 35 6 3 (9)ByronCollegiate
7 31 1 2* 41 29 3 (12)
Tennyson 11 20 6 - 37 2 2 (10)Total 60 170 23 10 263 45 16 (78)
* Collegiate Co-ordinator
3.4 Assessing school and LEA effectiveness in terms of educational attainment
Value added estimates of students’ GCSE total capped score (for the best 8 subjects) andfor maths and English were used to assess improvement in educational effectiveness. Toobtain the value added by a school the effects of prior attainment at KS2, gender, FreeSchool Meals (FSM) eligibility, ethnicity, SEN and English as the home language as well asa range of school context variables (e.g. proportion of FSM students, denomination, singlesex, and selection) on GCSE results is first estimated. An effective school is then classifiedas one where on average the students’ actual GCSE results are statistically significantlyhigher than the results predicted given the students’ prior attainment and their othercharacteristics and the school’s context variables. Thus schools fall into one of threecategories - effective as defined above, average (the students’ actual GCSE results are notsignificantly different from those predicted) and ineffective (actual GCSE results aresignificantly below the predicted scores).
Two measures of whether schools improved in their effectiveness between 2002 and 2005were developed.
Measure 1 is that the school moved from being average in 2002 to effective in 2005 or fromineffective in 2002 to average or effective in 2005 or has remained effective in both years.
The second measure is that the school had significantly better than predicted GCSE resultsin 2005 when the average national change in GCSE results between the two years iscontrolled for. In fact, maths and English value added results declined in 2005 compared to2002 whereas the value added total GCSE capped score was higher in 2005.
These measures and the findings are reported in more detail in section 6 of the report andthe detailed findings are given in Appendix D.
16
4. THE DP PROJECTS
This section provides background information and a summary of findings for each area,including the local aims of the DP project. Trends in GCSE results referred to in thediscussion of each project are based on the analysis reported in Appendix D. Furtherdetails on each DP project are in Appendix A.
Following the description of each project, this section also discusses the importance oflocal context in understanding the nature and development of the DP projects.
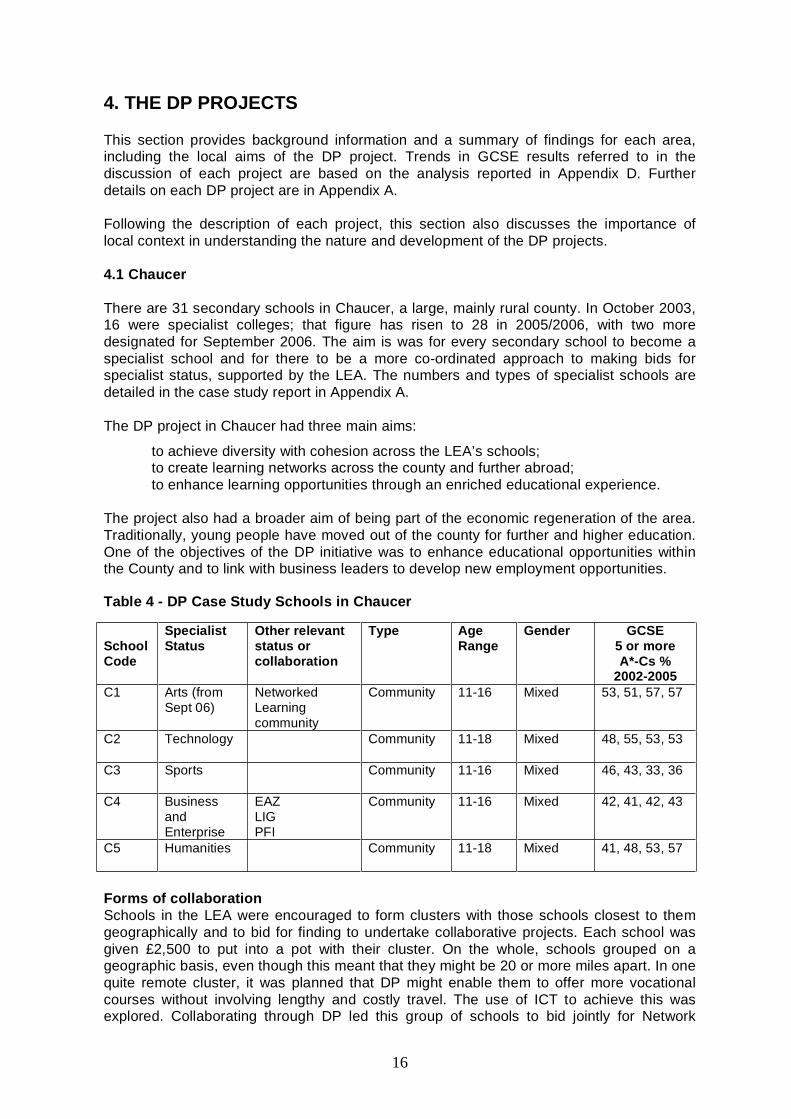
4.1 Chaucer
There are 31 secondary schools in Chaucer, a large, mainly rural county. In October 2003,16 were specialist colleges; that figure has risen to 28 in 2005/2006, with two moredesignated for September 2006. The aim is was for every secondary school to become aspecialist school and for there to be a more co-ordinated approach to making bids forspecialist status, supported by the LEA. The numbers and types of specialist schools aredetailed in the case study report in Appendix A.
The DP project in Chaucer had three main aims:
• to achieve diversity with cohesion across the LEA’s schools;• to create learning networks across the county and further abroad;• to enhance learning opportunities through an enriched educational experience.
The project also had a broader aim of being part of the economic regeneration of the area.Traditionally, young people have moved out of the county for further and higher education.One of the objectives of the DP initiative was to enhance educational opportunities withinthe County and to link with business leaders to develop new employment opportunities.
Table 4 - DP Case Study Schools in Chaucer
SchoolCode
SpecialistStatus
Other relevantstatus orcollaboration
Type AgeRange
Gender GCSE5 or moreA*-Cs %
2002-2005C1 Arts (from
Sept 06)NetworkedLearningcommunity
Community 11-16 Mixed 53, 51, 57, 57
C2 Technology Community 11-18 Mixed 48, 55, 53, 53
C3 Sports Community 11-16 Mixed 46, 43, 33, 36
C4 BusinessandEnterprise
EAZLIGPFI
Community 11-16 Mixed 42, 41, 42, 43
C5 Humanities Community 11-18 Mixed 41, 48, 53, 57
Forms of collaborationSchools in the LEA were encouraged to form clusters with those schools closest to themgeographically and to bid for finding to undertake collaborative projects. Each school wasgiven £2,500 to put into a pot with their cluster. On the whole, schools grouped on ageographic basis, even though this meant that they might be 20 or more miles apart. In onequite remote cluster, it was planned that DP might enable them to offer more vocationalcourses without involving lengthy and costly travel. The use of ICT to achieve this wasexplored. Collaborating through DP led this group of schools to bid jointly for Network
17
Learning Community status and resulted in their achieving additional funding from theirregional Government office.
The five schools chosen for detailed study in Chaucer, which were not in the same cluster,came from across the county and provide a cross-section of the county’s schools in termsof size and contexts (see table 4). Control from the centre (i.e. from the LEA) was minimaland there was very little in the way of formal structure attached to the cluster arrangements,which were essentially project-based and project-driven.
Collaborative activitiesThe types of collaboration and activities undertaken varied across the county and reflectedlocal needs and priorities. At a school level, this has included pupils travelling to differentschools in order to benefit from courses not available in their own school. For example, aGCSE course in Astronomy was hosted by one school, which had an enthusiastic andknowledgeable teacher of the subject. This course was made available to students fromother schools through a mixture of classes taught after school hours and on-line distancelearning.
There have been other examples of the use of ICT to share expertise. At LEA level, theEducation Business Partnership (EBP) and the Designing and Making Centre developedprogrammes involving ICT, which made alternative provision accessible to a range ofstudents in schools and colleges. Support materials were developed by the EBP. Theseincluded work-based materials that supported youngsters in setting up and running anenterprise with guidance notes. It involved a combination of school use and home use andteachers were trained to use it. This package was aimed at Years 10-11. It could be usedas a 6-week programme of one session per week or as a one-day workshop. This projectwas directed towards achieving the aim of linking education and business to promote theeconomic regeneration of the area.
Achieving diversityIn terms of achieving the aims of its Diversity Pathfinder bid, Chaucer increased thenumbers of specialist schools in the LEA, so that almost 100 per cent are now specialist.There is a range of specialisms, with the most frequent being Technology (7 out of 30schools).
Impacts on learning and achievementCompared to other DP LEAs, and to LEAs nationally, schools in Chaucer LEA did notsignificantly improve their effectiveness between 2002 and 2005. However, three of the fiveschools chosen as case studies did improve their effectiveness. One school also improvedits GCSE score relative to the national trend and thus was classed as particularly effective.
4.2 Pepys
This city LEA is very compact, having only ten secondary schools. It is also one of the mostdensely populated district authorities in the UK, outside London. The school population isrising and two new secondary schools have been opened in the last five years.Unemployment has fallen to its lowest rate for 25 years and, at 3.1 per cent, is one of thelowest rates in England. Free school meal entitlement is broadly in line with the nationalaverage (22.4 percent primary and 19.7 per cent secondary) and there is only a smallethnic minority population. However, there are pockets of severe deprivation.
All ten of the secondary schools in Pepys were part of the DP project (details of these aregiven in the full case study report). The aim of the project was to create a learningcommunity in the city, wherein schools would see themselves as responsible for theeducation of all the city’s children, not just those within their own establishment. The DPproject was seen as a way of bringing together a number of initiatives then underway,including an Excellence cluster, a Transport Pathfinder, and to develop a co-operative and
18
co-ordinated approach to seeking specialist school status. Fundamental to the notion ofdeveloping the learning community was support for schools in building their area ofspecialism. The aim was for all schools in the city to become specialist schools.
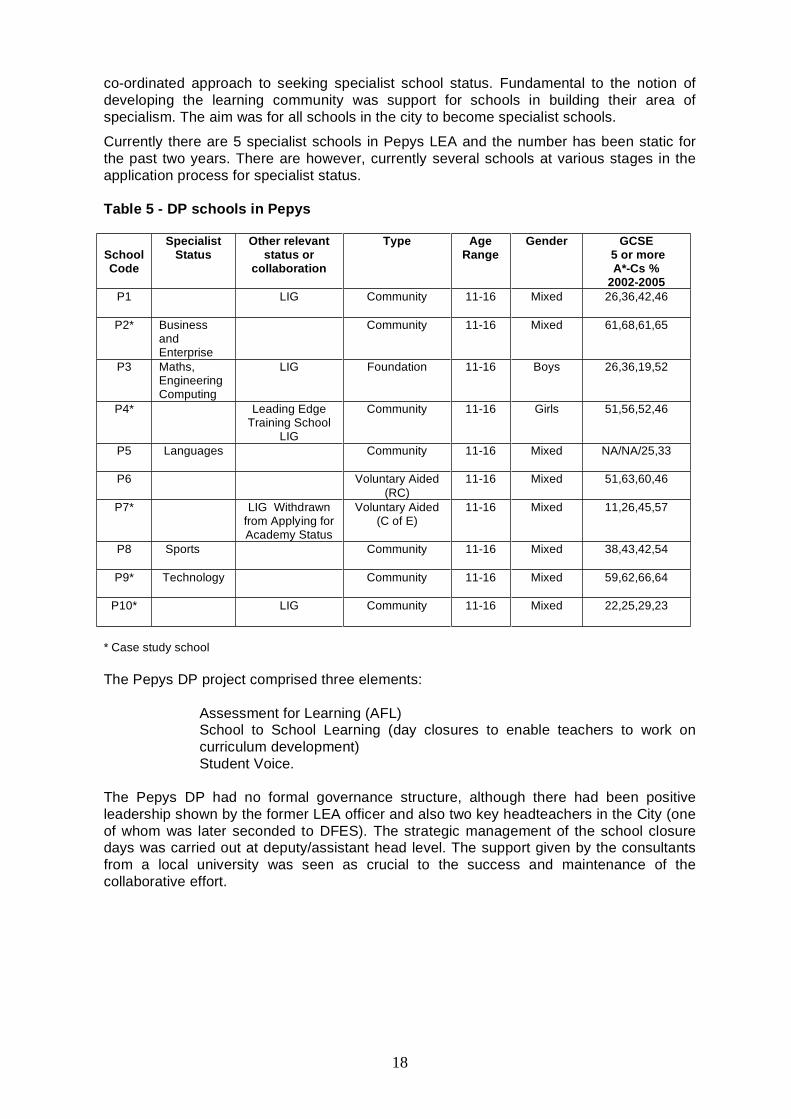
Currently there are 5 specialist schools in Pepys LEA and the number has been static forthe past two years. There are however, currently several schools at various stages in theapplication process for specialist status.
Table 5 - DP schools in Pepys
SchoolCode
SpecialistStatus
Other relevantstatus or
collaboration
Type AgeRange
Gender GCSE5 or moreA*-Cs %
2002-2005P1 LIG Community 11-16 Mixed 26,36,42,46
P2* BusinessandEnterprise
Community 11-16 Mixed 61,68,61,65
P3 Maths,EngineeringComputing
LIG Foundation 11-16 Boys 26,36,19,52
P4* Leading EdgeTraining School
LIG
Community 11-16 Girls 51,56,52,46
P5 Languages Community 11-16 Mixed NA/NA/25,33
P6 Voluntary Aided(RC)
11-16 Mixed 51,63,60,46
P7* LIG Withdrawnfrom Applying forAcademy Status
Voluntary Aided(C of E)
11-16 Mixed 11,26,45,57
P8 Sports Community 11-16 Mixed 38,43,42,54
P9* Technology Community 11-16 Mixed 59,62,66,64
P10* LIG Community 11-16 Mixed 22,25,29,23
* Case study school
The Pepys DP project comprised three elements:
• Assessment for Learning (AFL)• School to School Learning (day closures to enable teachers to work on
curriculum development)• Student Voice.
The Pepys DP had no formal governance structure, although there had been positiveleadership shown by the former LEA officer and also two key headteachers in the City (oneof whom was later seconded to DFES). The strategic management of the school closuredays was carried out at deputy/assistant head level. The support given by the consultantsfrom a local university was seen as crucial to the success and maintenance of thecollaborative effort.
19
Forms of collaboration
Pepys invested a great deal of time and financial resource into creating the Pepys‘Learning Community’, which is what they called their Diversity Pathfinder Project. Theyformed a link with a local university and were working with two consultants in developingtheir approach. The project developed in a divergent way, in that Pepys wanted to extendthe Learning Community ethos to its primary schools, whereas DP was confined tosecondary school collaboration. Pepys also involved local FE colleges in its collaborativeactivities, for example in sharing courses and staff across institutions.
Collaborative activities
Assessment for Learning
AFL link teachers’ meetings were set up at which teachers from ‘lead departments’ inschools gave presentations of their work. These included examples from one school inscience and in English, and from another in science. The emphasis in these examples wason involving students in assessing their learning and taking account of what students knowand don’t know in order to provide more focused teaching. In another school, in thehumanities curriculum area, students were involved in peer marking of work, and identifyingfor themselves what they needed to do to improve.
School-to-School Learning
LEA-wide closure of schools to enable subject teachers to work together was a key featureof Pepys DP. These events have occurred twice a year over the three years of the project.The activities were organised and led by heads of department and subject co-ordinators.These were generally seen to have been useful and positive, particularly for modern foreignlanguages, which had very good leadership and co-ordination and used an outsidefacilitator from the university to plan activities. This energised the teachers involved and ledto more collaboration. This was also the case in Technology and Science. But in othersubject areas, the experience was not so positive, since not all subject leaders were asenergetic and committed to this form of staff and curriculum development.
Student voice
Student Voice has been supported in a number of ways. Students have participated incurriculum planning and feedback during the closure days described in the previoussection. They have also been involved in an LEA-wide school council. The high profilegiven to Student Voice and the commitment shown by some of the schools to make this areality has led to some innovative practices, such as students giving feedback to newlyqualified teachers (NQTs) as part of their induction programme run by the training school.
Students have been working with teachers on curriculum design and delivery in someschools and this development has been publicised nationally at a DFES conference oninnovation held in London.
Impacts on learning and achievementGenerally, achievement in terms of GCSE scores has been on an upward trend in PepysLEA, comparing 2002 with 2005. Additionally there has been a positive impact ondisadvantaged pupils (as measured by free school meals eligibility), with improvements incapped GCSE scores between 2002 and 2005, for this group of pupils relative to nationaltrends. The overall improvement in Pepys’ scores can be attributed to some significantimprovements in the effectiveness of its lower performing schools, which suggests thatcollaboration has benefited those schools.

20
4.3 Nisbet
All 15 secondary schools in Nisbet were part of the DP project. There are currently 11specialist schools, a training school and two Leading Edge schools, and the aim of the LEAwas that all schools would become specialist in a phased programme that ensured that therange of specialisms was covered.
Table 6 - DP schools in Nisbet
SchoolCode
SpecialistStatus
Other relevantstatus orcollaboration
Type AgeRange
Gender GCSE5 or moreA*-Cs %
2002-2005N1 Arts Training School Community 11-16 Mixed 30, 34, 44, 46
N2 Sports Extended school Community 11-16 Mixed 27, 33, 25, 46N3 Technology Extended school Community 11-16 Mixed 36, 37, 36, 39
*N4 Business &Enterprise
Extended school Community 11-16 Mixed 34, 49, 49, 50
N5 Languages Community 11-16 Mixed n/a, n/a, n/a, 33
N6 Sports BeaconExtended school
Community 11-16 Mixed 41, 42, 47, 52
*N7 PerformingArts
Mentoring schoolExtended school
Community 11-16 Mixed 37, 37, 36, 46
*N8 Community 11-16 Mixed 32, 32, 40, 42N9 Leading Edge Community 11-16 Girls 56, 63, 72, 76
*N10 Community 11-16 Boys 23, 24, 26, 30
N11 Community 11-16 Mixed 40, 35, 35, 35
*N12 Technology Leading EdgeJoint Sixth FormCentre with N13
VoluntaryAided (RC)
11-18 Girls 74, 82, 88, 89
N13 Technology Sixth Form Centreshared with N12
VoluntaryAided (RC)
11-18 Boys 74, 78, 68, 71
N14 Languages Community 11-16 Girls 46, 45, 72, 62
N15 Maths &Computing
Foundation 11-18 Mixed 46, 65, 55, 54
* Case study school
The DP project in Nisbet had two main strands: one was to set up a ‘Network of BeaconPractice’, focused on teachers by creating a learning community of headteachers andteachers; the other was to promote ‘Cultural Harmony’, focused on students byencouraging the participation and empowerment of all students.

21
Forms of collaboration
Collaboration at secondary school level was managed mainly through the heads, withsupport from a senior education officer and his administrative staff. There were regularconferences (twice a year) where collaborative initiatives arising out of DP, LIG, LeadingEdge etc were reported on. Nisbet’s DP organisation developed to encompass a range ofcollaborative initiatives. The Network of Effective Practice, (NEPN) which was the maintangible outcome has underpinned subsequent collaborative work and has tied a number ofdifferent initiatives together. Diversity Pathfinder was the first time Nisbet was given fundingto develop collaborative work across all secondary schools. From this developed theNEPN, regular heads’ meetings to discuss and develop collaboration, and the website.Although the funding has now finished, many collaborative developments that emerged outof DP are still ongoing.
Collaborative activities
Subject network meetings, regular meetings of heads of department, or subjectcoordinators, for the exchange of ideas, information, and good practice took place twice aterm. These were usually convened by the subject adviser and held at the LEA’s CPDcentre. Some subject meetings (e.g. Maths) were held in schools, on a rotating basis, andthis was said to be very useful. The most successful and well-attended meetings seemed tobe for subjects where the teachers themselves controlled the agenda and made teachingand learning the heart of the meetings. The less successful ones were where the subjectadviser dominated the agenda and used the time to pass on directives from centralgovernment.
The Effective Practice Network (NEPN) was set up to include a data base which containedexamples of effective practice which schools were willing to share. The protocols for thiswork were developed and agreed by the heads. ‘Effective practice’ was defined by thecontributors, but had to be endorsed by someone outside the school, for example an Ofstedinspection or a member of the LEA advisory team. A dedicated website manager based inthe LEA was employed to set up the database and keep it up-dated on a termly basis. Eachschool was asked to identify a ‘link co-ordinator’ to channel contributions to the website. Thedata base is open to all and contains:
• A news page highlighting recent events, successes and new web entries• A secondary ‘effective practice’ search page• A search page devoted to the Nisbet Youth Cultural Harmony Project• Links to other useful web sites
The Cultural Harmony strand of the DP project held a conference, organised by the NisbetYouth Parliament and entitled ‘Racism Must Die’. This took place in May 2003 and wasattended by 60 young people from schools and Youth Centres/Projects. Workshops wereorganised throughout the day on various aspects of promoting cultural harmony, includingdance, story telling, music and the work of school councils. The conference received apositive evaluation from the attendees and a second conference ‘Harmony Must Live’ washeld in 2004. One spin off from this has been a visit to New York by students from one ofthe schools involved, where issues of racism and student participation were discussed withstudents from the New York schools.
A range of collaborative activities has been promoted across the schools, many of whichare related to LIG funding. Notable has been a partnership between a highly successfulgirls’ school and a failing boys’ school. Staff, generally ASTs from the girls’ school, maderegular visits to the boys’ school to help with curriculum development and professionaldevelopment of teachers. This resulted in the boys’ school being removed from specialmeasures, although our analysis of GCSE results indicates that attainment has not

22
improved in the boys’ school between 2002 and 2005 and that the school was less effectivein 2005 than it was in 2002.
Impacts on learning and achievement
Overall, however, Nesbit stands out as particularly effective in improving achievement atGCSE level among our DP LEAs, as 11 out of the 15 schools improved more than thenational trend. Nisbet has also appeared to be most effective in improving GCSE scores inEnglish and Maths, against a national downward trend in these subjects. In addition, thisLEA has also improved relative GCSE scores for the more disadvantaged pupils (asmeasured by Free School Meals eligibility).
4.4 Hardy
In Hardy, a large county, the emphasis of DP was increasing the number of specialistschools and raising achievement for all. The DP project involved all of its 76 secondaryschools, as well as all primary and special schools and the schools were organised inclusters. DP schools were sampled from two clusters - Area A and Area B. Area A is acompact town, Area B is a more dispersed area of development around a major road.
This DP model of funding being dispersed across a large number of schools contrasts withthe approach in most of the other areas. In this regard, Hardy is similar to Chaucer.
Details of the DP case study schools are in Table 7.
Table 7 - DP Case Study Schools in Hardy
SchoolCode
Specialist StatusSecuredInterest
Type AgeRange
Gender GCSE5 or moreA*-Cs %
2002-2005H1 Technology Community 11-18 Mixed 37, 47, 53, 48
H2 Sports Community 11-18 Mixed 21, 38, 28, 30
H3 Science andPerforming Arts
Community 11-18 Mixed 53, 56, 57, 53
H4 Language Foundation 11-18 Mixed 64, 60, 58, 54
H5 Performing Arts Community 11-18 Mixed 48, 42, 29, 51
H6 Sports Community 11-18 Mixed 38, 40, 46, 37
Forms of collaboration
The DP project had a high profile through local authority strategy and promotion. A projectofficer was funded for two years and a network of school clusters established. Through theclusters a local head or deputy was funded half a day per week to take forward localpriorities and to share good practice throughout the authority at cluster leader meetings.Case studies of good practice were disseminated via the local authority web site and inprint and an exhibition organised. The web site was used also to publish information aboutsuccessful bids for specialist status. During the project period the number of specialistschools throughout the county increased significantly.
23
Collaborative activities
In Area A, a group of headteachers worked to develop a strategy for specialismsappropriate for the employment and community needs of the town. Early work includedbrokering and this developed into a formal group including the local college and the nameof the headteachers group was changed as a result. Additional funding from 14-19 projectsenabled the appointment of a respected headteacher to co-ordinate the work. There werealso operational sub groups working on applied GCSEs and joint timetabling. Students inthis area have a wide range of vocational options as a result of the collaboration.
Area B was slower to develop collaborative activity among secondary schools in theadministrative cluster where there was a steep hierarchy between schools that were over orunder-subscribed. Individual schools worked on fundraising and developing a vision forspecialist status bids and these were welcomed as a form of school improvement andopportunity for furthering community links. The 14-19 agenda and the need to consolidatenumbers in post 16 did bring some collaborative activity towards the end of the project.
Impacts on learning and achievement
Compared to other DP areas, as a whole Hardy schools did not improve their effectivenessby the measures used here. The case study schools in both areas did not improve theireffectiveness overall. On measures of inclusion Hardy did worse than other DP areas.
4.5 Byron: Byron Collegiate
In Byron LEA the total number of secondary schools is 76. However the DP focus was onthe creation of collegiate academies. Four collegiates are at different stages ofdevelopment in the city. The one that is at a most advanced stage and which wassupported by DfES DP funds - Byron Collegiate - originally comprised six schools, includinga special school. This original group of six schools was the main focus of the researchevaluation.
The Collegiate formally commenced at the beginning of the Autumn term, 2002. The initialimpetus came from Byron LEA’s former Chief Education Officer who had a vision of acollegiate system of schools within the LEA, which, in its ultimate form, would involvestudents belonging to a collegiate rather than to an individual school. A headteacher in thegroup of schools in the case study collegiate was also a key driver. The collegiate emergedfrom existing and developing networks, including the Excellence in Cities (EiC) network towhich the schools belonged.
In 2003/4, the collegiate expanded, by including four additional schools. This was the resultof a successful bid by all 10 schools to the Learning and Skills Council, and a decision torationalise local arrangements to reduce multiple memberships of school partnerships.Details of the schools are shown in Table 8.
24
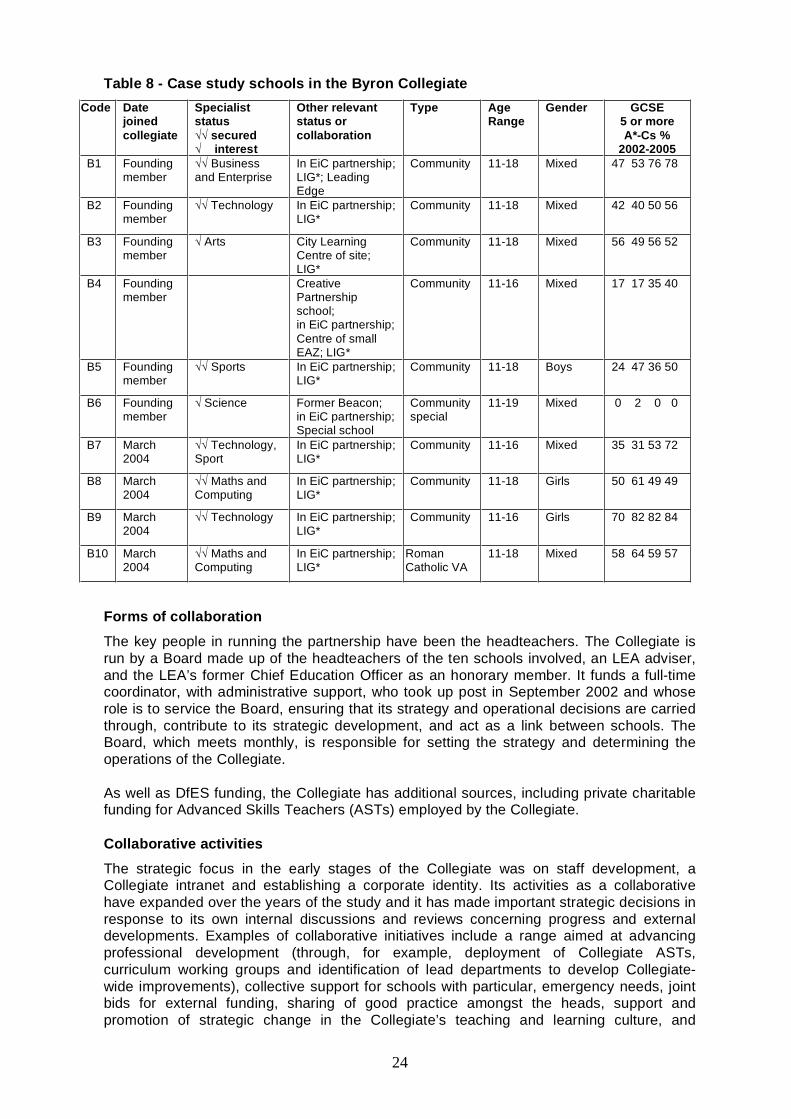
Table 8 - Case study schools in the Byron CollegiateCode Date
joinedcollegiate
Specialiststatus
securedinterest
Other relevantstatus orcollaboration
Type AgeRange
Gender GCSE5 or moreA*-Cs %
2002-2005B1 Founding
memberBusiness
and EnterpriseIn EiC partnership;LIG*; LeadingEdge
Community 11-18 Mixed 47 53 76 78
B2 Foundingmember
Technology In EiC partnership;LIG*
Community 11-18 Mixed 42 40 50 56
B3 Foundingmember
Arts City LearningCentre of site;LIG*
Community 11-18 Mixed 56 49 56 52
B4 Foundingmember
CreativePartnershipschool;in EiC partnership;Centre of smallEAZ; LIG*
Community 11-16 Mixed 17 17 35 40
B5 Foundingmember
Sports In EiC partnership;LIG*
Community 11-18 Boys 24 47 36 50
B6 Foundingmember
Science Former Beacon;in EiC partnership;Special school
Communityspecial
11-19 Mixed 0 2 0 0
B7 March2004
Technology,Sport
In EiC partnership;LIG*
Community 11-16 Mixed 35 31 53 72
B8 March2004
Maths andComputing
In EiC partnership;LIG*
Community 11-18 Girls 50 61 49 49
B9 March2004
Technology In EiC partnership;LIG*
Community 11-16 Girls 70 82 82 84
B10 March2004
Maths andComputing
In EiC partnership;LIG*
RomanCatholic VA
11-18 Mixed 58 64 59 57
Forms of collaboration
The key people in running the partnership have been the headteachers. The Collegiate isrun by a Board made up of the headteachers of the ten schools involved, an LEA adviser,and the LEA’s former Chief Education Officer as an honorary member. It funds a full-timecoordinator, with administrative support, who took up post in September 2002 and whoserole is to service the Board, ensuring that its strategy and operational decisions are carriedthrough, contribute to its strategic development, and act as a link between schools. TheBoard, which meets monthly, is responsible for setting the strategy and determining theoperations of the Collegiate.
As well as DfES funding, the Collegiate has additional sources, including private charitablefunding for Advanced Skills Teachers (ASTs) employed by the Collegiate.
Collaborative activities
The strategic focus in the early stages of the Collegiate was on staff development, aCollegiate intranet and establishing a corporate identity. Its activities as a collaborativehave expanded over the years of the study and it has made important strategic decisions inresponse to its own internal discussions and reviews concerning progress and externaldevelopments. Examples of collaborative initiatives include a range aimed at advancingprofessional development (through, for example, deployment of Collegiate ASTs,curriculum working groups and identification of lead departments to develop Collegiate-wide improvements), collective support for schools with particular, emergency needs, jointbids for external funding, sharing of good practice amongst the heads, support andpromotion of strategic change in the Collegiate’s teaching and learning culture, and

25
enhancement of curriculum opportunities. A key development in relation to the latter was adecision to initiate a Collegiate-wide vocational strategy, implemented from September2004, focusing on ‘hands-on’ courses.
In summary, the Collegiate developed a strong degree of collaboration and engaged fromtime to time in serious collective reflection on its strategic vision and the make-up of thecollegiate, which led to its rationalisation and important strategic decisions. A culture ofactive professional collaboration and mutual support between schools was nurtured, thoughthere remain challenges in its permeation to levels below senior management in someschools and in achieving the goals envisaged for a collegiate-wide electronic environment.
Amongst the Collegiate’s 10 schools, the number of specialist schools increased from fourin September 2002 to seven by September 2005. Over the same period, amongst thefounding six member schools the number increased from two to three. Diversification wasnot only concentrated on achieving specialist status, and other forms of diversification areprobably the more significant aspect of diversity developed in the context of the Collegiate.For example, one of the Collegiate schools developed a vocational health centre, opened in2006 and available for Collegiate-wide use, and there are plans for more schools to havespecialist vocational centres.
Impacts on learning and achievement
Quantitative analysis of GCSE results during the period of the study (2002 to 2005)concentrated on the five non-special schools, which founded the collegiate6. Theseschools, like those in Nisbet, improved as a group their GCSE performance relative to thenational trend. Four made significant progress in becoming more effective7. Some of thisprogress is likely to have been the result of the collaborative activity of the Collegiate,though the degree and precise nature of the relationship is extremely difficult to determine.Specific support was given to schools with particular and pressing difficulties, in order toachieve their short-term goals for improvement. Other activities and strategies wereintended to benefit all schools through shared professional development, collectiveinitiatives for selected groups of pupils from collegiate schools, and so on.
The 5 Byron collegiate schools, (excluding the special school where too few pupils tookGCSEs to include the school in the analysis) stand out with Nisbet schools as a groupwhich improved their effectiveness on both measures. Four out of the five schools hadbetter GCSE results in 2005 after removing the national average change between the twoyears.
Byron Collegiate emerged as the DP project with the strongest collaboration, followed byNisbet and Pepys, according to criteria explained in Section 7.4. This is reflected in thenumber of examples and illustrations from Byron Collegiate that are included in thediscussion of the study’s findings.
6 The special school had too few students with GCSE results to be included in the analysis.7 Byron LEA as a whole improved the educational attainment of disadvantaged students: There is evidence thatGCSE results of FSM students in Byron LEA, as in Nesbit and Pepys, improved relative to national trends(Appendix C).
26
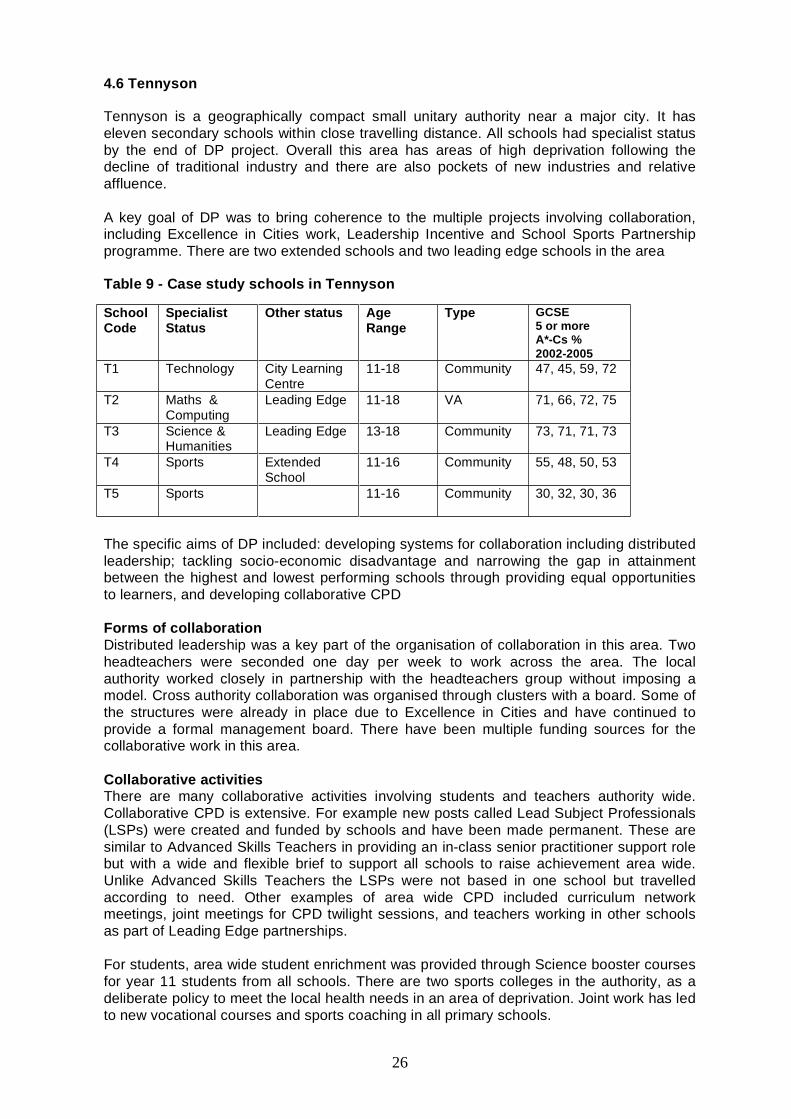
4.6 Tennyson
Tennyson is a geographically compact small unitary authority near a major city. It haseleven secondary schools within close travelling distance. All schools had specialist statusby the end of DP project. Overall this area has areas of high deprivation following thedecline of traditional industry and there are also pockets of new industries and relativeaffluence.
A key goal of DP was to bring coherence to the multiple projects involving collaboration,including Excellence in Cities work, Leadership Incentive and School Sports Partnershipprogramme. There are two extended schools and two leading edge schools in the area
Table 9 - Case study schools in Tennyson
SchoolCode
SpecialistStatus
Other status AgeRange
Type GCSE5 or moreA*-Cs %2002-2005
T1 Technology City LearningCentre
11-18 Community 47, 45, 59, 72
T2 Maths &Computing
Leading Edge 11-18 VA 71, 66, 72, 75
T3 Science &Humanities
Leading Edge 13-18 Community 73, 71, 71, 73
T4 Sports ExtendedSchool
11-16 Community 55, 48, 50, 53
T5 Sports 11-16 Community 30, 32, 30, 36
The specific aims of DP included: developing systems for collaboration including distributedleadership; tackling socio-economic disadvantage and narrowing the gap in attainmentbetween the highest and lowest performing schools through providing equal opportunitiesto learners, and developing collaborative CPD
Forms of collaborationDistributed leadership was a key part of the organisation of collaboration in this area. Twoheadteachers were seconded one day per week to work across the area. The localauthority worked closely in partnership with the headteachers group without imposing amodel. Cross authority collaboration was organised through clusters with a board. Some ofthe structures were already in place due to Excellence in Cities and have continued toprovide a formal management board. There have been multiple funding sources for thecollaborative work in this area.
Collaborative activitiesThere are many collaborative activities involving students and teachers authority wide.Collaborative CPD is extensive. For example new posts called Lead Subject Professionals(LSPs) were created and funded by schools and have been made permanent. These aresimilar to Advanced Skills Teachers in providing an in-class senior practitioner support rolebut with a wide and flexible brief to support all schools to raise achievement area wide.Unlike Advanced Skills Teachers the LSPs were not based in one school but travelledaccording to need. Other examples of area wide CPD included curriculum networkmeetings, joint meetings for CPD twilight sessions, and teachers working in other schoolsas part of Leading Edge partnerships.
For students, area wide student enrichment was provided through Science booster coursesfor year 11 students from all schools. There are two sports colleges in the authority, as adeliberate policy to meet the local health needs in an area of deprivation. Joint work has ledto new vocational courses and sports coaching in all primary schools.
27
Impacts on learning
Tennyson joined the study later than the other areas. The tests do not show significantimprovement in results for the authority as a whole. All the schools in the area wereinvolved in collaborative work. One case study school’s performance measures showdecline with the others unchanged or improved.
4.7 The Importance of Context
The brief outlines given above, indicate that the origin and development of the DP projectshave been shaped by a range of external factors and influences. From our analysis of thefull data set, we have derived the following set of key contextual factors that influenced theform and development of the DP projects in the six LEAs.
4.7.1 CompetitionDevelopment of DP projects was aided by a low degree of competition between schools.Schools that were not in direct competition for students were more likely to be able tocollaborate. Previous competitive relations between schools made it difficult for someschools to collaborate. Thus, some of the collaborative work that we have observed hasbeen between schools across long distances (e.g. an urban school in London with a ruralschool in the south west of England). In Nisbet, for example, the LEA had no spare schoolspaces, so heads were not generally worried about falling rolls. When it came tocollaboration, heads acknowledged that, generally, it was easier to collaborate with schoolsthat had similar challenges of experiences, rather than those with whom might be incompetition for pupils. In Pepys, there had been a history of competition and lack of co-operation, particularly from schools that had been grant maintained and had a history of‘going it alone’.
The arena of competition, or potential for competition, varied. For example, in Chaucergenerally there was little competition (or hierarchy), as the schools were so dispersed thatone school would serve its surrounding community. However, where there were twoschools serving a country town, there was keen competition and a reluctance tocollaborate. In Hardy Area B, schools in similar circumstances of falling post-16 rolls weremore likely to see an economic need to work together than a school with a successful sixthform. In Byron Collegiate, there continued to be what was described amongst the collegiateas ‘healthy’ competition, which co-existed with active collaboration.
4.7.2 HierarchySchools that had similar problems and similar status within the DP area, and therefore alow degree of hierarchy of esteem amongst them, on the whole found it easier tocollaborate. Where differences were more marked, resulting in a steeper hierarchy, therewere greater challenges. For example, there was a ‘deficit model’ model operating in somecollaborations, where a highly successful school had been partnered with a less successfulschool, and staff had some difficulties in sustaining an equal partnership approach.Tennyson showed greater movement of staff between schools of different status includingvia Leading Edge partnerships and sports partnerships. In Hardy Area B the steephierarchy and competitive relations between schools acted as a significant inhibitor ofcollaboration.
A moderate degree of hierarchy was found to be compatible with collaboration. Forexample, there were differences of influence and status amongst Byron Collegiate schools.In Nisbet, there was an acknowledged hierarchy among the schools in terms ofexamination results, with some high achieving schools at the top, some middle rankingschools, and one poorly performing school. At the end of the research period no secondaryschool in the LEA was in special measures. Heads appeared to be pragmatic about theirstatus, and sought ways to improve it by diversifying the range of opportunities they offered
28
to students as well as acknowledging other measures of success, such as value-addedresults and year-on-year improvement.
In Pepys, the hierarchy of schools appeared to be fluid on some respects, with differentschools being characterised as popular or unpopular over the lifetime of the project.
4.7.3 GeographyGeography was a further factor influencing collaboration. Geographical distance wasgenerally not conducive to collaboration. Schools mainly collaborated with others nearby,although, as noted, more distant collaborations may have had an appeal where localrelations were highly competitive or where personal chemistry between heads sustainedthe relationship. We might have expected problems of distance and travel to disappearthrough the potential of electronic communities. DP Findings show that the existence of inintranet was not sufficient and that teachers seemed to prefer the informal contact ofmeetings or visiting each other’s schools. The salience of geography as a factor was linkedto the limited effectiveness of electronic communities and ICT as means of facilitatingcollaborative activity without the necessity of travel (see Section 5.3.2).
4.7.4 External challengeThe existence and perceived strength and consequences of external challenges facingschools in the DP area represented a further contextual variable. Where these existed, theyhelped to stimulate a perception that forging new forms of collaborative activity wasnecessary and in the interests of local schools. Examples included loss of students toschools in other areas, anticipated demographic change reducing numbers of students infuture years, and impending Ofsted inspections where schools felt they were vulnerable toa poor evaluation.
4.7.5 Advocacy/facilitationThe initiation and development of DP projects depended on the presence of advocacy andfacilitation, i.e. local change agents working to advocate and facilitate collaboration. Localcatalysts (such as an officer of the LEA and/or a school principal) were needed to generateand build partnerships. Their time and energy provided a strong degree of activism thatengendered positive attitudes and commitment to change. Apart from local authority andlocal school partners, some areas used external consultants to assist the development oftheir DP projects.
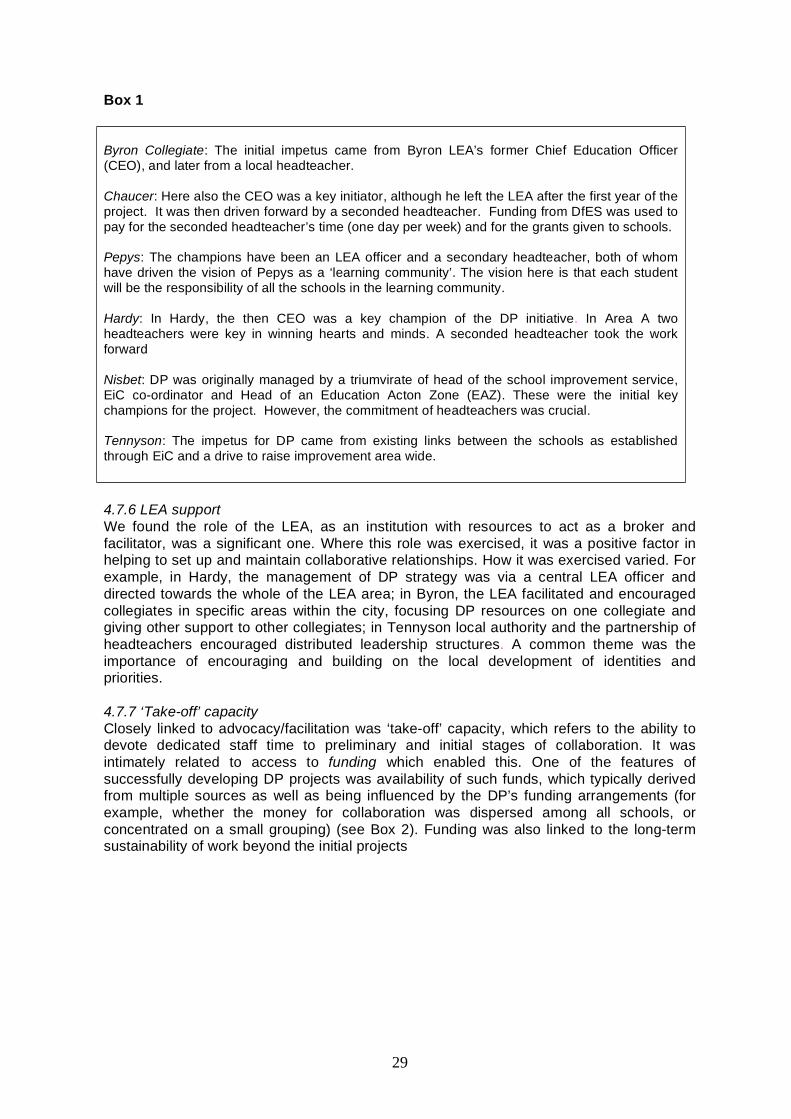
There were ‘champions’ for the DP projects in each of the LEAs (see Box 1). Across the sixLEAs, there was already an existing strategy and impetus for collaboration and for astrategic approach to achieving specialist status for the schools. The commitment of a‘critical mass’ of key leaders (headteachers and LEA staff) was an important factor ingaining the commitment of schools to participate and play an active role.
29
Box 1
Byron Collegiate: The initial impetus came from Byron LEA’s former Chief Education Officer(CEO), and later from a local headteacher.
Chaucer: Here also the CEO was a key initiator, although he left the LEA after the first year of theproject. It was then driven forward by a seconded headteacher. Funding from DfES was used topay for the seconded headteacher’s time (one day per week) and for the grants given to schools.
Pepys: The champions have been an LEA officer and a secondary headteacher, both of whomhave driven the vision of Pepys as a ‘learning community’. The vision here is that each studentwill be the responsibility of all the schools in the learning community.
Hardy: In Hardy, the then CEO was a key champion of the DP initiative. In Area A twoheadteachers were key in winning hearts and minds. A seconded headteacher took the workforward
Nisbet: DP was originally managed by a triumvirate of head of the school improvement service,EiC co-ordinator and Head of an Education Acton Zone (EAZ). These were the initial keychampions for the project. However, the commitment of headteachers was crucial.
Tennyson: The impetus for DP came from existing links between the schools as establishedthrough EiC and a drive to raise improvement area wide.
4.7.6 LEA supportWe found the role of the LEA, as an institution with resources to act as a broker andfacilitator, was a significant one. Where this role was exercised, it was a positive factor inhelping to set up and maintain collaborative relationships. How it was exercised varied. Forexample, in Hardy, the management of DP strategy was via a central LEA officer anddirected towards the whole of the LEA area; in Byron, the LEA facilitated and encouragedcollegiates in specific areas within the city, focusing DP resources on one collegiate andgiving other support to other collegiates; in Tennyson local authority and the partnership ofheadteachers encouraged distributed leadership structures. A common theme was theimportance of encouraging and building on the local development of identities andpriorities.
4.7.7 ‘Take-off’ capacityClosely linked to advocacy/facilitation was ‘take-off’ capacity, which refers to the ability todevote dedicated staff time to preliminary and initial stages of collaboration. It wasintimately related to access to funding which enabled this. One of the features ofsuccessfully developing DP projects was availability of such funds, which typically derivedfrom multiple sources as well as being influenced by the DP’s funding arrangements (forexample, whether the money for collaboration was dispersed among all schools, orconcentrated on a small grouping) (see Box 2). Funding was also linked to the long-termsustainability of work beyond the initial projects
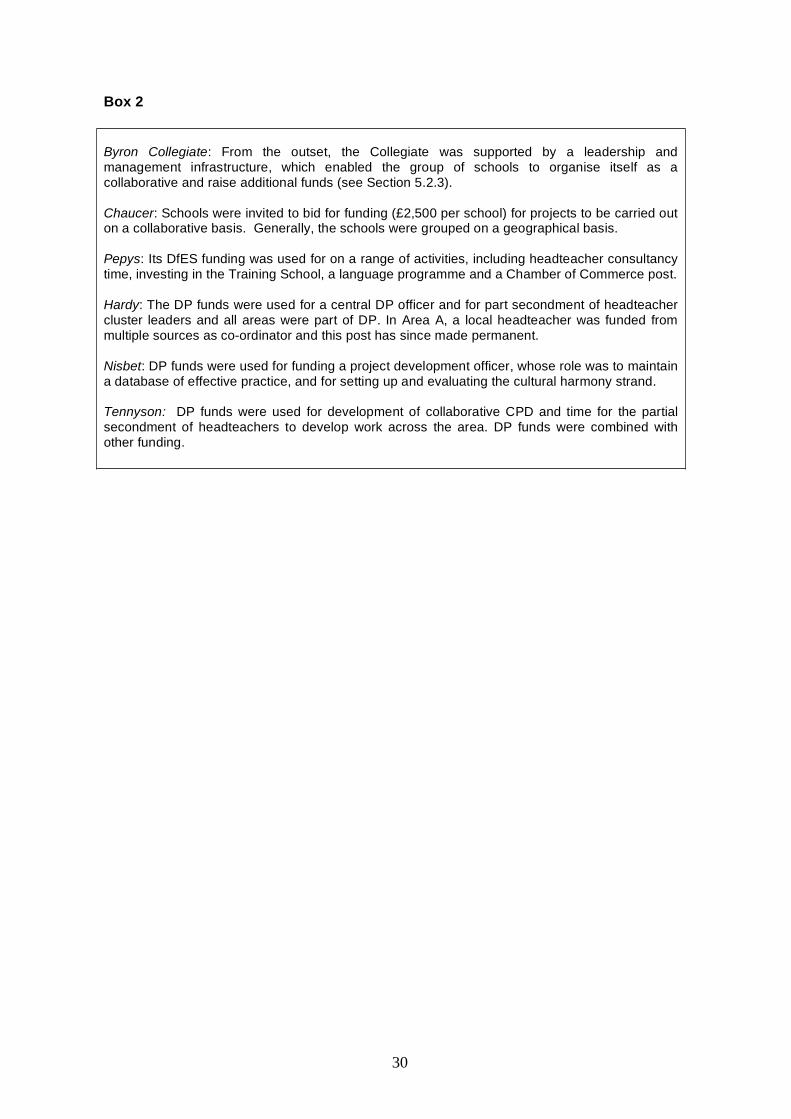
30
Box 2
Byron Collegiate: From the outset, the Collegiate was supported by a leadership andmanagement infrastructure, which enabled the group of schools to organise itself as acollaborative and raise additional funds (see Section 5.2.3).
Chaucer: Schools were invited to bid for funding (£2,500 per school) for projects to be carried outon a collaborative basis. Generally, the schools were grouped on a geographical basis.
Pepys: Its DfES funding was used for on a range of activities, including headteacher consultancytime, investing in the Training School, a language programme and a Chamber of Commerce post.
Hardy: The DP funds were used for a central DP officer and for part secondment of headteachercluster leaders and all areas were part of DP. In Area A, a local headteacher was funded frommultiple sources as co-ordinator and this post has since made permanent.
Nisbet: DP funds were used for funding a project development officer, whose role was to maintaina database of effective practice, and for setting up and evaluating the cultural harmony strand.
Tennyson: DP funds were used for development of collaborative CPD and time for the partialsecondment of headteachers to develop work across the area. DP funds were combined withother funding.
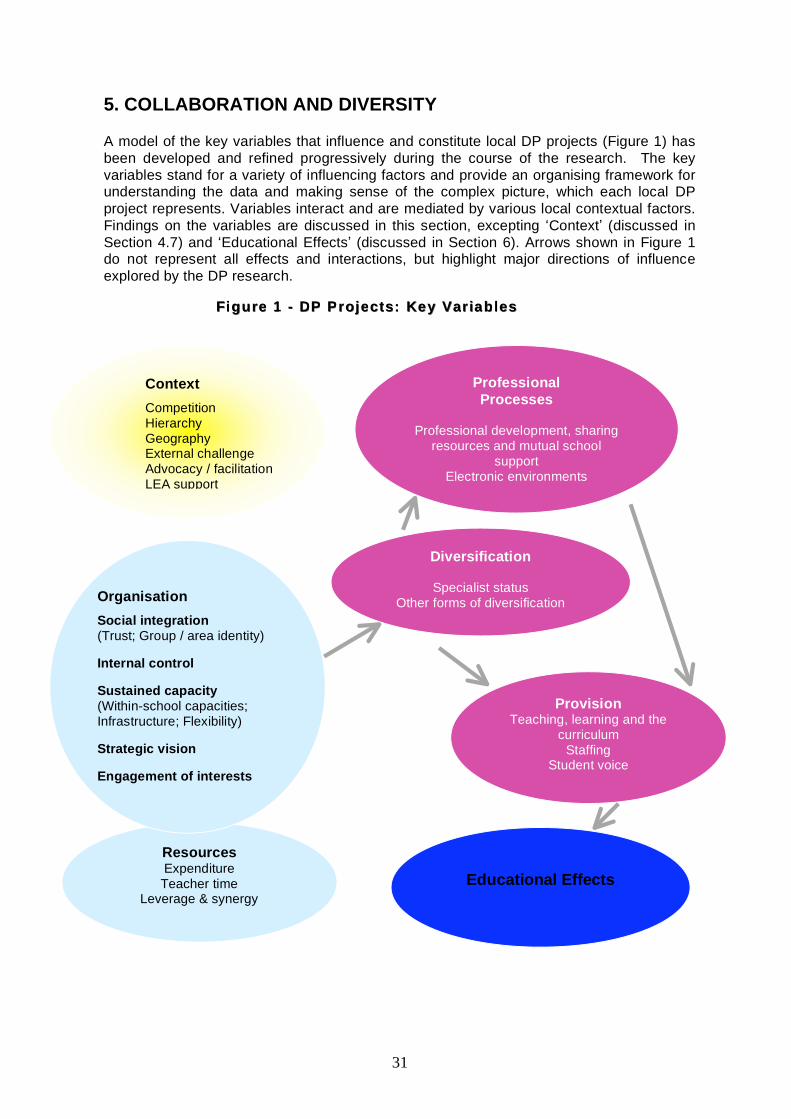
31
5. COLLABORATION AND DIVERSITY
A model of the key variables that influence and constitute local DP projects (Figure 1) hasbeen developed and refined progressively during the course of the research. The keyvariables stand for a variety of influencing factors and provide an organising framework forunderstanding the data and making sense of the complex picture, which each local DPproject represents. Variables interact and are mediated by various local contextual factors.Findings on the variables are discussed in this section, excepting Context (discussed inSection 4.7) and Educational Effects (discussed in Section 6). Arrows shown in Figure 1do not represent all effects and interactions, but highlight major directions of influenceexplored by the DP research.
Figure 1Figure 1 -- DP Projects: Key VariablesDP Projects: Key Variables
ProfessionalProcesses
Professional development, sharingresources and mutual school
supportElectronic environments
ResourcesExpenditureTeacher time
Leverage & synergy
OrganisationSocial integration(Trust; Group / area identity)
Internal control
Sustained capacity(Within-school capacities;Infrastructure; Flexibility)
Strategic vision
Engagement of interests
ProvisionTeaching, learning and the
curriculumStaffing
Student voice
Diversification
Specialist statusOther forms of diversification
Educational Effects
ContextCompetitionHierarchyGeographyExternal challengeAdvocacy / facilitationLEA support
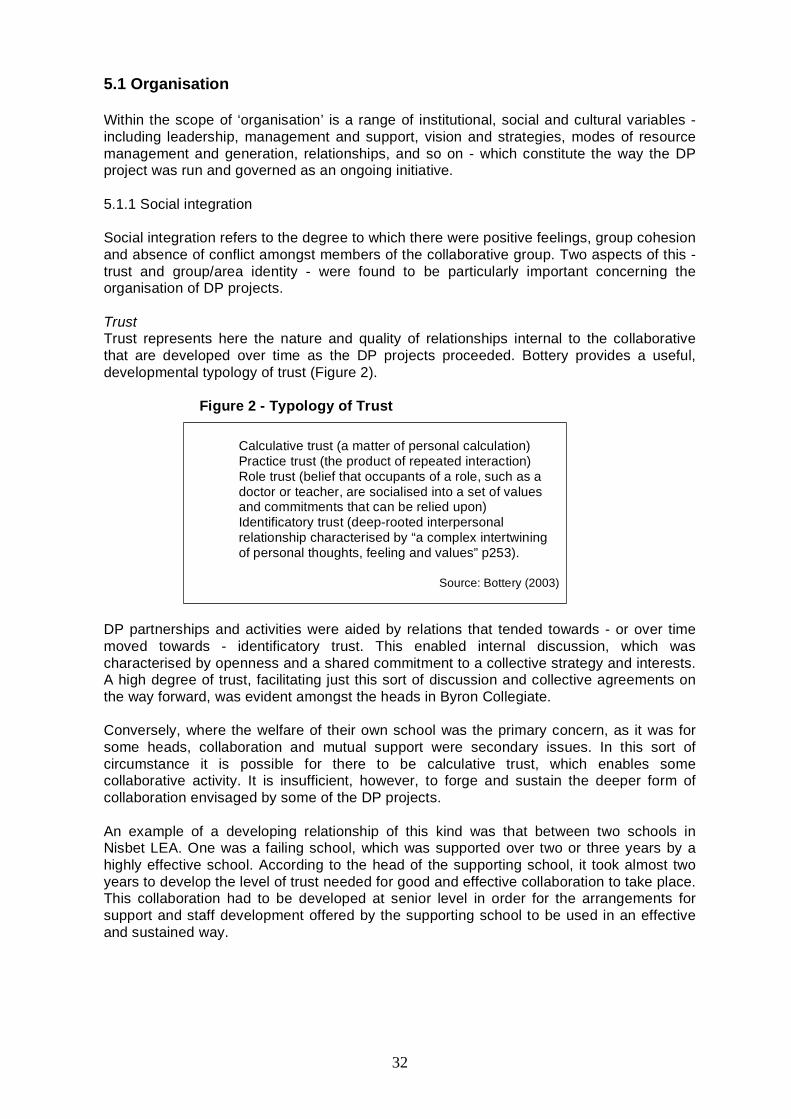
32
5.1 Organisation
Within the scope of ‘organisation’ is a range of institutional, social and cultural variables -including leadership, management and support, vision and strategies, modes of resourcemanagement and generation, relationships, and so on - which constitute the way the DPproject was run and governed as an ongoing initiative.
5.1.1 Social integration
Social integration refers to the degree to which there were positive feelings, group cohesionand absence of conflict amongst members of the collaborative group. Two aspects of this -trust and group/area identity - were found to be particularly important concerning theorganisation of DP projects.
TrustTrust represents here the nature and quality of relationships internal to the collaborativethat are developed over time as the DP projects proceeded. Bottery provides a useful,developmental typology of trust (Figure 2).
Figure 2 - Typology of Trust
• Calculative trust (a matter of personal calculation)• Practice trust (the product of repeated interaction)• Role trust (belief that occupants of a role, such as a
doctor or teacher, are socialised into a set of valuesand commitments that can be relied upon)
• Identificatory trust (deep-rooted interpersonalrelationship characterised by “a complex intertwiningof personal thoughts, feeling and values” p253).
Source: Bottery (2003)
DP partnerships and activities were aided by relations that tended towards - or over timemoved towards - identificatory trust. This enabled internal discussion, which wascharacterised by openness and a shared commitment to a collective strategy and interests.A high degree of trust, facilitating just this sort of discussion and collective agreements onthe way forward, was evident amongst the heads in Byron Collegiate.
Conversely, where the welfare of their own school was the primary concern, as it was forsome heads, collaboration and mutual support were secondary issues. In this sort ofcircumstance it is possible for there to be calculative trust, which enables somecollaborative activity. It is insufficient, however, to forge and sustain the deeper form ofcollaboration envisaged by some of the DP projects.
An example of a developing relationship of this kind was that between two schools inNisbet LEA. One was a failing school, which was supported over two or three years by ahighly effective school. According to the head of the supporting school, it took almost twoyears to develop the level of trust needed for good and effective collaboration to take place.This collaboration had to be developed at senior level in order for the arrangements forsupport and staff development offered by the supporting school to be used in an effectiveand sustained way.

33
Group/area identityTrust is linked to the development of personal and institutional identification with a group ofschools and the area that they collectively serve, i.e. a group/area identity. The more thissense of belonging develops, the greater the likelihood that collaboration will be facilitatedby a taken-for-granted collective commitment, positive relationships and, where there aredifficulties and tensions in the collaborative, a willingness to overcome these. It is part-and-parcel of what might be termed a normalisation of collaboration. Working together andsharing across institutions becomes the ‘way we do things round here’. In Pepys LEA, forexample, the main thrust of their DP project was to create a ‘learning community’ and tofoster a culture within which schools would acknowledge their collective responsibility for allthe pupils in the LEA and seek ways in which schools and other community partners couldwork jointly to achieve this. However, this was more difficult to achieve than the promotersof the ideal had envisaged and not all schools in the LEA were willing to put thecommunity’s needs before the needs of their own immediate catchment. In Hardy Area Athe town-wide needs helped to bring together the schools and the college. In Tennyson thediscussions over allocation of funding for the needs of the area, rather than for individualschools, were a reflection of the extent of area identity.
The national policy context impacts upon the ability to develop and sustain a collectiveidentity. In particular, attention by schools to their individual interests was reinforced by thenational accountability system which focuses on the performance and inspections ofindividual schools. Another example is that the bids for specialist status involved individualfundraising whereby schools had different access to potential local sponsors and could bein competition with each other for funds.
5.1.2 Internal control
The balance of initiative and power between central authorities and the local DP projectswas a significant factor. The relative autonomy of DP projects meant that the locus ofcontrol was shifted more to players internal to the project and less towards externaldirection. Authorship (or ownership) - the ability to create and shape the priorities andprocesses of projects - was in the hands of local actors such as headteachers (through thecollegiate board in Byron Collegiate and the EiC initiative in Tennyson). In Pepys one of theDP project’s prime aims was to involve the wider community so that they became part ofthe initiative. As a result, the collaborative groups were able to evolve and be shapedaccording to each LEA’s or area’s circumstances, rather than being required to follow asingle blueprint.
The positioning of the locus of control is a relative phenomenon. Schools are bound withina central framework of monitoring and incentives (through invitations to bid for centrallyfunded initiatives). In particular, the central framework still focuses on individual schoolperformance and on inspections of them as individual institutions.
5.1.3 Sustained capacity
Capacity here chiefly concerns the availability of staff who can give dedicated time to thecollaborative aims and activities of the DP project. Having benefited from ‘take-off’ capacity(see Section 5.6.6) , which refers by its nature to the preliminary stages of collaboration,there is a need for sustained capacity - staff, organisation and funding available for thecollaborative - to be continued and enhanced as the collaborative grows.
Sustainability is a major issue. That partnerships and collaboration between organisationsare “necessarily highly fragile structures” is the conclusion of Huxham and Vangen (2000b)on the basis of their extensive research into inter-organisational collaboration. DP fundingwas provided for three years only in order to pump-prime collaboration. If collaboration hasbeen successfully developed and embedded into local practices then it will be sustainedafter the funding ceases. In the Byron Collegiate and Nisbet, collaboration is sufficiently
34
well embedded that it is continuing to develop. In Chaucer and Hardy Area A multiplefunding and new organisations mean the work will continue, although other clusters inHardy have not gone so far. However, our data indicate that, without some formalorganisation and structure, either at cluster or LEA level, collaborations are not likely tocontinue or to expand. Pepys LEA has continued to provide funding for collaborativeactivities and the further development of the Learning Community.
A number of the collaborations have been sustained and continued to develop despitechanges of personnel, which indicates that they have become reasonably well embedded.Factors that make up sustained capacity include within-school capacities, infrastructure andflexibility.
Within-school capacitiesThis refers to the availability of staff from within member schools to spend time and efforton working and developing collaborative initiatives with other schools. Such capacity variedbetween projects and between schools. Even where the DP project had resourcesdedicated to DP activities, capacity to be involved in collaborative and mutually supportiveactivities varied greatly between member schools.
InfrastructureA significant positive factor was the creation of a durable organisational infrastructure tosupport the collaborative, which enabled ongoing leadership, management anddevelopment. This included, crucially, a leadership and management infrastructure that hadsenior support staff roles dedicated to facilitating and advancing the work of thecollaborative group. These leadership and management roles provided continuity ofsupport for the group and facilitate leverage and synergy (see below), maximisingresources and their cost-effective use. Integral to the effectiveness of the organisationalinfrastructure was its being characterised by credible senior leadership to promote thevision and operationalise the collaboration through formal structures and giving time tobrokering support.
The heads of Byron Collegiate demonstrated their commitment to the partnership bycontributing 0.5% of their school budget to the collegiate. This, and other funding securedthrough bidding, has enabled the collegiate to undertake a number of collegiate-wideinitiatives, including the employment of three ASTs to work across the schools. Ongoingleadership, management and development can also be secured through the use of externalconsultants. A key feature of the Pepys partnership has been the use of consultants to helpwith articulating the vision of a ‘learning community’. The LEA has contributed considerableextra funding (£150,000) for this purpose. The consultants had a research anddevelopment role, rather than an administrative function. Other research suggests thatsome form of effective leadership is crucial to successful collaborative working: “It isparadoxical that the single-mindedness of leaders appears to be central to collaborativesuccess” (Huxham and Vangen, 2000a, p. 1171).
There has been a variety of approaches across the six areas to the challenge of runningand sustaining the DP partnerships (see Box 3). These ranged from a formal boardstructure created by the Byron collegiate, through less formal, but discrete mechanisms,such as the Local Learning Partnership in Tennyson, to the more integrated approach usedin Nisbet and Pepys. In the LEAs where schools and population were more dispersed(Chaucer and Hardy) a delegated approach was adopted, with funding and responsibilityfor collaboration given to (mainly geographical) clusters of schools.
The approaches taken may reflect the styles of the LEAs, in terms of their relationships withschools. We can suggest that the prior history and context of LEA/school relations were asignificant factor in the ways in which they approached the setting up and running of the DPprojects. Taking Riley’s (1992) characterisation of LEAs as: traditional shire county,interventionist with egalitarian purposes, interventionist (corporate business) and

35
interactive, we could suggest that these are exemplified in our sample. Although all theLEAs were tending towards Riley’s emerging model (interactive), there were residualelements of previous approaches, which could account for the differences in the set up ofDP in the six LEAs.
The importance of striving for coherence in a complex and changing context was evident inour findings. For example, changes were made in responsibilities at LEA level in Nisbet tobring coherence to a multiplicity of partnership initiatives.
Box 3
Byron Collegiate: The Collegiate is run by a Board that comprises the headteachers of the 10 collegiateschools, an LEA adviser, and Byron LEA’s former CEO as an honorary member. It funds a full-timecoordinator, with administrative support, whose role is to service the Board, ensure that its strategy andoperational decisions are carried through, contribute to its strategic development, and act as a linkbetween schools. The Board is responsible for setting the strategy and determining the operations ofthe Collegiate.
Chaucer and Hardy: Both these areas took the decision to disburse DP funding across all the schoolsin the LEA and to encourage collaboration at a ‘cluster’ level. These LEAs are both geographicallylarge and have a spread of towns and villages, which makes a centralised approach less feasible thanin a more densely populated urban area. Thus, in these areas, there was no overarching managementboard or collective decision-making by headteachers, but instead a series of localised initiatives or‘clusters’. Hardy appointed a DP officer whose role was to organise meetings of cluster leaders andorganise workshops on topics related to specialism and facilitate links with community educationofficers and advisors. At the local level, a head or deputy was funded to coordinate cluster activities.
Pepys: The LEA was more prominent here in driving and supporting the DP initiative, although therewas also been strong support from one or two key headteachers. Although there were changes in keypersonnel, DP was still a significant initiative and became part of the City’s drive to create a ‘learningcommunity’. There is no separate board for managing the partnership, but it is on the agenda of eachSecondary Heads meeting.
Nisbet: Nisbet also attempted to minimise bureaucracy in the way in which it organised and managedDP. The project was coordinated from the centre by an LEA officer and employed a NetworkCoordinator to maintain a database of ‘effective practice’ to which schools were invited to contribute.Heads of the 15 secondary schools made strategic and policy decisions about the shape of the DPproject and had it on the agenda of their monthly meetings. There were also termly meetings ofsecondary heads, focusing on the development of partnership work.
Tennyson: Tennyson involved all the secondary schools, FE college provision and work-based learningprovision. Four clusters of schools were created, managed and coordinated through a ‘Local LearningPartnership’, chaired by the CEO and based on an earlier EiC coordinating body, working across all thesecondary schools. Two headteachers were seconded to act as brokers between the schools and apost of DP coordinator was created. The LEA characterised its approach as ‘distributed leadership’.The existing clusters created for implementing the 14-19 strategy were also used for DP activities.
FlexibilityIt is important to minimise bureaucracy and administration, as far as is feasible, in order tofree up time for people to collaborate and to give maximum focus on operational matters atthe local level. There is evidence that progress in developing the DP projects tended to beassociated with a capacity to make decisions that were in good time and responsive tolocal contingencies. In other words, it was important for partnerships to be characterised byflexibility; to display something of the “entrepreneurial culture [which]… is seen asovercoming the alleged stiffness, lethargy, and unresponsiveness of traditionalbureaucracy” (Woods and Woods 2004: 648). Such flexibility enabled them to respondquickly to needs - for example, to aid a school in difficulties by providing support forteaching and professional development. This is not to underplay the value of formal
36
procedures which are important in aiding transparency, respecting staff’s employmentrights, treating students and parents fairly etc8.
In Nisbet, the decision was taken to incorporate the management of the DP initiative intothe regular meetings of heads in the LEA. Later it was decided to also have conferencedays for heads dedicated to sharing information and experiences of collaborative activities.These conferences took place each term and were valuable exercises in confirming thebenefits of collaboration and demonstrating the range of activities that schools wereengaged in. Examples in Byron Collegiate include the rapid response by schools as agroup to the immediate needs of one of its members facing pressures (from the LEA andthe DfES) due to its low GCSE results, and the development of a strategic focus onteaching and learning which was not articulated in its original strategic vision.
5.1.4 Strategic vision
Some articulation of being on a collective journey, which aspires to move beyondtemporary collaborative arrangements, is important. In other words, some kind of strategicvision is needed. The content of this vision varied between collaboratives. Some werefocused purely on educational outcomes; others also focused on student participation anddemocracy and a wider socio-economic agenda (see Box 4).
Box 4
Byron Collegiate: The Collegiate arose from a vision of Collegiate Academies - schools actingtogether to further the education of all their students and committing themselves to a brief set ofcommon commitments. Its strategic focus initially was on staff development, a Collegiate intranetand establishing a corporate identity. Its collaborative activities expanded with time and it becamemore strategically focused on collegiate-wide change in teaching and learning and on vocationaleducation.
Chaucer: The strategic vision for Chaucer was that schools, in partnership with local enterprise,would be one of the drivers of economic regeneration in the area. It was seen as imperative toretain young people in the area, so that they could contribute to this. Broadening educationalopportunities through collaboration was seen as an essential part of this.
Pepys: The key motivator for collaborative activities in Pepys was the concept of a ‘learningcommunity’. This was underpinned by work with consultants from a nearby university, who ledstaff in the development of a strategic vision, which encompassed all the schools in the LEA(primary, secondary and special schools) and took as its basic values position the notion thatschools in Pepys should serve the needs of all the LEA’s children.
Nisbet: The two key foci of the project were the creation of a network of effective practice, toshare among schools, and the promotion of cultural harmony.
Hardy: A key driver for Hardy’s bid was to increase the number of specialist schools in the LEA,as a way of diminishing a potential hierarchy set up by having a small number of specialistschools. The vision of one of the clusters within Hardy was driven more by a need to develop thelocal economy, improve vocational education and rationalise post 16 provision.
Tennyson: A drive to decrease socio-economic disadvantage through building capacity forcollaboration was a key driver.
Strategic vision is not necessarily fully formed at the outset, nor is it unchangeable. In theDP projects the initial overview of strategy and aims was generated by the LEA andprovided a catalyst, and a number of the collaboratives consciously assessed and
8 See, for example, du Gay (2000).
37
amended their strategic vision. The sense from our findings is that the capacity to developand adapt the aims and direction of the DP collaborative group was essential. Strategicvision underpinned the capability of collaboratives to generate strategic innovation.
5.1.5 Engagement of interests
Fundamental to the viability of collaboratives is the engagement of interests. This refers tothe need to recognise the institutional interests of schools and to ensure they are given aplace in the development of the collaborative. Some school interests are recognised asmore pressing than others - e.g. where a school is under threat of closure. But all schoolsmust be able to see how they benefit over time. To this degree there is an instrumental,transactional relationship between school and collaborative, which depends on calculativetrust. For schools in difficult circumstances the advantages may seem more obvious.
Engagement of interests, however, depends on perceptions of interests and how narrowlyor widely these are conceived. For example, a head may see his or her school ascomfortably positioned with, on the face of it, relatively little to gain from collaborativeactivity, but such a perception may be conditioned in two ways. Firstly, the head may have,or come to have, an appreciation that schools in more difficult circumstances haveexpertise and experience that benefits the more comfortably positioned school (in otherwords there is a significant transactional benefit for the latter). In Nisbet, for example, thehead of the school that was supporting a failing school explained that one of the keybenefits that her school gained from the collaboration was that it was excellent staffdevelopment for her teachers. They gained from having to analyse their teaching and passon their experience to others. In addition, they gained considerable skills in mentoring andcoaching others.
Secondly, the understanding of what may be gained from collaborative activity may beframed within a broader view of interest, namely that the purpose (and interest) of theschool is to participate in the educational development of the community that is wider thanits own intake. This is bound up with the existence or development of a group/area identityand identificatory trust. In Tennyson the development of two sports colleges in closeproximity was related to the local heath needs and new vocational courses were jointlydeveloped. In Pepys this was signalled by the focus of their DP project on the creation of a‘learning community’ across the city.
5.2 Resources
The costs associated with the DP projects fall into two categories - expenditures recordedwithin budgets, and off-budget costs, in particular those of the time of teachers and otherstaff whose time may not be paid for out of DP funds. The latter, as expected, has beenmore difficult to track than the former. Data on the off-budget costs of teachers’ time spenton DP collaborative activities were collected by means of a pro-forma for Middle Leaders,which was sent to schools in the Spring and Summer terms of 2003, with the exception ofTennyson which was surveyed later.
5.2.1 Funding
There are two sources of expenditure data. The first is the projected funding for DP projectsprovided by the DfES, which is shown in Table 10. This gives the grant allocations by yearand in total. The average amount per school involved in the LEA’s DP project has beencalculated as well. Average DP projected funding per school varies widely from £40,000 inByron, where it was concentrated on the Collegiate Academy, to £6,447 in Hardy, where itwas spread across the DP clusters.
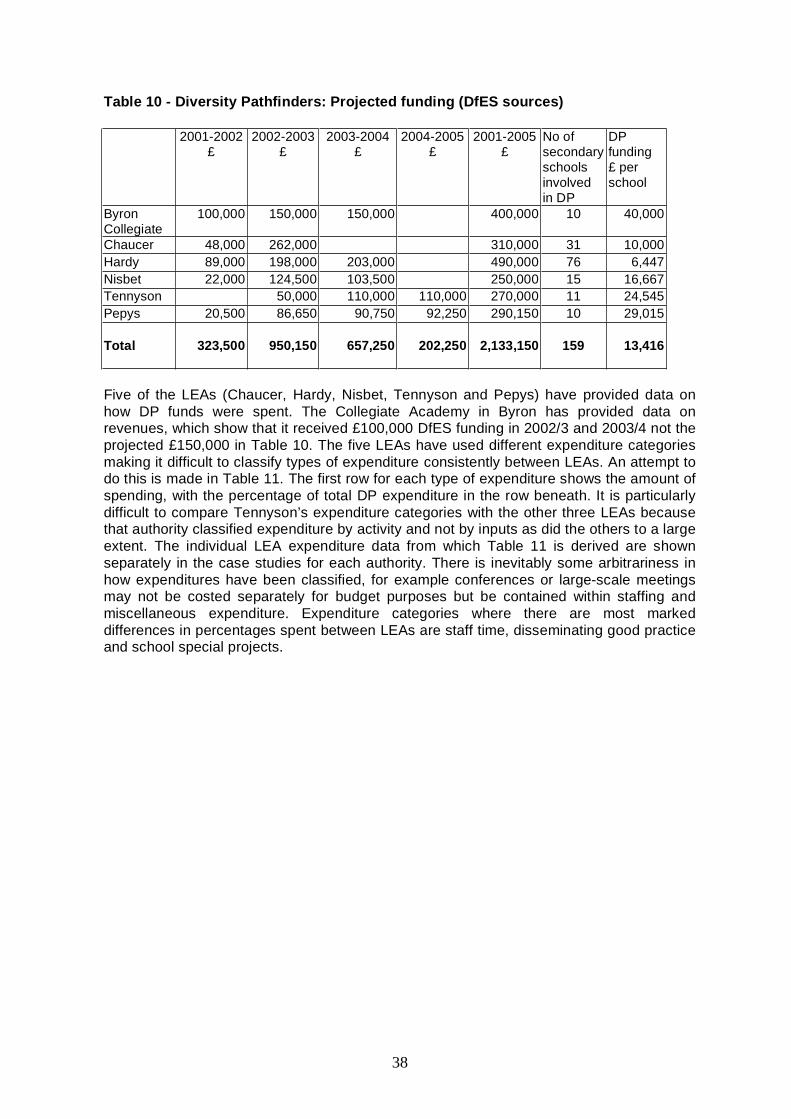
38
Table 10 - Diversity Pathfinders: Projected funding (DfES sources)
2001-2002£
2002-2003£
2003-2004£
2004-2005£
2001-2005£
No ofsecondaryschoolsinvolvedin DP
DPfunding£ perschool
ByronCollegiate
100,000 150,000 150,000 400,000 10 40,000
Chaucer 48,000 262,000 310,000 31 10,000Hardy 89,000 198,000 203,000 490,000 76 6,447Nisbet 22,000 124,500 103,500 250,000 15 16,667Tennyson 50,000 110,000 110,000 270,000 11 24,545Pepys 20,500 86,650 90,750 92,250 290,150 10 29,015
Total 323,500 950,150 657,250 202,250 2,133,150 159 13,416
Five of the LEAs (Chaucer, Hardy, Nisbet, Tennyson and Pepys) have provided data onhow DP funds were spent. The Collegiate Academy in Byron has provided data onrevenues, which show that it received £100,000 DfES funding in 2002/3 and 2003/4 not theprojected £150,000 in Table 10. The five LEAs have used different expenditure categoriesmaking it difficult to classify types of expenditure consistently between LEAs. An attempt todo this is made in Table 11. The first row for each type of expenditure shows the amount ofspending, with the percentage of total DP expenditure in the row beneath. It is particularlydifficult to compare Tennyson’s expenditure categories with the other three LEAs becausethat authority classified expenditure by activity and not by inputs as did the others to a largeextent. The individual LEA expenditure data from which Table 11 is derived are shownseparately in the case studies for each authority. There is inevitably some arbitrariness inhow expenditures have been classified, for example conferences or large-scale meetingsmay not be costed separately for budget purposes but be contained within staffing andmiscellaneous expenditure. Expenditure categories where there are most markeddifferences in percentages spent between LEAs are staff time, disseminating good practiceand school special projects.

39
Table 11 - LEA expenditures on Diversity Pathfinder 2001/2 to 2003/4 (£)
Type of expenditure Hardy Nesbit Tennyson Pepys ChaucerDP co-ordination at LEA level 106,380 See note 40,000 38,250 44,585
34% n/a 18% 22% 14%Allocations to schools for staff time 99,500 30155 92,000 24,875 78,290
32% 15% 41% 14% 24%Specialist school promotion 72,500 0 40000 24,000 44,000
23% 0% 18% 14% 13%Disseminating good practice/professional development 18,000 120,000 14,000 70,000 25,850
6% 58% 6% 40% 8%
Evaluation 3000 23,100 10,000 1,000 01% 11% 4% 1% 0%
Conferences 1,300 20,579 0 0 5,2250.4% 10.0% 0.0% 0.0% 1.6%
Misc: phones, travel, subsistence 8,250 1,996 0 1,750 02.7% 1.0% 0.0% 1.0% 0.0%
Electronic environment 0 7,907 14,000 0 47,0000.0% 3.9% 6.2% 0.0% 14.2%
Schools' special projects 0 1,500 15,000 15,000 85,0500.0% 0.7% 6.7% 8.6% 25.8%
TOTAL 308,930 205,237 225,000 174,875 330,000
Notes: Nisbet employed a DP project officer whose main role was to develop the Nisbet EffectivePractice Network so their salary is included within ‘disseminating good practice’. Tennyson classifiedexpenditure by activity not by salary payments to personnel, therefore activities called ‘Pathfinder co-ordination’ (excluding ‘curriculum and cluster development’ and ‘specialist school development’ areallotted to ‘DP co-ordination at LEA level’ and ‘curriculum and cluster development’ are placed under‘allocations to schools for staff time’.
5.2.2 Teacher time spent on collaborative activities
In order to gain some idea of the amount of time teachers were spending on collaborativeactivities, middle leaders in the case study schools were sent two short surveys askingthem to estimate the number of hours teachers in their department had spent oncollaborative activities during spring and summer terms of 2003; for Tennyson the termsreported on were autumn of 2003 and spring 20049. Middle Leaders were asked about thehours teachers had spent on the following activities:• Meetings = total meetings x teacher hours• CPD = total CPD x teacher hours• Teachers out = total teacher hours out of school for teaching and advice• Teachers in = total teacher hours coming in for teaching and advice• Students in = total teacher hours involved in students coming in to school• Students out = total teacher hours involved in students going out of school• Other = total teacher hours involved in other DP activities• Total = total of all these activities.
9 The second round of surveys is not reported for reasons explained in Section 3.3.3.
40
For both surveys taken together the response rate was 67 per cent, with a few schoolsreturning just one of the surveys. A summary table of teacher time spent on collaborativeactivities is given in Appendix E. The number of returns (i.e. middle leaders responding)was recorded to indicate whether all departments involved in collaborative activities werelikely to have responded. Given the numbers, it would appear that when a school hasreturned the survey this included most, if not all, middle leaders involved in collaborativeactivities. In three LEAs collaborative activities were less numerous in the summer term.
The survey indicates two interesting features of collaboration. First it is unevenly distributedacross schools, despite these being in the same collaborative cluster. Some schools reporta high number of hours - in the region of 400-500 plus teacher hours per term, whereasothers report few or no teacher time so spent. In part this is due to the lead role of some ofthe schools for example as a Training School or in supplying ASTs to other schools.Tennyson schools (4 out of 5 responding) reported the greatest number of teachers hoursspent on collaboration. On average the schools responding were devoting 200 teachershours over two terms to collaborative activities, which gives a rough average of 300 hours ayear (or slightly more if reduced activity in the summer term is allowed for) which is arounda quarter of the 1265 annual directed hours of a teacher. A rough estimate is therefore thata quarter of a teacher is used for collaborative activities per school.
Second, the main activities taking up teacher time were meetings, followed by CPD and, forsome schools, teachers out of school working in other schools. Very little time was devotedto teaching the schools’ own students out-of-school or other schools’ students in their ownschool, with the exception of one school in Byron and two schools in Tennyson.
5.2.3 Leverage and synergy
These concern capacity to sustain and enhance funding. Leverage refers to using DP toraise additional funding and synergy to combining DP with resources from other projects toincrease the total benefits.
There was evidence of leverage and synergy in all the DP LEAs. Schools were able toextend DP collaboration to make additional successful bids for project funding from avariety of sources. The Byron Collegiate, for example, raised additional funding from theGatsby Foundation and for an inclusion network for sharing good practice in SEN teaching.In Chaucer the Education Business Partnership and Design and Making Centre wereactively involved with DP in creating learning materials, and a school cluster obtainedfunding for a Networked Learning Community. Hardy has used DP to raise additionalfunding for specialist schools bids. DP funding from the DfES has mobilised schools to getin additional funding. Schools in the Byron Collegiate contribute 0.05% of their budgets tocollegiate revenues and in Tennyson schools have contributed £20,000 each to fund foursubject professional teachers.
5.3 Diversification
Diversification is concerned with how specialist status was promoted, its priority in the DPprojects, and trends in each area with regard to horizontal diversity (differences betweenschools in terms of formal specialist status but also recognition of other strengths andweaknesses between schools) and vertical diversity (the degree to which there is ahierarchy of esteem amongst schools).
5.3.1 Specialist status
There is evidence in each of the areas, of progress towards specialisation in terms ofspecialist status. Detailed figures are given in Table 12, where, for Byron LEA, ByronCollegiate is shown as well as the LEA.
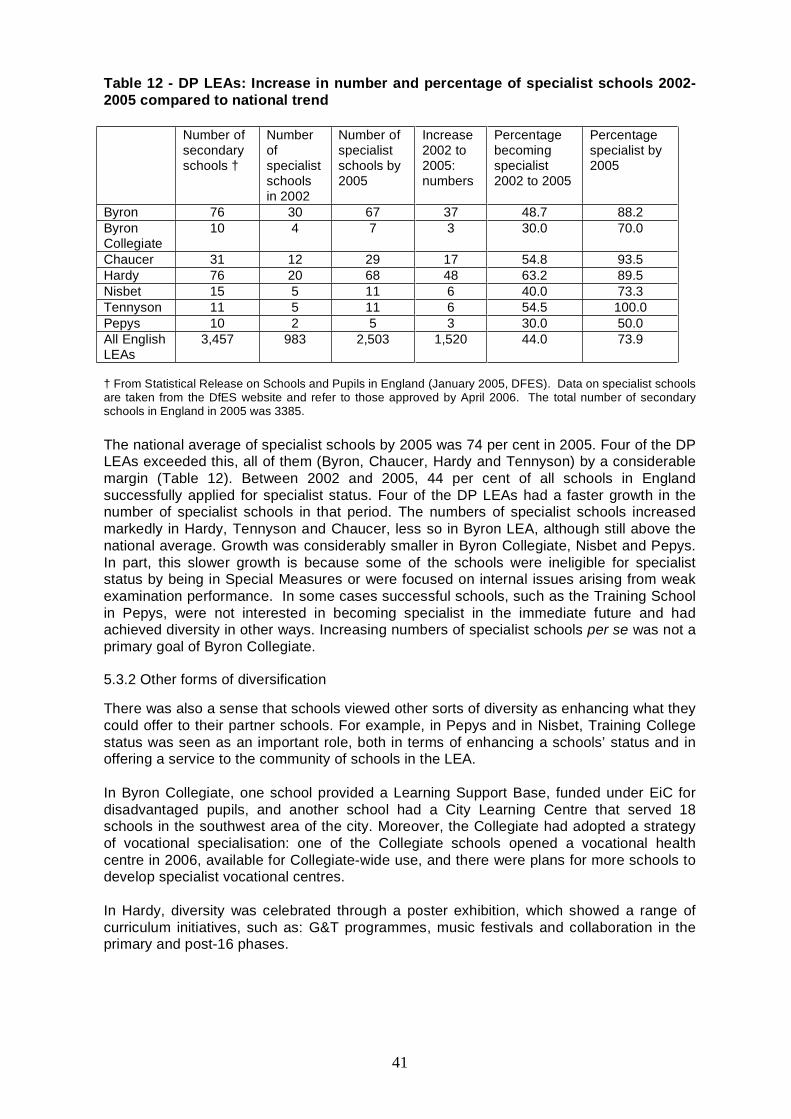
41
Table 12 - DP LEAs: Increase in number and percentage of specialist schools 2002-2005 compared to national trend
Number ofsecondaryschools †
Numberofspecialistschoolsin 2002
Number ofspecialistschools by2005
Increase2002 to2005:numbers
Percentagebecomingspecialist2002 to 2005
Percentagespecialist by2005
Byron 76 30 67 37 48.7 88.2ByronCollegiate
10 4 7 3 30.0 70.0
Chaucer 31 12 29 17 54.8 93.5Hardy 76 20 68 48 63.2 89.5Nisbet 15 5 11 6 40.0 73.3Tennyson 11 5 11 6 54.5 100.0Pepys 10 2 5 3 30.0 50.0All EnglishLEAs
3,457 983 2,503 1,520 44.0 73.9
† From Statistical Release on Schools and Pupils in England (January 2005, DFES). Data on specialist schoolsare taken from the DfES website and refer to those approved by April 2006. The total number of secondaryschools in England in 2005 was 3385.
The national average of specialist schools by 2005 was 74 per cent in 2005. Four of the DPLEAs exceeded this, all of them (Byron, Chaucer, Hardy and Tennyson) by a considerablemargin (Table 12). Between 2002 and 2005, 44 per cent of all schools in Englandsuccessfully applied for specialist status. Four of the DP LEAs had a faster growth in thenumber of specialist schools in that period. The numbers of specialist schools increasedmarkedly in Hardy, Tennyson and Chaucer, less so in Byron LEA, although still above thenational average. Growth was considerably smaller in Byron Collegiate, Nisbet and Pepys.In part, this slower growth is because some of the schools were ineligible for specialiststatus by being in Special Measures or were focused on internal issues arising from weakexamination performance. In some cases successful schools, such as the Training Schoolin Pepys, were not interested in becoming specialist in the immediate future and hadachieved diversity in other ways. Increasing numbers of specialist schools per se was not aprimary goal of Byron Collegiate.
5.3.2 Other forms of diversification
There was also a sense that schools viewed other sorts of diversity as enhancing what theycould offer to their partner schools. For example, in Pepys and in Nisbet, Training Collegestatus was seen as an important role, both in terms of enhancing a schools’ status and inoffering a service to the community of schools in the LEA.
In Byron Collegiate, one school provided a Learning Support Base, funded under EiC fordisadvantaged pupils, and another school had a City Learning Centre that served 18schools in the southwest area of the city. Moreover, the Collegiate had adopted a strategyof vocational specialisation: one of the Collegiate schools opened a vocational healthcentre in 2006, available for Collegiate-wide use, and there were plans for more schools todevelop specialist vocational centres.
In Hardy, diversity was celebrated through a poster exhibition, which showed a range ofcurriculum initiatives, such as: G&T programmes, music festivals and collaboration in theprimary and post-16 phases.

42
5.4 Professional Processes
A key aim of the DP project was to enable schools to work together to enhance the qualityand capacity of teaching. Table 13 summarises from the DP case studies the instances ofcollaborative professional processes. These are further discussed under the headings of‘professional development, sharing resources and mutual institutional support’ and ‘e-communities’.
Table 13 - Examples of collaborative professional processesByronCollegiate
Chaucer Hardy Nisbet Tennyson Pepys
Advanced SkillsTeachers / leadteachers
3ASTS(Gatsbyfunded)
ASTs: not DPfunded
ASTs at DPnetworkmeetings
ASToutreach.
‘LeadTeachers’workingacross allschools
AST outreach.NQT support.
Releasingteachers tosupport partnerschools
Yes Yes Yes Yes
CollaborativeCPD
Collegiatetraining days.Curriculumworkinggroups.Leaddepartments/lead teachersidentified toleaddevelopmentin specifiedcurriculumareas
Area A: networkon GCCSE &post 16
Sharedcourse formiddlemanagers
Trainingschool
Subjectnetworkmeetings
Joint CPD intwilightsessions
Trainingschool.
LEA-wideschool closuredays
Assessmentfor Learningmeetings
Electronicenvironmentand ICT
Collegiateintranet.Collegiate ICTstrategydirector
Sharedlearningmaterials
DP website.Area A:communitylearningplatform.
NisbetEffectivePracticeNetwork.
LearningPortal- fundedfrom 14-19action plan.
Intended butlittledevelopmentso far.
5.4.1 Professional development, sharing resources and mutual institutional supportOne of the main intended benefits of collaboration between schools was to enableprofessional development between schools. This is a way of sharing of resources to reduceunit costs and allows some schools to obtain resources to which they would not otherwisehave access. Joint professional development allows the collaboration to be visible toteachers
It has taken on a range of formats including joint meetings between schools as well as amore radical opportunity of movement of teachers between schools. Sharing teachers, withsome teachers going into partner schools to provide support, has been a feature of five ofthe DP LEAs. In Tennyson this was undertaken through Leading Edge partnerships, twilightsessions and flexible movement of staff to specific curriculum areas. Tennyson schoolsfunded new support roles called Lead Subject Professionals. This model of a local pool ofexpert senior teachers is similar to the model of collegiate ASTs in Byron and is linked togroup area identity. Releasing teachers to support partner schools has occurred in most ofthe DP projects. In some cases, this was a type of ‘fire-fighting’ support, in response to theshort-term, urgent requirements of a school facing particular difficulties, but there were alsoexamples of longer-term, planned support. In Tennyson and Byron there was a deliberatestrategy to build capacity among heads of departments and this was linked to the area-widevision of improvement.
43
This planned support was integral to joint professional development, which was found infive of the DP projects. Pepys provided an interesting example of the funding of a TrainingSchool which provided AST outreach and NQT support to other schools, as well has havinga lead role in professional development. Byron Collegiate, as part of their joint professionaldevelopment, held collegiate-wide training days and identified lead departments and leadteachers to pursue a programme of raising standards of teaching through an agreedframework for supporting, coaching and mentoring.
These examples of joint professional development may be replacing work previouslyundertaken by the local authority e.g. heads of department meetings, or they may beproviding an innovative way of providing voice to teachers at a range of levels to shareuseful work or be seen as penetration of the area wide vision beyond headteachers’groups. Penetration - in the sense of collaboration and its potential for positive changehaving an impact below the senior levels of schools - has been a major challenge for theprojects generally, in that, in most LEAs, the majority of teachers and pupils had not beeninvolved in collaborative activities.
5.4.2 e-communities
Developing a shared electronic environment (e-communities) for the exchange of ideas andinformation has been an element of all the DP projects. The Collegiate in Byron appointeda Collegiate ICT strategy director to take the lead on developing a collegiate intranet. Thishas not yet fulfilled its aims, partly for technical reasons (lack of a broadband network allschools can share). Chaucer has developed a shared course and shared schemes of workin science through the use of ICT. Nisbet made a major investment of DP funding intodeveloping a Network of Effective Practice. The platform is now functioning but evidencesuggests that it is not greatly used as yet. Tennyson launched a learning portal in summer2004 funded from its 14 -19 action plan. In Hardy there is a DP website featuring casestudies and details of DP network meetings. Area A has set up a community electroniclearning system, accessible to students from September 2004, but video conferencing hasbeen delayed due to technical difficulties.
The case-study evidence indicates that the productive use of electronic environmentsduring the project period did not develop as fast as hoped. They were not often used bystaff in the schools involved. They have suffered from not being initiated and led by theneeds of collaboration and teaching and learning, but by a top-down vision of technicalpotential. Problems have also often been due to lack of teacher time and awareness and totechnical difficulties. The limited use made of ICT and electronic environments inpartnership schemes is emerging as a quite consistent finding in research (see e.g. thesystematic research review of networks, Bell et al., 2006).
More positively, there is evidence of DP projects learning from experience so far andutilising their flexibility and relative autonomy to make adjustments that will seek to give theelectronic environments greater relevance and usage.
5.5 Provision
Provision covers a range of areas that directly impact on the range and quality of students’educational experience, including initiatives that directly bring about change in teaching,learning and the curriculum, effects on staffing (recruitment and retention) and the role ofand opportunities for student voice. Examples are given in Table 14.
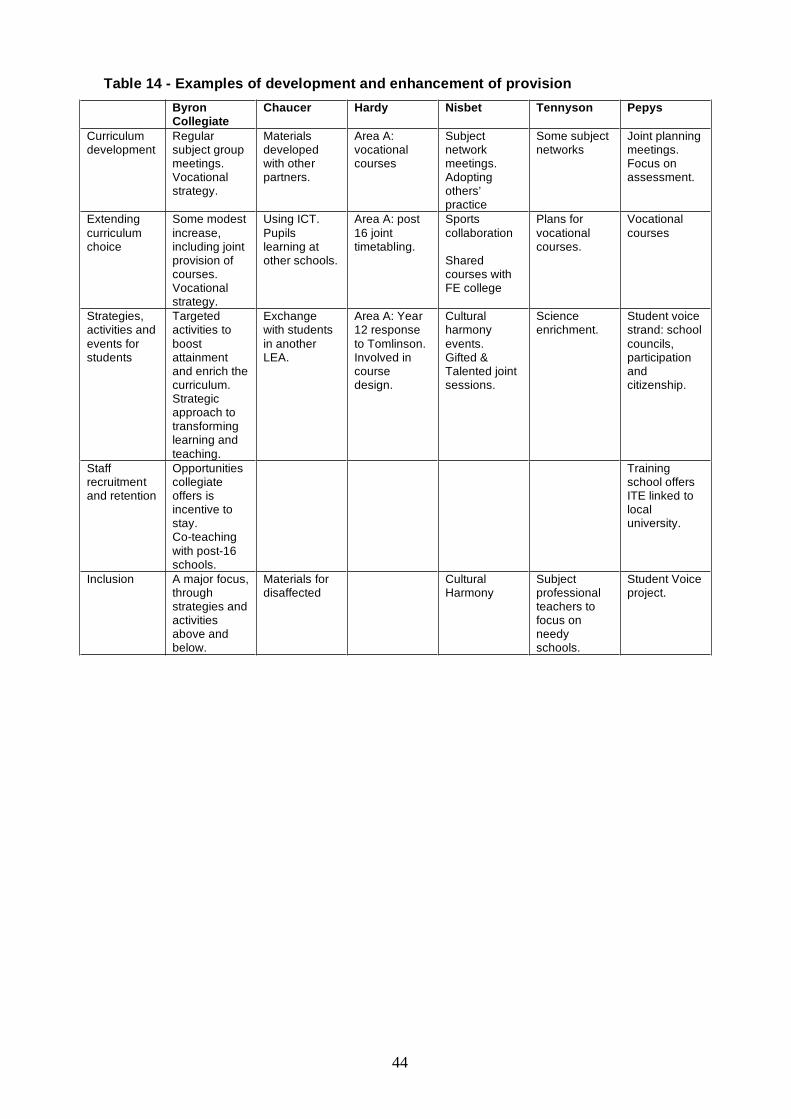
44
Table 14 - Examples of development and enhancement of provisionByronCollegiate
Chaucer Hardy Nisbet Tennyson Pepys
Curriculumdevelopment
Regularsubject groupmeetings.Vocationalstrategy.
Materialsdevelopedwith otherpartners.
Area A:vocationalcourses
Subjectnetworkmeetings.Adoptingothers’practice
Some subjectnetworks
Joint planningmeetings.Focus onassessment.
Extendingcurriculumchoice
Some modestincrease,including jointprovision ofcourses.Vocationalstrategy.
Using ICT.Pupilslearning atother schools.
Area A: post16 jointtimetabling.
Sportscollaboration
Sharedcourses withFE college
Plans forvocationalcourses.
Vocationalcourses
Strategies,activities andevents forstudents
Targetedactivities toboostattainmentand enrich thecurriculum.Strategicapproach totransforminglearning andteaching.
Exchangewith studentsin anotherLEA.
Area A: Year12 responseto Tomlinson.Involved incoursedesign.
Culturalharmonyevents.Gifted &Talented jointsessions.
Scienceenrichment.
Student voicestrand: schoolcouncils,participationandcitizenship.
Staffrecruitmentand retention
Opportunitiescollegiateoffers isincentive tostay.Co-teachingwith post-16schools.
Trainingschool offersITE linked tolocaluniversity.
Inclusion A major focus,throughstrategies andactivitiesabove andbelow.
Materials fordisaffected
CulturalHarmony
Subjectprofessionalteachers tofocus onneedyschools.
Student Voiceproject.

45
5.5.1 Teaching, learning and the curriculum
An intended benefit of school collaboration was joint curriculum development andenhancement of curricular choice for students. A particular focus intended for the DPprojects was greater inclusion by providing disadvantaged or disaffected students withmore attractive curriculum offerings. Table 14 summarises DP activities in the LEAs withrespect to curriculum development and enhancement of choice, as well as specific eventsorganised for students and any specific focus on inclusion. It is not possible to distinguishbetween curriculum development and broadening curriculum choice, when the former leadsto the latter, as is the case in a number of DP clusters with respect to developing newvocational courses.
Curriculum development activities are a strong feature of DP through the organisation ofsubject group meetings involving staff from the DP cluster to work on curriculumimprovements and develop new courses, which can then be offered to students in severalschools. Given the 14-19 agenda, the development of vocational courses at GCSE andpost-16 proved a fruitful area for collaboration. There are examples of new developmentsinvolving students from more than one school sharing courses, including via video links.For example in the Byron Collegiate, students from schools across the Collegiate took afood hygiene course via video; two shared, alternative vocational Year 10 options havebeen trialled; and students from the special school attend GCSE English classes atanother school. Potentially more significant than these singular initiatives, a strategicdecision was made to provide a Collegiate-wide focus on vocational, hands-on courses.Since September 2004 the schools have been progressing to become specialist vocationalcentres. Having successfully bid for Learning and Skills Council (LSC) funds, these havebeen used to provide (non-VGCSE) hands-on courses for students in danger of notattaining any qualifications. Btec courses have been developed by the Collegiate - byfunding cover and setting up networks between schools.
In Chaucer, students attended a course at another school and also shared coursematerials via ICT. Pepys schools organised vocational courses with the sixth form and FEcolleges. Area A in Hardy students were involved in shared vocational courses anddemand reportedly was higher than the capacity. However, joint course provision is oftendifficult to organise, especially at KS3 and KS4 because of the difficulty of aligning schooltimetables. Even the Byron Collegiate, the most tightly linked of the collaborations, hasfound this difficult, succeeding, by the end of the research, in creating two common two-hour blocks a week in schools’ timetables.
Inclusion has been a major issue for curriculum development in the Byron Collegiate andNisbet, which used DP funding to promote Cultural Harmony as a key theme. In several ofthe LEAs new vocational courses were seen as important for achieving inclusion, whilematerials aimed at disaffected students were developed in Chaucer. Shared activities forstudents also featured, the Nisbet Cultural Harmony events and the Pepys Student Voiceproject being particularly notable. Tennyson ran science enrichment sessions for GCSEstudents and the Byron Collegiate organised pupil interpersonal skills workshops tosupport mentoring.
The Byron Collegiate gave increasing attention to the question of how to further improvethe teaching and learning culture across the Collegiate in a more radical way thanparticular professional development initiatives and specific innovations aimed at enhancingthe curriculum. The Collegiate focused on the potential of TEEP (Teacher EffectivenessEnhancement Project), a programme aimed at promoting accelerated learning andmotivating and empowering learners, and took a strategic role in supporting TEEP byfacilitating training through its ASTs and collegiate training days.
46
5.5.2 Staffing (recruitment and retention)
Recruitment and retention of staff have been positively affected by the collaborative inByron. For example, staff were encouraged to seek posts in another Collegiate school as acareer step, rather than leaving the area entirely, and the Collegiate was developingopportunities for co-teaching with post-16 schools. In Pepys, the training school was set upwith the specific aim of ‘growing their own’, since recruitment and retention had been asignificant challenge for the LEA. The Training School runs a PGCE course in collaborationwith a local HEI.
5.5.3 Inclusion
Many of the initiatives arising from the collaborative in Byron were aimed at enhancing theopportunities of less advantaged students, such as the vocational strategy begun in 2004and the inclusion of the special school as an integral member of the Collegiate. TheCollegiate also directed funds and support to schools (and in consequence students) inmore difficult and deprived circumstances. There was a focus on disadvantaged students inNisbet, which has a high level of ethnic minority and economically deprived students. TheLEA has an inclusion policy, also, for students with special educational needs and hasclosed all but two of its special schools. There was collaboration across schools to meet theneeds of these pupils, but this has been an on-going feature of the LEA since before theDP initiative. More focused work, coming out of DP was the Cultural Harmony strand oftheir project, which was organised and run by school students, with the support ofresearchers from the local university. Findings from our analysis of the NPD (nationalPupils Database) data indicate that Nisbet was highly effective in improving the educationalattainment of economically deprived students.

47
6. EDUCATIONAL EFFECTS
6.1 Students’ experience and opportunities
Through the range of qualitative data collected in the areas, particularly from the case studyschools, research sought to trace the influence of collaborative activity and diversificationamongst schools. The evidence in Section 5.5 would seem to suggest that the experienceof at least some students in the schools and LEAs involved will have been enhancedthrough a widening of opportunities and a closer tailoring of the curriculum offer to theirneeds. The results of the surveys of students, however, indicate caution in claiming positiveeffects on students’ educational experience.
The students’ surveys were to provide an evaluation of the impact of DP projects in termsof curriculum choice, school satisfaction and collaborative working between students usingevidence from a survey of students in Year 11 in the Diversity Pathfinders case-studyschools in 2002/3 and 2005/6. When analysing student responses differences in measuredstudent characteristics (prior attainment, gender, eligibility for free school meals, SEN andethnicity were controlled for. The full survey report is in Appendix C.
The main findings are that there is no evidence of increased curriculum choice in DPschools. There was no significant difference between students in 2002/3 and those in2005/6 in terms of the availability of the subjects that they wished to take. In both surveysaround 20 per cent of students reported that there were learning opportunities they wouldlike that their school did not provide. When subjects that students reported taking in bothyears were compared, there was little increase in the range in 2005/6 apart from a fewmore vocational courses. This survey also provided further analysis of indicators ofsatisfaction with school derived from a factor analysis of responses to the questionnaire. Nosignificant improvement in each of the indicators of school satisfaction was found. On thecontrary, students were more likely to rate the overall quality of maths, quality of facilities,and satisfaction with using the computers lower in 2005/6 than in 2002/3.
Students’ attitudes to collaborative work with students from other schools and theirexperiences of working with students from other schools did not improve significantlybetween 2002/3 and 2005/6. While more lessons and activities with students from otherschools were reported in 2005/6 than in 2002/3, students’ perceptions that these helpedtheir learning had declined. There were some significant differences in the experiences ofworking with students from other schools by student group, with girls having lessexperience of collaboration than boys. Students whose first language is not English weremore likely to go to other schools for lessons, whereas those with high prior attainment atKS3 were less likely to use a computer or video link for learning with students from otherschools.
With regard to post-16 intentions, students from DP case-study schools in 2005/6 weremore likely to be unsure about their future plans than those in 2002/3, holding other thingsconstant.
The findings of the survey are disappointing with respect to providing evidence that DPfulfilled its aims of increasing curriculum choice, and improving teaching and learning forstudents, or encouraging increased participation in post-16 education. Students were, ifanything, less likely to wish to stay in full time education after 16 and were less satisfiedwith school in relation to the quality of maths and English learning and using computers.They were also more likely to have experienced harassment from other students.
The one major positive impact that can probably be attributed to DP was the increase in theproportion of students who had experienced lessons or activities with students from otherschools. But, this was offset by the increased proportion of students claiming that workingwith students from other schools never helps their learning.

48
Apart from finding that compared to 2002/3, SEN students were no longer more likely toreport harassment at school than non-SEN students, the survey evidence does not suggestany marked changes in inclusion for this group.
Given that only 13 out of 31 DP case-study schools responded to the survey in both years,the findings should be treated with caution. Nevertheless, the survey analysis provides noevidence that DP has succeeded in widening curriculum choice or improving the quality ofthe students’ experience of school or their desire to continue with full time education.
6.2 Attainment
Data from the National Pupil Database have been analysed in order to assess whether DPcould be judged to have contributed to an improvement in educational attainment in the DPLEAs and schools. The measures of GCSE attainment used are the GCSE capped score(the best 8 subjects), maths and English. (GCSE 2002 science results were not available.)Value added performance measures are used which means that each school’sperformance is compared relative to other secondary schools in England, controlling forstudent characteristics and school context variables that affect educational attainment. Thequantitative part of the evaluation of the DP programme has focused on assessing theimprovement in GCSE results made by DP LEAs and the DP schools over the period ofimplementation of DP from its start in 2002 to the conclusion of the evaluation in 2005.
It is important to bear in mind that if it is observed that schools have improved their resultsover the 3 years this cannot definitely be attributed to the DP project because theevaluation research design does not enable comparison of the DP schools with a group ofcontrol schools that were similar but did not engage in collaborative activities. Also, otherfactors than the DP project could have affected schools’ progress in improving educationalattainment. Therefore, this analysis identifies whether DP schools and DP LEAs improvedtheir students’ attainment at GCSE relative to all schools nationally when 2005 is comparedto 2002.
It is an important part of the DP evaluation to obtain evidence on the success or otherwiseof the DP schools in improving examination results. The differences in the extent to whichschools and LEAs improved their GCSE exam results over the three-year period areinterpreted and using knowledge of the schools’ and LEAs’ policies drawn from thequalitative data.
In this analysis the DP schools are all schools in the DP LEAs apart from Byron LEA, whereonly the 6 schools in a collegiate academy are included as they received all the DP funding.When individual schools’ value added results are presented, these are for all schools in thesmall LEAs (Nisbet, Tennyson and Pepys) and the 6 collegiate academy schools in ByronLEA. For Hardy and Chaucer - two large LEAs - the schools included are as follows: 6schools in the two case study areas in Hardy LEA; the case study schools and the partnerschools in their collaborative clusters in Chaucer LEA. (The overall effectiveness of a DPLEA is estimated by including it as a dummy variable - see Appendix D.)
The major findings from this analysis are now summarised. The full report is in Appendix D.
DP LEAs as a group improved overall GCSE results (the best 8 subjects) in 2005compared to 2002 by about 1 grade more than LEAs nationally when these are comparedas two groups. They did not improve English or maths results relative to other LEAs.However, not all DP LEAs contributed to this group improvement. When the effects ofindividual LEAs is measured, only Nesbit and Byron improved GCSE results between 2002and 2005. Byron improved the total GCSE score but Nesbit improved both English andmaths scores against a national downward trend in these two subjects.
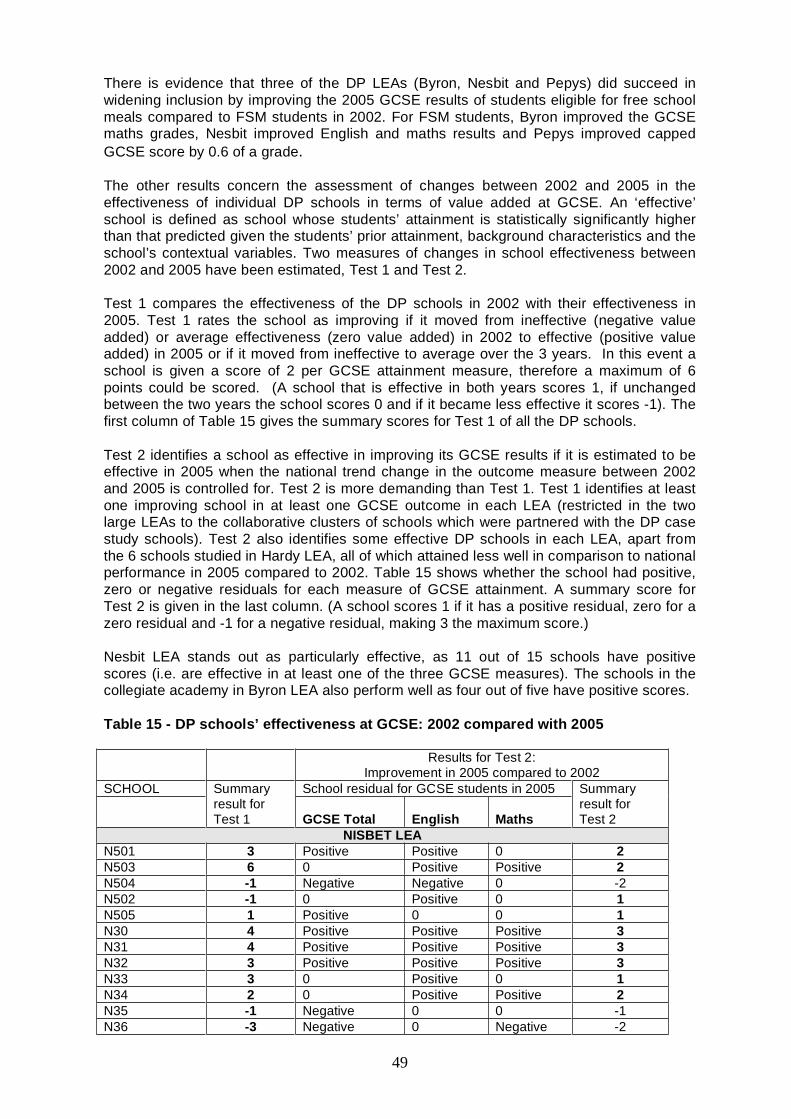
49
There is evidence that three of the DP LEAs (Byron, Nesbit and Pepys) did succeed inwidening inclusion by improving the 2005 GCSE results of students eligible for free schoolmeals compared to FSM students in 2002. For FSM students, Byron improved the GCSEmaths grades, Nesbit improved English and maths results and Pepys improved cappedGCSE score by 0.6 of a grade.
The other results concern the assessment of changes between 2002 and 2005 in theeffectiveness of individual DP schools in terms of value added at GCSE. An ‘effective’school is defined as school whose students’ attainment is statistically significantly higherthan that predicted given the students’ prior attainment, background characteristics and theschool’s contextual variables. Two measures of changes in school effectiveness between2002 and 2005 have been estimated, Test 1 and Test 2.
Test 1 compares the effectiveness of the DP schools in 2002 with their effectiveness in2005. Test 1 rates the school as improving if it moved from ineffective (negative valueadded) or average effectiveness (zero value added) in 2002 to effective (positive valueadded) in 2005 or if it moved from ineffective to average over the 3 years. In this event aschool is given a score of 2 per GCSE attainment measure, therefore a maximum of 6points could be scored. (A school that is effective in both years scores 1, if unchangedbetween the two years the school scores 0 and if it became less effective it scores -1). Thefirst column of Table 15 gives the summary scores for Test 1 of all the DP schools.
Test 2 identifies a school as effective in improving its GCSE results if it is estimated to beeffective in 2005 when the national trend change in the outcome measure between 2002and 2005 is controlled for. Test 2 is more demanding than Test 1. Test 1 identifies at leastone improving school in at least one GCSE outcome in each LEA (restricted in the twolarge LEAs to the collaborative clusters of schools which were partnered with the DP casestudy schools). Test 2 also identifies some effective DP schools in each LEA, apart fromthe 6 schools studied in Hardy LEA, all of which attained less well in comparison to nationalperformance in 2005 compared to 2002. Table 15 shows whether the school had positive,zero or negative residuals for each measure of GCSE attainment. A summary score forTest 2 is given in the last column. (A school scores 1 if it has a positive residual, zero for azero residual and -1 for a negative residual, making 3 the maximum score.)
Nesbit LEA stands out as particularly effective, as 11 out of 15 schools have positivescores (i.e. are effective in at least one of the three GCSE measures). The schools in thecollegiate academy in Byron LEA also perform well as four out of five have positive scores.
Table 15 - DP schools’ effectiveness at GCSE: 2002 compared with 2005
Results for Test 2:Improvement in 2005 compared to 2002
SCHOOL School residual for GCSE students in 2005Summaryresult forTest 1 GCSE Total English Maths
Summaryresult forTest 2
NISBET LEAN501 3 Positive Positive 0 2N503 6 0 Positive Positive 2N504 -1 Negative Negative 0 -2N502 -1 0 Positive 0 1N505 1 Positive 0 0 1N30 4 Positive Positive Positive 3N31 4 Positive Positive Positive 3N32 3 Positive Positive Positive 3N33 3 0 Positive 0 1N34 2 0 Positive Positive 2N35 -1 Negative 0 0 -1N36 -3 Negative 0 Negative -2
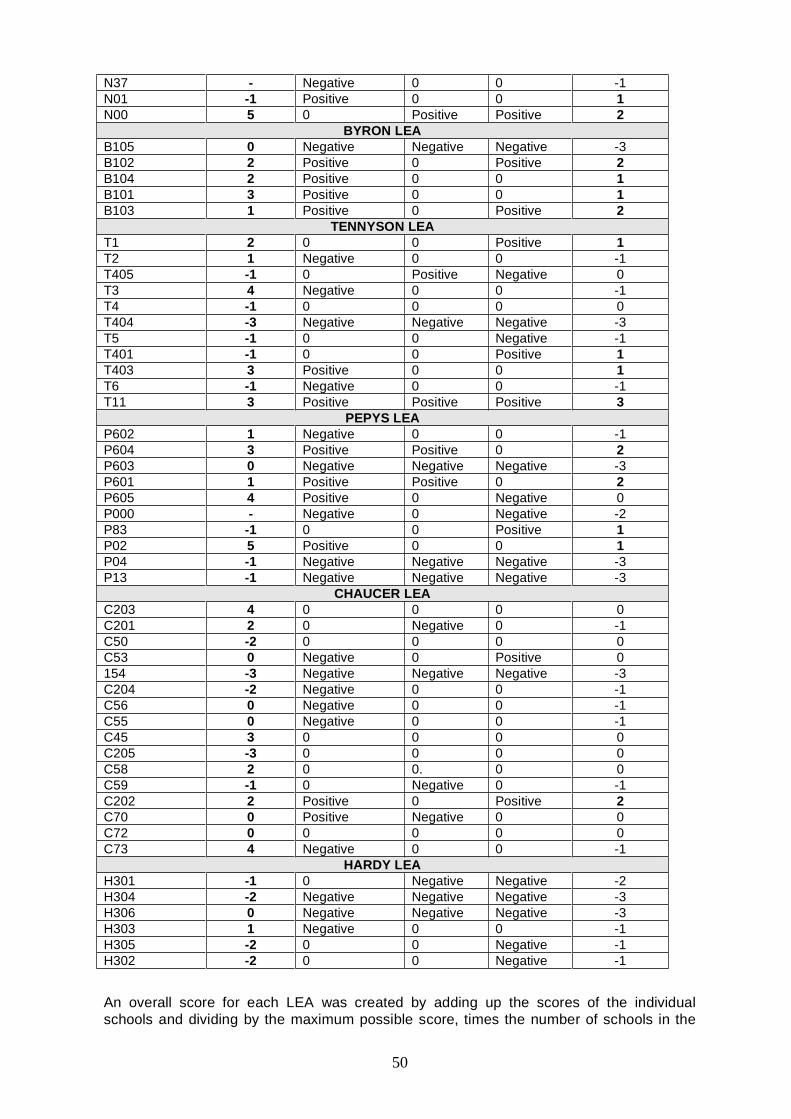
50
N37 - Negative 0 0 -1N01 -1 Positive 0 0 1N00 5 0 Positive Positive 2
BYRON LEAB105 0 Negative Negative Negative -3B102 2 Positive 0 Positive 2B104 2 Positive 0 0 1B101 3 Positive 0 0 1B103 1 Positive 0 Positive 2
TENNYSON LEAT1 2 0 0 Positive 1T2 1 Negative 0 0 -1T405 -1 0 Positive Negative 0T3 4 Negative 0 0 -1T4 -1 0 0 0 0T404 -3 Negative Negative Negative -3T5 -1 0 0 Negative -1T401 -1 0 0 Positive 1T403 3 Positive 0 0 1T6 -1 Negative 0 0 -1T11 3 Positive Positive Positive 3
PEPYS LEAP602 1 Negative 0 0 -1P604 3 Positive Positive 0 2P603 0 Negative Negative Negative -3P601 1 Positive Positive 0 2P605 4 Positive 0 Negative 0P000 - Negative 0 Negative -2P83 -1 0 0 Positive 1P02 5 Positive 0 0 1P04 -1 Negative Negative Negative -3P13 -1 Negative Negative Negative -3
CHAUCER LEAC203 4 0 0 0 0C201 2 0 Negative 0 -1C50 -2 0 0 0 0C53 0 Negative 0 Positive 0154 -3 Negative Negative Negative -3C204 -2 Negative 0 0 -1C56 0 Negative 0 0 -1C55 0 Negative 0 0 -1C45 3 0 0 0 0C205 -3 0 0 0 0C58 2 0 0. 0 0C59 -1 0 Negative 0 -1C202 2 Positive 0 Positive 2C70 0 Positive Negative 0 0C72 0 0 0 0 0C73 4 Negative 0 0 -1
HARDY LEAH301 -1 0 Negative Negative -2H304 -2 Negative Negative Negative -3H306 0 Negative Negative Negative -3H303 1 Negative 0 0 -1H305 -2 0 0 Negative -1H302 -2 0 0 Negative -1
An overall score for each LEA was created by adding up the scores of the individualschools and dividing by the maximum possible score, times the number of schools in the
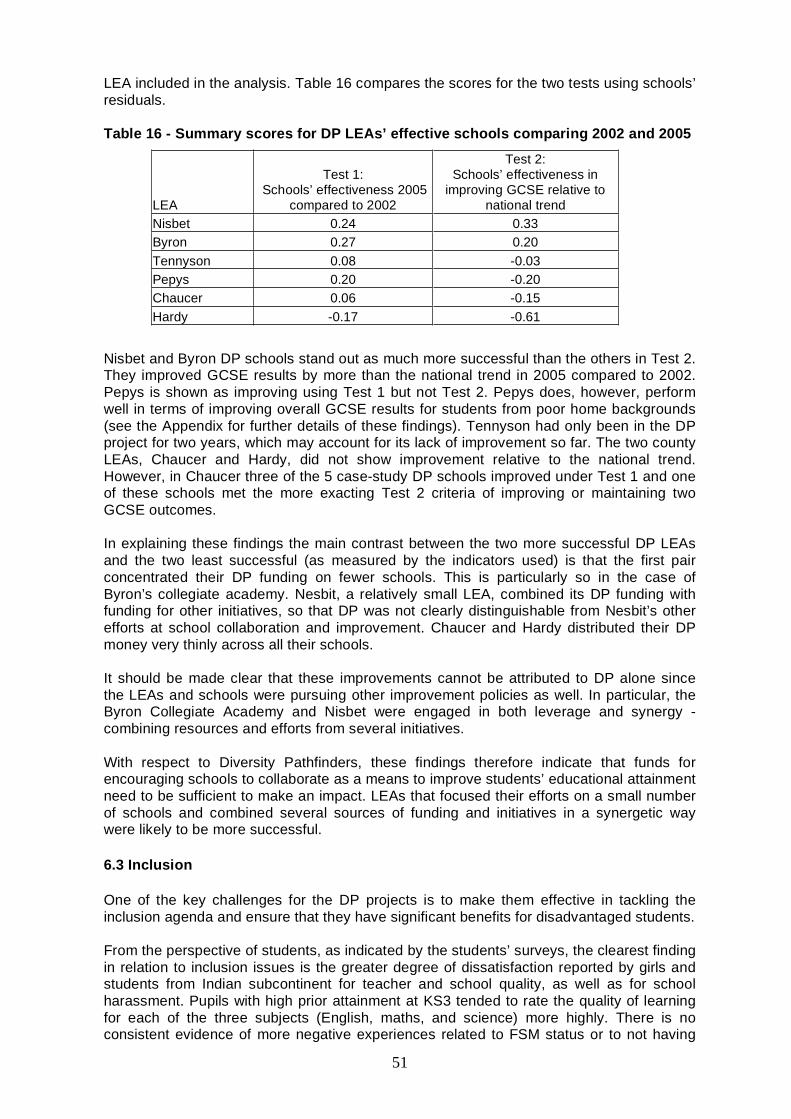
51
LEA included in the analysis. Table 16 compares the scores for the two tests using schools’residuals.
Table 16 - Summary scores for DP LEAs’ effective schools comparing 2002 and 2005
LEA
Test 1:Schools’ effectiveness 2005
compared to 2002
Test 2:Schools’ effectiveness in
improving GCSE relative tonational trend
Nisbet 0.24 0.33Byron 0.27 0.20Tennyson 0.08 -0.03Pepys 0.20 -0.20Chaucer 0.06 -0.15Hardy -0.17 -0.61
Nisbet and Byron DP schools stand out as much more successful than the others in Test 2.They improved GCSE results by more than the national trend in 2005 compared to 2002.Pepys is shown as improving using Test 1 but not Test 2. Pepys does, however, performwell in terms of improving overall GCSE results for students from poor home backgrounds(see the Appendix for further details of these findings). Tennyson had only been in the DPproject for two years, which may account for its lack of improvement so far. The two countyLEAs, Chaucer and Hardy, did not show improvement relative to the national trend.However, in Chaucer three of the 5 case-study DP schools improved under Test 1 and oneof these schools met the more exacting Test 2 criteria of improving or maintaining twoGCSE outcomes.
In explaining these findings the main contrast between the two more successful DP LEAsand the two least successful (as measured by the indicators used) is that the first pairconcentrated their DP funding on fewer schools. This is particularly so in the case ofByron’s collegiate academy. Nesbit, a relatively small LEA, combined its DP funding withfunding for other initiatives, so that DP was not clearly distinguishable from Nesbit’s otherefforts at school collaboration and improvement. Chaucer and Hardy distributed their DPmoney very thinly across all their schools.
It should be made clear that these improvements cannot be attributed to DP alone sincethe LEAs and schools were pursuing other improvement policies as well. In particular, theByron Collegiate Academy and Nisbet were engaged in both leverage and synergy -combining resources and efforts from several initiatives.
With respect to Diversity Pathfinders, these findings therefore indicate that funds forencouraging schools to collaborate as a means to improve students’ educational attainmentneed to be sufficient to make an impact. LEAs that focused their efforts on a small numberof schools and combined several sources of funding and initiatives in a synergetic waywere likely to be more successful.
6.3 Inclusion
One of the key challenges for the DP projects is to make them effective in tackling theinclusion agenda and ensure that they have significant benefits for disadvantaged students.
From the perspective of students, as indicated by the students’ surveys, the clearest findingin relation to inclusion issues is the greater degree of dissatisfaction reported by girls andstudents from Indian subcontinent for teacher and school quality, as well as for schoolharassment. Pupils with high prior attainment at KS3 tended to rate the quality of learningfor each of the three subjects (English, maths, and science) more highly. There is noconsistent evidence of more negative experiences related to FSM status or to not having
52
English as the mother tongue. With respect to the school fixed factors, students from EiCs10
and EAZs11 were significantly more likely to rate the overall quality of teacher and schoolhigher than those from non-EiCs and non-EAZs on average. However, there is also asignificantly greater degree of dissatisfaction as indicated by higher ratings for negativeattitudes to school and school harassment among students from EiCs and EAZs,respectively.
Interpreting these results presents difficulties. Trends in self-reported assessments ofsatisfaction can be the consequence of not only changes in external circumstances but alsoin individuals’ criteria and judgements. Certainly there are instances of students feelingpositive about the initiatives arising from the DP projects, as evidenced by the interviewswith students. However, the evidence from the students’ surveys sounds a cautionary noteabout how far DP is generating changes that make a significant, positive difference toparticular groups of students.
There were some positive indicators in some areas concerning educational attainment ofdisadvantaged students, as measured by FSM. Nesbit and Pepys, and Byron LEA taken asa whole, were found to have improved the GCSE results of these students between 2002and 2005, as noted in the previous section.
Inclusion does not appear to be a major, articulated theme in most of the DP projects,though this is not to say that concern to benefit disadvantaged students is absent. In someways it is implicit to the local DP aims, but it could be asked whether it would have benefitsto make enhancing the educational experience of particular groups of students andreducing the socio-economic achievement gap explicit and high profile aims.
10 Excellence in Cities11 Education Action Zones
53
7. CONCLUSIONS
The evaluation of DP has been complicated by the fact that there are a number of differentGovernment initiatives that have been promoting collaboration between schools, so wecannot be sure which effects are due to DP and which to other policy changes. However,as mentioned earlier, DP has enabled LEAs and collaboratives to develop their ownindividualistic responses to collaboration, rather than providing a single blueprint. Thus,having observed over the years of the study the range of partnerships that have developedin the participating LEAs, we are able to make some inferences from the different models ofpartnership that have evolved.
The six DP projects provide a range of approaches to collaboration - from one very tightly-knit grouping with a board for policy-making and a strong commitment to collaborationacross all the schools - to much looser ad hoc arrangements in some other areas, in whichschools come together for specific projects, but are not sustaining long term commitment tocollaborate.
7.1 Innovation
Overall, across the six LEAs, there has been a range of innovative activity stimulated byDP. These innovations have been included in the reporting of findings above, but some ofthe most interesting are highlighted here.
DP projects seeking to put the aims of DP into practice are attempting to bring aboutstrategic innovation, i.e. change which has both breadth and depth and embracessignificant transformation of processes, provision and organisation (Glatter et al 2005).They also undertake specific innovations that are smaller in scope. However, a focus onlyon specific innovations would not be consistent with the more radical ambitions of DP. Tobe precise, specific innovations have the potential to be valuable in their own right, but interms of the DP projects it needs to be asked whether they coalesced sufficiently to“unsettle traditional norms” and reach a ‘tipping point’, leading to sustainable qualitativechange (Glatter et al 2005: 390) - in particular towards a culture of collaboration. Examplesof specific innovations are summarised in Table 17 in relation to the broad areas of activityto which they are most relevant: organisation, professional processes or provision.

54
Table 17 - Summary of Specific InnovationsArea ofinnovationOrganisation • Communication strategies: in Hardy, there has been the
development of newsletters and website relating to DP;• Distributed leadership across institutions: although this might be
seen as a feature of all DP areas, Tennyson is making an explicitattempt to build a framework of collaboration, which creates adistributed leadership structure;
• Inclusion of special schools as a full and active partner, as inByron and Cluster A in Hardy and also in Pepys.
Professionalprocesses
• Shared funding and deployment of ASTs• Centralised database of good practice: in Nisbet a centralised
database of good practice supported by a project officer has beenset up.
• Subject networks: regular meetings of subject networks havebeen a feature of the Byron Collegiate and Nisbet, where it issupported by the school improvement service. Day closures inPepys have given subject teachers opportunities to work together.
• Funding of a training school: funding has been given to a trainingschool in Pepys. This has provided support for NQTs, arrangedthe working programmes of ASTs and is thought to havecontributed to the much-improved retention of teachers.
• Analysis of and response to variable strengths and weaknesses:collaborative audit of school departments’ strengths andweaknesses and identification of lead departments to bring aboutimprovement (Byron Collegiate).
Provision • Curriculum development - in particular, courses tailored to thespecific needs of groups of students.
• New specialisations not within the specialist schools framework,e.g. Health Tech vocational centre at School B4 in ByronCollegiate.
• Strategies to enhance the involvement of young people inplanning and decision-making about their educational experience.
• Movement of pupils to different schools in order to benefit fromcourses not available in their own school.
Strategic innovation was also evident - i.e. innovations that are i.e. “at least in intentionextensive in terms of size, scope and scale“ (Glatter et al 2005: 389), and are “aiming at asignificant qualitative change in relationships” (op. cit.: 392). These are some of the mostinteresting examples:
1) The creation of new organisational frameworks and cultures of collaborativeworking, which are aimed at forging and sustaining an identity and network ofprofessional interactions that cross school boundaries (Instances of this kind ofchange are the Byron Collegiate and Cluster A in Hardy.);
2) The Collegiate-wide vocational strategy of Byron Collegiate which has the potentialto impact not only on provision but also the nature and degree of diversification, theorganisational inter-dependence of schools and the ways in which staff work;
55
3) The concept of the ‘Learning Community’ in Pepys (This was aimed at changing theculture of schools in the LEA to bring about a commitment from schools to enhancethe learning of all pupils in the LEA, not just those in their own school, and includesprimary and special as well as secondary schools.);
4) In Chaucer, the commitment to involve schools and business in a joint efforttowards economic regeneration of the area (Recent newspaper reports indicate thatthere has been some success in attracting new businesses - specifically arts andmedia - to the area.).
7.2 Factors sustaining and hindering partnership
From the case studies we have derived a number of factors that are present in more thanone DP project, which tend to contribute to either sustaining or hindering partnership work.These factors do not necessarily comprise entirely independent variables, but interact. Forexample, a high degree of local competition between schools may lead to greaterwillingness to collaborate over longer geographical distances: thus, in this instance,competition mitigates the effect of distance as an inhibiting variable. The point is that whatoccurs locally is influenced by a mix of interacting factors that generate complex, dynamicconditions in which collaboration and diversification are sought.
Key contextual and organisational factors are formulated as a set of continua (Figures 3and 4). Where the variable in the local area is closer to the left pole of the continuum,collaboration and partnerships tend to be hindered. Where it is towards the right, it tends toact as a positive influence on setting up and maintaining collaborative relationshipsbetween schools. The key contextual factors (discussed in Section 4.7) are shown in Figure3, and key organisational factors (Section 5.1) in Figure 4.

56
Figure 3 - Key contextual factors
conducive to collaboration
high low
Competition
(prior competitive relations)
steep flat
Hierarchy
(hierarchy of esteem amongst local schools)
rural urban
Geography
(geographical spread amongst local schools)
low high
External challenge
(perceived strength/consequences of threats facing local schools)
weak strong
Advocacy / facilitation
(local change agents working to advocate and facilitate collaboration)
latent active
LEA support
(role of the LEA as broker and facilitator)
low high
‘take-off’ capacity
(availability of dedicated staff time devoted to preliminary and initial stages ofcollaboration)
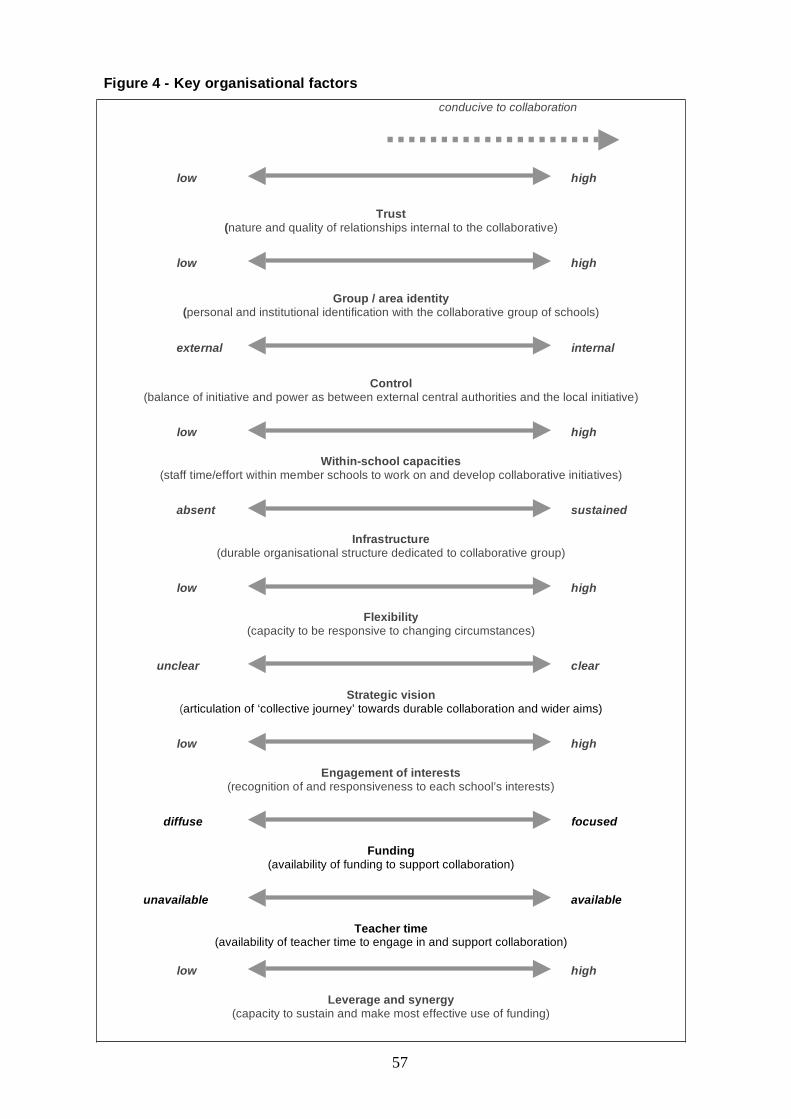
57
Figure 4 - Key organisational factorsconducive to collaboration
low high
Trust(nature and quality of relationships internal to the collaborative)
low high
Group / area identity(personal and institutional identification with the collaborative group of schools)
external internal
Control(balance of initiative and power as between external central authorities and the local initiative)
low high
Within-school capacities(staff time/effort within member schools to work on and develop collaborative initiatives)
absent sustained
Infrastructure(durable organisational structure dedicated to collaborative group)
low high
Flexibility(capacity to be responsive to changing circumstances)
unclear clear
Strategic vision(articulation of ‘collective journey’ towards durable collaboration and wider aims)
low high
Engagement of interests(recognition of and responsiveness to each school’s interests)
diffuse focused
Funding(availability of funding to support collaboration)
unavailable available
Teacher time(availability of teacher time to engage in and support collaboration)
low high
Leverage and synergy(capacity to sustain and make most effective use of funding)
58
In a context of continuous change and challenge, collaborative groups need to undergoinstitutional development so that they are able to act, make decisions and review andrevise plans as a coherent group. In other words, a collaborative needs to forge its own,dedicated institutional support which “increases [its] coherence and capacity for sorting outand integrating the myriad of choices, acting on them, assessing progress, and (re)directingenergies” (Fullan 1991: 349) and enables it to manage multiple innovations (Glatter et al2005).
7.3 Costs
In all the LEAs, DP funding has been productively combined with resources from othergovernment initiatives as detailed in the LEA case studies. The intertwining of DP withother projects involving collaboration makes it very difficult to identify the resulting benefitsas due to DP alone. However, the greater the leverage and synergy generated by the DPproject, the more likely it is that a virtuous circle is created that brings in and makesmaximum use of resources to release capacity for collaborative purposes. Our dataindicate that more effective collaboration was achieved in those LEAs where funding wasfocused on a small number of schools, (or where the LEA had small numbers of schools)rather than spreading small amounts of funding across a large number of schools. In termsof educational outcomes, those LEAs that focused the funding also achieved greaterimprovements in GCSE scores than those that spread the funding more widely.
7.4 The Diversification / Collaboration Nexus
The crux of the DP project and, hence, the essential concern of this research, is therelationship between diversification and collaboration. At the heart of the DP idea is that it ispossible for schools to put into practical operation some kind of “collaborative individualism”(Jervis-Tracey, 2005, p. 306), and that the features and nature of such collaboration willneed to differ according to local circumstances.
DP in each of the areas has certainly been distinctive. The areas are very different in termsof the nature and mix of local contextual factors. As a result, comparisons between themhave to be made with caution and need to bear in mind the complexity and influence ofthese local contextual factors.
On diversification, half of the DP areas increased the number of specialist schools at agreater rate than the national average. Of equal interest is that in all LEAs there was activedevelopment of other forms of diversification, which were seen as able to contribute to thecollaborative group.
To what degree did collaboration become embedded in the DP project areas? Most areasshowed evidence of activity in collaborative professional processes and joint developmentsin provision, summarised in Sections 5.4 and 5.5 and detailed in the case studies inAppendix A. There were evident differences in degree between DP projects. Some of thesewere due in part to differences in contextual factors. It needs also to be recognised thatthere are differences in power and influence between schools that need to be understoodand managed. This is especially so where hierarchies between schools are steep, but it is acontinuing challenge for any collaborative grouping of schools.
Another factor that all DP projects faced was the challenge of penetration, in the sense ofcollaboration and its potential for positive change having an impact below the senior levelsof schools. Although there were examples of collaborative activities for pupils, these werelimited, and such activities had not become part of school culture. Furthermore,collaborative activities were not seen by students as a positive element in their learning.
59
All DP projects achieved less than they had planned in relation to electronic environments.There has been less ICT-based interaction and pupil movement than anticipated in theoriginal vision of DP. The movement and interaction of staff and ideas have been moreapparent. One of the most positive aspects of the initiative has been the evidence of DPprojects learning from experience and utilising their flexibility and relative autonomy tomake adjustments: the capacity to develop and adapt the aims and direction of thecollaborative group is essential.
All DP projects faced the difficulty of achieving collaboration and some degree of collectiveidentity and commitment in an environment that did not provide the most favourableincentives. Attention by schools to their individual interests was reinforced by the nationalaccountability system that focuses on the performance and inspections of individualschools. Local accountability - to parents, the local community and other stakeholders -tended to be limited and undeveloped. Although links with school governors were set up,these were often weak. The DP project in Pepys was notable for integrating into its visionthe need to involve the wider community and student voice. However, the extent to whichthis has been achieved is difficult to quantify.
Giving each area a precise, overall score for its degree of collaboration would be animpossible and misleading task. However, the areas can be allocated positions relative toeach other on a continuum from nil collaboration to strong collaboration. This was done bythe research team making a collective judgement on the basis of fieldwork visits, analysisof qualitative data and discussion and testing within the team of emerging valuations ofeach DP project. The results of this process are shown in Figure 5. The following set ofcriteria were used to assess each DP project12:
• Degree of strategic vision: the extent to which the collaborative group had ordeveloped a coherent articulation of its being on a collective journey which aspiresto move beyond temporary collaborative arrangements;
• Degree of group / area identity: the extent to which the collaborative group had ordeveloped personal and institutional identification with a group of schools and thearea that they collectively serve;
• Creation of an infrastructure: the extent to which the collaborative group forged anenduring organisational structure of collaboration;
• Significant professional collaborative activity: the extent to which thecollaborative group generated shared professional development and mutualinstitutional support;
• Penetration below senior management levels: the extent to which collaborativeactivities involved and engaged teachers and other staff;
• Strategic innovation: the extent to which the collaborative group generatedchange which sought significant transformation of processes, provision andorganisation;
• Normalisation of collaboration as part of culture: the extent to which schoolsand staff working together in the collaborative group became ‘the way we do things’.
12 Each DP project was given a notional score out of ten for each criterion. These scores weretotalled to give an overall notional score for each project. The notional project scores were comparedagainst each other and discussed amongst the team. The DP projects were then allocated positionson the continuum shown in Figure 2.

60
Figure 5 - Assessment of relative degrees of collaboration in DP areas
strong collaboration
Byron Collegiate
NisbetPepys
TennysonHardy A
Chaucer
Hardy B
nil collaboration
Our findings suggest that where collaboration is active and embedded, diversity in itself canbe managed and utilised as a positive factor in shared professional development andschools working together. For example, Byron Collegiate developed types of diversity, suchas the creation of vocational centres like the Health Tec Centre based at one of its memberschools, which reflect the strategy and perceived needs of the students in its area. Anotherexample is the strategic decision in Pepys to concentrate energies and funding on one ofits schools becoming a training school, which would help in meeting the local need forqualified teachers.
The problematic educational consequences of combining diversity and weak collaborationhave been highlighted by the recent Annual Report of the Nuffield Review of 14-19Education and Training, which argues for a much more 'strongly collaborative' approachbased on the concept of a local learning area, in which there is a better balance betweeninstitutional freedom and collective responsibility (Hayward et al., 2005). Our findings areconsistent with this argument and suggest that the aim of diversification is best subsumedwithin and subject to a collaborative vision of local needs and strategies, rather than itsbeing an assumed starting point for a collaborative group.
The impact of collaborative DP activity was disappointing in terms of the effect, asperceived by students (on the measures used), on their educational experience. Inparticular, our survey data found that, whilst involvement of students in collaborativeprovision between schools had increased since 2002, the proportion of students rating thisas unhelpful (the majority) had risen significantly over the same period.
However, in areas that took and implemented a strategic approach to collaboration, therewas evidence which suggested there may well have been beneficial effects on students’attainment, including attainment of disadvantaged students. The DP projects thatconcentrated more on increasing specialist status amongst their schools, such as Chaucerand Hardy, did less well in promoting collaboration and in improving educational attainmentas measured by GCSE results. It is likely that other factors (e.g. the geographical spread ofthese large county LEAs) also had an influence on the development of collaboration inthose areas. Nevertheless, it is clear that DP projects that focused first and foremost oncollaboration, with less priority on increasing the proportion of specialist status schools,were the ones that generated more active collaborative cultures, greater sharedprofessional development and stronger evidence of increasing educational attainment,including that of disadvantaged students.
61
8. LESSONS FOR FUTURE POLICY AND PRACTICEHere we attempt to distil in a short space what seem to us to be the chief implications of theevaluation for policy and practice. Although the lessons are presented in ten distinctparagraphs with a single-word heading for each, it is important to appreciate that there isconsiderable overlap between the ideas so the paragraphs should not be regarded assharply separate. Each paragraph is followed by a single-sentence implication or ‘message’for policy-makers and practitioners to consider.
SustainabilityCollaboration should be viewed as a dynamic process not an event, with sustainability akey criterion of success. This requires a strategic vision for the collaborative venture, adurable organisational structure and sufficient capacity in terms of staff time and skills tosupport the project both at the outset and at subsequent stages. Flexibility and reflexivity -the capacity to adapt the aims and strategy in the light of new developments and changingcircumstances - are also very important for achieving partnerships that last. Other issues,relevant to sustainability, feature under the headings below. Continuing collaboration wasmost evident in the Byron Collegiate, Nisbet and Pepys.
Key implication. Collaborative ventures require strong organisational structures andadequate capacity, including adaptive skills.
LeadershipSuccessful collaborations require determined leadership to supply the drive, advocacy,energy and consistent facilitation to enable the impetus to be maintained. This includesboth strategic leadership, notably from the local authority and key professional figures inthe locality, and operational leadership from a partnership co-ordinator with specific timeand resource to undertake the task. This finding parallels that of research on partnershipsoutside education: “It is paradoxical that the single-mindedness of leaders appears to becentral to collaborative success” (Huxham and Vangen, 2000, p. 1171).
Key implication. Both strategic and operational leadership are needed forsuccessful and sustainable partnerships.
ValuesAlthough collaborative ventures should seek to bring demonstrable benefits to each of thepartner institutions, they also raise questions about the perceived scope of school leaders’responsibilities. A recent publication from the Association of School and College Leaders(ASCL) suggests that: “School leaders want a clear message that freedom for individualschools should function within a framework of shared responsibility for all schools” (Hill,2006, p. 84). If this is an accurate assessment of most school leaders’ preferences, theprospects for collaboration seem strong because the more successful cases in ourevaluation exhibited a values base of this kind.
Key implication. Collaborative schemes must seek to foster and maintain valuesconcerning group identity and shared responsibility for all students.
62
IncentivesWhatever the values orientation of professionals, human behaviour is influenced byincentives and so the propensity to collaborate is likely to be enhanced by incentivesdesigned to encourage them to do so. Currently attention by school staff to the individualinterests of their schools is reinforced by the national accountability system, which focuseson the performance and inspection of individual schools. While this situation persists it willcontinue to act as a constraint on the development of collaborative arrangements, and thuson system development unless significant countervailing incentives are introduced bygovernment.
Key implication. For a climate of collaboration to become widespread, appropriateincentives that counter-balance those focusing on individual schools need to beintroduced.
FundingThere is evidence from both our quantitative and qualitative work that cost-effective,successful, sustainable collaboration requires a focusing or targeting of funds on a limitednumber of schools rather than dispersing a given amount of resource over a large numberof schools. If funds are concentrated in this way, greater possibilities are created for whatwe have called ‘leverage and synergy’ - the capacity to sustain, enhance and make bestuse of funding. Such concentration can also include partner schools contributing fundsfrom the own resources, which provides an indication of their seriousness about andcommitment to the collaborative venture.
Key implication. Concentration of funding brings better outcomes than the widedispersal of equivalent resources.
RelationshipsCollaboration is fundamentally concerned with human relationships, in particular it dependson the degree of trust that exists between the partners at the start of the venture, how trustis developed and maintained and on whether it survives the inevitable turnover ofpersonnel and the challenges that arise. Trust is affected by many factors, includingpersonalities and the contextual factors we have highlighted such as the steepness of anyhierarchy of esteem among participating schools and the extent of competitive relationsbetween them. An important factor is what we have called ‘engagement of interests’ -recognising and responding to the needs of others. This finding mirrors a conclusion froma recent survey of school collaborative schemes for the Education ManagementInformation Exchange (EMIE) that the most successful cases “are those which began andhave been sustained in a spirit of common resolve and sensitivity to the needs of others”(Arnold, 2006, p. 38).
Key implication. Trust and the quality of human relationships in general are keyfactors in the development of successful school partnerships.
DiversityThe central focus of the DP pilots was intended to be collaboration within a context ofdiversification, especially but not exclusively in relation to the development of specialistschools. We did find examples of diversity being managed creatively to enhance provisionand support professional development. In the event however the DP projects whichconcentrated more on increasing specialist status amongst their schools, such as Chaucerand Hardy, did less well in promoting collaboration and improving educational attainmentas measured by GCSE results, although other factors such as geographical spread arelikely to be involved here. The projects that focused first and foremost on developing acollaborative vision of local needs and strategies had the greater success in terms of bothprocess and measured outcomes.
63
Key implication. The aim of diversification is better subsumed within and subject toa collaborative vision of local needs and strategies than viewed as a centralobjective for a collaborative group.
TechnologyOur evidence, which reflects that from other recent studies, (see for example Bell et al.,2006) suggests that collaborative activities based on electronic environments areparticularly challenging to develop successfully at our current stage of understanding of thetechnology and its educational potential. There is evidence of attempts to learn fromexperience and tackle the challenges, but currently it appears that personal and localcommunication provide a stronger base for successful collaboration than virtualcommunication. This may however be due to the way the electronic environments havebeen conceived and developed, sometimes emphasising broader public relationsobjectives more than serving the needs of the partnership and its students.
Key implication. Further pilot and evaluative activity is needed to understand howelectronic environments can be productively incorporated into school partnerships.
StudentsThe findings from our student survey are disappointing in relation to Diversity Pathfinders’aims of increasing curriculum choice, improving teaching and learning as perceived bystudents and encouraging increased participation in post-16 education. In addition,although there was an increase in the proportion of students who have experiencedlessons or activities with students from other schools, the proportion of students rating thatas unhelpful to their learning also increased. The opinions of students who becomeinvolved in school collaborative schemes are rarely canvassed so these findings need to betaken seriously.
Key implication. Attention needs to be given to finding effective ways of improvingthe student experience through school collaborative schemes as well asestablishing how these schemes are actually being experienced by students.
InclusionOur findings on inclusion are somewhat equivocal. On the one hand three of the LEAssucceeded in widening inclusion by improving the GCSE results of socially disadvantagedstudents more than the national trend, and these were also the three that emerged from DPwith the strongest forms of collaboration. On the other hand there is no clear evidence fromthe student survey of improved satisfaction among disadvantaged groups of students.However there were concrete examples in our case studies in which partnerships decidedto redistribute resources towards schools in difficulty, and others in which the collaborationenabled better opportunities to be created for all students including the less advantaged. Itwas noticeable though that inclusion was not as strongly articulated a theme in most of theprojects as appeared to be the government’s original intention. From our evidence wenevertheless consider that the potential for collaborative schemes to enhance inclusion hasbeen demonstrated in certain contexts.
Key implication. Inclusion can be enhanced through a committed and focusedapproach to school collaboration.
64
BIBLIOGRAPHY
Arnold, R. (2006) Schools in Collaboration: federations, collegiates and partnerships, EMIEreport no. 86, Slough, National Foundation for Educational Research.
Bell, M., Jopling, M., Cordingley, P., Firth, A., King, E. and Mitchell, H. (2006) SystematicResearch Review: the impact of networks on pupils, practitioners, organisations and thecommunities they serve. Nottingham: National College for School Leadership.
Bottery, M. (2003) The Management and Mismanagement of Trust, EducationalManagement and Administration, 31 (3): 245-261.DfES (2001) White Paper Schools - Achieving Success, DfES.
DfES (2003a) A New Specialist System: Transforming Secondary Education, London:DfES.
DfES (2003b) London Challenge: Transforming London Secondary Schools, London: DfES.
DfES (2005a) Higher Standards, Better Schools for All: More choice for parents and pupils,London: DfES.
DfES (2005b) Education Improvement Partnerships, London: DfES.
Du Gay, P. (2000) In praise of bureaucracy, London, Sage.
Fullan, M. G. (1991) The New Meaning of Educational Change, London: Cassell.
Glatter, R., Castle, F., Cooper, D., Evans, J. and Woods, P. A. (2005) What’s New?Identifying Innovation Arising from Collaborative Schemes’, Educational Management,Administration and Leadership, 33 (4): 381-399.
Hayward, G., Hodgson, A., Johnson, J., Oancea, A., Pring, R., Spours, K., Wilde, S. andWright, S. (2005), The Nuffield Review of 14-19 Education and Training: Annual Report2004-05, Oxford, University of Oxford Department of Educational Studies.
Hill, R. (2006) Leadership that Lasts: sustainable school leadership in the 21st century.Leicester: Association of School and College Leaders.
Huxham, C. and Vangen, S. (2000a) Leadership in the shaping and implementation ofcollaboration agendas: how things happen in a (not quite) joined-up world, Academy ofManagement Journal, 43(6), 1159-1175
Huxham, C. and Vangen, S. (2000b) ‘Ambiguity, complexity and dynamics in themembership of collaboration’, Human Relations, 53(6): 771-806.
Jervis-Tracey, P. (2005) Inter-instutional networks and alliances: new directions inleadership, International Journal of Leadership in Education, 8(4), 291-308.
Riley, K. (1992) The changing framework and purposes of LEAs. Research Papers inEducation, 7 (1) 3-25.
65
Woods, P. A. & Woods, G. J. (2004) Modernizing leadership through private participation: amarriage of inconvenience with public ethos?, Journal of Education Policy, 19(6): 643-672.

66
Appendix A
Case Study Reports of DP Projects
Chaucer
Background
There are 31 secondary schools in this LEA, a large, remote, and mainly rural county. Alarge proportion of the population have below average socio-economic circumstances. Thecounty has European Union Objective 1 status as a means of supporting economicregeneration. Despite this the schools are successful, with results in secondary schoolsbeing above the national average. All of the secondary schools have been involved inDiversity Pathfinder.
The LEA has 245 primary schools, 31 secondary schools and 4 special schools. Thepercentage of pupils in special schools is low, reflecting the commitment to inclusion, butstatement numbers are substantially above the national average at 5.8% in secondaryschools. However, the number of pupils eligible for free school meals is close to thenational average. It has been suggested that this relates to the number of self-employedpeople in small businesses in Chaucer.
In the more rural areas of this LEA there is little competition between schools, in the mainbecause they are too far apart. However in the more urban areas, and where rural schoolsare closer together, competition is fierce.
The DP project in Chaucer had three main aims:
• to achieve diversity with cohesion across the LEA’s schools;• to create learning networks across the county and further abroad;• to enhance learning opportunities through an enriched educational experience.
The project also had a broader aim of being part of the economic regeneration of the area.
As outlined above, one aim of DP in Chaucer was for every secondary school to become aspecialist school and for a more co-ordinated approach to making bids for specialist status,supported by the LEA. In October 2003 there were 12 specialist colleges; that figure hadrisen to 28 in 2005/2006, with two more designated for September 2006. These figuresindicate that this aim of DP has been realised in Chaucer.
The numbers and types of specialist schools throughout the county are shown in Table 1.
Table 1 - Numbers and Types of Specialist Schools in Chaucer (2005/2006)
Specialism NumberArts 3Business and Enterprise 3Engineering 1Humanities 2Languages 2Music 1Science 3Science + Maths and Computing 1Sports 4Sports + vocational 1Technology 7
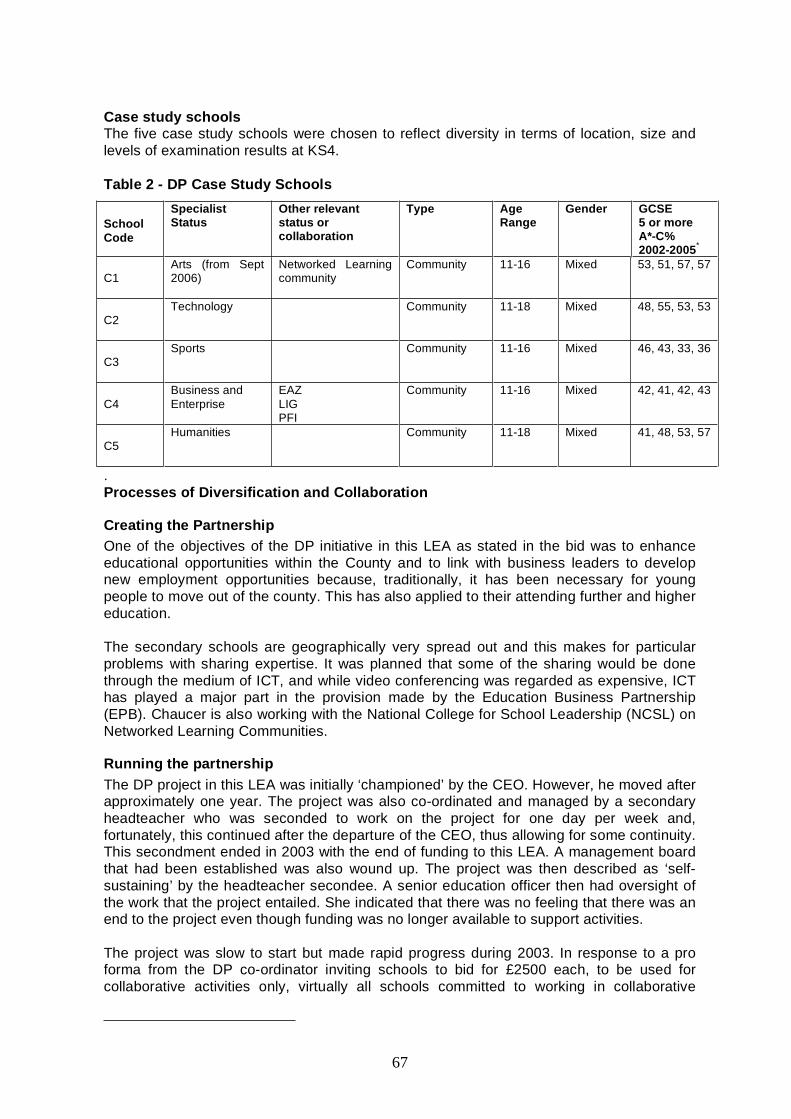
67
Case study schoolsThe five case study schools were chosen to reflect diversity in terms of location, size andlevels of examination results at KS4.
Table 2 - DP Case Study Schools
SchoolCode
SpecialistStatus
Other relevantstatus orcollaboration
Type AgeRange
Gender GCSE5 or moreA*-C%2002-2005*
C1Arts (from Sept2006)
Networked Learningcommunity
Community 11-16 Mixed 53, 51, 57, 57
C2Technology Community 11-18 Mixed 48, 55, 53, 53
C3Sports Community 11-16 Mixed 46, 43, 33, 36
C4Business andEnterprise
EAZLIGPFI
Community 11-16 Mixed 42, 41, 42, 43
C5Humanities Community 11-18 Mixed 41, 48, 53, 57
.Processes of Diversification and Collaboration
Creating the PartnershipOne of the objectives of the DP initiative in this LEA as stated in the bid was to enhanceeducational opportunities within the County and to link with business leaders to developnew employment opportunities because, traditionally, it has been necessary for youngpeople to move out of the county. This has also applied to their attending further and highereducation.
The secondary schools are geographically very spread out and this makes for particularproblems with sharing expertise. It was planned that some of the sharing would be donethrough the medium of ICT, and while video conferencing was regarded as expensive, ICThas played a major part in the provision made by the Education Business Partnership(EPB). Chaucer is also working with the National College for School Leadership (NCSL) onNetworked Learning Communities.
Running the partnershipThe DP project in this LEA was initially ‘championed’ by the CEO. However, he moved afterapproximately one year. The project was also co-ordinated and managed by a secondaryheadteacher who was seconded to work on the project for one day per week and,fortunately, this continued after the departure of the CEO, thus allowing for some continuity.This secondment ended in 2003 with the end of funding to this LEA. A management boardthat had been established was also wound up. The project was then described as ‘self-sustaining’ by the headteacher secondee. A senior education officer then had oversight ofthe work that the project entailed. She indicated that there was no feeling that there was anend to the project even though funding was no longer available to support activities.
The project was slow to start but made rapid progress during 2003. In response to a proforma from the DP co-ordinator inviting schools to bid for £2500 each, to be used forcollaborative activities only, virtually all schools committed to working in collaborative
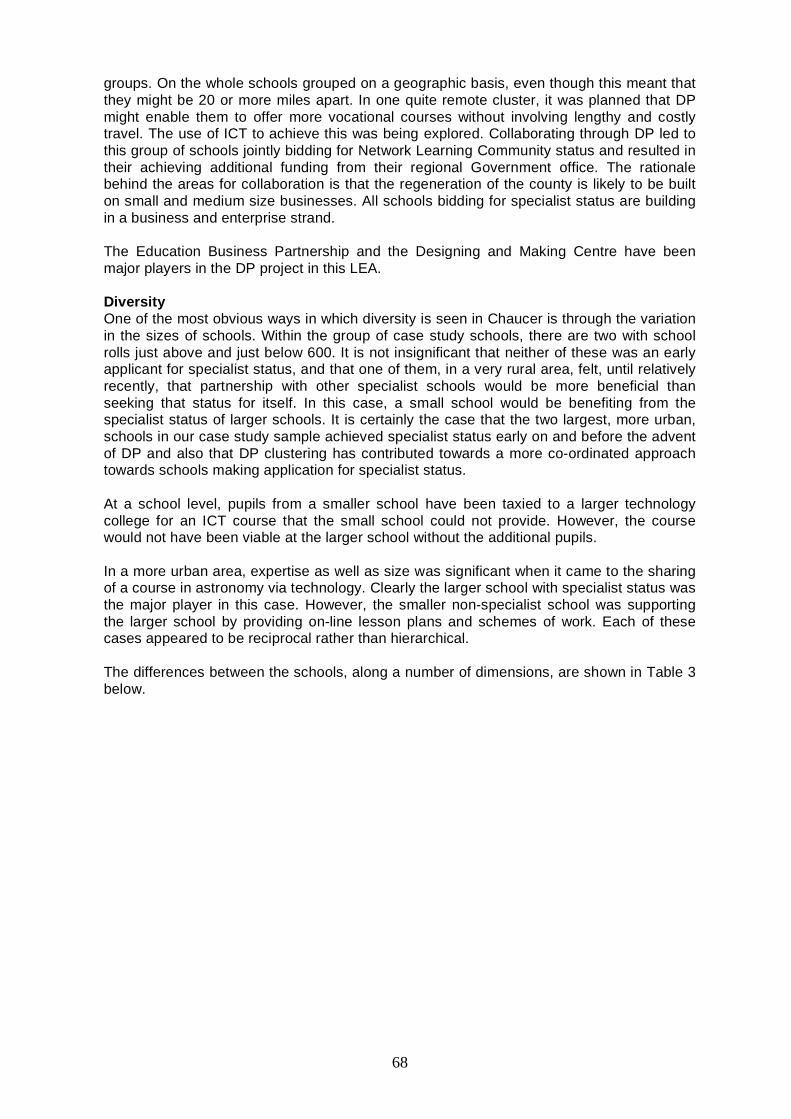
68
groups. On the whole schools grouped on a geographic basis, even though this meant thatthey might be 20 or more miles apart. In one quite remote cluster, it was planned that DPmight enable them to offer more vocational courses without involving lengthy and costlytravel. The use of ICT to achieve this was being explored. Collaborating through DP led tothis group of schools jointly bidding for Network Learning Community status and resulted intheir achieving additional funding from their regional Government office. The rationalebehind the areas for collaboration is that the regeneration of the county is likely to be builton small and medium size businesses. All schools bidding for specialist status are buildingin a business and enterprise strand.
The Education Business Partnership and the Designing and Making Centre have beenmajor players in the DP project in this LEA.
DiversityOne of the most obvious ways in which diversity is seen in Chaucer is through the variationin the sizes of schools. Within the group of case study schools, there are two with schoolrolls just above and just below 600. It is not insignificant that neither of these was an earlyapplicant for specialist status, and that one of them, in a very rural area, felt, until relativelyrecently, that partnership with other specialist schools would be more beneficial thanseeking that status for itself. In this case, a small school would be benefiting from thespecialist status of larger schools. It is certainly the case that the two largest, more urban,schools in our case study sample achieved specialist status early on and before the adventof DP and also that DP clustering has contributed towards a more co-ordinated approachtowards schools making application for specialist status.
At a school level, pupils from a smaller school have been taxied to a larger technologycollege for an ICT course that the small school could not provide. However, the coursewould not have been viable at the larger school without the additional pupils.
In a more urban area, expertise as well as size was significant when it came to the sharingof a course in astronomy via technology. Clearly the larger school with specialist status wasthe major player in this case. However, the smaller non-specialist school was supportingthe larger school by providing on-line lesson plans and schemes of work. Each of thesecases appeared to be reciprocal rather than hierarchical.
The differences between the schools, along a number of dimensions, are shown in Table 3below.
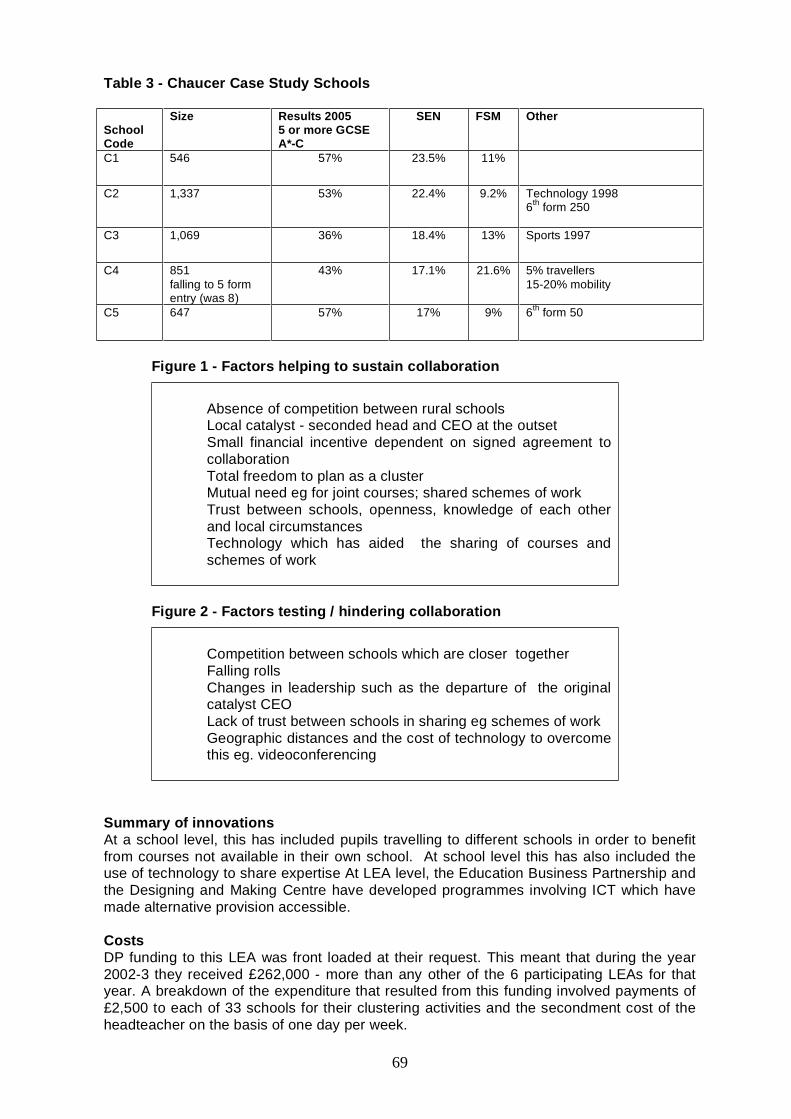
69
Table 3 - Chaucer Case Study Schools
SchoolCode
Size Results 20055 or more GCSEA*-C
SEN FSM Other
C1 546 57% 23.5% 11%
C2 1,337 53% 22.4% 9.2% Technology 19986th form 250
C3 1,069 36% 18.4% 13% Sports 1997
C4 851falling to 5 formentry (was 8)
43% 17.1% 21.6% 5% travellers15-20% mobility
C5 647 57% 17% 9% 6th form 50
Figure 1 - Factors helping to sustain collaboration
• Absence of competition between rural schools• Local catalyst - seconded head and CEO at the outset• Small financial incentive dependent on signed agreement to
collaboration• Total freedom to plan as a cluster• Mutual need eg for joint courses; shared schemes of work• Trust between schools, openness, knowledge of each other
and local circumstances• Technology which has aided the sharing of courses and
schemes of work
Figure 2 - Factors testing / hindering collaboration
• Competition between schools which are closer together• Falling rolls• Changes in leadership such as the departure of the original
catalyst CEO• Lack of trust between schools in sharing eg schemes of work• Geographic distances and the cost of technology to overcome
this eg. videoconferencing
Summary of innovationsAt a school level, this has included pupils travelling to different schools in order to benefitfrom courses not available in their own school. At school level this has also included theuse of technology to share expertise At LEA level, the Education Business Partnership andthe Designing and Making Centre have developed programmes involving ICT which havemade alternative provision accessible.
CostsDP funding to this LEA was front loaded at their request. This meant that during the year2002-3 they received £262,000 - more than any other of the 6 participating LEAs for thatyear. A breakdown of the expenditure that resulted from this funding involved payments of£2,500 to each of 33 schools for their clustering activities and the secondment cost of theheadteacher on the basis of one day per week.
70
The Education Business Partnership has made a major contribution to the development ofalternative curricula, particularly through the medium of ICT. The Design and MakingCentre has also played an important part but the actual costs of these to the DP budget arenot available.
Mutual institutional supportA certain amount of this comes from partnership through specialist school status, LIG,Network Learning Community and PFI. However, there is also the provision of courses withstudents travelling to another school to take advantage of these. These are courses thatwould not otherwise have been viable.
Professional development/ ASTsA technology college is the only school in its DP cluster that has ASTs, and they have beenpart of the collaborative partnership within the cluster by doing outreach work. The FEcollege has four ASTs: a science teacher who specialises in teaching and learningstrategies; a careers AST linked to a DfES Connexions role; the previous head of foodtechnology and the former SENCO is a SEN AST. The mechanism for outreach hasrecently been arbitrary because the LEA link advisers who had previously been in place areno longer available to make those connections. However, the local DP collaborative groupmeetings have increased focus and have been proactive and effective across a group ofschools. Another school, not one of our case studies, has provided Investors in Excellencetraining for teachers in other schools, including those in the cluster, which then enabledthem to work with 15 Y11 pupils with low self esteem.
Electronic environmentsSchemes of work in science are being shared electronically between schools in one clusterarea and astronomy is being taught through a website via one particular teacher. Work isalso being done on posting interactive worksheets.
An interactive ‘map’ was always one of the stated outcomes of DP. This presented somepractical difficulties but it is felt that its completion has progressed communication and thesharing of information between schools.
Support materials have been developed by the EBP. These include work-based materialsthat support youngsters in setting up and running an enterprise with guidance notes. Anexample of this is a piece of software called ‘Surf’. DP helped fund this programme, whichbegins with an introduction called ‘I can’ and then asks the question: ‘Could you managethis?’ It is based on, and includes images from a surf competition. There are plans to makethis both web-based and CD-rom based. The video streaming will be set up on the serverin the school. There are teacher notes with clear aims, guidance on extension tasks and acompetition that the students enter, which involves design and manufacture. There is anintroduction to the business, which involves interviews on their premises with entrepreneursfrom the surf business in the area. There is a combination of school use and home use andteachers are being trained to use it. This package is aimed at Y10-11. It can be used as a6-week programme of one session per week or as a one-day workshop. It revolves aroundemployability skills and forms part of a programme of awards that includes Foundation forWork and Enterprise, Career Planning and Wider Key Skills. There are also classroom-based and out of school activities put together as a structured 2-year course. This is aimedat disaffected youngsters. The wording of the pages is being differentiated for this purpose.A design has also been roughed out for more able and sixth form students.
71
Curriculum changeThe Design and Making Centre and the Education Business Partnership (EBP) have bothbeen involved in developing CD-rom based applied GCSE materials appropriate for Y 10-11. Functional short courses that relate to communication with employers and Asdanawards have also been developed.
A lot of this work is now reflected in the Enterprise Pathfinder, which is the second largestone nationally with ten schools participating. The EBP has been working with the localhospital trust to develop a medical module that provides information which youngsterswould not otherwise have access to. This has now been extended to include access to theNHS careers site. The EBP has recently received additional funding from DfES to enhancethis programme.
Student participationOne technology college in this LEA has developed a relationship with a school in one of theother DP LEAs as a result of contacts made through the project. The other school is in anurban borough, which provides a very different environment from the rural school inChaucer. Students from one school have visited the other and reciprocal visits have beenmade to participate in a performing arts programme and to share other areas of thecurriculum. In the same DP cluster, students have travelled from one school to another toparticipate in a course that could not be provided in their own school.
Educational EffectsOverall, schools in Chaucer did not show improvement in GCSE scores relative to thenational trend. However, 3 of the 5 case study DP schools improved their overalleffectiveness in terms of GCSE scores and one of these schools met the more exactingcriteria of improving or maintaining two GCSE outcomes.
Educational experience and opportunitiesIn some clusters students have benefited from the sharing of schemes of work and coursematerials made available through ICT in subjects that would not otherwise have beenavailable.
In some clusters students have benefited from attendance at other schools with staff ableto run courses not available in their own schools. This is particularly important as it relatesto post-16 provision, as the distances to be travelled to FE colleges in some parts of thisLEA are prohibitive.
Students have benefited from the development of alternative curriculum materials by theEducation business partnership. While in theory these are available to all, it is unclear as towhether the take-up of these has been county wide.
72
Pepys
Background and context
This city LEA is very compact, having only ten secondary schools. It is also one of the mostdensely populated district authorities in the UK, outside London. The school population isrising and two new secondary schools have been opened in the last five years.Unemployment has fallen to its lowest rate for 25 years and, at 3.1 per cent, is one of thelowest rates in England. Free school meal entitlement is broadly in line with the nationalaverage (22.4 percent primary and 19.7 per cent secondary) and there is only a smallethnic minority population. However, there are pockets of severe deprivation.
The city became a unitary authority in 1997, having previously been part of a shire county.Its ‘inheritance’ created some initial difficulties, which included a dearth of Y7 places withinthe authority and there was also a public loss of confidence in the first CEO. As a result, theLEA had to work hard to establish a partnership with its schools, but it has been successfulin doing so through effective consultation and communication. At the time of its lastOFSTED inspection in 2000, the LEA had identified 28 of its total of 73 schools as causingconcern. However, its schools are now improving faster than the national average and in itsOFSTED report of September 2004, support for 14-19 education is described as ‘highlysatisfactory’. Education is a priority for this LEA, it consistently spends above the SSA andit has also been successful in obtaining grants, such as SRB (Single Regeneration budget)which it has used to supplement its spending on schools.
There are 73 schools in the LEA, of which all 10 secondary schools are part of the DPproject. Currently there are 5 specialist schools and the number has been static for the pasttwo years. There are however, currently several schools at various stages in theapplication process for specialist status (see below).
Aims of the DP projectThe local aim of the project is to create a learning community in the city, wherein schoolssee themselves as responsible for the education of all the city’s children, not just thosewithin their own establishment. The DP project is seen as a way of bringing together anumber of initiatives currently underway – an Excellence cluster, a Transport Pathfinder,and a co-operative and co-ordinated approach to seeking specialist school status.Fundamental to the notion of developing the learning community is support for schools inbuilding their area of specialism. The aim, at the outset, was for all schools in the city tobecome specialist schools. This has become less of a focus of the project, although mostschools are continuing to apply for specialist status. The 2004 OFSTED report states that:
‘The ideas generated by the Pepys Learning Community, a partnership betweenschools, the LEA and further and higher education have led to the introduction ofa successful number of teaching and learning initiatives, including the focus onassessment for learning and on giving pupils a say in their education’.
Competition and hierarchy between schoolsA hierarchy of schools does exist in Pepys, but it is fluid. P10, which was once the sinkschool, has improved and is now out of special measures, although in 2005 its GCSEresults dipped. It no longer has a bad press locally, and its place as the ‘whipping boy’ hasbeen taken by other schools. According to the deputy head (March 2005) P10 is now‘flavour of the month’ and the progress the school has made in improving teaching andlearning have raised its status among the other schools. It is no longer ‘the poor relation’.However, GCSE results published in January 2006, which show a dip, may alter thisperception. (See Table 4 below)
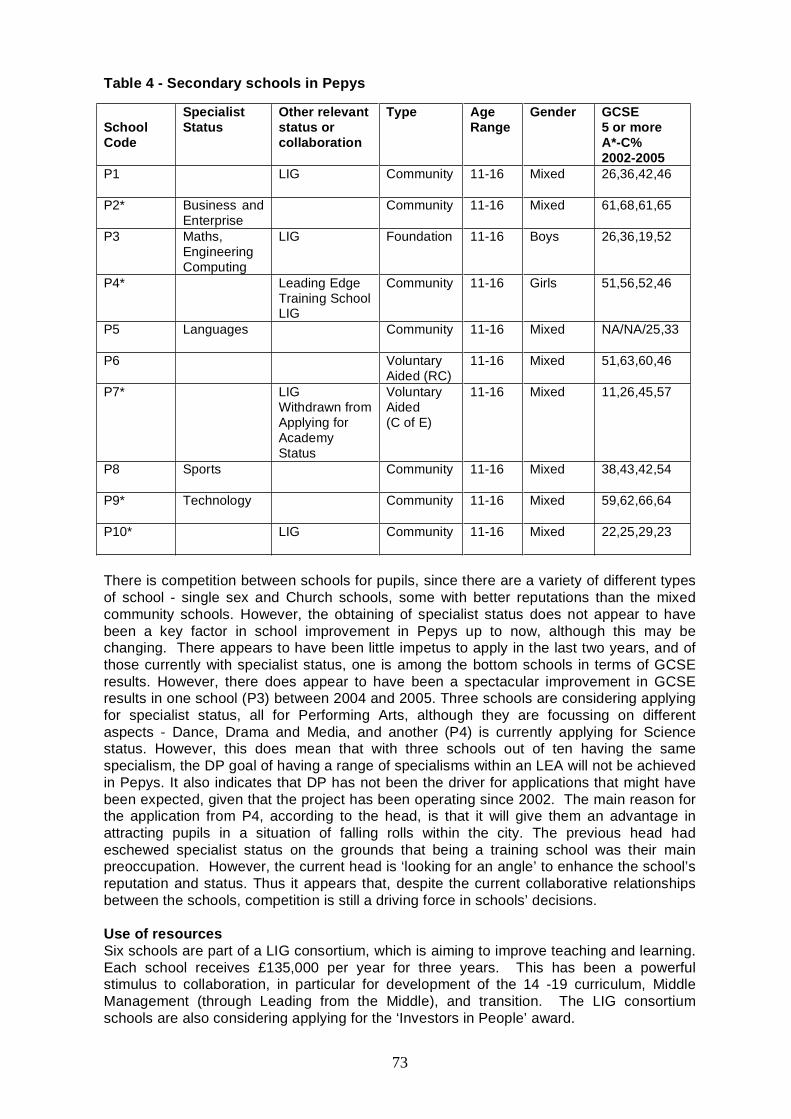
73
Table 4 - Secondary schools in Pepys
SchoolCode
SpecialistStatus
Other relevantstatus orcollaboration
Type AgeRange
Gender GCSE5 or moreA*-C%2002-2005
P1 LIG Community 11-16 Mixed 26,36,42,46
P2* Business andEnterprise
Community 11-16 Mixed 61,68,61,65
P3 Maths,EngineeringComputing
LIG Foundation 11-16 Boys 26,36,19,52
P4* Leading EdgeTraining SchoolLIG
Community 11-16 Girls 51,56,52,46
P5 Languages Community 11-16 Mixed NA/NA/25,33
P6 VoluntaryAided (RC)
11-16 Mixed 51,63,60,46
P7* LIGWithdrawn fromApplying forAcademyStatus
VoluntaryAided(C of E)
11-16 Mixed 11,26,45,57
P8 Sports Community 11-16 Mixed 38,43,42,54
P9* Technology Community 11-16 Mixed 59,62,66,64
P10* LIG Community 11-16 Mixed 22,25,29,23
There is competition between schools for pupils, since there are a variety of different typesof school - single sex and Church schools, some with better reputations than the mixedcommunity schools. However, the obtaining of specialist status does not appear to havebeen a key factor in school improvement in Pepys up to now, although this may bechanging. There appears to have been little impetus to apply in the last two years, and ofthose currently with specialist status, one is among the bottom schools in terms of GCSEresults. However, there does appear to have been a spectacular improvement in GCSEresults in one school (P3) between 2004 and 2005. Three schools are considering applyingfor specialist status, all for Performing Arts, although they are focussing on differentaspects - Dance, Drama and Media, and another (P4) is currently applying for Sciencestatus. However, this does mean that with three schools out of ten having the samespecialism, the DP goal of having a range of specialisms within an LEA will not be achievedin Pepys. It also indicates that DP has not been the driver for applications that might havebeen expected, given that the project has been operating since 2002. The main reason forthe application from P4, according to the head, is that it will give them an advantage inattracting pupils in a situation of falling rolls within the city. The previous head hadeschewed specialist status on the grounds that being a training school was their mainpreoccupation. However, the current head is ‘looking for an angle’ to enhance the school’sreputation and status. Thus it appears that, despite the current collaborative relationshipsbetween the schools, competition is still a driving force in schools’ decisions.
Use of resourcesSix schools are part of a LIG consortium, which is aiming to improve teaching and learning.Each school receives £135,000 per year for three years. This has been a powerfulstimulus to collaboration, in particular for development of the 14 -19 curriculum, MiddleManagement (through Leading from the Middle), and transition. The LIG consortiumschools are also considering applying for the ‘Investors in People’ award.
74
Pepys has invested a great deal of time and financial resource into creating the Pepys‘Learning Community’, which is what they call their Diversity Pathfinder Project. They haveformed a link with a local university and are working with two consultants in developing theirapproach. The project is developing in a divergent way, in that Pepys wants to extend theLearning Community ethos to its primary schools, whereas DP was confined to secondaryschool collaboration.
Organisation of the DP project.The Pepys Learning Community comprises three elements - Assessment for Learning(AFL), School to School Learning (the day closures to enable teachers to work oncurriculum development) and Student Voice. The Pepys Learning Community Websitesuggests that: ‘Each of these has the potential to transform learning across the city. Thesethree strands together create a powerful lever for positive change’.
The Pepys Learning Community Steering Group, formally known as PRAISE (PepysRaising Achievement and Improving Standards in Education) is a cross phase group ofheads, which has both a steering group and an operational group. These groups areresponsible for the development of the Learning Community.
The Pepys DP has no formal governance structure, although there has been positiveleadership shown by the former LEA officer and also two key headteachers in the City (oneof whom has been seconded to DFES). The strategic management of the school closuredays is done at deputy/assistant head level. The support given by the consultants from theuniversity is seen as crucial to the success and maintenance of the collaborative effort. It isa signal that it is taken seriously by the LEA and the involvement of the university addsstatus to the aims and outcomes and provides ‘a professional CPD element’ for the seniorstaff involved, through the feedback on the research and evaluation being conducted by theuniversity.
The ‘ownership’ or ‘authorship’ of the cross-city day events (which are a key manifestationof collaboration in Pepys) is in the hands of the subject leaders, so energy and commitmentvaries between subject areas. For example, modern foreign languages (MFL) has had verygood leadership and co-ordination and has used an outside facilitator from the university toplan activities. This has energised the teachers involved and led to more collaboration.This has also been the case in technology and science. But in other subject areas, theexperience has not been so positive. One suggestion for the next cross-LEA event is towork on cross-curricular themes, such as teaching and assessment, so that the energy andcommitment of key people can be spread across subject areas. However, the key strategicplanners in the PRAISE team are not currently planning another cross-LEA event involvingclosure of all the secondary schools, as it is felt that these have out-lived their usefulness intheir current form.
The AFL strand has developed as a partnership between The Centre for EducationalInnovation at the university, Pepys School Improvement Service, and a group of linkteachers from the schools. It is closely linked with the Student voice aspects of theLearning community, in that it is based on the principle that ‘teachers and learners worktogether to share ideas about how good their work is. They discuss how it could be betterand how to go about improving it, now and in the future’. This element is most stronglydeveloped in the primary phase, but is also seen as of increasing importance at secondarylevel. The head of P4 reported that, in terms of impact in her school, Student Voice wasthe most significant strand of work (9/10), AFL was the second most significant (7/10) andthe school to school learning the least significant (6/10).
75
DiversificationThis is developing slowly. As reported last year, the numbers of specialist schoolsincreased from three to five between 2002 and 2004, but since then no more schools havebeen designated. Three schools are considering applications for Performing Arts, but arestill in the early stages of raising money. One school (P7) was due to apply for Academystatus, but has decided not to go ahead with this. P4 is to apply for specialist status inscience. The role of P4 as a training school has been increased. Originally designated forinitial teacher training, it is now also concerned with workforce reform and induction forteaching assistants. A significant number of teachers are trained as mentors for the traineeteachers and their work with them is mutually beneficial and is improving leadership andteaching in the school. Similar opportunities for training are being offered to non-teachingstaff. According to Ofsted (2003) the training school ‘is a major development that is makinga positive contribution to raising standards in the school’. Ofsted also reported that theschool was making good links with other schools and universities as part of the trainingschool role. However, currently there are some problems with accreditation, since a localHEI has pulled out of its arrangement to be part of the designated recommending body(DRB), which means that currently there is no higher education partner.
CostsThe financial costs are detailed in Appendix 1. The heads of department were given time(half days) for planning the events. Students involved in cross-Pepys and national eventsaround Student Voice, were also given time to prepare presentations and to participate, butthis involved a small number of students. One aspect of the Student Voice initiative(Students as Researchers) was reported by students in P10 to have been very useful andsuccessful for them, but to have taken a great deal of time. These students hadinvestigated systems of rewards in schools and had written to a number of schools to askabout their systems, circulated and analysed questionnaires in their own school and writtena report for governors. Although they felt that they had gained a lot in terms of confidenceand skills, and had contributed to decision-making in the their school, they felt that, giventhe amount of coursework they had to do for GCSE, that it wasn’t feasible for them tocontinue to be involved. An interesting issue, which also surfaced in this school was thatthe student council had spent a lot of time and energy campaigning for a student from arefugee family who was due to be deported, and that other things that should have beenraised were not, because there was not enough time. The students involved felt quitefrustrated and thought that there should have been a separation between this issue, whichhad become important and had been taken up by local and national media, and otherissues that the school council should be dealing with.
Professional processesThere are a number of these across the City, as described above. These were set up underthe auspices of the Learning Community and are supported by the consultancy with theUniversity. For example, there are AFL link teachers’ meetings at which teachers from ‘leaddepartments’ in schools give presentations of their work. These have included examplesfrom one school in science and in English and from another in science. The emphasis inthese examples has been on involving students in assessing their learning and takingaccount of what students know and don’t know in order to provide more focused teaching.In another school, in the humanities curriculum area, students have been involved in peermarking of work, and identifying for themselves what they need to do to improve.
ASTs are located in the training school, but work across the schools in the City. ASTs donot carry out projects for schools, rather share their expertise and knowledge withcolleagues to help them identify and develop future steps. Thus, they are working in anadvisory capacity. Schools can make an application for AST support and this is not chargedfor, as the ASTs are funded by the LEA, and each school has an allocation of days.
76
ProvisionThere is no shared provision across Pepys schools, although there has been talk of this. Itwas not able to get agreement for common timetabling or travel arrangements to facilitateit, so that the only cross-school event is the one day per year LEA-wide school closure.However, there are ASTs, based in the training school, who work across the schools in thecity. They focus on key strands such as the KS3 strategy (see above). The day closuresacross the City were to enable teachers to focus on curriculum development and thesehave been useful up to a point (see below). The setting up of the training school, which wasnot directly part of the DP project, has provided a way for the city to improve recruitmentand retention. It provides CPD for school staff across the City, as well as ITE, in the form ofthe GTP.
Student Voice has been a significant feature of DP in Pepys and has involved the settingup of school councils, as well as a city-wide council. This has led through to representationon a national student council.
In addition, in some schools, the students have been involved in curriculum development(for example, in history), working with the head of department to devise ‘student-friendly’teaching strategies. They have also been involved in interviews for staff appointments andfeedback to NQTs.
InnovationThe high profile given to Student Voice and the commitment shown by some of the schoolsto make this a reality has led to some innovative practices, such as students givingfeedback to NQTs as part of their induction programme run by the training school.Students, working with teachers on curriculum design and delivery is an innovation that hasbeen publicised nationally at a DFES conference on innovation held in London.
The LEA-wide closure to enable subject teachers to work together is also innovative anddemonstrates the commitment of the LEA to support collaboration. However, the fact thatnot all heads and subject leaders were fully supportive of this initiative, and thepracticalities involved in planning and coordinating the activities at school level have madethis less successful than some of the other initiatives.
Educational effectsGenerally, achievement in terms of GCSE scores has been on an upward trend in PepysLEA, comparing 2002 with 2005. Additionally there has been a positive impact ondisadvantaged pupils (as measured by free school meals eligibility), with improvements incapped GCSE scores between 2002 and 2005, for this group of pupils. The overallimprovement in Pepys’ scores can be attributed to some significant improvements in theeffectiveness of its lower performing schools, which suggests that collaboration hasbenefited those schools. The qualitative data confirms this. Although participantsacknowledge the positive impact of student voice and assessment for learning on thequality of teaching, they are cautious about whether it has improved student satisfactionlevels or achievement. Students interviewed for the research certainly seemed positiveabout their experiences of being involved, but these were a very small sample, and themajority of students did not play an active role, for example, in the school council. The AFLaspects (involving all students in assessing their progress and learning needs) may takemore time to work through to show an effect. It involves the willingness of teachers tochange their modes of relating to students, and some involved in the training expressed aworry that it would undermine their teaching and behaviour management styles. Interviewswith some students revealed that some of those highly committed and involved still felt that,in some aspects they were not being heard. For example, when it came to choosingoptions, some were not allowed to make the choices they wanted (a vocational courseinstead of German), and also felt that Spanish would be a much more popular and usefulMFL.

77
Some schools were slow to adapt their curriculum to meet the needs of less able pupils andto link up with colleges to enable students to study an alternative curriculum, and werebeing offered a more traditional curriculum, which led to problems of non-attendance.
Deep collaborationIt is not clear that ‘deep collaboration’ is yet a characteristic of the Pepys LearningCommunity. There is commitment to the principle that schools should meet the needs of allchildren in Pepys, but this has yet to manifest itself as a long-term driver of closercollaboration. There is more connection between schools and more joint working andsupport across curriculum areas, but it is as yet unclear whether this will be sustained.
What hinders and what sustains collaborationIn Pepys a number of factors have helped set up and sustain collaboration. Theappointment of a number of new heads has helped a new culture emerge, which is lesscompetitive and more mutually supportive than previously. There are still two (out of ten)heads, who are said to be less involved in collaboration, but this has not been a real setback. Trust is seen as important and this has to come from the top leadership down, tosupport staff getting together. Having targets is seen as pushing heads to work together tofind solutions to common problems. An example given of this was issues aroundattendance, which is a problem across Pepys. Another was raising the levels of GCSEresults, where heads will discuss strategies.
External challenges, such as, in Pepys, difficulties in recruitment and retention of staff,have led to joint action to find collaborative solutions, one of these being the designation ofthe training school.
Funding helps collaboration, by providing funded time for people to meet up and workjointly. LIG has been a great advantage here, probably more significant than DP, becauseof the level of funding (£35,000 per school per year).
Competition and a sense of hierarchy among the schools is said to have diminished sincethe setting up of the learning community initiative. The positions of the schools in the Pepysleague tables is more fluid, although there is still one school that remains below the 30% A-C level. However, there is still a competitive element in school relations and the overallhierarchy in terms of high status and lower status schools is also still present, if in a lessstark form than before.
Collaboration in the form of the cross-LEA days has not led to a sustained collaborativeapproach to curriculum development. The second of these days (there have been three inall) was judged not to have been particularly successful, partly because not all heads wouldrelease staff and also because the planning was left to middle managers and many of themfelt that this was an extra burden non top of heir other duties. Although some of themeetings were seen as useful and productive, others were less so, and this has contributedto the decision not to hold another event of this kind. It was felt that smaller groups ofschools facing similar problems (i.e. low achievement or low pupil motivation) might bemore useful.

78
Appendix 1 - Financial costs of Diversity Pathfinder in Pepys
Small amounts of money have been allocated to schools to facilitate their writing of bids forspecialist status and the training school has received substantial funding. Otherwise DPfunding, as shown below, has largely contributed to the costs of the LEA officer andHeadteacher involved.
2002- 2003 £
Support for bid writing for first submission 2,000Successful schools (3) - identification of contribution to DP programme- £1000 for management time 3,000Support for admin linked to DP commitment @ £200 per school 2,000Training school 35,000Contingency 1,000Senior Adviser time 5,000Admin support / meeting costs 3,000Fundraising costs 20,000Consultancy time - 35 days head teacher @ £425 14,875
Total £85,875Amount unallocated £625
2003- 2004£
Support for bid writing for first submission 2,000Successful schools (3) - identification of contribution to DP programme -£1000 for management time 5,000Representation at national level 4,000Training school 35,000Contribution to PLC 750Senior Adviser time 6,000Central admin support for meetings in schools 250Language programme 15,000Chamber of commerce post 20,000Evaluation 1,000Total DP available £90,750
Amount unallocated £2500
Additional fundingBy LEA through EDP using consultants to ‘drive Learning Communities programme’
£150,000
79
Nisbet
Background
The LEA serves an ethnically diverse, highly mobile and growing population. There are anumber of factors that contribute to the high mobility of its people including: inwardmigration, a young population, high fertility rates, a significant percentage of housing beingin the private sector and significant inflow of refugee and asylum seeking families. Englishis an additional language for over half of the school-aged population. There is a highincidence of health problems and social disadvantage. Unemployment is very high. Thenumber of looked after children and children at risk has increased sharply.
The richly diverse population of around 239,500 has the youngest age profile in London,with 28 per cent under 16 years old. Black African, Pakistani and Bangladeshi childrenmake up more than 30 per cent of this group. The white United Kingdom population hasdecreased in size and is characterised by an older age structure. Other white groups haveincreased, particularly refugee and asylum seeker families from Eastern Europe. TheIndian and Black Caribbean populations are relatively stable in size. These trends areleading to greater diversity in Nisbet’s population. Mobility rates have increased to 11 percent in primary schools and dropped to 5 per cent in secondary schools. English is anadditional language for 61 per cent of primary and 56 per cent of secondary age children.
The compulsory school age (5-16) population is around 45,000. Forty per cent of primaryaged pupils and 43 per cent of secondary aged pupils are entitled to free school meals.These are well above the national averages. The number of pupils with statements ofspecial educational need is below the national average. The well-established policy ofinclusion means that the majority of these pupils are in mainstream schools. TheExcellence in Cities (EiC) programme is in place and covers all primary and secondaryschools.
All 15 secondary schools in this Nisbet are part of the DP project. The aim of the LEA isthat all schools will become specialist in a phased programme that ensures that the rangeof specialisms is covered.
In Nisbet there is little real competition between schools. There is a hierarchy, but this isacknowledged and is seen as a given. The variety of schools in Nisbet (single sex, mixed,Church, foundation etc.) means that each school has its own constituency and does notfeel very threatened by the others. If there is competition, it is more likely to be with similarschools in adjoining boroughs. Also, there are no surplus places, so schools are full.
There are currently 11 specialist schools, a training school and 2 Leading Edge schools.Every school knows where it stands in the hierarchy as far as results are concerned. Theone secondary school that was in special measures is now out, and this has been seen asa joint endeavour between the schools, particularly with the Leading Edge school.
Diversity Pathfinder is only one of a large range of collaborative initiatives, and is not themost significant in terms of funding, visibility or energy. Nisbet’s decision to make allschools part of LIG collaboratives has been a focus for much joint work. For example thehead of N7 school reported that: ‘What has shaped N7’s collaborations has been work withthe Northern LIG collaborative, not so much from DP’.
Also the existence of two Leading Edge schools has, on the one hand, led to a lot of jointwork between, for example, the failing school and one of the Leading Edge schools, but, atthe same time it has inhibited other schools from becoming involved with the failing school.This is because (1) the failing school’s capacity to be collaborative was limited and (2) theLeading Edge school was taking the major role in providing the kinds of support that theother schools were offering, so there would have been duplication.
80
The major part of the DP funding was spent on setting up and maintaining a database ofeffective practice, which was intended to be a means for schools to collaborate by sharinginformation about their own effective practice. In reality, this has not been particularlysuccessful, since many teachers do not know about it, and it is not used as a prime sourceof ideas or as a means of finding contacts.
OrganisationCollaboration at secondary school level is managed mainly through the heads, with supportfrom a senior education officer and his administrative staff. There are regular conferences(twice a year) where collaborative initiatives arising out of DP, LIG, Leading Edge etc arereported on. These meetings are in addition to regular meetings of the Secondary HeadsAssociation, as the agendas of these have become to full of business items to allow fulldiscussion of initiatives arising out of collaboration in all its forms.
Nisbet’s DP organisation has developed to encompass a range of collaborative initiatives.The Network of Effective Practice, (NEPN) which was the main tangible outcome hasunderpinned subsequent collaborative work and has tied a number of different thingstogether (e.g. LIG). ‘It has become a way of life, not a project’. It (DP) has ‘becomeembedded’. It has played an important role in setting up a collaborative culture but ‘has notbecome a straight jacket’ (LEA officer).
The Local Authority has used the Effective Practice Network as a forum for developingNisbet’s response to ‘Building Schools for the Future (BSF). They have worked together todevelop ‘a shared vision of what building schools for the future might look like’. From theLEA officer’s perspective, BSF is ‘a follow on from NEPN’.
According to the LEA officer, under the EAZ model, heads got money but withoutresponsibility. Diversity Pathfinder was the first time Nisbet was given funding to developcollaborative work across all secondary schools. From this developed the NEPN, regularheads meetings to discuss and develop collaboration, and the website. Although thefunding has now finished, many collaborative developments that emerged out of DP are stillongoing. ‘The great thing about DP is that it has underpinned all collaborative work’. Theheads in Nisbet have agreed to form an Education Improvement Partnership. Heads aretaking on school improvement and the local authority (not LEA) is providing support acrossa range of services.
DiversificationAs noted above, 11 of Nisbet’s 15 secondary schools are now specialist schools, and oneis also a training school. In addition, another is to become a ‘mentoring school’ (See Table5 below).
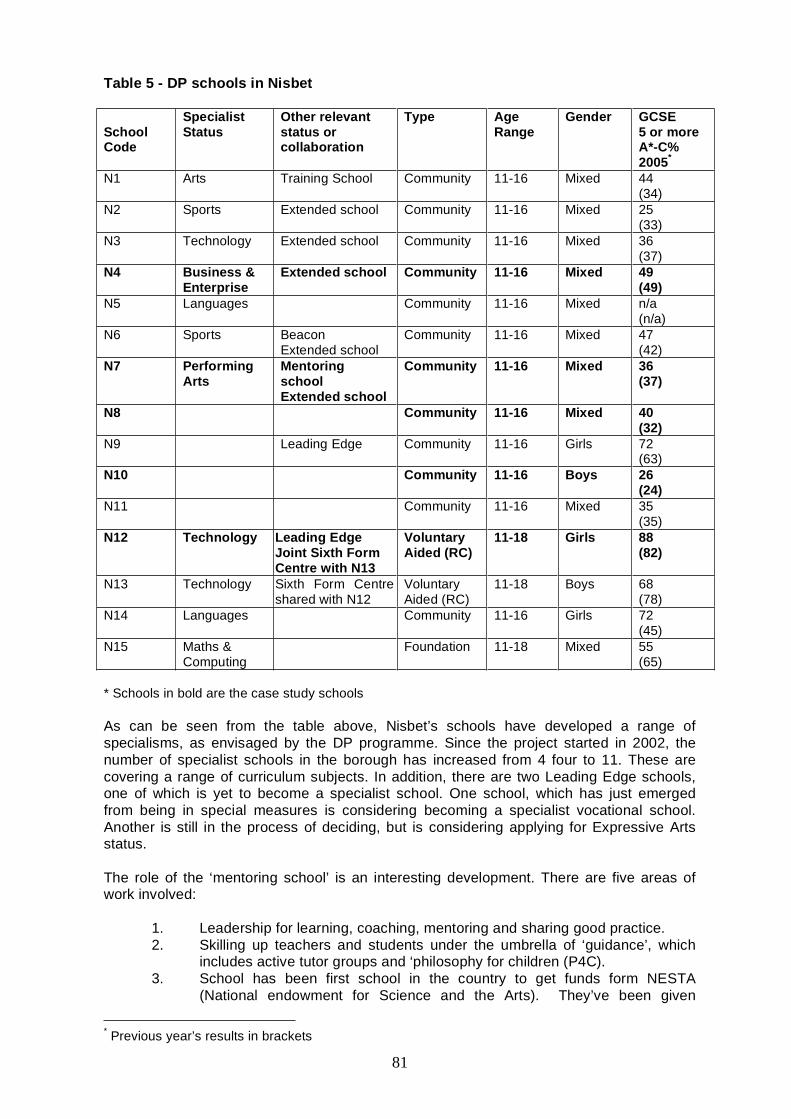
81
Table 5 - DP schools in Nisbet
SchoolCode
SpecialistStatus
Other relevantstatus orcollaboration
Type AgeRange
Gender GCSE5 or moreA*-C%2005*
N1 Arts Training School Community 11-16 Mixed 44(34)
N2 Sports Extended school Community 11-16 Mixed 25(33)
N3 Technology Extended school Community 11-16 Mixed 36(37)
N4 Business &Enterprise
Extended school Community 11-16 Mixed 49(49)
N5 Languages Community 11-16 Mixed n/a(n/a)
N6 Sports BeaconExtended school
Community 11-16 Mixed 47(42)
N7 PerformingArts
MentoringschoolExtended school
Community 11-16 Mixed 36(37)
N8 Community 11-16 Mixed 40(32)
N9 Leading Edge Community 11-16 Girls 72(63)
N10 Community 11-16 Boys 26(24)
N11 Community 11-16 Mixed 35(35)
N12 Technology Leading EdgeJoint Sixth FormCentre with N13
VoluntaryAided (RC)
11-18 Girls 88(82)
N13 Technology Sixth Form Centreshared with N12
VoluntaryAided (RC)
11-18 Boys 68(78)
N14 Languages Community 11-16 Girls 72(45)
N15 Maths &Computing
Foundation 11-18 Mixed 55(65)
* Schools in bold are the case study schools
As can be seen from the table above, Nisbet’s schools have developed a range ofspecialisms, as envisaged by the DP programme. Since the project started in 2002, thenumber of specialist schools in the borough has increased from 4 four to 11. These arecovering a range of curriculum subjects. In addition, there are two Leading Edge schools,one of which is yet to become a specialist school. One school, which has just emergedfrom being in special measures is considering becoming a specialist vocational school.Another is still in the process of deciding, but is considering applying for Expressive Artsstatus.
The role of the ‘mentoring school’ is an interesting development. There are five areas ofwork involved:
1. Leadership for learning, coaching, mentoring and sharing good practice.2. Skilling up teachers and students under the umbrella of ‘guidance’, which
includes active tutor groups and ‘philosophy for children (P4C).3. School has been first school in the country to get funds form NESTA
(National endowment for Science and the Arts). They’ve been given
* Previous year’s results in brackets
82
£175,000 for a 2-year R&D project around using digital media with Y8students. This will be shared with other Nisbet schools.
4. They have a project with a local FE College looking at the processes thatshape up best practices in 14-16 links and 16+ transition.
5. Evaluation of the processes that enhance collaboration between the twoperforming arts schools in the authority.
This package has been funded by the SSAT, to the tune of £80,000 per year.
The role of one of the Leading Edge schools is also an interesting example of theprocesses of diversification and collaboration. The school has played a major role insupporting another school to come out of special measures. This has involved ASTs goinginto the school to work alongside teachers and subject leaders. Some of the tensionsgenerated by this work were due to factors such as gender and age differences betweenthe ASTs and long-serving members of staff at the receiving school, and a resistance bysome teachers to try new approaches. At senior leadership level, some different kinds oftensions were present. These involved lack of strategic direction for the work, lack of aneffective advocate for collaboration in the receiving school at the start, (later thingsimproved and a good working relationship developed between two senior members of staffat the schools). This example indicates that collaboration is not easy or straightforward, butneeds flexibility and commitment if it is to be successful (as this ultimately was).
Both of these examples (Mentoring and Leading Edge) are concerned with schoolimprovement and sharing good practice across the range of curriculum subjects, ratherthan a focus on the particular subject specialism of the school.
CostsAll those involved concede that there are considerable costs to collaboration, both in termsof time and money. Many of the collaborations are funded through specific fundingallocations, such as: Gifted and Talented; the ASTs, the LIG collaboratives. However,according to the head of one of the Leading Edge schools, the funding does not cover thecosts of the time involved, and also these were ‘kick start’ funding and likely not tocontinue, although she hoped that they would want to continue with the collaborations.“The cost of collaboration is far greater than the money you get. The problem for ourcollaboration is one of capacity it is not about finance, but that capacity comes from beingable to have maybe have a better staffing ratio than you normally would”. The balance tocosts, this head saw significant benefits for the school from collaborative partnerships:“Collaboration has been a stimulus for the school to improve. We have a much fullerunderstanding of why our practice works. You have people that have the confidence tomodel good practice for others. For example, Maths has gone from being the worst to thebest department in the school”.
According to the head of one of the schools, collaboration is hard because of timeconstraints on communication. ‘Unless you’ve got someone with dedicated time, thesethings are immensely straining for schools’. If there were different structures (e.g.timetabled time to work on projects across the schools), that would give more flexibility.
Professional processesThe DP in Nisbet project had two main strands: one was to set up a ‘Network of BeaconPractice’, focused on teachers by creating a learning community of headteachers andteachers; the other was to promote ‘Cultural Harmony’, focused on students byencouraging the participation and empowerment of all students.
The first strand has involved two initiatives:
(a) Subject network meetings - these are regular (twice-termly) meetings of heads ofdepartment, or subject coordinators, for the exchange of ideas, information, and good
83
practice. These are usually convened by the subject adviser and held at the LEA’s CPDcentre. Some subject meetings (e.g. Maths) are held in schools, on a rotating basis, andthis is said to be very useful. The most successful and well-attended meetings seem tobe for subjects where the teachers themselves control the agenda and make teachingand learning the heart of the meetings. The less successful ones are where the subjectadviser dominates the agenda and uses the time to pass on directives from centralgovernment. Overall, the meetings are perceived at the school level to have becomemuch more useful and interesting over the last year or so (since they have been a partof DP). This appears to be the achievement of the aim articulated by the DPmanagement team at an early stage of the project:
In addition, subject networks will be a key feature of collaboration andpartnership work. The key issue is to make them effective forums for thesharing of ideas and good practice. The School Improvement Service willbe key player in bringing subject specialists together across schools,including across primary and secondary schools (report by managementteam).
(b) Nisbet Effective Practice Network (NEPN) - this has been set up to include a database which contains examples of effective practice which schools are willing to share.The protocols for this work have been developed and agreed by the heads. ‘Effectivepractice’ is defined by the contributors, but should be endorsed by someone outside theschool, for example an Ofsted inspection or a member of the LEA advisory team. Adedicated website manager based in the LEA has been employed to set up thedatabase and keep it up-dated on a termly basis. Each school has been asked toidentify a ‘link co-ordinator’ to channel contributions to the website. The data base isopen to all and contains:
• A news page highlighting recent events, successes and new web entries• A secondary ‘effective practice’ search page• A search page devoted to the Nisbet Youth Cultural Harmony Project• Links to other useful web sites
The website is now up and running, but there is some concern that there is not enoughinformation on it currently to make it attractive or useful to teachers. There is someevidence to support this view from the school-level interviews, in that most subject leadersand ASTs interviewed were not aware of it, or, if they were, had not accessed the site.
The Cultural Harmony strand of the project held a conference, organised by the NisbetYouth Parliament and entitled ‘Racism Must Die’. This took place in May 2003 and wasattended by 60 young people from schools and Youth Centres/Projects. Workshops wereorganised throughout the day on various aspects of promoting cultural harmony, includingdance, story-telling, music and the work of school councils. The conference received apositive evaluation from the attendees and a second conference ‘Harmony Must Live’ washeld in 2004. One spin off from this has been a visit by students from one of the school toNew York, where issues of racism and student participation were discussed with studentsfrom New York schools.
Other collaborative initiativesOne development for closer collaboration has been that the two specialist performing artsschools are jointly appointed a performing arts administrator to be shared across the twoschools. ‘This is a signal to us both that we want to do more joint work instead ofcompeting, and to complement each other as performing arts colleges and build somecapacity’.
A lot of collaborative work has come out of the LIG collaborative, which is not DP. ‘All ofthis comes out of the big frame for wanting to collaborate, but it doesn’t technically come
84
out of the Pathfinder, but it’s paralleled by that’ (Headteacher). One school is doing theirsecond training on ‘Coaching the coaches’, with the five schools in their LIG group. ‘All fiveschools in the collaborative are coming to that, and looking for ways to share practice’.(Headteacher).
Provision,It’s not clear, from the data, the extent to which curriculum development or changes inteaching and learning in the schools are outcomes of collaboration between the DPschools. There are one or two examples, such as the development of an RE syllabus forone of the schools, which come under this umbrella, but generally, some of the moreextensive innovations are the result of contacts from further afield. For example, one schoolis introducing a Y7 curriculum, which provides more of a primary school atmosphere for Y7.This came out of meetings and visits to a number of schools outside the LEA.
One of the schools is to start an innovative link with a local FE College (see above). Thisalso involves eight other secondary schools. Each will be sending students to the collegefor one day per week. Each school has contributed a Teaching Assistant, who will supportteaching with a mixed group of students.
InnovationOne of the strands of Nisbet’s DP was the ‘Cultural Harmony’ project. One school, inparticular became heavily involved in this. In 2002/3 there was a conference, whichstudents from the school council went to. In 2003/4 the school council conducted a surveyin the school about experiences of racism. This showed that pupils felt the school was aracially harmonious place. In January 2004, some of the pupils went to a workshop abouthow to do action research in schools, and there was a link up with South Bank University,which involved 5 secondary schools and also a conference involving 11 schools. A group ofpupils also went to New York, to exchange ideas with students there. A report of theresearch has been prepared by researchers at South Bank University. There is also areport on the New York visit.
Educational effectsOverall, Nesbit stands out as particularly effective in improving achievement at GCSE levelamong the DP LEAs, as 11 out of the 15 schools improved more than the national trend.Nisbet has also appeared to be most effective in improving GCSE scores in English andMaths, against a national downward trend in these subjects. In addition, this LEA has alsoimproved GCSE scores for the more disadvantaged pupils (as measured by Free SchoolMeals eligibility).
Although there are qualitative reports of increased commitment by students, and increasedprogression to further and higher education, it is difficult to disentangle the various factorsthat can influence this. Similarly with improvements in exam results at KS4. These haveimproved in Nisbet over the past three years, but it would be difficult to say which of themany initiatives and collaborations were responsible for this.
Deep collaborationGenerally, there is a collaborative culture in Nisbet, with many examples of collaborativework and sharing between schools, particularly at senior management level. Therelationship that the Leading Edge school has developed with a school that was in specialmeasures has become one of ‘deep collaboration’: ‘We are still working with [the school]because there’s still a lot to be done, and having done all that work we don’t want to lose it.Government and research people do not understand how long it takes to get into the deepfabric where you’ve got enough trust and understanding to make a difference. And if you’vegained it, you’re sure as heck not going to give it up’. (HT Leading Edge school).
However, this type of collaboration in depth is not common. The head of another schoolremarked that: ‘The context in Nisbet is so manic at the moment that it’s hard to get
85
sustained partnerships. And it’s not because anybody is acting in bad faith, and there’s a lotof superficial “Oh yes we do and we all work well together” stuff, but actually gettingsustained partnerships going is like pulling teeth. In Nisbet at the moment, there are 11specialist schools all doing their own thing and trying to collaborate’.
The head of one of the schools felt that ‘There are still things you wouldn’t share, orexample if something hadn’t gone well, you wouldn’t want to wash your dirty linen in public’.She felt that schools in Nisbet would not want to go as far down the road as becoming acollegiate, but, on the other had, would not want to be isolated.
It is difficult to assess the depth of the collaborations in Nisbet. Schools appear to work indyads, sharing and collaborating with those that they have most in common with, or forwhich they have assumed a special responsibility (e.g. the Leading Edge school and theschool in special measures). A number of schools have collaborations outside the LEA, forexample, with the Carpe Vitam project, or with Seven Kings, or with a school in another DPLEA. However, what is notable is that schools in Nisbet are proactive and committed toworking collaboratively towards improving provision and that both the schools and the LEAare highly effective.

86
Hardy
Background
In this local authority area, geography and social geography play a key part inunderstanding the background to the schools context. This large county has 76 secondaryschools representing a wide range of categories including community comprehensives,foundation schools and in some areas, selective grammar schools. The rural and suburbansettings contain areas of high employment and affluence and also pockets of relativedisadvantage.
Diversity Pathfinders had a high profile through local authority promotion. There was anexplicit goal to increase the number of specialist schools and a centrally appointed team toco-ordinate this. Previously the small number of specialist schools tended to be associatedwith the highest achieving schools and to some extent with elitism. Through DiversityPathfinders, specialist school status came to be viewed in a different way, more as a normbecause the number of specialist schools did increase significantly during the projectperiod. Specialist status was identified as having the potential of benefiting all students in alocal community by “working together to share resources and expertise to raiseachievement.” The local authority put forward an ambitious goal to include all secondaryschools along with primary schools and special schools with the idea of communities ofschools.
After consultation with the local authority, it was decided to track two different areas as partof the evaluation of Diversity Pathfinders. Two contrasting locations were chosen, Areas Aand B, with a sample of 3 schools in each. Area A is a compact town with eleven secondaryschools and data was drawn from three case-study schools representing a range ofachievement. Area B has a different geography as a ribbon development along a majortransport link and three schools were selected for data collection, which again representeda range. The examples in this case study draw chiefly on data from Area A because, duringthe project period 2002 to 2005, the level of inter-school collaboration activity was higherthan in Area B and this outcome was expected given the starting points. By the end of theproject Area A had been held up as an exemplary model within the local authority and alsorecognised nationally. In contrast, Area B had experienced more challenges and a slowerstart in establishing collaboration although there had been some developments by the endof the period. The reasons for difficulties as well as success in collaboration provideimportant implications beyond the sample schools.
OrganisationExamples of changes in the organisation will be considered at the level of the localauthority and also in two different areas. The Diversity Pathfinders strategy of including allschools in such a large authority and the promotion of specialisms required centralleadership. A Diversity Pathfinders central local authority project officer was funded for twoyears to lead the project and this gave a high profile to the work.
The DP officer set up group structures for DP as a network of geographical clusters ofschools. Within each cluster, leaders drawn from a local headteacher or deputyheadteacher who were given half a day per week to take forward the local plans forcollaboration and report to the DP network. This work might be supporting specialist statusthrough the development of the community plans or other local priorities. The clusterleaders also met as a group across the authority to share progress.
An outcome of the organisational aspect of the local authority work was to link DP project toother curriculum priorities and to other national initiatives sports networks. DP was alsolinked to Curriculum networks led by advisors for heads of departments across the authorityorganising meetings and dissemination of work.
87
The organisation of DP in Area A, built on an existing headteacher group. The DP projectwas a local catalyst for working together on the needs of the town as a whole. The specialfocus was life-long learning and raising standards through more vocational provision andimproving community and local industries links. There was a high level of commitment andbehind the scenes work from key headteachers in getting the vision developed andaccepted. One headteacher described the shift in the collaboration work as starting bywinning hearts and minds and moving on to developing more enduring organisationalstructures. This meant that over the project period the existing collaboration work onspecialist status among headteacher developed into much more extensive collaborationincluding the local FE College and local industry and significant external funding. Over theproject period there was a change in the organisation and governance of the collaborationevolving into a more formal partnership including the FE college with a memorandum ofunderstanding. An advisory group whose members included a local university, theConnections service, senior FE staff provided the executive body. The name of the formerheadteachers group was changed to reflect this strategic change of partners.
The work attracted significant external funding to develop extensive 14-19 work. Thisenabled the appointment of a local and well respected headteacher as co-ordinator to takethe 14-19 collaboration work forward, initially for two years. This co-ordinator post was thenestablished as permanent post and additional support was provided via a deputy director.The collaboration work of this area was further developed via operational sub-groups.These groups included meetings at head of department level and deputy headteacherlevel. These groups focused on issues such as developing joint timetabling and AppliedGCSEs, skills,
In Area B by contrast there was less DP collaborative activity or evidence of enduringorganisational structures during the project period. On the one hand school leadersexpressed a wish to collaborate but also some degree of frustration at the local barriers.This suggested that the administrative cluster did not match any strong sense of a localcommunity of secondary schools although pairs of schools in similar circumstances andcollaboration with primary schools did develop. Towards the end of the project the 14-19agenda provided another reason for collaboration.
DiversificationThe local authority has been pro-active in encouraging all schools to apply for specialiststatus and there has been an increase countywide which can be seen as curriculumdiversification. For example Area A includes a training school, engineering, business andenterprise, sports and technology schools. Two special schools are also involved in thetown partnership. In Area A, one school has a major local industrial sponsor and has beendeveloping these curriculum links. Some of the links have been to encourageentrepreneurship in technology and others have been sponsorship of projects in Art andMusic. The school sees the level of involvement as positive and appropriate. The emphasison industrial links and improving vocational options has been a major driver in Area A. Ablocked town wide timetable on one day has facilitated a new option choice for appliedGCSEs. There is a programme of college courses.
In Area B the schools applying for specialist status saw it as an impetus for schoolimprovement via staff motivation and an injection of capital. One school in the sample wasdelayed in achieving specialist status due to insufficient improvement to satisfy externalcriteria.
CostsThe DP funds were used to support a central DP team and cluster leaders in the areas thusspreading the funding across a wide area. In Area A the DP funding was not seen assignificant compared to other funding from multiple streams relating to post 16 workincluding modern apprenticeships.
88
There were many comments from headteachers in both areas on the time costs of puttingtogether a bid for specialist status especially with regard to local sponsorship andfundraising. The LEA started a trust fund pool to support schools to achieve specialiststatus but no schools in the area made direct use of this during the DP period.
Professional processesThe local authority web site had an area devoted to DP information and case studies. Forexample, across the authority, primary schools were included in the DP project and therewas an increased emphasis given to examples of ways of working with feeder schools.These were published as good practice case studies by the central DP officer. As thenumber of specialist schools increased there was a concern that all primary schools shouldhave access to the new facilities and resources. In response the DP web site was used topublish lists of schools and the kind of help on offer. Other examples on the web siteincluded case studies from secondary curriculum leaders and information about the schoolswith newly acquired specialist status. The importance of the local authority web site can beseen as a way to raise the profile of collaborative work and as a celebration of successalthough it does not provide an indication of take-up.
At local level in Area A there was an intention to develop a town wide intranet for parentsand teachers to access information about courses. This was much slower to develop thananticipated as seen in other parts of the UK in the DP project more widely. Howeverthrough combining extra project resources the Area A intranet did develop as informationtool on local options. Area A acknowledges that an alternative way of planning the e-environment would be on a smaller scale namely, a need to start with targeted curriculumareas in schools and work from the grassroots enthusiasts upwards. There weredifferences in the teacher response and student response to the e-environment aselectronic learning tools looking at career options had a high take up. Plans for video-conferencing between schools in Area A were delayed due to technical difficulties
After senior level work on the possibilities of working together to increase provision the nextstage was to involve other school staff including deputies and heads of departments. Inboth Area A and Area B there were face to face meetings relating to the planning ofprovision across schools. In Area A this has been focused on post 16 provision. In Area Bthe meetings and opportunities were more extensive, for example joint planning meetingsto develop applied GCSEs and subject co-ordinators meetings.
ProvisionThe rewards of increased capital associated with specialist school status were seen as away to improve school facilities and local curriculum provision in an area. The applicationfor specialist status includes fundraising. This was undertaken on an individual basis byheadteachers and was seen as time-consuming and potentially divisive. For example inArea B one school had attracted a lot of funding for new facilities in contrast to anotherschool new to fundraising. This reflects the horizontal diversities between schools targetinglocal employers who might provide the school with fundraising or sponsorship or theprovision of work experience places. This issue was taken up at local authority level and acentral trust fund was developed to help schools with sponsorship. In the case study areasthe schools did not directly benefit from this trust fund but raised funds through individualefforts.
In Areas A and B the local need to consolidate post-16 provision and consider the viabilityof schools was an incentive to start collaborative work. In Area A, this vision developed intoseveral years work and led to significant changes to the 14-19 provision and increasedoptions and pathways. One of the guiding principles in the planning increased curriculumprovision was the need to consider progression routes. Therefore initial work on post-16courses has had an impact on provision lower down the schools. This includes new optionpathways for Years 9, 10. The schools and college in the town have agreed a to co-ordinate timetables to allow a single option block one day per week. Across the area 65%
89
of year 10 students have been involved in applied GCSEs. The increased flexibilityprogramme involves day release for attending college courses including plumbing,hairdressing, media and outdoor education. The demand for good vocational places hasbeen higher than the available provision. There is also a reported improvement in stayingon rates.
Some comments from students on the difference between school and college work are asfollows:“In school you have to write it in folders but in college it is more relaxed and practical. We
can make in one day what would take a whole term in school.”“We have to get changed in and out of uniform when we come from college. There isnowhere to put your dirty work-boots. They are not allowed in PE”“We started mixing after about three lessons. We know them from football anyway.”
InnovationFor this research, the development of innovation in Area A in the sample schools was thespecific focus. For example the permanent appointment of a local headteacher to takeforward the collaborative work provides an example of a new form of leadership role andhas also led to a financial model being shared beyond the area. Also, the new network ofstaff contacts reflected structures innovative for this area because there had been werelimited links previously among neighbouring schools. Group meetings at deputy and headof department level worked on for example planning, timetables, developing electroniccareer tools, piloting new GCSE courses, selection of syllabi and development of jointmaterials. The development of an increased number of vocational pathways and optionscould only have happened through the joint one. An example a of the change in thinking toplacing student needs before the individual institution was a new options booklet statingwhat is taught at post 16 level rather than where.
Educational effectsAccording to qualitative findings, the individual case study schools have been activelyengaged with issues of learning and in some cases have viewed specialist status or localcollaborative work as a means of school improvement. According to quantitative findingsand tests of statistical significance reported in this study, this local authority as a whole didnot improve results relative to the national trend. Looking at measures of GCSE results andinclusion and FSM, Hardy did slightly worse than other Diversity Pathfinder areas. At thelevel of the case study schools, by one test there was no overall change between 2002 and2005 with the exception of a sports college in Area A which showed a significantimprovement in Maths and another school in Area A which showed a decrease during aperiod of staff changes. However by an additional, more exacting test, the results of allcase schools in both areas did less well in comparison to national performance in 2005compared to 2002. In Area A there were other non-case schools in the collaborative groupwhose results were not included in these tests.
Deep collaborationIn such a large county with all schools potentially DP schools there were several possiblecase-studies of collaboration at a time when the word was becoming a currency. The localauthority team was proactive in publication and disseminating its own case-study materialof good practice via booklets, case studies on the web and an exhibition day. These includeexamples relating to collaboration with primary schools which is not the focus of thisresearch. Thus DP has had a high profile centrally in contrast with varying responses atlocal level.
The two areas chosen for the research evaluation underline some of the complexitiesinvolved in establishing deep collaboration. In both Areas A and B, the time taken toestablish trust and vision based on local needs took years and is still developing. One headteacher’s view was: “Some people say the words but don’t do it and some don’t even say
90
the words. We say it and do it… It is to the credit of X School [with highest status andresults in Area] that they are fully on board, not just dispensing charity.”
The difference in progress was to some extent expected based on different starting pointsand different levels of other project funding. Area B presented particular challenges ofentrenched perceptions of hierarchy and of separation. For example one school hadrecognition beyond their area for innovative practice and CPD and shared this with feederprimary schools but the collaboration with other local secondary schools in differentcircumstances was under-developed. In Area B, the drive for specialist status motivatedsome schools in terms of internal improvement and new attempts at community links. Oneschool was disappointed at unsuccessful bid. At the end of the project the economic needto rationalise post-16 provision especially for schools in similar circumstances with smallsixth forms started a new phase of attempts at collaboration.
In Area A, the change in name from a headteachers group to a group including the collegereflects a long term commitment and strategic change. The group has survived severalchanges of senior school staffing and some temporary stalling of involvement. The workwas a continuation of earlier work to develop community learning and employability througha Single Regeneration. The new organisational structures and planning for sustainabilityincluding a permanent co-ordinator indicate a strong commitment to the collaboration.Penetration of the vision to classroom teachers is still on going but teachers interviewedover two periods indicated an awareness of the vision.
In particular, the appointment of a local co-ordinator in Area A has been a key factor in thesustainability along with the procurement of multiple funding streams. This co-ordinator,previously a local head has a high degree of local respect and has been involved innational networking. The co-ordinator’s office also provides an administrator and this isvalued by schools as a way to see through collaborative arrangements. The DP fundingalone would not have sustained this level of co-ordination.
Area A has been recognised as providing excellent and exemplar practice in 14-19provision according to external reports and agencies. Similarly this area is heralded by thelocal authority as forward thinking and influential. It can be seen to locally owned and alsocollaborating with wider local authority priorities. One headteacher summed up theimportance of collaboration being locally owned “We don’t want a template. You can’t forcecollaboration.”

91
Byron Collegiate
Background
In Byron, the DP focus was on the creation of collegiate academies. Four collegiates are atdifferent stages of development in the city. The one that is at a most advanced stage(Collegiate A) was supported by DfES DP funds till the end of March 2004, with the LEAcontributing a further £100,000 in 2004/05 to continue, in effect, DP funding for a furtheryear. The Collegiate formally commenced at the beginning of the autumn term 2002.
In Spring 2004 the original six schools that formed the Collegiate were joined by anadditional four schools, to create a Collegiate of 10 schools (Table 1). This was the result ofa successful bid with those schools for Learning and Skills Council (LSC) funding and adecision by all the schools concerned to rationalise local arrangements in order to reducemultiple memberships of school partnerships.
The research project has concentrated on the original six founding schools (Schools B1,B2, B3, B4, B5 and B6), and these are the case study schools for the purposes of thestudy.
Table 6 - Secondary Schools in Byron Collegiate Academy
SchoolCode
Datejoinedcollegiate
Specialiststatus
securedinterest
Other relevantstatus orcollaboration
Type AgeRange
Gender GCSE5 or more A*-C%2002 to 2005
B1 Foundingmember
Business andEnterprise
In EiC partnership;Leading Edge
Community 11-18 Mixed 47 53 76 78
B2 Foundingmember
Technology In EiC partnership; Community 11-18 Mixed 42 40 50 56
B3 Foundingmember
Arts City LearningCentre of site;
Community 11-18 Mixed 56 49 56 52
B4 Foundingmember
CreativePartnership school;in EiC partnership;Centre of smallEAZ;
Community 11-16 Mixed 17 17 35 40
B5 Foundingmember
Sports In EiC partnership; Community 11-18 Boys 24 47 36 50
B6 Foundingmember
Science former Beacon;in EiC partnership;Special school
Communityspecial
11-19 Mixed 0 2 0 0
B7 March2004
Technology,Sport
In EiC partnership; Community 11-16 Mixed 35 31 53 72
B8 March2004
Maths andComputing
In EiC partnership; Community 11-18 Girls 50 61 49 49
B9 March2004
Technology In EiC partnership; Community 11-16 Girls 70 82 82 84
B10 March2004
Maths andComputing
In EiC partnership; RomanCatholicvoluntaryaided
11-18 Mixed 58 64 59 57
ContextThere is some degree of competition amongst the founding collegiate schools, though it isperceived by the heads to be ‘healthy competition’ which is consistent with mutual supportfounded in a strong partnership. The loss of pupils from the area to other schools in Byronis a shared problem, affecting School B4 more than the others.
92
School B1: School B1 is probably the best placed of the founding six schools, i.e. theschool in least challenging circumstances. Its head has been very active in the Collegiate,e.g. dealing with collective bids for funding, supporting others schools (leading the supportfor School B4 for example) and working especially closely with the head of School B2.
School B2: The head of School B2 was the second to chair the Collegiate Board,completing her term as chair at the end of the summer term 2004. School B2 has aparticular reputation for supporting specialist educational needs, but this also, in the view ofthe head, skews perceptions of the school.
School B3: The head of School B3 was the first chair of the Collegiate Board. School B3has had difficulties in the past and has, for example, the highest proportion of SEN children(apart from the special school, B6) in the collegiate: almost a half of its pupils are classedas SEN (with or without a statement). However, its GCSE results since 2000 haveimproved markedly. At the end of the academic year 2003/04, the head left School B3 totake up a post at a non-Collegiate school.
School B4: The school is categorised as in ‘challenging circumstances’. It is the centre of asmall EAZ working in partnership with a group of primary schools to raise literacy andnumeracy standards using ICT and video conferencing, and is a Creative Partnershipschool. Approximately 40% of its students are from White ethnic backgrounds; 60% fromAfrican/Caribbean, dual heritage or Asian ethnic backgrounds (16% approx. Asian). Theschool was listed in the DfES top 100 most improved schools in 2001. Under pressure fromthe DfES and LEA and not expected to achieve its 5 A*-C GCSE target of 20% in 2004, itdid in fact exceed this (35%) and increased the proportion again in 2005 to 40%.
School B5: The school has been under pressure to improve its performance and put mucheffort into preparing for its Ofsted inspection in 2003, with active support from theCollegiate. The 2003 Ofsted report concluded that this “is a good school where studentsachieve well” and that it is improving “because of the good leadership of the headteacherand the chair of governors”. Most pupils’ backgrounds are Indian, Pakistani or BlackCaribbean, though there is a variety ethnic groups in the school.
School B6: School B6 is a special school and in some ways is at the heart of theCollegiate. Board meetings usually tale place there and the Collegiate Co-ordinator and hisoffice is based at the school. School B6, as would be expected, usually has a distinctiveperspective as a special school, with financial issues often being significant (e.g. notreceiving LIG finding). There is a strong commitment from both School B6 and themainstream schools to working together and to support and learning being two-waybetween special and mainstream schooling.
The schools that joined in 2004 comprise a voluntary aided Roman Catholic school (SchoolB11) which is also a member of the city’s Catholic Partnership of schools, two girls’ schools(Schools B8 and B9), and a co-educational school (B7).
OrganisationThe LEA, in the person of the then CEO during the years running up to the Collegiate’s
foundation, played a crucial role in developing the Collegiate idea and getting it off theground. The Board have emphasised that a strong LEA was an encouragement to schoolsto adopt wider allegiances.
The headteacher (till Easter 2003) of School B4 was a key catalyst locally in establishingthe Collegiate. Her driving motivation was to make a difference to the “equality gap”.Tackling inequality and promoting social justice are in the mission of the Collegiate but notgiven a high profile because, according to the headteacher, it is not worth havingarguments about this: hence it is “patchily present”.
An important relationship in developing the collegiate locally was that between the head ofSchool B4 and head of School B1 who was mentor to the former. Rejected by the ‘good
93
schools’ which the head of School B4 approached, the Collegiate emerged from existingand developing networks, such as the relationship between Schools B1 and B2, and theEiC network which the Collegiate schools were already part of. Multiple funding sources(notably the DfES Diversity Pathfinders project, the LEA and a charitable foundation) havebeen important in enabling the collegiate to set itself up and to develop.
Each school also came to the collegiate idea with its own agenda: for example, for SchoolB4 its very survival was a high priority; for School B2 it was its (relatively small) size andthe need to develop its profile beyond a reputation for being effective with special needs;for School B1, aware of trends in the policy context, collaboration represented the way ofthe future (interview, head, School B2, July 2004). Attention by schools to their individualinterests is reinforced by the national accountability system which focuses on theperformance and inspections of individual schools. (The Collegiate has consideredcollective indicators and targets and it is planned that they will return to the agenda.)
The Collegiate is run by a Board, made up of:- headteachers of all ten schools;- an LEA adviser;- former CEO of Byron as honorary member.
The chairing of the Board rotates amongst the heads. A head holds the Chair for one year,which then passes to the Vice Chair.
A full-time Collegiate Co-ordinator, who works to the Board, took up post at the beginningof September 2002. The Collegiate Co-ordinator is a former deputy head (from outside thecollegiate) and is supported by a full-time administrator. This support office servicesmeetings, but the role is more extensive and significant than that. The day-to-day influenceand initiative of the Collegiate Co-ordinator is seen by the headteachers as essential to theeffective running and development of the Collegiate. His pro-active role is not only amanagerial one of ensuring that decisions are implemented but embraces vital leadershipactivities - such as helping to ensure coherence amongst the group, encouraging andgiving confidence to participants, and taking initiatives on behalf of the group of schools.Action plans and systematic reviews of the progress of the Collegiate’s decisions and plansare amongst the papers prepared for the Board which assist the Collegiate in evaluating itswork. The Collegiate also employs its own advanced skills teachers (ASTs), three in all.
The Board meets regularly (monthly). It is committed to the principles and vision forcollegiate academies (CAs). In the original bid to establish CAs in Byron, they weredescribed as groups of schools which act together to create a ‘commonwealth’ for thebenefit of pupils and staff and in which staff have a sense of belonging both to their ownschool and the collegiate13. Byron Collegiate is also committed to a brief set of specificconditions. These include common closure days and off-timetable days, broad bandconnectivity to enable video conferencing, collegiate days for common activities andthemes, establishment of a group of link governors, and a budget contribution from schoolsof a half to one per cent. A rationalisation plan, adopted in March 2004, constituted anenlarged Collegiate A of 10 schools alongside a new collegiate of 10 schools, with all 20 ofthe schools being members of an EiC Partnership. The collegiates are seen as theoperational level to which the EiC Partnership is responsive. In other words, control anddirection of the partnerships rest with the smaller collegiate groupings.
The Collegiate has made decisions about its joint activities and deployment of funds overthe years, which have resulted in the range of initiatives detailed in the sections whichfollow. The Collegiate has worked well in managing the ‘bidding culture’ and facilitatingschools’ inclusion in bids for funding, through joint bids, such as a successful application for
13 ‘Collegiate Academies: Promoting the Interdependence of Schools Without Sacrificing Freedom - Pilot Bid’,2001.
94
the funding of an inclusion network aimed at facilitating the sharing of good practice in SENteaching amongst the Collegiate schools. The Board of the Collegiate has also madeimportant strategic decisions - for example, the rationalisation of collaboratives which led tothe expansion of the Collegiate, the decision to develop a strategy on vocationalopportunities and the less successful development of an electronic environment (seebelow). But strategic decisions are a challenge and difficult to resolve amidst thecontinuous flow of specific and new initiatives and demands.
The collegiate co-ordinator described there being “perfect trust” (interview, May 2005)amongst the heads in the Collegiate. Existence of a high degree of trust is validated byremarks of headteachers interviewed and observations of Board meeting (most explicitly atBoard meeting, July 2005).
This is not to say that there are no tensions or differences between heads. As noted, theschools also have their own agendas. And, for example, a slowing of the pace was notedwith expansion of the Collegiate to 10 schools. There was not the same “energy” and moreattention was being given to questions of ‘can we afford to do such-and-such?’, though theincoming heads were very much in favour of collaboration (collegiate co-ordinator interview,May 2005).
However, tensions and differences are overcome through a mix of trust, shared identity asa group and identifiable benefits to the schools. Key positive characteristics of thecollegiate identified by the heads are (observation, Board meeting, July 2005):
• Practical benefits, such as sharing of ideas/practices and support from thecollegiate ASTs
• Aid to strategic thinking that comes from heads working together, e.g regardingbehaviour management
• Shared self review by schools• Collective capacity and influence, e.g. in making funding bids and lobbying
organisations such as the LEA• Welcoming culture amongst heads: this was powerfully endorsed by heads new to
the collegiate and by the head of the special school• Support and willingness of colleague heads to listen• Focus of meetings on the children: as one put it, these meetings “restore humanity
to teaching”• The support and contribution of the collegiate co-ordinator, described as absolutely
essential.
Some of the key factors helping to sustain the Collegiate are summarised in Figure 1, andothers testing or hindering the partnership are summarised in Figure2.
95
Figure 1 - Factors helping to sustain the Collegiate
• ‘Healthy competition’ - competition between collegiate schools perceived as healthy and notinconsistent with mutual support
• Local catalyst - head of School B4 - to generate the collegiate• Operational focus, minimum distraction by bureaucracy and administration• Evolutionary, rather than being required to follow a blue-print• Ability to be flexible• Good relationships - relations and internal discussion are characterised by trust, openness,
knowledge of each other and local circumstances; the welcoming culture and willingness to listencited above
• Critical voices - heads at various times who have been willing to ask searching questions – such as‘is the collegiate being radical enough?’, ‘are we really doing what the Collegiate was set up to do?’
• Infrastructure - full-time collegiate co-ordinator with administrative support• Multiple sources of funding, notably from Gatsby; the Collegiate has been a vehicle to draw in
additional funds through collective bids• Commitment of schools’ own funds - schools putting their own money into the Collegiate, which
encouraged collegiality and commitment• Ownership / authorship by heads• Enlargement - expansion of Collegiate to 10 schools which means that the collaborative is better able
to generate funds for collaboration and increases capacity for mutual support)
Figure 2 - Factors testing/hindering the Collegiate
• Changes in leadership, for example the head of School B4 moving to new post. The Collegiateseems to have been able to survive this kind of test.
• Limited capacity - there is a limit to the amount of time staff can be allowed to go out of their schoolto participate in collaborative activities. This is exacerbated in the Collegiate because its schoolshave severely limited spare capacity (e.g. to enable staffing to support each other). Enlargement ofthe Collegiate helps.
• Weakness in accountability link - role of link governors in relation to the Collegiate is weak.Governors do meet and are informed of Collegiate activities, but heads acknowledge that thegovernor role has not been as active as it could or should be.
• Variability - schools being at different stages and with differing needs• Disappointing impact of electronic environment – the collegiate electronic environment has not
proved as successful as anticipated.• Limitations in penetration - change has often not been as radical/deep as some heads would like.• Enlargement - expansion of the Collegiate tests cohesion and ability to keep operational focus.
Diversification
Horizontal diversity: Three of the founding schools have specialist status, the most recentbeing School B5, which became a specialist sports school in 2004. School B6 (the specialschool) has applied for specialist status in science and School B3 is considering applyingfor specialist status in the Arts. All have Sixth Forms except Schools B3 and B414. Otheraspects to school diversity include School B1’s EiC funded Learning Support Base fordisadvantaged pupils, School B3’s City Learning Centre which serves 18 schools in SouthWest Byron, School B10’s status as a Roman Catholic voluntary aided schools, and genderspecialisation in schools B5 (boys), B8 (girls) and B9 (girls).
Specialisation amongst the Collegiate schools has increased but not only in terms ofseeking the formal status of a specialist school. For example, School B1 has added to itsspecialist status as a Business and Enterprise college a focus on language (it plans to hosta Collegiate Business Language Centre); and School B4 has, from January 2006,incorporated a vocational health centre, known as Health Tech, which will be used by otherByron Collegiate schools. Health Tec’s first programme is for Year 9s who will visits for aday (to study healthy eating) which will link with what they are doing in the curriculum.
14 School B3 still has designation for a Sixth Form but does not run one at the moment.
96
Health Tech will also link up to schools via ICT links – the first significant step forward indeveloping an active electronic environment by the Collegiate.
An audit undertaken (on 10th May 2005) by the Collegiate of departmental strengths andweaknesses showed strengths but no weaknesses in two of the schools (Schools B1 andB6) and a mixture of strengths and weaknesses in the remaining schools. Since this audit,the Collegiate has decided to identify lead departments (more on this below under‘Professional Development’ in the section on ‘Professional Processes’).
The spread of diversity increased with the expansion to 10 schools, which brought in avoluntary aided school and three specialist schools: Technology (schools B7 and B9) (plusSport for School B7), and Maths and Computing (school B8 and 1B0).
Vertical diversity: Whilst competition for students is absent amongst the Collegiateschools, there are differences in performance and degree of ‘challenging circumstances’.School B4 has been in most difficulty, and School B5 has been under pressure. Partly dueto support from within the Collegiate, both have improved. Schools B1 and B2 are in themost comfortable circumstances. Although there is not a sharp hierarchy amongst theschools, there are, as at least two heads took pains to point out, differences in status andinfluence (interviews, heads of B2, B4). A school such as School B1 is, therefore,sometimes seen as the one that ‘naturally’ takes the lead in initiatives. This should not beoverstated however: one of the heads, who had highlighted differences in status,emphasised that the Collegiate had been very welcoming when that head had taken uppost and that in practice the collegiate schools operated as a partnership.
CostsAs well as DfES funding, the Collegiate has funding from a private charitable trust (Gatsby)for the ASTs and from each member school amounting to half a per cent of its budget.
In the academic year 2002/03, actual income was15:
£
DfES grant 100,000.00
Inclusion Programme Grant 20,000.00
0.5% school budget contribution 68,006.00
Total income (excluding Gatsby income) 188,006.00
(Actual expenditure was £167,534, leaving £20,472 to carry forward. Note that this differsfrom the figure below of £17,000 carried forward.)
In the academic year 2003/04 the Collegiate’s income was made up as follows16:
£
DfES grant 100,000.00
2002/03 underspend 17,000.00
0.5% school budget contribution 72,206.9617
Total income (excluding Gatsby income) 189,206.96
15 Source: Collegiate Co-ordinator, in notes received October 2004.16 Source: written report to Board meeting.17 This is an updated figure from Collegiate Co-ordinator, in notes received October 2004.

97
Planned income (of the expanded, 10-school Collegiate) in the academic year 2004/05 is18:
£
DfES grant 100,000.00
Gatsby funding 150,000.00
Pupil Fellowship 18,000.00
Surplus monies from EiC Partnership
LIG 50,563.0019
G&T 57,094.0020
0.5% school budget contribution 120,218.00*
Total income (excluding Gatsby income) 495,875.00**
* This may be reduced this year because of exceptional income items
**Excludes TEEP (Gatsby), Business Enterprise Project (DfES), 14-19 CollegiateGrant (LSC)
Time spent by the headteachers of the founding, case study schools on the Board can beestimated from the number of Board meetings. Twenty-nine meetings were held between10th July 2002 and 11th July 2005, each taking approximately half a day. Multiplied by thenumber of headteachers (six), that gives 87 person days (or 5 days per head per year).However, this in itself would be an underestimate, as it does not take account of activitiesand meetings outside the formal Board meetings.
Professional Processes
Sharing resources and mutual institutional support: The Board has been a forum forsharing information, contributing ideas and help (to support each other’s schools withspecific needs) and pooling effort. Examples include:
• Release of teachers in one school to assist where there was a short-term gap incurriculum provision and teaching support was needed in another. Schools B4 (seeVignette: School B4) and B5 have benefited from this. School B5 was going throughstaffing changes and the support from the Collegiate gave it time to build capacityfor improvement. It is considered by the Board that this had a significant positiveimpact on School B5 in 2003 which helped it to gain a good Ofsted evaluation andto raise A*-C GCSE results from 24% to 47%, with the results in 2005 being arecord for the school. Areas in School B5 where support was particularly helpfulwere ICT, maths, science and business studies.
• Pupil fellowships, which comprised activities aimed at re-motivating pupils whoseperformance had dipped (more on this below under ‘Curriculum Change’ in sectionon ‘Provision’).
• Sharing experience and practices in Board meetings - for example in use ofmaterials, such as Transforming Learning, and approaches to the new, ‘lightertouch’ system of Ofsted inspections (including its emphasis on student voice)(observation, Board meeting, April 05).
• Joint approach to professional development of middle managers, e.g. in lessonobservation (implemented through staff’s involvement in the SWAN {EiC} training
18 Source: written report to Board meeting.19 This is an updated figure from Collegiate Co-ordinator, in notes received October 2004.20 This is an updated figure from Collegiate Co-ordinator, in notes received October 2004.

98
programme, a collegiate self-review programme and a half-day support programmewhich started at School B7 {Progress Summary Action Plan 2004/05}).
Vignette: School B4Following a special meeting of the Collegiate in January 2004, School B4 wasgiven help by the Collegiate ASTs and staff from schools B1, B6 and B7. Areas ofhelp included the analysis and use of data and targeting pupils to achieve highergrades in GCSE. The proportion of pupils attaining five or more A*-C GCSEs rosefrom 17% in 2003 to 40% in 2005. This increase, together with an awarenessthat there is support available from schools in the Collegiate, has also reportedlyhad a beneficial effect on stability of staffing at School B4.The contribution is not just one-way, particularly since the crisis at School B4has passed. For example, students from other Collegiate schools attend SchoolB4 for computer maintenance and, more widely, with the opening of the HealthTech specialist vocational centre, School B4 is providing a significant resourcefor the whole Collegiate.
[interviews with collegiate co-ordinator, May 2005, and head of School B4, June 2005;+ observations of Board meetings]
99
Professional development: This has been a main focus of the Board. Activities haveincluded the following.
• Deployment of ASTs: Three Collegiate ASTs have been deployed according topriorities and plans agreed by the Board. As well as these, there are ASTsemployed by individual schools whose deployment is also planned collectively atBoard level. In addition, teaching assistants and teachers have been visiting otherschools to report back on good practice. There were challenges in ensuring thatASTs were used for their true role in enhancing and advancing the quality ofteaching, rather than as supply teachers. The role of ASTs has been discussed at anumber of board meetings, with the need to be sure that their work is addressingschools’ most essential needs becoming sharper as the ending of Gatsby fundingfor the posts approaches. A proposed programme for AST work presented to theBoard in May 2005 acknowledged that “a large proportion of the AST time inschools has been reactive dealing with problems of staffing, preparing for OFSTEDetc.”. The Collegiate Co-ordinator nevertheless described ASTs as the “main drivingforce for penetration” (interview, May 2005) because they are in contact withteachers in the classroom. This has been evident at Collegiate events, such asInclusion Week in June 2003 involving 90 teachers, as well as through directsupport to schools. A systematic analysis and review of the ASTs’ activities, writtenup in May 2005 to accompany the proposed programme of AST work, showed thesupport given to all of the collegiate schools. The head of School B5, interviewed inJune 2005, cited support in maths and science teaching (improving course work)though it was too soon at that point to the effects in terms of KS3 results; so too didthe assistant head (teaching and learning) at School B4 where AST support washelpful, amongst other things, in improving the analysis and use of data. School B2has also benefited from AST support in maths. The fact that there are variouscollaborative activities increases the potential for sustained professionalrelationships to develop as staff work with teachers from other school in more thanone capacity (e.g. in developing BTEC courses and as an AST, as cited by theassistant head of School B4).
• The Collegiate has supported the development of school-based ASTs, by fundingcover so staff have been able to come off timetable to prepare portfolios (interview,dep. head, School B5). Examples of school-based ASTs supporting other Collegiateschools include ASTs from School B7 helping improve English and ICT at SchoolB4.
• The Collegiate Co-ordinator gave as an example of commitment to the Collegiatethe head of School B1’s willingness to lose two key staff members who wererecruited to be Collegiate ASTs. (It is difficult to find good enough staff to be ASTsfrom outside the Collegiate.)
• During 2002/03 weekly cross-Collegiate curriculum group meetings were held on asubject by subject basis involving subject leaders from all the schools. These wereseen by the Board as successful in engaging the interest and enthusiasm of subjectleaders and generating networking beyond the formal meetings. Interviews by theresearch team with subject leaders showed mixed views and evaluations.Curriculum groups seemed to be most effective where an AST or enthusiastic headof department was involved to provide leadership and prompt action (collegiate co-ordinator interview, January 2004). A change of focus was agreed for the academicyear 2003/04 by the Board in order to reduce the numbers of meetings and timespent by teaching staff outside schools. (Pressure on time is exacerbated becausethe Collegiate schools are also involved in professional development activitiessponsored by the larger EiC Partnership.) This new strategy has been insufficientlysuccessful. It has worked where there is an AST or enthusiastic head of departmentto drive the group. Otherwise the loss of a sense of identity and face-to-faceinteraction which meetings provide has led to a loss of momentum.
100
• Collegiate training days have been held. One in 2003 involved curriculum groupsworking together. Feedback collected by the Board from teachers showed amajority found this satisfactory or better, though some did not find the day as usefulas it could have been. Another, held in 2004, on the Collegiate’s electronicenvironment appears to have been less successful. A collegiate training day in 2005focused on preparing the new vocational qualifications with options that includedmind mapping and accelerated learning as part of the strategy on teaching andlearning (see below).
• Lead departments and lead teachers have been identified with the aim of pursuing aprogramme of raising standards of teaching through an agreed framework forsupporting/coaching/mentoring (Progress Summary Action Plan 2004/05). Sciencewas identified as the weakest core subject across the collegiate (Collegiate ASTSummary Report, May 2005). Outcomes identified by the end of the academic year2004/05 comprised (Progress Summary Action Plan 2004/05):
o Working groups in place for some subjectso Framework for support visits agreed for September 2005o ASTs trained on coachingo Good Ofsteds reported for schools B6 and B7.
Electronic environments: Establishment of a Collegiate intranet to facilitate sharing ofpractice and innovations has been one of the key initiatives. The intranet becameoperational in the Autumn terms 2003 and in time is intended to be accessible by parentsand others in the community, as well as by teaching staff and students within the schools.As the year progressed, and the strategic direction of the Collegiate was reviewed, theBoard moved towards making e-learning and ICT a specific and distinctive focus of theCollegiate. A Collegiate ICT Strategy Director was appointed who, together with an ICTstrategy director in each school, had responsibility for forming a Collegiate team chargedwith encouraging the use of ICT in the classroom and to develop the potential of theintranet. A cross-collegiate training day was held in early 2004. However, the use andimpact of the intranet have not fulfilled the Collegiate’s aims. This is due to a mix of factors:technical difficulties; resistance in some schools; lack of curriculum groups to drive it.
Provision
Staff recruitment and retention: Retention has improved markedly because of theexistence of the Collegiate, as well as recruitment improving. Staff are more encouraged toseek posts in another Collegiate school as a career step, rather than leaving the areaentirely (interview, collegiate co-ordinator, May 2005). To further aid recruitment andretention, the collegiate is developing opportunities for co-teaching with post-16 schools:shared delivery is in place between schools B1 and B2 (Progress Summary Action Plan2004/05). (Students from both schools are on a course with delivery provided by a teacherfrom each school and lessons taken on both sites.)
Teaching and learning: Over time the collegiate has extended the range of targetedactivities intended to improve learning and the effectiveness of teaching in specific areas.By 2005, these included the following (Progress Summary Action Plan 2004/05):
• Improvement of boy’s attainment at KS4 through an AST art project
• Targeting of conversion of level 4-5 at KS3 in maths and science through ASTbooster lessons
• KS4 science virtual coursework programme (GCSE grade improvements werenoted by the Board at schools B1, B3, B4 and B6)
• A poetry / literacy Year 8 project with schools B1, B2, B8 and B11, culminating in atheatre performance positively rated by staff and students
101
• Support for KS4 borderline students in science, maths and technology
• Initiation of plan to introduce CATE and CASE by ASTs across all schools
• More effective use of ICT in teaching and learning: ASTs and leading practitionersare delivering CPD on classroom use of ICT and interactive whiteboard use isexpanding across the curriculum (especially in science, maths and technology), aswell as Flash software being used in science departments; e-learning is also beingdeveloped through a pilot project
• A collegiate gifted and talented programme, involving 395 students, 10 activitiesand all schools.
One of the problems facing the Collegiate, expressed by at least one of the heads twoyears into the Collegiate’s existence (interview, head, School B2, 2004), was its failure tomake sufficient difference to the heart of what schools are about, namely teaching andlearning. This issue was raised at Board meetings. As a result, increasing attention hasbeen given to the question of how to further improve the teaching and learning cultureacross the Collegiate in a more radical and strategic way than the professionaldevelopment initiatives cited above and specifically targeted areas. This concern hasfocused on the potential of TEEP (Teacher Effectiveness Enhancement Project), whichpromotes accelerated learning and is designed to motivate and empower learners. There isno formal commitment to implement TEEP across the Collegiate - schools approach it attheir own pace - but the Collegiate has played an important role in promoting it. Forexample, the Collegiate facilitated locally based training in TEEP, based at School B6, andCollegiate ASTs have facilitated TEEP training within schools (e.g. interview, dep. head,School B5). The Collegiate’s Progress Summary Action Plan 2004/05 commits thecollegiate to raising attainment through Transforming Learning at KS3 by training andinvolvement of lead teachers, TEEP trainers and ASTs in accelerated learning. Outcomesachieved towards this end comprise (Progress Summary Action Plan 2004/05):
• collegiate training day, which included mind mapping and accelerated learning• TEEP training day at School B5, supported by ASTs• 28 collegiate staff Phase 1 TEEP trained; 11 Phase 2 trained• ASTs trained on critical skills.
Curriculum change: Actions have been taken aimed at increasing educationalopportunities and options for students.
• As part of opening opportunities for courses provided by one school to pupils acrossthe Collegiate, an accredited food hygiene course was made available in 2002/03 to25 students in Collegiate schools by means of video conferencing (24 weresuccessful in gaining the Food Hygiene qualification).
• Collegiate events for pupils have been organised. A Collegiate Activity Week in theSummer Term 2003 included a Collegiate Sports Day for pupils who really enjoysport, try hard but do not normally get selected for participation in sports events.Other examples include a Cadet Day involving seven pupils from each schools, anArt day at B3 and G&T collegiate Art day at School B5, RE Quiz at B3, Mathsexperience at B4, and Technology workshops at B2 (interview, dep. head, SchoolB5; feedback from collegiate co-ordinator).
• A pilot programme was put on in September 2003 which trialled two alternativeoptions for Year 10: a BTEC Public Services and ASDAN course linked to theCollegiate Cadet Force at School B5 and a City and Guilds practical trades coursecovering brickwork, painting and decorating, plastering, woodwork and plumbing.
102
• A Pupil Fellowship programme, funded by the Gatsby Foundation, in which 48 Year8 students, eight from each school, selected because they would benefit from theresponsibility of becoming a mentor for younger students. The programmeconsisted of activities designed to build self-esteem and to develop leadership andteam building skills. This model was annual and ran for 2 years. It was thenchanged to a Literacy Project funded by Gatsby.
• There has been movement towards a common day and cross-Collegiate options incommon curriculum times. Progress has been made in aligning the school days ofthe Collegiate schools. The step was modest - two 2-hour common curriculumblocks per week were implemented in September 2003. This was tried for a yearbut the setting-up of the vocational centre concerned meant schools had to haveflexibility to fit into its capacity. A number of schools moved to an early finish onWednesdays to allow for common CPD time. Five schools have agreed a commonPost-16 framework. Moving school days so they are in line with each other andallow Collegiate timetabling is a complex and challenging task. There are a varietyof reasons why each school has chosen, for example, its timing of the lunch period,in the light of its student population. Curriculum deputies of the Collegiate schoolsmet to explore this and initially progress in generating ideas to move forward wasdisappointing. However, the deputies persevered and, following training and withencouragement from the Board, the plans for 2 weekly 2-hour blocks emerged. Theplan was that each of the six schools would offer at least one option for pupilsacross the Collegiate during these blocks. However, although each school couldsuggest a subject, this plan did not prove to be feasible. There was, then, a changeof strategy to provide a Collegiate-wide focus on the vocational curriculum.
• A group of students from School B6 (the special school) went to School B1 to studyEnglish to A to C level, though this is not continuing in the current year (2005/06).Year 10 B6 students have also joined School B5 for the cadet force.
• Use of video-conferencing has been limited because of problems with broadband inthe city which means that all six schools cannot be linked at the same time. Theproblem is not expected to be resolved until 2006.
• All Year 10 students, in 2003/04 and again in 2004/05, from all of the Collegiateschools took part in a collegiate-wide Business Enterprise project (collegiate co-ordinterview, May 2005). Enterprise education is to be a continuing collegiate activity(observation, Board meeting, April 2005).
• The Collegiate-wide vocational strategy focuses on ‘hands-on’ courses. FromSeptember 2004 it was resolved that all schools should become specialistvocational centres, through LSC funding. All funding was used for hands on coursesbased at two local centres which are providers of vocational courses. (Proposalssuch as supporting uniformed public services at School B5 and motor vehicle atSchool B1 were not accepted by the LSC). The courses are not VGCSEs but are toprovide hands-on study for students in danger of not attaining any qualifications. Forexample, BTEC courses have been developed by the Collegiate - by funding cover,setting up networks between schools (Schools B3, B4 and B5 took the lead in jointlydeveloping courses in areas such as art and design, and School B1 in sport) andproviding training sessions. As a result, for example, School B5 had five BTECcourses by September 2005 (interviews with dep. head, School B5 and asst. head,School B4). The vocational strategy is part of the collegiate’s strategic aim todevelop effective 14-19 provision. Plans and outcomes by the end of the academicyear 2004/05 included (Progress Summary Action Plan 2004/05):
o two successful bids to LSC (via SWAN 14-19 Executive ManagementGroup) which are being used to fund vocational provision
o partnerships established with the Strategic Health Authority and LSC
103
o improved communication channels with Bournville (FE) College and a rangeof WBL (work based learning) providers
o increased vocational provision at local vocational centres (Quinzone andHunters Hill)
o working groups established to develop GNVQ successor and new vocationalcourses
o Byron Collegiate Sixth Form plannedo Progression routes for all KS4 vocational courses planned

104
InnovationThis section highlights the specific and strategic innovations amongst the changesidentified above.
Specific InnovationsSome of the main specific innovations are summarised in Table 2, not all of whichcontinued. Some were more successful than others.
Table 7 - Summary of Specific Innovations in Collegiate AArea ofinnovationOrganisation • Collective indicators and targets: the Collegiate has considered these and it is planned
that they will return to the agenda.Diversification • Analysis of and response to variable strengths and weaknesses: collaborative audit of
school departments’ strengths and weaknesses and identification of lead departmentsto bring about improvement.
• Inclusion of a special school as a full and active partner.• New specialisations, eg Health Tech vocational centre at School B4.
Professionalprocesses
• Electronic environment for collaboration: the Collegiate intranet.• Collegiate employment of ASTs and the collaborative deployment (through the Board)
of these and school-based ASTs.• Cross-Collegiate curriculum group meetings.• Collegiate training days.
Provision • Introduction of TEEP (Teacher Effectiveness Enhancement Project) to improve cultureof teaching and learning.
• Trialling and introduction of specific courses and enhancement of course options.• Collegiate events for pupils.• Steps towards common day and alignment of school days across the Collegiate.• Byron Collegiate Sixth Form.
Strategic InnovationsStrategic innovations changes are intended to be extensive in size, scope and scale and toaffect processes, provision and organisation. Two initiatives appear to be strategic in thissense21:
The Collegiate itself as an organisational experiment, run by a Board and withsupporting infrastructure (collegiate co-ordinator, etc.), with the aim of bringing aboutcloser partnership and a sense of identity between schools.
The Collegiate-wide vocational strategy which has the potential to impact not only onprovision but also the nature and degree of diversification, the organisational inter-dependence of schools and the ways in which staff work.
Educational Effects
Educational experience and opportunities: There have been additional opportunities forstudents, including new options for students across the Collegiate, a Collegiate activityweek and a Pupil Fellowship Scheme. (Details of these are under ‘Curriculum Change’above.) The extent of involvement of students is illustrated by the estimate that half of Year7 students throughout the Collegiate participated in collaborative activities over the twoyears 2002/03 and 2003/04 and that all Year 10 students took part in the BusinessEnterprise Project involving all of the Collegiate schools during 2003/04 and 2004/05. Theemphasis has come to be less on moving students - e.g. between students - and more onsharing of good practice and professional development amongst practitioners (interview,dep. head, School B5) and staff moving between schools (interview, asst head {CPD},School B4) .
21 ‘What’s New? Identifying Innovation Arising from Collaborative Schemes’, R. Glatter, F. Castle, D. Cooper, J.Evans, and P. A. Woods, Educational Management, Administration and Leadership, 33 (4): 381-399, 2005.
105
The first analysis of the student surveys indicated that Collegiate students were more likelyto indicate that they enjoy visits or activities with students from other schools and that theylearn more when students from other schools take part in activities. The significance andmeaning of these findings have yet to be assessed - in particular the degree to which theycan be related to DP activities in the areas.
Attainment: Quantitative analysis of GCSE results during the period of the study (2002 to2005) concentrated on the five non-special schools that founded the collegiate22. Theseschools, like those in Nisbet, improved as a group their GCSE performance relative to thenational trend. Four made significant progress in becoming more effective. Some of thisprogress is likely to have been the result of the collaborative activity of the Collegiate,though the degree and precise nature of the relationship is extremely difficult to determine.Specific support was given to schools with particular and pressing difficulties, in order toachieve their short-term goals for improvement. Other activities and strategies wereintended to benefit all schools through shared professional development, collectiveinitiatives for selected groups of pupils from collegiate schools, and so on.
Inclusion: Whilst support focused on the less advantaged students and reduction of theachievement gap between advantaged and disadvantaged students are not specific,explicit aims of the Collegiate, many of the initiatives arising from the collaborative areaimed at enhancing the opportunities of less advantaged students. These include thefollowing:
• The Pupil Fellowship Scheme (see above under ‘Curriculum Change’ in section on‘Provision’).
• The vocational strategy, started in September 2004, is aimed at providing hands-onstudy for students in danger of not attaining any qualifications (see above under‘Curriculum Change’ in section on ‘Provision’).
• The Collegiate has directed funds and support to schools (and in consequencestudents) in more difficult and deprived circumstances, such as schools B3, B4 andB5. A specific instance is the purchase of 25 laptops by the Collegiate for studentsat School B4 who do not have access to computing facilities at home.
• The special school takes part in all activities, including the vocational strategy, aswell benefiting in specific ways (e.g. higher level GCSE English being madeavailable for some of its students, which would not have been the case withoutcollaboration).
• The Collegiate funded the release of a teacher from School B5 (a boys’ school) towork one day a week on a Collegiate-wide initiative to address the issue of under-achieving boys (collegiate co-ord. interview, May 2005).
Other initiatives vary in their focus. For example, the Food Hygiene course was open to alland included ‘achievers’ as well as other students, whilst the Collegiate Sports Day wasaimed at ‘middling achievers’ who otherwise fall between initiatives designed for the ‘high’or ‘low’ achievers / disadvantaged students.
Deep Collaboration
The Byron Collegiate developed and sustained a strong degree of collaboration withidentifiable and beneficial consequences for schools, teachers and pupils. From time totime, in response to perceived needs of the collaborative and with the aim of enhancing itseffectiveness, the Collegiate engaged in serious collective reflection on its strategic visionand the make-up of the collegiate, which led to its rationalisation and important strategicdecisions. A culture of active professional collaboration and mutual support betweenschools was nurtured. There remain, however, challenges in its permeation to levels below
22 The special school had too few students with GCSE results to be included in the analysis.

106
senior management in some schools and in achieving the goals envisaged for a collegiate-wide electronic environment.
107
Tennyson
Background
Collaboration has been high on the agenda of the schools and local authority in this areafor some years. Diversity Pathfinders (DP) is one of several funded initiatives operatinghere that have involved collaboration. Other key examples include Excellence in Cities,Extended Schools Pathfinder, Leadership Incentive Grant and Sports England.
This background is important to understanding how the collaborative work started and howit has grown. A key goal of Diversity Pathfinders has been to bring coherence to thesemultiple projects and this can be seen in the examples of organisation and fundingarrangements. An important goal has been “tackling socio-economic disadvantage andnarrowing the gap in attainment between the highest and lowest performing schools.” Thespecific aims of DP as outlined in the project proposal submitted to the DfES were todevelop:
1. Capacity for collaboration - through joint strategic planning and developing specialismslinked to “robust systems for collaboration” so that all schools could draw from best practiceincluding provision of a virtual learning environment
2. Equal opportunity to learners to benefit from leading edge teaching and learningsupport “no matter where they live and which schools they attend”, increasing choice forstudents through greater curriculum diversity, and providing co-coordinated supportservices to remove barriers for learning;
3. Develop collaborative CPD and sharing best practice through promoting innovativeapproaches to teaching and learning and improving the quality of teaching and learning
4. Curriculum specialisms to allow high level curriculum expertise toflourish
This area officially joined the DP project in 2003, later than other project areas, whichjoined in 2002 and finished in 2005. Five schools were selected for sample sites forinterviews with students, headteachers and teachers and LA officers. Surveys wereadministered in 2003 and 2005 to a sample of students and staff.
ContextThere area is a geographically compact small unitary authority near a major city. It has atotal of eleven secondary schools all of which now have specialist status. There are six 11-18 schools, three 11-16 and two 13-18 in one area which has kept middle schools.
Overall this area scores high on deprivation indices following the decline of traditionalmanufacturing and heavy industry. There are also new build areas and pockets of relativeaffluence and new industries.
There is a high degree of innovation in meeting the needs of the area through partnershipwork and multiple sources of government funding have been used. There is a TrainingSchool, two Leading Edge Schools, two Extended Schools, a PFI school and a schoolseeking trust status. Unusually, there are two specialist sports colleges within a shortdistance with the rationale that this is appropriate to meet the social deprivation and healthneeds of the area. The development of new curriculum courses in engineering and sportscoaching can be seen as an outcome of the aim to develop vocational pathways.
All eleven schools are involved in collaborative work; some in small local clusters some inpairs, some in out of authority collaboration. Any attempt to draw a map all of the linkswould show many lines of the range of local and area wide partnerships includingimmediate neighbours and cluster schools and area-wide curriculum offers. There are
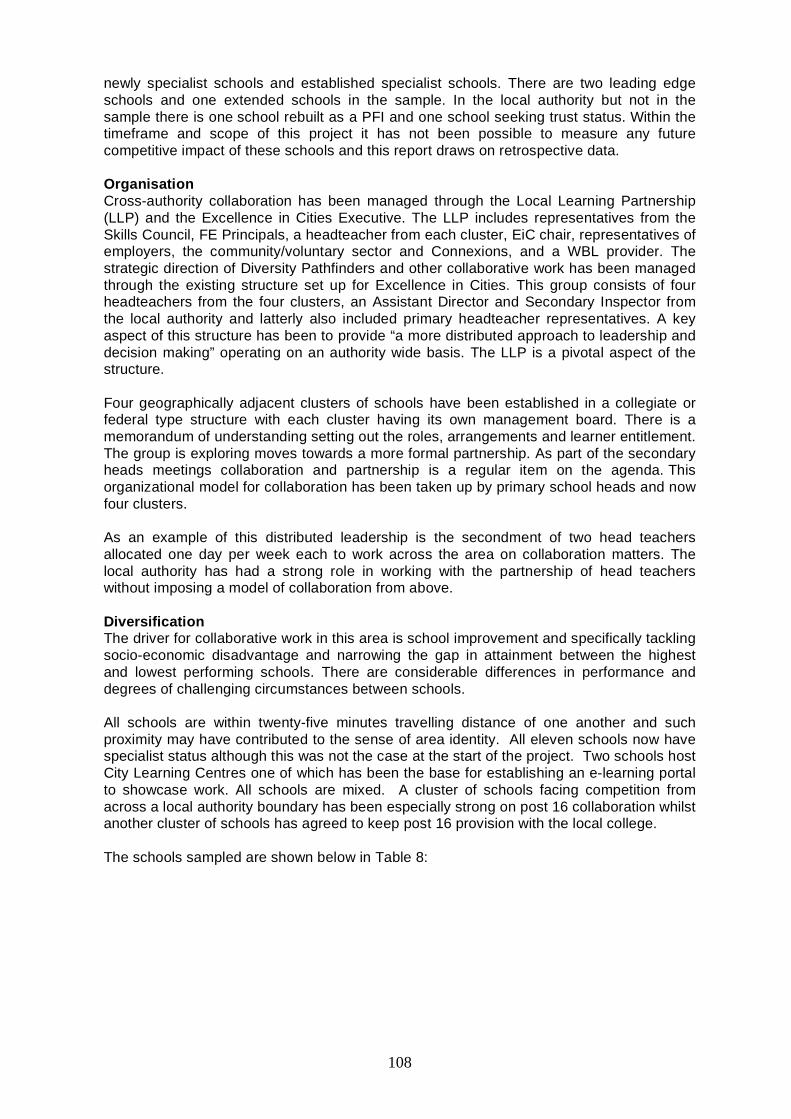
108
newly specialist schools and established specialist schools. There are two leading edgeschools and one extended schools in the sample. In the local authority but not in thesample there is one school rebuilt as a PFI and one school seeking trust status. Within thetimeframe and scope of this project it has not been possible to measure any futurecompetitive impact of these schools and this report draws on retrospective data.
OrganisationCross-authority collaboration has been managed through the Local Learning Partnership(LLP) and the Excellence in Cities Executive. The LLP includes representatives from theSkills Council, FE Principals, a headteacher from each cluster, EiC chair, representatives ofemployers, the community/voluntary sector and Connexions, and a WBL provider. Thestrategic direction of Diversity Pathfinders and other collaborative work has been managedthrough the existing structure set up for Excellence in Cities. This group consists of fourheadteachers from the four clusters, an Assistant Director and Secondary Inspector fromthe local authority and latterly also included primary headteacher representatives. A keyaspect of this structure has been to provide “a more distributed approach to leadership anddecision making” operating on an authority wide basis. The LLP is a pivotal aspect of thestructure.
Four geographically adjacent clusters of schools have been established in a collegiate orfederal type structure with each cluster having its own management board. There is amemorandum of understanding setting out the roles, arrangements and learner entitlement.The group is exploring moves towards a more formal partnership. As part of the secondaryheads meetings collaboration and partnership is a regular item on the agenda. Thisorganizational model for collaboration has been taken up by primary school heads and nowfour clusters.
As an example of this distributed leadership is the secondment of two head teachersallocated one day per week each to work across the area on collaboration matters. Thelocal authority has had a strong role in working with the partnership of head teacherswithout imposing a model of collaboration from above.
DiversificationThe driver for collaborative work in this area is school improvement and specifically tacklingsocio-economic disadvantage and narrowing the gap in attainment between the highestand lowest performing schools. There are considerable differences in performance anddegrees of challenging circumstances between schools.
All schools are within twenty-five minutes travelling distance of one another and suchproximity may have contributed to the sense of area identity. All eleven schools now havespecialist status although this was not the case at the start of the project. Two schools hostCity Learning Centres one of which has been the base for establishing an e-learning portalto showcase work. All schools are mixed. A cluster of schools facing competition fromacross a local authority boundary has been especially strong on post 16 collaboration whilstanother cluster of schools has agreed to keep post 16 provision with the local college.
The schools sampled are shown below in Table 8:
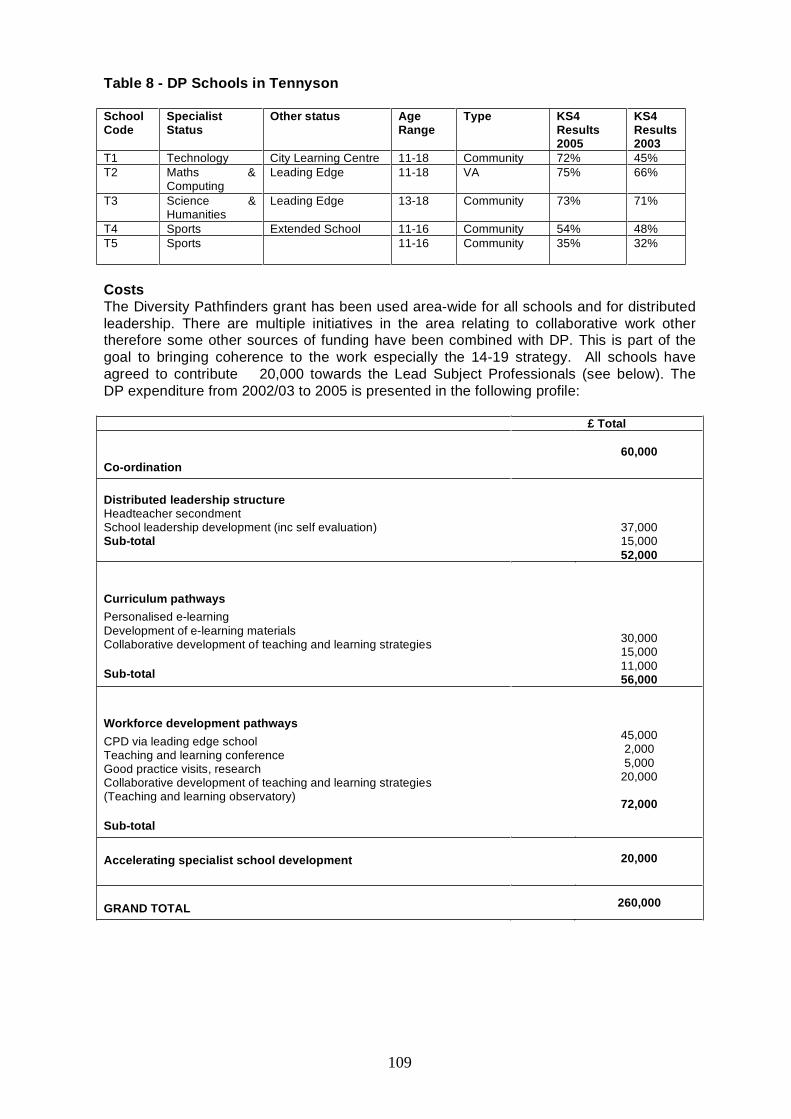
109
Table 8 - DP Schools in Tennyson
SchoolCode
SpecialistStatus
Other status AgeRange
Type KS4Results2005
KS4Results2003
T1 Technology City Learning Centre 11-18 Community 72% 45%T2 Maths &
ComputingLeading Edge 11-18 VA 75% 66%
T3 Science &Humanities
Leading Edge 13-18 Community 73% 71%
T4 Sports Extended School 11-16 Community 54% 48%T5 Sports 11-16 Community 35% 32%
CostsThe Diversity Pathfinders grant has been used area-wide for all schools and for distributedleadership. There are multiple initiatives in the area relating to collaborative work othertherefore some other sources of funding have been combined with DP. This is part of thegoal to bringing coherence to the work especially the 14-19 strategy. All schools haveagreed to contribute 20,000 towards the Lead Subject Professionals (see below). TheDP expenditure from 2002/03 to 2005 is presented in the following profile:
£ Total
Co-ordination60,000
Distributed leadership structureHeadteacher secondmentSchool leadership development (inc self evaluation)Sub-total
37,00015,00052,000
Curriculum pathwaysPersonalised e-learningDevelopment of e-learning materialsCollaborative development of teaching and learning strategies
Sub-total
30,00015,00011,00056,000
Workforce development pathwaysCPD via leading edge schoolTeaching and learning conferenceGood practice visits, researchCollaborative development of teaching and learning strategies(Teaching and learning observatory)
Sub-total
45,0002,0005,000
20,000
72,000
Accelerating specialist school development 20,000
GRAND TOTAL 260,000

110
Professional processesThere are extensive examples of collaborative professional development processes andmutual institutional support in this area. The themes of distributed leadership, of increasingcapacity and willingness to share data can be seen in the different examples.
The seconded head teachers have had a role in brokering support across the schools andwere clearly very credible in building up trust. An early example of sharing data occurredwhen all the head teachers reviewed the strengths and weaknesses of their schools in theform of a collaborative audit of departments across the area. This provided a starting pointfor identifying joint needs and was then used to plan area wide work impacting on teachingin local clusters and across the whole area. This sharing of data has continued and nowincludes financial data.
A significant recruitment initiative was the creation of four new senior posts called LeadSubject Professionals in September 2004. Their role has been to provide area wide supportat classroom level to improve teaching and learning according to school needs. Theappointments were made from high calibre teachers, most of whom were already workingas Advanced Skills Teachers in supporting colleagues. Unlike Advanced Skills Teachersthey would not be based in one home school with only 20% outreach, but under this modeltheir home school would change every half term and they would spend time meetingtogether as a group. The schools provided money for the salaries and their posts arepermanent. They are responsible to the seconded head teachers and senior schoolsinspector and spend one day per week meeting as a group. They represent four coresubjects and also work across-disciplines by organizing training and working with localauthority strategy consultants. Comments from schools include: “made a lasting andpositive impact on the department…..expertise and experience has greatly influenced ourthinking….An invaluable input. Challenging at the same time as realistic. Understands lifeat the chalk face.”
A local model for a training course for aspirant head teachers has been developed as avariation on the National Professional Qualification for Headship. This includes shadowingand residential sessions. Several local head teachers have trained to become SchoolImprovement Partners and this is seen as helpful professional development.
Area wide curriculum network meetings have been popular and especially in Maths.Sessions are run by heads of department and teachers for other teachers and replace anearlier model run by Local Authority advisors for department heads.
An area wide virtual learning forum was established with the aim of linking all secondaryschools and in conjunction with the colleges and work-based learning providers. The aimwas to showcase work for employers and parents and to provide homework information forstudents. Like other Diversity Pathfinder areas, the take up by teachers and development ofpooled materials was somewhat slower than anticipated. There are, however, pockets ofenthusiasm and good practice being developed at school level including some humanitieswork.
ProvisionOpportunities for student enrichment can be seen in examples of new provision arisingfrom collaboration. An area wide science booster course was held at the local CLC withseveral hundred year 11 students from across the area taking part in inter-activeworkshops focused on developing course work. This was organized by all the sciencedepartments and was repeated with different groups of pupils over a two-year period. Anarea-wide dance festival involved many of the local schools and was linked to a GCSEDance. Area-wide Gifted and Talented programmes have included visits and workshops forall pupils and some master classes with primary schools. The two Sports Colleges are partof the national School Sports Partnership Programme and acting together they havedelivered sports co-coordinator primary link teachers in all primary secondary and special
111
schools in the borough ahead of target dates and this reflects the importance in the visionof responding to social and health needs in an area of deprivation.
Changes in curriculum provision can be seen at local cluster level through joint work. Forexample, two sports colleges have developed an apprenticeship in Sports Managementand Leading Coaching. Schools and a Primary Healthcare Trust are piloting a vocationalcourse linked to the local need for swimming pool attendants with year 10 students.Schools in one cluster are offering vocational or applied GCSEs with 70% of the teachingtaking place at the local FE college. The courses are Business, Health and Social Care andEngineering. Students have to commit to staying later in the day than the school timetable.Students interviewed said they liked being treated as adults at the college and the practicalnature of the work. However teachers were more likely to prefer to keep the students atschool in order to control the teaching whilst acknowledging the more extensive facilitiesavailable through the FE provider.
The chief method for developing the diversity of provision is through collaborative CPD andsharing of staff. An important feature is that the collaborative professional developmenthas developed not according to a standard or centralized model but has had ownership bythe different schools. For example, one cluster of three secondary schools synchronizedtheir timetables for an early finish in order to hold a monthly collaborative CPD twilightsession. This has been held in each school in turn with the emphasis on staff of all levels ofexperience sharing practical teaching strategies. It started in one school as an optionaltwilight session related to 14-19 courses but has now become a part of the timetable for allstaff and is its second year of operation. Through a Leading Edge partnership, twoneighbouring schools have been involved in visiting each other’s classrooms and providingsupport and resources, holding joint staff development with sessions run by both schools.
Summary of InnovationsThis area is interesting because of the range of collaboration at different levels includingpairs of schools, area clusters and authority wide activity. The penetration of thepartnership work can be seen through the increased opportunities for teachers to supportone another across schools. Comments from a partner school’s teacher include: “This isnot an action plan. This is action.” The teacher-to-teacher professional development inclassrooms and through teachers leading sessions has been well received because it givesteachers something they can use immediately. The work of the lead professional teachershas become more oriented towards strategic and capacity building including work at headsof department level as well as work with individual teachers.
Educational EffectsReported examples of educational effects include: improved science GCSE resultsfollowing the booster workshops across the area. The development of vocational courses isbeing linked to post 16 staying on rates. In one school a Humanities teacher who hasdeveloped a homework site on the intranet claims that it is having a motivational effect onstudents and a higher completion rate. It should be noted that this area joined the projectlater than other DP areas.
Impacts on Learning and AchievementAll the schools in this authority were involved in collaborative work and aware of the gapsbetween schools. This local authority joined the DP study later than the other localauthorities and this should be kept in mind when looking at the quantitative findingsreported in this study. By the tests reported here, Tennyson as a whole did not improveeffectiveness more than the national trend during the period. Looking at the five case studyschools individually, one school’s performance is seen to have declined during the periodwith the others unchanged or improved. The faith school in the sample scored the higheston all measures of improvement and another case study school improved significantlyespecially in Maths.
112
Deep CollaborationCollaboration in this area has become a part of the way of working for headteachers and tosome teachers below this level. The post-16 movement of students is well established butyounger students in years 10 and 11 may also experience support from teachers outsidetheir home school or attend cross-school events or work in local FE colleges for somecourses.
A key feature has been ownership of the collaborative work by schools. Another featurehas been the distributed leadership and the full support of the local authority. There hasbeen increasing involvement primary schools in the collaboration work although this hasevolved rather than being imposed. See for example the outreach work of the two sportsColleges in establishing extensive primary link teachers.
A further example of deep collaboration can be seen in the commitment to mutualinstitutional support and the recognized need for flexibility. According to one headteacher:“Much of the work is about relationships. A lot of the process is done through talking topeople. We’ve done it rather than write it.” There has been flexibility in solving the issue ofhigh demand for support from the Lead Subject Professionals, which has grown more thantheir availability. Decisions about where to give priority - at one stage the priority was to aschool with notice to improve - has involved recognition that not all schools will receive thesame amount of support supply and negotiations have taken place with priority going to aschool under notice to improve. Therefore not all schools received equal input. The schoolcontribution to funding for the Lead Subject Professionals in 2006 has been negotiated on aproportional basis according to the extent that other grants are available
The area can now be seen to be at a critical point in terms of the collaboration becomingembedded for example in strategic moves towards more formalized collaboration underdiscussion in 2006. According to a local authority officer “the idea behind formalizing thepartnership is we want to be more than a loose group of personalities working together.”Similarly the headteachers in this area see collaboration as the most important driver forschool improvement.

113
APPENDIX B
Research Instruments
1. Initial Interview with headteacher2. Head of Department Proforma3. DP Interviews 2005 - Headteacher example4. Student Questionnaire

114
Initial interview with headteacher
BACKGROUND INFORMATION ONTHE SCHOOLCan you tell me something about theschool and its pupils?
• Size• Buildings and catchment• Age range• Characteristics of pupil
population• Strengths of the school
Any particular challenges the schoolfaces?
SPECIALIST STATUS
(If school is a specialist school)• What is specialism?• Why was this specialism chosen?• How long has school been a specialist school?• What difference has it made to the school?
(If school is in bidding process)• What specialism are you bidding for?• Why was this specialism chosen?• What difference will it make to the school?
(If school is not bidding at the moment)• Why are you currently not bidding?• Are you planning to bid in the future?• If yes, what specialism will you bid for?
If no, why not?What difference will this make to the school?
To what extent is collaboration with other schools afeature of your bid?
HOW IS DP CURRENTLYOPERATING?
• Details of any meetings/conferences/events around DP thatyou have attended?
• Have there been any formaloutcomes or agreements arising fromDP? Can you give me details ofthese?
• How much time do you spend on DPactivities?
How much funding do you have in yourbudget from the LEA for DP?
FUTURE DEVELOPMENTS
• How do you see DP developingover the next 2 to 3 years?
• What do you think the benefits ofDP are likely to be?
• Are there any disadvantages thatyou can foresee fromimplementing DP?
• What will be the main challengesin getting collaboration off theground and then sustaining it?
Have there been any impacts on yourschool, its staff or its pupils because ofDiversity Pathfinders?
COMPETITIVE/COLLABORATIVERELATIONSHIPS
• Are you currently in competition withother schools for pupils? If yes, whichones?
• Which schools do you currentlycollaborate with?
• For what purposes do you collaborate?Details of current collaborations/ collaborativeactivities? Who is involved?Has there been a change in the amount or natureof collaboration over the last 2 or 3 years? If yes,in what ways?
SCHOOL ORGANISATION
How is the school organised for teaching andadministration?
• Faculties• House system• Pupil groupings (setting, streaming,
banding etc).• Specialist groups (i.e. G&T or SEN)
Are any of these likely to change as a result ofDP?
KNOWLEDGE OF/ INVOLVEMENT IN DP
• What is your understanding of the aimsof the DP project?
• How did you hear about DP?• What were your initial reactions to the
DP idea?• How is it progressing from your point of
view?• What are your expectations of the
impacts of DP– for pupils?– for staff?
For the school as a whole?
115
Dear Colleague,
Evaluation of Diversity Pathfinders Project
We are very pleased that your school has agreed to participate in the Diversity Pathfinders evaluation. As part of the evaluation, weare attempting to cost the time involved in collaboration between schools.
We are writing to ask if you would help us with this by filling in the attached pro forma with reference to any collaborativeactivities which are part of the local Diversity Pathfinders initiative you or members of your department have been involved induring the past term (Summer 2003). We are asking all Heads of Department in your school, as well as the SENCOs and ICT co-ordinator, to do this.
We realise that it is not always possible to accurately assess what time has been spent on particular activities, but hope that you will be able togive us some indication of the time you and/or your staff have spent on collaborative activities as a result of the Diversity Pathfinders initiative.We are aware that your project may be at an early stage and that, at this point in time, there may not be too much data to enter in the pro formawhich relates to Diversity Pathfinder. However, its completion in 2003 will provide us with a base-line with which future data can be compared.Future pro formas will be distributed at the end of the following terms:
o Spring 2005o Summer 2005
We would be grateful if you would fill in the attached pro forma as fully as possible. It should be returned to your Headteacher in theenvelope supplied in order that it can be returned to the research team by 19th December. If you have any queries, please do nothesitate to contact Jennifer Evans at the Institute of Education (tel: 020 7612 6418, e-mail [email protected]).
Replies are strictly confidential to the research team and will only be used for research purposes.
116
Thank you very much for your help.
Diversity Pathfinder (DP) Evaluation
……………………………..School, …………………………… LEA, ……………………………. department.
Completed by ……………… ………………….. (Head of department/SENCO/ICT Co-ordinator)
Please complete this for your department.
Period: Spring term 2003
1) During the Summer term 2003, has your department been associated with any collaborative activities which are part of the localDiversity Pathfinders initiative?
YES / NO(Delete as appropriate)
2) If yes, please answer the questions on the next page for each of the activities that apply.
NB. ‘DP secondary schools’ in the questions overleaf means all the secondary schools in Nesbit
Contact Jennifer Evans (phone, email) if you have any questions.Please return to Jennifer Evans, Institute of Education, 59 Gordon Square, London WC1H 0AL

117
Activities which are part of the local DiversityPathfinders initiative:
Number ofteachersinvolved
Number ofevents/occasions
*Total numberof teacherhours
Number ofstudentsinvolved
**Contribution toteaching and learning inthis school
Meetings with staff from other DP secondaryschools to organise DP activities/undertake DP-related administrationProfessional development shared with other DPsecondary schoolsTeachers from your department going out to teachin other DP secondary schoolsTeachers coming into your department from otherDP secondary schools to teach classesTeachers from your department going to other DPsecondary schools to consult/adviseTeachers coming in from other DP secondaryschools to consult/advise in your departmentStudents from classes in your department going tolessons in other DP secondary schoolsStudents coming in to lessons in your departmentfrom other DP secondary schoolsOther collaborative activities with DP secondaryschools. Please specify:
* Include travel time**Code the current contribution of this activity to improving teaching and learning in your department0 = no contribution, 1 = a little contribution, 2 = moderate contribution, 3 = major contribution
Thank you for completing the proforma.
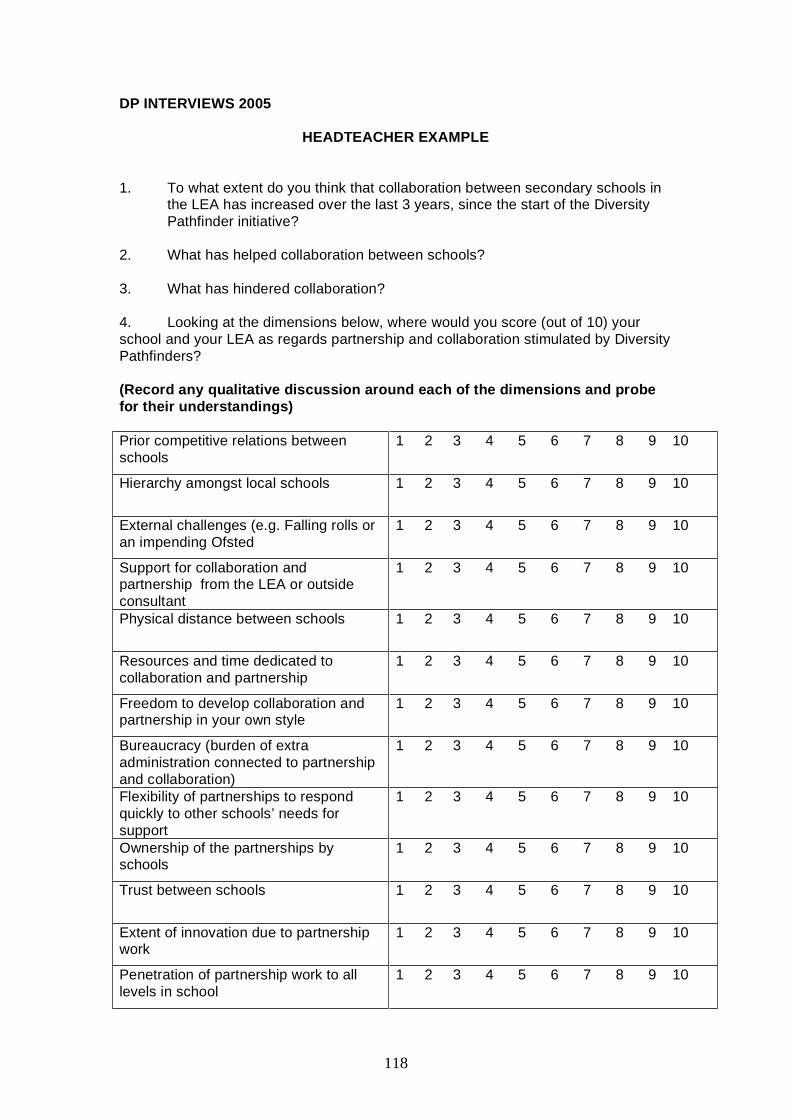
118
DP INTERVIEWS 2005
HEADTEACHER EXAMPLE
1. To what extent do you think that collaboration between secondary schools inthe LEA has increased over the last 3 years, since the start of the DiversityPathfinder initiative?
2. What has helped collaboration between schools?
3. What has hindered collaboration?
4. Looking at the dimensions below, where would you score (out of 10) yourschool and your LEA as regards partnership and collaboration stimulated by DiversityPathfinders?
(Record any qualitative discussion around each of the dimensions and probefor their understandings)
Prior competitive relations betweenschools
1 2 3 4 5 6 7 8 9 10
Hierarchy amongst local schools 1 2 3 4 5 6 7 8 9 10
External challenges (e.g. Falling rolls oran impending Ofsted
1 2 3 4 5 6 7 8 9 10
Support for collaboration andpartnership from the LEA or outsideconsultant
1 2 3 4 5 6 7 8 9 10
Physical distance between schools 1 2 3 4 5 6 7 8 9 10
Resources and time dedicated tocollaboration and partnership
1 2 3 4 5 6 7 8 9 10
Freedom to develop collaboration andpartnership in your own style
1 2 3 4 5 6 7 8 9 10
Bureaucracy (burden of extraadministration connected to partnershipand collaboration)
1 2 3 4 5 6 7 8 9 10
Flexibility of partnerships to respondquickly to other schools’ needs forsupport
1 2 3 4 5 6 7 8 9 10
Ownership of the partnerships byschools
1 2 3 4 5 6 7 8 9 10
Trust between schools 1 2 3 4 5 6 7 8 9 10
Extent of innovation due to partnershipwork
1 2 3 4 5 6 7 8 9 10
Penetration of partnership work to alllevels in school
1 2 3 4 5 6 7 8 9 10
119
5. Overall, do you think that collaboration and partnership has been of benefit foryour school? If so, in what ways (probe for issues such as staff development,recruitment and retention, curriculum development, school status, pupil satisfaction,pupil enrolment, quality of teaching and learning, exam results).
6. Have there been any negative consequences or drawbacks to collaborationas far as your school is concerned? (Probe for resource and time implications,poaching of staff, exposure of school to negative publicity etc)
7. Has Diversity Pathfinder, as an initiative been the chief stimulus forcollaboration, or are there other policies which have been more influential in thisway?
8. Which aspects of the Nisbet Diversity Pathfinder have been most beneficial toyour school (score out of 10):
• Network of Effective Practice• Support for gaining specialist status• The Website• Heads meetings to discuss partnership work• Cultural Harmony and pupil involvement• Link co-ordinators• Subject network meetings

120
STUDENT QUESTIONNAIRE AND ACCOMPANYING LETTER23
Dear Student,
We are carrying out this survey to find out what students think about the subjects they aretaking in Year 11 and the way the subjects are taught. If you fill in the questionnaire, youwill be entered into a prize draw to win £25 in record tokens.
Please fill in the code number you have been given. This will help us to make sure all thestudents chosen for the survey will have a chance to win the prize.
The answers you give will be not be seen by anyone at your school. They will only beused by the research team.
The questionnaire asks about the subjects you are studying this year and how they aretaught. It also asks for your views about school life in general.
Please answer only for those subjects you are studying.
If you are not studying a subject, please skip those questions and go to the next screen.
Thanks very much for your help.
The research team
23 The questionnaire was completed on-line
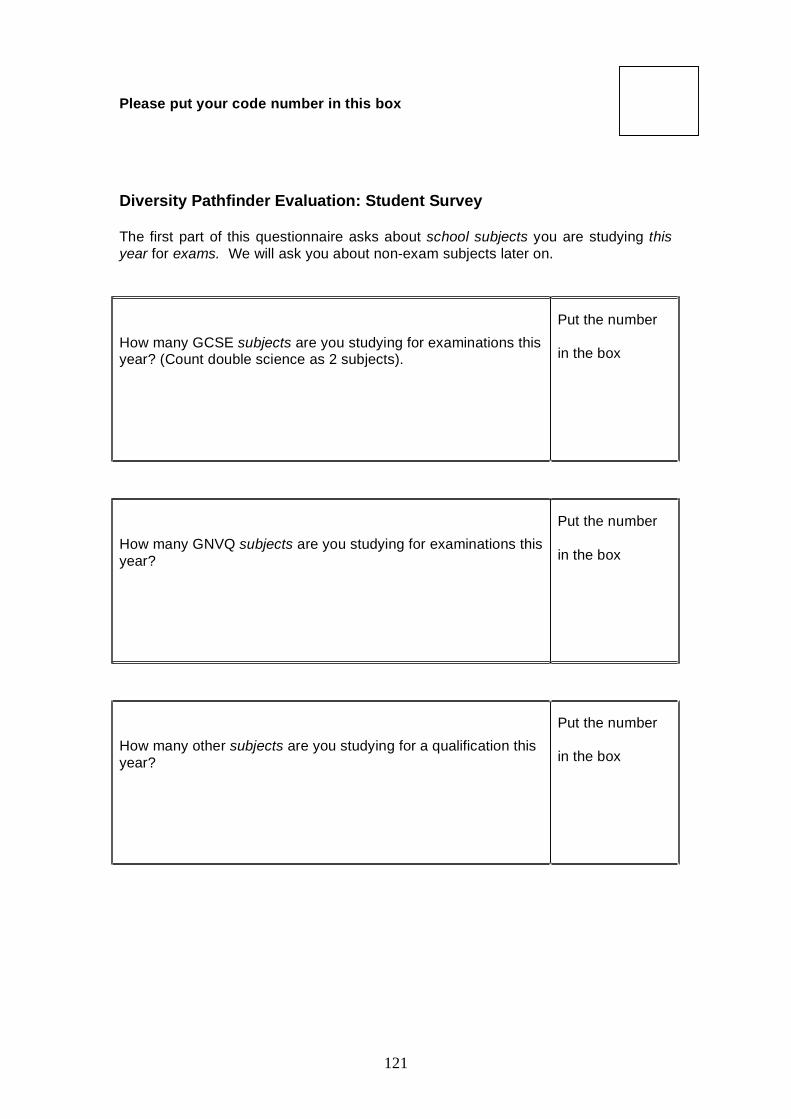
121
Please put your code number in this box
Diversity Pathfinder Evaluation: Student Survey
The first part of this questionnaire asks about school subjects you are studying thisyear for exams. We will ask you about non-exam subjects later on.
How many GCSE subjects are you studying for examinations thisyear? (Count double science as 2 subjects).
Put the number
in the box
How many GNVQ subjects are you studying for examinations thisyear?
Put the number
in the box
How many other subjects are you studying for a qualification thisyear?
Put the number
in the box
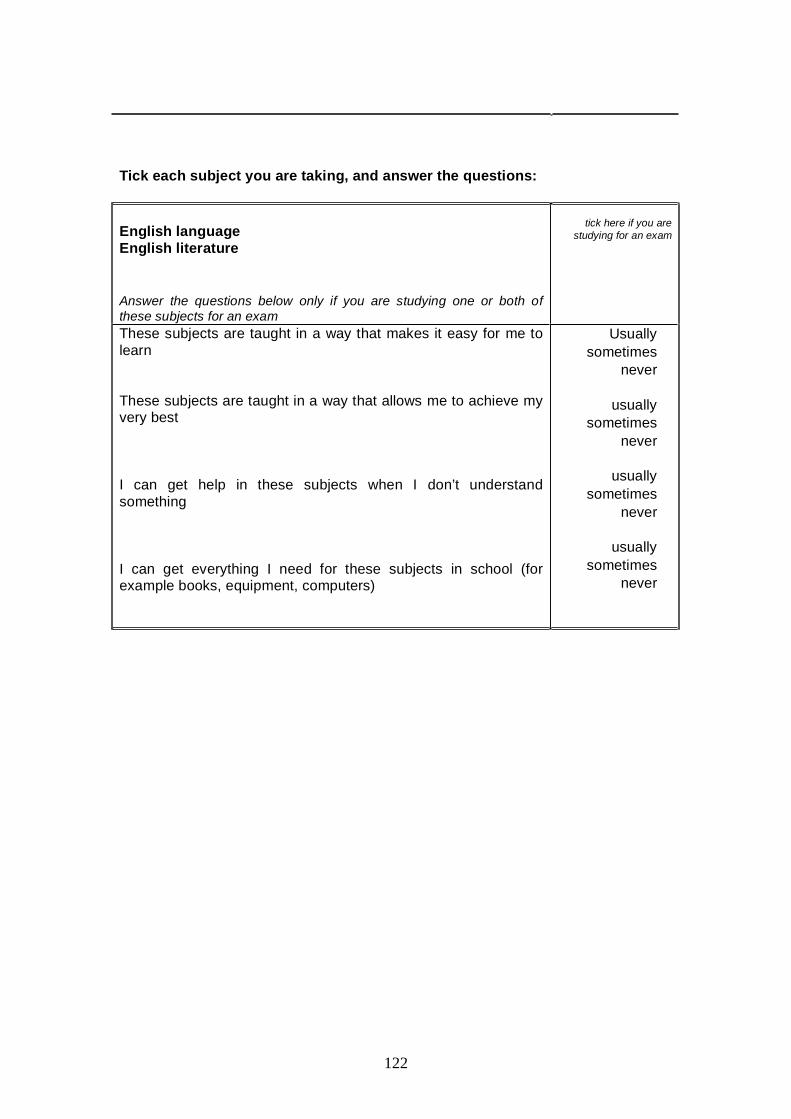
122
Tick each subject you are taking, and answer the questions:
English languageEnglish literature
Answer the questions below only if you are studying one or both ofthese subjects for an exam
tick here if you arestudying for an exam
These subjects are taught in a way that makes it easy for me tolearn
These subjects are taught in a way that allows me to achieve myvery best
I can get help in these subjects when I don’t understandsomething
I can get everything I need for these subjects in school (forexample books, equipment, computers)
Usuallysometimes
never
usuallysometimes
never
usuallysometimes
never
usuallysometimes
never
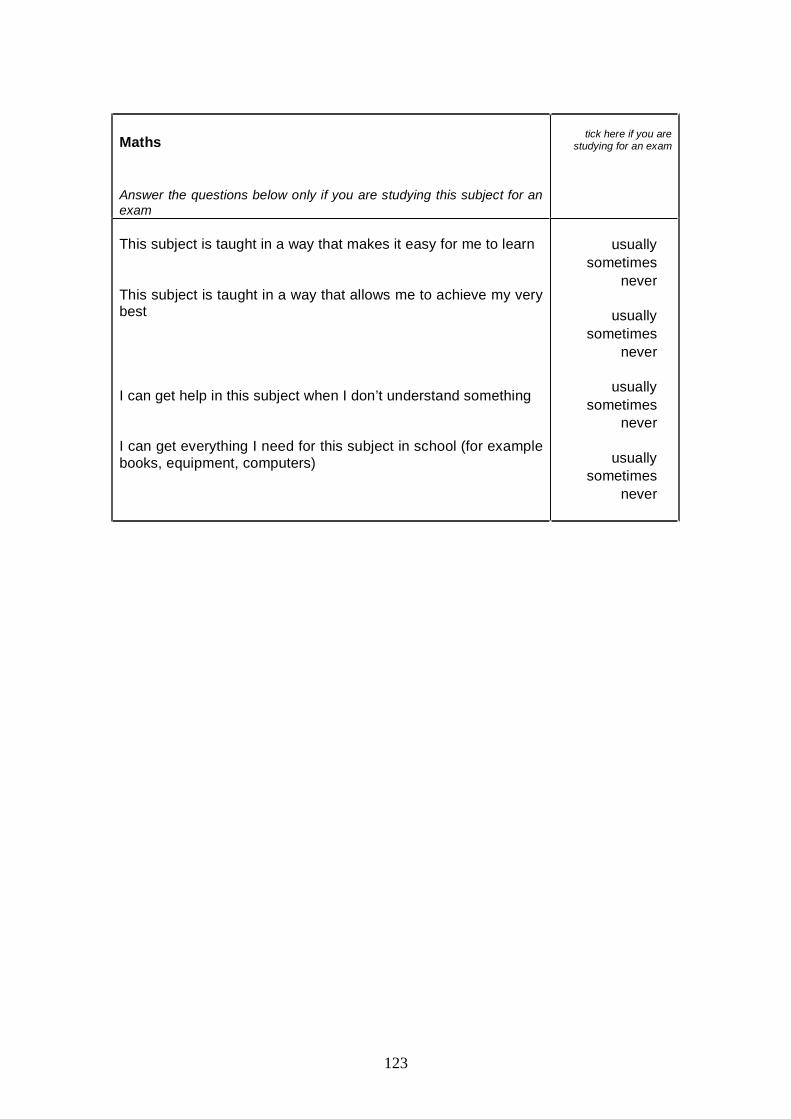
123
Maths
Answer the questions below only if you are studying this subject for anexam
tick here if you arestudying for an exam
This subject is taught in a way that makes it easy for me to learn
This subject is taught in a way that allows me to achieve my verybest
I can get help in this subject when I don’t understand something
I can get everything I need for this subject in school (for examplebooks, equipment, computers)
usuallysometimes
never
usuallysometimes
never
usuallysometimes
never
usuallysometimes
never
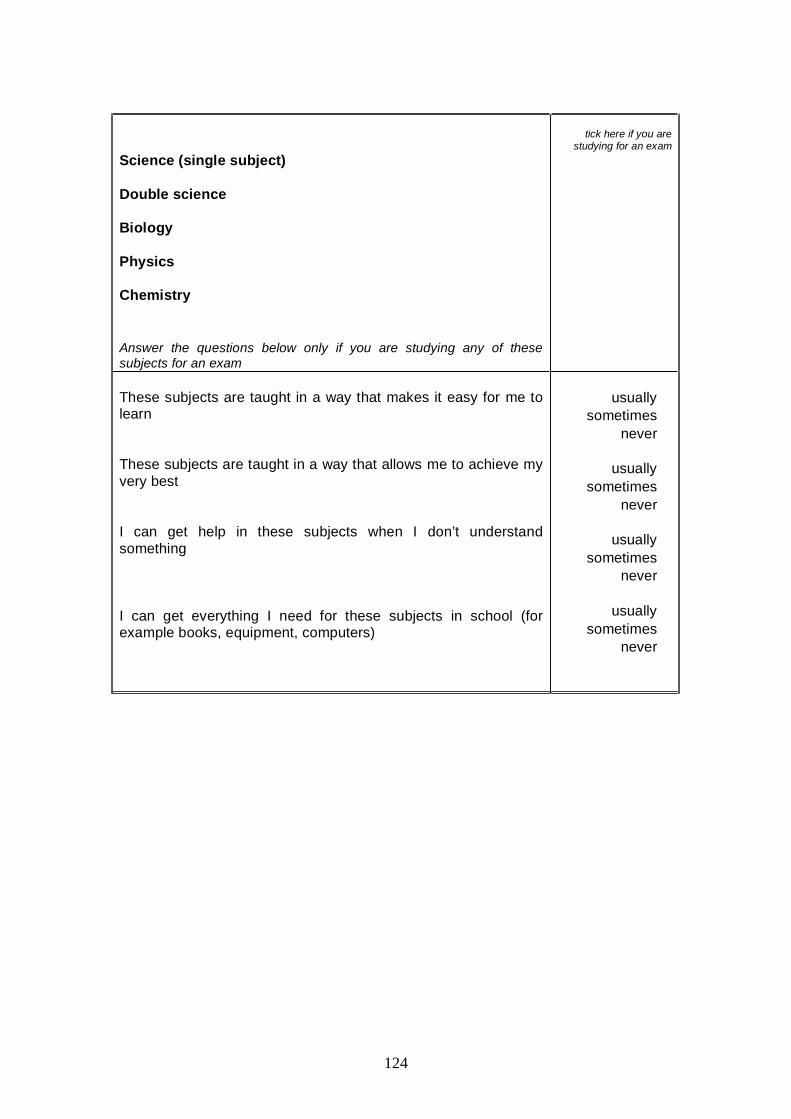
124
Science (single subject)
Double science
Biology
Physics
Chemistry
Answer the questions below only if you are studying any of thesesubjects for an exam
tick here if you arestudying for an exam
These subjects are taught in a way that makes it easy for me tolearn
These subjects are taught in a way that allows me to achieve myvery best
I can get help in these subjects when I don’t understandsomething
I can get everything I need for these subjects in school (forexample books, equipment, computers)
usuallysometimes
never
usuallysometimes
never
usuallysometimes
never
usuallysometimes
never
125
Design and technology
Food technology
Answer the questions below only if you are studying either of thesesubjects for an exam
tick here if you arestudying for an exam
These subjects are taught in a way that makes it easy for me tolearn
I can get help in these subjects when I don’t understandsomething
These subjects are taught in a way that allows me to achieve myvery best
I can get everything I need for these subjects in school (forexample books, equipment, computers)
usuallysometimes
never
usuallysometimes
never
usuallysometimes
never
usuallysometimes
never

126
Other languages
FrenchGermanSpanishOther language
Community or home language
Latin/Greek/Classical studies
Answer the questions below if you are studying any of these subjects for an exam
tick here if you arestudying for an exam
These subjects are taught in a way that makes it easy for me tolearn
I can get help in these subjects when I don’t understandsomething
These subjects are taught in a way that allows me to achieve myvery best
I can get everything I need for these subjects in school (forexample books, equipment, computers)
usuallysometimes
never
usuallysometimes
never
usuallysometimes
never
usuallysometimes
never
127
ICT
Answer the questions below if you are studying this subject for an exam
tick here if you arestudying for an exam
This subject is taught in a way that makes it easy for me to learn
I can get help in this subject when I don’t understand something
This subject is taught in a way that allows me to achieve my verybest
I can get everything I need for this subject in school (for examplebooks, equipment, computers)
usuallysometimes
never
usuallysometimes
never
usuallysometimes
never
usuallysometimes
never
128
History
Geography
RE
Answer the questions below if you are studying any of these subjects for an exam
tick here if you arestudying for an exam
These subjects are taught in a way that makes it easy for me tolearn
I can get help in these subjects when I don’t understandsomething
These subjects are taught in a way that allows me to achieve myvery best
I can get everything I need for these subjects in school (forexample books, equipment, computers)
usuallysometimes
never
usuallysometimes
never
usuallysometimes
never
usuallysometimes
never

129
Business studies
Economics
Answer the questions below if you are studying one or both of these subjects for an exam
tick here if you arestudying for an exam
These subjects are taught in a way that makes it easy for me tolearn
I can get help in these subjects when I don’t understandsomething
These subjects are taught in a way that allows me to achieve myvery best
I can get everything I need for these subjects in school (forexample books, equipment, computers)
usuallysometimes
never
usuallysometimes
never
usuallysometimes
never
usuallysometimes
never
130
PE and Sport
Answer the questions below if you are studying one or both of these subjects for an exam
tick here if you arestudying for an exam
These subjects are taught in a way that makes it easy for me tolearn
I can get help in these subjects when I don’t understandsomething
These subjects are taught in a way that allows me to achieve myvery best
I can get everything I need for these subjects in school (forexample books, equipment, computers)
usuallysometimes
never
usuallysometimes
never
usuallysometimes
never
usuallysometimes
never
131
Music
Drama
Dance
Answer the questions below if you are studying any of these subjects for an exam
tick here if you arestudying for an exam
These subjects are taught in a way that makes it easy for me tolearn
I can get help in these subjects when I don’t understandsomething
These subjects are taught in a way that allows me to achieve myvery best
I can get everything I need for these subjects in school (forexample books, equipment, computers)
usuallysometimes
never
usuallysometimes
never
usuallysometimes
never
usuallysometimes
never

132
Social Science
Sociology
Answer the questions below if you are studying one or both of these subjects for an exam
tick here if you arestudying for an exam
These subjects are taught in a way that makes it easy for me tolearn
I can get help in these subjects when I don’t understandsomething
These subjects are taught in a way that allows me to achieve myvery best
I can get everything I need for these subjects in school (forexample books, equipment, computers)
usuallysometimes
never
usuallysometimes
never
usuallysometimes
never
usuallysometimes
never
133
Vocational courses (GNVQs)
Applied Art and DesignApplied BusinessEngineeringHealth and Social CareApplied ICTLeisure and TourismManufacturingApplied Science
Answer the questions below if you are studying any of these subjects for an exam
tick here if you arestudying for an exam
These subjects are taught in a way that makes it easy for me tolearn
I can get help in these subjects when I don’t understandsomething
These subjects are taught in a way that allows me to achieve myvery best
I can get everything I need for these subjects in school (forexample books, equipment, computers)
usuallysometimes
never
usuallysometimes
never
usuallysometimes
never
usuallysometimes
never

134
Next, please tick all your non-exam subjects.
Non-exam courses
PSHECitizenshipRECareersPE and sportKey skillsICT
Other subject
tick here if these arenon-exam subjects
please write the nameof the subject here

135
Option choices
Thinking back to making your option choices in year 9:
Were you able to take all the subjects you wanted in year 10? yesno
If not: what subject(s) were you not able to take?
why?
because it wasn’t available in the option scheme
because I wasn’t good enough at the subject inyear 9
because they clashed with other subjects I wanted to take
I don’t know why
Were there any subjects you would have like to have taken thatwere not available at this school?
If yes: write the subject name(s) here
write the subject
name(s) here
tick all the reasons thatapply
yesno
write the subject
name(s) here

136
About your school:
The next section asks about your school:
Decide on your answer and tick in the column
StronglyAgree
Agree Not Sure Disagree Stronglydisagree
My teachers encourage me to work hard
Most of the lessons can’t end soon enoughfor me
This school is a good school
Using computers in the lesson makes thework more interesting
Most of the time I do not want to go toschool
Most of the teachers seem to enjoyteaching us
The students here encourage each other inlessons
Most of the teachers here are respected bythe students
School work here is dull and boring
There are lots of activities to take part in atlunchtime or after school
Certain students in class are favoured bymy teachers more than the rest
I really like school
In class, I enjoy working in groups withother students

137
StronglyAgree
Agree Not Sure Disagree Stronglydisagree
Most teachers use a variety of ways ofteaching to help us understand and learn
Using computers in the lessons helps me tolearn more easily
Teachers always notice when I work hard
Other students make fun of people whowork hard
Teachers always try to get the best out ofstudents
Other students make my life miserable
This school has good facilities (for sport,art, technology etc)
This school is well equipped (books,computers, for science and technology etc)
If I have a problem I can talk to a teacherabout it
I have a mentor or tutor who is verysupportive
If I am worried about my work I can talk to ateacher
This school has high standardsWhat I learn at school will be useful to mein my adult life
This school gives students enoughopportunities to work with other schools
I think it is a good for our learning forstudents to from different schools to worktogether

138
Learning elsewhere:
This section asks you about learning with students from other schools, and about theopportunities you have to learn elsewhere.
Please answer every question:
Since the beginning of year 10 have you:
• Had any lessons in your school with studentsfrom another school?
yes, three times or moreyes, once or twiceno
• Gone to another school or college for any ofyour lessons?
yes, three times or moreyes, once or twiceno
• Been to another school or college to use theirequipment or facilities?
yes, three times or moreyes, once or twiceno
• Worked with students from another school usinga computer or video link?
yes, three times or moreyes, once or twiceno
Is working with students from other schools helpful toyour learning?
usuallysometimesnever
I haven’t worked with studentsfrom other schools

139
Since the beginning of year 10 have you:
Been out of school on a school visit, journey or ‘fieldtrip’ as part of your studies?
yesno
If yes, have any of these been with students from otherschools?
yesno
no out ofschool visits
Do you take part regularly (at least once a month) in any extraactivities in the lunchtime or after school?
yesno
• Are any of these activities with students from otherschools?
yesno
no extra activities
• Do you enjoy visits or activities with students from otherschools?
yesno
no students fromother schools
• Do you learn more when students from other schoolstake part?
yesno
no students fromother schools
• Are there any opportunities for learning you would likethat the school doesn’t currently provide?
If yes, please write here what they are:
yesno

140
Plans at the end of year 11
The next section asks about your plans for the future.
What do you plan to do at the end of year11?
leave school and get a job
leave school, get a job, and go to collegepart time
go to college full time
stay in the 6th form at this school
go to the 6th form of another school
not sure yet
Do you hope to go to university? yesno
not sure yet
Thank you for taking part in this survey.
142
IntroductionThe aim of this report is to present evidence on the impact of the DiversityPathfinders (DP) project with respect to:
(a) The diversity of curriculum choice experienced by students, including theirability to choose subjects that they wish to study at GCSE/GNVQ;
(b) students’ general satisfaction with teaching and with school;
(c) students’ attitudes to continuing in post-16 education;
(d) students’ experiences of working with students from other schools;
(e) exclusion issues in terms of differences in the reported experiences ofstudents of different ability, gender, ethnicity and household income.
Data on these aspects of students’ experiences were collected by means of a surveyof Year 11 students in 2002/3 in the DP case-study schools, which was repeated withanother cohort of Year 11 students in 2005/6. The purpose of the survey is tocompare students’ responses at the start of DP implementation in 2002 with thoseafter three years of collaborative activity. In order to monitor changes that may bebrought about by DP activity in the DP schools, the evaluation sets out first toestablish a base-line for the diversity of curriculum provision and the extent of schoolcollaboration at the start of the project and then to monitor how these changed overtime. We employ pre-test/post-test approach to this evaluation because DP is not apre-determined ‘treatment’, which is uniformly applied to the selected schools and notto others. The crucial feature of DP is that it is Pathfinding - the different schoolpartnerships are finding their own paths to collaboration and diversity. It is also thecase that many non-DP schools are working to collaborate and diversify, though notgiven the specific boost of the DP project. The nature of the DP policy means that acontrol group of schools could not be established for comparison with DP schools.
In both 2002/3 and 2005/6 all 31 DP case-study schools24 were asked to select amixed ability form group of around 30 students to participate in the survey, which wascompleted on-line. In 2002/3 624 Year 11 students in 26 Diversity Pathfinder schoolsresponded.
This was followed up by a survey of Year 11 in 2005/6, which had a lower responserate of 261 students in 13 of the Diversity Pathfinder case study schools, which isequivalent to around 42% of the original sample collected in 2002/3. The lowerresponse rate in 2005/6 was disappointing and occurred despite several approachesto non-responding schools. A factor explaining this may have been that after 3 yearsof hosting researchers the schools were suffering from research fatigue. Possiblyschools less engaged with DP were less inclined to respond - for example no schoolsfrom Hardy responded in 2005/6. However, it is unlikely that the lower response ratein 2005/6 has biased the results against finding improved perceptions by students in2005/6 compared to students in 2002/3. There is no statistically significant differencein average prior attainment at KS3 or in the mean proportions of students eligible forfree school meals or of black ethnicity. If anything one would expect that moreengaged schools would bother to respond to the second survey and this might biasthe results in favour of finding a positive change in student perceptions.
24 A special school was included in the survey but could not be included in the analysisbecause of insufficient numbers of students in the National Pupil Database.

143
Estimation modelIn order to test whether there is a statistically significant difference in students’satisfaction towards school between the two surveyed years (2002/3 and 2005/6), weset up our basic model as follows:
,00''
10 ijjjijijij euSCXTS +++++= (1)
where ijS denotes satisfaction number or level for student i in DP school j, T is the
time dummy (2002/3 = 0, 2005/6 = 1), the parameter 1 captures the time-trendeffect, ijX is a vector of individual characteristics, including:
gender (boy = 0, girl = 1)
free school meal eligibility (FSM = 1, not FSM = 0)
ethnicity (coded as white, black (African and Caribbean) or Indian sub-continent)25 (i.e. black = 1, not = 0) (Indian subcontinent = 1, not = 0)
mother tongue English (1) or not (0)
Special Educational Needs (SEN) (rated 1-5 on the old code): two alternativemeasures for SEN were tested:
SENANY (coded 0 or 1 for any SEN code from 1 to 5)SENSTAT (statemented or waiting statement coded 1 or else 0)
KS3 level in English, maths and science and the average level in all threesubjects.
The variable jSC represents a vector of school characteristics, including:
Beacon school = 1, not = 0
Education Action Zone (EAZ) = 1, not = 0
Excellence in Cities (EiC) = 1, not = 0
Total number of students in the school
Proportion of students eligible for FSM in the school.
Other school characteristics were omitted from the final regression analysis, as theywere not statistically significant in explaining students’ responses.
The results of the analysis are presented by considering each of issues (a) to (d)listed above (curriculum choice, satisfaction with teaching and school, post 16intentions and school collaboration). There were by intention no direct questions inthe survey on inclusion. Evidence on inclusion is obtained by determining whetherthe responses of students who differ by ability, income or ethnicity are different and isincluded within the consideration of each issue (a) to (d). The statistical analysisinvolved either (i) fitting a two level regression equation in which school and pupil arethe two levels at which the variance in the response variables is decomposed, or (ii)cross-sectional regressions with school dummies to allow for differences betweenschools to be controlled for in the analysis. Whilst the two methods are similar innature, the estimation of a two level model enables us to test whether there areschool effects in the sense that pupils’ responses differ by school after controlling forthe fixed effects at pupil and school level.
25 The number of students was insufficient to disaggregate ethnicity any further.

144
In some cases the response (dependent) variable is measured on an interval scaleand in others it is categorical or ordinal. The fixed factors in the regression equationsare taken from the variables listed above. We also did a separate regression analysisfor the sub-sample of schools that we have information for both years (2002/3 and2005/6), as well as the full sample. This is so that we can obtain the genuinedifference in the time-trend effects for those schools that were present in bothsurveyed years. The statistical findings are summarised in the text and in tables inthe main body of the report. The results taken from the full sample analysis and notthe sub-sample analysis are reported in the main text for the sake of simplicity,unless stated otherwise. However, in most of the regressions results in terms of signand significance of the explanatory variables are the same. In addition to this, itshould be noted that the responding sample of DP schools in 2005/6 are more likelyto be the more active of the DP schools and the ones more engaged with DP projectfrom the year 2002 onwards. Therefore, it is possible that our results will be biasedin favour of ‘positive DP responses’ than if all DP case-study schools had responded.
The actual estimates, for both the full sample and sub-sample, are provided in theAppendix A* to this student survey report.
The topics in the student survey for years 2002/3 and 2005/6 are listed below.
Section 1 Subjects and examinations taken in Year 11 (for evidence on curriculumchoice);
Section 2 Student satisfaction with the subjects they were studying;
Section 3 Option choices: students were asked whether they were able to study allthe subjects they wished to and if not, for reasons: they were also asked to name anysubjects they would have liked to study at school but were not able to;
Section 4 Twenty eight questions on pupils’ general satisfaction with school;
Section 5 Students’ attitudes towards and experiences of working with students fromother schools;
Section 6 Students’ intentions after Year 11 regarding education and work.
Curriculum choiceStudents were asked how many subjects they were taking at GCSE and GNVQ.This ranged from 1 to 14 with a mean of 9.4 in 2002/3 and from 4 to 16 with a meanof 9.8 in 2005/6.
Using the full sample, we find that having a statement of SEN reduced the number ofsubjects taken (both GCSE and GNVQ) by 2.0. Pupils whose first language is notEnglish took 0.5 more subjects and those from Indian subcontinent ethnic took 0.3subjects less than average. An increase in the prior attainment at Key Stage 3 ofone level (e.g., from level 2 to level 3) was associated with a 0.4 increase in thenumber of subjects taken at GCSE and GNVQ. A 100 more pupils in the schoolincreased the number of subjects taken by 0.05. Students from EAZ and EiC schoolstook 1.2 and 0.7 subjects less than average, respectively. Students in 2005/6 took0.1 subjects more than students in 2002/3 for both full sample and sub-sampleanalyses, though the effect is statistically insignificant.
* Appendices to this report are available from the authors
145
This indicates that there was no significant change in the number of subjects takenby students between 2002/3 and 2005/6.
In terms of the number of subjects taken at GNVQ, we find that girls took 0.2 GNVQsubjects more than boys on average. Black students took 0.3 subjects less and thosefrom Indian subcontinent ethnic took 0.2 subjects at GNVQ less than white studentson average. Students from either EAZ or EiC schools took 0.2 subjects at GNVQmore than average, respectively. Students in 2005/6 took 0.09 subjects at GNVQmore than students in 2002/3 in the full sample analysis. However, the equivalenttime-trend effect (though positive) is statistically insignificant when we use only theschools that were present in both years in the analysis. Thus, the positive time-trendeffect in the number of GNVQs obtained in the full sample analysis may be spurious;what may appear to be an increase in the number of subjects taken at GNVQbetween 2002/3 and 2005/6 is probably a reflection of the number of students takingGNVQ subjects in the DP schools that did not participate in both surveys. .
Students were also asked if they were able to choose all the subjects they wished to(responding yes/no). Twenty six percent of students reported that they had beenunable to take all the individual subjects that had wished to in both 2002/3 and2005/6.
Whether an individual student reported being able to choose all the subjects theywanted to take at GCSE/GNVQ was analysed as a binary response variable. Asreported in Table A2 (Appendix*), black students and pupils whose first language isnot English were more likely to report that they could take all the subjects theywanted only in the sub-sample analysis. There was no evidence of school effectsother than the finding that students from EiC schools were less likely to be able totake all subjects that they wish to take in the sub-sample analysis. In addition to this,there was no significant evidence of the time-trend effect.
Students in 2005/6 reported no greater choice with regard to the availability of thesubjects that they wished to take than students in 2002/3.
Students’ satisfaction with teachingFor each subject grouping (e.g. English literature and language) students were askedto select ‘usually’, ‘sometimes’ or ‘never’ for four questions:
these subjects are taught in a way that makes it easy for me to learn;
these subjects are taught in a way that allows me to achieve my very best;
I can get help in these subjects when I don’t understand something;
I can get everything I need for these subjects in school.
For each subject grouping an overall quality of learning rating for each student wascalculated and so this varied from 12 (maximum of 4 for each element above) to aminimum of 3. These scores were averaged over all the students surveyed in eachschool to produce an average quality of learning rating for the school for each subjectarea. The results of the regressions of quality of learning on the fixed school andpupil factors are summarised in Table 1 and reported in detail in Tables A3 to A5 inthe Appendix*.
* Appendices to this report can be obtained from the authors
146
For English, maths and science, prior attainment in the subject at KS3 was positivelyrelated to the pupil’s quality of learning ratings. Girls and black pupils had lowerratings for science. There is a negative and statistically well-defined time-trend effectin English and maths; students in 2005/6 are less likely to be satisfied with the qualityof learning in English and Maths than students in 2002/3, holding other thingsconstant. There was no evidence of school effects in all three subjects.
Table 1 - Rating of quality of learning
Subject Fixed factors which are significantEnglish Prior attainment in English positively
related to rating of quality of learning.Students from EiC schools were morelikely to rate quality of learning higherthan average. There was a negative andstatistically significant time-trend effect inboth full sample and sub-sampleanalyses.
Maths Prior attainment in maths positivelyrelated to rating of quality of learning.Students whose first language was notEnglish tend to rate quality of learningvery highly. There was a negative andstatistically significant time-trend effect inboth full sample and sub-sampleanalyses.
Science Prior attainment in science positivelyrelated to rating of quality of learning. .Boys had higher rating than girls, andblack pupils lower ratings than otherethnic groups. There was a positivethough insignificant time-trend effect inboth full sample and sub-sampleanalyses.
Students in 2005/6 reported a lower quality of learning in English and mathscompared to students in 2002/3.
Students’ satisfaction with schoolQuestions of both a positive and negative nature were posed on students’ generalattitudes to their school, with 5 possible responses (strongly agree, agree, not sure,disagree, disagree strongly). The items were subject to factor analysis from whichwere derived six constructs reflecting satisfaction with school (Malmberg, 2003). Thefactor analysis was re-run with the whole student sample for 2002/3 and 2005/6surveys to ensure that any changes over time in reported satisfaction were not due toa change in the measurement of the constructs for satisfaction with school.
Table 2 shows the constructs of student satisfaction with school, including the itemsthat contribute to each construct and Cronbach’s statistic for reliability. The studentscores for each construct were averaged to give a school value. For two of theconstructs - negative attitudes towards school (DP4) and school harassment (DP6) -a low score is indicative of greater satisfaction, whereas for the other four a higherscore is associated with greater satisfaction.
147
Table 2 - Constructs for satisfaction with school (pooled 2002/3 and 2005/6)
Construct (Cronbach’s ) ItemsTeachers use a variety of teaching methodsTeachers enjoy teaching usTeachers notice when I work hardTeachers try to get the best out of studentsTeachers respected by studentsStudents encourage each other
DP1: Quality of Teaching ( = 81)
Teachers encourage me to work hardSchool has good equipmentThis is a good schoolThis school has high standardsSchool has good facilities
DP2: Quality of School ( = 76)
I really like my schoolI can talk to teacher about problemsI can talk to teacher if I'm worried
DP3: Perceived teacher support ( =.68)
I have a mentor who is supportiveLessons can't end soon enough for meMost of the time I don't want to go to school
DP4: Negative attitude ( = .57)
Work is dull and boringUsing computers makes work interestingDP5: Computers ( = .76)Using computers makes learning easierOthers make fun of those who work hardDP6: School harassment ( = .50)Others make my life miserable
Fitting a two level model to the six school satisfaction constructs with year dummyindicates whether these attitudes differed according to pupil characteristics, schoolfactors, or surveyed year and what proportion of unexplained variance (if any) was atschool level. The summary results are given in Table 3 and reported in detail inTables A6 to A11 in the Appendix*.
Girls showed a lower degree of satisfaction with school than boys in three out of sixconstructs (quality of teaching, perceived teacher support, and using computers).Students with higher prior attainment at Key Stage 3 had lower ratings for negativeattitudes and school harassment. Pupils with Indian sub-continent ethnic origins hada lower rating for quality of school, whilst students whose first language is not Englishhad a significantly higher rating for quality of school. Students from EiC schools hada higher rating for quality of teaching and school, though they also report a higherlevel of negative attitudes on average. Students from EAZ schools had a higherrating for quality of school, though they also report a higher level of schoolharassment on average. The coefficient of year dummy is negative and significant inthe sub-sample analysis for two out of six constructs (quality of school and usingcomputers).
Students in 2005/6 rated quality of the school and using computers less highly thandid students in 2002/3.
* Appendices to this report can be obtained from the authors
148
Table 3 - Relationship between school satisfaction and pupil and school factors
School satisfactionconstruct
Pupil fixed factorswhich are significant
School fixed factorswhich are significant
Time-trend effectwhich is significant
Quality of teaching Girl: negativeKS3 attainment:negative
EiC: positiveNo school effects
Not significant
Quality of school Indian subcontinent:negativeFirst language is notEnglish: positive
None significantNo school effects
Negative in both fullsample and sub-sampleanalyses
Perceived teachersupport
Girl: negative EAZ: positiveEiC: positiveNo evidence of schooleffects
Negative only in the fullsample analysis
Using computers Girl: negativePrior attainment:negative
None significantNo school effects
Negative in both fullsample and sub-sampleanalyses
Negative attitudes toschool(positive coefficientmeans higher ratingfor negative attitudes)
Prior attainment:negative
EiC: positiveNo school effects
Not significant
School harassment Prior attainment:negativeIndian subcontinent:positive
EAZ: positiveNo school effects
Not significant
In addition to the school satisfaction ratings, the single question asking students torate their agreement with the statement ‘I really like my school (coded 5 = stronglyagree to 1 strongly disagree) was analysed in a two level model. The model wasestimated using ordered probit model with school dummies as controls. It was foundthat liking school is positively related to prior attainment at KS3. There was significantevidence of a significant negative time-trend effect - see Table A12 in the Appendix*.
Students in 2005/6 were more likely to report not ‘liking school’ compared to studentsin 2002/3.
Students were also asked whether they thought that the lessons learned in schoolwould be useful in life. The ordinal responses (coded 5 = strongly agree to 1 stronglydisagree) were regressed using an ordered probit estimator with school dummies,and are reported in Table A13. There was only weak evidence that students fromBeacon schools were less likely to agree that lessons they learned in school will beuseful for later on in life.
Students in 2005/6 were significantly less likely to agree that they are learningsomething useful in school than students in 2002/3.
* Appendices to this report can be obtained from the authors
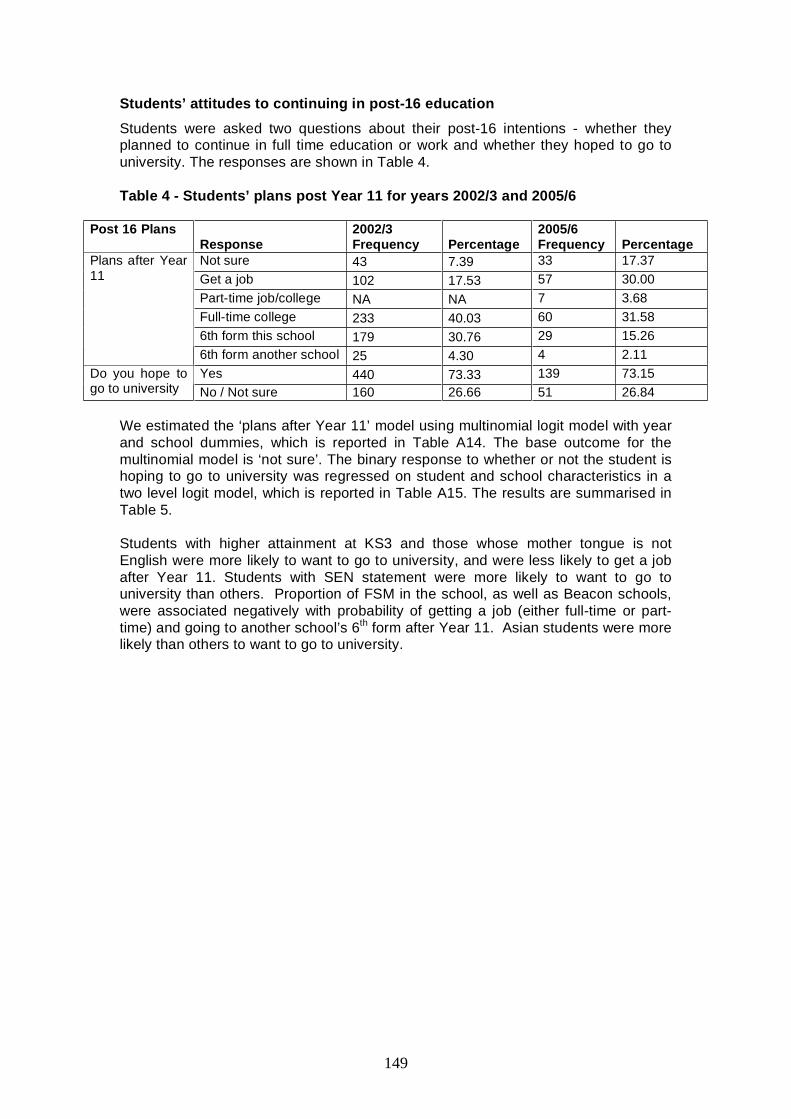
149
Students’ attitudes to continuing in post-16 education
Students were asked two questions about their post-16 intentions - whether theyplanned to continue in full time education or work and whether they hoped to go touniversity. The responses are shown in Table 4.
Table 4 - Students’ plans post Year 11 for years 2002/3 and 2005/6
Post 16 PlansResponse
2002/3Frequency Percentage
2005/6Frequency Percentage
Not sure 43 7.39 33 17.37Get a job 102 17.53 57 30.00Part-time job/college NA NA 7 3.68Full-time college 233 40.03 60 31.586th form this school 179 30.76 29 15.26
Plans after Year11
6th form another school 25 4.30 4 2.11Yes 440 73.33 139 73.15Do you hope to
go to university No / Not sure 160 26.66 51 26.84
We estimated the ‘plans after Year 11’ model using multinomial logit model with yearand school dummies, which is reported in Table A14. The base outcome for themultinomial model is ‘not sure’. The binary response to whether or not the student ishoping to go to university was regressed on student and school characteristics in atwo level logit model, which is reported in Table A15. The results are summarised inTable 5.
Students with higher attainment at KS3 and those whose mother tongue is notEnglish were more likely to want to go to university, and were less likely to get a jobafter Year 11. Students with SEN statement were more likely to want to go touniversity than others. Proportion of FSM in the school, as well as Beacon schools,were associated negatively with probability of getting a job (either full-time or part-time) and going to another school’s 6th form after Year 11. Asian students were morelikely than others to want to go to university.
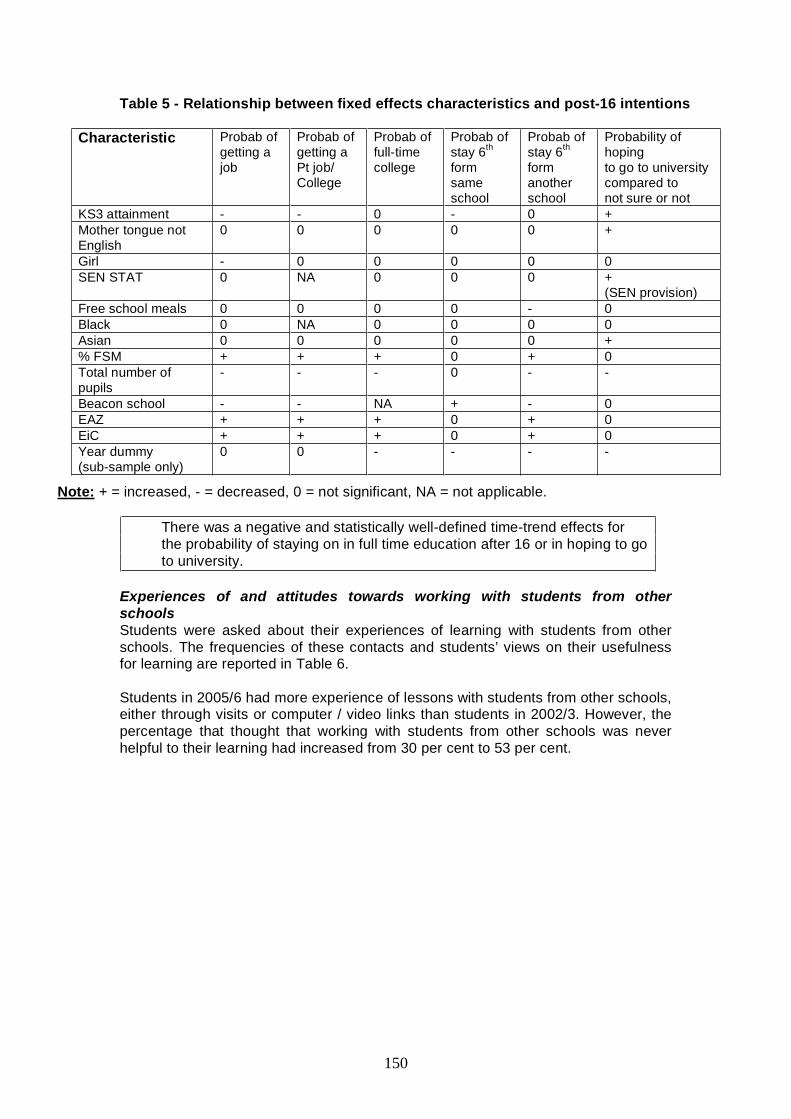
150
Table 5 - Relationship between fixed effects characteristics and post-16 intentions
Characteristic Probab ofgetting ajob
Probab ofgetting aPt job/College
Probab offull-timecollege
Probab ofstay 6th
formsameschool
Probab ofstay 6th
formanotherschool
Probability ofhopingto go to universitycompared tonot sure or not
KS3 attainment - - 0 - 0 +Mother tongue notEnglish
0 0 0 0 0 +
Girl - 0 0 0 0 0SEN STAT 0 NA 0 0 0 +
(SEN provision)Free school meals 0 0 0 0 - 0Black 0 NA 0 0 0 0Asian 0 0 0 0 0 +% FSM + + + 0 + 0Total number ofpupils
- - - 0 - -
Beacon school - - NA + - 0EAZ + + + 0 + 0EiC + + + 0 + 0Year dummy(sub-sample only)
0 0 - - - -
Note: + = increased, - = decreased, 0 = not significant, NA = not applicable.
There was a negative and statistically well-defined time-trend effects forthe probability of staying on in full time education after 16 or in hoping to goto university.
Experiences of and attitudes towards working with students from otherschoolsStudents were asked about their experiences of learning with students from otherschools. The frequencies of these contacts and students’ views on their usefulnessfor learning are reported in Table 6.
Students in 2005/6 had more experience of lessons with students from other schools,either through visits or computer / video links than students in 2002/3. However, thepercentage that thought that working with students from other schools was neverhelpful to their learning had increased from 30 per cent to 53 per cent.

151
Table 6 - Frequencies of students’ learning experiences involving contact withother schools for years 2002/3 and 2005/6
Frequency(2002/3)
AveragePercentage(2002/3)
Frequency(2005/6)
AveragePercentage(2005/6)
No 480 81.91 111 54.68
Once or twice 72 12.29 36 17.73
Three times + 34 5.80 56 27.59
Have you had anylessons in yourschool with studentsfrom anotherschool?
Total 586 100.00 203 100.00
No 376 62.25 125 55.56
Once or twice 151 25.00 69 30.67
Three times + 77 12.75 31 13.78
Have you gone toanother school /college for any ofyour lessons?
Total 604 100.00 225 100.00
No 400 65.25 124 52.10
Once or twice 135 22.02 86 36.13
Three times + 78 12.72 28 11.76
Have you been toanother school /college to use theirequipment orfacilities?
Total 613 100.00 238 100.00
No 540 87.80 175 73.22
Once or twice 56 9.11 47 19.67
Three times + 19 3.09 17 7.11
Have you workedwith students fromother schools usinga computer or videolink?
Total 615 100.00 239 100.00
Never 64 30.62 89 52.66
Sometimes 119 56.94 63 37.28
Usually 26 12.44 16 9.47
Is working withstudents from otherschools helpful toyour learning?
Total 209 100.00 169 100.00
Students’ responses to these questions were regressed using an ordered probitestimator with school dummies, and are reported in Tables A18 to A22. Girls were
152
significantly less likely than boys to have lessons with other students from otherschools. They were also less likely to go to other schools for lessons, and useequipments in other schools. Students whose first language is not English were morelikely to go to other schools for lessons. Students with high prior attainment at KS3were less likely to use computer or video link in learning with students from otherschools. Pupils from EAZ and EiC schools were more likely than others to go toother schools for lessons, and use camera and video links in their collaboration withstudents from other schools. Students from EiC schools were more likely to useequipments from other schools, whilst students from EAZ schools were more likely togo to other schools for lessons.
Students were also asked about activities with students from other schools. Theresponses are summarised in Table 7.
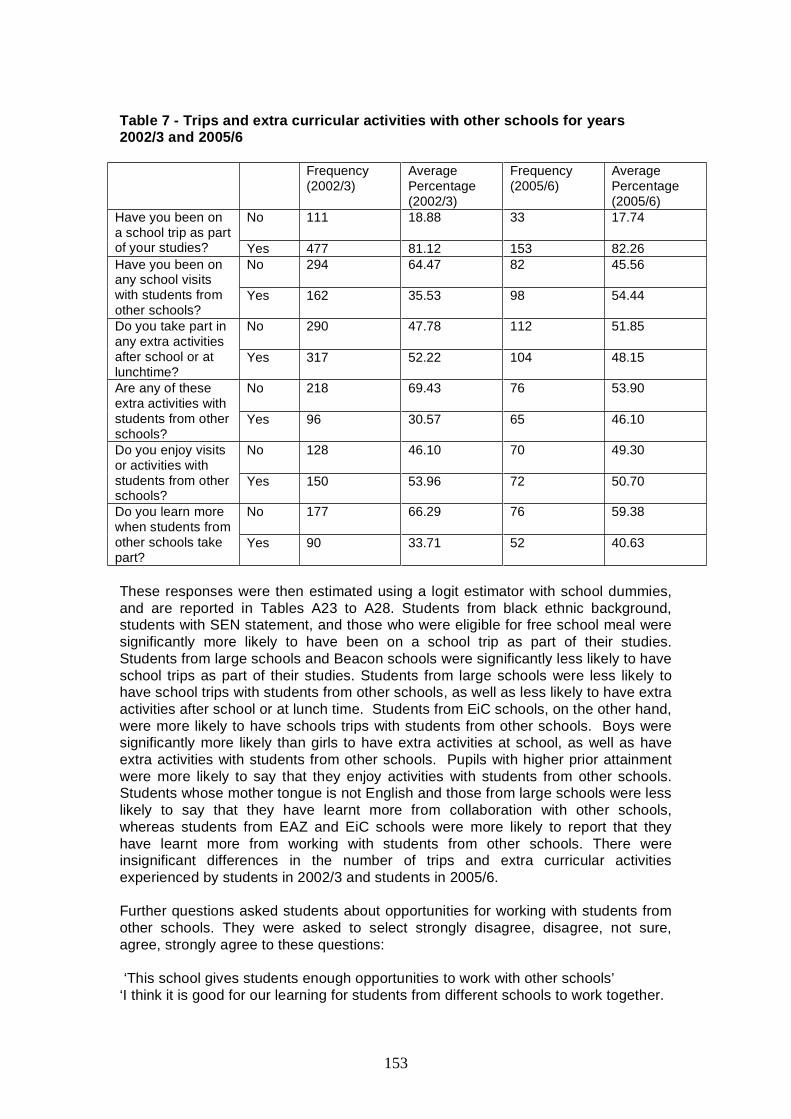
153
Table 7 - Trips and extra curricular activities with other schools for years2002/3 and 2005/6
Frequency(2002/3)
AveragePercentage(2002/3)
Frequency(2005/6)
AveragePercentage(2005/6)
No 111 18.88 33 17.74Have you been ona school trip as partof your studies? Yes 477 81.12 153 82.26
No 294 64.47 82 45.56Have you been onany school visitswith students fromother schools?
Yes 162 35.53 98 54.44
No 290 47.78 112 51.85Do you take part inany extra activitiesafter school or atlunchtime?
Yes 317 52.22 104 48.15
No 218 69.43 76 53.90Are any of theseextra activities withstudents from otherschools?
Yes 96 30.57 65 46.10
No 128 46.10 70 49.30Do you enjoy visitsor activities withstudents from otherschools?
Yes 150 53.96 72 50.70
No 177 66.29 76 59.38Do you learn morewhen students fromother schools takepart?
Yes 90 33.71 52 40.63
These responses were then estimated using a logit estimator with school dummies,and are reported in Tables A23 to A28. Students from black ethnic background,students with SEN statement, and those who were eligible for free school meal weresignificantly more likely to have been on a school trip as part of their studies.Students from large schools and Beacon schools were significantly less likely to haveschool trips as part of their studies. Students from large schools were less likely tohave school trips with students from other schools, as well as less likely to have extraactivities after school or at lunch time. Students from EiC schools, on the other hand,were more likely to have schools trips with students from other schools. Boys weresignificantly more likely than girls to have extra activities at school, as well as haveextra activities with students from other schools. Pupils with higher prior attainmentwere more likely to say that they enjoy activities with students from other schools.Students whose mother tongue is not English and those from large schools were lesslikely to say that they have learnt more from collaboration with other schools,whereas students from EAZ and EiC schools were more likely to report that theyhave learnt more from working with students from other schools. There wereinsignificant differences in the number of trips and extra curricular activitiesexperienced by students in 2002/3 and students in 2005/6.
Further questions asked students about opportunities for working with students fromother schools. They were asked to select strongly disagree, disagree, not sure,agree, strongly agree to these questions:
‘This school gives students enough opportunities to work with other schools’‘I think it is good for our learning for students from different schools to work together.

154
The distributions by surveyed year are reported in Table 8.
Table 8 - Attitudes to working with students from other schools for years2002/3 and 2005/6
Enoughopportunitiesto work withother schools(2002/3)
Enoughopportunitiesto work withother schools(2005/6)
Good to workwith studentsfrom otherschools(2002/3)
Good to workwith studentsfrom otherschools(2005/6)
Percent Percent Percent Percent
Strongly Disagree 12.4 9.6 3.5 5Disagree 26.7 19.2 8.8 11.2Not Sure 27.6 26.2 30.5 34.2Agree 27.0 31.9 42.2 39.6Strongly Agree 6.4 13.1 14.9 10.0Total N 623 260 623 260
These responses were regressed using an ordered probit estimator, controlling forschool dummies, and are reported in Tables A16 and A17. Girls were less likely thanboys to report that they have enough opportunities to work with students from otherschools. There were statistically insignificant relationships between students’characteristics and attitudes of whether it is good to work with students from otherschools. There were insignificant differences in attitudes to whether there are enoughopportunities to work with other schools between students in 2002/3 and students in2005/6.
Students in 2005/6 were significantly less likely to think that it is good to collaboratewith students from other schools compared to students in 2002/3.
Students were also asked to name any opportunities for learning that they felt theirschools did not currently provide, but which they would like. The percentages andfrequencies for all schools for whether there were other learning opportunities thatstudents would like are shown in Table 9. The responses were regressed using alogit estimator with school dummies, and the estimates are reported in Table A29.Students with higher prior attainment were more likely than others to agree that thecollaboration allowed for other learning opportunities that were not provided for at theschool that the student would like to take. The time-trend effect was statisticallyinsignificantly different from zero both full sample and sub-sample regressions.
Table 9 - Frequencies and percentages whether there are other learningopportunities that are not provided for at the school that the student would like
Frequencies(2002/3)
Percentage(2002/3)
Frequencies(2005/6)
Percentage(2005/6)
No 475 80.24 155 77.89Yes 117 19.76 44 22.11Total 592 100.00 199 100.00
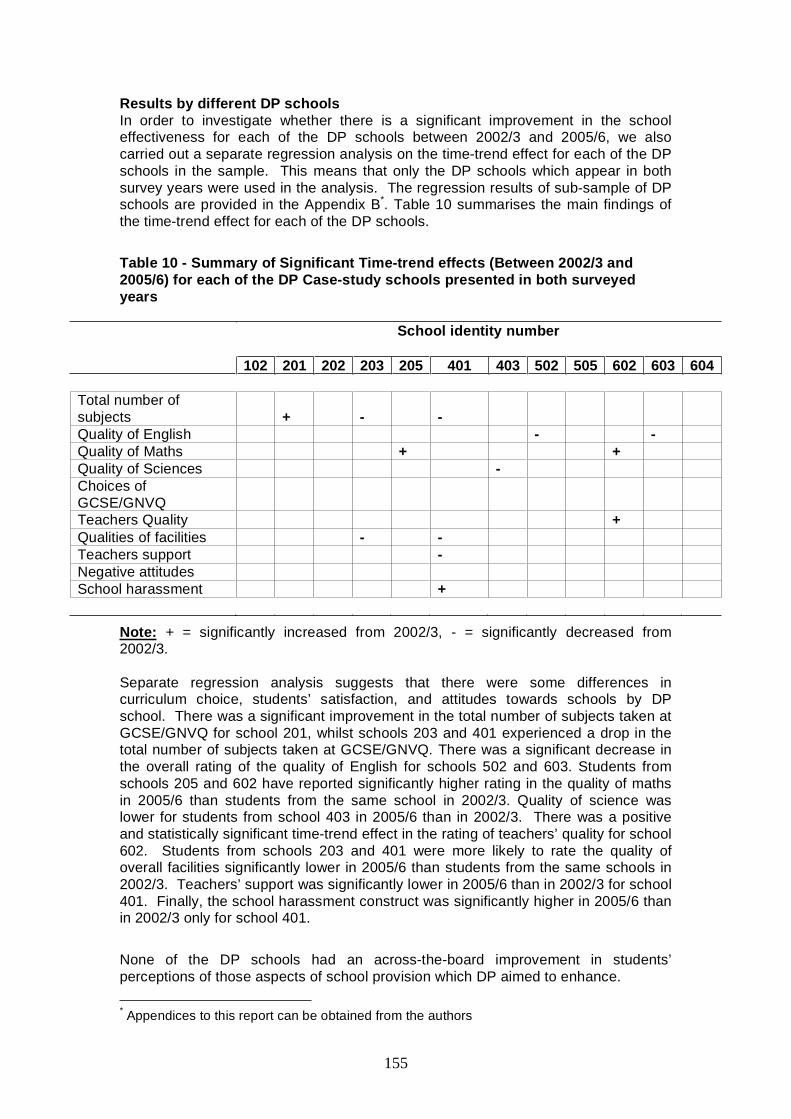
155
Results by different DP schoolsIn order to investigate whether there is a significant improvement in the schooleffectiveness for each of the DP schools between 2002/3 and 2005/6, we alsocarried out a separate regression analysis on the time-trend effect for each of the DPschools in the sample. This means that only the DP schools which appear in bothsurvey years were used in the analysis. The regression results of sub-sample of DPschools are provided in the Appendix B*. Table 10 summarises the main findings ofthe time-trend effect for each of the DP schools.
Table 10 - Summary of Significant Time-trend effects (Between 2002/3 and2005/6) for each of the DP Case-study schools presented in both surveyedyears
School identity number
102 201 202 203 205 401 403 502 505 602 603 604
Total number ofsubjects + - -Quality of English - -Quality of Maths + +Quality of Sciences -Choices ofGCSE/GNVQTeachers Quality +Qualities of facilities - -Teachers support -Negative attitudesSchool harassment +
Note: + = significantly increased from 2002/3, - = significantly decreased from2002/3.
Separate regression analysis suggests that there were some differences incurriculum choice, students’ satisfaction, and attitudes towards schools by DPschool. There was a significant improvement in the total number of subjects taken atGCSE/GNVQ for school 201, whilst schools 203 and 401 experienced a drop in thetotal number of subjects taken at GCSE/GNVQ. There was a significant decrease inthe overall rating of the quality of English for schools 502 and 603. Students fromschools 205 and 602 have reported significantly higher rating in the quality of mathsin 2005/6 than students from the same school in 2002/3. Quality of science waslower for students from school 403 in 2005/6 than in 2002/3. There was a positiveand statistically significant time-trend effect in the rating of teachers’ quality for school602. Students from schools 203 and 401 were more likely to rate the quality ofoverall facilities significantly lower in 2005/6 than students from the same schools in2002/3. Teachers’ support was significantly lower in 2005/6 than in 2002/3 for school401. Finally, the school harassment construct was significantly higher in 2005/6 thanin 2002/3 only for school 401.
None of the DP schools had an across-the-board improvement in students’perceptions of those aspects of school provision which DP aimed to enhance.
* Appendices to this report can be obtained from the authors
156
ConclusionThe main purpose of this report is to provide an evaluation of the impact of DiversityPathfinders in terms of curriculum choice, school satisfaction and collaborativeworking between students using evidence from a survey of students in Year 11 in theDiversity Pathfinders case-study schools in 2002/3 and 2005/6. In interpreting thefindings from the survey it must be borne in mind that by its very nature DP cannot beevaluated as a treatment with ‘treated’ schools compared to a group of controlschools. Consequently, we cannot definitely attribute any changes in students’perceptions between 2002/3 and 2005/6 to the DP project since other factorsaffecting secondary education were also changing over the three years and couldhave affected students’ perceptions. However, if we cannot find any significantchange in the desired direction in student perceptions then this must make us verycautious of making claims about DP having an impact on students’ experiences atschool.
The main findings are that there is no evidence of increased curriculum choice.There was no significant difference between students in 2002/3 and those in 2005/6in terms of the availability of the subjects that they wished to take. There was astatistically insignificant 2 percentage point increase in 2005/6 in students reportinglearning opportunities that they would like but that their school did not provide.Students in 2005/6 did not take more subjects at GCSE/GNVQ than students in2002/3 or a greater range of subjects, holding other things constant.
This study has also provided further analysis of indicators of satisfaction at schoolderived from factor analysis of responses to the questionnaire. No significantimprovement in each of the indicators of school satisfaction was found. On thecontrary, students were more likely to rate the overall quality of maths, quality offacilities, and satisfaction with using the computers lower in 2005/6 than in 2002/3.
The clearest finding in relation to inclusion issues was the greater degree ofdissatisfaction reported by girls and students from Indian subcontinent for teacherand school quality, as well as for school harassment. Pupils with high priorattainment at KS3 tended to rate the quality of learning for each of the three subjects(English, maths, and science) more highly. There was no consistent evidence ofmore negative experiences related to FSM status or to not having English as themother tongue. With respect to the school fixed factors, students from EiC and EAZwere significantly more likely to rate the overall quality of teacher and school higherthan those from non-EiC and non-EAZ on average. However, there was also asignificantly greater degree of dissatisfaction as indicated by higher ratings fornegative attitudes to school and school harassment among students from EiC andEAZ, respectively.
Students’ attitudes to collaborative work with students from other schools and theirexperiences of working with students from other schools did not improve significantlybetween 2002/3 and 2005/6. While more lessons and activities with students fromother schools were reported in 2005/6 than in 2002/3, students’ perceptions thatthese helped their learning had declined, so that a majority thought these neverhelped their learning. There were some significant differences in the experiences ofworking with students from other schools by student group with girls having lessexperience of collaboration than boys. Students whose first language is not Englishwere more likely to go to other schools for lessons, whereas those with high priorattainment at KS3 were less likely to use computer or video links for learning withstudents from other schools.
157
With regards to post-16 intentions, students from DP case-study schools in 2005/6were more likely to be unsure about their future plans than those in 2002/3, holdingother things constant.
The findings of the survey are disappointing with respect to providing evidence thatDP fulfilled its aims of increasing curriculum choice, and improving teaching andlearning for students, or encouraging increased participation in post-16 education.Students were, if anything, less likely to wish to stay in full time education after 16and were less satisfied with school in relation to the quality of maths and Englishlearning, using computers and harassment.
The one major positive impact that can probably be attributed to DP was the increasein the proportion of students who had experienced lessons or activities with studentsfrom other schools. But, this was offset by the increased proportion of studentsclaiming that working with students from other schools never helps their learning.
Apart from finding that compared to 2002/3, SEN students were no longer more likelyto report harassment at school than non-SEN students, the survey evidence does notsuggest any marked changes in inclusion.
Given that only 13 out of 32 DP case-study schools responded to the survey in bothyears, the findings should be treated with caution. Nevertheless, the survey analysisprovides no evidence that DP succeeded in widening curriculum choice or improvingthe quality of the students’ experience of school or their desire to continue with fulltime education.
REFERENCE
Malmberg, L. (2002/3) The Diversity Pathfinders study: reliability and validity of theconstructs. Mimeo. Oxford Institute of Education.

158
APPENDIX D
EVALUATION OF GCSE EXAMINATION IMPROVEMENT OF DIVERSITYPATHFINDERS SCHOOLS BETWEEN 2002 AND 2005
Nick Powdthavee and Rosalind Leva i
An important aim of Diversity Pathfinders (DP) is to improve educational standards.We assess this by comparing DP LEAs’ and DP schools’ value added GCSEexamination performance in 2002 with that in 2005. The measures of GCSE used arethe GCSE capped score (the best 8 subjects) maths and English. (GCSE 2002science results were not available.) Because value added performance measures areused we are comparing each school’s performance relative to other secondaryschools in England, controlling for student characteristics and school contextvariables that affect educational attainment. These are detailed below.
It is important to bear in mind that if we observe that schools have improved theirresults over the 3 years we cannot definitely attribute this to the DP project becausethe evaluation research design does not enable us to compare the DP schools with agroup of control schools that were similar but did to engage in collaborative activities.This was clearly stated in our research proposal. The very nature of the DP projectwas to enable the six participating LEAs and schools to develop their ownapproaches to collaborative working. This means that DP was not a uniform‘treatment’. Neither were non-DP schools prevented from developing collaborativeactivities. This means that we could not in 2002 select a group of control schools thatwould reliably not collaborate with other schools.
However, it is an important part of the DP evaluation to obtain evidence on thesuccess or otherwise of the DP schools in improving examination results. Thedifferences in the extent to which schools and LEAs improved their GCSE examresults over the three-year period can be interpreted and explained using knowledgeof the schools drawn from the qualitative data.
I. Empirical StrategyTo carry out our evaluation on the effectiveness of Diversity Pathfinders (DP)schools, we begin by constructing a simple multilevel model with three levels (LEA,school, and student) to measure the differences in GCSE attainment between DPand the non-DP LEAs. We divide our empirical analysis into two main parts in orderto test whether:
DP LEAs are more effective than others, including whether they have performedbetter at improving GCSE results for disadvantaged students;
Individual DP schools have improved their effectiveness comparing 2005 GCSEresults with those in 2002. This requires estimating the schools’ shrunkenresiduals (i.e. a measure of school effectiveness) and determining whether theyare statistically significantly different from zero (i.e. from average performance).
The DP schools are all schools in the DP LEAs apart from Byron LEA, whichconcentrated its DP funding on 6 schools in a collegiate academy. The relativeeffectiveness of each LEA’s DP schools as a group is tested by including the DPLEAs as separate dummy variables.
When we present individual schools’ value added results we have restricted theschools examined to all those in the small LEAs (Nisbet, Tennyson and Pepys) and
159
the 6 collegiate academy schools in Byron LEA. For the two large LEAs we include 6schools in the two case study areas in Hardy LEA and for Chaucer LEA the casestudy schools and the partner schools in their collaborative clusters. The relativeeffectiveness of all schools in the two large LEAs is tested by including individualLEA dummy variables as indicated below. Therefore, we do not need to present theindividual results of all schools in the two large LEAs.
In order to test whether there is a statistically significant difference in the GCSEattainment between DP LEAs and non-DP LEAs, we set up our model as follows:
,22 000''2
210 ijkjkkkjkijkijkijkijkijk euvDPSXKSKSPS ++++++++= (1)
where:
subscript i refers to the student, subscript j to the school and subscript k to the LEA;
ijkPS is the point cap GCSE score (best 8 subjects) for pupil i in school j in LEA k;
ijkKS 2 is a measure of prior attainment (key stage 2);
ijkKS 22 is key stage 2 squared;
ijkX is a set of individual characteristics, including gender, ethnicity, age at the startof the school year, whether the first language is English, special educational needs(SEN) status, and eligibility for free school meal (FSM).
The variable jkS denotes a set of school variables, including the school percentageof students with FSM eligibility, the school percentage of SEN, and the schoolpercentage of additional educational needs (AEN), as well as school dummiesindicating types of schools (e.g. all boys, all girls, Roman Catholic, Church ofEngland, secondary modern school, grammar school, and other school).
The dummy variable kDP represents whether the LEA is one of the DiversityPathfinders LEAs. The parameter of interest is therefore, , which captures theeffect of DP LEAs on GCSE outcome. In addition:
v0k is the random disturbance or error term for LEA k
u0jk is the random disturbance or error term for school jk
eij0k is the random disturbance or error term for student ijk.
For our second test on whether DP LEAs have made any significant progress interms of their GCSE outcomes from 2002 to 2005, a time-dummy, T, and itsinteraction with DP LEA dummy are incorporated in (1) to give:
,)(22 000''2
210 ijkjkkjkjkjkijkijkijkijktijk euvTDPTDPSXKSKSPS ++++++++++= (2)
where the parameter, , captures the main effect of the time-dummy (0 = 2002, 1 =2005), and captures the time-effect on the DP variable. The progress of DP LEAs(or schools) is therefore the sum of + compared to the progress of others (whichis simply ).26
26 Note that we have assumed independence between the same school from two differentperiods in the hierarchical structure of our data (i.e. school A with two observations – one in2002 and another in 2005 - becomes two independent schools in our analysis so that we can
160
Our third test includes the 6 DP LEAs separately, as 6 dummy variables in equation2.
The unique feature of the multilevel models described above is that they allow thegroups in the sample (in our case, there are 3-level hierarchical units: i) LEA, ii)school, and iii) student) to be treated as a random sample from the population ofgroups. This is reflected in the 3 random error terms. In other words, the multilevelapproach takes into account that students from the same school may share similarschool climates that allow them to achieve similar grades at school, for example. Forthe sake of simplicity, we only allow the intercept to be random at the three classifiedlevels (LEA, school, and student) in our preliminary models. The above models arefitted using MLwiN program and Pupil Level Annual School Census (PLASC) datasetfor 2002 and 2005.
II. Results for DP LEAsThe first set of findings concern whether DP LEAs improved their examination resultsin 2005 compared with 2002. We report the findings about the size and statisticalsignificance of the coefficients for the main independent variables in equations 1 and2. The full results are reported in the tables in the Appendix. The main relevantfindings are summarized in the main body of the report.
II.1 How the control variables affect GCSE attainmentBefore reporting the main findings on comparative improvement in GCSE resultsfrom 2002 to 2005 for DP LEAs and schools, we report general results for the factorsthat affect students’ GCSE attainment. Table A1, which reports GCSE results forthe capped score, English and maths in 2002 is referred to, but the results for thecontrol variables are very similar in the other regression equations.
Other main findings from Table A1 can be summarised as follows:
• Prior attainment (at the Key Stage 2 level) has a non-linear effect on GCSEcapped score: the predicted GCSE score rises more rapidly as the KS2 scoreincreases. In other words more able students as measured by their KS2scores, make more progress over their secondary education than less ablestudents. A similar pattern is observed for the best maths and English score.
• Girls performed significantly better than boys. For example, girls are morelikely to obtain on average 2.4 more GCSE points than boys, ceteris paribus.
• GCSE outcomes are significantly lower for those who are eligible for FSM.Students from poor backgrounds (as indicated by their FSM status) are morelikely to obtain on average around 4.6 GCSE points less than others.
• Students from ethnic minority backgrounds (e.g. Blacks, Asians, andChinese) and whose first language is not English tend to make betterprogress in GCSE than others on average.
• Students with special educational needs are more likely than others toperform poorly at the GCSE.
• Younger students make more progress over KS4, as shown by the negativerelationship between GCSE outcomes and student’s age at the start of theacademic year.
• There are significant correlations between most of the school variables andGCSE outcomes. For example, there is a negative and well-defined
include the school twice as a dependent variable in the regression of both 2002 and 2005examination results).

161
relationship between the school percentage of students who are eligible forFSM and GCSE results. Students who went to all boys (or all girls) schoolstend to achieve higher GCSE scores than those who attended mixed sexschools. Similar results are obtained for students from faith schools.
• The random effects are statistically significant in all three hierarchical levels,indicating that there are significant group variations in the GCSE outcomesbetween LEA, school, and student. This is seen from the last three lines ofTable A1, which report the variance in exam results at LEA, school andstudent level. As in other research on English exam results, a very highproportion of the unexplained variance is at the student level. Ninety three percent of the unexplained variance in exam results is at student level, six percent at school level and only 1 per cent at LEA level.
II.2 DP LEAs: GCSE outcomes 2002In 2002, the DP LEAs as a group were not more effective in terms of their students’GCSE performance than other LEAs.
The first column of Table A1 in the Appendix reports the GCSE capped scoreestimates from running equation (1) on attainment data for 2002. The coefficient onthe dummy for DP LEAs is positive though poorly defined ( cpo int_ = 0.618, S.E. =0.490). This indicates that there is an insignificant difference in the GCSE resultsbetween non-DP and DP LEAs.
The last two columns in Table A1 split GCSE results by subject. Using the bestEnglish score as the dependent variable, the second column shows that studentsstudying in the DP LEAs in 2002 did not perform significantly better in English thanstudents from non-DP LEAs ( english = 0.062, S.E. = 0.051). Similar results areobtained in the third column of Table A1 for maths; the coefficient on DP LEAscontinues to be positive but statistically insignificant ( maths = 0.047, S.E. = 0.059).
II.3 DP LEAs: progress in GCSE outcomes made between 2002 and 2005From estimating equation (2) using a pooled dataset for the years 2002 and 2005 wefind that students in DP LEAs as a group made more progress than other students interms of the capped GCSE total score. Students from DP LEAs in 2005 were morelikely to obtain around 1 GCSE point more than students from non-DP LEAs in 2005.This means that DP LEA students’ overall results in 2005 were higher than those in2002 even after removing the national upward trend. However, DP LEAs students’results for English and maths in 2005 were no different from those in other LEAs.
The results are reported in Table A2 in the Appendix. Ceteris paribus, studentsnationally taking GCSE in 2005 obtained on average around 3.2 more GCSE pointsthan students taking GCSE in 2002. However, this improvement in the overall GCSEscore for students in 2005 is more likely to have come from subjects other thanEnglish and Maths, as students in 2005 obtained around 0.4 points less thanstudents in 2002 in both GCSE English and Maths. Controlling for the time dummy,the coefficient on DP LEAs continues to be positive though poorly defined across allcolumns.
Whether students from DP LEAs in 2005 performed significantly better than studentsin other LEAs is shown by the coefficient on the interaction term ( TDPk ). This ispositive and statistically significant in the first column of Table A2, suggesting thatstudents from DP LEAs have made significant progress in their overall GCSE resultscompared to other non-DP LEAs in 2005.
162
On the other hand, the coefficient on the interaction term continues to be positive butstatistically insignificant in both English and Maths regressions. Students from DPLEAs in 2005 do not seem to have performed significantly better than students fromnon-DP LEAs in 2005 in either GCSE English or Maths. Like other students fromnon-DP LEAs in 2005, students from DP LEAs in 2005 obtain on average around 0.4points lower than students in 2002 in both GCSE English and Maths. Table A2’sother results are qualitatively similar to that obtained in previous tables.
To summarise: these results indicate a relative improvement in capped GCSE resultsfor students in all DP LEAs as a group compared to students in other LEAs when2005 is compared to 2002
II.4 Individual DP LEAs: progress in GCSE outcomes made between 2002 and2005Equation 2 was re-estimated using a dummy for each DP LEA to see if some and notother DP LEAs made more progress relative to all other LEAs nationally. This indeedseems to be the case. The only DP LEAs that improved GCSE results between 2002and 2005 more than the national trend are Byron and Nesbit. Byron improved thecapped GCSE total score more than the national rate while Nesbit improved Englishand maths results more than the national rate. This was a particularly creditableperformance by Nesbit since the national trend in maths and English wasdownwards.
As can be seen from Table A3, the year dummy for 2005 is 3.2 for the GCSE cappedscore, -0.448 for English and -0.397 for maths. The coefficient on interactionsbetween the LEA and year is the test of whether the LEA improved more than thenational rate for 2005 compared to 2002. After controlling for individual studentcharacteristics and school context variables, Byron’s capped GCSE score was 2.8points higher than the results for other LEAs. Nesbit’s English scores were 0.41higher and their students’ maths scores 0.32 higher than those in other LEAs. Pepyshad maths scores, which were lower by 0.174 of a grade than other LEAs. All theother DP LEAs were not statistically significantly different from the national changesbetween 2002 and 2005.
II.5 Did DP LEAs improve results for disadvantaged students?One of the aims of the Diversity Pathfinders Project was to improve inclusion. Onetest of the success of this is whether disadvantaged students’ GCSE results in 2005improved relative to the same groups’ results in 2002. Two indicators ofdisadvantage are available in the PLASC dataset (i) the studnt is eligible for freeschool meals (FSM); (ii) the student belongs to a low achieving ethnic group (this isdefined as one of the ethnic groups which make up the Additional Educational Needs(AEN) indicator used by the DfES for allocating additional funding in the EducationSpending Share Formula).The measure of whether a DP LEA was successful in improving disadvantagedstudents’ GCSE results between 2002 and 2005 is estimated by the coefficient onthe interaction term:
LEA*Year 2005* FSMand LEA*Year 2005* AENWe find that three of the DP LEAs, Byron, Nesbit and Pepys, succeeded inimproving the GCSE results of students eligible for free school meals between 2002and 2005. Byron improved the GCSE maths grades of FSM students relative to thenational trend, Nesbit improved English and maths results and Pepys improvedcapped GCSE score by 0.6 of a grade.
163
The results are shown in Table A4 in the Appendix.
From the estimated coefficient of the interaction between FSM and Year, we can seethat nationally students eligible for FSM in fact did worse in total GCSE and Englishin 2005 than in 2002. The interaction terms between LEA and FSM indicate how wellFSM students did in these LEAs compared to other LEAs. Byron is the only one ofthe 6 DP LEAs to got better results for FSM students in 2002. In contrast, Hardy didslightly worse in all three measures of GCSE results.
When we look at the interactions between LEA, year and FSM, Byron FSM studentsdid slightly better in maths (0.01 of a grade) in 2005 relative to the national trend.Nesbit FSM students score 0.022 grades more in English and 0.035 grades more inmaths in 2005 than 2002. Pepys FSM students gain 0.6 grades more in the cappedGCSE score, which is a sizable improvement.
The test was replicated for students classified as belong to ethnic groups withAdditional Educational Needs. There were few significant results. Nesbit AENstudents obtained 0.002 grades more in maths in 2005 than in 2002 and Byron AENstudents obtained 0.005 grades less in English in 2005 compared to 2002. (We donot report these results in detail.)
III Results for individual DP schoolsThe next tests compare the performance of individual DP schools with that of schoolsnationally. The measure of the effectiveness of a school used in these tests is thedifference between the actual exam results of each student and the exam resultspredicted for that student by the regression equation (i.e. by the students’ priorattainment and other characteristics, and the school’s context variables). Thisdifference is known as the residual. Because each school has different numbers ofstudents, their contribution to overall average residual for the school needs to beappropriately weighted so that the estimated standard deviation of the residual is notbiased. This residual is called the ‘shrunken residual’. MLwiN is used for theestimations because it produces shrunken residuals.
Because we wish to have a measure of the residual of each school unaffected bywhich LEA it is in we do not include DP LEA dummy in the regression equation thatproduces schools’ shrunken residuals. These shrunken residuals are basically theunexplained GCSE results obtained from the estimation of multilevel equations (1)and (2) but with DP LEA dummy having been excluded from the regression. We usethe following definitions of an effective, average or ineffective school.
• If a school has a shrunken residual, which is positive and statisticallysignificant at 5 per cent then it is said to be effective.
• If its shrunken residual is not statistically significantly different from zero thenthe school is deemed average.
• If a school has a shrunken residual, which is negative and statisticallysignificant at 5 per cent then it is deemed to be ineffective.
These classifications are made for each GCSE performance measure – best 8subjects, English and maths in both 2002 and 2005.
Effectiveness is essentially a relative concept. Effective schools are deemed suchbecause their students’ attainment is higher than would be predicted on the basis ofthe pupils’ characteristics and the schools’ context variables. Predicted attainment iswhat ‘average’ schools achieve, given the values of the control variables, asestimated by the regression equation. To be ‘effective’ a school has to achieveresults which are statistically significantly higher than average (i.e. the shrunken
164
residual or difference between the predicted and actual results is greater than 0 atthe 95% confidence level). Similarly an ineffective school is one whose students’attainment is significantly below what is predicted on the basis of their students’characteristics and the school’s context variables.
We report two tests. The first compares each school’s effectiveness in 2002 with itseffectiveness in 2005 in order to assess whether or not the school improved. Thisinvolves estimating equation in for 2002 and then for 2005 and comparing shrunkenresiduals in the two years.
The second test measures school’s progress in improving GCSE results in 2005compared to 2002. This involves estimating equation 2 with pooled data for 2002 and2005 and a year dummy. The shrunken residuals from equation 2 for students in2005 are used to judge whether a school is effective in making progress between2002 and 2005. If a school has a significant, positive residual it has made greaterprogress than the national trend and is therefore deemed to be ‘effective’.
III.1 Comparing schools’ effectiveness in 2002 with effectiveness in 2005Table 1 shows the schools’ shrunken residuals for the 3 attainment measures in2002 and in 2005, indicating with an * where the residual is statistically significant.A school is classified as having improved in a measure of GCSE performance if itmoved from:
ineffective (negative residual) to average (0) or effective (positive);or from average to effective.
A school is classified as having worsened in a measure of GCSE performance if itmoved from:
average or effective to ineffective;from effective to average.
A school which does not change its rating is classified as unchanged. If the schoolhad positive residuals in both years then it is classified as effective and unchanged.The results are summarised in the last column of Table 1 where.
improved schools are indicated by I and are given a score of 2 for each I foreach of the three performance measures;unchanged and effective schools are indicated by EU and given a score of 1;unchanged schools (either 0 or negative) are given a score of 0;worsening schools are indicated by W and given a score of –1.
The scores for each of the three performance measures are added up and shown inthe last column. Schools with scores of 1 or more are highlighted in bold.
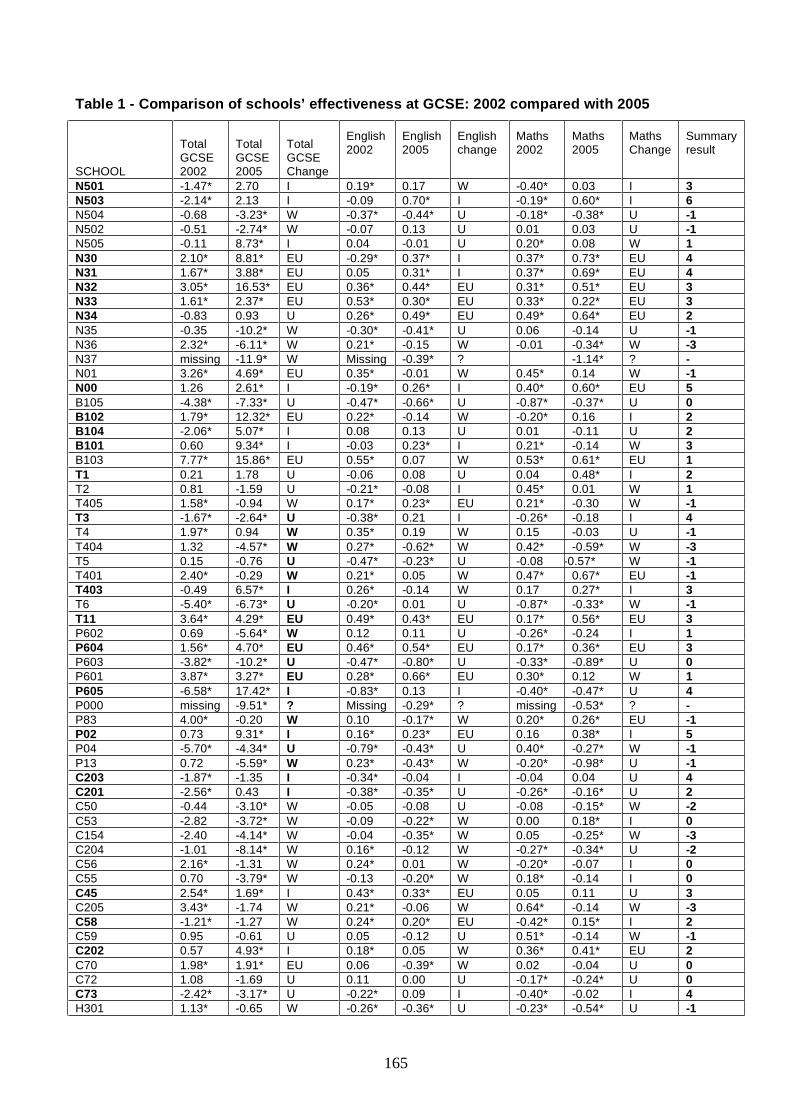
165
Table 1 - Comparison of schools’ effectiveness at GCSE: 2002 compared with 2005
SCHOOL
TotalGCSE2002
TotalGCSE2005
TotalGCSEChange
English2002
English2005
Englishchange
Maths2002
Maths2005
MathsChange
Summaryresult
N501 -1.47* 2.70 I 0.19* 0.17 W -0.40* 0.03 I 3N503 -2.14* 2.13 I -0.09 0.70* I -0.19* 0.60* I 6N504 -0.68 -3.23* W -0.37* -0.44* U -0.18* -0.38* U -1N502 -0.51 -2.74* W -0.07 0.13 U 0.01 0.03 U -1N505 -0.11 8.73* I 0.04 -0.01 U 0.20* 0.08 W 1N30 2.10* 8.81* EU -0.29* 0.37* I 0.37* 0.73* EU 4N31 1.67* 3.88* EU 0.05 0.31* I 0.37* 0.69* EU 4N32 3.05* 16.53* EU 0.36* 0.44* EU 0.31* 0.51* EU 3N33 1.61* 2.37* EU 0.53* 0.30* EU 0.33* 0.22* EU 3N34 -0.83 0.93 U 0.26* 0.49* EU 0.49* 0.64* EU 2N35 -0.35 -10.2* W -0.30* -0.41* U 0.06 -0.14 U -1N36 2.32* -6.11* W 0.21* -0.15 W -0.01 -0.34* W -3N37 missing -11.9* W Missing -0.39* ? -1.14* ? -N01 3.26* 4.69* EU 0.35* -0.01 W 0.45* 0.14 W -1N00 1.26 2.61* I -0.19* 0.26* I 0.40* 0.60* EU 5B105 -4.38* -7.33* U -0.47* -0.66* U -0.87* -0.37* U 0B102 1.79* 12.32* EU 0.22* -0.14 W -0.20* 0.16 I 2B104 -2.06* 5.07* I 0.08 0.13 U 0.01 -0.11 U 2B101 0.60 9.34* I -0.03 0.23* I 0.21* -0.14 W 3B103 7.77* 15.86* EU 0.55* 0.07 W 0.53* 0.61* EU 1T1 0.21 1.78 U -0.06 0.08 U 0.04 0.48* I 2T2 0.81 -1.59 U -0.21* -0.08 I 0.45* 0.01 W 1T405 1.58* -0.94 W 0.17* 0.23* EU 0.21* -0.30 W -1T3 -1.67* -2.64* U -0.38* 0.21 I -0.26* -0.18 I 4T4 1.97* 0.94 W 0.35* 0.19 W 0.15 -0.03 U -1T404 1.32 -4.57* W 0.27* -0.62* W 0.42* -0.59* W -3T5 0.15 -0.76 U -0.47* -0.23* U -0.08 -0.57* W -1T401 2.40* -0.29 W 0.21* 0.05 W 0.47* 0.67* EU -1T403 -0.49 6.57* I 0.26* -0.14 W 0.17 0.27* I 3T6 -5.40* -6.73* U -0.20* 0.01 U -0.87* -0.33* W -1T11 3.64* 4.29* EU 0.49* 0.43* EU 0.17* 0.56* EU 3P602 0.69 -5.64* W 0.12 0.11 U -0.26* -0.24 I 1P604 1.56* 4.70* EU 0.46* 0.54* EU 0.17* 0.36* EU 3P603 -3.82* -10.2* U -0.47* -0.80* U -0.33* -0.89* U 0P601 3.87* 3.27* EU 0.28* 0.66* EU 0.30* 0.12 W 1P605 -6.58* 17.42* I -0.83* 0.13 I -0.40* -0.47* U 4P000 missing -9.51* ? Missing -0.29* ? missing -0.53* ? -P83 4.00* -0.20 W 0.10 -0.17* W 0.20* 0.26* EU -1P02 0.73 9.31* I 0.16* 0.23* EU 0.16 0.38* I 5P04 -5.70* -4.34* U -0.79* -0.43* U 0.40* -0.27* W -1P13 0.72 -5.59* W 0.23* -0.43* W -0.20* -0.98* U -1C203 -1.87* -1.35 I -0.34* -0.04 I -0.04 0.04 U 4C201 -2.56* 0.43 I -0.38* -0.35* U -0.26* -0.16* U 2C50 -0.44 -3.10* W -0.05 -0.08 U -0.08 -0.15* W -2C53 -2.82 -3.72* W -0.09 -0.22* W 0.00 0.18* I 0C154 -2.40 -4.14* W -0.04 -0.35* W 0.05 -0.25* W -3C204 -1.01 -8.14* W 0.16* -0.12 W -0.27* -0.34* U -2C56 2.16* -1.31 W 0.24* 0.01 W -0.20* -0.07 I 0C55 0.70 -3.79* W -0.13 -0.20* W 0.18* -0.14 I 0C45 2.54* 1.69* I 0.43* 0.33* EU 0.05 0.11 U 3C205 3.43* -1.74 W 0.21* -0.06 W 0.64* -0.14 W -3C58 -1.21* -1.27 W 0.24* 0.20* EU -0.42* 0.15* I 2C59 0.95 -0.61 U 0.05 -0.12 U 0.51* -0.14 W -1C202 0.57 4.93* I 0.18* 0.05 W 0.36* 0.41* EU 2C70 1.98* 1.91* EU 0.06 -0.39* W 0.02 -0.04 U 0C72 1.08 -1.69 U 0.11 0.00 U -0.17* -0.24* U 0C73 -2.42* -3.17* U -0.22* 0.09 I -0.40* -0.02 I 4H301 1.13* -0.65 W -0.26* -0.36* U -0.23* -0.54* U -1
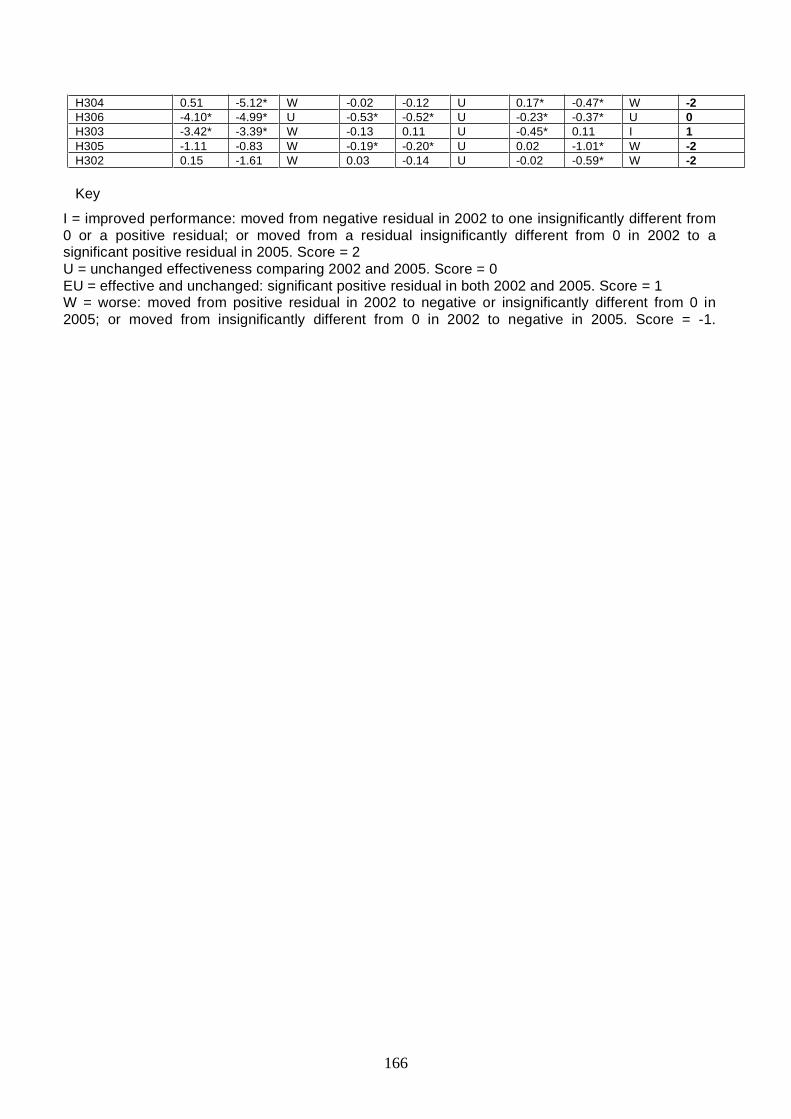
166
H304 0.51 -5.12* W -0.02 -0.12 U 0.17* -0.47* W -2H306 -4.10* -4.99* U -0.53* -0.52* U -0.23* -0.37* U 0H303 -3.42* -3.39* W -0.13 0.11 U -0.45* 0.11 I 1H305 -1.11 -0.83 W -0.19* -0.20* U 0.02 -1.01* W -2H302 0.15 -1.61 W 0.03 -0.14 U -0.02 -0.59* W -2
Key
I = improved performance: moved from negative residual in 2002 to one insignificantly different from0 or a positive residual; or moved from a residual insignificantly different from 0 in 2002 to asignificant positive residual in 2005. Score = 2U = unchanged effectiveness comparing 2002 and 2005. Score = 0EU = effective and unchanged: significant positive residual in both 2002 and 2005. Score = 1W = worse: moved from positive residual in 2002 to negative or insignificantly different from 0 in2005; or moved from insignificantly different from 0 in 2002 to negative in 2005. Score = -1.
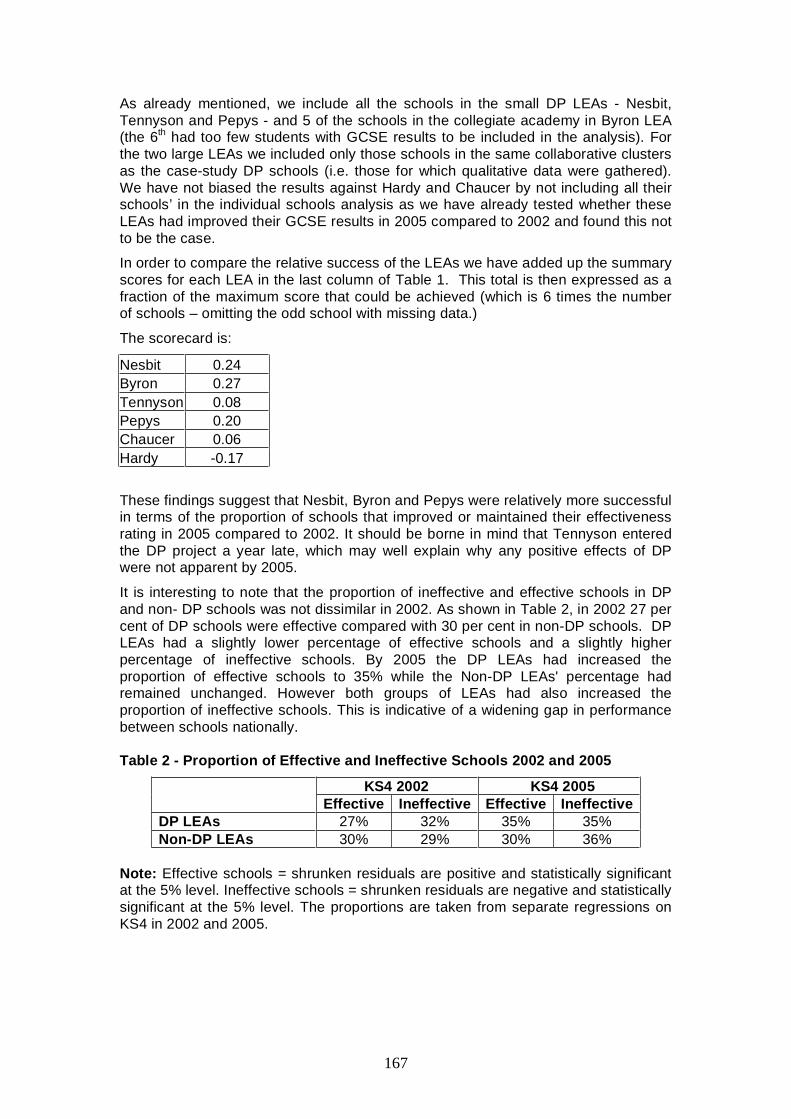
167
As already mentioned, we include all the schools in the small DP LEAs - Nesbit,Tennyson and Pepys - and 5 of the schools in the collegiate academy in Byron LEA(the 6th had too few students with GCSE results to be included in the analysis). Forthe two large LEAs we included only those schools in the same collaborative clustersas the case-study DP schools (i.e. those for which qualitative data were gathered).We have not biased the results against Hardy and Chaucer by not including all theirschools’ in the individual schools analysis as we have already tested whether theseLEAs had improved their GCSE results in 2005 compared to 2002 and found this notto be the case.
In order to compare the relative success of the LEAs we have added up the summaryscores for each LEA in the last column of Table 1. This total is then expressed as afraction of the maximum score that could be achieved (which is 6 times the numberof schools – omitting the odd school with missing data.)
The scorecard is:
Nesbit 0.24Byron 0.27Tennyson 0.08Pepys 0.20Chaucer 0.06Hardy -0.17
These findings suggest that Nesbit, Byron and Pepys were relatively more successfulin terms of the proportion of schools that improved or maintained their effectivenessrating in 2005 compared to 2002. It should be borne in mind that Tennyson enteredthe DP project a year late, which may well explain why any positive effects of DPwere not apparent by 2005.
It is interesting to note that the proportion of ineffective and effective schools in DPand non- DP schools was not dissimilar in 2002. As shown in Table 2, in 2002 27 percent of DP schools were effective compared with 30 per cent in non-DP schools. DPLEAs had a slightly lower percentage of effective schools and a slightly higherpercentage of ineffective schools. By 2005 the DP LEAs had increased theproportion of effective schools to 35% while the Non-DP LEAs' percentage hadremained unchanged. However both groups of LEAs had also increased theproportion of ineffective schools. This is indicative of a widening gap in performancebetween schools nationally.
Table 2 - Proportion of Effective and Ineffective Schools 2002 and 2005
KS4 2002 KS4 2005Effective Ineffective Effective Ineffective
DP LEAs 27% 32% 35% 35%Non-DP LEAs 30% 29% 30% 36%
Note: Effective schools = shrunken residuals are positive and statistically significantat the 5% level. Ineffective schools = shrunken residuals are negative and statisticallysignificant at the 5% level. The proportions are taken from separate regressions onKS4 in 2002 and 2005.
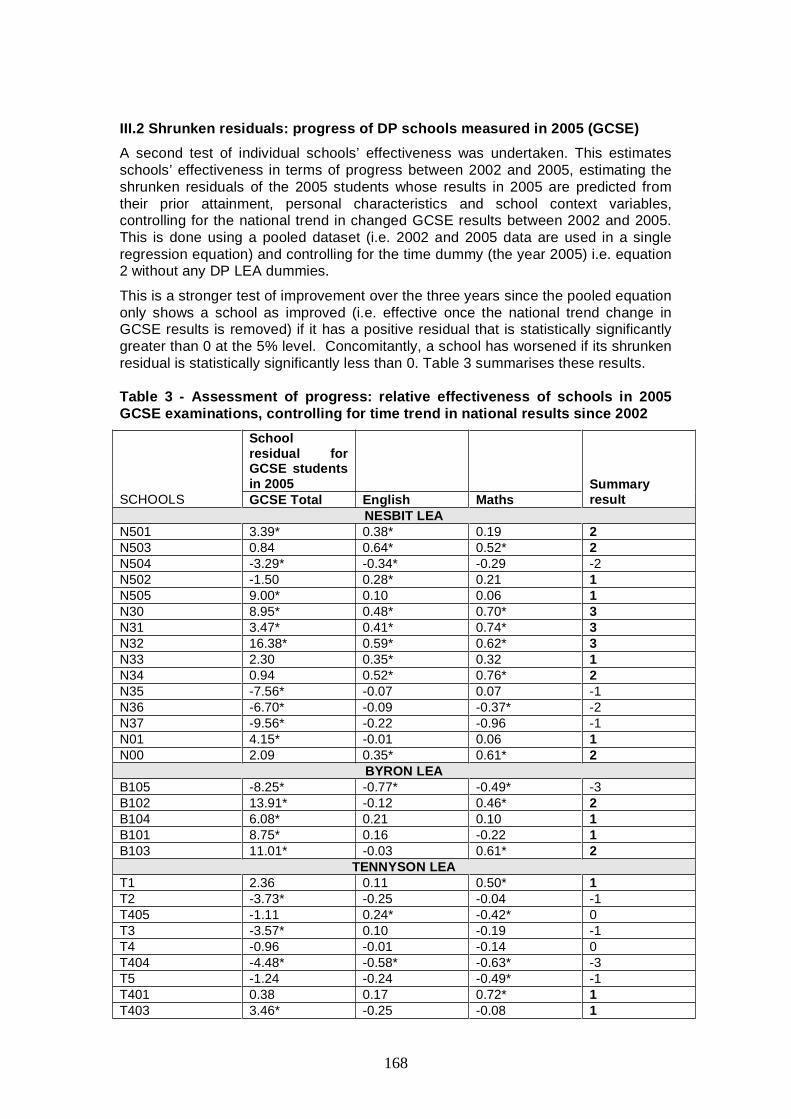
168
III.2 Shrunken residuals: progress of DP schools measured in 2005 (GCSE)A second test of individual schools’ effectiveness was undertaken. This estimatesschools’ effectiveness in terms of progress between 2002 and 2005, estimating theshrunken residuals of the 2005 students whose results in 2005 are predicted fromtheir prior attainment, personal characteristics and school context variables,controlling for the national trend in changed GCSE results between 2002 and 2005.This is done using a pooled dataset (i.e. 2002 and 2005 data are used in a singleregression equation) and controlling for the time dummy (the year 2005) i.e. equation2 without any DP LEA dummies.
This is a stronger test of improvement over the three years since the pooled equationonly shows a school as improved (i.e. effective once the national trend change inGCSE results is removed) if it has a positive residual that is statistically significantlygreater than 0 at the 5% level. Concomitantly, a school has worsened if its shrunkenresidual is statistically significantly less than 0. Table 3 summarises these results.
Table 3 - Assessment of progress: relative effectiveness of schools in 2005GCSE examinations, controlling for time trend in national results since 2002
Schoolresidual forGCSE studentsin 2005
SCHOOLS GCSE Total English MathsSummaryresult
NESBIT LEAN501 3.39* 0.38* 0.19 2N503 0.84 0.64* 0.52* 2N504 -3.29* -0.34* -0.29 -2N502 -1.50 0.28* 0.21 1N505 9.00* 0.10 0.06 1N30 8.95* 0.48* 0.70* 3N31 3.47* 0.41* 0.74* 3N32 16.38* 0.59* 0.62* 3N33 2.30 0.35* 0.32 1N34 0.94 0.52* 0.76* 2N35 -7.56* -0.07 0.07 -1N36 -6.70* -0.09 -0.37* -2N37 -9.56* -0.22 -0.96 -1N01 4.15* -0.01 0.06 1N00 2.09 0.35* 0.61* 2
BYRON LEAB105 -8.25* -0.77* -0.49* -3B102 13.91* -0.12 0.46* 2B104 6.08* 0.21 0.10 1B101 8.75* 0.16 -0.22 1B103 11.01* -0.03 0.61* 2
TENNYSON LEAT1 2.36 0.11 0.50* 1T2 -3.73* -0.25 -0.04 -1T405 -1.11 0.24* -0.42* 0T3 -3.57* 0.10 -0.19 -1T4 -0.96 -0.01 -0.14 0T404 -4.48* -0.58* -0.63* -3T5 -1.24 -0.24 -0.49* -1T401 0.38 0.17 0.72* 1T403 3.46* -0.25 -0.08 1
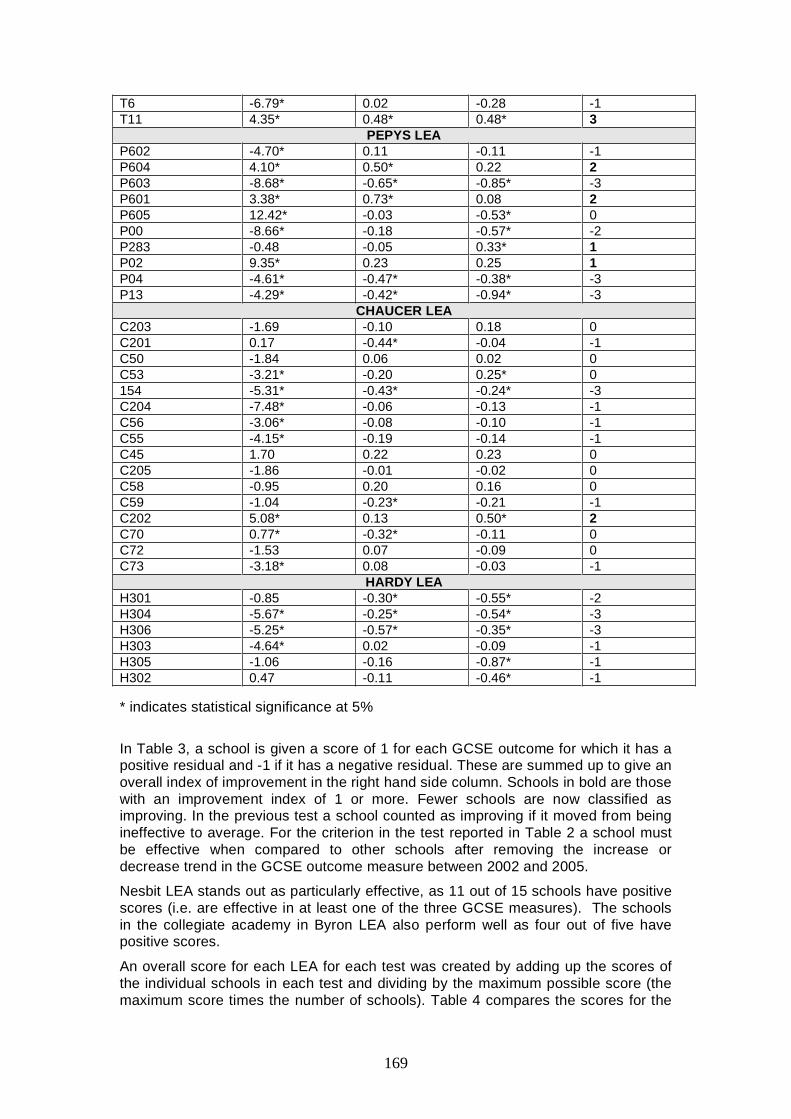
169
T6 -6.79* 0.02 -0.28 -1T11 4.35* 0.48* 0.48* 3
PEPYS LEAP602 -4.70* 0.11 -0.11 -1P604 4.10* 0.50* 0.22 2P603 -8.68* -0.65* -0.85* -3P601 3.38* 0.73* 0.08 2P605 12.42* -0.03 -0.53* 0P00 -8.66* -0.18 -0.57* -2P283 -0.48 -0.05 0.33* 1P02 9.35* 0.23 0.25 1P04 -4.61* -0.47* -0.38* -3P13 -4.29* -0.42* -0.94* -3
CHAUCER LEAC203 -1.69 -0.10 0.18 0C201 0.17 -0.44* -0.04 -1C50 -1.84 0.06 0.02 0C53 -3.21* -0.20 0.25* 0154 -5.31* -0.43* -0.24* -3C204 -7.48* -0.06 -0.13 -1C56 -3.06* -0.08 -0.10 -1C55 -4.15* -0.19 -0.14 -1C45 1.70 0.22 0.23 0C205 -1.86 -0.01 -0.02 0C58 -0.95 0.20 0.16 0C59 -1.04 -0.23* -0.21 -1C202 5.08* 0.13 0.50* 2C70 0.77* -0.32* -0.11 0C72 -1.53 0.07 -0.09 0C73 -3.18* 0.08 -0.03 -1
HARDY LEAH301 -0.85 -0.30* -0.55* -2H304 -5.67* -0.25* -0.54* -3H306 -5.25* -0.57* -0.35* -3H303 -4.64* 0.02 -0.09 -1H305 -1.06 -0.16 -0.87* -1H302 0.47 -0.11 -0.46* -1
* indicates statistical significance at 5%
In Table 3, a school is given a score of 1 for each GCSE outcome for which it has apositive residual and -1 if it has a negative residual. These are summed up to give anoverall index of improvement in the right hand side column. Schools in bold are thosewith an improvement index of 1 or more. Fewer schools are now classified asimproving. In the previous test a school counted as improving if it moved from beingineffective to average. For the criterion in the test reported in Table 2 a school mustbe effective when compared to other schools after removing the increase ordecrease trend in the GCSE outcome measure between 2002 and 2005.
Nesbit LEA stands out as particularly effective, as 11 out of 15 schools have positivescores (i.e. are effective in at least one of the three GCSE measures). The schoolsin the collegiate academy in Byron LEA also perform well as four out of five havepositive scores.
An overall score for each LEA for each test was created by adding up the scores ofthe individual schools in each test and dividing by the maximum possible score (themaximum score times the number of schools). Table 4 compares the scores for the
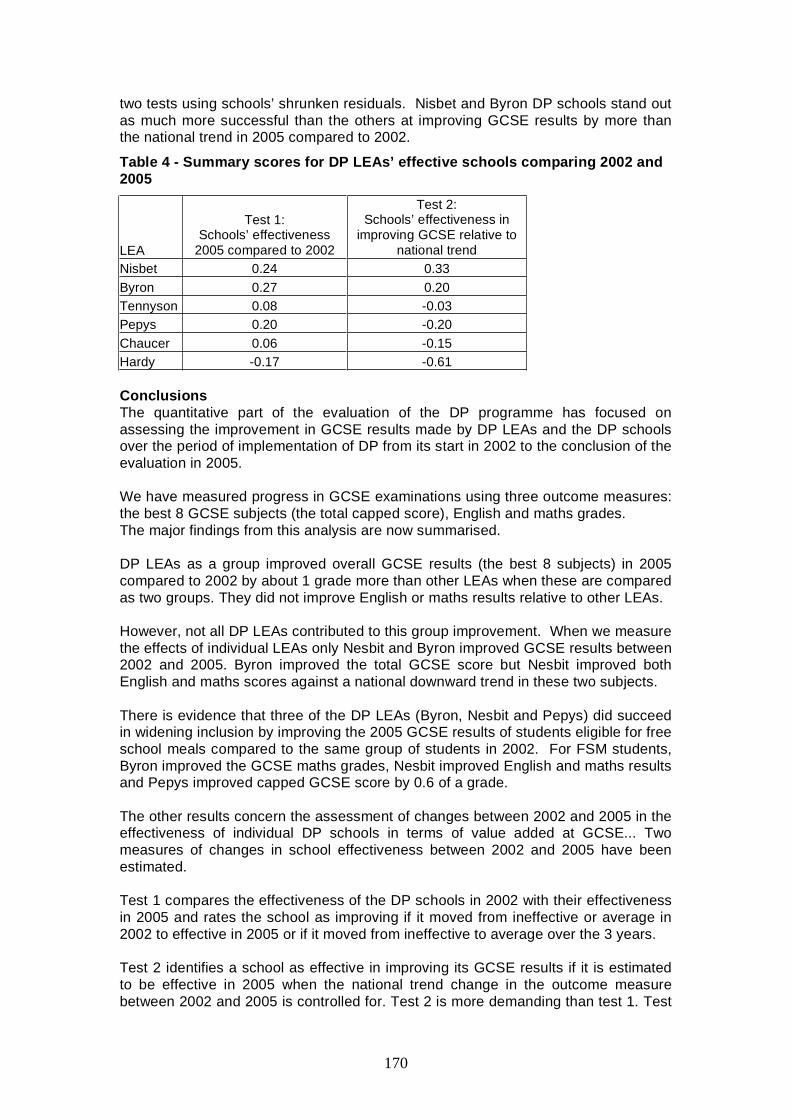
170
two tests using schools’ shrunken residuals. Nisbet and Byron DP schools stand outas much more successful than the others at improving GCSE results by more thanthe national trend in 2005 compared to 2002.
Table 4 - Summary scores for DP LEAs’ effective schools comparing 2002 and2005
LEA
Test 1:Schools’ effectiveness
2005 compared to 2002
Test 2:Schools’ effectiveness in
improving GCSE relative tonational trend
Nisbet 0.24 0.33Byron 0.27 0.20Tennyson 0.08 -0.03Pepys 0.20 -0.20Chaucer 0.06 -0.15Hardy -0.17 -0.61
ConclusionsThe quantitative part of the evaluation of the DP programme has focused onassessing the improvement in GCSE results made by DP LEAs and the DP schoolsover the period of implementation of DP from its start in 2002 to the conclusion of theevaluation in 2005.
We have measured progress in GCSE examinations using three outcome measures:the best 8 GCSE subjects (the total capped score), English and maths grades.The major findings from this analysis are now summarised.
DP LEAs as a group improved overall GCSE results (the best 8 subjects) in 2005compared to 2002 by about 1 grade more than other LEAs when these are comparedas two groups. They did not improve English or maths results relative to other LEAs.
However, not all DP LEAs contributed to this group improvement. When we measurethe effects of individual LEAs only Nesbit and Byron improved GCSE results between2002 and 2005. Byron improved the total GCSE score but Nesbit improved bothEnglish and maths scores against a national downward trend in these two subjects.
There is evidence that three of the DP LEAs (Byron, Nesbit and Pepys) did succeedin widening inclusion by improving the 2005 GCSE results of students eligible for freeschool meals compared to the same group of students in 2002. For FSM students,Byron improved the GCSE maths grades, Nesbit improved English and maths resultsand Pepys improved capped GCSE score by 0.6 of a grade.
The other results concern the assessment of changes between 2002 and 2005 in theeffectiveness of individual DP schools in terms of value added at GCSE... Twomeasures of changes in school effectiveness between 2002 and 2005 have beenestimated.
Test 1 compares the effectiveness of the DP schools in 2002 with their effectivenessin 2005 and rates the school as improving if it moved from ineffective or average in2002 to effective in 2005 or if it moved from ineffective to average over the 3 years.
Test 2 identifies a school as effective in improving its GCSE results if it is estimatedto be effective in 2005 when the national trend change in the outcome measurebetween 2002 and 2005 is controlled for. Test 2 is more demanding than test 1. Test

171
1 identifies at least one improving school in at least one GCSE outcome in each LEA(restricted in the two large LEAs to the collaborative clusters of schools which werepartnered with the DP case study schools). Test 2 also identifies some effective DPschools in each LEA, apart from the 6 schools studied in Hardy LEA, all of whichattained less well in comparison to national performance in 2005 compared to 2002.
Using the results from both tests 1 and 2 (which are summarized in Table 4) Nesbitand Byron are the only DP LEAs where the DP schools have improved their GCSEperformance relative to the national trend between 2002 and 2005. Pepys is shownas improving using test 1 but not test 2. It does, however, perform well in terms ofimproving overall GCSE results for students from poor home backgrounds.Tennyson had only been in the DP project for 2 years, which may account for its lackof improvement so far. The two large LEAs, Chaucer and Hardy, did not showimprovement relative to the national trend. However, in Chaucer 3 of the 5 casestudy DP schools improved under test 1 and one of these schools met the moreexacting test 2 criteria of improving or maintaining two GCSE outcomes.
In explaining these findings the main contrast between the two more successful DPLEAs and the two least successful (as measured by the indicators we have used) isthat the first pair concentrated their DP funding on fewer schools. This is particularlyso in the case of Byron’s collegiate academy. Nesbit, a relatively small LEA,combined its DP funding with funding for other initiatives so that DP was not clearlydistinguishable from Nesbit’s other efforts at school collaboration. Chaucer andHardy distributed their DP money very thinly across all their schools.
These findings therefore indicate that funds for encouraging schools to collaborate asa means to improve students’ educational attainment need to be sufficient to makean impact and that LEAs which focus their efforts on a small number of schools andcombine several sources of funding and initiatives in a synergetic way, are likely tobe more successful.
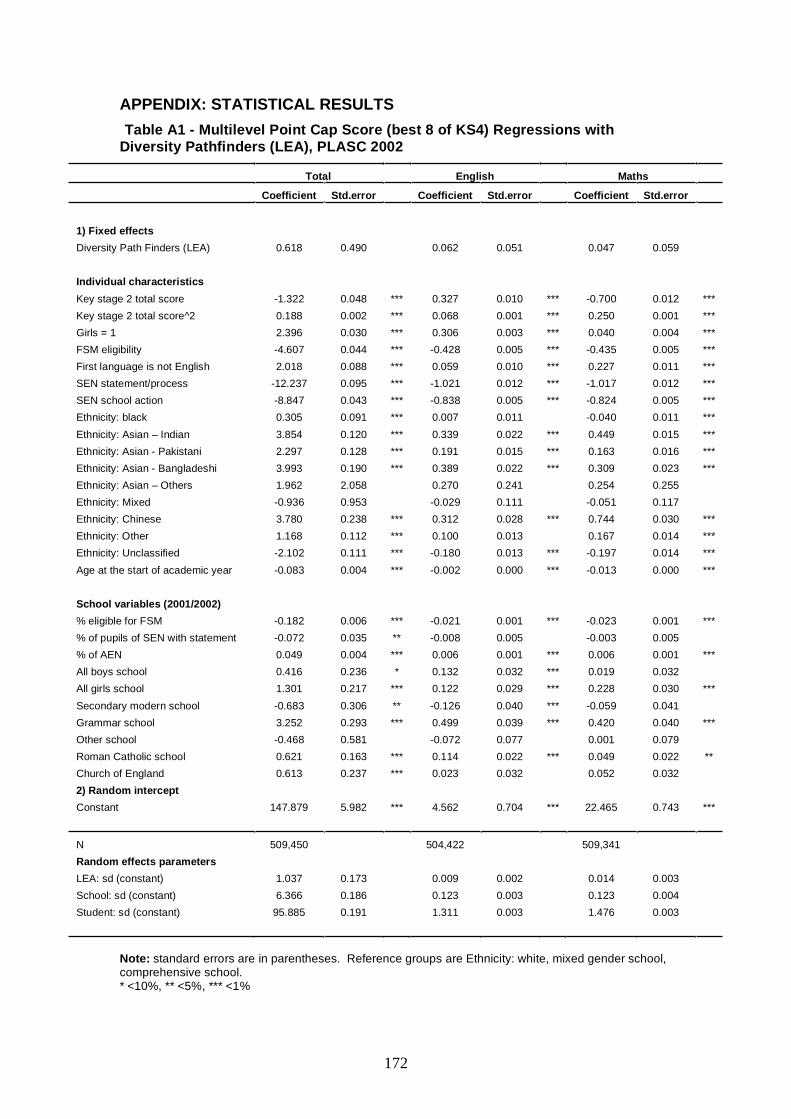
172
APPENDIX: STATISTICAL RESULTSTable A1 - Multilevel Point Cap Score (best 8 of KS4) Regressions with
Diversity Pathfinders (LEA), PLASC 2002
Total English Maths
Coefficient Std.error Coefficient Std.error Coefficient Std.error
1) Fixed effectsDiversity Path Finders (LEA) 0.618 0.490 0.062 0.051 0.047 0.059
Individual characteristicsKey stage 2 total score -1.322 0.048 *** 0.327 0.010 *** -0.700 0.012 ***Key stage 2 total score^2 0.188 0.002 *** 0.068 0.001 *** 0.250 0.001 ***Girls = 1 2.396 0.030 *** 0.306 0.003 *** 0.040 0.004 ***FSM eligibility -4.607 0.044 *** -0.428 0.005 *** -0.435 0.005 ***First language is not English 2.018 0.088 *** 0.059 0.010 *** 0.227 0.011 ***SEN statement/process -12.237 0.095 *** -1.021 0.012 *** -1.017 0.012 ***SEN school action -8.847 0.043 *** -0.838 0.005 *** -0.824 0.005 ***Ethnicity: black 0.305 0.091 *** 0.007 0.011 -0.040 0.011 ***Ethnicity: Asian – Indian 3.854 0.120 *** 0.339 0.022 *** 0.449 0.015 ***Ethnicity: Asian - Pakistani 2.297 0.128 *** 0.191 0.015 *** 0.163 0.016 ***Ethnicity: Asian - Bangladeshi 3.993 0.190 *** 0.389 0.022 *** 0.309 0.023 ***Ethnicity: Asian – Others 1.962 2.058 0.270 0.241 0.254 0.255Ethnicity: Mixed -0.936 0.953 -0.029 0.111 -0.051 0.117Ethnicity: Chinese 3.780 0.238 *** 0.312 0.028 *** 0.744 0.030 ***Ethnicity: Other 1.168 0.112 *** 0.100 0.013 0.167 0.014 ***Ethnicity: Unclassified -2.102 0.111 *** -0.180 0.013 *** -0.197 0.014 ***Age at the start of academic year -0.083 0.004 *** -0.002 0.000 *** -0.013 0.000 ***
School variables (2001/2002)% eligible for FSM -0.182 0.006 *** -0.021 0.001 *** -0.023 0.001 ***% of pupils of SEN with statement -0.072 0.035 ** -0.008 0.005 -0.003 0.005% of AEN 0.049 0.004 *** 0.006 0.001 *** 0.006 0.001 ***All boys school 0.416 0.236 * 0.132 0.032 *** 0.019 0.032All girls school 1.301 0.217 *** 0.122 0.029 *** 0.228 0.030 ***Secondary modern school -0.683 0.306 ** -0.126 0.040 *** -0.059 0.041Grammar school 3.252 0.293 *** 0.499 0.039 *** 0.420 0.040 ***Other school -0.468 0.581 -0.072 0.077 0.001 0.079Roman Catholic school 0.621 0.163 *** 0.114 0.022 *** 0.049 0.022 **Church of England 0.613 0.237 *** 0.023 0.032 0.052 0.0322) Random interceptConstant 147.879 5.982 *** 4.562 0.704 *** 22.465 0.743 ***
N 509,450 504,422 509,341Random effects parametersLEA: sd (constant) 1.037 0.173 0.009 0.002 0.014 0.003School: sd (constant) 6.366 0.186 0.123 0.003 0.123 0.004Student: sd (constant) 95.885 0.191 1.311 0.003 1.476 0.003
Note: standard errors are in parentheses. Reference groups are Ethnicity: white, mixed gender school,comprehensive school.* <10%, ** <5%, *** <1%
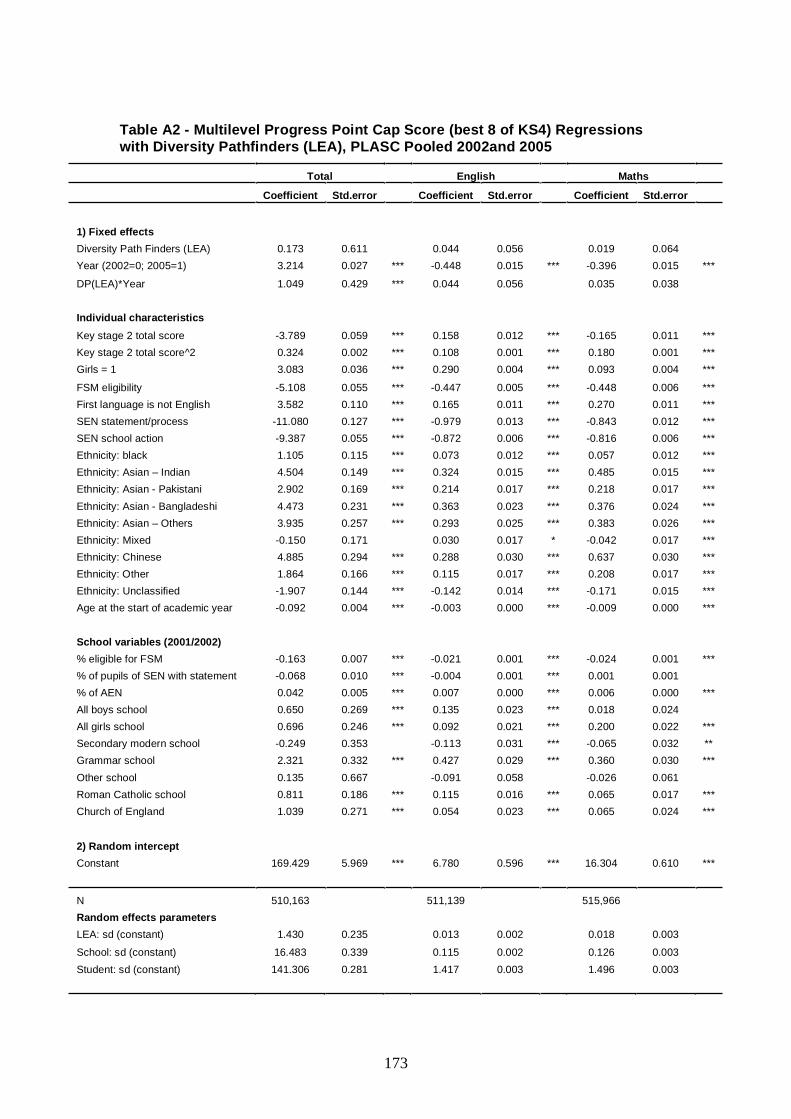
173
Table A2 - Multilevel Progress Point Cap Score (best 8 of KS4) Regressionswith Diversity Pathfinders (LEA), PLASC Pooled 2002and 2005
Total English Maths
Coefficient Std.error Coefficient Std.error Coefficient Std.error
1) Fixed effectsDiversity Path Finders (LEA) 0.173 0.611 0.044 0.056 0.019 0.064Year (2002=0; 2005=1) 3.214 0.027 *** -0.448 0.015 *** -0.396 0.015 ***
DP(LEA)*Year 1.049 0.429 *** 0.044 0.056 0.035 0.038
Individual characteristicsKey stage 2 total score -3.789 0.059 *** 0.158 0.012 *** -0.165 0.011 ***Key stage 2 total score^2 0.324 0.002 *** 0.108 0.001 *** 0.180 0.001 ***Girls = 1 3.083 0.036 *** 0.290 0.004 *** 0.093 0.004 ***
FSM eligibility -5.108 0.055 *** -0.447 0.005 *** -0.448 0.006 ***First language is not English 3.582 0.110 *** 0.165 0.011 *** 0.270 0.011 ***SEN statement/process -11.080 0.127 *** -0.979 0.013 *** -0.843 0.012 ***SEN school action -9.387 0.055 *** -0.872 0.006 *** -0.816 0.006 ***Ethnicity: black 1.105 0.115 *** 0.073 0.012 *** 0.057 0.012 ***Ethnicity: Asian – Indian 4.504 0.149 *** 0.324 0.015 *** 0.485 0.015 ***Ethnicity: Asian - Pakistani 2.902 0.169 *** 0.214 0.017 *** 0.218 0.017 ***Ethnicity: Asian - Bangladeshi 4.473 0.231 *** 0.363 0.023 *** 0.376 0.024 ***Ethnicity: Asian – Others 3.935 0.257 *** 0.293 0.025 *** 0.383 0.026 ***Ethnicity: Mixed -0.150 0.171 0.030 0.017 * -0.042 0.017 ***Ethnicity: Chinese 4.885 0.294 *** 0.288 0.030 *** 0.637 0.030 ***Ethnicity: Other 1.864 0.166 *** 0.115 0.017 *** 0.208 0.017 ***Ethnicity: Unclassified -1.907 0.144 *** -0.142 0.014 *** -0.171 0.015 ***Age at the start of academic year -0.092 0.004 *** -0.003 0.000 *** -0.009 0.000 ***
School variables (2001/2002)% eligible for FSM -0.163 0.007 *** -0.021 0.001 *** -0.024 0.001 ***% of pupils of SEN with statement -0.068 0.010 *** -0.004 0.001 *** 0.001 0.001% of AEN 0.042 0.005 *** 0.007 0.000 *** 0.006 0.000 ***All boys school 0.650 0.269 *** 0.135 0.023 *** 0.018 0.024All girls school 0.696 0.246 *** 0.092 0.021 *** 0.200 0.022 ***Secondary modern school -0.249 0.353 -0.113 0.031 *** -0.065 0.032 **Grammar school 2.321 0.332 *** 0.427 0.029 *** 0.360 0.030 ***Other school 0.135 0.667 -0.091 0.058 -0.026 0.061Roman Catholic school 0.811 0.186 *** 0.115 0.016 *** 0.065 0.017 ***Church of England 1.039 0.271 *** 0.054 0.023 *** 0.065 0.024 ***
2) Random interceptConstant 169.429 5.969 *** 6.780 0.596 *** 16.304 0.610 ***
N 510,163 511,139 515,966Random effects parametersLEA: sd (constant) 1.430 0.235 0.013 0.002 0.018 0.003
School: sd (constant) 16.483 0.339 0.115 0.002 0.126 0.003Student: sd (constant) 141.306 0.281 1.417 0.003 1.496 0.003
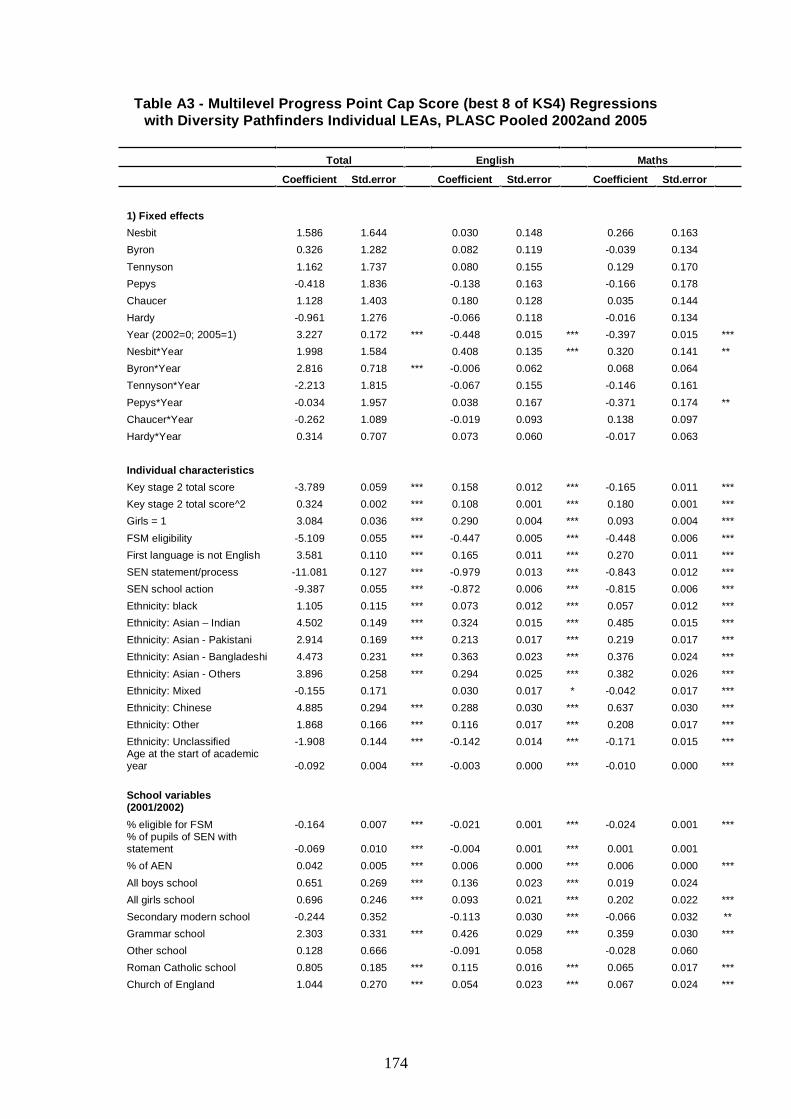
174
Table A3 - Multilevel Progress Point Cap Score (best 8 of KS4) Regressionswith Diversity Pathfinders Individual LEAs, PLASC Pooled 2002and 2005
Total English Maths
Coefficient Std.error Coefficient Std.error Coefficient Std.error
1) Fixed effectsNesbit 1.586 1.644 0.030 0.148 0.266 0.163Byron 0.326 1.282 0.082 0.119 -0.039 0.134Tennyson 1.162 1.737 0.080 0.155 0.129 0.170Pepys -0.418 1.836 -0.138 0.163 -0.166 0.178Chaucer 1.128 1.403 0.180 0.128 0.035 0.144Hardy -0.961 1.276 -0.066 0.118 -0.016 0.134Year (2002=0; 2005=1) 3.227 0.172 *** -0.448 0.015 *** -0.397 0.015 ***Nesbit*Year 1.998 1.584 0.408 0.135 *** 0.320 0.141 **Byron*Year 2.816 0.718 *** -0.006 0.062 0.068 0.064Tennyson*Year -2.213 1.815 -0.067 0.155 -0.146 0.161Pepys*Year -0.034 1.957 0.038 0.167 -0.371 0.174 **Chaucer*Year -0.262 1.089 -0.019 0.093 0.138 0.097Hardy*Year 0.314 0.707 0.073 0.060 -0.017 0.063
Individual characteristicsKey stage 2 total score -3.789 0.059 *** 0.158 0.012 *** -0.165 0.011 ***Key stage 2 total score^2 0.324 0.002 *** 0.108 0.001 *** 0.180 0.001 ***Girls = 1 3.084 0.036 *** 0.290 0.004 *** 0.093 0.004 ***FSM eligibility -5.109 0.055 *** -0.447 0.005 *** -0.448 0.006 ***First language is not English 3.581 0.110 *** 0.165 0.011 *** 0.270 0.011 ***SEN statement/process -11.081 0.127 *** -0.979 0.013 *** -0.843 0.012 ***SEN school action -9.387 0.055 *** -0.872 0.006 *** -0.815 0.006 ***Ethnicity: black 1.105 0.115 *** 0.073 0.012 *** 0.057 0.012 ***Ethnicity: Asian – Indian 4.502 0.149 *** 0.324 0.015 *** 0.485 0.015 ***Ethnicity: Asian - Pakistani 2.914 0.169 *** 0.213 0.017 *** 0.219 0.017 ***Ethnicity: Asian - Bangladeshi 4.473 0.231 *** 0.363 0.023 *** 0.376 0.024 ***Ethnicity: Asian - Others 3.896 0.258 *** 0.294 0.025 *** 0.382 0.026 ***Ethnicity: Mixed -0.155 0.171 0.030 0.017 * -0.042 0.017 ***Ethnicity: Chinese 4.885 0.294 *** 0.288 0.030 *** 0.637 0.030 ***Ethnicity: Other 1.868 0.166 *** 0.116 0.017 *** 0.208 0.017 ***Ethnicity: Unclassified -1.908 0.144 *** -0.142 0.014 *** -0.171 0.015 ***Age at the start of academicyear -0.092 0.004 *** -0.003 0.000 *** -0.010 0.000 ***
School variables(2001/2002)% eligible for FSM -0.164 0.007 *** -0.021 0.001 *** -0.024 0.001 ***% of pupils of SEN withstatement -0.069 0.010 *** -0.004 0.001 *** 0.001 0.001% of AEN 0.042 0.005 *** 0.006 0.000 *** 0.006 0.000 ***All boys school 0.651 0.269 *** 0.136 0.023 *** 0.019 0.024All girls school 0.696 0.246 *** 0.093 0.021 *** 0.202 0.022 ***Secondary modern school -0.244 0.352 -0.113 0.030 *** -0.066 0.032 **Grammar school 2.303 0.331 *** 0.426 0.029 *** 0.359 0.030 ***Other school 0.128 0.666 -0.091 0.058 -0.028 0.060Roman Catholic school 0.805 0.185 *** 0.115 0.016 *** 0.065 0.017 ***Church of England 1.044 0.270 *** 0.054 0.023 *** 0.067 0.024 ***

175
2) Random interceptConstant 169.609 5.975 *** 6.785 0.596 *** 16.341 0.610 ***
N 510,163 511,139 515,966Random effects parametersLEA: sd(constant) 1.360 0.226 0.012 0.002 0.016 0.002School: sd(constant) 16.444 0.338 0.115 0.002 0.126 0.003Student: sd(constant) 141.307 0.281 1.417 0.003 1.496 0.003
Note: see Table A1.
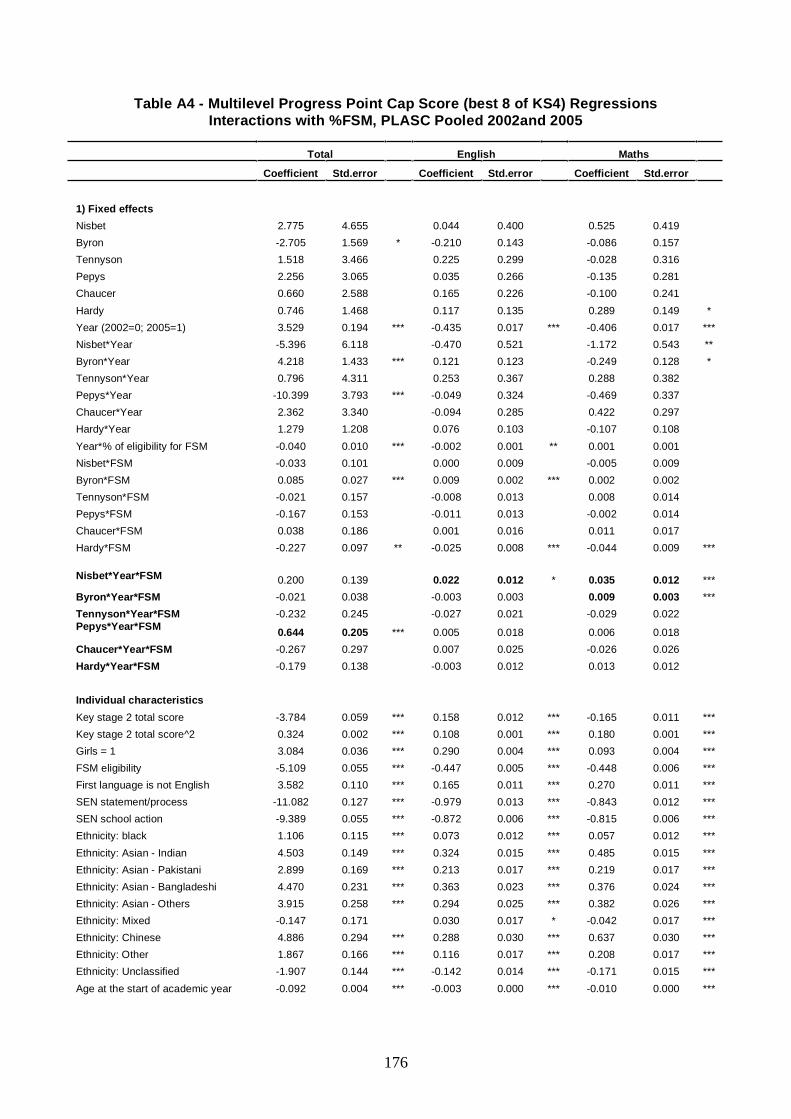
176
Table A4 - Multilevel Progress Point Cap Score (best 8 of KS4) RegressionsInteractions with %FSM, PLASC Pooled 2002and 2005
Total English Maths
Coefficient Std.error Coefficient Std.error Coefficient Std.error
1) Fixed effectsNisbet 2.775 4.655 0.044 0.400 0.525 0.419Byron -2.705 1.569 * -0.210 0.143 -0.086 0.157Tennyson 1.518 3.466 0.225 0.299 -0.028 0.316Pepys 2.256 3.065 0.035 0.266 -0.135 0.281Chaucer 0.660 2.588 0.165 0.226 -0.100 0.241Hardy 0.746 1.468 0.117 0.135 0.289 0.149 *Year (2002=0; 2005=1) 3.529 0.194 *** -0.435 0.017 *** -0.406 0.017 ***Nisbet*Year -5.396 6.118 -0.470 0.521 -1.172 0.543 **Byron*Year 4.218 1.433 *** 0.121 0.123 -0.249 0.128 *Tennyson*Year 0.796 4.311 0.253 0.367 0.288 0.382Pepys*Year -10.399 3.793 *** -0.049 0.324 -0.469 0.337Chaucer*Year 2.362 3.340 -0.094 0.285 0.422 0.297Hardy*Year 1.279 1.208 0.076 0.103 -0.107 0.108Year*% of eligibility for FSM -0.040 0.010 *** -0.002 0.001 ** 0.001 0.001Nisbet*FSM -0.033 0.101 0.000 0.009 -0.005 0.009Byron*FSM 0.085 0.027 *** 0.009 0.002 *** 0.002 0.002Tennyson*FSM -0.021 0.157 -0.008 0.013 0.008 0.014Pepys*FSM -0.167 0.153 -0.011 0.013 -0.002 0.014Chaucer*FSM 0.038 0.186 0.001 0.016 0.011 0.017Hardy*FSM -0.227 0.097 ** -0.025 0.008 *** -0.044 0.009 ***
Nisbet*Year*FSM 0.200 0.139 0.022 0.012 * 0.035 0.012 ***Byron*Year*FSM -0.021 0.038 -0.003 0.003 0.009 0.003 ***Tennyson*Year*FSM -0.232 0.245 -0.027 0.021 -0.029 0.022Pepys*Year*FSM 0.644 0.205 *** 0.005 0.018 0.006 0.018Chaucer*Year*FSM -0.267 0.297 0.007 0.025 -0.026 0.026Hardy*Year*FSM -0.179 0.138 -0.003 0.012 0.013 0.012
Individual characteristicsKey stage 2 total score -3.784 0.059 *** 0.158 0.012 *** -0.165 0.011 ***Key stage 2 total score^2 0.324 0.002 *** 0.108 0.001 *** 0.180 0.001 ***Girls = 1 3.084 0.036 *** 0.290 0.004 *** 0.093 0.004 ***FSM eligibility -5.109 0.055 *** -0.447 0.005 *** -0.448 0.006 ***First language is not English 3.582 0.110 *** 0.165 0.011 *** 0.270 0.011 ***SEN statement/process -11.082 0.127 *** -0.979 0.013 *** -0.843 0.012 ***SEN school action -9.389 0.055 *** -0.872 0.006 *** -0.815 0.006 ***Ethnicity: black 1.106 0.115 *** 0.073 0.012 *** 0.057 0.012 ***Ethnicity: Asian - Indian 4.503 0.149 *** 0.324 0.015 *** 0.485 0.015 ***Ethnicity: Asian - Pakistani 2.899 0.169 *** 0.213 0.017 *** 0.219 0.017 ***Ethnicity: Asian - Bangladeshi 4.470 0.231 *** 0.363 0.023 *** 0.376 0.024 ***Ethnicity: Asian - Others 3.915 0.258 *** 0.294 0.025 *** 0.382 0.026 ***Ethnicity: Mixed -0.147 0.171 0.030 0.017 * -0.042 0.017 ***Ethnicity: Chinese 4.886 0.294 *** 0.288 0.030 *** 0.637 0.030 ***Ethnicity: Other 1.867 0.166 *** 0.116 0.017 *** 0.208 0.017 ***Ethnicity: Unclassified -1.907 0.144 *** -0.142 0.014 *** -0.171 0.015 ***Age at the start of academic year -0.092 0.004 *** -0.003 0.000 *** -0.010 0.000 ***

177
School variables (2001/2002)% eligible for FSM -0.154 0.008 *** -0.021 0.001 *** -0.024 0.001 ***% of pupils of SEN with statement -0.045 0.011 *** -0.004 0.001 *** 0.001 0.001% of AEN 0.040 0.005 *** 0.006 0.000 *** 0.006 0.000 ***All boys school 0.639 0.268 *** 0.136 0.023 *** 0.019 0.024All girls school 0.737 0.245 *** 0.093 0.021 *** 0.202 0.022 ***Secondary modern school -0.279 0.351 -0.113 0.030 *** -0.066 0.032 **Grammar school 2.502 0.331 *** 0.426 0.029 *** 0.359 0.030 ***Other school 0.158 0.663 -0.091 0.058 -0.028 0.060Roman Catholic school 0.807 0.185 *** 0.115 0.016 *** 0.065 0.017 ***Church of England 0.989 0.269 *** 0.054 0.023 *** 0.067 0.024 ***
2) Random interceptConstant 169.383 5.971 *** 6.769 0.596 *** 16.316 0.610 ***
N 510,163 511,139 515,966Random effects parametersLEA: sd(constant) 1.407 0.23 0.013 0.002 0.016 0.002School: sd(constant) 16.209 0.334 0.114 0.002 0.124 0.003Student: sd(constant) 141.306 0.281 1.417 0.003 1.496 0.003
Note: standard errors are in parentheses. Reference groups are Ethnicity: white, mixed gender school,comprehensive school.* <10%, ** <5%, *** <1%
178
Appendix E - Teacher time spent on collaborative activities:
Summary of data from Head of Department proformas Spring andSummer Terms 200327
Heads of department were asked about the hours teachers had spent on thefollowing activities:
Meetings = total meetings x teacher hoursCPD = total CPD x teacher hoursTeachers out = total teacher hours out of school for teaching and adviceTeachers in = total teacher hours coming in for teaching and adviceStudents in = total teacher hours involved in students coming in to schoolStudents out = total teacher hours involved in students going out of schoolOther = total teacher hours involved in other DP activitiesTotal = total of all these activities
The tables below show the number of teacher hours each school reported on thelisted activities for the two terms surveyed and the total hours.Non-responses are noted.
27+ Spring 2004 for Tennyson
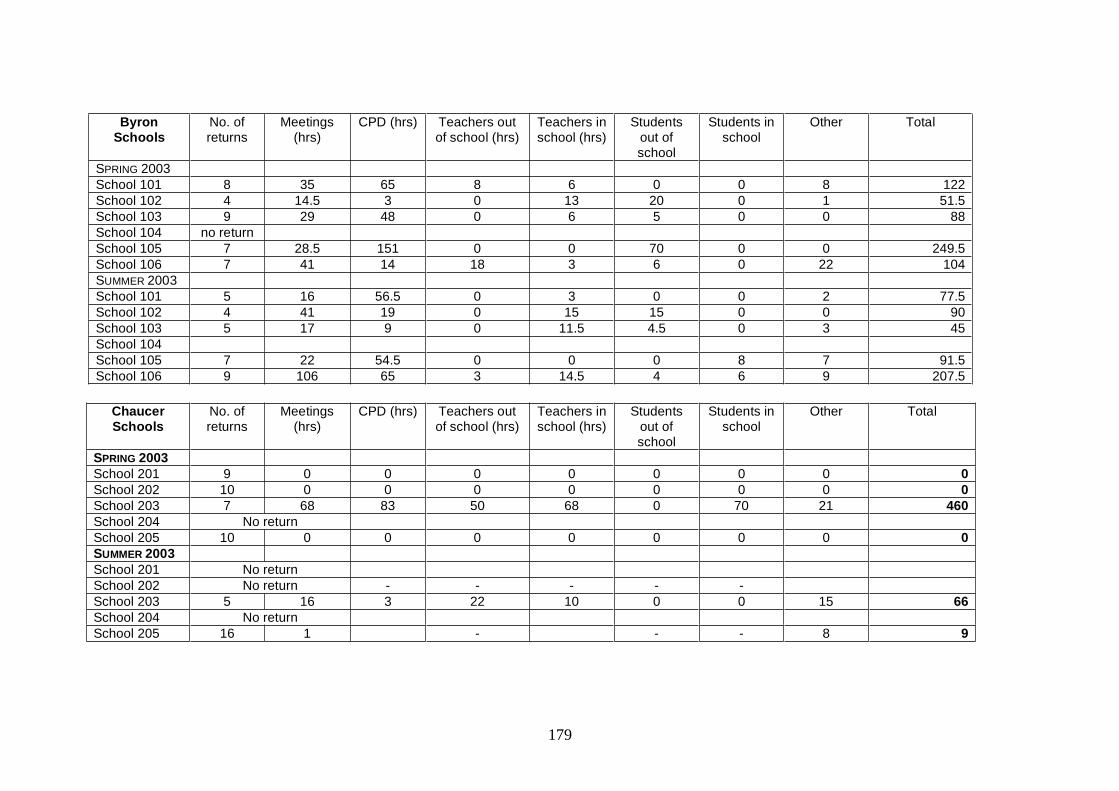
179
ByronSchools
No. ofreturns
Meetings(hrs)
CPD (hrs) Teachers outof school (hrs)
Teachers inschool (hrs)
Studentsout ofschool
Students inschool
Other Total
SPRING 2003School 101 8 35 65 8 6 0 0 8 122School 102 4 14.5 3 0 13 20 0 1 51.5School 103 9 29 48 0 6 5 0 0 88School 104 no returnSchool 105 7 28.5 151 0 0 70 0 0 249.5School 106 7 41 14 18 3 6 0 22 104SUMMER 2003School 101 5 16 56.5 0 3 0 0 2 77.5School 102 4 41 19 0 15 15 0 0 90School 103 5 17 9 0 11.5 4.5 0 3 45School 104School 105 7 22 54.5 0 0 0 8 7 91.5School 106 9 106 65 3 14.5 4 6 9 207.5
ChaucerSchools
No. ofreturns
Meetings(hrs)
CPD (hrs) Teachers outof school (hrs)
Teachers inschool (hrs)
Studentsout ofschool
Students inschool
Other Total
SPRING 2003School 201 9 0 0 0 0 0 0 0 0School 202 10 0 0 0 0 0 0 0 0School 203 7 68 83 50 68 0 70 21 460School 204 No returnSchool 205 10 0 0 0 0 0 0 0 0SUMMER 2003School 201 No returnSchool 202 No return - - - - -School 203 5 16 3 22 10 0 0 15 66School 204 No returnSchool 205 16 1 - - - 8 9
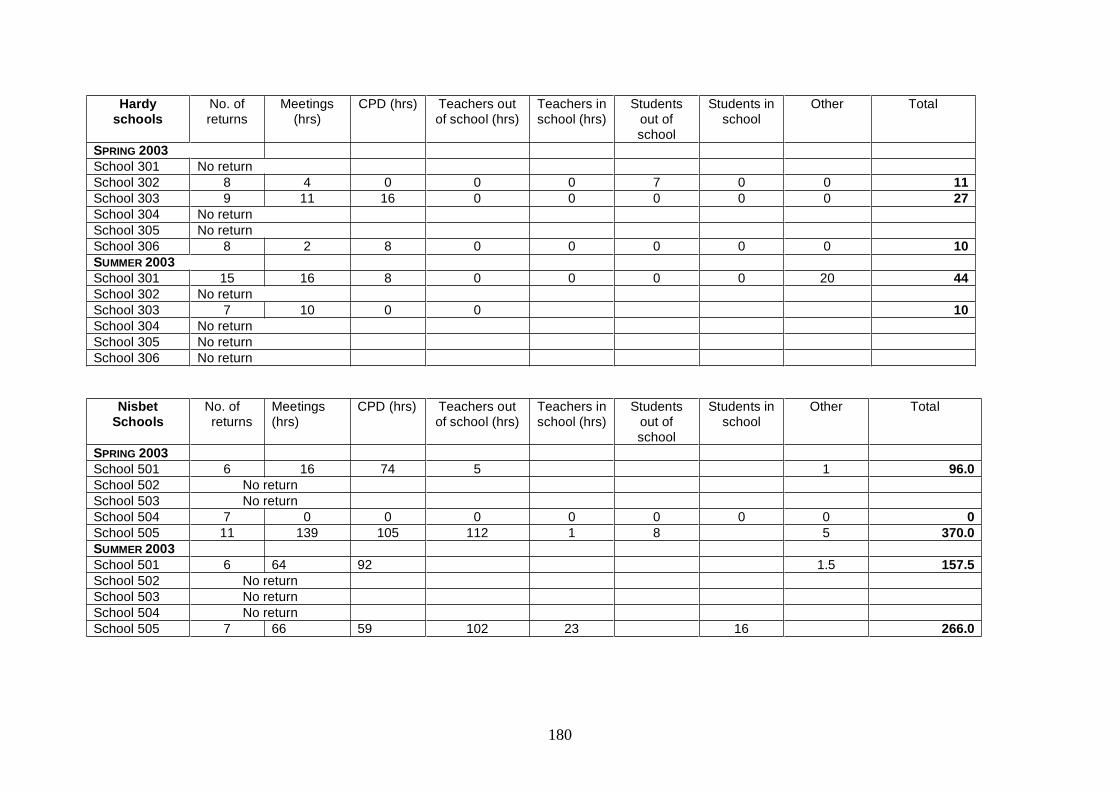
180
Hardyschools
No. ofreturns
Meetings(hrs)
CPD (hrs) Teachers outof school (hrs)
Teachers inschool (hrs)
Studentsout ofschool
Students inschool
Other Total
SPRING 2003School 301 No returnSchool 302 8 4 0 0 0 7 0 0 11School 303 9 11 16 0 0 0 0 0 27School 304 No returnSchool 305 No returnSchool 306 8 2 8 0 0 0 0 0 10SUMMER 2003School 301 15 16 8 0 0 0 0 20 44School 302 No returnSchool 303 7 10 0 0 10School 304 No returnSchool 305 No returnSchool 306 No return
NisbetSchools
No. ofreturns
Meetings(hrs)
CPD (hrs) Teachers outof school (hrs)
Teachers inschool (hrs)
Studentsout ofschool
Students inschool
Other Total
SPRING 2003School 501 6 16 74 5 1 96.0School 502 No returnSchool 503 No returnSchool 504 7 0 0 0 0 0 0 0 0School 505 11 139 105 112 1 8 5 370.0SUMMER 2003School 501 6 64 92 1.5 157.5School 502 No returnSchool 503 No returnSchool 504 No returnSchool 505 7 66 59 102 23 16 266.0

181
Tennysonschools
No. ofreturns
Meetings(hrs)
CPD (hrs) Teachers outof school (hrs)
Teachers inschool (hrs)
Studentsout ofschool
Students inschool
Other Total
AUTUMN 2003School 401 9 51.5 75 68 34 54 27 21 330.5School 402 12 208 248 8 0 0 0 29 493.0School 403 10 75 37 12 2 0 0 185 311.0School 404 14 39.5 29 83 12 94 136 84 477.5School 405 No returnSPRING 2004School 401 9 52.5 64 58 38 66 27 19 324.5School 402 12 204 268.5 11 19 0 10 64 576.5School 403 10 57 40.5 19 0 16 0 53 185.5School 404 13 20.5 127 67 0 99 194 71 578.5School 405 No return
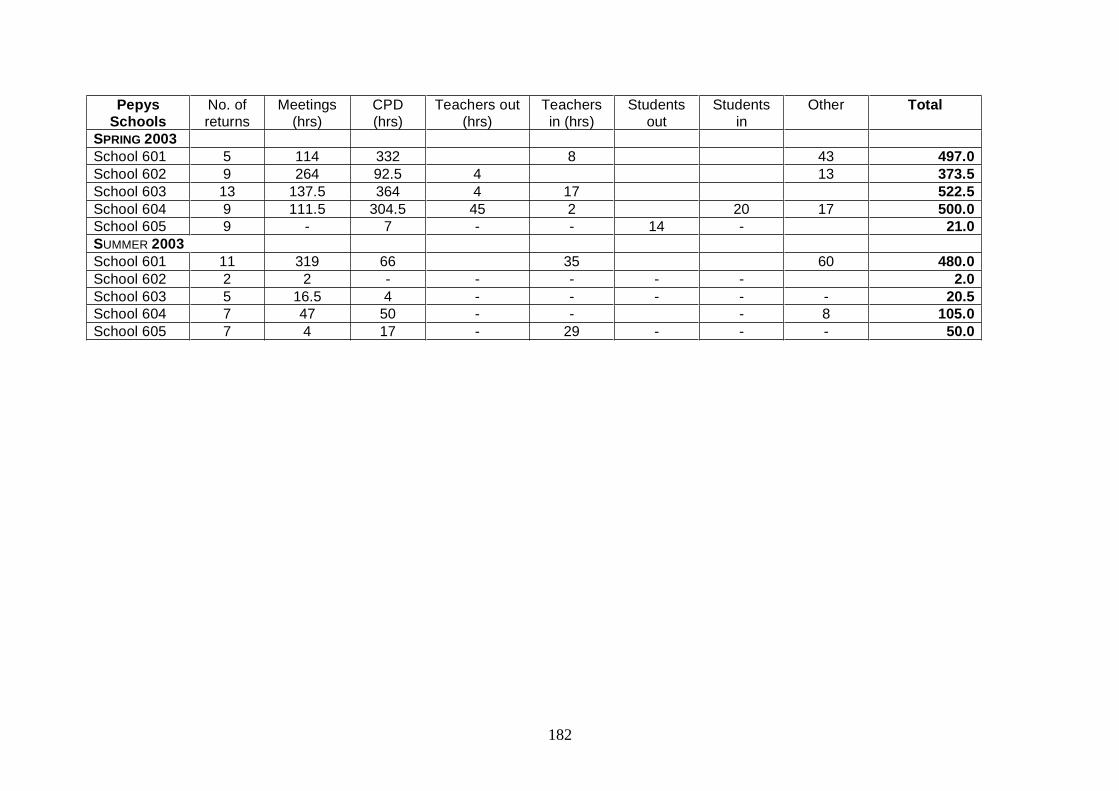
182
PepysSchools
No. ofreturns
Meetings(hrs)
CPD(hrs)
Teachers out(hrs)
Teachersin (hrs)
Studentsout
Studentsin
Other Total
SPRING 2003School 601 5 114 332 8 43 497.0School 602 9 264 92.5 4 13 373.5School 603 13 137.5 364 4 17 522.5School 604 9 111.5 304.5 45 2 20 17 500.0School 605 9 - 7 - - 14 - 21.0SUMMER 2003School 601 11 319 66 35 60 480.0School 602 2 2 - - - - - 2.0School 603 5 16.5 4 - - - - - 20.5School 604 7 47 50 - - - 8 105.0School 605 7 4 17 - 29 - - - 50.0

Copies of this publication can be obtained from:
DfES PublicationsP.O. Box 5050Sherwood ParkAnnesleyNottinghamNG15 0DJ
Tel: 0845 60 222 60Fax: 0845 60 333 60Minicom: 0845 60 555 60Online: www.dfespublications.gov.uk
© Institute of Education, University of London 2006
Produced by the Department for Education and Skills
ISBN 978 1 84478 882 8Ref No: RR826www.dfes.go.uk/research