Pollen Tube Distribution in the Kiwifruit (Actinidia deliciosa A ...
Upload
independentCategory
view
0download
0
Pollen diversity captures landscape structure anddiversityIsabelle Matthias*, Malte Sebastian Swen Semmler and Thomas Giesecke
Department of Palynology and Climate Dynamics, University of G€ottingen, Albrecht-von-Haller-Institute for PlantSciences, Untere Karsp€ule 2, 37073 G€ottingen, Germany
Summary
1. Past changes in plant and landscape diversity can be evaluated through pollen analysis, however,pollen-based diversity indexes are potentially biased by differential pollen production and deposition.Studies examining the relationship between pollen and landscape diversity are therefore needed. Theaim of this study was to evaluate how different pollen-based indexes capture aspects of landscapediversity.2. Pollen counts were obtained from surface samples of 50 small- to medium-sized lakes in Bran-denburg (north-east Germany) and compiled into two sets, with one containing all pollen countsfrom terrestrial plants and the second restricted to wind-pollinated taxa. Both sets were adjusted forthe pollen production/dispersal bias using the REVEALS model. A high-resolution biotope map wasused to extract the density of total biotopes and different biotopes per area as parameters describinglandscape diversity. In addition, tree species diversity was obtained from forest inventory data.3. The Shannon index and the number of taxa in a sample of 10 pollen grains are highly correlatedand provide a useful measure of pollen type diversity which corresponds best to landscape diversitywithin one km of the lake and the proportion of non-forested area within seven km. Adjustments ofthe pollen production/dispersal bias only slightly improve the relationships between pollen diversityand landscape diversity for the restricted data set as well as for the forest inventory data and corre-sponding pollen types.4. Using rarefaction analysis, we propose the following convention: pollen type diversity is repre-sented by the number of types in a small sample (low count e.g. 10), pollen type richness is thenumber of types in a large sample (high count e.g. 500), and pollen sample evenness is character-ized by the ratio of the two.5. Synthesis. Pollen type diversity is a robust index that captures vegetation structure and landscapediversity. It is ideally suited for between site comparisons as it does not require high pollen counts.In concert with pollen type richness and evenness, it helps evaluating the effect of climate changeand human land use on vegetation structure on long timescales.
Key-words: diversity, evenness, landscape structure, north-east Germany, palaeoecology and land-use history, palynological richness, pollen, rarefaction analysis, REVEALS, Shannon index
Introduction
Ecosystem functioning, stability and productivity have beenshown to be influenced by species diversity on short time-scales and for dynamic ecosystems such as grasslands (Til-man, Lehman & Thompson 1997; Loreau et al. 2001; Ives &Carpenter 2007). The importance of diversity for ecosystemfunctioning on longer timescales and more resilient systemslike forests is more difficult to assess, and pollen analysis isin principle an apt tool in such an investigation. However, the
application of pollen-based diversity indexes is biased bythree factors: the lack of taxonomic precision, species-specificdifferences in pollen production and dispersal, and the lack ofa fixed source area (Giesecke, Ammann & Brande 2014).Nevertheless, pollen analytical results document that the num-ber of different pollen types per sample varies through time(Odgaard 1994; Berglund et al. 2008a; Giesecke et al. 2012;Colombaroli et al. 2013). These variations in the number ofpollen types in standard high counts (palynological richness)have been shown to be indicative of landscape changes (Birks& Line 1992). For example, increases in palynological rich-ness are connected with early human land use in the naturallyforested landscapes of central and northern Europe (Poska,
*Correspondence author. E-mail: [email protected]
© 2015 The Authors. Journal of Ecology © 2015 British Ecological Society
Journal of Ecology doi: 10.1111/1365-2745.12404
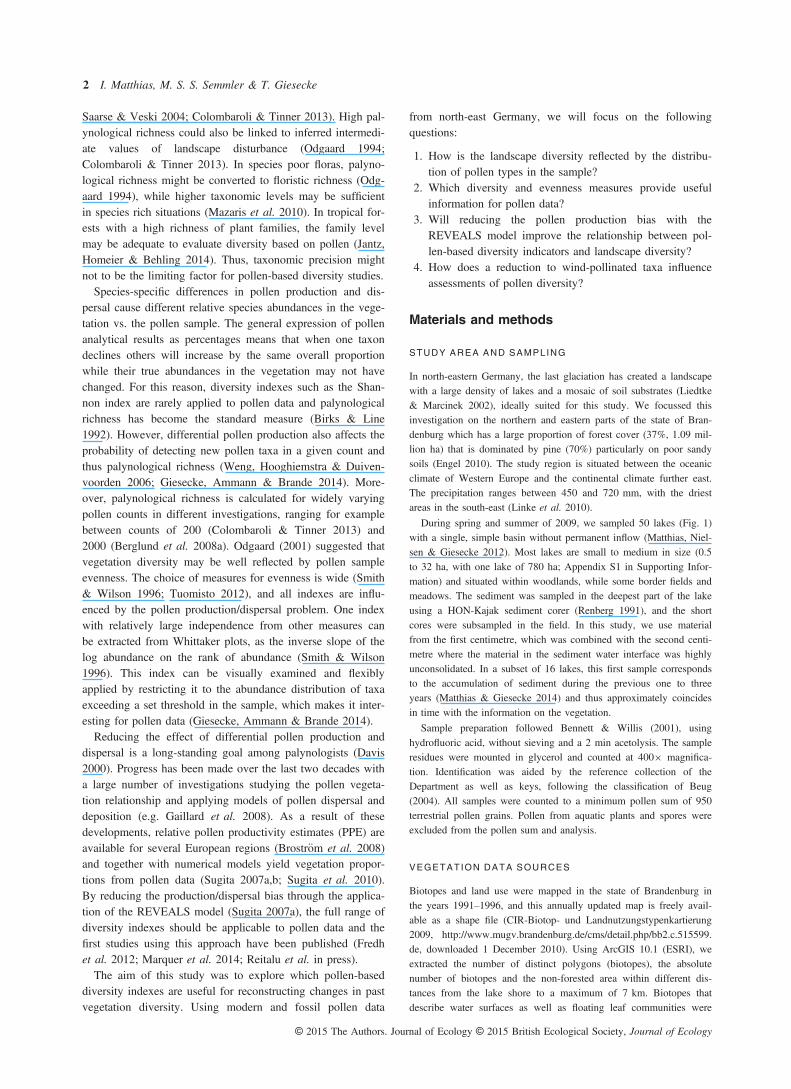
Saarse & Veski 2004; Colombaroli & Tinner 2013). High pal-ynological richness could also be linked to inferred intermedi-ate values of landscape disturbance (Odgaard 1994;Colombaroli & Tinner 2013). In species poor floras, palyno-logical richness might be converted to floristic richness (Odg-aard 1994), while higher taxonomic levels may be sufficientin species rich situations (Mazaris et al. 2010). In tropical for-ests with a high richness of plant families, the family levelmay be adequate to evaluate diversity based on pollen (Jantz,Homeier & Behling 2014). Thus, taxonomic precision mightnot to be the limiting factor for pollen-based diversity studies.Species-specific differences in pollen production and dis-
persal cause different relative species abundances in the vege-tation vs. the pollen sample. The general expression of pollenanalytical results as percentages means that when one taxondeclines others will increase by the same overall proportionwhile their true abundances in the vegetation may not havechanged. For this reason, diversity indexes such as the Shan-non index are rarely applied to pollen data and palynologicalrichness has become the standard measure (Birks & Line1992). However, differential pollen production also affects theprobability of detecting new pollen taxa in a given count andthus palynological richness (Weng, Hooghiemstra & Duiven-voorden 2006; Giesecke, Ammann & Brande 2014). More-over, palynological richness is calculated for widely varyingpollen counts in different investigations, ranging for examplebetween counts of 200 (Colombaroli & Tinner 2013) and2000 (Berglund et al. 2008a). Odgaard (2001) suggested thatvegetation diversity may be well reflected by pollen sampleevenness. The choice of measures for evenness is wide (Smith& Wilson 1996; Tuomisto 2012), and all indexes are influ-enced by the pollen production/dispersal problem. One indexwith relatively large independence from other measures canbe extracted from Whittaker plots, as the inverse slope of thelog abundance on the rank of abundance (Smith & Wilson1996). This index can be visually examined and flexiblyapplied by restricting it to the abundance distribution of taxaexceeding a set threshold in the sample, which makes it inter-esting for pollen data (Giesecke, Ammann & Brande 2014).Reducing the effect of differential pollen production and
dispersal is a long-standing goal among palynologists (Davis2000). Progress has been made over the last two decades witha large number of investigations studying the pollen vegeta-tion relationship and applying models of pollen dispersal anddeposition (e.g. Gaillard et al. 2008). As a result of thesedevelopments, relative pollen productivity estimates (PPE) areavailable for several European regions (Brostr€om et al. 2008)and together with numerical models yield vegetation propor-tions from pollen data (Sugita 2007a,b; Sugita et al. 2010).By reducing the production/dispersal bias through the applica-tion of the REVEALS model (Sugita 2007a), the full range ofdiversity indexes should be applicable to pollen data and thefirst studies using this approach have been published (Fredhet al. 2012; Marquer et al. 2014; Reitalu et al. in press).The aim of this study was to explore which pollen-based
diversity indexes are useful for reconstructing changes in pastvegetation diversity. Using modern and fossil pollen data
from north-east Germany, we will focus on the followingquestions:
1. How is the landscape diversity reflected by the distribu-tion of pollen types in the sample?
2. Which diversity and evenness measures provide usefulinformation for pollen data?
3. Will reducing the pollen production bias with theREVEALS model improve the relationship between pol-len-based diversity indicators and landscape diversity?
4. How does a reduction to wind-pollinated taxa influenceassessments of pollen diversity?
Materials and methods
STUDY AREA AND SAMPLING
In north-eastern Germany, the last glaciation has created a landscapewith a large density of lakes and a mosaic of soil substrates (Liedtke& Marcinek 2002), ideally suited for this study. We focussed thisinvestigation on the northern and eastern parts of the state of Bran-denburg which has a large proportion of forest cover (37%, 1.09 mil-lion ha) that is dominated by pine (70%) particularly on poor sandysoils (Engel 2010). The study region is situated between the oceanicclimate of Western Europe and the continental climate further east.The precipitation ranges between 450 and 720 mm, with the driestareas in the south-east (Linke et al. 2010).
During spring and summer of 2009, we sampled 50 lakes (Fig. 1)with a single, simple basin without permanent inflow (Matthias, Niel-sen & Giesecke 2012). Most lakes are small to medium in size (0.5to 32 ha, with one lake of 780 ha; Appendix S1 in Supporting Infor-mation) and situated within woodlands, while some border fields andmeadows. The sediment was sampled in the deepest part of the lakeusing a HON-Kajak sediment corer (Renberg 1991), and the shortcores were subsampled in the field. In this study, we use materialfrom the first centimetre, which was combined with the second centi-metre where the material in the sediment water interface was highlyunconsolidated. In a subset of 16 lakes, this first sample correspondsto the accumulation of sediment during the previous one to threeyears (Matthias & Giesecke 2014) and thus approximately coincidesin time with the information on the vegetation.
Sample preparation followed Bennett & Willis (2001), usinghydrofluoric acid, without sieving and a 2 min acetolysis. The sampleresidues were mounted in glycerol and counted at 4009 magnifica-tion. Identification was aided by the reference collection of theDepartment as well as keys, following the classification of Beug(2004). All samples were counted to a minimum pollen sum of 950terrestrial pollen grains. Pollen from aquatic plants and spores wereexcluded from the pollen sum and analysis.
VEGETAT ION DATA SOURCES
Biotopes and land use were mapped in the state of Brandenburg inthe years 1991–1996, and this annually updated map is freely avail-able as a shape file (CIR-Biotop- und Landnutzungstypenkartierung2009, http://www.mugv.brandenburg.de/cms/detail.php/bb2.c.515599.de, downloaded 1 December 2010). Using ArcGIS 10.1 (ESRI), weextracted the number of distinct polygons (biotopes), the absolutenumber of biotopes and the non-forested area within different dis-tances from the lake shore to a maximum of 7 km. Biotopes thatdescribe water surfaces as well as floating leaf communities were
© 2015 The Authors. Journal of Ecology © 2015 British Ecological Society, Journal of Ecology
2 I. Matthias, M. S. S. Semmler & T. Giesecke

excluded from the analysis. Lake area and perimeter were obtainedfrom digitized topographic maps.
The composition of tree species around the lakes was obtainedfrom the tree inventory data bases ‘Datenspeicher Wald’ (DSW2;http://www.dsw2.de/index.html) and a federal agency, ‘Bundesanstaltf€ur Immobilienaufgaben’ (Matthias, Nielsen & Giesecke 2012). Forestinventory data were not available for military areas, roadside trees,trees in urban areas and woodlands <0.01 ha. Tree abundance aroundthe lakes was extracted for the different distances from the centre ofthe lake (Matthias, Nielsen & Giesecke 2012). The mean tree abun-dance was distance weighted by the mean distances of the circlesfrom the centre of the lake. The Shannon index was calculated basedon the resulting weighted species abundance and compared to theShannon index on the REVEALS transformed pollen counts of treepollen.
DATA ANALYSIS
REVEALS
The REVEALS model was applied to reduce the production/dispersalbias of the pollen data (Marquer et al. 2014). We used REVEALS
v4.5 (S. Sugita personal communication) with the Prentice-Sugita dis-persal model for lakes (Sugita, Gaillard & Brostr€om 1999). Vegeta-tion proportions were reconstructed for an area of 7 km (Fig. 2),which is a spatial scale relevant to the pollen data in this region(Matthias, Nielsen & Giesecke 2012). Fall speed for the single pollentypes was taken from the literature (Dyakowska 1936; Eisenhut 1961;Gregory 1973; Sugita, Gaillard & Brostr€om 1999) and calculatedusing Stokes’s Law (Gregory 1973). Pollen productivity estimates(PPEs) were applied from the literature (Sugita, Gaillard & Brostr€om1999; Brostr€om, Sugita & Gaillard 2004; Soepboer et al. 2007;Matthias, Nielsen & Giesecke 2012) recalculated with Pinus as a ref-erence taxon. Approximate values based on the mode of pollen dis-persal were assigned to species where PPEs were not available (seeAppendix S2). The pollination mode was obtained from data basesand literature (Willemstein 1987; Raven, Evert & Eichhorn 2000;J€ager 2011; BiolFlor 2013). Taxa were divided in three groups: wind-pollinated taxa (PPE set to 0.4), wind and insect pollinated taxa (PPEset to 0.2) and insect pollinated taxa (PPE set to 0.1). PPE for Cerea-lia vary widely in the literature (Brostr€om, Sugita & Gaillard 2004;Soepboer et al. 2007; Matthias, Nielsen & Giesecke 2012) and weretherefore handled as insect pollinated taxa, as they are often self-pollinated (BiolFlor 2013). Only Secale was set to wind and insect
Non-forested areaForestLake
km
Fig. 1. Distribution study sites in relation toforested area in the German state ofBrandenburg. Site names and geographicalpositions of the lakes are provided inAppendix S1. The distribution of forest coveris based on CORINE Land Cover 2000(Umweltbundesamt & DLR-DFD 2004).
© 2015 The Authors. Journal of Ecology © 2015 British Ecological Society, Journal of Ecology
Pollen diversity captures landscape diversity 3

pollinated. The estimated vegetation proportions were used to adjustthe pollen counts to be able to use the same kind of indexes as withthe original data.
DIVERSITY INDEXES
A large number of indexes have been developed to evaluate diversityand evenness in ecology and most are strongly related to each other(Hill 1973). In a preliminary analysis, we tested the performance ofdifferent indexes and selected the Shannon index H0 as a diversitymeasure and the slope of the inverted rank-order abundance (hence-forth SLOPE) with a threshold of 1% for taxon inclusion as an even-ness measure (Giesecke, Ammann & Brande 2014). Initial analysisincluded the Simpson index, which behaved similar to the Shannonindex, however, with slightly lower correlations to the vegetation dataand was therefore not pursued further. Palynological richness, thenumber of pollen types per sample, depends on the number of grainscounted, and sample-based rarefaction is therefore applied to obtainpalynological richness for standardized high pollen counts (Birks &Line 1992). This measure compares to the richness in the ecologicalsense, which is understood as the number of elements at a particularassessment level. In particular for small samples, the number of taxa(S) depends on the relative abundances of taxa within the sample(Hurlbert 1971). Odgaard (2008) observed in a study of modern sam-ples in Denmark that the number of pollen types in a small samplewas correlated with the evenness of that sample as calculated by Pie-lou’s evenness J = H0/log(S) and found the strongest correlation for apollen count of 10 grains. We conducted a similar comparison ofsample-based rarefaction to different pollen counts and comparedthem to the above diversity and evenness indexes (Fig. 3). The Shan-non index H0 and rarefaction to a base of 10 were found to be closelycorrelated, and the Shannon index was therefore not used as a sepa-rate index. Since the Shannon index is the varying parameter in Pie-lou’s evenness, the correlations found by Odgaard (2008) support therobustness of this correlation, only that here we argue it to reflectdiversity rather than evenness. The SLOPE1% index describes addi-tional variance and was retained as an index as well as rarefaction toa base of 10, 500 and the highest possible sum, which is the low-est count in any one sample per data set and differs between them.
Rarefaction analysis was conducted using the vegan package, version2.0-9 (Oksanen et al. 2013) and the R program, version 3.0.1 (R CoreTeam 2013). All indices were calculated for different pollen data sets:the original pollen counts, only wind-pollinated taxa, as well as forthe pollen data-transformed using the REVEALS program.
Pollen-based indexes were compared to the total number of bio-topes per area, the number of distinct biotopes and the proportion ofthe non-forested area for different distances from the lake shore aswell as to the ratio between lake perimeter and lake area. The impor-tance of combinations of these variables was assessed in multiple lin-ear regression models and evaluated with the Akaike informationcriterion (AIC) in a stepwise algorithm as implemented in the MASSpackage (version 7.3-29, Venables & Ripley 2002) with both, forwardand backward selection. Landscape variables were used for the dis-tance that gave the best fit in a simple regression model.
The lake Sonnenburger Fenn was excluded from comparisons withthe landscape factors, because the pollen assemblage was stronglyaffected by neighbouring gardens as indicated by the encounter of ahigh richness of rare pollen types.
Site nu
mber
010
2468
1012 14161820222426283032343638404244464850
10 20 30 40
Alnus
05 5 10 15 20 25
Betula
0510 5 10 15 20 25
Carpinu
s
01530 0 15 30 45
Fagus
0.0 2.5
Fraxinu
s
051015 5
Larix
/Pseud
otsug
a
0510 5
Picea
0153045 15 30 45 60
Pinus
0.00.5 0.5 1.0
Populu
s
05101520 5 10 15
Quercu
s
0.02.5 2.5
Tilia co
rdata
0.00.5 0.5
Tilia pl
atyph
yllos
05 5 10
Poace
ae (<
37 µm
)
Fig. 2. Percentage diagram depicting the common trees and wild grasses as proportion of the terrestrial pollen sum (green) and REVEALS-adjusted proportions (red) for surface samples of 50 lakes in Brandenburg ordered from north to south. Site numbers correspond to locations inFig. 1, and names and geographical positions of the lakes are provided in Appendix S1.
R² = 0.99
R ² = 0.75
0
2
4
6
8
10
12
14
0
1
2
3
4
5
6
7
8
0 1 2 3 4
Slope1%E
(T10
)
Shannon index
E (T10)SLOPE1%
Fig. 3. Comparison of Shannon index with the number of taxa in asample of 10 (sample-based rarefaction to 10 (E(T10)) and theinverted slope of the rank-order abundance (SLOPE1%) for the uncon-straint pollen proportions.
© 2015 The Authors. Journal of Ecology © 2015 British Ecological Society, Journal of Ecology
4 I. Matthias, M. S. S. Semmler & T. Giesecke
Results
POLLEN DATA
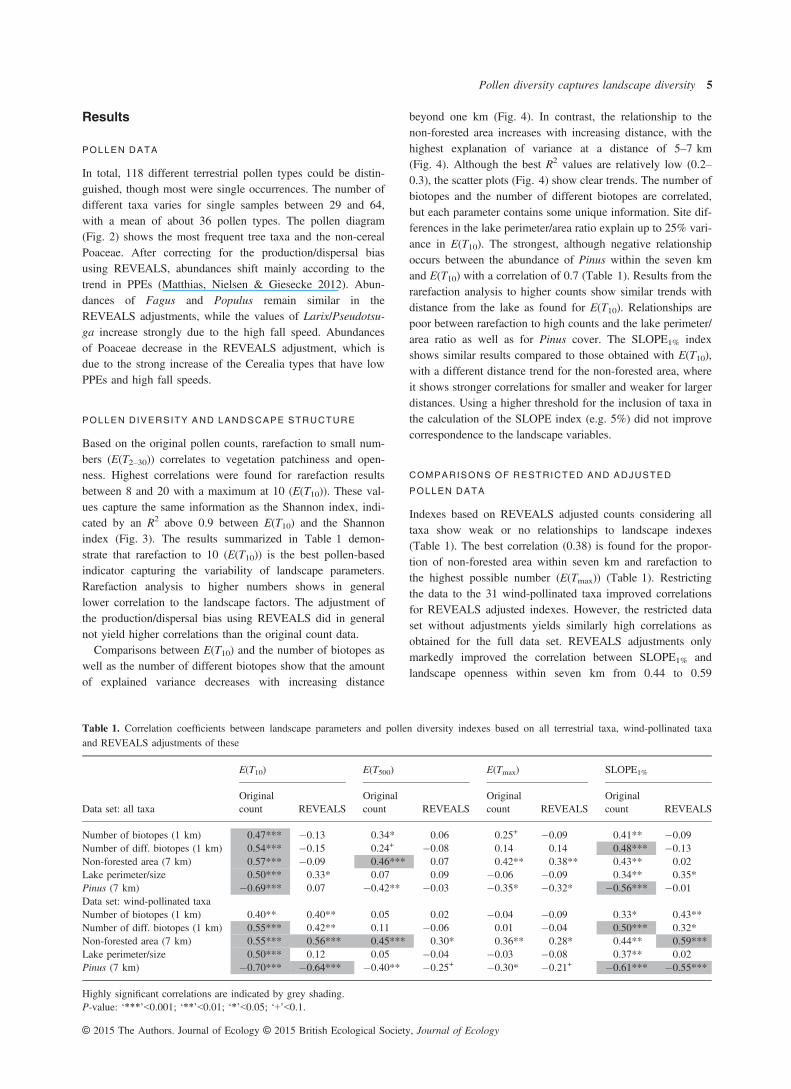
In total, 118 different terrestrial pollen types could be distin-guished, though most were single occurrences. The number ofdifferent taxa varies for single samples between 29 and 64,with a mean of about 36 pollen types. The pollen diagram(Fig. 2) shows the most frequent tree taxa and the non-cerealPoaceae. After correcting for the production/dispersal biasusing REVEALS, abundances shift mainly according to thetrend in PPEs (Matthias, Nielsen & Giesecke 2012). Abun-dances of Fagus and Populus remain similar in theREVEALS adjustments, while the values of Larix/Pseudotsu-ga increase strongly due to the high fall speed. Abundancesof Poaceae decrease in the REVEALS adjustment, which isdue to the strong increase of the Cerealia types that have lowPPEs and high fall speeds.
POLLEN DIVERSITY AND LANDSCAPE STRUCTURE
Based on the original pollen counts, rarefaction to small num-bers (E(T2–30)) correlates to vegetation patchiness and open-ness. Highest correlations were found for rarefaction resultsbetween 8 and 20 with a maximum at 10 (E(T10)). These val-ues capture the same information as the Shannon index, indi-cated by an R2 above 0.9 between E(T10) and the Shannonindex (Fig. 3). The results summarized in Table 1 demon-strate that rarefaction to 10 (E(T10)) is the best pollen-basedindicator capturing the variability of landscape parameters.Rarefaction analysis to higher numbers shows in generallower correlation to the landscape factors. The adjustment ofthe production/dispersal bias using REVEALS did in generalnot yield higher correlations than the original count data.Comparisons between E(T10) and the number of biotopes as
well as the number of different biotopes show that the amountof explained variance decreases with increasing distance
beyond one km (Fig. 4). In contrast, the relationship to thenon-forested area increases with increasing distance, with thehighest explanation of variance at a distance of 5–7 km(Fig. 4). Although the best R2 values are relatively low (0.2–0.3), the scatter plots (Fig. 4) show clear trends. The number ofbiotopes and the number of different biotopes are correlated,but each parameter contains some unique information. Site dif-ferences in the lake perimeter/area ratio explain up to 25% vari-ance in E(T10). The strongest, although negative relationshipoccurs between the abundance of Pinus within the seven kmand E(T10) with a correlation of 0.7 (Table 1). Results from therarefaction analysis to higher counts show similar trends withdistance from the lake as found for E(T10). Relationships arepoor between rarefaction to high counts and the lake perimeter/area ratio as well as for Pinus cover. The SLOPE1% indexshows similar results compared to those obtained with E(T10),with a different distance trend for the non-forested area, whereit shows stronger correlations for smaller and weaker for largerdistances. Using a higher threshold for the inclusion of taxa inthe calculation of the SLOPE index (e.g. 5%) did not improvecorrespondence to the landscape variables.
COMPARISONS OF RESTRICTED AND ADJUSTED
POLLEN DATA
Indexes based on REVEALS adjusted counts considering alltaxa show weak or no relationships to landscape indexes(Table 1). The best correlation (0.38) is found for the propor-tion of non-forested area within seven km and rarefaction tothe highest possible number (E(Tmax)) (Table 1). Restrictingthe data to the 31 wind-pollinated taxa improved correlationsfor REVEALS adjusted indexes. However, the restricted dataset without adjustments yields similarly high correlations asobtained for the full data set. REVEALS adjustments onlymarkedly improved the correlation between SLOPE1% andlandscape openness within seven km from 0.44 to 0.59
Table 1. Correlation coefficients between landscape parameters and pollen diversity indexes based on all terrestrial taxa, wind-pollinated taxaand REVEALS adjustments of these
Data set: all taxa
E(T10) E(T500) E(Tmax) SLOPE1%
Originalcount REVEALS
Originalcount REVEALS
Originalcount REVEALS
Originalcount REVEALS
Number of biotopes (1 km) 0.47*** �0.13 0.34* 0.06 0.25+ �0.09 0.41** �0.09Number of diff. biotopes (1 km) 0.54*** �0.15 0.24+ �0.08 0.14 0.14 0.48*** �0.13Non-forested area (7 km) 0.57*** �0.09 0.46*** 0.07 0.42** 0.38** 0.43** 0.02Lake perimeter/size 0.50*** 0.33* 0.07 0.09 �0.06 �0.09 0.34** 0.35*Pinus (7 km) �0.69*** 0.07 �0.42** �0.03 �0.35* �0.32* �0.56*** �0.01Data set: wind-pollinated taxaNumber of biotopes (1 km) 0.40** 0.40** 0.05 0.02 �0.04 �0.09 0.33* 0.43**Number of diff. biotopes (1 km) 0.55*** 0.42** 0.11 �0.06 0.01 �0.04 0.50*** 0.32*Non-forested area (7 km) 0.55*** 0.56*** 0.45*** 0.30* 0.36** 0.28* 0.44** 0.59***Lake perimeter/size 0.50*** 0.12 0.05 �0.04 �0.03 �0.08 0.37** 0.02Pinus (7 km) �0.70*** �0.64*** �0.40** �0.25+ �0.30* �0.21+ �0.61*** �0.55***
Highly significant correlations are indicated by grey shading.P-value: ‘***’<0.001; ‘**’<0.01; ‘*’<0.05; ‘+’<0.1.
© 2015 The Authors. Journal of Ecology © 2015 British Ecological Society, Journal of Ecology
Pollen diversity captures landscape diversity 5

(Table 1). This is also the only case where the correlation forSLOPE1% is higher than for E(T10).To further test the performance of REVEALS adjustments
for pollen-based diversity studies, we used the forest inven-tory data to calculate the Shannon index on distance weightedtree abundance within seven km of each lake. The compari-son between the Shannon index on tree abundance and theShannon index on pollen counts restricted to the same taxayielded a R2-value of 0.4 (Fig. 5). The REVEALS adjustmentof the pollen data improves this relationship minimally, rais-ing the R2 value to 0.42.
MULTIPLE L INEAR REGRESSION
The results from all pollen data sets show that the number ofthe non-forested areas within seven km and biotopes in onekm are important landscape parameters influencing pollendiversity (Table 2). In combination with the lake perimeter/area ratio, these parameters explain the highest amount of var-iance for E(T10) of the untransformed data sets. The combina-tion of number of biotopes and non-forested area explains39% of the variance in E(T10), and only the addition of the
lake perimeter/area ratio brings the final model to explain59% variance for the original count data. SLOPE1% yields ahigh R2 value (0.39) with the number of biotopes in one kmand the non-forested area within seven km as explanatoryvariables for the REVEALS adjusted data set (Table 2).
0
0.05
0.1
0.15
0.2
0.25
0.3
0.35 Non-forested area
E (T10)SLOPE1%
0
0.05
0.1
0.15
0.2
0.25
0 2000 4000 6000 8000
R²
R²
R²
Distance from the lake shore (m)
0 2000 4000 6000 8000
Distance from the lake shore (m)
0 2000 4000 6000 8000
Distance from the lake shore (m)
Number of biotopes
E (T10)SLOPE1%
0
0.05
0.1
0.15
0.2
0.25
0.3
0.35 Number of different biotopes
E (T10)SLOPE1%
R ² = 0.219233.5
44.5
55.5
66.5
7
0 0.1 0.2 0.3 0.4 0.5 0.6 0.7
E (T10)
R ² = 0.16590
2
4
6
8
10
12
0 0.1 0.2 0.3 0.4 0.5 0.6 0.7
SLOPE1%
Number of biotopes ha–1 (within 1 km)
R ² = 0.1874
SLOPE1%
R ² = 0.22750
2
4
6
8
10
12 SLOPE1%
R ² = 0.29153
3.54
4.55
5.56
6.57
0 0.05 0.1 0.15 0.2 0.25
E (T10)
Number of different biotopes ha–1 (within 1 km)0 0.05 0.1 0.15 0.2 0.25
Number of different biotopes ha–1 (within 1 km)
R ² = 0.32183
3.54
4.55
5.56
6.57
0 20 40 60 80 100
E (T10)
Non-forested area (cover % within 7 km)0 20 40 60 80 100
Non-forested area (cover % within 7 km)
Num
ber o
f tax
aN
umbe
r of t
axa
Num
ber o
f tax
a
Num
ber o
f tax
a
0
2
4
6
8
10
12
Num
ber o
f tax
aN
umbe
r of t
axa
Number of biotopes ha–1 (within 1 km)
Fig. 4. Scatter plots for the best correlations between the number of taxa in a sample of 10 (E(T10)) and inverted slope of the rank-order abun-dance (SLOPE1%) based on all terrestrial pollen, with the total number of biotopes per hectare, number of different biotopes per hectare and pro-portion of non-forested area. Right hand panels depict the changes of R2 with distance from the lake.
R ² = 0.4204
R² = 0.4021
1
1.2
1.4
1.6
1.8
2
2.2
2.4
2.6
0 0.5 1 1.5 2 2.5Sha
nnon
inde
x fo
r pol
len
coun
tsan
d R
EV
EALS
Shannon index for distance weighted forest data within 7 km
REVEALS adjustedOriginal counts
Fig. 5. Agreement of Shannon index calculated on distance weightedtree species abundance obtained from forest inventory data and theShannon index of corresponding pollen percentages and theirREVEALS adjustments.
© 2015 The Authors. Journal of Ecology © 2015 British Ecological Society, Journal of Ecology
6 I. Matthias, M. S. S. Semmler & T. Giesecke

Discussion
The Shannon index and the number of pollen types in a theo-retical count of 10 (E(T10)) describe nearly the same charac-teristics of the abundance distribution in the sample (Fig. 3,see also Odgaard 2008). Palynological richness or the numberof pollen types in high pollen counts shows little correspon-dence to the Shannon index. Thus, in the following, we userarefaction to the low count E(T10) to describe pollen diver-sity in addition to the common usage of palynological rich-ness expressed for high pollen counts to refer to the richnessaspect of the sample (Birks & Line 1992).
OPENNESS
The proportion of non-forested area is the strongest factorexplaining differences in palynological diversity and richness(Fig. 4; Table 1). Agreement between the total proportion ofherbaceous pollen, indicating open areas in a forested regionand palynological richness, has been previously observed infossil records (e.g. Sepp€a 1998; Poska, Saarse & Veski 2004;Berglund, Persson & Bj€orkman 2008b) and demonstrated in amodern comparison similar to this study (Meltsov et al.2013). The reason for this relationship may be a combinationof factors: trees generally produce more pollen than herbs,and thus, the latter has a low probability to be detected in atree dominated landscape (Odgaard 1999). Pollen originatingfrom herbs below a forest canopy may be less likely to reacha lake compared to pollen emitted by herbs in a treeless situa-tion, due to lower wind velocities within the trunk space andfiltration of twigs and leafs (e.g. Anderson 1970; Raynor,Hayes & Ogden 1974; Tauber 1977). The herbaceous flora inEurope is richer than the tree flora and even if the pollentypes for many taxa cannot be separated beyond subfamilylevel, there are still more distinguishable herbaceous than
arboreal pollen types. As humans started opening the centraland northern European forests for agriculture around6000 years ago, they increased the habitat for herbaceous taxaand thus increased floristic diversity on a landscape scale (e.g.Berglund et al. 2008a; Giesecke et al. 2012; Colombaroliet al. 2013).The non-forested area within seven km from the lake is
negatively correlated to the area covered by Pinus, which isthe variable with the strongest correlation to pollen diversity.Pinus is the most important tree species in Brandenburg con-stituting about 70% of the forest cover (Engel 2010), and itoccurs predominantly in monospecific plantations on nutrientpoor sandy soils. Thus, the variable ‘Pinus cover within sevenkm’ describes the proportion of large homogeneous floristi-cally species poor pine forests which often occur on extensiveoutwash plains in the region. Like non-forested area, Pinuscover correlates with pollen richness, although not asstrongly. Therefore, it may rather be the effect of a single pol-len type dominating the pollen sample than the reduced floris-tic diversity in extensive pine plantations that leads to thestrong correlation with pollen diversity.
LOCAL VEGETATION AND PATCHINESS
The number of different biotopes and in particular the totalnumber of biotopes per area represents vegetation patchinessand landscape diversity. Within one km from the lake, this iscorrelated to pollen diversity (Fig. 4). It is difficult to relatethe different biotopes to numbers of species they may har-bour; however, it is fair to assume that the number of speciesincreases with the number of different biotopes. As the transi-tions between biotopes are often characterized by higher rich-ness (e.g. Beierkuhnlein 2007) also, the total number ofbiotopes per area may be related to species richness. Thus, itmay be hypothesized that the good correlation between
Table 2. Performance of multiple regression models combining landscape parameters as predictors for pollen diversity and richness indicators
Original countsNon-forestedarea (7 km)
Number ofbiotopes (1 km)
Number of diff.biotopes (1 km)
Lakeperimeter/size adjusted R2
Data set: all taxaE(T10) FM** FM*** FM*** 0.5968E(T500) FM** FM 0.2271E(Tmax) FM** 0.1585SLOPE1% FM+ FM** FM* 0.3262
Data set: wind-pollinated taxaE(T10) FM** FM+ FM FM*** 0.5417E(T500) FM** 0.1843E(Tmax) FM* 0.1145SLOPE1% FM+ FM** FM+ 0.3298
REVEALSData set: wind-pollinated taxaE(T10) FM*** FM* 0.3432E(T500) FM* FM 0.08698E(Tmax) FM** FM FM 0.09816SLOPE1% FM*** FM* 0.391
P-value: ‘***’<0.001; ‘**’<0.01; ‘*’ <0.05; ‘+’<0.1.FM, Final model.
© 2015 The Authors. Journal of Ecology © 2015 British Ecological Society, Journal of Ecology
Pollen diversity captures landscape diversity 7

patchiness and pollen diversity for shorter distances is due tothe higher probability of detecting pollen from taxa with lowproduction, as well as from rare species. If this were true,there should be a correlation with pollen richness, which isnot observed. Meltsov et al. (2013) compared pollen richnessto patch diversity and found the correlation to increasebeyond one km from the lake. However, the authors used aland cover map with coarser units so that patch diversity maybe correlated to non-forested area. A comparison of absolutepollen deposition and plant abundance shows that the largestproportion of pollen is delivered from plants within a fewhundred metres from the lake shore (Matthias & Giesecke2014). Consequently, pollen diversity captures the diversityaspect of abundant species as described by the two patchinessvariables.The strong correlation between lake shore length relative to
size and pollen diversity (Table 1) seems to work in a similarway as the two patchiness parameters, while it is not corre-lated to either. A long curvy shoreline increases the probabil-ity that different tree and herb species occur near the shore,which leads to a strong representation of their pollen. How-ever, there is no correlation between the lake perimeter/arearatio and pollen richness. This parameter holds some explana-tory power for between site investigations. However, it shouldchange little through time at most sites.
ADJUSTING FOR POLL INAT ION MODE AND
PRODUCTION DISPERSAL BIAS
The abundant vegetation types in the study region are repre-sented by wind-pollinated taxa. Therefore, reducing the dataset to pollen types from wind-pollinated species yielded littledifference for the correlation between landscape factors andpollen diversity. The REVEALS adjustment of the wind-polli-nated taxa shows similar correlations to the landscape parame-ters as found for the uncorrected data set. For the non-forested area, the adjustment improved the correlation for theSLOPE1% index, while reducing it for pollen richness. Weexpected to find a stronger effect of the REVEALS adjust-ment for the diversity indicators like E(T10) and its absencemay be explained by the similar PPEs for the main tree spe-cies in the region. Most lakes are surrounded by forest so thatalso the large differences in pollen production between for-ested and non-forested area hardly come to bare. TheREVEALS adjustments of the full data set resulted in poorcorrelations to landscape parameters compared to the untrans-formed data. This is mainly due to simplified pollen produc-tivity estimates for many less common taxa. The introducedbias outweighs any potential improvements. We neverthelessattempted this correction, as in principle REVEALS adjust-ments could improve assessments of pollen richness by equal-izing the detection probability between samples. Assessingrichness from restricted data sets is problematic as the restrict-ing constraint sets the limit for the highest richness. In thehere presented case, richness was restricted to a maximum of31 wind-pollinated taxa and this restriction alone reduced thecorrelation between pollen type richness and non-forested
area. Thus, REVEALS adjustments does not improve assess-ments of pollen type richness, but may be beneficial for theapplication of diversity indicators.
DIVERSITY, R ICHNESS AND EVENNESS
We have shown pollen diversity to be a responsive measurecapturing aspects of landscape diversity around a site, but ithas rarely been used to describe past changes in vegetationstructure. The pollen-based Shannon index and rarefaction to10 show significant correlations to all landscape variablestested. Also, the SLOPE1% index correlates with these para-meters indicating that it represents diversity rather than even-ness as assumed earlier (Giesecke, Ammann & Brande 2014).All these diversity measures are potentially biased by species-specific differences in pollen production and dispersal (Birks& Line 1992). Nevertheless, this study shows that the pre-sumed bias due to production and dispersal may not inhibit acorrespondence between landscape diversity around a site andpollen diversity in a surface sample. There may, however, bedistortions in different settings, for example near tree lines inarctic and alpine settings (Sepp€a 1998), where the most abun-dant pollen types are potentially of long distance origin.While we did not directly investigate the correspondence
between floristic diversity near the lake and pollen type rich-ness, the removed outlier does indicate that this componentmay be important. The removed lake was bordered by a gar-den and the pollen count yielded disproportionately high rich-ness of rare pollen types. Land use resulting in increasedfloristic diversity such as gardens, orchards or villages wasnot differentiated in the analysis, which may explain the highvariability in richness that cannot be explained by landscapeparameters. The much smaller but more controlled data setfrom Estonia (Meltsov et al. 2011, 2013) shows a strong cor-relation of non-forested area with pollen richness, which alsoincreases with distance. Human population density in Estoniais less than half of that in Brandenburg and the abovedescribed factors may therefore have a smaller effect. Never-theless, both studies agree that pollen richness corresponds toland use and landscape diversity in a wider area around asite.Thus, pollen sample richness and diversity provide a
description of different aspects of the abundance distributionof pollen types in the sample and relate to different aspects oflandscape diversity. It seems therefore these indices can beused to explore the concept of evenness. Tuomisto (2012)argues that evenness may be obtained as the ratio of diversityand richness. This follows in principle Hill’s (1973) sugges-tion that evenness can be defined as the ratio between thediversity numbers N of lower and higher order (e.g. N0/N1).Hills concept of diversity number of different order or theeffective number of species at different sampling depths isconceptually similar to the rarefaction analysis to differentsample size with the sample size or pollen count being inver-sely related to the order a in ‘Hill’s numbers’. It has beenpreviously discussed that the reciprocal of Simpson’s index(N2) corresponds to rarefaction to a sample of 2 (Oksanen
© 2015 The Authors. Journal of Ecology © 2015 British Ecological Society, Journal of Ecology
8 I. Matthias, M. S. S. Semmler & T. Giesecke

2013). Here we demonstrate that the Shannon index or itsexponential (N1) is closely correlated to the number of taxa ina sample of 10 and argue that rarefaction to a high count(e.g. counts of 500–1000 pollen grains) corresponds to rich-ness (N0). Following this, evenness can be obtained as theratio between rarefaction to a low count (2–30) and a highcount (500–1000). Testing this evenness index against thelandscape factors, we see significant correlations with lakeperimeter/size (r = 0.53, P < 0.001) and number of differentbiotopes (r = 0.39, P < 0.01) which is in line with the abovediscussion.A post-glacial pollen diagram (Brande 1996) from the
study region provides a convenient data set to explore theusefulness of these three indexes for fossil data (Fig. 6). Inparticular, during the Lateglacial and early Holocene, palyno-logical richness changes little indicating a stable species pool,while the cooling during the Younger Dryas and the initialwarming of the Holocene changed vegetation structure asindicated by strong changes in pollen diversity. The trough indiversity at the beginning of the Holocene marks a reductionin landscape diversity, as the Lateglacial parkland changesinto a species poor birch and pine forest. Since diversityencompasses richness, the diversity and richness curves can-not show completely different trends, while their ratio depictsa different pattern. With the onset of agriculture, diversityincreases slower than richness, resulting in a decline in even-ness. This low evenness for samples describing enhancedhuman land use may be counter intuitive when thinking aboutthe landscape, but it does describe the abundance distributionof pollen types in these samples, which are characterized by alarge number of rare pollen types. Early human land use mayhave resulted in reducing the abundance of particular treesthat were used for construction and enhancing the area forherbs, thus reducing pollen diversity while enhancing pollenrichness. Here the rarefaction derived evenness helps detect-ing settlement phases as troughs in evenness. In the exampleof the Tegeler See diagram (Fig. 6), this is particularly visiblefor a settlement phase during the late Bronze Age between3000 and 2500 years cal. BP.
PERSPECTIVES AND PITFALLS
Utilizing the abundance distributions of pollen types tomake inferences about changes in landscape diversity is lar-gely unexplored, while it holds potential for the understand-ing of long-term drivers for floristic and landscapediversity. Rarefaction to common high pollen counts hasproven a convenient tool. The here suggested pollen diver-sity and evenness will not replace it, but add to it and helpdifferentiate and evaluate changes in past vegetation struc-ture and richness. The reduction in pollen production/dis-persal bias seems most effective for diversity indexes.Additional modern comparisons are needed to understandwhat pollen diversity indexes correspond to in the flora andlandscape around a site.The study by Goring et al. (2013) illustrates potential prob-
lems when applying diversity indicators to large data bases.However, the lack of a relationship in their study betweenpollen and floristic richness in north-western North Americacan be explained. The study focusses on richness using countsof around 300 pollen grains. It includes sites from very differ-ent settings, ranging from small ponds to lakes with severalkm in diameter, lakes where farming activity is ongoing inthe catchment, sites from predominantly forested regions andpresumably also sites from naturally open, dry mountain val-leys. In such, a mixed sample collection pollen type richnesswill mainly be influenced by local pollen production andshow differences in local vegetation structure and diversity,such as landscape openness and land use, rather than differ-ences in the regional species pool. Palynological richness mayin principle reflect the size of the regional species pool; how-ever, pollen counts higher than 300 may be necessary (Gies-ecke et al. 2012). Here surface samples may be combined inregional clusters to reduce local effects and obtain high sam-ple sizes. Working with samples from data bases has theadded problem of analysis from different investigators, whichgenerally results in different taxonomic precision. To circum-vent this, Goring et al. (2013) combined the taxa at highertaxonomic level, which leads to a loss of information. Thisstrategy may be inevitable when aiming to work with all
2.5
3.5
4.5
5.5
E (T
10)
1020
30
E(T
739)
0.16
0.20
0.24
0.28
13 000 11 000 10 000 9000 8000 7000 6000 5000 4000 3000 2000 1000 0
E(T
10)
E(T
739)
Age cal. BP12 000
Fig. 6. Pollen type diversity (E(T10)),richness (E(T739)) and evenness (E(T10)/E(T739)) for the terrestrial pollen typesanalysed in a post-glacial core from TegelerSee in north-west Berlin (Brande 1996).
© 2015 The Authors. Journal of Ecology © 2015 British Ecological Society, Journal of Ecology
Pollen diversity captures landscape diversity 9

possible samples. However, different names may be used bydifferent investigators that both achieved high taxonomic pre-cession and here synonym tables may be better suited to har-monize such data sets. Databases store results frominvestigations with different purposes and while investigationsaiming at general shifts in vegetation cover may not requirehigh taxonomic precision, studies on early human land usewill put more effort in pollen determination. Both types ofdata sets may be used for a range of analysis where they pro-vide similar results, but this will not be the case with studiesfocussing on pollen type richness or evenness.
Conclusion
We show that pollen type diversity as measured by the Shan-non index or rarefaction to a sample of 10 is a useful indica-tor that corresponds to different aspects of landscape diversitysuch as the richness of biotopes. In this study, pollen diversitywas determined by the proportion of non-forested area withinseven km, vegetation patchiness within one km and the ratioof shore length to lake area. Pollen type richness (the numberof types in a high count) was found to be little influenced bylocal vegetation patchiness and correlates best to the propor-tion of non-forested area within seven km. Following ecologi-cal theory suggesting that evenness can be obtained as theratio between diversity and richness, we propose that this var-iable can be assessed as the ratio between the number of spe-cies in a small and a large sample or the number of taxa in alow (10) vs. a high (500) pollen count as assessed by rarefac-tion analysis.The pollen production/dispersal bias influences pollen-
based diversity indicators. This bias may be reduced usingmodels of pollen transport and deposition together with infor-mation on pollen productivity. Adjustments may only berobust for the most abundant and in particular wind-pollinatedtaxa. This is sufficient for diversity, but not for richness andevenness indexes. In central Europe, the reduction to onlywind-pollinated taxa did not affect the pollen diversity indexas most abundant pollen types come from wind-pollinatedplants. This may hold true for many parts of the world butshould be tested for different vegetation types.Thus, pollen type diversity seems to be a robust measure
for between site comparisons. It is not restricted to pollen dia-grams with high counts and therefore valuable for large scalecomparisons. The example pollen data show that the indexhighlights climate driven shifts in vegetation structure and theevenness index may be useful detecting early human impact.In combination, the suggested set of indexes may yield newinsight into pollen analytical results. Using rarefaction-baseddiversity, richness and evenness indexes are conceptually sim-ple and may also prove useful in related fields.
Acknowledgements
We are grateful to Shinya Sugita for providing the REVEALS.v4.5. programand for further fruitful discussion and suggestions for handling the pollen data.We also like to thank the referees for helpful comments on an earlier draft of
this manuscript. We thank Daniela Rorig for language editing. This study wasfunded by the German Research Foundation (DFG, GI 732/1-1).
Data accessibility
The biotope map is available from the official webpage of the state of Branden-burg (http://www.lugv.brandenburg.de/cms/detail.php/bb1.c.310483.de). Forestinventory data can be obtained from the forest administration ‘DatenspeicherWald’ (DSW2; http://www.dsw2.de/index.html) and the federal agency “Bunde-sanstalt f€ur Immobilienaufgaben” (http://www.bundesimmobilien.de/). The ori-ginal pollen counts of the surface samples from all lakes are stored in Pangaea(data are available at http://doi.pangaea.de/10.1594/PANGAEA.844893).
References
Anderson, S.Th. (1970) The relative pollen productivity and pollen representa-tion of North European trees, and correction factors for tree pollen spectra.Determined by surface pollen analyses from forests. Danmarks geologiskeundersøgelse. Raekke, 2, 96, 1–99.
Beierkuhnlein, C. (2007) Biogeographie. Die r€aumliche Organisation des Le-bens in eine sich ver€andernden Welt. Verlag Eugen Ulmer, Stuttgart.
Bennett, K.D. & Willis, K.J. (2001) Pollen. Tracking environmental changeusing lake sediments, Vol 3: Terrestrial, Algal and Siliceous Indicators (edsJ.P. Smoll, H.J.B. Birks & W.M. Last), pp. 5–32. Kluwer Academic Publish-ers, Dordrecht.
Berglund, B.E., Persson, T. & Bj€orkman, L. (2008b) Late Quaternary landscapeand vegetation diversity in a North European perspective. Quaternary Inter-national, 184, 187–194.
Berglund, B.E., Gaillard, M.-J., Bj€orkman, L. & Persson, T. (2008a) Long-termchanges in floristic diversity in southern Sweden: palynological richness, veg-etation dynamics and land-use. Vegetation History and Archaeobotany, 17,573–583.
Beug, H.-J. (2004) Leitfaden der Pollenbestimmung. Verlag Dr. Friedrich Pfeil,M€unchen.
BiolFlor (2013) Eine Datenbank mit biologisch-€okologischen Merkmalen derFlora von Deutschland. Eine Kooperation von UmweltforschungszentrumLeipzig-Halle GmbH und Bundesamt f€ur Naturschutz. Bundesamt f€ur Naturs-chutz. http://www2.ufz.de/biolflor/index.jsp.
Birks, H.J.B. & Line, J.M. (1992) The use of rarefaction analysis for estimatingpalynological richness from Quaternary pollen-analytical data. The Holocene,2, 1–10.
Brande, A. (1996) Berlin. Palaeoecological Events During the Last15000 Years: Regional Syntheses of Palaeoecological Studies of Lakes andMires in Europe (eds B.E. Berglund, H.J.B. Birks, M. Ralska-Jasiewiczowa& H.E. Wright), pp. 518–523. John Wiley & Sons, Chichester.
Brostr€om, A., Sugita, S. & Gaillard, M.J. (2004) Pollen productivity estimatesfor reconstruction of past vegetation cover in the cultural landscape of south-ern Sweden. The Holocene, 14, 371–384.
Brostr€om, A., Nielsen, B., Gaillard, M.-J., Hjelle, K.L., Mazier, F., Binney, H.et al. (2008) Pollen productivity estimates of key European plant taxa forquantitative reconstruction of past vegetation: a review. Vegetation Historyand Archaeobotany, 17, 461–478.
Colombaroli, D. & Tinner, W. (2013) Determining the long-term changes inbiodiversity and provisioning services along a transect from Central Europeto the Mediterranean. The Holocene, 23, 1625–1634.
Colombaroli, D., Beckmann, M., van der Knaap, W.O., Curdy, P. & Tinner,W. (2013) Changes in biodiversity and vegetation composition in the centralSwiss Alps during the transition from pristine forest to first farming. Diver-sity and Distributions, 19, 157–170.
Davis, M.B. (2000) Palynology after Y2K – understanding the source area of pol-len in sediments. Annual Review of Earth and Planetary Sciences, 28, 1–18.
Dyakowska, J. (1936) Research on the rapidity of the falling down of pollen ofsome trees. Bulletin international de l’Academie polonaise des sciences etdes lettres, Classe des Sciences mathematiques et naturelles. Serie B, Sci-ences naturelles, III, 155–169.
Eisenhut, G. (1961) Untersuchung €uber die Morphologie und €Okologie derPollenk€orner heimischer und fremdl€andischer Waldb€aume. Paul Parey, Ham-burg.
Engel, J. (2010) Brandenburg – Kiefernland in Wandel. MILAktuell, 2, 29–30.Fredh, D., Brostr€om, A., Zill�en, L., Mazier, F., Rundgren, M. & Lageras, P.(2012) Floristic diversity in the transition from traditional to modern land-usein southern Sweden A.D. 1800-2008. Vegetation History and Archaeobotany,21, 439–452.
© 2015 The Authors. Journal of Ecology © 2015 British Ecological Society, Journal of Ecology
10 I. Matthias, M. S. S. Semmler & T. Giesecke
Gaillard, M.-J., Sugita, S., Bunting, M.J., Middleton, R., Brostr€om, A., Casel-dine, C. et al. (2008) The use of modelling and simulation approach inreconstructing past landscapes from fossil pollen data: a review and resultsfrom the POLLANDCAL network. Vegetation History and Archaeobotany,17, 419–443.
Giesecke, T., Ammann, B. & Brande, A. (2014) Palynological richness andevenness – insights from the taxa accumulation curve. Vegetation Historyand Archaeobotany, 23, 217–228.
Giesecke, T., Wolters, S., Jahns, S. & Brande, A. (2012) Exploring holocenechanges in palynological richness in northern Europe – did postglacial immi-gration matters? PLoS ONE, 7, 1–12.
Goring, S., Lacourse, T., Pellatt, M.G. & Mathewes, R.W. (2013) Pollenassemblage richness does not reflect regional plant species richness: a cau-tionary tale. Journal of Ecology, 101, 1137–1145.
Gregory, P.H. (1973) The Microbiology of the Atmosphere. Leonard Hill,Aylesbury.
Hill, M.O. (1973) Diversity and evenness: a unifying notation and its conse-quences. Ecology, 54, 427–432.
Hurlbert, S.H. (1971) The nonconcept of species diversity: a critique and alter-native parameters. Ecology, 52, 577–586.
Ives, A.R. & Carpenter, S.R. (2007) Stability and diversity of ecosystems. Sci-ence, 317, 58–62.
J€ager, E.J. (2011) Rothmaler. Excursionsflora von Deutschland. Gef€aßpflanzen:Grundband. Spektrum Akademischer Verlag, Heidelberg.
Jantz, N., Homeier, J. & Behling, H. (2014) Representativeness of tree diversityin the modern pollen rain of Andean montane forests. Journal of VegetationScience, 25, 481–490.
Liedtke, H. & Marcinek, J. (2002) Physische Geographie Deutschlands. Klett-Perthes, Gotha, Stuttgart.
Linke, C., Grimmert, S., Hartmann, I. & Reinhardt, K. (2010) Auswertung reg-ionaler Klimamodelle f€ur das Land Brandenburg. Fachbeitr€age des Lande-sumweltamtes Heft Nr. 113. http://www.mugv.brandenburg.de/cms/media.php/lbm1.a.2334.de/i_fb113.pdf (Accessed 27 February 2012).
Loreau, M., Naeem, S., PInchausti, P., Bengtsson, J., Grime, J.P., Hector, A.,Hooper, D.U., Huston, M.A., Raffaelli, D., Schmid, B., Tilman, D. & War-dle, D.A. (2001) Biodiversity and ecosystem functioning: current knowledgeand future challenges. Science, 294, 804–808.
Marquer, L., Gaillard, M.J., Sugita, S., Trondman, A.-K., Mazier, F., Nielsen,A.B. et al. (2014) Holocene changes in vegetation composition in northernEurope: why pollen-based quantitative reconstruction matters. QuaternarySciences Reviews, 90, 199–216.
Matthias, I. & Giesecke, T. (2014) Insights into pollen source area, transportand deposition from modern pollen accumulation rates in lake sediments.Quaternary Science Reviews, 87, 12–23.
Matthias, I., Nielsen, A.B. & Giesecke, T. (2012) Evaluating the effect of flow-ering age and forest structure on pollen productivity estimates. VegetationHistory and Archaeobotany, 21, 471–484.
Mazaris, A.D., Kallimanis, A.S., Tzanopoulos, J., Sgardelis, S.P. & Pantis, J.D.(2010) Can we predict the number of plant species from the richness of afew common genera, families or orders? Journal of Applied Ecology, 47,662–670.
Meltsov, V., Poska, A., Odgaard, B.V., Sammul, M. & Kull, T. (2011) Palyno-logical richness and pollen sample evenness in relation to local floristicdiversity in southern Estonia. Review of Palaeobotany and Palynology, 166,344–351.
Meltsov, V., Poska, A., Reitlau, T., Sammul, M. & Kull, T. (2013) The role oflandscape structure in determining palynological and floristic richness. Vege-tation History and Archaeobotany, 22, 39–49.
Odgaard, B.V. (1994) The Holocene vegetation history of northern West Jut-land, Denmark. Opera Botanica, 123, 3–171.
Odgaard, B.V. (1999) Fossil pollen as a record of past biodiversity. Journal ofBiogeography, 26, 7–17.
Odgaard, B.V. (2001) Palaeoecological perspectives on pattern and progress inplant diversity and distribution adjustments: a comment on recent develop-ments. Diversity and Distributions, 7, 197–201.
Odgaard, B.V. (2008) Does pollen type diversity reflect vegetation diversity?Terra Nostra, 2, 209.
Oksanen, J. (2013) Vignettes: ecological diversity. R: a language and environ-ment for statistical computing. Vegan: Community Ecology Package. R pack-age version 2.0-9. (eds J. Oksanen, F.G. Blanchet, R. Kindt, P. Legendre,P.R. Minchin, R.B. O’Hara, G.L. Simpson, P. Solymos, M.H.H. Stevens &H. Wagner) http://CRAN.R-project.org/package=vegan.
Oksanen, J., Blanchet, F.G., Kindt, R., Legendre, P., Minchin, P.R., O’Hara,R.B., Simpson, G.L., Solymos, P., Stevens, M.H.H. & Wagner, H. (2013)Vegan: Community Ecology Package. R package version 2.0-9. http://CRAN.R-project.org/package=vegan.
Poska, A., Saarse, L. & Veski, S. (2004) Reflections of pre- and early-agrarianhuman impact in the pollen diagrams of Estonia. Palaeogeography, Palaeo-climatology, Palaeoecology, 209, 37–50.
R Core Team (2013) R: A Language and Environment for Statistical Comput-ing. R Foundation for Statistical Computing, Vienna, Austria. URL http://www.R-project.org/.
Raven, P.H., Evert, R.F. & Eichhorn, S.E. (2000) Biologie der Pflanzen. Walterde Gruyter, Berlin, New York.
Raynor, G.S., Hayes, J.V. & Ogden, E.C. (1974) Particulate dispersion into andwithin a forest. Boundary-Layer Meteorology, 7, 429–456.
Reitalu, T., Gerhold, P., Poska, A., P€artel, M., V€ali, V. & Veski, S. (in press)Novel insights into post-glacial vegetation change: functional and phyloge-netic diversity in pollen records. Journal of Vegetation Science. doi:10.1111/jvs.12300.
Renberg, I. (1991) The HON-Kajak sediment corer. Journal of Paleolimnology,6, 167–170.
Sepp€a, H. (1998) Postglacial trends in palynological richness in the northernFennoscandian tree-line area and their ecological interpretation. The Holo-cene, 8, 43–53.
Smith, B. & Wilson, J.N. (1996) A consumer’s guide to evenness indices.Oikos, 76, 70–82.
Soepboer, W., Sugita, S., Lotter, A.F., Van Leuwen, J.F.N. & Van der Knaap,W.O. (2007) Pollen productivity estimates for quantitative reconstruction ofvegetation cover on the Swiss Plateau. The Holocene, 17, 1–13.
Sugita, S. (2007a) Theory of quantitative reconstruction of vegetation I: pollenfrom large sites REVEALS regional vegetation composition. The Holocene,17, 229–241.
Sugita, S. (2007b) Theory of quantitative reconstruction of vegetation II: allyou need is LOVE. The Holocene, 17, 243–257.
Sugita, S., Gaillard, M.J. & Brostr€om, A. (1999) Landscape openness and pol-len records: a simulation approach. The Holocene, 9, 409–421.
Sugita, S., Parshall, T., Calcote, R. & Walker, K. (2010) Testing the LandscapeReconstruction Algorithm for spatially explicit reconstruction of vegetationin northern Michigan and Wisconsin. Quaternary Research, 74, 289–300.
Tauber, H. (1977) Investigations of aerial pollen transport in a forested area.Dansk Botanisk Arkiv, 3, 1–121.
Tilman, D., Lehman, D. & Thompson, K. (1997) Plant diversity and ecosystemproductivity: theoretical considerations. Proceedings of the National Academyof Sciences of the United States of America, 94, 1857–1861.
Tuomisto, H. (2012) An updated consumer’s guide to evenness and relatedindices. Oikos, 121, 1203–1218.
Umweltbundesamt & DLR-DFD (2004) CORINE Land Cover 2000. Daten zurBodenbedeckung – Deutschland. http://www.corine.dfd.dlr.de.
Venables, W.N. & Ripley, B.D. (2002) Modern Applied Statistics with S, 4thedn. Springer, New York.
Weng, C., Hooghiemstra, H. & Duivenvoorden, J.F. (2006) Challenges inestimating past plant diversity from fossil pollen data: statistical assess-ment, problems, and possible solutions. Diversity and Distributions, 12,310–318.
Willemstein, S.C. (1987) An Evolutionary Basis for Pollination Ecology. (Lei-den Botanical Series). E. J. Brill, Leiden.
Received 1 September 2014; accepted 26 March 2015Handling Editor: Matt McGlone
Supporting Information
Additional Supporting Information may be found in the online ver-sion of this article:
Appendix S1. Characteristics of the sampled lakes.
Appendix S2. Fall speed and PPEs of the pollen taxa
© 2015 The Authors. Journal of Ecology © 2015 British Ecological Society, Journal of Ecology
Pollen diversity captures landscape diversity 11
Copyright © 2022 FDOKUMEN