EVALUATION OF LIGHTING ENERGY PERFORMANCE OF ...
17
© 2018 JETIR July 2018, Volume 5, Issue 7 www.jetir.org (ISSN-2349-5162) JETIRC006272 Journal of Emerging Technologies and Innovative Research (JETIR) www.jetir.org 1581 EVALUATION OF LIGHTING ENERGY PERFORMANCE OF TRADITIONAL AND MODERN INSTITUTIONAL BUILDINGS. V.Arivumani Ph.D Research Scholar, Department of Architecture, School of Architecture & Planning, Anna University, Chennai. Iyer Vijayalaxmi Kasinath Associate Professor, Department of Architecture, School of Architecture & Planning, Anna University, Chennai ABSTRACT: As Industrialization has gained speed, Energy Consumption and given harm to the Environment has become one of the biggest global problems. Designing buildings and constructing them with conventional methods cause damages to the environment and increase energy consumption. Therefore in order to achieve best results to reduce the impact of buildings over the environment, a case study has been done with the support of informative literature and calculations. This literature has been carried out to show forth the works of various international designers with their observations, the case study has been carried out to compare two styles of buildings: vernacular and modern. The buildings chosen are the College of Engineering (main building) and the administrative building in the campus of Anna University, Chennai. It is found that the orientation of the buildings plays a significant role in the lighting energy of buildings. In general, for office rooms, illuminance provided by artificial lighting is 40% lower than that required. But sufficient lighting is provided by natural lighting with a daylight factor of 9%. Author Keywords: Revit, eQUEST, Zoning, Lighting Design, Co-efficient of Utilization. 1 INTRODUCTION Energy consumption in buildings contributes more to world’s total end use of energy. In India, buildings account for more than 30 to 40 percent of total electricity consumption as per the U.S Energy Information Administration (EIA). Out of this19% is used for indoor lighting (EIA). India’s current power production capacity is unable to meet the expected energy demand. To lower the electricity usage and increase the energy performance of both new and existing buildings, some general precautions must be taken. Designing the buildings for energy efficiency is necessary to meet the future needs. 2 OBJECTIVE OF THE STUDY The objective of this project is to Make a parametric study of the building with respect to orientation, shape and zoning of the building. Conduct Artificial Lighting design studies on buildings. 3 SCOPE OF THE STUDY This study will present a standardized level of lighting energy performance of an existing building. The study also includes the calculation of Lighting Design of two buildings under study. 4 REVIEW OF LITERATURE Ho Yang et al. (2010) studied the Economic analysis of the daylight-linked lighting control system in office buildings. The objective of the study was to perform an economic analysis of the daylight-linked automatic on/off lighting control system installed for the purpose of energy savings in office buildings. For this, a building was chosen as a typical example, and the energy cost was calculated by using the daylight and building energy analysis simulation. Also, the result for total energy consumption showed that, when lighting control was applied, this was reduced by 8.5% when the glazing ratio was 100%, 8.2% for 80%, and 7.6% for 60% when compared to non-application. Irene Wong (2012) et al. studied the simulation and experimental studies on natural lighting in enclosed lift lobbies of high rise residential buildings by remote source solar lighting. The lift lobbies in these buildings are enclosed without windows and their floor heights are restricted to not more than 2.8 m. Electric lighting is switched on continuously for 24 h a day. Buildings accounts for nearly half of the total primary energy use in the territory. This project investigated the potential of applying remote source solar lighting technology to introduce natural lighting into the enclosed lift lobbies. The overall transmittance efficiency of the system was simulated to be 39%. Nikolaos et al. (2012) studied the Implementation conditions for energy saving technologies and practices in office buildings. The assessment of the available lighting technologies in use in office buildings, showed that the installation of lighting saving technologies was positively influenced by a number of parameters, such as high annual financial turnover, recently established companies and companies managed by older, highly educated and energy aware people. The potential energy saving from the application of different energy efficiency technologies in lighting was: 75% from the replacement of tungsten filament lamps with compact fluorescent lamps; 10% from the replacement of 38 mm diameter fluorescent tubes with 26 mm diameter fluorescent tubes; and 25% with replacement of tungsten filament display lights with tungsten halogen lamps.
-
Upload
khangminh22 -
Category
Documents
-
view
0 -
download
0
Transcript of EVALUATION OF LIGHTING ENERGY PERFORMANCE OF ...
© 2018 JETIR July 2018, Volume 5, Issue 7 www.jetir.org (ISSN-2349-5162)
JETIRC006272 Journal of Emerging Technologies and Innovative Research (JETIR) www.jetir.org 1581
EVALUATION OF LIGHTING ENERGY
PERFORMANCE OF TRADITIONAL AND
MODERN INSTITUTIONAL BUILDINGS.
V.Arivumani
Ph.D Research Scholar,
Department of Architecture, School of Architecture & Planning, Anna University, Chennai.
Iyer Vijayalaxmi Kasinath Associate Professor, Department of Architecture, School of Architecture & Planning, Anna University, Chennai
ABSTRACT: As Industrialization has gained speed, Energy Consumption and given harm to the Environment has become
one of the biggest global problems. Designing buildings and constructing them with conventional methods cause damages to the
environment and increase energy consumption. Therefore in order to achieve best results to reduce the impact of buildings over
the environment, a case study has been done with the support of informative literature and calculations. This literature has been
carried out to show forth the works of various international designers with their observations, the case study has been carried out
to compare two styles of buildings: vernacular and modern. The buildings chosen are the College of Engineering (main building)
and the administrative building in the campus of Anna University, Chennai. It is found that the orientation of the buildings plays
a significant role in the lighting energy of buildings. In general, for office rooms, illuminance provided by artificial lighting is
40% lower than that required. But sufficient lighting is provided by natural lighting with a daylight factor of 9%.
Author Keywords: Revit, eQUEST, Zoning, Lighting Design, Co-efficient of Utilization.
1 INTRODUCTION Energy consumption in buildings contributes more to world’s total end use of energy. In India, buildings account for more
than 30 to 40 percent of total electricity consumption as per the U.S Energy Information Administration (EIA). Out of this19% is
used for indoor lighting (EIA).
India’s current power production capacity is unable to meet the expected energy demand. To lower the electricity usage and
increase the energy performance of both new and existing buildings, some general precautions must be taken. Designing the
buildings for energy efficiency is necessary to meet the future needs.
2 OBJECTIVE OF THE STUDY The objective of this project is to
Make a parametric study of the building with respect to orientation, shape and zoning of the building.
Conduct Artificial Lighting design studies on buildings.
3 SCOPE OF THE STUDY This study will present a standardized level of lighting energy performance of an existing building. The study also includes the
calculation of Lighting Design of two buildings under study.
4 REVIEW OF LITERATURE
Ho Yang et al. (2010) studied the Economic analysis of the daylight-linked lighting control system in office buildings. The
objective of the study was to perform an economic analysis of the daylight-linked automatic on/off lighting control system
installed for the purpose of energy savings in office buildings. For this, a building was chosen as a typical example, and the
energy cost was calculated by using the daylight and building energy analysis simulation. Also, the result for total energy
consumption showed that, when lighting control was applied, this was reduced by 8.5% when the glazing ratio was 100%, 8.2%
for 80%, and 7.6% for 60% when compared to non-application. Irene Wong (2012) et al. studied the simulation and
experimental studies on natural lighting in enclosed lift lobbies of high rise residential buildings by remote source solar lighting.
The lift lobbies in these buildings are enclosed without windows and their floor heights are restricted to not more than 2.8 m.
Electric lighting is switched on continuously for 24 h a day. Buildings accounts for nearly half of the total primary energy use in
the territory. This project investigated the potential of applying remote source solar lighting technology to introduce natural
lighting into the enclosed lift lobbies. The overall transmittance efficiency of the system was simulated to be 39%. Nikolaos et al.
(2012) studied the Implementation conditions for energy saving technologies and practices in office buildings. The assessment of
the available lighting technologies in use in office buildings, showed that the installation of lighting saving technologies was
positively influenced by a number of parameters, such as high annual financial turnover, recently established companies and
companies managed by older, highly educated and energy aware people. The potential energy saving from the application of
different energy efficiency technologies in lighting was: 75% from the replacement of tungsten filament lamps with compact
fluorescent lamps; 10% from the replacement of 38 mm diameter fluorescent tubes with 26 mm diameter fluorescent tubes; and
25% with replacement of tungsten filament display lights with tungsten halogen lamps.

© 2018 JETIR July 2018, Volume 5, Issue 7 www.jetir.org (ISSN-2349-5162)
JETIRC006272 Journal of Emerging Technologies and Innovative Research (JETIR) www.jetir.org 1582
Energy saving for electrical lighting and reduction of cooling load studied by E.J. Gago et al. (2015) shows that the
residential sector is responsible for approximately a quarter of energy consumption in Europe. This consumption, together with
that of other buildings, mainly from the tertiary sector, makes up 40% of total energy consumption and 36% of CO2 emissions.
Artificial lighting makes up 14% of electrical consumption in the European Unionand19% worldwide. It is possible to reduce
energy consumption and therefore CO2 emissions into the atmosphere. Lancashir et al. reported that each kWh of energy saved
prevents the emission of 680.39 g of carbon dioxide, 5.67 g of sulfur dioxide, and 2.27 g of nitrogen oxide. Skylight systems are
inappropriate for direct application in the tropics to balance the thermal and lighting loads. Therefore, these systems should be
integrated by using shading, glare protection, proper use of reflective surfaces, reflectors, prisms and multi-pane, using splaying
and wells for skylight, as well as double-layered roof system, and taking advantage of different geometries, roof angles,
orientations, and complicated roof profiles. Tomas Mendez Echenagucia et al. (2015) studied the early design stage of a
building envelope for multi-objective search through heating, cooling and lighting energy performance. By means of genric
algorithms, a multi-objective search was performed with the aim of minimising the energy need for heating, cooling and lighting
of a case study. The investigation was carried out for an open space office building by varying number, position, shape and type
of windows and the thickness of the masonry walls. The search was performed through an implementation of the NSGA-II
algorithm, which was made capable of exchanging information with the EnergyPlus building energy simulation tool. Energy
demand, system loads, construction and operating cost, thermal comfort, life cycle cost, lifecycle environmental impact and CO2
emissions are among the most investigated objectives in the building sector. Building operation and optimal scheduling strategies
were also investigated. An optimisation of both envelope and HVAC systems was performed in. Even though a combined
optimisation of envelope and HVAC systems was found to be preferable to a sequential approach where the HVAC systems are
optimised after the envelope, only slightly better results were obtained at the expense of a considerable increase of the
computational run time. Results retrieved from the box plot elaborations highlighted a small Window-to-Wall Ratio of the
building in all locations. Pareto front solutions were characterised by very low WWR values especially in east, west and north
exposed facades. The area of the south facing windows was higher compared to the other orientations and characterised by a
wider spread.
Building lighting energy consumption prediction for supporting energy data analytics has been studied by Kadir Amasyali
and Nora El-Gohary (2016). Building energy software tools such as EnergyPlus and eQuest are being widely used for energy
consumption prediction. In order to predict energy consumption of buildings without many input parameters, data-driven models
were developed. These studies can be classified based on their learning algorithms, spatial scales, temporal granularities, types of
energy consumption prediction, and types of dataset. Learning algorithms include support vector machines (SVM), artificial
neural networks (ANN), decision trees, and other statistical algorithms. Economic feasibility of maximizing day lighting of a
standard office building with efficient electric lighting has been studied by Marc Fontoynonta et.al (2016). Certain architectural
special features increased the proportion of the indoor area with sufficient daylight by up to 40%, with an increase of construction
costs ranging between 1.3% and 15.5% of the cost of the building. The relative proportion of primary energy requirements
associated with lighting was increased to 47%. Thus, since lighting represents the largest part of electricity consumption, it is
potentially a relevant field for energy savings. Daylight supplies sufficient illuminance levels at location of use. In the case of an
office building such a return on investment related to day lighting still needs to be demonstrated in order to become attractive both
to investors and operators. A case study of buildings in the tropics was studied by Rizki et al. (2016) for understanding design
optimization for window size, orientation, and wall reflectance with regard to various daylight metrics and lighting energy
demand. Most studies were conducted for locations with high latitude, where the sun is located most of the time either at the
South or at the North part of the sky hemisphere, which is not the case in the tropics. Therefore, this article presents a simulation
study to investigate the influence of window-to-wall ratio (WWR), wall reflectance, and window orientation on various daylight
metrics and lighting energy demand in simple buildings located in the tropical climate. An optimum window-to-wall ratio
(WWR) is believed to be able in yielding significant energy savings for heating, cooling and lighting demand in buildings. It is
noticed that as more efficient technologies are employed in buildings, the influence of WWR on the building energy performance
tends to become lower.
5 METHODOLOGY Two buildings namely, Campus Main building and Administrative buildings comprising of two parts (Main administrative
building and FERE building) are taken for the evaluation of lighting energy performance out using simulation tools – REVIT
Architecture and eQUEST. The work methodology involves comprises of the following;
Collection of weather data for whole year of 2014
Architectural Drawings of Building plan and elevation
Building Materials used in the construction of the buildings
Building Occupancy, Lighting, Equipment details
Lighting Energy performance of the building through simulation using Revit Architecture and eQUEST software.
Conducting artificial lighting design studies.
Analyzing the results obtained and data interpreted.
5.1 Weather Data June was the hottest month of the year 2014 with an average temperature of 40°C while the lowest average temperature was
18oC in the month of February. The variation of maximum temperature is 25%. The variation of minimum temperature is 28%.
Figure 1 shows the maximum and minimum outdoor temperature for the year 2014 in College of Engineering- Guindy Campus.

© 2018 JETIR July 2018, Volume 5, Issue 7 www.jetir.org (ISSN-2349-5162)
JETIRC006272 Journal of Emerging Technologies and Innovative Research (JETIR) www.jetir.org 1583
Fig. 1. Variation of maximum and minimum outdoor temperature
Fig. 2. Variation of dry and wet bulb outdoor temperature
Outdoor Humidity is lowest at 55% during May and highest at 70% during November 2014. Figure 3 shows the variation of
monthly outdoor relative humidity for year 2014 in College of Engineering- Guindy Campus.
Fig. 3. Variation of outdoor relative humidity
The maximum wind speed is at 9 m/s during July and minimum wind speed of 0.4 m/s during October 2014. Figure 4 shows
the variation of monthly wind speed for the year 2014 in College of Engineering- Guindy Campus.
Fig. 4. Variation of maximum and minimum wind speed
© 2018 JETIR July 2018, Volume 5, Issue 7 www.jetir.org (ISSN-2349-5162)
JETIRC006272 Journal of Emerging Technologies and Innovative Research (JETIR) www.jetir.org 1584
5.2 Building Information The case study buildings comprising of the Main Building and the Administrative buildings are located in the tropical climate
of Chennai on latitude of 13°05'24"N and longitude 80°16'12"E at an altitude of 8 meters from the mean sea level. While the
Main Building is one large building built in the vernacular style of architecture, the Administrative building comprises of two
blocks namely University Administrative Building (UAB) and Fundamental Engineering and Research Establishment (FERE)
building which are built in the contemporary style of architecture.
5.2.1 Main Building
For the purpose of analysis, the College of Engineering - Guindy Campus, Main Building is taken. Built in 1920, the building
features many passive strategies to cater to the tropical climate. Built in the vernacular style of architecture, the longer axis of the
building is oriented towards North-South direction.
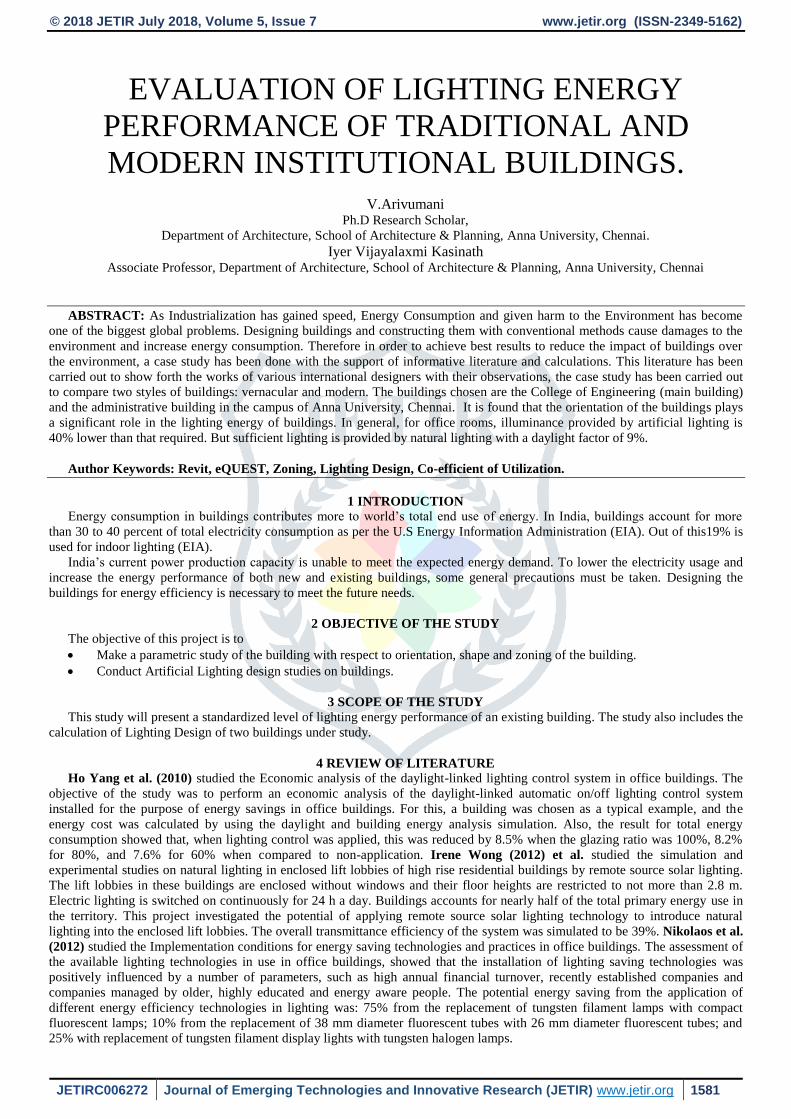
5.2.1a. Building drawings
Figures 5(a) and 5(b) show the ground and first floor plan of the Main Building respectively.
Fig. 5(a) Ground floor plan
Fig. 5(b) First floor plan
5.2.1b. Main Building Space Summary
The building use spaces are classified into eight major zones comprising of (1) Class rooms (2) Bank (3) Drawing halls (4)
Lobby (5) Restrooms (6) Conference Room (7) Computer room (8) All others. Total carpet area of the building is 3300 sq.m and
the plinth area is 3413.2sq.m. On the ground floor, 86.9% of the total area is naturally ventilated and the remaining areas are air-
conditioned. In first floor 84.4% of total first floor area is naturally ventilated. Table 1 gives the space summary of the building.
Table 2 gives a brief about the building materials used in the construction of the building.
Table 1 Main Building Space allocation
Air Conditioned Non Air conditioned
Building Use Area (sq.m.) Building Use Area (sq.m.)
Office room
(Executive) 99 Drawing hall 666
Bank 222 Office(General) 284
Conference hall 67 Storage 180
Computer room 123 Class room 338
- - Rest room 79
- - Others 1068
Total area 511 Total area 2686

© 2018 JETIR July 2018, Volume 5, Issue 7 www.jetir.org (ISSN-2349-5162)
JETIRC006272 Journal of Emerging Technologies and Innovative Research (JETIR) www.jetir.org 1585
Table 2 Building Materials used for construction
Component Building Material
Wall Brickwork with lime mortar
Window Wooden frames with clear glass(1.2m x 1.2m)
Door Wooden doors 1.2 m wide
Ground floor height- 4 m
First floor – 2.7 m
Wall finishes Exterior-Open brickwork system, Interior-Cement plastering
Floor finish 0.6 m x 0.6 m vitrified tiles
Roof Wooden rafter, Steel beams, Madras Terrace slab
5.2.1c. Window Wall Ratio
Table 3 shows the calculation of window wall ratio of Main building.
Table 3 Calculation of window wall ratio
Floor Room Type Wall Area (m2) Window Area (m2) Window Wall
Ratio
Ground floor
Classroom I 71.28 4.86 0.07
Classroom II 59.4 3.24 0.05
Classroom III 59.4 4.86 0.08
Classroom IV 59.4 5.94 0.1
Classroom V 37.62 1.62 0.04
First floor
Classroom VI 39.6 1.62 0.04
Classroom VII 41.31 4.86 0.12
Office 76.5 5.76 0.08
5.2.2. Administrative Building
The Administrative Building consists of two building blocks namely the University Administrative Building (UAB), built in
the year 1990 and Fundamental Engineering and Research Establishment (FERE) Building built in the year 1975. The UAB is
oriented with its longer axis along the East-West axis, while the FERE building is oriented along the North- South direction. The
energy performance of both orientations is to be compared.
Table 4 shows the occupancy in the University Building and FERE Building on various levels.
Table 4 Occupancy of University Building and F.E.R.E Building
Level
Occupancy(person)
University Building(VC) F.E.R.E Building
Ground floor 21 66
First floor 27 74
Second floor 11 70

© 2018 JETIR July 2018, Volume 5, Issue 7 www.jetir.org (ISSN-2349-5162)
JETIRC006272 Journal of Emerging Technologies and Innovative Research (JETIR) www.jetir.org 1586
The longer axis of the University Building is East oriented and the FERE building is North oriented making them
perpendicular to one another. The University Building is exposed to intense Eastern and Western Sun, whereas only the shorter
faces of the FERE building is subjected to Eastern and Western sun. Both the buildings are surrounded by large number of trees
which casts good shade to all sides of both the buildings.
5.2.2a. Building drawings
Figures 6(a), 6(b) and 6(c) show the floor plans of the University Building. Figure 7(a), 7(b) and 7(c) shows the Floor Plans of
the FERE building. Figures 8(a) and 8(b) show the front East elevation of the University Building and North elevation of the
Fundamental Engineering and Research Establishment (FERE) Building respectively.
Fig. 6(a). Ground floor Plan of University Building Fig. 6(b). First floor Plan of University Building
Fig. 6(c). Second floor Plan of University Building

© 2018 JETIR July 2018, Volume 5, Issue 7 www.jetir.org (ISSN-2349-5162)
JETIRC006272 Journal of Emerging Technologies and Innovative Research (JETIR) www.jetir.org 1587
Fig. 7(a). Ground floor Plan of FERE Building
Fig. 7(b). First floor Plan of FERE Building
Fig. 7(c). Second floor Plan of FERE Building
Fig. 9(a). 3D model of the building
Fig. 8(a). Front-east elevation of
the University Building.
Fig. 8(b). North elevation of
the FERE Building.

© 2018 JETIR July 2018, Volume 5, Issue 7 www.jetir.org (ISSN-2349-5162)
JETIRC006272 Journal of Emerging Technologies and Innovative Research (JETIR) www.jetir.org 1588
Fig. 9(b). Rendered image from REVIT software
Fig. 9(c). Western elevation Fig. 9(d). Southern elevation
Fig. 9(e). Eastern view (Ground Floor) Fig. 9(f). South Eastern view (First Floor)
5.2.2b. Area Details The details of the plot area, plinth area and carpet area of the administrative buildings is as mentioned in Table 5.
Table 5 Area details of the Administrative Building
S.No Detail Area
1. Plot area 17,140 m2
2. Plinth area 1256 m2
3. Built-up area 3754 m2
4. Air conditioned area 2005.4 m2
The Administrative building comprises of three floor levels. The carpet area of each floor of both the buildings is mentioned
in Table 6.
Table 6 Carpet area of Administrative Building
Level
Carpet area of Administrative Building
University Building(m2) FERE Building(m2)
Ground level 393 863
First level 590 801
Second level 590 801
5.2.2c. Materials
The University Administrative building and the FERE building are built in the contemporary style of architecture using
modern building materials as shown in Table 7

© 2018 JETIR July 2018, Volume 5, Issue 7 www.jetir.org (ISSN-2349-5162)
JETIRC006272 Journal of Emerging Technologies and Innovative Research (JETIR) www.jetir.org 1589
Table 7 Materials used in Administrative building
Component Material
University Building F.E.R.E. building
Wall Brick Brick
Window Wooden Wooden
Door Wooden doors Wooden doors
Floor Mosaic and tiles Mosaic
Roof Concrete Concrete
5.3 Building model
The software used for energy analysis of the building are REVIT Architecture 2013 and eQUEST. Using the CAD drawing as
the base, the plans are extruded to 3D model using Revit software as shown in Figure 9(a). After extruding the building, Revit's
rendering engine is used to make a more realistic image. This is accomplished by using the premade model, wall, floor, etc. The
rendered image from REVIT software is shown in Figure 9(b) which is closely resembles the building. Figures 9(c) and 9(d)
shows the view of the building along Western and Southern directions. Figure 9(e) shows the Eastern view on the Ground floor.
Figure 9(f) shows the South Eastern view on the First floor.
5.3.1 Building zones The building is divided into seven zones depending upon the usage of rooms, as shown in table 8.
Table 8 shows the various zone details of the Main building.
Zone Usage Nos Occupancy
I Classroom 7 420
II Drawing Hall 3 360
III Computer Room 1 40
IV Office Room 1 40
V Conference Hall 1 40
VI Bank 1 100
VII Dean Room 1 3
5.3.2 Building operations and scheduling This includes information about the occupancy schedule (times, days of the week, and seasonal variations), occupied indoor
thermostat set points, HVAC and internal equipment operations schedules. eQUEST defaults operations schedule information
based on building type.
Figure 10(a) shows the Occupancy scheduling of the seven zones in the main building. Classrooms are both day-loaded and
non-day loaded. Figure 10(b) shows the lighting schedule of seven zones in the main building.
Fig. 10(a). Occupancy Profile
Fig. 10(b). Lighting Profile

© 2018 JETIR July 2018, Volume 5, Issue 7 www.jetir.org (ISSN-2349-5162)
JETIRC006272 Journal of Emerging Technologies and Innovative Research (JETIR) www.jetir.org 1590
Description of zones for University Administrative Building and FERE building is given in Annexure 1.
5.4 Artificial Lighting Design Study
When planning a lighting installation, it is necessary to perform a series of calculations. In general, these refer to the exact
illuminance levels in specific parts of the space and the number of luminaires required for a room space. The utilisation factor
describes the portion of luminous flux emitted by the light sources, which falls on the working plane after interaction with
luminaires and room surfaces. It is derived from the geometry of the space, the reflectance of the room surfaces and the efficiency
and the distribution characteristics of the luminaires used.
5.4.1 Main Building
Lighting Design- as per SP: 41 (S&T) - 1987
Number of luminaires required =
Where, E – Illuminance required, lux
A – Floor area of the room; µ - Coefficient of utilization
D – Maintenance factor; Φ – Output in lumens
Coefficient of utilization is found from room index value.
Room index = [(L x W)] / (L+W)hm
Height of workplane is assumed to be 0.75 m.
Mounting height above the workplane, hm =3.35-0.75 = 2.6 m (mounted) ,
=3.96-1.07-0.75 = 2.6 m (suspension)
Luminaire used is two lamp aluminium troffer with louvers. It comes under direct lighting category. Luminaires should
be placed parallel to long wall.
Spacing of luminaires = 0.8H=0.8 x 3.6 = 2.9 m
Initial lumen output of lamps = 2440 lumen
Maintenance factor = 0.75 good;
Reflectance: Wall -0.5,Ceiling – 0.8, Floor – 0.1
By using the standard coefficient of utilization and illuminance value the required number of luminaires is found out and
compared with the original number of luminaires provided in the site.
5.4.2. Artificial Lighting Studies on Administrative Buildings
Room index = [(L x W)] / (L+W)hm
Height of workplane is assumed to be 0.75 m.
Mounting height above the workplane = 3.66-0.75 = 2.9 m (without false ceiling)
=3.35-0.75 = 2.6 m (with false ceiling)
Luminaire used is two lamp aluminium troffer with louvers. It comes under direct lighting category.
Required illuminance for the rooms = 300 lux
Initial lumen output of lamps = 2440 lumen
Maintenance factor = 0.75good
Reflectance = Wall -0.5; Ceiling – 0.8; Floor – 0.1
Luminaires should be placed parallel to long wall.
6.0. RESULTS AND DISCUSSIONS
The Main building and Administrative Building including the University Building and Fundamental Engineering and
Research Establishment (FERE) Building of Anna University are selected for energy performance study. Once the modelling and
calculations are completed, energy analysis of the building is done in Revit and eQUEST software to assess Electricity
Consumption and Peak demand requirement of the building. Artificial lighting study is also done to check whether the provided
lighting complies with the Indian Standards. The results obtained based on the above is discussed as follows.
6.1. REVIT ANALYSIS RESULTS
The buildings are analysed by Revit software and results are drawn out. In main building the monthly Electricity consumption
is 40% more in summer months as compared to winter months. Demand is 10% more in summer months as compared to winter
months in all the buildings. Figure 11(a) shows the monthly Electricity Consumption of the buildings. Electricity consumption is
40% more in summer months as compared to winter months in the main building. Figure 11(b) shows the monthly peak electricity
demand of the buildings. Demand is 10% more in summer months as compared to winter months in all the buildings.
Fig. 11(a). Monthly Electricity Consumption

© 2018 JETIR July 2018, Volume 5, Issue 7 www.jetir.org (ISSN-2349-5162)
JETIRC006272 Journal of Emerging Technologies and Innovative Research (JETIR) www.jetir.org 1591
Fig. 11(b). Monthly Peak Demand
6.2. eQUEST Analysis Results Next step is to analyze the building using eQUEST software.
6.3. Main building Figure 12(a) shows the monthly energy consumption of the building. It is found that Lighting consumes more energy than
miscellaneous equipment and mechanical fans. About 17 % of total annual energy consumption is for lighting of the building.
Monthly peak demand is higher in the month of May and least in the month of January 2014. Lighting accounts for higher annual
peak demand of electricity consumption than mechanical fans and miscellaneous equipments. Figure 12(b) shows the monthly
peak demand of the building.
Fig. 12(a). Monthly Energy Consumption by enduse – Main building
Fig. 12(b). Monthly Peak Demand by enduse – Main building
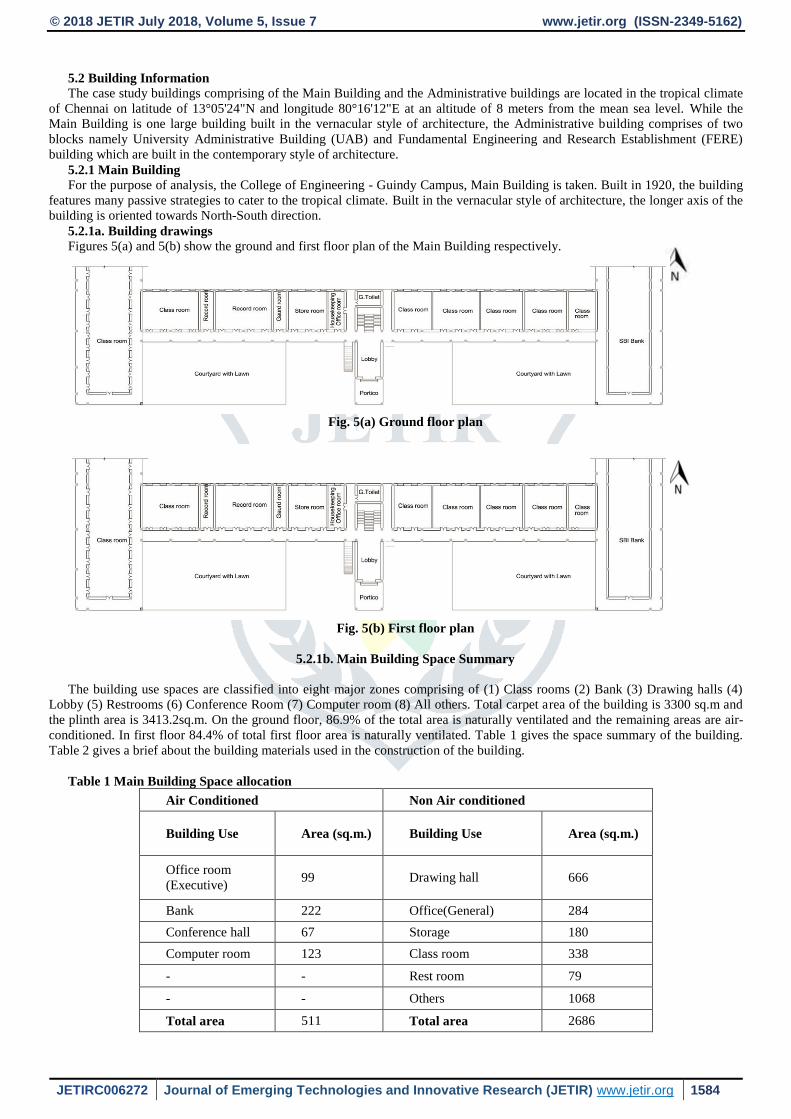
6.4. Administrative building
University building consumes more energy when compared to the FERE building. With respect to energy consumption for
lighting there is not much difference in summer as well as winter months. Figure 13(a) shows the electric consumption for Area
Lighting and Ventilation fans of the Administrative buildings (University Administrative Building and FERE building). Annual
Electricity Consumption for the Administrative building (University building and FERE building) is shown in Figure 13(b).
Energy Consumption for Lighting and Miscellaneous equipment is 61% and 54% respectively, higher in University building
when compared to FERE building. Mechanical fans’ utilization is similar for both, the University Administrative and FERE
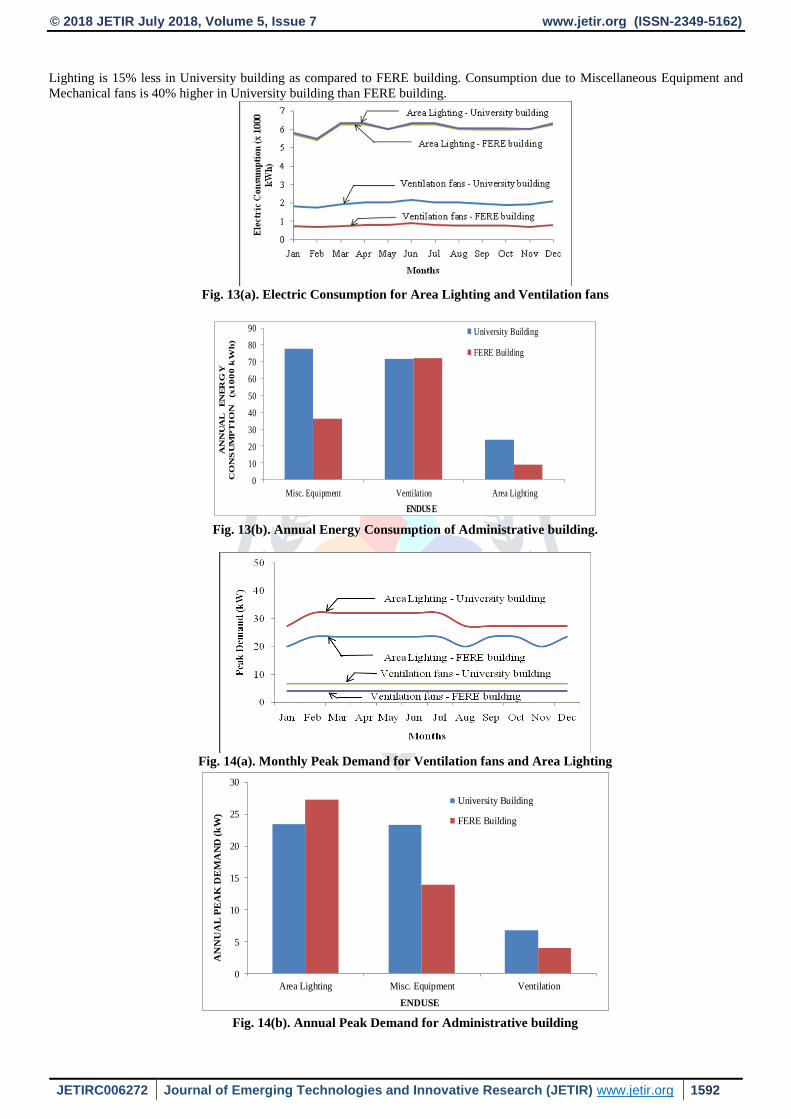
building. Peak Demand for lighting of University building is higher than the FERE building. Lighting contributes more to Peak
demand compared to Mechanical fans. Figures 14(a) and 14(b) respectively show the Monthly Peak Demand and Annual Peak
Demand for Mechanical fans and Area Lighting in the Administrative buildings. It is found that the Annual Peak Demand for
© 2018 JETIR July 2018, Volume 5, Issue 7 www.jetir.org (ISSN-2349-5162)
JETIRC006272 Journal of Emerging Technologies and Innovative Research (JETIR) www.jetir.org 1592
Lighting is 15% less in University building as compared to FERE building. Consumption due to Miscellaneous Equipment and
Mechanical fans is 40% higher in University building than FERE building.
Fig. 13(a). Electric Consumption for Area Lighting and Ventilation fans
0
10
20
30
40
50
60
70
80
90
Misc. Equipment Ventilation Area Lighting
AN
NU
AL
E
NE
RG
Y
CO
NS
UM
PT
IO
N
(x1
00
0 k
Wh
)
ENDUS E
University Building
FERE Building
Fig. 13(b). Annual Energy Consumption of Administrative building.
Fig. 14(a). Monthly Peak Demand for Ventilation fans and Area Lighting
0
5
10
15
20
25
30
Area Lighting Misc. Equipment Ventilation
AN
NU
AL
PE
AK
DE
MA
ND
(k
W)
ENDUSE
University Building
FERE Building
Fig. 14(b). Annual Peak Demand for Administrative building
© 2018 JETIR July 2018, Volume 5, Issue 7 www.jetir.org (ISSN-2349-5162)
JETIRC006272 Journal of Emerging Technologies and Innovative Research (JETIR) www.jetir.org 1593
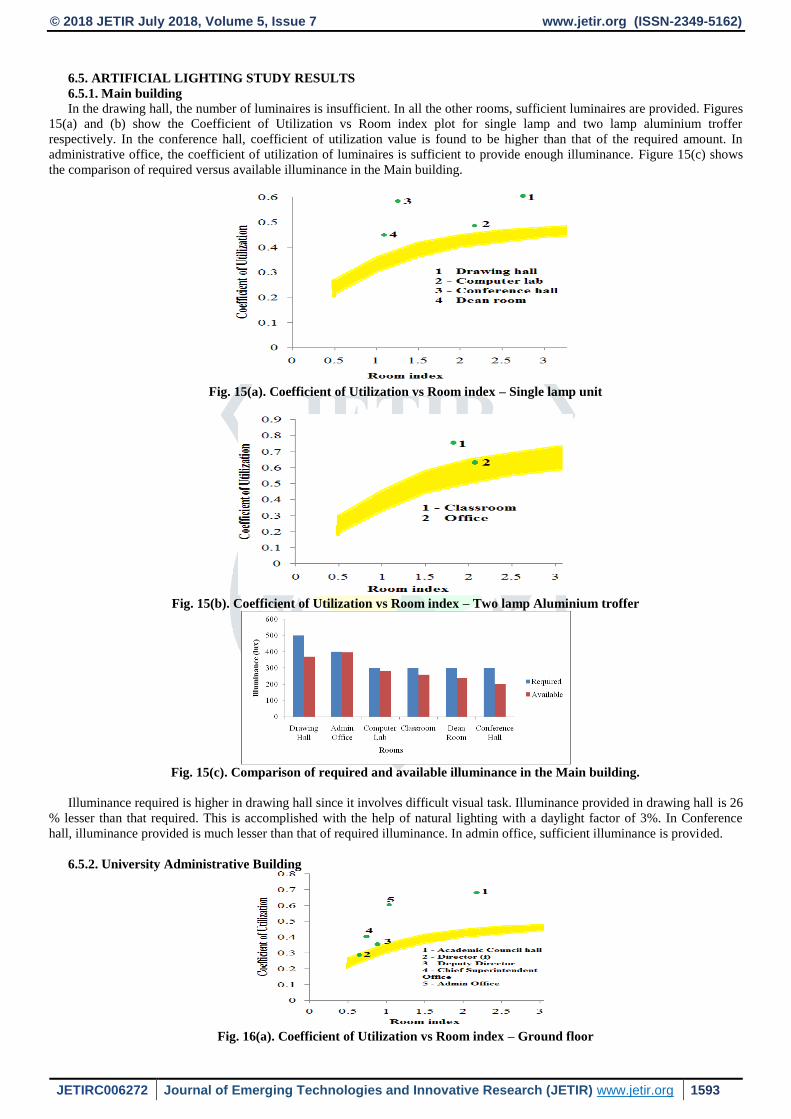
6.5. ARTIFICIAL LIGHTING STUDY RESULTS
6.5.1. Main building
In the drawing hall, the number of luminaires is insufficient. In all the other rooms, sufficient luminaires are provided. Figures
15(a) and (b) show the Coefficient of Utilization vs Room index plot for single lamp and two lamp aluminium troffer
respectively. In the conference hall, coefficient of utilization value is found to be higher than that of the required amount. In
administrative office, the coefficient of utilization of luminaires is sufficient to provide enough illuminance. Figure 15(c) shows
the comparison of required versus available illuminance in the Main building.
Fig. 15(a). Coefficient of Utilization vs Room index – Single lamp unit
Fig. 15(b). Coefficient of Utilization vs Room index – Two lamp Aluminium troffer
Fig. 15(c). Comparison of required and available illuminance in the Main building.
Illuminance required is higher in drawing hall since it involves difficult visual task. Illuminance provided in drawing hall is 26
% lesser than that required. This is accomplished with the help of natural lighting with a daylight factor of 3%. In Conference
hall, illuminance provided is much lesser than that of required illuminance. In admin office, sufficient illuminance is provided.
6.5.2. University Administrative Building
Fig. 16(a). Coefficient of Utilization vs Room index – Ground floor

© 2018 JETIR July 2018, Volume 5, Issue 7 www.jetir.org (ISSN-2349-5162)
JETIRC006272 Journal of Emerging Technologies and Innovative Research (JETIR) www.jetir.org 1594
Figures 16(a), (b) and (c) show the Coefficient of Utilization versus Room index plot for ground, first and second floor of the
University Administrative Building respectively. In the Syndicate Hall, Director (Finance) room, Office of Additional Registrar
rooms, sufficient lighting is provided. In Deputy Director’s room and Director’s room sufficient lighting is provided. Figures
17(a), (b) and (c) show the comparison of required and available illuminance of ground, first and second floor of the university
building respectively.
Fig. 16(b). Coefficient of Utilization vs Room index – First floor
Fig.16(c). Coefficient of Utilization vs Room index – Second floor
Fig. 17(a). Comparison of Required and available Illuminance in the Ground floor- University building.
Fig. 17(b). Comparison of Required and available Illuminance in the First floor- University building.
Fig. 17(c). Comparison of Required and available Illuminance in the Second floor- University building.

© 2018 JETIR July 2018, Volume 5, Issue 7 www.jetir.org (ISSN-2349-5162)
JETIRC006272 Journal of Emerging Technologies and Innovative Research (JETIR) www.jetir.org 1595
In Deputy Director’s room and Director’s room, sufficient lighting is provided. In executive rooms, sufficient lighting is
provided. In office rooms, the artificial lighting provided is lesser by upto 50%. In the syndicate hall, the provided illuminance is
found to be sufficient for efficient lighting. In other office rooms it is found to be 33% lesser than what is needed.
6.5.3. FERE building Figures 18(a), (b) and (c) show the Coefficient of Utilization versus Room index plot for ground, first and second floor of
FERE building respectively. Artificial Lighting provided can be limited to the level of requirement as it can be seen that the
Coefficient of Utilization is much higher than the requirement. In some of the zones, natural light contributes significantly with a
daylight factor of 9%. Figures 19(a), (b) and (c) show the comparison of required and available illuminance of ground, first and
second floor of FERE building respectively.
Fig. 18(a). Coefficient of Utilization vs Room index –Ground floor FERE building.
Fig. 18(b). Coefficient of Utilization vs Room index –First floor FERE building.
Fig. 18(c). Coefficient of Utilization vs Room index –Second floor FERE building
Fig. 19(a). Comparison of Required and available Illuminance in the Ground floor- FERE building

© 2018 JETIR July 2018, Volume 5, Issue 7 www.jetir.org (ISSN-2349-5162)
JETIRC006272 Journal of Emerging Technologies and Innovative Research (JETIR) www.jetir.org 1596
Fig. 19(b). Comparison of Required and available illuminance in the First floor- FERE building.
Fig. 19(c). Comparison of Required and available Illuminance in the Second floor- FERE building.
In Office rooms (executive), the provided illuminance is found to be sufficient. But in other regular office rooms, on the first
floor, illuminance provided by artificial lighting is 40% lower than that required. But sufficient lighting is provided by natural
lighting with a daylight factor of 9%. In the Public Relations section, the illuminance provided is 35% lesser than that needed. In
executive office rooms, illuminance is 14% lesser than that of required illuminance.
6.5.4. COMPARISON BETWEEN BUILDINGS
Energy Consumption of University building is 50% higher than that of FERE building, due to orientation, longer side of the
University building is facing east and west direction. There is only marginal variation in the results during the summer months of
May, June and July 2014. Larger variation of about 30% is seen in the winter months. Both the software results show higher
energy consumption of about 35000 kWh in the summer months. Energy consumption in the main and administrative buildings
are mainly for Space cooling and lighting.
7. CONCLUSION After a wide study of different case study and analysis in lighting as per above literature and calculation, its been observed
that building orientation, control systems parameters and design parameters plays a vital role in the conclusion of lighting
required, the main aim was to show the best lighting system.
Orientation of the building plays a significant role in the Energy Efficiency of buildings. Since the Main building is oriented
North-South longer axis, it is found that Electricity consumption is 40% more in summer months as compared to winter months.
Monthly peak demand is higher in the month of May and least in the month of January for the same occupancy and equipment
load. In the Drawing Halls, the numbers of luminaires are insufficient (see table 9). In the Conference hall, Coefficient of
Utilization value is found to be much higher than that required. In Administrative office, the Coefficient of Utilization of
luminaires is sufficient to provide enough illuminance.
The University Building consumes more energy when compared to the FERE building. In the FERE building there is only
marginal variation in electricity consumption between summer and winter showing that choice of envelope building materials
plays an important role in Space Cooling and Lighting energy needs. In Office rooms (executive), the provided illuminance is
found to be sufficient. In general office rooms (first floor), the illuminance provided by artificial lighting is 40% lower than that
required. But sufficient lighting is provided by natural lighting with a daylight factor of 9%. By using Switching Controls, the
energy consumption due to Lighting can be drastically reduced.
Hence, after such comparisons, it has been observed and proved that the vernacular techniques followed while constructing
the main building proves to be more energy efficient and helps in reducing the consumption of electricity, hence as per the
abstract and objective the design of future buildings should consist of all parameter as per the points observed and proved to save
our environment being affected by our buildings.
REFERENCES
Byung-Lip Ahn, Seunghwan Yoo, Jonghun Kim, Hakgeun Jeong, Seung-Bok Leigh, Cheol-Yong Jang (2016), ‘Thermal
management of LED lighting integrated with HVAC systems in office buildings’, Journal of Energy and Buildings, Elsevier
Publications, Vol. 127, pp. 1159-1170.
Chuang Wang, Da Yan, Xiaoxin Ren (2016), ‘Modeling individual’s light switching behavior to understand lighting energy
use of office building’, Journal of Energy Procedia, Elsevier Publications, Vol. 88, pp. 781 – 787.
Dipti Chitnis, N.Thejokalyani, H.C.Swart, S.J.Dhoble (2016), ‘Escalating opportunities inthe field of lighting’, Journal of
Renewable and Sustainable Energy Reviews, Elsevier Publications, Vol. 64, pp. 727–748.
Eduardo Fernandez and Gonzalo Besuievsky (2012), ‘Inverse lighting design for interior buildings integrating natural and
artificial sources’, Journal of Computers & Graphics, Elsevier Publications, Vol. 36, pp. 1096–1108.
E.J. Gago, T.Muneer, M.Knez, H.Köster (2015), ‘Natural light controls and guides in buildings. Energy saving for electrical
lighting, reduction of cooling load’, Journal of Renewable and Sustainable Energy Reviews, Elsevier Publications, Vol. 41,
pp. 1–13.
In-Ho Yang and Eun-Ji Nam (2010), ‘Economic analysis of the daylight-linked lighting control system in office buildings’,
Journal of Solar Energy, Elsevier Publications, Vol. 84, pp. 1513–1525.

© 2018 JETIR July 2018, Volume 5, Issue 7 www.jetir.org (ISSN-2349-5162)
JETIRC006272 Journal of Emerging Technologies and Innovative Research (JETIR) www.jetir.org 1597
Irene Wong, H.L. Choi, H. Yang (2012), ‘Simulation and experimental studies on natural lighting in enclosed lift lobbies of
highrise residential buildings by remote source solar lighting’, Journal of Applied Energy, Elsevier Publications, Vol. 92, pp.
705–713.
Kadir Amasyali and Nora El-Gohary (2016), ‘Building lighting energy consumption prediction for supporting energy data
analytics’, Journal of Procedia Engineering, Elsevier Publications, Vol. 145, pp. 511 – 517.
Marc Fontoynont, Karine Ramananarivo, Thierry Soreze, Gerald Fernez, Karen Guldhammer Skov (2016), ‘Economic
feasibility of maximising daylighting of a standard office building with efficient electric lighting’, Journal of Energy and
Buildings, Elsevier Publications, Vol. 110, pp. 435-442.
Nikolaos Zografakis, Konstantinos Karyotakis, Konstantinos P.Tsagarakis(2012), ‘Implementation conditions for energy
saving technologies and practices in office buildings: Part 1. Lighting’, Journal of Renewable and Sustainable Energy
Reviews, Elsevier Publications, Vol. 16, pp. 4165 – 4174.
Rizki A. Mangkuto, Mardliyahtur Rohmah, Anindya Dian Asri (2016), ‘Design optimisation for window size, orientation,
and wall reflectance with regard to various daylight metrics and lighting energy demand: A case study of buildings in the
tropics’, Journal of Applied Energy, Elsevier Publications, Vol. 164, pp. 211 - 219.
SP 41- Part 4 (S & T) – 1987 – Handbook on functional requirements of buildings.
Tomas Mendez Echenagucia, Alfonso Capozzoli, Ylenia Cascone, Mario Sassone (2015),‘The early design stage of a
building envelope: Multi-objective search through heating, cooling and lighting energy performance analysis’, Journal of
Applied Energy, Elsevier Publications, Vol. 154, pp. 577 - 591.