Complex evaluation methodology for energy-integrated ...
99
BUDAPEST UNIVERSITY OF TECHNOLOGY AND ECONOMICS GEORGE OLAH DOCTORAL SCHOOL Complex evaluation methodology for energy-integrated distillation columns Thesis submitted to the Budapest University of Technology and Economics for the degree of Doctor of Philosophy in Chemical Engineering presented by Hajnalka Kencse under the supervision of Prof. Dr. Peter Mizsey 2009
-
Upload
khangminh22 -
Category
Documents
-
view
1 -
download
0
Transcript of Complex evaluation methodology for energy-integrated ...

BUDAPEST UNIVERSITY OF TECHNOLOGY AND ECONOMICS
GEORGE OLAH DOCTORAL SCHOOL
Complex evaluation methodology for energy-integrated
distillation columns
Thesis submitted to the
Budapest University of Technology and Economics
for the degree of
Doctor of Philosophy in Chemical Engineering
presented by
Hajnalka Kencse
under the supervision of
Prof. Dr. Peter Mizsey
2009

2
Acknowledgements
I would like to gratefully acknowledge the supervision of Professor Péter Mizsey during
this work. Without his support and contributions, this thesis would never have emerged.
I thank my previous and present colleagues at the Department of Chemical and
Environmental Process Engineering for sharing their wisdom, which has inspired and
enlightened me. Thanks for the warm welcome of the colleagues when I started my work
at the department and for the friendly atmosphere over the years.
Sincere thanks to Balázs Bánfai and Prof. Sándor Kemény for the chemometrics related
discussions. I also thank to Zsolt Szitkai and József Manczinger for their guidance in
distillation design.
I would like to thank the PhD Scholarship based on Romanian-Hungarian Bilateral
State Agreement, the financial support of Richter Gedeon Centenary Foundation and
George Olah Doctoral School during my PhD studies.
I am forever indebted to my parents and my sisters that they helped and supported
me and always believed in me. Special thank to my mother who made enormous efforts
and sacrifices to provide the stability for my education.
Finally, I would like to thank the personal support and endless love of my fiancé over the
past years.
This thesis would not have been possible without this supporting milieu.
Hajnalka Kencse
Budapest, August, 2009

3
Abstract
Distillation is the primary separation process used in the chemical process industry for
liquid mixtures separation. Apart from the numerous advantages of the distillation, it has
a drawback, namely its significant energy requirement. In order to reduce the energy
consumption of these systems energy integration is applied within the distillation
columns or with other units of the global process. The specific literature offers a large
number of solutions for energy integration.
During the process design it is important to select the best applicable energy
integration for the distillation system in the case of the given separation task. In the last
decades the set of the selection criteria was completed with new elements. Apart from the
economic criterion, nowadays the environmental consciousness and controllability are
also important parameters of the process design.
The primary motivation of this thesis is to elaborate a complex process design
methodology that evaluates the distillation systems based on exergetic, economic and
greenhouse gas (GHG) emission aspects. The aim of the methodology is to determine
how these three features should be applied in process design to obtain information about
the accuracy of the design alternatives. The methodology is tested and demonstrated on
three different energy-integrated distillation systems: the direct sequence with backward
heat-integration (DQB), fully thermally coupled distillation column (FTCDC), and sloppy
distillation system with forward heat-integration (SQF). The studied distillation systems
are compared to each other and to the non-integrated conventional arrangement in the
case of the separation of ternary mixtures. Applying the proposed methodology reveals
that among the investigated distillation schemes the heat-integrated DQB alternative
proves to be the best applicable since it shows the most favoured features in a wide and
flexible range. The application of the methodology on the energy-integrated distillation
proofs the accuracy of the complex evaluation methodology. On the other hand, it
highlights and demonstrates that the exergy analysis can predict the results of the
economic study and the environmental evaluation to make the decisions, associated with
process design, much simpler.

4
Based on the results of the energy-integrated distillation system investigation the
backward heat-integrated distillation system is proposed during the retrofit design of an
industrial N, N-dimethylformamid (DMF)-water separation system. The task was to
examine how the capacity of the distillation based separation system could be increased
by 42.8% of a distillation system consisting three columns. The performance of the
existing distillation system and various increased-capacity structures have been studied
using rigorous process simulation. As the results of the study shows, the proposed energy
integration results in significant energy savings. The energy-integrated separation system
of increased-capacity consumes about half of the energy that would be required for the
operation of the non energy-integrated system.
The secondary motivation of my work is to investigate the controllability features
of the energy-integrated distillation systems and to elaborate an easy applicable
controllability analysis method in order to compare energy-integrated distillation systems
based on their control properties and to select the easiest controllable one.
The proposed controllability analysis is applied on the investigated energy-integrated
distillation systems and the results of this comparative study show that DQB has the best
control features among the studied ones. The second best is the FTCDC and it is followed
by the SQF. However, the conventional direct distillation sequence without energy
integration is considered a simple configuration, its controllability features prove to be
worse than the studied energy-integrated distillation systems. The results of the
controllability analysis are verified with closed-loop simulations by carrying out load
rejection analysis. It can be concluded that the results of the two different analysis
methods are in good agreement.
The application of the proposed controllability analysis sustains that the method is
simple and fast, thus it can be used in the early stage of process design.

5
Table of Contents
Chapter 1 Introduction............................................................................................... 7
1.1 Motivation and focus .................................................................................. 7 1.2 Approach..................................................................................................... 8 1.3 Overview of the dissertation ....................................................................... 9
Chapter 2 Literature review .................................................................................... 10
2.1 Distillation................................................................................................. 10 2.2 Energy-integrated distillation systems...................................................... 12 2.3 Thermodynamic efficiency of the distillation systems ............................. 14 2.4 Environmental emission estimation.......................................................... 15 2.5 Controllability issues and dynamic behaviour .......................................... 17 2.5.1 Condition number (CN) ............................................................................ 20 2.5.2 Morari resiliency index (MRI).................................................................. 20 2.5.3 Relative Gain Array Number (RGAno).................................................... 20
Chapter 3 The investigated case studies.................................................................. 24
3.1 The studied energy-integrated distillation systems................................... 24 3.1.1 Direct sequence with backward heat integration (DQB) .......................... 24 3.1.2 Fully thermally coupled distillation column (FTCDC). ........................... 25 3.1.3 Sloppy distillation system with forward heat integration (SQF) .............. 26 3.1.4 Conventional direct distillation scheme (Conv. Dir.) ............................... 27 3.2 Separation tasks ........................................................................................ 28
Chapter 4 The proposed complex evaluation methodology .................................. 29
4.1 Introduction............................................................................................... 29 4.2 Definition of the evaluation methodology ................................................ 29 4.3. The first level of the methodology............................................................ 30 4.3.1 The elaboration of the process alternatives............................................... 31 4.3.2 Definition of system boundaries ............................................................... 31 4.3.3 Selection of input / output parameters ...................................................... 31 4.4 The second level of the methodology ....................................................... 31 4.4.1 Collection of the necessary data ............................................................... 31 4.4.2 Exergy analysis ......................................................................................... 32 4.4.3 Economic Study........................................................................................ 34 4.4.4 Greenhouse gas emission estimation ........................................................ 34 4.5 The third level of the methodology........................................................... 35 4.5.1 Ranking process alternatives based on desirability function .................... 36 4.5.2 Decision .................................................................................................... 37 4.6 Application of the proposed evaluation methodology on the studied
distillation systems.................................................................................... 37 4.7 Conclusions of the complex evaluation methodology application ........... 49

6
Chapter 5 Retrofit design of an industrial heat-integrated distillation system... 51
5.1 Introduction............................................................................................... 51 5.2 The aim of the retrofit design work .......................................................... 52 5.3 Description of the existing separation process.......................................... 52 5.4 Simulation of the existing separation process........................................... 54 5.5 Retrofit scenarios and calculations ........................................................... 57 5.5.1 Existing vacuum columns.........................................................................59 5.5.2 Extra column connected parallel to the vacuum columns ........................ 60 5.5.3 Atmospheric column................................................................................. 60 5.6 Suggested retrofit design........................................................................... 61 5.7 Conclusions............................................................................................... 64
Chapter 6 Operability evaluation of the energy-integrated distillation systems. 65
6.1 Controllability analysis of the distillation systems ................................... 66 6.1.1 The selection of the controlled and manipulated variables....................... 66 6.1.2 Calculation of the controllability indices in frequency domain................ 66 6.1.3 Aggregation of the controllability indices ................................................ 67 6.1.4 Ranking of the studied distillation systems .............................................. 68 6.2 Application of the controllability analysis
on the investigated distillation systems..................................................... 68 6.3 Conclusion ................................................................................................ 78
Chapter 7 Major new results ................................................................................... 79
Thesis 1 ................................................................................................................... 79 Thesis 2 ................................................................................................................... 79 Thesis 3 ................................................................................................................... 80 Thesis 4 ................................................................................................................... 80
List of Publications ......................................................................................................... 81
References ................................................................................................................... 85
Nomenclature .................................................................................................................. 88
List of figures ................................................................................................................... 91
List of tables ................................................................................................................... 92
Appendix A ................................................................................................................... 93
Appendix B ................................................................................................................... 95

Chapter 1 Introduction
7
Chapter 1 Introduction
“Distillation, King in separation, will remain as the workhorse
separation device of the process industries. Even though it is old in
the art, with a relatively mature technology support base, it attracts
research and professional interest. Without question, distillation will
sail into future with clear skies and a strong wind. It will remain the
key separation method against which alternate methods must be
judged.” Dr. James R. Fair, 1990
In this chapter the thesis is presented concisely and placed in a wider perspective. The
motivations of my work are summarized and the approach is described. At the end of this
chapter an overview of the thesis is given. The literature background and the related
works are discussed in Chapter 2.
1.1 Motivation and focus
The chemical process design practice has developed over the years according to the
requirements of the time. The aim of the process design is to find the feasible process
alternatives and to choose the most suitable one for the specific production task. This
process design became computer aided in the last decades which makes possible to apply
more complex analysis in the early stage of design. Within the computer aided conceptual
design two major approaches are elaborated: the hierarchical approach, and the
algorithmic design approach. These approaches help to find the optimal process
alternative by working out the heat and material balances, operating conditions, and
process equipment performances. Parallel to the design of the process further studies are
needed in order to eliminate process alternatives outside the limits of the operating
conditions, profitability or safety conditions. Further benefit of comprehensive process
evaluation in early stage is that the late modifications with high cost can be avoided.

Chapter 1 Introduction
8
Thus, the methodology of process design used in the past decades should be reconsidered
and developed according to the criteria claimed by recent requirements.
The early stage of process design was practically based on engineering design and
the alternatives were evaluated merely according to their economic features. The
methodology of process design should be completed with new steps. Nowadays, due to
increasing energy prices and strict environmental regulations the investigation of the
energy efficiency and the emissions of the process must take place simultaneously at the
early stage of process design.
The demand for energy has been continuously increasing for years and operation
units with large energy demand have become more difficult to be supplied. The energy
efficiency of a system becomes an important criterion during retrofitting and design of
industrial processes. On the other hand, the emission regulations constrain engineers to
consider the concept of environmentally-consciousness in their work. This
environmentally-consciousness is even more important in the European Union since the
Union ratified the Kyoto Protocol and established a scheme for greenhouse gas emission
trading in 2005. Due to the large energy demand of distillation systems these regulations
have special importance which can be reduced e.g. by using energy integration.
The thesis presents an evaluation methodology for energy-integrated distillation
columns which investigates the distillation system based on exergy analysis, economic
study, and greenhouse gas emission estimation. As a next step of the process design the
controllability and dynamic behaviour of the distillation systems are investigated. These
investigation steps assure the designer that the distillation system will meet the claimed
requirements.
The proposed methodology should be included in the global process synthesis
beside of the preliminary evaluation of the market, development of data necessary for the
design, and detailed engineering design.
1.2 Approach
The simulation models of the studied distillation systems are implemented in the ASPEN
Plus process simulator. Moreover, the applied studies in this work e.g. exergy analysis,

Chapter 1 Introduction
9
economic study require the use of MS-Excel connected to the process simulator where
the different exergy calculating equations or the cost functions are introduced.
The environmental impact assessment in the dissertation is done with the use of
SimaPro software. The model developed by Gadalla et al verifies the results calculated by
this software. The controllability study is carried out with the Control Design Interface of
Aspen Dynamics and the results are further analysed in Matlab.
In order to model the distillation systems the following simulation methodology is
developed: first, the number of the theoretical trays, location of the feed trays and the
reflux ratio are estimated with shortcut design procedure. The results of the shortcut
design are implemented in rigorous column model.
The model of the distillation system composed by two columns is simulated first
without energy integration and based on the energy-demand the energy integration
between the two columns is applied. Furthermore, the energy consumption of the
distillation system is optimized. The applied process simulator is used also for equipment
sizing such as distillation column diameter, tray geometry, and heat exchanger
dimensions.
1.3 Overview of the dissertation
The remainder of this thesis is as follows:
In chapter 2 the literature review is presented in connection with my work in topic.
The chapter 3 presents the investigated distillation systems as case studies and the
separation tasks.
The chapter 4 elaborates a complex evaluation methodology for energy-integrated
distillation systems. The proposed methodology is applied on the distillation systems
presented in the previous chapter
An industrial retrofit design is presented in the chapter 5. The task of the retrofit
design is to increase capacity by 42.8% and energy saving.
Chapter 6 presents operability evaluation of the energy-integrated distillation
system regarding controllability and dynamic behaviour.

Chapter 2 Literature review
10
Chapter 2 Literature review
Distillation is a widely used separation process, which separates liquid mixtures formed
by components with different volatilities. The group of separation processes can be
classified according to the type of feed stream (heterogeneous or homogeneous).
Homogeneous feed can be classified based on the type of controlling process either
equilibrium process or rate governed process, the equilibrium process can be classified
depending on the type of separating agent (energy or mass). The energy is used as
separating agent in distillation, evaporation and crystallization processes. Mass separating
agent is used in the case of absorption, stripping, and extraction. The previously
mentioned rate governed process class contains unit operations such as reverse osmosis,
gaseous diffusion, electro dialysis, and gas permeation.
Heterogeneous feed is generally separated by mechanical separation processes as
filtration, flotation, and centrifuge.
In this thesis the distillation is selected as separation process in case of zeotropic
ternary mixtures. In the case of regular distillation the separation is occurring by adding a
separating agent, which takes the form of matter or energy.
The disadvantage of the distillation is its high energy consumption which involves
high operating cost for these separation units. Significant energy savings can be made
with use of distillation structures with energy integration such as heat integration, heat
pumping, and thermocoupling.
2.1 Distillation
Distillation is a key separation technology in the chemical industries for the separation of
liquid mixtures. It is a process of separating the liquid mixture into two or more products
that have different boiling points by boiling out the more volatile components out of the
mixture. In spite of its low thermodynamic efficiency the popularity of the distillation has
not decreased in the last decades. The advantage of the distillation has both kinetic and
thermodynamic reasons: it takes place without added inert material and the mass transfer
Chapter 2 Literature review
11
per unit volume in distillation is limited only by the diffusional resistances, thus the
distillation has the potential for high mass transfer rates and proportionally it involves
low capital costs. The distillation can not be used or not economic in the cases when:
• The difference of the volatility between the components is small.
• A small quantity of high boiling point component is to be recovered from feed and
the whole feed has to be vaporized because of this small quantity.
• A compound is not stable thermally even under vacuum conditions.
• The mixture is extremely corrosive or highly fouling.
The distillation design can not be discussed without mentioning the vapour-liquid
equilibrium (VLE). However VLE is a large topic and the detailed discussion is not the
aim of the thesis so a brief and practical state-of-the-art review is presented of the VLE
topic.
The K-value is a measure of the tendency of component i to vaporize:
phase liquid in i component of fraction of Mole
phase vapor in i component of fraction of MoleK i =
(1)
The high K-value shows that the component tends to concentrate in the vapour phase and
the low K-value indicates that the component tends to concentrate in the liquid phase. If
the K-value is unity, the component will split equally between the vapour and liquid
phase. The K-value is a function of temperature, pressure, and composition.
Apart from the K-value, the relative volatility can be use to characterize the liquid
mixture:
j component of valueK
i component of valueKij −
−=α (2)
Distillation is a technique of separating components according to their relative volatility
which is a measure of the ease of separation. If relative volatility is high, one component
has a much greater tendency to vaporize than the other and the mixture can be easily
separated e. g. by distillation. In the case of relative volatility close to unity the mixture
can not be separated by distillation.
The ease of separation of ternary mixtures (ABC) can be characterized by the separation
index (SI):

Chapter 2 Literature review
12
BC
AB
α
αSI =
(3)
where αij is the relative volatility.
If SI<1 A/B separation is more difficult than B/C separation. If SI~1 A/B separation is as
difficult as B/C separation, the ease of separation is balanced. If SI>1 the B/C separation
is more difficult than A/B separation.
The present thesis contains case studies separating ideal mixtures. In these ideal mixtures
the components have similar physicochemical properties with equal intermolecular forces
between the molecules. The VLE for an ideal mixture can be defined as:
( ) ( )TPxTxPy iiii0,γ= (4)
where
xi, yi – the vapour and liquid mole fractions of component i
P - pressure
T – temperature
Pi0 – saturated vapour pressure of component i
γi – activity coefficient of component i in liquid phase
The activity coefficient is a measure of non-ideality of a mixture and changes both with
temperature and composition. In the case of ideal mixtures the value of activity
coefficient is unity.
2.2 Energy-integrated distillation systems
The demand for energy has been continuously increasing for years and operation units
with large energy demand have become more difficult to be supplied. Reconsideration
and rationalization of industrial plants is recommended. On the other hand reducing
energy requirements of distillation systems leads to lower CO2 emission; this is why the
plant designer must take the different energy saving solutions in account and choose the
adequate distillation system for the specific separation task.
The large energy requirement of distillation can be reduced by using different types
of energy integration between the distillation columns. Among the energy-integrated
solutions several alternatives can be mentioned:

Chapter 2 Literature review
13
i. Heat integrated columns
• Conventional heat integration
− Forward heat integration
− Backward heat integration
• Sloppy sequence with heat integration
− Forward heat integration
− Backward heat integration
− Partial heat-integrated alternatives
ii. Thermo coupling
• Fully thermally coupled distillation column or Petlyuk column
• Divided wall column or Kaibel column
• Side stream rectifier
• Side stream stripper
iii. Heat pumping
• Vapour recompression
• Bottom flash
• Closed cycle or working fluid
iv. Energy integration of the distillation columns with the overall process
Even today, the most frequently studied energy consuming process in the chemical
industry is the separation systems based on distillation. The large energy requirement of
these processes can be reduced by using energy integration.
This thesis studies representative distillation systems of the heat-integrated and the
thermocoupling group. These energy-integrated distillation systems are frequently studied
in the literature1-7, investigating their energy saving properties through comparative
studies, elaborating design methods for one specific type of energy-integrated distillation
sequence. Sobocan et al8 developed a systematic synthesis of thermally integrated
distillation systems. This method helps in reducing external energy input of the
distillation systems by minimizing the utility consumption and maximizing the heat
exchange between the integrated columns. The elaborated algorithmic procedure uses the
extended grand composite curve in order to select the most adequate heat-integrated

Chapter 2 Literature review
14
distillation system. The proposed design method takes in account only energetic criteria.
A completely different approach is developed by Wang et al9 for distillation system
synthesis. The authors propose an improved genetic algorithm, on which a rigorous
model for synthesis and optimization of a distillation system is set up. The proposed
approach does not rely on a sequential decomposition of the problem since it accounts
simultaneously for the trade-off between energy cost and separation sequence.
Mascia et al10 examines different heat-integrated and thermally coupled distillation
systems. The authors carry out a comparative study of the investigated distillation
systems and rate these systems based on their total annual cost. Apart from the economic
evaluation, this rating does not contain any other criterion.
Annakou et al11 have studied heat-integrated schemes and fully thermally coupled
distillation columns (FTCDC) by rigorous modelling and compared them to conventional
schemes. They have found that FTCDC can be competitive with the heat-integrated
schemes only in those cases when the concentration of the middle component is high and
the A/B split is harder than B/C split otherwise FTCDC is less economic than the heat-
integrated scheme.
Regarding the energy demand of the thermally coupled distillation columns
Hernandez et al.12 have studied the Petlyuk column and six alternative arrangements for
ternary hydrocarbon mixture separation. They have found that the alternative distillation
systems have very similar values of energy demands and thermodynamic efficiencies.
2.3 Thermodynamic efficiency of the distillation systems
The large energy demand of the distillation urges to study the process and to identify the
energy losses. Certainly, the low thermodynamic efficiency of distillation is caused not
by the separation process but mainly by the work necessary to introduce and remove the
heat from the column13. Thermodynamically, the distillation process consists of the
removal of entropy of mixing. The process requires exergy or work of separation. In a
distillation process, exergy is provided by the input and the removal of heat at different
temperature levels. Heat at high temperature is fed into the reboiler and heat at low
temperature is removed in the condenser. Efficiency of distillation columns is very low

Chapter 2 Literature review
15
because the actual exergy needed for a separation is much larger than the exergy for
reversible separation.
In order to investigate the energy wastes, a useful tool is the exergy analysis, which
gives an overall view about the location and scale of energy losses in the process. Some
published works in literature focus on development of exergy analysis methods and
expressive parameters in order to quantify and represent the lost energy and the
thermodynamic efficiency of the distillation columns14-18. Other research works similar to
this one, apply the basic equations of the second law of thermodynamics and calculate the
thermodynamic efficiency for different distillation systems19, 20.
Suphanit et al. use successfully the exergy loss profile combined with the real
column T-H profile in order to locate the heat transfer across the wall of the dividing-wall
distillation column. The exergy analysis can be applied also for the study of complex
distillation plants to identify the process sections with the highest exergy losses and to
locate process sections with exergy improvement potential20, 21.
2.4 Environmental emission estimation
The emission inventory of distillation systems may contain air pollutants and residual
wastes. The former is produced through the heat generation and because of the large
energy demands of the distillation systems the quantity of air pollutants is significant.
The quantity of the emission related to the residual wastes depends on the separated
mixture. The air pollutants released by the heating system of the distillation may contain
carbon-, nitrogen-, sulphur-, and halogen-containing compounds. The quality and
quantity of these pollutants depend on the type of the fuel used for heating. In the case of
the fossil fuels the major part of the emission is formed by the carbon dioxide (CO2).
Thus, the air pollutant emission related to distillation systems contribute to the global
warming. Present-day measurements demonstrate the global increases in the
concentration of gases such as carbon dioxide, methane, and nitrous oxide in the
atmosphere. These greenhouse gases (GHG) act as atmospheric thermal isolators. They
absorb infrared radiation from the surface of the Earth and reradiate a portion of this
radiation back to the surface.22 These pollutants have a residence time that means how
long a representative molecule of the substance will stay in the atmosphere before it is

Chapter 2 Literature review
16
removed. In order to express the contribution of different gases in global warming the
global warming potential (GWP) was defined. The GWP is a quantified measure of the
globally averaged relative radiative forcing impacts of a particular greenhouse gas. It is
defined as the ratio of the time-integrated radiative forcing from the instantaneous release
of 1 kilogram (kg) of a trace substance relative to that of 1 kg of a reference gas (CO2).
Thus, the GWP depends on the absorption of infrared radiation by a given substance, the
spectral location of its absorbing wavelengths, and the atmospheric lifetime of the
substance.
The use of energy efficient distillation is beneficial also from the point of view of
greenhouse gas emission since this emission is limited in most of the countries. The CO2
emission of distillation systems is investigated by Gadalla et al23, 24. The authors quantify
the CO2 emission for a propylene-propane splitting process and propose a model for the
estimation of CO2. The model calculates the emissions flow rates from furnaces, boilers
and integrated gas turbines. According to the authors the CO2 emission can be decreased
by 83% using internally heat-integrated distillation column compared to conventional
alternatives in the case of a state of art propylene-propane split. In my thesis the CO2
emission calculations are verified using the model proposed by Gadalla et al24.
These studies, however, do not make a complex investigation of the different energy
consuming systems and their environmental effects, that is, how the results of the exergy
analysis can be applied to evaluate economic and environmental features in advance
making the process design step simpler. Therefore, the goal of my study is to elaborate
and propose such an evaluation methodology of process design alternatives that helps to
accomplish more energy efficient, economic, and environmental friendly processes. The
proposed methodology is evaluated and demonstrated on energy-integrated distillation
systems and helps to decide among the different kinds of energy integration solution for
ternary mixture separation.
The final aim is to classify the different process design alternatives to make the
evaluation of the synthesis step simpler at the early stage of process design.

Chapter 2 Literature review
17
2.5 Controllability issues and dynamic behaviour
The chemical processes during their operation must satisfy several requirements imposed
by the designers such as production specifications, operational constrains, economics,
environmental regulations. These requirements dedicate the need for control structures,
which realize the continuous monitoring of the operation. The task of the control
structure usually is to suppress the influence of external disturbances, to ensure the
stability of the chemical process, and to optimize the performance of the chemical
process.
Unit operations like distillation are generally controlled with feedback control
loops. The main elements of these feedback control loops are the output, potential
disturbance, and available manipulated variable. The disturbance change unpredictably
and according to the control objective, the output has to be kept at the desired value. The
feedback control works as it follows (Figure 1): the sensor measures the value of output
that is compared with the desired value (set point) and the deviation is supplied to the
controller. The controller changes the value of the manipulated variable in order to reduce
the magnitude of the deviation. Usually, the controller affects the manipulated variable
through the final control element (e.g. control valve).
Figure 1 General feedback control loop block diagram.

Chapter 2 Literature review
18
The binary distillation column shown in Figure 2 has two degrees of freedom
which can be used to specify top and bottom compositions. Apart from the compositions,
the levels and pressures may vary from the control point, so the distillation column may
be viewed as a 5 × 5 system25. The 5 manipulated variables are: reflux rate (L),
distillation rate (D), bottom rate (B), heat duty of the reboiler (Q), column head vapour
rate (V), and / or their ratio. The controlled variables are: levels in top and bottom, top
and bottom composition, and column pressure.
Figure 2 Binary distillation column with control loops25.
The process design procedure is a sequential discipline, where the control design is
carried out after the plant is designed. During plant design a number of basic plant
performance requirements have to be ensured in order to obtain a design which provides
acceptable operational performance. Usually, the process design alternatives are judged
on economic aspects alone without taking operability into account.
Operability is the ability of the plant to provide acceptable static and dynamic
operational performance that includes flexibility, switchability, controllability and several
other issues26.

Chapter 2 Literature review
19
The switchability measures the ease of moving the process from one desired
stationary point to another. Similarly, resiliency measures the degree to which a
processing system can meet its design objectives despite external disturbances and
uncertainties in design parameters.
Controllability is a capability of a process to operate economically and safely,
without violating constraints, achieving various design objectives in the presence of these
uncertainties. Since controllability is an inherent property of the process itself, it should
be considered at the design stage before the control system design is fixed. The most
preferable way to consider controllability at the design stage is to include controllability
as one of the design objectives just like traditional economic ones in the design
optimization problem.
Controllability evaluation methods may be classified into three types by the model
used in the evaluation procedure, steady-state model-based, linear dynamic model based,
and nonlinear dynamic model-based ones. Another way to evaluate controllability
quantitatively and explicitly is performing dynamic simulations of the target process.
However, detailed dynamic simulation requires detailed information on the system,
which is not known until the later part of design stage. Hence, in the last decades
different authors27-31 have developed simple controllability study methods, which can be
carried out in the early design phase.
In addition, it is important to emphasize that the controllability analysis usually is applied
for two type of problem:
i. Selection of the best controlled and manipulated variable pairing within one
process32, 33.
ii. Evaluation of control properties for two or more process alternatives34, 35
The controllability analysis is carried out by calculating the transfer function matrices (G)
with the CDI interface of the Aspen Dynamics. These transfer function matrices are
subjected to SVD (Singular Value Decomposition):
G = UΣVH (5)
where the G is an l × m matrix, Σ is an l × m matrix with , k = min (l, m) non-negative
singular values, σi, arranged in descending order along its main diagonal; the other entries
are zero. U is an l × l unitary matrix of output singular vectors, ui, V is an m × m unitary

Chapter 2 Literature review
20
matrix of input singular vectors vi and H denotes the complex conjugate transpose of the
corresponding matrix36.
In order to carry out the controllability study, different control indices were
elaborated, which are used to predict the degree of directionality and the level of
interactions in the system. These indices can be calculated in steady state or in frequency
domain. The controllability indices applied in my thesis are the following.
2.5.1 Condition number (CN)
CN of the transfer function matrix is the ratio between the maximum and minimum
singular values:
)G(
)G()G(
σσγ =
(6)
where )(Gσ is the maximum singular value and )(Gσ the minimum singular value of
the transfer function matrix. CN, lower than 10, indicates a well controllable process36. A
matrix with condition number larger than 103 is said to be ill-conditioned which implies
that the system is sensitive to unstructured input uncertainty. Theoretically, if the CN is
smaller than 10 the effects of the input uncertainty are always negligible. In contrast, the
large CN indicates the model sensitivity in general, but it does not hold in every case.
Therefore, the control structure with large CN can not be excluded from the possible
ones.
2.5.2 Morari resiliency index (MRI)
MRI also named as minimal singular value of the open-loop transfer function, which
stands for a specific input and output direction. The control system that presents large
value for MRI is preferred. Large MRI values indicate that the process can handle
disturbances without saturation of the manipulated variables27.
2.5.3 Relative Gain Array Number (RGAno)
RGAno is calculated from the relative gain array (RGA) which is the square matrix
defined as:
( ) ( ) TGG×=GRGA − (7)

Chapter 2 Literature review
21
where × is the Hadamard product and T denotes the transpose of the corresponding
matrix.
In the work of Bristol37 the RGA is proposed as a tool for pairing controlled and
manipulated variables in decentralized control system. Variable pairings corresponding to
positive relative gains should be preferred as close to unity as possible. Negative gains or
relative gains much larger than unity should be avoided, and large negative relative gains
are particularly undesirable.
RGA indicates the preferable variable pairings in a decentralized control system
based on interaction considerations and also provides information about integral
controllability, integrity, and robustness with respect to modelling errors and input
uncertainty28. The RGAno defined in equation 8 shows the deviation of the RGA from
unity:
( )sum
IGRGA=noRGA − (8)
However, the controllability study based on different control indices is a promising
evaluation method for selection of the best controlled and manipulated variable pairing;
many authors do not support its application without load rejection analysis in time
domain because the latter one entirely reveals the dynamic behaviour of the distillation
systems.
Gross et al33 describes a controllability analysis of an industrial heat-integrated
distillation process. The purpose of the work is to select the best controlled and
manipulated variable pairing for the studied heat-integrated distillation system. In order
to reveal the control properties of the system the authors carry out steady state
controllability analysis calculating RGA, Niederlinski index, MRI, CN. The steady state
controllability analysis is followed by dynamic controllability analysis where the control
indices are calculated in frequency domain. The results of the controllability analysis are
verified by a load rejection analysis, in other words by analyzing the closed-loop
behaviour of the distillation systems. The authors find that the controllability analysis can
only offer some hints about the dynamic process behaviour. This emphasizes the point
that a controllability analysis should be rather seen as a necessary than a sufficient
condition for selecting manipulated variable alternatives in the process design.

Chapter 2 Literature review
22
Based on the controllability study alone it is very difficult to decide which control
structure alternative is the best and which is the second best.
Haggblom28 proves that the frequency dependent RGA is suitable for evaluation of
distillation control structures only by considering the partially controlled plant obtained
by closing the inventory control loops.
Other authors like Lee et al38 consider that the relative gain array cannot be
effectively applied to dynamic systems for controllability evaluation however it is widely
used as a controllability index of steady-state systems.
Based on the publications in the literature can be concluded that the controllability
study used for controlled and manipulated variable pairing selection within a distillation
system is not reliable and the results should be verified by closed loop simulations.
In the case when the authors34, 35 evaluate the control properties of different distillation
system alternatives the applied controllability study can predict which alternative is easier
to control.
Bildea et al34 presents a comparative study of sloppy distillation system with
forward heat-integration (SQF) and with backward heat-integration. The aim of this work
is to prove the relationship between the design and control of the distillation systems. The
applied tools are the frequency dependent controllability analysis and the closed-loop
simulation. The authors find that the two investigated distillation systems have similar
energy consumption but their dynamic behaviour differs. The controllability analysis
predicts - in all situations - better dynamic properties for the sloppy distillation system
with forward heat-integration.
Gabor et al35 presents a simple methodology for the determination of controllability
indices in the frequency domain. The authors apply this methodology on two different
thermally coupled distillation systems (side-stream stripper and side-stream rectifier) and
investigate the controllability and dynamic behaviour of these. The controllability
investigation is applied both for selection of the best controlled and manipulated variable
pairing within one distillation system and for control properties comparison of two
distillation system alternatives. However, the selection of controlled and manipulated
variable pairing is based on controllability indices the results are not tested with the more
reliable closed loop simulation. Thus, the paper do not prove that the frequency

Chapter 2 Literature review
23
dependent controllability indices can select the best control structure for a given
distillation system. Conversely, in the following part of the paper the two thermally
coupled distillation systems are evaluated with the frequency dependent controllability
indices and closed loop simulation as well. The authors find that the results of the
frequency dependent controllability indices and closed loop simulation are in
correspondence and the comparative study can select the distillation system with better
control properties in the case of different ternary mixtures.
Mizsey et al39 investigate the control properties of three different energy-integrated
distillation systems, namely the direct distillation sequence with backward heat
integration (DQB), with forward heat integration (DQF), and fully thermally coupled
distillation column (FTCDC). Their controllability study is based on the degrees of
freedom analysis and the steady state analysis tools for both energy-integrated schemes.
First, the controlled and manipulated variables are selected on the basis of engineering
judgment, secondly, the possible pairings of these controlled and manipulated variables
for composition control loops are analyzed by steady state tools to determine the most
promising candidates of the control structure, and finally, dynamic simulations are carried
out for all energy-integrated schemes with the previously selected control structure
candidates to determine the best of them. This work selects the promising control
structures based on the steady state controllability indices and the selection is verified by
closed loop simulations in time domain. The control properties of the energy-integrated
distillation systems are compared between each other and the authors conclude that the
FTCDC is less favourable than the heat-integrated distillation schemes.
None of the papers mentioned above on controllability evaluation topic try to
aggregate the different control indices. On the contrary these indices are considered
individually. However, they may show opposite operability characteristics for a given
control structure. Often the results of the controllability studies are difficult to interpret
because of the controversial index results for a given control structure (e.g. the value of
the CN is close to the desirable domain but the RGA value indicates strong interactions).

Chapter 3 The investigated case studies
24
Chapter 3 The investigated case studies
3.1 The studied energy-integrated distillation systems
Three type of energy-integrated distillation systems are studied and are compared to the
conventional scheme. In case of ternary mixture separation, distillation systems consist of
two columns. In this thesis direct separation sequence is analyzed. The studied distillation
systems are selected from different types of conventional and energy-integrated
distillation groups. The best connection is chosen from this groups referring to the
column coupling and to the direction of energy integration. First distillation system is a
direct sequence with backward heat integration instead of forward because of its better
economic and control features highlighted by Rév et al40. The sloppy distillation
structures with forward and the backward heat integration have similar characteristics in
energetic point of view. The forward heat integration is chosen for my study because of
its better control properties demonstrated by Bildea et al34 and Emtir41.
The studied distillation systems are the followings:
3.1.1 Direct sequence with backward heat integration (DQB).
In the case of the separation of ternary mixtures, the heat-integrated distillation system
consists of two columns. The direct separation sequence with backward heat integration
is studied. The base idea of this distillation system is to use the overhead vapour from the
second high-pressure column to provide heat to the first low-pressure column. The
reboiler of the first column is combined with the condenser of the second (Figure 3).

Chapter 3 The investigated case studies
25
Figure 3 Direct distillation sequence with backward heat integration (DQB).
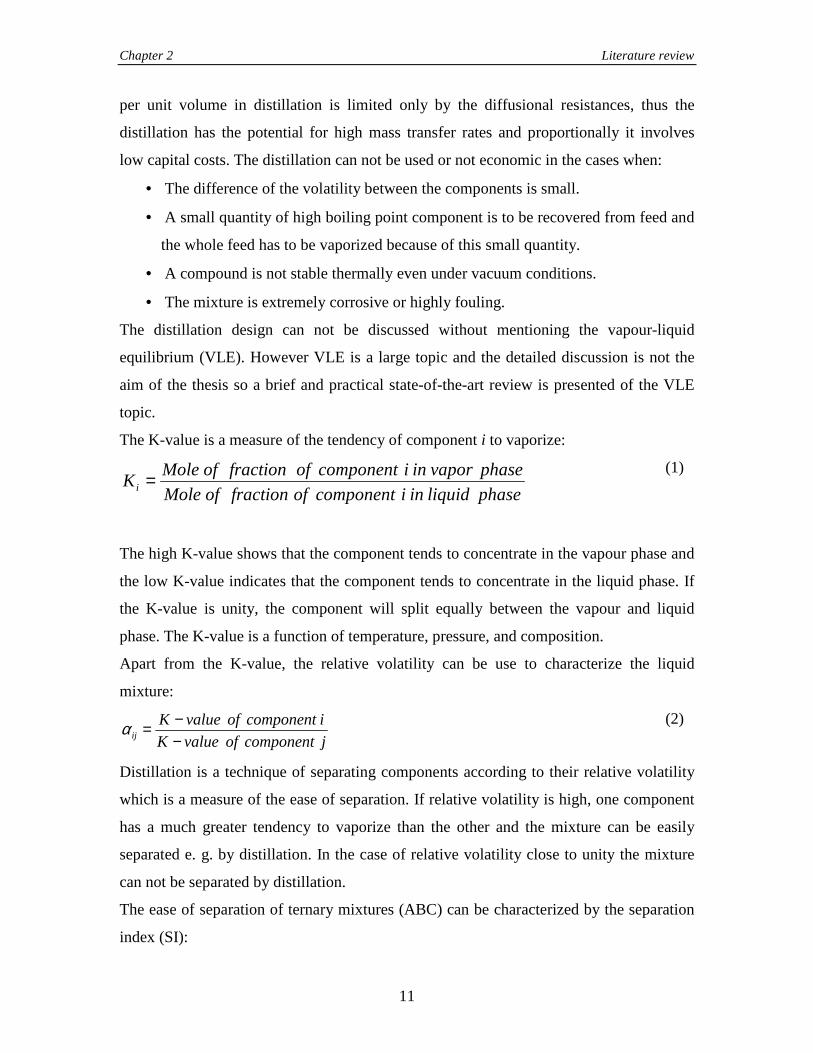
3.1.2 Fully thermally coupled distillation column (FTCDC).
Fully thermally coupled distillation column is also called Petlyuk column consists of a
prefractionator and a main column. The required heat amount for the separation is
provided through direct contact of the material flows (Figure 4). In the prefractionator it
is required to have the most volatile component (A) of the ternary mixture only in the top
product, and to have the heaviest component (C) only in bottom product. The middle
component (B) distributes between the top and bottom products. The top product (V12 -
L21) and the bottom product (L12 - V21) can be estimated 11.
The top product of the prefractionator can be calculated with equation 9:
V12 - L21 = A + β B (9)
The bottom product of the prefractionator can be calculated with equation 10:
L12 - V21 = C + (1-β) B (10)
The optimal fractional recovery of the middle component estimates the flow rates in the
prefractionator where the energy consumption of the FTCDC is minimal:
CA
CB
αα
ααβ
−−=
(11)
where β is the optimal fractional recovery of the middle component and it had been
defined by Treybal 42; αi is the volatility of component i.

Chapter 3 The investigated case studies
26
Figure 4 Fully thermally coupled distillation column (FTCDC).
3.1.3 Sloppy distillation system with forward heat integration (SQF).
This distillation system basically is a heat-integrated sequence, but in the prefractionator
sloppy separation takes place. The middle component distribution in the prefractionator is
similar to the Petlyuk column. There is no material flow from the main column to the
prefractionator. The first column is a high pressure prefractionator, its distillate and
bottom product are fed to the second, low-pressure column. The forward heat integration
between the two columns is carried out by an integrated heat exchanger, where the
overhead vapour from the high-pressure prefractionator is used to boil up the low-
pressure column (Figure 5). The forward scheme was selected in this work because
previous studies 34, 41 have shown that it is better controllable than the backward
integration.

Chapter 3 The investigated case studies
27
Figure 5 Sloppy distillation system with forward heat-integration (SQF).
3.1.4 Conventional direct distillation scheme (Conv. Dir.) is used as base case for
comparison. It consists of two simple distillation columns connected in such a way that
bottom product of the first column is the feed of the second column. In literature, they are
considered to be conventional arrangements for ternary distillation. Direct separation
sequence is studied (Figure 6).
Figure 6 Conventional direct distillation scheme (Conv. Dir.).

Chapter 3 The investigated case studies
28
3.2 Separation tasks
For the overall investigation of the distillation systems, three different ternary mixtures
are selected (Table 1).
Three product purities are supposed in the economic study ( Table 2). Table 1 Ternary mixtures studied
Case Mixture αA αB αAB β SI 1 isopentane-pentane-hexane 3.62 2.78 1.3 0.68 0.47 2 pentane-hexane-heptane 7.38 2.67 2.76 0.26 1.03 3 butane-isopentane-pentane 2.95 1.3 2.26 0.154 1.74
Table 2 Expected product purities
Case Product Purities (%) 1 99 2 95 3 90
The chosen ternary mixtures have different ease of separation that can be characterized
by the separation index (SI), presented in equation 3.
The results of this work are often presented as a function of SI which gives indication
about the location of the more difficult separation task.
In mixture 1 A/B separation is more difficult than B/C separation (SI<1). In mixture 2 A/B
separation is as difficult as B/C separation (SI~1), the ease of separation is balanced. In
mixture 3 the B/C separation is more difficult than A/B separation (SI>1).
The heat-integrated distillation system with backward heat integration (DQB) is
also investigated for the separation of 14.1 % N,N-dimethylformamid (DMF) containing
aqueous solution through an industrial case study of retrofit design. The separation task in
this case study is presented in Table 3.
Table 3 Separation task for DQB industrial case study.
Feed mixture content Feed mixture composition (%) Product Purities (%)
DMF 14.1 95
Water 85.9 99.9

Chapter 4 The proposed complex evaluation methodology
29
Chapter 4 The proposed complex evaluation methodology
4.1 Introduction
In the course of process design there are several steps on different design layers of the
process synthesis activity43. These general steps of a process design project are:
conceptual design, detailed engineering design, project execution, start up and trial runs,
and finally the production. In the conceptual design step also known as early stage of the
process design complex evaluation can be carried out since the process design became
computer aided in the last decades and does not require as much time and effort as in the
past. There are also several attempts to make the process synthesis activity simpler so that
the design engineer can find the best process alternative. In this early phase of design, the
conception of elaboration methodology has a great importance.
4.2 Definition of the evaluation methodology
My work proposes an evaluation methodology of distillation systems that consists of
three levels and takes into account exergy, economic, and emission criteria in order to
find the most adequate process structure.
These three levels of the methodology are the following:
1.) definition of the problem and selection of the competitive process alternatives
2.) multicriteria evaluation of the process alternatives including exergy analysis,
economic study, and GHG emission estimation.
3.) ranking of the process alternatives based on the summarized indicator and the
choice of the most adequate one.
The proposed methodology is demonstrated on distillation systems as one of the
highest energy utilising system in the separation industry. The steps of the methodology
are shown in Figure 7 and are described as follows.

Chapter 4 The proposed complex evaluation methodology
30
Figure 7 Flow diagram of the complex evaluation methodology of distillation
systems.
4.3. The first level of the methodology
The first level of the methodology named as the problem definition includes the
elaboration of process alternatives, the definition of system boundaries, and the selection
of the input / output parameters.

Chapter 4 The proposed complex evaluation methodology
31
4.3.1 The elaboration of the process alternatives
The elaboration of the process alternatives in the case of the distillation processes consists
of the preliminary shortcut design defining the number of trays, feed location according
to the separation task. The set of the process alternatives increases with the consideration
of the available energy integration, which can have different types and can be used at
different locations. This step also includes the selection of the competitive design
alternatives from the wide range of solutions.
4.3.2 Definition of system boundaries
The second step of the methodology defines the system boundaries of the competitive
alternatives. The well-defined process segments include the distillation columns and the
process utilities in this work and they are subject to the comparative study.
4.3.3 Selection of input / output parameters
The selection of identical input/output parameters makes possible the comparative study
of the distillation design alternatives. The basic assumption is the fixation of the input and
output data in order to study the process itself, thus the different distillation design
alternatives can be compared between each other or to a reference process.
4.4 The second level of the methodology
The second level of the methodology carries out the multicriteria evaluation of the design
alternatives.
4.4.1 Collection of the necessary data
The starting step is the collection of data necessary for the different analyses. The
summary of the data is presented in Table 4.
Table 4 Summary of the data required for the application of the evaluation
methodology
Analysis Data
Exergy Ambient pressure
Ambient temperature

Chapter 4 The proposed complex evaluation methodology
32
Molar enthalpy of component i
Molar entropy of component i
Relative volatility of components ij
Economic Cost of the utilities
Heat capacity
Latent evaporation heat
Marshall & Swift index
Material costs
Greenhouse Gas
Emission Estimation
Global warming potential of component i
Efficiency of the firing equipment
The multicriteria evaluation of distillation system alternatives focuses on (i) exergy
analysis, (ii) economic study, (iii) GHG emission estimation. Each of the analysis
calculates an indicator that can be summarized at the next level of the evaluation
methodology. These indicators are the following: thermodynamic efficiency, total annual
cost, and the carbon dioxide equivalent emission. The following section describes the
applied analyses in detail.
4.4.2 Exergy analysis
Energy efficiency of the studied process alternatives can be calculated based on the first
law of thermodynamics, which leads to an energy analysis. Since not all the heat energy
can be converted to useful work, stated by the second law of thermodynamics, exergy
analysis proves to be more adequate to determine the thermodynamic efficiency of the
process alternatives. By definition, exergy is the maximum capacity of the system to
perform useful work as it proceeds to a specific final state in equilibrium with its
surroundings.
In the case of distillation systems, the columns can be considered as heat engines
and their exergy demand is the minimum isothermal work of separation. Instead of
mechanical work, separation work is produced. The purpose of this analysis is to compare
the energy saving performance of the evaluated distillation systems based on
thermodynamic efficiency, which gives information about the efficiency of the supplied

Chapter 4 The proposed complex evaluation methodology
33
heat conversion into separation work in the distillation systems. Apart from the
thermodynamic efficiency, the exergy loss is also calculated that shows the energy
wastes. The distillation design alternatives have good potential for improvement
regarding energy saving when it has considerable exergy losses and low thermodynamic
efficiencies18. The thermodynamic efficiency is selected as indicator in the evaluation
methodology and it can be calculated44 with the following equation 12:
SEPloss
SEP
WEx
Wη
+=
(12)
where WSEP [kW] is the work of separation, Exloss [kW] is the exergy loss of the system.
The separation work can be defined with the equation 13.
∑∑ −=inletoutlet
SEP nExnExW (13)
where n [kmol/h] is the mole flow of the inlet and outlet streams, the Ex [kJ/kmol] is the
specific exergy which can be calculated with the equation 14.
STHEx 0−= (14)
where H [kJ/kmol] is the molar enthalpy, S [kJ/kmol K] is the molar entropy and T0 [K] is
the ambient temperature which is fixed at 283 K in this work.
Gouy-Stodola theorem45, 46 states that the lost available work is directly proportional to
the entropy production. The proportionality factor is simply the ambient temperature T0:
irr0loss STEx ∆= (15)
Based on the second law of thermodynamics the entropy production can be calculated:
∑∑ +++=inlet reb
reb
outlet cond
condirr )
T
QnS()
T
QnS(S∆
(16)
where Qcond and Qreb [kW] are the heat duties of the condenser and reboiler, Tcond and Treb
[K] are the temperatures of the cooling and heating media, respectively.
However, the exergy analysis calculates also the exergy loss, only the thermodynamic
efficiency is selected as indicator in the evaluation methodology. The reason behind this
selection is that the exergy loss profile can provide information about the location of the

Chapter 4 The proposed complex evaluation methodology
34
energy wastes within the distillation system while the thermodynamic efficiency
characterizes the complete process segment. The exergy loss and thermodynamic
efficiency together provide useful information e.g. in the case of retrofit design because
they indicate the possibility of further energy savings for a specific distillation system.
4.4.3 Economic Study
Economic features should be estimated throughout every stage of the process design. The
purpose of the economic study is the determination of the economic efficiency in function
of their capital and utility costs. The correlation between economic study and exergy
analysis is important as well, because e.g. exergy analysis may give hints about economic
properties of the system. In order to compare these results with that of the exergy analysis
the same operating conditions are used. Thus, the separation tasks and the inlet / outlet
stream properties are identical to the parameters used during the exergy analysis. The
objective function is the Total Annual Cost (TAC) that includes capital and utility costs
and it is calculated according to the equation 17.
TAC = Annual capital cost + Annual operating cost (17)
Annual capital cost = Capital cost / Plant life time (18)
The operating cost includes the utility costs and it is calculated per year as a function of
the operating hours. Marshall and Swift cost index is used to update the capital costs to
the present time of the estimate. It takes in account the inflation and other factors, which
contribute to the change of the equipment prices. This cost index is recommended for use
with process-equipment estimates and chemical-plant investment estimates. The
economic study provides the TAC as indicator that characterizes the different distillation
design alternatives.
4.4.4 Greenhouse gas emission estimation
As the environmental emissions regulations have grown stricter in the last decades, the
GHG emission estimation has especial importance and it should be included in the early
stage of process design. This work considers only the GHG emission since this form the
most significant part of the pollution caused by the studied distillation processes. The
emission inventory and quantification motivates the designer to realize environmental

Chapter 4 The proposed complex evaluation methodology
35
friendly processes. These emissions have also special impact on the profitability of
industrial processes since the Kyoto Protocol was ratified by many countries and it was
established a scheme for GHG emission trading in 2005. Some countries have introduced
taxes based on the carbon content of the energy products and this tax is called ‘carbon
tax’. A ‘carbon tax’ is a charge to be paid on each fossil fuel, proportional to the quantity
of carbon emitted when it is burned. Concerning the present demands, carbon dioxide
equivalent emissions need to be quantified.
Estimation of carbon dioxide equivalent (CO2e) emission: beside of CO2 emission
other greenhouse gases are also estimated like nitrous oxide (N2O), methane (CH4),
hydrofluorocarbons, and sulfur hexafluoride (SF6) (Table 5).
Table 5 Global warming potentials of different greenhouse gases
Greenhouse Gases GWP value/100 years
Nitrous oxide (N2O) 296
Methane (CH4) 23
Trifluoromethane (HFC-23) 12000
1,1,1,2-Tetrafluoroethane (HFC-134a) 1300
Sulfur hexafluoride (SF6) 22200
The CO2e is calculated by summing up the GHG emissions multiplied by their GWP
value (eq 19).
( ) emission gas Greenhouse GWPemission equivalent CO2 ∑ ×= (19)
The GHG emission estimation calculates the CO2e emission of the distillation design
alternatives per year that can be used as indicator in the evaluation methodology.
4.5 The third level of the methodology
The third level of the methodology includes the ranking of the process alternatives and
the decision which system is the most adequate for the specific task.

Chapter 4 The proposed complex evaluation methodology
36
4.5.1 Ranking process alternatives based on desirability function
The ranking is based on the desirability function, where the input data are the indicators
calculated on the previous level. The indicators provide important information about
process performances and allow the comparison of process alternatives with respect to
specific aspects. However, they are not suitable for a direct comparison among the
different analyses; therefore, the desirability function (Dfct) is used to summarize the
different indicators. The Dfct is selected among the other methods, which can be found in
the literature because different criteria with different engineering units can be aggregated
in one process indicator and nonlinear functions can be used in the optimization
procedure.
The desirability function (Dfct) approach is a useful statistical method to optimize
the multiple characteristics problems. This method proposed by Harrington 47 converts
the multiple quality characteristics into a single characteristic problem by maximizing the
total desirability. The indicators are transformed into an individual desirability value d for
the desirability function model. If the response exceeds the acceptable value, the value of
d becomes 0; if the response is at the target value, the desirability value d becomes 1. The
individual desirability functions, d are continuous functions and they are chosen from
among a family of linear or exponential functions. Based on these individual functions
the overall desirability function, Dfct, is constructed (eq 20), and this makes possible the
ranking of the process alternatives. The Dfct is defined as the geometric average of the k
individual desirability functions and desirability includes the designer priorities and
desires using the m weight factor 48 .
( )∑
×××=∑
= ∏=
jm
jjj mk
mmmk
i
mifct ddddD
1
21 ...21
1
1
(20)
where k is the number of indicators and m is the weight factor.
High value of Dfct shows that all dk are toward the target value that indicates the most
adequate process alternative.
The form of the dk functions are selected in such a manner that describes the nature of the
criterion that should be maximised or minimised (equations 20a, 20b and 20c). The
constant in the power in the exponential dk function has the same engineering unit as the
numerator.

Chapter 4 The proposed complex evaluation methodology
37
)10/..exp(11 EfficThermd −−= (20a)
)10/exp(2 TACd −= (20b)
)10/exp( 23 eCOd −= (20c)
4.5.2 Decision
The last step of the methodology is the decision making based on the Dfct. The process
alternative with the highest Dfct value is the most favourable solution for the specific
separation task based on the criteria mentioned in the second level of the evaluation
methodology. The selected process alternative can be subject to the detailed engineering
design as the next step of the process design project.
4.6 Application of the proposed evaluation methodology on the studied
distillation systems
Optimal parameters of the above mentioned separation systems are determined. Rigorous
tools calculate adequate reflux ratios, number of trays, and optimal feed tray. In the case
studies selected, the total number of the theoretical trays of the separation schemes ranges
between 70-95 and the column diameters range between 0.9-1.5 m. The reflux ratios vary
according to the ease of separation in a wide range. The simulation models of the studied
distillation systems are implemented in the ASPEN PLUS process simulator. The exergy
analysis and economic study require the use of MS-Excel connected to the process
simulator where the different exergy calculating equations or the cost functions are
introduced.
Definition of the boundaries The methodology is applied on the process segment that contains the distillation columns
and the heat exchangers, including the condensers and reboilers.
Selection of the input / output parameters For the investigation of the distillation systems, three different ternary mixtures are
selected (Table 1). Mixtures of more than three components are not considered at the
stage of this study so that the complexity of the several designs, that is typical for the
more than three component mixtures, does not disturb the overview of my proposed

Chapter 4 The proposed complex evaluation methodology
38
methodology. Because of the same reason, only zeotropic mixtures are considered. Three
product purities are supposed in the economic study (
Table 2).
In the case of the exergy analysis and GHG emission estimation one product purity
(95%) is selected. Feed flow rate is 100 kmol/h and its composition is always equimolar.
The Soave-Redlich-Kwong model is used to calculate vapour-liquid equilibrium. This
model is widely used in the refinery and gas processing industries for the prediction of
vapour-liquid equilibria for systems containing non-polar components.
The ambient pressure and temperature is taken 101 kPa and 298 K respectively.
Results of the exergy analysis Exergy analysis is applied to the studied energy-integrated distillation systems and to the
conventional direct distillation scheme.
In order to perform the exergy analysis the balance regions has to be fixed. Figure
3-5 show the system boundaries where the exergy analysis is applied. The analysis takes
into account the inlet and outlet material streams and the heat duty of the reboilers and of
the condensers. In order to compare the thermodynamic efficiency of the studied
distillation systems the entering and leaving stream physical properties must be identical.
In this study the temperature, pressure, and composition of the inlet and outlet streams are
equal for each case study and the product purity of the outlet streams is selected to be
95%. Therefore, the inlet and outlet stream exergies are identical for the studied
distillation systems separating one specific ternary mixture. Thus, the separation work
does not vary as a function of the used distillation system only in function of the
separated mixture. The cooling water temperature is taken 283 K and the temperature of
the steam used in the reboilers is 433 K. The calculated thermodynamic efficiency (eq 12)
is linear dependent on the taken temperature grades 49 thus one can obtain different
efficiency values if the temperature of the used cooling and heating media is different or
the ambient temperature is fixed differently.
Each distillation system is studied for three different ternary mixtures (Table 1) in
order to investigate also the effect of SI on the energy saving properties of the distillation
systems. The distillation systems are ranked according to their exergy loss and
thermodynamic efficiency.

Chapter 4 The proposed complex evaluation methodology
39
In Figure 8 the exergy loss is presented as a function of SI for each distillation
system. The three SI value represents the three ternary mixtures with different ease of
separation. As the figure shows the exergy loss is the lowest when the ease of separation
of the mixture is balanced so the SI value is close to 1. If the ease of separation becomes
unbalanced thus the SI of the mixture differs from 1 the exergy loss increases. Generally,
the exergy loss of the distillation systems is the highest in the case of the third mixture
separation with SI=1.74. It has to be noted that SI value of the third mixture deviates the
most from 1 which means that this mixture is the furthest from the symmetric ease of
separation.
0
200
400
600
800
1000
1200
0.47 1.03 1.74
Separation Index
Exe
rgy
loss
[kW
]
DQB
SQF
FTCDC
Conv. Dir.
Figure 8 Exergy loss in function of the separation index.
The comparison of the different distillation systems shows that the DQB has the smallest
exergy loss followed by SQF. Entirely, these two heat-integrated distillation systems
show the best energy saving alternatives and consequently the thermodynamic efficiency
of these systems is the highest (Figure 9).
0
2
4
6
8
10
12
14
0.47 1.03 1.74
Separation Index
Th
erm
ody
nam
ic e
ffic
ien
cy [%
] DQB
SQF
FTCDC
Conv. Dir.
Figure 9 Thermodynamic efficiency in function of the separation index.

Chapter 4 The proposed complex evaluation methodology
40
The thermodynamic efficiency of the FTCDC is better compared to the
conventional direct scheme in the case of the mixtures with SI=1.03 and in the case of the
other mixtures there is a very slight difference in the thermodynamic efficiency of the
FTCDC and conventional direct scheme. Figure 9 shows that the DQB has 5% higher
thermodynamic efficiency than that of the conventional direct scheme in the case of
mixture 2 with SI=1.03. These results support the idea that processes with high exergy
loss and low thermodynamic efficiency can be energetically improved18.
In order to localize the exergy loss in the distillation system, the exergy analysis
can be applied separately on the process units. Figure 10 shows the quantity of the
exergy loss of the two distillation columns. The exergy loss in the prefractionator
(column 1) of the FTCDC is low since it has neither reboiler nor condenser.
0
100
200
300
400
500
600
DQB SQF FTCDC Conv. Dir.
Exe
rgy
loss
[kW
]
Column 2
Column 1
Figure 10 Exergy loss of the two distillation columns in the case of mixture with
SI=1.03.
The results of the exergy analysis are compared to the energy consumption data of
the distillation systems. The calculation of the energy consumption assumes that the
distillation systems have only heat requirements neglecting e.g. the electricity usage of
the pumps etc. The heat demand of the studied distillation systems is presented in the
Figure 11. One can notice that the tendency of the heat demand is similar to that of the
exergy analysis. This can be explained with the identical ambient and utility temperatures
for each case study.

Chapter 4 The proposed complex evaluation methodology
41
0
1000
2000
3000
4000
5000
6000
7000
0.47 1.03 1.74
Hea
t d
eman
d [k
W]
DQB
SQF
FTCDC
Conv. Dir.
Figure 11 Heat demand of the distillation systems in function of the separation index.
The exergy analysis determines the thermodynamic efficiency of the investigated systems
which gives information about the supplied heat conversion into separation work and
identifies the energy wastes through the exergy loss. This tool reveals the energy saving
performance of the system and locates those process units which need further energetic
improvements.
In the case study the exergy analysis identifies the characteristics of the studied
distillation systems regarding to the energy efficiency but it is uncertain how precisely the
costs or the CO2e emission of these systems can be predicted. Therefore the next steps of
this work are an economic study calculating the costs of the studied distillation systems
and furthermore the estimation of the CO2e emission.
Results of economic study The economic study as a design step is tested on the distillation design alternatives. Based
on their economic efficiency the investigated distillation schemes are compared between
each other and the best energy integration solution can be chosen. The economic study
calculates the TAC of the investigated distillation systems. These systems are
investigated for the same separation task and within the same system boundaries as in the
exergy analysis. The TAC is calculated in the function of the separation index. In the
literature, economic feature of energy-integrated distillation schemes have been discussed
with increase of product purity 11, 40. However, it has not been investigated in the aspect

Chapter 4 The proposed complex evaluation methodology
42
of separation index, which expresses the ease of separation of the given mixture. The SI
allows the generalization of the ternary mixtures based on their relative volatility.
Concerning the TAC (eq 17, 18) calculation in this case study, the plant life time is
10 years with 8000 operating hours per year. The capital cost contains the installed cost
of the column shell, tower internals, condenser and reboiler. These costs are estimated
using respective equations proposed by Douglas 43 and updated by the Marshall and Swift
index which value is taken from literature 50. Operating cost contains the cooling water
and steam costs. The industrial prices are used to calculate the utility costs. The equations
used for capital and operating cost calculations are presented in the Appendix A.
Results of the comparative economic study for the separation systems and ternary
mixtures studied are shown in Figure 12-11. The representation of the results in these
three figures differs in the expected product purities. The effect of different product
purity requirements is investigated in order to reveal the properties of the investigated
distillation system alternatives in detail.
Figure 12 shows the Total Annual Cost (TAC) vs. Separation Index (SI) when the
required product purity is 90%. In this case the most economic distillation structure is the
direct sequence with backward heat-integration (DQB) followed by the sloppy distillation
system with forward heat integration (SQF). Fully thermally coupled distillation columns
show savings compared to the conventional direct distillation scheme which has the
highest costs.
0
2
4
6
8
0.47 1.03 1.74
Separation Index
TA
C
105 U
SD
/yr
DQB
SQF
FTCDC
Conv. Dir.
Figure 12 TAC vs. SI when the required product purity is 90%.

Chapter 4 The proposed complex evaluation methodology
43
In the next case where the required product purity is 95% (Figure 13) total annual cost of
each distillation structure increase and the rank between of the heat-integrated distillation
systems (DQB, SQF) does not change. The FTCDC has higher costs compared to the
conventional direct scheme in the case of the mixtures with unbalanced ease of separation
(SI=0.47, 1.74). The FTCDC proves to be inefficient for these separation tasks.
0
2
4
6
8
10
12
0.47 1.03 1.74
Separation Index
TAC
105
US
D/y
r
DQBSQFFTCDCConv. Dir.
Figure 13 TAC vs. SI when the required product purity is 95%.
The results of the economic study in the case of 99% product purity (Figure 14)
show that the most economic distillation structure is the DQB and only in the case of
mixture with SI=0.47 it is SQF. Although the SQF is not the most economic structure in
every case, but it is not as sensible to the increase of product purity as other structures.

Chapter 4 The proposed complex evaluation methodology
44
0
3
6
9
12
15
18
0.47 1.03 1.74
Separation Index
TA
C
1
05U
SD
/yr
DQBSQFFTCDCConv. Dir.
Figure 14 TAC vs. SI when the required product purity is 99%.
It follows from Figure 12–11 that the TAC has an increasing tendency with the increase
of the product purity which correlates with the raised energy usage of high product purity
distillations. The studied distillation schemes run with the lowest costs when the ease of
separation is balanced (SI=1.03) and the heat-integrated systems (DQB, SQF) are the
most economic arrangements in almost every case and it is always better than FTCDC.
The results of the economic study correlate with the results of the exergy analysis.
Results of GHG emission estimation The GHG emissions of the studied energy-integrated distillation systems are estimated
and compared to the emission of conventional distillation scheme. The major emission
related to the distillation systems of the case study is the GHG emission caused by the
large heat requirement of these systems. Therefore, the energy requirements of the
different distillation systems are calculated. Based on the energy consumption data of the
distillation schemes, GHG emissions are estimated using SimaPro 6.0 and the results are
verified by the model developed by Gadalla et al. 24 for quantifying the emissions
associated with distillation systems. Reducing energy requirements of distillation systems
leads to lower GHG emission; this is why reconsideration of the design methodology is
necessary. Energy integration could be a solution to reach a lower GHG emission through

Chapter 4 The proposed complex evaluation methodology
45
better energy utilization. Carbon dioxide equivalent is used in order to quantify these
emitted GHG (eq 19). The global warming potential (GWP) values of the GHG are taken
for 100 years time horizon (Table 2). This CO2e emissions are estimated assuming four
different fossil fuels as heat source: natural gas, oil, coal, and lignite. The emitted
greenhouse gases using these fossil fuels are composed mainly by CO2 and by slight
amount of N2O and CH4. The amount of emitted halogenous compounds is practically
negligible compared to the CO2 emission and therefore it can be neglected.
Appropriate firing equipment is selected for each kind of heat source based on the
descriptions found in the literature 51:
• Natural gas heated atmospheric burner with low NOx emission with efficiency
η=87%.
• Fuel oil (low sulphur) boiler under 100 kW with efficiency η=87%.
• Industrial coal furnace used in range of 1-10MW with efficiency η=80%.
• Stove lignite briquette 5-15kW with efficiency η=70%
The results show that the investigated energy-integrated distillation systems have lower
CO2e emission compared to the conventional direct distillation scheme. The energy
requirement and consequently the associated CO2e emission grow with the increase of the
product purity. This tendency is valid for all of the studied distillation systems but the
SQF is the least sensitive (Figure 15).
Energy-integration of the distillation columns can reduce the CO2e emission and further
minimization of this emission can be reached by using cleaner fossil energy source.

Chapter 4 The proposed complex evaluation methodology
46
0
200
400
600
800
CO
2e e
mis
sio
n [
103
kg/y
ear]
Conv. Dir. FTCDC SQF DQB
Distillation Systems
90%
95%
99%
Figure 15 CO2e emission of the studied distillation systems at different product purities
in case of mixture with SI=1.03, with natural gas as fossil fuel.
Figure 16 shows the CO2e emissions of the four studied distillation systems in case of the
different fossil fuel used as heat source. CO2e emission is the lowest when natural gas is
used as heat source in the case of each studied distillation scheme. This tendency is true
for each studied separation problem.
0
300
600
900
1200
1500
Conv. Dir FTCDC SQF DQB
Distillation Systems
CO
2e e
mis
sio
n [k
g/y
ear]
Natural GasOilCoalLignite
Figure 16 CO2e emission of fossil fired distillation structures, the product purity is 95%,
mixture with SI=1.03.

Chapter 4 The proposed complex evaluation methodology
47
The CO2e emission increases if the ease of separation is not symmetric that is when
separation index (SI) is far from 1 (Figure 17).
0
400
800
1200
1600
2000
2400
2800
0.47 1.03 1.74
Separation Index
CO
2e e
mis
sio
n [
kg]
Conv. Dir.FTCDCDQBSQF
Figure 17 CO2e emission of the distillation systems, in the case of different ternary
mixtures. The required product purity is 95% and with natural gas as fossil fuel.
The CO2e emission reduction compared to the base case is also investigated. The CO2e
emissions are summarized for all three product purities into one average CO2e emission
saving figure. These figures are shown in one chart (Figure 18) for all the three studied
energy-integrated distillation schemes.
CO2 relative emission saving correlate to Conv. Dir. distillation scheme
0
5
10
15
20
25
30
35
40
45
FTCDC SQF DQB
Distillation structures
CO
2 re
lati
ve e
mis
sio
n s
avin
g
[%]
Figure 18 CO2e relative emission saving compared to the conventional direct distillation
scheme.

Chapter 4 The proposed complex evaluation methodology
48
Figure 18 shows that the DQB structure has the best performance that means, the DQB
scheme is the most flexible in the CO2e emission issue if product purity alters. The
average emission saving of DQB reaches 40%. The CO2e emission confirms the results
of the previous studies of this work and draws the attention to the consequences of wasted
energy.
Ranking the process alternatives The ranking of process alternatives is based on the different process indicators from the
exergy analysis, economic study, and the GHG emission estimation. The indicators are
numerically presented in the Figure 9, Figure 13, Figure 17 and they are transformed into
an individual desirability value d from 0 to 1. In the case of thermodynamic efficiency,
maximization is desirable, while the TAC and CO2e emission should be minimized. The
weighting factors of the different indicators are taken equally 1 in this case study;
however, the desirability function method allows the use of weighted indicators if the
criteria are not equally important. According to the equation 20, Dfct is calculated and
presented in function of the different ternary mixtures and the investigated distillation
systems (Figure 19).
Figure 19 Dfct vs. SI for the studied distillation systems.
Decision
The complex evaluation methodology reveals that the most adequate distillation system is
the SQF in the case of the mixture with SI=0.47 and the DQB in the case of the mixtures

Chapter 4 The proposed complex evaluation methodology
49
SI= 1.03 and 1.74. The case study investigations prove that the results of the exergy
analysis are in linear correlation with the economic features as well as with the emissions.
The methodology for the estimation of the different process design alternatives can
become quite simple. We can conclude that the results of the exergy analysis are in strict
correlations with the results of the economic, and environmental analysis. Therefore, it
can be concluded that the determination of thermodynamic efficiency on exergy analysis
basis is satisfactory for the evaluation of the different design alternatives. Considering
that the proposed methodology can be used in the process design stage of distillation
systems, the basic assumption of the process design should be applied also in this
methodology. The basic assumption is that the ambient parameters should be identical in
each case. It means that the temperature, pressure, and compositions of the input and
output streams must be the same for each process design alternative.
4.7 Conclusions of the complex evaluation methodology application
The proposed process investigation methodology for distillation systems helps to evaluate
process alternatives from a complex point of view. Following this methodology, the
problem defined on the first level is suitable for the complex comparative study. The
second level is the multicriteria evaluation and it forms the hearth of the methodology.
On this level three different kinds of analysis are carried out in order to evaluate the
distillation systems based on exergetic, economic, and environmental impact aspects. On
the last level of the methodology these three aspects are aggregated by the Dfct in order to
help the selection of the most adequate distillation design alternative giving one general
characteristic figure for each process design alternative.
In the case study, three energy-integrated distillation systems are investigated and
compared to the conventional direct scheme. The input / output parameters and the
system boundaries are defined similarly for these investigated systems. In the case of the
exergy analysis the base of comparison is their thermodynamic efficiency. This analysis
shows that the heat-integrated distillation structures (DQB and SQF) are the most energy-
efficient among the studied ones. The thermodynamic efficiency of all the studied
distillation systems is the highest when the ease of separation is symmetric, that is, the

Chapter 4 The proposed complex evaluation methodology
50
exergy loss is minimal in analogue cases. Economic study supports the results of the
exergy analysis and shows that the heat-integrated distillation structures have the best
economic features as well. Although the FTCDC is less economic than the other
investigated heat-integrated systems but it shows energy savings compared to the
conventional sequence. CO2e emission reduction can be achieved with the use of cleaner
fossil energy source, and using heat-integrated distillation schemes. CO2e emissions of
the distillation systems can be decreased by an average 40% using DQB arrangement
instead of conventional alternative. The CO2e emission estimation demonstrates that in
most cases, the DQB has the lowest CO2e emission but the SQF is less sensitive to
product purity change.
Applying the Dfct reveals that among the different distillation schemes, the heat-
integrated DQB alternative proves to be the best applicable, since it shows the features in
a wide and flexible range.
This work also shows that the thermodynamic efficiency determined during exergy
analysis predicts the results of the economic study and provides further information about
the system. Based on these results one can conclude that the generally favoured economic
study can be replaced with exergy analysis in the early stage of process design.
Moreover, the exergy analysis can also predict the emissions associated with the utilized
energy and this proportionality can simplify the decision making during the process
synthesis step. This emphasizes the improving importance of the exergy analysis also in
the process design practice.

Chapter 5 Retrofit design of an industrial heat-integrated distillation system
51
Chapter 5 Retrofit design of an industrial heat-integrated
distillation system
5.1 Introduction
This chapter presents a retrofit design of an existing industrial heat-integrated distillation
system consisting of three columns originally. The retrofit design case study gave the
possibility to study the heat-integration in industrial scale and to investigate the energy-
integration in the case of polar mixture; therefore, this case study serves as a completion
of the previous studies for hydrocarbon mixtures.
The task was to examine how the capacity of the separation system could be increased by
42.8% and to increase the energy saving performance. Based on the previous evaluation
study the backward heat-integrated solution is investigated for the given N, N-
dimethylformamid - water mixture. The performance of the existing distillation system
and of various increased-capacity structures have been studied using rigorous process
simulation.
N,N-dimethylformamid (DMF) is a well known solvent of many hydrophobic
organic compounds. DMF is also used as crystallization medium in the pharmaceutical
industries but the main consumer of DMF is the polymer industry. Production and
processing of polyamide and acrylic fibers, films, coatings and wire enamels all require
the usage of DMF. The solvent spinning process that is used for the production of
polyamide fibers uses large amounts of DMF. The polymer is dissolved in DMF resulting
in a solution that is suitable for extrusion through a spinneret. The extrusion is followed
by the precipitation of the polymer fiber with the help of an aqueous bath. In the last step
of the technology the DMF is recovered from an aqueous solution, so it can be reused as
a solvent.
DMF-water mixtures are separated using distillation. Although the DMF and water
constitute an ideal mixture and could be separated in a single distillation column, in the
industrial practice usually a two-column heat-integrated sequence is used for the

Chapter 5 Retrofit design of an industrial heat-integrated distillation system
52
separation. The initial ca. 40 wt% DMF containing solution is fed into a vacuum column.
The top product of the vacuum column is pure water; the bottom product enriched in
DMF is fed into the second column that is operated at atmospheric pressure. The bottom
product of the atmospheric column is 99.99 wt% DMF, while the top product of the
atmospheric column is 99.9 wt% water. The overhead vapour of the atmospheric column
provides the heat that is necessary for boiling up the vacuum column. The condenser of
the atmospheric column and the reboiler of the vacuum column are replaced by a single
heat exchanger. This arrangement is called direct distillation sequence with backward
heat integration.
5.2 The aim of the retrofit design work
The general aim of this work is to suggest process modifications that enable the capacity
increase of an existing DMF-water separation system that is operated at the site of a
Hungarian polymer fiber production plant. The performance of the existing energy-
integrated distillation system and of various increased-capacity alternatives are studied
using rigorous process simulation. Process modifications are suggested based on the
simulations exclusively.
5.3 Description of the existing separation process
Scheme of the DMF recovery system of an existing Hungarian polymer fiber production
plant is shown in Figure 20. The DMF is recovered from 14 tons/h 60 wt% water
containing aqueous solution.

Chapter 5 Retrofit design of an industrial heat-integrated distillation system
53
IA
IB
B6
II
FEED
B8
2 3
4
B10
5
6
WATER-IA WATER-IB
9
7
10
B12REFLUX
WATER-II
DMF
B1
BOILUP-B
BOILUP-A
8
I a
p=200 mmHg
p=760 mmHg
I b
II
p=200 mmHg
Feed:14t/hr
DMF 40 wt%Water 60 wt%
DMF99.99 wt%
Water99.9 wt% Water
99.9 wt%
Figure 20 The original DMF-water separation system with backward heat integration.
At this particular plant the crude DMF solution is fed into two parallel connected
distillation columns: Ia, Ib that are operated at 200 mmHg vacuum. The column internal
of these two columns is an older type of Sulzer Mellapak structured packing. The vacuum
columns produces 99.9 wt% water containing distillate and a bottom product that
contains approximately 60 wt% DMF and 40 wt% water. The vapour phase bottom
products of the vacuum columns are fed into an atmospheric pressure distillation column
(column II), that contains trays as column internals. Column II produces a 99.9 wt%
water containing distillate and extremely pure (99.99 wt%) DMF in the bottom. The latter
is the main product of the separation system. Low water content of the purified DMF is a
key factor of the polymer fibre production.
All relevant data of the existing separation system and distillation columns are
known, except for the exact type of structured packing that is installed in the vacuum
columns. The columns are heat-integrated; the overhead vapour of the atmospheric
column boils up the parallel connected two vacuum columns (Figure 20). The capacity of
the existing separation structure is 14 t/h that has to be increased up to 20 t/h.

Chapter 5 Retrofit design of an industrial heat-integrated distillation system
54
5.4 Simulation of the existing separation process
Simulation of the existing separation system was carried out at first. This study deals with
the basic chemical engineering retrofit design of the system, therefore, pumps and other
supplementary technological elements are not considered in the simulations. For the sake
of simplicity, the two parallel connected vacuum columns are simulated as a single
distillation column. Structure of the original separation system - as it is simulated - is
shown in Figure 21
IB
B6
II
FEED
1
WATER-I
4
5
B12REFLUX
WATER-II
DMF
BOILUP
p=200 mmHg
p=760 mmHg
I
II
Feed:14t/hr
DMF 40 wt%Water 60 wt%
DMF99.99 wt%
Water99.9 wt%
B12
3
Figure 21 Simulation of the original DMF-water separation system.
Simulation calculations were carried out using the ChemCad 5.1.3 and the Aspen Plus
12.1 process simulators. In order to avoid numerical difficulties, simulation of the system
shown in Figure 21 is built up in a stepwise manner:
• First, the two parallel vacuum columns have been simulated (as one column)
• Second, atmospheric distillation column had been added
• Finally, the heat-integrated separation system was simulated

Chapter 5 Retrofit design of an industrial heat-integrated distillation system
55
The UNIQUAC model is used to calculate vapour-liquid equilibrium. Specifications of
the columns of the existing separation system are shown in Table 6.
Table 6 Specifications of the columns of the existing separation system
Column I
(200 mmHg)
Column II
(760 mmHg)
Pressure (mmHg) 200 760
No. of theoretical trays 16 27
Feed stage 16 17
Feed thermal condition Partially vaporized Totally vaporized
Reflux ratio 0.57 0.86
Column diameter (mm) Column Ia: 1000
Column Ib: 1400 2000
As Table 6 shows, the packed vacuum columns is simulated as if they were columns with
trays. Numbers of theoretical trays of the packed columns is calculated using the packed
height of the columns and HETP vs. F factor diagram.
The height equivalent to a theoretical plate (HETP) is a key parameter for describing
mass-transfer efficiency in structured packing. This HEPT is the height of packing that is
required to produce an ideal separation where the exiting vapour and liquid are in
thermodynamic equilibrium. Column designers use the HETP to calculate the height of
packing necessary to achieve a given separation. The HETP depends on the geometry of
the packing, the physical properties of the chemical system, and the operating conditions
of the column.
The HETP-F factor diagram of the assumed type of Sulzer packing (presumably
Sulzer Mellapak 250-350, regarding that the present separation system was built in the
early eighties) is used for calculations. Since aqueous mixtures do not wet the packing
with efficiency as it is assumed in the Sulzer HETP-F factor diagrams, the value of the
theoretical trays obtained this way had to be divided by two. According to Kister52,
separation efficiency of the Sulzer Mellapak packings in case of rectifying aqueous
mixtures is half of the efficiency that can be observed in case of organic mixtures.
Simulation calculation of the existing separation process gave back exactly the flow rate
and composition data of the columns that could be measured in the plant. From the point

Chapter 5 Retrofit design of an industrial heat-integrated distillation system
56
of view of heat integration, the most important data are the heat duty and temperature of
the condenser of the atmospheric column, and those of the reboiler of the vacuum
column. These data are shown in Table 7 and Table 8. As these tables show, both the
temperatures and the heat duties enable heat integration between the two columns. Heat
duty values of Table 7 show that the condenser of the atmospheric column provides more
heat than it is necessary to boil up the vacuum columns. In reality the difference between
the absolute values of the heat duties is the heat loss of the existing system (around 12%).
When simulating the heat-integrated model a trim condenser was used to account for the
heat loss.
Table 7 Reboiler data of the vacuum columns
Bottom temperature
[ºC]
Reboiler heat duty
[kW]
Column I (200 mmHg) 70.47 4265.03
Table 8 Condenser data of the atmospheric column
Top temperature
[ºC]
Condenser heat duty
[kW]
Column II (760 mmHg) 99.63 -4887.14
Usually, the least expensive way of increasing the capacity of existing distillation
columns is the replacement of the original column internals with new, high efficiency
structured packings. Selection of the packing type requires column vapour load data.
Simulated liquid and vapour flow rates of the vacuum and of the atmospheric columns
are shown in Figure 22 and Figure 23.

Chapter 5 Retrofit design of an industrial heat-integrated distillation system
57
0
2500
5000
7500
10000
12500
15000
17500
20000
22500
0 2 4 6 8 10 12 14 16
Stage number
Liq
uid
/ V
apo
r fl
ow
s [k
g/h
r]
Liquid flow
Vapor flow
Figure 22 Internal vapour and liquid flows in the vacuum column (column I).
0
2000
4000
6000
8000
10000
12000
14000
16000
0 3 6 9 12 15 18 21 24 27
Stage number
Liq
uid
an
d V
apo
r fl
ow
s [k
g/h
r] Liquid flow
Vapor flow
Figure 23 Internal vapour and liquid flows in the atmospheric column (column II).
The most important data for column sizing is the vapour flow rate. As the figures above
show, the highest vapour flow rates in both columns occur at the feed stages. These
maximum vapour flow rates are to be taken into account when calculating the optimal
column diameters or when calculating the performance of a column at a given diameter.
5.5 Retrofit scenarios and calculations
There are many conceivable ways in which the capacity of the entire system could be
increased from 14 tons/h to 20 tons/h. We have considered the following scenarios:

Chapter 5 Retrofit design of an industrial heat-integrated distillation system
58
A. It is not necessary to change the structure of the system. Simply by increasing the
feed flow rates of the columns will do; the system will keep its separation
efficiency.
B. Replacing the internals/packings of some of the existing columns or installing
new high efficiency packings in all of the columns.
C. Addition of the available extra column and installing new high efficiency
packings in some/all of the columns.
Scenario A is not a real opportunity. If the problem could have been solved this way than
the operators of the plant already could have increased the capacity. Installation of new,
high efficiency packings is necessary by all means.
Capacity calculation of the columns is carried out according to the F factor
method53 using the available HETP-F factor diagrams of the different types of new Sulzer
Mellapak packings54. The F factor method requires the calculation of the maximum
vapour flow rate, the maximum vapour density, and the knowledge of the column cross
sections. The F factor can be calculated according to equation 21.
Vmfactor *VF ρ= (21)
where Vm is the maximum superficial vapour velocity [m/s] and ρv is the maximum
vapour density [kg/m3] in the column. Vapour velocity can be calculated using equation
22:
3600*A*
MV
V
maxm ρ
&
= (22)
where maxM& is the maximum vapour flow rate [kg/h] and A is the cross-sectional area of
the distillation column [m2].
In this case, the cross sectional areas of the columns are given. Maximum vapour flow
rates and vapour densities are calculated using the process simulation program (Figure
22 and Figure 23). In the following, detailed calculations of the individual distillation
columns are shown.

Chapter 5 Retrofit design of an industrial heat-integrated distillation system
59
5.5.1 Existing vacuum columns
These are columns Ia and Ib that are operated at 200 mmHg pressure. Parameters
required for the F factor calculation in case of 14 tons/h feed flow rate are the following:
Maximum vapour flow rate: maxM& = 8150.6 kg/h (as shown in Figure 22)
Maximum vapour density: ρv = 0.1982 kg/m3
Using the parameters of columns Ia, Ib the value of the F factor can be calculated
for the increased capacity (20 tons/h). The summed cross sectional area of the two
columns is 2.32 m2. The maximum vapour flow rate shown in Figure 22 is to be
multiplied by 1.42857 (20/14 tons/h). Using equation 21 and 22 the value of the F factor
results in 3.13, this is multiplied by a safety factor of 1.2. Applying a safety factor is
usual; in this case it allows 20% positive deviation from the planned feed flow rate.
Accordingly, the final value of the F factor is 3.756. Figure 24 shows the HETP-F factor
function measured for the Sulzer Mellapak 250.Y, and Mellapak Plus 252.Y packings.
These packings are the latest products of Sulzer Chemtech.
Separation efficiency
0
0,2
0,4
0,6
0,8
1
0 1 2 3 4
F factor [√Pa]
HE
TP
[m
]
Mellapak 250Y
MellapakPlus 252Y
Figure 24 Separation efficiency of Sulzer packings at 200 mmHg.
As Figure 24 shows, the separation efficiency of Sulzer Mellapak 250.Y packings is
falling at F factor values greater than 2.5 and the separation efficiency of Sulzer Mellapak
Plus 252Y starts to fail at 3.5 F factor value. This way it is proven that the vacuum
columns with increased capacity (20 tons/h; F=3.756) could not satisfy the given purity
requirements; capacity increase of the vacuum columns cannot be achieved by installing

Chapter 5 Retrofit design of an industrial heat-integrated distillation system
60
new high efficiency packings. Retrofit scenarios A and B do not work, addition of the
available extra column is necessary.
5.5.2 Extra column connected parallel to the vacuum columns
The available extra column (Ic) can be used for increasing the capacity of the vacuum
part of the separation system if it is connected parallel to columns Ia and Ib. In this case
all three columns are operated at 200 mmHg. The diameter of the available column is
1100 mm. The total cross-sectional area that can be reached this way is 3.275 m2
(columns Ia, Ib, Ic together). Using this cross-sectional area and the maximum vapour
flow rate, the value of the F factor results in 2.22 for 20 tons/h feed. Using a safety factor
of 1.2 again, the final value of the F factor becomes 2.664. Figure 24 shows that at this F
factor value the separation efficiency of the Sulzer Mellapak 250.Y and 252Y packings
just begins to deteriorate. Simply just replacing the packings and connecting the available
column parallel to the existing vacuum system is not a safe solution, because at increased
capacity (20 tons/h) the system would work at its upper capacity limit.
Still, capacity increase can be safely achieved when adding 3 more meters to the packed
height of the available extra column (Ic), and when using the Mellapak Plus 252Y
structured packing in all three columns (Ia, Ib, Ic). Adding 3 meters to the hull of column
Ic can be carried out by the technicians on-site, relatively easily at moderate cost.
5.5.3 Atmospheric column
The atmospheric column is marked column II in Figure 21. The course of the capacity
calculation is similar to the previous calculations.
In case of 14 tons/h capacity, the maximum vapour flow rate in column II is 14442 kg/h
and the maximum vapour density (ρv) is 2.096 kg/ m3. The diameter of column II is 1m.
Using a safety factor of 1.2, the F factor value in column II for 20 tons/h capacity is
1.512. As Figure 25 shows, Column II could easily handle the increased capacity when it
would be re-filled with Mellapak 250Y or 252Y packings.

Chapter 5 Retrofit design of an industrial heat-integrated distillation system
61
Separation efficiency
0
0,2
0,4
0,6
0,8
1
0 1 2 3 4
F factor [√Pa]H
ET
P [
m]
Mellapak 250Y
MellapakPlus 252Y
Figure 25 Separation efficiency of packings at 720 mmHg.
Since the existing packings of the vacuum columns (Ia, Ib, Ic) are to be replaced by
Mellapak 252Y packings anyway, it is recommended to use the same type of packings in
the atmospheric column (column II), too. This way the atmospheric column will work far
under its capacity limit, and can equalize the incidental vapour flow upsurges that may
occur due to the actions of the process control system.
5.6 Suggested retrofit design
Concluding the results of the calculations that is carried out up to this point, it can be
stated that the capacity increase from 14 tons/h to 20 tons/h is possible, provided with the
following process modifications:
• The packed height of the available extra column (Ic) is to be elongated by 3m and
the column is to be connected parallel to the existing two columns (Ia, Ib) of the
vacuum part of the system.
• The internals of all the four columns (Ia, Ib, Ic, II) are to be replaced by 252Y
type of Sulzer Mellapak Plus structured packings.
The suggested retrofit design that can handle the increased 20 tons/h DMF-water feed is
shown in Figure 26. Discussions with the plant managers made it clear that the suggested

Chapter 5 Retrofit design of an industrial heat-integrated distillation system
62
retrofit design is the most economical solution that can be found for the capacity increase
problem.
8
BO ILUP- A
9
BO ILUP- B
11
RE FLUX
W ATE R- II
5
6
7
FE ED
2
10
DM F
W ATE R- ICW ATE R- IB
B1
B12
B10
B8
II
B6
ICIB
I b
p=200 mmHg
p=760 mmHg
I c
II
p=200 mmHg
Feed:20t/hr
DMF 40 wt%Water 60 wt%
DMF99.99 wt%
Water99.9 wt%
IA
1
W ATE R- IA
4
BO ILUP- C
I a
p=200 mmHg
Figure 26 Heat-integrated retrofit design for the separation of 20 tons/h DMF-water
mixture.
In order to estimate the operating cost of the retrofit structure, energy requirements of the
individual distillation columns and the energy requirement of the whole separation
system have been calculated. Major results are shown in line 3 of Table 9. Lines 2 shows
the energy requirement of the present heat integrate lower capacity system. For the sake
of comparison, line 1 shows the energy requirement of the lower capacity system,
supposing that there is no heat integration. As Table 9 shows, energy integration results
in large energy savings. The increased-capacity energy-integrated separation system
consumes about half of the energy that would be required for the operation of the non
energy-integrated system at lower capacity.

Chapter 5 Retrofit design of an industrial heat-integrated distillation system
63
Table 9 Energy requirement for the recovery of DMF
Distillation
sequence
Feed flow
rate
[tons/h]
Heat duty of
the condensers
[kW]
Heat duty of
the reboilers
[kW]
Total heat duty
[kW]
2+1 columns
without heat
integration
14
9129.2
9635.8
18765
2+1 columns with
heat integration
14
5313
1392.6
6704.6
3+1 columns with
heat integration
20
7445
1924.6
9369.6
The results are even more interesting when the heat duties are related to the mass flow
rate of the recovered pure DMF solution. Table 10 shows the calculated energy
requirements for the recovery of 1 kg DMF. The reduction of the energy consumption by
using energy-integrated system is 64.26% in case of original capacity (feed: 14 tons/h)
and 65.04% in case of increased capacity (feed: 20 tons/h).
Table 10 Energy requirement for the recovery of 1 kg DMF
Distillation
sequence
Feed
[tons/h]
Condensers
heat duty [kW]
Reboilers heat
duty [kW]
Total heat duty
[kW]
2+1 columns
without heat
integration
14 0.65208 0.68827 1.34035
2+1 columns with
heat integration 14 0.3795 0.0995 0.4789
3+1 columns with
heat integration 20 0.3722 0.0962 0.4685

Chapter 5 Retrofit design of an industrial heat-integrated distillation system
64
Comparing the values of the last column of Table 10 clearly shows that the heat-
integrated distillation system obtained by the retrofit design has the lowest specific
energy consumption.
5.7 Conclusions
It can be concluded that increasing the capacity of the heat-integrated separation system
from 14 tons/h to 20 tons/h is possible. The extra column that is available on-site is to be
elongated by 3m, and is to be connected parallel to the existing two columns of the
vacuum part of the separation system. The internals of all the columns are to be replaced
by new, high efficiency Sulzer Mellapak Plus 252Y structured packings. Energy
requirements of the recovery of 1kg DMF have been calculated for both the existing and
for the suggested retrofit structure. The results show that the heat-integrated distillation
system obtained by the retrofit design has somewhat lower specific energy consumption
compared to the existing heat-integrated separation system, while its capacity is increased
by 42.8%. The study shows that the energy integration principles can be applied on polar
binary mixture separation as well.
The industrial case study is an example of the successful application of the process
design principles obtained at the investigation of the energy-integrated distillation
alternatives in this work.

Chapter 6 Operability evaluation of the energy-integrated distillation systems
65
Chapter 6 Operability evaluation of the energy-integrated
distillation systems
The operability of the energy-integrated distillation systems is an important criterion
during the design phase and it has to be taken into account before applying a specific
energy-integration beside of the energy-saving, economic or environmental properties.
Since the operating cost is the main part of the total annual cost it is important to operate
the distillation systems in their optimal range. Thus, the controllability study has to
become the integral part of process design tasks and should be completed in the early
stage of the process design. The operability of the process unit can be analyzed with
different tools such as controllability study of the steady state model or in frequency
domain. More reliable investigation can be carried out with load rejection analysis in time
domain that requires the dynamic model of the process unit. This latter analysis is a time
and energy consuming investigation.
The controllability study predicts the dynamic behaviour of the distillation system.
The task is to foretell how controllable the process is, can it handle large disturbances or
how robust it is. The operability of distillation systems depends on their controllability
and dynamic behaviour.
The aim of this chapter is to elaborate an easy applicable controllability analysis
method in order to compare energy-integrated distillation systems based on their control
properties and to select the easiest controllable one. This chapter verifies the results of the
proposed controllability study with load rejection analysis. The controllability analysis
method is described as follows.

Chapter 6 Operability evaluation of the energy-integrated distillation systems
66
6.1 Controllability analysis of the distillation systems
6.1.1 The selection of the controlled and manipulated variables
The first step of the analysis is the selection of the controlled and manipulated variables
for the investigated systems. Considering a simple two product distillation column, the
column has two degrees of freedom, which may be used to specify top and bottom
compositions. The distillation column is a 5 × 5 system: the controllers manipulate all
five inputs (L, B, V, D, Q,) in order to keep the five outputs (reflux drum level and
column bottom level, pressure, top and bottom product composition). Since the levels and
pressure must be controlled at all times to ensure stable operation, the level and pressure
loops are designed first 32 and in the next step the composition control loops can be
designed for the distillation column.
6.1.2 Calculation of the controllability indices in frequency domain
The controllability analysis is carried out by calculating the transfer function matrices (G)
for open-loop control systems. These transfer function matrices are subjected to Singular
Value Decomposition (SVD) described in Chapter 1. Based on SVD the controllability
indices can be calculated. These controllability indices are used to predict the degree of
directionality and the level of interactions in the system. The analysis is performed in the
frequency domain calculating frequency dependent indices which may yield additional
information about the investigated system55. It is important to note that the values of the
controllability indices should be read in the range of the critical frequency that is
calculated for each system in open-loop and in function of the time constant which results
from the response of a step disturbance.
olcrit T
2πω = (23)
where the ωcrit [rad/sec] is the critical frequency and Tol [sec] is the time constant.

Chapter 6 Operability evaluation of the energy-integrated distillation systems
67
6.1.3 Aggregation of the controllability indices
The specialized literature traditionally considers the different controllability indices
individually; however, they may show opposite controllability characteristics for a given
control structure. The results of the controllability study are often difficult to interpret
because of the controversial index results for the investigated system (e.g. the value of the
CN is close to the desirable band but the RGA value indicates strong interactions).
In order to aggregate the different controllability indices my thesis proposes a method to
optimize the multiple control characteristics problems. This method usually is applied in
statistics and it is called the desirability function (Dfct) previously described in Chapter 3.
In this chapter the method of desirability function is used to select control structure
for energy-integrated distillation systems with the best controllability characteristics such
as CN, MRI and RGAno in frequency domain.
The individual desirability functions, d are continuous functions and they are chosen from
among a family of linear or exponential functions. The overall desirability function Dfct is
defined as the geometric average of the individual desirability functions.
The used individual desirability functions have the following specification:
a) The CN value below 10 indicates a well-conditioned system and in this range the
dCN approaches 1 which is desirable. A transfer matrix with CN larger than 103 is
considered ill-conditioned. The value of dCN is close to 0 at large CN values
(>103) but it is not zero, thus the control structure is not excluded only because of
its large CN. The chosen dCN function, which describes the previously mentioned
criteria has the following form ( equation 24 )
( )( )CNbaexpdCN ⋅+−= (24)
b) The large MRI value predicts resilience process which can deal effectively with
disturbances. The maximization of this individual response is desirable. Thus, the
function of dMRI has the form presented in equation 25. The dMRI function gives
low d values for MRI values lower than 10-2 and highly discriminates the MRI
parameters between 10-2 and 1 since the most of the investigated control structure
have its MRI in this range.

Chapter 6 Operability evaluation of the energy-integrated distillation systems
68
( )10MRIexp1dMRI ×−−= (25)
c) Small values of RGAno indicate a preferable variable pairings with less
interaction. Therefore the minimization of this individual response is
advantageous. The chosen function dRGAno favours RGAno values lower than 1
and its value abruptly decrease at higher values than 1.
−=10
RGAnoexpdRGAno
(26)
6.1.4 Ranking of the studied distillation systems
Based on the Dfct the studied distillation systems are ranked. High value of Dfct shows that
all d are toward the target value which indicates that the system has good controllability
features.
The thesis contains a verification study of the proposed control properties
evaluation analysis. The controllability analysis is applied on the studied distillation
systems and the results are verified with closed loop simulations in time domain.
6.2 Application of the controllability analysis on the investigated
distillation systems
Composition control is realized at the studied distillation systems; therefore mole fraction
is selected as controlled variable.
The selection of the manipulated variable pairings among the possible ones is based
on closed-loop simulations since the publications in the literature do not consider reliable
the selection based on controllability indices33. The selected manipulated variable pairing
for the investigated distillation systems are presented in the Table 11. Ratio control is not
considered in this work.

Chapter 6 Operability evaluation of the energy-integrated distillation systems
69
Table 11 Selected manipulated variable pairings
Distillation systems Manipulated variable pairings
DQB D1L2B2
FTCDC LSQ
SQF LSB
Conv. Dir. D1L2B2
The chosen manipulated variables are: L – reflux rate of the respective column (kmol/h);
D – distillate flow rate of the column (kmol/h); B – bottom product rate of the column
(kmol/h); Q - heat duty of the column’s reboiler (kW). The operating conditions selected
for controllability study are: pentane- hexane- heptane ternary mixture with equimolar
feed composition and 95% product purity.
In the case of the studied energy-integrated distillation systems the controlled and
manipulated variables are shown on Figure 27-28.
Figure 27 DQB indicating its controlled and manipulated variables.
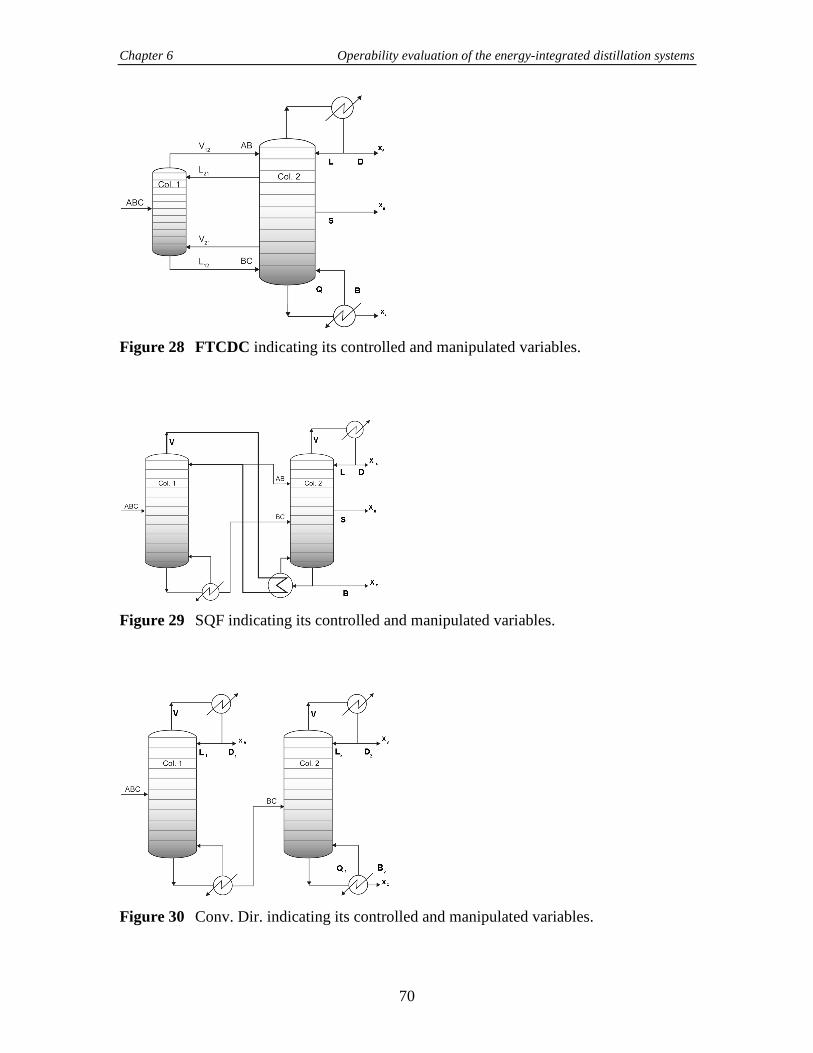
Chapter 6 Operability evaluation of the energy-integrated distillation systems
70
Figure 28 FTCDC indicating its controlled and manipulated variables.
Figure 29 SQF indicating its controlled and manipulated variables.
Figure 30 Conv. Dir. indicating its controlled and manipulated variables.

Chapter 6 Operability evaluation of the energy-integrated distillation systems
71
The frequency dependent controllability indices (CN, MRI, RGAno) are calculated and
presented in Figures 31-33. The values of the controllability indices that count in the
range of the critical frequency are calculated for each system in open-loop in function of
the time constant which results from the response of a step disturbance. The values of the
critical frequency of each distillation system differ and they range between 10-3 and 10-2
[rad/sec].
The Figure 31 shows the condition number in function of frequency. Based on the
CN values, the ranking of the studied distillation systems in sense of controllability
would be: the easiest controllable systems are the DQB and SQF followed by the
FTCDC, and Conv. Dir. shows the worst control properties (Table 12). If the MRI is
taken in account the above mentioned ranking modifies as follows: the more resilience
process is the FTCDC that is followed by the DQB and SQF and the last is the Conv. Dir.
In point of view of the RGAno that indicates the interactions between the control loops of
the distillation system the ranking is totally different: the Conv. Dir. shows the less
interactions followed by the DQB, FTCDC, SQF. Table 12 shows that the ranking of the
distillation systems in controllability point of view can be confusing if the controllability
indices are taken account individually.
Table 12 Ranking of the distillation systems based on individual controllability indices
Controllability indices Ranking
CN MRI RGAno
I DQB FTCDC Conv. Dir.
II SQF DQB DQB
III FTCDC SQF FTCDC
IV Conv. Dir. Conv. Dir. SQF

Chapter 6 Operability evaluation of the energy-integrated distillation systems
72
0
20
40
60
80
100
120
140
160
180
1E-05 0.0001 0.001 0.01 0.1 1 10 100
Frequency [rad/sec]
CN
Conv. Dir.
DQB
SQF
FTCDC
Figure 31 Condition number in function of frequency.
0
0.05
0.1
0.15
0.2
0.25
0.3
0.35
0.4
0.45
0.5
1E-05 0.0001 0.001 0.01 0.1 1 10 100
Frequency [rad/sec]
MR
I
Conv.Dir.
DQB
FTCDC
SQF
Figure 32 Morari resiliency index in function of frequency.
0
2
4
6
8
10
12
14
16
1E-05 0.0001 0.001 0.01 0.1 1 10 100
Frequency [rad/sec]
RG
A-n
o
Conv. Dir
DQB
FTCDC
SQF
Figure 33 RGA number in function of frequency.

Chapter 6 Operability evaluation of the energy-integrated distillation systems
73
In order to help the decision of the control designer the desirability function is applied.
Figure 34 indicates that the DQB has the best control properties taking into account the
three indices, simultaneously.
0.95730.9018
0.8310
0.5260
0.0000
0.2000
0.4000
0.6000
0.8000
1.0000
1.2000
DQB FTCDC SQF Conv. Dir.
Distillation systems
Des
irab
ility
fun
ctio
n
Figure 34 Desirability function values for the studied distillation systems.
The proposed controllability analysis makes it easy to select the best operable distillation
systems among the studied ones. Closed loop simulations verify the controllability
analysis. The verification consist of load rejection analysis that is carried out by applying
different disturbances on the distillation systems with closed-loop control structures.
The closed loop simulations are executed for two types of disturbances: step change in
the feed flow rate (from 100 kmol/h to 101 kmol/h) and feed composition (from
0.3300/0.3400/0.3300 to 0.3333/0.3434/0.3233). The PI controllers are tuned with the
Ziegler-Nichols method using the automatic tuning tool of Aspen Dynamics in
decentralized control structure to maintain the three product compositions at the set point.
The quality of the control for different cases is compared based on the integral absolute
error (IAE). The responses for the feed flow rate disturbances are shown in Figure 35 -
36. The set point of the composition controller is 0.95 [kmol/kmol] that means the
desirable mole fraction of the key component in the three different product stream. Figure
35 shows that the feed flow rate disturbance applied at 5 h is eliminated within 2 hours
and the controller placed on the hexane product flow produces the highest overshoot. The
dynamic behaviour of the distillation systems during the load rejection analysis is
evaluated based on IAE.

Chapter 6 Operability evaluation of the energy-integrated distillation systems
74
( )∫∞
=0
dtteIAE (27)
The IAE measured during the responses on the feed flow rate is presented in the Table
13. As the table shows the best dynamic behaviour has the DQB that is followed by the
FTCDC, SQF, and Conv. Dir.
0.946
0.9465
0.947
0.9475
0.948
0.9485
0.949
0.9495
0.95
0.9505
2 3 4 5 6 7 8 9 10
Time [h]
Mo
le f
ract
ion
PentaneHexaneHeptane
Figure 35 Product composition of DQB after step change in feed flow rate.
0.948
0.949
0.95
0.951
0.952
0.953
0.954
0.955
1 2 3 4 5 6
Time [h]
Mo
le F
ract
ion
Pentane
Hexane
Heptane
Figure 36 Product composition of FTCDC after step change in feed flow rate.

Chapter 6 Operability evaluation of the energy-integrated distillation systems
75
0.942
0.944
0.946
0.948
0.95
0.952
0.954
2 3 4 5 6 7 8
Time [h]
Mo
lar
frac
tio
n
PentaneHexaneHeptane
Figure 37 Product composition of SQF after step change in feed flow rate.
0.94
0.942
0.944
0.946
0.948
0.95
0.952
0.954
0.956
2 3 4 5 6 7 8 9 10
Time [h]
Mo
le F
ract
ion
Pentane
Hexane
Heptane
Figure 38 Product composition of Conv. Dir. after step change in feed flow rate.
Table 13 IAE values in the case of feed flow step disturbance
IAE values of product streams
DQB FTCDC SQF Conv. Dir.
Pentane 7.41E-05 1.14E-03 1.92E-04 1.35E-04 Hexane 1.54E-03 4.57E-04 1.42E-06 5.68E-02 Heptane 3.74E-05 7.72E-04 3.51E-02 1.07E-03 Average 5.49E-04 7.88E-04 1.18E-02 1.93E-02 Ranking I II III IV

Chapter 6 Operability evaluation of the energy-integrated distillation systems
76
The responses for the feed composition disturbances are shown in Figure 39 – 40. Based
on the composition disturbance responses the rank of the distillation systems does not
change.
0.9495
0.95
0.9505
0.951
0.9515
0.952
0 1 2 3 4 5 6 7 8 9 10
Time [h]
Mo
le f
ract
ion
Pentane
Hexane
Heptane
Figure 39 Product composition of DQB after step change in feed composition.
0.949
0.95
0.951
0.952
1 2 3 4 5 6
Time [h]
Mo
le F
ract
ion
Pentane
Hexane
Heptane
Figure 40 Product composition of FTCDC after step change in feed composition.

Chapter 6 Operability evaluation of the energy-integrated distillation systems
77
0.949
0.95
0.951
0.952
0.953
0 1 2 3 4 5 6
Time [h]
Mol
e F
ract
ion
Pentane
Hexane
Heptane
Figure 41 Product composition of SQF after step change in feed composition.
0.949
0.95
0.951
0.952
1 1.5 2 2.5 3 3.5 4 4.5 5 5.5 6 6.5 7 7.5Time [h]
Mo
le F
ract
ion
Pentane
Hexane
Heptane
Figure 42 Product composition of Conv. Dir. after step change in feed composition.
Table 14 IAE values in the case of feed composition step disturbance
IAE values of product streams
DQB FTCDC SQF Conv. Dir.
Pentane 1.31E-04 9.10E-04 6.33E-04 3.62E-04
Hexane 2.77E-04 3.40E-04 4.34E-04 1.50E-03
Heptane 1.71E-05 5.19E-04 1.26E-03 4.87E-04 Average 1.42E-04 5.90E-04 7.75E-04 7.83E-04 Ranking I II III IV

Chapter 6 Operability evaluation of the energy-integrated distillation systems
78
6.3 Conclusion
Chapter 6 proposes a simple controllability analysis that is applied on the studied
distillation systems. The controllability analysis investigates the control features of the
distillation systems in frequency domain and compares them based on their control
properties.
The results of the comparative study of the different distillation systems from
controllability point of view show that the direct sequence with backward heat integration
(DQB) is the best choice. The second best is the FTCDC and it is followed by the SQF.
However, the conventional direct distillation sequence is considered a simple
configuration it has the worst control properties. This result can be found odd but it is in
correspondence with the results of Alatiqi and Luyben56. They compare the control
properties of the conventional direct sequence with a thermally coupled distillation
system and they find that the conventional sequence presents worst control properties
during the controllability analysis and closed loop simulations as well.
The controllability analysis proposed in my thesis is a simple way to evaluate
different distillation systems in order to select the easiest operable one. The analysis
requires the calculation of the transfer matrices of the investigated distillation systems
that is subject to SVD. Based on the calculated singular values the controllability indices
can be defined in the frequency domain. These controllability indices are aggregated with
the desirability function in order to simplify the decision which system is the easiest to
control.
The proposed method is verified with closed-loop simulations and the results
correspond with the previous controllability analysis. The application of the
controllability analysis sustains that the method is simple and fast, thus it can be used in
the early stage of the design procedure.

Chapter 7 Major new results
79
Chapter 7 Major new results
Thesis 1
1. a.) I proposed an evaluation methodology for distillation systems that helps the
engineer at the process design step. The methodology has three levels, which guide the
designer in the problem definition, multicriteria evaluation, and ranking of the process
design alternatives. The methodology considers the exergy, economic, and emission
criteria in order to find the most adequate process design alternative.
I tested the methodology on energy-integrated distillation systems. Theoretically, this
methodology can be used on any kind of energy consuming processes in order to evaluate
them from exergetic, economic, and emission points of view.
1. b.) First in this research topic, I applied the so called desirability function to rank the
process alternatives. For this purpose I elaborated a summarized indicator on the basis of
the desirability function to help the choice of the most adequate process alternative for
the specific separation task.
Thesis 2
I determined with complex evaluation based on my methodology presented in Thesis 1
that the direct sequence with backward heat-integration (DQB) is the best applicable
energy-integrated distillation system in the case of the zeotropic ternary mixture
separation since it shows the features in a wide and flexible range. For the sake of the
comparison beside of the DQB, I investigated the fully thermally coupled distillation
column (FTCDC), and sloppy distillation system with forward heat-integration (SQF),
and compared to the conventional direct scheme. I applied exergy analysis, economic
study, GHG emission estimation, and investigated the controllability properties. The
results show that the DQB is the best process alternative in every issue.

Chapter 7 Major new results
80
Thesis 3
I determined that the energy integration principles, which were elaborated on terner
hydrocarbon mixtures, are applicable on polar binary mixtures as well. I made a
process improvement for the backward heat-integrated distillation system of
N, N-dimethylformamid – water separation in industrial scale. My retrofit design
study shows that the required capacity increase can be attained by adding an
existing distillation column with the replacement of its internals with a new
structural packing. With my design the capacity of the DMF – water separation
system could be increased by 42.8 %. The energy requirement of the proposed heat-
integrated separation system is 35 % of the non-integrated one.
Thesis 4
I elaborated a controllability analysis methodology, which is a simple way to evaluate
different process design alternatives in order to select the easiest controllable one. The
analysis is based on the state-space representation of the systems investigated. The
transfer matrix is subject to singular value decomposition in order to determine the
frequency dependent controllability indices, which are summarized with the desirability
function. I introduced and successfully applied also for the evaluation of process design
alternatives (Thesis 1).
I tested the proposed controllability analysis on energy-integrated distillation systems and
I verified the results with load rejection analysis. The results of these analyses are in
agreement with the results obtained with the application of the frequency dependent
controllability indices. Consequently, I determined that the proposed controllability
analysis can be used instead of the tedious and time consuming load rejection analysis.
The application of this controllability analysis sustains that the method is simple and fast,
thus it can be used in the early stage of the design procedure.

List of publication
81
List of Publications
Papers published in refereed journals
1. Hajnalka Kencse, József Manczinger, Zsolt Szitkai, Péter Mizsey: Retrofit Design of
an Energy Integrated Distillation System, Periodica Polytechnica, Chemical
Engineering; 51/1, 2007, 11-16.
2. Hajnalka Kencse, Péter Mizsey: Comprative Study of Energy-Integrated Distillation
Systems Based on Exergy Analysis and Greenhouse Gas Emissions, Revista de
Chimie; 60, no. 10 / 2009, IF=0.389.
3. Hajnalka Kencse, Peter Mizsey: Methodology for the Design and Evaluation of
Distillation Systems: Exergy Analysis, Economic Features and GHG Emissions,
AICHE Journal, early view online, 2009, IF=1.883
Partly related publication
4. Levente L. Simon, Hajnalka Kencse, Konrad Hungerbuhler: Optimal rectification
column, reboiler vessel, connection pipe selection and optimal control of batch
distillation considering hydraulic limitations, Chemical Engineering and Processing:
Process Intensification, Volume 48, Issue 4, April 2009, Pages 938-949, IF=1.518.

List of publication
82
Conference proceedings
1. Hajnalka Kencse, Máté Gábor, Péter Mizsey: Energiaintegrált desztillációs
rendszerek modellezése, Mőszaki Kémiai Napok ’05, 2005, pp 188, ISBN
9639495719, Veszprém, Hungary.
2. Máté Gábor, Hajnalka Kencse, Péter Mizsey.: Energiaintegrált desztilláló rendszerek
vizsgálata, Mőszaki Kémiai Napok ’06, 2006, pp 268 Veszprém, Hungary.
3. Hajnalka Kencse, Máté Gábor, Péter Mizsey: Comprehensive Investigation of
Energy-Integrated Distillation, 17th International Congress of Chemical and Process
Engineering, 2006, pp 346, ISBN 8086059456, Praha, Czech Republic.
4. Hajnalka Kencse, Péter Mizsey: Comprehensive Process Investigation Methodology
for Energy-Integrated Distillation, 17th European Symposium on Computer Aided
Process Engineering, 2007, pp 883, ISBN 9780444531575, Bucharest, Romania.
5. Hajnalka Kencse, Péter Mizsey: The Impact of Energy-Integration on carbon
dioxide emissions, Permea 2007, Membrane Science and Technology Conference of
Visegrad Countries, 2007, pp 265, ISBN 9789639319691, Siófok, Hungary.
6. Hajnalka Kencse, Péter Mizsey: Investigation of Exergy Loss and CO2e Emission
for Energy-Integrated Distillation Systems, 35th International Conference of SSCHE,
2008, pp 49, ISBN 9788022729031, Tatranské Matliare, Slovakia.
7. Hajnalka Kencse, Péter Mizsey: Investigation of CO2e Emission for Energy-
Integrated Distillation Systems, INTERFACES ’08 Sustainable development in
petroleum refining and petrochemistry, 2008, pp 81, 9789639319868, Sopron,
Hungary.

List of publication
83
Oral lectures and presentations
1. Hajnalka Kencse, Máté Gábor, Péter Mizsey: Energiaintegrált desztillációs
rendszerek modellezése, Mőszaki Kémiai Napok ’05, 2005, Veszprém, Hungary.
2. Hajnalka Kencse, Máté Gábor, Péter Mizsey: Comprehensive Investigation of
Energy-Integrated Distillation, 17th International Congress of Chemical and Process
Engineering, 2006, Praha, Czech Republic.
3. Hajnalka Kencse, Máté Gábor, Péter Mizsey: Az energiaintegrált desztilláció átfogó
vizsgálata, BUTE, Doctorandus Conference at Faculty of Chemical Technology and
Biotechnolog, 2006, Budapest, Hungary.
4. Hajnalka Kencse, Péter Mizsey: Összetett vizsgálati módszer energiaintegrált
desztilláció tanulmányozására, BUTE, Doctorandus Conference at Faculty of
Chemical Technology and Biotechnology, 2007, Budapest, Hungary.
5. Hajnalka Kencse, Péter Mizsey: Vizsgálati módszer energiaintegrált desztilláció
tanulmányozására, Annual meeting of Richter Gedeon Centenary Foundation, 2007,
Budapest, Hungary.
6. Hajnalka Kencse, Péter Mizsey: Investigation of Exergy Loss and CO2e Emission
for Energy-Integrated Distillation Systems, 35th International Conference of SSCHE,
2008, Tatranské Matliare, Slovakia.
7. Hajnalka Kencse, Péter Mizsey: Investigation of CO2e Emission for Energy-
Integrated Distillation Systems, INTERFACES ’08 Sustainable development in
petroleum refining and petrochemistry, 2008, Sopron, Hungary.
8. Hajnalka Kencse, Péter Mizsey: Desztillációs rendszerek komplex vizsgálata,
Mőveleti Munkabizottság Ülés, 2008, Budapest, Hungary.
9. Péter Mizsey, Hajnalka Kencse: Desztillációs rendszerek komplex vizsgálata:
energia, exergia, szabályozás, környezet, Hungarian Society for Industrial Ecology
meeting, 2009, Budapest, Hungary.

List of publication
84
Posters
1. Hajnalka Kencse, Péter Mizsey: Comprehensive Process Investigation Methodology
for Energy-Integrated Distillation, 17th European Symposium on Computer Aided
Process Engineering, 2007, Bucharest, Romania.
2. Hajnalka Kencse, Péter Mizsey: The Impact of Energy-Integration on carbon
dioxide emissions, Permea 2007, Membrane Science and Technology Conference of
Visegrad Countries, 2007, Siófok, Hungary.

References
85
References
1. Fidkowski, Z. T., Distillation configurations and their energy requirements. Aiche Journal 2006, 52, (6), 2098-2106. 2. Fonyo, Z.; Mizsey, P., Economic Applications of Heat-Pumps in Integrated Distillation Systems. Heat Recovery Systems & Chp 1994, 14, (3), 249-263. 3. Fuentes, C.; Luyben, W. L., Comparison of Energy Models for Distillation-Columns. Industrial & Engineering Chemistry Fundamentals 1982, 21, (3), 323-325. 4. Halvorsen, I. J.; Skogestad, S., Minimum energy consumption in multicomponent distillation. 1. V-min diagram for a two-product column. Industrial & Engineering Chemistry Research 2003, 42, (3), 596-604. 5. Halvorsen, I. J.; Skogestad, S., Minimum energy consumption in multicomponent distillation. 2. Three-product Petlyuk arrangements. Industrial & Engineering Chemistry Research 2003, 42, (3), 605-615. 6. Halvorsen, I. J.; Skogestad, S., Minimum energy consumption in multicomponent distillation. 3. More than three products and generalized Petlyuk arrangements. Industrial & Engineering Chemistry Research 2003, 42, (3), 616-629. 7. Hernandez, S.; Pereira-Pech, S.; Jimenez, A.; Rico-Ramirez, V., Energy efficiency of an indirect thermally coupled distillation sequence. Canadian Journal of Chemical Engineering 2003, 81, (5), 1087-1091. 8. Sobocan, G.; Glavic, P., A simple method for systematic synthesis of thermally integrated distillation sequences. Chemical Engineering Journal 2002, 89, (1-3), 155-172. 9. Wang, K. F.; Qian, Y.; Yuan, Y.; Yao, P. J., Synthesis and optimization of heat integrated distillation systems using an improved genetic algorithm. Computers & Chemical Engineering 1998, 23, (1), 125-136. 10. Mascia, M.; Ferrara, F.; Vacca, A.; Tola, G.; Errico, M., Design of heat integrated distillation systems for a light ends separation plant. Applied Thermal Engineering 2007, 27, (7), 1205-1211. 11. Annakou, O.; Mizsey, P., Rigorous comparative study of energy-integrated distillation schemes. Industrial & Engineering Chemistry Research 1996, 35, (6), 1877-1885. 12. Hernandez, S.; Segovia-Hernandez, J. G.; Rico-Ramirez, V., Thermodynamically equivalent distillation schemes to the Petlyuk column for ternary mixtures. Energy 2006, 31, (12), 2176-2183. 13. Olujic, Z.; Fakhri, F.; de Rijke, A.; de Graauw, J.; Jansens, P. J., Internal heat integration - the key to an energy-conserving distillation column. Journal of Chemical Technology and Biotechnology 2003, 78, (2-3), 241-248. 14. Fonyo, Z., Thermodynamic Analysis of Rectification - 1. Reversible Model of Rectification. International Chemical Engineering 1974, 14, (1), 18-27. 15. Fonyo, Z., Thermodynamic Analysis of Rectification - 2. Finite Cascade Models. International Chemical Engineering 1974, 14, (2), 203-210. 16. LeGoff, P.; Cachot, T.; Rivero, R., Exergy analysis of distillation processes. Chemical Engineering & Technology 1996, 19, (6), 478-485.

References
86
17. Zhu, P., An Improved Calculation of the Thermodynamically Based Allocation of Cumulative Exergy Consumption in the Petroleum Distillation Process. Chinese Journal of Chemical Engineering 2008, 16, (1), 104-107. 18. Bandyopadhyay, S., Thermal Integration of a Distillation Column Through Side-Exchangers. Chemical Engineering Research and Design 2007, 85, (1), 155-166. 19. Suphanit, B.; Bischert, A.; Narataruksa, P., Exergy loss analysis of heat transfer across the wall of the dividing-wall distillation column. Energy 2007, 32, (11), 2121-2134. 20. Tijani, A. S.; Ramzan, N.; Witt, W., Process and plant improvement using extended exergy analysis, a case study. Revista De Chimie 2007, 58, (4), 392-396. 21. Rivero, R.; Rendón, C.; Gallegos, S., Exergy and exergoeconomic analysis of a crude oil combined distillation unit. Energy 2004, 29, (12-15), 1909-1927. 22. Seinfeld, J. H.; Pandis, S. N., Atmospheric Chemistry and Physics. Second edition ed.; John Wiley & Sons: 2006. 23. Gadalla, M.; Olujic, Z.; de Rijke, A.; Jansens, P. J., Reducing CO2 emissions of internally heat-integrated distillation columns for separation of close boiling mixtures. Energy 2006, 31, (13), 2409-2417. 24. Gadalla, M.; Olujic, Z.; Jobson, M.; Smith, R., Estimation and reduction of CO2 emissions from crude oil distillation units. Energy 2006, 31, (13), 2398-2408. 25. Stephanopoulos, G., Chemical Process Control. An Introduction to Theory and Practice. Prentice-Hall: 1984. 26. Weitz, O.; Lewin, D. R., Dynamic controllability and resiliency diagnosis using steady state process flowsheet data. Computers & Chemical Engineering 1996, 20, (4), 325-335. 27. Morari, M., Flexibility and Resiliency of Process Systems. Computers & Chemical Engineering 1983, 7, (4), 423-437. 28. Haggblom, K. E., Control structure analysis by partial relative gains. Proceedings of the 36th Ieee Conference on Decision and Control, Vols 1-5 1997, 2623-2624. 29. Boling, J. M.; Haggblom, K. E., Control-relevant identification of an ill-conditioned distillation column. Proceedings of the 1996 Ieee International Conference on Control Applications 1996, 570-575. 30. Haggblom, K. E., Combined internal model and inferential control of a distillation column via closed-loop identification. Journal of Process Control 1996, 6, (4), 223-232. 31. Kalmar, I.; Hajdu, H., Steady-State Study on the Transformation Method of Distillation Control-Structures. Hungarian Journal of Industrial Chemistry 1995, 23, (1), 59-68. 32. Skogestad, S.; Lundstrom, P.; Jacobsen, E. W., Selecting the Best Distillation Control Configuration. Aiche Journal 1990, 36, (5), 753-764. 33. Gross, F.; Baumann, E.; Geser, A.; Rippin, D. W. T.; Lang, L., Modelling, simulation and controllability analysis of an industrial heat-integrated distillation process. Computers & Chemical Engineering 1998, 22, (1-2), 223-237. 34. Bildea, C. S.; Dimian, A. C., Interaction between design and control of a heat-integrated distillation system with prefractionator. Chemical Engineering Research & Design 1999, 77, (A7), 597-608.

References
87
35. Gabor, M.; Mizsey, P., A methodology to determine controllability indices in the frequency domain. Industrial & Engineering Chemistry Research 2008, 47, (14), 4807-4816. 36. Skogestad, S.; Postlethwaite, I., Multivariable Feedback Control Analysis and Design. John Wiley & Sons: 1996. 37. Bristol, E., On a new measure of interaction for multivariable process control. Automatic Control, IEEE Transactions on 1966, 11, (1), 133-134. 38. Lee, B.; Kim, Y.; Shin, D.; Yoon, E. S., A study on the evaluation of structural controllability in chemical processes. Computers & Chemical Engineering 2001, 25, (1), 85-95. 39. Mizsey, P.; Hau, N. T.; Benko, N.; Kalmar, I.; Fonyo, Z., Process control for energy integrated distillation schemes. Computers & Chemical Engineering 1998, 22, (Supplement 1), S427-S434. 40. Rév, E.; Emtir, M.; Szitkai, Z.; Mizsey, P.; Fonyó, Z., Energy savings of integrated and coupled distillation systems. Computers & Chemical Engineering 2001, 25, (1), 119-140. 41. Emtir, M., Economic and Controllability Analysis of Energy-Integrated Distillation Schemes. In Budapest, 2002. 42. Treybal, R. E., Mass transfer operation. 2nd ed.; McGraw-Hill: New York, 1986. 43. Douglas, J. M., Conceptual Design of Chemical Processes. McGraw-Hill: New York, 1988. 44. Seader, J. D.; Henley, E. J., Separation Process Principles. Wiley: 2006. 45. Gouy, M., Sur l’energie utilizable. Journal of Physics 1889, 8, (501). 46. Stodola, A., Steam and Gas Turbines. McGraw-Hill: New York, 1910. 47. Harrington, E. C., The desirability function. Industrial Quality Control 1965, 21, 494-498. 48. Derringer, G.; Suich, R., Simultaneous optimization of several response variables. Journal of Quality Technology 1980, 12, 214-219. 49. Al-Muslim, H.; Dincer, I.; Zubair, S. M., Effect of reference state on exergy efficiencies of one- and two-stage crude oil distillation plants. International Journal of Thermal Sciences 2005, 44, (1), 65-73. 50. Chemical Engineering. Access Intelligence: New York, 2005. 51. Frischknecht R., U. B., Bosshart, S., Ciot, M., Ciseri, L., Doka, G., Hischier, R., Martin, A., Dones, R., Gantner, U. Ökoinventare von Energiesystemen, Grundlagen für den Ökologischen Vergleich von Energiesystemen und den Einbezug von Energiesystemen in Ökobilanzen für die Schweiz. 52. Kister, H. Z., Distillation Design. McGraw-Hill: New York, 1992. 53. Fonyo, Z.; Fabry, G., Vegyipari Mővelettani Alalpismeretek second edition ed.; Nemzeti Tankönyvkiadó: Budapest, 2004. 54. Sulzer Structured Packings for Distillation and Absorption. 55. Skogestad, S.; Jacobsen, E. W.; Morari, M., Inadequacy of Steady-State Analysis for Feedback-Control - Distillate-Bottom Control of Distillation-Columns. Industrial & Engineering Chemistry Research 1990, 29, (12), 2339-2346. 56. Alatiqi, I. M.; Luyben, W. L., Control of a Complex Sidestream Column/Stripper Distillation Configuration. Industrial & Engineering Chemistry Process Design and Development 1986, 25, (3), 762-767.

Nomenclature
88
Nomenclature
Latin symbols A The most volatile component of the ternary mixture
a Fitted parameter
AHT Heat transfer area, [m2]
B Middle component of the ternary mixture
B bottom product rate of the distillation column, (kmol/h)
b Fitted parameter
C The heaviest component of the ternary mixture
CN Condition number
CO2e Carbon dioxide equivalent, [kg]
cp Specific heat capacity, [kJ/kg K]
d Individual desirability value
D Distillate flow rate of the distillation column, (kmol/h)
Dcol Column diameter, [m]
Dfct Desirability function
DMF N,N-dimethylformamid
DQB Direct distillation sequence with backward heat integration
Ex Specific exergy, [kJ/kmol]
Exloss Lost exergy rate, [kW]
Fc Correction factor
FTCDC Fully thermally coupled distillation column

Nomenclature
89
GWP Global warming potential
H Molar enthalpy, [kJ/kmol]
HC Column height, [m]
HETP Height equivalent to a theoretical plate
HT Tray stack height, [m]
IAE Integral absolute error
L Reflux rate of the distillation column, (kmol/h)
L12 Liquid flow rate from column 1 to column 2, [kmol/h]
L21 Liquid flow rate from column 2 to column 1, [kmol/h]
M&S Marshall and Swift index
m Weight factor
M Maximum vapour flow rate, [kg/h]
MRI Morari resiliency index
n Mole flow, [kmol/h]
Q Heat duty of the column’s reboiler, (kW)
Qcond Heat duty of the condenser, [kW]
Qreb Heat duty of the reboiler, [kW]
r Latent evaporation heat, [kJ/kg]
RGA Relative gain array
RGAno Relative gain array number
S Molar entropy, [kJ/kmol K]
SI Separation Index
SQF Sloppy distillation system with forward heat-integration

Nomenclature
90
SVD Singular value decomposition
T0 Ambient temperature, [K]
Tcond Cooling water temperature, [K]
Tol Time constant, [sec]
Treb Heating steam temperature, [K]
TAC Total annual cost, [$/year]
V12 Vapour flow rate column 1 to column 2, [kmol/h]
V21 Vapour flow rate from column 2 to column 1, [kmol/h]
vm Maximum specific vapour velocity, [m/s]
WSEP Work of separation, [kW]
Greek letters αi Volatility of component i
αij Relative volatility of components i, j
β Optimal fractional recovery of the middle component
∆Sirr Entropy production, [kJ/h K]
∆Tmed Logarithmic mean temperature difference
η Thermodynamic efficiency
ρ Maximum vapour density, [kg/m3]
ωcrit Critical frequency, [rad/sec]

List of figures
91
List of figures
Figure 1 General feedback control loop block diagram. ......................................................................17 Figure 2 Binary distillation column with control loops........................................................................18 Figure 3 Direct distillation sequence with backward heat integration (DQB). ....................................25 Figure 4 Fully thermally coupled distillation column (FTCDC)..........................................................26 Figure 5 Sloppy distillation system with forward heat-integration (SQF). ..........................................27 Figure 6 Conventional direct distillation scheme (Conv. Dir.). ...........................................................27 Figure 7 Flow diagram of the complex evaluation methodology of distillation systems.....................30 Figure 8 Exergy loss in function of the separation index. ....................................................................39 Figure 9 Thermodynamic efficiency in function of the separation index. ...........................................39 Figure 10 Exergy loss of the two distillation columns in the case of mixture with SI=1.03..................40 Figure 11 Heat demand of the distillation systems in function of the separation index.........................41 Figure 12 TAC vs. SI when the required product purity is 90%............................................................42 Figure 13 TAC vs. SI when the required product purity is 95%............................................................43 Figure 14 TAC vs. SI when the required product purity is 99%............................................................44 Figure 15 CO2e emission of the studied distillation systems at different product purities in case of
mixture with SI=1.03, with natural gas as fossil fuel. ..........................................................46 Figure 16 CO2e emission of fossil fired distillation structures, the product purity is 95%, mixture with
SI=1.03. ................................................................................................................................46 Figure 17 CO2e emission of the distillation systems, in the case of different ternary mixtures. The
required product purity is 95% and with natural gas as fossil fuel. ......................................47 Figure 18 CO2e relative emission saving correlate to the conventional direct distillation scheme. .......47 Figure 19 Dfct vs. SI for the studied distillation systems. .......................................................................48 Figure 20 The original DMF-water separation system with backward heat integration. .......................53 Figure 21 Simulation of the original DMF-water separation system. ....................................................54 Figure 22 Internal vapour and liquid flows in the vacuum column (column I)......................................57 Figure 23 Internal vapour and liquid flows in the atmospheric column (column II)..............................57 Figure 24 Separation efficiency of Sulzer packings at 200 mmHg........................................................59 Figure 25 Separation efficiency of packings at 720 mmHg. ..................................................................61 Figure 26 Heat-integrated retrofit design for the separation of 20 tons/h DMF-water mixture. ............62 Figure 27 DQB indicating its controlled and manipulated variables. ....................................................69 Figure 28 FTCDC indicating its controlled and manipulated variables. ................................................70 Figure 29 SQF indicating its controlled and manipulated variables. .....................................................70 Figure 30 Conv. Dir. indicating its controlled and manipulated variables.............................................70 Figure 31 Condition number in function of frequency...........................................................................72 Figure 32 Morari resiliency index in function of frequency. .................................................................72 Figure 33 RGA number in function of frequency. .................................................................................72 Figure 34 Desirability function values for the studied distillation systems............................................73 Figure 35 Product composition of DQB after step change in feed flow rate. ........................................74 Figure 36 Product composition of FTCDC after step change in feed flow rate. ....................................74 Figure 37 Product composition of SQF after step change in feed flow rate...........................................75 Figure 38 Product composition of Conv. Dir. after step change in feed flow rate. ................................75 Figure 39 Product composition of DQB after step change in feed composition. ...................................76 Figure 40 Product composition of FTCDC after step change in feed composition................................76 Figure 41 Product composition of SQF after step change in feed composition. ....................................77 Figure 42 Product composition of Conv. Dir. after step change in feed composition............................77

List of tables
92
List of tables
Table 1 Ternary mixtures studied .......................................................................................................28 Table 2 Expected product purities ......................................................................................................28 Table 3 Separation task for DQB case study. .....................................................................................28 Table 4 Summary of the data required for the application of the evaluation methodology................31 Table 5 Global warming potentials of different greenhouse gases .....................................................35 Table 6 Specifications of the columns of the existing separation system...........................................55 Table 7 Reboiler data of the vacuum columns....................................................................................56 Table 8 Condenser data of the atmospheric column ...........................................................................56 Table 9 Energy requirement for the recovery of DMF .......................................................................63 Table 10 Energy requirement for the recovery of 1 kg DMF ...............................................................63 Table 11 Selected manipulated variable pairings .................................................................................69 Table 12 Ranking of the distillation systems based on individual controllability indices ........................ ...............................................................................................................................................71 Table 13 IAE values in the case of feed flow step disturbance.............................................................75 Table 14 IAE values in the case of feed composition step disturbance ................................................77

93
Appendix A
Equations for the economic study
The equations used for capital and operating cost calculations are the following.
The installed cost of column shell is calculated using equation A.1:
)F(2.18H101.9D280
S&M $ shell,column of cost Installed c
0.802C
1.066col +
= (A.1)
where the value of correction factor Fc depends on the pressure and shell material of the
column and it ranges between 3-10. The chosen shell material is carbon steel.
M&S stands for the Marshall and Swift cost index published in Chemical Engineering50.
The M&S updates the equipment costs of process industry to the present time. This index
is used to give a general estimate, but can not take into account all factors that affect the
equipment prices.
Installed cost of tower internals is calculated using column diameter and the tray stack
height (Ht, [m]). The tray type is bubble cap.
ct1.55
col FH4.7D280
S&M $ internals, tower of cost Installed
= (A.2)
where the correction factor’s (Fc) value varies depending on tray spacing, type and
material.
Installed cost of reboiler or condenser is estimated with installed cost of heat exchanger.
( )c65.0
HT F29.2A1.101280
S&M $ condenser, reboiler, of cost Installed +
= (A.3)
where AHT [m2] is the heat transfer area. The value of correction factor (Fc) depends on
the type of heat exchanger and the chosen value is 5.
Cooling water cost is calculated per year and it is the product of water price [$/t] and the
mass flow rate of cooling water [t/h]. The required water mass flow is calculated with
equation A.4:
pmed
cond
c∆T
Q [kg/s] water,cooling of rate flow Mass
×=
(A.4)
where cp [kJ/kg K] is specific heat capacity of cooling water.

94
Steam cost is also calculated per year and it is the product of the price of steam [$/t] and
the steam flow rate [t/h]. Calculating steam costs: the heat duty of the reboiler is known
and the required steam flow rate is calculated using equation A.5:
r
Q [kg/s] flow, Steam reb=
(A.5)
where r [kJ/kg] is the latent evaporation heat of water.
The value of Marshall and Swift index, used in the dissertation is: M&S = 1164.3.
The cost of steam: 18.1 $/t and the cost of cooling water: 0.042 $/t.

95
Appendix B
Investigated distillation system design
Table B.1. Investigated distillation system design and results in the case of
isopentane-pentane-hexane separation (SI=0.47), product purity 95%
DQB SQF FTCDC Conv. Dir. Description
Col.1 Col.2 Col.1 Col.2 Col.1 Col.2 Col.1 Col.2
Pressure [bar] 1 6 7 1.2 1 1 1 1
Diameter [m] 1.85 1.45 1.4 1.7 1.5 2.1 1.63 0.85
Reflux ratio 9.9 1.04 0.64 8 0.66 11 6.35 1.26
Nr. stages 80 10 30 50 7 83 60 20
Feed stage 36 6 10 45 5 - 25 10
Reboiler duty
[kW] - 2212.2 2055.6 - - 2502.1 1853.7 562
Condenser duty
[kW] 1848.8 - - 1916.0 - 2110.3 1768.0 546.0
Wsep [kW] 45.2 6.14 130.15 -77.11 -85.15 135.85 42.5 10.17
Exergy loss [kW] 348.1 317.1 246 386 71.2 691.1 599.1 184.4
TAC ×103 [$/year] 7.03165 7.19357 9.79364 8.223912
GHG emission
(fuel: natural gas) 1113.8 907.1 1284.4 1334.6

96
Table B.2. Investigated distillation system design and results in the case of
pentane- hexane- heptane separation (SI=1.03), product purity 95%
DQB SQF FTCDC Conv. Dir. Description
Col.1 Col.2 Col.1 Col.2 Col.1 Col.2 Col.1 Col.2
Pressure [bar] 1 5 7 1.2 1 1 2 1
Diameter [m] 1.01 1.06 1.15 1.07 1.17 1.42 0.9 0.97
Reflux ratio 1.4 0.65 0.58 2.4 0.56 3.25 1.15 2
Nr. stages 40 40 25 70 17 80 40 40
Feed stage 22 18 12 55 10 - 20 15
Reboiler duty
[kW] 995.3 1228.2 1192.3 603.2 905.9
Condenser duty
[kW] 599.2 806.2 1072.1 512.5 770.7
Wsep [kW] 49.3 -3.6 171 -130 -28.7 76.4 43.6 -3.1
Exergy loss [kW] 119.4 182.3 156 172 36.8 332 165.1 316.6
TAC ×103 [$/year] 3.1984 4.18078 4.35044 5.262007
GHG emission
(fuel: natural gas) 367.2 462.5 552.9 613.1

97
Table B.3. Investigated distillation system design and results in the case of
butane- isopentane- pentane separation (SI=1.74), product purity 95%
DQB SQF FTCDC Conv. Dir. Description
Col.1 Col.2 Col.1 Col.2 Col.1 Col.2 Col.1 Col.2
Pressure [bar] 1 3 7 1 1 1.5 2 2
Diameter [m] 1.43 1.40 1.54 1.89 1.27 2.06 1.02 1.5
Reflux ratio 5.71 0.86 0.87 9.7 0.68 13 3 7.35
Nr. stages 16 90 10 70 15 80 20 60
Feed stage 6 50 5 53 8 - 11 35
Reboiler duty
[kW] 1815 2090.1 3143.9 973.0 2069.0
Condenser duty
[kW] 1776.1 2174.6 3049 937 2158
Wsep [kW] 33.8 16.27 60.69 -10.66 62.09 111.97 38.58 12.95
Exergy loss [kW] 100.8 492 431.6 252.7 62 948.9 298.4 703.4
TAC ×103 [$/year] 5.45076 7.55698 11.04038 10.27356
GHG emission
(fuel: natural gas) 987.4 991.4 1254.3 1294.4

98
Declaration
I declare that this thesis was done by me and all of the used sources are referred at the end
on the thesis.
The research work reported in this thesis has been carried out under the supervision of
Prof. Dr Peter Mizsey, Head of Department of Chemical and Environmental Process
Engineering at Budapest University of Technology and Economics.
No portion of the work referred to in this thesis has been submitted in support of an
application for another degree or qualification of this, or any other university, or other
institute.
________________________
Hajnalka Kencse
Budapest, August 12th, 2009.

99
NYILATKOZAT
Alulírott …Kencse Hajnalka….kijelentem, hogy ezt a doktori értekezést magam
készítettem és abban csak a megadott forrásokat használtam fel. Minden olyan részt,
amelyet szó szerint, vagy azonos tartalomban, de átfogalmazva más forrásból átvettem,
egyértelmıen, a forrás megadásával megjelöltem.
________________________
Kencse Hajnalka
Budapest, 2009. augusztus 12.……………………..